increasing energy efficiency in industry applying pinch analysis
TRANSCRIPT
Increasing energy efficiency in industry applying pinch analysis
A dairy plant case study
Margrét Ormslev Ásgeirsdóttir
______________________________________________________
Increasing energy efficiency in industry applying pinch analysis
A dairy plant case study
Margrét Ormslev Ásgeirsdóttir
A 30 ECTS credit units Master´s thesis
Supervisor Dr. Simon Harvey
A Master´s thesis done at RES | The School for Renewable Energy Science
in affiliation with University of Iceland & University of Akureyri
Akureyri, February 2010
Increasing energy efficiency in industry applying pinch analysis A dairy plant case study A 30 ECTS credit units Master´s thesis
© Margrét Ormslev Ásgeirsdóttir, 2010
RES | The School for Renewable Energy Science
Solborg at Nordurslod
IS600 Akureyri, Iceland
Telephone + 354 464 0100
www.res.is
Printed in 2010
at Stell Printing in Akureyri, Iceland

v
ABSTRACT
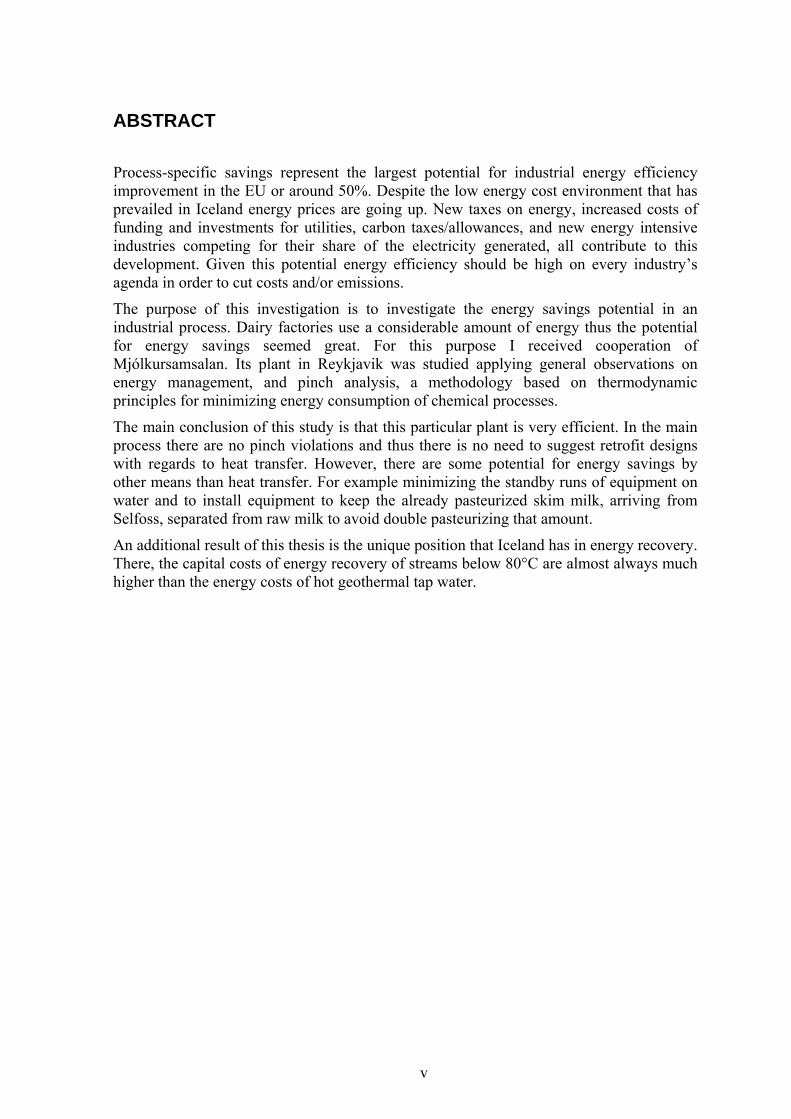
Process-specific savings represent the largest potential for industrial energy efficiency improvement in the EU or around 50%. Despite the low energy cost environment that has prevailed in Iceland energy prices are going up. New taxes on energy, increased costs of funding and investments for utilities, carbon taxes/allowances, and new energy intensive industries competing for their share of the electricity generated, all contribute to this development. Given this potential energy efficiency should be high on every industry’s agenda in order to cut costs and/or emissions.
The purpose of this investigation is to investigate the energy savings potential in an industrial process. Dairy factories use a considerable amount of energy thus the potential for energy savings seemed great. For this purpose I received cooperation of Mjólkursamsalan. Its plant in Reykjavik was studied applying general observations on energy management, and pinch analysis, a methodology based on thermodynamic principles for minimizing energy consumption of chemical processes.
The main conclusion of this study is that this particular plant is very efficient. In the main process there are no pinch violations and thus there is no need to suggest retrofit designs with regards to heat transfer. However, there are some potential for energy savings by other means than heat transfer. For example minimizing the standby runs of equipment on water and to install equipment to keep the already pasteurized skim milk, arriving from Selfoss, separated from raw milk to avoid double pasteurizing that amount.
An additional result of this thesis is the unique position that Iceland has in energy recovery. There, the capital costs of energy recovery of streams below 80°C are almost always much higher than the energy costs of hot geothermal tap water.

vi
PREFACE
This thesis is submitted in partial fulfilment of the requirements of the Degree of Master of Science in Renewable Energy Science at RES | the School for Renewable Energy Science. My studies were in part sponsored by Landsvirkjun Energy Research Fund and the National Energy Authority.
The choice of this project was inspired by my belief that energy efficiency is something every industry and person has an obligation to keep in mind. After attending Dr. Harvey’s class at RES I noticed the tool of pinch analysis to improve energy efficiency in industrial processes. Thus, I found it fitting to try to apply this tool in an energy intensive industry here in Iceland.
I would like to express my gratitude to my advisor Dr. Simon Harvey for his help, guidance and especially for his patience to go over everything long distance.
Thanks to Mjólkursamsalan hf. for allowing me to examine their process and special thanks to Jón K. Baldursson, Reykjavik plant manager; Aðalsteinn Aðalsteinsson, technician, and Brynjar Pétursson, dairy expert; for providing me with the necessary data and putting up with my endless questions.
Also, thanks to my employer, Landsbankinn, for giving me the time off needed to attend my studies.
Special acknowledgement to Dr. Björn Gunnarsson, rector at RES; Sigrún Lóa Kristjánsdóttir and Zane Brikovska, office managers, for making it possible for me to attend RES in part by distance learning.
I would like to thank my family for continuous support, putting up with my busy schedule and letting me move across the country to study.
I would also like to thank all my professors at RES and fellow students for making my studies a great experience.
Last but not least, my sincerest gratitude to my husband for always encouraging me to go after my dreams and ambitions and always believing in me 200%.
vii
TABLE OF CONTENTS
1 Introduction ....................................................................................................................... 1
1.1 Thesis statement ......................................................................................................... 2
2 Energy efficiency .............................................................................................................. 3
2.1 Pinch analysis ............................................................................................................ 3
2.1.1 Introduction of basic concepts .......................................................................... 4
2.1.2 Step by step ...................................................................................................... 8
2.1.3 Properties of milk ............................................................................................. 9
3 A Dairy case study – MS dairy Plant in Reykjavík ........................................................ 10
3.1 Current energy consumption .................................................................................... 11
3.2 Main process ............................................................................................................ 12
3.2.1 Reception and raw milk storage ..................................................................... 14
3.2.2 Operation: Start up and shut down procedures .............................................. 15
3.2.3 Milk processing .............................................................................................. 15
3.2.4 Cream processing ........................................................................................... 23
3.2.5 Sour milk processing ...................................................................................... 28
3.3 Service streams ........................................................................................................ 33
3.3.1 Cleaning ......................................................................................................... 34
3.3.2 Equipment service streams ............................................................................. 36
3.4 Refrigeration ............................................................................................................ 38
4 Conclusions ..................................................................................................................... 41
References ........................................................................................................................... 44
Appendix A – Notes on various calculations ........................................................................ 1
Specific weight ................................................................................................................. 1
Specific heat ...................................................................................................................... 1
Cream separation .............................................................................................................. 2
Duties and intermediate temperatures: ............................................................................. 2
Time running ..................................................................................................................... 7
Water circulations ............................................................................................................. 7
Electricity .......................................................................................................................... 8
Appendix B – Design data summary ..................................................................................... 1
Milk pasteurizers ............................................................................................................... 1

viii
Cream pasteurizer ............................................................................................................. 3
Sour milk pasteurizer ........................................................................................................ 3
Appendix C - Equipment ....................................................................................................... 1
Compression chillers......................................................................................................... 1
Heat exchangers ................................................................................................................ 1
Appendix D – Variable Cp value ........................................................................................... 1
ix
LIST OF FIGURES
Figure 1.1 Distribution of CO2 emissions between sectors (Emission database for global atmospheric reasearch). ................................................................................................. 1
Figure 2.1 Annual costs as functions of minumum temperature approach (Harvey 2009). .. 5
Figure 2.2 Composite curves, ∆Tmin=10K (Harvey 2009). ................................................... 5
Figure 2.3 Cascade calculations (Harvey 2009). ................................................................... 7
Figure 2.4 A grand composite curve (Harvey 2009). ............................................................ 7
Figure 3.1 MS Reykjavík plant layout. ............................................................................... 13
Figure 3.2 Inventory of main process flows. ....................................................................... 14
Figure 3.3 Milk processing, general flowsheet. .................................................................. 16
Figure 3.4 Streams in milk main process for pinch analysis. .............................................. 20
Figure 3.5 Composite curves for milk main process. .......................................................... 22
Figure 3.6 Cream processing, general flowsheet. ................................................................ 23
Figure 3.7 Streams in cream main process for pinch analysis............................................. 26
Figure 3.8 Composite curves for cream main process......................................................... 27
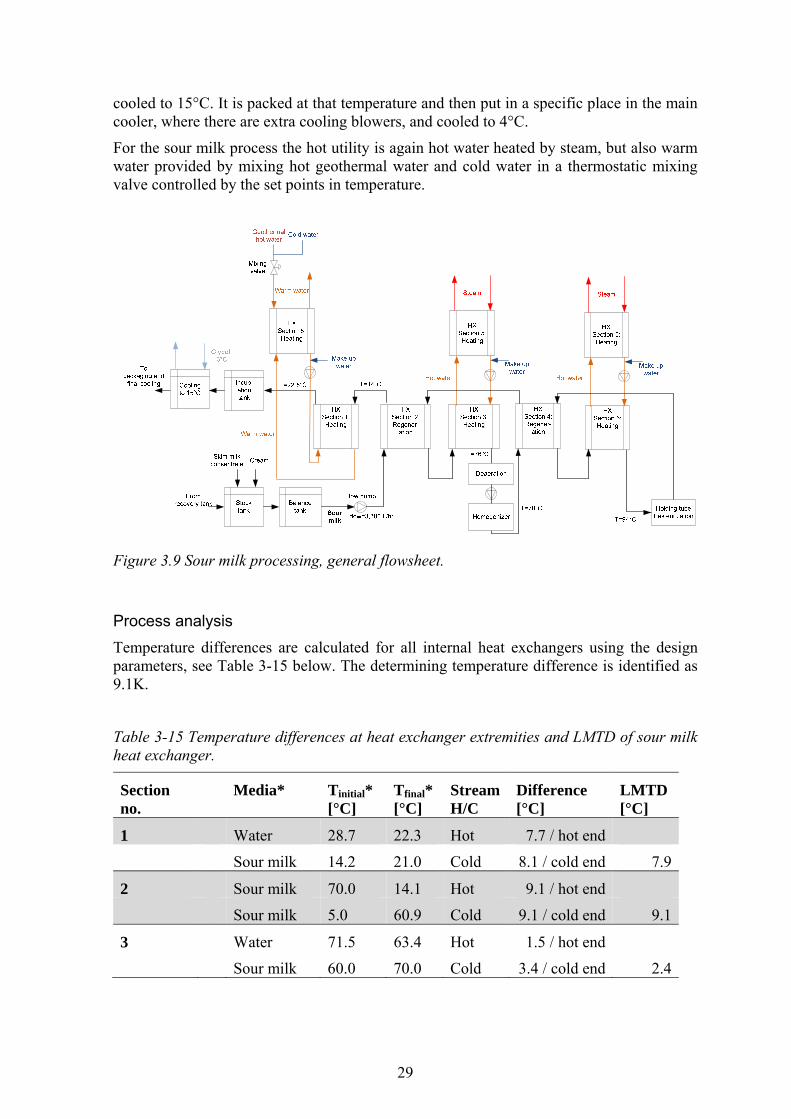
Figure 3.9 Sour milk processing, general flowsheet. .......................................................... 29
Figure 3.10 Streams in sour milk main process for pinch analysis. .................................... 31
Figure 3.11 Composite curve for sour milk main process. .................................................. 33
Figure 3.12 Inventory of service stream flows. ................................................................... 34
Figure 3.13 Cleaning process, general flowsheet. ............................................................... 35
Figure 3.14 Refrigeration arrangement for process cooling. ............................................... 38
Figure 3.15 Refrigeration arrangement for storage cooling. ............................................... 39
Figure 3.16 A typical absorption refrigeration arrangement. .............................................. 40
Figure 4.1 Monetary savings of improve efficiency versus electricity price. ..................... 43
Figure A.1 Steps of analysis. ................................................................................................. 1
Figure A.2 Position of the intermediate temperatures for the milk process. ......................... 2
Figure A.3 Steps in calculating intermediate temperatures. .................................................. 3
Figure D.1 Comparison of a fixed Cp value and a linear assumption of one. ....................... 1
x
LIST OF TABLES
Table 3-1 Key feedstock and production of Reykjavik dairy factory. ................................ 11
Table 3-2 Energy flows per year, milk, cream and sour milk pasteurizing processes. ....... 12
Table 3-3 Reception cooler relevant data. ........................................................................... 14
Table 3-4 Duties of milk heat exchanger sections. .............................................................. 17
Table 3-5 Temperature differences at heat exchanger extremities and LMTD of milk heat exchanger. .................................................................................................................... 18
Table 3-6 Inputs in milk main process for pinch analysis. .................................................. 21
Table 3-7 Milk. Pinch temperature and hot and cold utility. ............................................... 21
Table 3-8 Energy consumption per year for milk process on water circulation. ................. 22
Table 3-9 Energy consumption and cost due to double pasteurization of skim milk. ......... 23
Table 3-10 Duties of cream heat exchanger sections and tanks. ......................................... 24
Table 3-11 Temperature differences at heat exchanger extremities and LMTD of cream heat exchanger. ............................................................................................................ 25
Table 3-12 Inputs in cream main process for pinch analysis. ............................................. 27
Table 3-13 Cream. Pinch temperature and hot and cold utility. .......................................... 27
Table 3-14 Energy consumption per year for cream process on water circulation. ............ 28
Table 3-15 Temperature differences at heat exchanger extremities and LMTD of sour milk heat exchanger. ............................................................................................................ 29
Table 3-16 Duties of sour milk heat exchanger and tank. ................................................... 30
Table 3-17 Inputs in sour milk main process for pinch analysis. ........................................ 32
Table 3-18 Sour milk. Pinch temperature and hot and cold utility...................................... 32
Table 3-19 Energy consumption per year for sour milk process on water circulation. ....... 33
Table 3-20 Heat sources and sinks for water. ...................................................................... 37
Table 3-21 Common working fluids for absorption chillers. .............................................. 40
Table 4-1 Sources of waste and possible actions to produce energy and monetary savings. ..................................................................................................................................... 42
Table 4-2 Energy flows per year, milk, cream and sour milk pasteurizing processes. Base case versus an improved efficiency case. .................................................................... 42
Table A-1 Whole milk process heat exchanger, MG1. ......................................................... 3
Table A-2 Whole milk process heat exchanger, MG2. ......................................................... 4
Table A-3 Light milk process heat exchanger, MG1. ........................................................... 4
Table A-4 Light milk process heat exchanger, MG2. ........................................................... 5
Table A-5 Skim milk process heat exchanger, MG1............................................................. 5
xi
Table A-6 Skim milk process heat exchanger, MG2............................................................. 6
Table A-7 Cream process heat exchanger and tanks, RG1. .................................................. 6
Table A-8 Sour milk process heat exchanger, SG1. .............................................................. 7
Table A-9 Time running per year .......................................................................................... 7
Table A-10 Estimation of electricity consumption................................................................ 8
Table B-1 Design parameters: technical data ........................................................................ 1
Table B-2 Run 1 milk heat exchanger. Skim milk, design data. ........................................... 1
Table B-3 Run 2 milk heat exchanger. Whole milk, design data. ......................................... 2
Table B-4 Run 3 milk heat exchanger. Light milk, design data. ........................................... 2
Table B-5 Cream heat exchanger, design data. ..................................................................... 3
Table B-6 Sour milk heat exchanger, design data. ................................................................ 3
1
1 INTRODUCTION
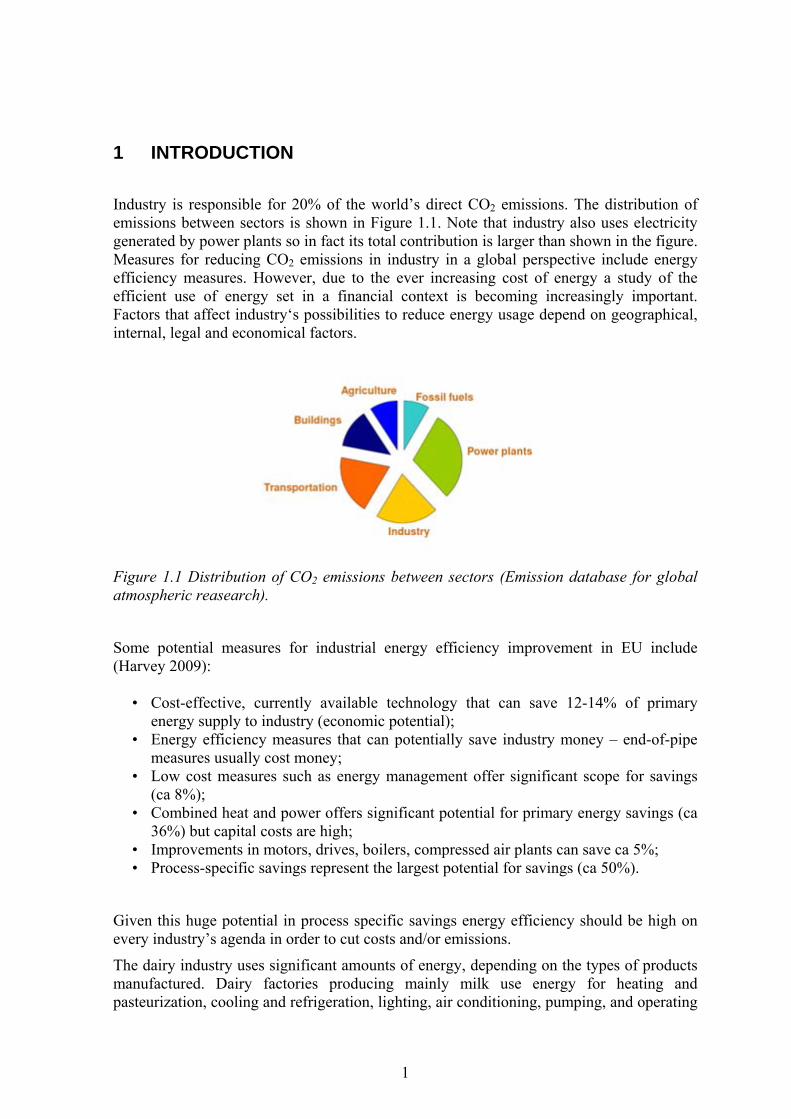
Industry is responsible for 20% of the world’s direct CO2 emissions. The distribution of emissions between sectors is shown in Figure 1.1. Note that industry also uses electricity generated by power plants so in fact its total contribution is larger than shown in the figure. Measures for reducing CO2 emissions in industry in a global perspective include energy efficiency measures. However, due to the ever increasing cost of energy a study of the efficient use of energy set in a financial context is becoming increasingly important. Factors that affect industry‘s possibilities to reduce energy usage depend on geographical, internal, legal and economical factors.
Figure 1.1 Distribution of CO2 emissions between sectors (Emission database for global atmospheric reasearch).
Some potential measures for industrial energy efficiency improvement in EU include (Harvey 2009):
• Cost-effective, currently available technology that can save 12-14% of primary
energy supply to industry (economic potential); • Energy efficiency measures that can potentially save industry money – end-of-pipe
measures usually cost money; • Low cost measures such as energy management offer significant scope for savings
(ca 8%); • Combined heat and power offers significant potential for primary energy savings (ca
36%) but capital costs are high; • Improvements in motors, drives, boilers, compressed air plants can save ca 5%; • Process-specific savings represent the largest potential for savings (ca 50%).
Given this huge potential in process specific savings energy efficiency should be high on every industry’s agenda in order to cut costs and/or emissions.
The dairy industry uses significant amounts of energy, depending on the types of products manufactured. Dairy factories producing mainly milk use energy for heating and pasteurization, cooling and refrigeration, lighting, air conditioning, pumping, and operating
2
processing and auxiliary equipment. Factories producing concentrated milk products, cheese, whey or powders require additional energy for churning, pressing, separation, concentration, evaporation and drying. There are many opportunities for recovering heat in dairy processing plants; however, the feasibility of implementing such systems depends on the location of the heat source in relation to the potential area of use, the capital cost of heat recovery equipment, and the potential energy savings (UNEP 2004).
In Iceland there are two major dairy companies, MS and KEA. This project will analyze a specific process plant at the MS dairy factory in Reykjavik, Iceland.
The sources of energy in Iceland are electricity, generated from hydro or geothermal energy, and thermal energy from geothermal sources. As energy prices are not high in Iceland (for industry: lower than 7 ISK/kWh for electricity and 71 ISK/m3 for hot water excluding sales tax (Reykjavik Energy 2009)) and energy is generated from renewable sources the benefits of reduced energy usage in terms of costs and emissions reduction may not be as obvious as elsewhere.
However, renewable energy power generation is not entirely emission free considering the life cycle of the power plants. Geothermal power plants also emit some harmful substances every year such as H2S. For example annual CO2 emissions from Hellisheiði Geothermal Power Plant in Iceland amount to 30,000 tonnes/year (Gislason 2009). Most importantly, the most environmentally friendly and cheapest MWh is the MWh that need not be generated. And although energy prices are low the amount of energy needed provides potential for significant savings.
In addition, there is increasing effort to attract traditional energy intensive industries to Iceland (e.g. aluminum industry) but also new applications such as high-speed high-capacity computer servers. Promoting energy efficiency contributes to increased available energy supply (in fact by reducing demand) and thus is a clear indirect benefit to Iceland’s economy.
Furthermore, Iceland is currently concerned about the maximum emissions allowed by the Kyoto Protocol and if it does not reduce its emissions, industries may have to start paying for their carbon emissions and that will reduce Iceland’s appeal for investors in heavy industry and also incur extra costs for current industry. Also, if Iceland does not reach its goals there is a penalty for non-compliance in 2012 of 100 EUR/tonne CO2 over the emission target (Lokey 2008).
1.1 Thesis statement
The dairy industry is a significant consumer of energy. In addition to conventional observations and analysis to estimate potential energy savings, pinch analysis is used to analyze the heating and cooling demands of an industrial process. It has been successfully applied to a number of process industries where energy costs represent a significant proportion of the total production cost.
This study will analyze energy saving potential and apply pinch technology to a dairy production process to:
• Estimate its energy savings potential for heating and cooling purposes; • Suggest a retrofit design of the heat exchanger network;
3
Steps of analysis:
• Description of the plant and processes; • Inventory of existing process, flows and temperatures; • Pinch analysis; • Energy management – examine potential energy savings that can be obtained with
small measures and to increase energy awareness; Properties of milk • Description of the plant and processes and inventory of existing process; flows and
temperatures • General calculations • Pinch analysis • Energy management • Waste heat utilization
2 ENERGY EFFICIENCY
Energy efficiency can be improved by a number of ways. To estimate the most efficient use of energy the main pillars are to study energy management, energy conversion, energy recovery, and process integration.
Energy management is the most straightforward way of decreasing energy use. Simple things such as turning off lights when not necessary and generally being aware of use of energy are ways of energy management. Energy conversion involves examining the selection of a fuel as an energy source (electricity, heat, coal etc.) and the most efficient use of that fuel for an application. Energy recovery aims to minimize losses and waste energy. Various ways can be considered for energy recovery. Commonly implemented measures include increasing insulation, preventing friction and recuperating heat by heat exchanging. For fluids, indirect heat exchangers are most common whereas heat pumps are often used for air. Process integration or pinch technology is a way to quantify the maximum energy recovery potential for an industrial process.
For this thesis the most relevant points to consider are energy management and energy recovery (process integration).
2.1 Pinch analysis
Pinch analysis (process integration, pinch technology) is a methodology for minimizing energy consumption of chemical processes by calculating thermodynamically feasible energy targets (or minimum energy consumption) and achieving them by optimizing heat recovery systems, energy supply methods and process operating conditions. It is also known as process integration, heat integration, energy integration or pinch technology.
It is based on thermodynamic principles (mainly the 2nd law) and on the fact that different processes in an industrial plant require different temperature and pressure. It is a tool for heat exchanger network design and the investigation of heat and power utility options.
4
The process data is represented as a set of energy flows, or streams, as a function of heat load against temperature. These data are combined for all the streams in the plant to give composite curves, one for all hot streams (releasing heat) and one for all cold streams (requiring heat). The point of closest approach between the hot and cold composite curves is the pinch temperature and is where the heat exchanger network design is the most constrained. Hence, by finding this point and starting design there, the energy targets can be achieved using heat exchangers to recover heat between hot and cold streams. In practice, during the pinch analysis, often cross-pinch exchanges of heat are found between a stream with its temperature above the pinch and one below the pinch. Removal of those exchanges by alternative matching enables the process reach its energy target.
The main advantage of process integration is to consider a system as a whole (i.e. integrated or holistic approach) in order to improve its design and/or operation. In contrast, an analytical approach would attempt to improve or optimize process units separately without necessarily taking advantage of potential interactions among them.
Typically, process integration techniques are employed at the beginning of a project (e.g. a new plant or green field design) to screen out promising options to optimize the design. Increasingly however, they are used for analyzing an existing plant (as is the case in this project). The optimal solution for a retrofit is not the same as for green field design. For retrofit of heat exchanger networks there are no “perfect” methods (for larger networks) and for a given level of increased heat recovery a retrofit design which modifies as few units as possible is usually the most cost effective solution (Harvey 2009).
2.1.1 Introduction of basic concepts To understand the basics of pinch technology there are a few important concepts that must be defined:
• Hot/cold streams; • Heat exchangers, heaters and coolers; • ∆Tmin; • Composite curves; • The pinch; • Interval temperatures; • Grand composite curve.
A hot stream is a material stream with a specified flow and heat capacity that requires cooling in order for its temperature to be changed from an initial to a target value. A hot stream implies a cooling demand. Similarly, a cold stream requires heat in order for its temperature to be changed from the initial to a target value. A cold stream implies a heating demand.
There are three types of heat exchangers under consideration: An internal heat exchanger placed between two process streams, heaters that add heat to the process from an external heat source. The external heat source is called a hot utility and coolers that extract heat from the process to an external cooling system. The external cooling system is called a cold utility.
The minimum temperature approach, ∆Tmin, is the lowest temperature difference between the hot stream and the cold stream that can be accepted in a heat exchanger. Its value is
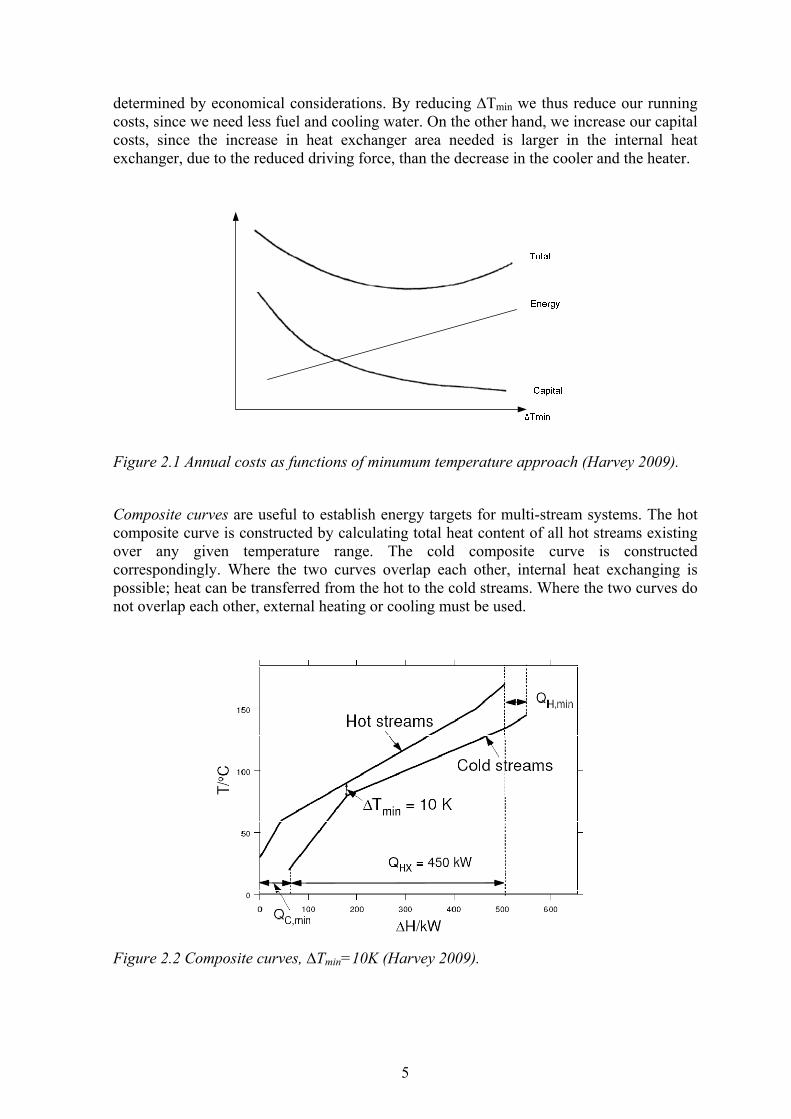
5
determined by economical considerations. By reducing ∆Tmin we thus reduce our running costs, since we need less fuel and cooling water. On the other hand, we increase our capital costs, since the increase in heat exchanger area needed is larger in the internal heat exchanger, due to the reduced driving force, than the decrease in the cooler and the heater.
Figure 2.1 Annual costs as functions of minumum temperature approach (Harvey 2009).
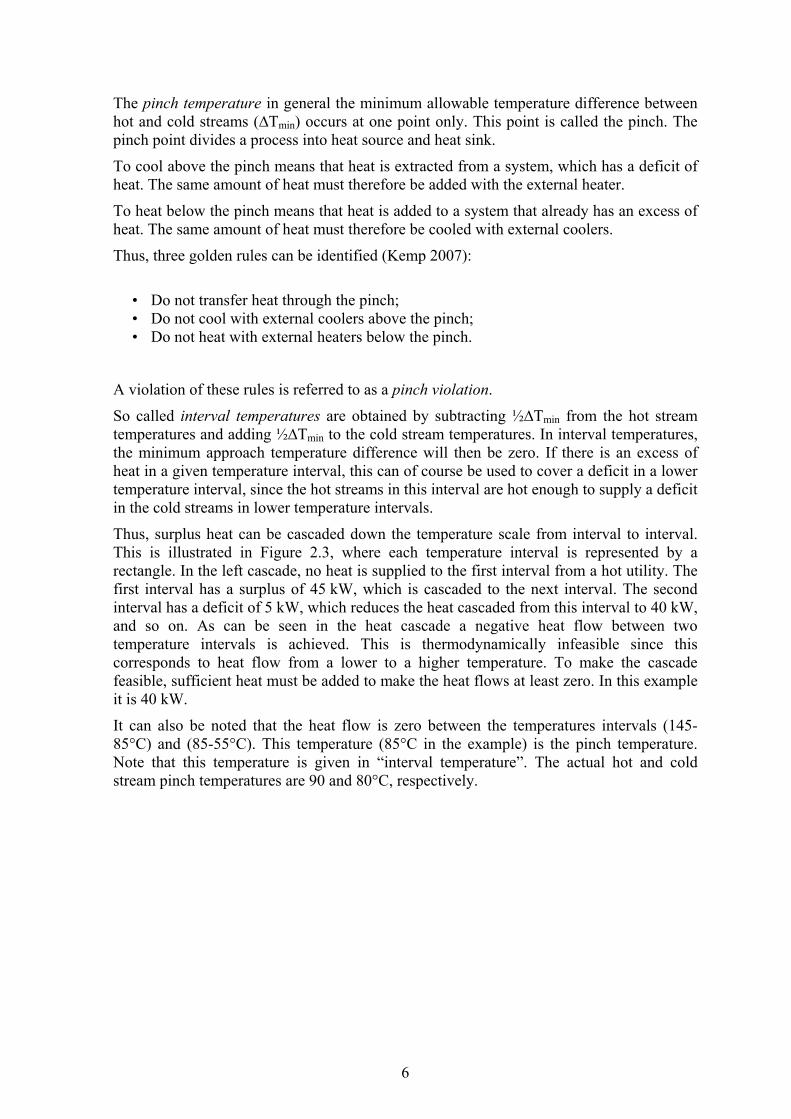
Composite curves are useful to establish energy targets for multi-stream systems. The hot composite curve is constructed by calculating total heat content of all hot streams existing over any given temperature range. The cold composite curve is constructed correspondingly. Where the two curves overlap each other, internal heat exchanging is possible; heat can be transferred from the hot to the cold streams. Where the two curves do not overlap each other, external heating or cooling must be used.
Figure 2.2 Composite curves, ∆Tmin=10K (Harvey 2009).
6
The pinch temperature in general the minimum allowable temperature difference between hot and cold streams (∆Tmin) occurs at one point only. This point is called the pinch. The pinch point divides a process into heat source and heat sink.
To cool above the pinch means that heat is extracted from a system, which has a deficit of heat. The same amount of heat must therefore be added with the external heater.
To heat below the pinch means that heat is added to a system that already has an excess of heat. The same amount of heat must therefore be cooled with external coolers.
Thus, three golden rules can be identified (Kemp 2007):
• Do not transfer heat through the pinch; • Do not cool with external coolers above the pinch; • Do not heat with external heaters below the pinch.
A violation of these rules is referred to as a pinch violation.
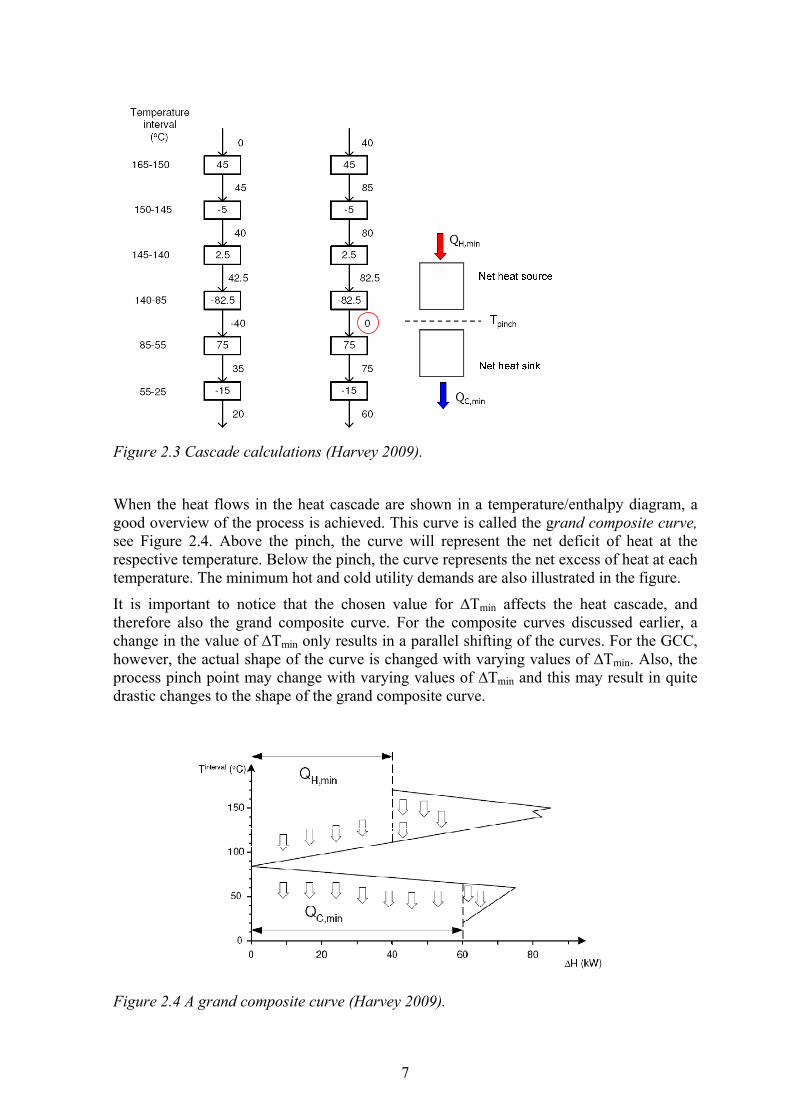
So called interval temperatures are obtained by subtracting ½∆Tmin from the hot stream temperatures and adding ½∆Tmin to the cold stream temperatures. In interval temperatures, the minimum approach temperature difference will then be zero. If there is an excess of heat in a given temperature interval, this can of course be used to cover a deficit in a lower temperature interval, since the hot streams in this interval are hot enough to supply a deficit in the cold streams in lower temperature intervals.
Thus, surplus heat can be cascaded down the temperature scale from interval to interval. This is illustrated in Figure 2.3, where each temperature interval is represented by a rectangle. In the left cascade, no heat is supplied to the first interval from a hot utility. The first interval has a surplus of 45 kW, which is cascaded to the next interval. The second interval has a deficit of 5 kW, which reduces the heat cascaded from this interval to 40 kW, and so on. As can be seen in the heat cascade a negative heat flow between two temperature intervals is achieved. This is thermodynamically infeasible since this corresponds to heat flow from a lower to a higher temperature. To make the cascade feasible, sufficient heat must be added to make the heat flows at least zero. In this example it is 40 kW.
It can also be noted that the heat flow is zero between the temperatures intervals (145-85°C) and (85-55°C). This temperature (85°C in the example) is the pinch temperature. Note that this temperature is given in “interval temperature”. The actual hot and cold stream pinch temperatures are 90 and 80°C, respectively.
7
Figure 2.3 Cascade calculations (Harvey 2009).
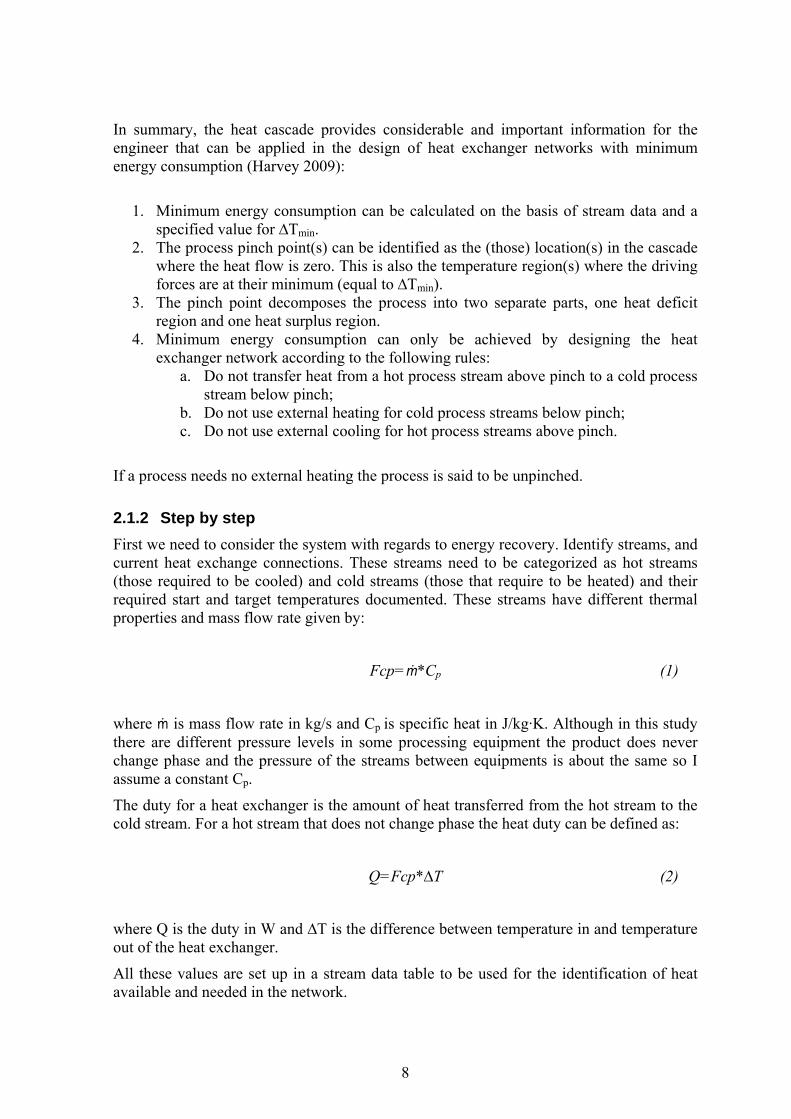
When the heat flows in the heat cascade are shown in a temperature/enthalpy diagram, a good overview of the process is achieved. This curve is called the grand composite curve, see Figure 2.4. Above the pinch, the curve will represent the net deficit of heat at the respective temperature. Below the pinch, the curve represents the net excess of heat at each temperature. The minimum hot and cold utility demands are also illustrated in the figure.
It is important to notice that the chosen value for ∆Tmin affects the heat cascade, and therefore also the grand composite curve. For the composite curves discussed earlier, a change in the value of ∆Tmin only results in a parallel shifting of the curves. For the GCC, however, the actual shape of the curve is changed with varying values of ∆Tmin. Also, the process pinch point may change with varying values of ∆Tmin and this may result in quite drastic changes to the shape of the grand composite curve.
Figure 2.4 A grand composite curve (Harvey 2009).
8
In summary, the heat cascade provides considerable and important information for the engineer that can be applied in the design of heat exchanger networks with minimum energy consumption (Harvey 2009):
1. Minimum energy consumption can be calculated on the basis of stream data and a
specified value for ∆Tmin. 2. The process pinch point(s) can be identified as the (those) location(s) in the cascade
where the heat flow is zero. This is also the temperature region(s) where the driving forces are at their minimum (equal to ∆Tmin).
3. The pinch point decomposes the process into two separate parts, one heat deficit region and one heat surplus region.
4. Minimum energy consumption can only be achieved by designing the heat exchanger network according to the following rules:
a. Do not transfer heat from a hot process stream above pinch to a cold process stream below pinch;
b. Do not use external heating for cold process streams below pinch; c. Do not use external cooling for hot process streams above pinch.
If a process needs no external heating the process is said to be unpinched.
2.1.2 Step by step First we need to consider the system with regards to energy recovery. Identify streams, and current heat exchange connections. These streams need to be categorized as hot streams (those required to be cooled) and cold streams (those that require to be heated) and their required start and target temperatures documented. These streams have different thermal properties and mass flow rate given by:
Fcp=ṁ*Cp (1)
where ṁ is mass flow rate in kg/s and Cp is specific heat in J/kg·K. Although in this study there are different pressure levels in some processing equipment the product does never change phase and the pressure of the streams between equipments is about the same so I assume a constant Cp.
The duty for a heat exchanger is the amount of heat transferred from the hot stream to the cold stream. For a hot stream that does not change phase the heat duty can be defined as:
Q=Fcp*∆T (2)
where Q is the duty in W and ∆T is the difference between temperature in and temperature out of the heat exchanger.
All these values are set up in a stream data table to be used for the identification of heat available and needed in the network.
9
The design of the heat exchangers is based on the minimum allowable temperature difference between the two streams being heat exchanged called the ∆Tmin. It is therefore critical to set this value to the optimal achievable value.
Next is to find the pinch temperature and composite curves. For these calculations, it is best to make use of a dedicated software program. In this study I use the Excel macro Propi2 for this purpose, which was developed by Chalmers Industry Energy Analysis, Sweden. With the above data the minimum energy consumption can be calculated and the current design compared to that value. Then it can be studied if there is possibility to retrofit the current design to reduce/eliminate pinch violations and improve energy efficiency.
For existing plants it is not realistic to propose the solution to be the same as the green field design one. Both due to economical reasons of replacing potentially all equipment as well as the physical placement of the streams themselves and any obstacles that might be between streams that are proposed to exchange heat in a green field design. Thus, existing equipment and layout needs to be taken into account when working on a retrofit design.
2.1.3 Properties of milk The fat content of the raw milk varies from 3.6% to 4.2% by season. The design parameters assume a set value of 3.9% fat which is the theoretical mean value of fat content in whole milk (Bylund 1995). That is the value I will use in my calculations. The fat content of light and skim milk is 1.5% and 0.05% respectively (MS).
When warmed the volume of milk increases. The coefficient of thermal expansion of fresh milk is approximately 0.335 cm3/kg·K (Hui 2007). This can affect design considerations for storage and flow rates through processing treatments. However, thermal expansion is not included in calculated flow rates in this study as they are negligible or around 0.0002% of the average flow volume.
The heat capacity in milk and cream depends strongly upon fat content. Milk fat has a heat capacity of 2,177 J/kg·K (Chandan 2006).
Specific heat is the ratio between the amount of heat necessary to raise a given weight of a substance to a specific temperature and the amount of heat necessary to raise an equal weight of water to the same temperature. It is nearly identical to heat capacity figure as the heat capacity of water is fairly constant over the range of 0-100°C (Hui 2007).
To be precise the heat capacity of skim milk increases with temperature from 50 to 140°C according to (Chandan 2006):
Heat capacity, skim milk = 2.814*temp in °C+3,824 (3)
And for whole milk in the range of 50-140°C is (Manufacturing):
Heat capacity, milk = 2.976*temp in C+3,692 (4)
10
where the heat capacity calculated is in J/kg·K. For lower temperature range things get more complicated due to the properties of milk fat, correctly referred to as "fat" as it is solid at room temperature opposed to "oil" which is liquid at room temperature. The melting points of individual triglycerides ranges from -75 to 72°C. However, the final melting point of milk fat is at 37°C because higher melting triglycerides dissolve in the liquid fat. This temperature is significant because 37°C is the body temperature of the cow and the milk would need to be liquid at this temperature. The melting curves of milk fat are complicated by the diverse lipid composition (Neil 2001).
This is of great relevance since most energy calculations are highly depend on the specific heat value of milk. Especially, for this study as in the milk pasteurizing process the heat exchangers have milk on both sides but with different temperatures and fat content. The decrease in flow for light and skim milk is almost entirely due to separation of milk fat.
In theory, it is safe to assume a fixed specific heat value (Cp value). However, the value of ∆Tmin can be very sensitive to variable Cp and this should be taken into account.
In dairy industry applications it is standard practice to use a fixed average value of Cp and further the value for skim milk of 3,977 J/kg·K (La Fondation de technologie laitére du Québec 1985). In accordance with this practice, I have chosen to neglect the slight variation of Cp with temperature but address this variation slightly in Appendix D. For the purpose of this study, as skim milk is the driver I assume a constant Cp value for skim milk as mentioned above and calculate Cp of whole milk and light milk by comparing relevant duties in the heat exchangers. For sour milk (13% fat content) and cream (36% fat content) I use a weighted average of the Cp values for skim milk (≈0% fat content) and 100% milk fat.
For water a Cp of 4,090 J/kg·K is assumed for hot water and 30% propylene glycol has a Cp value of 3,915 J/kg·K (The Engineering Toolbox).
Specific weight of milk is around 1 kg/L. Fattier products, such as cream, are a bit lighter than the less fatty ones (MS) but as the variation is small and design documents assume the above value, 1 kg/L is the value assumed for all relevant products in this study.
3 A DAIRY CASE STUDY – MS DAIRY PLANT IN REYKJAVÍK
For this study I had the cooperation of Mjólkursamsalan ehf. (MS), one of the two major dairy product producers in Iceland. The company has seven plants around Iceland each producing their part of the total product mix offered by the company. MS is in majority (93%) owned by 700 cow farmers in Iceland. Its role is to process milk produced by the owners into dairy products for consumers and its estimated yearly total amount of products produced was around 61,000 tonnes in 2009.
Around 100 milk producers deliver their milk to the MS factory in Reykjavík. Milk received per year is around 15 million litres from the producers in addition to 14 million litres from other MS plants for processing. In Reykjavík the main products are milk (whole milk, semi-skim and skim), sour milk, cream, cooking cream, baby milk and organic milk. In this report I will focus only on the three traditional products; milk, sour milk and cream. For the past few years there has been no growth in amount produced so yearly amounts produced are expected to stay approximately the same for the next few years.
11
Table 3-1 Key feedstock and production of Reykjavik dairy factory.
Feedstock Received 2008
[‘000 L]
Raw milk 23,750
Skim milk 5,700
Product Produced 2008
[‘000 L]
Whole milk 10.786
Light milk 11,909
Skim milk* 4,017
Cream 431
Sour milk** 1,028 *Both regular skim milk and vitamin added skim milk.
**All types of sour milk which have different flavour and fat content.
Interestingly, the balance of low fat products in the product line of the Reykjavík plant would leave them with excess cream if they would process all the low fat products out of raw milk. In the nearby town of Selfoss, where there is also a dairy farm located at the premises, the local plant produces butter and other fatty dairy products that need a lot of cream so they have excess skim milk. Hence, the Reykjavík plant orders a certain amount of skim milk from Selfoss to avoid a product balance with excess cream. Tankers with pasteurized skim milk are thus sent from the MS dairy plant in Selfoss to Reykjavík. The amount delivered in 2008 was around 5,700,000 L.
A part of this amount is blended with cream to produce light milk and a part is used for vitamin added skim milk but about 24% is directly used as regular skim milk. Currently, this skim milk is pasteurized again to get the product to packing (and due to reception contamination). This means that about 1,380,999 L/year of skim milk is in fact run through pasteurization twice. This indicates a potential energy savings by installing a completely separate line for the already pasteurized skim milk arriving from Selfoss, see Section 3.2.3.
3.1 Current energy consumption
As mentioned before plants producing mainly milk use energy for heating and pasteurization, cooling and refrigeration, lighting, air conditioning, pumping, and operating processing and auxiliary equipment. In this study, the main focus is on the specific energy requirements of the pasteurization process. Options to address energy consumptions are not directly quantified but discussed in Section 3.4.
As hot utility the plant has its own 11 kV high voltage electrical boiler which has a capacity of 3,000 kW but is run at about 1,300 kW. The electricity for the boiler is purchased from Reykjavik Energy generated from geothermal energy. This is however
12
unsecure energy which can be cut off unilaterally by RE. In 2008 MS purchased 2,754,023 kWh of electricity for the boiler. As a backup the plant has an oil boiler which is used about 2% on average per year which represents about 55,080 kWh of oil or about 32,412 barrels of oil equivalent per year.
The steam is produced from purified water and it is a closed loop using the condensate as input which returns at around 95°C. There are two steam storage units which keep steam at a pressure around 3-10 bars and the steam is delivered to the process at 3 bar and around 130-160°C (MS).
In addition to servicing this plant MS sells some steam to a nearby ice cream producing plant. This amount is currently not monitored and the ice cream plant pays a fixed monthly fee for the steam. The amount is contracted as 25% of operational costs for the boilers. This amount is based on the historical share of energy used as the ice cream plant was once a part of the dairy plant but is now a separate company. Recently, the ice cream plant has opened discussions as they claim they have made energy improvements but it is hard to verify this claim of lower consumption due to the fact there are no measurements. Also, historically energy prices have been low but are rising both because of increased capital costs of the energy companies, due to the current currency and financial crisis, and also there are plans on increasing taxes on energy. These factors mentioned above may lead to the necessity of putting up measuring equipment for the outgoing steam.
For cooling purposes a glycol mix (70% water and 30% monopropylene glycol) is used in circulation cooled with a compression chiller unit.
Main electrical equipment in the process is pumps, separators and homogenizers. Cooling compressors use up a lot of energy both for cooling in the pasteurization process, to compensate for heat losses in storage and also for refrigeration.
In listing the energy flows in Table 3-2, I only consider the milk, cream and sour milk pasteurization processes (not reception or final storage cooling nor the production of other products nor other operations such as therminization). The “base case” is defined as the current energy consumption.
Table 3-2 Energy flows per year, milk, cream and sour milk pasteurizing processes.
Base case [kWh/a]
Heat demand 265,696
Internal heat exchanging 2,920,126
Cooling demand 252,957
Electricity for pasteurization equipment 137,599
3.2 Main process
In MS Reykjavik factory, see layout in Figure 3.1, milk is received in the reception area and stored in raw milk tanks for further processing in the operation room before being packed and stored in a cooler before being loaded on trucks and shipped to customers.
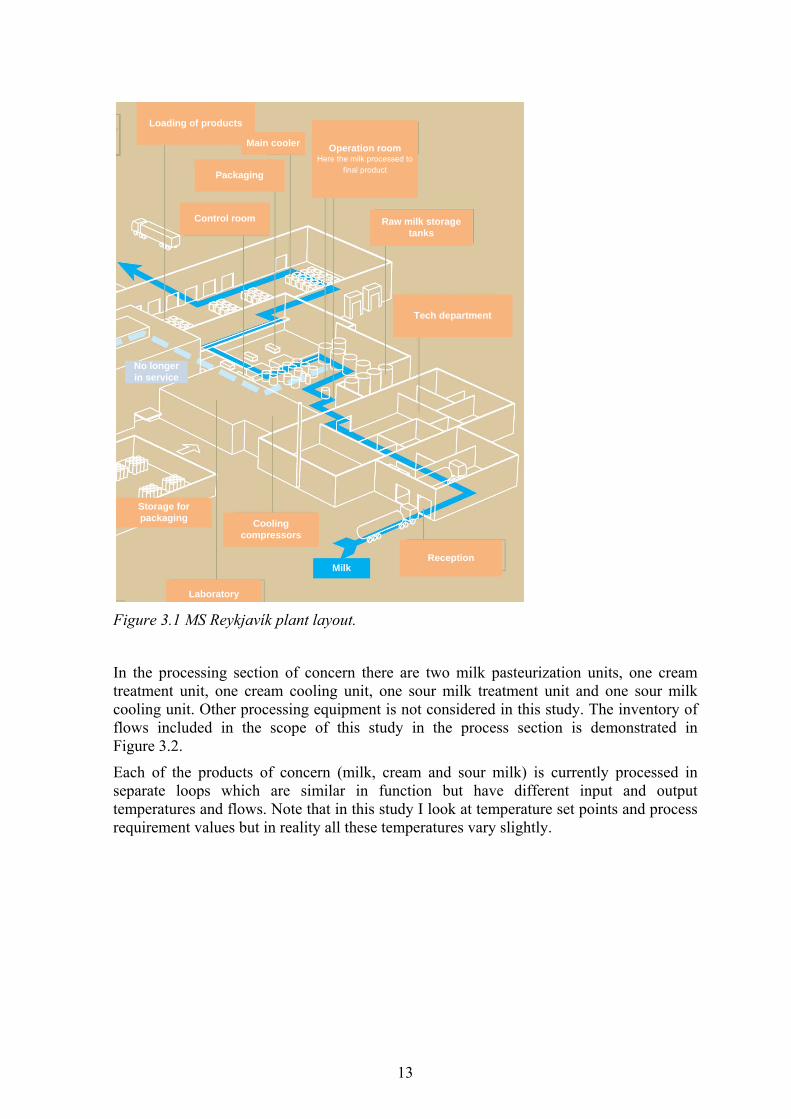
13
Figure 3.1 MS Reykjavík plant layout.
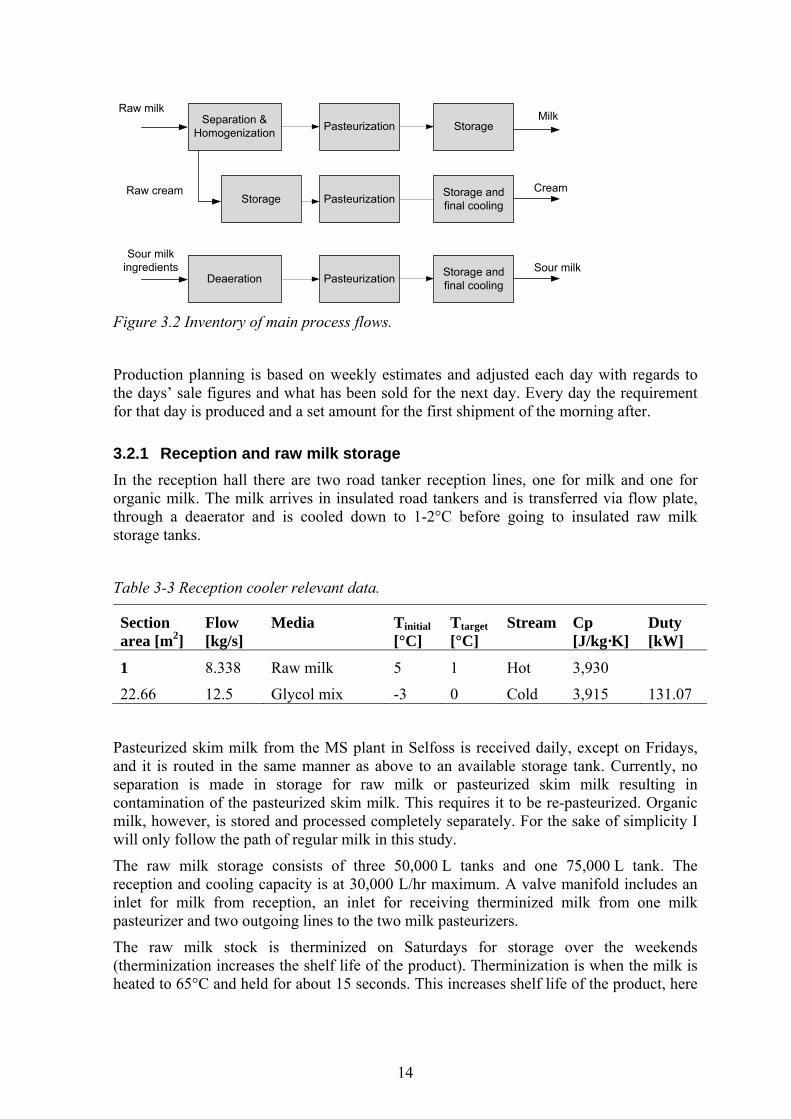
In the processing section of concern there are two milk pasteurization units, one cream treatment unit, one cream cooling unit, one sour milk treatment unit and one sour milk cooling unit. Other processing equipment is not considered in this study. The inventory of flows included in the scope of this study in the process section is demonstrated in Figure 3.2.
Each of the products of concern (milk, cream and sour milk) is currently processed in separate loops which are similar in function but have different input and output temperatures and flows. Note that in this study I look at temperature set points and process requirement values but in reality all these temperatures vary slightly.
Laboratory
Storage for packaging Cooling
compressors
Reception
Tech department
Raw milk storage tanks
Operation roomHere the milk processed to
final productPackaging
Control room
Milk
Loading of products
Main cooler
No longer in service
14
PasteurizationSeparation & Homogenization Storage
Pasteurization Storage and final cooling
Raw milkMilk
CreamRaw cream
PasteurizationDeaeration Storage and final cooling
Sour milk ingredients Sour milk
Storage
Figure 3.2 Inventory of main process flows.
Production planning is based on weekly estimates and adjusted each day with regards to the days’ sale figures and what has been sold for the next day. Every day the requirement for that day is produced and a set amount for the first shipment of the morning after.
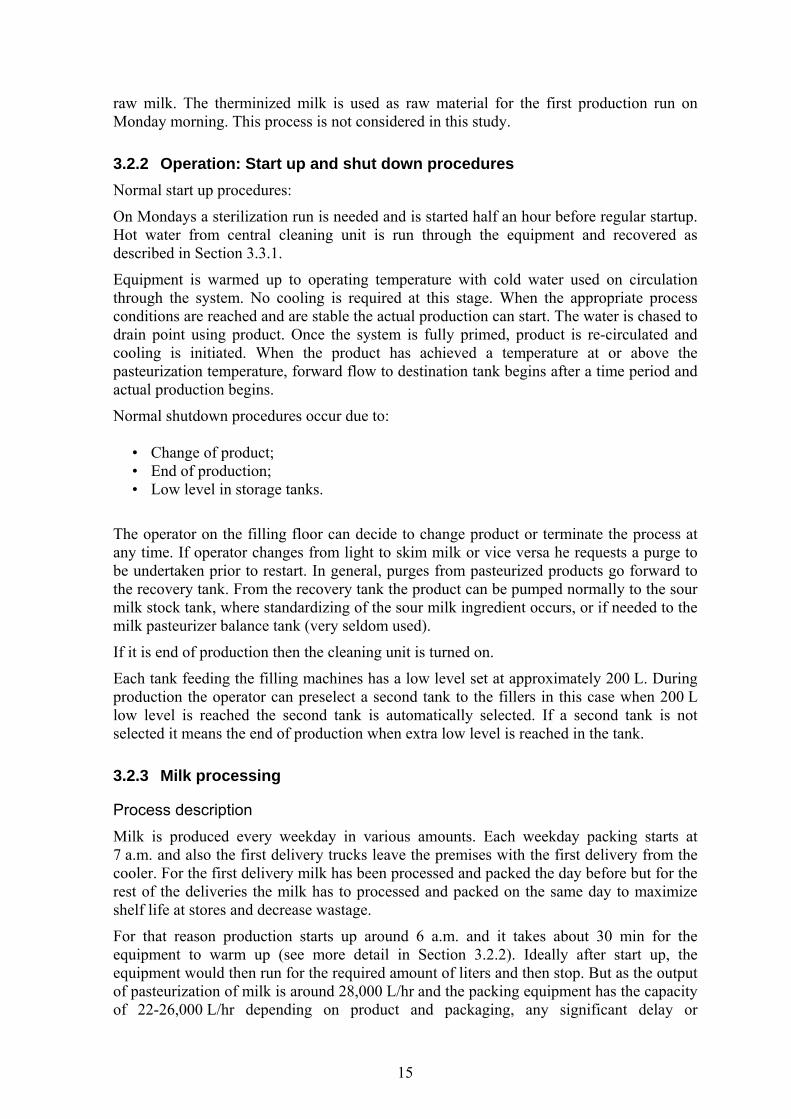
3.2.1 Reception and raw milk storage In the reception hall there are two road tanker reception lines, one for milk and one for organic milk. The milk arrives in insulated road tankers and is transferred via flow plate, through a deaerator and is cooled down to 1-2°C before going to insulated raw milk storage tanks.
Table 3-3 Reception cooler relevant data.
Section area [m2]
Flow [kg/s]
Media Tinitial [°C]
Ttarget [°C]
Stream Cp [J/kg·K]
Duty [kW]
1 8.338 Raw milk 5 1 Hot 3,930
22.66 12.5 Glycol mix -3 0 Cold 3,915 131.07
Pasteurized skim milk from the MS plant in Selfoss is received daily, except on Fridays, and it is routed in the same manner as above to an available storage tank. Currently, no separation is made in storage for raw milk or pasteurized skim milk resulting in contamination of the pasteurized skim milk. This requires it to be re-pasteurized. Organic milk, however, is stored and processed completely separately. For the sake of simplicity I will only follow the path of regular milk in this study.
The raw milk storage consists of three 50,000 L tanks and one 75,000 L tank. The reception and cooling capacity is at 30,000 L/hr maximum. A valve manifold includes an inlet for milk from reception, an inlet for receiving therminized milk from one milk pasteurizer and two outgoing lines to the two milk pasteurizers.
The raw milk stock is therminized on Saturdays for storage over the weekends (therminization increases the shelf life of the product). Therminization is when the milk is heated to 65°C and held for about 15 seconds. This increases shelf life of the product, here
15
raw milk. The therminized milk is used as raw material for the first production run on Monday morning. This process is not considered in this study.
3.2.2 Operation: Start up and shut down procedures Normal start up procedures:
On Mondays a sterilization run is needed and is started half an hour before regular startup. Hot water from central cleaning unit is run through the equipment and recovered as described in Section 3.3.1.
Equipment is warmed up to operating temperature with cold water used on circulation through the system. No cooling is required at this stage. When the appropriate process conditions are reached and are stable the actual production can start. The water is chased to drain point using product. Once the system is fully primed, product is re-circulated and cooling is initiated. When the product has achieved a temperature at or above the pasteurization temperature, forward flow to destination tank begins after a time period and actual production begins.
Normal shutdown procedures occur due to: • Change of product; • End of production; • Low level in storage tanks.
The operator on the filling floor can decide to change product or terminate the process at any time. If operator changes from light to skim milk or vice versa he requests a purge to be undertaken prior to restart. In general, purges from pasteurized products go forward to the recovery tank. From the recovery tank the product can be pumped normally to the sour milk stock tank, where standardizing of the sour milk ingredient occurs, or if needed to the milk pasteurizer balance tank (very seldom used).
If it is end of production then the cleaning unit is turned on.
Each tank feeding the filling machines has a low level set at approximately 200 L. During production the operator can preselect a second tank to the fillers in this case when 200 L low level is reached the second tank is automatically selected. If a second tank is not selected it means the end of production when extra low level is reached in the tank.
3.2.3 Milk processing
Process description Milk is produced every weekday in various amounts. Each weekday packing starts at 7 a.m. and also the first delivery trucks leave the premises with the first delivery from the cooler. For the first delivery milk has been processed and packed the day before but for the rest of the deliveries the milk has to processed and packed on the same day to maximize shelf life at stores and decrease wastage.
For that reason production starts up around 6 a.m. and it takes about 30 min for the equipment to warm up (see more detail in Section 3.2.2). Ideally after start up, the equipment would then run for the required amount of liters and then stop. But as the output of pasteurization of milk is around 28,000 L/hr and the packing equipment has the capacity of 22-26,000 L/hr depending on product and packaging, any significant delay or
16
malfunction in the packaging section results in a buildup of excess milk so in these cases milk flow from the raw milk storage tanks is stopped, all milk processed from the balance tank and water is put on closed loop circulation until the packaging unit has recovered. Same applies for sour milk and cream but with different nominal capacities. Also, when changing product a water purge is necessary.
Usually, the planned production does not finish until after 10 a.m. (when the sales numbers for the previous day arrive) but sometimes the process has to be run on water if the batch finishes before the adjustment of estimated production can take place. As it is not practical to stop the equipment in these cases cold water is taken in and put on circulation where it is heated and cooled as the milk would be in the process. When the milk starts again the water goes down the drain.
The last cycle of milk followed by water is run to a recovery tank as the water may have mixed a little with the milk making it unsuitable for standardized milk products. This “contaminated” milk is used as raw material for sour milk production. Then the equipment is cleaned by the centralized cleaning equipment, see description in Section 3.3.1.
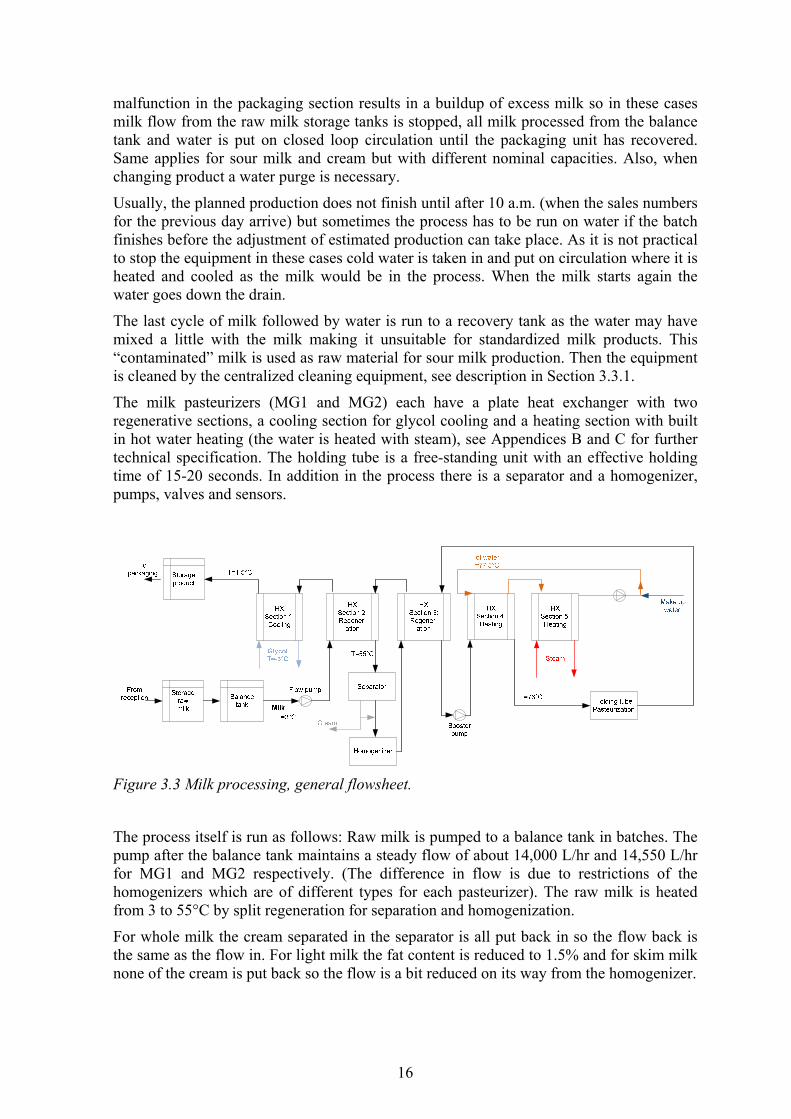
The milk pasteurizers (MG1 and MG2) each have a plate heat exchanger with two regenerative sections, a cooling section for glycol cooling and a heating section with built in hot water heating (the water is heated with steam), see Appendices B and C for further technical specification. The holding tube is a free-standing unit with an effective holding time of 15-20 seconds. In addition in the process there is a separator and a homogenizer, pumps, valves and sensors.
Figure 3.3 Milk processing, general flowsheet.
The process itself is run as follows: Raw milk is pumped to a balance tank in batches. The pump after the balance tank maintains a steady flow of about 14,000 L/hr and 14,550 L/hr for MG1 and MG2 respectively. (The difference in flow is due to restrictions of the homogenizers which are of different types for each pasteurizer). The raw milk is heated from 3 to 55°C by split regeneration for separation and homogenization.
For whole milk the cream separated in the separator is all put back in so the flow back is the same as the flow in. For light milk the fat content is reduced to 1.5% and for skim milk none of the cream is put back so the flow is a bit reduced on its way from the homogenizer.
17
After treatment the recombined/homogenized milk is heated from 55 to 76°C by split regeneration and then heated to pasteurization temperature, 76°C, by hot water. Then it is run through a holding tube to fully pasteurize the milk. Thereafter it is cooled to 8°C by regeneration (heat exchanges with the incoming milk) and final cooling to 1.5°C by -3°C glycol mix.
The pasteurization temperature is controlled indirectly by controlling the temperature of the hot water in the heater to a set point of 77.5°C. This set point controls the inflow of steam to heat the water. If this temperature goes below 72.3°C the equipment will be bypassed and send all the milk back to the balance tank.
Pasteurized milk is stored in one of four 20,000 L tanks where it is then sent to packaging. A general flowsheet of the process is shown in Figure 3.3.
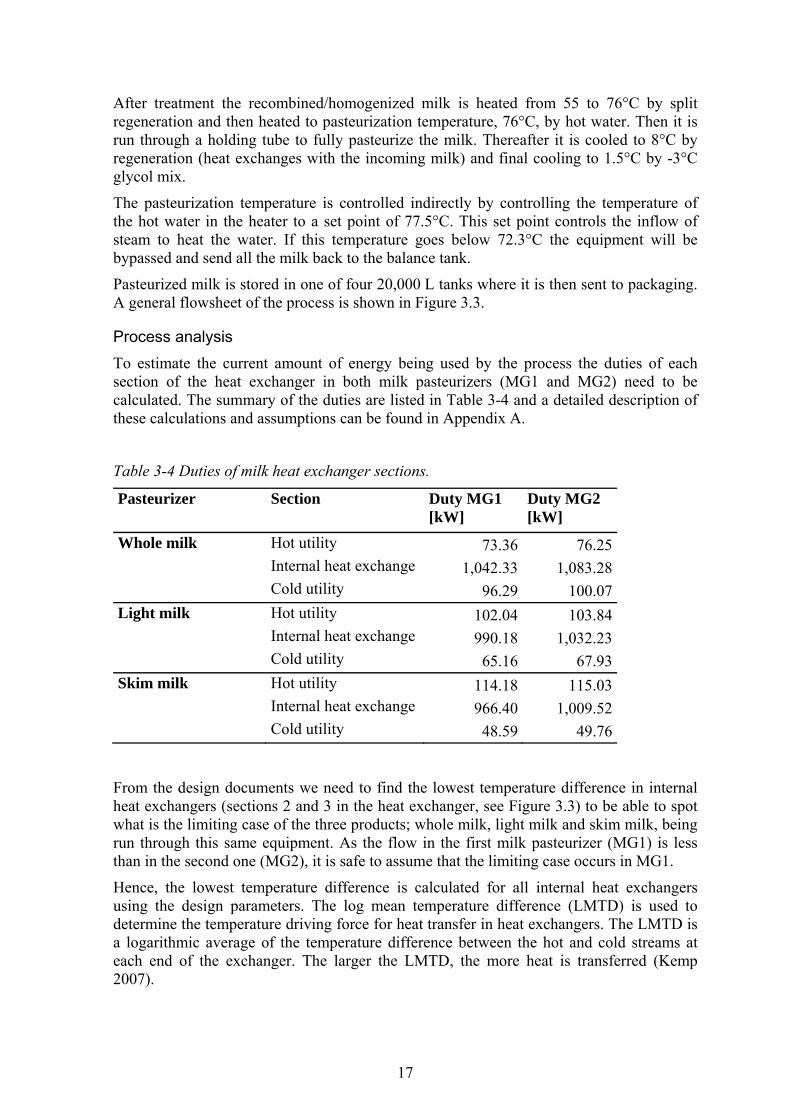
Process analysis To estimate the current amount of energy being used by the process the duties of each section of the heat exchanger in both milk pasteurizers (MG1 and MG2) need to be calculated. The summary of the duties are listed in Table 3-4 and a detailed description of these calculations and assumptions can be found in Appendix A.
Table 3-4 Duties of milk heat exchanger sections.
Pasteurizer Section Duty MG1 [kW]
Duty MG2 [kW]
Whole milk Hot utility 73.36 76.25 Internal heat exchange 1,042.33 1,083.28
Cold utility 96.29 100.07 Light milk Hot utility 102.04 103.84
Internal heat exchange 990.18 1,032.23 Cold utility 65.16 67.93 Skim milk Hot utility 114.18 115.03
Internal heat exchange 966.40 1,009.52 Cold utility 48.59 49.76
From the design documents we need to find the lowest temperature difference in internal heat exchangers (sections 2 and 3 in the heat exchanger, see Figure 3.3) to be able to spot what is the limiting case of the three products; whole milk, light milk and skim milk, being run through this same equipment. As the flow in the first milk pasteurizer (MG1) is less than in the second one (MG2), it is safe to assume that the limiting case occurs in MG1.
Hence, the lowest temperature difference is calculated for all internal heat exchangers using the design parameters. The log mean temperature difference (LMTD) is used to determine the temperature driving force for heat transfer in heat exchangers. The LMTD is a logarithmic average of the temperature difference between the hot and cold streams at each end of the exchanger. The larger the LMTD, the more heat is transferred (Kemp 2007).
18
The definition for LMTD for a countercurrent heat exchanger is:
LMTD= , , , ,
, ,, ,
(5)
As its name suggests LMTD is in fact only an elaborate way of calculating an average temperature difference. If the temperature profiles are parallel as they are in section 3 of the heat exchanger in this particular process then the LMTD is (Harvey 2009):
Thot,out -Tcold,in= Thot,in -Tcold,out (6)
where T are temperatures in K.
Once established it can be used to calculate the heat transfer in a heat exchanger by the simple equation:
Q=U*A*LMTD (7)
where U is the overall heat transfer coefficient in W/m2K, Q is the exchanged heat duty in W, and A is the exchange area in m2. This can be used also for sizing the heat exchanger but as the area is given in the design documents, and the duty already established , see Appendices A and B, there is no added value to calculate the U values in this particular process.
Design calculations from the dairy plant assume a slightly different flow and temperatures than actual run conditions. To locate what is the determining flow from which the dimensioning of the heat exchanger area is determined in the design I need to identify the lowest temperature difference. So, temperature differences and LMTD are calculated from the design data, see Table 3-5 below.
The determining flow is identified as the flow through heat exchanger, section 2 for skim milk with the temperature difference of 2K. Hence, we need to analyze the skim milk process further to determine the pinch point and maximum energy recovery.
Table 3-5 Temperature differences at heat exchanger extremities and LMTD of milk heat exchanger.
Section no.
Media* Tinitial* [°C]
Tfinal* [°C]
Stream H/C
Difference [°C]
LMTD [°C]
Whole milk
1 Whole milk 7.8 2.0 Hot 6.0 / hot end
Glycol -1.0 1.8 Cold 3.0 / cold end 4.5
2 Whole milk 67.8 7.8 Hot 4.8 / hot end
Raw milk 3.0 63.0 Cold 4.8 / cold end 4.8
19
3 Whole milk 75.1 67.8 Hot 4.8 / hot end
Whole milk 63.0 70.3 Cold 4.8 / cold end 4.8
4 Water 75.8 73.3 Hot 0.7 / hot end
Whole milk 70.3 75.1 Cold 3.0 / cold end 1.8
Light milk
1 Light milk 6.1 2.0 Hot 4.3 / hot end
Glycol -1.0 2.8 Cold 3.0 / cold end 3.6
2 Light milk 66.1 6.1 Hot 7.0 / hot end
Raw milk 3.0 59.1 Cold 3.1 / cold end 5.0
3 Light milk 77.0 66.1 Hot 7.0 / hot end
Light milk 59.1 70.0 Cold 7.0 / cold end 7.0
4 Water 77.9 74.4 Hot 0.9 / hot end
Light milk 70.0 77.0 Cold 4.4 / cold end 2.6
Skim milk
1 Skim milk 5.0 2.0 Hot 2.7 / hot end
Glycol -1.0 2.3 Cold 3.0 / cold end 2.8
2 Skim milk 62.3 5.0 Hot 7.5 / hot end
Raw milk 3.0 54.8 Cold 2.0 / cold end 4.7
3 Skim milk 75.0 62.3 Hot 7.5 / hot end
Skim milk 54.8 67.5 Cold 7.5 / cold end 7.5
4 Water 75.9 72.2 Hot 0.9 / hot end
Skim milk 67.5 75.0 Cold 4.7 / cold end 2.8
*Values from the design documents, see Appendix B.
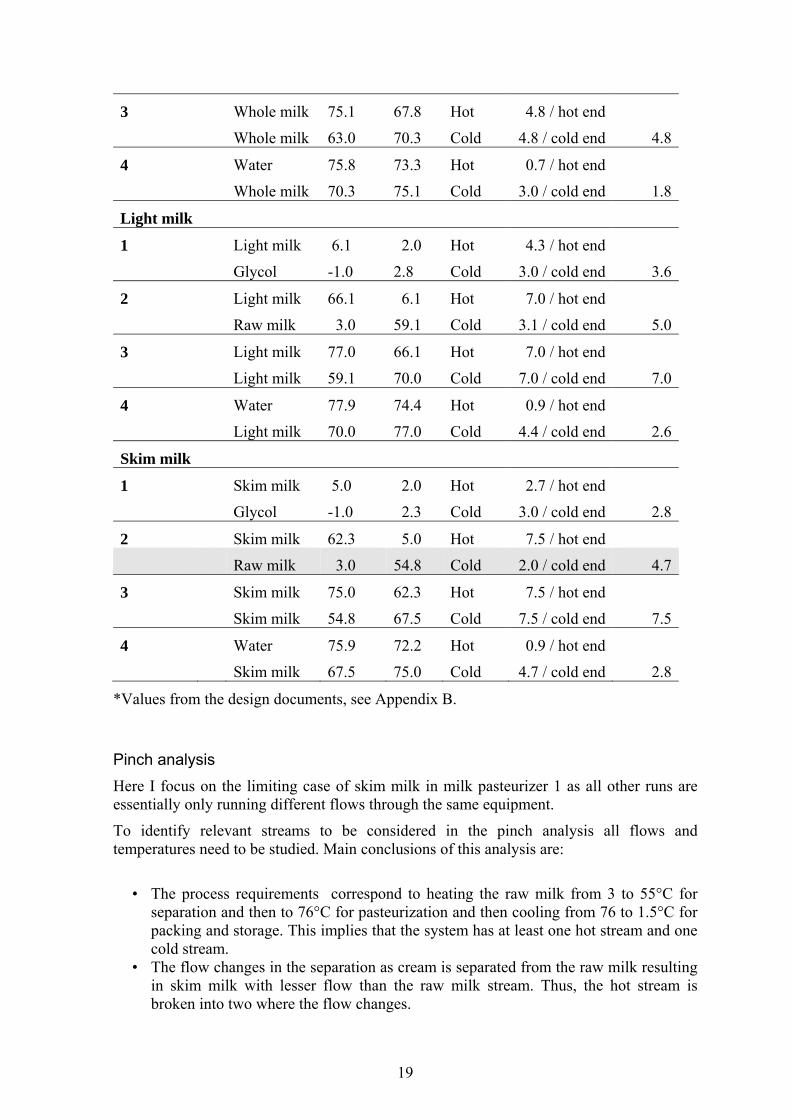
Pinch analysis Here I focus on the limiting case of skim milk in milk pasteurizer 1 as all other runs are essentially only running different flows through the same equipment.
To identify relevant streams to be considered in the pinch analysis all flows and temperatures need to be studied. Main conclusions of this analysis are:
• The process requirements correspond to heating the raw milk from 3 to 55°C for
separation and then to 76°C for pasteurization and then cooling from 76 to 1.5°C for packing and storage. This implies that the system has at least one hot stream and one cold stream.
• The flow changes in the separation as cream is separated from the raw milk resulting in skim milk with lesser flow than the raw milk stream. Thus, the hot stream is broken into two where the flow changes.
20
The above analysis results in identifying three streams for pinch analysis (see Figure 3.4):
1. Raw milk to separation; heating from 3 to 55°C; 2. Skim milk from separation to pasteurization; heating from 55 to 76°C; 3. Pasteurized skim milk to packing and storage, cooling from 76 to 1.5°C.
Figure 3.4 Streams in milk main process for pinch analysis.
Using the minimum temperature approach, ∆Tmin, the lowest temperature difference between the hot stream and the cold stream that can be accepted in a heat exchanger needs to be identified. All temperature differences are calculated in Table 3-5 and show that the minimum allowable difference for this process is in the first regeneration sections of the heat exchanger and is 2K. Hence, the ∆Tmin is equal to 2K for milk.
For the hot and cold utility in the skim milk process, ∆Tmin is 0.7K and 2.7K respectively, see Table 3-5.
To perform the pinch analysis for this specific network the inputs listed in Table 3-6 are run through Propi software and the results of that analysis are to be found in Table 3-7.
21
Table 3-6 Inputs in milk main process for pinch analysis.
Stream no.
H/C Tinitial [°C]
Ttarget [°C]
Flow [kg/s]
Cp [J/kg·K]
Duty [kW]
DT* [K]
1 Cold 3.0 55.0 3.8889 3,930 794.74 1
2 Cold 55.0 76.0 3.4225 3,977 285.84 1
4 Hot 76.0 1.5 3.4225 3,977 1,014.99 1
HW Hot 77.5 73.7 0.35
GL Cold -3.0 0.7 1.35
*This represents the individual stream contribution to minimum acceptable temperature difference.
Table 3-7 Milk. Pinch temperature and hot and cold utility.
Pinch temp. [°C]
Minimum hot utility [kW]
Minimum cold utility [kW]
Actual hot utility [kW]
Actual cold utility [kW]
4 113.27 47.68 114.18 48.59
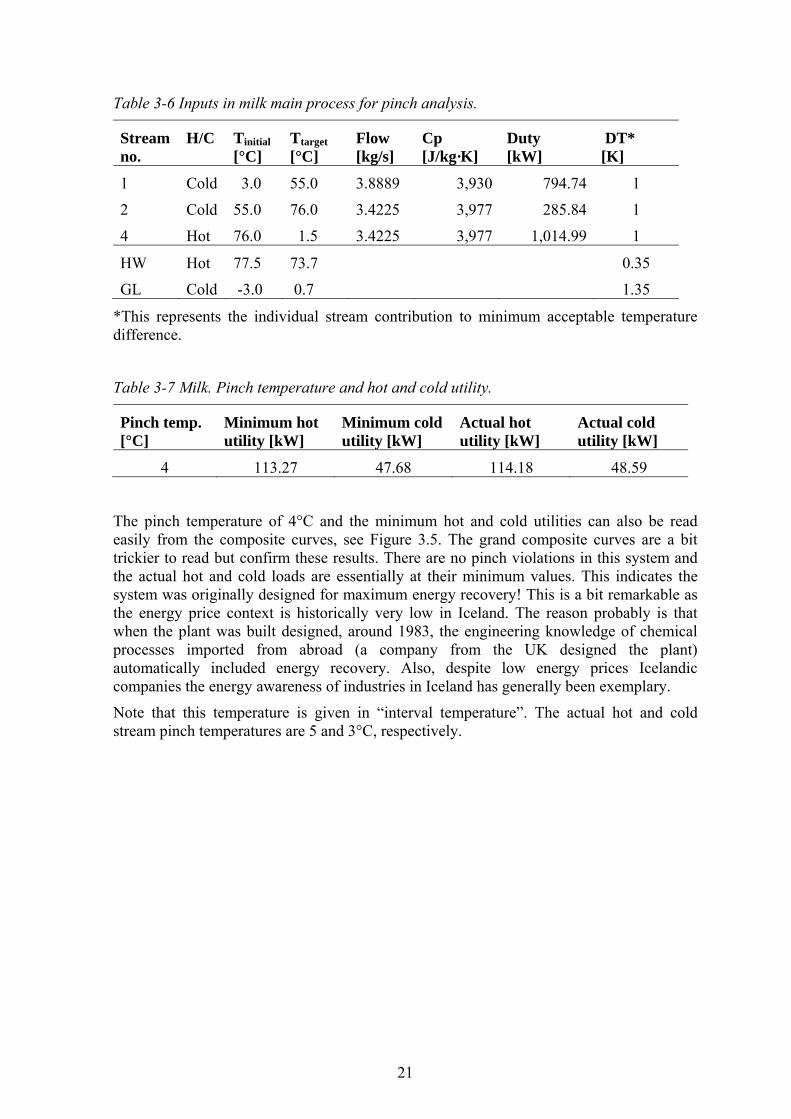
The pinch temperature of 4°C and the minimum hot and cold utilities can also be read easily from the composite curves, see Figure 3.5. The grand composite curves are a bit trickier to read but confirm these results. There are no pinch violations in this system and the actual hot and cold loads are essentially at their minimum values. This indicates the system was originally designed for maximum energy recovery! This is a bit remarkable as the energy price context is historically very low in Iceland. The reason probably is that when the plant was built designed, around 1983, the engineering knowledge of chemical processes imported from abroad (a company from the UK designed the plant) automatically included energy recovery. Also, despite low energy prices Icelandic companies the energy awareness of industries in Iceland has generally been exemplary.
Note that this temperature is given in “interval temperature”. The actual hot and cold stream pinch temperatures are 5 and 3°C, respectively.
22
Figure 3.5 Composite curves for milk main process.
As there are no pinch violations in the current network design thus no retrofit design is proposed for this system with regards to heat transfer.
Energy management Excluding start up and shut down procedures the milk processing equipment runs on water for about a half an hour each production day. In that operation the flows are the same as for whole milk, that is no separation occurs, and I assume the temperatures are the same. As water has a higher Cp value the energy used is slightly higher than in a milk run. By minimizing this time on standby considerable energy and monetary savings can be obtained and the monetary savings are bound to increase as energy prices rise like discussed earlier, see Table 3-8.
Table 3-8 Energy consumption per year for milk process on water circulation.
Hot utility [kW]
Cold utility [kW]
Electricity [kW]
Time* [h/a]
Total
MG1 76.35 100.21 60.56 130 30,826 kWh/a
MG2 79.35 104.41 63.61 130 32,158 kWh/a
Current cost (assuming 7 ISK/kWh) 440,886 ISK per year
Future cost (assuming 9 ISK/kWh) 566,853 ISK per year
*Average time running on water.
Considering the deliveries of already pasteurized skim milk of about 1,380,999 L/year that could be used directly as skim milk for packaging, but are currently double pasteurized, the energy lost per year is 21,899 kWh and the estimated annual cost is 152,268 ISK with current assumed energy price, see Table 3-9. This could be avoided by adding a separate storage tank with a direct connection to packaging and separate reception line. With energy prices and the demand for less fatty products going up the energy saved with this arrangement should be kept in mind. However, with regards to investment cost of
23
equipment skyrocketing due to the major depreciation of the Icelandic krona and its small return it does not seem to be a feasible investment in the near future.
Table 3-9 Energy consumption and cost due to double pasteurization of skim milk.
Hot utility [kWh/a]
Cold utility [kWh/a]
Electricity [kWh/a]
Total
MG1 5,523 2,350 2,929 10,803 kWh/a
MG2 5,564 2,455 3,077 11,096 kWh/a
Current cost (assuming 7 ISK/kWh) 153,292 ISK per year
Future cost (assuming 9 ISK/kWh) 197,089 ISK per year
See Appendix A for details on calculations.
An additional concern regarding energy efficiency is the potential over sizing of pumps in the process. Over sizing of pumps leads to them not operating at optimal levels and thus using more energy than actually needed for operation. In this study I did not go into the sizing of pumps in particular.
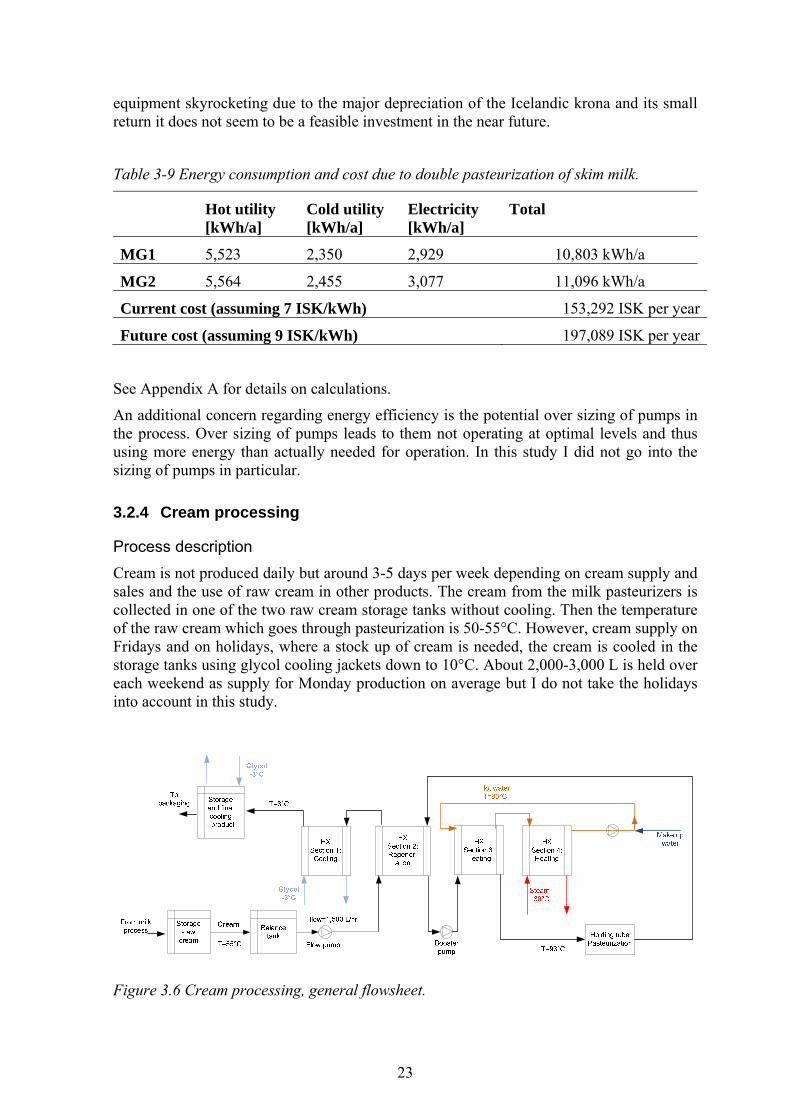
3.2.4 Cream processing
Process description Cream is not produced daily but around 3-5 days per week depending on cream supply and sales and the use of raw cream in other products. The cream from the milk pasteurizers is collected in one of the two raw cream storage tanks without cooling. Then the temperature of the raw cream which goes through pasteurization is 50-55°C. However, cream supply on Fridays and on holidays, where a stock up of cream is needed, the cream is cooled in the storage tanks using glycol cooling jackets down to 10°C. About 2,000-3,000 L is held over each weekend as supply for Monday production on average but I do not take the holidays into account in this study.
Figure 3.6 Cream processing, general flowsheet.
24
Raw cream is pumped from one of the two raw cream storage tanks to the balance tank. From the balance tank the cream is pumped at a rate of 1,500 L/hr through a heat exchanger for preheating and then is then pumped through a heater where it reaches about 93°C. This temperature is controlled indirectly by controlling the temperature of the hot water of the heater at a set point of 94°C. The cream is then held at pasteurization temperature for 15-20 seconds. If this temperature goes below 87°C the equipment will bypass and send all the cream back to the balance tank.
After pasteurization the cream is cooled by heat exchanging with the incoming cream and then cooled to 8°C by -3°C glycol solution. The pasteurized cream is filled into one of three 3,000 L pasteurized cream storage tanks that each have a glycol mix cooling jacket and the temperature of the cream is cooled to 2°C and then maintained at the desired value by on/off control of the glycol feed due to losses. Afterwards, the cream is run through to packaging, see Figure 3.6.
Process analysis To estimate the current amount of energy being used by the process the duties of each section of the cream heat need to be calculated.
Note that the cases described in the process analysis of intake temperatures of 10 and 55°C, depending on if the cream is processed soon after separation or after cooling, are in fact the same with regards to energy consumption. The load of cold utility is just shifted. That is to say, if the cream is cooled to 10°C in the tank before running through the system it can absorb more heat from the hot stream resulting in lower cooling demand of the hot stream by the same amount as the load was in the tank initially. If it is not cooled the cooling demand of the hot stream after internal heat exchange is higher by the same amount. Hence, these cases are regarded as equivalent with regards to hot and cold utility and I thus elected to only study the 10°C intake temperature but add the duty of cooling of the raw cream. The duty of internal heat exchange however will change depending on intake temperature.
As in the milk processing case the hot water is defined as the hot utility. The cold utility consists of cooling from 55 to 10°C in initial tank, cooling of hot stream down to 8°C and final cooling from 8 to 2°C in final storage tank. The duties are listed in Table 3-10 and a detailed description of these calculations and assumptions can be found in Appendix A.
Table 3-10 Duties of cream heat exchanger sections and tanks.
Pasteurizer Section Duty [kW] Cream Hot utility 19.56
Internal heat exchange (10/55°C) 95.58 / 30.66 Cold utility 93.08
Pinch analysis To find out the individual stream contribution to temperature difference it needs to be calculated from the design data, see results in Table 3-11. Note that section 4 is the steam
25
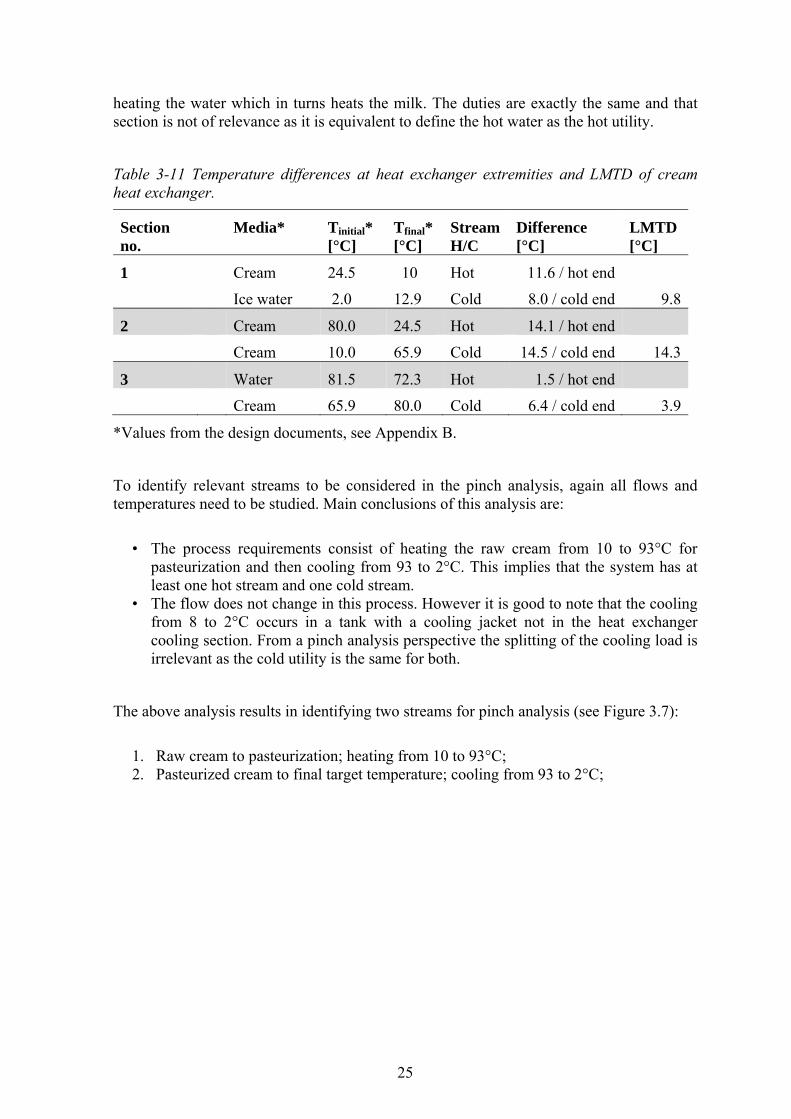
heating the water which in turns heats the milk. The duties are exactly the same and that section is not of relevance as it is equivalent to define the hot water as the hot utility.
Table 3-11 Temperature differences at heat exchanger extremities and LMTD of cream heat exchanger.
Section no.
Media* Tinitial* [°C]
Tfinal* [°C]
Stream H/C
Difference [°C]
LMTD [°C]
1 Cream 24.5 10 Hot 11.6 / hot end
Ice water 2.0 12.9 Cold 8.0 / cold end 9.8
2 Cream 80.0 24.5 Hot 14.1 / hot end
Cream 10.0 65.9 Cold 14.5 / cold end 14.3
3 Water 81.5 72.3 Hot 1.5 / hot end
Cream 65.9 80.0 Cold 6.4 / cold end 3.9
*Values from the design documents, see Appendix B.
To identify relevant streams to be considered in the pinch analysis, again all flows and temperatures need to be studied. Main conclusions of this analysis are:
• The process requirements consist of heating the raw cream from 10 to 93°C for
pasteurization and then cooling from 93 to 2°C. This implies that the system has at least one hot stream and one cold stream.
• The flow does not change in this process. However it is good to note that the cooling from 8 to 2°C occurs in a tank with a cooling jacket not in the heat exchanger cooling section. From a pinch analysis perspective the splitting of the cooling load is irrelevant as the cold utility is the same for both.
The above analysis results in identifying two streams for pinch analysis (see Figure 3.7):
1. Raw cream to pasteurization; heating from 10 to 93°C; 2. Pasteurized cream to final target temperature; cooling from 93 to 2°C;
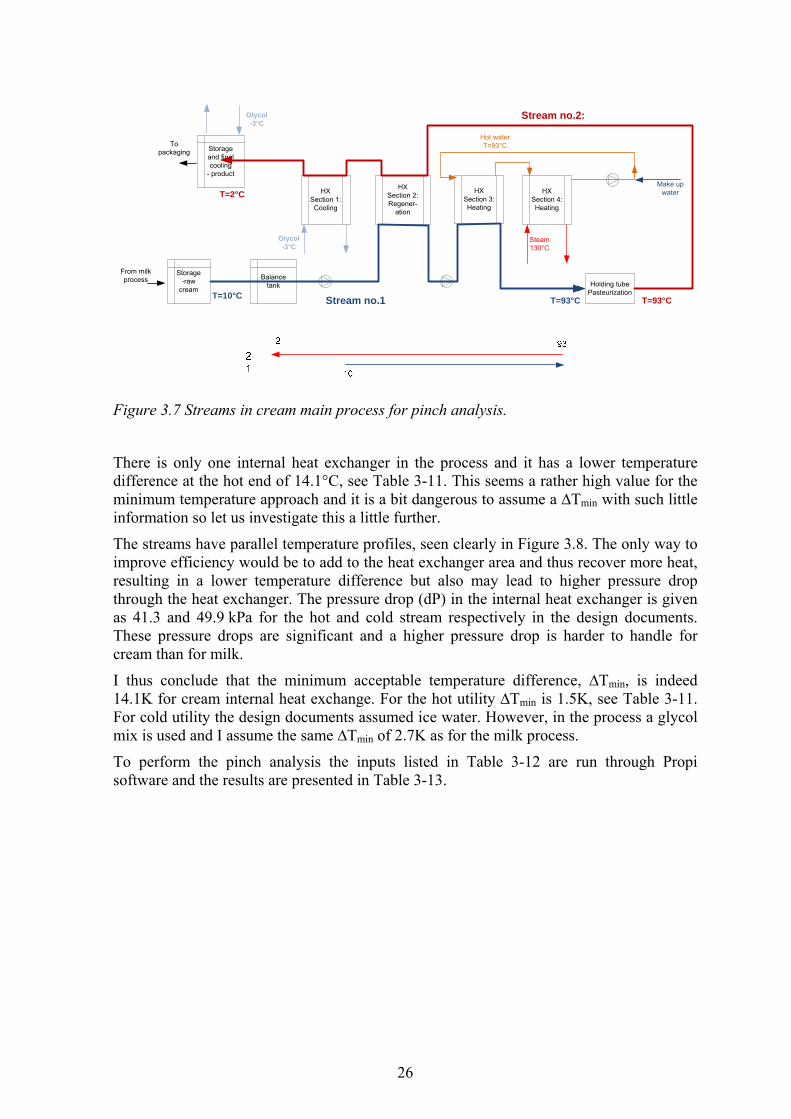
26
Storage-raw
cream
Balance tank
Storage and final cooling
- product
Holding tubePasteurization
HXSection 3:Heating
HXSection 4:Heating
Steam 130°C
HXSection 2:Regener-
ation
HXSection 1:Cooling
Glycol -3°C
Make up water
Hot waterT=93°CTo
packaging
Glycol -3°C
From milk process
Stream no.1
Stream no.2:
T=2°C
T=10°C T=93°C T=93°C
Figure 3.7 Streams in cream main process for pinch analysis.
There is only one internal heat exchanger in the process and it has a lower temperature difference at the hot end of 14.1°C, see Table 3-11. This seems a rather high value for the minimum temperature approach and it is a bit dangerous to assume a ∆Tmin with such little information so let us investigate this a little further.
The streams have parallel temperature profiles, seen clearly in Figure 3.8. The only way to improve efficiency would be to add to the heat exchanger area and thus recover more heat, resulting in a lower temperature difference but also may lead to higher pressure drop through the heat exchanger. The pressure drop (dP) in the internal heat exchanger is given as 41.3 and 49.9 kPa for the hot and cold stream respectively in the design documents. These pressure drops are significant and a higher pressure drop is harder to handle for cream than for milk.
I thus conclude that the minimum acceptable temperature difference, ∆Tmin, is indeed 14.1K for cream internal heat exchange. For the hot utility ∆Tmin is 1.5K, see Table 3-11. For cold utility the design documents assumed ice water. However, in the process a glycol mix is used and I assume the same ∆Tmin of 2.7K as for the milk process.
To perform the pinch analysis the inputs listed in Table 3-12 are run through Propi software and the results are presented in Table 3-13.
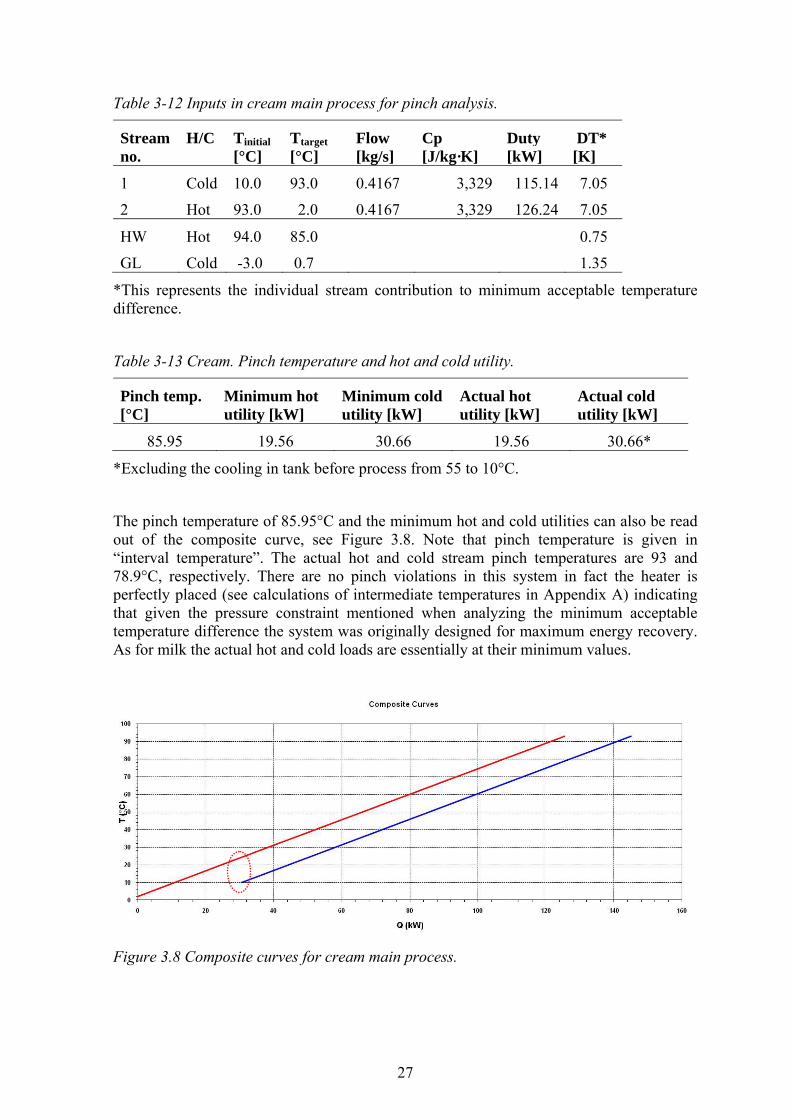
27
Table 3-12 Inputs in cream main process for pinch analysis.
Stream no.
H/C Tinitial [°C]
Ttarget [°C]
Flow [kg/s]
Cp [J/kg·K]
Duty [kW]
DT* [K]
1 Cold 10.0 93.0 0.4167 3,329 115.14 7.05
2 Hot 93.0 2.0 0.4167 3,329 126.24 7.05
HW Hot 94.0 85.0 0.75
GL Cold -3.0 0.7 1.35
*This represents the individual stream contribution to minimum acceptable temperature difference.
Table 3-13 Cream. Pinch temperature and hot and cold utility.
Pinch temp. [°C]
Minimum hot utility [kW]
Minimum cold utility [kW]
Actual hot utility [kW]
Actual cold utility [kW]
85.95 19.56 30.66 19.56 30.66*
*Excluding the cooling in tank before process from 55 to 10°C.
The pinch temperature of 85.95°C and the minimum hot and cold utilities can also be read out of the composite curve, see Figure 3.8. Note that pinch temperature is given in “interval temperature”. The actual hot and cold stream pinch temperatures are 93 and 78.9°C, respectively. There are no pinch violations in this system in fact the heater is perfectly placed (see calculations of intermediate temperatures in Appendix A) indicating that given the pressure constraint mentioned when analyzing the minimum acceptable temperature difference the system was originally designed for maximum energy recovery. As for milk the actual hot and cold loads are essentially at their minimum values.
Figure 3.8 Composite curves for cream main process.
28
As there are no pinch violations in the current network design thus no retrofit design is proposed for this system with regards to heat transfer. The only way already mentioned to increase efficiency for parallel temperature profiles is to enlarge the heat exchanger area and this would need a more detailed analysis on what exactly is the acceptable pressure drop for cream in a heat exchanger. This will not be carried out in this study.
Energy management Excluding start up and shut down procedures the cream processing equipment runs on water for about an hour each production day on average (remember cream is only produced part of the week). The water is not cooled in the tank only down to 8°C in the process. The energy used for this purpose is rather small as all there are no major electrical equipment only pumps. By minimizing this time on standby some energy and monetary savings can be obtained, see Table 3-14 (see assumptions in more detail in Appendix A).
Table 3-14 Energy consumption per year for cream process on water circulation.
Hot utility [kW]
Cold utility [kW]
Electricity [kW]
Time* [h/a]
Total
Cream 24.03 27.44 5.49 208 11,847 kWh/a
Current cost (assuming 7 ISK/kWh) 82,933 ISK per year
Future cost (assuming 9 ISK/kWh) 106,628 ISK per year
*Average time running on water.
3.2.5 Sour milk processing
Process description The raw sour milk stock tank is filled from the recovery tank. Skim milk concentrate (high in protein) and pasteurized cream (high in fat content) are mixed to the stock tank until the desired level of protein and fat is reached. From the stock tank the milk is re-pasteurized in the sour milk pasteurizer. The reason why it is pasteurized again is that sour milk needs to reach a higher temperature for pasteurization to get the right flora of bacteria.
Raw sour milk from the stock tank is pumped to the balance tank. Then a pump is set to maintain a flow of 3,300 L/hr. First the sour milk is preheated from about 5°C with the outgoing warm sour milk in a heat exchanger. Then it is run through a heater to a set point of 76°C and then passed forward to the deaerator which is under vacuum and where the temperature drops about 6°C. Afterwards, the sour milk is homogenized and run through a second heat exchanger and finally through a second heater to reach its pasteurization temperature at a set point of 94°C and held in a spiral holding tube. If this temperature goes below 90°C the equipment will bypass and send all the sour milk back to the balance tank.
After holding it is cooled by heat exchanging with the incoming milk (in two sections of the heat exchanger) and then it is reheated to set point of 22.5°C with warm water and then it is sent to a storage tank. This incubation temperature is held for 18 - 20 hours and then the sour milk is pumped to a tank with a warm water cooling jacket where the sour milk is
29
cooled to 15°C. It is packed at that temperature and then put in a specific place in the main cooler, where there are extra cooling blowers, and cooled to 4°C.
For the sour milk process the hot utility is again hot water heated by steam, but also warm water provided by mixing hot geothermal water and cold water in a thermostatic mixing valve controlled by the set points in temperature.
Figure 3.9 Sour milk processing, general flowsheet.
Process analysis Temperature differences are calculated for all internal heat exchangers using the design parameters, see Table 3-15 below. The determining temperature difference is identified as 9.1K.
Table 3-15 Temperature differences at heat exchanger extremities and LMTD of sour milk heat exchanger.
Section no.
Media* Tinitial* [°C]
Tfinal* [°C]
Stream H/C
Difference [°C]
LMTD [°C]
1 Water 28.7 22.3 Hot 7.7 / hot end
Sour milk 14.2 21.0 Cold 8.1 / cold end 7.9
2 Sour milk 70.0 14.1 Hot 9.1 / hot end
Sour milk 5.0 60.9 Cold 9.1 / cold end 9.1
3 Water 71.5 63.4 Hot 1.5 / hot end
Sour milk 60.0 70.0 Cold 3.4 / cold end 2.4
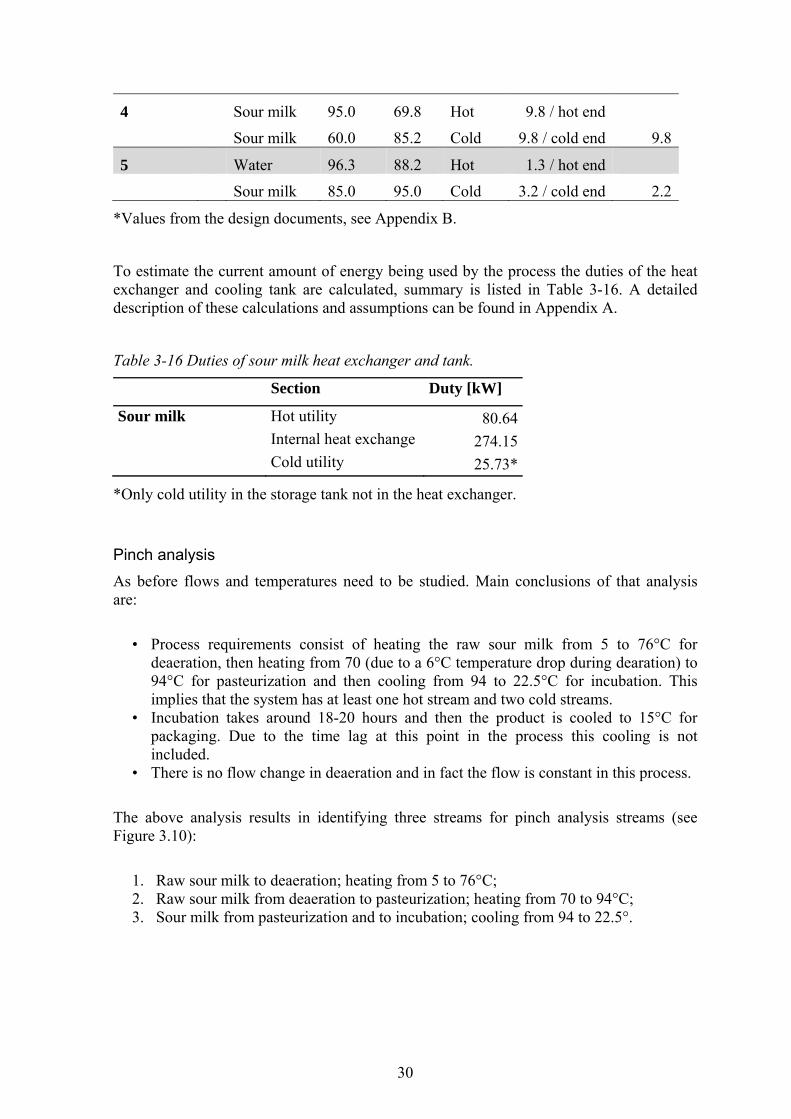
30
4 Sour milk 95.0 69.8 Hot 9.8 / hot end
Sour milk 60.0 85.2 Cold 9.8 / cold end 9.8
5 Water 96.3 88.2 Hot 1.3 / hot end
Sour milk 85.0 95.0 Cold 3.2 / cold end 2.2
*Values from the design documents, see Appendix B.
To estimate the current amount of energy being used by the process the duties of the heat exchanger and cooling tank are calculated, summary is listed in Table 3-16. A detailed description of these calculations and assumptions can be found in Appendix A.
Table 3-16 Duties of sour milk heat exchanger and tank.
Section Duty [kW]
Sour milk Hot utility 80.64Internal heat exchange 274.15
Cold utility 25.73*
*Only cold utility in the storage tank not in the heat exchanger.
Pinch analysis As before flows and temperatures need to be studied. Main conclusions of that analysis are:
• Process requirements consist of heating the raw sour milk from 5 to 76°C for
deaeration, then heating from 70 (due to a 6°C temperature drop during dearation) to 94°C for pasteurization and then cooling from 94 to 22.5°C for incubation. This implies that the system has at least one hot stream and two cold streams.
• Incubation takes around 18-20 hours and then the product is cooled to 15°C for packaging. Due to the time lag at this point in the process this cooling is not included.
• There is no flow change in deaeration and in fact the flow is constant in this process.
The above analysis results in identifying three streams for pinch analysis streams (see Figure 3.10):
1. Raw sour milk to deaeration; heating from 5 to 76°C; 2. Raw sour milk from deaeration to pasteurization; heating from 70 to 94°C; 3. Sour milk from pasteurization and to incubation; cooling from 94 to 22.5°.
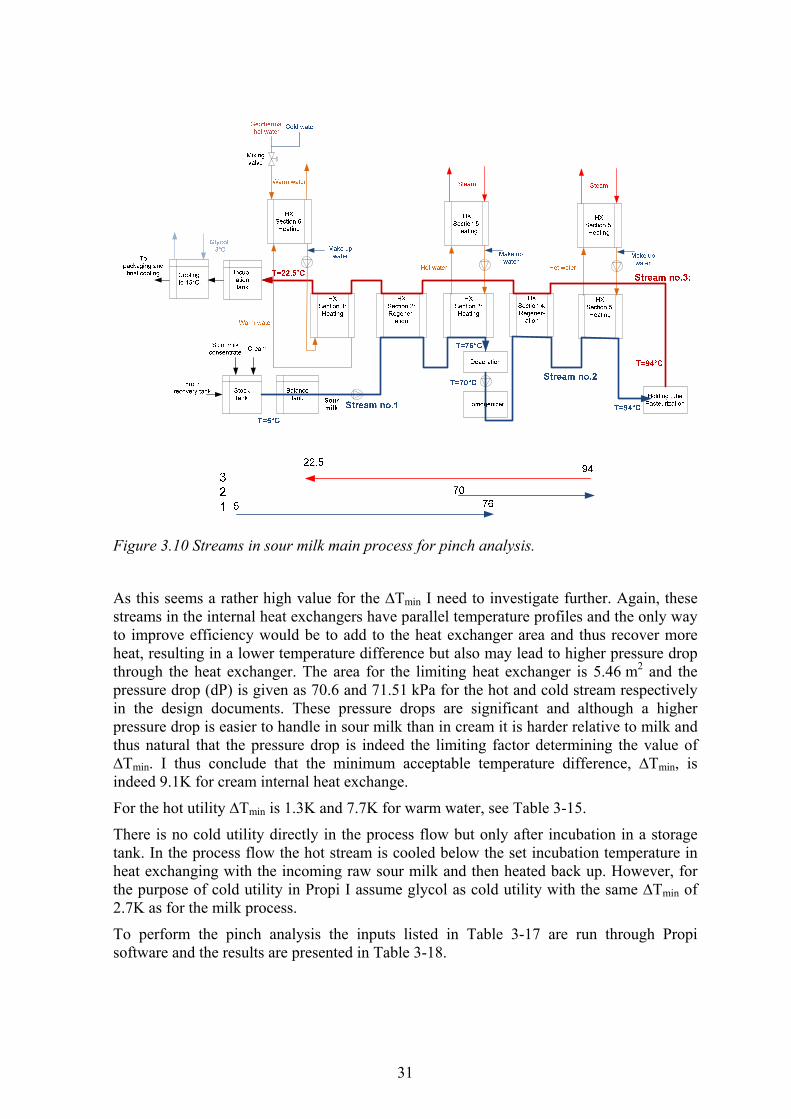
31
Figure 3.10 Streams in sour milk main process for pinch analysis.
As this seems a rather high value for the ∆Tmin I need to investigate further. Again, these streams in the internal heat exchangers have parallel temperature profiles and the only way to improve efficiency would be to add to the heat exchanger area and thus recover more heat, resulting in a lower temperature difference but also may lead to higher pressure drop through the heat exchanger. The area for the limiting heat exchanger is 5.46 m2 and the pressure drop (dP) is given as 70.6 and 71.51 kPa for the hot and cold stream respectively in the design documents. These pressure drops are significant and although a higher pressure drop is easier to handle in sour milk than in cream it is harder relative to milk and thus natural that the pressure drop is indeed the limiting factor determining the value of ∆Tmin. I thus conclude that the minimum acceptable temperature difference, ∆Tmin, is indeed 9.1K for cream internal heat exchange.
For the hot utility ∆Tmin is 1.3K and 7.7K for warm water, see Table 3-15.
There is no cold utility directly in the process flow but only after incubation in a storage tank. In the process flow the hot stream is cooled below the set incubation temperature in heat exchanging with the incoming raw sour milk and then heated back up. However, for the purpose of cold utility in Propi I assume glycol as cold utility with the same ∆Tmin of 2.7K as for the milk process.
To perform the pinch analysis the inputs listed in Table 3-17 are run through Propi software and the results are presented in Table 3-18.
32
Table 3-17 Inputs in sour milk main process for pinch analysis.
Stream no.
H/C Tinitial [°C]
Ttarget [°C]
Flow [kg/s]
Cp [J/kg·K]
Duty [kW]
DT* [K]
1 Cold 5.0 76.0 0.9167 3,743 243.6 4.55
2 Cold 70.0 94.0 0.9167 3,743 82.3 4.55
3 Hot 94.0 22.5 0.9167 3,743 245.3 4.55
HW1 Hot 95.3 86.8 0.65
HW2 Hot 77.5 72.6 0.65
WW Hot 30.2 22.5 3.5
GL Cold -3.0 0.7 1.5
*This represents the individual stream contribution to minimum acceptable temperature difference.
Table 3-18 Sour milk. Pinch temperature and hot and cold utility.
Pinch temp. [°C]
Minimum hot utility [kW]
Minimum cold utility [kW]
Actual hot utility [kW]
Actual cold utility [kW]
9.55 80.60 0 80.64 0
The pinch temperature of 9.55°C and the minimum hot and cold utilities can also be read out of the composite curve, see Figure 3.11. Note that pinch temperature is given in “interval temperatures”. The actual hot and cold stream pinch temperatures are 14.1 and 5.0°C, respectively. There are no pinch violations in this system. It is very interesting that no cold utility is in fact needed as the incubation temperature is so high (22.5°C) also the solution designed for the process to size up the regeneration part actually having temperature going below the target temperature of the hot stream and then use a cheap and medium temperature heater (hot geothermal water mix) to reach the set point. It is clear that this system was originally designed for maximum energy recovery. Similar to results for other products the actual hot and cold loads are essentially at their minimum values.
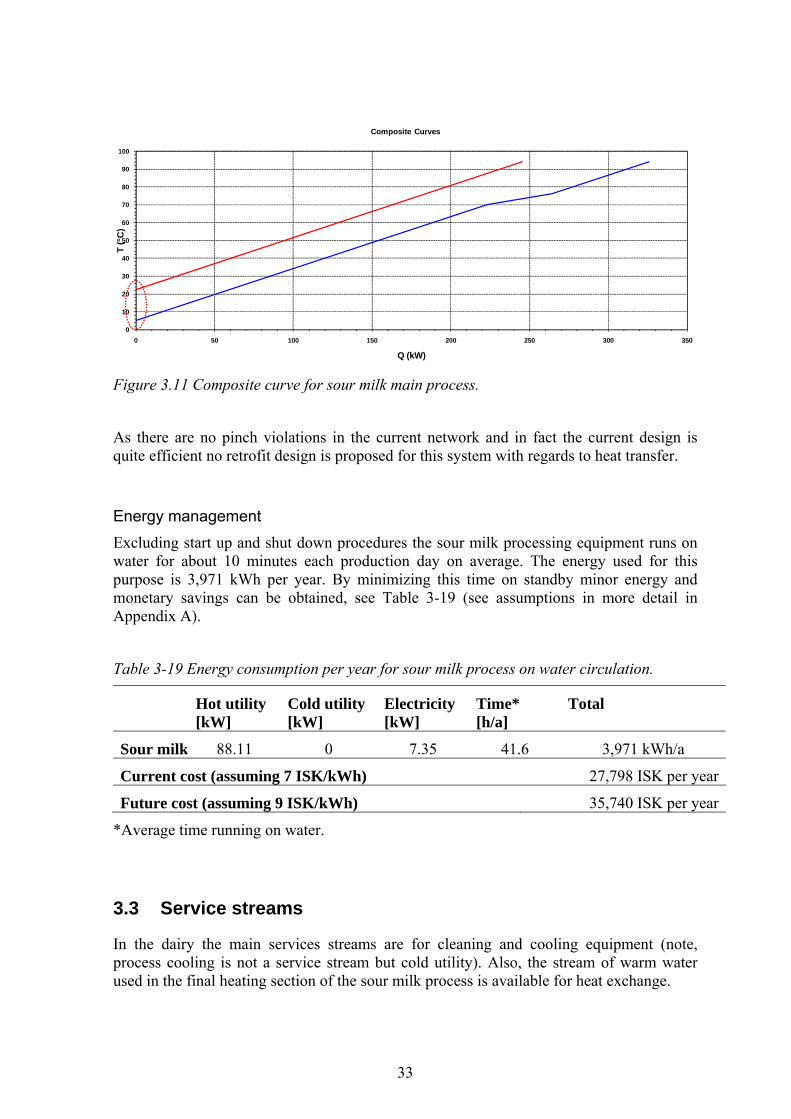
33
Figure 3.11 Composite curve for sour milk main process.
As there are no pinch violations in the current network and in fact the current design is quite efficient no retrofit design is proposed for this system with regards to heat transfer.
Energy management Excluding start up and shut down procedures the sour milk processing equipment runs on water for about 10 minutes each production day on average. The energy used for this purpose is 3,971 kWh per year. By minimizing this time on standby minor energy and monetary savings can be obtained, see Table 3-19 (see assumptions in more detail in Appendix A).
Table 3-19 Energy consumption per year for sour milk process on water circulation.
Hot utility [kW]
Cold utility [kW]
Electricity [kW]
Time* [h/a]
Total
Sour milk 88.11 0 7.35 41.6 3,971 kWh/a
Current cost (assuming 7 ISK/kWh) 27,798 ISK per year
Future cost (assuming 9 ISK/kWh) 35,740 ISK per year
*Average time running on water.
3.3 Service streams
In the dairy the main services streams are for cleaning and cooling equipment (note, process cooling is not a service stream but cold utility). Also, the stream of warm water used in the final heating section of the sour milk process is available for heat exchange.
0
10
20
30
40
50
60
70
80
90
100
0 50 100 150 200 250 300 350
T (°
C)
Q (kW)
Composite Curves
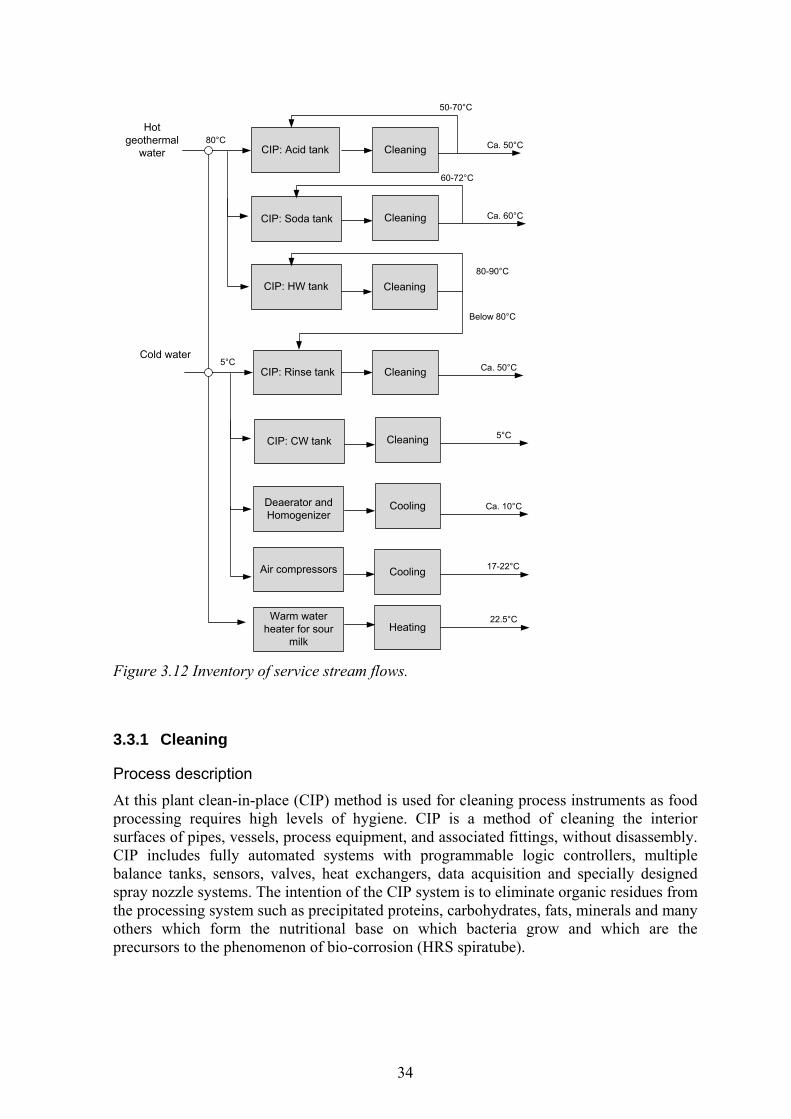
34
CIP: Acid tank
Hot geothermal
water
Cold water
CIP: Soda tank
CIP: HW tank
80°C
60-72°C
80-90°C
Below 80°C
CIP: Rinse tank
CIP: CW tank
Deaerator and Homogenizer
Ca. 50°C
5°C
Ca. 10°C
5°C
Air compressors 17-22°C
Cleaning
Cleaning
Cleaning
Cleaning
Cleaning
Cooling
Cooling
Ca. 60°C
Ca. 50°C
50-70°C
Warm water heater for sour
milk
22.5°CHeating
Figure 3.12 Inventory of service stream flows.
3.3.1 Cleaning
Process description At this plant clean-in-place (CIP) method is used for cleaning process instruments as food processing requires high levels of hygiene. CIP is a method of cleaning the interior surfaces of pipes, vessels, process equipment, and associated fittings, without disassembly. CIP includes fully automated systems with programmable logic controllers, multiple balance tanks, sensors, valves, heat exchangers, data acquisition and specially designed spray nozzle systems. The intention of the CIP system is to eliminate organic residues from the processing system such as precipitated proteins, carbohydrates, fats, minerals and many others which form the nutritional base on which bacteria grow and which are the precursors to the phenomenon of bio-corrosion (HRS spiratube).
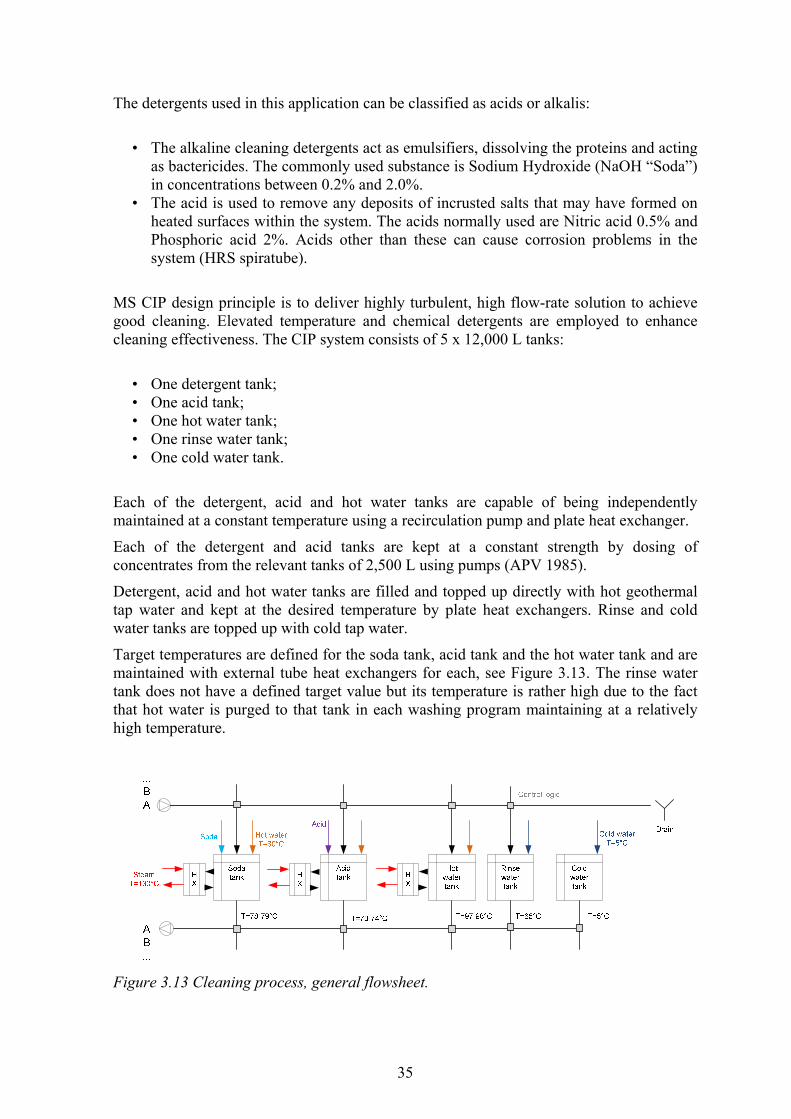
35
The detergents used in this application can be classified as acids or alkalis:
• The alkaline cleaning detergents act as emulsifiers, dissolving the proteins and acting
as bactericides. The commonly used substance is Sodium Hydroxide (NaOH “Soda”) in concentrations between 0.2% and 2.0%.
• The acid is used to remove any deposits of incrusted salts that may have formed on heated surfaces within the system. The acids normally used are Nitric acid 0.5% and Phosphoric acid 2%. Acids other than these can cause corrosion problems in the system (HRS spiratube).
MS CIP design principle is to deliver highly turbulent, high flow-rate solution to achieve good cleaning. Elevated temperature and chemical detergents are employed to enhance cleaning effectiveness. The CIP system consists of 5 x 12,000 L tanks:
• One detergent tank; • One acid tank; • One hot water tank; • One rinse water tank; • One cold water tank.
Each of the detergent, acid and hot water tanks are capable of being independently maintained at a constant temperature using a recirculation pump and plate heat exchanger.
Each of the detergent and acid tanks are kept at a constant strength by dosing of concentrates from the relevant tanks of 2,500 L using pumps (APV 1985).
Detergent, acid and hot water tanks are filled and topped up directly with hot geothermal tap water and kept at the desired temperature by plate heat exchangers. Rinse and cold water tanks are topped up with cold tap water.
Target temperatures are defined for the soda tank, acid tank and the hot water tank and are maintained with external tube heat exchangers for each, see Figure 3.13. The rinse water tank does not have a defined target value but its temperature is rather high due to the fact that hot water is purged to that tank in each washing program maintaining at a relatively high temperature.
Figure 3.13 Cleaning process, general flowsheet.
36
This is a seven pump unit capable of about 30-35 washing programs which depend on the product and operation. Each has a different run time and order of flows:
• A1-A6: Cleans raw milk storage, raw cream storage tanks and lines; • B: Cleans milk pasteurizer 1 (MG1); • C: Cleans milk pasteurizer 2 (MG2); • D1-D2: Cleans cream pasteurizer and sour milk pasteurizer (LG1 and RG1); • D3-D4: Cleans whole process for organic milk • E1-E7: Cleans finished products tanks / lines; • F1-F6: Cleans finished products tanks / lines; • G: Cleans tankers and CIP tanks;
These seven units can all run simultaneously. The energy recovery control logic, however, is always the same.
Using software the general cleaning process is carried out in the following stages (there are be some differences in the order of steps depending on products):
1 Initial flushing; Rinse water passed through the equipment to be cleaned to drain; 2 Soda cleaning; Detergent re-circulated from unit through the equipment to be cleaned
for the time required by the procedure, return temperature and solution strength monitored;
3 Intermediate rinse; Cold water flushes out detergent which goes back to soda tank while the concentration and temperatures are high enough and then to drain;
4 Acid circulation; Acid re-circulated from unit through the equipment to be cleaned for the time and temperature required by the procedure, return temperature and solution strength monitored;
5 Disinfection; Hot water re-circulated from unit through the equipment to be cleaned and the previous acid (or detergent) is flushed back to appropriate tank while the concentration and temperatures are high enough to recover both heat and acid (detergent). The minimum sterilization temperature of 90°C once reached is timed and is held for the amount of time required by the procedure (about 20-30 minutes);
6 Final rinse; cold water is circulated to cool systems. Previous hot water purged to hot water tank while hot enough then the rest goes to the rinse water tank.
There is also sterilization only option where only steps 5 and 6 are performed. This is performed if there has been no activity using the equipment for 1-2 days and is done before starting up production.
On completion of CIP, the plant items are shutdown and drain valves along the route are opened for a fixed time.
3.3.2 Equipment service streams Some equipment in the main process requires cooling, mainly the deaerator and homogenizers. Cold tap water is run through the equipment either directly or through small heat exchangers and is sent to drain. The flow rate is not substansial, intake temperature is aroun 5°C and the exit temperature is below 10°C.
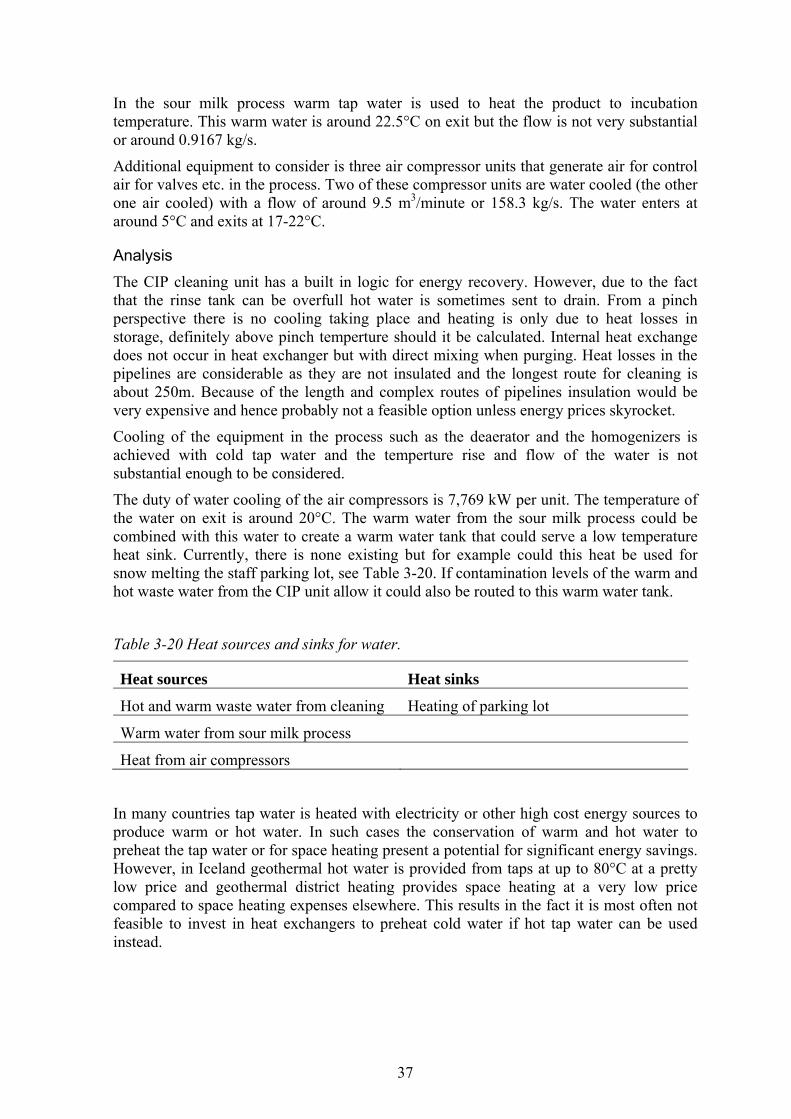
37
In the sour milk process warm tap water is used to heat the product to incubation temperature. This warm water is around 22.5°C on exit but the flow is not very substantial or around 0.9167 kg/s.
Additional equipment to consider is three air compressor units that generate air for control air for valves etc. in the process. Two of these compressor units are water cooled (the other one air cooled) with a flow of around 9.5 m3/minute or 158.3 kg/s. The water enters at around 5°C and exits at 17-22°C.
Analysis The CIP cleaning unit has a built in logic for energy recovery. However, due to the fact that the rinse tank can be overfull hot water is sometimes sent to drain. From a pinch perspective there is no cooling taking place and heating is only due to heat losses in storage, definitely above pinch temperture should it be calculated. Internal heat exchange does not occur in heat exchanger but with direct mixing when purging. Heat losses in the pipelines are considerable as they are not insulated and the longest route for cleaning is about 250m. Because of the length and complex routes of pipelines insulation would be very expensive and hence probably not a feasible option unless energy prices skyrocket.
Cooling of the equipment in the process such as the deaerator and the homogenizers is achieved with cold tap water and the temperture rise and flow of the water is not substantial enough to be considered.
The duty of water cooling of the air compressors is 7,769 kW per unit. The temperature of the water on exit is around 20°C. The warm water from the sour milk process could be combined with this water to create a warm water tank that could serve a low temperature heat sink. Currently, there is none existing but for example could this heat be used for snow melting the staff parking lot, see Table 3-20. If contamination levels of the warm and hot waste water from the CIP unit allow it could also be routed to this warm water tank.
Table 3-20 Heat sources and sinks for water.
Heat sources Heat sinks
Hot and warm waste water from cleaning Heating of parking lot
Warm water from sour milk process
Heat from air compressors
In many countries tap water is heated with electricity or other high cost energy sources to produce warm or hot water. In such cases the conservation of warm and hot water to preheat the tap water or for space heating present a potential for significant energy savings. However, in Iceland geothermal hot water is provided from taps at up to 80°C at a pretty low price and geothermal district heating provides space heating at a very low price compared to space heating expenses elsewhere. This results in the fact it is most often not feasible to invest in heat exchangers to preheat cold water if hot tap water can be used instead.
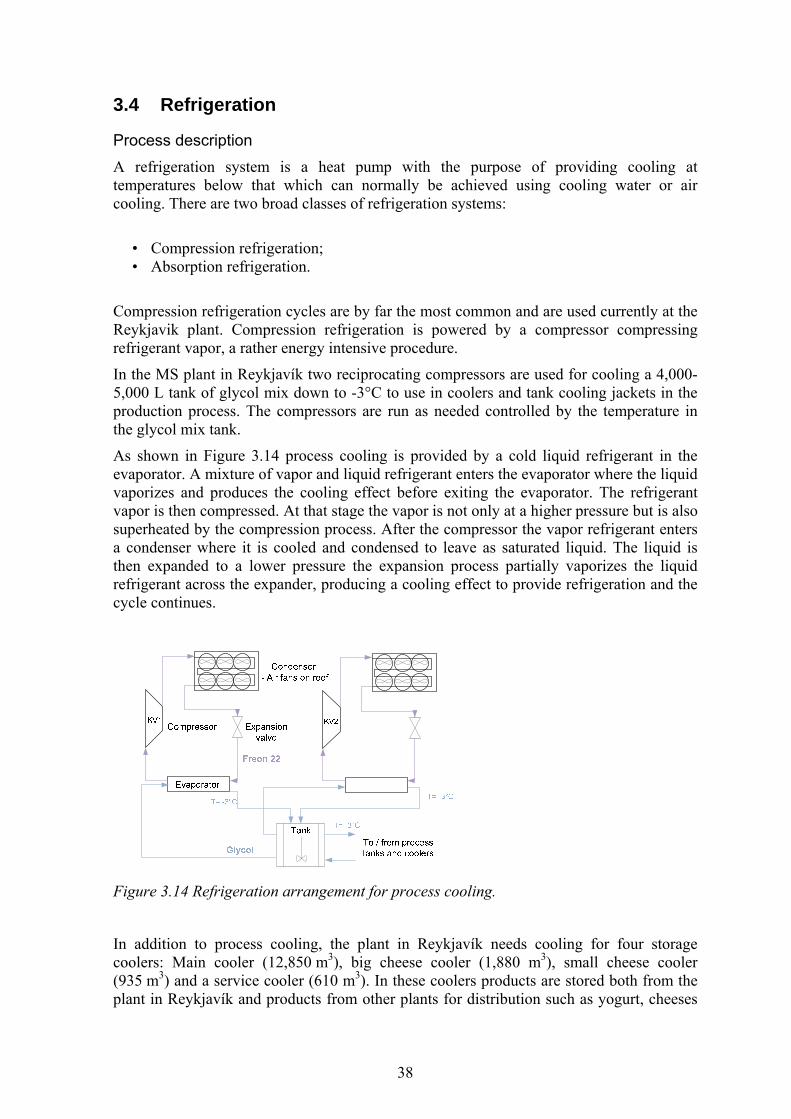
38
3.4 Refrigeration
Process description A refrigeration system is a heat pump with the purpose of providing cooling at temperatures below that which can normally be achieved using cooling water or air cooling. There are two broad classes of refrigeration systems:
• Compression refrigeration; • Absorption refrigeration.
Compression refrigeration cycles are by far the most common and are used currently at the Reykjavik plant. Compression refrigeration is powered by a compressor compressing refrigerant vapor, a rather energy intensive procedure.
In the MS plant in Reykjavík two reciprocating compressors are used for cooling a 4,000-5,000 L tank of glycol mix down to -3°C to use in coolers and tank cooling jackets in the production process. The compressors are run as needed controlled by the temperature in the glycol mix tank.
As shown in Figure 3.14 process cooling is provided by a cold liquid refrigerant in the evaporator. A mixture of vapor and liquid refrigerant enters the evaporator where the liquid vaporizes and produces the cooling effect before exiting the evaporator. The refrigerant vapor is then compressed. At that stage the vapor is not only at a higher pressure but is also superheated by the compression process. After the compressor the vapor refrigerant enters a condenser where it is cooled and condensed to leave as saturated liquid. The liquid is then expanded to a lower pressure the expansion process partially vaporizes the liquid refrigerant across the expander, producing a cooling effect to provide refrigeration and the cycle continues.
Figure 3.14 Refrigeration arrangement for process cooling.
In addition to process cooling, the plant in Reykjavík needs cooling for four storage coolers: Main cooler (12,850 m3), big cheese cooler (1,880 m3), small cheese cooler (935 m3) and a service cooler (610 m3). In these coolers products are stored both from the plant in Reykjavík and products from other plants for distribution such as yogurt, cheeses
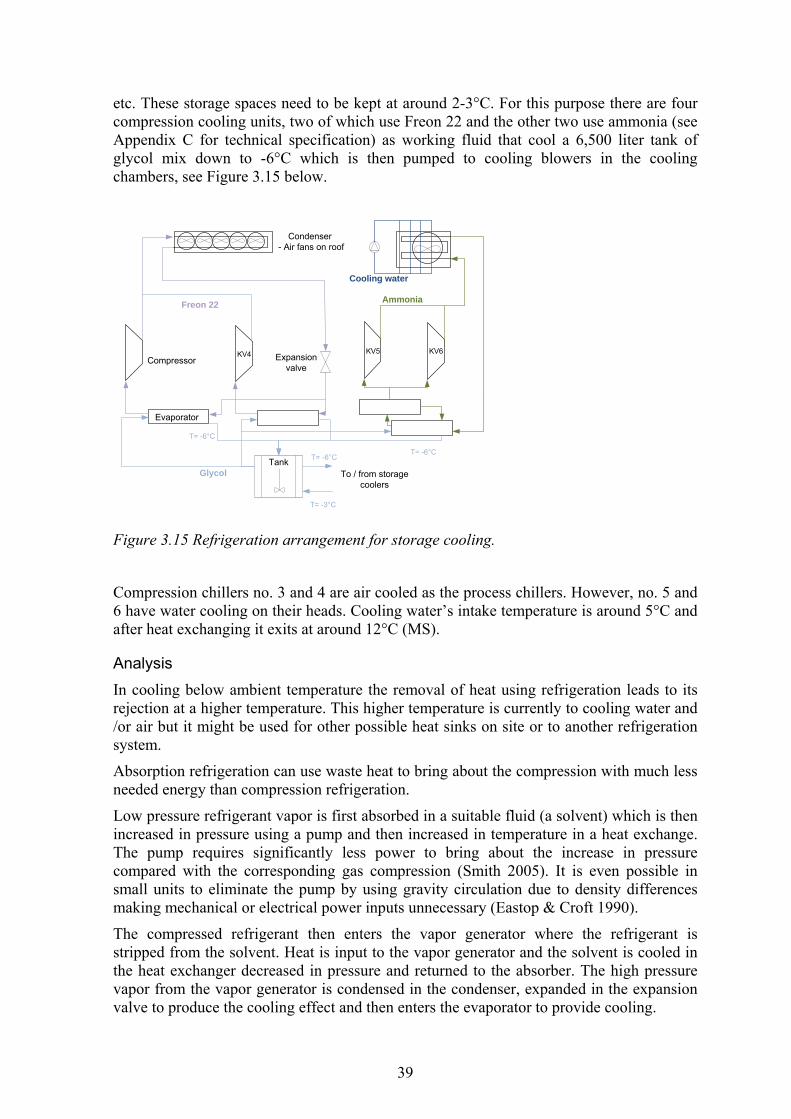
39
etc. These storage spaces need to be kept at around 2-3°C. For this purpose there are four compression cooling units, two of which use Freon 22 and the other two use ammonia (see Appendix C for technical specification) as working fluid that cool a 6,500 liter tank of glycol mix down to -6°C which is then pumped to cooling blowers in the cooling chambers, see Figure 3.15 below.
Condenser- Air fans on roof
Evaporator
CompressorKV4
TankTo / from storage
coolers
T= -6°C
T= -6°C
Glycol
Freon 22
T= -3°C
T= -6°C
Expansion valve
KV5 KV6
Ammonia
Cooling water
Figure 3.15 Refrigeration arrangement for storage cooling.
Compression chillers no. 3 and 4 are air cooled as the process chillers. However, no. 5 and 6 have water cooling on their heads. Cooling water’s intake temperature is around 5°C and after heat exchanging it exits at around 12°C (MS).
Analysis In cooling below ambient temperature the removal of heat using refrigeration leads to its rejection at a higher temperature. This higher temperature is currently to cooling water and /or air but it might be used for other possible heat sinks on site or to another refrigeration system.
Absorption refrigeration can use waste heat to bring about the compression with much less needed energy than compression refrigeration.
Low pressure refrigerant vapor is first absorbed in a suitable fluid (a solvent) which is then increased in pressure using a pump and then increased in temperature in a heat exchange. The pump requires significantly less power to bring about the increase in pressure compared with the corresponding gas compression (Smith 2005). It is even possible in small units to eliminate the pump by using gravity circulation due to density differences making mechanical or electrical power inputs unnecessary (Eastop & Croft 1990).
The compressed refrigerant then enters the vapor generator where the refrigerant is stripped from the solvent. Heat is input to the vapor generator and the solvent is cooled in the heat exchanger decreased in pressure and returned to the absorber. The high pressure vapor from the vapor generator is condensed in the condenser, expanded in the expansion valve to produce the cooling effect and then enters the evaporator to provide cooling.
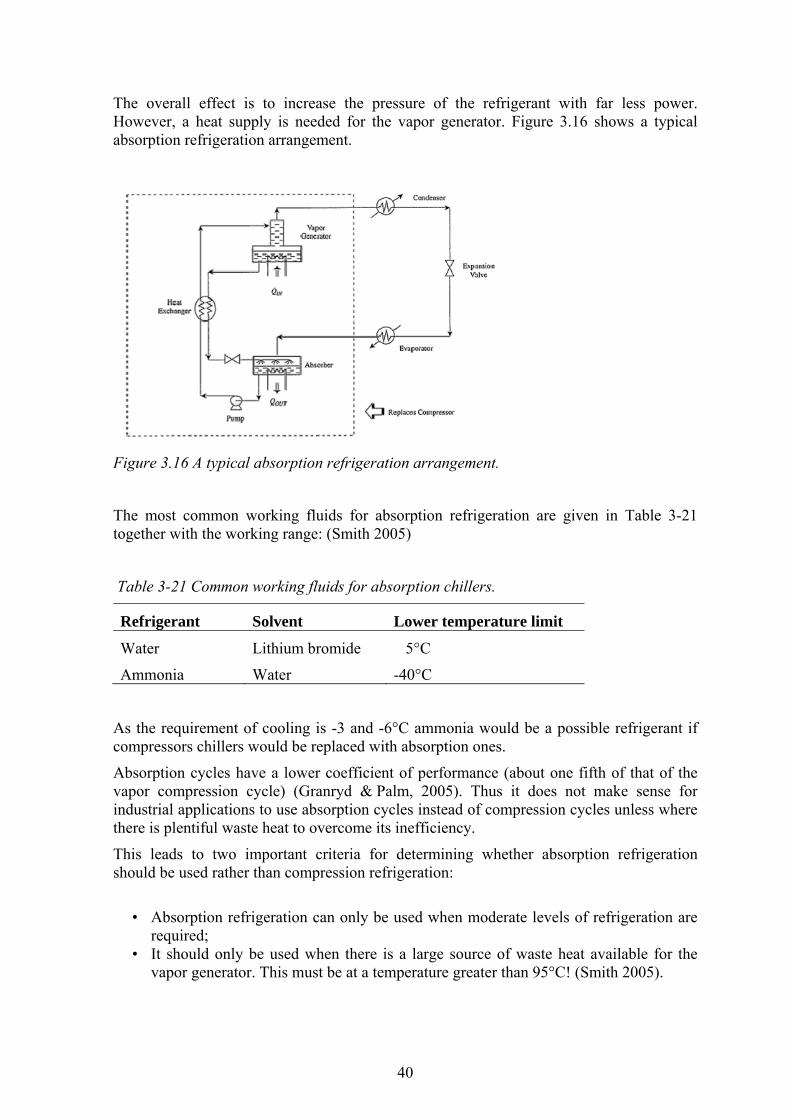
40
The overall effect is to increase the pressure of the refrigerant with far less power. However, a heat supply is needed for the vapor generator. Figure 3.16 shows a typical absorption refrigeration arrangement.
Figure 3.16 A typical absorption refrigeration arrangement.
The most common working fluids for absorption refrigeration are given in Table 3-21 together with the working range: (Smith 2005)
Table 3-21 Common working fluids for absorption chillers.
Refrigerant Solvent Lower temperature limit
Water Lithium bromide 5°C
Ammonia Water -40°C
As the requirement of cooling is -3 and -6°C ammonia would be a possible refrigerant if compressors chillers would be replaced with absorption ones.
Absorption cycles have a lower coefficient of performance (about one fifth of that of the vapor compression cycle) (Granryd & Palm, 2005). Thus it does not make sense for industrial applications to use absorption cycles instead of compression cycles unless where there is plentiful waste heat to overcome its inefficiency.
This leads to two important criteria for determining whether absorption refrigeration should be used rather than compression refrigeration:
• Absorption refrigeration can only be used when moderate levels of refrigeration are
required; • It should only be used when there is a large source of waste heat available for the
vapor generator. This must be at a temperature greater than 95°C! (Smith 2005).
41
Cooling water from the compression chillers no. 5 and 6 is not at high enough temperature to be of much use. Also, the flow is not steady as these chillers are not always in operation.
The waste heat from service streams is considerable in energy content but not at a high temperature to be able to run an absorption chiller.
As a result it is not feasible to switch out part of the compression chillers for absorption ones.
4 CONCLUSIONS
The specific heat value of milk is a complicated issue in processes where regeneration of milk with different fat contents are heat exchanged as the Cp value varies not only with temperature but more so with fat content. Hence, a standardized and a clear approach should be available for all working with dairy applications and technology.
The main conclusion of this study is that the Reykjavik MS dairy plant is very efficient, both regarding the main processes and the hot water systems. This is somewhat surprising, given the low energy cost context that has prevailed in Iceland for many years. It seems that in the design for the plant in 1983 much consideration was given to maximum energy recovery or perhaps international standards of energy recovery were a part of all dairy plant design as the design came from the UK. So in fact, at the time the plant was over efficient as it was imported design from an environment with quite different energy cost environment.
In the main process there are no pinch violations and thus there is no need to suggest retrofit designs with regards to heat transfer.
In Sweden, analyses at dairy plants also show that the main processes have highly sophisticated ways of energy recovery (Frank & Nyström 2002). However, in countries where cold tap water needs to be heated with electricity, steam or fuel to produce hot water the improved energy recovery of service streams has led to energy savings (Sundström 2005). In Iceland there is a ready and cheap supply of geothermal hot water so the energy recovery of service streams is not feasible as energy costs are lower than the capital costs of energy recovery actions.
However, there are some potential for energy savings by other means than heat transfer. Looking at the planning of production the main potential for energy savings is trying to minimize the standby runs of equipment on water and to install an additional tank and reception line to keep the already pasteurized milk from Selfoss separated from raw milk and thus avoid double pasteurizing that amount. Here the economies of scale will affect investment decisions and as the amount received currently is not high enough to recover capital cost with energy savings. This option should be kept in mind as energy prices are rising and the demand for less fatty products as well.
In processes that need refrigeration and have abundance of waste heat, conventional compression chillers can be replaced with absorption chillers that use far less electricity. At the Reykjavik plant the waste heat was not at high enough temperature or of that magnitude so that absorption chillers are a feasible option.
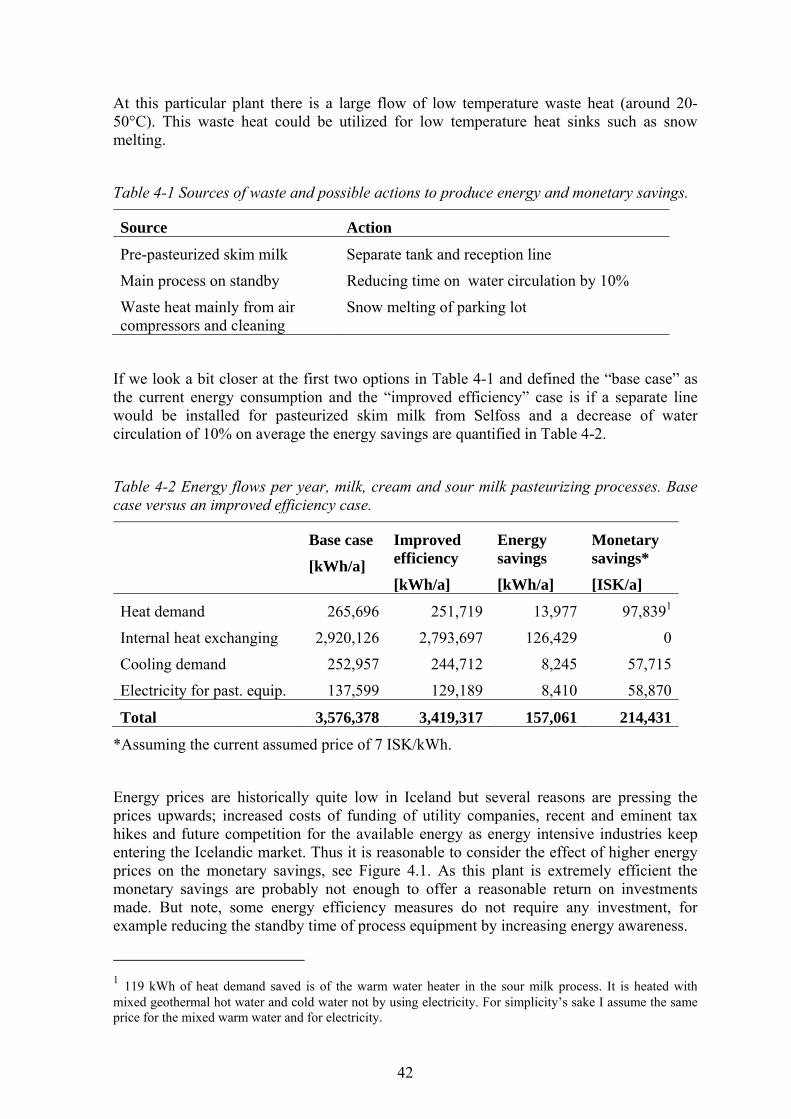
42
At this particular plant there is a large flow of low temperature waste heat (around 20-50°C). This waste heat could be utilized for low temperature heat sinks such as snow melting.
Table 4-1 Sources of waste and possible actions to produce energy and monetary savings.
Source Action
Pre-pasteurized skim milk Separate tank and reception line
Main process on standby Reducing time on water circulation by 10%
Waste heat mainly from air compressors and cleaning
Snow melting of parking lot
If we look a bit closer at the first two options in Table 4-1 and defined the “base case” as the current energy consumption and the “improved efficiency” case is if a separate line would be installed for pasteurized skim milk from Selfoss and a decrease of water circulation of 10% on average the energy savings are quantified in Table 4-2.
Table 4-2 Energy flows per year, milk, cream and sour milk pasteurizing processes. Base case versus an improved efficiency case.
Base case
[kWh/a]
Improved efficiency
[kWh/a]
Energy savings
[kWh/a]
Monetary savings*
[ISK/a]
Heat demand 265,696 251,719 13,977 97,8391
Internal heat exchanging 2,920,126 2,793,697 126,429 0
Cooling demand 252,957 244,712 8,245 57,715
Electricity for past. equip. 137,599 129,189 8,410 58,870
Total 3,576,378 3,419,317 157,061 214,431
*Assuming the current assumed price of 7 ISK/kWh.
Energy prices are historically quite low in Iceland but several reasons are pressing the prices upwards; increased costs of funding of utility companies, recent and eminent tax hikes and future competition for the available energy as energy intensive industries keep entering the Icelandic market. Thus it is reasonable to consider the effect of higher energy prices on the monetary savings, see Figure 4.1. As this plant is extremely efficient the monetary savings are probably not enough to offer a reasonable return on investments made. But note, some energy efficiency measures do not require any investment, for example reducing the standby time of process equipment by increasing energy awareness.
1 119 kWh of heat demand saved is of the warm water heater in the sour milk process. It is heated with mixed geothermal hot water and cold water not by using electricity. For simplicity’s sake I assume the same price for the mixed warm water and for electricity.
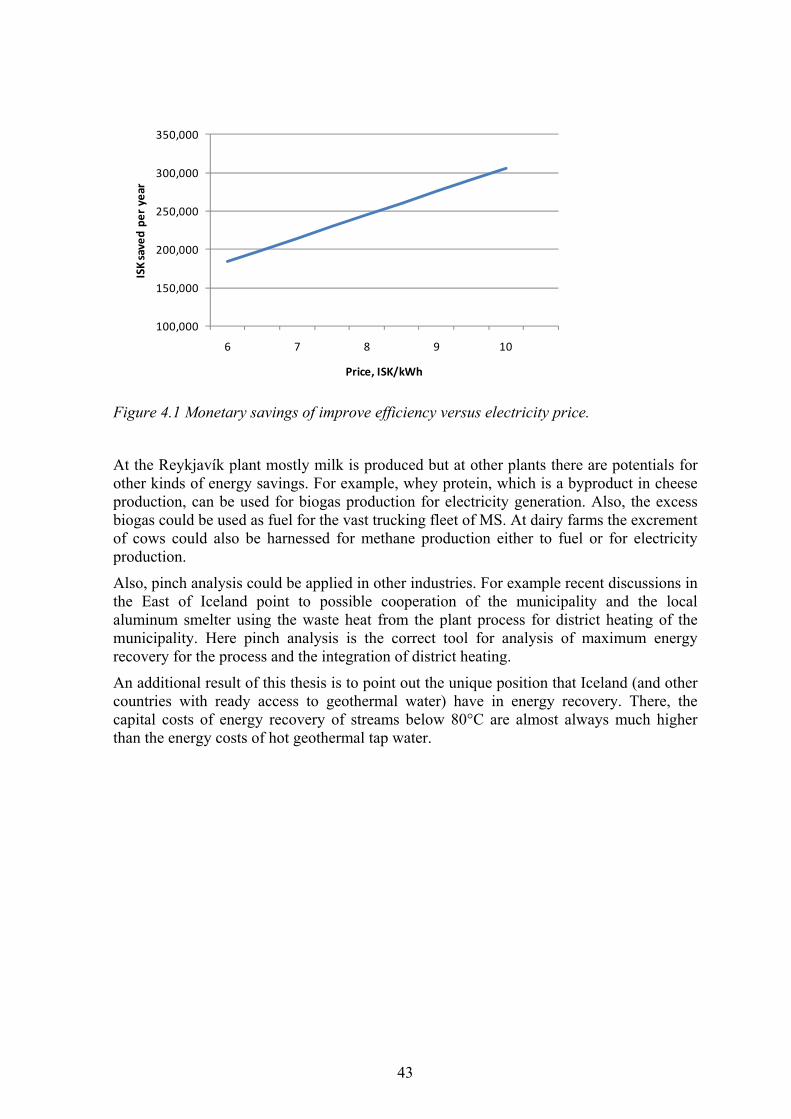
43
Figure 4.1 Monetary savings of improve efficiency versus electricity price.
At the Reykjavík plant mostly milk is produced but at other plants there are potentials for other kinds of energy savings. For example, whey protein, which is a byproduct in cheese production, can be used for biogas production for electricity generation. Also, the excess biogas could be used as fuel for the vast trucking fleet of MS. At dairy farms the excrement of cows could also be harnessed for methane production either to fuel or for electricity production.
Also, pinch analysis could be applied in other industries. For example recent discussions in the East of Iceland point to possible cooperation of the municipality and the local aluminum smelter using the waste heat from the plant process for district heating of the municipality. Here pinch analysis is the correct tool for analysis of maximum energy recovery for the process and the integration of district heating.
An additional result of this thesis is to point out the unique position that Iceland (and other countries with ready access to geothermal water) have in energy recovery. There, the capital costs of energy recovery of streams below 80°C are almost always much higher than the energy costs of hot geothermal tap water.
100,000
150,000
200,000
250,000
300,000
350,000
6 7 8 9 10
ISK saved pe
r year
Price, ISK/kWh
44
REFERENCES
APV International July 1985, Process description for Mjolkursamsalan dairy, project w/o 81782-939, Rev. 1, APV, UK.
APV International 1985 and 2001, Heat exchangers specifications, APV, UK.
Absorption refrigeration, Wikipedia the free encyclopedia, viewed January 2010, http://en.wikipedia.org/wiki/Absorption_refrigeration.
Bylund, Gösta 1995, Dairy processing handbook, Tetra Pak processing systems AB, S-221 86, Lund Sweden.
Chandan, R.C. 2006, Manufacturing yogurt and fermented milks. Blackwell Publishing.
CIP Cleaning (cleaning in place), HRS spiratube, viewed November 2009, http://www.hrs-spiratube.com/en/products/processing-systems-cleaning-in-place-cip.aspx.
Clean in place, Wikipedia the free encyclopedia, viewed November 2009, http://en.wikipedia.org/wiki/Clean-in-place
Eastop, T. D., Croft, D. R.. 1990, Energy Efficiency for Engineers and Technologists, Pearson Education, UK.
Franck, Per-Åke & Nyström, Ingrid 2002, Utökad systemanalys för Ersboda mejeri i Umeå, CIT Industriell Energyianalys AB, Sweden.
Gislason, Sigurður Reynir 2009, Lecture notes at RES – RES603, Institute of Earth Sciences, University of Iceland.
Goff, Douglas, Introduction to Dairy Science and Technology: Milk History, Consumption, Production, and Composition, University Guelph, Canada, viewed January 2010. http://www.foodsci.uoguelph.ca/dairyedu/intro.html.
Granryd, Eric & Palm, Björn, 2005, Refrigerating engineering, Stockholm Royal Institute of Technology, Sweden.
Harvey, Simon 2009. Lecture notes at RES - ESP602. Chalmers, Sweden.
Hui, Y.H. (ed.) 2007, Handbook of food products manufacturing: Health, meat, milk, poultry, seafood, and vegetables, John Wiley & Sons Ínc.
Kemp, Ian. C., 2nd edition, 2007, Pinch analysis and process integration. A user guide on process integration for the efficient use of energy, Butterworth-Heinemann
La Fondation de technologie laitére du Québec, 1985, Dairy science and technology: principles and applications, Les presses de l’université Laval, Canada.
Log mean temperature difference, Wikipedia, the free encyclopedia, viewed December 2009, http://en.wikipedia.org/wiki/LMTD.
Lokey, Elizabeth 2009, Lecture notes at RES – ESP606, Camco International, US.
MS, interviews with staff at Reykjavik dairy plant, October 2009 to January 2010.
Neil 2001, Dairy chemistry and physics, N.E.M. Business Solutions, viewed January 2010, http://www.cip.ukcentre.com/chem1.htm#Milk%20fat%20Structure%20-%20Fat%20Globules.
Pinch analysis, Wikipedia, the free encyclopedia, viewed October 2009, http://en.wikipedia.org/wiki/Pinch_analysis.
45
Process integration, Wikipedia, the free encyclopedia, viewed October 2009, http://en.wikipedia.org/wiki/Process_integration.
Propylene Glycol based Heat-Transfer Fluids, The Engineering Toolbox, viewed November 2009, http://www.engineeringtoolbox.com/propylene-glycol-d_363.html.
Reykjavik Energy, 2009, Verðskrá rafmagn og heitt vatn (eng. Price list, electricity and hot water), Reykjavik Energy, Iceland.
Sahdev, Mukesh, Pinch Technology: Basics for the Beginners. The Chemical Engineers’ Resource Page, viewed October 2009. http://www.cheresources.com/pinchtech1.shtml.
Smith, Robin 2005, Chemical process design and integration, Centre for process integration, School of Chemical Engineering and Analytical Science, University of Manchester, John Wiley & Sons.
Sundström 2005, Integrerade processlösningar för livsmedelsindustri – processintegration: Utvärdering av genomförda energisparande investeringar (Biotrans) vid Norrmejeriers anläggning i Umeå - Slutrapport, CIT Industriell Energyianalys AB, Sweden.
The UNEP working group for cleaner production in the food industry (Penny Prasad, Robert Pagan, Michael Kauter and Nicole Price) 2004, Eco-efficiency for the Dairy Processing Industry, Environmental Management Centre, The University of Queensland, St Lucia, Australia.
A - 1
APPENDIX A – NOTES ON VARIOUS CALCULATIONS
For this study the calculations and main steps are demonstrated in the figure below. Further description is to be found in the following sections.
Figure A.1 Steps of analysis.
Specific weight
The specific weight of all products considered are assumed to be 1 kg/L thus all flows are easily converted from L/hr to kg/s.
Specific heat
The average value given in references for skim milk is 0.95 cal/g°C which converts to 3,977 J/kg·K. The Cp value for milk fat is 2,177 J/kg·K.
For sour milk and cream a simple weighted average of milk fat and skim milk was calculated giving 3,743 and 3,329 J/kg·K respectively.
For whole milk the duty of the skim milk in the section of the milk pasteurizer heat exchanger where raw milk and skim milk are heat exchanged was calculated and then assumed the same duty for whole milk and solved for its Cp value, resulting in 3,930 J/kg·K. Then for light milk the duty of whole milk in the same section on a light milk run was calculated and solved for the Cp value of light milk, resulting in 3,937 J/kg·K.
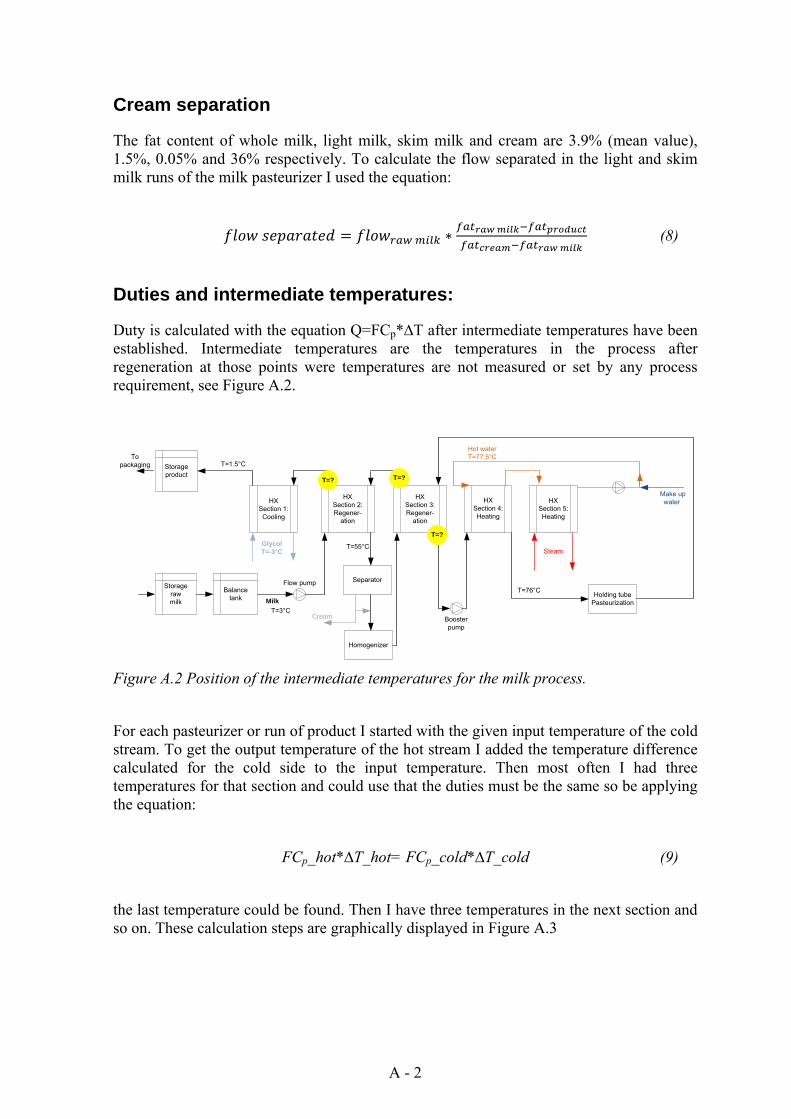
A - 2
Cream separation
The fat content of whole milk, light milk, skim milk and cream are 3.9% (mean value), 1.5%, 0.05% and 36% respectively. To calculate the flow separated in the light and skim milk runs of the milk pasteurizer I used the equation:
(8)
Duties and intermediate temperatures:
Duty is calculated with the equation Q=FCp*∆T after intermediate temperatures have been established. Intermediate temperatures are the temperatures in the process after regeneration at those points were temperatures are not measured or set by any process requirement, see Figure A.2.
Storageraw milk
Balance tank
Homogenizer
Separator
Holding tubePasteurization
Storageproduct
HXSection 4:Heating
HXSection 5:Heating
Make up water
Steam GlycolT=-3°C
Booster pump
HXSection 3:Regener-
ation
HXSection 2:Regener-
ation
HXSection 1:Cooling
Milk
Flow pump
Cream
To packaging
Hot waterT=77.5°C
T=3°C
T=55°C
T=76°C
T=1.5°C
T=?
T=?T=?
Figure A.2 Position of the intermediate temperatures for the milk process.
For each pasteurizer or run of product I started with the given input temperature of the cold stream. To get the output temperature of the hot stream I added the temperature difference calculated for the cold side to the input temperature. Then most often I had three temperatures for that section and could use that the duties must be the same so be applying the equation:
FCp_hot*∆T_hot= FCp_cold*∆T_cold (9)
the last temperature could be found. Then I have three temperatures in the next section and so on. These calculation steps are graphically displayed in Figure A.3
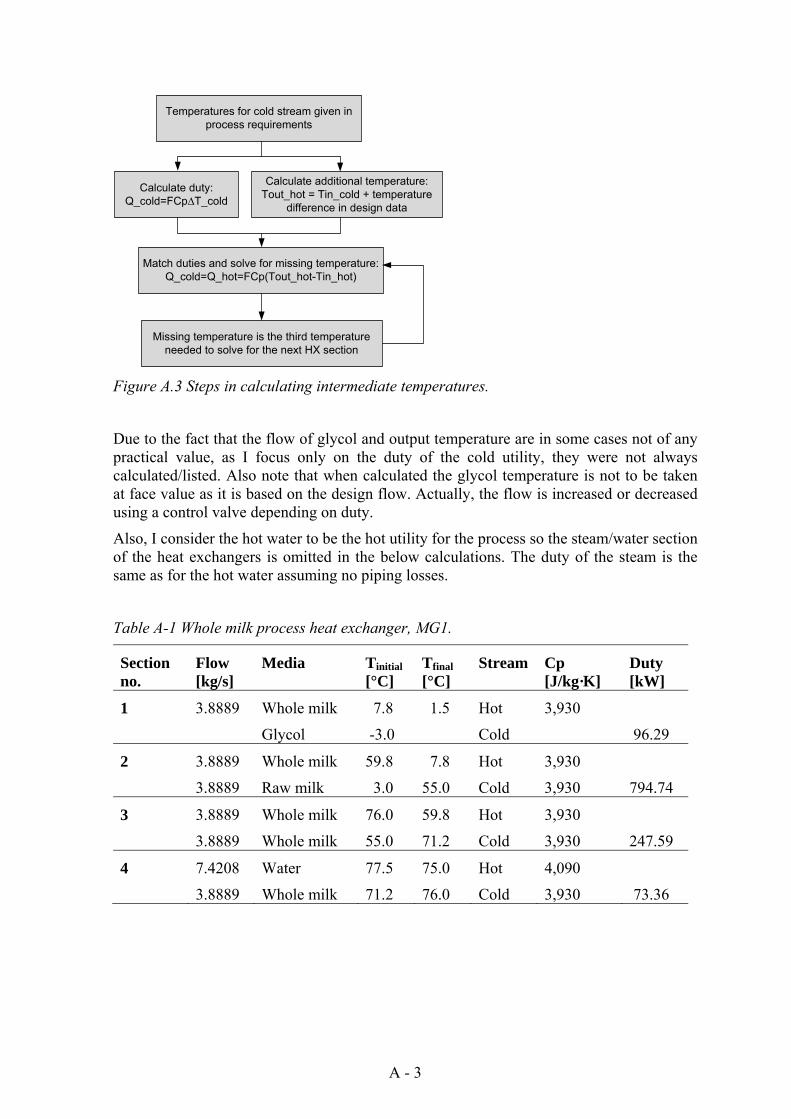
A - 3
Calculate additional temperature:Tout_hot = Tin_cold + temperature
difference in design data
Calculate duty:Q_cold=FCp∆T_cold
Match duties and solve for missing temperature:Q_cold=Q_hot=FCp(Tout_hot-Tin_hot)
Missing temperature is the third temperature needed to solve for the next HX section
Temperatures for cold stream given in process requirements
Figure A.3 Steps in calculating intermediate temperatures.
Due to the fact that the flow of glycol and output temperature are in some cases not of any practical value, as I focus only on the duty of the cold utility, they were not always calculated/listed. Also note that when calculated the glycol temperature is not to be taken at face value as it is based on the design flow. Actually, the flow is increased or decreased using a control valve depending on duty.
Also, I consider the hot water to be the hot utility for the process so the steam/water section of the heat exchangers is omitted in the below calculations. The duty of the steam is the same as for the hot water assuming no piping losses.
Table A-1 Whole milk process heat exchanger, MG1.
Section no.
Flow [kg/s]
Media Tinitial [°C]
Tfinal [°C]
Stream Cp [J/kg·K]
Duty [kW]
1 3.8889 Whole milk 7.8 1.5 Hot 3,930
Glycol -3.0 Cold 96.29
2 3.8889 Whole milk 59.8 7.8 Hot 3,930
3.8889 Raw milk 3.0 55.0 Cold 3,930 794.74
3 3.8889 Whole milk 76.0 59.8 Hot 3,930
3.8889 Whole milk 55.0 71.2 Cold 3,930 247.59
4 7.4208 Water 77.5 75.0 Hot 4,090
3.8889 Whole milk 71.2 76.0 Cold 3,930 73.36
A - 4
Table A-2 Whole milk process heat exchanger, MG2.
Section no.
Flow [kg/s]
Media Tinitial [°C]
Tfinal [°C]
Stream Cp [J/kg·K]
Duty [kW]
1 4.0417 Whole milk 7.8 1.5 Hot 3,930
Glycol -3.0 Cold 100.07
2 4.0417 Whole milk 59.8 7.8 Hot 3,930
4.0417 Raw milk 3.0 55.0 Cold 3,930 825.96
3 4.0417 Whole milk 76.0 59.8 Hot 3,930
4.0417 Whole milk 55.0 71.2 Cold 3,930 257.32
4 7.4208 Water 77.5 75.0 Hot 4,090
4.0417 Whole milk 71.2 76.0 Cold 3,930 76.25
Table A-3 Light milk process heat exchanger, MG1.
Section no.
Flow [kg/s]
Media Tinitial [°C]
Tfinal [°C]
Stream Cp [J/kg·K]
Duty [kW]
1 3.5981 Light milk 6.1 1.5 Hot 3,937
Glycol -3.0 Cold 65.16
2 3.5981 Light milk 62.2 6.1 Hot 3,937
3.8889 Raw milk 3.0 55.0 Cold 3,930 794.74
3 3.5981 Light milk 76.0 62.2 Hot 3,937
3.5981 Light milk 55.0 68.8 Cold 3,937 195.44
4 7.4208 Water 77.5 74.1 Hot 4,090
3.5981 Light milk 68.8 76.0 Cold 3,937 102.04
A - 5
Table A-4 Light milk process heat exchanger, MG2.
Section no.
Flow [kg/s]
Media Tinitial [°C]
Tfinal [°C]
Stream Cp [J/kg·K]
Duty [kW]
1 3.7509 Light milk 6.1 1.5 Hot 3,937
Glycol -3.0 Cold 67.93
2 3.7509 Light milk 62.0 6.1 Hot 3,937
4.0417 Raw milk 3.0 55.0 Cold 3,930 825.96
3 3.7509 Light milk 76.0 62.0 Hot 3,937
3.7509 Light milk 55.0 69.0 Cold 3,937 206.27
4 7.4208 Water 77.5 74.1 Hot 4,090
3.7509 Light milk 69.0 76.0 Cold 3,937 103.84
Table A-5 Skim milk process heat exchanger, MG1.
Section no.
Flow [kg/s]
Media Tinitial [°C]
Tfinal [°C]
Stream Cp [J/kg·K]
Duty [kW]
1 3.4225 Skim milk 1.5 Hot 3,977
Glycol -3.0 Cold 48.59
2 3.4225 Skim milk 63.4 5.0 Hot 3,977
3.8889 Raw milk 3.0 55.0 Cold 3,930 794.74
3 3.4225 Skim milk 76.0 63.4 Hot 3,977
3.4225 Skim milk 55.0 67.6 Cold 3,977 171.66
4 7.4208 Water 77.5 73.7 Hot 4,090
3.4225 Skim milk 67.6 76.0 Cold 3,977 114.18
A - 6
Table A-6 Skim milk process heat exchanger, MG2.
Section no.
Flow [kg/s]
Media Tinitial [°C]
Tfinal [°C]
Stream Cp [J/kg·K]
Duty [kW]
1 3.5752 Skim milk 5.0 1.5 Hot 3,977
Glycol -3.0 Cold 50.76
2 3.5752 Skim milk 62.0 5.0 Hot 3,977
4.0417 Raw milk 3.0 55.0 Cold 3,930 825.96
3 3.5752 Skim milk 76.0 62.0 Hot 3,977
3.5752 Skim milk 55.0 69.0 Cold 3,977 203.75
4 7.4208 Water 77.5 74.2 Hot 4,090
3.5752 Skim milk 69.0 76.0 Cold 3,977 100.81
Table A-7 Cream process heat exchanger and tanks, RG1.
Section no.
Flow [kg/s]
Media Tinitial [°C]
Tfinal [°C]
Stream Cp [J/kg·K]
Duty [kW]
1 0.4167 Cream 24.1 8 Hot 3,329 0.4444 Glycol -3 9.9 Cold 3,915 22.33 2 0.4167 Cream 93 24.1 Hot 3,329 0.4167 Cream 10 78.9 Cold 3,329 95.58 3 0.5278 Water 94 85.0 Hot 4,090 0.4167 Cream 78.9 93 Cold 3,329 19.56
Tank before 0.4167 55.0 10.0 Hot 3,329 62.42 Tank after 0.4167 8.0 2.0 Hot 3,329 8.32
*Tanks are cooled with a glycol mix cooling jacket (-3°C).
A - 7
Table A-8 Sour milk process heat exchanger, SG1.
Section no. Flow [kg/s]
Media Tinitial [°C]
Tfinal [°C]
Stream Cp [J/kg·K]
Duty [kW]
1 0.9167 Water 30.2 22.5 Hot 4,090
0.9167 Sour milk 14.1 22.5 Cold 3,743 28.82
2 0.9167 Sour milk 79.8 14.1 Hot 3,743
0.9167 Sour milk 5.0 70.7 Cold 3,743 225.43
3 0.9167 Water 77.5 72.6 Hot 4,090
0.9167 Sour milk 70.7 76.0 Cold 3,743 18.19
4 0.9167 Sour milk 94.0 79.8 Hot 3,743
0.9167 Sour milk 70.0 84.2 Cold 3,743 48.72
5 0.9722 Water 95.3 86.8 Hot 4,090
0.9167 Sour milk 84.2 94.0 Cold 3,743 33.63
Tank 0.9167 Sour milk 22.5 15.0 Hot 3,743 25.73
*Tanks are cooled with a glycol mix cooling jacket (-3°C).
Time running
The time it takes to produce the yearly amount of products is based on production numbers from 2008 (production numbers are not expected to change significantly between years) and running capacity of the pasteurizers. I assume that milk pasteurizers are run the same amount of time each by dividing the total production time by two.
Table A-9 Time running per year
Equipment Capacity [L] Production time [hrs/a]
Average time run on water [hrs/a]
Total time running [hrs/a]
MG1 14,000 936 130 1,066
MG2 14,550 936 130 1,066
RG1 1,500 287 208 495
SG1 3,300 308 42 350
Water circulations
In water circulation runs the water is heated and cooled like the product would be and then run to the balance tank forming a closed loop through the system. Although the intake temperature of the water is around 5°C for the first run and then at around final temperature of the process for the rest of the circulations, I assume exactly the same
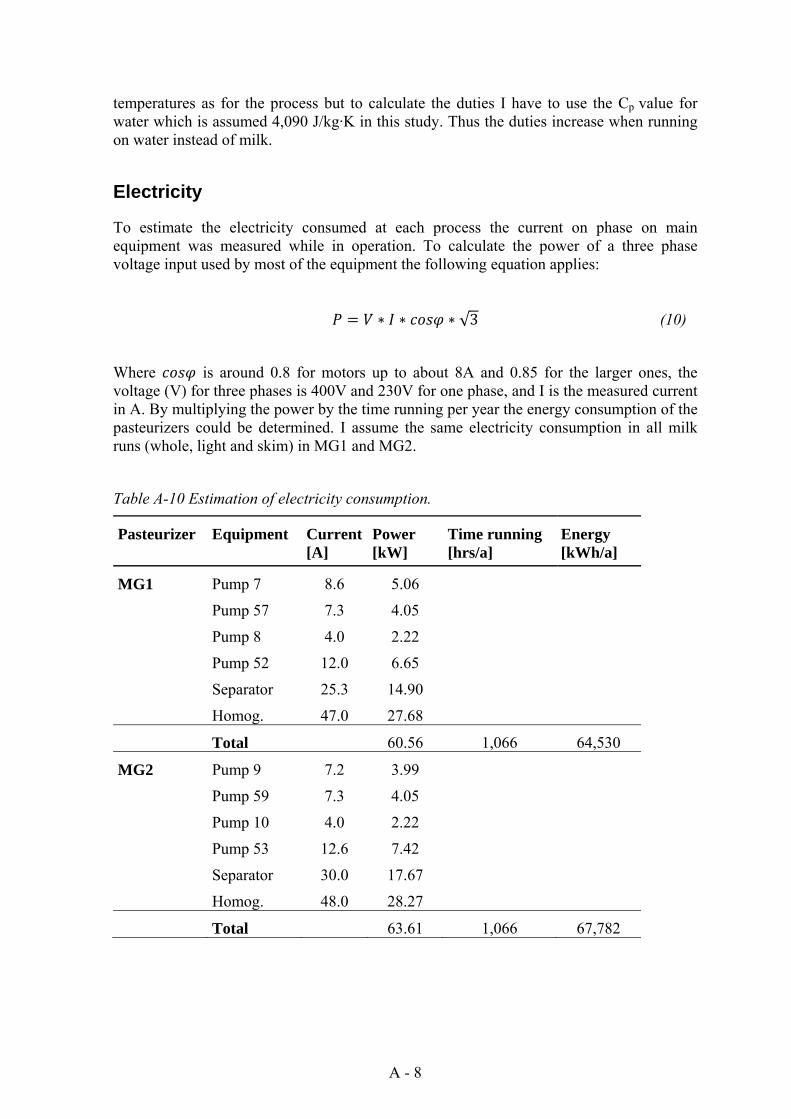
A - 8
temperatures as for the process but to calculate the duties I have to use the Cp value for water which is assumed 4,090 J/kg·K in this study. Thus the duties increase when running on water instead of milk.
Electricity
To estimate the electricity consumed at each process the current on phase on main equipment was measured while in operation. To calculate the power of a three phase voltage input used by most of the equipment the following equation applies:
√3 (10)
Where is around 0.8 for motors up to about 8A and 0.85 for the larger ones, the voltage (V) for three phases is 400V and 230V for one phase, and I is the measured current in A. By multiplying the power by the time running per year the energy consumption of the pasteurizers could be determined. I assume the same electricity consumption in all milk runs (whole, light and skim) in MG1 and MG2.
Table A-10 Estimation of electricity consumption.
Pasteurizer Equipment Current [A]
Power [kW]
Time running [hrs/a]
Energy [kWh/a]
MG1 Pump 7 8.6 5.06
Pump 57 7.3 4.05
Pump 8 4.0 2.22
Pump 52 12.0 6.65
Separator 25.3 14.90
Homog. 47.0 27.68
Total 60.56 1,066 64,530
MG2 Pump 9 7.2 3.99
Pump 59 7.3 4.05
Pump 10 4.0 2.22
Pump 53 12.6 7.42
Separator 30.0 17.67
Homog. 48.0 28.27
Total 63.61 1,066 67,782
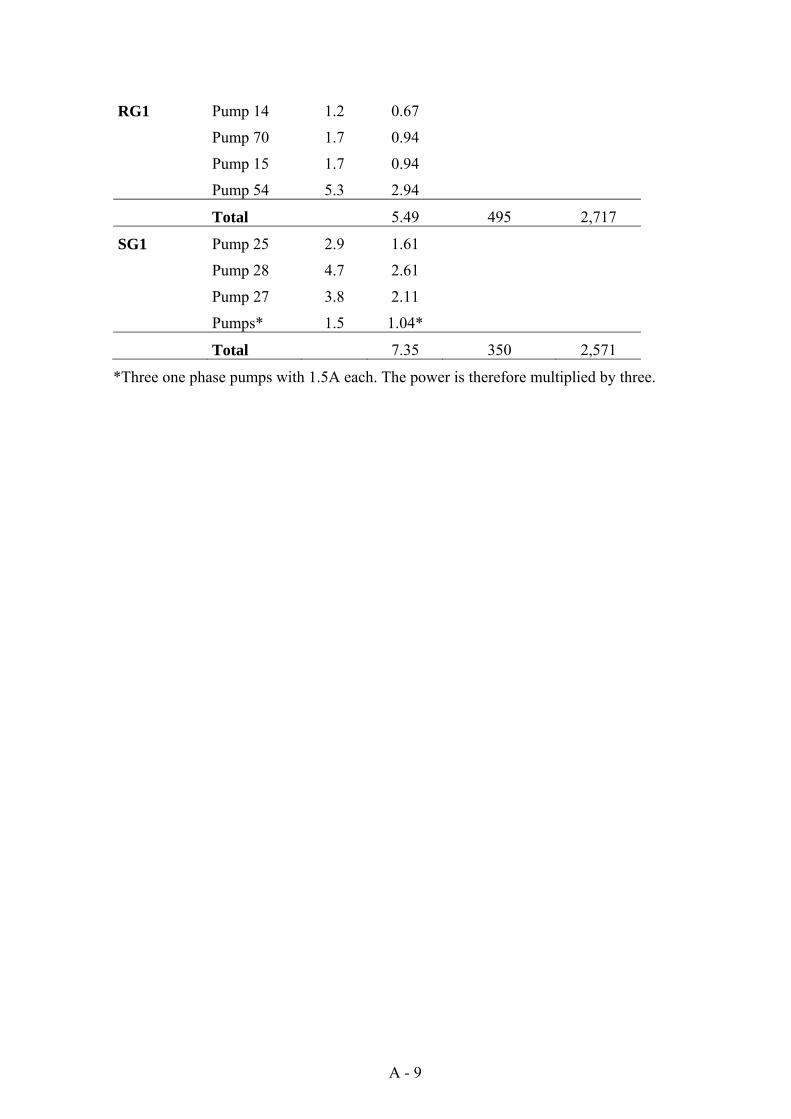
A - 9
RG1 Pump 14 1.2 0.67
Pump 70 1.7 0.94
Pump 15 1.7 0.94
Pump 54 5.3 2.94
Total 5.49 495 2,717
SG1 Pump 25 2.9 1.61
Pump 28 4.7 2.61
Pump 27 3.8 2.11
Pumps* 1.5 1.04*
Total 7.35 350 2,571
*Three one phase pumps with 1.5A each. The power is therefore multiplied by three.
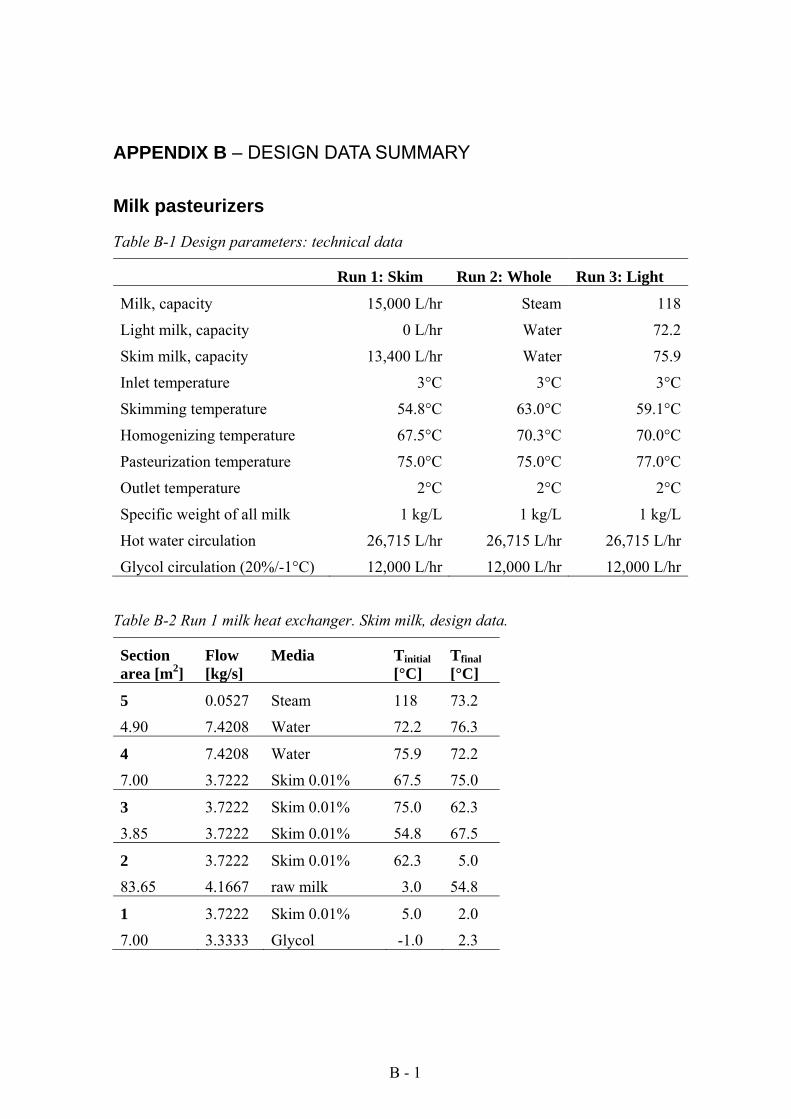
B - 1
APPENDIX B – DESIGN DATA SUMMARY
Milk pasteurizers
Table B-1 Design parameters: technical data
Run 1: Skim Run 2: Whole Run 3: Light
Milk, capacity 15,000 L/hr Steam 118
Light milk, capacity 0 L/hr Water 72.2
Skim milk, capacity 13,400 L/hr Water 75.9
Inlet temperature 3°C 3°C 3°C
Skimming temperature 54.8°C 63.0°C 59.1°C
Homogenizing temperature 67.5°C 70.3°C 70.0°C
Pasteurization temperature 75.0°C 75.0°C 77.0°C
Outlet temperature 2°C 2°C 2°C
Specific weight of all milk 1 kg/L 1 kg/L 1 kg/L
Hot water circulation 26,715 L/hr 26,715 L/hr 26,715 L/hr
Glycol circulation (20%/-1°C) 12,000 L/hr 12,000 L/hr 12,000 L/hr
Table B-2 Run 1 milk heat exchanger. Skim milk, design data.
Section area [m2]
Flow [kg/s]
Media Tinitial [°C]
Tfinal [°C]
5 0.0527 Steam 118 73.2
4.90 7.4208 Water 72.2 76.3
4 7.4208 Water 75.9 72.2
7.00 3.7222 Skim 0.01% 67.5 75.0
3 3.7222 Skim 0.01% 75.0 62.3
3.85 3.7222 Skim 0.01% 54.8 67.5
2 3.7222 Skim 0.01% 62.3 5.0
83.65 4.1667 raw milk 3.0 54.8
1 3.7222 Skim 0.01% 5.0 2.0
7.00 3.3333 Glycol -1.0 2.3
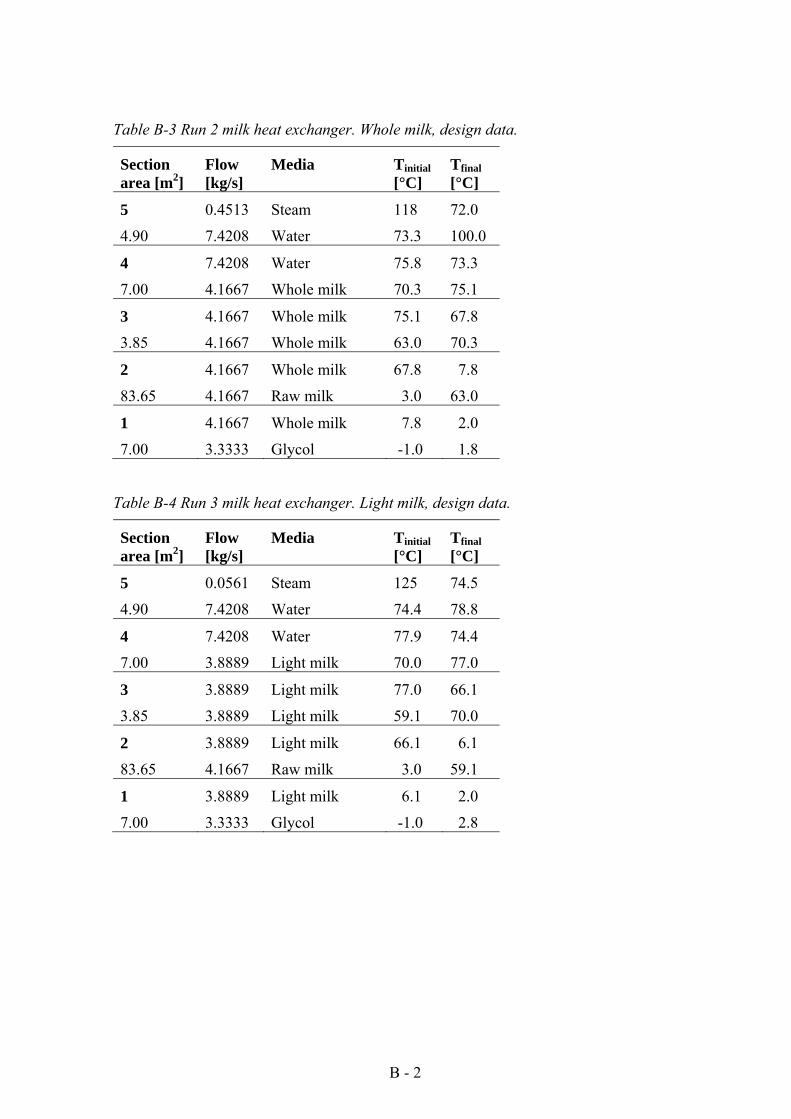
B - 2
Table B-3 Run 2 milk heat exchanger. Whole milk, design data.
Section area [m2]
Flow [kg/s]
Media Tinitial [°C]
Tfinal [°C]
5 0.4513 Steam 118 72.0
4.90 7.4208 Water 73.3 100.0
4 7.4208 Water 75.8 73.3
7.00 4.1667 Whole milk 70.3 75.1
3 4.1667 Whole milk 75.1 67.8
3.85 4.1667 Whole milk 63.0 70.3
2 4.1667 Whole milk 67.8 7.8
83.65 4.1667 Raw milk 3.0 63.0
1 4.1667 Whole milk 7.8 2.0
7.00 3.3333 Glycol -1.0 1.8
Table B-4 Run 3 milk heat exchanger. Light milk, design data.
Section area [m2]
Flow [kg/s]
Media Tinitial [°C]
Tfinal [°C]
5 0.0561 Steam 125 74.5
4.90 7.4208 Water 74.4 78.8
4 7.4208 Water 77.9 74.4
7.00 3.8889 Light milk 70.0 77.0
3 3.8889 Light milk 77.0 66.1
3.85 3.8889 Light milk 59.1 70.0
2 3.8889 Light milk 66.1 6.1
83.65 4.1667 Raw milk 3.0 59.1
1 3.8889 Light milk 6.1 2.0
7.00 3.3333 Glycol -1.0 2.8
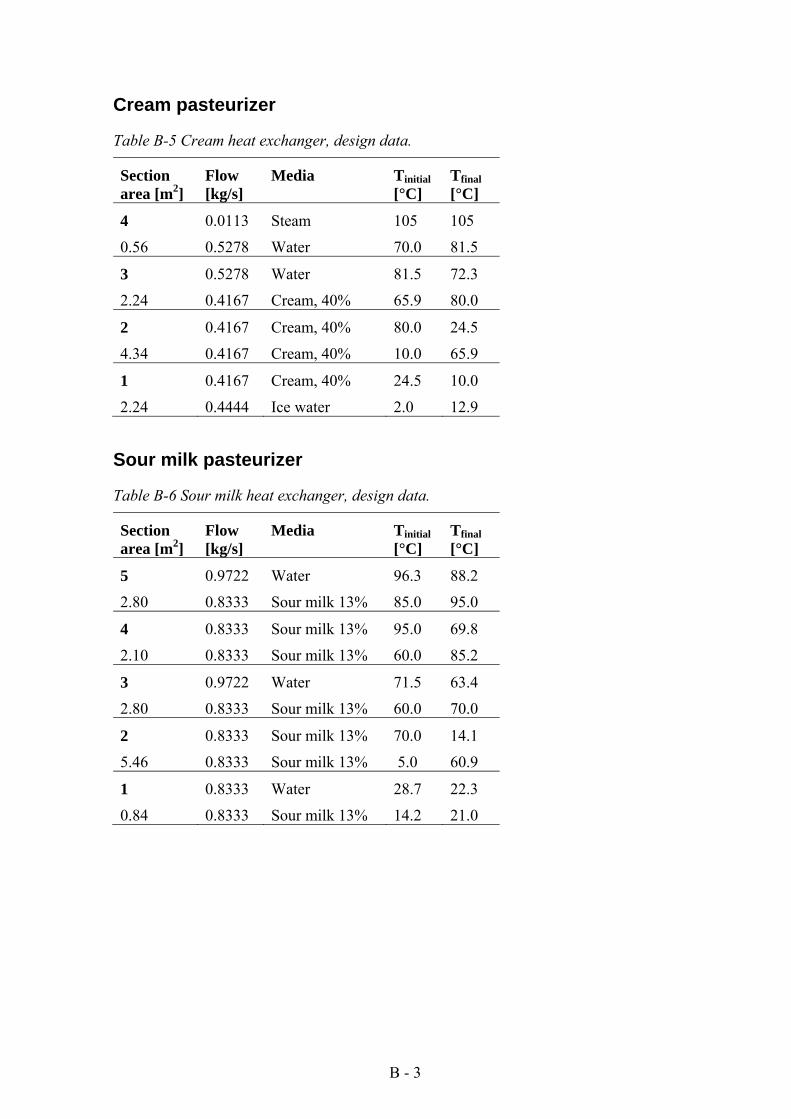
B - 3
Cream pasteurizer
Table B-5 Cream heat exchanger, design data.
Section area [m2]
Flow [kg/s]
Media Tinitial [°C]
Tfinal [°C]
4 0.0113 Steam 105 105
0.56 0.5278 Water 70.0 81.5
3 0.5278 Water 81.5 72.3
2.24 0.4167 Cream, 40% 65.9 80.0
2 0.4167 Cream, 40% 80.0 24.5
4.34 0.4167 Cream, 40% 10.0 65.9
1 0.4167 Cream, 40% 24.5 10.0
2.24 0.4444 Ice water 2.0 12.9
Sour milk pasteurizer
Table B-6 Sour milk heat exchanger, design data.
Section area [m2]
Flow [kg/s]
Media Tinitial [°C]
Tfinal [°C]
5 0.9722 Water 96.3 88.2
2.80 0.8333 Sour milk 13% 85.0 95.0
4 0.8333 Sour milk 13% 95.0 69.8
2.10 0.8333 Sour milk 13% 60.0 85.2
3 0.9722 Water 71.5 63.4
2.80 0.8333 Sour milk 13% 60.0 70.0
2 0.8333 Sour milk 13% 70.0 14.1
5.46 0.8333 Sour milk 13% 5.0 60.9
1 0.8333 Water 28.7 22.3
0.84 0.8333 Sour milk 13% 14.2 21.0
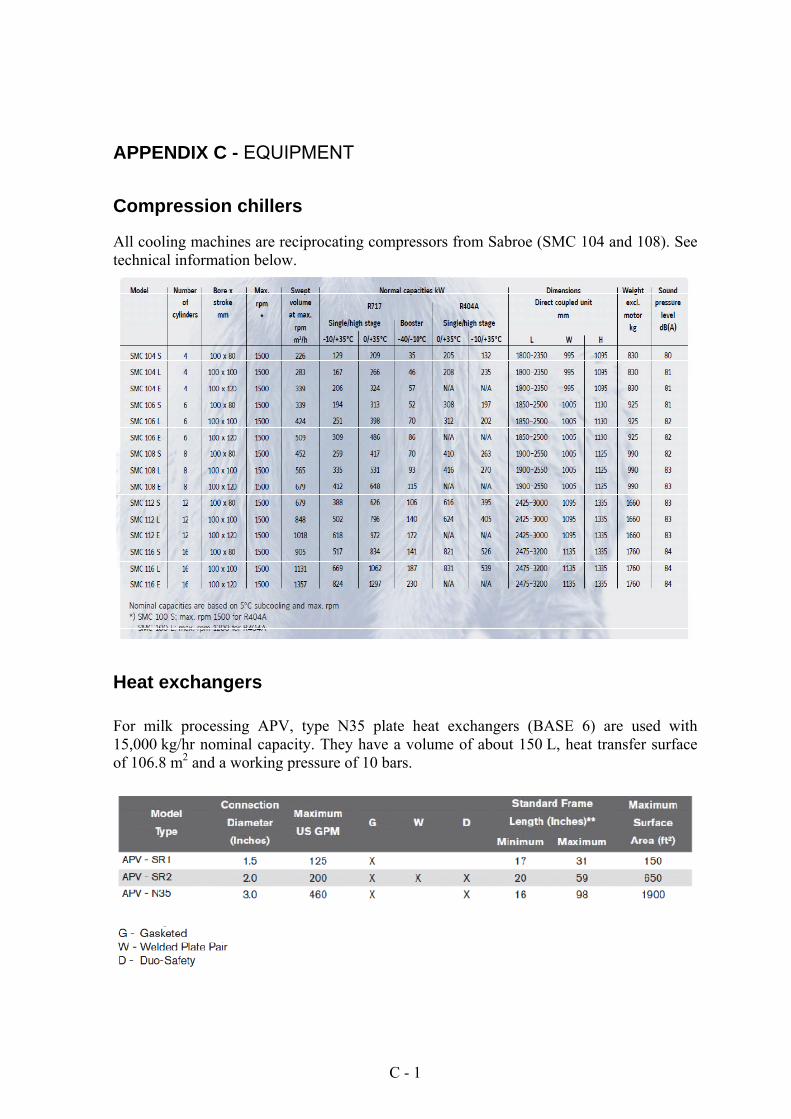
C - 1
APPENDIX C - EQUIPMENT
Compression chillers
All cooling machines are reciprocating compressors from Sabroe (SMC 104 and 108). See technical information below.
Heat exchangers
For milk processing APV, type N35 plate heat exchangers (BASE 6) are used with 15,000 kg/hr nominal capacity. They have a volume of about 150 L, heat transfer surface of 106.8 m2 and a working pressure of 10 bars.
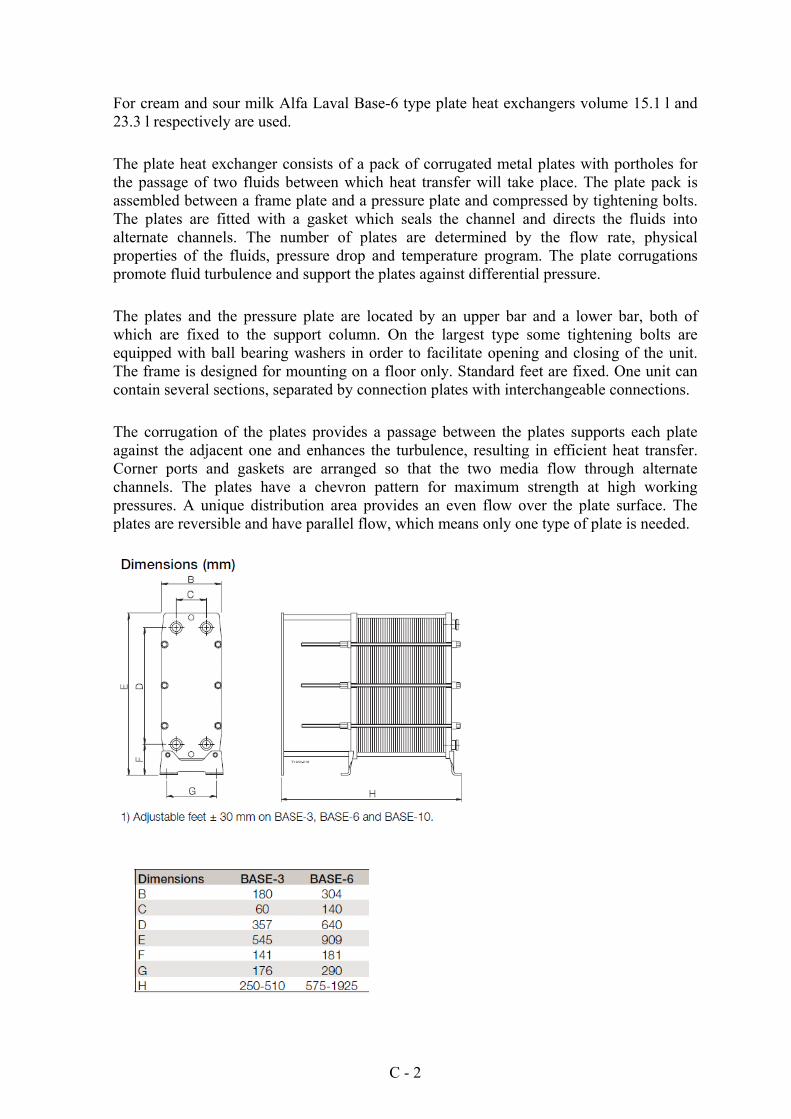
C - 2
For cream and sour milk Alfa Laval Base-6 type plate heat exchangers volume 15.1 l and 23.3 l respectively are used.
The plate heat exchanger consists of a pack of corrugated metal plates with portholes for the passage of two fluids between which heat transfer will take place. The plate pack is assembled between a frame plate and a pressure plate and compressed by tightening bolts. The plates are fitted with a gasket which seals the channel and directs the fluids into alternate channels. The number of plates are determined by the flow rate, physical properties of the fluids, pressure drop and temperature program. The plate corrugations promote fluid turbulence and support the plates against differential pressure.
The plates and the pressure plate are located by an upper bar and a lower bar, both of which are fixed to the support column. On the largest type some tightening bolts are equipped with ball bearing washers in order to facilitate opening and closing of the unit. The frame is designed for mounting on a floor only. Standard feet are fixed. One unit can contain several sections, separated by connection plates with interchangeable connections.
The corrugation of the plates provides a passage between the plates supports each plate against the adjacent one and enhances the turbulence, resulting in efficient heat transfer. Corner ports and gaskets are arranged so that the two media flow through alternate channels. The plates have a chevron pattern for maximum strength at high working pressures. A unique distribution area provides an even flow over the plate surface. The plates are reversible and have parallel flow, which means only one type of plate is needed.
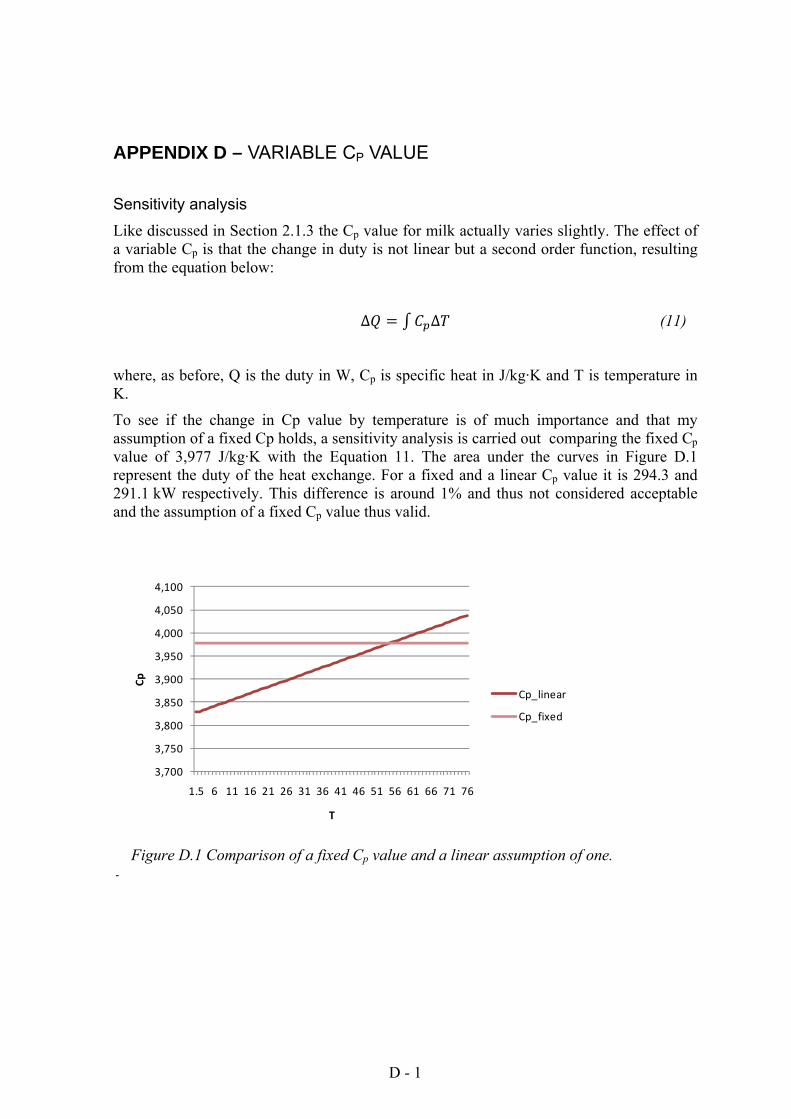
D - 1
APPENDIX D – VARIABLE CP VALUE
Sensitivity analysis Like discussed in Section 2.1.3 the Cp value for milk actually varies slightly. The effect of a variable Cp is that the change in duty is not linear but a second order function, resulting from the equation below:
∆ ∆ (11)
where, as before, Q is the duty in W, Cp is specific heat in J/kg·K and T is temperature in K.
To see if the change in Cp value by temperature is of much importance and that my assumption of a fixed Cp holds, a sensitivity analysis is carried out comparing the fixed Cp value of 3,977 J/kg·K with the Equation 11. The area under the curves in Figure D.1 represent the duty of the heat exchange. For a fixed and a linear Cp value it is 294.3 and 291.1 kW respectively. This difference is around 1% and thus not considered acceptable and the assumption of a fixed Cp value thus valid.
Figure D.1 Comparison of a fixed Cp value and a linear assumption of one.
3,700
3,750
3,800
3,850
3,900
3,950
4,000
4,050
4,100
1.5 6 11 16 21 26 31 36 41 46 51 56 61 66 71 76
Cp
T
Cp_linear
Cp_fixed