increased htlv-i proviral load and preferential expansion of htlv-i tax-specific cd8+ t cells in...
TRANSCRIPT

Molecular and ClinicalCorrelation in Five IndianFamilies with SpinocerebellarAtaxia 12Achal K. Srivastava, DM,1 Shweta Choudhry, MSc,2
Musuwadi S. Gopinath, MD,1 Sanghamitra Roy, MSc,2
Manjari Tripathi, DM,1 Samir K. Brahmachari, PhD,2,3
and Satish Jain, DM1
Spinocerebellar ataxia 12 (SCA12) is a recently identifiedform of autosomal dominant cerebellar ataxia associatedwith the expansion of an unstable CAG repeat in the 5*untranslated region of the gene PPP2R2B. We analyzed77 Indian families with autosomal dominant cerebellarataxia phenotype and confirmed the diagnosis of SCA12in 5 families, which included a total of 6 patients and 21family members. The sizes of the expanded alleles rangedfrom 55 to 69 CAG repeats, and the sizes of the normalalleles ranged from 7 to 31 repeats. We believe our studyis the first to demonstrate that SCA12 may not be as rarein some populations as previously thought.
Ann Neurol 2001;50:796–800
Autosomal dominant cerebellar ataxias (ADCAs) are agenetically heterogeneous group of hereditary neurode-generative disorders manifesting clinically in varyingdegrees of brainstem and cerebellar pathology or dys-function.1,2 The discovery of distinct disease-causinggenetic loci, which were previously defined on the basisof clinical1,2 and pathological criteria,3 has led to thegenetic subgrouping of ADCAs into spinocerebellarataxia 1 (SCA1),4 SCA2,5 SCA3/Machado-Joseph dis-ease (MJD),6 SCA6,7 SCA7,8 SCA8,9 SCA10,10
SCA12,11 SCA17,12 and dentatorubral pallidoluysianatrophy (DRPLA).13 Various ADCAs are caused by theabnormal expansion of trinucleotide repeat motifs intheir corresponding genes,4–9, 11–13 except for SCA10,which is due to a pentanucleotide (ATTCT) repeat ex-pansion.10
Recently, an expansion of CAG repeat in the 59 un-translated region of the gene PPP2R2B, encoding abrain-specific regulatory subunit of protein phosphatase2A, has been found to be responsible for a novel formof ADCA, termed SCA12.11 The expanded alleles con-tain 55 to 78 repeats, compared with 7 to 32 repeats innormal chromosomes.11,14,15 SCA12 is rare,11,14,15 andafter its first description in a large American pedigreeof German decent by Holmes and colleagues,11 onlyone more family, from India, has been identified so farwith SCA12 expansion.14 In this article, we report themolecular and clinical features of SCA12 mutation infive unrelated Indian families. In addition, we provideinformation on the occurrence of SCA12 among In-dian ADCA patients and report that SCA12 is not rarein India.
Subjects and MethodsA total of 293 individuals from 77 ADCA families and 135normal controls were studied. All probands and affected rel-atives were clinically examined by a team of neurologists andwere also subjected to nerve conduction studies and imagingof the brain (computed tomography [CT] or magnetic reso-nance imaging [MRI]). ADCA type was diagnosed in accor-dance with standard criteria.2 Blood samples were collectedfrom all patients, normal relatives (who were also evaluatedclinically), and healthy controls. All participants gave in-formed consent and confidentiality was ensured. Parentalconsent was obtained for minors. Some of these pedigreeshave been reported previously.16
DNA Isolation, Genotyping, and Sequencing AnalysisGenomic DNA was isolated from peripheral blood leuko-cytes using a modification of the salting-out procedure.17
The repeat-containing regions at SCA1,4 SCA2,5 SCA3/MJD,6 SCA6,7 SCA7,18 SCA8,9 SCA12,11 and DRPLA13
loci were amplified by polymerase chain reaction (PCR) us-ing previously published primers. The exact size of each re-peat was determined by Gene Scan analysis using an ABIPrism 377 automated DNA sequencer (Applied Biosystems,Foster City, CA).
All of the expanded and a few normal SCA12 alleles wereanalyzed by DNA sequencing. PCR products were generatedfrom genomic DNA using primer pair SCA12-FP (59 TG-GCCCTTAGCTGAGTGG 39) and SCA12-RP (59 TGCT-GGGAAAGAGTCGTG 39). Approximately 100ng ofgenomic DNA was amplified in a 50ml reaction volume con-taining a final concentration of 5mM Tris, 25mM KCl,0.75mM MgCl2, 0.05% gelatin, 20pmol of each primer,200mM dNTPs, and 0.5 units of Taq DNA polymerase.Samples were denatured at 94°C for 3 minutes followed by35 cycles of denaturation (94°C, 30 seconds), annealing(55°C, 30 seconds), extension (72°C, 30 seconds), and a fi-nal extension of 7 minutes at 72°C in a Perkin Elmer Ge-neAmp PCR System 9600 (Applied Biosystems, Foster City,CA). The PCR products were purified from bands cut out ofagarose gel using a QIAquick gel extraction kit (Qiagen) andwere directly sequenced using the dideoxy chain terminatorchemistry on an ABI Prism 377 automated DNA sequencerwith the PCR primers.
From the 1Department of Neurology, Neurosciences Center, All In-dia Institute of Medical Sciences, New Delhi, India; 2FunctionalGenomics Unit, Center for Biochemical Technology (CSIR), Delhi,India; and 3Molecular Biophysics Unit, Indian Institute of Science,Bangalore, India.
Received May 9, 2001, and in revised form Aug 24. Accepted forpublication Aug 24, 2001.
Published online Nov 1, 2001; DOI 10.1002/ana.10048
Address correspondence to Dr Jain, Department of Neurology,Neurosciences Center, All India Institute of Medical Sciences, NewDelhi, India 110 029. E-mail: [email protected]
BRIEF COMMUNICATIONS
796 © 2001 Wiley-Liss, Inc.

ResultsFrequency of SCA12 Mutation in Indian ADCA PatientsAmong the 77 families studied, the SCA1 mu-tation was detected in 12 families (15.6%), SCA2
in 19 families (24.7%), SCA3/MJD and SCA7 in2 families each (2.6%), and SCA12 in 5 families(6.5%). None had expansion at SCA6, SCA8, orDRPLA loci. The remaining 37 families (48%)
Fig 1. Pedigrees of five Indian families affected by SCA12. Solid symbols represent affected status, symbols with a question markrepresent presymptomatic status (for individuals with CAG expansion who have not yet developed clinical symptoms), and open sym-bols represent unaffected status. For the 27 individuals who were actually examined and genotyped, the SCA12 CAG repeat allelesizes and the age at disease onset are listed below their pedigree symbols.
Srivastava et al: Indian Families with SCA12 797
were negative for expansion at all the loci stud-ied.
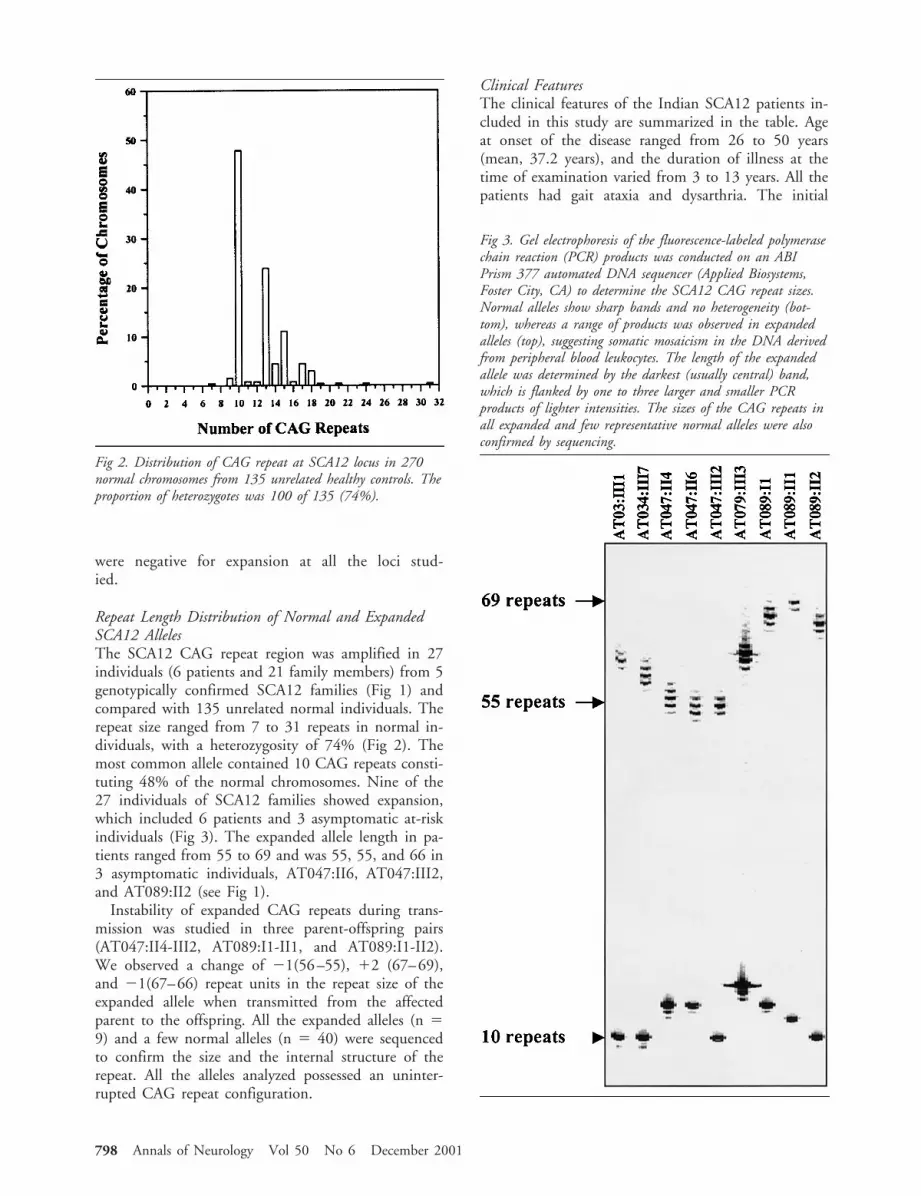
Repeat Length Distribution of Normal and ExpandedSCA12 AllelesThe SCA12 CAG repeat region was amplified in 27individuals (6 patients and 21 family members) from 5genotypically confirmed SCA12 families (Fig 1) andcompared with 135 unrelated normal individuals. Therepeat size ranged from 7 to 31 repeats in normal in-dividuals, with a heterozygosity of 74% (Fig 2). Themost common allele contained 10 CAG repeats consti-tuting 48% of the normal chromosomes. Nine of the27 individuals of SCA12 families showed expansion,which included 6 patients and 3 asymptomatic at-riskindividuals (Fig 3). The expanded allele length in pa-tients ranged from 55 to 69 and was 55, 55, and 66 in3 asymptomatic individuals, AT047:II6, AT047:III2,and AT089:II2 (see Fig 1).
Instability of expanded CAG repeats during trans-mission was studied in three parent-offspring pairs(AT047:II4-III2, AT089:I1-II1, and AT089:I1-II2).We observed a change of 21(56–55), 12 (67–69),and 21(67–66) repeat units in the repeat size of theexpanded allele when transmitted from the affectedparent to the offspring. All the expanded alleles (n 59) and a few normal alleles (n 5 40) were sequencedto confirm the size and the internal structure of therepeat. All the alleles analyzed possessed an uninter-rupted CAG repeat configuration.
Clinical FeaturesThe clinical features of the Indian SCA12 patients in-cluded in this study are summarized in the table. Ageat onset of the disease ranged from 26 to 50 years(mean, 37.2 years), and the duration of illness at thetime of examination varied from 3 to 13 years. All thepatients had gait ataxia and dysarthria. The initial
Fig 2. Distribution of CAG repeat at SCA12 locus in 270normal chromosomes from 135 unrelated healthy controls. Theproportion of heterozygotes was 100 of 135 (74%).
Fig 3. Gel electrophoresis of the fluorescence-labeled polymerasechain reaction (PCR) products was conducted on an ABIPrism 377 automated DNA sequencer (Applied Biosystems,Foster City, CA) to determine the SCA12 CAG repeat sizes.Normal alleles show sharp bands and no heterogeneity (bot-tom), whereas a range of products was observed in expandedalleles (top), suggesting somatic mosaicism in the DNA derivedfrom peripheral blood leukocytes. The length of the expandedallele was determined by the darkest (usually central) band,which is flanked by one to three larger and smaller PCRproducts of lighter intensities. The sizes of the CAG repeats inall expanded and few representative normal alleles were alsoconfirmed by sequencing.
798 Annals of Neurology Vol 50 No 6 December 2001
symptom of the disease in 4 of our patients was tremorin the hands, while the remaining 2 presented with gaitataxia and dysarthria. Five of 6 had brisk reflexes and 2patients had extensor plantar responses. Other symp-toms were slow saccades, broken pursuits, horizontalnystagmus, facial myokymia, and axial dystonia. Noneof the patients had visual problems, ophthalmoplegia,dysphagia, or dementia (“deranged” Mini Mental Sta-tus Examination score). Nerve conductions revealedsubclinical sensory neuropathy in 2 (absent sural sen-sory nerve action potential [SNAP]) and axonal sensorymotor neuropathy in three (reduced amplitude of com-pound motor action potential [CMAP], reduced motornerve conduction velocity [MNCV], and absent suralSNAP), but were normal in 1 affected individual. Re-sults of nerve conduction studies in 2 at-risk individu-als were normal. Brain imaging (CT/MRI) was per-formed on all 6 affected patients and showed cerebellaras well as cerebral cortical atrophy in 5, while the CTscan was normal for the sixth patient (AT034:III7).
Correlation between Repeat Number and Ageat OnsetNo apparent correlation was observed between the re-peat size and the age at disease onset in SCA12 pa-tients. Our observation is consistent with previous re-ports.11,14,19 However, in one parent-offspring pair,the transmission of the disease allele from the father
AT089:I1 (disease onset at 50 years; repeat length n 567) to his affected son AT089:II1 (onset at 27 years;repeat length n 5 69) did accompany a decrease in ageat onset with an increase in the number of repeat units.Contraction in the length of the expanded allele from56 to 55 and from 67 to 66 was observed in the trans-mission of the disease allele from affected fathers(AT047:II4 and AT089:I1, respectively) to theirasymptomatic children (AT047:III2 and AT089:II2).As the latter are young (20 and 32 years) and still notclinically affected, it is not possible to comment on theconsequence of this contraction on the age at onset atthis time.
DiscussionOur study demonstrates that SCA12 is not rare in In-dia and accounts for approximately 7% of the ADCAcases seen in our centre. The molecular study ofSCA12 families revealed a pathological CAG expansionin all 6 affected individuals and in 3 asymptomatic in-dividuals. The repeat sizes of the expanded allelesranged from 55 to 69 repeat units and were unstableduring transmission from parents to offspring. How-ever, the instability was restricted to few repeat unitchanges (21 to 12 repeat units). In contrast to otherCAG repeat disorders20 in which expansions are morecommon than contractions, in our SCA12 familiescontractions (in two of the three vertical transmissions)were observed more frequently. Furthermore, an in-verse correlation between increasing repeat size and ear-lier age at disease onset, a characteristic of triplet repeatdisorders,20 was also not observed in our SCA12 pa-tients.
The clinical features of our SCA12 patients are com-parable to those described earlier11,14,19 and span thefull spectrum of ADCA type I except for optic atrophy.Even in the presence of overt ataxia in all cases, 67% ofthe patients reported hand tremor as the initial symp-tom. Oculomotor disturbances (in 3 of 6 patients), fa-cial myokymia (in 2 of 6), and axial dystonia (in 1 of6) were the other features we observed. In contrast toprevious reports,11,14,19 none of our patients had clin-ical evidence of dementia (2 patients aged 57 and 62years had ataxia for over a decade), while 2 had facialmyokymia. Additionally, we found evidence of subclin-ical neuropathy in 5 of 6 patients. A clinical compari-son of the SCA12 phenotype with other SCAs revealedno specific signs that could consistently identify thissubtype, making genotyping essential for its accuratediagnosis. In retrospect, we conclude that those ADCApatients presenting with hand tremor in a setting ofmilder ataxia, with brisk reflexes, evidence of subclini-cal peripheral neuropathy, and cerebral cortical andcerebellar atrophy, can be suspected of having SCA12.
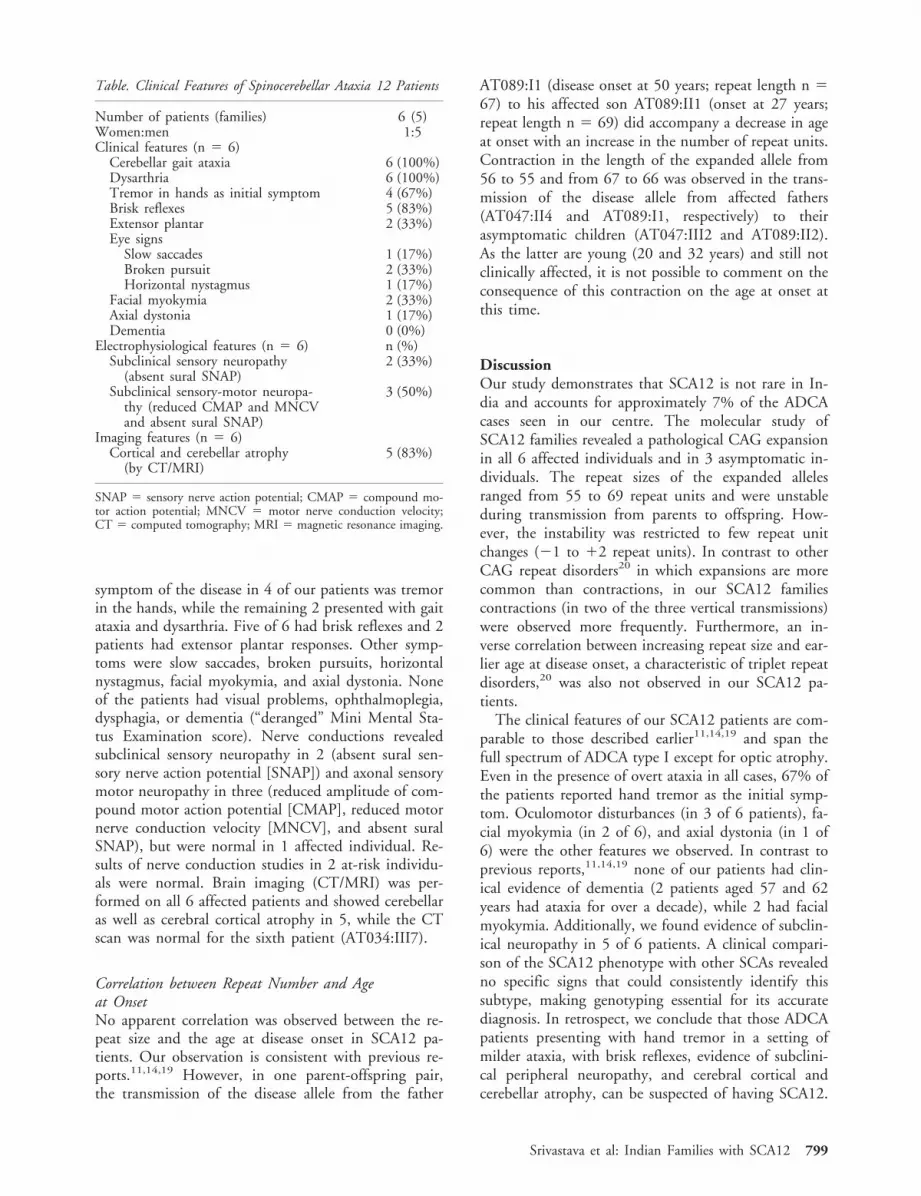
Table. Clinical Features of Spinocerebellar Ataxia 12 Patients
Number of patients (families) 6 (5)Women:men 1:5Clinical features (n 5 6)
Cerebellar gait ataxia 6 (100%)Dysarthria 6 (100%)Tremor in hands as initial symptom 4 (67%)Brisk reflexes 5 (83%)Extensor plantar 2 (33%)Eye signs
Slow saccades 1 (17%)Broken pursuit 2 (33%)Horizontal nystagmus 1 (17%)
Facial myokymia 2 (33%)Axial dystonia 1 (17%)Dementia 0 (0%)
Electrophysiological features (n 5 6) n (%)Subclinical sensory neuropathy
(absent sural SNAP)2 (33%)
Subclinical sensory-motor neuropa-thy (reduced CMAP and MNCVand absent sural SNAP)
3 (50%)
Imaging features (n 5 6)Cortical and cerebellar atrophy
(by CT/MRI)5 (83%)
SNAP 5 sensory nerve action potential; CMAP 5 compound mo-tor action potential; MNCV 5 motor nerve conduction velocity;CT 5 computed tomography; MRI 5 magnetic resonance imaging.
Srivastava et al: Indian Families with SCA12 799

Financial support from the Department of Biotechnology, Govern-ment of India, to S. K. Brahmachari of the Programme on Func-tional Genomics, is duly acknowledged. We thank Dr M. Mukerjifor scientific assistance and Ms R. Jaya, Ms Sakshi, Ms Manju, MsGurjit, and Mrs Anuradha for technical support.
References1. Harding AE. The clinical features and classification of the late
onset autosomal dominant cerebellar ataxias: a study of 11 fam-ilies, including descendants of ‘the Drew family of Walworth.’Brain 1982;105:1–28.
2. Harding AE. Clinical features and classification of inheritedataxias. Adv Neurol 1993;61:1–14.
3. Konigsmark BW, Weiner LP. The olivopontocerebellaratrophies: a review. Medicine (Baltimore) 1970;49:227–241.
4. Orr HT, Chung MY, Banfi S, et al. Expansion of an unstabletrinucleotide CAG repeat in spinocerebellar ataxia type 1. NatGenet 1993;4:221–226.
5. Pulst SM, Nechiporuk A, Nechiporuk T, et al. Moderate ex-pansion of a normally biallelic trinucleotide repeat in spinocer-ebellar ataxia type 2. Nat Genet 1996;4:269–276.
6. Kawaguchi Y, Okamoto T, Taniwaki M, et al. CAG expansionin a novel gene for Machado-Joseph disease at chromosome14q32.1. Nat Genet 1994;8:221–227.
7. Zhuchenko O, Bailey J, Bonnen P, et al. Autosomal dominantcerebellar ataxia (SCA6) associated with small polyglutamine ex-pansions in the alpha 1A-voltage-dependent calcium channel.Nat Genet 1997;15:62–69.
8. David G, Abbas N, Stevanin G, et al. Cloning of the SCA7gene reveals a highly unstable CAG repeat expansion. NatGenet 1997;17:65–70.
9. Koob MD, Moseley ML, Schut LJ, et al. An untranslated CTGexpansion causes a novel form of spinocerebellar ataxia (SCA8).Nat Genet 1999;21:379–384.
10. Matasuura T, Yamagata T, Burgess DL, et al. Large expansionof the ATTCT pentanucleotide repeat in spinocerebellar ataxiatype 10. Nat Genet 2000;26:191–194.
11. Holmes SE, O’Hearn EE, McInnis MG, et al. Expansion of anovel CAG trinucleotide repeat in the 59 region of PPP2R2B isassociated with SCA12. Nat Genet 1999;23:391–392.
12. Nakamura K, Jeong SY, Uchihara T, et al. SCA17, a novelautosomal dominant cerebellar ataxia caused by an expandedpolyglutamine in TATA-binding protein. Hum Mol Genet2001;10:1441–1448.
13. Koide R, Ikeuchi T, Onodera O, et al. Unstable expansion ofCAG repeat in hereditary dentatorubral-pallidoluysian atrophy(DRPLA). Nat Genet 1994;6:9–13.
14. Fujigasaki H, Verma IC, Camuzat A, et al. SCA12 is a rarelocus for autosomal dominant cerebellar ataxia: a study of anIndian family. Ann Neurol 2001;49:117–21.
15. Worth PF, Wood NW. Spinocerebellar ataxia type 12 is rare inthe United Kingdom. Neurology 2001;56:419–420.
16. Saleem Q, Choudhry S, Mukerji M, et al. Molecular analysis ofautosomal dominant hereditary ataxias in the Indianpopulation: high frequency of SCA2 and evidence for a com-mon founder mutation. Hum Genet 2000;106:179–187.
17. Miller SA, Dykes DD, Polesky HF. A simple salting out pro-cedure for extracting DNA from human nucleated cells. Nu-cleic Acids Res 1988;16:1215.
18. Gouw LG, Castaneda MA, McKenna CK, et al. Analysis of thedynamic mutation in the SCA7 gene shows marked parentaleffects on CAG repeat transmission. Hum Mol Genet 1998;7:525–532.
19. O’Hearn E, Holmes SE, Calvert PC, et al. SCA-12: tremorwith cerebellar and cortical atrophy is associated with a CAGrepeat expansion. Neurology 2001;56:299–303.
20. Cummings CJ, Zoghbi HY. Fourteen and counting: unravelingtrinucleotide repeat diseases. Hum Mol Genet 2000;9:909–916.
Reorganization of SomaticSensory Function in theHuman Thalamus AfterStrokeShinji Ohara, MD, PhD,and Frederick A. Lenz, MD, PhD
A patient with a thalamic stroke underwent amicroelectrode-guided stereotactic thalamic explorationduring surgery for control of tremor. The results of so-matic sensory mapping in this patient were comparedwith explorations carried out during stereotactic surgeryfor the control of essential tremor (70 patients). Therewas evidence both of somatotopic reorganization and ofanatomic reorganization of the representation of deepstructures in the principal somatic sensory nucleus of thethalamus and the nuclei located anterior to it. This casedemonstrates that thalamic reorganization can occur aftera thalamic stroke and may play a role in recovery fromsuch a stroke.
Ann Neurol 2001;50:800–803
Reorganization of cortical function has been shown totake place after a cortical stroke, and may be related tofunctional recovery from strokes.1–4 Subcortical lesionsalso cause functional deficits, followed by substantialrecovery, perhaps due to changes in cortical func-tion.5,6 However, the subcortical structure itself mayreorganize. We present results of a microelectrode ex-ploration during thalamic surgery for tremor after anischemic thalamic stroke that demonstrated clear tha-lamic reorganization after the stroke.
Case ReportThe patient was 59-year-old Caucasian man who experiencedsudden onset of a left hemiparesis and hemianesthesia due to
From the Department of Neurosurgery, Johns Hopkins Hospital,Baltimore, MD
Received May 11, 2001, and in revised form Aug 28, 2001. Ac-cepted for publication Aug 28, 2001.
Published online Nov 1, 2001; DOI: 10.1002/ana.10041
Address correspondence to Dr Lenz, Department of Neurosurgery,Johns Hopkins Hospital, Meyer 7-113, 600 North Wolfe Street,Baltimore, MD 21287-7713. E-mail: [email protected]
800 © 2001 Wiley-Liss, Inc.

an ischemic stroke. Magnetic resonance imaging and com-puted tomography showed an infarction in the right medialtemporo-occipital lobes and right posterior thalamus (Fig,A). His initial symptoms, including anesthesia, abated, butwithin a few weeks he developed tremor in his left hand thatdid not respond to medical therapy.7–11
On examination, the patient had a left hemianopia, mildleft hemiparesis, and disabling tremor in the left upper ex-tremity. His tremor occurred at rest as well as with postureand action at a frequency of approximately 4Hz. Given thefailure of medical therapy, the patient was taken to the op-erating room for implantation of a thalamic stimulatingelectrode for control of tremor. The procedure was termi-nated after the exploration and before implantation ofthe electrode because it became clear that the area in whichthe electrode would be implanted was involved with thestroke.
Operative ProceduresThe coordinates of thalamic nuclei were interpolated fromthe coordinates of the anterior commissure–posterior com-missure (AC–PC) line, as determined from a computed to-mography scan. The target region was explored with the mi-croelectrode, which was advanced along trajectories madethrough a burr hole located 2.5cm lateral to the midline atthe level of the coronal suture. The first trajectory was to-ward the principal somatic sensory nucleus (ventral caudal,Vc), because the response of cells in this area to somaticstimulation was the most reliable physiological landmark forthe exploration.12 Next, the regions anterior to Vc, presumedthalamic nuclei ventral intermediate and ventral oral poste-rior, were explored to identify the optimal site for implanta-tion of the electrode.
Physiological exploration with the microelectrode involvedboth recording of neuronal activity and stimulation at mi-croampere current levels. Cells responding to somatic sensorystimulation (sensory cells) were characterized by their re-sponse to stimulation of cutaneous or deep structures. Cuta-neous sensory cells responded to touch or light pressure ap-plied to the skin. Deep sensory cells responded to jointmovement or to squeezing of muscle or tendon, or both, butthey did not respond to stimulation of the skin deformed bythese stimuli. A reproducible response to repeated applica-tion of a stimulus in one part of the body was required toidentify a neuronal receptive field (RF).
Data AnalysisTo demonstrate the unique distribution of sensory cells, wereviewed a consecutive series of essential tremor (ET) pa-tients undergoing stereotactic surgery (70 patients, 237 tra-jectories) as a control population. None of these patients wasfound to have abnormalities on detailed somatic sensory ex-amination. Deep or cutaneous RFs were used to identify thebody part represented by a cell. Separate body parts weredefined as intraoral structures, face, upper extremity, orlower extremity, based on the distribution of sensory cells.13
Differences in proportions were tested statistically using a x2
or Fisher’s exact test, as appropriate.
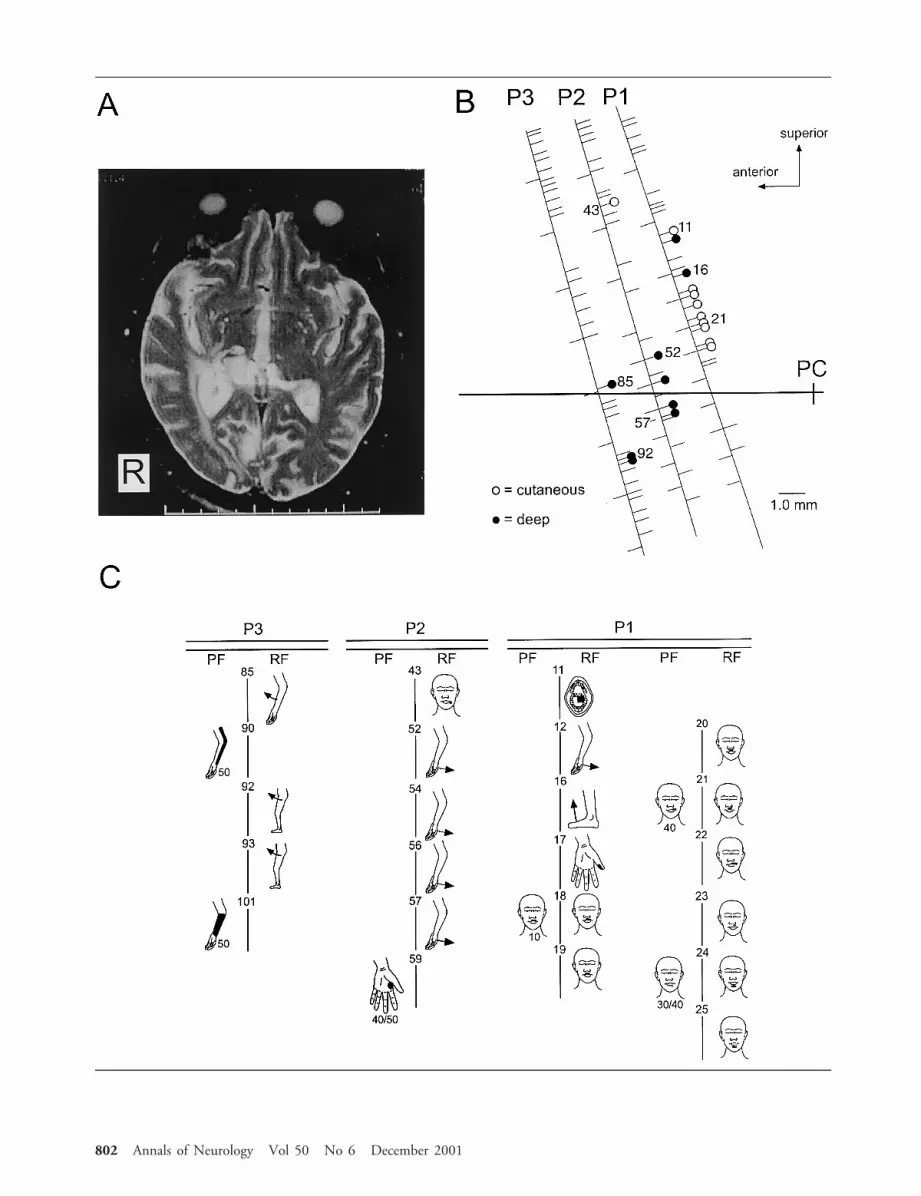
ResultsIn the present case, sensory cells were recorded alongeach of three trajectories in the 14mm lateral parasag-ittal plane. There were 19 sensory cells (9 deep and 10cutaneous sensory cells) among a total of 83 cells re-corded in this patient (see Fig, B). In the 70 ET pa-tients, a total of 4,088 cells were identified along 237trajectories. The location of recordings in thalamus wasverified by the presence of thalamic neuronal burstingfiring pattern for cells.14 It was not possible to distin-guish the discharge patterns in this patient from thosein the controls given this small number of cells in ourpatient. We first examined the location of deep sensorycells relative to the AC–PC line. The distribution ofdeep sensory cells above the AC–PC line in the presentcase was 5 of 9 (56%); significantly different (p 50.04) from that in the ET patients 476 of 563 (85%).The proportion of all cells that were located above theAC–PC line was not different (p 5 0.09) between ourcase (62 of 83; 74%) and the ET patients (3361 of4088; 82%). Therefore, the proportion of deep sensorycells above the AC–PC line was significantly lower inthe present case than in controls.
Along the most posterior trajectory in the case (seeFig, B), 11 sensory cells were identified; the RFs ofthese cells together included all four body parts (ie, in-traoral structures, face, upper extremity, and lower ex-tremity). Along 237 trajectories in 70 control patientswith ET, however, 47% (112 of 237), 35% (84 of237), and 8% (20 of 237) of trajectories had one, two,and three of four body parts represented in the RFs ofdeep and cutaneous sensory cells recorded along a tra-jectory. Trajectories with no RFs comprised 9% (21 of237), but trajectories with RFs including all four bodyparts were never found in this sample. Therefore, theproportion of trajectories with four body parts repre-sented was significantly higher in the stroke patient (1of 3) than in control ET patients (0 of 237; p 5 0.01).
DiscussionThe present case of thalamic stroke demonstrates reor-ganization of thalamic maps based on comparison withmaps in 70 control patients with ET. RFs for cells lo-cated along one trajectory in the present case coveredall of four body parts, which was not observed in alarge control sample of ET patients (237 trajectories,70 patients). The normal consistency of RFs along onetrajectory is due to the normal somatotopy of cutane-ous and deep cells. Cells with cutaneous RFs are ar-ranged into parasagittal sheets of cells, so that a trajec-tory in the parasagittal plane will usually encountercellular RFs located on one or two different parts ofthe body.13 The representation of deep structures inany part of the body parallels the cutaneous represen-tation of those parts (see Fig 5 in Lenz et al13). Thus,the representation of four body parts along a single tra-
Ohara and Lenz: Reorganization of Human Thalamus After Stroke 801
802 Annals of Neurology Vol 50 No 6 December 2001
jectory in the parasagittal plane (see Fig) is a dramaticdeparture from normal thalamic somatotopy.
These results also suggest that the location of cellswith deep RFs has been shifted to a position inferior tothe usual location of such cells. These results could re-sult from physical distortion of the thalamus resultingfrom the stroke. However, it is more likely that thesomatic sensory nucleus and the nuclei anterior to ithave reorganized as a result of the stroke. To ourknowledge, this is the first report of single neuron anal-ysis demonstrating functional reorganization in the pri-mate thalamus after a thalamic stroke.
It has been reported that thalamic sensory organiza-tion is modified by interruption of sensory input.14–17
The thalamic reorganization resulting from the tha-lamic damage has been previously reported in only 2patients without either a description of lesions or a mi-croelectrode analysis in the region of the stroke.8 Therelationship between thalamic reorganization and cor-tical reorganization is inextricable due to reciprocalconnections of these structures. Studies using positronemission tomography in patients with a subcorticalstroke assume that the function in the subcorticalstructures is taken over by related cortical areas.5,6 Re-covery from motor stroke due to striatal–capsular in-farction is associated with bilateral activation of thecortical motor system, with use of ipsilateral pathwaysand recruitment of additional cortical sensorimotor ar-eas.5 The hemiplegia after ischemic infarction in thebasal ganglia and the thalamus is reported to recover inparallel with the activation in the ipsilateral sensorimo-tor cortex.6 Therefore, cortical reorganization is an im-portant aspect of recovery from subcortical strokes.However, the present case demonstrates that thalamicreorganization may also play a role in recovery fromthalamic strokes.
This work was supported by the National Institutes of Health(NS38493 and NS40059 to F.A.L.).
We thank L. H. Rowland for excellent technical assistance.
References1. Castro-Alamancos MA, Borrel J. Functional recovery of fore-
limb response capacity after forelimb primary motor cortexdamage in the rat is due to the reorganization of adjacent areasof cortex. Neuroscience 1995;68:793–805.
2. Nudo RJ, Wise BM, SiFuentes F, et al. Neural substrates forthe effects of rehabilitative training on motor recovery afterischemic infarct. Science 1996;272:1791–1794.
3. Nudo RJ, Milliken GW. Reorganization of movement repre-sentations in primary motor cortex following focal ischemic in-farcts in adult squirrel monkeys. J Neurophysiol 1996;75:2144–2149.
4. Xerri C, Merzenich MM, Peterson BE, et al. Plasticity of pri-mary somatosensory cortex paralleling sensorimotor skill recov-ery from stroke in adult monkeys. J Neurophysiol 1998;79:2119–2148.
5. Weiller C, Chollet F, Friston KJ, et al. Functional reorganiza-tion of the brain in recovery from striatocapsular infarction inman. Ann Neurol 1992;31:463–472.
6. Weder B, Knorr U, Herzog H, et al. Tactile exploration ofshape after subcortical ischaemic infarction studied with PET.Brain 1994;117:593–605.
7. Dejerine J, Roussy G. La syndrome thalamique. Rev Neurol1906;14:521–532.
8. Ohye C, Shibazaki T, Hirai T, et al. Plastic change of thalamicorganization in patients with tremor after stroke. Appl Neuro-physiol 1985;48:288–292.
9. Kim JS. Delayed onset hand tremor caused by cerebral infarc-tion. Stroke 1992;23:292–294.
10. Ferbert A, Gerwig M. Tremor due to stroke. Mov Disord1993;8:179–182.
11. Miwa H, Hatori K, Kondo T, et al. Thalamic tremor: casereports and implications of the tremor-generating mechanism.Neurology 1996;46:75–79.
12. Lenz FA, Normand SL, Kwan HC, et al. Statistical predictionof the optimal lesion site for thalamotomy in parkinsoniantremor. Mov Disord 1995;10:318–328.
13. Lenz FA, Dostrovsky JO, Tasker RR, et al. Single-unit analysisof the human ventral thalamic nuclear group: somatosensoryresponses. J Neurophysiol 1988;59:299–316.
14. Lenz FA, Kwan HC, Martin R, et al. Characteristics of soma-totopic organization and spontaneous neuronal activity in theregion of the thalamic principal sensory nucleus in patientswith spinal cord transection. J Neurophysiol 1994;72:1570 –1587.
15. Garraghty PE, Kaas JH. Functional reorganization in adultmonkey thalamus after peripheral nerve injury. Neuroreport1991;2:747–750.
16. Rasmusson DD. Changes in the response properties of neuronsin the ventroposterior lateral thalamic nucleus of the raccoonafter peripheral deafferentation. J Neurophysiol 1996;75:2441–2450.
17. Lenz FA, Zirh AT, Garonzik IM, et al. Neuronal activity in theregion of the principle sensory nucleus of human thalamus(ventralis caudalis) in patients with pain following amputations.Neuroscience 1998;86:1065–1081.
Š Fig. (A) Axial T2-weighted magnetic resonance image shows an ischemic lesion in the right posterior thalamus. (B) Positions of thetrajectories (oblique lines) relative to the anterior commissure–posterior commissure (AC–PC) line (horizontal line). Locations ofcells and stimulation sites are indicated by tick marks to the right and left of each trajectory, respectively. Open circles 5 cutaneoussensory cells; closed circles 5 deep sensory cells. (C) Projected and receptive fields for the sites identified in B. Each site where acell was recorded or stimulation was carried out is indicated by the same number in B and C. Threshold (in mA) is indicated be-low the projected field figurines. Bar in A is in centimeters.
Ohara and Lenz: Reorganization of Human Thalamus After Stroke 803
Evidence for PostjunctionalSerotonin (5-HT1) Receptorsin the TrigeminocervicalComplexPeter J. Goadsby, MD, DSc, Simon Akerman, MSc,and R. James Storer, PhD
Units linked to stimulation of the superior sagittal sinuswere identified and recorded from in the trigeminocervi-cal complex of the anesthetized cat. Iontophoresis of glu-tamate NMDA receptor agonists increased the baseline-firing rate of these neurons. Coejection of sumatriptan,4991W93, or ergometrine resulted in a significant reduc-tion in NMDA agonist-induced increases in firing. Thesedata establish the existence of triptan-sensitive (5-HT1)receptors on postsynaptic central trigeminal neurones.
Ann Neurol 2001;50:804–807
The pain in primary headache syndromes, such as mi-graine and cluster headache, is transmitted via the oph-thalmic (first) division of the trigeminal nerve frompain-producing intracranial structures, such as the duramater and large vessels, projecting to the trigeminocer-vical complex.1 Modulation of pain transmission bytriptans, 5-HT1B/1D receptor agonists, formed an im-portant advance in treatment,2 offering clarification ofpotential pharmacological mechanisms involved in ter-minating these attacks.3 A key question in understand-ing the mechanism of action of these compounds istheir site of action.
One proposed site of action for triptans is within thetrigeminocervical complex.3 It has been assumed, basedon observations of inhibition of plasma protein extrav-asation,4 and because of the localization of 5-HT1D
mRNA in the trigeminal ganglion,5 that triptans blocktrigeminal transmission by a prejunctional mechanism.However, this has never been tested. It has been shownthat some component of transmission across the tri-geminal nucleus involves glutamatergic mecha-nisms.6–8 In the current study we exploited the factthat microiontophoretic application of NMDA recep-tor agonists can excite trigeminal neurons locally and
thus directly override any prejunctional inhibitory ef-fect of triptans, allowing direct examination of thefunctional localization of 5HT1 receptors in the tri-geminocervical complex.
Materials and MethodsAll studies reported were conducted and terminated undergeneral anesthesia in accordance with a project license is-sued by the Home Office of the United Kingdom underthe Animals (Scientific Procedures) Act 1986. Five catsweighing 3.3 6 0.4kg (mean SD) were anesthetized witha-chloralose (60mg/kg ip; Sigma, St. Louis, MO) and pre-pared for physiological monitoring. Halothane (May &Baker-Rhone-Poulenc, Dagenham, UK/Fluothane, Zeneca,Macclesfield, UK) (0.5–3% in a 40% oxygen/air mixture)was administered during surgical procedures and then dis-continued during experimental protocols.9 Core tempera-ture was monitored and maintained using a rectal ther-mistor probe and a homeothermic heater blanket system(Harvard Apparatus, Holliston, MA). Cats were intubatedand ventilated with a 40% oxygen/air mixture (HarvardApparatus); end-tidal CO2 and expired oxygen were con-tinuously monitored (Datex-Ohmeda, Helsinki, Finland).The depth of anesthesia was examined periodically by test-ing for sympathetic (pupillary and cardiovascular) responsesto noxious stimulation and withdrawal reflexes in the ab-sence of neuromuscular blockade.
Stimulation and RecordingThe superior sagittal sinus (SSS) was isolated for stimula-tion and supramaximally stimulated (20 –28V, 250 msec,0.1–1.0Hz) after neuromuscular blockade with gallaminetriethiodide (Concord, Essex, UK) (initially 10 –15mg/kgIV maintained with 5–10mg/kg/hr).10 Extracellular record-ings were made using a microiontophoretic combinationelectrode consisting of seven-barreled glass pipette incorpo-rating a central tungsten-recording electrode with an ex-posed recording tip length of approximately 12mm.11 Theelectrode was advanced or retracted in the cord substanceusing a microdrive (Kopf Instruments, Tujunga, CA, orBurleigh Instruments, NY). Signal from the recording elec-trode was fed via a preamplifier (1,000) (Neurolog, Digi-timer, Herts, UK) through a 50Hz noise eliminator (Hum-bug, Quest Scientific, North Vancouver, BC) and neurologfilter (bandwidth 300Hz to 10kHz) to a second stage vari-able amplifier then via a window discriminator and A/Dconverter to a microcomputer where the signal was pro-cessed. The receptive fields of the units were characterizedas nociceptive specific (NS) if they responded to noxiousmechanical stimuli (such as pinch or pricking with a nee-dle) or wide dynamic range (WDR) if they responded toboth.12 A microiontophoresis current generator (Dagan6400, Dagan Corporation, Minneapolis, MN) provided thecurrent for ejecting test substances from the barrels. Retain-ing and balancing currents were used routinely.13
At the end of the experiment selected sites were markedwith an electrolytic lesion made by passing a 20 to 25mAcathodal current through the recording electrode for 20 to30 seconds.
From the Headache Group, Institute of Neurology, The National Hos-pital for Neurology and Neurosurgery, Queen Square, London, UK
Received Mar 27, 2001, and in revised form Sep 4. Accepted forpublication Sep 4, 2001.
Published online Nov 5, 2001; DOI: 10.1002/ana.0274R
Address correspondence to Dr Goadsby, Institute of Neurology, QueenSquare, London WC1N 3BG UK. E-mail: [email protected]
804 © 2001 Wiley-Liss, Inc.

DrugsThe 4991W93, 4S[3-(trans-3-dimethylamino-cyclobutyl)-1H-indol-5-yl methyl] oxazolidin-2-one, and sumatriptanwere obtained from GlaxoWellcome Research and Develop-ment (Stevenage, UK). Micropipette barrels used for ionto-phoresis of test substances were filled with 1.0M DL-homocysteate (DL-H), pH 8.0 (ICN, Pharmaceuticals); 1.0M L-glutamate, monosodium, pH 8.0 (Sigma), 50mM er-gonovine (ergometrine) maleate, pH 4.0 (Sigma),sumatriptan, and 4991W93; saline (as a control).
Statistical AnalysisSummary data are presented as the mean standard error ofthe mean. Neuronal responses to the test compound in eachanimal were compared with baseline firing rates using thecritical ratio test.14 Population effects of compounds weretested using the Mann-Whitney U test using a level of sig-nificance of p , 0.05 (SPSS version 9.0).
ResultsAnimals from which data are reported had cardiorespi-ratory parameters that were normal for the anesthetizedcat. Blood gas parameters were measured at intervalsthroughout the experiment and were within normallimits: arterial blood pH 7.38 6 0.04 and pCO2
3.40 6 0.89kPa.
Neuronal CharacteristicsCells were located 0mm to 24mm caudal to the mid-point C2 rootlets, 0 to 300mm lateral to the dorsal rootentry zone at a depth of 2700mm to 22,000mm be-low the (dorsal) cord surface. Cells responded to supe-rior sagittal sinus (SSS) stimulation with latencies con-sistent with Ad fibers (8–10ms). All neurones reportedwere classified as wide dynamic range (WDR).
Baseline Characteristics and Effect of ExcitatoryAmino AcidsNeurones responding to electrical stimulation of theSSS were identified. They responded with a firing rate
of 15 spikes/50 stimuli. Microiontophoresis of DL-Hincreased firing of neurones linked to SSS from a base-line of 13.6 6 1.4/sec to 50.2 6 5.6/sec (n 5 10; p ,0.01). Microiontophoresis of L-glutamate increased fir-ing of neurones linked to SSS from a baseline of0.48 6 0.06/sec to 27.9 6 2.4/sec (n 5 5; p , 0.01).
Effect of 5HT1B/1D AgonistsIontophoresis of sumatriptan during continued ejectionof DL-H resulted in a reduction in firing rate from54.3 6 2.9 to 29.8 6 4.2/sec (n 5 5; p , 0.05; Fig1). Similarly, ejection of 4991W93 (Fig 2) produced aprompt reduction in firing of trigeminal neurones.Ejection of the ergot alkaloid ergometrine resulted in adose-dependent reduction in firing from a control levelof 46.1 6 4.6/sec to 30.8 6 4.5/sec at a current of180nA (n 5 5; p , 0.05; Fig 3).
DiscussionThis study demonstrates that microiontophoresis of theglutamate receptor agonists DL-homocysteate (DL-H) orL-glutamate into the region of the trigeminal neuronescan activate cells also linked to stimulation of the su-perior sagittal sinus. Furthermore, while being activatedby glutamate receptor agonists, ejection of ergometrine,or the triptans, sumatriptan or 4991W93, inhibitedneuronal activation. Given that DL-H and L-glutamatewere exogenously supplied, and can thus override anyprejunctional blockade of transmitter release, it can besuggested that each of ergometrine, sumatriptan, and4991W93 may have postsynaptic actions within thetrigeminal nucleus. If this is correct then postsynaptictrigeminal neurones are likely to contain one or moreof 5-HT1B, 5-HT1D or 5-HT1F receptors to mediatethis action.
Triptans, which are serotonin 5HT1B/1D receptoragonists, inhibit evoked trigeminovascular nociceptiveactivity in the trigeminocervical complex. Each of
Fig 1. Inhibition of DL-H excitation bysumatriptan. DL-H was applied continu-ously at 4nA. Cell firing was suppressedduring pulses of sumatriptan at 150nA(bars). Firing rate (ordinate, Hz) is plot-ted in 1-second bins on the abscissa (time,seconds).
Goadsby et al: Postjunctional 5-HT Receptors 805

sumatriptan, after blood-brain barrier disruption, elet-riptan, naratriptan, rizatriptan, 4991W93, and zolmi-triptan, block evoked trigeminal nucleus activity.3 Fur-thermore, serotonin itself inhibits trigeminovascularlyevoked nociceptive responses in the caudal trigeminalnucleus.15 Triptans and serotonin are effective acuteantimigraine treatments.2 It has been assumed thattriptans act on a prejunctional 5HT1 receptor whosedefinitive characteristics are yet to be determined.However, the cited intravenous studies cannot definethe localization of the putative triptan receptor.
Iontophoretic application of a triptan16 can localizethe effect to the second order trigeminal synapse. How-ever, for spontaneously active and sagittal sinus-evokedresponses, it cannot differentiate pre- and postsynapticblockade. The new data effectively eliminate the possi-bility of a presynaptic effect by supplying the transmit-ter exogenously. This suggests that some component ofthe inhibition is likely to be postsynaptic, although itremains a distinct possibility that both pre- and
postsynaptic modulation is taking place. This conclu-sion is analogous to the prejunctional arguments madefor the peripheral action of triptans in which it wasshown that sumatriptan would not block the effects ofexogenously supplied substance P,17 and thus was mostlikely to be acting prejunctionally to block neurogenicplasma protein extravasation. Experiments using directdistension of the superior sagittal sinus18 similarly sug-gested that sumatriptan could block peripheral trans-mission without necessarily constricting blood ves-sels.19 It remains possible that the observed effect inour study involves modulation of some other third site,such as a modulatory neuron with facilitatory effects atthis synapse. No such neuron has been thus described,and because the effects of microiontophoresis are lim-ited by diffusion, the neuron at least would have to bemodulating the second order synapse in the trigeminalnucleus.
In summary, data are presented that demonstrate ac-tivation of trigeminal neurons in the most caudal tri-
Fig 2. Inhibition of DL-H excitation by4991W93. DL-H was applied continuouslyat 4nA. Cell firing was suppressed duringpulses of 4991W93 microiontophoresis at150nA (bars). Firing rate (ordinate, Hz)is plotted in 1-second bins on the abscissa(time, seconds).
Fig 3. Inhibition of L-glutamate excitationby ergometrine. L-glutamate was appliedin 10-second pulses at 50nA followed by20-second periods of retaining current.Cell firing was suppressed during er-gometrine microiontophoresis (bars). Thesuppression was dose dependent to themaximum inhibition at 1180nA. Firingrate (ordinate, Hz) is plotted in 1-secondbins on the abscissa (time, seconds).
806 Annals of Neurology Vol 50 No 6 December 2001
geminal nucleus caudalis with nociceptive vascular in-put, from structures known to be pain-producing inhumans, by activation of glutamate receptors. Co-iontophoresis of glutamate agonists, DL-homocysteateor L-glutamate, with either of the 5HT1B/1D agonists,sumatriptan and 4991W93, or the ergot alkaloid, er-gometrine, resulted in inhibition of neuronal activa-tion. These data are consistent with the view that thereare postsynaptic triptan-sensitive receptors in the tri-geminal nucleus, while not excluding the presence ofpresynaptic modulation. These receptors may be a tar-get for antimigraine compounds, and their identity andpresence needs to be considered in any formulation ofthe mechanism of action of triptans.
This work was supported by GlaxoWellcome and The WellcomeTrust. PJG is a Wellcome Trust Senior Research Fellow.
We thank Paul Hammond and Michele Lasalandra for their excel-lent technical assistance.
This material was presented in abstract form at the Tenth Interna-tional Headache Congress, June 29 to July 2, 2001, in New York.20
References1. Goadsby PJ. The pathophysiology of headache. In: Silberstein
SD, Lipton RB, Solomon S, eds. Wolff’s headache and otherhead pain. 7th ed. Oxford: Oxford University Press, 2001:57–72.
2. Ferrari MD. Migraine. The Lancet 1998;351:1043–1051.3. Goadsby PJ. The pharmacology of headache. Prog Neurobiol
2000;62:509–525.4. Moskowitz MA, Cutrer FM. SUMATRIPTAN: a receptor-
targeted treatment for migraine. Annu Rev Med 1993;44:145–154.5. Rebeck GW, Maynard KI, Hyman BT, Moskowitz MA. Selec-
tive 5 HT1Da serotonin receptor gene expression in trigeminalganglion: implications for antimigraine drug development. ProcNatl Acad Sci USA 1994;91:3666–3669.
6. Storer RJ, Goadsby PJ. Trigeminovascular nociceptive transmis-sion involves N-methyl-D-aspartate and non-N-methyl-D-aspartate glutamate receptors. Neuroscience 1999;90:1371–1376.
7. Mitsikostas DD, Sanchez del Rio M, Waeber C, et al. TheNMDA receptor antagonist MK-801 reduces capsaicin-inducedc-fos expression within rat trigeminal nucleus caudalis. Pain1998;76:239–248.
8. Mitsikostas DD, Sanchez del Rio M, Waeber C, et al. Non-NMDA glutamate receptors modulate capsaicin induced c-fosexpression within trigeminal nucleus caudalis. Br J Pharmacol1999;127:623–630.
9. Storer RJ, Butler P, Hoskin KL, Goadsby PJ. A simple method,using 2-hydroxypropyl-b-cyclodextrin, of administering a-chlor-alose at room temperature. J Neurosci Meth 1997;77:49–53.
10. Storer RJ, Akerman S, Connor HE, Goadsby PJ. 4991W93, apotent blocker of neurogenic plasma protein extravasation, in-hibits trigeminal neurons at 5-hydroxytryptamine (5-HT1B/1D)agonist doses. Neuropharmacology 2001;40:911–917.
11. Hellier M, Boers P, Lambert GA. Fabrication of a metal-coredmulti-barrelled microiontophoresis assembly. J Neurosci Meth1990;32:55–61.
12. Hu JW, Dostrovsky JO, Sessle BJ. Functional properties ofneurons in the cat trigeminal subnucleus caudalis (medullarydorsal horn). I. Responses to oro-facial noxious and nonnoxiousstimuli and projections to thalamus and subnucleus oralis.J Neurophysiol 1981;45:173–192.
13. Bloom FE. To spritz or not to spritz: the doubtful value ofaimless iontophoresis. Life Sci 1974;14:1819–1834.
14. Nagler J, Conforti N, Feldman S. Alterations produced by cor-tisol in the spontaneous activity and responsiveness to sensorystimuli of single cells in the tuberal hypothalamus of the rat.Neuroendocrinology 1973;12:52–66.
15. Goadsby PJ, Hoskin KL. Serotonin inhibits trigeminal nucleusactivity evoked by craniovascular stimulation through a5-HT1B/1D receptor: a central action in migraine? Ann Neurol1998;43:711–718.
16. Storer RJ, Goadsby PJ. Microiontophoretic application of sero-tonin (5HT)1B/1D agonists inhibits trigeminal cell firing in thecat. Brain 1997;120:2171–2177.
17. Buzzi MG, Moskowitz MA. The antimigraine drug,sumatriptan (GR43175), selectively blocks neurogenic plasmaextravasation from blood vessels in dura mater. Br J Pharmacol1990;99:202–206.
18. Kaube H, Hoskin KL, Goadsby PJ. Activation of the trigemi-novascular system by mechanical distension of the superior sag-ittal sinus in the cat. Cephalalgia 1992;12:133–136.
19. Hoskin KL, Kaube H, Goadsby PJ. Sumatriptan can inhibittrigeminal afferents by an exclusively neural mechanism. Brain1996;119:1419–1428.
20. Goadsby PJ, Akerman S, Storer RJ. Triptans can act post-synaptically in the trigeminal nucleus: a microiontophoreticstudy. Cephalalgia 2001;21:285–286.
Increased HTLV-I ProviralLoad and PreferentialExpansion of HTLV-I Tax-Specific CD81 T Cells inCerebrospinal Fluid fromPatients with HAM/TSPMasahiro Nagai, MD, PhD, Yoshihisa Yamano, MD, PhD,Meghan B. Brennan, BA, Carlos A. Mora, MD,and Steven Jacobson, PhD
To date, high human T-cell lymphotropic virus type Iproviral load in patients with human T-cell lymphotropicvirus type I-associated myelopathy/tropical spastic para-
From the Viral Immunology Section, Neuroimmunology Branch,National Institute of Neurological Disorders and Stroke, NationalInstitutes of Health, Rockville Pike, Bethesda, MD 20892.
Received Apr 13, 2001, and in revised form Sep 4, 2001. Acceptedfor publication Sep 4, 2001.
Published online Nov 2, 2001; DOI 10.1002/ana.10065
Address correspondence to Dr Jacobson, Viral Immunology Section,Neuroimmunology Branch, National Institute of NeurologicalDisorders and Stroke, National Institutes of Health, Building10, Room 5B-16, 9000 Rockville Pike, Bethesda, MD.E-mail: [email protected]
© 2001 Wiley-Liss, Inc. 807
paresis has been reported and is thought to be related tothe pathogenesis of human T-cell lymphotropic virustype I-associated myelopathy/tropical spastic paraparesis.However, the proviral load in cerebrospinal fluid has notbeen well investigated. We measured human T-cell lym-photropic virus type I proviral load in cerebrospinalfluid cells from human T-cell lymphotropic virus typeI-associated myelopathy/tropical spastic paraparesis pa-tients using real-time quantitative polymerase chain reac-tion (TaqMan). Human T-cell lymphotropic virus type Iproviral load in cerebrospinal fluid cells were signifi-cantly higher than that of the matched peripheral bloodmononuclear cells, and a high ratio of human T-cell lym-photropic virus type I proviral load in cerebrospinal fluidcells to peripheral blood mononuclear cells were observedin patients with short duration of illness. Human T-celllymphotropic virus type I Tax-specific CD81 T cells, asdetected by peptide-loaded HLA tetramers, accumulatedin cerebrospinal fluid compared with that in peripheralblood mononuclear cells, while the frequency ofcytomegalovirus-specific CD81 T cells in cerebrospinalfluid was reduced. These observations suggest that accu-mulation of both human T-cell lymphotropic virus typeI-infected cells and preferential expansion of humanT-cell lymphotropic virus type I-specific CD81 cells incerebrospinal fluid may play a role in the pathogenesis ofhuman T-cell lymphotropic virus type I-associated my-elopathy/tropical spastic paraparesis.
Ann Neurol 2001;50:807–812
Human T-cell lymphotropic virus type I (HTLV-I) isan exogenous human retrovirus responsible for the pro-gressive neurological disease, HTLV-I-associated my-elopathy/tropical spastic paraparesis (HAM/TSP).1,2
The vast majority of people infected with HTLV-I areclinically asymptomatic, and less than 5% of those in-fected develop HAM/TSP. It has been suggested thatvirus–host interactions play a role in this inflammatoryneurological disease. Newly adapted real-time quantita-tive polymerase chain reaction (PCR) approaches havesupported the observations that HTLV-I proviral loadsin peripheral blood mononuclear cells (PBMC) fromHAM/TSP patients were higher than those of HTLV-Iasymptomatic carriers; thus, these high proviral loadshave been related to the pathogenesis of this disor-der.3–6 However, the HTLV-I proviral load in cerebro-spinal fluid (CSF) from HAM/TSP patients remains tobe determined.
Experimental observations in the CSF are thought tobetter reflect events in the central nervous system(CNS) than can be achieved by analysis of peripheralblood.7 HTLV-I virus,8 anti-HTLV-I antibodies,1,2
and HTLV-I-specific CD81 cytotoxic T lympho-cytes9,10 have been detected in CSF from HAM/TSPpatients and have provided insights into the viral im-munological events in the CNS of affected patients. It
was therefore of interest to determine the levels ofHTLV-I proviral loads in HAM/TSP CSF. In addi-tion, immunological methods that measure HLA-restricted virus-specific CD81 T-cell responses to im-munodominant epitopes of HTLV-I (tetramers)10–12
were also used to determine whether these cells couldbe detected in the CSF of patients with HAM/TSP.
We report that the level of HTLV-I proviral (tax)DNA in CSF cells from HAM/TSP patients using real-time quantitative PCR techniques (TaqMan) was ele-vated in the CSF of HAM/TSP patients comparedwith PBMC. Moreover, in patients from whom suffi-cient CSF cells could be obtained, the frequency ofHTLV-I-specific CD81 cells were also elevated in theCSF and appear to represent a virus-specific expansion.
Patients and MethodsSubjects and Sample PreparationPeripheral blood and CSF were obtained from patients withHAM/TSP by informed consent. The diagnosis of HAM/TSP was assessed according to the World Health Organiza-tion guidelines.13 HTLV-I antibodies were present in the se-rum and in the CSF of all patients. Lumber punctures andblood samples were performed after obtaining informed con-sent as part of a clinical protocol reviewed and approved bythe National Institutes of Health institutional review panel.The characteristics of patients with HAM/TSP are summa-rized in Table 1. Peripheral blood was taken on the same daythat the CSF was collected. PBMC were isolated from pe-ripheral blood samples on a density gradient, and CSF cellswere collected after CSF was spun at 1,500 rpm for 10 min-utes. DNA was extracted from cells using spin columnsDNA extraction kit (Qiagen, Valencia, CA). Sufficient CSFcells were obtained from HAM/TSP patients 7, 8, and 9,permitting the identification of HTLV-I Tax11-19-specificCD81T-cell and CMV-pp65-specific CD81 T cells as de-scribed below.
Quantitative Polymerase Chain ReactionHTLV-I proviral load was measured using real-time quanti-tative PCR (TaqMan) as described previously.12 The amountof HTLV-I proviral DNA was calculated by the followingformula:
copy number of HTLV-I (pX) per 100 cells
5 [(copy number of HTLV-I)/(copy number of b-actin/2)]
3 100.
Identification of Tax11-19-Specific CD81T-Cell andCMV-pp65-Specific CD81 T CellsAnalysis of antigen-specific CD81 cells was performed us-ing a phycoerythrin-conjugated Tax11-19 peptide (LLF-GYPVYV) loaded HLA-A*0201 tetramer (provided byNIAID MHC Tetramer Core Facility, Atlanta, GA, and Na-tional Institutes of Health AIDS Research and ReferenceReagent Program) or CMV-pp65(NLVPMVATV)-loadedHLA-A*0201 tetramer (kindly provided from Dr. Mats Eng-
808 Annals of Neurology Vol 50 No 6 December 2001
strand, Uppsala University, Sweden). The cells were washedand incubated with HLA-A2 tetramer, anti-CD4-FITC(Caltag Laboratories, Burlingame, CA), and anti-CD8-TRI-COLOR (Caltag Laboratories) monoclonal antibodies for 30minutes at 4°C. The labeled cells were washed, followed byflow cytometric analysis. HLA-DR, CD25 expression ontetramer-positive cells was also measured as previously de-scribed.12
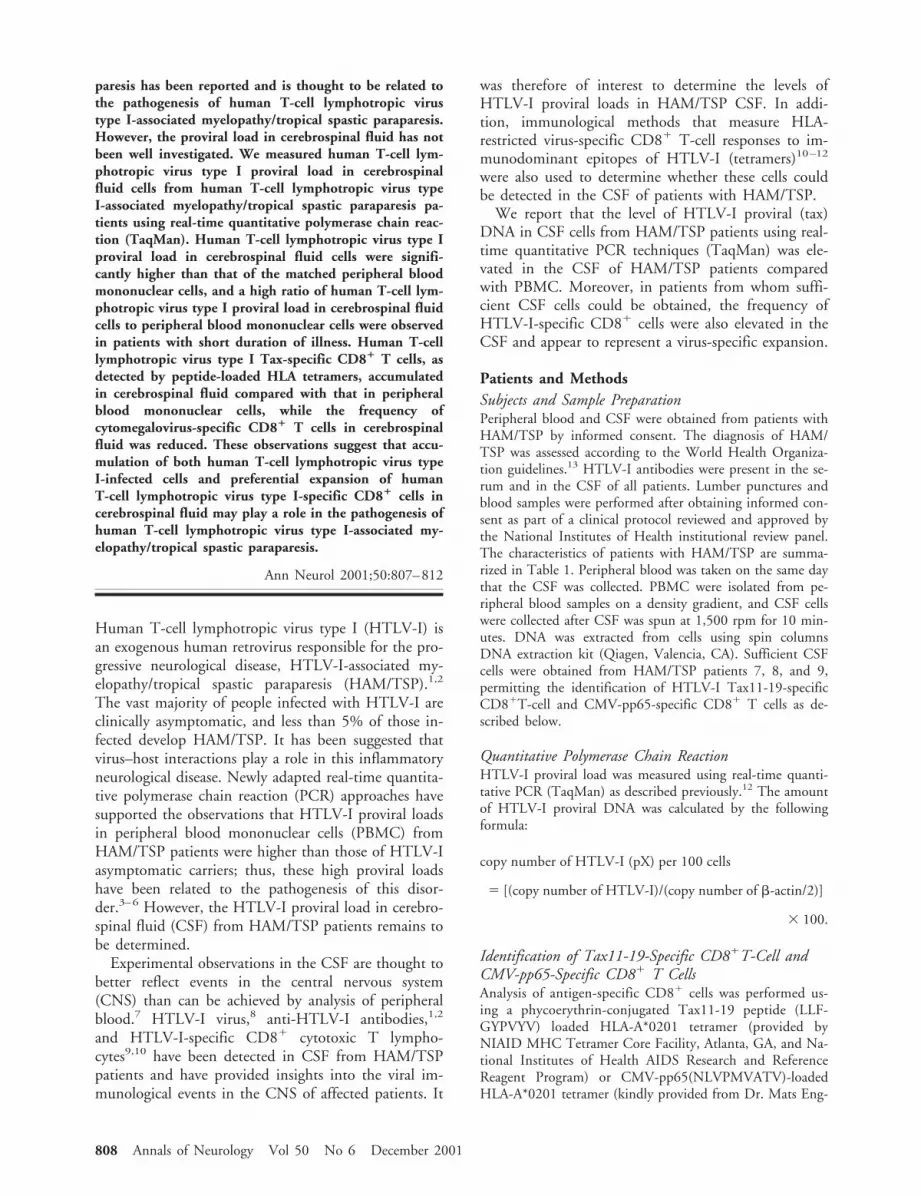
Results and DiscussionTable 1 presents the clinical characteristics of HAM/TSP patients and HTLV-I proviral loads of matchingPBMC and CSF cells. In all patients, the HTLV-I pro-viral load in CSF cells was higher than that in PBMC.The mean 6SEM and median copy numbers in CSFwere 50.45 6 7.44 (median 46.26), and those inPBMC were 22.03 6 2.65 (median 23.56). This dif-ference was statistically significant (p 5 0.0277, Wil-coxon signed-ranks test). This result is consistent withpreviously published data reporting that the proportionof HTLV-I Tax protein-expressing cells in the CSFfrom HAM/TSP patients was higher than that inPBMC.14 However, Puccioni-Sohler and colleagues15
measured higher proviral loads in the PBMC of HAM/TSP patients in Brazil, as compared with those in theCSF. These conflicting data may result from technicaldifferences since the Brazilian study measured HTLV-Iproviral loads using semiquantitative PCR methodswithout normalization with a housekeeping gene.
In this present study, the ratio of HTLV-I proviralload in the CSF compared with PBMC ranged from1.6 to 4.3. Of interest is the observation that patientswho had relatively high ratios (.2) were all cases witha short duration of illness and expanded disability sta-tus scale scores of .6 (Table 1). This relative augmen-tation of HTLV-I proviral load in the CSF may there-fore relate to disease pathogenesis in the CNS of
HAM/TSP patients, although it remains unclearwhether this high ratio is also observed in the earlystages of HAM/TSP with low expanded disability sta-tus scale and short duration of disease.
HTLV-I primarily infects CD41 T cells, althoughCD81 T cells may also be an important in vivo reser-voir.16,17 To exclude the possibility that the differencein HTLV-I proviral load between CSF cells andPBMC was merely attributable to proportional changesof CD41 T cells, the percentage of CD41 and CD81
cells in CSF and PBMC were evaluated by flow cytom-etry. The CD41/CD81 ratio in CSF did not differsignificantly compared with that of PBMC (data notshown) as previously reported.18,19 As demonstrated inHAM-6, the percentages of CD41 and CD81 cells inCSF were 46.7% and 25.8%, respectively. The per-centages in PBMC were 33.2% and 19.5%, respec-tively. Therefore, a change in the proportion of T-cellsubsets would not be sufficient to account for the ap-proximate fourfold increase in HTLV-I proviral load.This result suggests that HTLV-I-infected lymphocytesmay preferentially migrate into the CSF from periph-eral blood, or HTLV-I-infected lymphocytes may selec-tively expand in this compartment. These two possi-bilities are not mutually exclusive. It has been demon-strated that HTLV-I can cross the blood–brain barrierby migration of infected lymphocytes in vivo, whichhas been associated with clonal expansion of HTLV-I-infected cells in the CSF of patients with HAM/TSP.20
It has been suggested that CSF cells may reflect im-munological events in CNS tissue.7 The expansion ofHTLV-I Tax11-19-specific CD81 T cells in the CSFof HAM/TSP patients9,10 have supported the hypoth-esis that these cells may be directly involved in thepathogenesis of this disorder. However, it is unclearwhether this increase in HTLV-I Tax-specific CD81
Table 1. Clinical Characteristics and HTLV-I Proviral Load of HAM/TSP Patients
Subject Race/OriginAge(yr) Sex EDSSa
Durationof Illness
(yr)
HTLV-I ProviralLoadb
RatioCSF PBMC
HAM-1 B/USA 56 F 6 13 47.95 30.00 1.6HAM-2 W/USA 59 M 7 14 44.56 24.41 1.8HAM-3 B/USA 64 M 6 12 40.82 22.93 1.8HAM-4 B/USA 45 F 6 3 49.67 24.19 2.1HAM-5 B/African 39 F 6.5 1 33.90 10.49 3.2HAM-6 H/USA 57 F 6.5 2 85.81 20.16 4.3HAM-7 B/Jamaican 55 F 7.5 26 NT 26.47 —HAM-8 B/Jamaican 14 F 6.5 4 NT 27.67 —HAM-9 W/USA 45 M 2.0 2 NT 24.12 —
aEDSS 5 expanded disability status scale.bHTLV-I proviral load is expressed as the copy number of HTLV-I DNA per 100 cells. The ratio was calculated by (HTLV-I proviral load inCSF)/(HTLV-I proviral load in PBMC).
HTLV-I 5 human T-cell lymphotropic virus type I; HAM/TSP 5 HTLV-I-associated myelopathy/tropical spastic paraparesis; CSF 5 cere-brospinal fluid; PBMC 5 peripheral blood mononuclear cells; W 5 Caucasian; B 5 black; H 5 Hispanic; NT 5 not tested.
Nagai et al: HTLV-1 Infection in CSF of HAM/TSP 809

810 Annals of Neurology Vol 50 No 6 December 2001
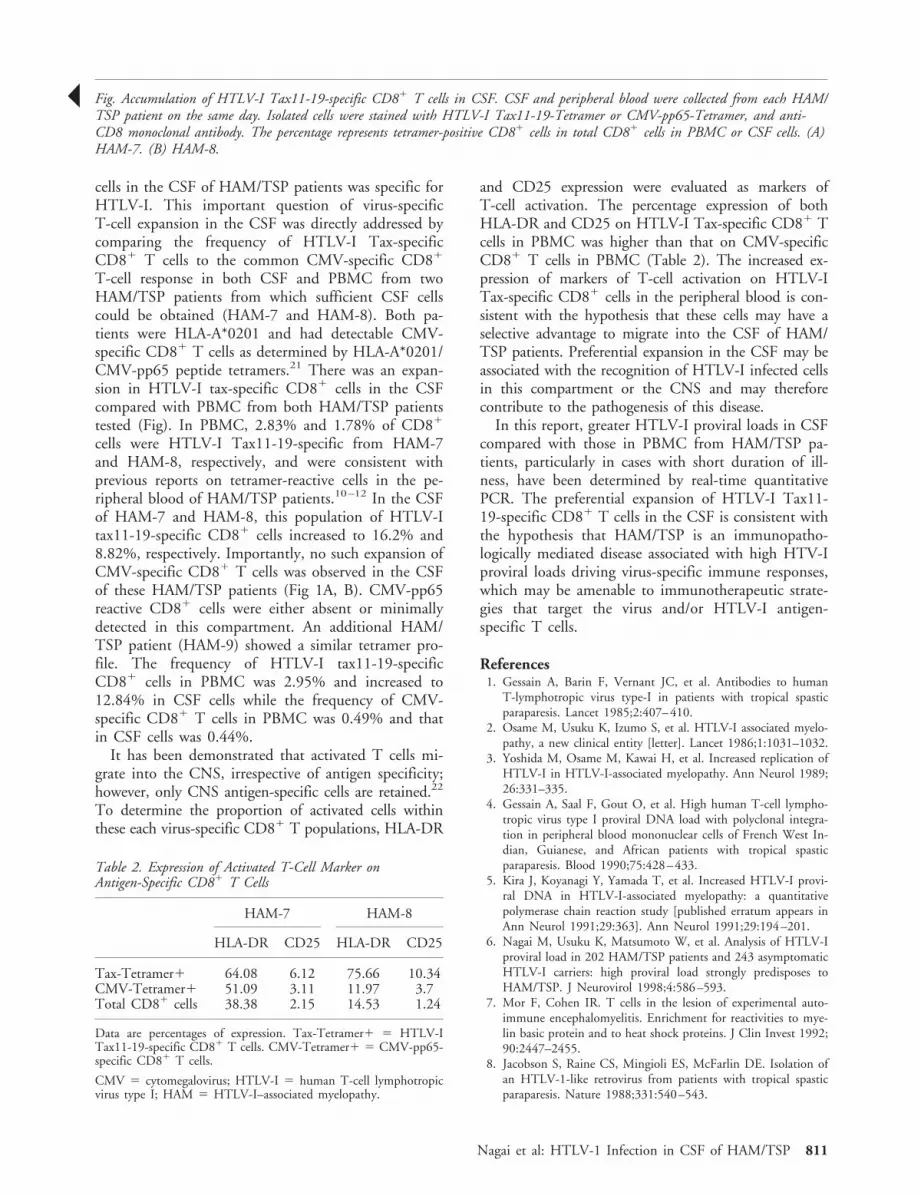
cells in the CSF of HAM/TSP patients was specific forHTLV-I. This important question of virus-specificT-cell expansion in the CSF was directly addressed bycomparing the frequency of HTLV-I Tax-specificCD81 T cells to the common CMV-specific CD81
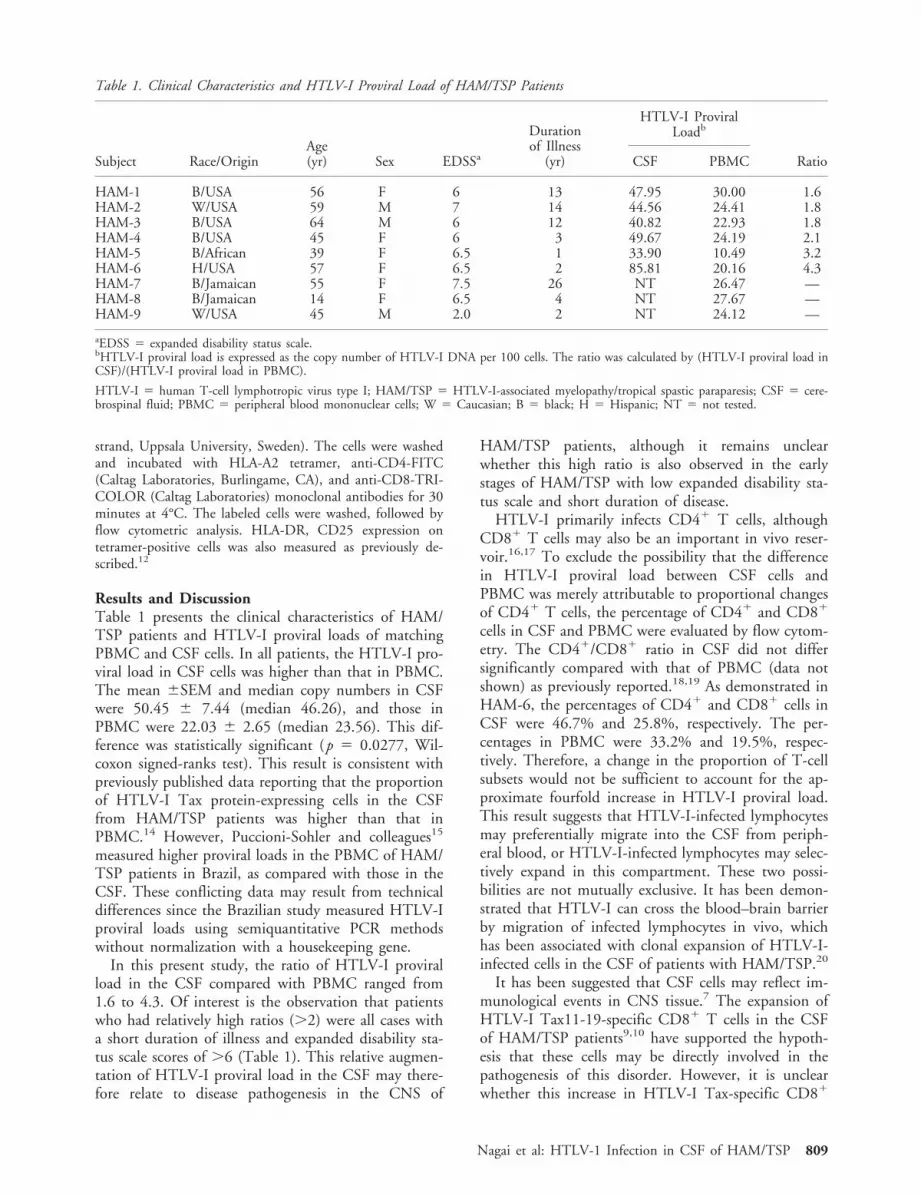
T-cell response in both CSF and PBMC from twoHAM/TSP patients from which sufficient CSF cellscould be obtained (HAM-7 and HAM-8). Both pa-tients were HLA-A*0201 and had detectable CMV-specific CD81 T cells as determined by HLA-A*0201/CMV-pp65 peptide tetramers.21 There was an expan-sion in HTLV-I tax-specific CD81 cells in the CSFcompared with PBMC from both HAM/TSP patientstested (Fig). In PBMC, 2.83% and 1.78% of CD81
cells were HTLV-I Tax11-19-specific from HAM-7and HAM-8, respectively, and were consistent withprevious reports on tetramer-reactive cells in the pe-ripheral blood of HAM/TSP patients.10–12 In the CSFof HAM-7 and HAM-8, this population of HTLV-Itax11-19-specific CD81 cells increased to 16.2% and8.82%, respectively. Importantly, no such expansion ofCMV-specific CD81 T cells was observed in the CSFof these HAM/TSP patients (Fig 1A, B). CMV-pp65reactive CD81 cells were either absent or minimallydetected in this compartment. An additional HAM/TSP patient (HAM-9) showed a similar tetramer pro-file. The frequency of HTLV-I tax11-19-specificCD81 cells in PBMC was 2.95% and increased to12.84% in CSF cells while the frequency of CMV-specific CD81 T cells in PBMC was 0.49% and thatin CSF cells was 0.44%.
It has been demonstrated that activated T cells mi-grate into the CNS, irrespective of antigen specificity;however, only CNS antigen-specific cells are retained.22
To determine the proportion of activated cells withinthese each virus-specific CD81 T populations, HLA-DR
and CD25 expression were evaluated as markers ofT-cell activation. The percentage expression of bothHLA-DR and CD25 on HTLV-I Tax-specific CD81 Tcells in PBMC was higher than that on CMV-specificCD81 T cells in PBMC (Table 2). The increased ex-pression of markers of T-cell activation on HTLV-ITax-specific CD81 cells in the peripheral blood is con-sistent with the hypothesis that these cells may have aselective advantage to migrate into the CSF of HAM/TSP patients. Preferential expansion in the CSF may beassociated with the recognition of HTLV-I infected cellsin this compartment or the CNS and may thereforecontribute to the pathogenesis of this disease.
In this report, greater HTLV-I proviral loads in CSFcompared with those in PBMC from HAM/TSP pa-tients, particularly in cases with short duration of ill-ness, have been determined by real-time quantitativePCR. The preferential expansion of HTLV-I Tax11-19-specific CD81 T cells in the CSF is consistent withthe hypothesis that HAM/TSP is an immunopatho-logically mediated disease associated with high HTV-Iproviral loads driving virus-specific immune responses,which may be amenable to immunotherapeutic strate-gies that target the virus and/or HTLV-I antigen-specific T cells.
References1. Gessain A, Barin F, Vernant JC, et al. Antibodies to human
T-lymphotropic virus type-I in patients with tropical spasticparaparesis. Lancet 1985;2:407–410.
2. Osame M, Usuku K, Izumo S, et al. HTLV-I associated myelo-pathy, a new clinical entity [letter]. Lancet 1986;1:1031–1032.
3. Yoshida M, Osame M, Kawai H, et al. Increased replication ofHTLV-I in HTLV-I-associated myelopathy. Ann Neurol 1989;26:331–335.
4. Gessain A, Saal F, Gout O, et al. High human T-cell lympho-tropic virus type I proviral DNA load with polyclonal integra-tion in peripheral blood mononuclear cells of French West In-dian, Guianese, and African patients with tropical spasticparaparesis. Blood 1990;75:428–433.
5. Kira J, Koyanagi Y, Yamada T, et al. Increased HTLV-I provi-ral DNA in HTLV-I-associated myelopathy: a quantitativepolymerase chain reaction study [published erratum appears inAnn Neurol 1991;29:363]. Ann Neurol 1991;29:194–201.
6. Nagai M, Usuku K, Matsumoto W, et al. Analysis of HTLV-Iproviral load in 202 HAM/TSP patients and 243 asymptomaticHTLV-I carriers: high proviral load strongly predisposes toHAM/TSP. J Neurovirol 1998;4:586–593.
7. Mor F, Cohen IR. T cells in the lesion of experimental auto-immune encephalomyelitis. Enrichment for reactivities to mye-lin basic protein and to heat shock proteins. J Clin Invest 1992;90:2447–2455.
8. Jacobson S, Raine CS, Mingioli ES, McFarlin DE. Isolation ofan HTLV-1-like retrovirus from patients with tropical spasticparaparesis. Nature 1988;331:540–543.
Š Fig. Accumulation of HTLV-I Tax11-19-specific CD81 T cells in CSF. CSF and peripheral blood were collected from each HAM/TSP patient on the same day. Isolated cells were stained with HTLV-I Tax11-19-Tetramer or CMV-pp65-Tetramer, and anti-CD8 monoclonal antibody. The percentage represents tetramer-positive CD81 cells in total CD81 cells in PBMC or CSF cells. (A)HAM-7. (B) HAM-8.
Table 2. Expression of Activated T-Cell Marker onAntigen-Specific CD81 T Cells
HAM-7 HAM-8
HLA-DR CD25 HLA-DR CD25
Tax-Tetramer1 64.08 6.12 75.66 10.34CMV-Tetramer1 51.09 3.11 11.97 3.7Total CD81 cells 38.38 2.15 14.53 1.24
Data are percentages of expression. Tax-Tetramer1 5 HTLV-ITax11-19-specific CD81 T cells. CMV-Tetramer1 5 CMV-pp65-specific CD81 T cells.
CMV 5 cytomegalovirus; HTLV-I 5 human T-cell lymphotropicvirus type I; HAM 5 HTLV-I–associated myelopathy.
Nagai et al: HTLV-1 Infection in CSF of HAM/TSP 811

9. Elovaara I, Koenig S, Brewah AY, et al. High human T celllymphotropic virus type 1 (HTLV-1)-specific precursor cyto-toxic T lymphocyte frequencies in patients with HTLV-1-associated neurological disease. J Exp Med 1993;177:1567–1573.
10. Greten TF, Slansky JE, Kubota R, et al. Direct visualization ofantigen-specific T cells: HTLV-1 Tax11–19-specific CD8(1) Tcells are activated in peripheral blood and accumulate in cere-brospinal fluid from HAM/TSP patients. Proc Natl Acad Sci US A 1998;95:7568–7573.
11. Bieganowska K, Hollsberg P, Buckle GJ, et al. Direct analysisof viral-specific CD81 T cells with soluble HLA- A2/Tax11–19tetramer complexes in patients with human T cell lymphotropicvirus-associated myelopathy. J Immunol 1999;162:1765–1771.
12. Nagai M, Kubota R, Greten TF, et al. Increased activated hu-man t cell lymphotropic virus type I (HTLV-I) Tax11–19-specific memory and effector CD81 cells in patients withHTLV- I-associated myelopathy/tropical spastic paraparesis:correlation with HTLV-I provirus load. J Infect Dis 2001;183:197–205.
13. Osame M. Review of WHO kagoshima meeting and diagnosticguidelines for HAM/TSP. In: Blattner W, ed. Human retrovi-rology HTLV. New York: Raven; 1990:191–197.
14. Moritoyo T, Izumo S, Moritoyo H, et al. Detection of humanT-lymphotropic virus type I p40tax protein in cerebrospinalfluid cells from patients with human T-lymphotropic virus typeI-associated myelopathy/tropical spastic paraparesis. J Neurovi-rol 1999;5:241–248.
15. Puccioni-Sohler M, Rios M, Bianco C, et al. An inverse corre-lation of HTLV-I viral load in CSF and intrathecal synthesisof HTLV-I antibodies in TSP/HAM. Neurology 1999;53:1335–1339.
16. Hanon E, Stinchcombe JC, Saito M, et al. Fratricide amongCD81 T lymphocytes naturally infected with human T celllymphotropic virus type I. Immunity 2000;13:657–664.
17. Nagai M, Brennan MB, Sakai JA, et al. CD81 T cells are an invivo reservoir for human T-cell lymphotropic virus type I.Blood 2001;98:1506–1511.
18. Mori M, Kinoshita K, Ban N, et al. Activated T-lymphocyteswith polyclonal gammopathy in patients with humanT-lymphotropic virus type I-associated myelopathy. Ann Neu-rol 1988;24:280–282.
19. Ijichi S, Eiraku N, Osame M, et al. Activated T lymphocytes incerebrospinal fluid of patients with HTLV-I-associated myelop-athy (HAM/TSP). J Neuroimmunol 1989;25:251–254.
20. Cavrois M, Gessain A, Gout O, et al. Common human T cellleukemia virus type 1 (HTLV-1) integration sites in cerebrospi-nal fluid and blood lymphocytes of patients with HTLV-1-associated myelopathy/tropical spastic paraparesis indicate thatHTLV-1 crosses the blood-brain barrier via clonal HTLV-1-infected cells. J Infect Dis 2000;182:1044–1050.
21. Solache A, Morgan CL, Dodi AI, et al. Identification of threeHLA-A*0201-restricted cytotoxic T cell epitopes in the cyto-megalovirus protein pp65 that are conserved between eightstrains of the virus. J Immunol 1999;163:5512–5518.
22. Hickey WF, Hsu BL, Kimura H. T-lymphocyte entry into thecentral nervous system. J Neurosci Res 1991;28:254–260.
23. Kurtzke J. 1983. Rating neurologic impairment in multiplesclerosis: an expanded disability status scale (EDSS). Neurology33:1444–1452.
Spinocerebellar Ataxia Type2 Presenting as FamilialLevodopa-ResponsiveParkinsonismDin-E Shan, MD, PhD,1,3 Bing-Wen Soong, MD, PhD,1,3
Chen-Ming Sun, MD,2 Shwn-Jen Lee, PhD, PT,4
Kwong-Kum Liao, MD,1,3 and Ren-Shyan Liu, MD2
A genetic analysis identified 2 patients, approximatelyone-tenth of our patients with familial parkinsonism,who had expanded trinucleotide repeats in SCA2 genes.The reduction of 18F-dopa distribution in both the puta-men and caudate nuclei confirmed that the nigrostriataldopaminergic system was involved in parkinsonian pa-tients with SCA2 mutation.
Ann Neurol 2001;50:812–815
Familial parkinsonism occurs in about 2.8% of Chinesepatients.1 Specific genes responsible for familial parkin-sonism include a-synuclein, parkin, and t genes.2 Themode of inheritance related to the a-synuclein gene mu-tation is autosomal-dominant, but it is now known tobe a rare cause of familial parkinsonism.
Genetic anticipation occurs in some families withparkinsonism, suggesting involvement of an unstabletrinucleotide (CAG) repeat.3 Spinocerebellar ataxiatype 3 (SCA3) may present with L-dopa-responsiveparkinsonism.4 Noncerebellar symptoms are usuallymild in SCA6, but include parkinsonism.5 Recently, alarge family from northern Taiwan with a mutation atthe SCA2 locus was reported; some present with par-kinsonism.6 SCA2 has expanded CAG repeats withinthe range of 34 to 59 in chromosome 12q. In Taiwan,the SCA2 mutation accounts for about 10.8% ofautosomal-dominant cerebellar ataxia.7 The SCA2 phe-notype differs from those of SCA1 and SCA3, with itshigher frequencies of slowed ocular movements, pos-tural and action tremor, myoclonus, and hyporeflexia.8
Parkinsonism with minor cerebellar deficits occurs.9
Patients may present with either a typical L-dopa-
From the 1Neurological Institute, and 2National PET/CyclotronCenter, Taipei Veterans General Hospital, and 3Departments ofNeurology and 4Physical Therapy, National Yang-Ming University,Taipei, Taiwan, ROC.
Received July 10, 2001, and in revised form Sep 7, 2001. Acceptedfor publication Sep 8, 2001.
Published online Nov 1, 2001; DOI: 10.1002/ana.10055
Address correspondence to: Dr Shan, Neurological Institute, TaipeiVeterans General Hospital, Taipei, Taiwan 11217, Republic ofChina. E-mail: [email protected]
812 © 2001 Wiley-Liss, Inc.

responsive parkinsonism or an atypical parkinsonism,including pictures of ataxia or progressive supranuclearpalsy (PSP).6 To characterize these parkinsonian pa-tients further, in relation to SCA2 gene mutations, weconducted the following study.
Patients and MethodsGenetic screening for expanded CAG repeats in the SCA2gene was performed in 23 parkinsonian patients from 19families with familial parkinsonism, and in 2 patients withpostural tremor but with family members affected with par-kinsonism. All patients were recruited from the approxi-mately 800 patients with parkinsonism who were registeredin the Special Clinic for Movement Disorders of Taipei Vet-erans General Hospital. Each patient must have two of the
three cardinal features—rest tremor, rigidity, and bradykine-sia–to be diagnosed as having parkinsonism. Genomic DNAwas isolated from the peripheral leukocytes, and a polymer-ase chain reaction (PCR) was performed using primers F-1and R-1 for SCA2, as previously described.10,11 Patients witha proven SCA2 gene expansion were selected for assessmentsby the Unified Parkinson’s Disease Rating Scale (UPDRS),12
by gait analyses,13 and by 18F-dopa-positron emission to-mography (PET) scanning.
Gait analyses were assessed both before and after a singlechallenge dose of 200/50mg of L-dopa/benserazide. The datawere compared with those from 12 sporadic parkinsonianpatients of comparable age (mean 60.3 6 4.6 years) and du-ration of illness (mean 9.5 6 3.1 years).
For PET scanning, antiparkinson medication was stoppedfor at least 12 hours and 100mg of carbidopa was given 90minutes before injection. Static 18F-dopa-PET scanning wasperformed on Scanditronix PC4096-15WB whole-body PETscanner (Scanditronix, Sweden) 120 minutes after injectionof 185MBq of 18F-dopa.
Images converted to ANALYZE format (Biomedical Imag-ing Resources, Mayo Foundation, Rochester, MN) by MEDX3.3 (Sensor Systems, Sterling, VA) were transformed into Ta-lairach and Tournoux space14 by the SPM99 (Wellcome De-partment of Cognitive Neurology, London, UK) under Mat-lab (Mathworks, Natic, MA), using a 12-parameter linearaffine normalization and a further nonlinear iteration algo-rithms with a template image generated from a 45-year-oldhealthy man. This template image was the control subject inthis study.
The region of interest (ROI) technique was applied to thetransaxial slice at the AC/PC line. A standardized template ofROIs was made for defining bilateral caudate nuclei, putam-ina, and gray matter of occipital lobes in this transaxial slice,according to the corresponding Talairach coordinates. Thisstandardized template of ROIs was then superimposed onthe images to compute mean regional radioactivity.
Semiquantitative analysis using simple ratios of regional18F-dopa uptakes was conducted, which were calculated fromthe mean regional radioactivity for bilateral caudate nuclei
Table. Clinical Features, Gait Characteristics, and SimpleRatios of Regional 18F-Dopa Uptake of Patients 1 and 2
Pt 1 Pt 2
Age at onset 50 50Duration of illness 6 yr 9 yrSymptoms at onset Tremor of left
legTremor of both
legsFirst UPDRS subscale
IIIa7 14
Last UPDRS subscaleIII
45 23
Rest tremor of legs 111 111Rest tremor of hands 11 1Postural tremor of
hands11 2
Action tremor of hands 2 2Rigidity 111 11Brisk tendon reflexes Left knee Left biceps/kneePlantar reflexes Flexor responses Flexor responsesAtaxia 2 2Dysmetria 2 2Pursuit Intact IntactSaccades Slow and hypo-
metricSlow and hypo-
metricNystagmus 2 1Autonomic dysfunction 2 2Speed/off (cm/sec) 67.0 6 11.0 110.7 6 6.8Speed/on (cm/sec) 107.9 6 7.6 126.1 6 4.4Stride length/off (cm) 65.3 6 5.0 123.9 6 7.5Stride length/on (cm) 100.8 6 6.1 127.4 6 4.0Simple ratio
(left caudate)b2.01 2.02
Simple ratio(right caudate)b
2.18 1.96
Simple ratio(left putamen)b
1.53 1.85
Simple ratio(right putamen)b
1.54 1.75
aThe first UPDRS assessments were performed 1 year after onset inboth patients.bThe simple ratios of the regional 18F-dopa uptake of the left andright caudate nucleus and the left and right putamen to that of theoccipital cortex in the control subject are 2.75, 2.63, 2.76, and 2.52,respectively.
UPDRS 5 Unified Parkinson’s Disease Rating Scale.2 5 absent; 1 5 mild; 11 5 moderate; 111 5 severe.
Fig 1. Family pedigrees of Patient 1 (A) and Patient 2 (B).
Shan et al: SCA2 and Familial PD 813

and putamina, respectively, divided by the gray matter of theoccipital cortex.
ResultsTwo patients with parkinsonian features were identi-fied as having an expanded SCA2 gene with 36 and 37CAG repeat numbers, respectively. Their clinical fea-tures are summarized in Table.
Patient 1, an ethnic Taiwanese woman, had tremorsof the left leg. Her mother had presented with atrihexyphenidyl-responsive leg tremor at 54 years of age,followed by gait disturbance, and expired at the age of73 (Fig 1A). The tremor in Patient 1 spread to the rightleg 3 years after onset; she would occasionally feel hesi-tant when starting to walk. Her baseline UPDRS sub-scale III, walking speed, and stride length were compa-rable with those of controls (31.9, 68.8cm/sec, 76.2cm,respectively). A single dose of L-dopa/benserazide pro-duced a 27% improvement in UPDRS subscale III (vs.44% in controls), a 65% improvement in walking speed(vs. 26% in controls, p , 0.01 by Wilcoxon rank-sumtest), and a 53% improvement in stride length (vs. 19%in controls, p , 0.01), confirming that she was respon-sive to L-dopa.
Patient 2, an ethnic Taiwanese man, had tremors ofboth legs. His mother had presented with sinemet-responsive tremors at the age of 68, followed by gaitdisturbance, and expired at 79 years old (see Fig 1B).The leg tremor of Patient 2 was not suppressed by pro-pranolol, but it disappeared after taking alcohol, tri-hexyphenidyl, or primidone. He had occasional shuf-fling and falling three years after the onset. His baselinewalking speed and stride length were better than thoseof controls (p , 0.01, by unpaired t test), confirminghis slower progression of motor disability. A single doseof L-dopa/benserazide produced a 48% improvementin UPDRS subscale III, a 14% improvement in walk-ing speed, and a 3% improvement in stride length.
Surface electromyograms (EMGs) disclosed in theright vastus medialis of both patients a 4-Hz rest
tremor, which disappeared on voluntarily changing ofthe leg position. Motor conduction time was measuredby transcranial magnetic stimulation and showed aslightly prolonged conduction time from the cerebralcortex to the lumbar cord (20.3msec, normal,17msec) in Patient 1, but normal conduction periph-erally. The sympathetic skin response showed an absentresponse in both palm and sole, and the normal pat-tern of R-R intervals variation was lost in patient 2.Magnetic resonance imaging showed slight atrophy ofthe cerebral cortex in Patient 2.
PET studies showed decreased 18F-dopa distributionin the bilateral striatum of both patients (Fig 2). Thesimple ratios of the regional 18F-dopa uptake of thecaudate nucleus or the putamen, respectively, to that ofthe occipital cortex in both patients were lower thanthose of the control (see Table).
DiscussionThe results of this study confirm previous findings thatpatients with a mutation at the SCA2 locus couldpresent with typical L-dopa-responsive parkinsonismand with minimal cerebellar deficits.6,9 We identified 2patients, approximately one-tenth of our populationwith familial parkinsonism, who had expanded CAGrepeats with low repeat numbers. This is consistentwith the finding that parkinsonism occurs in patientswith a relatively low repeat number in the expandedSCA2 genes.6 None of our patients presented with my-oclonus, dystonia, or myokymia, which usually appearsin patients with a relatively high repeat number.15 Ge-netic anticipation occurred in both patients.
The classic 4 to 6 Hz rest tremor of Parkinson’s dis-ease (PD) occurs mostly in both hands and is tempo-rarily suppressed when the extremity is voluntarily ac-tivated.16 The pattern of the tremor in both of ourpatients was similar to that of typical parkinsoniantremor, except for the predominant leg distributionand the good response to primidone and alcohol. The-
Fig 2. Transaxial view of 18F-dopa positron emission tomography (PET) images in Patient 1 (A), Patient 2 (B), a healthy subject(C), and a standardized template of regions of interest (ROIs) superimposed on the healthy subject (D). Profound loss of putaminal18F-dopa uptake and, to a lesser extent, of caudate 18F-dopa uptake, occurred in both patients.
814 Annals of Neurology Vol 50 No 6 December 2001

oretically, patients with lesions involving both the ni-grostriatal dopaminergic system and the cerebellotha-lamic system may present with Holmes’ tremor, a low-frequency rest and intention tremor.16 None of ourpatients demonstrated the existence of intentiontremor. However, it is possible that, with the progres-sion of their cerebellar deficit, their tremor patternmight change.
We measured the 18F-dopa metabolism using thestriato-occipital ratio method, which is simple but assensitive as the method that measures the decarboxyl-ation coefficient.17 The results confirmed that the ni-grostriatal dopaminergic system was involved in bothpatients with SCA2 mutation. Unlike previous PET re-ports in patients with sporadic PD, the caudate nucleuswas severely involved in both cases.18 Their pattern of18F-dopa distribution appeared similar to that found inpatients with PSP. This explained that some of the af-fected family members might present with a clinicalpicture indistinguishable from PSP,6 and that our pa-tients had start hesitation and falling early in thecourse, features characteristic of PSP.
Although our case number was limited, some char-acteristic features appeared: (1) both had onset in theirfifties; (2) both started with a prominent 4-Hz resttremor of the legs; (3) the progression of motor dis-ability was relatively slow; (4) both maintained a goodL-dopa-responsiveness; and (5) both showed a reduced18F-dopa distribution, not only in the putamen but inthe caudate nucleus as well. It would be difficult toidentify our patients among patients with sporadic PD,based on the clinical features alone. Gwinn-Hardy andcolleagues6 described that their parkinsonian patientscould be distinguished by the absence of a rest tremor,and the mildly broad-based gait; none of these featuresexisted in our patients. They could have had an asym-metric onset or an asymmetric 18F-dopa distribution,just as sporadic PD patients had. Neither presentedwith overt signs, indicating cerebellar dysfunction, ex-cept mild gaze-directed nystagmus in Patient 2. Theonly hints were an unusual alcohol-responsive legtremor, and a mild slowing of the ocular saccades orgait hesitation suggestive of PSP.
This work was supported by the National Science Council (NSC-90-2314-B-075-059) from the ROC and Taipei Veterans GeneralHospital (VGH-90-372).
We thank Ms Win-Yung Sheng for assistance in the statistical anal-ysis.
References1. Chia LG, Liu LH. Parkinson’s disease in Taiwan: an analysis of
215 patients. Neuroepidemiology 1992;11:113–120.2. Vaughan JR, Davis MB, Wood NW: Genetics of parkinsonism:
a review. Ann Hum Genet 2001;65:111–126.
3. Payami H, Bernard S, Larsen K, et al. Genetic anticipation inParkinson’s disease. Neurology 1995;45:135–138.
4. Tuite PJ, Rogaeva EA, St George-Hyslop PH, Lang AE. Dopa-responsive parkinsonism phenotype of Machado-Joseph disease:confirmation of 14q CAG expansion. Ann Neurol 1995;38:684–687.
5. Schols L, Kruger R, Amoiridis G, et al. Spinocerebellar ataxiatype 6: genotype and phenotype in German kindreds. J NeurolNeurosurg Psychiatry 1998;64:67–73.
6. Gwinn-Hardy K, Chen JY, Liu H, et al. Spinocerebellar ataxiatype 2 with parkinsonism in ethnic Chinese. Neurology 2000;55:800–805.
7. Soong BW, Lu YC, Chao KB, Lee HY: Frequency analysis ofautosomal dominant cerebellar ataxias in Taiwanese patientsand clinical and molecular characterization of spinocerebellarataxia type 6. Arch Neurol 2001;58:1105–1109.
8. Schols L, Gispert S, Vorgerd M, et al. Spinocerebellar ataxiatype 2. Genotype and phenotype in German kindreds. ArchNeurol 1997;54:1073–1080.
9. Sasaki H, Fukazawa T, Wakisaka A, et al. Central phenotypeand related varieties of spinocerebellar ataxia 2 (SCA2): a clin-ical and genetic study with a pedigree in the Japanese. J NeurolSci 1996;144:176–181.
10. Pulst SM, Nechiporuk A, Nechiporuk T, et al. Moderate ex-pansion of a normally biallelic trinucleotide repeat in spinocer-ebellar ataxia type 2. Nature Genet 1996;14:269–276.
11. Soong B, Cheng C, Liu R, Shan D: Machado-Joseph disease:clinical, molecular, and metabolic characterization in Chinesekindreds. Ann Neurol 1997;41:446–452.
12. Lang AE, Fahn S. Assessment of Parkinson’s disease. In: Mun-sant TL, ed. Quantification of neurological deficit. Woburn,MA: Butterworths, 1989:285–309.
13. Shan DE, Lee SJ, Chao LY, Yeh SI: Gait analysis in advancedParkinson’s disease—effect of levodopa and tolcapone. CanJ Neurol Sci 2001;28:70–75.
14. Talairach J, Tournoux P. Co-planar stereotaxic atlas of the hu-man brain 3-dimensional proportional system: an approach tocerebral imaging. New York: Thieme Medical, 1988.
15. Cancel G, Durr A, Didierjean O, et al. Molecular and clinicalcorrelations in spinocerebellar ataxia 2: a study of 32 families.Hum Mol Genet 1997;6:709–715.
16. Deuschl G, Raethjen J, Lindemann M, Krack P: The patho-physiology of tremor. Muscle Nerve 2001;24:716–735.
17. Hoshi H, Kuwabara H, Leger G, et al. 6-[18F]fluoro-L-dopametabolism in living human brain: a comparison of six analyt-ical methods. J Cereb Blood Flow Metab 1993;13:57–69.
18. Brooks DJ, Ibanez V, Sawle GV, et al. Differing patterns ofstriatal 18F-dopa uptake in Parkinson’s disease, multiple systematrophy, and progressive supranuclear palsy. Ann Neurol 1990;28:547–555.
Shan et al: SCA2 and Familial PD 815

Complete Allele Informationin the Diagnosis ofFacioscapulohumeralMuscular Dystrophy byTriple DNA AnalysisRichard J. L. F. Lemmers, BSc,1 Peggy de Kievit,1
Michel van Geel, PhD,3 Michiel J.R. van der Wielen,1
Egbert Bakker, PhD,1 George W. Padberg, MD, PhD,2
Rune R. Frants, PhD,1
and Silvere M. van der Maarel, PhD1
Facioscapulohumeral muscular dystrophy is caused bypartial deletion of the D4Z4 repeat array on chromosome4q35. Genetic diagnosis is based on sizing of this repeatarray, which is complicated by cross-hybridization of ahomologous polymorphic repeat array on chromosome10 and by the frequent exchanges between these chromo-somal regions. The restriction enzyme XapI optimizes thediagnosis of facioscapulohumeral muscular dystrophy byuniquely digesting 4-derived repeat units and leaving 10-derived repeat units undigested, thus complementingBlnI, which uniquely digests 10-derived repeat units. Atriple analysis with EcoRI, EcoRI/BlnI, and XapI un-equivocally allows characterization of each of the four al-leles, whether homogeneous or hybrid. This is particu-larly useful in the case of identical sized 4-derived and10-derived arrays, in situations of suspected facioscapu-lohumeral muscular dystrophy with nonstandard alleleconfigurations, and for assignment of hybrid fragmentsto their original alleles.
Ann Neurol 2001;50:816–819
Facioscapulohumeral muscular dystrophy (FSHD,MIM 158900) is characterized by progressive weaknessand atrophy of facial and shoulder girdle muscles and agradual spread, variable in time, to abdominal andfoot-extensor muscles, followed by involvement of up-
per arm and pelvic girdle muscles. Recently, attentionhas been drawn to the absence of facial weakness andpelvic girdle onset.1–3 Clinical uncertainties in somepatients and the high frequency of new mutationsmake reliable DNA diagnosis mandatory for geneticconfirmation and counseling.
FSHD is associated with partial deletions of thepolymorphic D4Z4 repeat array on 4q35. This array isvisualized in EcoRI-digested DNA by hybridizationwith probe p13E-11 (D4F104S1), which recognizesthe region proximal to the D4Z4 repeat (Fig 1). Innormal people, the array varies between 11 to 150units; patients carry an allele of 1 to 10 units (10 to38kb).4,5 DNA diagnosis is compromised by cross-hybridization of p13E-11 to a highly homologouspolymorphic array on 10q26.6,7 At least 10% of chro-mosome 10-derived fragments in the population are,38kb and do not cause disease. The restriction en-zyme BlnI specifically recognizes chromosome 10-derived units, but not chromosome 4-derived units.8
Therefore, BlnI-insensitive chromosome 4 alleles canbe discriminated from BlnI-sensitive chromosome 10alleles by EcoRI/BlnI double digestion (Fig 2B; see Fig1). Pulsed-field gel electrophoresis (PFGE), allowingdiscrimination of fragments .50kb and separation ofboth 4 and 10 alleles, demonstrated the existence of4-derived arrays on chromosome 10 or 10-derived ar-rays on chromosome 4.9 Hybrid repeat arrays consist-ing of mixtures of 4- and 10-derived units have alsobeen identified, adding to the complexity of the DNAdiagnosis. Especially in patients with a complex repeatarray composition, in patients in whom the probe re-gion itself is also deleted, or in patients who displaysomatic mosaicism for the repeat array deletion, PFGEhas proved very useful.9–12
These complicated situations underscore the needfor simple and reliable tests without use of PFGE,particularly when DNA testing is increasingly wantednot only as a confirmatory but also as an exclusiontest.
Patients and MethodsSubjectsControl Subjects 1 and 2 are from a random Dutch popu-lation. Subject 3 is a de novo FSHD patient. Subject 4 is a57-year-old man who was seen by his local neurologist forshoulder pain. When he claimed that his cousin had FSHD,DNA testing was performed showing a shortened EcoRI frag-ment, indicating that he a gene carrier with a probability ofgreater than 98%. He was referred for a second opinion.Apart from pain, he reported progressive difficulties raisinghis arms above his head for a period of 10 years. The phys-ical examination showed mild m. infraspinatus atrophy andweakness (MRC grade 4), as well as bilateral deltoid, biceps,and triceps weakness (grade 4). Painful elevation of the armslimited to 145 degrees was present bilaterally. Exorotation of
From the 1Center for Human and Clinical Genetics, Leiden Uni-versity Medical Center, Leiden; 2Department of Neurology, Univer-sity Medical Center Nijmegen, Nijmegen, The Netherlands; and3Department of Cancer Genetics, Roswell Park Cancer Institute,Buffalo, NY.
Current address for Dr van Geel: Department of Dermatology, Uni-versity Medical Center Nijmegen, P.O Box 9101, 6500 HB, TheNetherlands.
Received May 21, 2001, and in revised form Sep 10, 2001. Ac-cepted for publication Sep 10, 2001.
Published online Nov 5, 2001; DOI 10.1002/ana.10057
Address correspondence to Dr van der Maarel, Leiden UniversityMedical Center, Department of Human and Clinical Genetics,Wassenaarseweg 72, 2333 AL Leiden, The Netherlands.E-mail: [email protected]
816 © 2001 Wiley-Liss, Inc.
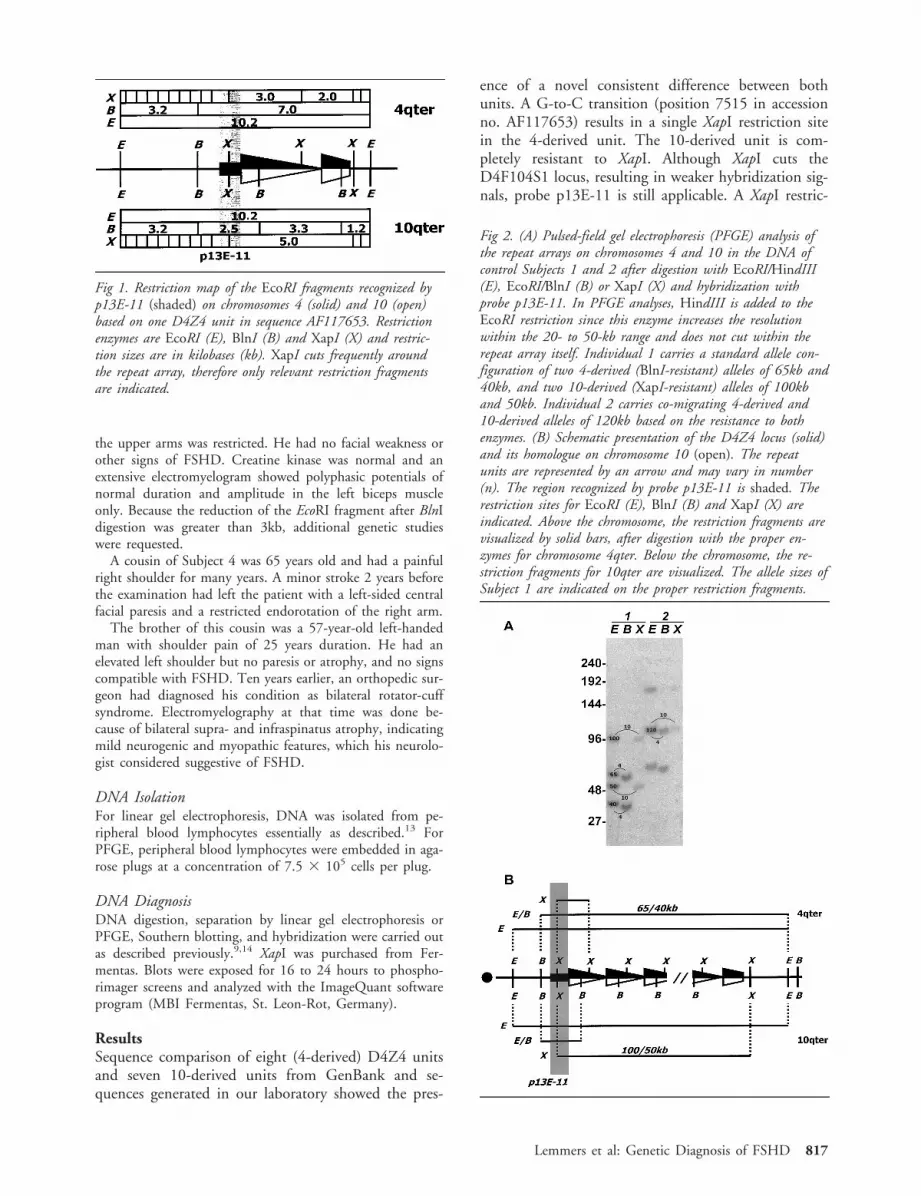
the upper arms was restricted. He had no facial weakness orother signs of FSHD. Creatine kinase was normal and anextensive electromyelogram showed polyphasic potentials ofnormal duration and amplitude in the left biceps muscleonly. Because the reduction of the EcoRI fragment after BlnIdigestion was greater than 3kb, additional genetic studieswere requested.
A cousin of Subject 4 was 65 years old and had a painfulright shoulder for many years. A minor stroke 2 years beforethe examination had left the patient with a left-sided centralfacial paresis and a restricted endorotation of the right arm.
The brother of this cousin was a 57-year-old left-handedman with shoulder pain of 25 years duration. He had anelevated left shoulder but no paresis or atrophy, and no signscompatible with FSHD. Ten years earlier, an orthopedic sur-geon had diagnosed his condition as bilateral rotator-cuffsyndrome. Electromyelography at that time was done be-cause of bilateral supra- and infraspinatus atrophy, indicatingmild neurogenic and myopathic features, which his neurolo-gist considered suggestive of FSHD.
DNA IsolationFor linear gel electrophoresis, DNA was isolated from pe-ripheral blood lymphocytes essentially as described.13 ForPFGE, peripheral blood lymphocytes were embedded in aga-rose plugs at a concentration of 7.5 3 105 cells per plug.
DNA DiagnosisDNA digestion, separation by linear gel electrophoresis orPFGE, Southern blotting, and hybridization were carried outas described previously.9,14 XapI was purchased from Fer-mentas. Blots were exposed for 16 to 24 hours to phospho-rimager screens and analyzed with the ImageQuant softwareprogram (MBI Fermentas, St. Leon-Rot, Germany).
ResultsSequence comparison of eight (4-derived) D4Z4 unitsand seven 10-derived units from GenBank and se-quences generated in our laboratory showed the pres-
ence of a novel consistent difference between bothunits. A G-to-C transition (position 7515 in accessionno. AF117653) results in a single XapI restriction sitein the 4-derived unit. The 10-derived unit is com-pletely resistant to XapI. Although XapI cuts theD4F104S1 locus, resulting in weaker hybridization sig-nals, probe p13E-11 is still applicable. A XapI restric-
Fig 1. Restriction map of the EcoRI fragments recognized byp13E-11 (shaded) on chromosomes 4 (solid) and 10 (open)based on one D4Z4 unit in sequence AF117653. Restrictionenzymes are EcoRI (E), BlnI (B) and XapI (X) and restric-tion sizes are in kilobases (kb). XapI cuts frequently aroundthe repeat array, therefore only relevant restriction fragmentsare indicated.
Fig 2. (A) Pulsed-field gel electrophoresis (PFGE) analysis ofthe repeat arrays on chromosomes 4 and 10 in the DNA ofcontrol Subjects 1 and 2 after digestion with EcoRI/HindIII(E), EcoRI/BlnI (B) or XapI (X) and hybridization withprobe p13E-11. In PFGE analyses, HindIII is added to theEcoRI restriction since this enzyme increases the resolutionwithin the 20- to 50-kb range and does not cut within therepeat array itself. Individual 1 carries a standard allele con-figuration of two 4-derived (BlnI-resistant) alleles of 65kb and40kb, and two 10-derived (XapI-resistant) alleles of 100kband 50kb. Individual 2 carries co-migrating 4-derived and10-derived alleles of 120kb based on the resistance to bothenzymes. (B) Schematic presentation of the D4Z4 locus (solid)and its homologue on chromosome 10 (open). The repeatunits are represented by an arrow and may vary in number(n). The region recognized by probe p13E-11 is shaded. Therestriction sites for EcoRI (E), BlnI (B) and XapI (X) areindicated. Above the chromosome, the restriction fragments arevisualized by solid bars, after digestion with the proper en-zymes for chromosome 4qter. Below the chromosome, the re-striction fragments for 10qter are visualized. The allele sizes ofSubject 1 are indicated on the proper restriction fragments.
Lemmers et al: Genetic Diagnosis of FSHD 817
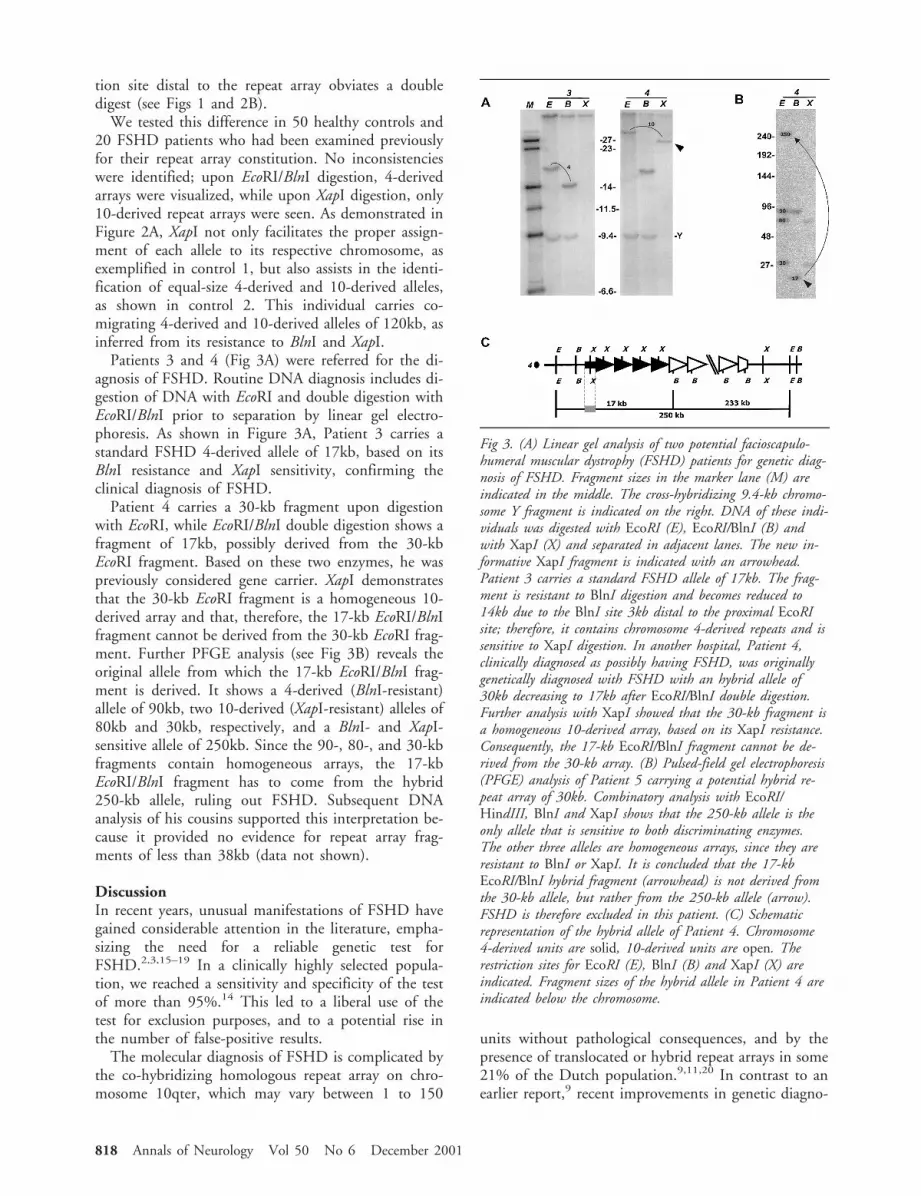
tion site distal to the repeat array obviates a doubledigest (see Figs 1 and 2B).
We tested this difference in 50 healthy controls and20 FSHD patients who had been examined previouslyfor their repeat array constitution. No inconsistencieswere identified; upon EcoRI/BlnI digestion, 4-derivedarrays were visualized, while upon XapI digestion, only10-derived repeat arrays were seen. As demonstrated inFigure 2A, XapI not only facilitates the proper assign-ment of each allele to its respective chromosome, asexemplified in control 1, but also assists in the identi-fication of equal-size 4-derived and 10-derived alleles,as shown in control 2. This individual carries co-migrating 4-derived and 10-derived alleles of 120kb, asinferred from its resistance to BlnI and XapI.
Patients 3 and 4 (Fig 3A) were referred for the di-agnosis of FSHD. Routine DNA diagnosis includes di-gestion of DNA with EcoRI and double digestion withEcoRI/BlnI prior to separation by linear gel electro-phoresis. As shown in Figure 3A, Patient 3 carries astandard FSHD 4-derived allele of 17kb, based on itsBlnI resistance and XapI sensitivity, confirming theclinical diagnosis of FSHD.
Patient 4 carries a 30-kb fragment upon digestionwith EcoRI, while EcoRI/BlnI double digestion shows afragment of 17kb, possibly derived from the 30-kbEcoRI fragment. Based on these two enzymes, he waspreviously considered gene carrier. XapI demonstratesthat the 30-kb EcoRI fragment is a homogeneous 10-derived array and that, therefore, the 17-kb EcoRI/BlnIfragment cannot be derived from the 30-kb EcoRI frag-ment. Further PFGE analysis (see Fig 3B) reveals theoriginal allele from which the 17-kb EcoRI/BlnI frag-ment is derived. It shows a 4-derived (BlnI-resistant)allele of 90kb, two 10-derived (XapI-resistant) alleles of80kb and 30kb, respectively, and a BlnI- and XapI-sensitive allele of 250kb. Since the 90-, 80-, and 30-kbfragments contain homogeneous arrays, the 17-kbEcoRI/BlnI fragment has to come from the hybrid250-kb allele, ruling out FSHD. Subsequent DNAanalysis of his cousins supported this interpretation be-cause it provided no evidence for repeat array frag-ments of less than 38kb (data not shown).
DiscussionIn recent years, unusual manifestations of FSHD havegained considerable attention in the literature, empha-sizing the need for a reliable genetic test forFSHD.2,3,15–19 In a clinically highly selected popula-tion, we reached a sensitivity and specificity of the testof more than 95%.14 This led to a liberal use of thetest for exclusion purposes, and to a potential rise inthe number of false-positive results.
The molecular diagnosis of FSHD is complicated bythe co-hybridizing homologous repeat array on chro-mosome 10qter, which may vary between 1 to 150
units without pathological consequences, and by thepresence of translocated or hybrid repeat arrays in some21% of the Dutch population.9,11,20 In contrast to anearlier report,9 recent improvements in genetic diagno-
Fig 3. (A) Linear gel analysis of two potential facioscapulo-humeral muscular dystrophy (FSHD) patients for genetic diag-nosis of FSHD. Fragment sizes in the marker lane (M) areindicated in the middle. The cross-hybridizing 9.4-kb chromo-some Y fragment is indicated on the right. DNA of these indi-viduals was digested with EcoRI (E), EcoRI/BlnI (B) andwith XapI (X) and separated in adjacent lanes. The new in-formative XapI fragment is indicated with an arrowhead.Patient 3 carries a standard FSHD allele of 17kb. The frag-ment is resistant to BlnI digestion and becomes reduced to14kb due to the BlnI site 3kb distal to the proximal EcoRIsite; therefore, it contains chromosome 4-derived repeats and issensitive to XapI digestion. In another hospital, Patient 4,clinically diagnosed as possibly having FSHD, was originallygenetically diagnosed with FSHD with an hybrid allele of30kb decreasing to 17kb after EcoRI/BlnI double digestion.Further analysis with XapI showed that the 30-kb fragment isa homogeneous 10-derived array, based on its XapI resistance.Consequently, the 17-kb EcoRI/BlnI fragment cannot be de-rived from the 30-kb array. (B) Pulsed-field gel electrophoresis(PFGE) analysis of Patient 5 carrying a potential hybrid re-peat array of 30kb. Combinatory analysis with EcoRI/HindIII, BlnI and XapI shows that the 250-kb allele is theonly allele that is sensitive to both discriminating enzymes.The other three alleles are homogeneous arrays, since they areresistant to BlnI or XapI. It is concluded that the 17-kbEcoRI/BlnI hybrid fragment (arrowhead) is not derived fromthe 30-kb allele, but rather from the 250-kb allele (arrow).FSHD is therefore excluded in this patient. (C) Schematicrepresentation of the hybrid allele of Patient 4. Chromosome4-derived units are solid, 10-derived units are open. Therestriction sites for EcoRI (E), BlnI (B) and XapI (X) areindicated. Fragment sizes of the hybrid allele in Patient 4 areindicated below the chromosome.
818 Annals of Neurology Vol 50 No 6 December 2001

sis showed that only homogeneous or hybrid 4-derivedarrays of less than 38kb on chromosome 4 have beenidentified in FSHD. Short homogeneous 10-derivedarrays on chromosome 4 or, small repeat arrays onchromosome 10, irrespective of their composition, havenever been associated with disease. Unfortunately, thecurrent techniques do not permit determination of theoriginal EcoRI fragment from which hybrid EcoRI/BlnIfragments are derived.
Introduction of the restriction enzyme XapI refinesFSHD diagnosis. XapI has opposite characteristics toBlnI: it recognizes a single restriction site within the4-derived repeat unit, while the 10-derived repeat unitis XapI-resistant. Therefore, digestion of DNA withEcoRI, with EcoRI/BlnI, and with XapI, allows un-equivocal determination of chromosome 4-derived and10-derived alleles. XapI is particularly useful when re-peat arrays are composed of clusters of 4-derived and10-derived repeat units, in which it provides completeallele information. Patient 4 (see Fig 3A–C) exemplifiesthe power of this procedure, since a potential hybridshort repeat array of four 4-derived repeat units (17kb),followed by three 10-derived units (13kb) in a telo-meric direction, would have explained the 30-kb EcoRIfragment, in a clinically atypical FSHD patient. How-ever, the XapI digest indicates that the 30-kb EcoRIfragment is a homogeneous 10-derived repeat and that,therefore, the 17-kb EcoRI/BlnI hybrid fragment can-not have been derived from the 30-kb EcoRI fragment.Indeed, PFGE analysis demonstrates the presence of a250-kb EcoRI fragment sensitive to BlnI and XapI fromwhich the 17-kb EcoRI/BlnI fragment must be derived.This was supported by the finding that his supposedlyaffected cousins did not carry alleles ,38kb. Since wehave not observed a small fragment with BlnI-sensitiverepeats, residing on chromosome 4 and responsible forFSHD, there is no genetic support for the diagnosis ofFSHD.
Although such complicated allele constitutions areprobably rare, the increasing use of the DNA test asexclusion criterion necessitates the additional use ofXapI to obtain complete allele information.
This work is funded by the Prinses Beatrix Fonds, the Dutch FSHDFoundation, the Muscular Dystrophy Association (USA), the FSHSociety (USA), and the Association Francaise Contre les Myopa-thies.
S.M.vd.M. is a Gisela Thier Fellow of the Leiden University Med-ical Center.
References1. Padberg GW. Facioscapulohumeral disease. Thesis. Leiden Uni-
versity, 1982.2. Felice KJ, North WA, Moore SA, Mathews KD. FSH dystro-
phy 4q35 deletion in patients presenting with facial-sparingscapular myopathy. Neurology 2000;54:1927–1931.
3. van der Kooi AJ, Visser MC, Rosenberg N, et al. Extension ofthe clinical range of facioscapulohumeral dystrophy: report ofsix cases. J Neurol Neurosurg Psychiatry 2000;69:114–116.
4. Wijmenga C, Hewitt JE, Sandkuijl LA, et al. Chromosome 4qDNA rearrangements associated with facioscapulohumeral mus-cular dystrophy. Nature Genet 1992;2:26–30.
5. van Deutekom JC, Wijmenga C, van Tienhoven EA, et al.FSHD associated DNA rearrangements are due to deletions ofintegral copies of a 3.2 kb tandemly repeated unit. Hum MolGenet 1993;2:2037–2042.
6. Bakker E, Wijmenga C, Vossen RH, et al. The FSHD-linkedlocus D4F104S1 (p13E-11) on 4q35 has a homologue on10qter. Muscle Nerve 1995;2:S39–44.
7. Deidda G, Cacurri S, Grisanti P, et al. Physical mapping evi-dence for a duplicated region on chromosome 10qter showinghigh homology with the facioscapulohumeral muscular dystro-phy locus on chromosome 4qter. Eur J Hum Genet 1995;3:155–167.
8. Deidda G, Cacurri S, Piazzo N, Felicetti L. Direct detection of4q35 rearrangements implicated in facioscapulohumeral muscu-lar dystrophy (FSHD). J Med Genet 1996;33:361–365.
9. van Deutekom JC, Bakker E, Lemmers RJ, et al. Evidence forsubtelomeric exchange of 3.3 kb tandemly repeated units be-tween chromosomes 4q35 and 10q26: implications for geneticcounselling and etiology of FSHD1. Hum Mol Genet 1996;5:1997–2003.
10. Cacurri S, Piazzo N, Deidda G, et al. Sequence homology be-tween 4qter and 10qter loci facilitates the instability of subte-lomeric KpnI repeat units implicated in facioscapulohumeralmuscular dystrophy. Am J Hum Genet 1998;63:181–190.
11. Lemmers RJLF, van der Maarel SM, van Deutekom JCT, et al.Inter- and intrachromosomal subtelomeric rearrangements on4q35: implications for facioscapulohumeral muscular dystrophy(FSHD) aetiology and diagnosis. Hum Mol Genet 1998;7:1207–1214.
12. van der Maarel SM, Deidda G, Lemmers RJ, et al. De novofacioscapulohumeral muscular dystrophy: frequent somaticmosaicism, sex-dependent phenotype, and the role of mitotictranschromosomal repeat interaction between chromosomes 4and 10. Am J Hum Genet 2000;66:26–35.
13. Miller SA, Dykes DD, Polesky HF. A simple salting out pro-cedure for extracting DNA from human nucleated cells. Nu-cleic Acids Res 1988;16:1215.
14. Bakker E, van der Wielen MJ, Voorhoeve E, et al. Diagnostic,predictive, and prenatal testing for facioscapulohumeral muscu-lar dystrophy: diagnostic approach for sporadic and familialcases. J Med Genet 1996;33:29–35.
15. Brouwer OF, Padberg GW, Ruys CJ, et al. Hearing loss infacioscapulohumeral muscular dystrophy. Neurology 1991;41:1878–1881.
16. Brouwer OF, Padberg GW, Bakker E, et al. Early onset fa-cioscapulohumeral muscular dystrophy. Muscle Nerve 1995;2:S67–S72.
17. Funakoshi M, Goto K, Arahata K. Epilepsy and mental retar-dation in a subset of early onset 4q352 facioscapulohumeralmuscular dystrophy. Neurology 1998;50:1791–1794.
18. Miura K, Kumagai T, Matsumoto A, et al. Two cases of chro-mosome 4q35-linked early onset facioscapulohumeral musculardystrophy with mental retardation and epilepsy. Neuropediat-rics 1998;29:239–241.
19. Felice KJ, Moore SA. Unusual clinical presentations in patientsharboring the facioscapulohumeral dystrophy 4q35 deletion.Muscle Nerve 2001;24:352–356.
20. van Overveld PG, Lemmers RJ, Deidda G, et al. Interchromo-somal repeat array interactions between chromosomes 4 and 10:a model for subtelomeric plasticity. Hum Mol Genet 2000;9:2879–2884.
Lemmers et al: Genetic Diagnosis of FSHD 819

So Near Yet So Far: Neglectin Far or Near SpaceDepends on Tool UseAlan J. Pegna, PhD, Leila Petit, MA,Anne-Sarah Caldara-Schnetzer, MA, Asaid Khateb, PhD,Jean-Marie Annoni, MD, Roman Sztajzel, MD,and Theodor Landis, MD
The study of unilateral spatial neglect has shown thatspace can be dissociated on a peripersonal versus extra-personal basis. We report a novel type of dissociationbased on tool use in a patient suffering from left neglect.Line bisection was carried out in near and far space, us-ing a stick and a laser pointer. A rightward bias was al-ways found for the former, but not for the latter. Neglectthus appears to be contingent not only on distance, butalso on the motor action required by the task.
Ann Neurol 2001;50:820–822
Recent studies of patients suffering from unilateral spatial ne-glect (USN) have produced evidence suggesting that near(peripersonal) and far (extrapersonal) space are not coded byidentical brain networks. Indeed, brain injury can affect ei-ther representation selectively. Halligan and Marshall1 firstreported a patient who exhibited USN in a line-bisectiontask carried out within grasping space, but these investigatorsfailed to show any deviations when the lines were situated inextrapersonal space and bisection carried out with a lightpen. Later evidence2–5 showed the opposite dissociation withUSN present in far space, but not near space.
Recently, Berti and Frassinetti6 reported that the limit be-tween far and near space could be modulated through theuse of a tool. Indeed, their patient showed peripersonal, butnot extrapersonal, USN. Nevertheless, a rightward bias inline bisection appeared when the stimuli were placed beyondgrasping distance, when the task was carried out with a stick.These investigators concluded that the use of a stick pro-duced an extension of body space resulting in a recoding of“far” space as “near” by the relevant brain structures, consis-tent with suggestions from research in monkeys.7,8
Considering the importance of these findings, we soughtto investigate them further in a patient who showed leftUSN restricted to peripersonal space after he sustained a
right parietal infarct. Our investigation witnessed yet anotherpattern of results.
Case ReportPatient C.M. is a right-handed 87-year-old French-speakingman who had longstanding hypertension. When a suddenweakness in his left upper limb was noted, he was brought tothe hospital.
On admission, neurological examination indicated tempo-ral disorientation, dysarthria with hypophonia, a left homon-ymous hemianopia, a left facial droop, and left hypesthesia.He was completely hemiplegic on the left side and showeddiminished sensory functions for touch, pain, temperature,and vibration on the left side. A left USN was noted. Echo-Doppler of the cervical arteries showed a 40% stenosis of theright internal carotid artery. A computed tomography scan ofthe brain performed 24 hours after the onset of symptomsshowed an ancient infarct located in the right posteriorwatershed region. Ten days later, a computed tomographyscan of the brain showed acute infarcts with contrast enhance-ment involving the right pre- and postrolandic regions, aswell as the posterior arm of the internal capsule.
Neuropsychological AssessmentA comprehensive neuropsychological examination was car-ried out at 8 and 10 day after admission. On both days hewas cooperative and slow and presented attentional fluctua-tions. He complained spontaneously of hemiplegia and ofspeech and memory disturbances. Speech was slurred, andhis voice was weak and monotone.
There was no aphasia. The patient displayed spatial dys-graphia when writing short sentences; he also omitted wordson the left side of the text when reading. Similarly, drawingswere incomplete in the left visual half-field. Line bisectiontested clinically showed a clear rightward bias, as well as theomission of lines situated on the left side of the page. Therewas no representational neglect. Visual recognition in theright visual half-field was assessed clinically and did not showany signs of visual agnosia. A number of motor persevera-tions were also noted on graphic productions. A mild mem-ory impairment was noted on the Rey auditory–verbal learn-ing task.
MethodThe patient was tested on a controlled line-bisection task inwhich the size of the lines and the distance from the stimuliare systematically varied. Three male control subjects (aged87, 86, and 80) hospitalized for non-central nervous systemdiseases served as controls in the same line bisection task.The patient and the control subjects gave informed consentto participate in the test. The experiment was carried outwith the subjects comfortably seated in a quiet room.
The distances were selected such that three were withingrasping distance and three were in extrapersonal space. Linebisection was thus carried out at 30, 55, 80, 110, 140, and170cm from the patient’s eyes, with the first three distancescorresponding to near space and the latter three to far space.The sizes of the lines presented were established to corre-spond to visual angles of 15, 30, and 45 degrees at each ofthe six possible distances. Lines were drawn with black ink
From the Neurology Clinic, Geneva University Hospitals, Geneva,Switzerland.
Received Jun 21, 2001, and in revised form Sep 10, 2001. Acceptedfor publication Sep 10, 2001.
Published online Nov 2, 2001; DOI: 10.1002/ana.10058
Address correspondence to Dr Pegna, Neurology Clinic, GenevaUniversity Hospitals, 24 Rue Micheli-du-Crest, 1211 Geneva 14,Switzerland. E-mail: [email protected]
820 © 2001 Wiley-Liss, Inc.

on white paper and were placed on a cardboard for testing.The lines were positioned at eye level, with the center ofeach line corresponding to the midline.
The complete set of lines was bisected first using a pencil(attached to a 150cm pole for distances of .80cm), andthen again using a projection light pen that was placed in theright hand and held close to the sternum. Thirty-six mea-sures were thus obtained for every subject (3 line sizes 3 6distances 3 2 bisection conditions).
The deviations from the center produced by the subjects,measured in degrees of visual angle, were then transformedinto percentages with respect to the size of the lines. A valueof 0 indicated that the bisection was situated correctly in thecenter. Deviation of the subject’s response to the right of theobjective center (corresponding to left neglect) was indicatedby a positive value. Deviations to the left were indicated bynegative values.
ResultsFor the patient, the median percentage displacementfrom the center, along with the upper and lower quar-tile range, are shown in the Table for each of the 2 32 conditions: near space versus far space and pointing(light pen) versus reaching (pencil and pole). The dif-ferences between conditions are statistically significant,as determined by Kruskal-Wallis one-way analysis ofvariance by ranks test [H(3) 5 19.3; N 5 36; p 50.0002]. As is obvious from the data, deviations aregreatest for near space in the reaching condition, fol-lowed by bisection in extrapersonal space with a stick.By contrast, line bisection in near and far space with alight pen shows only a minimal deviation.
To determine the extent to which the deviationsshould be considered pathological, the values obtainedfrom the controls were used to compute the 5th to95th percentile limits (values generally used as aboundaries for “normal” function in neuropsychologi-cal testing) in each of the four conditions (see Table).
The Figure presents the patient’s results plottedalong with the normal limits produced by controls.The deviation in near space with a pencil is patholog-ical. Although less pronounced, a similar statement canbe made when bisection is carried out in extrapersonalspace by means of a pole. When using a light pen,however, the patient does not produce any signs of ne-glect, whether in near or in far space.
DiscussionThe key finding in this study was that USN was notobserved when the patient bisected the lines with a lightprojection pen whether the task was carried out in nearor in far space. By contrast, the use of the pencil andstick produced a rightward bias, whatever the distance.
One possible explanation is that the representationof space may be modified depending on the action tobe carried out. In other words, the representation of faror near space could be influenced by the motor re-sponse required when measuring neglect. This hypoth-esis has been repeatedly addressed in the literature. Tocircumvent motor responses, for example, USN hasbeen evaluated in near and far space, using optical il-lusions though no dissociation was observed betweendistances.9 However, dissociations could result fromthe effect of lesions on motor programs, rather than ona more perceptual level of neglect.3,7
Proof of a differential effect of response mode on theintensity of USN comes from a number of earlier re-ports. For example, USN has been found to be lessmarked in a detection task using visuospatial stimulithan verbal.10 Furthermore, neglect patients show agreater number of errors in a pointing task when usingthe right hand, rather than the left hand,11 suggestingthat some interaction takes place between the motoract and the processing of information. Finally, a pa-tient has been reported in whom perceptual tasks (eg,reading) were less markedly impaired than when a mo-tor component was present (eg, line bisection).5
These observations, along with our data, suggest thatduring the course of information processing, the actionrequired by the task determines which representationof space should be activated.
Interestingly, when using a stick, USN in far space isless pronounced than in near space. Similarly, the useof a light pen shows a slightly greater rightward shift innear than far space. Thus, an explanation given strictlyin terms of the “action” hypothesis would also appearinsufficient. Rather, our findings demonstrate that notonly is USN dissociable in terms of far and near space,but also what is considered to be near or far by thebrain is at least partially determined by the type of ac-tion required with respect to the object. These findings
Table. Determination of Extent to Which Deviations Should Be Considered Pathological
Reaching Near Pointing Near Reaching Far Pointing Far
CM 15.4 (14.3–17.5) 2.3 (1.6–3.3) 7.7 (1.4–8.0) 0.8 (26.2–4.3)Controls 1.4 0.5 2.0 0.2Percentile limits (5th–95th)a 21.6–4.2 22.3–2.5 21.1–3.5 22.1–1.4
Median displacement during line bisection in far and near space, using laser light pen (pointing) or pencil/stick (reaching) of patient C.M. (withupper and lower quartiles given in parentheses) and controls. Values are percentage displacement errors (positive values indicate a rightwarddisplacement).aObtained from controls.
Pegna et al: Tool-Dependent Hemineglect 821
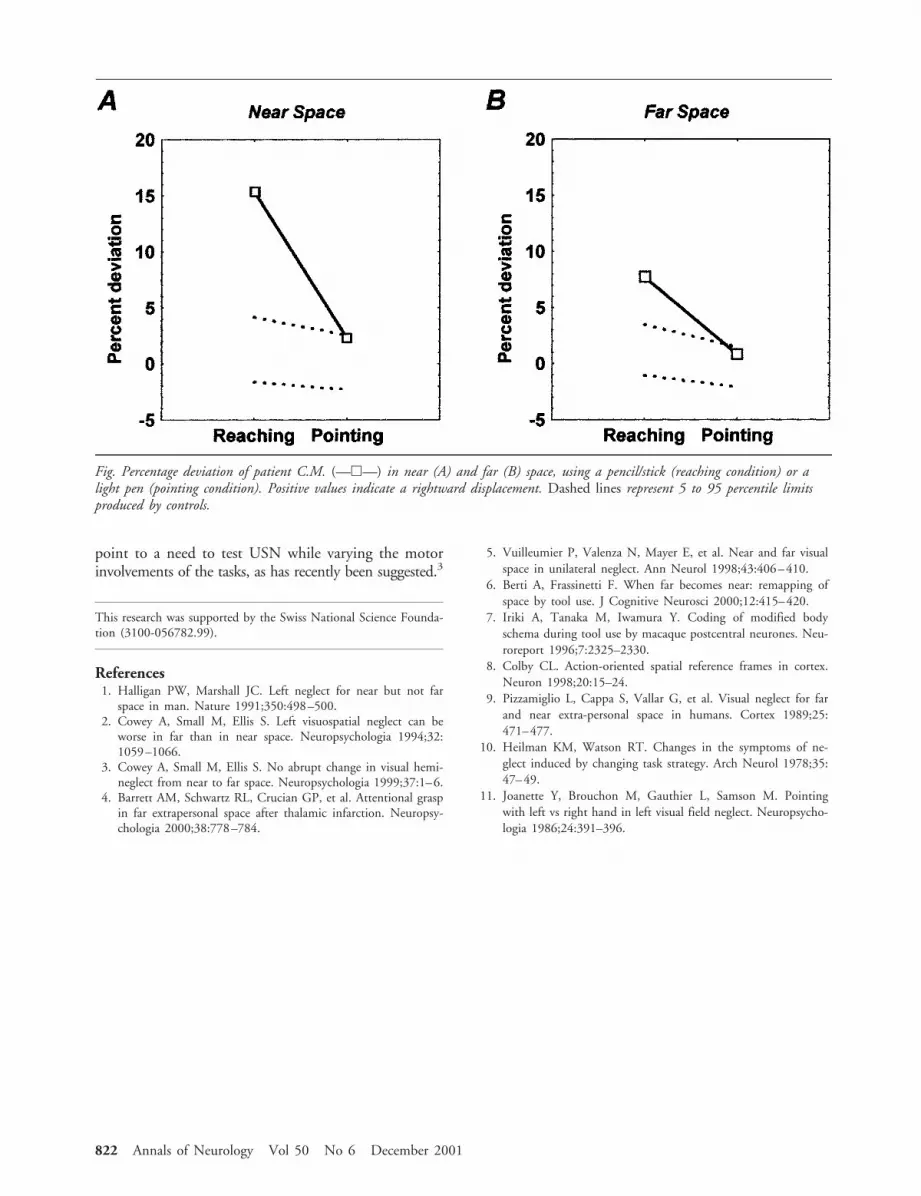
point to a need to test USN while varying the motorinvolvements of the tasks, as has recently been suggested.3
This research was supported by the Swiss National Science Founda-tion (3100-056782.99).
References1. Halligan PW, Marshall JC. Left neglect for near but not far
space in man. Nature 1991;350:498–500.2. Cowey A, Small M, Ellis S. Left visuospatial neglect can be
worse in far than in near space. Neuropsychologia 1994;32:1059–1066.
3. Cowey A, Small M, Ellis S. No abrupt change in visual hemi-neglect from near to far space. Neuropsychologia 1999;37:1–6.
4. Barrett AM, Schwartz RL, Crucian GP, et al. Attentional graspin far extrapersonal space after thalamic infarction. Neuropsy-chologia 2000;38:778–784.
5. Vuilleumier P, Valenza N, Mayer E, et al. Near and far visualspace in unilateral neglect. Ann Neurol 1998;43:406–410.
6. Berti A, Frassinetti F. When far becomes near: remapping ofspace by tool use. J Cognitive Neurosci 2000;12:415–420.
7. Iriki A, Tanaka M, Iwamura Y. Coding of modified bodyschema during tool use by macaque postcentral neurones. Neu-roreport 1996;7:2325–2330.
8. Colby CL. Action-oriented spatial reference frames in cortex.Neuron 1998;20:15–24.
9. Pizzamiglio L, Cappa S, Vallar G, et al. Visual neglect for farand near extra-personal space in humans. Cortex 1989;25:471–477.
10. Heilman KM, Watson RT. Changes in the symptoms of ne-glect induced by changing task strategy. Arch Neurol 1978;35:47–49.
11. Joanette Y, Brouchon M, Gauthier L, Samson M. Pointingwith left vs right hand in left visual field neglect. Neuropsycho-logia 1986;24:391–396.
Fig. Percentage deviation of patient C.M. (—h—) in near (A) and far (B) space, using a pencil/stick (reaching condition) or alight pen (pointing condition). Positive values indicate a rightward displacement. Dashed lines represent 5 to 95 percentile limitsproduced by controls.
822 Annals of Neurology Vol 50 No 6 December 2001