incentives in economic departments: testing tournaments?
TRANSCRIPT

Incentives in Economic Departments: TestingTournament Theory?∗
Tom Coupé�, Valérie Smeets�and Frédéric Warzynski§
March 31, 2003Still preliminary version, comments welcome
AbstractWe use a dataset of average wages by rank in US economic de-
partments over the period 1977-1997 to test empirical implications oftournament theory (Lazear and Rosen, 1981) against other theoriesthat have similar effects, like standards and basic marginal productiv-ity theory (Gibbs, 1995; Prendergast, 1999). We link this informationto individual production data to test whether wage gaps affect theproductivity and cooperative behavior of economists and to controlfor marginal productivity theory. We Þnd that the wage gap is in-creasing along the hierarchy, even when controlling for production byrank. Moreover, wages are more sensitive to productivity for higherranks. We Þnd some evidence that higher wage gaps lead to higherproductivity but not that wage gaps depend on the number of contes-tants nor that they lead to less cooperation. These Þndings tend to goin favor of the use of standards rather than tournaments in economicdepartments.
∗We thank Charles Scott and John Siegfried for allowing us to use the UAQ salary data.The paper beneÞtted from comments by Mathias Dewatripont and Patrick Legros, andby seminar participants at University College London student seminar, Trinity CollegeDublin (DEW), 2002 Jamboree in Toulouse, University of Liège, the Day for BelgianLabor Economists (Leuven, January 2002) and the Econometric Society North AmericanSummer Meeting (UCLA, June 2002). All errors are ours.
�ECARES, ULB and EERC, Kiev, e-mail: [email protected]�University of Toulouse; ECARES, ULB and University of Liège, e-mail:
[email protected]§IDEI, University of Toulouse, email: [email protected]
1

�No matter what we may say, none of us is a philosopher-saint,and you can’t fully understand the development of economic ideaswithout a sense of the structure of rewards that economists face�,
Paul Krugman, Incidents from my career,
www.wws.princeton.edu/~pkrugman/incidents.html
1 IntroductionA large literature has examined how relative performance evaluation (RPE)schemes are helpful to improve the incentives provided by an organizationto its employees and to induce sorting of the most able individuals. In thispaper, we analyze the wage policy of U.S. economic departments over theperiod 1977-1997 and link it to tournament theory (Lazear and Rosen, 1981),the Þrst and more popular of these RPE theories. Tournament theory hasseveral implications about the way wages are structured in the hierarchyso as to generate incentives and about the way individuals react to theseincentives.The empirical literature testing tournament theory has mostly focused on
executive pay (see e.g. Eriksson, 1999; Conyon et al., 1999 and Bognanno,2001 for recent exercises), where only the absolute top of the hierarchy wasconsidered and individual productivity was proxied by Þrm performance; ormore naturally on sport tournaments (see e.g. Ehrenberg and Bognanno,1990a&b and Becker and Huselid, 1992) where individual performance isimmediately retrievable, but hierarchies are absent.We extend the analysis to the academic world and more speciÞcally to the
case of economic departments. The academic profession combines two im-portant aspects: Þrst, there is a well-established three-layers hierarchy, andsecond, it is possible to obtain measures of individual productivity and co-operation since entry on the labor market, and therefore at each hierarchicallevel, by looking at publications patterns. In a more and more competi-tive academic environment, wage policy should be a key tool not only forproviding incentives but also for keeping and reallocating scarce talent.Another important criticism against existing papers is that most studies
did not test tournaments againt other theories like standards or basic the-ories of marginal productivity that have similar predictions (Gibbs, 1995;Prendergast, 1999).
2
We try to answer two questions. What are the main determinants ofthe wage policy in an economic department department, and more impor-tantly, does the wage structure inßuence the behavior of economists and how?Our main contribution is to test tournaments theory against standards andmarginal productivity.To answer these questions, we link our university level wage dataset to
individual productivity and cooperation data to assess the consequences ofwage gaps. We use the composition of economic departments in the 107universities which were ranked by the NRC in 1993 and link names to thebibliographic information provided by EconLit. We also use the fact that wehave information on the entire population of the department to compute theaverage productivity by rank, so as to link the wage gap to the differencesof productivity of the different ranks to control for marginal productivitytheory.We Þnd that the wage gaps are increasing with rank. This Þnding is
robust when controlling for productivity differences, and productivity dif-ferences also explain part of the wage gap. Wages become more linked toperformance at higher ranks, indicating a sorting effect as more productiveindividuals are allocated to higher pay jobs along the career. We also Þndevidence that wage gaps lead to more productivity. However, the wage gapdoes not appear to be affected by the number of contestants, nor does itinßuence cooperation among contestants. The evidence therefore suggeststhe use of standards rather than tournaments in economic departments, andalso the existence of a learning process about the talent of individuals alongthe career, resulting in the sorting of individuals.
2 Theory and Empirical Predictions
2.1 Tournaments
Tournaments are a simple form of RPE. People are being rewarded for beingthe Þrst, such as a sprinter winning a race or an high-rank executive beingpromoted to CEO. We provide hereafter a simpliÞed version of Lazear andRosen (1981).The output produced by individual i is stochastic and depends on effort
a:qi = ai + εi
3
There is a cost of effort Ψ (ai) . There exists another worker j with similarcharacteristics.Suppose the wage of the worker is a combination of a Þxed part t and a
prize for winning W , so that the expected payment is t+ pW , where p is theprobability of winning the tournament:
p = Pr (qi > qj) = Pr (ai − aj > εj − εi) = G (ai − aj)
where G is the cumulative distribution of normal εj − εi with mean 0 andvariance 2σ2.The agent therefore selects effort that maximises his utility function t +
pW −Ψ (a):Wg (ai − aj) = Ψ
0 (ai)
By symmetry ai = aj. Assuming for simplicity that Ψ (a) = a2
2, by
selecting W = 1g(0)
the principal can achieve the Þrst best. More generally,the higher the gap, the higher the effort exerted by the contestants.This literature has since been extended and detailing the various develop-
ments is beyond the scope of this paper. We focus our attention to testablehypotheses.
Hypothesis 1: the value of winning should increase asone goes up the promotion ladder (Rosen, 1986).
The intuition is that in a sequential game with N stages and s stages re-maining to be played, prizes are increasing in survival: ∆Ws > 0 ∀s. Winningone step further gives the option to continue, but since there are fewer stepsremaining, the option value that determines the incentives of the playersplays out, so the wage gap must reßect the loss of the survival option.
Hypothesis 2: the wage spread should be higher the morethere are contestant for the prize (Nalebuff and Stiglitz,1983)
This is a very intuitive Þnding: the more people are Þghting for a prize,the more difficult is it to obtain it, and the higher the prize should be toprovide the same level of incentives. While equilibrium effort is not affected,the wage spreads depends on the number of contestants (see also McLaughlin,1988).
4

Hypothesis 3: higher wage gaps should be associatedwith higher productivity
This proceeds directly from the theory, as higher gaps lead to better in-centives. This implies that universities with higher gaps will perform better,either in terms of publications or in terms of rankings.
Hypothesis 4: higher wage gaps should reduce coopera-tive behavior among contestants (Lazear, 1989)
While competition among contestants provides incentives to exert moreeffort, it could also discourage contestants to cooperate, or even induce themto sabotage each other�s work. It might therefore be efficient to have lowerwage gaps to avoid this negative sabotage behavior, at the expense of lowerproductive effort.
2.2 Standards
Standards are another simple form of promotion scheme, where all individ-uals who reach an established treshold are promoted. In that case, it is stillthe case that propositions 1 and 3 hold, but not propositions 2 and 4, be-cause the other contestants of the game are not true competitors. However,contestants are still incentivized by the contest prize and the prize must bestructured with that aim. Standards are therefore a safeguard against thepotential negative sabotaging effects of tournaments. While considered asexogenous by the contestants, standards are established by the organizationso as to guarantee a given level of sorting. One way to see it is that standardsare actually set by learning by doing, i.e. by observing the effect of previ-ously established standards on the talent pool and constitute dynamically anevolving set of rules1.
2.3 Marginal Productivity Theory
Marginal productivity theory simply implies that agents are rewarded ac-cording to their productivity. In that case, increasing wage gaps could alsoreßect the fact that higher ranked individuals are more productive. Talent
1We thank Ed Lazear for suggesting this aspect.
5
reveals itself as individuals start producing. Sorting emerges as a conse-quence of the survival game, as exit and reallocation proceeds. If the moreable individuals are sorted in the higher wage universities, then the fact thathigher wage gaps lead to higher productivity (proposition 3) could also be aconsequence of the sorting effect, rather than reßecting the incentive effect.There are no clear implication concerning propositions 2 and 4.
3 Data
3.1 University Level Data
Every year the American Economic Association (AEA) sends to economic de-partments the Universal Academic Questionnaire (UAQ) where informationis asked on, among other things, average salaries by category of jobs (assis-tant, associate and full professors), the size of the department by categoryand the number of degrees awarded. We use the answers to these surveys forthe years 1977 to 1997, providing a total of 2,100 observations2or on average100 departments a year. Salaries are deßated using the GDP-implicit pricedeßator (the base year is 1998).Average real wages have increased over time for all 3 categories. In 1977,
an economic department paid on average 64,000 $ to its professors, in 1997 itwas about 85,000$. The average wage of associate professors increased from48,000$ to 63,000$ and the assistant professors from 38,000$ to 53,000$.Figure 2 shows the evolution of the wage gap. While the wage difference
between associate and full professors has remained quite constant over time,the gap between assistant professors and the other categories has decreasedover time.
2Unfortunately, only few departments have participated every year so we have an un-balanced panel. From 2,338 university-year pairs, we further excluded observations wherewe did not have information on all ranks (186 cases), where the average salary was less then10,000 $ (8 outliers), and where the natural rank order was not observed (44 -mostly whenassistant professors average wage was higher than associate professors wage). Results werenot affected by the cleaning. One should be aware of two additional features: Þrst, thenumber of participants in the UAQ has been declining over time, we have 116 observationsin 1977 against 79 in 1997. Second, the composition of our sample changes from one yearto another, for example, Washington University is present each year, Princeton is present12 years and Harvard only once.
6
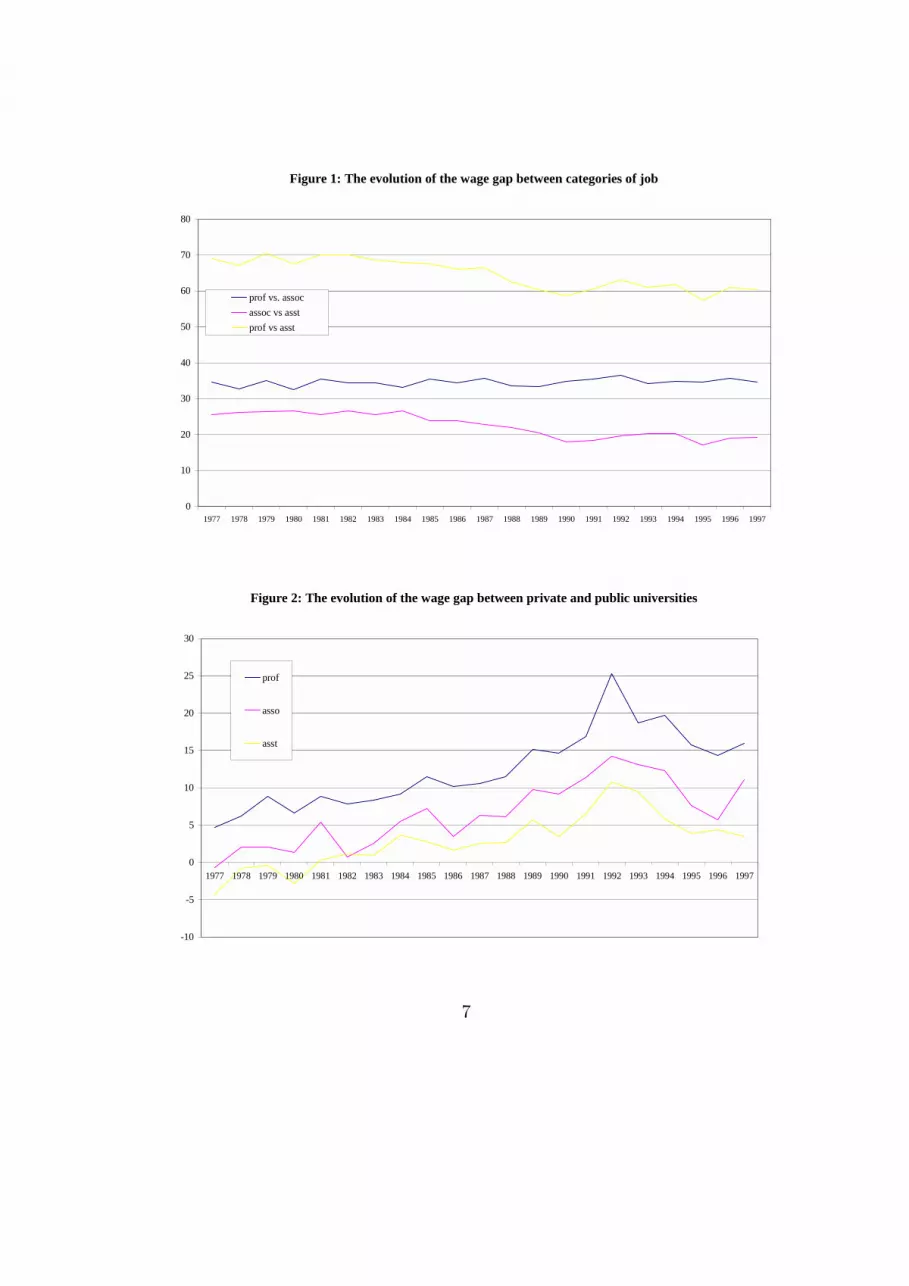
Figure 1: The evolution of the wage gap between categories of job
0
10
20
30
40
50
60
70
80
1977 1978 1979 1980 1981 1982 1983 1984 1985 1986 1987 1988 1989 1990 1991 1992 1993 1994 1995 1996 1997
prof vs. assocassoc vs asstprof vs asst
Figure 2: The evolution of the wage gap between private and public universities
-10
-5
0
5
10
15
20
25
30
1977 1978 1979 1980 1981 1982 1983 1984 1985 1986 1987 1988 1989 1990 1991 1992 1993 1994 1995 1996 1997
prof
asso
asst
7

At Þrst sight, our data conÞrm the Þrst prediction of tournament theory:in 1998, on average, the gap between the salary of an assistant professor andthe salary of an associate professor was about 19% while the gap between thesalary of an associate professor and the salary of a full professor was about35%. This appears to indicate that the wage gap is increasing with the joblevel.Another interesting feature of our dataset is that the variance increases
with rank as well (Table 1). This seems to indicate that promotions lead topay differentiation, while pay is relatively similar at the assistant professorlevel.
Table 1: Average wage and standard deviation by rank
Mean Std. dev.Wasst 52,588 5,879Wassoc 62,837 10,323Wprof 84,750 18,272
As we also have data on departments in both public (70 to 80%) andprivate (20 to 30%) universities, we can bring further evidence on the wellknown widening gap between public and private universities (see e.g. Alexan-der, 2001 and The Economist, 2000). Figure 3 shows the evolution of thegap between private and public departments for the different level. Privateuniversities do pay better, especially at the level of the professors. However,the difference for assistant professors is fairly small. Note also that for allthree job levels, the difference has increased over time3.Tournaments take place in the context of an internal labor market with no
explicit role for outside options. We check whether this important hypothesisis valid in economic departments. The UAQ also provides information onthe number of hires, promotions and leaves by year and by rank. Using allobservations for which we have data on the number of faculty in t and t− 1,and on the internal and external moves, we compute three variables: thepercentage of individuals leaving the department by year and by rank, thepercentage of newly hired individuals by year and by rank, and the percentage
3A problem so far has been that our sample is changing over time. To see whetherthings would change if we had complete panel, we also looked at the 52 universities forwhich we have observations both at the beginning and at the end of our period. Webasically get the same results.
8

of newly hired individuals coming from outside the department by year andby rank. Table 2 shows the average of these three variables.
Table 2: Average Internal and Outside Mobility
Rank % of individuals % of individuals % of new hired fromleaving the department hired by rank the outside
Professors 3.6 % 5.5 % 28 %Associates 3 % 12.1 % 25 %Assistants 1.5 % 19.1 % 95.8 %
The average percentage of individuals leaving the department is relativelysmall and increasing with ranks, while the average percentage of individualswho are new in the department is decreasing with rank, and relatively largeat the assistant professor level, which, in the case of the academic labor mar-ket, can clearly be described as a port of entry, as 95% of the new assistantprofessors are hired from the outside, while this percentage decreases dra-matically with rank. These statistics are consistent with the idea of internalcompetition for jobs.
3.2 Individual Data
We further use information about the entire population of individuals relatedto 107 universities which were ranked by the NRC in 19934. This datasetcontains 2,673 individuals and provides the name, rank and university towhich they are affiliated during the academic year 1992-1993. These nameswere linked to the bibliographic information in EconLit. This allows us notonly to look at the performance of individuals in terms of research but alsogives us the possibility to look at their cooperative behavior (through co-authorship).The department composition, together with the bibliographic record of
each individual, was then matched with the wage dataset. Wages for each
4As a robustness check, we also used the 7th and the 9th edition of the Guide toGraduate Study in Economics to get information on the faculty of the departments. The7th edition (academic years 1982-1984) gives for each department, the names of the facultyand their rank (from assistant to full professor). The 9th edition (academic year 1994-1995)in addition gives information on the date and the university of Ph.D. though sometimeslacks information on ranks. In a longer version of the paper, we also show the results usingthis alternative source.
9
layer were available for 50 universities (the list is available from the authors),among them 13 are private. This provides information about 1,291 individ-uals. More than half of them are full professors (694 individuals or 53.8%of the sample), the category of associate professors is composed of 292 indi-viduals (or 22.6% of the sample) and the others are assistant professors (305individuals, or 23.6% of the sample).
4 Empirical analysis
4.1 Increasing Wage Gaps
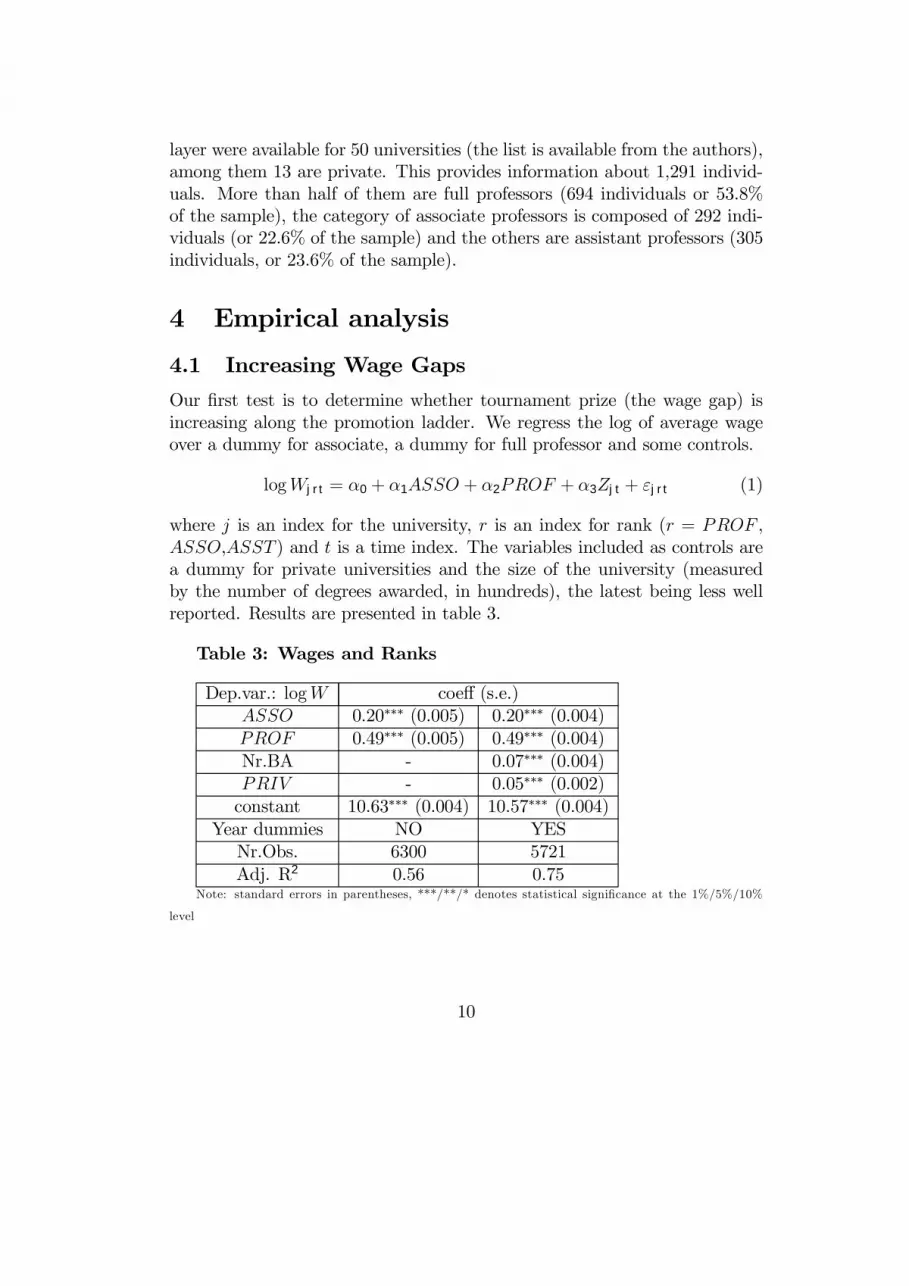
Our Þrst test is to determine whether tournament prize (the wage gap) isincreasing along the promotion ladder. We regress the log of average wageover a dummy for associate, a dummy for full professor and some controls.
logWjrt = α0 + α1ASSO + α2PROF + α3Zjt + εjrt (1)
where j is an index for the university, r is an index for rank (r = PROF ,ASSO,ASST ) and t is a time index. The variables included as controls area dummy for private universities and the size of the university (measuredby the number of degrees awarded, in hundreds), the latest being less wellreported. Results are presented in table 3.
Table 3: Wages and Ranks
Dep.var.: logW coeff (s.e.)ASSO 0.20∗∗∗ (0.005) 0.20∗∗∗ (0.004)PROF 0.49∗∗∗ (0.005) 0.49∗∗∗ (0.004)Nr.BA - 0.07∗∗∗ (0.004)PRIV - 0.05∗∗∗ (0.002)constant 10.63∗∗∗ (0.004) 10.57∗∗∗ (0.004)
Year dummies NO YESNr.Obs. 6300 5721Adj. R2 0.56 0.75
Note: standard errors in parentheses, ***/**/* denotes statistical signiÞcance at the 1%/5%/10%
level
10

We Þnd evidence of an increasing relationship between wage and thejob level. As one moves up in the hierarchy, the gap increases. As canbe seen in the Þrst column, job levels alone explain 56% of the variance.This Þnding supports one implication from tournament theory that the gapbetween each layer of the hierarchy should become larger and larger, so asto provide incentives to tournament participants to exert effort and win theprize. Size of the institution and its ownership also play an important rolein wage determination.However, one could argue that wage differentials simply reßect produc-
tivity differentials. To control for this possibility, we need a measure ofperformance for each hierarchical layer. To disaggregate university pro-duction by category of job, we use the list of the names and the ranks ofindividuals working in the department as provided in the 1992 survey of theNRC. For each individual, we constructed the publication history between1969 and 1998 from EconLit. This allows us to compute the mean numberof publications per rank for each of the 107 doctoral programs included inthe NRC survey.Publications are adjusted for quality and corrected for coauthorship, di-
viding the weight of the paper by the number of coauthors. Different qualityweights have been proposed in the literature an we selected one methodol-ogy, suggested in Bauwens (1998). Each journal receives a weight betweenone and Þve on the basis of the product of the impact factor and the totalnumber of citations received during a given year (the latter reßecting betterthe long run) and then gives weight 1 to journals not included in the JournalCitation Report (JCR) but included in Econlit, because the non-JCR in-cluded journals are quite likely to be rarely cited ones. This method has theadvantage of being simple and of weigthing all journals. One disadvantage isthat weights can be seen as relatively subjective. We also used publicationsweighted by the impact factor of the journal and this yielded comparableresults.We link the cross section information on the composition of economic
departments and their publication to the information about wages for theyear 1992. We Þnd a match for 50 universities. It is important to stress that,while we gain some insight on the potential variables inßuencing wages, welose the time dimension. We were unfortunately not able to follow the careerof individuals5 as the survey was not continued in subsequent years.
5In Coupé et al. (2003), we follow the career of a sample of 1,000 top economists
11

Wage gaps could reßect differences in average past publications. Univer-sities are likely to reward individuals on the basis of past accomplishements,reßecting their reputation which increases the prestige of the university towhich they are associated. We create a variable called average past publica-tion by rank (PPUB) by summing all papers produced by the individuals inour sample over the period 1969-1992 over ranks and dividing by the numberof individuals by rank. We regress the log of wage gaps over the log of PPUBfor all ranks, controlling for ranks, as in Eq. (2):
logWjr = δ0 + δ1ASSO + δ2PROF + δ3 logPPUBjr + εjr (2)
Table 4: Wages and Past Performance
Dep.var.: logWconstant 10.57∗∗∗ (0.03)logPPUB 0.08∗∗∗ (0.02)ASSO 0.08∗∗ (0.03)PROF 0.38∗∗∗ (0.04)Nr.Obs 150Adj. R2 0.79
Note: see table 3
In table 4, we Þnd that publications matter, but also that promotionpremia are lower when controlling for production differentials. The raw gapsfor this subsample of 50 universities are 19% (from assistant to associate) and54% (from associate to professor). Correcting for past performance, we getgaps of 8% and 38%. Despite this reduction is size, we still Þnd increasingwage gaps.We also ran the equation for each rank separately:
logWjr = γ0 + γ1 logPPUBjr + ε0jr∀r (3)
and linked their productivity to their career achievements, but without information aboutindividual wages.
12
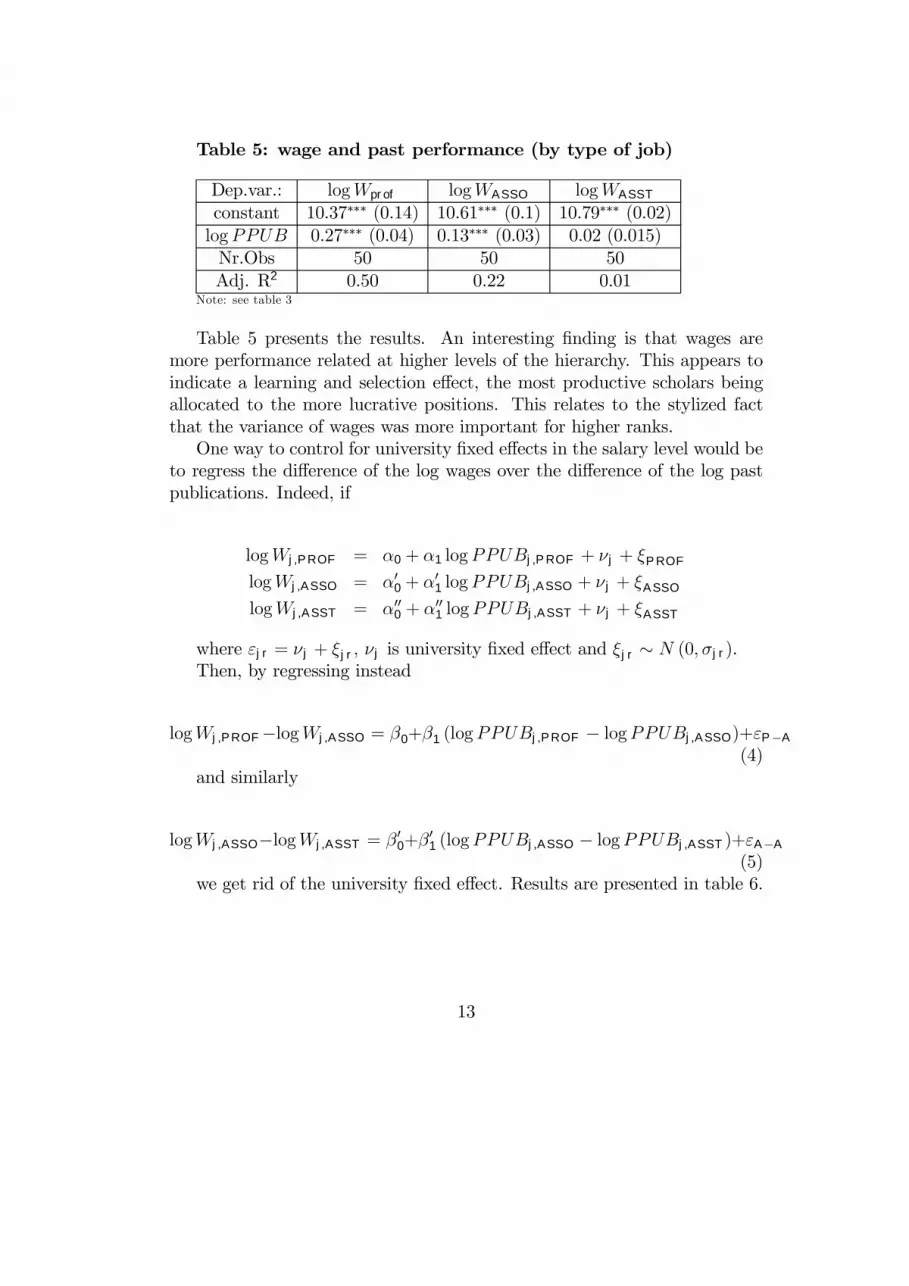
Table 5: wage and past performance (by type of job)
Dep.var.: logWprof logWASSO logWASST
constant 10.37∗∗∗ (0.14) 10.61∗∗∗ (0.1) 10.79∗∗∗ (0.02)logPPUB 0.27∗∗∗ (0.04) 0.13∗∗∗ (0.03) 0.02 (0.015)Nr.Obs 50 50 50Adj. R2 0.50 0.22 0.01
Note: see table 3
Table 5 presents the results. An interesting Þnding is that wages aremore performance related at higher levels of the hierarchy. This appears toindicate a learning and selection effect, the most productive scholars beingallocated to the more lucrative positions. This relates to the stylized factthat the variance of wages was more important for higher ranks.One way to control for university Þxed effects in the salary level would be
to regress the difference of the log wages over the difference of the log pastpublications. Indeed, if
logWj,PROF = α0 + α1 logPPUBj,P ROF + νj + ξP ROF
logWj,ASSO = α00 + α01 logPPUBj,ASSO + νj + ξASSO
logWj,ASST = α000 + α001 logPPUBj,ASST + νj + ξASST
where εjr = νj + ξjr, νj is university Þxed effect and ξjr ∼ N (0, σjr).Then, by regressing instead
logWj,PROF−logWj,ASSO = β0+β1 (logPPUBj,PROF − logPPUBj,ASSO)+εP−A
(4)and similarly
logWj,ASSO−logWj,ASST = β00+β
01 (logPPUBj,ASSO − logPPUBj,ASST )+εA−A
(5)we get rid of the university Þxed effect. Results are presented in table 6.
13

Table 6: Wage Gaps and Past Publication Differences
Dep.var.: logWP ROF − logWASSO logWASSO − logWASST
constant 0.28∗∗∗ (0.026) 0.15∗∗∗ (0.022)logPPUBP ROF − logPPUBASSO 0.12∗∗∗ (0.034) -logPPUBASSO − logPPUBASST - 0.027∗∗ (0.01)
Nr.Obs 50 50Adj. R2 0.18 0.06
Note: see table 3
We Þnd a positive effect of publication: higher wage gaps are partly ex-plained by higher publication gaps. Moreover, the difference in the constantagain indicates an increasing wage gap. Finally, the sensitivity of wage gapsto productivity differences increases along the career. What we do not con-trol for in this speciÞcation is that there could be a university-by-rank Þxedeffects. To properly address this issue, we would have needed a panel dataset.A related alternative explanation for wage gaps is experience. Individuals
would accumulate human capital and wages would be linked to seniority.Changes in experience could also have an inßuence on the evolution of thewage gap. We checked this hypothesis using individual data of the 9th Guideto Graduate Study in Economics which gave for some universities the year ofPh.D. Controlling for the average experience level, we did not Þnd signiÞcanteffect of experience6.To sum up, economic departments have increasing wage gaps and this
Þnding can not be entirely explained by performance differentials. This sug-gests that incentive-related motivations might lie at the origin of this Þnding.We also Þnd evidence of sorting, as wages become more performance relatedat higher ranks.
4.2 The Prize and the Number of Contestants
The second hypothesis that we want to test is whether the wage gap betweenjob ladders is a function of the number of participants. The more there
6There are also some elements that could explain the variation across departments forwhich we can not control such as differences in teaching loads. However, given the relative(compared to publications) unobservability of the quality of teaching, relatively to othercontestants, universities are less likely to provide incentives in this area. A more pragmaticreason for ignoring it was that the data was not available.
14

are participants, the more complicated it should be to win the prize, andtherefore, ex ante, a bigger reward should be needed to provide sufficientincentives to contestants. We therefore regress the wage gap between the fullprofessor level and the associate professor level over the number of associateprofessors waiting for promotion, controlling for size and type of institution.
logGAPj,PROF−ASSO = f(NR.ASSOj , PRIVj, SIZEj) (6)
and similarly, we regress the wage gap between the associate professorlevel and the assistant professor level on the number of assistant professorsand the same controls as in the previous regression.
logGAPj,ASSO−ASST = f(NR.ASSTj , PRIVj, SIZEj) (7)
Results are provided in table 7a. The number of contenders is positivelyand signiÞcantly related to the wage spread, in line with tournament the-ory. The more people are Þghting for the prize, the larger should the prizebe. The relationship is apparently stronger for the gap at the lower level(GAPASSO−ASST ).
Table 7a: Effect of the (absolute) number of contestants on thewage gap
Dep.var.: logGAPPROF−ASSO logGAPASSO−ASST
Nr. Contestants 0.017∗∗∗ (0.004) 0.019∗∗∗ (0.005)Nr.BA 0.18∗∗∗ (0.01) 0.12∗∗∗ (0.015)PRIV 0.33∗∗∗ (0.028) 0.23∗∗∗ (0.03)constant 9.30∗∗∗ (0.005) 8.85∗∗∗ (0.06)Nr.Obs. 1853 1852Adj. R2 0.19 0.10
Note: see table 3
In our analysis, we have used the absolute number of contestants. Bydoing this, we do not control for the number of positions available. In theliterature on Þrms one generally takes the number of board-members (in otherwords, divided by 1 CEO) as a proxy for the chance of winning the prize.Eriksson (1999) Þnds that for each additional manager with �signiÞcant�responsibilities, the wage gap increase by 1.8%. Conyon et al. (2001) Þndthat each additional board-member increases the gap by 3.5%. Bognanno
15

(2001) Þnally shows that each additional vice president increases the gapbetween the president and the vice-presidents salary by 4%.One rough proxy could be to divide the number of contestants by the
number of existing positions in the upper level. Indeed one could argue thatthe probability to be promoted will increase with the number of existingpositions. We create a variable labelled relative number of contestants bydividing the number of associate professors by the number of professors andthe number of assistants by the number of associate professors. We thenregress the wage gap over this new variable and controls. The results arepresented in table 7b.
Table 7b: Effect of the (relative) number of contestants on thewage gap
Dep.var.: logGAPP ROF−ASSO logGAPASSO−ASST
Rel. Nr. Contestants -0.016∗∗ (0.007) 0.015∗ (0.009)Nr.BA 0.18∗∗∗ (0.012) 0.14∗∗∗ (0.014)PRIV 0.30∗∗∗ (0.027) 0.23∗∗∗ (0.032)constant 9.40∗∗∗ (0.05) 8.92∗∗∗ (0.06)Nr.Obs. 1853 1852Adj. R2 0.18 0.09
Note: see table 3
We Þnd a positive and slightly signiÞcant effect of the number of assistantprofessors per associate professor and a negative and signiÞcant effect of thenumber of associate professors per professor. This goes against our expec-tations and is much less supporting tournaments, but this might be becausewe use a rough proxy.Ultimately, what we want to proxy is what is the probability to get tenure.
Ehrenberg et al (1998) look at the effect of the probability of getting tenureon the wage differential between assistant and associate professors. TheyÞnd a negative (so a higher probability of winning the prize decreases thesize of the prize) but insigniÞcant effect of the tenure probability on theratio of the salary of an associate professor over the salary of an assistantprofessor. Using instrumental variables, they Þnd a substantial signiÞcanteffect: lowering the probability of getting tenure by 50% increases the ratioby 30 percentage points.Again, we want to control for productivity differential. To do so, we Þrst
regress the log of the wage gap over the log of the gap in average cumulative
16

publications (see Eq. 4 and 5). The part which is not explained by the pub-lication differential is the corrected wage gap (CGAP ). We then regress thecorrected wage gap over the number of (absolute and relative) contestants.
CGAPj,PROF−ASSO = f(NR.CONTESTANTSj) (8)
CGAPj,ASSO−ASST = f(NR. CONTESTANTSj) (9)
Results are reported in tables 8a and 8b. We observe that the num-ber of contestants is relevant to explain the corrected gap only for assistantprofessors but not for associate professors.
Table 8a: The effect of the number of (absolute) contestants onthe corrected wage gap
Dep.var.: CGAPPROF−ASSO CGAPASSO−ASST
Nr. Contestants 0.006 (0.005) 0.007∗ (0.004)constant 0.32∗∗∗ (0.035) 0.11∗∗∗ (0.02)Nr.Obs. 50 50Adj. R2 0.01 0.04
Note: see table 3
Table 8b: The effect of the number of (relative) contestants onthe corrected wage gap
Dep.var.: CGAPPROF−ASSO CGAPASSO−ASST
Nr. Contestants -0.05 (0.03) 0.02∗∗∗ (0.007)constant 0.31∗∗∗ (0.02) 0.12∗∗∗ (0.01)Nr.Obs. 50 50Adj. R2 0.02 0.12
Note: see table 3
The result can be linked to the observed hierarchical structure of eco-nomic departments. Contrarily to Þrms where the hierarchy is organized ina pyramide-like scheme, the largest layer in departments is composed of pro-fessors, while the number of associates is usually smaller than the numberof assistants. This could explain why there seems to be a tournament effectin the Þrst round of promotion (from assistant to associate), but not in thesecond.
17

4.3 Incentive Effect
Do economists at the assistant and associate level produce more in highergaps universities? Are people responding to incentives? To check this, wetest whether we can Þnd a relationship between production on the one handand wage gap on the other. To avoid reversed causality, we use individualpublications (weigthed for coauthorship and adjusted for quality, as for pastpublications) during the the years 1993-1995 as a measure of performance(PERF ).We regress this productivity variable over the log of the wage gap in the
university where the individual is affiliated:
PERFi = λ0 + λ1GAPjr + λ2ASSO + εi (10)
where GAPjr is logGAPj,ASSO−ASST if individual i is assistant professorand logGAPj,P ROF−ASSO if he is associate. We Þnd a positive and signiÞcanteffect of the wage gap on individual performance (table 9). A doubling ofthe wage gap would lead to an increase of the average production by rankof 1 AER-equivalent article. Assistant professors in our sample appear tobe more productive than associate professors. This comparison only reßectscross-sectionnal differences between individuals in the subsamples, and notnecessarily a dynamic reduction of productivity after the Þrst promotion (onthe latest see Coupé et al., 2003).
Table 9: Effect of the the wage gap on performance
Dep.var.: PERFGAP 5.35∗∗ (2.15)ASSO -2.37∗∗∗ (0.55)constant 4.95∗∗∗ (0.53)Nr.Obs. 597Adj. R2 0.03
Note: see table 3
Previously we noticed that part of the wage gap was due not to incentivesreasons but to productivity differential. To correct for this, we use once againthe corrected wage gap instead of the observed wage gap:
PERFi = λ00 + λ
01CGAPjr + λ
02ASSOi + ε
0i (11)
18
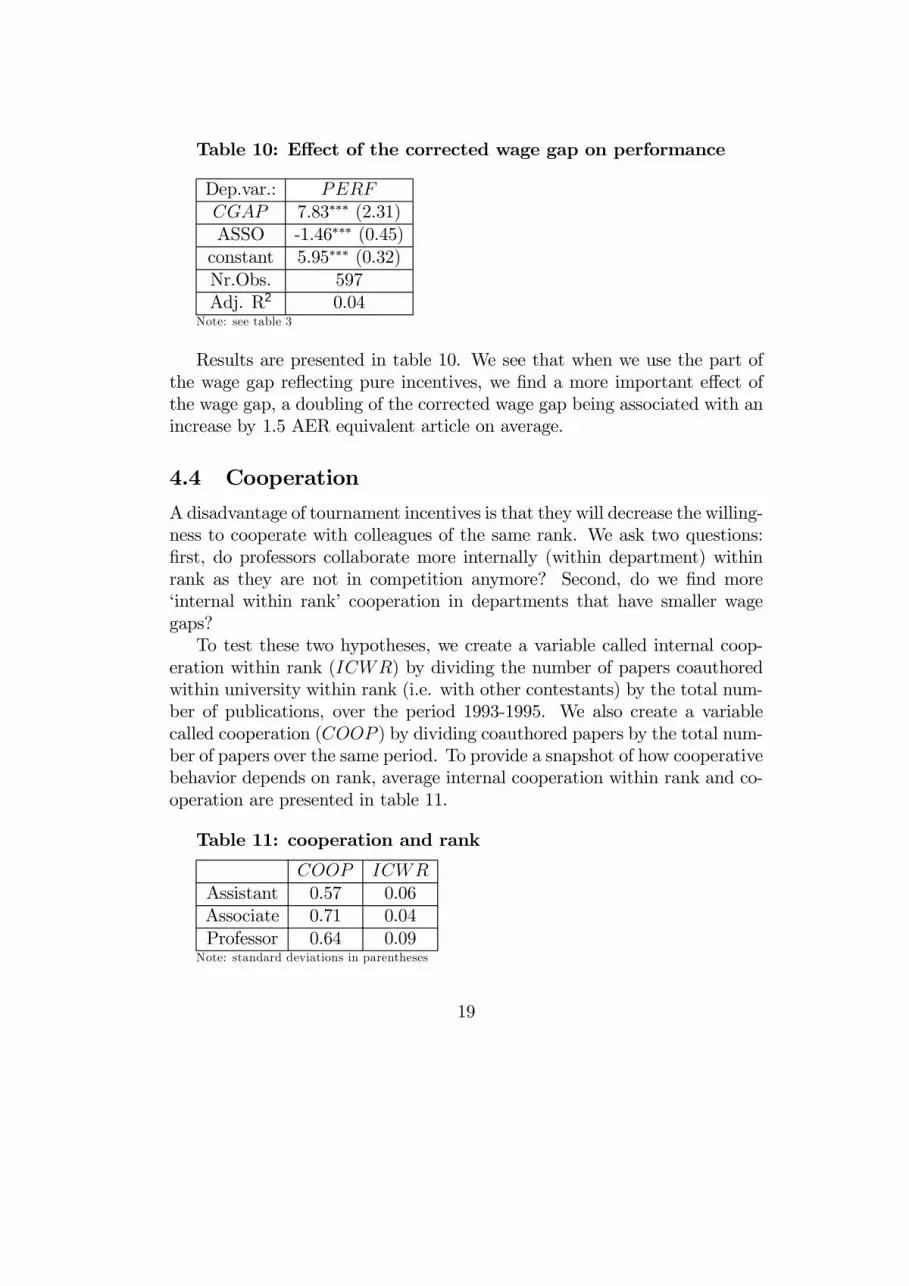
Table 10: Effect of the corrected wage gap on performance
Dep.var.: PERFCGAP 7.83∗∗∗ (2.31)ASSO -1.46∗∗∗ (0.45)constant 5.95∗∗∗ (0.32)Nr.Obs. 597Adj. R2 0.04
Note: see table 3
Results are presented in table 10. We see that when we use the part ofthe wage gap reßecting pure incentives, we Þnd a more important effect ofthe wage gap, a doubling of the corrected wage gap being associated with anincrease by 1.5 AER equivalent article on average.
4.4 Cooperation
A disadvantage of tournament incentives is that they will decrease the willing-ness to cooperate with colleagues of the same rank. We ask two questions:Þrst, do professors collaborate more internally (within department) withinrank as they are not in competition anymore? Second, do we Þnd more�internal within rank� cooperation in departments that have smaller wagegaps?To test these two hypotheses, we create a variable called internal coop-
eration within rank (ICWR) by dividing the number of papers coauthoredwithin university within rank (i.e. with other contestants) by the total num-ber of publications, over the period 1993-1995. We also create a variablecalled cooperation (COOP ) by dividing coauthored papers by the total num-ber of papers over the same period. To provide a snapshot of how cooperativebehavior depends on rank, average internal cooperation within rank and co-operation are presented in table 11.
Table 11: cooperation and rank
COOP ICWRAssistant 0.57 0.06Associate 0.71 0.04Professor 0.64 0.09
Note: standard deviations in parentheses
19

We Þnd that, among those economists who published at least one pa-per over the period (949 individuals or 73.5% of the sample), 63.5% of thepapers are coauthored. Moreover, associate professors are those who coop-erated more during that period. On the other hand, they are also those whocooperated less within rank. However, note that the the number of associateprofessors is often smaller than the number of assistant professors and muchsmaller than the number of professors.We then relate ICWR to the log of the wage gap as in the previous
subsection. Because there are a lot of people who do not cooperate at allor that cooperate on all their papers, we prefer to use a dichotomic variableas dependent variable and create a dummy DICWR equal to 1 if individualcooperated internally within rank on at least one paper and 0 otherwise.Individuals who did not publish did not cooperate neither and were assignedvalue of 0 (we relax this assumption infra). In our sample, 43 assistantprofessors (around 14% of the sample) and 23 associate professors (around8% of the sample) cooperated within rank.We run a probit analysis:
ICWR∗i = µ0 + µ1GAPjr + µ2ASSOi + εi
DICWRi = 1 if ICWR∗i > 0
DICWRi = 0 if ICWR∗i ≤ 0
Table 12: Effect of the the wage gap on cooperation
Dep.var.: DICWRGAP -0.078 (0.129)ASSO -0.052∗ (0.03)Nr.Obs. 597Pseudo R2 0.02
Log likelihood -204.4Note: see table 3
Table 12 shows the marginal changes. We Þnd negative but not signiÞcanteffect of the wage gap. Cooperative behavior within rank does not appear
20
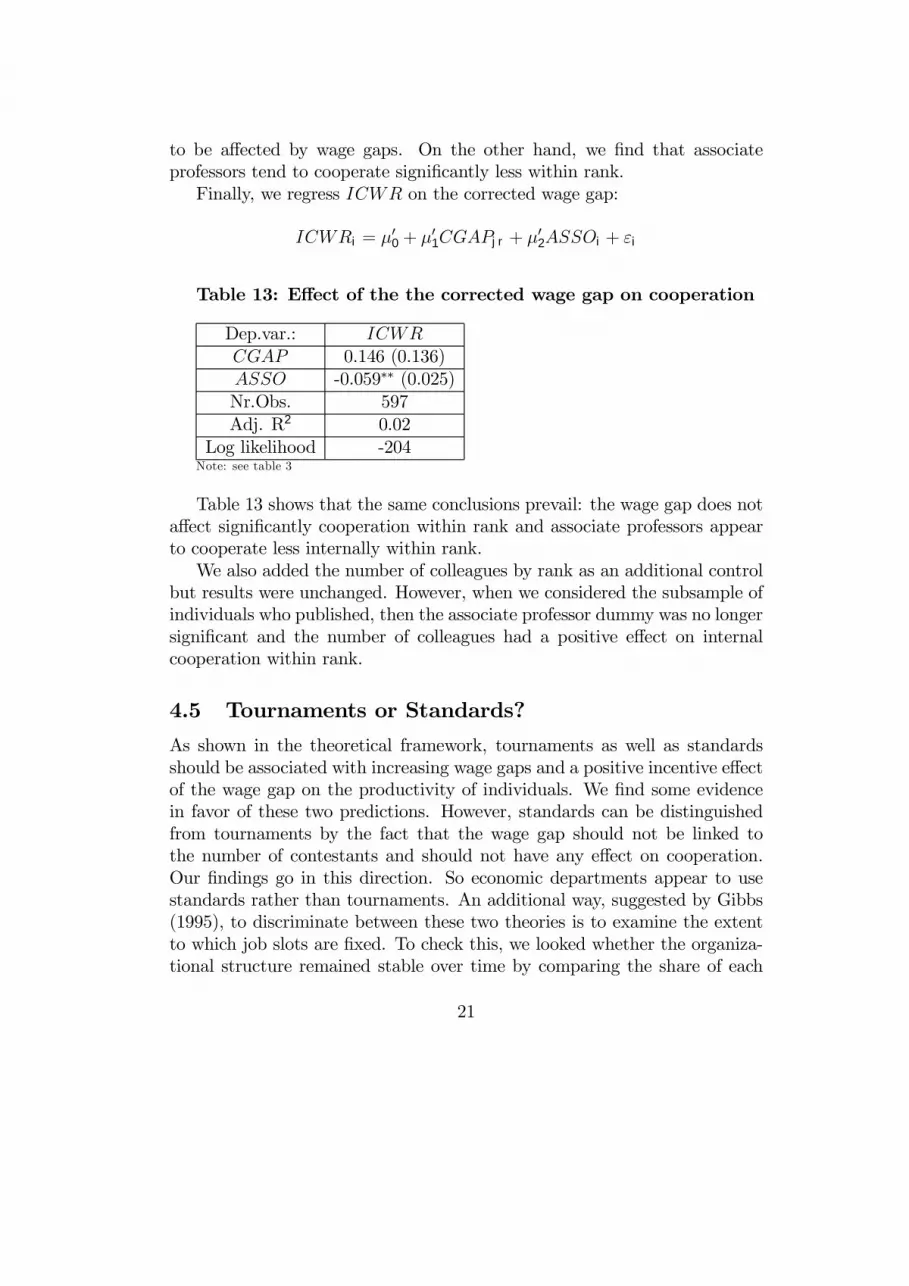
to be affected by wage gaps. On the other hand, we Þnd that associateprofessors tend to cooperate signiÞcantly less within rank.Finally, we regress ICWR on the corrected wage gap:
ICWRi = µ00 + µ
01CGAPjr + µ
02ASSOi + εi
Table 13: Effect of the the corrected wage gap on cooperation
Dep.var.: ICWRCGAP 0.146 (0.136)ASSO -0.059∗∗ (0.025)Nr.Obs. 597Adj. R2 0.02
Log likelihood -204Note: see table 3
Table 13 shows that the same conclusions prevail: the wage gap does notaffect signiÞcantly cooperation within rank and associate professors appearto cooperate less internally within rank.We also added the number of colleagues by rank as an additional control
but results were unchanged. However, when we considered the subsample ofindividuals who published, then the associate professor dummy was no longersigniÞcant and the number of colleagues had a positive effect on internalcooperation within rank.
4.5 Tournaments or Standards?
As shown in the theoretical framework, tournaments as well as standardsshould be associated with increasing wage gaps and a positive incentive effectof the wage gap on the productivity of individuals. We Þnd some evidencein favor of these two predictions. However, standards can be distinguishedfrom tournaments by the fact that the wage gap should not be linked tothe number of contestants and should not have any effect on cooperation.Our Þndings go in this direction. So economic departments appear to usestandards rather than tournaments. An additional way, suggested by Gibbs(1995), to discriminate between these two theories is to examine the extentto which job slots are Þxed. To check this, we looked whether the organiza-tional structure remained stable over time by comparing the share of each
21
hierarchical layer in 1983 and 1992. On average, these shares changed byabout 10% over a ten year period, which again goes in favor of standards.
5 ConclusionWe have used a very rich panel dataset providing average wage and depart-ment size at each level of the economic departments� hierarchy over morethan twenty years to test empirically key elements of tournament theory.We provide evidence that wage gaps are increasing with the job level, evenwhen controlling for differences in productivity by rank. Moreover, averagewages increase with productivity along the career, suggesting the presence ofsorting, as the more productive economists are being matched with the moreproductive universities, which also pay higher wages. We Þnd that individ-ual productivity is positively linked to wage gaps, i.e. wage gaps have anincentive effect. However, we do not Þnd strong evidence that the number ofcontestants inßuences wage gaps, nor that wage gaps are associated with lesscooperation among contestants. These Þndings would tend to support theexistence of standards rather than tournaments in economic departments.This is further conÞrmed by the variability of the organisational structure ineconomic departments.
References[1] Alexander, F.K. (2000), The Silent Crisis: The Fiscal Capacity of Pub-
lic Universities to Compete for Faculty, Review of Higher Education,Forthcoming, December, 2000.
[2] Baker, George P., Jensen, Michael C. and Murphy, Kevin J. (1988),Compensation and Incentives: Practice vs. Theory, Journal of Finance,43, 593-616.
[3] Bauwens, L. (1998), A New Method to Rank University Research andResearchers in Economics in Belgium, Working Paper, CORE.
[4] Becker, Brian E. and Huselid, Mark A. (1992), The Incentive Effects ofTournament Compensation Systems, Administrative Science Quarterly,37, 336-350.
22

[5] Bognanno, Michael L. (2001), Corporate Tournaments, Journal of LaborEconomics, 19, 290-315.
[6] Conyon, Martin J., Peck, Simon I. and Sadler, Graham (1999), Cor-porate tournaments and executive compensation, mimeo, University ofWarwick.
[7] Coupé, Tom, Smeets, Valérie and Warzynski, Frédéric (2003), Incen-tives, Sorting and Productivity Along the Career, Mimeo, University ofToulouse.
[8] Ehrenberg, Ronald G. and Bognanno, Michael L. (1990a), The IncentiveEffects of Tournaments Revisited: Evidence from the European PGATour, Industrial and Labor Relations Review, 43, 74S-88S.
[9] Ehrenberg, Ronald G. and Bognanno, Michael L. (1990b), Do Tourna-ments Have Incentive Effects?, Journal of Political Economy, 98, 1307-1324.
[10] Ehrenberg, Ronald G., Pieper, Paul J. and Willis, Rachel A. (1998), DoEconomics Departments with Lower Tenure Probabilities Pay HigherFaculty Salaries?, Review of Economics and Statistics, 80, 503-512.
[11] Eriksson, Tor (1999), Executive Compensation and Tournament Theory:Empirical tests on Danish Data, Journal of Labor Economics, 17, 262-280.
[12] Gibbs, Michael (1995), Testing Tournaments? An Appraisal of the The-ory and Evidence, Labor Law Journal.
[13] Lazear, Edward and Rosen, Sherwin (1981), Rank Order Tournamentsas Optimal Labor Contracts, Journal of Political Economy, 89, 841-864.
[14] Lazear, Edward (1989), Pay Equality and Industrial Politics, Journal ofPolitical Economy, 97, 561-580.
[15] McLaughlin, Kenneth J. (1988), Aspects of Tournament Models: A Sur-vey, Research in Labor Economics, 9, 225-256.
[16] Nalebuff, Barry J. and Stiglitz, Joseph E. (1983), Prizes and incentives:towards a general theory of compensation and competition, Bell Journalof Economics, 14, 21-43.
23
[17] Prendergast, Canice (1999), The Provision of Incentives in Firms, Jour-nal of Economic Literature, 37, 7-63.
[18] Rosen, Sherwin (1986), Prizes and Incentives in Elimination Tourna-ments, American Economic Review, 76, 701-715.
[19] Rosen, Sherwin (1988), Promotions, Elections and Other Contests, Jour-nal of Institutional and theoretical Economics, 144, 73-90.
[20] The Economist (2000), �University Education: The Gap Widens,22/04/2000.
24