in vivo hiv-1 hypermutation and viral loads among antiretroviral-naive brazilian patients
TRANSCRIPT

IMMUNOLOGY
In Vivo HIV-1 Hypermutation and Viral LoadsAmong Antiretroviral-Naive Brazilian Patients
Mariana Leao de Lima-Stein,1 Wagner Tadeu Alkmim,1 Maria Clara de Souza Bizinoto,1
Luis Fernandez Lopez,2 Marcelo Nascimento Burattini,2 Juliana Terzi Maricato,1 Leila Giron,1
Maria Cecılia Araripe Sucupira,1 Ricardo Sobhie Diaz,1 and Luiz Mario Janini1
Abstract
Hypermutation alludes to an excessive number of specific guanine-to-adenine (G- > A) substitutions in proviralDNA and this phenomenon is attributed to the catalytic activity of cellular APOBECs. Population studiesrelating hypermutation and the progression of infection by human immunodeficiency virus type 1 (HIV-1) havebeen performed to elucidate the effect of hypermutation on the natural course of HIV-1 infection. However, themany different approaches employed to assess hypermutation in nucleotide sequences render the comparison ofresults difficult. This study selected 157 treatment-naive patients and sought to correlate the hypermutation levelof the proviral sequences in clinical samples with demographic variables, HIV-1 RNA viral load, and the levelof CD4 + T cells. Nested touchdown polymerase chain reaction (PCR) was performed with specific primers todetect hypermutation in the region of HIV-1 integrase, and the amplified sequences were run in agarose gelswith HA-Yellow. The analysis of gel migration patterns using the k-means clustering method was validated byits agreement with the results obtained with the software Hypermut. Hypermutation was found in 31.2% of theinvestigated samples, and a correlation was observed between higher hypermutation levels and higher viral loadlevels. These findings suggest a high frequency of hypermutation detection in a Brazilian cohort, which canreflect a particular characteristic of this population, but also can result from the method approach by aiming athypermutation-sensitive sites. Furthermore, we found that hypermutation events are pervasive during HIV-1infection as a consequence of high viral replication, reflecting its role during disease progression.
Introduction
Retroviruses characteristically tolerate high mu-tation levels at an estimated rate of 3.4 · 10–5 mutations/
site/generation1,2; however, even minimal increases abovethis tolerated threshold might result in the ‘‘error catastro-phe’’ that, in biological terms, means the genetic collapse ofthese populations.3 Infection by HIV-1 is characterized byhigh turnover, with viral production and elimination esti-mated to be up to 1010 viruses/day4; nevertheless, most suchviral particles are thought to be nonviable.5 Due to its abilityto replicate and suffer mutations excessively and close to theerror threshold, HIV-1 currently remains as a treatable butincurable infection.6
Following their original description, the apolipoprotein BmRNA editing enzyme, catalytic polypeptide 3 family(APOBEC3s) is composed of the first enzymes describedwhose catalytic activity interferes with viral replication by
leading HIV-1 viral populations into an error catastrophe.7
Hypermutation is detected in HIV-1 as a monotonous accu-mulation of guanine-to-adenine (G/A) substitutions alongthe virus genome. In this process, the full extension of thecDNA synthesized by viral reverse transcription undergoesdeamination of its cytidine-to-uridine bases under the actionof cellular APOBEC3s, and while the complementary strandis being synthesized, G/A mutations are fixed in the pre-integrative and the proviral DNA.8 On the other hand, one ofthe functions of the HIV-1 Vif protein is to antagonize theaction of cellular APOBECs, thus hindering their restrictiveeffect.9,10 Vif is a 43-kDa viral protein that is essential forproductive viral infection and that inhibits the action of cel-lular APOBEC3s (A3B, A3DE, A3F, and A3B) by acting asan adaptive molecule that induces the proteasome-mediateddegradation of APOBEC3s.11
In addition, vif counteracts the action of APOBEC3s byinhibiting the packaging of APOBECs into the viral particle
1Federal University of Sao Paulo, Sao Paulo, SP, Brazil.2University of Sao Paulo Medical School, Sao Paulo, SP, Brazil.
AIDS RESEARCH AND HUMAN RETROVIRUSESVolume 30, Number 9, 2014ª Mary Ann Liebert, Inc.DOI: 10.1089/aid.2013.0241
867

or by decreasing the translation of APOBEC3G mRNA.12
Most of the hypermutated genomes were proven to be de-fective.13,14 Studies established that in vif-defective HIV par-ticles, there was a significant restriction of the events of the viralcycle following their entrance and integration into the hostgenome, in addition to the inability of these strains to cause newinfections.10 Evidence indicates that hypermutated viruses arereplication incompetent.14 One study employing real-timepolymerase chain reaction (PCR) quantification found up to a35-fold decrease in the viral infectiveness and a 5- to 7-foldreduction in viral DNA synthesis when HIV DNA was exposedto APOBEC3G in a culture of 293T lymphocytes15 and a recentstudy detected that only a single APOBEC3G molecule is ableto produce inactivating levels of HIV hypermutation, as adiscrete ‘‘all or nothing’’ phenomenon.16 Different from ourfindings, other studies take hypermutation as an event thatgenerates sublethal frequencies of viral diversification, in-cluding antiretroviral resistance mutations.17–19
Also reported was a correlation between the presenceof hypermutated sequences and lower viral load levels,20 orwith higher counts of CD4 + T lymphocytes.21 In addition,an APOBEC3G polymorphism prevalent among AfricanAmericans, namely H186R, was associated with a decline inCD4 + T lymphocytes.22 It has also been demonstrated thathigh viral load set points correlate with lower levels ofAPOBEC3G mRNA expression,23 and that there is an inversecorrelation between HIV-1 plasma viral load and hyper-mutation or APOBEC3G mRNA levels in long-term non-progressors, but not in the noncontroller group.24 Piantadosiet al. (2009),25 however, did not find any correlations be-tween the presence of hypermutation in the viral sequencesand the HIV-1 viral load or the decline in CD4 + T lympho-cytes. Assessments of the levels of mRNA expression haveyielded contradictory results. Cho et al. (2006)26 found lowerlevels of APOBEC3G and 3F mRNA in individuals infectedwith HIV-1 than in noninfected individuals. In turn, the datapublished by Reddy et al. (2010)27 on a population of Africanwomen at high risk for HIV subtype C infection suggestedthat the primary infection by HIV-1 deregulates the expres-sion of APOBEC3G mRNA.
Because the hypermutation of proviral sequences is themost efficient manner of detecting the action of APOBECs,this study sought to assess the frequency of HIV hypermu-tated sequences in proviral DNA of treatment-naive patientsin a Brazilian cohort vis-a-vis levels of viral replication asinferred by HIV viral loads. This study applied a cost re-duced, previously published, and fully validated gel-basedassay to detect hypermutation in HIV sequences.14
In the present study, primers were targeted to short viralgenome sequences in regions that are highly conservedamong the different HIV-1 subtypes28 and that correspondto hypermutation hot spots. Hypermutation hot spots wereaddressed based on previous publications from our groupin which sliding windows scanned HIV-1 genomes search-ing for hypermutation-related mutations, its levels, and itscontexts. Furthermore, our previously published analysisindicated that the HIV-1 integrase gene is frequently a hotspot for hypermutation.29,30 Clones from samples with pre-viously known levels of hypermutation were sequenced andsequences were analyzed by the Hypermut Program (LosAlamos) to access the intensity of hypermutation. The in-tensity of hypermutation according to Hypermut was corre-
lated with gel migration patterns applying the gel-basedmethodology described in Janini et al.14 In this system, hy-permutated sequences are delayed during electrophoresisruns in agarose gels containing HA-Yellow.31
The validation of HA-Yellow migration patterns andthe Hypermut Program output by a statistical clusterizationmethod allowed us to characterize hypermutation based onmigration patterns visualized on HA-Yellow gels. By ap-plying this methodology to treatment-naive patients, hy-permutated sequences were recovered in 31.2% of theirclinical samples. Individuals with hypermutated HIV-1 se-quences exhibited greater viral load levels and a tendencytoward lower CD4 + T lymphocyte counts, thus suggestingthat the amount of hypermutated sequences generated in theviral population appears to depend upon the number of rep-lication events that have occurred in this population.
Materials and Methods
Patient selection
Peripheral blood mononuclear cell (PBMC) samples from157 antiretroviral treatment-naive individuals with chronicHIV infection, with ages above 18 years old and treated at theHIV outpatient clinic of the Federal University of Sao Paulo(UNIFESP), were analyzed. Data were collected on viral load[nucleic acid sequence-based amplification (NASBA)method, bio Merrieux, Marcy-I’Etoile, France], CD4 + lym-phocyte count (fluorescence-activated cell sorting—FACS-Calibur 4-color flow cytometer, BD Biosciences, San Jose,CA), and demographic variables.
DNA extraction and PCR amplification
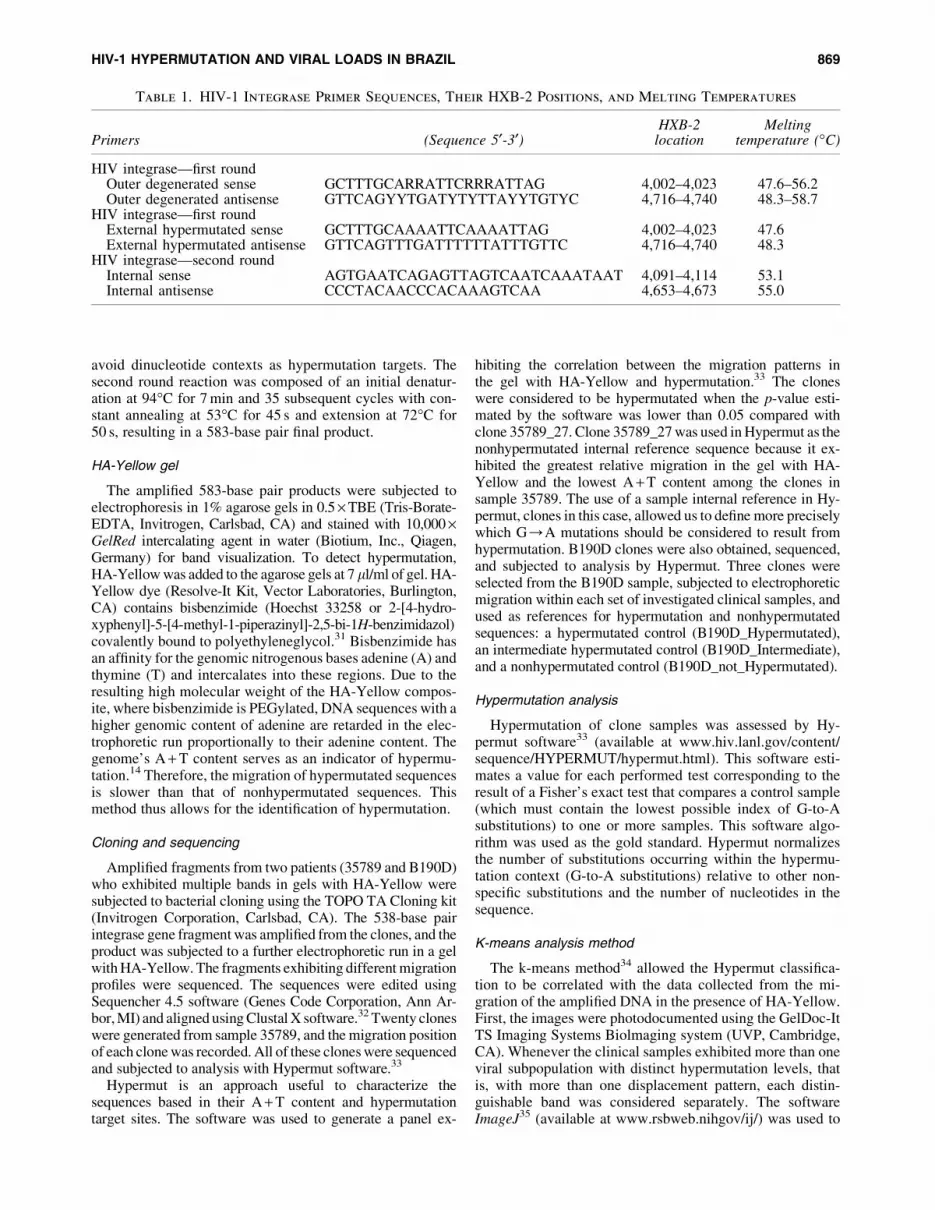
The total DNA of the PBMC samples was extracted us-ing the QIAamp DNA Blood Mini Kit (Qiagen, Hilden,Germany) according to the manufacturer’s instructions.The HIV-1 integrase gene was used as the target of nestedtouchdown PCR. The external primers were designed con-taining degenerated and/or hypermutated sites in the locationswhere hypermutation was expected to increase the sensitivityof hypermutation detection. As shown in Table 1, the de-generated primers contained G-to-A substitutions in certainsites of the component GpA and GpG contexts, whereas thehypermutated primers contained G-to-A substitutions in all ofthe GpA and GpG sites. The first-round reaction included28 mM Tris–HCl (pH 8.3), 70 mM KCl, 4.0 mM MgCl2,0.4 mM dNTPs, and 0.6 pM of a 1:1 mixture of each external(degenerated and hypermutated) primer and 0.025U Ampli-Taq. The first cycle of the first round was composed of aninitial DNA denaturation at 94�C for 7 min, annealing at 49�Cfor 45 s, and extension at 72�C for 55 s. The touchdown ap-proach was used with decreasing annealing temperatures.Starting at 49�C in the first cycle, the annealing temperaturewas decreased by 0.5�C at each successive cycle until itreached 45�C, at which point it was kept constant untilcompleting the 35 reaction cycles.
The resulting product corresponded to a 782-base pairfragment of the integrase gene. The second round employed5.0 ll of the PCR product amplified in the first round in areaction including 28 mM Tris–HCl (pH 8.3), 70 mM KCl,3.5 mM MgCl2, 0.4 mM dNTPs, and 0.6 pM of each internalprimer. The primers for the second round were designed to
868 DE LIMA-STEIN ET AL.
avoid dinucleotide contexts as hypermutation targets. Thesecond round reaction was composed of an initial denatur-ation at 94�C for 7 min and 35 subsequent cycles with con-stant annealing at 53�C for 45 s and extension at 72�C for50 s, resulting in a 583-base pair final product.
HA-Yellow gel
The amplified 583-base pair products were subjected toelectrophoresis in 1% agarose gels in 0.5 · TBE (Tris-Borate-EDTA, Invitrogen, Carlsbad, CA) and stained with 10,000 ·GelRed intercalating agent in water (Biotium, Inc., Qiagen,Germany) for band visualization. To detect hypermutation,HA-Yellow was added to the agarose gels at 7 ll/ml of gel. HA-Yellow dye (Resolve-It Kit, Vector Laboratories, Burlington,CA) contains bisbenzimide (Hoechst 33258 or 2-[4-hydro-xyphenyl]-5-[4-methyl-1-piperazinyl]-2,5-bi-1H-benzimidazol)covalently bound to polyethyleneglycol.31 Bisbenzimide hasan affinity for the genomic nitrogenous bases adenine (A) andthymine (T) and intercalates into these regions. Due to theresulting high molecular weight of the HA-Yellow compos-ite, where bisbenzimide is PEGylated, DNA sequences with ahigher genomic content of adenine are retarded in the elec-trophoretic run proportionally to their adenine content. Thegenome’s A + T content serves as an indicator of hypermu-tation.14 Therefore, the migration of hypermutated sequencesis slower than that of nonhypermutated sequences. Thismethod thus allows for the identification of hypermutation.
Cloning and sequencing
Amplified fragments from two patients (35789 and B190D)who exhibited multiple bands in gels with HA-Yellow weresubjected to bacterial cloning using the TOPO TA Cloning kit(Invitrogen Corporation, Carlsbad, CA). The 538-base pairintegrase gene fragment was amplified from the clones, and theproduct was subjected to a further electrophoretic run in a gelwith HA-Yellow. The fragments exhibiting different migrationprofiles were sequenced. The sequences were edited usingSequencher 4.5 software (Genes Code Corporation, Ann Ar-bor, MI) and aligned using Clustal X software.32 Twenty cloneswere generated from sample 35789, and the migration positionof each clone was recorded. All of these clones were sequencedand subjected to analysis with Hypermut software.33
Hypermut is an approach useful to characterize thesequences based in their A + T content and hypermutationtarget sites. The software was used to generate a panel ex-
hibiting the correlation between the migration patterns inthe gel with HA-Yellow and hypermutation.33 The cloneswere considered to be hypermutated when the p-value esti-mated by the software was lower than 0.05 compared withclone 35789_27. Clone 35789_27 was used in Hypermut as thenonhypermutated internal reference sequence because it ex-hibited the greatest relative migration in the gel with HA-Yellow and the lowest A + T content among the clones insample 35789. The use of a sample internal reference in Hy-permut, clones in this case, allowed us to define more preciselywhich G/A mutations should be considered to result fromhypermutation. B190D clones were also obtained, sequenced,and subjected to analysis by Hypermut. Three clones wereselected from the B190D sample, subjected to electrophoreticmigration within each set of investigated clinical samples, andused as references for hypermutation and nonhypermutatedsequences: a hypermutated control (B190D_Hypermutated),an intermediate hypermutated control (B190D_Intermediate),and a nonhypermutated control (B190D_not_Hypermutated).
Hypermutation analysis
Hypermutation of clone samples was assessed by Hy-permut software33 (available at www.hiv.lanl.gov/content/sequence/HYPERMUT/hypermut.html). This software esti-mates a value for each performed test corresponding to theresult of a Fisher’s exact test that compares a control sample(which must contain the lowest possible index of G-to-Asubstitutions) to one or more samples. This software algo-rithm was used as the gold standard. Hypermut normalizesthe number of substitutions occurring within the hypermu-tation context (G-to-A substitutions) relative to other non-specific substitutions and the number of nucleotides in thesequence.
K-means analysis method
The k-means method34 allowed the Hypermut classifica-tion to be correlated with the data collected from the mi-gration of the amplified DNA in the presence of HA-Yellow.First, the images were photodocumented using the GelDoc-ItTS Imaging Systems Biolmaging system (UVP, Cambridge,CA). Whenever the clinical samples exhibited more than oneviral subpopulation with distinct hypermutation levels, thatis, with more than one displacement pattern, each distin-guishable band was considered separately. The softwareImageJ35 (available at www.rsbweb.nihgov/ij/) was used to
Table 1. HIV-1 Integrase Primer Sequences, Their HXB-2 Positions, and Melting Temperatures
Primers (Sequence 5¢-3¢)HXB-2
locationMelting
temperature (�C)
HIV integrase—first roundOuter degenerated sense GCTTTGCARRATTCRRRATTAG 4,002–4,023 47.6–56.2Outer degenerated antisense GTTCAGYYTGATYTYTTAYYTGTYC 4,716–4,740 48.3–58.7
HIV integrase—first roundExternal hypermutated sense GCTTTGCAAAATTCAAAATTAG 4,002–4,023 47.6External hypermutated antisense GTTCAGTTTGATTTTTTATTTGTTC 4,716–4,740 48.3
HIV integrase—second roundInternal sense AGTGAATCAGAGTTAGTCAATCAAATAAT 4,091–4,114 53.1Internal antisense CCCTACAACCCACAAAGTCAA 4,653–4,673 55.0
HIV-1 HYPERMUTATION AND VIRAL LOADS IN BRAZIL 869

measure the distances, in pixels, among the highest light-intensity peaks on each sample. Given that each light-intensitypeak corresponds to the highest DNA concentration of theamplified product, the distance between it and the point ofsample application measures its displacement in the electro-phoresis gel. Hence, the hypermutation analysis was turnedinto a mathematical problem of clustering sets of Euclideandistances. Furthermore, each gel had its internal controls, be-cause electrophoresis conditions may be influenced by tem-perature, agarose percentage, and other factors.
There are a number of different clustering methods, eachone working better with a different set of data. Our problem isnew and we have no previous information on the statisticalbehavior of our variables, so we opted for the method with theminimum set of assumptions. The k-means method34 fits verywell, with only two acceptable assumptions: independenceof observations and normal distribution of the residualsand errors. The idea behind the method is very simple: foreach gel, suppose that its n biological sample displacementsare partitioned in k clusters fS1, S2, . . . , Skg(k � n). Then,among all possible sets of k clusters, look for the one thatminimizes the within-cluster sum of squares.
WCSS¼ +k
i¼ 1
+xj2Si
(xj�li)2
where mi is the mean of points in Si.It is worth noting that the k-means method, widely used in
signal processing, presents two strong drawbacks: first, thereis no prescription on how to choose the number k of clusters;second, there is no efficient algorithm to calculate the mini-mum of the sum of squares (it is an NP-hard computationalproblem). Nevertheless, those drawbacks do not apply in thepresent analysis. First, we look for exactly two clusters (hy-permutated or nonhypermutated) and we do know one ref-erence member in each cluster. These are the hypermutatedand normal controls, respectively. Second, as our set of pointsis small, we can solve the problem by hand, using spreadsheetsoftware. We started the clustering analysis ordering the el-ements by displacement size, attributing the two largest onesto the hypermutation cluster and the others to the normalcluster. In the next steps, we moved the next larger displace-ment value from the normal to the hypermutation cluster andcontinued to do so until we had two elements in the normalcluster. Then we test for the statistical significance of theminimum within-cluster sum of squares. The k-means clus-tering method is a type of ANOVA, with the different groupscharacterized first, and then each element is analyzed to de-termine the group to which it belongs. To classify the samplesas hypermutated, the maximum likelihood method was adop-ted to avoid false-positive results. There are a number of sta-tistical software packages that implement k-means calculation.In particular, the R statistical package (www.r-project.org) hasa k-means library that implements a variety of algorithmssuitable to solve additional related problems.
Quantification of proviral loads and number of cellsin the analyzed clinical samples
HIV proviral loads were measured by qPCR using theHIV-1 integrase gene as the target and the human CCR5 geneas the normalizer. We extrapolated copy numbers from
standard curves generated with plasmids harboring the CCR5and the HIV integrase gene sequences, as described bySharkey et al. (2000) and Komninakis et al. (2012).36,37
Briefly, the reaction mixture consisted of 20 ll of Gene ex-pression master mix (Life Technologies, Carlsbad, CA, andUSA Applied Biosystems, Coutabouef, France) 2 · , 0.75 lMof each oligonucleotide, 0.3 lM of each probe, 5 ll of sample,and DNase RNase-free water q.s.p. 20 ll. Sequences ofprimers and probes and cycling conditions are available at theabove mentioned citations.
Detection of hypermutation in clinical samples
After the samples were classified as hypermutated or notby electrophoretic runs in gels with HA-Yellow and validatedby the k-means method, the mean, median, and quartiles ofthe viral load indexes were calculated in the hypermutatedand nonhypermutated sample groups. These indexes werecompared using Sigma Stat 4 software with a significancelevel of p < 0.05. Characteristics such as sex and CD4 + T cellcount were also assessed.
Results
Analysis of hypermutation using a gel-based approachwith HA-Yellow dye has already been fully validated beforewith protease sequences. In this context, protease clone se-quences with an increasing number of G/A substitutionswere subjected to electrophoretic runs in agarose gels withHA-Yellow dye in order to determine HA-Yellow’s sensi-tivity and specificity.14 By the application of this methodol-ogy, two patients exhibiting fragments with differenthypermutation levels were selected. The amplified sequencesfrom patients 35789 and B190D were subjected to bacterialcloning and then sequenced. A total of 20 clones from patient35789 and three clones from patient B190D (B190D_Hypermutated, B190D_Intermediate, and B190D_not_Hypermutated) were sequenced. Each clone was assessed inan agarose gel with HA-Yellow (Fig. 1) to characterize itshypermutation level.
This study considered the classification of hypermutationsupplied by Hypermut as the standard to define hypermuta-tion. Samples exhibiting a p < 0.05 in the above mentionedtest were considered to be hypermutated (Table 2). The
FIG. 1. The assessment of migration profiles in an agarosegel with HA-Yellow of the clones generated from patient35789 and the hypermutation controls from patient B190D.
870 DE LIMA-STEIN ET AL.

Hypermut results were correlated with the results of themigration of the amplified fragments in agarose gels withHA-Yellow through a k-means clustering analysis. Thiscorrelation made it possible to determine which patterns ofmigration in the gel might be associated with hypermutatedsamples. Table 2 shows a panel with the values obtained fromthe Hypermut analysis of the clones from patients 35789 andB190D. Clone 35789_27 of sample 35789 was used as anintrinsic nonhypermutated control in the Hypermut analysisbecause it exhibited the longest displacement among all ofthe clones in the gel with HA-Yellow and the lowest A + Tcontent. The number of G/A substitutions is described inthe column #G/A. p-values lower than 0.05 indicate thatthe sequences were considered to be hypermutated comparedwith the control 35789_27. These values are shown in theFisher exact p-value column. The right-most columns, titled‘‘Dinucleotide Context,’’ describe the number of G/Asubstitutions occurring in every possible dinucleotide (GpG,GpA, GpC, and GpT). Mutations typical of hypermutationand random mutations were observed throughout thesequences.
Analyzing the images of the gels with HA-Yellow usingImageJ software made it possible to measure the position ofeach sequence in the gel from the origin of the electrophoreticrun to the point with the highest luminosity. The point withthe highest luminosity corresponds to the region with thehighest DNA concentration in the sample and represents thefinal position of the sequence in the gel for analysis.
Figure 2 indicates how the position of each sample wasidentified in the gel. Twelve clinical samples and the previ-ously sequenced patient B190D controls containing knownhypermutation levels are represented on the left side of Fig. 2after an electrophoresis run on a gel containing HA-Yellow.
The samples that displaced a shorter distance from the pointof origin (samples 03, 07, 09, 11, and 12 and the hypermu-tated control) exhibit the highest hypermutation levels. Thegraphs on the right side show the migration position (ab-scissa) and intensity (ordinate) of the samples. The depres-sions in the panel correspond to the regions with maximalluminosity. In the graphs, a greater shift of the depressions tothe left means a shorter migration of the samples in the geland, thus, a higher A + T content and hypermutation level.
To validate the k-means technique associated with the HA-Yellow gels, the hypermutated and nonhypermutated con-trols of sample B190D were used. Thus, it was possible toclassify each clone of patient 35789 as either correspondingto the migration pattern of the hypermutated or the non-hypermutated sequences (see Fig. 5). For all of the clonesassessed, there was a correlation between Hypermut analysisand the k-means method except for clone 35789_35, whichwas rated as hypermutated in Hypermut ( p = 2.40E-03) andborderline by the k-means method (see Fig. 5). However, wesuccessfully validated the correlation between both methodsby linear regression, where R2 = 0.98 (data not shown).
After a satisfactory correlation was established betweenthe data from the electrophoretic migration in the gels withHA-Yellow and the k-means clustering and the results of thesame 23 cloned sequences in Hypermut, we processed theclinical samples and correlated the results with the associateddata.
Each set of clinical samples was PCR amplified and sub-jected to electrophoretic runs together with the three controlclones from sample B190D (Fig. 3). The electrophoretic runsin agarose gels with HA-Yellow samples were then classifiedas hypermutated or nonhypermutated by the k-means method.Clinical samples were not subjected to sequencing or
Table 2. Sequence Characteristics Description of 35789 and B190D Clones
According to Hypermut Parameters
Dinucleotide context
SequenceFisher exact
p-value #G/A GG GA GC GT
35789_01 0.959167 5 1 1 1 235789_02 0.860379 7 2 1 2 135789_04 5.12E-14 60 21 35 1 235789_05 0.71822 7 3 3 0 135789_06 0.591371 7 3 2 0 135789_08 0.262761 6 2 2 1 135789_09 0.703421 7 2 2 1 235789_10 2.05E-06 34 21 11 0 135789_13 0.202824 18 9 6 0 235789_15 0.71822 7 3 3 0 135789_17 5.12E-14 60 21 35 1 235789_21 2.57E-06 26 18 5 0 235789_25 0.635934 4 1 2 0 135789_26 3.82E-05 28 15 10 1 135789_28 1.07E-14 61 22 35 1 235789_30 0.591371 6 2 2 1 135789_31 0.707485 2 1 1 0 035789_33 4.04E-15 60 22 35 1 135789_35 1.69E-06 26 18 5 0 2B190D_NOT_HYPERMUTATED 0.542087 9 2 3 1 2B190D_INTERMEDIATE 0.800222 9 2 2 2 2B190D_HYPERMUTATED 1.47E-17 58 21 30 1 6
HIV-1 HYPERMUTATION AND VIRAL LOADS IN BRAZIL 871

Hypermut software because we were able to validate our studybased on HA-Yellow gels and the k-means clusterizationmethod. As shown in Fig. 3, this method identified hypermu-tation in samples 27, 28, 29, 31, and 33. Figure 3 also shows thedifferent hypermutation levels in samples 27, 31, and 34. Thesamples rated as borderline in the k-means classification wereclassified as nonhypermutated to avoid false-positive resultssince Hypermut was considered the gold standard.
Hypermutation was detected in 49/157 (*31.2%) of theinvestigated samples, from which 29/157 (18.5%) exhibitedmore than one viral population with different hypermutationlevels. Supplementary Table S1 (Supplementary Data areavailable online at www.liebertpub.com/aid) presents the
demographic and clinical data of the patients and Supple-mentary Figs S1, S2, and S3 assess the HA-Yellow-basedapproach for all clinical samples. As mentioned above,samples classified as ‘‘borderline’’ by the k-means methodwere considered nonhypermutated.
To investigate whether detection of hypermutation couldbe associated with proviral load values and number of cellspresent in each clinical sample, we quantified proviral loadsby qPCR from the studied samples. We addressed the HIV-1integrase gene as target and the human CCR5 gene as nor-malizer. We extrapolated copy numbers from standard curvesgenerated with plasmids harboring the CCR5 and the HIV-1integrase gene sequences. We were able to analyze 118(75%) of the total number of samples, with 58 classified ashypermutated and 60 without hypermutation according toHA-Yellow gel/k-means analysis. Mean values for sampleswith and without hypermutation detection were 303.66(minimum value = 74.3 – maximum value = 533) · 106 cellsand 295.38 (minimum value = 117.3 – maximum value =473.4) · 106 cells, respectively. We did not find differenceswith statistical significance when proviral load values fromsamples with hypermutation and from samples without hy-permutation were compared. t-test and ANOVA generatedvalues of p = 0.8404 and p = 0.955, respectively.
The full case series was composed of 70 females (44.6%)and 87 males (55.4%); hypermutation was detected in 18/87(20.7%) of the males and in 31/70 (44.3%) of the females, andit was more frequent in the females (Chi-squared test,p = 0.003). The mean viral load of the patients was 214,279(standard deviation 378,583) copies/ml, and the median was41,400 copies/ml. The detection of hypermutation was higherin patients with higher viral load levels (Mann–Whitney test,p = 0.035) (Fig. 4 and Supplementary Table S1).
The overall case series mean of the CD4 + T-lymphocytecount was 366 (standard deviation 279) cells/mm3. In patients
FIG. 3. An agarose gel with HA-Yellow illustrating theresults of clinical samples 26 to 36. The arrow indicates asample with viral subpopulations exhibiting different hy-permutation levels.
FIG. 2. The measurementof the position of each se-quence in the gel. Equal ref-erence regions representedby the boxes were defined foreach sequence using ImageJ.A graph was generated foreach sample migration dis-tance from the origin in theabscissa and the intensity ofthe light signal in the ordinate.
872 DE LIMA-STEIN ET AL.

with samples exhibiting hypermutation, the mean of the T cellcount was 308 (standard deviation 256) cells/mm3, and themedian was 208 cells/mm3; in samples in which hypermuta-tion was not detected, the mean number of CD4 + T lympho-cytes was 393 (standard deviation 285) cells/mm3, and themedian was 347 cells/mm3. The patients with higher hy-permutation levels also exhibited lower mean and medianCD4 + T-lymphocyte counts; however, this difference was notstatistically significant (Fisher’s test, p = 0.068).
Quantitative analysis
The mean viral load was higher in the patients with hy-permutation (Mann–Whitney, p = 0.023). An HIV-1 viralload above 100,000 RNA copies/ml relates to a faster pro-gression to AIDS.38 In our case series, patients were dividedinto two groups for analysis, based on viral load values higheror lower than 100,000 RNA copies/ml. A total of 100 patientsexhibited serum viral load values lower than 100,000 RNAcopies/ml, 23% of which exhibited virus with hypermutation;53 patients exhibited a viral load higher than 100,000 RNAcopies/ml, 46.3% of which exhibited virus with hypermuta-tion. The frequency of hypermutation detection was higher inthe patients with higher viral load levels (Mann–Whitneytest, p = 0.007). When we compare patients with or withouthypermutation detection and their respective viral loads, acorrelation was found between higher viral loads and hy-permutation detection (Mann–Whitney test, p = 0.035) (Fig. 4).
In summary, out of a total of 157 investigated patients,hypermutation was detected in 49 (*31%). Females ex-hibited a higher frequency of hypermutation compared withmales (Chi-square, p = 0.003). A quantitative analysis re-vealed that the patients with samples in which hypermutationwas detected exhibited higher viral load levels (Mann–Whitney test, p = 0.035) and a nonsignificant tendency to-ward lower CD4 + T-lymphocyte counts.
Discussion
This study was the first to assess hypermutation frequencyin a Brazilian naive cohort. A method for hypermutationstudy was formulated to detect G-to-A substitutions in targetsites and allowed k-means clustering analysis of electro-
phoretic runs in HA-Yellow gels. The high sensitivity andspecificity of hypermutation detection in the sequences weredue to selection of a hypermutation hot spot (viral integrasegene),39 the touchdown approach, and the high magnesiumconcentration (4.0 mM) in the first round of nested PCR.Experimental standardization showed that higher magnesiumchloride concentrations increase the detection of hypermu-tated sequences.
To validate the method, two clinical samples, B190D and35789, were selected to be cloned and sequenced becausethey exhibited viral subpopulations with different hypermu-tation levels (Fig. 1). The clone sequences were subjected toHypermut and tested with agarose gels with HA-Yellow dye.The results thus obtained with HA-Yellow gel were corre-lated with the results of the classification supplied by theHypermut software (Fig. 5). Through the use of the k-meansmethod, the displacement of the PCR-amplified sequences inthe gel with HA-Yellow was perfectly correlated with theclassification supplied by the Hypermut software, thus vali-dating systematically the application of this approach to thedetection of hypermutation in clinical samples using gelswith HA-Yellow. The k-means classification system sup-plied a robust, reproducible, and rapid method of detectinghypermutation, which is less expensive than sequencing,and thus allowed for the assessment of a larger number ofsamples.
The results were correlated with the data of the corre-sponding population (Tables 3 and 4 and SupplementaryTable S1). By applying this method to 157 investigated pa-tients, HIV-1 hypermutation was detected in 49 individuals(*31%). Hypermutation detection was higher in femalesthan in males (Chi-Square, p = 0.003). The patients withsamples in which hypermutation of viral sequences was de-tected exhibited higher viral load levels (Mann–Whitney test,p = 0.007).
Hypermut detects A/G substitutions within the GpG andGpA contexts of a subgenomic sequence when comparedwith a control sequence. The proper manner of obtainingclassifications in this software is by setting the least hy-permutated sample as the control sample, which, as a rule, isthe one with the lowest A + T content in the investigated set.When this rule is not observed, errors in classification occur.
FIG. 4. Statistical analysis com-paring the viral load in patientswith or without hypermutation. Itwas performed with the Mann–Whitney test, p = 0.035.
HIV-1 HYPERMUTATION AND VIRAL LOADS IN BRAZIL 873

The software itself recommends carefully choosing the ref-erence sequence. With regard to the process of the naturaldiversification of HIV-1, G/A transitions are the mostcommonly found,40 and although they might occur within theGpG and GpA hypermutation contexts, it is not possible torule out that these transitions might occur independently ofthis phenomenon. Thus, it is not impossible for Hypermut,when assessing unrelated viral sequences, to count G/Atransitions in HIV-1 natural diversification as typical hy-permutation substitutions. Therefore, one approach to mini-mizing this error is to sequence clones of the same patientthat exhibit different patterns of migration in a gel, that is,different hypermutation levels revealed by a gel with HA-Yellow.
The two samples in this study, namely 35789 and B190D,exhibited multiple bands in gels with HA-Yellow, indicatingdifferent hypermutation levels in the viral populations, andthus they were cloned (Fig. 1), sequenced, and analyzed usingHypermut software (Table 2). The generation of clones al-lowed for the identification of a less hypermutated sequenceor a sequence without hypermutation, which was used asthe sample internal reference. The use of sequences from asample primarily distinguished for exhibiting different hy-permutation levels allows for the minimization of the effectthat other substitutions might have on the calculation of hy-permutation-specific mutations performed by Hypermutsoftware. Hypermutation is not an erratic process, and it ischaracterized by a specific accumulation of G-to-A substi-tutions in a definite context and should not be confoundedwith the mutational background of a virus such as HIV-1,
which replicates under the influence of a highly diversifyingforce.
As mentioned above, a direct comparison of the resultsreported by different studies is often not possible, due to theuse of different criteria to analyze sequences and discriminatehypermutation. Thus, this difference in criteria influences theresults and conclusions of each study. Hypermut is used asthe gold standard for hypermutation classification in a largeportion of studies; however, the results generated by this al-gorithm depend essentially on the reference sequence againstwhich all of the other sequences are compared. The studyby Piantadosi et al. (2009),25 which found the highest hy-permutation frequency reported in the literature up to thepresent time, used a software-produced sequence known as‘‘most recent common ancestor’’ (MRCA) as its referencesequence. Although obtained from actual sequences, MCRA isa virtual sequence. Furthermore, most hypermutated genomesare not viable and cannot replicate yielding no descendants.
The use of MRCAs to gauge hypermutation does not seemto be the best approach. The study by Wei et al. (2004)41 usedHXB-2 as a reference sequence. Despite being widely knownand used, in our opinion, this sequence also fails to providethe most appropriate standard for the investigation of hy-permutation in Hypermut since the use of nonrelated refer-ence sequences that are not essentially related to theinvestigated sequences might underestimate or overestimatethe occurrence of hypermutation. Other studies used algo-rithms other than Hypermut to classify the samples. Thestudies by Pace et al. (2006) and Ulenga et al. (2008)20,23
estimated hypermutation based on a statistical analysis that,
FIG. 5. Comparison betweenthe results generated by the Hy-permut software and k-meansmethod of classification for clones35789 and BD190D.
Table 3. Populational Data and Percentage of Hypermutation in the Studied Population
Sex Female: 70 (44.6%)Male: 87 (55.4%)
Viral load Mean: 214,270 – 378,583 Maximum: 1,980,000 Normal distribution p = 0.02Median: 41,400 Minimum: 80 Kolmogorov–Smirnov
CD4 Mean: 366 – 279 Maximum: 1,437 Normal distribution p = 0.054Median: 328 Minimum: 2 Kolmogorov–Smirnov
Hypermutated sample Yes: 49 (31.2%)No: 108 (68.7%)
874 DE LIMA-STEIN ET AL.

similarly to Hypermut, took into account the number of nu-cleotides in the sequence, the number of G/A mutationswithin the hypermutation context (GpG and GpA), thenumber of occurrences of the second most prevalent mutationin the HIV-1 genome (A/G), and the total number of ran-dom mutations related to the reference sequence. Our studyselected the sequence with the lowest A + T content as thehypermutation reference and classified samples only aftervalidating the correlation between the migration distance of aPCR product in a gel with HA-Yellow and the Hypermut goldstandard algorithm.
The detection method used to locate hypermutated se-quences might or might not favor the detection of this type ofsequence. The method used in at least two studies mentionedabove [Pace et al (2006). and Ulenga et al. (2008)20,23] wassequencing; however, the detection of minority populationsrequires a specific approach, such as cloning. In this sense,the study by Kieffer et al. (2005)42 sought to assess not onlythe majority but also the minority sequences by sequencingthe clones obtained by serial dilution and reported that hy-permutation was detected in approximately 9–10% of thetotal number of proviral particles present in a patient and thatthis same phenomenon was not detected at the level of viralRNA.
Finally, the threshold defining whether a sequence is hy-permutated or not also influences the counting of hypermu-tated sequences. The study by Land et al. (2008)21 consideredthe presence of stop codons in proviral sequences as a markerof hypermutation and did not take into account that stopcodons could have been caused by random mutations and thatsometimes hypermutation might not result in stop codons butrestrict viral replication by other means.
For the present study, we chose to validate the presence ofhypermutation based on real sequences obtained from clonesof a single patient. Thus, we could subtract the substitutionspresent in the mutational background of HIV-1 more effi-ciently and consider only G/A substitutions within thehypermutation context in the assessment of samples with ahigher degree of accuracy. Thus, the total correlation be-tween the displacement of a sample in an agarose gel withHA-Yellow and the results obtained with the software Hy-permut according to the maximum likelihood method in k-means clustering allowed for the validation of a displacementpattern in an agarose gel with HA-Yellow, distinguishingbetween hypermutated and nonhypermutated samples (Fig.1). The samples classified as ‘‘borderline’’ by the k-meansmethod were counted as nonhypermutated to avoid false-positive results. If, instead of the maximum likelihoodmethod, classic considerations were used in the k-means
variance analysis ( p < 0.01), the number of samples classifiedas hypermutated would be even higher (52.2%).
The ability of HA-Yellow to detect hypermutation is due toits ability to retard sequences proportionally to their A + Tcontent. Clinical samples of patients who were treated ornontreated, progressing or nonprogressing, and receiving ornot receiving antiretroviral therapy in which hypermutationwas detected exhibited substitutions in the specific GpG orGpA contexts described17,43–47 and, consequently, an in-creased A + T content in their sequences. In contrast to Hy-permut, which selectively discriminates GpG and GpAcontexts that are hypermutation targets, HA-Yellow is notselective for hypermutation and might also bind to nonspe-cific A + T sites. However, no other biological process forincreasing the viral A + T content is known other than hy-permutation, and for this reason, HA-Yellow can be used todetect hypermutation. In this sense, an important goal of thisstudy was to develop a method that, once validated, no longerrequires the sequencing of samples but uses the displacementof sequences in gels to detect hypermutation. Thus, we founda perfectly applicable correlation between two differentmethods, namely, sequencing and gels with HA-Yellowfollowed by k-means clusterization.
The k-means method defined a threshold that allowed sam-ples to be classified as hypermutated or nonhypermutated. Incontrast, no threshold in the number of G/A substitutions wasever defined to establish the minimum number of substitutionsrequired to classify a sample as hypermutated. Different regionsof the HIV-1 genome are known to exhibit a differential sus-ceptibility to hypermutation. Polypurine tracts, for instance, donot suffer hypermutation, whereas viral negative factor (nef)and integrase genes are hypermutation hot spots.29,30,48,49 Hy-permut itself takes into account characteristics of sequences,such as size, G/A substitutions within the hypermutationcontext, and the number of guanine bases in the sequence,among others, to infer a p-value based on Fisher’s exact test thatestimates the probability that a sequence is hypermutated. Forinstance, if the polypurine tract of a hypermutated sequence wasto be subjected to Hypermut analysis because the hypermutationlevels tend to be zero in this genomic region, hypermutationwould not be detected. Therefore, it is critically important toestablish a threshold, and the threshold should be linked to theparticular genomic region under investigation.
Concerning the biological and experimental significanceof samples that cannot be easily classified as either hy-permutated or nonhypermutated, in the present study, thesesamples corresponded to the clones and samples classified as‘‘borderline’’ by the k-means method (Fig. 5). As mentionedabove, we considered the clones and samples classified as
Table 4. Comparative Data of the Studied Population Based on Detection of Hypermutation
Sex Viral load CD4
Patients with hypermutation Males Mean Mean18 (36.74%) 285,782 – 437,662 308 – 256Females Median Median31 (63.26%) 110,000 208
Patients without hypermutation Males Mean Mean56 (51.9%) 181,825 – 343,618 393 – 285Females Median Median52 (48.1%) 30,550 347
HIV-1 HYPERMUTATION AND VIRAL LOADS IN BRAZIL 875

‘‘borderline’’ by the k-means method as nonhypermutated.Thus, upon observing the ‘‘borderline’’ sequences, we maynot rule out the hypothesis that these samples represent viralpopulations that suffered partial hypermutation but stillsuccessfully integrated into the host genome.
As shown in Fig. 5, with the sole exception of clone35789_35, all of the clones considered being hypermutatedin the Hypermut analysis ( p < 0.05) received the sameclassification by the k-means method. This graph furthershows that clone 35789_35 exhibits a vertical drag inelectrophoresis, and thus we may not rule out that the dragmight have placed the highest luminosity point in the regioncorresponding to the nonhypermutated samples. Therefore,we may not dismiss the hypothesis that analysis by the k-means method classified hypermutated clinical samples as‘‘borderline’’ and, consequently, gave false-negative re-sults. Considering the frequency of differences between theclassifications supplied by both methods as 1/20 (5%), if thisdifference were extended to the clinical samples, we wouldhave detected hypermutation in up to 37% of the investi-gated population. However, the fact that the k-meansmethod did not detect hypermutation in one sample does notdiminish the reliability of the analysis, whose error is ap-proximately 5%; consequently, this method of classificationis valid.
The present study sought to assess the impact that hy-permutation might have on the replicative ability of HIVin vivo as inferred by the patients’ viral loads. For this reason,157 samples were selected from an antiretroviral treatment-naive population. Because the HIV-1 integrase region is ex-tremely conserved among the several viral subtypes and it isa hypermutation hot spot, it was selected to sort the hy-permutation levels of samples.39,50 We chose a hypermuta-tion hotspot as reporter in order to increase our power ofdetection, allowing us to identify hypermutation even in lessrepresented sequences in viral populations. Because eachsample was treated equally and hypermutation controls werepresent in each electrophoresis run our method could reallydifferentiate samples according to their hypermutation status.
The presence of HIV-1 hypermutated sequences was de-tected in 31.2% of the analyzed samples. This value is thesecond highest frequency reported in the literature, followingonly that of Piantadosi et al. (2009),25 who used MRCA as areference sequence. The use of MRCA further assumes anancestry relationship between it and the assessed samplesequence. This notion assumes the existence of generationsbetween MRCA and the hypermutated sequence. However,hypermutation is not a process of gradual and generationalaccumulation of G/A substitutions but an abrupt processresulting in nonviable viral particles that have lost theirreplicative ability.
If, instead of using the maximum likelihood method, wehad used p < 0.01 in this study, which is statistically accept-able, we would have encountered a higher frequency of thisphenomenon (82/157, corresponding to 52.2%). To avoidfalse-positive results, we chose a more stringent classificationaccording to Hypermut; however, due to the likelihoodmethod, we observed once our sample 35789_35 was con-sidered hypermutated based on k-means displacementmethod and not hypermutated according to Hypermut. So, wecannot rule out the possibility that we have underestimatedthe true number of hypermutated samples.
Other studies suggested that not all of the hypermutatedvariants are able to integrate into the host genome. Cellenzymes known as DNA glycosylases (e.g., UNG andSMUGs)48 are associated with the degradation of uracylatedviral cDNA, although this mechanism has not yet been fullyelucidated. If, indeed, the effect of these cell DNA repairenzymes is effective, our findings represent a further indi-cation of the fact that the frequency of hypermutation trace-able by detection methods based on viral DNA mightbe lower than the frequency occurring in the intracellularenvironment.
Because different values of proviral loads could have animpact on the detection of hypermutated sequences, we ranqPCR analysis to measure proviral loads in our clinicalsamples. We could not find statistical significant differencesbetween proviral loads in hypermutated and nonhyper-mutated samples, meaning that identification of hypermuta-tion was not biased in our study on the size of the proviralcompartment. Due to the difficulty in establishing straightcorrelations between viral and proviral loads as a result of thedifferential kinetics of each compartment, we could notspeculate about the comparison between these values in ourclinical samples.
The method described in this study allowed for the de-tection of a high number of samples exhibiting hypermuta-tion of the viral sequences (31.2% of our target population).To date, there are no other systematic studies on the Brazilianpopulation surveying the prevalence of hypermutation inthis country. We suspect that although the Brazilian targetpopulation is genetically quite diversified and might exhibitunique characteristics compared with other and more ho-mogeneous populations with different ethnoracial composi-tions, the sensitivity of the detection method was possiblycritical for the high prevalence of hypermutation found,which, in fact, was higher than that found by most stud-ies.14,20,22 Nevertheless, we may not rule out that the fre-quency of hypermutation in the Brazilian population mightbe higher than in other populations that have already beeninvestigated.
A study by An et al. (2004)22 showed that the H186Rpolymorphism in African Americans is related to fasterprogression to AIDS. Based on that finding, it is possible tosuggest that classification by skin color should represent afactor in the assessment of hypermutation effects among thedifferent Brazilian racial types, especially when the signifi-cance of miscegenation in this country is taken into account.Nevertheless, the factor ‘‘skin color’’ is not believed to be themost accurate attribute to characterize the ethnic origin of thepatients in this study because, particularly in Brazil, skincolor is not a good predictor of genomic ancestry.51 Althoughwe did not find an apparent correlation between any ethnicgroup and the frequency of hypermutation, more specificstudies are needed to establish the prevalence of this poly-morphism in Brazil and its influence on this country’s pop-ulation regarding progression to AIDS.
The only study performed in Brazil searched for A3Gpolymorphisms among the Brazilian population among an-tiretroviral-naive HIV-1-infected patients. That study de-tected one polymorphism, namely rs5757463, which in G/Ghomozygosis or C/G heterozygosis is associated with lowerCD4 levels compared with allele C/C carriers.52 Another im-portant factor is the method chosen to select the hypermutated
876 DE LIMA-STEIN ET AL.

sequences. In studies using sequencing as the method of se-lection, because it is not the best approach to detect minoritypopulations,53 the sequences these studies considered to behypermutated were possibly also the most represented se-quences in the sample. These studies actually assessed the viralload levels of patients in whom the majority of sequencesexhibited hypermutation. Regarding the difference betweenthe present study and other studies, the method we employedassessed short sequences using primers targeted to hypermu-tated sites to detect hypermutation even when present in fewsequences of the viral population. This difference is one of thereasons that we found a high number of hypermutated samples.A further issue concerns the HIV-1 genomic region subjectedto analysis. We chose integrase because it is extremely con-served among the different viral strains and is a hypermutationhot spot. Regarding the possible occurrence of hypermutationin both majority and minority viral populations, our studydesign allowed for the tracing of short sequences of the viralgenome known to be hypermutation targets,39 and there was noneed to assess the full genome because the amplification ofintegrase sufficed to trace hypermutation. Therefore, we em-ployed a PCR specifically modified to ensure high sensitivityand specificity for hypermutated sequences, and thus it wasable to detect hypermutation at all possible levels whenever itwas present (Table 2).
Finally, based on the validation of the analysis of themigration of amplified sequences in agarose gels with HA-Yellow by the k-means method, the sequencing of theamplified material to detect hypermutation was not neededbecause detection was possible based on the migration dis-tance of the samples from the point of application.
The analysis of the migration of the amplified fragments ofthe clinical samples in the gels with HA-Yellow revealed thepresence of more than one viral subpopulation in the sample.Figure 3 shows that samples 27, 31, and 34 contain viralpopulations exhibiting different hypermutation levels in asingle patient. HIV-1 is known to suffer the influence of hostfactors54,55 and it is likely that hypermutation is also a viralevent. Consequently, these findings imply that one singleclinical sample might exhibit viral subpopulations that aremore or less susceptible to hypermutation. Several host fac-tors are known to influence the progression of the disease,such as the APOBEC3G H186R polymorphism, which in theAfrican American population, is associated with rapid pro-gression to AIDS; haplotypes htSNP 6 and ctSNP 5G presentin CUL5 in this same population, which are associated with ahigher CD4 depletion rate in HIV-1-infected individuals56;and the APOBEC3G rs5757463 polymorphism, which in theBrazilian population is associated with lower CD4 levels.52
Although innate immunity is regulated by the host, we ob-served that hypermutation might affect viral subpopulationsin a differentiated manner. It is estimated that 7 – 4 APO-BEC3G molecules are incorporated into each HIV-1 viralparticle.49
As far as viral diversity, the Brazilian HIV-1 epidemic isknown to be genetically diverse. Several HIV-1 subtypes andrecombinant strains circulate in Brazil with subtype B themost prevalent. Most of the HIV-1 subtyping done in Brazilhas addressed the pol region of the viral genome. Because ofthis we sought to study the genetic diversity of vif in a set of214 samples containing the same 157 samples used in thestudy presented here. The HIV-1 virion infectivity factor
(Vif) is required during viral replication to inactivate the hostcell antiviral factor, APOBEC. Phylogenetic analysis char-acterized 165 (77.1%) samples as subtype B, 27 (12.6%) assubtype F, 14 (6.5%) as BF recombinants, and 8 (3.8%) assubtype C. The prevalence of vif subtypes was similar to whathas been observed for pol in the Brazilian epidemic.57
With regard to the demographic data (Table 3 and Sup-plementary Table S1) and gender, in our case series, themale:female ratio was 1:0.8. The mean total viral load was214,270 viral RNA copies/ml (median 41,400 copies/ml),and the mean CD4 + count was 366 cells/mm3 (median 328cells/mm3). Upon including the data on hypermutation, theprevalence of hypermutation was higher in females because,from the total number of samples in which hypermutationwas detected, 63.26% corresponded to females (Chi-square,p = 0.003) (Table 4). This study is the first to detect a higherprevalence of hypermutation in females, and further studiesare needed to better elucidate this finding.
Interestingly, patients with samples in which hypermuta-tion was detected exhibited lower numbers of CD4 + cells(308 – 256) compared to patients with samples in which hy-permutation was not detected (393 – 285). Although thisdifference was not statistically significant (Fisher’s exact test,p = 0.068), it represented a trend and may suggest that hy-permutation is a cumulative process becoming more evidentas the disease progresses.
The basal viral load is a biological marker of HIV repli-cation in which levels correlate to the pace of disease pro-gression, and levels above 100,000 RNA copies/ml areassociated with rapid progression to AIDS.38 Surprisingly,the patients in this study with samples in which hypermuta-tion was detected exhibited higher mean (285,782 – 437,662)and median viral load levels compared to patients withsamples in which hypermutation was not detected (181,825 –343,618) (Table 4). Because our results differed from otherspublished in the literature, we divided our case series intopatients with viral loads above and below100,000 RNAcopies/ml. Nevertheless, the detection of hypermutation washigher in the patients with higher viral load levels (Mann–Whitney test, p = 0.007). Due to the high mean standard de-viation of viral load we performed another statistical test. Wedivided the patients in two groups according to the presenceor absence of hypermutation detection. It was found thatpatients with hypermutation presented higher viral loads(Mann–Whitney test, p = 0.035). Therefore, our resultsstrongly suggest that hypermutation is linked to persistentlyhigh levels of viral replication. Hypermutated proviruses fromelite suppressors were found at a frequency that was not sig-nificantly different from that observed in patients on highlyactive antiretroviral therapy with suppressed virus replication47
and RNA hypermutated virus sequences are not found.15,17
However, hypermutated vif could be easily detected in long-term nonprogressors possibly because of the lack of super-imposing replication-competent virus sequences.58
Thus, it is conceivable that hypermutation exhibits a higherfrequency when viral replication is also higher. Our method ishighly sensitive; thus, we cannot rule out the possibility thatthe detection of hypermutation traced a minority portion ofviral particles that do not contribute to total viral replication.However, we cannot rule out the possibility of a correlationamong higher viral load values, higher replication, and higherfrequencies of hypermutation.
HIV-1 HYPERMUTATION AND VIRAL LOADS IN BRAZIL 877

Our strategy did not require sequencing and was carefullybased on the analysis of the migration profiles of amplifiedsamples in gels with HA-Yellow and the k-means classifi-cation method. This data analysis allowed us to identify ahigher frequency of hypermutation in females ( p = 0.003)than in males. More studies are needed to determine if hy-permutation is gender related. Furthermore, we were able toestablish a direct correlation between higher viral replicationlevels and the presence of hypermutation ( p = 0.035), as wellas a tendency toward decreased CD4 + T cell levels( p = 0.068) and hypermutation. We have yet to consider thatwe studied only one viral load measurement of a naive cohortthat probably presents heterogeneous AIDS progression, andother studies, such as those by Kourteva et al. (2012) andUlenga et al. (2008),23,24 considered two or more groupsbased on their different rates of AIDS progression.
Although our results differ from other published results,based on these findings, we can suppose that the accumula-tion and production of hypermutation occur progressively inthe course of HIV-1 infection and increase when HIV repli-cation is more intense. Based on the fact that viral load is aviral replication marker and CD4 + T cell levels predictclinical outcome but also work as a time marker of infection,it is expected that viruses under replication processes orlonger duration infections present a higher accumulation ofsequences with hypermutation.59,60 Based on these findings,we cannot rule out the possibility that hypermutation mighteventually act as a factor that correlates with the generationof viral genetic diversity because viruses under the influenceof immunological pressure or drugs escape in an attemptto produce resistant varieties and achieve immunologicalescape.61
Our interpretation of the set of findings in this study in-dicates that hypermutation is a pervasive process that can beassociated with high levels of viral replication, and we cannotrule out that the viral load values detected in an individualrepresent the number of viral particles that escaped from thehypermutation process. In the same vein, we could supposethat for hypermutation to occur, viral replication is a re-quirement. Thus, the occurrence of hypermutation dependsupon viral replication and might also result from viral repli-cation. In this sense, it is conceivable that the mediated innateimmunity of APOBECs might not be a determinant againstHIV, and hypermutation might not be a relevant marker ofrestriction to disease progression.
Acknowledgments
This study was supported by the FAPESP research grant(2007/50650-0) and by the Infectious Diseases Departmentof the Federal University of Sao Paulo (UNIFESP).
Author Disclosure Statement
No competing financial interests exist.
References
1. Rathore A, Chatterjee A, Yamamoto N, and Dhole TN:Absence of H186R polymorphism in exon 4 of the APO-BEC3G gene among North Indian individuals. Genet Test2008;12:453–456.
2. Mansky LM and Temin HM: Lower in vivo mutation rateof human immunodeficiency virus type 1 than that pre-dicted from the fidelity of purified reverse transcriptase. JVirol 1995;69:5087–5094.
3. Eigen M: Error catastrophe and antiviral strategy. Proc NatlAcad Sci USA 2002;99:13374–13376.
4. Perelson AS, Neumann AU, Markowitz M, Leonard JM,and Ho DD: HIV-1 dynamics in vivo: Virion clearance rate,infected cell life-span, and viral generation time. Science1996;271:1582–1586.
5. Li Y, Hui H, Burgess CJ, et al.: Complete nucleotide se-quence, genome organization, and biological properties ofhuman immunodeficiency virus type 1 in vivo: Evidencefor limited defectiveness and complementation. J Virol1992;66:6587–6600.
6. Johnston R: HIV cure: Controversy, consensus, and a con-sortium. AIDS Res Hum Retroviruses 2010;26:943–946.
7. Sheehy AM, Gaddis NC, Choi JD, and Malim MH: Isola-tion of a human gene that inhibits HIV-1 infection andis suppressed by the viral Vif protein. Nature 2002;418:646–650.
8. Mangeat B, Turelli P, Caron G, Friedli M, Perrin L, andTrono D: Broad antiretroviral defence by human APO-BEC3G through lethal editing of nascent reverse tran-scripts. Nature 2003;424:99–103.
9. Gabuzda DH, Lawrence K, Langhoff E, et al.: Role of vifin replication of human immunodeficiency virus type 1 inCD4 + T lymphocytes. J Virol 1992;66:6489–6495.
10. Gaddis NC, Chertova E, Sheehy AM, Henderson LE, andMalim MH: Comprehensive investigation of the moleculardefect in vif-deficient human immunodeficiency virus type1 virions. J Virol 2003;77:5810–5820.
11. Ribeiro AC, Maia e Silva A, Santa-Marta M, et al.:Functional analysis of Vif protein shows less restriction ofhuman immunodeficiency virus type 2 by APOBEC3G. JVirol 2005;79:823–833.
12. Opi S, Kao S, Goila-Gaur R, et al.: Human immunodefi-ciency virus type 1 Vif inhibits packaging and antiviralactivity of a degradation-resistant APOBEC3G variant. JVirol 2007;81:8236–8246.
13. Julias JG and Pathak VK: Deoxyribonucleoside tri-phosphate pool imbalances in vivo are associated with anincreased retroviral mutation rate. J Virol 1998;72:7941–7949.
14. Janini M, Rogers M, Birx DR, and McCutchan FE: Humanimmunodeficiency virus type 1 DNA sequences geneticallydamaged by hypermutation are often abundant in patientperipheral blood mononuclear cells and may be generatedduring near-simultaneous infection and activation of CD4( + )T cells. J Virol 2001;75:7973–7986.
15. Mbisa JL, Barr R, Thomas JA, et al.: Human immunode-ficiency virus type 1 cDNAs produced in the presence ofAPOBEC3G exhibit defects in plus-strand DNA transferand integration. J Virol 2007;81:7099–7110.
16. Armitage AE, Deforche K, Chang CH, et al.: APOBEC3G-induced hypermutation of human immunodeficiency virustype-1 is typically a discrete ‘‘all or nothing’’ phenomenon.PLoS Genet 2012;8:e1002550.
17. Russell RA, Moore MD, Hu WS, and Pathak VK: APO-BEC3G induces a hypermutation gradient: Purifying se-lection at multiple steps during HIV-1 replication results inlevels of G-to-A mutations that are high in DNA, inter-mediate in cellular viral RNA, and low in virion RNA.Retrovirology 2009;6:16.
878 DE LIMA-STEIN ET AL.

18. Fourati S, Lambert-Niclot S, Soulie C, et al.: HIV-1 genome isoften defective in PBMCs and rectal tissues after long-termHAART as a result of APOBEC3 editing and correlates with thesize of reservoirs. J Antimicrob Chemother 2012;67:2323–2326.
19. Fourati S, Malet I, Lambert S, et al.: E138K and M184Imutations in HIV-1 reverse transcriptase co-emerge as aresult of APOBEC3 editing in the absence of drug expo-sure. AIDS 2012;26:1619–1624.
20. Pace C, Keller J, Nolan D, et al.: Population level analysisof human immunodeficiency virus type 1 hypermutationand its relationship with APOBEC3G and vif genetic var-iation. J Virol 2006;80:9259–9269.
21. Land AM, Ball TB, Luo M, et al.: Human immunodefi-ciency virus (HIV) type 1 proviral hypermutation correlateswith CD4 count in HIV-infected women from Kenya. JVirol 2008;82:8172–8182.
22. An P, Bleiber G, Duggal P, et al.: APOBEC3G geneticvariants and their influence on the progression to AIDS. JVirol 2004;78:11070–11076.
23. Ulenga NK, Sarr AD, Hamel D, Sankale JL, Mboup S, andKanki PJ: The level of APOBEC3G (hA3G)-related G-to-Amutations does not correlate with viral load in HIV type 1-infected individuals. AIDS Res Hum Retroviruses 2008;24:1285–1290.
24. Kourteva Y, De Pasquale M, Allos T, McMunn C, andD’Aquila RT: APOBEC3G expression and hypermutationare inversely associated with human immunodeficiency virustype 1 (HIV-1) burden in vivo. Virology 2012;430:1–9.
25. Piantadosi A, Humes D, Chohan B, McClelland RS, andOverbaugh J: Analysis of the percentage of human immu-nodeficiency virus type 1 sequences that are hypermutatedand markers of disease progression in a longitudinal cohort,including one individual with a partially defective Vif. JVirol 2009;83:7805–7814.
26. Cho SJ, Drechsler H, Burke RC, Arens MQ, Powderly W,and Davidson NO: APOBEC3F and APOBEC3G mRNAlevels do not correlate with human immunodeficiency virustype 1 plasma viremia or CD4 + T-cell count. J Virol2006;80:2069–2072.
27. Reddy K, Winkler CA, Werner L, et al.: APOBEC3G ex-pression is dysregulated in primary HIV-1 infection andpolymorphic variants influence CD4 + T-cell counts andplasma viral load. AIDS 2010;24:195–204.
28. Sanabani S, Kleine Neto W, Kalmar EM, Diaz RS, JaniniLM, and Sabino EC: Analysis of the near full length ge-nomes of HIV-1 subtypes B, F and BF recombinant from acohort of 14 patients in Sao Paulo, Brazil. Infect GenetEvol 2006;6:368–377.
29. Kijak GH, Janini LM, Tovanabutra S, et al.: Variablecontexts and levels of hypermutation in HIV-1 proviralgenomes recovered from primary peripheral blood mono-nuclear cells. Virology 2008;376:101–111.
30. Kijak GH, Janini M, Tovanabutra S, et al.: HyperPack: Asoftware package for the study of levels, contexts, andpatterns of APOBEC-mediated hypermutation in HIV.AIDS Res Hum Retroviruses 2007;23:554–557.
31. Muller W, Hattesohl I, Schuetz HJ, and Meyer G: Poly-ethylene glycol derivatives of base and sequence specificDNA ligands: DNA interaction and application for basespecific separation of DNA fragments by gel electropho-resis. Nucleic Acids Res 1981;9:95–119.
32. Thompson JD, Gibson TJ, and Higgins DG: Multiple se-quence alignment using ClustalW and ClustalX. Curr Pro-tocall Bioinform 2002;Chapter 2:Unit 2 3.
33. Rose PP and Korber BT: Detecting hypermutations in viralsequences with an emphasis on G – > A hypermutation.Bioinformatics 2000;16:400–401.
34. MacQueen J: Some methods for classification and analysisof multivariate observations. Proceedings of the FifthBerkeley Symposium on Mathematical Statistics andProbability, 1967;1:281–297.
35. Schneider CA, Rasband WS, and Eliceiri KW: NIH Imageto ImageJ: 25 years of image analysis. Nat Methods 2012;9:671–675.
36. Sharkey ME, Teo I, Greenough T, et al.: Persistence ofepisomal HIV-1 infection intermediates in patients on highlyactive anti-retroviral therapy. Nat Med 2000;6:76–81.
37. Komninakis SV, Santos DE, Santos C, Oliveros MP, Sa-nabani S, and Diaz RS: HIV-1 proviral DNA loads (asdetermined by quantitative PCR) in patients subjected tostructured treatment interruption after antiretroviral therapyfailure. J Clin Microbiol 2012;50:2132–2133.
38. Egger S, Petoumenos K, Kamarulzaman A, et al.: Long-term patterns in CD4 response are determined by an in-teraction between baseline CD4 cell count, viral load, andtime: The Asia Pacific HIV Observational Database(APHOD). J Acquir Immune Defic Syndr 2009;50:513–520.
39. Suspene R, Rusniok C, Vartanian JP, and Wain-Hobson S:Twin gradients in APOBEC3 edited HIV-1 DNA reflect thedynamics of lentiviral replication. Nucl Acids Res 2006;34:4677–4684.
40. Goodenow M, Huet T, Saurin W, Kwok S, Sninsky J, andWain-Hobson S: HIV-1 isolates are rapidly evolving qua-sispecies: Evidence for viral mixtures and preferred nu-cleotide substitutions. J Acquir Immune Defic Syndr 1989;2:344–352.
41. Wei M, Xing H, Hong K, et al.: Biased G-to-A hypermu-tation in HIV-1 proviral DNA from a long-term non-progressor. AIDS 2004;18:1863–1865.
42. Kieffer TL, Kwon P, Nettles RE, Han Y, Ray SC, andSiliciano RF: G– > A hypermutation in protease and re-verse transcriptase regions of human immunodeficiencyvirus type 1 residing in resting CD4 + T cells in vivo. JVirol 2005;79:1975–1980.
43. Vartanian JP, Meyerhans A, Sala M, and Wain-Hobson S:G– > A hypermutation of the human immunodeficiencyvirus type 1 genome: Evidence for dCTP pool imbalanceduring reverse transcription. Proc Natl Acad Sci USA 1994;91:3092–3096.
44. Martinez MA, Vartanian JP, and Wain-Hobson S: Hy-permutagenesis of RNA using human immunodeficiencyvirus type 1 reverse transcriptase and biased dNTP concen-trations. Proc Natl Acad Sci USA 1994;91:11787–11791.
45. Wain-Hobson S, Sonigo P, Guyader M, Gazit A, and HenryM: Erratic G– > A hypermutation within a complete cap-rine arthritis-encephalitis virus (CAEV) provirus. Virology1995;209:297–303.
46. Dinoso JB, Kim SY, Siliciano RF, and Blankson JN: Acomparison of viral loads between HIV-1-infected elitesuppressors and individuals who receive suppressive highlyactive antiretroviral therapy. Clin Infect Dis 2008;47:102–104.
47. Gandhi SK, Siliciano JD, Bailey JR, Siliciano RF, andBlankson JN: Role of APOBEC3G/F-mediated hypermu-tation in the control of human immunodeficiency virus type1 in elite suppressors. J Virol 2008;82:3125–3130.
48. Sousa MM, Krokan HE, and Slupphaug G: DNA-uracil andhuman pathology. Mol Aspects Med 2007;28:276–306.
HIV-1 HYPERMUTATION AND VIRAL LOADS IN BRAZIL 879

49. Xu H, Chertova E, Chen J, et al.: Stoichiometry of theantiviral protein APOBEC3G in HIV-1 virions. Virology2007;360:247–256.
50. Skinner LM, Lamers SL, Sanders JC, Eyster ME, Good-enow MM, and Katzman M: Analysis of a large collectionof natural HIV-1 integrase sequences, including those fromlong-term nonprogressors. J Acquir Immune Defic SyndrHum Retrovirol 1998;19:99–110.
51. Pimenta JR, Zuccherato LW, Debes AA, et al.: Color andgenomic ancestry in Brazilians: A study with forensic mi-crosatellites. Hum Hered 2006;62:190–195.
52. Bizinoto MC, Leal E, Diaz RS, and Janini LM: Locipolymorphisms of the APOBEC3G gene in HIV type 1-infected Brazilians. AIDS Res Hum Retroviruses 2011;27:137–141.
53. Schuurman R, Demeter L, Reichelderfer P, Tijnagel J, deGroot T, and Boucher C: Worldwide evaluation of DNAsequencing approaches for identification of drug resistancemutations in the human immunodeficiency virus type 1reverse transcriptase. J Clin Microbiol 1999;37:2291–2296.
54. Chang J, Naif HM, Li S, Sullivan JS, Randle CM, andCunningham AL: Twin studies demonstrate a host cellgenetic effect on productive human immunodeficiency vi-rus infection of human monocytes and macrophages in vitro.J Virol 1996;70:7792–7803.
55. Naif HM, Li S, Alali M, et al.: Definition of the stage ofhost cell genetic restriction of replication of human im-munodeficiency virus type 1 in monocytes and monocyte-derived macrophages by using twins. J Virol 1999;73:4866–4881.
56. An P, Duggal P, Wang LH, et al.: Polymorphisms of CUL5are associated with CD4 + T cell loss in HIV-1 infectedindividuals. PLoS Genet 2007;3:e19.
57. Simao LNAW, Zukurov JPL, Bueno J, Bizinoto MCS,Nunes ERM, Rodrigues F, Soane MM, Lima ML, Diaz RS,and Janini LM: APOBEC3G-related motifs and subtypeanalysis of human immunodeficiency virus type 1 Vif se-quences in Sao Paulo, Brazil. Brasılia: Virus Rev Res2009;14.
58. Simon V, Zennou V, Murray D, Huang Y, Ho DD, andBieniasz PD: Natural variation in Vif: Differential impacton APOBEC3G/3F and a potential role in HIV-1 diversi-fication. PLoS Pathog 2005;1:e6.
59. Chaudhary M, Kashyap B, Gautam H, Saini S, and BhallaP: Use of surrogate markers to predict the HIV diseasestage and time to initiate antiretroviral therapy in devel-oping countries. J Int Assoc Physicians AIDS Care (Chic)2008;7:259–264.
60. Mellors JW, Rinaldo CR Jr, Gupta P, White RM, Todd JA,and Kingsley LA: Prognosis in HIV-1 infection predictedby the quantity of virus in plasma. Science 1996;272:1167–1170.
61. Smith RJ, Okano JT, Kahn JS, Bodin EN, and Blower S:Evolutionary dynamics of complex networks of HIV drug-resistant strains: The case of San Francisco. Science 2010;327:697–701.
Address correspondence to:Luiz Mario Ramos Janini
Universidade Federal de Sao PauloRua Pedro de Toledo, 781, 16o andar
Vila ClementinoSao Paulo, SP 04039032
Brazil
E-mail: [email protected]
880 DE LIMA-STEIN ET AL.