in situ rem and ex situ spm studies of silicon (111) surface
TRANSCRIPT

phys. stat. sol. (a) 202, No. 12, 2344–2354 (2005) / DOI 10.1002/pssa.200521232
© 2005 WILEY-VCH Verlag GmbH & Co. KGaA, Weinheim
In situ REM and ex situ SPM studies of silicon (111) surface
A. L. Aseev*, 1, S. S. Kosolobov1, A. V. Latyshev1, Se Ahn Song2, A. A. Saranin3,
A. V. Zotov3, and V. G. Lifshits3
1 Institute of Semiconductor Physics, Siberian Branch, Russian Academy of Sciences, Novosibirsk, Russia
2 Samsung Advanced Institute of Technology, POB 111 Suwon 440-600, Korea 3 The Institute of Automation and Control Processes, Far Eastern Branch of the Russian Academy
of Sciences, Vladivostok, Russia
Received 7 June 2005, accepted 15 August 2005 Published online 12 September 2005
Dedicated to Professor Dr. Johannes Heydenreich on the occasion of his 75th birthday
PACS 68.35.Bs, 68.35.Rh, 68.37.–d, 68.37.Ef, 68.37.Ps, 68.47.Fg
Combination of experimental methods, including ultrahigh vacuum in situ reflection electron microscopy, scanning tunnelling microscopy and atomic force microscopy, has been applied for analysis of surface struc-ture and dynamic processes on silicon (111) surfaces during sublimation, rapid temperature cooling, oxygen reactions and metal-silicon surface phase formation. From analysis of triangular negative islands, 0.08 nm in depth, which were forming during quenching, it was deduced the effective activation energy of the island generation is equalled to ≈0.35 eV and made conclusion that the (1 × 1) ⇒ (7 × 7) phase transition on Si(111) assumes to be responsible for the negative island nucleation. On the base of the in situ REM study, the dependence of step motion, initiated by surface vacancies generation during oxygen-silicon interaction, on the terrace width was measured. Peculiarities of the initial stages of silicon surface oxidation at low pres-sures were considered. From precision measurements, the top silicon atom density was determined for the metal-silicon surface phase formed during Na, Ca, Mg and Ag deposition on clean silicon (111) surface.
© 2005 WILEY-VCH Verlag GmbH & Co. KGaA, Weinheim
1 Introduction
Clear understanding of behavior of adatoms and vacancies on a crystal surface provides possibility to control surface atomic processes during nanostructure fabrications. These processes can be described in the frames of elementary interplays of the point defects such as adatoms and vacancies with each other and surface sinks. Unfortunately, a direct observation of the point defects on the surface is not possible in most cases, especially at enhanced temperatures. However, their behavior on the surface can be under-stood on the base of analysis of atomic steps, which can be studied from experiments at conditions far from equilibrium. A large number of experimental studies has been performed over the last decade by using scanning probe microscopy (SPM) which allows routinely visualizing not only monatomic steps but a single atom on the surface also. In spite of the attractive advantages in high resolution of SPM methods, there are some disadvantages such as the low time resolution of scanning and narrow temperature range for inves-tigation, making these methods inapplicable for in situ investigations of practical interesting materials. One of the powerful methods for in situ investigations of the structural processes on semiconductor surfaces is ultrahigh vacuum reflection electron microscopy (UHV-REM) [1]. Whereas this method allows observing of the dynamical processes on the surfaces up to the enhanced temperatures, it has
* Corresponding author: e-mail: [email protected], Phone: +07 3832 333950, Fax: +07 3832 331080

phys. stat. sol. (a) 202, No. 12 (2005) / www.pss-a.com 2345
© 2005 WILEY-VCH Verlag GmbH & Co. KGaA, Weinheim
Original
Paper
some restrictions in the spatial resolution in comparison with SPM methods. In this paper the combina-tion of surface-sensitive methods, in situ UHV-REM, UHV-STM and AFM at the ambient condition, has been performed for characterization of stepped silicon surfaces at various treatments. It is our goal to present an overview of the recent studies on structural and morphological transformations on a stepped silicon surface during sublimation, quenching, metal deposition and gas reactions.
2 Experimental
Dynamic structural processes on the silicon surface were studied from in situ experiments by means of UHV-REM which detailed construction was described previously [2]. The sample, 8 × 1 × 0.3 mm3 in sizes, was cut from a (111) silicon wafer with a miscut angle corresponding to 100 nm interstep distance. After cutting procedure, atomic steps were oriented perpendicular to the long side of the sample. After standard chemical treatments the sample was mounted to a sample holder and placed into the sample chamber. The sample holder was special designed for providing electrical current heating and rotating of the sample in azimuth and Bragg’s planes. In the UHV chamber of an electron microscope the sample was cleaned by high temperature annealing during several minutes. After cleaning procedure, no any pinning centres for the motion of atomic steps during sublimation were visualized. The reconstruction transition of (7 × 7) ⇔ (1 × 1) at 830 °C was observed surely at diffraction (RHEED) and imaging (REM) modes that indirectly argues to atomic cleanness of the silicon surface. A scanning tunnelling microscope Omicron has been used at another UHV chamber at room tempera-ture for analyzing surface structure with atomic resolution. For STM observations, electrochemically etched tungsten tips cleaned by in situ heating were employed. All images were acquired in the constant-height mode after cooling the sample to room temperature. Unfortunately there were no ways to transfer the studied sample from REM chamber to STM one without breaking UHV conditions. Therefore the similar substrates were studied in details by REM and STM at the different UHV chamber but the sam-ples were treated at the same way. Atomic force microscope, Solver P-47H (NT-MDT), has been applied to analyze a silicon substrate after removing from UHV chambers. The both contact and semi-contact (frequency-modulation) modes were performed at ambient conditions. Standard silicon cantilevers were used with a resonance eigen- frequency of ≈300 kHz. For stability reasons stiff cantilevers were preferable minimizing the effects of tip-substrate forces. The both temperature and humidity of atmosphere near the sample were monitored during AFM scanning.
3 Results and discussion
3.1 Morphology of stepped silicon surfaces
Figure 1 represents REM (a), STM (b) and AFM (c) images of a stepped Si(111) surface. It should be pointed out that REM and STM images were obtained at UHV conditions whereas AFM image was
a) c)b)
Fig. 1 Typical REM (a), STM 30 × 30 nm2 (b) and AFM 3.5 × 3.5 µm2 (c) images of the clean Si(111) surface.

2346 A. L. Aseev et al.: In situ REM and ex situ SPM studies of silicon (111) surface
© 2005 WILEY-VCH Verlag GmbH & Co. KGaA, Weinheim
obtained after evacuation of the sample from UHV-chamber. REM image shows a clean Si(111) surface with monatomic steps of 0.31 nm in height at 900 °C (Fig. 1a). Thin dark wavy lines are atomic steps, regular distributed on the silicon surface. Such surface morphology was obtained by thermal annealing of the silicon sample during several minutes at 1300 °C inside the UHV chamber. After thermal cleaning there was the reversible (7 × 7) ⇔ (1 × 1) transition occurred on a silicon (111) surface at 830 °C. Fig-ure 1b shows STM image (30 × 30 nm2) of an area between monatomic steps on silicon surface cleaned by the same procedure in an UHV chamber equipped by STM. One can see an atomic structure of the Si(111)–(7 × 7) surface reconstruction. Average distance between the atomic steps (an average terrace width) was defined by wafer’s misori-entation and was measured from Fig. 1a as ≈100 nm. The sample heating to temperatures above 900 °C caused the atomic steps movement in step-up direction (from bottom-right to top-left direction on Fig. 1a) due to sublimation. Atomic step motion can be observed in REM at temperature up to melting point one. It should be pointed out that recorded REM images are foreshortened by a factor 1/50 in the direction of the electron beam incidence due to a small angle between surface and electron beam. Unfor-tunately, due to foreshortening of REM images, precision analysis of surface morphology by REM is complicated while AFM has ability to reproduce three-dimensional surface structure easily. Although AFM investigations were carried out at ambient condition immediately after sample evacuation from the UHV-chamber of the electron microscope, it allows to observe surface morphology with atomic resolu-tion in the direction perpendicular to the surface plane. Figure 1c represents an AFM micrograph of a silicon (111) surface with regular distribution of the atomic steps. Thin lines, crossing the image diago-nally, are monatomic steps.
3.2 Formation of large step-free area
For investigation of the atomic mechanisms of surface transformations one need to reduce the impact of the atomic steps. It may be achieved by creating wide terraces between steps. There are several ways to produce areas on the silicon surface with extremely small atomic steps density. One of the ways is to use the so-called “mesa”-structured surfaces [3–5] and another one is based on self-reordering of the atomic steps on the silicon surface [6, 7]. To form a large step free area, we used phenomenon of step distribution instability at the silicon surface at the conditions of sample heating by direct electri-cal current. Regular distribution of atomic steps observes in a case of step-up direction of the electric current at (830–1050 °C) and (1250–1350 °C) temperature ranges. In the middle temperature range (1050–1250 °C) regular steps observes in a case of step-down direction of the electric current. The step rearrangement was explained by introducing an effective charge of diffusing adatoms taking into account an adatom drift in applying electrical field [8, 9]. However, step bunching effect allows us to control the
Fig. 2 AFM image (phase contrast) of 10 × 10 µm2 Si(111) surface with atomic steps (thin white lines), two bunches (white stripes) and wide terraces.

phys. stat. sol. (a) 202, No. 12 (2005) / www.pss-a.com 2347
© 2005 WILEY-VCH Verlag GmbH & Co. KGaA, Weinheim
Original
Paper
spatial distribution of the atomic steps by means of step redistribution. By using step bunching, extra large terraces with maximum width up to 40 µm were achieved. The process of step bunching on silicon surface in the UHV chamber was controlled routinely by REM. After high temperature annealing the sample was cooled down to room temperature and trans-ferred from UHV microscope. Figure 2 shows AFM micrograph of the silicon surface covered by natural oxide with step bunches, atomic steps and wide terraces between them. Such atomic step density was realized during step bunching at 1260 °C under the heating electrical current flowing in the step-down direction. The average roughness of the silicon surface with natural oxide measured by AFM was less than 1 Å at the area between monatomic steps.
3.3 Surface morphology after quenching
Figure 3a represents AFM-image of the silicon surface after quenching from 1100 °C with cooling rate of 400 °C/s. Atomic step separates upper (bottom-left) and lower (top-right) situated terraces. One can see that high density of triangular islands having dark contrast were formed on the terraces after quench-ing. Shape and distribution of the islands follows a three-fold symmetry of the Si(111)–7 × 7 surface structure. Narrow denuded zones, free of islands, were observed along the atomic step on the both ter-races. An average width of denuded zone on the upper terrace was measured by AFM to be equalled 0.20 ± 0.02 µm and on the bottom terrace –0.22 ± 0.04 µm. Contrast analysis shows that the island depth is less than the height of the monatomic step. Figure 3b shows corresponding height spectra from the area with islands on the terrace. The average depth of these islands is approximately 0.08 nm that is sufficiently smaller than the step height on the Si(111) surface. Similar experiments on the quenching of a silicon surface, performed by means of UHV-STM technique, confirmed the depth measurements by AFM and showed that an area within the negative island has the (7 × 7) surface phase [10]. From the analysis of the temperature dependencies of density of the negative islands it was shown, that the effective activation energy of island growth is 0.35 ± 0.05 eV. The surface density of negative islands was measured to be dependent on the temperature, whereas the size of the triangular islands did not alter during changing the quenching temperature. The temperature independence of the island shape allows us to conclude that negative island nucleation during quenching is due to accumulation of vacan-cies during the growth of the (7 × 7) and other surface phases. There are at least three possible sources of vacancies: the adatom sublimation from the surface, transportation of bulk vacancies to the surface
a) b)
0.8
h, Å
N,p
t
Fig. 3 AFM image (2.2 × 2.2 µm2) of the stepped silicon (111) surface quenched from 1100 °C (a). The height spectra from the terrace area measured by AFM shows the interpeak distance corresponded to is-lands depth of 0.08 nm (b).
2348 A. L. Aseev et al.: In situ REM and ex situ SPM studies of silicon (111) surface
© 2005 WILEY-VCH Verlag GmbH & Co. KGaA, Weinheim
and generation of surface vacancies during the (1 × 1) ⇒ (7 × 7) transition. From the velocity of step motion on the Si(111) surface at 1260 °C measured by in situ UHV-REM experiments, a possible step shift during the quenching time is about 50 nm. This corresponds to the density of generated vacancies ∼8 × 10⁹ sm–2 which is much smaller than that one measured experimentally. It means that the role of sublimation on vacancy formation during quenching is negligible. According to estimations the vacancy concentration near melting point is about 1015 cm–3 for silicon
crystal [11, 12]. The migration length of vacancies v v
D tλ = is ~200 µm guessing the quenching time t
to be equal 1s and the diffusion coefficient of Dv ≈ 5 × 10⁻⁴ cm2/s. Assuming that the whole bulk va-
cancies drain to the surface during quenching from 1380 °С with the diffusion length, the density of surface vacancies reaches 2 × 1013 cm–2. The changing quenching temperature from 1250 °С, with the vacancy concentration in bulk near 1013 cm–3 (∼exp (–5.02 eV/kT)) to 1100 °С, reduces the density of surface vacancies from 2 × 1011 cm–2 to 2 × 109 cm–2. These estimations clearly show drastic changing of surface vacancy concentration. Since the area of the negative islands does not depend experimentally on quenching temperature, the drain of bulk vacancies to the surface does not influence island formation. The last source of vacancy formation might be the (1 × 1) ⇔ (7 × 7) transition which is supplemented by generation of the additional adatoms on the silicon surface that can change the surface morphology [13]. The structures and energies of adatom vacancies on the Si(111)–(7 × 7) surface were studied by tight-binding molecular dynamics calculation [14]. Adatom vacancies on the edge of the (7 × 7) unit cell were found to have formation energies lower than those of corner of the unit cell by about 0.1 eV. This calculation is in agreement with our result that the negative islands 0.08 nm in depth, are formed at the large step-free areas of Si(111) surface after quenching from high temperature. Thus, while rapid cooling allows to freeze the step distribution on the surface, the significant atomic transformation occurs due to changing of the surface superstructure [10, 15]. Generation of point defects during the (1 × 1) ⇒ (7 × 7) surface phase transition assumes to be responsible for the island formation.
3.4 Oxygen reactions at the surface
According to a number of experimental studies, the interaction of oxygen with silicon surface drastically depends on gas pressure and sample temperature [16, 17]. Silicon oxidation at low temperature and high oxygen pressure creates thin film of silicon dioxide. At high temperature and low oxygen pressure, oxy-gen adsorption on a silicon surface produces volatile silicon monoxide. A transition for changing gas reaction from oxidation to etching at a silicon surface during oxygen interaction is characterized by the critical oxygen pressure P
c. It was shown that P
c exponentially increases as the temperature growth with
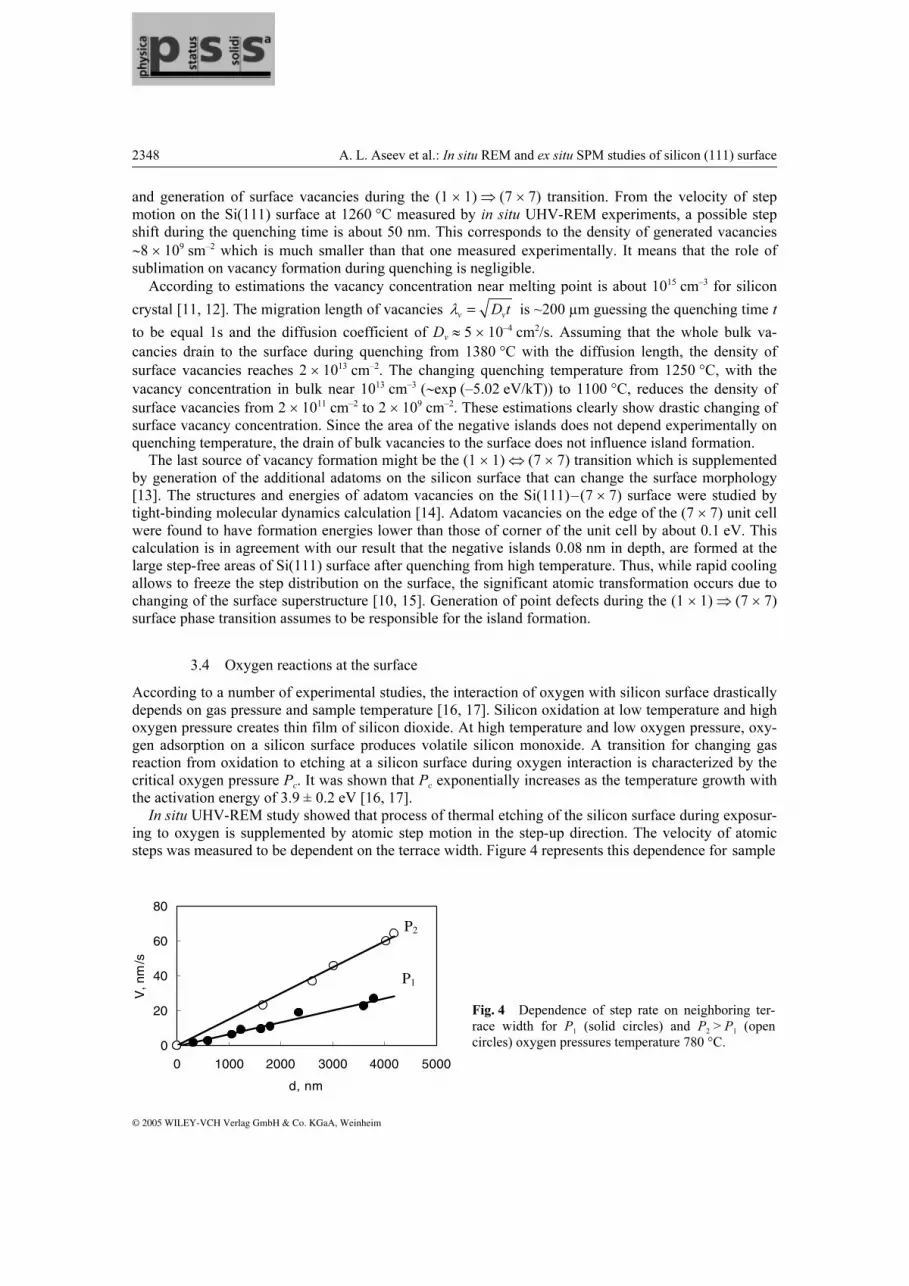
the activation energy of 3.9 ± 0.2 eV [16, 17]. In situ UHV-REM study showed that process of thermal etching of the silicon surface during exposur-ing to oxygen is supplemented by atomic step motion in the step-up direction. The velocity of atomic steps was measured to be dependent on the terrace width. Figure 4 represents this dependence for sample
0
20
40
60
80
0 1000 2000 3000 4000 5000
d, nm
V, n
m/s
P1
P2
Fig. 4 Dependence of step rate on neighboring ter-race width for P
1 (solid circles) and P
2 > P
1 (open
circles) oxygen pressures temperature 780 °C.

phys. stat. sol. (a) 202, No. 12 (2005) / www.pss-a.com 2349
© 2005 WILEY-VCH Verlag GmbH & Co. KGaA, Weinheim
Original
Paper
temperature of 780 °C and two residual oxygen pressures of P2 > P1. It should be noted that in both cases the dependences have linear behavior. In the frames of the BCF theory [18] it means that the diffusion species have the migration length comparable or larger than the terraces width. Otherwise the step veloc-ity should be independed on the terrace width. At higher oxygen pressure or lower temperature the steps motion was supplemented by nucleation of two-dimensional islands with monolayer depth (negative islands) at the center of the terraces in agree-ment with [19, 20]. Typical AFM image of the oxygen etching silicon surface at conditions of two-dimensional nucleation is shown in Fig. 5a. One can see the set of triangular negative islands, one monolayer in depth. It should be pointed out that the atomic steps were found to be roughened due to oxygen interaction at the surface. Assuming that oxygen etching of a silicon surface proceeds via removing of the silicon atoms through monoxide evaporation, one can conclude the formation of the vacancies on the terraces between steps. The formation of two-dimensional negative islands during oxygen reaction directly argues to the in-creased concentration of surface vacancies on the silicon surface [21]. Let us consider the role of the surface vacancies in structural transformations of the silicon surface during thermal etching by oxygen. Nucleation, diffusion and interaction of vacancies with monatomic steps can cause the step motion dur-ing oxidation of silicon surface at elevated temperatures. Similar to epitaxial growth at high supersaturation of the vacancies on the terraces, the BCF theory predicts negative island nucleation at the terraces in agreements with experimental data (Fig. 5a). To investigate peculiarities of the island nucleation, the silicon samples were exposed with constant dose of oxygen at various temperatures. At lower temperatures the density of negative islands was higher than at elevated temperatures while the island size was enlarger. Moreover, it was found that the surface phase transition of (7 × 7) ⇒ (1 × 1) caused some enlarging of the islands while the reverse transition of (1 × 1) ⇒ (7 × 7) caused the same reducing them. As mentioned above, the phase transition from the higher packed (1 × 1) to the lower packed (7 × 7) surface reconstruction causes adatoms generation at the ter-races [13]. Capturing these adatoms by the negative islands makes them smaller. Contrary, additional surface vacancies generated by the surface during the (7 × 7) ⇒ (1 × 1) transition initiated the negative islands enlarging. In addition, the shape of the negative islands also was changed from triangular at 780 °C to almost circle at 910 °C during the (7 × 7) ⇒ (1 × 1) transition. Further exposition of the silicon surface at oxygen atmosphere caused island growth due to capturing vacancies by islands and coalescent of small islands into the big ones until a top layer is completely removed. During these processes the morphology of top-most layer of the surface was changed from smooth (no negative islands) to rough (0.5 ML covering of the negative islands). Periodic nucleation of
a) b)
Fig. 5 Typical 5 × 5 µm2 AFM images of silicon (111) surface with two-dimensional negative islands (a) and after oxide layer formation (b).

2350 A. L. Aseev et al.: In situ REM and ex situ SPM studies of silicon (111) surface
© 2005 WILEY-VCH Verlag GmbH & Co. KGaA, Weinheim
negative islands, their increasing during exposition and their coalescence with each other caused the intensity oscillation of specular reflected electron beam registered by REM [22]. The period of such oscillations corresponds to the time of the upper layer removing. Our measurements showed that the etching rate of silicon surface does not depend on the temperature while it depends on the oxygen pressure. It means that the etching rate at studied temperature range (500–900 °C) is determined by the rate of oxygen molecules adsorption but not by the diffusion proc-esses at the silicon surface. At increasing oxygen pressures the step motion observed by REM was stopped when the surface was covered with dioxide. The set of pinning centres for step motion was observed due to dioxide growth [23–25]. Figure 5b shows typical AFM image of the silicon surface area at the initial stage of the diox-ide layer formation. One can see atomic step roughening and small white contrast dots decorating atomic steps and terraces. These dots decorating atomic steps and terraces are the predominant places for an initial stage of dioxide formation. It should be pointed out that such dots were not observed at the sam-ples oxidized at room temperature during natural dioxide formation. The density of the dots situated at the terraces was found to increase with enlarging the density of the out-phase boundaries initiated by the (7 × 7) domains. The last fact allows to conclude that atomic steps and out phase boundaries act as the places for preferential formation of oxide clusters at initial stages of oxidation. Thus, our investigations of oxygen reactions at silicon surface showed the significant changing in the surface morphology occurred due to thermal etching and oxidation of the silicon surface.
3.5 STM study of Si redistribution during metal-silicon surface phase formation
Deposition of the metal submonolayer films onto the crystalline silicon surfaces often results in the for-mation of the ordered metal-silicon surface phases. In the cases when the top silicon atom density of the forming surface phase differs from that of the original silicon surface, the phase formation is accompa-nied by the silicon redistribution and changing of the surface morphology. As an example, let us consider formation of the Si(111)3 × 1-Na surface phase. STM image of the as-cleaned Si(111)7 × 7 surface prior Na deposition is shown in Fig. 6. The sample surface displays large terraces of a typical width in the range from 3000 to 6000 Å separated by mon-atomic steps. (In all images shown, the down-step direction is from left to right). The surface structure is the well-ordered Si(111)7 × 7 reconstruction. The feature of the surface that appears to be essential for the (7 × 7)-to-(3 × 1) transformation is the presence of the (7 × 7) anti-phase domain boundaries (marked by arrow in Fig. 6 and shown also at a greater magnification in the inset in this figure). These boundaries run across the terrace and are separated by a typical distance of 1000 to 3000 Å.
Fig. 6 4000 × 4000 Å2 filled state (Vt = +2.5 V) STM image of a
Si(111)7 × 7 sample surface prior Na deposition. The arrow indi-cates the 7 × 7 anti-phase domain boundary which is shown in the inset at a greater magnification (scale 250 × 250 Å2).

phys. stat. sol. (a) 202, No. 12 (2005) / www.pss-a.com 2351
© 2005 WILEY-VCH Verlag GmbH & Co. KGaA, Weinheim
Original
Paper
Fig. 7 7000 × 7000 Å2 filled state (Vt = +2.5 V) STM images showing a Si(111) surface at different
stages of the 7 × 7 to 3 × 1 transformation induced by Na adsorption. Na deposition time is (a) 3 s, (b) 15 s, (c) 30 s and (d) 180 s.
Figure 7 presents a set of the large-scale (7000 × 7000 Å2) STM images of the Si(111) sample surface acquired successively at the various stages of the (7 × 7) to (3 × 1) transformation. The very early stage of a Na deposition is illustrated by Fig. 7a. One can see that (7 × 7) to (3 × 1) transformation starts from the step edges, while no (3 × 1)-Na domains appear on the remaining area of the (7 × 7) terraces. The only exception is the (7 × 7) anti-phase domain boundaries where chains of the triangular-shaped (3 × 1)-Na islands form. The high-resolution STM observations reveal that remaining Si(111)7 × 7 has under-gone a transformation also: it converts upon Na adsorption to a so-called δ-7 × 7-Na structure. With a further Na deposition (Figs. 7b and c), the (7 × 7) ⇒ (3 × 1) transformation proceeds via the propagation of the (7 × 7)/(3 × 1) boundary across the terrace in the step-up direction. In this process, a flat (7 × 7) surface “splits” into the two-level system of the one-atomic layer height islands (upper level) residing on the terrace (lower level). As illustrated by Fig. 8, the islands and the terrace surface both display the Si(111)3 × 1-Na reconstruction. (The corresponding upper and lower reconstruction domains will be referred further as u-(3 × 1) and l-(3 × 1), respectively.) The (7 × 7) ⇒ (3 × 1) transformation is completed when no (7 × 7) regions are left at the sample surface. As a result, a surface like that shown in Fig. 7d is formed. One can see that the chains of the triangular-shaped (3 × 1)-Na islands nucleated along domain boundaries of the original (7 × 7) surface evolve finally into (3 × 1)-Na stripes. The other area of the terraces is occupied by the randomly distributed 3 × 1-Na islands of arbitrary shape. The change in a surface morphology is a consequence of the difference in the top Si atom density of the Si(111)3 × 1 and Si(111)7 × 7 surfaces. If one minimizes the effect of the steps by considering a

2352 A. L. Aseev et al.: In situ REM and ex situ SPM studies of silicon (111) surface
© 2005 WILEY-VCH Verlag GmbH & Co. KGaA, Weinheim
surface area which is distant enough from the steps, the Si amount in the top layer before and after the (7 × 7) ⇒ (3 × 1) transformation can be balanced in the sense of the fundamental law of conserva- tion of matter, namely, the total amount of silicon accumulated in the u-3 × 1 and l-3 × 1 domains should be the same as in the original (7 × 7) top layer, i.e., 2.08 ML (102 silicon atoms per (7 × 7) unit cell). Figure 9 illustrates the mass redistribution in the top silicon atom layer. If Si
3 1Θ
¥ is a top silicon atom
density in the Si(111)3 × 1 surface phase, 3 1u
A- ¥
and 3 1l
A- ¥
are the fractions of area occupied by u-(3 × 1) (islands, upper level) and l-(3 × 1) (terraces, lower level), respectively, then the silicon mass balance equation can be written as
Si Si
3 1 3 1 3 1 3 1(2 ) 2.08
l uA AΘ Θ
- ¥ ¥ - ¥ ¥+ + = .
Substituting the experimentally determined values for 3 1u
A- ¥
and 3 1l
A- ¥
, the equation can be solved for Si
3 1Θ
¥, i.e. the top Si atom density in the Si(111)3 × 1 phase can be determined.
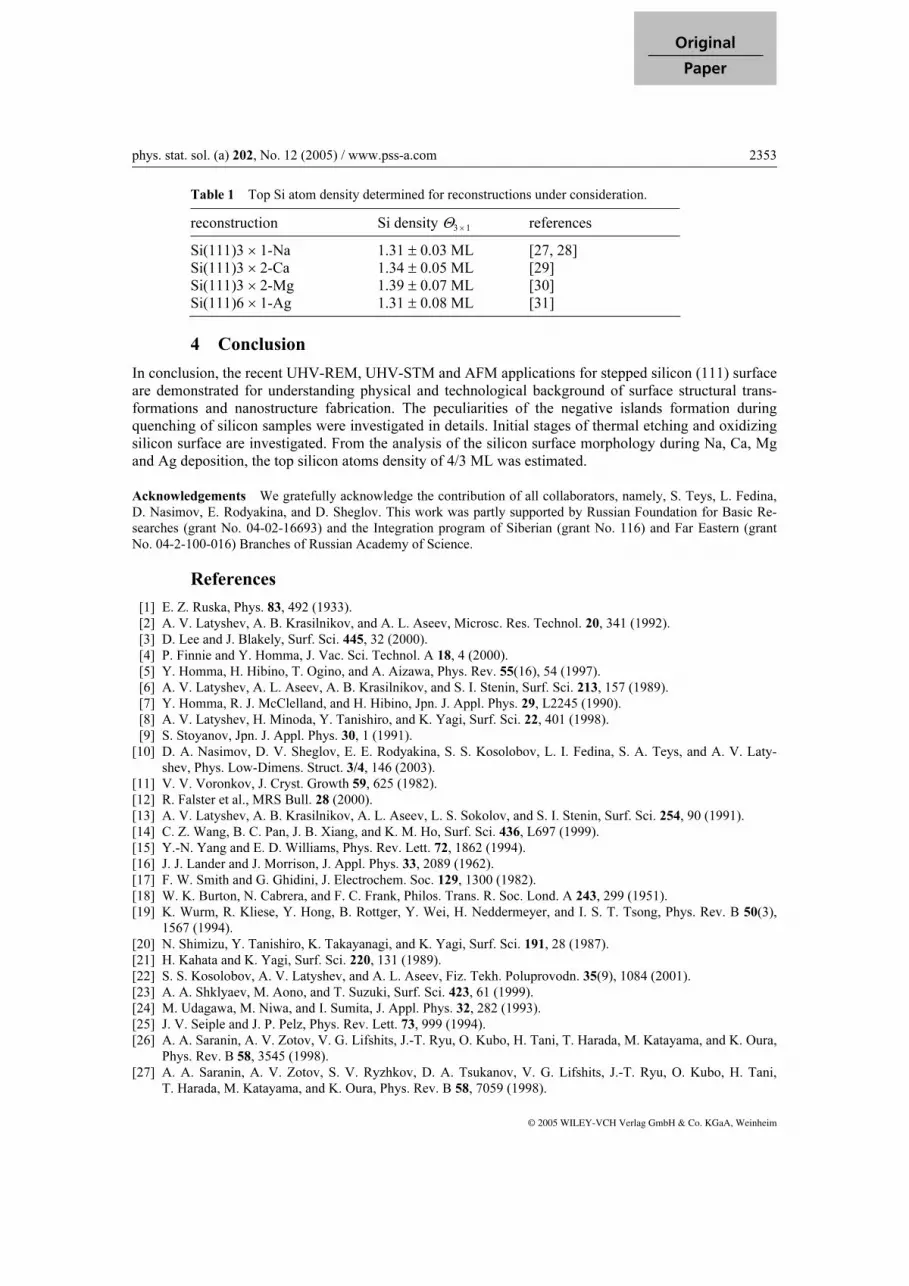
Besides the Si(111)3 × 1-Na phase [26, 27], this evaluation procedure was applied to the Si(111)3 × 2-Ca [28], Si(111)3 × 2-Mg [29] and Si(111)6 × 1-Ag [30] samples. The results of the top silicon atom density determination for the phases under consideration are summarized in Table 1. One can see that the results obtained show that all phases have the same top silicon atom density of 4/3 ML. The accuracy of the determination is sufficiently high that this result can be stated as being conclusive. In particular, it indicates that these surface phases represent a family of the metal-induced reconstructions, having a similar arrangement of the top Si substrate layer [31].
Fig. 9 Schematic diagram illustrating Si redistribution during 7 × 7-to-3 × 1 structural transformation. (a) original Si(111)7 × 7 surface, (b) two-level Si(111)3 × 1 surface. Dashed lines show top Si density levels for ideal Si(111)1 × 1 planes.
Fig. 8 500 × 500 Å2 filled state (Vt = +2.5 V) STM image show-
ing that in the converted region both islands and terrace display the 3 × 1-Na reconstruction.
phys. stat. sol. (a) 202, No. 12 (2005) / www.pss-a.com 2353
© 2005 WILEY-VCH Verlag GmbH & Co. KGaA, Weinheim
Original
Paper
Table 1 Top Si atom density determined for reconstructions under consideration.
reconstruction Si density Θ3× 1 references
Si(111)3 × 1-Na 1.31 ± 0.03 ML [27, 28] Si(111)3 × 2-Ca 1.34 ± 0.05 ML [29] Si(111)3 × 2-Mg 1.39 ± 0.07 ML [30] Si(111)6 × 1-Ag 1.31 ± 0.08 ML [31]
4 Conclusion
In conclusion, the recent UHV-REM, UHV-STM and AFM applications for stepped silicon (111) surface are demonstrated for understanding physical and technological background of surface structural trans-formations and nanostructure fabrication. The peculiarities of the negative islands formation during quenching of silicon samples were investigated in details. Initial stages of thermal etching and oxidizing silicon surface are investigated. From the analysis of the silicon surface morphology during Na, Ca, Mg and Ag deposition, the top silicon atoms density of 4/3 ML was estimated.
Acknowledgements We gratefully acknowledge the contribution of all collaborators, namely, S. Teys, L. Fedina, D. Nasimov, E. Rodyakina, and D. Sheglov. This work was partly supported by Russian Foundation for Basic Re-searches (grant No. 04-02-16693) and the Integration program of Siberian (grant No. 116) and Far Eastern (grant No. 04-2-100-016) Branches of Russian Academy of Science.
References
[1] E. Z. Ruska, Phys. 83, 492 (1933). [2] A. V. Latyshev, A. B. Krasilnikov, and A. L. Aseev, Microsc. Res. Technol. 20, 341 (1992). [3] D. Lee and J. Blakely, Surf. Sci. 445, 32 (2000). [4] P. Finnie and Y. Homma, J. Vac. Sci. Technol. A 18, 4 (2000). [5] Y. Homma, H. Hibino, T. Ogino, and A. Aizawa, Phys. Rev. 55(16), 54 (1997). [6] A. V. Latyshev, A. L. Aseev, A. B. Krasilnikov, and S. I. Stenin, Surf. Sci. 213, 157 (1989). [7] Y. Homma, R. J. McClelland, and H. Hibino, Jpn. J. Appl. Phys. 29, L2245 (1990). [8] A. V. Latyshev, H. Minoda, Y. Tanishiro, and K. Yagi, Surf. Sci. 22, 401 (1998). [9] S. Stoyanov, Jpn. J. Appl. Phys. 30, 1 (1991). [10] D. A. Nasimov, D. V. Sheglov, E. E. Rodyakina, S. S. Kosolobov, L. I. Fedina, S. A. Teys, and A. V. Laty-
shev, Phys. Low-Dimens. Struct. 3/4, 146 (2003). [11] V. V. Voronkov, J. Cryst. Growth 59, 625 (1982). [12] R. Falster et al., MRS Bull. 28 (2000). [13] A. V. Latyshev, A. B. Krasilnikov, A. L. Aseev, L. S. Sokolov, and S. I. Stenin, Surf. Sci. 254, 90 (1991). [14] C. Z. Wang, B. C. Pan, J. B. Xiang, and K. M. Ho, Surf. Sci. 436, L697 (1999). [15] Y.-N. Yang and E. D. Williams, Phys. Rev. Lett. 72, 1862 (1994). [16] J. J. Lander and J. Morrison, J. Appl. Phys. 33, 2089 (1962). [17] F. W. Smith and G. Ghidini, J. Electrochem. Soc. 129, 1300 (1982). [18] W. K. Burton, N. Cabrera, and F. C. Frank, Philos. Trans. R. Soc. Lond. A 243, 299 (1951). [19] K. Wurm, R. Kliese, Y. Hong, B. Rottger, Y. Wei, H. Neddermeyer, and I. S. T. Tsong, Phys. Rev. B 50(3),
1567 (1994). [20] N. Shimizu, Y. Tanishiro, K. Takayanagi, and K. Yagi, Surf. Sci. 191, 28 (1987). [21] H. Kahata and K. Yagi, Surf. Sci. 220, 131 (1989). [22] S. S. Kosolobov, A. V. Latyshev, and A. L. Aseev, Fiz. Tekh. Poluprovodn. 35(9), 1084 (2001). [23] A. A. Shklyaev, M. Aono, and T. Suzuki, Surf. Sci. 423, 61 (1999). [24] M. Udagawa, M. Niwa, and I. Sumita, J. Appl. Phys. 32, 282 (1993). [25] J. V. Seiple and J. P. Pelz, Phys. Rev. Lett. 73, 999 (1994). [26] A. A. Saranin, A. V. Zotov, V. G. Lifshits, J.-T. Ryu, O. Kubo, H. Tani, T. Harada, M. Katayama, and K. Oura,
Phys. Rev. B 58, 3545 (1998). [27] A. A. Saranin, A. V. Zotov, S. V. Ryzhkov, D. A. Tsukanov, V. G. Lifshits, J.-T. Ryu, O. Kubo, H. Tani,
T. Harada, M. Katayama, and K. Oura, Phys. Rev. B 58, 7059 (1998).

2354 A. L. Aseev et al.: In situ REM and ex situ SPM studies of silicon (111) surface
© 2005 WILEY-VCH Verlag GmbH & Co. KGaA, Weinheim
[28] A. A. Saranin, V. G. Lifshits, H. Bethge, R. Kayser, H. Goldbach, A. Klust, J. Wollschlaeger, and M. Henzler, Surf. Sci. 448, 87 (2000).
[29] O. Kubo, A. A. Saranin, A. V. Zotov, J.-T. Ryu, H. Tani, T. Harada, M. Katayama, V. G. Lifshits, and K. Oura, Surf. Sci. 415, L971 (1998).
[30] A. A. Saranin, A. V. Zotov, V. G. Lifshits, J.-T. Ryu, O. Kubo, H. Tani, T. Harada, M. Katayama, and K. Oura, Surf. Sci. 429, 127 (1999).
[31] A. A. Saranin, A. V. Zotov, V. G. Lifshits, M. Katayama, and K. Oura, Surf. Sci. 426, 298 (1999).