improving the czech health care system - oecd
TRANSCRIPT
Organisation for Economic Co-operation and Development
ECO/WKP(2018)70
Unclassified English - Or. English
7 December 2018
ECONOMICS DEPARTMENT
IMPROVING THE CZECH HEALTH CARE SYSTEM
ECONOMICS DEPARTMENT WORKING PAPERS No. 1522
By Falilou Fall and Daniela Glocker
OECD Working Papers should not be reported as representing the official views of the OECD
or of its member countries. The opinions expressed and arguments employed are those of the
author(s).
Authorised for publication by Patrick Lenain, Assistant Director, Country Studies Branch,
Economics Department.
All Economics Department Working Papers are available at www.oecd.org/eco/workingpapers.
JT03441067
This document, as well as any data and map included herein, are without prejudice to the status of or sovereignty over any territory, to the
delimitation of international frontiers and boundaries and to the name of any territory, city or area.

2 │ ECO/WKP(2018)70
IMPROVING THE CZECH HEALTH CARE SYSTEM Unclassified
OECD Working Papers should not be reported as representing the official views of the OECD or of its member countries. The opinions expressed and arguments employed are those of the author(s). Working Papers describe preliminary results or research in progress by the author(s) and are published to stimulate discussion on a broad range of issues on which the OECD works. Comments on Working Papers are welcomed, and may be sent to OECD Economics Department, 2 rue André Pascal, 75775 Paris Cedex 16, France, or by e-mail to [email protected]. All Economics Department Working Papers are available at www.oecd.org/eco/workingpapers
This document and any map included herein are without prejudice to the status of or sovereignty over any territory, to the delimitation of international frontiers and boundaries and to the name of any territory, city or area The statistical data for Israel are supplied by and under the responsibility of the relevant Israeli authorities. The use of such data by the OECD is without prejudice to the status of the Golan Heights, East Jerusalem and Israeli settlements in the West Bank under the terms of international law. On 3 May 2018, the OECD Council invited Lithuania to become a Member. At the time of preparation the deposit of Lithuania’s instrument of accession to the OECD Convention was pending and therefore Lithuania does not appear in the list of OECD Members and is not included in the OECD zone aggregates. On 25 May 2018, the OECD Council invited Colombia to become a Member. At the time of preparation the deposit of Colombia’s instrument of accession to the OECD Convention was pending and therefore Colombia does not appear in the list of OECD Members and is not included in the OECD zone aggregates.
© OECD (2018)
You can copy, download or print OECD content for your own use, and you can include excerpts from OECD publications, databases and multimedia products in your own documents, presentations, blogs, websites and teaching materials, provided that suitable acknowledgment of OECD as source and copyright owner is given. All requests for commercial use and translation rights should be submitted to [email protected]
ECO/WKP(2018)70 │ 3
IMPROVING THE CZECH HEALTH CARE SYSTEM Unclassified
ABSTRACT/RÉSUMÉ
Improving the Czech health care system
The Czech health care system is doing well in terms of health outcomes compared to other
Central East European economies that inherited similar health systems after the transition
and has been converging to OECD averages. However, benchmarking the Czech health
system to countries with comparable institutional setting points to potential for efficiency
gains. This paper assesses the performance and emerging key challenges of the Czech
health system, and provides recommendations to adapt the system to remain effective and
financially sustainable in the context of an ageing society. Further, the contribution of
various disincentives in the system on the supply and the demand side of health care are
discussed.
This Working Paper relates to the 2018 OECD Economic Survey of Czech Republic.
(www.oecd.org/eco/surveys/economic-survey-czech-republic.htm).
JEL classification: I13; I15; I12; I18; I11
Keywords: Czech Republic, health care system, health policy, healthcare coordination,
health disparities, ageing, hospital, primary healthcare, pharmaceutical expenditures,
generics, prevention, health insurance, fee-for-services, health practitioners.
********
Améliorer le système de santé tchèque
Le système de santé tchèque affiche de bonnes performances par rapport aux autres
économies d’Europe Centrale et de l’Est qui ont hérité de systèmes de santé similaires après
la transition et qui ont convergé vers les moyennes de l’OCDE. Cependant, l’analyse
comparative du système de santé tchèque par rapport aux pays ayant des arrangements
institutionnels comparables montre qu’il y a potentiel important de gains d’efficience. Ce
document évalue les performances et les principaux défis émergents du système de santé
tchèque, et fournit des recommandations pour adapter le système afin de rester efficace et
financièrement viable dans le contexte d'une société vieillissante. En outre, la contribution
de divers facteurs désincitatifs du côté de l’offre et de la demande de soins de santé est
discutée.
Ce Document de travail se rapporte à l'Étude économique de l'OCDE de République
Tchèque 2018
(http://www.oecd.org/fr/eco/etudes/etude-economique-republique-tcheque.htm).
Classification JEL: I13; I15; I12; I18; I11
Mots clefs: République Tchèque, système de santé, politique de santé, coordination du
système de santé, disparités de santé, vieillissement, hôpital, soins primaires de santé,
dépenses pharmaceutiques, génériques, prévention, assurances médicales, tarification à
l’acte, professions médicales.

4 │ ECO/WKP(2018)70
IMPROVING THE CZECH HEALTH CARE SYSTEM Unclassified
Table of contents
Improving the Czech health care system ............................................................................................. 6
Overview of health outcomes in the Czech Republic .......................................................................... 9 Improving the coherence and organisation of the health care system ............................................... 16 Improving the delivery of health care ................................................................................................ 25 Managing health spending and strengthening financial sustainability .............................................. 37 Promoting healthy lifestyle choices and preventive policies ............................................................. 50 Improving health literacy ................................................................................................................... 55 References .......................................................................................................................................... 58
Tables
Table 1. Determinants that drive regional variations in health outcomes ............................................. 12 Table 2. Responsibility for public health in the Czech Republic .......................................................... 24
Figures
Figure 1. Total health care expenditure is rising ..................................................................................... 6 Figure 2. OECD typology of health care systems ................................................................................... 8 Figure 3. Health outcomes have improved on several dimensions ......................................................... 9 Figure 4. Life expectancy is lower in socially deprived districts .......................................................... 10 Figure 5. Life expectancy at birth across districts ................................................................................. 11 Figure 6. Health inequalities by socio-economic status ........................................................................ 13 Figure 7. Prevalence of diseases by Roma and non-Roma people ........................................................ 14 Figure 8. Life expectancy across the OECD ......................................................................................... 16 Figure 9. Czech’s number of physician consultations is high ............................................................... 21 Figure 10. Diabetes hospital admissions in adults are decreasing ......................................................... 22 Figure 11. Thirty-day mortality after admission to hospital for ischaemic stroke is relatively high ..... 23 Figure 12. Health expenditure by type of service .................................................................................. 25 Figure 13. Hospital expenditure by type of service ............................................................................... 26 Figure 14. The average length of stay in hospital is above OECD average .......................................... 27 Figure 15. Hospital care capacity is still high ....................................................................................... 28 Figure 16. Investment in the health care sector remains modest ........................................................... 30 Figure 17. Long-term care ..................................................................................................................... 33 Figure 18. Evolution in the number of practising physicians ................................................................ 35 Figure 19. The Emigration rate of doctors is high ................................................................................. 36 Figure 20. Nurses related indicators ...................................................................................................... 37 Figure 21. Growth of health care spending ........................................................................................... 38 Figure 22. Composition of health expenditure ...................................................................................... 39 Figure 23. Share of generics in the total pharmaceutical market .......................................................... 40 Figure 24. Financing sources of health insurance ................................................................................. 42 Figure 25. Out-of-pocket medical spending is low ............................................................................... 44 Figure 26. The population is ageing rapidly .......................................................................................... 46 Figure 27. Disability-adjusted life years and its components ................................................................ 47 Figure 28. Evolution of health care cost profile over population age cohorts ....................................... 48
ECO/WKP(2018)70 │ 5
IMPROVING THE CZECH HEALTH CARE SYSTEM Unclassified
Figure 29. Public health care expenditure projections .......................................................................... 49 Figure 30. Snapshot of risk factors to health ......................................................................................... 50 Figure 31. Excise taxes on alcohol and tobacco in the Czech Republic are low ................................... 52 Figure 32. Alcohol and tobacco consumption and their price developments ........................................ 53
Boxes
Box 1. Health care systems: A wide variety of frameworks and an OECD typology ............................. 8 Box 2. Explaining regional variations in health outcomes .................................................................... 11 Box 3. The Czech health care system .................................................................................................... 17 Box 4. Reimbursement policy for pharmaceuticals ............................................................................... 41 Box 5. Taxes on sweetened beverages across OECD ........................................................................... 54 Box 6. Making patients experience data available to the public: examples from across the OECD ..... 56 Box 7. Recommendations to improve the Czech health care system .................................................... 57

6 │ ECO/WKP(2018)70
IMPROVING THE CZECH HEALTH CARE SYSTEM Unclassified
Improving the Czech health care system
By Falilou Fall and Daniela Glocker1
Health contributes both to well-being and economic growth. The health status of the
population is linked to economic performance through workforce participation and
productivity. An efficient health care system that provides equal access and quality
treatment of care also contribute to better well-being and makes society more inclusive
(James, Devaux and Sassi, 2017[1]). Health outcomes in turn are influenced by a set of
determinants, ranging from access to and quality of care to living conditions and lifestyle
choices of the population.
The Czech health care system performs well along several dimensions. Along with
incomes, living conditions have converged towards the OECD average over the last two
decades. Life expectancy rose by 2.6 years to 78.7 years between 2005 and 2015, just below
the average of 80.6 years in the OECD (OECD, 2017[2]). Spending on health care at 7.2%
of GDP in 2016 is relatively low compared with OECD peers, although the health care
system provides mandatory, universal coverage for all its residents (Figure 1).
Figure 1. Total health care expenditure is rising
% of GDP
Source: OECD (2017), Health at a Glance 2017: OECD Indicators, OECD Publishing, Paris.
http://dx.doi.org/10.1787/health_glance-2017-en.
1 The authors are members of the Economics Department of the OECD. They would like to thank
OECD Economics Department colleagues Peter Hoeller, Isabelle Joumard, Isabell Koske, Patrick
Lenain, Piritta Sorsa and Alvaro Pereira for their comments and suggestions, as well as Béatrice
Guerard for statistical support and Assa Fofana and Carolina Gonzalez for editorial assistance. This
paper benefited from contributions from Ales Belohradsky seconded from the Czech Ministry of
Finance. The document has also benefitted from valuable comments from Francesca Colombo and
Agnès Couffinhal and their team from the Employment, Labour and Social Affairs Directorate.
0
2
4
6
8
10
12
14
16
18
20
TU
R
LVA
ME
X
LUX
PO
L
ES
T
SV
K
CZ
E
ISR
HU
N
KO
R
IRL
GR
C
CH
L
SV
N
ISL
ITA
PR
T
ES
P
OE
CD
NZ
L
FIN
AU
S
GB
R
AU
T
DN
K
BE
L
NO
R
NLD
CA
N
JPN
FR
A
SW
E
DE
U
CH
E
US
A
2016 2000
ECO/WKP(2018)70 │ 7
IMPROVING THE CZECH HEALTH CARE SYSTEM Unclassified
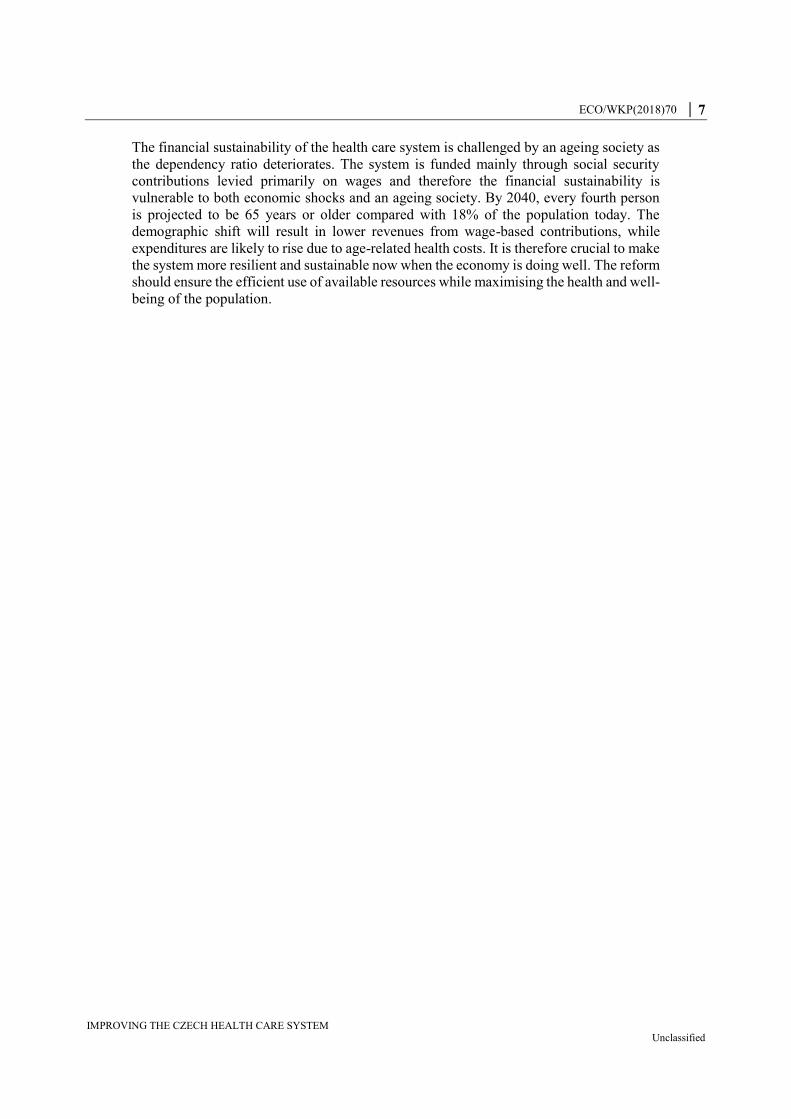
The financial sustainability of the health care system is challenged by an ageing society as
the dependency ratio deteriorates. The system is funded mainly through social security
contributions levied primarily on wages and therefore the financial sustainability is
vulnerable to both economic shocks and an ageing society. By 2040, every fourth person
is projected to be 65 years or older compared with 18% of the population today. The
demographic shift will result in lower revenues from wage-based contributions, while
expenditures are likely to rise due to age-related health costs. It is therefore crucial to make
the system more resilient and sustainable now when the economy is doing well. The reform
should ensure the efficient use of available resources while maximising the health and well-
being of the population.
8 │ ECO/WKP(2018)70
IMPROVING THE CZECH HEALTH CARE SYSTEM Unclassified
This paper assesses the performance and emerging key challenges of the Czech health care
system, and provides recommendations to adapt the system to remain effective and
financially sustainable with regard to ageing. The system is doing well in terms of health
outcomes converging to the OECD average and performing well compared with other CEE
economies that inherited similar health care systems after the transition. Benchmarking to
countries with a comparable institutional setting (Box 1) however points to potential
efficiency gains.
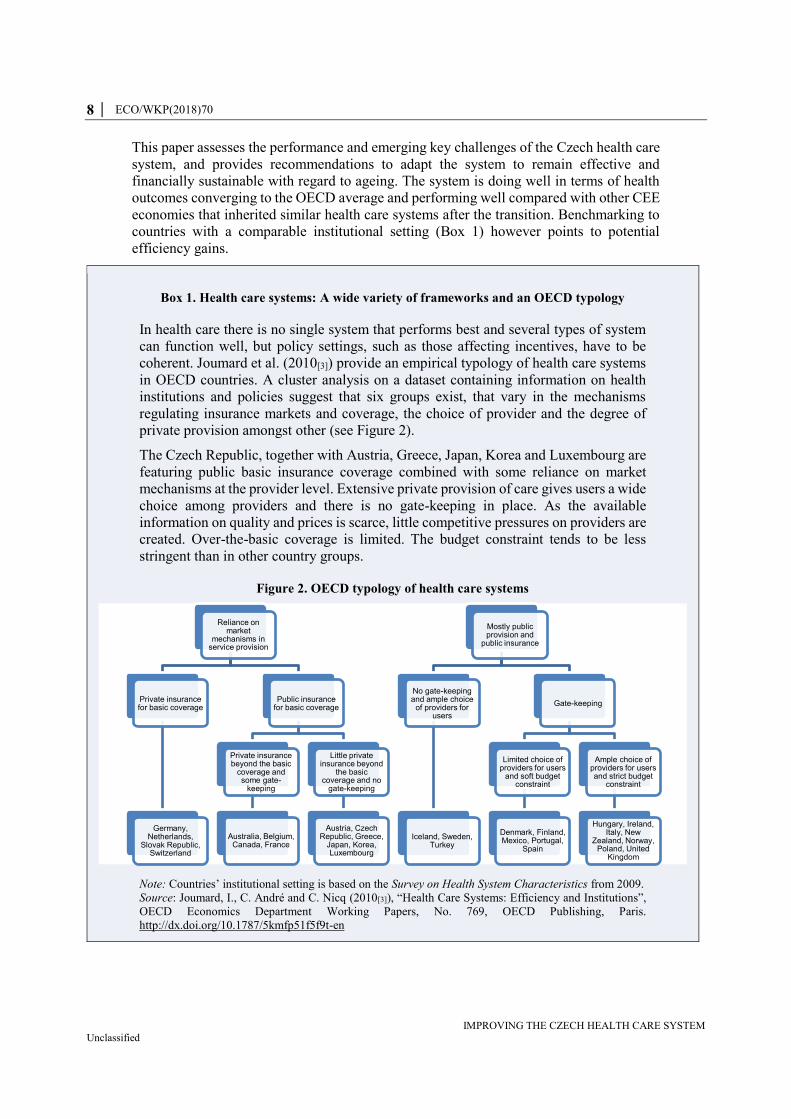
Box 1. Health care systems: A wide variety of frameworks and an OECD typology
In health care there is no single system that performs best and several types of system
can function well, but policy settings, such as those affecting incentives, have to be
coherent. Joumard et al. (2010[3]) provide an empirical typology of health care systems
in OECD countries. A cluster analysis on a dataset containing information on health
institutions and policies suggest that six groups exist, that vary in the mechanisms
regulating insurance markets and coverage, the choice of provider and the degree of
private provision amongst other (see Figure 2).
The Czech Republic, together with Austria, Greece, Japan, Korea and Luxembourg are
featuring public basic insurance coverage combined with some reliance on market
mechanisms at the provider level. Extensive private provision of care gives users a wide
choice among providers and there is no gate-keeping in place. As the available
information on quality and prices is scarce, little competitive pressures on providers are
created. Over-the-basic coverage is limited. The budget constraint tends to be less
stringent than in other country groups.
Figure 2. OECD typology of health care systems
Note: Countries’ institutional setting is based on the Survey on Health System Characteristics from 2009.
Source: Joumard, I., C. André and C. Nicq (2010[3]), “Health Care Systems: Efficiency and Institutions”,
OECD Economics Department Working Papers, No. 769, OECD Publishing, Paris.
http://dx.doi.org/10.1787/5kmfp51f5f9t-en
Reliance on market
mechanisms in service provision
Private insurance for basic coverage
Germany, Netherlands,
Slovak Republic, Switzerland
Public insurance for basic coverage
Private insurance beyond the basic
coverage and some gate-
keeping
Australia, Belgium, Canada, France
Little private insurance beyond
the basic coverage and no
gate-keeping
Austria, Czech Republic, Greece,
Japan, Korea, Luxembourg
Mostly public provision and
public insurance
No gate-keeping and ample choice
of providers for users
Iceland, Sweden, Turkey
Gate-keeping
Limited choice of providers for users
and soft budget constraint
Denmark, Finland, Mexico, Portugal,
Spain
Ample choice of providers for users and strict budget
constraint
Hungary, Ireland, Italy, New
Zealand, Norway, Poland, United
Kingdom
ECO/WKP(2018)70 │ 9
IMPROVING THE CZECH HEALTH CARE SYSTEM Unclassified
The paper also discusses how various disincentives in the system create inefficiencies on
the supply and the demand side of health care.
Overview of health outcomes in the Czech Republic
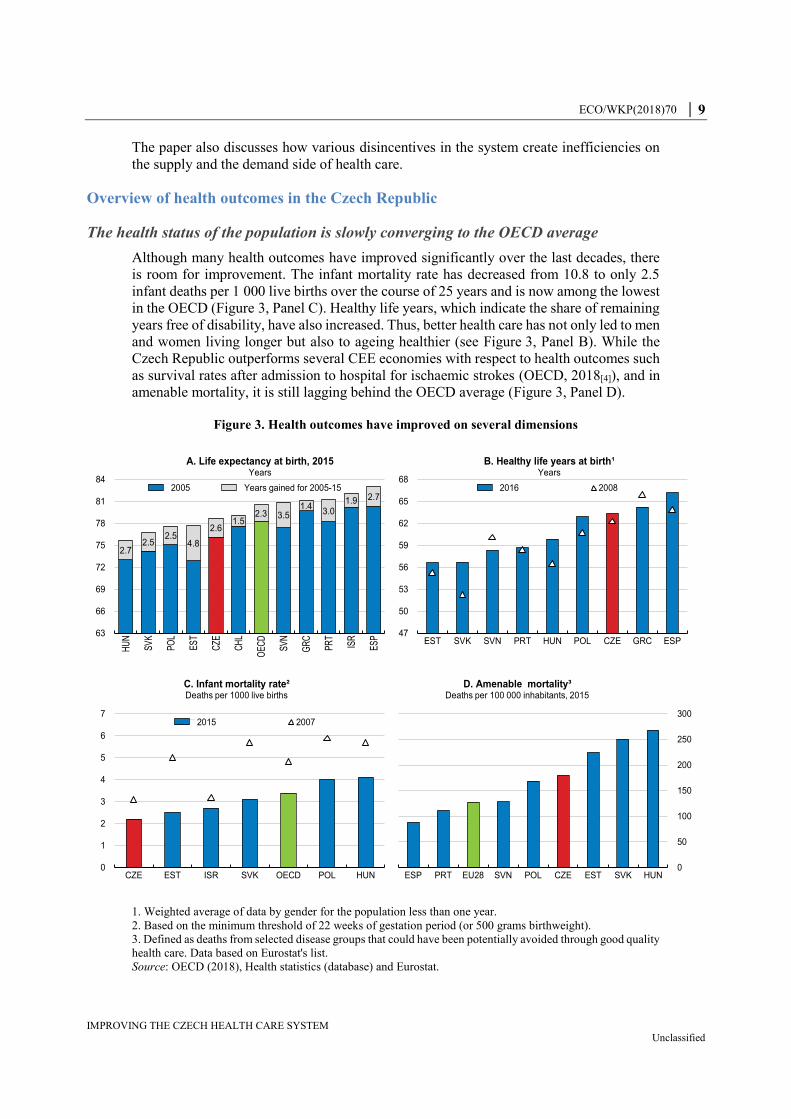
The health status of the population is slowly converging to the OECD average
Although many health outcomes have improved significantly over the last decades, there
is room for improvement. The infant mortality rate has decreased from 10.8 to only 2.5
infant deaths per 1 000 live births over the course of 25 years and is now among the lowest
in the OECD (Figure 3, Panel C). Healthy life years, which indicate the share of remaining
years free of disability, have also increased. Thus, better health care has not only led to men
and women living longer but also to ageing healthier (see Figure 3, Panel B). While the
Czech Republic outperforms several CEE economies with respect to health outcomes such
as survival rates after admission to hospital for ischaemic strokes (OECD, 2018[4]), and in
amenable mortality, it is still lagging behind the OECD average (Figure 3, Panel D).
Figure 3. Health outcomes have improved on several dimensions
1. Weighted average of data by gender for the population less than one year.
2. Based on the minimum threshold of 22 weeks of gestation period (or 500 grams birthweight).
3. Defined as deaths from selected disease groups that could have been potentially avoided through good quality
health care. Data based on Eurostat's list.
Source: OECD (2018), Health statistics (database) and Eurostat.
2.72.5
2.54.8
2.61.5
2.3 3.51.4
3.01.9 2.7
63
66
69
72
75
78
81
84
HU
N
SV
K
PO
L
ES
T
CZE
CH
L
OE
CD
SV
N
GR
C
PR
T
ISR
ES
P
A. Life expectancy at birth, 2015Years
2005 Years gained for 2005-15
47
50
53
56
59
62
65
68
EST SVK SVN PRT HUN POL CZE GRC ESP
B. Healthy life years at birth¹Years
2016 2008
0
1
2
3
4
5
6
7
CZE EST ISR SVK OECD POL HUN
C. Infant mortality rate²Deaths per 1000 live births
2015 2007
ESP PRT EU28 SVN POL CZE EST SVK HUN0
50
100
150
200
250
300
D. Amenable mortality³Deaths per 100 000 inhabitants, 2015
10 │ ECO/WKP(2018)70
IMPROVING THE CZECH HEALTH CARE SYSTEM Unclassified
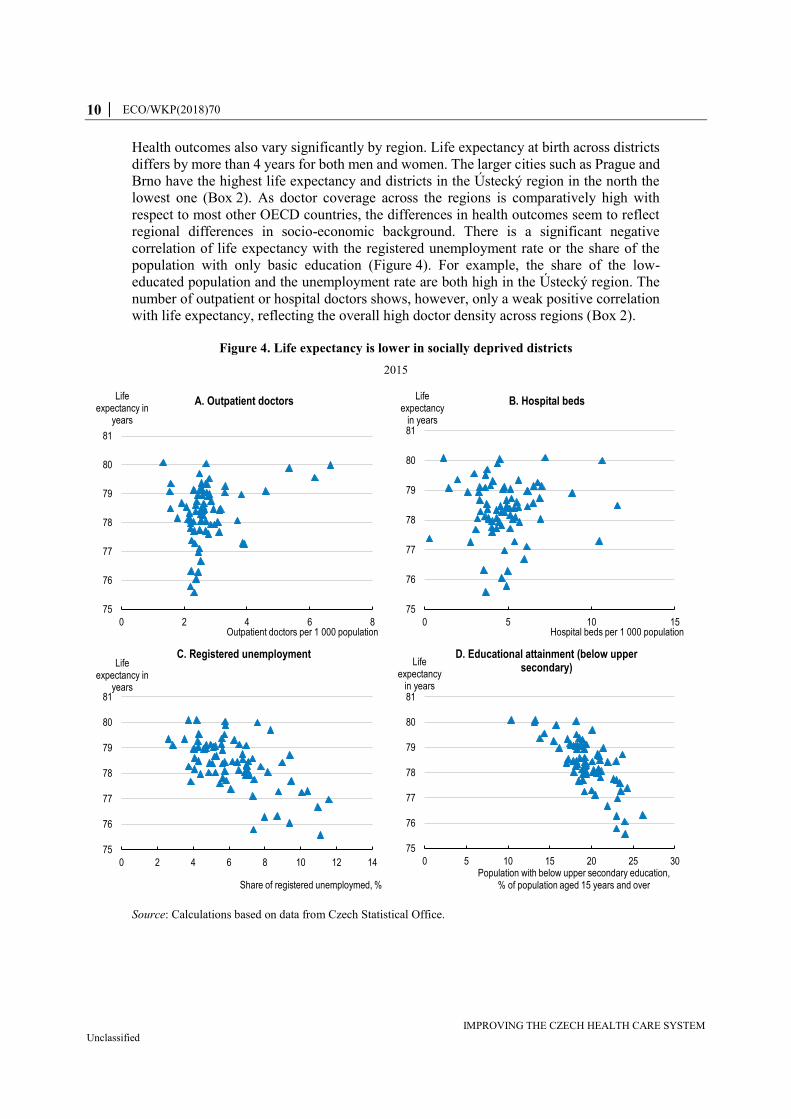
Health outcomes also vary significantly by region. Life expectancy at birth across districts
differs by more than 4 years for both men and women. The larger cities such as Prague and
Brno have the highest life expectancy and districts in the Ústecký region in the north the
lowest one (Box 2). As doctor coverage across the regions is comparatively high with
respect to most other OECD countries, the differences in health outcomes seem to reflect
regional differences in socio-economic background. There is a significant negative
correlation of life expectancy with the registered unemployment rate or the share of the
population with only basic education (Figure 4). For example, the share of the low-
educated population and the unemployment rate are both high in the Ústecký region. The
number of outpatient or hospital doctors shows, however, only a weak positive correlation
with life expectancy, reflecting the overall high doctor density across regions (Box 2).
Figure 4. Life expectancy is lower in socially deprived districts
2015
Source: Calculations based on data from Czech Statistical Office.
75
76
77
78
79
80
81
0 5 10 15
Life expectancy
in years
Hospital beds per 1 000 population
B. Hospital beds
75
76
77
78
79
80
81
0 5 10 15 20 25 30
Life expectancy
in years
Population with below upper secondary education, % of population aged 15 years and over
D. Educational attainment (below upper secondary)
75
76
77
78
79
80
81
0 2 4 6 8
Life expectancy in
years
Outpatient doctors per 1 000 population
A. Outpatient doctors
75
76
77
78
79
80
81
0 2 4 6 8 10 12 14
Life expectancy in
years
Share of registered unemploymed, %
C. Registered unemployment
ECO/WKP(2018)70 │ 11
IMPROVING THE CZECH HEALTH CARE SYSTEM Unclassified
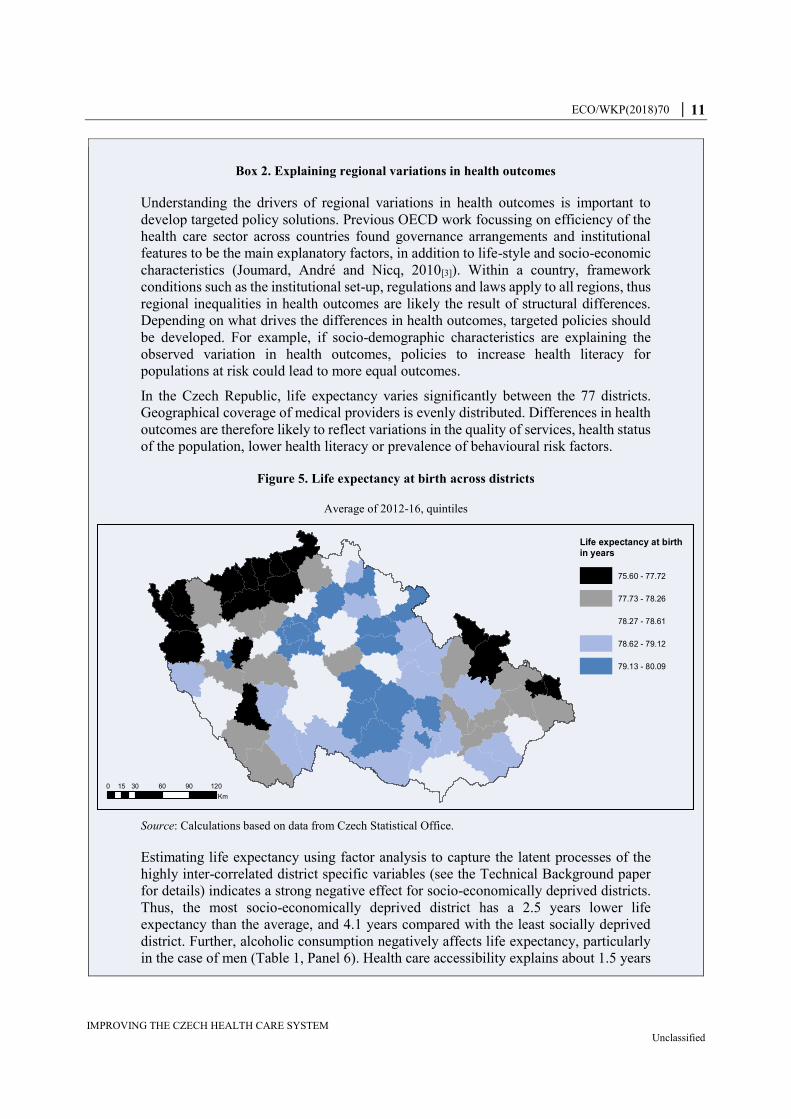
Box 2. Explaining regional variations in health outcomes
Understanding the drivers of regional variations in health outcomes is important to
develop targeted policy solutions. Previous OECD work focussing on efficiency of the
health care sector across countries found governance arrangements and institutional
features to be the main explanatory factors, in addition to life-style and socio-economic
characteristics (Joumard, André and Nicq, 2010[3]). Within a country, framework
conditions such as the institutional set-up, regulations and laws apply to all regions, thus
regional inequalities in health outcomes are likely the result of structural differences.
Depending on what drives the differences in health outcomes, targeted policies should
be developed. For example, if socio-demographic characteristics are explaining the
observed variation in health outcomes, policies to increase health literacy for
populations at risk could lead to more equal outcomes.
In the Czech Republic, life expectancy varies significantly between the 77 districts.
Geographical coverage of medical providers is evenly distributed. Differences in health
outcomes are therefore likely to reflect variations in the quality of services, health status
of the population, lower health literacy or prevalence of behavioural risk factors.
Figure 5. Life expectancy at birth across districts
Average of 2012-16, quintiles
Source: Calculations based on data from Czech Statistical Office.
Estimating life expectancy using factor analysis to capture the latent processes of the
highly inter-correlated district specific variables (see the Technical Background paper
for details) indicates a strong negative effect for socio-economically deprived districts.
Thus, the most socio-economically deprived district has a 2.5 years lower life
expectancy than the average, and 4.1 years compared with the least socially deprived
district. Further, alcoholic consumption negatively affects life expectancy, particularly
in the case of men (Table 1, Panel 6). Health care accessibility explains about 1.5 years
Life expectancy at birthin years
75.60 - 77.72
77.73 - 78.26
78.27 - 78.61
78.62 - 79.12
79.13 - 80.09
0 30 60 90 12015
Km

12 │ ECO/WKP(2018)70
IMPROVING THE CZECH HEALTH CARE SYSTEM Unclassified
difference, between the district with the lowest and the highest density of doctors and
medical facilities. Urban regions are slightly better off, with Prague at the top having
approximately eight months of life extra beyond the average thanks to the urban
amenities and the way of life. Environmental pollution has only little power in
explaining the differences in health outcomes within the Czech Republic.
There are also gender differences in the urbanisation effect. It seems that for females,
the city amenities do not bring such an advantage, or they are offset by negative aspects
connected to urbanisation. One has to take into account that these effects are separated
from the socioeconomic aspects, which certainly are correlated with the urban-rural
pattern.
Table 1. Determinants that drive regional variations in health outcomes
Factor analysis on cross-section of 77 districts.
(1)
Min
(2)
Max
(3)
LE at birth
(4)
LE at 65
(5)
LE (fem) at birth
(6)
LE (male) at birth
Urbanisation -1.18 5.65 0.12 (0.05) * 0.13 (0.04) ** 0.06 (0.06)
0.17 (0.06) **
Health care accessibility -2.96 3.38 0.24 (0.05) *** 0.23 (0.04) *** 0.23 (0.06) *** 0.23 (0.06) ***
Socioeconomic deprivation -1.96 3.07 -0.82 (0.05) *** -0.47 (0.04) *** -0.80 (0.06) *** -0.85 (0.06) ***
Environmental pollution -2.09 4.21 -0.04 (0.05)
0.02 (0.04)
0.01 (0.05)
-0.09 (0.06)
Alcoholic consumption -1.30 3.37 -0.18 (0.05) ** 0.06 (0.04)
0.04 (0.06)
-0.40 (0.06) ***
Average life expectancy
78.23 (0.05) *** 17.71 (0.04) *** 81.23 (0.05) *** 75.38 (0.06) ***
Adjusted R².
0.80
0.69
0.75
0.78
Note: Statistical significance notation: * p<0.05; ** p<0.01; *** p<0.001. Standard errors in parentheses.
Urbanisation is mainly defined by population density, education, knowledge-intensive business
specialisation and also number of crimes per population as this is also a feature of cities. Health accessibility
is composed from density of doctors and medical facilities. Socioeconomic deprivation is negatively
connected to civic participation measured as election participation and positively to unemployment, social
exclusion and gambling. Environmental pollution is based on concentration of SO2 and particular matters
in air. Alcoholic consumption reflects a combination of hospitalisation and mortality rates for alcohol-
related diseases.
Minimum and maximum values express the range for every factor, while the mean values are always 0. It
measures a deviation from average life expectancy and as such it is comparable between different factors.
Source: Based on data from the Czech Statistical Office, Institute of Health Information and Statistics
(UZIS), Czech Hydrometeorological Institute, Ministry of Finance and Ministry of Labour and Social
Affairs.
In addition to socio-economic, medical infrastructure and urbanisation factors, regional
life expectancy might be the result of quality differences in medical care. Potential
differences across districts in the quality of care are unobservable due to a lack of quality
and performance indicators for the medical sector. For example, sorting of better skilled
medical personnel into more attractive regions (i.e. with less crime and lower air
pollution) could ultimately create differences in the quality of treatment and potentially
explain the absence of effects. However, to identify potential sorting and quality
differences and their effect on health outcomes requires better data that are currently not
available.
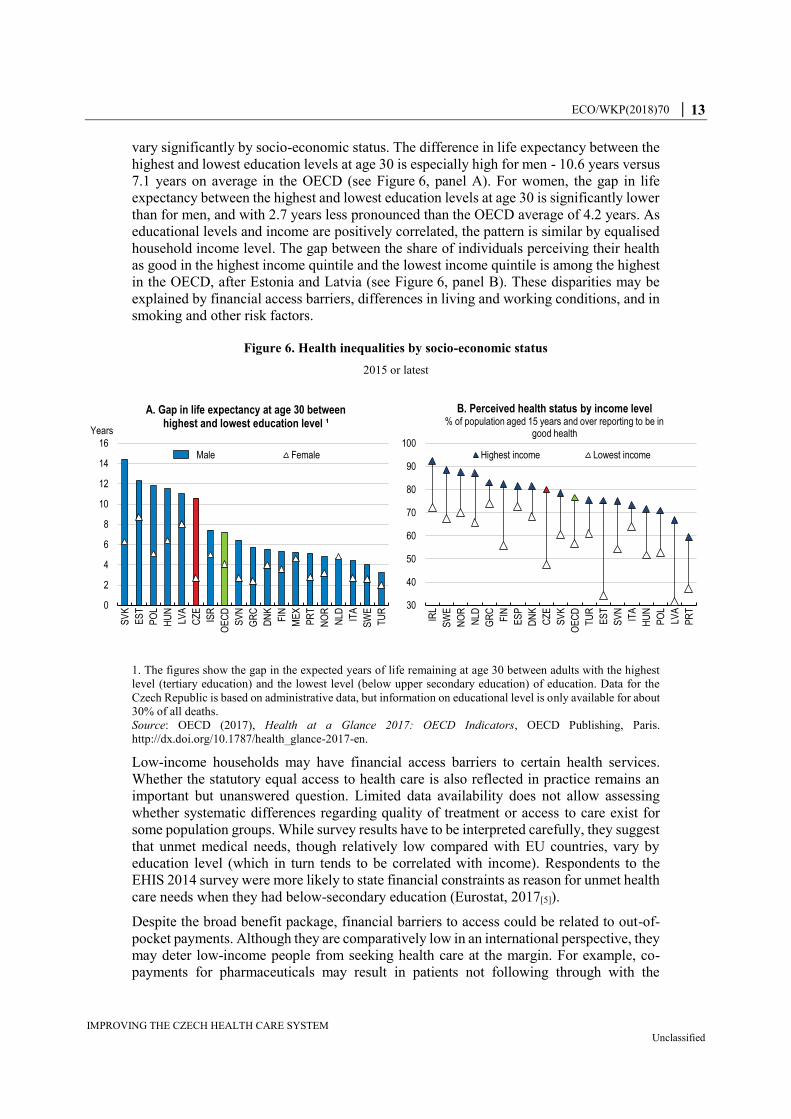
Health outcomes differ by socio-economic background
The universal coverage with a broad benefit package ensures equal access to health care
regardless of socio-economic background. However, despite equal access, health outcomes
ECO/WKP(2018)70 │ 13
IMPROVING THE CZECH HEALTH CARE SYSTEM Unclassified
vary significantly by socio-economic status. The difference in life expectancy between the
highest and lowest education levels at age 30 is especially high for men - 10.6 years versus
7.1 years on average in the OECD (see Figure 6, panel A). For women, the gap in life
expectancy between the highest and lowest education levels at age 30 is significantly lower
than for men, and with 2.7 years less pronounced than the OECD average of 4.2 years. As
educational levels and income are positively correlated, the pattern is similar by equalised
household income level. The gap between the share of individuals perceiving their health
as good in the highest income quintile and the lowest income quintile is among the highest
in the OECD, after Estonia and Latvia (see Figure 6, panel B). These disparities may be
explained by financial access barriers, differences in living and working conditions, and in
smoking and other risk factors.
Figure 6. Health inequalities by socio-economic status
2015 or latest
1. The figures show the gap in the expected years of life remaining at age 30 between adults with the highest
level (tertiary education) and the lowest level (below upper secondary education) of education. Data for the
Czech Republic is based on administrative data, but information on educational level is only available for about
30% of all deaths.
Source: OECD (2017), Health at a Glance 2017: OECD Indicators, OECD Publishing, Paris.
http://dx.doi.org/10.1787/health_glance-2017-en.
Low-income households may have financial access barriers to certain health services.
Whether the statutory equal access to health care is also reflected in practice remains an
important but unanswered question. Limited data availability does not allow assessing
whether systematic differences regarding quality of treatment or access to care exist for
some population groups. While survey results have to be interpreted carefully, they suggest
that unmet medical needs, though relatively low compared with EU countries, vary by
education level (which in turn tends to be correlated with income). Respondents to the
EHIS 2014 survey were more likely to state financial constraints as reason for unmet health
care needs when they had below-secondary education (Eurostat, 2017[5]).
Despite the broad benefit package, financial barriers to access could be related to out-of-
pocket payments. Although they are comparatively low in an international perspective, they
may deter low-income people from seeking health care at the margin. For example, co-
payments for pharmaceuticals may result in patients not following through with the
0
2
4
6
8
10
12
14
16
SV
K
ES
T
PO
L
HU
N
LVA
CZ
E
ISR
OE
CD
SV
N
GR
C
DN
K
FIN
ME
X
PR
T
NO
R
NLD IT
A
SW
E
TU
R
Years
A. Gap in life expectancy at age 30 between highest and lowest education level ¹
Male Female
30
40
50
60
70
80
90
100IR
L
SW
E
NO
R
NLD
GR
C
FIN
ES
P
DN
K
CZ
E
SV
K
OE
CD
TU
R
ES
T
SV
N
ITA
HU
N
PO
L
LVA
PR
T
B. Perceived health status by income level% of population aged 15 years and over reporting to be in
good health
Highest income Lowest income
14 │ ECO/WKP(2018)70
IMPROVING THE CZECH HEALTH CARE SYSTEM Unclassified
prescribed treatment due to financial constraints and limited knowledge of reimbursable
generics (see below). In addition, prospective patients might be deterred to seek medical
care if it requires the upfront payment of a registration fee for new patients or if it involves
treatment that is not covered by the health insurance, such as most dental treatments. While
no detailed information is available about the financial access barriers, most of the
respondents with low education, which stated financial issues as reason for unmet health
care needs, were referring to medical care and prescribed medicines (Eurostat, 2017[6]).
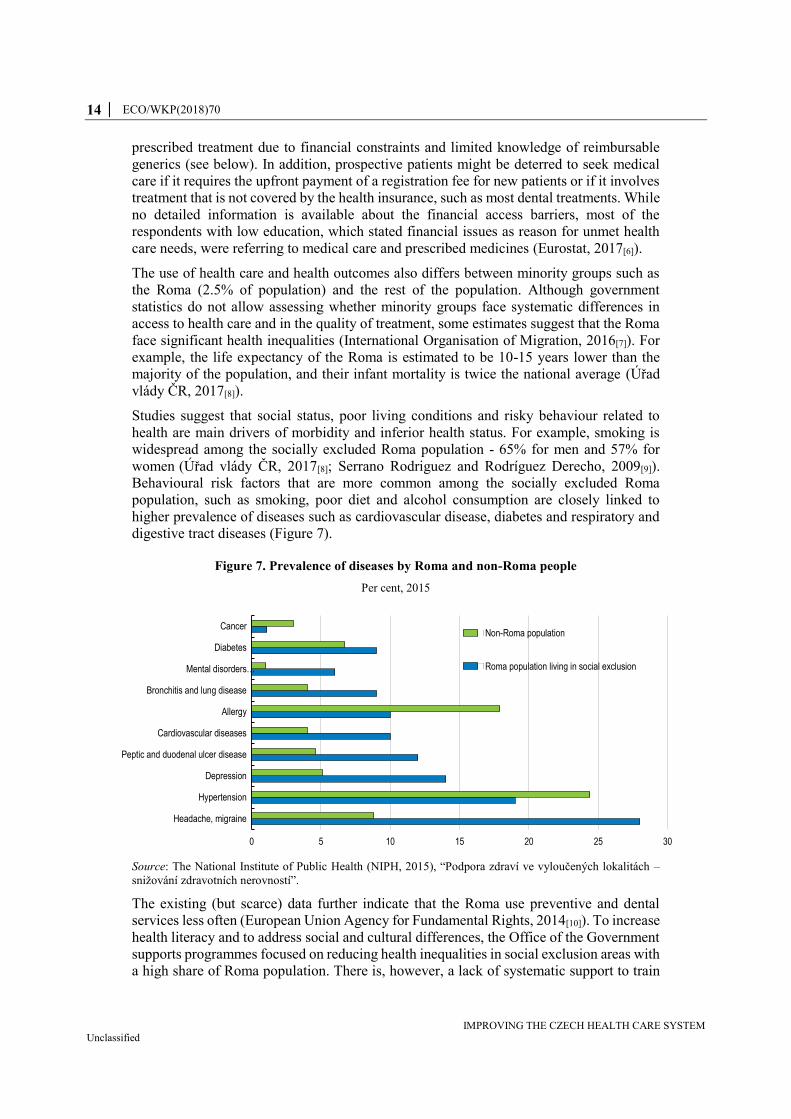
The use of health care and health outcomes also differs between minority groups such as
the Roma (2.5% of population) and the rest of the population. Although government
statistics do not allow assessing whether minority groups face systematic differences in
access to health care and in the quality of treatment, some estimates suggest that the Roma
face significant health inequalities (International Organisation of Migration, 2016[7]). For
example, the life expectancy of the Roma is estimated to be 10-15 years lower than the
majority of the population, and their infant mortality is twice the national average (Úřad
vlády ČR, 2017[8]).
Studies suggest that social status, poor living conditions and risky behaviour related to
health are main drivers of morbidity and inferior health status. For example, smoking is
widespread among the socially excluded Roma population - 65% for men and 57% for
women (Úřad vlády ČR, 2017[8]; Serrano Rodriguez and Rodríguez Derecho, 2009[9]).
Behavioural risk factors that are more common among the socially excluded Roma
population, such as smoking, poor diet and alcohol consumption are closely linked to
higher prevalence of diseases such as cardiovascular disease, diabetes and respiratory and
digestive tract diseases (Figure 7).
Figure 7. Prevalence of diseases by Roma and non-Roma people
Per cent, 2015
Source: The National Institute of Public Health (NIPH, 2015), “Podpora zdraví ve vyloučených lokalitách –
snižování zdravotních nerovností”.
The existing (but scarce) data further indicate that the Roma use preventive and dental
services less often (European Union Agency for Fundamental Rights, 2014[10]). To increase
health literacy and to address social and cultural differences, the Office of the Government
supports programmes focused on reducing health inequalities in social exclusion areas with
a high share of Roma population. There is, however, a lack of systematic support to train
0 5 10 15 20 25 30
Headache, migraine
Hypertension
Depression
Peptic and duodenal ulcer disease
Cardiovascular diseases
Allergy
Bronchitis and lung disease
Mental disorders…
Diabetes
CancerNon-Roma population
Roma population living in social exclusion
ECO/WKP(2018)70 │ 15
IMPROVING THE CZECH HEALTH CARE SYSTEM Unclassified
and increase the awareness of health and social assistants with respect to social, cultural
and language barriers of minority groups (Úřad vlády ČR, 2017[8]). Targeted policies at
minority groups should include preventive and educational programmes, in combination
with health providers and social assistants being sensitised for minority population’s risk
factors and specific needs.
Health outcomes can benefit from health spending reforms
Raising health spending and efficiency can have large gains. Although Czech spending on
health per capita is low in international comparison, it is among the highest compared with
the CEE economies. However, this does not necessarily translate into better health
outcomes. While life expectancy of the Czech population is higher than in Lithuania (4.2
years), Hungary (3 years), Slovakia (2 years) or Estonia (1 year), it remains about two years
below Slovenia where spending on health is comparable (see Figure 8). Benchmarking the
Czech Republic to countries with similar spending and institutional characteristics,
suggests that health outcomes underperform. The Korean and Greek populations have
higher life expectancy than the Czechs, despite slightly lower health spending per capita.
Recent OECD work also shows that the Czech health status remains below the one of
Slovenia, Korea and Greece, even when controlling for additional differences in life-style
and social factors (Giorno and Londáková, 2017[11]). This suggests that at current funding
levels, the Czech health care system has room to increase efficiency and improve health
outcomes.
OECD studies further suggest the potential for efficiency gains. Applying a Data Envelope
Analysis (DEA), Dutu and Sicari (2016[12]) find that when keeping health expenditure
constant but spending it more efficiently, i.e. according to the best practice in the sample
(Japan, Iceland, Korea), life expectancy could be increased by about 4%. Furthermore,
increasing health spending could improve health outcomes further. OECD estimates based
on a sample of OECD countries from 1990-2015 suggest that a 10% increase in health
spending (or by about USD 245 per capita per year) is associated with a potential gain in
life expectancy of about 3.5 months (James, Devaux and Sassi, 2017[1]).

16 │ ECO/WKP(2018)70
IMPROVING THE CZECH HEALTH CARE SYSTEM Unclassified
Figure 8. Life expectancy across the OECD
2015
Source: OECD (2017), Health at a Glance 2017: OECD Indicators, OECD Publishing, Paris.
http://dx.doi.org/10.1787/health_glance-2017-en.
Improving the coherence and organisation of the health care system
Improving the management and regulation of the health care system
OECD research suggests that there is no single best health care model: each model has its strengths
and weaknesses (Joumard, André and Nicq, 2010[3]). In all systems incentives are designed to
induce actors to behave appropriately in terms of delivering cost-efficient services and quality or
limit overconsumption of health services, while regulation should guarantee fair competition and
proper price signals (see Box 1).
The Czech health system is characterised by the state exerting strong control through price and
volume regulations (Box 3). While this has kept costs down, efficiency and quality have suffered
from asymmetry of information between three types of actors: insurance funds, health care
providers and individuals. Thus, there is a lack of proper incentive mechanisms and price signalling
(Box 3) suggesting that there is ample room to improve the efficiency and quality of the system.
AUS
AUT
BEL
BRA
CAN
CHL
CHN
COL
CRI
CZE
DNK
EST
FINFRA
DEU
GRC
HUN
ISL
IND
IDN
IRL
ISR ITA
JPN
KOR
LVA LTU
LUX
MEX
NLDNZL
NOR
POL
PRT
RUS
SVK
SVN
ESP
SWE
CHE
TUR
GBR
USA
R² = 0.57
67
69
71
73
75
77
79
81
83
85
0 20 40 60 80 100
Life expectancy in
years
GDP per capita (Thousand USD PPP)
A. Life expectancy at birth and GDP per capita2015 (or nearest year)
AUS
AUT
BEL
BRA
CANCHL
CHN
COL
CRI
CZE
DNK
EST
FIN
FRA
DEUGRC
HUN
ISL
INDIDN
IRL
ISR ITA
JPN
KOR
LVALTU
LUX
MEX
NLD
NZL
NOR
POL
PRT
RUS
SVK
SVN
ESPSWE CHE
TUR
GBRUSA
R² = 0.54
65
70
75
80
85
0 2 4 6 8 10
Life expectancy
in years
Health spending per capita (Thousand USD PPP)
B. Life expectancy at birth and health spending per capita
2015 (or nearest year)
ECO/WKP(2018)70 │ 17
IMPROVING THE CZECH HEALTH CARE SYSTEM Unclassified
Box 3. The Czech health care system
The current structure
The main features of the health care system were established in the early 1990s after the
transition towards democracy. The principle of free choice of a health-care provider was
introduced, and most of the primary care, non-hospital ambulatory specialist care, the
pharmaceutical industry, pharmacies and spa facilities were privatised. Hospitals
remained in public ownership, complemented only by a small number of private facilities
that emerged over the subsequent years. Several laws were adopted that structure the
system, in particular, the General Health Insurance Act (1991), the Act on the General
Health Insurance Fund (1991), and the Act on Departmental, Professional, Corporate,
and Other Health Insurance Funds (1992). The introduction of insurance funds
transformed the health scheme into a health insurance (SHI) model.
Coverage, scope and financing
Health care is delivered as a public service by different types of providers, which are
financed by the health insurance funds. The funds play a key role and though
independent, they are heavily regulated. Health insurance works on the basis of
solidarity, which means that contributions are not linked to health care received or to
health status.
More specifically,
Coverage: The health insurance system is universal. All employees and self-
employed are subject to universal coverage through mandatory wage or revenue
based contributions. Economically inactive persons (children, students, persons
on parental leave, pensioners, unemployed, prisoners and asylum seekers) are
covered by state contributions.
Scope: Individuals have the right to choose their insurance fund. The range of
benefits is very broad and includes inpatient and outpatient care, prescription
pharmaceuticals, rehabilitation, some dental procedures, spa treatments and
over-the-counter pharmaceuticals (if prescribed by a physician). Indeed, the
Czech law stipulates that insured individuals are entitled to any medical
treatment delivered with the aim of maintaining or improving their health status.
In practice, however, benefits are rationed by legislation, formularies, an annual
negotiation process between the health insurance funds and providers aimed at
defining specific conditions of reimbursement and a fee schedule known as the
“List of Health Services”.
Financing: Compulsory, revenue-based contributions are the main source of
health care financing, accounting for around 75% of the revenues of insurance
funds and 54% of overall health revenues. The remaining share comes from the
state as contributions for economically inactive people and out-of-pocket
payments. The individual health insurance funds collect the monthly SHI
contributions from employers and employees, from self-employed people, and
from individuals without taxable income who are not insured by the state.
The functioning of the insurance scheme
18 │ ECO/WKP(2018)70
IMPROVING THE CZECH HEALTH CARE SYSTEM Unclassified
People can choose between seven insurance companies. However, the General Health
Insurance Fund (Všeobecná zdravotní pojišťovna, VZP) established in 1992 is the oldest
and main insurance company. It covers the largest share of insured people. There is a
redistribution mechanism between insurance funds according to a risk-adjustment
scheme to correct selection biases. Up to 2017, the redistribution between insurance
funds was based on a capitation formula taking into account age and gender. In January
2018, a new redistribution mechanism has come into force, which is based on
pharmaceutical cost groups (PCG). Besides age and gender, it takes into account cost
differences by diagnosis and therefore reflects the needs of chronically ill patients.
Moreover, ex-post compensation of 80% and 95% of costs above thresholds stated by
law is provided for “costly insured individuals” whose annual costs exceed these
thresholds. This is intended to protect the health insurance funds from unexpected
fluctuations in expenditure. The reallocation process is managed by the VZP through a
special central account. Each month the health insurance funds report to the VZP the
total amount of SHI contributions they have collected, as well as the age, gender and
PCGs of their insured individuals.
Individuals can choose freely among the health insurance funds and may switch funds
once a year either on 1 January or 1 July. Health insurance funds must accept all
applicants who have a legal basis for entitlement; risk selection is not permitted. In fact,
shifting is very limited as differences between insurance funds’ packages and their cost
are small.
Indeed, the services provided by insurance funds are heavily regulated and they have
limited leeway in contracting with health providers. The Ministry of Health acts as an
arbiter in the purchasing process; it supervises annual negotiations between the health
insurance funds and the providers to determine the conditions of reimbursement –
including payment mechanisms – for specific groups of providers, such as acute care
hospitals, GPs or ambulatory care specialists. Each year the Ministry of Health publishes
a so-called Reimbursement Decree, which serves as a framework for defining specific
conditions of reimbursement, such as payment mechanisms. These conditions act as
amendments to the existing long-term contracts between health insurance funds and
providers. If the negotiations between health providers and insurance funds fail, the
Reimbursement Decree applies. Individual health care providers and health insurance
funds further have an option to negotiate individualised reimbursement contracts
regardless of the results of collective negotiations and Reimbursement Decree.
Recent reforms of the health system and measures introduced
Reforms in the last decade have aimed to increase the efficiency and transparency of
health service provision, improve data systems, and contain costs. An important reform
took place in 2003, when ownership of half of the hospitals was transferred from the
state to the 14 newly formed, self-governing regions. Through this decentralisation
process, some regions decided to change the legal form of some hospitals, by
transforming them into private companies (of which regional authorities still own the
majority of shares). There has been a mix of reforms but generally, implementation has
been slow and many implementation processes are still ongoing:
Diagnosis Related Groups (DRG) were introduced as early as 2007. However,
it is not used as the main framework for reimbursement due to the difficulties in
classifying and identifying costing of hospital cases. Hospital reimbursement is
based on the global budget using DRG as a complement to estimate the changes
ECO/WKP(2018)70 │ 19
IMPROVING THE CZECH HEALTH CARE SYSTEM Unclassified
in volume of provided services. Long-term care (as well as outpatient hospital
consultations) is reimbursed on a capped fee-for-service basis.
In 2008, the introduction of user fees and co-payments for pharmaceuticals
substantially increased the share of out-of-pocket payments, especially in the
2008-2012 period. In 2013, all user fees except the one for emergency services
were cancelled by the newly elected government taking effect in 2015.
Source: Alexa J, Rečka L, Votápková J, van Ginneken E, Spranger A, Wittenbecher F. (2015[13]); Czech
Republic: Health system review. Health Systems in Transition, 17(1):1–165; Act 592/1992 Coll.; WHO
Global Health Expenditure Database.
The Ministry of Health plays a central role, not only in determining health policy but in the
negotiation process between insurance funds and health care providers (hospitals or GPs,
for instance). Each year insurance funds and health-care providers negotiate the
reimbursement rate of health services. But, as the ministry publishes annually a
reimbursement decree that sets the prices of health care, the negotiation process is not
genuine as one party (often health providers) tends to rely on the decree. Lobbying to obtain
more favourable prices through the decree is prevalent, while the negotiation process has
little influence. This weakens the capacity of insurance funds to negotiate lower prices to
reduce cost, link prices to performance and reap efficiency gains.
The ministry also faces a dilemma between its responsibility to guarantee the financial
sustainability of the system and its short-run interest as the owner of many hospitals and
ultimately having to cover their eventual deficits. The decree also weakens the incentives
of health-care providers to increase their efficiency and cost effectiveness as they can
always rely on the reimbursement decree as a fall-back option. Having a genuine
negotiation process between health care providers and insurance funds, reducing the scope
of the reimbursement decree and/or its drafting entrusted to an independent commission
would help solve some of the issues.
The regulation of the system rests heavily on volume limitations. As in most countries, the
health basket is determined by law. The Act on Public Health Insurance (Act. No. 48/1997)
defines access to health care and sets a range of procedures and services excluded either
explicitly or implicitly. For instance, abortion, examinations requested by employers and
various medical certificates are implicitly excluded as they do not meet the general
requirement of maintaining or improving an individual’s health status. Moreover, a
negative list defines explicitly excluded services such as cosmetic surgery and some dental
treatments. However, the Act on Public Health Insurance is complemented by a mechanism
of “formularies”, which is a positive list of approved pharmaceuticals, medical aids and
dental aids that may be reimbursed under the health insurance system. Finally, the list of
health services is updated annually, detailing the size of benefits and services covered.
The formularies and lists limit consumption and use of some services and care. For
instance, for some treatments or above defined-standard care, partial coverage is not
permitted. This means that patients cannot top up their statutory coverage by choosing a
treatment that is more expensive or more efficient than what the coverage is offering and
paying only for the difference. By strictly controlling treatment reimbursed and defining
the standard of care, the system limits consumption and the use of more advanced
technologies or pharmaceuticals at the expense of potentially more efficient treatments.
Overall, there is a need to rebalance the system towards more competition between health
providers and insurance funds, and towards private funding to improve quality, efficiency
20 │ ECO/WKP(2018)70
IMPROVING THE CZECH HEALTH CARE SYSTEM Unclassified
and reduce the reliance on public funding. As will be detailed below, the high reliance of
the health care system on wage based contributions in the context of an ageing society will
put pressure on public resources. There are different options to reform the settings of the
health-care system:
One option is to decrease the scope of the reimbursement decree by limiting the
number of items covered but also leaving sufficient room for genuine negotiations
between health providers and insurance funds. The negotiations should include
ways to increase efficiency and quality of care among the counterparties to
reimbursement prices. However, there would still be a need to allow for greater
differentiations between insurance funds to make sure they are incentivised to
guarantee the best quality at a cost-efficient way to their clients. This option can be
complemented by increasing the share of co-payments on a broader basis than the
current co-payment system which is focused on pharmaceuticals and some specific
health care services. Although, some exemptions and ceilings in the annual amount
of co-payments should be put in place to protect vulnerable groups such as
chronically ill or low-income people.
Another option is to introduce a two pillar system to strengthen the performance of
the system while reinforcing its financial sustainability in the long term. The first
pillar would be mandatory and include the same basket of services covered by the
public system across all insurance companies. In that case, it is necessary to define
what services are accessible to all without any financial barrier. These should
include all essential and cost-effective care. However, what is defined as “essential”
may differ according to national contexts and over time, and cost-effectiveness
thresholds will depend on overall budget constraints. The transparency in how
decisions are made on which services to include in the benefit basket is essential
(OECD, 2015[14]). The second pillar would be optional and individuals would be
free to contract a complementary insurance policy with any insurance fund. As
such, insurance companies would compete on this second pillar by designing
complementary policy packages. However, there is another possibility to
differentiate the two pillars. That is to define a percentage of reimbursement
guaranteed in the first pillar and let individuals decide whether to buy a
complementary insurance policy for the rest or pay out of pocket.
The organisation of the system does not provide a role for the patient as the end consumer
of health care. The Czechs have wide access to GPs or specialists and, except for selected
specialties (e.g. dentistry care, assisted reproduction, aesthetic surgery, etc.) or emergency
outpatient care, no user fees exist. Medical care costs are not salient as incurred costs are
paid by the health insurance fund directly to the service provider. Overconsumption might
result as medical services are perceived as free by the patient. Indeed, the number of
physician consultations per inhabitant is among the highest in the OECD and CEE-
economies (Figure 9). As discussed below, reducing potential overconsumption is not
addressed through incentives on the demand side but rather put on GPs and specialists who
can have an upper threshold on the volume of their activities.

ECO/WKP(2018)70 │ 21
IMPROVING THE CZECH HEALTH CARE SYSTEM Unclassified
Figure 9. Czech’s number of physician consultations is high
Per inhabitants, 2015 or nearest year
Source: OECD (2017) Health statistics (database).
A monitoring framework to evaluate the efficiency of the management of the health care
system would raise efficiency and produce better outcomes. Identifying emerging
challenges, developing policies and evaluating their performance once implemented
requires the collection of adequate data. Input indicators measuring how much was put into
the health system as well as output indicators measuring how much of health services were
provided (e.g. doctor consultations) are partially available. However, outcome indicators
assessing the achievement of health care delivered are lacking and need to be developed
and monitored. While a new data collection system is under development, it is not yet
systematically used to benchmark hospital performance or to control the quality of care.
However, the new DRG system should allow for more benchmarking and performance
management (see below).
A performance-based data system is necessary for the monitoring and management of the
health system. The amendment of the Act on Health Services in 2016 (Act. No. 147/2016
Coll.) provides for the building of a data system for monitoring health care quality. The
registry is now set up, but consensus is needed among stakeholders on indicators and policy
implementation. The amendment permits to set up a comprehensive National Registry of
Reimbursed Health Services. It operates in co-operation with the health insurance
companies and will contain most of the production and reimbursement data collected from
the healthcare providers. Due to the broad scope of the collected data, the registry will be
used to validate or even replace many current data collections within the National Health
Information System. It will become the main data source for the production of performance
indicators, namely those quantifying the inputs and the volume of provided health services.
Further, outcome measures to capture the quality of care are being developed, i.e. in relation
to the implementation of the DRG system.
The registry was launched in early 2018 and data collected are not yet used to monitor the
quality of care or for pay-for-performance. The implementation should be accelerated to
allow for quality measures and improvements in the reimbursement of health care and
pharmaceuticals. In particular, it is needed for the reform of the DRG, which relies on
developing unbiased output indicators. It will also be useful for the identification of areas
where efficiency gains are possible and the monitoring of reforms.
0
2
4
6
8
10
12
14
16
ME
X
SW
E
CH
L
NZ
L
CH
E
PR
T
FIN
NO
R
DN
K
IRL
LUX
ISL
LVA
FR
A
ES
T
AU
T
BE
L
ITA
SV
N
OE
CD
AU
S
PO
L
ES
P
CA
N
NLD
TU
R
DE
U
CZ
E
SV
K
HU
N
JPN
KO
R
22 │ ECO/WKP(2018)70
IMPROVING THE CZECH HEALTH CARE SYSTEM Unclassified
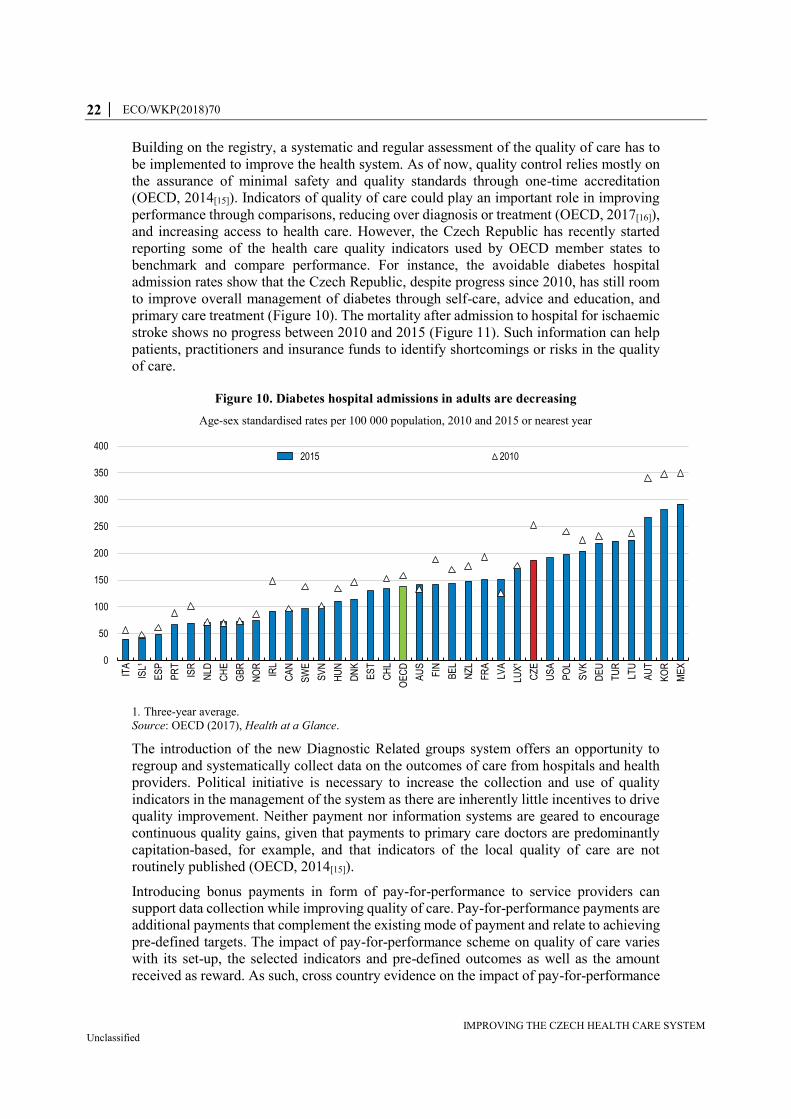
Building on the registry, a systematic and regular assessment of the quality of care has to
be implemented to improve the health system. As of now, quality control relies mostly on
the assurance of minimal safety and quality standards through one-time accreditation
(OECD, 2014[15]). Indicators of quality of care could play an important role in improving
performance through comparisons, reducing over diagnosis or treatment (OECD, 2017[16]),
and increasing access to health care. However, the Czech Republic has recently started
reporting some of the health care quality indicators used by OECD member states to
benchmark and compare performance. For instance, the avoidable diabetes hospital
admission rates show that the Czech Republic, despite progress since 2010, has still room
to improve overall management of diabetes through self-care, advice and education, and
primary care treatment (Figure 10). The mortality after admission to hospital for ischaemic
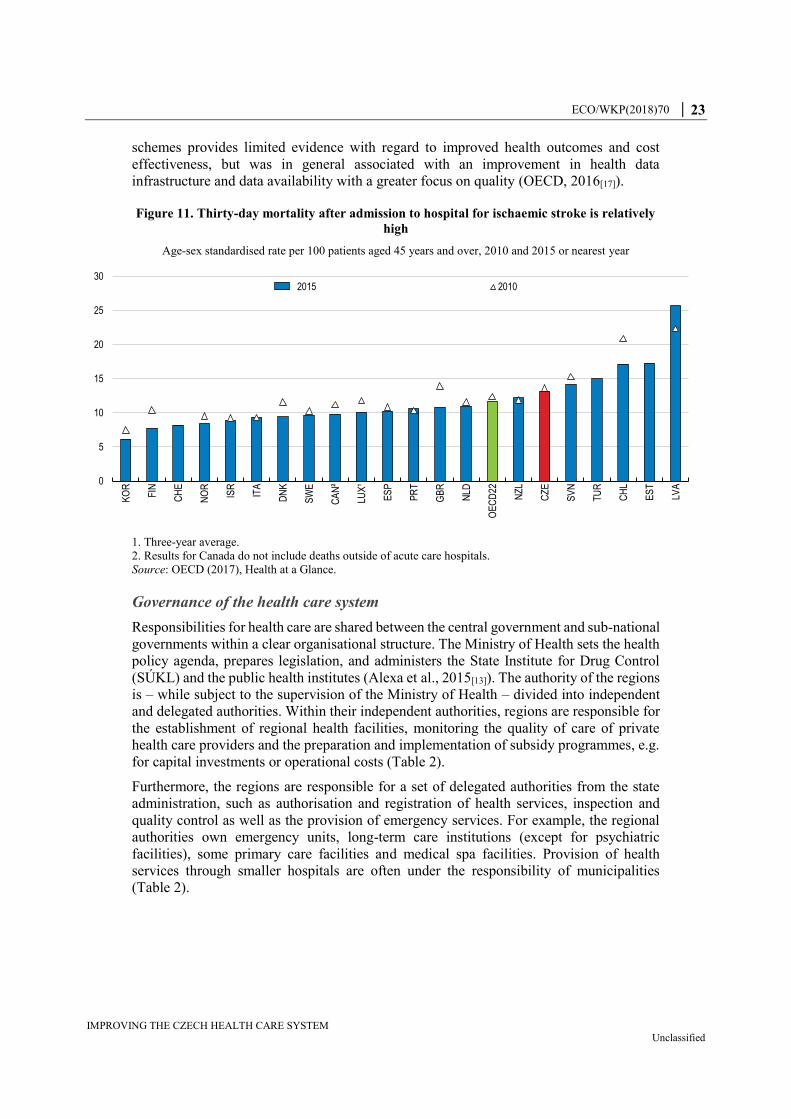
stroke shows no progress between 2010 and 2015 (Figure 11). Such information can help
patients, practitioners and insurance funds to identify shortcomings or risks in the quality
of care.
Figure 10. Diabetes hospital admissions in adults are decreasing
Age-sex standardised rates per 100 000 population, 2010 and 2015 or nearest year
1. Three-year average.
Source: OECD (2017), Health at a Glance.
The introduction of the new Diagnostic Related groups system offers an opportunity to
regroup and systematically collect data on the outcomes of care from hospitals and health
providers. Political initiative is necessary to increase the collection and use of quality
indicators in the management of the system as there are inherently little incentives to drive
quality improvement. Neither payment nor information systems are geared to encourage
continuous quality gains, given that payments to primary care doctors are predominantly
capitation-based, for example, and that indicators of the local quality of care are not
routinely published (OECD, 2014[15]).
Introducing bonus payments in form of pay-for-performance to service providers can
support data collection while improving quality of care. Pay-for-performance payments are
additional payments that complement the existing mode of payment and relate to achieving
pre-defined targets. The impact of pay-for-performance scheme on quality of care varies
with its set-up, the selected indicators and pre-defined outcomes as well as the amount
received as reward. As such, cross country evidence on the impact of pay-for-performance
0
50
100
150
200
250
300
350
400
ITA
ISL¹
ES
P
PR
T
ISR
NLD
CH
E
GB
R
NO
R
IRL
CA
N
SW
E
SV
N
HU
N
DN
K
ES
T
CH
L
OE
CD
AU
S
FIN
BE
L
NZ
L
FR
A
LVA
LUX
¹
CZ
E
US
A
PO
L
SV
K
DE
U
TU
R
LTU
AU
T
KO
R
ME
X
2015 2010
ECO/WKP(2018)70 │ 23
IMPROVING THE CZECH HEALTH CARE SYSTEM Unclassified
schemes provides limited evidence with regard to improved health outcomes and cost
effectiveness, but was in general associated with an improvement in health data
infrastructure and data availability with a greater focus on quality (OECD, 2016[17]).
Figure 11. Thirty-day mortality after admission to hospital for ischaemic stroke is relatively
high
Age-sex standardised rate per 100 patients aged 45 years and over, 2010 and 2015 or nearest year
1. Three-year average.
2. Results for Canada do not include deaths outside of acute care hospitals.
Source: OECD (2017), Health at a Glance.
Governance of the health care system
Responsibilities for health care are shared between the central government and sub-national
governments within a clear organisational structure. The Ministry of Health sets the health
policy agenda, prepares legislation, and administers the State Institute for Drug Control
(SÚKL) and the public health institutes (Alexa et al., 2015[13]). The authority of the regions
is – while subject to the supervision of the Ministry of Health – divided into independent
and delegated authorities. Within their independent authorities, regions are responsible for
the establishment of regional health facilities, monitoring the quality of care of private
health care providers and the preparation and implementation of subsidy programmes, e.g.
for capital investments or operational costs (Table 2).
Furthermore, the regions are responsible for a set of delegated authorities from the state
administration, such as authorisation and registration of health services, inspection and
quality control as well as the provision of emergency services. For example, the regional
authorities own emergency units, long-term care institutions (except for psychiatric
facilities), some primary care facilities and medical spa facilities. Provision of health
services through smaller hospitals are often under the responsibility of municipalities
(Table 2).
0
5
10
15
20
25
30
KO
R
FIN
CH
E
NO
R
ISR
ITA
DN
K
SW
E
CA
N²
LUX
¹
ES
P
PR
T
GB
R
NLD
OE
CD
22
NZ
L
CZ
E
SV
N
TU
R
CH
L
ES
T
LVA
2015 2010

24 │ ECO/WKP(2018)70
IMPROVING THE CZECH HEALTH CARE SYSTEM Unclassified
Table 2. Responsibility for public health in the Czech Republic
National responsibility (Ministry of Health) Regional responsibility Municipal responsibility
- Health care
- management of large hospitals
- Establishment and management of hospitals - Health services, through both municipal hospitals and private doctors
- Public health protection, health research activities and directly controlled health facilities
- Nursing homes
- Ensuring the safety, quality and rational use of pharmaceutical and medicinal products, precursors and additives; approving, licensing and monitoring pharmaceuticals and medical aids
- Facilities for physically and mentally disabled adults and children
- The search for, protection and use of natural medicinal sources, natural spas and mineral water resources, medicinal products and technical equipment for prevention, diagnostics and treating people
- Monitoring the quality of health care delivery of private providers, jointly with professional medical chambers; monitoring refers to a minimum set of criteria for material and technical equipment, as well as qualification of medical staff which are set by the Ministry of Health.
- Health insurance and health information systems - Ensuring that non-state providers comply with a variety of laws and directives that define the technical, staffing and hygienic requirements before registering and thereby allowing them to offer health services
- The use of biocide preparations and introduction of biocide preparations and agents to the market
Source: Adapted from Council of Regions (2017[18]), “Public Health”,
https://portal.cor.europa.eu/divisionpowers/countries/MembersNLP/CR/Policy-Areas-
Obligatory/Pages/Public-Health.aspx (accessed December 2017).
Good governance of health care is crucial for the system to be able to adapt quickly to new
objectives and priorities. While the responsibilities within the health care system across the
levels of government are clearly defined, overlapping responsibilities between the Ministry
of Labour and Social Affairs and the Ministry of Health regarding long-term care create
inefficiencies. Long-term care is provided through the Ministry of Labour and Social
Welfare for a person with reduced self-sufficiency resulting from deteriorating health. The
Ministry of Health is responsible for long-term care in terms of the provision of health care
without which the patient’s state of health would deteriorate. Payment for care delivery
under the two systems differs, creating incentives for seeking long-term care in the medical
rather than in the long-term care setting. Better co-ordination between policy sectors is
therefore needed to reduce inefficiencies in the supply of long-term care.
The development of an e-health system offers an important potential to improve the
governance of the health system through better information collection and allows to reap
efficiency gains and to implement a smart pay-for-performance system. An e-health system
is discussed but has not been introduced. However, e-prescription has been introduced as
mandatory since the beginning of 2018 (with a year suspension of sanctions for the case of
non-compliance). After 6 months, uptake of e-prescription was about 80%. However, this
step has to be closely monitored to ensure that especially old doctors are not favouring
retirement over investing in the required technology. This would pose a threat to health
care provision especially in rural areas.
The use of new technologies to improve the efficiency of communication between doctors
and health insurance companies has not yet been implemented. The current setting of the
system should facilitate its introduction as it is already heavily centralised and health
providers’ remuneration depends already on transmitting certain information. As is many
ECO/WKP(2018)70 │ 25
IMPROVING THE CZECH HEALTH CARE SYSTEM Unclassified
countries, shared private health data through electronic health records faces resistance due
to data privacy issues. However, the development of digital systems is focusing on security
issues. A voluntary policy is needed to subsidise the equipment of health providers or raise
remuneration, train the users and put in place judicial rules that reassure people on the use
of the information.
Improving the delivery of health care
Reforming hospital management and inpatient care
The allocation of resources, the effectiveness of treatments and the appropriateness of care
received are important parameters for the efficiency of the system. There are different ways
to optimise health spending and effectiveness, for example by streamlining procedures,
adjusting treatment methods or creating economies of scale through co-ordinated care
provision.
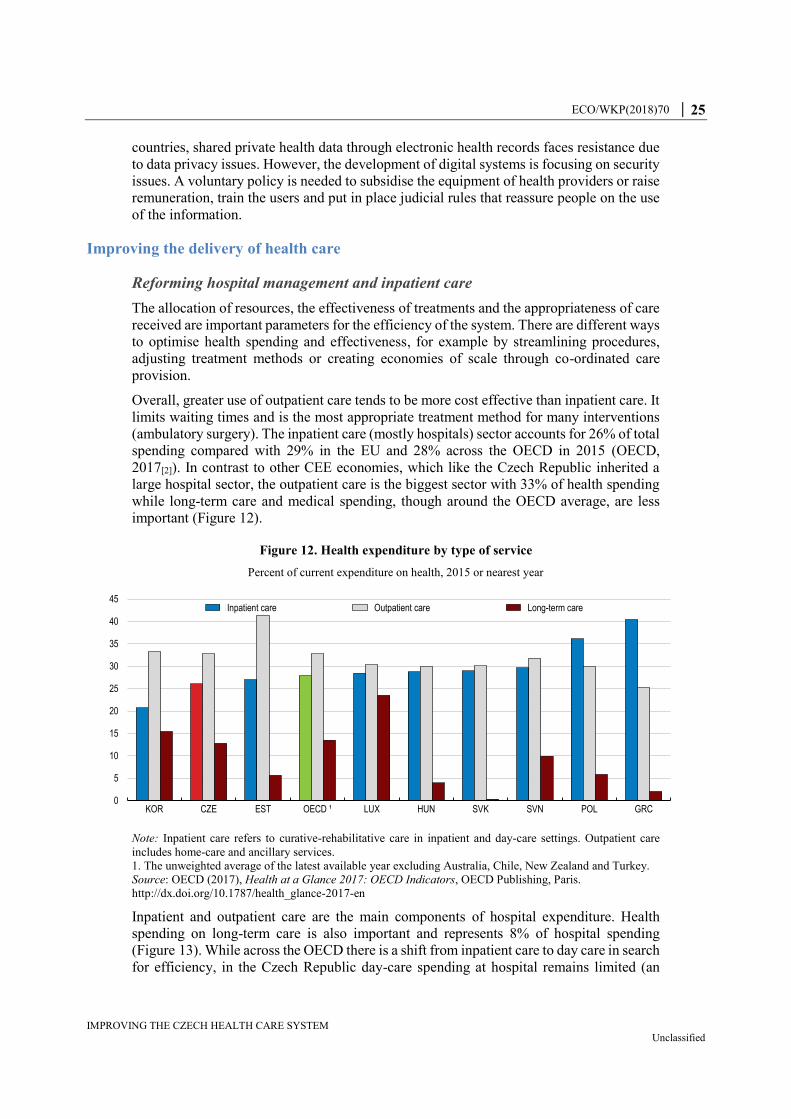
Overall, greater use of outpatient care tends to be more cost effective than inpatient care. It
limits waiting times and is the most appropriate treatment method for many interventions
(ambulatory surgery). The inpatient care (mostly hospitals) sector accounts for 26% of total
spending compared with 29% in the EU and 28% across the OECD in 2015 (OECD,
2017[2]). In contrast to other CEE economies, which like the Czech Republic inherited a
large hospital sector, the outpatient care is the biggest sector with 33% of health spending
while long-term care and medical spending, though around the OECD average, are less
important (Figure 12).
Figure 12. Health expenditure by type of service
Percent of current expenditure on health, 2015 or nearest year
Note: Inpatient care refers to curative-rehabilitative care in inpatient and day-care settings. Outpatient care
includes home-care and ancillary services.
1. The unweighted average of the latest available year excluding Australia, Chile, New Zealand and Turkey.
Source: OECD (2017), Health at a Glance 2017: OECD Indicators, OECD Publishing, Paris.
http://dx.doi.org/10.1787/health_glance-2017-en
Inpatient and outpatient care are the main components of hospital expenditure. Health
spending on long-term care is also important and represents 8% of hospital spending
(Figure 13). While across the OECD there is a shift from inpatient care to day care in search
for efficiency, in the Czech Republic day-care spending at hospital remains limited (an
0
5
10
15
20
25
30
35
40
45
KOR CZE EST OECD ¹ LUX HUN SVK SVN POL GRC
Inpatient care Outpatient care Long-term care

26 │ ECO/WKP(2018)70
IMPROVING THE CZECH HEALTH CARE SYSTEM Unclassified
estimated 2% of hospital spending). More effort should be put to shift inpatient care
towards day care as it lowers spending. Monitoring the development of new medical
technologies will help in developing day-care.
New medical technologies – in particular the diffusion of less invasive surgical
interventions – and better anaesthetics have made day care interventions possible, and
reduced the unit cost per intervention by shortening the length of a hospital stay (OECD,
2017[2]). However, the impact of the rise in same-day surgery on overall health spending
may not be straightforward since the reduction in unit cost (compared to inpatient surgery)
may be offset by the growth in the volume of procedures performed. There is also a need
to take into account any additional cost related to post-acute care and community health
services following these interventions.
Figure 13. Hospital expenditure by type of service
Percentage of hospital expenditure, 2015 or nearest year
Note: Outpatient care includes ancillary services. Data on day-care spending in the Czech Republic faces
methodological issues and might be underreported.
1. The unweighted average of the latest available year excluding Chile, Denmark, Israel, Mexico, New Zealand,
Switzerland, Turkey and the United States.
Source: OECD (2017), Health at a Glance 2017: OECD Indicators, OECD Publishing, Paris.
http://dx.doi.org/10.1787/health_glance-2017-en.
Moreover, progress in reducing the average length of a hospital stay, which at 9.3 days
(2015) remains well above the OECD average (of 7.8 days), would bring some efficiency
gains (Figure 14, Panel A). Reducing the length of stay can be achieved through the
advancement of treatments as well as on the backbone of good primary care such that
patients can be discharged earlier from hospitals without compromising their recovery. It
is in particular the average length of stay for normal delivery which is high compared with
other countries (Figure 14, Panel B). However, advancements in ambulatory procedures
are helping to reduce the average length of stay. For instance, cataract surgery treated as
day care surgery increased to 95% compared with the OECD average of 86%. In several
countries, nearly all cataract surgeries are performed as day cases (OECD, 2017[2]).
However, the Czech Republic has improved significantly in the coverage and treatment of
mental care shifting from in- to out-patient care. The number of persons treated as
outpatients for mental illness doubled since 2000 reaching almost 700 000 while inpatient
treatments have decreased. A reform is currently being implemented with European funds
0
20
40
60
80
100
PR
T
KO
R
CA
N
FIN
ES
T
NLD
SW
E
GB
R
ES
P
CZ
E
ITA
IRL
JPN
AU
S
LVA
NO
R
OE
CD
¹
SV
N
LUX
ISL
FR
A
HU
N
SV
K
AU
T
BE
L
GR
C
DE
U
PO
L
Inpatient care Day care Outpatient care Long-term care Other

ECO/WKP(2018)70 │ 27
IMPROVING THE CZECH HEALTH CARE SYSTEM Unclassified
to improve the quality of life of people with mental illness by the restructuring of services,
the creation of a functional network of care facilities and a new approach in the support of
patients. The new approach aims to provide timely diagnosis and treatment of basic mental
disorders through better support of co-operation between primary care and specialised
psychiatric services. The network of existing general and specialised psychiatric outpatient
clinics and surgery of clinical psychologists will be completed and community care
expanded.
Figure 14. The average length of stay in hospital is above OECD average
Days, 2015 or latest
1. Data refer to average length of stay for curative (acute) care (resulting in an underestimation). In Japan, the
average length of stay for all inpatient care was 29 days in 2015 (down from 39 days in 2000).
2. OECD average is the unweighted average of the OECD available countries.
Source: OECD (2017), Health at a Glance 2017: OECD Indicators, OECD Publishing, Paris.
http://dx.doi.org/10.1787/health_glance-2017-en.
The Czech Republic inherited a health system focused on hospital care from communist
times, which still contributes to inefficiencies. Albeit declining since 2000 the number of
hospital beds (6.2 per 1 000 inhabitants) is still above the OECD average (4.7) (Figure 15,
Panel A). However, long-term care use of hospital beds influences the assessment of the
number of hospital beds. The high number of beds also correlates with the total number of
hospitals which are not always well allocated geographically. Better co-ordination of
neighbouring municipalities and regional hospitals by merging and regrouping of some
0
5
10
15
20
25
TUR
MEX
AUS
DN
K
CH
L
SWE
US
A
NLD
¹
ISL
IRL
NO
R
ISR
NZL
SVN
GR
C
GBR SV
K
POL
ESP
CA
N¹
BEL
EST
OEC
D
ITA
LVA
CH
E
AUT
PRT
DE
U
LUX
CZE FI
N
HU
N
FRA
KOR
JPN
¹
A. Average length of stay in hospital
2015 2000
0
1
2
3
4
5
6
MEX
ESP
CH
L
OEC
D²
SVN
POL
CZE
SVK
HU
N
B. Average length of stay for normal delivery
0
2
4
6
8
10
12
SVK
CZE
POL
MEX
OEC
D²
ESP
SVN
PRT
HU
N
EST
CH
L
C. Average length of stay for acute myocardial infarction (AMI)

28 │ ECO/WKP(2018)70
IMPROVING THE CZECH HEALTH CARE SYSTEM Unclassified
services could further enhance the efficiency of the hospital sector as well as improving the
overall quality of care.
The combination of numbers of hospital beds, occupancy rate and hospital discharges
indicates that the number of hospital beds could be further reduced (Figure 15, Panel B and
C). While the occupancy rate is close to OECD average, the high number of hospital
discharges (at least one night at the hospital) compared to OECD indicates that occupancy
rates are potentially mirroring sub-optimal choice in treatment and use of hospital
resources. Rather than shifting towards day-care, patients seem to be admitted to inpatient
care to keep occupancy rates up indicating inefficient management of hospital resources.
Figure 15. Hospital care capacity is still high
Source: OECD (2017), OECD Health Statistics (database).
The remuneration scheme should be used to incentivise hospitals to search for efficiency
gains. After a succession of changes in the remuneration scheme of hospitals, it has
stabilised since 2012 consisting of a combination of four different reimbursement
mechanisms, including case payments based on Diagnostic Related Groups (DRGs),
individual contracts, global budgets and fee-for-service payments for hospital outpatient
care. Reimbursement based on global budgets modified through DRGs mix is now the main
source of hospital revenues (more than 70%).
0
2
4
6
8
10
12
14
16
MEX CH
L
SWE
DN
K
CAN
GBR TU
R
NZL
USA ES
P
IRL
ISR
ISL
ITA
PRT
NO
R
AUS
NLD
GR
C
FIN
SVN
CH
E
OEC
D
LUX
EST
LVA
SVK
FRA
BEL
CZE
POL
HU
N
AUT
DEU
KOR
JPN
A. Number of hospital beds Per 1 000 inhabitants
2015 2005
0
20
40
60
80
100
NLD
USA PR
T
KOR
EST
SVK
SVN
TUR
HU
N
LVA
LUX
GR
C
AUT
CZE
OEC
D
JPN
FRA
ESP
MEX CH
L
BEL
ITA
DEU
NO
R
CH
E
CAN IS
R
IRL
B. Occupancy rate of curative (acute) care beds % of available beds
2015 2005
0.0
50.0
100.0
150.0
200.0
250.0
300.0
MEX
CAN CH
L
PRT
ISL
ESP
ITA
NLD JP
N
USA
GBR IR
L
NZL
LUX
DN
K
SWE
OEC
D
ISR
KOR
NO
R
BEL
FIN
POL
TUR
EST
CH
E
AUS
FRA
SVN
LVA
GR
C
HU
N
SVK
CZE
DEU AU
TC. Hospital discharges
Per 1 000 inhabitants2015 2005
ECO/WKP(2018)70 │ 29
IMPROVING THE CZECH HEALTH CARE SYSTEM Unclassified
The Czech DRG system is based on the International defined DRG system. 1 057 groups
exist currently. The groups were initially created by the National Reference Centre (NRC).
Since 2015 it is under the Institute of Health Information and Statistics (ÚZIS). However,
since 2014 the relative weights list published every year by the Ministry of Health has not
been updated. The relative weights were calculated based on data from only 12 hospitals,
which provided the data on a voluntary basis. The current system is not functioning
properly and does not reflect the real cost of health services. It does not allow to benchmark
hospital performance in terms of efficiency and best practices and select the subgroup that
is used to set prices.
A new DRG system has been under preparation for a couple of years under the programme
“DRG Restart”. It is currently being tested by a representative sample of over 40 hospitals
on a voluntary basis and the results will be compared with the current system. The
development of the new DRG system should be accelerated. It should be based on a broad
group of hospitals to guarantee enough variance in the information collected for each type
of health services. The DRG system should then be used for setting the prices of health
services but also to incentivise or reform underperforming hospitals based on a group of
best-performing hospitals.
In addition to the overcapacity illustrated by the number of hospital beds, there are issues
around the quality of infrastructure. Many psychiatric institutions, long-term care and
nursing facilities, and small rural hospitals are in need of modernisation (OECD and
European Observatory on Health Systems and Policies, 2017[19]). Given the quite high
number of hospitals and facilities and the low level of spending, it is not surprising that
capital investment is not sufficient to maintain the quality of infrastructure and equipment.
Investment in physical capital in the health sector at 0.5% of GDP is around the OECD
average (Figure 16).
Underinvestment is partly explained by the reimbursement scheme which does not take
into account the use of infrastructure. Therefore hospitals and health care facilities rely on
public subsidies and EU funds for investment. Health infrastructure investment and
modernisation should be better planned and co-ordinated across regions, as well as follow
an integrated approach in the financing of health at the hospital, regional and ministerial
level. For example, the management of acute ischemic strokes has been re-grouped in
stroke centres and resulted in major improvements. As a result, the probability to receive
the necessary treatment below the recommended threshold of 60 minutes is among the
highest in the EU.
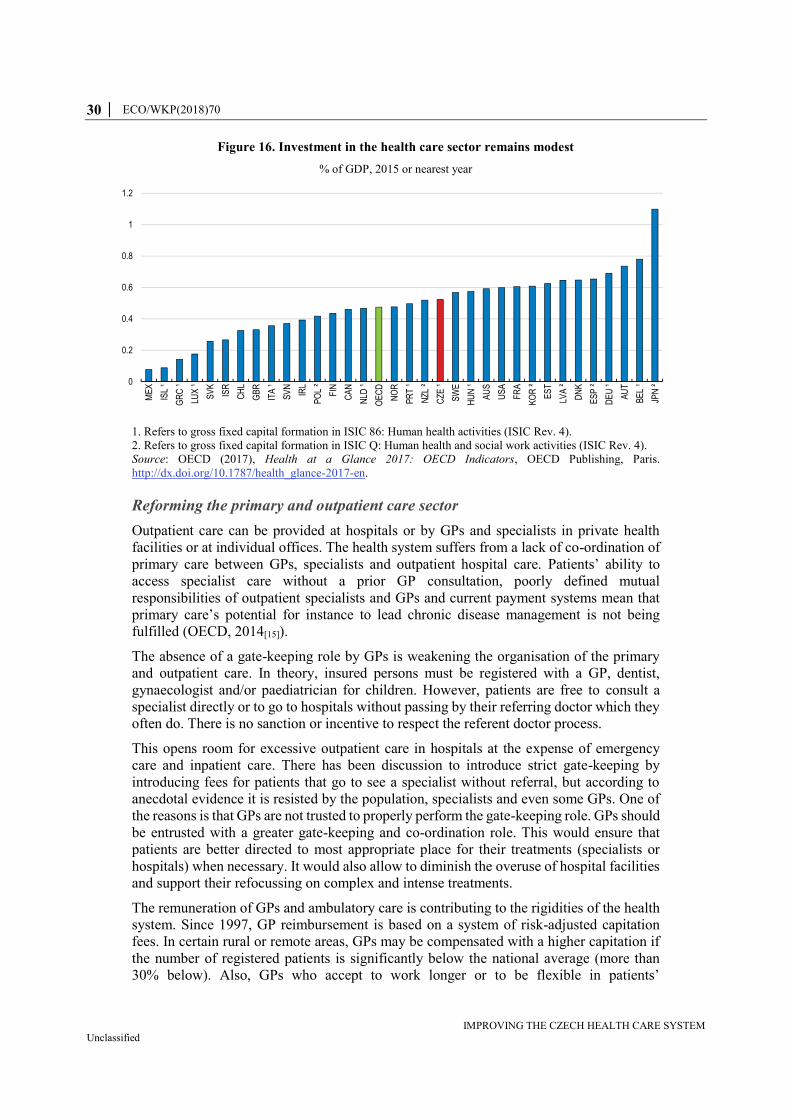
30 │ ECO/WKP(2018)70
IMPROVING THE CZECH HEALTH CARE SYSTEM Unclassified
Figure 16. Investment in the health care sector remains modest
% of GDP, 2015 or nearest year
1. Refers to gross fixed capital formation in ISIC 86: Human health activities (ISIC Rev. 4).
2. Refers to gross fixed capital formation in ISIC Q: Human health and social work activities (ISIC Rev. 4).
Source: OECD (2017), Health at a Glance 2017: OECD Indicators, OECD Publishing, Paris.
http://dx.doi.org/10.1787/health_glance-2017-en.
Reforming the primary and outpatient care sector
Outpatient care can be provided at hospitals or by GPs and specialists in private health
facilities or at individual offices. The health system suffers from a lack of co-ordination of
primary care between GPs, specialists and outpatient hospital care. Patients’ ability to
access specialist care without a prior GP consultation, poorly defined mutual
responsibilities of outpatient specialists and GPs and current payment systems mean that
primary care’s potential for instance to lead chronic disease management is not being
fulfilled (OECD, 2014[15]).
The absence of a gate-keeping role by GPs is weakening the organisation of the primary
and outpatient care. In theory, insured persons must be registered with a GP, dentist,
gynaecologist and/or paediatrician for children. However, patients are free to consult a
specialist directly or to go to hospitals without passing by their referring doctor which they
often do. There is no sanction or incentive to respect the referent doctor process.
This opens room for excessive outpatient care in hospitals at the expense of emergency
care and inpatient care. There has been discussion to introduce strict gate-keeping by
introducing fees for patients that go to see a specialist without referral, but according to
anecdotal evidence it is resisted by the population, specialists and even some GPs. One of
the reasons is that GPs are not trusted to properly perform the gate-keeping role. GPs should
be entrusted with a greater gate-keeping and co-ordination role. This would ensure that
patients are better directed to most appropriate place for their treatments (specialists or
hospitals) when necessary. It would also allow to diminish the overuse of hospital facilities
and support their refocussing on complex and intense treatments.
The remuneration of GPs and ambulatory care is contributing to the rigidities of the health
system. Since 1997, GP reimbursement is based on a system of risk-adjusted capitation
fees. In certain rural or remote areas, GPs may be compensated with a higher capitation if
the number of registered patients is significantly below the national average (more than
30% below). Also, GPs who accept to work longer or to be flexible in patients’
0
0.2
0.4
0.6
0.8
1
1.2
ME
X
ISL
¹
GR
C ¹
LUX
¹
SV
K
ISR
CH
L
GB
R
ITA
¹
SV
N
IRL
PO
L ²
FIN
CA
N
NLD
¹
OE
CD
NO
R
PR
T ¹
NZ
L ²
CZ
E ¹
SW
E
HU
N ¹
AU
S
US
A
FR
A
KO
R ²
ES
T
LVA
²
DN
K
ES
P ²
DE
U ¹
AU
T
BE
L ¹
JPN
²

ECO/WKP(2018)70 │ 31
IMPROVING THE CZECH HEALTH CARE SYSTEM Unclassified
appointments receive a bonus. However, some services, such as preventive examinations
and home visits are paid under the fee-for-service system (around 10 to 15% of GPs
revenues; Alexa et al., 2015[13]). Since 2007, ambulatory care specialists are paid under a
system of capped fee-for-service up to a pre-defined threshold adjusted annually. Above
the threshold, reimbursement fees decline (Alexa et al., 2015[13]).
One incentive for insured people to register with a GP is that it facilitates access by limiting
waiting times compared with ambulatory providers. Though there is no mandatory
threshold in the number of registrations a GP can take, some GPs reject or discourage
further registrations above certain limits. This is due to either workload or because some
insurance funds decrease capitation fees for additional patients if they deem the number of
registered patients too high.
Another factor contributing to high consultations of outpatient services is the number of
certificates requested from patients for reasons unrelated to health. For instance, employees
often have to provide a doctor’s certificate from the first day of absence onwards, otherwise
their absence is considered unexcused. This appears unnecessary as the first three days of
sick leave are unpaid and contribute to the excessive number of outpatient consultations.
The level of remuneration of doctors and medical workers is not an issue as the ratios of
Czech doctors and medical workers revenues to average earnings are fairly comparable to
those of OECD countries (OECD, 2017[2]). However, the design creates disincentives to
work more for some GPs. Anecdotal evidence suggests that some GPs and specialists limit
their activity after reaching a certain volume because of the decreasing reimbursement
(Alexa et al., 2015[13]).
A better mix of capitation fees and fee-for-service should be implemented, in particular for
GPs. Increasing the share of fee-for-services in GPs’ revenues could be linked to more
effective prevention activity and retraining. Also, introducing co-payments would bring
more responsible behaviour by insured individuals and GPs with regard to their patients.
For example, to not exclude certain population groups, co-payments could be imposed
when patients seek specialist advice without GPs referral. For both GPs and specialists, the
remuneration should include more quality-based components. Developing e-health and
including incentives for GPs and specialists to co-operate through an electronic health
system would also increase efficiency and limit the number of consultations and duplication
of acts due to information sharing.
Designing a long-term care strategy adapted to an ageing society
The demand for long-term care has increased in the Czech Republic as in other OECD
countries in recent years. The impact of ageing is already weighing on the capacity of long-
term care provisions. The share of the population aged 80 years and over is estimated to
rise from 4% in 2015 to 9% by 2050. The current organisation and financing of long-term
care is not prepared to absorb such increases in demand. Long-term care spending
represented 1.3% of GDP in 2015 (OECD, 2017[2]), of which 82% is for inpatient long-
term care. Long-term care spending in real terms has been increasing by 5% annually over
the last ten years, faster than the OECD average (OECD, 2017[2]) and represents more than
10% of health care spending (Figure 17, Panel A).
The social and health care aspects of long-term care have different organisation and funding
structures (ministries of Social Affairs and Health). While efforts to increase co-operation
between the two ministries have tried to optimise the efficiency of patient care, substantial
differences in funding create perverse incentives in the use of hospital facilities. Residential
32 │ ECO/WKP(2018)70
IMPROVING THE CZECH HEALTH CARE SYSTEM Unclassified
long-term care facilities and other social services are financed by central, regional or
municipal budgets, whereas health care facilities for long-term inpatient care are financed
primarily through the health insurance.
Since 2007, new legislation based on the principle of free choice of social services provides
a care allowance to individuals rather than to institutions. It also introduced a funding
mechanism that permitted (a) health-care facilities to finance some forms of social care
from the state or regional budgets; and (b) social care facilities to finance some services
through contracts with the health insurance funds.
The individual care allowance led to lower budgets for established care institutions and to
the development of informal carers. The monthly allowance varies between CZK 880
(EUR 34.70) and CZK 13 200 (EUR 520.50) depending on health status and age.
Individuals can use the allowance to remunerate informal carers including family members.
It seems that there is a mismatch between the supply of affordable residential long-term
social care facilities and demand (Alexa et al., 2015[13]).
A lack of co-ordination and differences in reimbursement of health care provided in
hospitals and long-term social care establishments contribute to the inefficient use of
hospital services. For example, user fees were abolished for health-care services, but still
exist in social care, creating incentives to seek long-term care in higher-cost medical care
rather than in social care (OECD and European Observatory on Health Systems and
Policies, 2017[19]). This has led to over-use of long-term inpatient care of hospitals
(Figure 17, Panel D). The occupation rate of these hospitals beds is around 100%. In
particular, the average length of stay is prolonged unnecessarily because of the lack of
places in care institutions. This situation is further aggravated by the reimbursement policy,
which is more favourable in the health care system and is based on per-day reimbursement
which incentivises longer stays.
There is a need to support the development of care institutions and to harmonise the
reimbursement policy of health care provided in hospitals and other facilities. Regional
authorities should be incentivised to ensure that enough long-term care institutions exist
within their borders, taking into account future developments. The development of
comprehensive home care offers an alternative to hospitalisation. Comprehensive home
care is a service of care and assistance provided to patients within their own social
environments. It is a medical service provided by nurses under physician supervision and
reimbursed by health insurance funds. The development of comprehensive home care
should be favoured as an alternative to a lengthy stay in a hospital. The level of the social
care allowance should be means-tested to ensure that individuals who wish to enter a social
care institution can also afford it. To limit undue increases of the cost of social care
institutions, a contractual policy can be set up with these social care institutions in terms of
pricing.
ECO/WKP(2018)70 │ 33
IMPROVING THE CZECH HEALTH CARE SYSTEM Unclassified
Figure 17. Long-term care
2015 or latest
Note: OECD average is the unweighted average of the data shown.
1. Data for Czech Republic refer to 2009 data.
2. The numbers of long-term care beds in hospitals are not available for Australia, Switzerland, Turkey and the
United Kingdom.
3. Long-term care share of total health care spending doesn’t include social long-term care spending.
Source: OECD (2017), OECD Health Statistics (database); OECD (2017), OECD Economic Surveys: Slovak
Republic 2017, OECD Publishing, Paris. http://dx.doi.org/10.1787/eco_surveys-svk-2017-en and OECD
(2017), Health at a Glance 2017: OECD Indicators, OECD Publishing, Paris.
http://dx.doi.org/10.1787/health_glance-2017-en.
The ageing of health practitioners is threatening access to health care
The number of physicians and health practitioners has been increasing over the last twenty
years and is above the OECD average (Figure 18, Panel A). The physician density is with
5.7 and 4.2 doctors per 1 000 population in urban and rural areas respectively (Figure 18,
Panel B).
Although the number of doctors currently is relatively high, the high average age of doctors
may soon result in supply constraints affecting coverage and quality of care. Between 2000
0
5
10
15
20
25
PR
T
ES
T
KO
R
ES
P
FR
A
SV
K
FIN
SV
N
HU
N
LUX
OE
CD
CZ
E
DE
U
AU
S
DN
K
NO
R
NZ
L
SW
E
NLD IS
R
CH
E
B. Share of long-term care recipients aged 65 years¹Percentage of population aged 65 and over
Institutions Home
0
2
4
6
8
10
12
14
PR
TS
VK
HU
NC
ZE
KO
RIR
LA
UT
ES
PC
AN
DE
UE
ST
OE
CD
JPN
AU
SN
ZL
NLD
DN
KC
HE
ISR
US
AS
WE
NO
R
C. Long-term care workers Per 100 people aged 65 and over
0
5
10
15
20
25
30
35
40
SV
KG
RC
AU
SH
UN
PO
LE
ST
ISR
ES
PLV
AP
RT
KO
RIT
AU
SA
CA
NA
UT
CZ
EO
EC
DF
RA
CH
ES
VN
LUX
GB
RIS
LB
EL
IRL
DN
KJP
ND
EU
SW
EF
INN
OR
NLD
A. Long-term care spendingPercentage of total current health care spending
58 69
0
10
20
30
40
50
60
70
80
90
100
TU
RP
OL
LVA
ITA
ISR
JPN
US
AA
UT
ES
PG
BR
CZ
EN
OR
DN
KO
EC
DE
ST
IRL
CA
NS
VN
AU
SD
EU
FR
AN
ZL
HU
NK
OR
SV
KIS
LF
INC
HE
SW
EB
EL
LUX
NLD
D. Long-term care beds in institutions and hospitals²
Per 1 000 population aged 65 and over
Institutions Hospitals

34 │ ECO/WKP(2018)70
IMPROVING THE CZECH HEALTH CARE SYSTEM Unclassified
and 2015, the proportion of doctors above 55 years has increased from 20% to 37%, one of
the highest in the OECD (Figure 18, Panel C). Among general practitioners, the share of
doctors close to retirement is even higher. In 2017, about one out of three general
practitioners was aged 60 years or older (ČLS-JEP, 2018[20]). Within the near future, the
retirement of these doctors poses a threat to maintain the accessibility to health care,
especially in rural areas (OECD and European Observatory on Health Systems and
Policies, 2017[19]; OECD, 2017[2]).
The mix of doctors providing basic and special primary care is also unbalanced with
significantly fewer generalists than specialists. 19% of doctors are generalists compared
with 30% in the OECD on average (OECD, 2017[2]). As primary care plays a key role for
a well-performing health system, the low share of GPs creates serious barriers to its
performance. The ageing of doctors can also be an issue for life-long training and the skill
mix. The incentives in the system, in particular, the heavy regulation of the activities of
GPs are not rewarding and may limit the investment in life-long training by practitioners.
As old GPs are less likely to undertake retraining to update their practices, they are less
trusted to play a gate-keeping role.
Emigration of doctors is also affecting the number of practitioners, though the emigration
rate is below the OECD average (Figure 19). Higher wages and better perceived working
conditions abroad are pushing Czech doctors to migrate or work abroad. Given the
proximity to Germany, emigration rates might not capture the whole picture as doctors may
commute to Germany for work, benefiting from better wages and work conditions. The
number of Czech doctors working in Germany has more than doubled since 2010, from
less than 500 to more than 1 000 (Bundesärztekammer, 2017[21]; 2011[22]). There is a need
to retain doctors as well as create incentives to attract more Czech students to enrol in health
faculties and also doctors from abroad to ensure sufficient supply in the medium to long-
term.
Though there is no formal limitation in access to health studies in terms of exams or
requirements, faculties may restrict the number of students accepted due to capacity limits.
International students who study in English pay tuition fees, which contribute to the budget.
However, they can add to capacity constraints. In 2016, these international students were
about 16% of total students in health care faculties (ÚZIS, 2018[23]). In the short-run, due
to the rapid ageing of Czech doctors, a plan should be put in place to increase the capacity
of Czech health faculties and the number of students that remain within the Czech Republic.
Financing of medical faculties should therefore be adjusted accordingly to guarantee that
they have enough resources to cope with increasing the number of students.
In principle, Czech legislation guarantees access to doctors and to health facilities within a
reasonable distance and time. To increase the incentives for doctors to settle in more remote
areas, a subsidy programme has been designed that covers the cost of setting up a new
medical clinic. In addition, greater reimbursements from health insurance funds are used
as additional measure to create incentives for doctors to settle in remote areas. These
incentive programmes should be closely monitored and regularly evaluated to adjust to
emerging needs in a timely manner.
ECO/WKP(2018)70 │ 35
IMPROVING THE CZECH HEALTH CARE SYSTEM Unclassified
Figure 18. Evolution in the number of practising physicians
Note: Unweighted OECD average. Panel A: Data for the Czech Republic from the OECD Health Statistics
database up to 2013. From 2014 onwards numbers are estimated on the basis of UZIS data on personnel capacity
of doctors in healthcare (registered and contractual doctors) and applying a correction coefficient to align with
available information of previous years. Panel B: Czech Republic, numbers refer to FTE, including additionally
pharmacists.
Source: OECD (2018), Health Statistics (database); UZIS (Institute of Health Information and Statistics of the
Czech Republic), Zdravotnictví ČR: Personální Kapacity 2016; and OECD (2017), Health at a Glance 2017.
2.5
2.7
2.9
3.1
3.3
3.5
3.7
3.9
2000 2001 2002 2003 2004 2005 2006 2007 2008 2009 2010 2011 2012 2013 2014 2015 2016
A. Physicians - total numberDensity per 1 000 inhabitants
CZE OECD
0
1
2
3
4
5
6
7
SVK CZE PRT HUN NOR CHE FIN SWE EST FRA LVA AUS CAN KOR JPN TUR
B. Physicians - urban versus ruralDensity per 1 000 inhabitants, 2015 or nearest year
Predominantly rural Predominantly urban
0
10
20
30
40
50
60
ITA
ISR
ES
T
FR
A
LVA
BE
L
DE
U
ISL
LUX
HU
N
DN
K
CZ
E
SV
K
JPN
US
A
OE
CD
CH
E
SW
E
CA
N
AU
T
ES
P
CH
L
NZ
L
SV
N
FIN
AU
S
NLD
NO
R
IRL
KO
R
GB
R
C. Share of doctors aged 55 years and overPer cent, 2000 and 2015 (or nearest year)
2015 2000
36 │ ECO/WKP(2018)70
IMPROVING THE CZECH HEALTH CARE SYSTEM Unclassified
Figure 19. The Emigration rate of doctors is high
Percentage of total number of doctors, 2015 or nearest year
Note: Share of doctors trained in the country, but working abroad. 2014 for Denmark, Japan, Sweden and the
United States. Data for OECD is the unweighted average of available country data.
Source: OECD (2017), OECD Health Statistics (database), Eurostat and UZIS (Institute of Health Information
and Statistics of the Czech Republic).
In contrast to doctors, the number of nurses at 8 per 1 000 population is slightly below the
OECD average (9 per 1 000 population). The ratio of nurses to doctors is also below the
OECD average (OECD, 2017[2]). The Czech Republic has among the lowest number of
nursing graduates in the OECD - 16 per 100 000 population (Figure 20, Panel C)—with a
decreasing trend in recent years.
While the remuneration of nurses is not particularly low in public hospitals compared with
other OECD countries, it is, however, low in private health care facilities (Figure 20, Panel
A). Moreover, the low remuneration in the private sector does not create an incentive to
enrol in nursing studies.
Given the ageing dynamic of the population, the demand for graduate nurses is increasing,
in particular in the long-term care sector. Therefore, more effort is needed to increase the
enrolment of students in nursing studies. In particular, a better regulation of wage settings
in the private sector through sectoral or branch negotiations could help to close the gap
with the public sector and attract more students. Adapting career prospects to make the
nursing profession more attractive, for instance by allowing greater responsibilities along
the career path, for example in preventive programmes and patient education of chronic
diseases as is the case in the UK (Delamaire and Lafortune, 2010[24]).
0
5
10
15
20
25
30
JPN
USA PR
T
KOR
NO
R
TUR
FRA
CH
L
FIN
ESP
SVN
CH
E
AUS
MEX IT
A
DEU
SWE
AUT
CZE
GBR
GR
C
CAN
OEC
D
NLD
DN
K
LVA
POL
BEL
ISR
LUX
NZL
SVK
HU
N
EST
IRL
ISL
%34 44
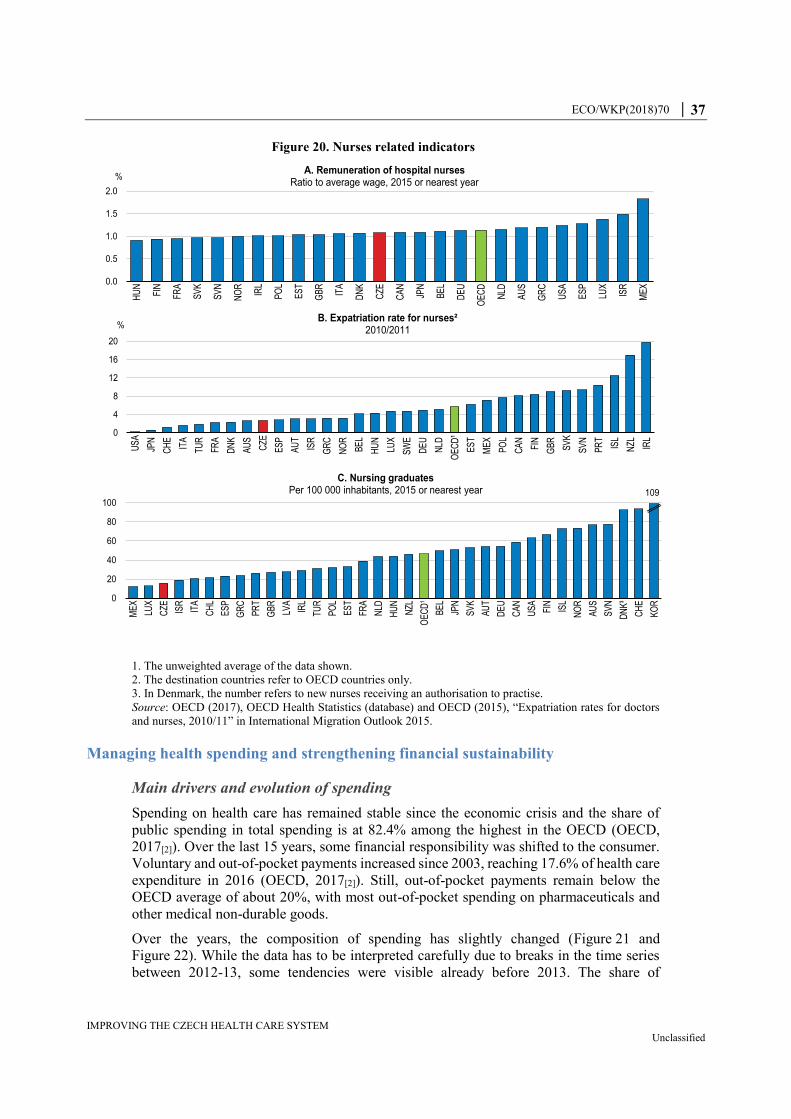
ECO/WKP(2018)70 │ 37
IMPROVING THE CZECH HEALTH CARE SYSTEM Unclassified
Figure 20. Nurses related indicators
1. The unweighted average of the data shown.
2. The destination countries refer to OECD countries only.
3. In Denmark, the number refers to new nurses receiving an authorisation to practise.
Source: OECD (2017), OECD Health Statistics (database) and OECD (2015), “Expatriation rates for doctors
and nurses, 2010/11” in International Migration Outlook 2015.
Managing health spending and strengthening financial sustainability
Main drivers and evolution of spending
Spending on health care has remained stable since the economic crisis and the share of
public spending in total spending is at 82.4% among the highest in the OECD (OECD,
2017[2]). Over the last 15 years, some financial responsibility was shifted to the consumer.
Voluntary and out-of-pocket payments increased since 2003, reaching 17.6% of health care
expenditure in 2016 (OECD, 2017[2]). Still, out-of-pocket payments remain below the
OECD average of about 20%, with most out-of-pocket spending on pharmaceuticals and
other medical non-durable goods.
Over the years, the composition of spending has slightly changed (Figure 21 and
Figure 22). While the data has to be interpreted carefully due to breaks in the time series
between 2012-13, some tendencies were visible already before 2013. The share of
0
20
40
60
80
100
ME
X
LUX
CZE IS
R
ITA
CH
L
ES
P
GR
C
PR
T
GB
R
LVA
IRL
TUR
PO
L
ES
T
FRA
NLD
HU
N
NZL
OE
CD
¹
BE
L
JPN
SV
K
AU
T
DE
U
CA
N
US
A
FIN
ISL
NO
R
AU
S
SV
N
DN
K³
CH
E
KO
R
C. Nursing graduatesPer 100 000 inhabitants, 2015 or nearest year 109
0.0
0.5
1.0
1.5
2.0
HU
N
FIN
FRA
SV
K
SV
N
NO
R
IRL
PO
L
ES
T
GB
R
ITA
DN
K
CZE
CA
N
JPN
BE
L
DE
U
OE
CD
NLD
AU
S
GR
C
US
A
ES
P
LUX
ISR
ME
X
%A. Remuneration of hospital nurses
Ratio to average wage, 2015 or nearest year
0
4
8
12
16
20
US
A
JPN
CH
E
ITA
TUR
FRA
DN
K
AU
S
CZE
ES
P
AU
T
ISR
GR
C
NO
R
BE
L
HU
N
LUX
SW
E
DE
U
NLD
OE
CD
¹
ES
T
ME
X
PO
L
CA
N
FIN
GB
R
SV
K
SV
N
PR
T
ISL
NZL IR
L
%B. Expatriation rate for nurses²
2010/2011
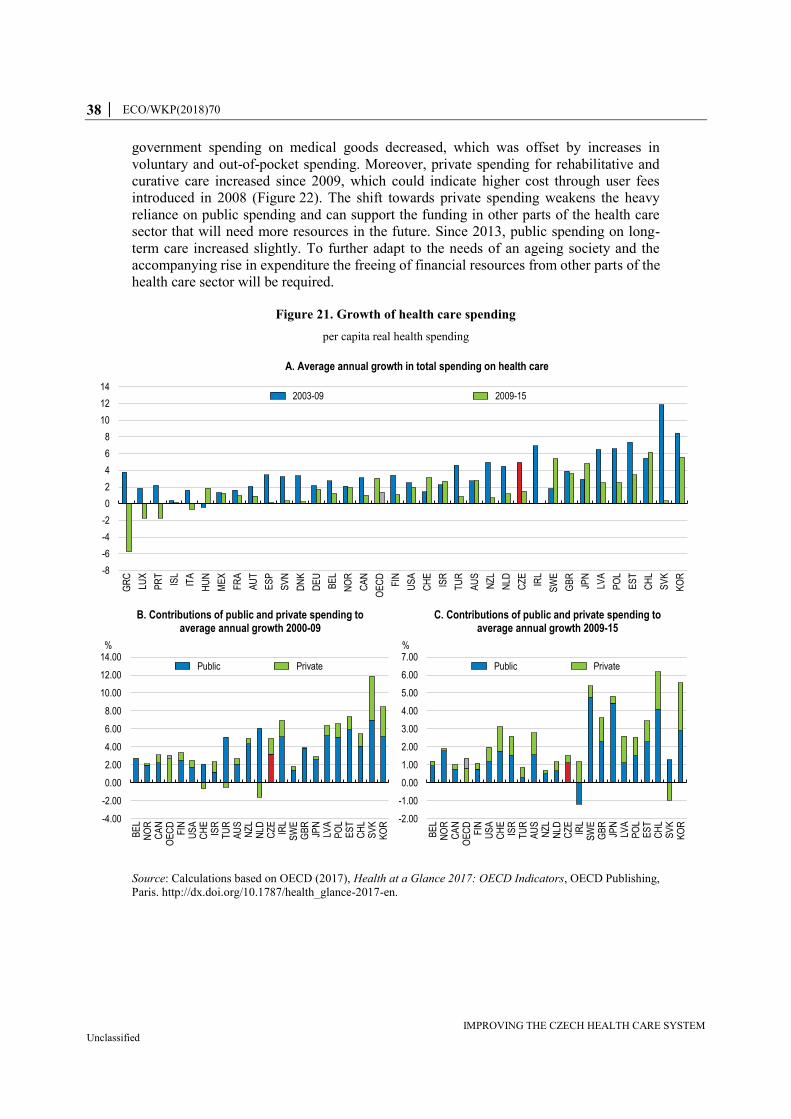
38 │ ECO/WKP(2018)70
IMPROVING THE CZECH HEALTH CARE SYSTEM Unclassified
government spending on medical goods decreased, which was offset by increases in
voluntary and out-of-pocket spending. Moreover, private spending for rehabilitative and
curative care increased since 2009, which could indicate higher cost through user fees
introduced in 2008 (Figure 22). The shift towards private spending weakens the heavy
reliance on public spending and can support the funding in other parts of the health care
sector that will need more resources in the future. Since 2013, public spending on long-
term care increased slightly. To further adapt to the needs of an ageing society and the
accompanying rise in expenditure the freeing of financial resources from other parts of the
health care sector will be required.
Figure 21. Growth of health care spending
per capita real health spending
Source: Calculations based on OECD (2017), Health at a Glance 2017: OECD Indicators, OECD Publishing,
Paris. http://dx.doi.org/10.1787/health_glance-2017-en.
-8
-6
-4
-2
0
2
4
6
8
10
12
14
GR
C
LUX
PR
T
ISL
ITA
HU
N
ME
X
FR
A
AU
T
ES
P
SV
N
DN
K
DE
U
BE
L
NO
R
CA
N
OE
CD
FIN
US
A
CH
E
ISR
TU
R
AU
S
NZ
L
NLD
CZ
E
IRL
SW
E
GB
R
JPN
LVA
PO
L
ES
T
CH
L
SV
K
KO
R
A. Average annual growth in total spending on health care
2003-09 2009-15
-4.00
-2.00
0.00
2.00
4.00
6.00
8.00
10.00
12.00
14.00
BE
LN
OR
CA
NO
EC
DF
INU
SA
CH
EIS
RT
UR
AU
SN
ZL
NLD
CZ
EIR
LS
WE
GB
RJP
NLV
AP
OL
ES
TC
HL
SV
KK
OR
%
B. Contributions of public and private spending to average annual growth 2000-09
Public Private
-2.00
-1.00
0.00
1.00
2.00
3.00
4.00
5.00
6.00
7.00
BE
LN
OR
CA
NO
EC
DF
INU
SA
CH
EIS
RT
UR
AU
SN
ZL
NLD
CZ
EIR
LS
WE
GB
RJP
NLV
AP
OL
ES
TC
HL
SV
KK
OR
%
C. Contributions of public and private spending to average annual growth 2009-15
Public Private

ECO/WKP(2018)70 │ 39
IMPROVING THE CZECH HEALTH CARE SYSTEM Unclassified
Figure 22. Composition of health expenditure
Per cent, 2003-15
Source: Calculations based on OECD (2017), Health at a Glance 2017: OECD Indicators, OECD Publishing,
Paris. http://dx.doi.org/10.1787/health_glance-2017-en.
To raise the efficiency of health spending, the government has initiated a shift from
inpatient to outpatient care and day care and changes in the spending pattern since 2013
indicate a small shift from inpatient to outpatient care so far (OECD, 2018[25]).
The decline in spending in the pharmaceutical sector towards the OECD average is an
example of better cost efficiency. To improve the control and transparency of
pharmaceutical spending, the State Institute for Drug Control (SÚKL) has been responsible
both for setting the maximum ex‐factory price and for decisions on reimbursements since
2008. Prices are only regulated for reimbursable pharmaceuticals, and are set at ex-factory
or statutory prices. The ex‐factory price of a certain pharmaceutical is set as the average
price of the three lowest manufacturing prices of the particular drugs in reference countries.
In combination with reimbursement rules that incentivise customers to purchase generic
substitutes, price growth has slowed due to a higher share of generic drugs (see Figure 23).
The penetration of generic drugs is a policy priority. Since 2008, a doctor can either
prescribe the generic or the original drug. If not explicitly prohibited on the prescription,
0
10
20
30
40
50
60
70
80
90
100
2003 2006 2009 2012 2015
A. Governemt spending
Curative and rehabilitative care Long-term care (health)
Ancillary services (non-specified by function) Medical goods (non-specified by function)
Preventive care Governance and health system and financing administration Other
0
10
20
30
40
50
60
70
80
90
100
2003 2006 2009 2012 2015
B. Voluntary and out-of-pocket payments
0
10
20
30
40
50
60
70
80
90
100
2003 2004 2005 2006 2007 2008 2009 2010 2011 2012 2013 2014 2015
C. Total
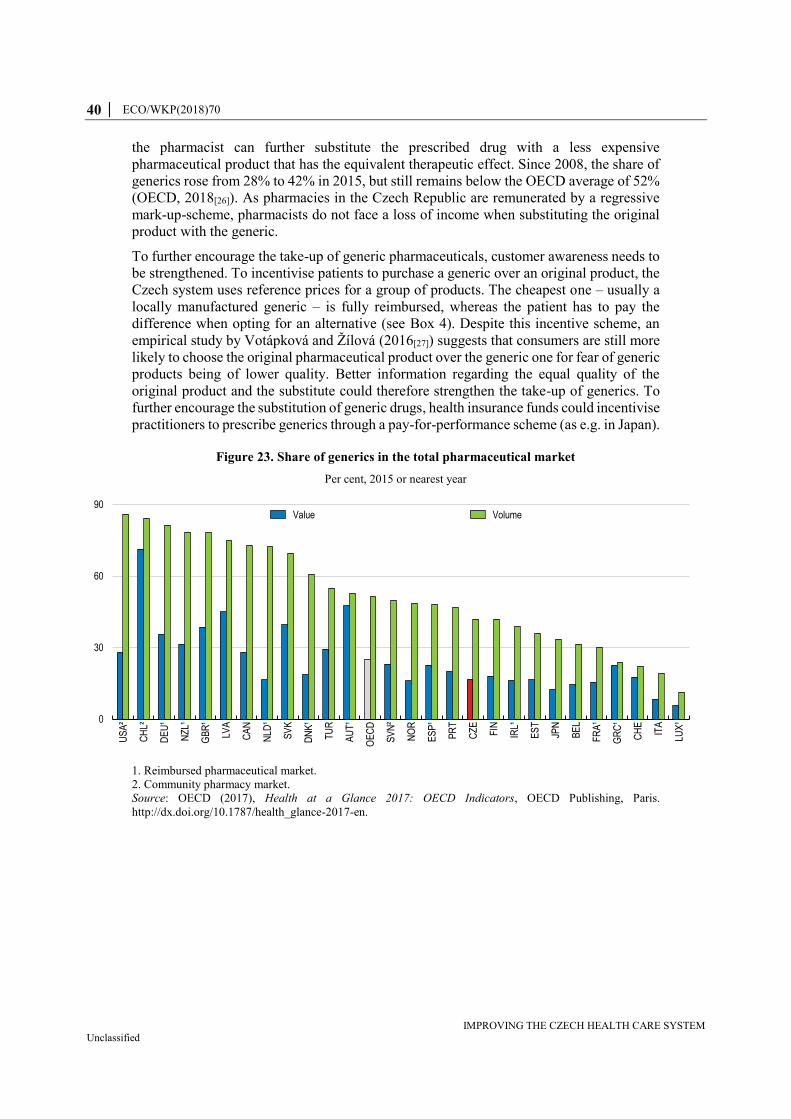
40 │ ECO/WKP(2018)70
IMPROVING THE CZECH HEALTH CARE SYSTEM Unclassified
the pharmacist can further substitute the prescribed drug with a less expensive
pharmaceutical product that has the equivalent therapeutic effect. Since 2008, the share of
generics rose from 28% to 42% in 2015, but still remains below the OECD average of 52%
(OECD, 2018[26]). As pharmacies in the Czech Republic are remunerated by a regressive
mark-up-scheme, pharmacists do not face a loss of income when substituting the original
product with the generic.
To further encourage the take-up of generic pharmaceuticals, customer awareness needs to
be strengthened. To incentivise patients to purchase a generic over an original product, the
Czech system uses reference prices for a group of products. The cheapest one – usually a
locally manufactured generic – is fully reimbursed, whereas the patient has to pay the
difference when opting for an alternative (see Box 4). Despite this incentive scheme, an
empirical study by Votápková and Žílová (2016[27]) suggests that consumers are still more
likely to choose the original pharmaceutical product over the generic one for fear of generic
products being of lower quality. Better information regarding the equal quality of the
original product and the substitute could therefore strengthen the take-up of generics. To
further encourage the substitution of generic drugs, health insurance funds could incentivise
practitioners to prescribe generics through a pay-for-performance scheme (as e.g. in Japan).
Figure 23. Share of generics in the total pharmaceutical market
Per cent, 2015 or nearest year
1. Reimbursed pharmaceutical market.
2. Community pharmacy market.
Source: OECD (2017), Health at a Glance 2017: OECD Indicators, OECD Publishing, Paris.
http://dx.doi.org/10.1787/health_glance-2017-en.
0
30
60
90
US
A²
CH
L²
DE
U¹
NZ
L¹
GB
R¹
LVA
CA
N
NLD
¹
SV
K
DN
K¹
TU
R
AU
T¹
OE
CD
SV
N²
NO
R
ES
P¹
PR
T
CZ
E
FIN
IRL¹
ES
T
JPN
BE
L
FR
A¹
GR
C¹
CH
E
ITA
LUX
¹
Value Volume
ECO/WKP(2018)70 │ 41
IMPROVING THE CZECH HEALTH CARE SYSTEM Unclassified
Box 4. Reimbursement policy for pharmaceuticals
Reimbursement is based on reference groups, which are groups of
pharmaceuticals with similar effectiveness, safety profile and clinical use, and
are considered to be therapeutically interchangeable. All pharmaceuticals within
the same reference group have the same reimbursement price. It is also possible
to give a premium reimbursement price if a drug has better effectiveness, a better
safety profile or a better compliance rate than the reference product. The list of
reference groups includes about 300 groups of pharmaceuticals based on
therapeutic indications issued by the Ministry of Health.
The reimbursement price is set at the lowest EU price of a pharmaceutical within
each reference group. Only if the lowest EU price is considered to be too low,
the reimbursement price is set as the average of the two following lowest EU
prices of the reference product.
The Act on Public Health Insurance (Act. No. 48/1997 Coll.) also specifies 195
clusters of pharmaceuticals within which at least one product should be fully
reimbursed. In this case reimbursement price is not set based on the lowest EU
price but according to the lowest Czech price. In general, the cheapest out of a
defined group of pharmaceuticals is fully reimbursed, whereas the patient has to
pay the difference to the reference price when purchasing other pharmaceuticals.
The reimbursement policy also allows to set a second reimbursement price for a
specific group of patients or a specific indication, which is not covered by
reimbursement of the reference product.
Source: SÚKL (2018[28]), “Pricing and Reimbursement”.
Strengthening the financing of the health care system
The main sources of revenue for the social insurance system are compulsory contributions
that are levied on wages (Figure 24, Panel A). Employers and employees pay 13.5% of
gross wages, split into 9% for the employer and 4.5% for the employee. Self-employed pay
13.5% based on 50% of their profits, but at least CZK 2 024 per month (EUR 80). The
contribution is directly collected by the health insurance funds. For the economically
inactive population, the state covers the contributions on their behalf (CZK 969 per month
in 2018, EUR 38). The money for the economically inactive is paid by the Ministry of
Finance to the Health Insurance funds. In 2016, 64.9% of the revenue of health insurance
funds was coming from the employed, 6.6% from self-employed and the remaining 28.5%
from state contributions (Úzis, 2017[29]).
Capital investment in health facilities that are managed by the Ministry of Health or that
fall under the responsibility of the regional authorities are channelled through a budget that
is funded by general taxation. In addition, capital investment can be covered by EU
structural and cohesion funds from the Integrated Operational Programme of the Czech
Republic. In 2016, spending of state, regional and municipal budgets accounted for 6.3%
of total health expenditure (Úzis, 2017[29]).
The Ministry of Health also provides direct financing for public health services, covering
some of the costs of training medical personnel, running a variety of specialised health
services, air emergency services, conducting medical research, and providing postgraduate

42 │ ECO/WKP(2018)70
IMPROVING THE CZECH HEALTH CARE SYSTEM Unclassified
education to physicians. The medical rescue service is subsidised by regional governments
(Alexa et al., 2015[13]).
Figure 24. Financing sources of health insurance
1. There are four different groups of contributors in the social insurance scheme. Average monthly contributions
are estimated from information on total revenues of social insurance funds broken down by each group of
contributors. Additional information used for the estimation covers the number of employed and self-employed,
average wage, general assessment base and estimates of contributors among different groups. The estimates are
intended to express full-time equivalents, however, especially in the case of the self-employed, the information
base is not complete.
Source: OECD (2017), Health at a Glance 2017: OECD Indicators, OECD Publishing, Paris.
http://dx.doi.org/10.1787/health_glance-2017-en; Czech social insurance funds and Czech Statistical Office.
To increase revenues and allow more spending on health care in the future, the tax base
needs to be broadened. The health funding is based on the solidarity system which relies
heavily on contributions paid by employers and employees, whereas the contributions of
the self-employed and from the state are considerably lower (Figure 24, Panel B). Within
the current contribution scheme, contributions by the self-employed could be increased
gradually. In particular, the basis of self-employed contributions should be better defined
to reflect their real contribution capacity (OECD, 2018[30]).
The contribution from the state will not be sufficient in covering the cost of health care,
although the set-up acts as an automatic stabiliser in times of an economic downturn. As
such, the financial sustainability of the health care system is vulnerable to economic shocks
and demographic change. The more people shift from employment to inactivity, the lower
the total contributions to the health system. This financing of the system is therefore pro-
cyclical and following the financial crisis, the largest health insurance fund VZP ran up
debt (Alexa et al., 2015[13]). In addition to increasing state contributions, alternative
solutions to rebalance revenues are needed, addressing both the cyclicality and diminishing
revenues from economically active people due to population ageing. Government
contributions should be linked more tightly to health spending to cover economically
inactive people.
To cover public expenditure of the health care system, revenues from general taxation for
the health care sector should be broadened. One way is to set a contribution rates on all
kind of revenues (capital and property income for instance), not only on wages, and
therefore ensure that all revenues are contributing to health. In addition, taxes with potential
0
10
20
30
40
50
60
70
80
90
100
USA CHL JPN FIN BEL CZE KOR EST SVN POL
%
A. Financing sources of compulsory insuranceTransfers from government
SIC from employees
SIC from employers
SIC from self-employed
SIC from others
Other
0.0
0.5
1.0
1.5
2.0
2.5
3.0
3.5
4.0
Employees Self-employed Individualswithout taxable
income
State insured
Thousand CZK
B. Estimated average monthly contribution by group of insured ¹
2010 2016
ECO/WKP(2018)70 │ 43
IMPROVING THE CZECH HEALTH CARE SYSTEM Unclassified
behavioural effects that reduce the need for spending on health care and add to overall
revenues could be introduced or increased. As discussed below, higher taxes on tobacco
and alcohol may not only raise revenue, but also create incentives for consumers to reduce
consumption and thereby related health problems.
Increasing and broadening co-payments can promote cost-efficient consumption of health
care. For services that are not covered by insurance, the patient has to pay the expenses
directly to the service provider. The main cost for patients is related to pharmaceuticals and
medical goods (8.8%) and for providers of ambulatory health care (4.9%) (OECD,
2018[25]). While out-of-pocket payments as a share of final household consumption remain
low if compared with countries with a similar institutional setting (Korea: 5.1%, Greece:
4.9%) and the OECD average of about 3%, out-of-pocket payments have been slowly
increasing over the years reaching 2.4% of final household consumption in 2015
(Figure 25, Panel A). Out-of-pocket payments could be broadened but reduced for
pharmaceuticals and dental care.
To reduce the number of consultations and increase private participation in health funding,
a system of user fees was introduced in 2008. A physician visit with clinical examination
cost CZK 30 (around EUR 1.10); every item on a drug prescription CZK 30; and CZK 60
for each day of inpatient care and CZK 90 for emergency services. The introduction of user
fees was highly criticised and in 2011 the prescription fee was altered to CZK 30
(EUR 1.10) per prescription (not per item on the prescription) and the fee per inpatient day
was increased from CZK 60 (EUR 2.20) to CZK 100 (EUR 3.65). Despite a lack of
empirical evidence, in July 2013 the Constitutional Court decided that this increase was
unfair to vulnerable groups and the fee was abolished. The government abolished all
remaining fees in January 2015, except the fees for emergency services.
Co-payments for pharmaceuticals, dental care and health tools and aids are, however, still
in place (Figure 25, Panel C). For pharmaceuticals, most of the prescribed drugs in
outpatient care are only partially covered by public health insurance, with the patient having
to cover the rest.
The impact of user fees and co-payments on health care consumption is a disputed issue
since the Rand Health Insurance experiment (Manning et al., 1987[31]). The randomised
experiment was initiated by the US federal government in 1974 to evaluate the effect of
user-fees on health care consumptions. Based on this experience, Manning et al. (1987[31])
found that higher patient payments significantly reduced medical care utilisation, without
any effect on health outcomes on average. This result was confirmed by Chandra et al.
(2010[32]) for elderly persons in the US but with compensation effects on inpatient care, in
particular among the most vulnerable groups. In France (Chiappori, Durand and Geoffard,
1998[33]) and in South Korea (Kim, Ko and Yang, 2005[34]), user charges were not found to
reduce health care consumption. Research in Germany, Japan and other countries found
mixed results of higher user charges on health care or drug consumption.
44 │ ECO/WKP(2018)70
IMPROVING THE CZECH HEALTH CARE SYSTEM Unclassified
Figure 25. Out-of-pocket medical spending is low
Percentages, 2015 or nearest available
Note: Indicators shown relate to current health spending excluding long-term care (health) expenditure.
Source: OECD (2017), Health at a Glance 2017: OECD Indicators, OECD Publishing, Paris.
http://dx.doi.org/10.1787/health_glance-2017-en.
In the Czech Republic, results are also mixed. While Hromádková and Zdeněk (2013[35])
find that user fees had some (although limited) effects on drug demand, Zápal (2010[36]) do
not find a response. Žílová and Votápková (2012[37]) find that the effect of the abolition of
user charges on the number of doctor visits is insignificant. An often used argument against
user fees was the potential deterrence of lower-income populations at the margin in
requesting health care (International Organisation of Migration, 2016[7]).
The lessons from the empirical and theoretical studies of the effects of co-payments on
health care consumption are thus mixed. First, country-specific institutional features (basic
coverage, complementary insurance, private sector role, pricing policy, etc.) matter for the
design of the scheme. Besides other effects, it influences public perceptions and acceptance
0
1
2
3
4
5
6
FR
A
LUX
GB
R
DE
U
SV
N
NZ
L
CA
N
CZ
E
SV
K
NLD
US
A
IRL
PO
L
JPN
DN
K
ES
T
NO
R
OE
CD
AU
T
FIN ITA
ISL
AU
S
BE
L
SW
E
ISR
ME
X
ES
P
PR
T
LVA
CH
L
HU
N
GR
C
KO
R
CH
E
A. Out-of-pocket medical spending as a share of household final consumption
0
10
20
30
40
50
60
SV
K
ES
P
ME
X
CA
N
DN
K
CZ
E
ES
T
PO
L
GR
C
DE
U
AU
S
NLD
LVA
NO
R
SW
E
FIN
KO
R
BE
L
ISL
GB
R
ISR
AU
T
HU
N
SV
N
JPN
LUX
FR
A
OE
CD
CH
E
ITA
IRL
PR
T
B. Out-of-pocket medical spending as a share of total current health care spending
0
10
20
30
40
50
60
SV
K
ES
P
ME
X
CA
N
DN
K
CZ
E
ES
T
PO
L
GR
C
DE
U
AU
S
NLD
LVA
NO
R
SW
E
FIN
KO
R
BE
L
ISL
GB
R
ISR
AU
T
HU
N
SV
N
JPN
LUX
FR
A
OE
CD
CH
E
ITA
IRL
PR
T
C. Share of out-of-pocket spending in retail pharmaceutical spending

ECO/WKP(2018)70 │ 45
IMPROVING THE CZECH HEALTH CARE SYSTEM Unclassified
of the scheme, which has become one of the main lessons from the Czech experience.
Second, to be effective, co-payments must not be too low or too high. Regarding the above
empirical studies, the Czech case seems to have suffered from user fees that were too low
(especially in the case of the CZK 30 fees for a doctor’s visit). It did not affect much the
patients’ behaviour, but brought an extra administrative burden for doctors. Finally, to
minimise eviction effects on inpatient care, vulnerable groups (low income, chronic
diseases) should be exempted or the annual amount of co-payments capped.
There is room for reintroducing a better designed system of co-payments in the Czech
Republic. The biggest challenge is currently with respect to public perceptions and political
sensitivity. Any change must be accompanied with profound informational campaign. The
size of fees should be evaluated to ensure a positive pay-off taking into account the
administrative burden. One way could be to exclude GPs and introduce co-payments for
visits to specialists and hospital visits without referral, which would also strengthen their
gate-keeping role.
The role of the health insurance funds
Health insurance funds have little room to compete with each other in terms of services and
prices. The services that are covered by health insurance companies are anchored in the Act
on Public Health Insurance, which defines a broad benefit package. Providing additional
services is often not viable as there is no price competition for attracting or incentivising
the insured person to move to another fund. As discussed above, the reimbursement of
health care services is based on contracts between providers and health insurance funds, so
that there is no direct channel to provide financial incentives to the end consumer of health
care to avoid unnecessary demand or encourage a healthier lifestyle. However, setting up
a system that allows insurers to negotiate more effectively the fees with the service
providers that are for example linked to their performance can provide room for
competition on quality. Further, creating flexibility in the system to allow for contractual
policies between insurance funds and individuals could be used to support preventive care
and healthy behaviour. For example, lower fees for people who participate in preventive
exercise and medical screening programmes could create incentive to adjust towards a
healthy lifestyle.
The risk-adjustment redistribution scheme was reformed and enacted in January 2018,
opening the possibility for improving the quality of care for chronic patients. The switch
from a risk-adjustment scheme based solely on gender and age towards a more
sophisticated PCG system avoids the selection of good risks of health insurance funds (see
Box 1). Moreover, the current system is more beneficial towards health insurance funds
that have more patients with chronic diseases. Encouraging health insurance companies to
attract chronic patients may ultimately lead to a better quality of care. For example, health
insurance companies could set up a specialised network by focussing on contracting
relevant health providers and by optimising patients’ pathways and treatment methods.
Greater competition in the health insurance market could improve the quality of care
(Porter and Teisberg, 2004[38]; Gaynor, 2006[39]). While managing the reimbursement
claims, the health insurance funds already monitor service providers’ activity within their
network. Collecting additional information about the quality of care and allowing insurance
funds adjust reimbursement accordingly could benefit the overall quality of health care
(OECD, 2014[15]).

46 │ ECO/WKP(2018)70
IMPROVING THE CZECH HEALTH CARE SYSTEM Unclassified
Ageing will account for roughly half of the future rise in health care spending
The population is ageing rapidly. The share of people aged 65 years and above will reach
almost 30% by 2050 (Figure 26). Although the impact of ageing on health spending is
uncertain, recent estimates show an upward pressure on public health care expenditure in
the next four decades. Under the assumption of no policy change and disregarding the non-
demographic factors, public expenditure on health care is set to rise from 6.2% in 2016 to
8.2% of GDP around 2060 just because of ageing (Figure 29).
Figure 26. The population is ageing rapidly
Source: OECD (2017), Health at a Glance 2017: OECD Indicators, OECD Publishing, Paris.
http://dx.doi.org/10.1787/health_glance-2017-en.
This demographic scenario takes into account death-related costs and assumes that gains in
life expectancy are mostly spent in good health. This assumption is extrapolating past
trends. For example, disability-adjusted life years (DALY), the sum for the whole
population of the number of years that were lost due to any disease or injury, have been
decreasing during the last quarter century (Figure 27, Panel A and B). Although the trend
is still decreasing, the pace has slowed down after 2000 because of rising years lived with
disability (Figure 27, Panel A). The growth of years lived with disability is driven mainly
0
5
10
15
20
25
30
35
40
ISR
ME
X
TU
R
US
A
AU
S
LUX
NZ
L
NO
R
CH
L
DN
K
SW
E
ISL
GB
R
IRL
CA
N
FIN
BE
L
FR
A
OE
CD
LVA
NLD
HU
N
SV
K
CH
E
ES
T
CZ
E
AU
T
DE
U
PO
L
SV
N
ITA
KO
R
GR
C
PR
T
ES
P
JPN
%
A. Population aged 65 years and over
2015 2050
0
2
4
6
8
10
12
14
16
ME
X
TU
R
ISR
HU
N
SV
K
IRL
AU
S
CH
L
LUX
US
A
NO
R
CZ
E
LVA
ISL
NZ
L
SW
E
DN
K
PO
L
ES
T
GB
R
OE
CD
FIN
BE
L
CA
N
FR
A
NLD
CH
E
SV
N
AU
T
GR
C
DE
U
PR
T
ES
P
KO
R
ITA
JPN
%
B. Population aged 80 years and over
2015 2050
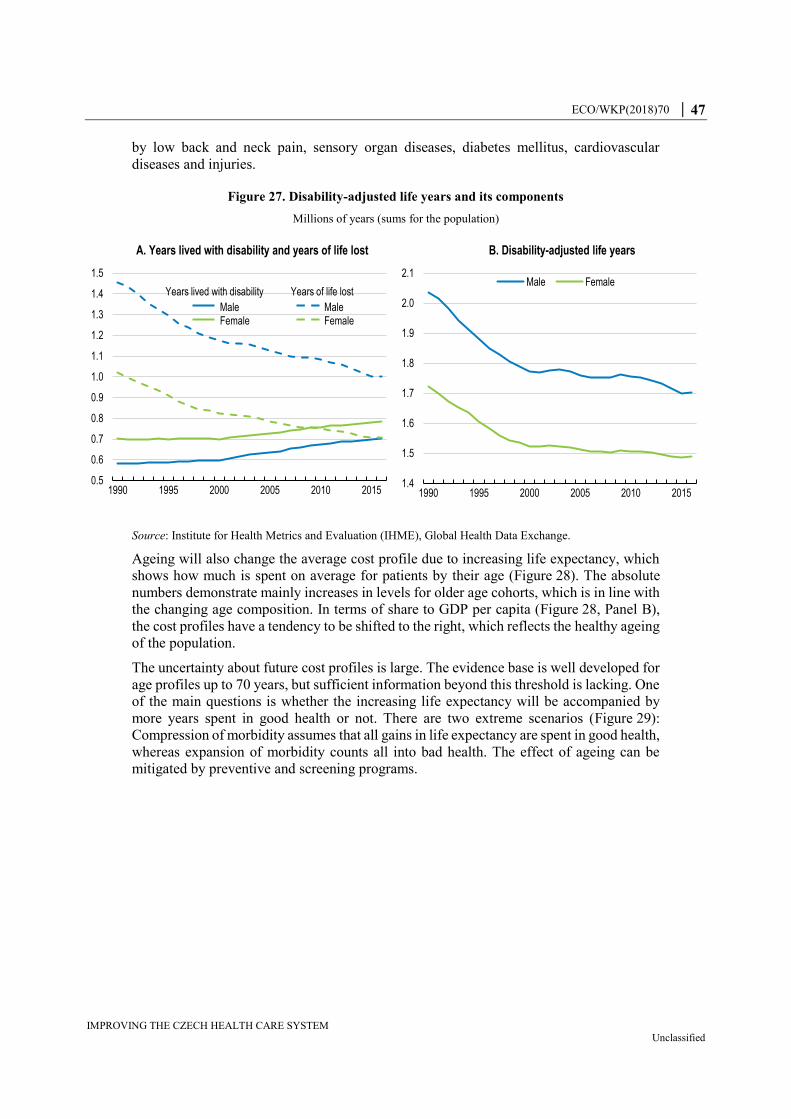
ECO/WKP(2018)70 │ 47
IMPROVING THE CZECH HEALTH CARE SYSTEM Unclassified
by low back and neck pain, sensory organ diseases, diabetes mellitus, cardiovascular
diseases and injuries.
Figure 27. Disability-adjusted life years and its components
Millions of years (sums for the population)
Source: Institute for Health Metrics and Evaluation (IHME), Global Health Data Exchange.
Ageing will also change the average cost profile due to increasing life expectancy, which
shows how much is spent on average for patients by their age (Figure 28). The absolute
numbers demonstrate mainly increases in levels for older age cohorts, which is in line with
the changing age composition. In terms of share to GDP per capita (Figure 28, Panel B),
the cost profiles have a tendency to be shifted to the right, which reflects the healthy ageing
of the population.
The uncertainty about future cost profiles is large. The evidence base is well developed for
age profiles up to 70 years, but sufficient information beyond this threshold is lacking. One
of the main questions is whether the increasing life expectancy will be accompanied by
more years spent in good health or not. There are two extreme scenarios (Figure 29):
Compression of morbidity assumes that all gains in life expectancy are spent in good health,
whereas expansion of morbidity counts all into bad health. The effect of ageing can be
mitigated by preventive and screening programs.
0.5
0.6
0.7
0.8
0.9
1.0
1.1
1.2
1.3
1.4
1.5
1990 1995 2000 2005 2010 2015
A. Years lived with disability and years of life lost
Years lived with disability
FemaleMaleFemale
Male
Years of life lost
1.4
1.5
1.6
1.7
1.8
1.9
2.0
2.1
1990 1995 2000 2005 2010 2015
B. Disability-adjusted life years
Male Female
48 │ ECO/WKP(2018)70
IMPROVING THE CZECH HEALTH CARE SYSTEM Unclassified
Figure 28. Evolution of health care cost profile over population age cohorts
Health care cost per capita profiles ¹
1. The cost profiles for health care expenditure express how much on average it is paid for an insured by age.
If the shape of the profile remains unchanged over time, but population is ageing (i.e. there are more people in
the right part of the graph), it means more overall costs. The assumption of healthy ageing implies the profile
shifts to the right. At the same time, health care expenditure can rise by other reasons than demographic, which
would cause a shift in levels upwards.
2. Deflated by GDP deflator.
3. In order to separate the income effect, this picture shows the profiles as ratios to GDP per capita. It depicts
what would be the ratio of health care expenditure to GDP if the whole population was from a given age cohort.
Source: Calculations based on data from OECD (2017), System of Health Accounts (database), Czech
Statistical Office and Eurostat.
However, the demographic factors explain only a small part of the future development of
health care spending. In line with recent research (de la Maisonneuve and Oliveira Martins,
2013[40]; Medeiros and Schwierz, 2013[41]), the major drivers of health care expenditure are
the non-demographic factors such as technological and institutional improvements
(Figure 29, Panel B). The “cost pressure” scenario assumes that non-demographic factors
have a large effect on health care expenditure, while the “cost containment” scenario
implies that the impact of non-demographic factors diminishes over the projection horizon.
In upcoming decades, however, these factors are likely to have an increasing impact on
health care financing, as the Czech Republic still follows a convergence path in
technologies and health care standards towards the more advanced economies.
0
10
20
30
40
50
60
70
80
0 10 20 30 40 50 60 70 80 90 100
Thousand CZK
Age cohort, years
A. In real terms, at 2010 prices, male ²
2004 2016
0
10
20
30
40
50
60
70
80
0 10 20 30 40 50 60 70 80 90 100
Thousand CZK
Age cohort, years
B. In real terms, at 2010 prices, female ²
2004 2016
0
5
10
15
20
0 10 20 30 40 50 60 70 80 90 100
%
Age cohort, years
C. In percentage of GDP per capita, male ³
2004 2016
0
5
10
15
20
0 10 20 30 40 50 60 70 80 90 100
%
Age cohort, years
D. In percentage of GDP per capita, female ³
2004 2016
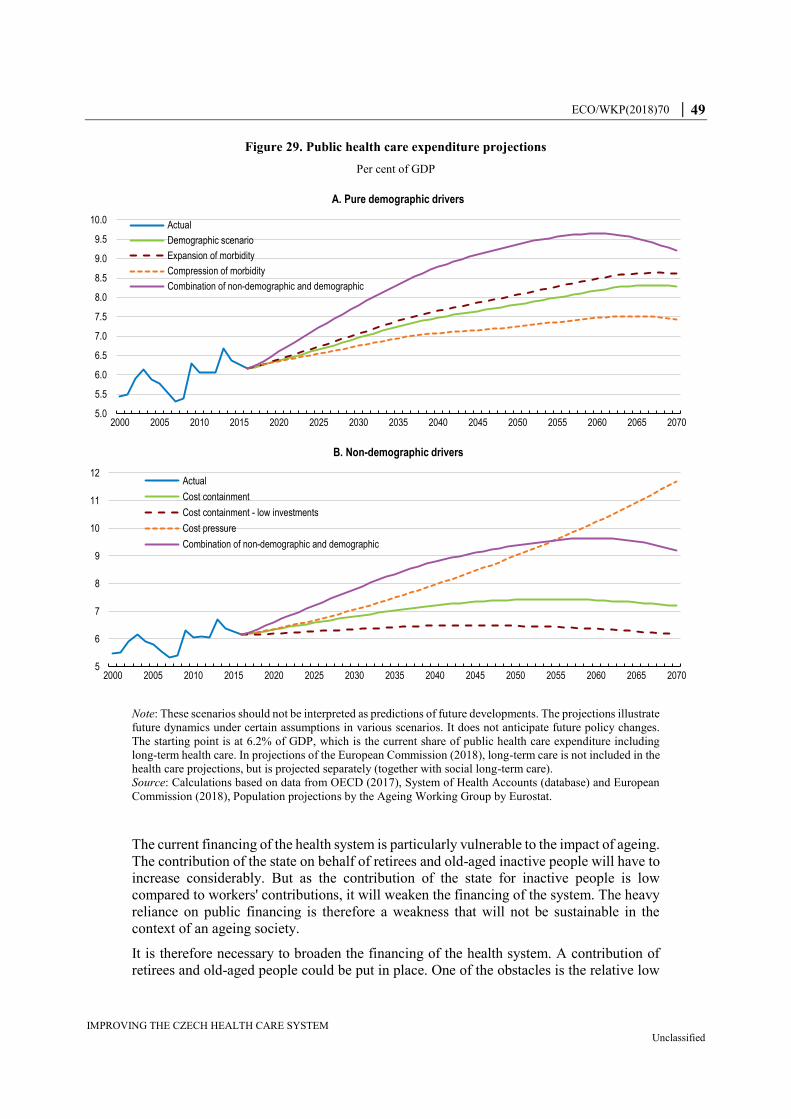
ECO/WKP(2018)70 │ 49
IMPROVING THE CZECH HEALTH CARE SYSTEM Unclassified
Figure 29. Public health care expenditure projections
Per cent of GDP
Note: These scenarios should not be interpreted as predictions of future developments. The projections illustrate
future dynamics under certain assumptions in various scenarios. It does not anticipate future policy changes.
The starting point is at 6.2% of GDP, which is the current share of public health care expenditure including
long-term health care. In projections of the European Commission (2018), long-term care is not included in the
health care projections, but is projected separately (together with social long-term care).
Source: Calculations based on data from OECD (2017), System of Health Accounts (database) and European
Commission (2018), Population projections by the Ageing Working Group by Eurostat.
The current financing of the health system is particularly vulnerable to the impact of ageing.
The contribution of the state on behalf of retirees and old-aged inactive people will have to
increase considerably. But as the contribution of the state for inactive people is low
compared to workers' contributions, it will weaken the financing of the system. The heavy
reliance on public financing is therefore a weakness that will not be sustainable in the
context of an ageing society.
It is therefore necessary to broaden the financing of the health system. A contribution of
retirees and old-aged people could be put in place. One of the obstacles is the relative low
5.0
5.5
6.0
6.5
7.0
7.5
8.0
8.5
9.0
9.5
10.0
2000 2005 2010 2015 2020 2025 2030 2035 2040 2045 2050 2055 2060 2065 2070
A. Pure demographic drivers
Actual
Demographic scenario
Expansion of morbidity
Compression of morbidity
Combination of non-demographic and demographic
5
6
7
8
9
10
11
12
2000 2005 2010 2015 2020 2025 2030 2035 2040 2045 2050 2055 2060 2065 2070
B. Non-demographic drivers
Actual
Cost containment
Cost containment - low investments
Cost pressure
Combination of non-demographic and demographic
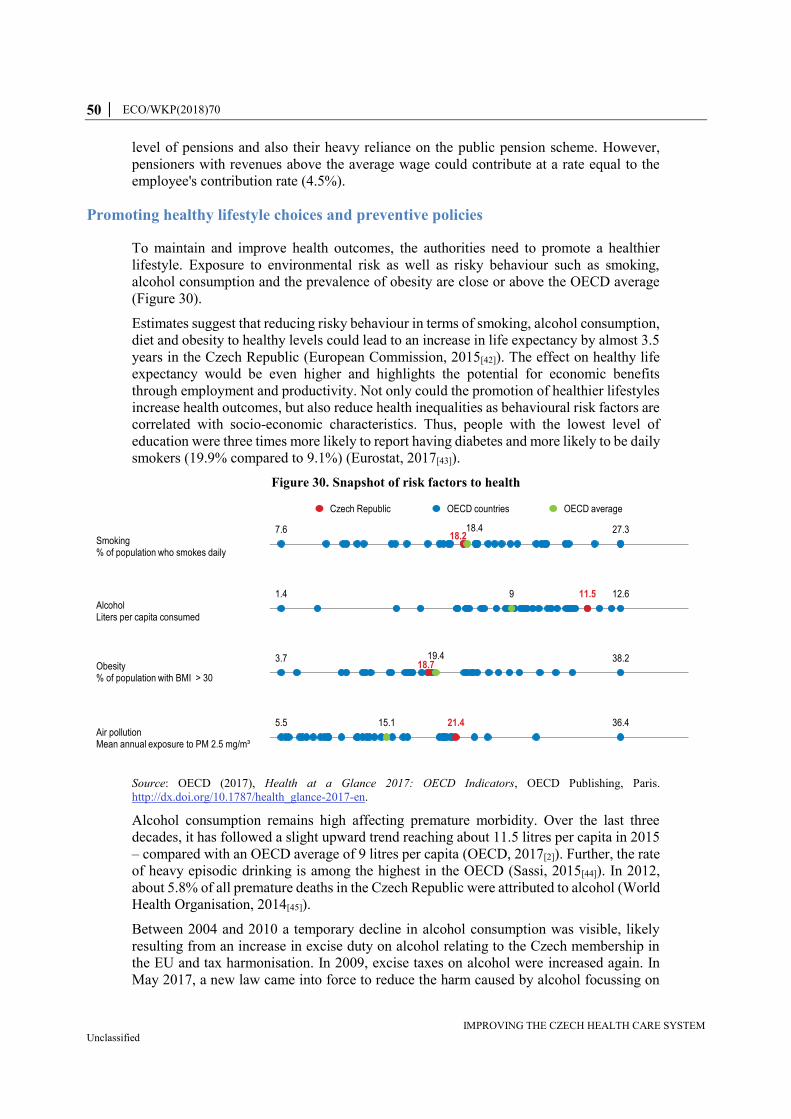
50 │ ECO/WKP(2018)70
IMPROVING THE CZECH HEALTH CARE SYSTEM Unclassified
level of pensions and also their heavy reliance on the public pension scheme. However,
pensioners with revenues above the average wage could contribute at a rate equal to the
employee's contribution rate (4.5%).
Promoting healthy lifestyle choices and preventive policies
To maintain and improve health outcomes, the authorities need to promote a healthier
lifestyle. Exposure to environmental risk as well as risky behaviour such as smoking,
alcohol consumption and the prevalence of obesity are close or above the OECD average
(Figure 30).
Estimates suggest that reducing risky behaviour in terms of smoking, alcohol consumption,
diet and obesity to healthy levels could lead to an increase in life expectancy by almost 3.5
years in the Czech Republic (European Commission, 2015[42]). The effect on healthy life
expectancy would be even higher and highlights the potential for economic benefits
through employment and productivity. Not only could the promotion of healthier lifestyles
increase health outcomes, but also reduce health inequalities as behavioural risk factors are
correlated with socio-economic characteristics. Thus, people with the lowest level of
education were three times more likely to report having diabetes and more likely to be daily
smokers (19.9% compared to 9.1%) (Eurostat, 2017[43]).
Figure 30. Snapshot of risk factors to health
Source: OECD (2017), Health at a Glance 2017: OECD Indicators, OECD Publishing, Paris.
http://dx.doi.org/10.1787/health_glance-2017-en.
Alcohol consumption remains high affecting premature morbidity. Over the last three
decades, it has followed a slight upward trend reaching about 11.5 litres per capita in 2015
– compared with an OECD average of 9 litres per capita (OECD, 2017[2]). Further, the rate
of heavy episodic drinking is among the highest in the OECD (Sassi, 2015[44]). In 2012,
about 5.8% of all premature deaths in the Czech Republic were attributed to alcohol (World
Health Organisation, 2014[45]).
Between 2004 and 2010 a temporary decline in alcohol consumption was visible, likely
resulting from an increase in excise duty on alcohol relating to the Czech membership in
the EU and tax harmonisation. In 2009, excise taxes on alcohol were increased again. In
May 2017, a new law came into force to reduce the harm caused by alcohol focussing on
7.6 27.3
12.61.4
3.7 38.2
5.5 36.4
18.2
11.5
18.7
21.4
18.4
9
19.4
15.1
Smoking% of population who smokes daily
AlcoholLiters per capita consumed
Obesity% of population with BMI > 30
Air pollutionMean annual exposure to PM 2.5 mg/m³
Czech Republic OECD countries OECD average
ECO/WKP(2018)70 │ 51
IMPROVING THE CZECH HEALTH CARE SYSTEM Unclassified
increasing public awareness. It was, however, not accompanied by regulatory measures
such as reducing the availability and affordability of alcoholic beverages (Hnilicová et al.,
2017[46]). For example, wine has zero excise taxes and introducing higher taxes on alcohol
are politically sensitive and alcohol prices are among the lowest in the EU (Sassi, 2015[44];
OECD, 2016[47]).
The authorities’ efforts to reduce tobacco consumption have shown first effects, as the share
of daily smokers is now just below the OECD average. The government’s action plan for
tobacco control for the period 2015-2018 envisaged a reduction in the consumption of
tobacco products by 8% until 2018, as well as the reduction of the population’s exposure
to environmental tobacco smoke. As one of the last European countries, the Czech Republic
has approved an extended smoking ban for indoor areas such as restaurants, pubs, bars and
certain outside areas ( around public transport stations) which came into force in May 2017.
In addition, the share of daily smokers decreased over the last years, following successive
price increases after the Czech accession to the EU. Thus, excise taxes for tobacco have
successively increased to soften price jumps that were needed to meet the minimum
taxation by 2014 to align with EU legislation. Still, the cost of cigarettes remains low in
international comparison (Figure 31).
Policy measures targeted to reduce alcohol and tobacco consumption should follow an
integrated approach that extends beyond price incentives. While price increases due to
higher taxation reduced the share of the smoking population, alcohol consumption seems
to be more price-inelastic. Additional measures to reduce alcohol consumption could
therefore include the banning of advertisement, restricting places of sales as well as
strengthening preventive programmes targeted at vulnerable population, which tend to
consume more alcohol (Sassi, 2015[44]). In addition, policy action tackling drunk driving
could be implemented through higher police presence on the streets that carry out random
alcohol test.
In addition, increasing prices of sugary and high-caloric food items through appropriate tax
levies could promote healthier diets as the consumption of these products seems to have a
high price elasticity (Sassi, 2016[48]; Sassi, Belloni and Capobianco, 2013[49]). Specific
taxation for high-calorie products that are for example high in saturated fats, trans-fatty
acids or sugar could be introduced as was for example done in Hungary, Finland, France
and Mexico. Studies for Mexico show that taxation of sweetened beverages was correlated
with a decrease in consumption when a healthier untaxed alternative was provided (Marron,
Gearing and Iselin, 2015[50]; Sassi, Belloni and Capobianco, 2013[49]; Sassi, 2016[48])
(Box 5). Such a tax should be further complemented by additional measures to promote
healthier lifestyles and ultimately reduced the incidence of obesity.
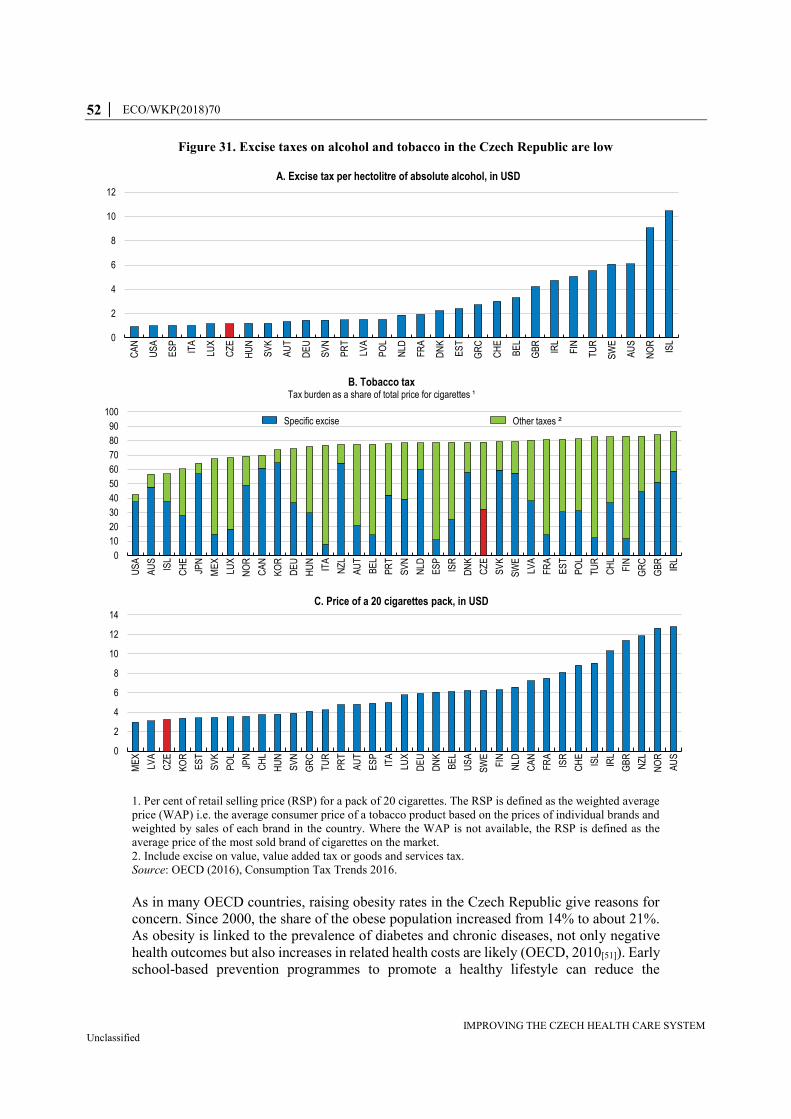
52 │ ECO/WKP(2018)70
IMPROVING THE CZECH HEALTH CARE SYSTEM Unclassified
Figure 31. Excise taxes on alcohol and tobacco in the Czech Republic are low
1. Per cent of retail selling price (RSP) for a pack of 20 cigarettes. The RSP is defined as the weighted average
price (WAP) i.e. the average consumer price of a tobacco product based on the prices of individual brands and
weighted by sales of each brand in the country. Where the WAP is not available, the RSP is defined as the
average price of the most sold brand of cigarettes on the market.
2. Include excise on value, value added tax or goods and services tax.
Source: OECD (2016), Consumption Tax Trends 2016.
As in many OECD countries, raising obesity rates in the Czech Republic give reasons for
concern. Since 2000, the share of the obese population increased from 14% to about 21%.
As obesity is linked to the prevalence of diabetes and chronic diseases, not only negative
health outcomes but also increases in related health costs are likely (OECD, 2010[51]). Early
school-based prevention programmes to promote a healthy lifestyle can reduce the
0
2
4
6
8
10
12
CA
N
US
A
ES
P
ITA
LUX
CZ
E
HU
N
SV
K
AU
T
DE
U
SV
N
PR
T
LVA
PO
L
NLD
FR
A
DN
K
ES
T
GR
C
CH
E
BE
L
GB
R
IRL
FIN
TU
R
SW
E
AU
S
NO
R
ISL
A. Excise tax per hectolitre of absolute alcohol, in USD
0
10
20
30
40
50
60
70
80
90
100
US
A
AU
S
ISL
CH
E
JPN
ME
X
LUX
NO
R
CA
N
KO
R
DE
U
HU
N
ITA
NZ
L
AU
T
BE
L
PR
T
SV
N
NLD
ES
P
ISR
DN
K
CZ
E
SV
K
SW
E
LVA
FR
A
ES
T
PO
L
TU
R
CH
L
FIN
GR
C
GB
R
IRL
B. Tobacco taxTax burden as a share of total price for cigarettes ¹
Specific excise Other taxes ²
0
2
4
6
8
10
12
14
ME
X
LVA
CZ
E
KO
R
ES
T
SV
K
PO
L
JPN
CH
L
HU
N
SV
N
GR
C
TU
R
PR
T
AU
T
ES
P
ITA
LUX
DE
U
DN
K
BE
L
US
A
SW
E
FIN
NLD
CA
N
FR
A
ISR
CH
E
ISL
IRL
GB
R
NZ
L
NO
R
AU
S
C. Price of a 20 cigarettes pack, in USD

ECO/WKP(2018)70 │ 53
IMPROVING THE CZECH HEALTH CARE SYSTEM Unclassified
prevalence of diabetes, whereas early control, counselling and quality management in the
primary care sector can avoid high costs due to chronic complications that are common for
diabetes when left untreated or poorly controlled (OECD, 2014[15]).
In the Czech Republic, despite aggregate decreases in the potential life years lost per
100 000 population, premature mortality relating to the cause of diabetes mellitus has not
shown any advancements over the last 10 years showing room to improve treatment
management (OECD, 2018[4]). General practitioners should be incentivised to take on a
greater role in prevention and chronic disease management as a fundamental part of their
role as primary care provider. For example, they could act as main co-ordinator between
primary and specialist care, while also supporting the patient through patient education and
strengthening self-management practices (OECD, 2014[15]).
Figure 32. Alcohol and tobacco consumption and their price developments
1. Refer to the population aged 15 and more.
Source: Czech Statistical Office and OECD (2017), Health Statistics (database).
Measures to prevent diabetes should be scaled up. A National Diabetes Programme was
initiated in 2012 with a strong focus on reducing the risk factors such as obesity, low
physical activity, overeating and improper diet. Thus, educational programmes such as
“Healthy School” or “Healthy Workplace” promote healthy lifestyle choices. In 2016, the
control of food sales in elementary schools was introduced, banning products that contain
sweeteners, trans-fatty acids or caffeine and excluding tea. Further measures to tackle
obesity could include compulsory food labelling, the regulation of food advertising to
children and mass media campaigns (Sassi, 2009[52]). Although these have been suggested
as part of the National Diabetes Programme and are in line with the Health 2020 strategy,
they have not yet been implemented.
11.0
11.5
12.0
12.5
13.0
80
90
100
110
120
2000 2004 2008 2012 2016
Litres per capita ¹
Index, 2005=100
A. Alcohol
Relative price to the overall CPI(left axis)
Qualtiy white wine 1l, relative priceto the overall CPI (left axis)
Alcohol consumption (right)
17.5
20.0
22.5
25.0
27.5
30.0
80
100
120
140
160
180
2002 2004 2006 2008 2010 2012 2014 2016
% of population ¹
Index, 2005=100
B. Tobacco
Relative price (left axis)
Share of smoking population (right axis)

54 │ ECO/WKP(2018)70
IMPROVING THE CZECH HEALTH CARE SYSTEM Unclassified
Box 5. Taxes on sweetened beverages across OECD
In many countries, health policies started to address the impact of sweetened beverages
and unhealthy food on health, in particular, obesity and diabetes (WHO, 2015).
Increasing taxes on sugar is the main tool used in many countries. In the OECD -
although other high-sugar products such as confectionary, ice cream and chocolate are
often taxed as well - most commonly, taxes have been imposed on sweetened beverages:
Finland currently taxes sugar-sweetened, artificially-sweetened and non-
sweetened beverages, including energy drinks, mineral waters and juices. These
taxes (EUR 0.22/L) are primarily intended to generate revenue, although the
potential positive health impacts are acknowledged, especially for younger
people. A lower tax rate (EUR 0.11/L) is applied to beverages with less than 0.5
g of sugar per 100g of product.
France introduced taxes on all beverages with added sugar and sweetener in
2012 with a flat rate of EUR 7.53 per hectolitre. In 2017, the tax scheme was
amended and now beverages with less than 5 g of sugar per 100 ml are exempted
and for drinks with 5 to 8 g of sugar per 100 ml the tax rate of EUR 7.53 per
hectolitre applies. Beverages with a sugar content of 8 to 10 g per 100 ml are
taxed the double, and beverages with more than 10 g of sugar per 100 ml are
taxed the triple of that rate.
Hungary taxes sugar-sweetened beverages (at EUR 0.63/litre). The taxes were
introduced in 2011 to improve public health. They were also seen as part of a
pro-growth tax shift towards consumption. The taxes have resulted in decreases
in consumption of sugary soft drinks by about 20% in 2016.
Mexico introduced an ad quantum tax on sugar-sweetened beverages in 2014
amounting to 1 Peso per litre. Artificially sweetened beverages are not taxed.
Annual sales of sodas declined by 6% in 2014 after the introduction of the soda
tax.
Norway taxes both sugar-sweetened and artificially-sweetened beverages. These
taxes were all originally introduced to raise revenue but their continued use now
also has a health rationale. In the beginning of 2018, the sugar tax per litre was
increased from 2.81 up to 4.75 kroner.
Belgium implemented a tax on sugar-sweetened, artificially-sweetened and non-
sweetened beverages. The introduction of the tax is part of a broader tax reform
policy to shift some of the tax burden away from labour income and largely
towards consumption that generates negative externalities.
United Kingdom introduced a tax of GBP 0.18 per litre on beverages with more
than 5 g of sugar per 100 ml of product. A higher rate (GBP 0.24 per litre) is
imposed on drinks with more than 8 g of sugar per 100 ml of product. The tax
does not apply to fruit juices or milk-based products, and smaller producers are
exempted from the tax. In response to the announced tax introduction, several
producers have reacted and reduced the sugar content of sweetened beverages to
below 5 g per 100 ml of product.
Source: OECD (2016), Health-related taxes on food and non-alcoholic beverages in OECD countries: Key
design issues; WHO (2015), “Using price policies to promote healthier diets”, World Health Organization
ECO/WKP(2018)70 │ 55
IMPROVING THE CZECH HEALTH CARE SYSTEM Unclassified
Improving health literacy
Preventive programmes are crucial to reduce avoidable health care cost. In the Czech
Republic, preventive programmes focus on immunisation programmes and medical
screening to detect diseases early. However, early intervention and preventive programmes
regarding risky lifestyle choices are not widespread, despite the close link to chronic
diseases. For example, an OECD study based on estimates for 2010 suggests that alcohol
preventive programmes could significantly reduce deaths from chronic diseases and
injuries. A programme of brief interventions by primary care physicians, aimed at people
drinking too much is estimated to lead to a total annual gain of 26 000 years of life in good
health. Cost-benefit estimations show that prevention has the potential to cut health
expenditures for chronic diseases and injuries by up to USD PPPs 73 million per year in
the Czech Republic (Sassi, 2015[44]).
Preventive programmes rarely extend beyond pre- and elementary school interventions.
Accompanying the implementation of the Health 2020 strategy, the Ministry of Health,
together with the Ministry of Education co-operated to ensure that 50% of pre-school
children and 95% of elementary school children have access to institutions that support the
health consciousness programmes (Alexa et al., 2015[13]). These efforts could be extended
to incorporate healthy behaviour. For example, the school setting could be used to provide
nutritious school meals and restrict the availability of unhealthy foods and beverages also
beyond elementary school. Furthermore, inequalities in health outcomes could be reduced
by education through addressing specific health topics such as injuries, mental health,
sexually transmitted infections, violence, pregnancy and substance use.
Health education and access to information should be available for all citizens to make
sound health decisions. Despite scarce data, a first survey conducted on health literacy in
the Czech Republic showed that about 60% of the respondents showed deficits in general
health literacy (Kučera, Pelikan and Šteflová, 2016[53]). Moreover, the study found that
health literacy is correlated negatively with age and positively with education and that
health literacy has a considerable influence on healthy behaviour and thus on health status.
Providing better access to health information for the general public in addition to health
education and prevention programmes in schools can serve as means to create more equal
health outcomes. In addition to basic information regarding health in daily life and risk
factors, in case of needed medical intervention, information on potential treatments, the
quality of health care providers and facilities should be easily accessible.
Although there have been attempts to improve the information on the performance of health
care facilities to the public, coverage tends to be low and of limited value for patients to
make informed choices. For example, the Czech Society of General Practice, the Health
Care Institute and the Ministry of Health conduct different surveys to collect data based on
patient perspectives and experiences. The fragmented nature of data collection poses a
challenge to achieve a coherent and robust analysis of patient satisfaction and the
evaluation of provider and system performance due to differences in survey design and
coverage. A better co-ordination of survey design and the provision of the data at one
central location – as is for example the case in the UK (Box 6) - could support patients to
find relevant information.
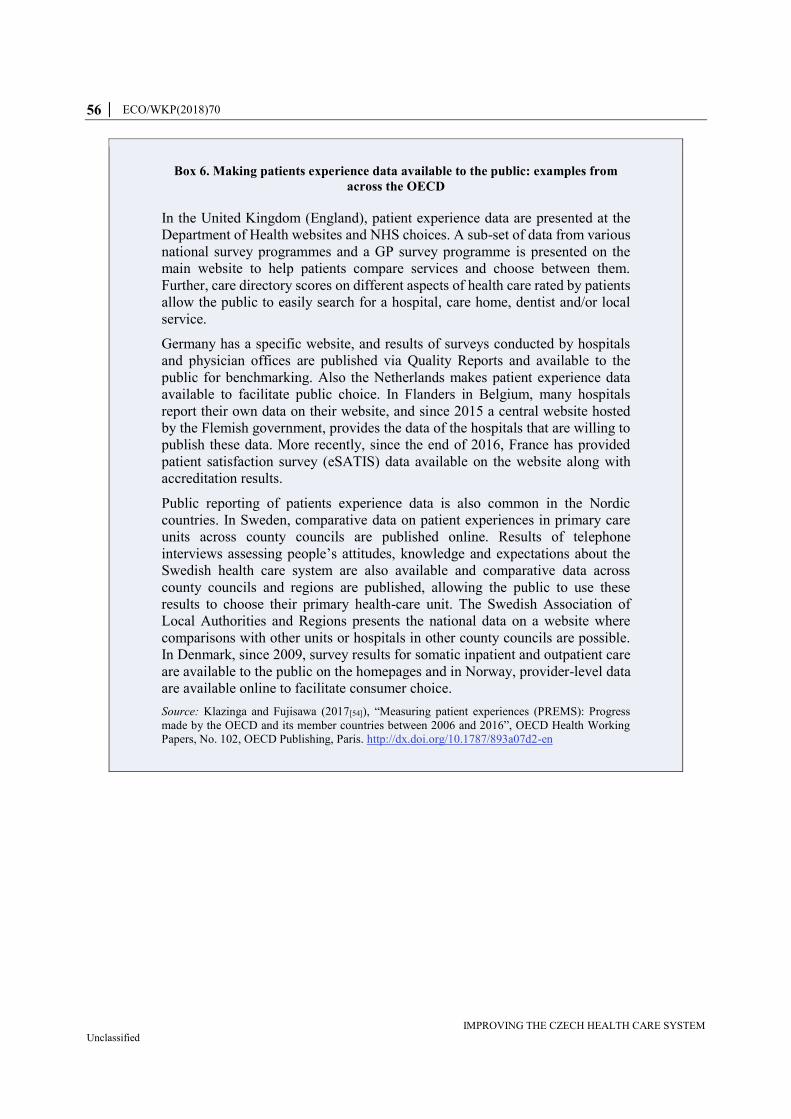
56 │ ECO/WKP(2018)70
IMPROVING THE CZECH HEALTH CARE SYSTEM Unclassified
Box 6. Making patients experience data available to the public: examples from
across the OECD
In the United Kingdom (England), patient experience data are presented at the
Department of Health websites and NHS choices. A sub-set of data from various
national survey programmes and a GP survey programme is presented on the
main website to help patients compare services and choose between them.
Further, care directory scores on different aspects of health care rated by patients
allow the public to easily search for a hospital, care home, dentist and/or local
service.
Germany has a specific website, and results of surveys conducted by hospitals
and physician offices are published via Quality Reports and available to the
public for benchmarking. Also the Netherlands makes patient experience data
available to facilitate public choice. In Flanders in Belgium, many hospitals
report their own data on their website, and since 2015 a central website hosted
by the Flemish government, provides the data of the hospitals that are willing to
publish these data. More recently, since the end of 2016, France has provided
patient satisfaction survey (eSATIS) data available on the website along with
accreditation results.
Public reporting of patients experience data is also common in the Nordic
countries. In Sweden, comparative data on patient experiences in primary care
units across county councils are published online. Results of telephone
interviews assessing people’s attitudes, knowledge and expectations about the
Swedish health care system are also available and comparative data across
county councils and regions are published, allowing the public to use these
results to choose their primary health-care unit. The Swedish Association of
Local Authorities and Regions presents the national data on a website where
comparisons with other units or hospitals in other county councils are possible.
In Denmark, since 2009, survey results for somatic inpatient and outpatient care
are available to the public on the homepages and in Norway, provider-level data
are available online to facilitate consumer choice.
Source: Klazinga and Fujisawa (2017[54]), “Measuring patient experiences (PREMS): Progress
made by the OECD and its member countries between 2006 and 2016”, OECD Health Working
Papers, No. 102, OECD Publishing, Paris. http://dx.doi.org/10.1787/893a07d2-en
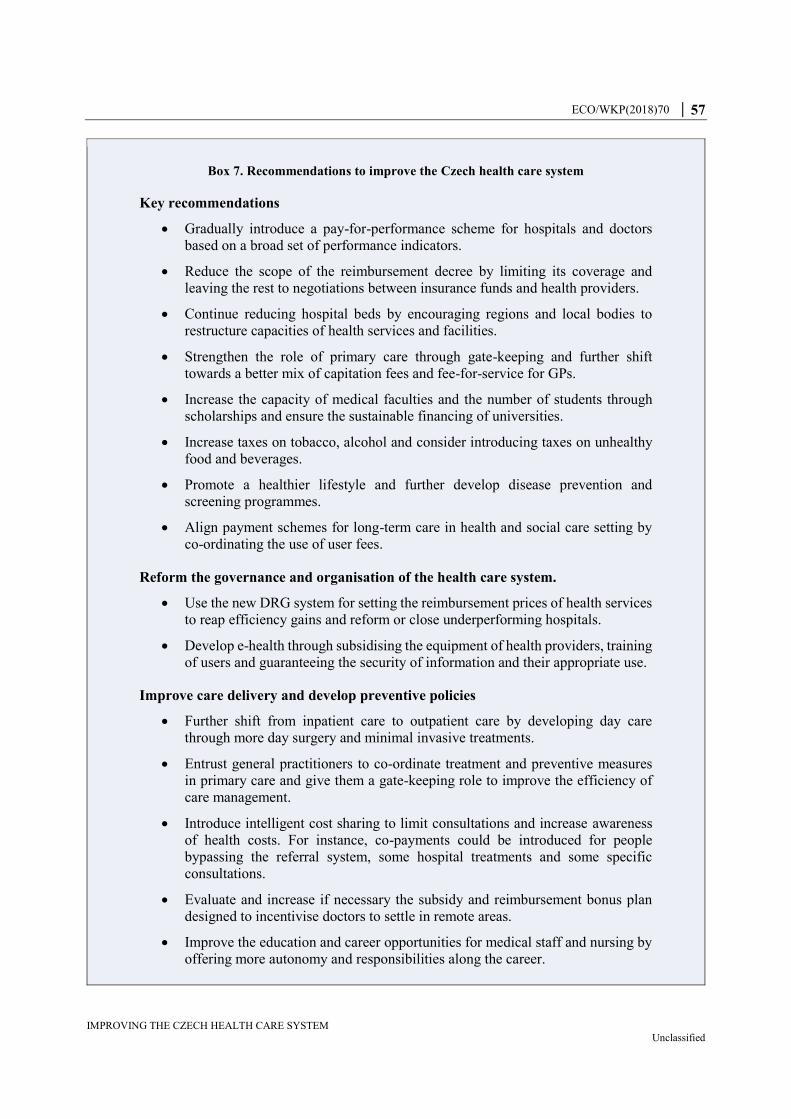
ECO/WKP(2018)70 │ 57
IMPROVING THE CZECH HEALTH CARE SYSTEM Unclassified
Box 7. Recommendations to improve the Czech health care system
Key recommendations
Gradually introduce a pay-for-performance scheme for hospitals and doctors
based on a broad set of performance indicators.
Reduce the scope of the reimbursement decree by limiting its coverage and
leaving the rest to negotiations between insurance funds and health providers.
Continue reducing hospital beds by encouraging regions and local bodies to
restructure capacities of health services and facilities.
Strengthen the role of primary care through gate-keeping and further shift
towards a better mix of capitation fees and fee-for-service for GPs.
Increase the capacity of medical faculties and the number of students through
scholarships and ensure the sustainable financing of universities.
Increase taxes on tobacco, alcohol and consider introducing taxes on unhealthy
food and beverages.
Promote a healthier lifestyle and further develop disease prevention and
screening programmes.
Align payment schemes for long-term care in health and social care setting by
co-ordinating the use of user fees.
Reform the governance and organisation of the health care system.
Use the new DRG system for setting the reimbursement prices of health services
to reap efficiency gains and reform or close underperforming hospitals.
Develop e-health through subsidising the equipment of health providers, training
of users and guaranteeing the security of information and their appropriate use.
Improve care delivery and develop preventive policies
Further shift from inpatient care to outpatient care by developing day care
through more day surgery and minimal invasive treatments.
Entrust general practitioners to co-ordinate treatment and preventive measures
in primary care and give them a gate-keeping role to improve the efficiency of
care management.
Introduce intelligent cost sharing to limit consultations and increase awareness
of health costs. For instance, co-payments could be introduced for people
bypassing the referral system, some hospital treatments and some specific
consultations.
Evaluate and increase if necessary the subsidy and reimbursement bonus plan
designed to incentivise doctors to settle in remote areas.
Improve the education and career opportunities for medical staff and nursing by
offering more autonomy and responsibilities along the career.
58 │ ECO/WKP(2018)70
IMPROVING THE CZECH HEALTH CARE SYSTEM Unclassified
Reform the financing of health care
Gradually increase contributions from the self-employed to better reflect their
contribution capacity.
Broaden revenues from general taxation for the health care sector by setting a
contribution on all kinds of revenues.
Prepare long-term care for ageing
Incentivise regional authorities to ensure that enough long-term care institutions
exist within their borders.
Provide social care allowance taking into account individual’s income to
guarantee that individuals can afford access to institutional care.
References
Alexa, J. et al. (2015), Czech Republic: Health system review. Health Systems in Transition,
World Health Organisation and European Observatory on Health Systems and Policies,
http://www.euro.who.int/__data/assets/pdf_file/0005/280706/Czech-HiT.pdf?ua=1.
[13]
Bundesärztekammer (2017), Ärztestatistik - Ausländische Ärztinnen/Ärzte am 31.12.2016,
http://www.bundesaerztekammer.de/fileadmin/user_upload/downloads/pdf-
Ordner/Statistik2016/Stat16Tab10.pdf (accessed on 12 March 2018).
[21]
Bundesärztekammer (2011), Ärztestatistik - Ausländische Ärztinnen und Ärzte in Deutschland
am 31.12.2010,
http://www.bundesaerztekammer.de/fileadmin/user_upload/specialdownloads/Stat10Tab10.p
df (accessed on 12 March 2018).
[22]
Chandra, A., J. Gruber and R. McKnight (2010), “Patient Cost-Sharing and Hospitalization
Offsets in the Elderly”, American Economic Review, Vol. 100/1, pp. 193-213,
http://dx.doi.org/10.1257/aer.100.1.193.
[32]
Chiappori, P., F. Durand and P. Geoffard (1998), “Moral hazard and the demand for physician
services: First lessons from a French natural experiment”, European Economic Review,
Vol. 42/3-5, pp. 499-511, http://dx.doi.org/10.1016/S0014-2921(98)00015-4.
[33]
ČLS-JEP (2018), Společnosti a spolky lékařů [Companies and medical associations], Česká
lékařská společnost Jana Evangelisty Purkyně, http://www.cls.cz/prehled-clenu (accessed on
16 January 2018).
[20]
Council of Regions (2017), CoR - Public Health,
https://portal.cor.europa.eu/divisionpowers/countries/MembersNLP/CR/Policy-Areas-
Obligatory/Pages/Public-Health.aspx (accessed on 13 December 2017).
[18]
ECO/WKP(2018)70 │ 59
IMPROVING THE CZECH HEALTH CARE SYSTEM Unclassified
de la Maisonneuve, C. and J. Oliveira Martins (2013), “Public Spending on Health and Long-
term Care: A new set of projections”, OECD Economic Policy Papers, No. 6, OECD
Publishing, Paris, http://dx.doi.org/10.1787/5k44t7jwwr9x-en.
[40]
Delamaire, M. and G. Lafortune (2010), “Nurses in Advanced Roles: A Description and
Evaluation of Experiences in 12 Developed Countries”, OECD Health Working Papers,
No. 54, OECD Publishing, Paris, http://dx.doi.org/10.1787/5kmbrcfms5g7-en.
[24]
Dutu, R. and P. Sicari (2016), “Public Spending Efficiency in the OECD: Benchmarking Health
Care, Education and General Administration”, OECD Economics Department Working
Papers, No. 1278, OECD Publishing, Paris, http://dx.doi.org/10.1787/5jm3st732jnq-en.
[12]
European Commission (2015), Comparative efficiency of health systems, corrected for selected
lifestyle factors Final report,
https://ec.europa.eu/health//sites/health/files/systems_performance_assessment/docs/2015_ma
celi_report_en.pdf (accessed on 22 January 2018).
[42]
European Union Agency for Fundamental Rights (2014), Discrimination against and living
conditions of Roma women in 11 EU Member States Roma survey – Data in focus,
http://fra.europa.eu/en/publications-and-resources/data-and-maps/survey-data-explorer-
results-2011-roma-survey.
[10]
Eurostat (2017), European Core Health Indicators (ECHI), European Commission,
http://appsso.eurostat.ec.europa.eu/nui/show.do?dataset=hlth_ehis_cd1e&lang=en.
[43]
Eurostat (2017), Self-reported unmet needs for health care by sex, age, specific reasons and
educational attainment level [hlth_ehis_un1e].
[5]
Eurostat (2017), Self-reported unmet needs for specific health care-related services due to
financial reasons by sex, age and educational attainment level [hlth_ehis_un2e].
[6]
Gaynor, M. (2006), “What Do We Know About Competition and Quality in Health Care
Markets?”, No. 12301, NBER Working Paper Series, http://www.nber.org/papers/w12301
(accessed on 20 March 2018).
[39]
Giorno, C. and K. Londáková (2017), “Improving the efficiency and outcomes of the Slovak
health-care system”, OECD Economics Department Working Papers, No. 1404, OECD
Publishing, Paris, http://dx.doi.org/10.1787/f2b496cd-en.
[11]
Hnilicová, H. et al. (2017), “Comparison of alcohol consumption and alcohol policies in the
Czech Republic and Norway”, Central European Journal of Public Health,
http://dx.doi.org/10.21101/cejph.a4918.
[46]
Hromadkova, E. and M. Zdenek (2013), “Demand Side Cost-Sharing and Prescription Drugs
Utilization: Evidence from a Quasi-Natural Experiment”, CERGE-EI Working Paper Series,
No. 486, CERGE-EI, Prague, http://dx.doi.org/10.2139/ssrn.2260531.
[35]
International Organisation of Migration (2016), Implementation of the National Roma
Integration Strategy and Other National Commitments in the Field of Health CZECH
REPUBLIC A multi-stakeholder perspective report on 2005–2014 developments.
[7]

60 │ ECO/WKP(2018)70
IMPROVING THE CZECH HEALTH CARE SYSTEM Unclassified
James, C., M. Devaux and F. Sassi (2017), “Inclusive growth and health”, OECD Health
Working Papers, No. 103, OECD Publishing, Paris, http://dx.doi.org/10.1787/93d52bcd-en.
[1]
Joumard, I., C. André and C. Nicq (2010), “Health Care Systems: Efficiency and Institutions”,
OECD Economics Department Working Papers, No. 769, OECD Publishing, Paris,
http://dx.doi.org/10.1787/5kmfp51f5f9t-en.
[3]
Kim, J., S. Ko and B. Yang (2005), “The effects of patient cost sharing on ambulatory utilization
in South Korea.”, Health policy (Amsterdam, Netherlands), Vol. 72/3, pp. 293-300,
http://dx.doi.org/10.1016/j.healthpol.2004.09.002.
[34]
Klazinga, N. and R. Fujisawa (2017), “Measuring patient experiences (PREMS): Progress made
by the OECD and its member countries between 2006 and 2016”, OECD Health Working
Papers, No. 102, OECD Publishing, Paris, http://dx.doi.org/10.1787/893a07d2-en.
[54]
Kučera, Z., J. Pelikan and A. Šteflová (2016), “Health literacy in Czech population results of the
comparative representative research”, Cas Lek Cesk, Vol. 155/5, pp. 233-241.
[53]
Manning, W. et al. (1987), “Health Insurance and the Demand for Medical Care: Evidence from
a Randomized Experiment”, The American Economic Review, Vol. 77/3, pp. 251-277,
http://dx.doi.org/10.2307/1804094.
[31]
Marron, D., M. Gearing and J. Iselin (2015), “Should We Tax Unhealthy Foods and Drinks?”,
SSRN Electronic Journal, http://dx.doi.org/10.2139/ssrn.2703598.
[50]
Medeiros, J. and C. Schwierz (2013), “Estimating the drivers and projecting long-term public
health expenditure in the European Union: Baumol's "cost disease" revisited”,
European Economy - Economic Papers 2008 - 2015,
https://ideas.repec.org/p/euf/ecopap/0507.html (accessed on 13 February 2018).
[41]
OECD (2018), “Health expenditure and financing: Health expenditure indicators”, OECD Health
Statistics (database), http://dx.doi.org/10.1787/data-00349-en.
(accessed on 13 February 2018)
[25]
OECD (2018), “Health status”, OECD Health Statistics (database),
http://dx.doi.org/10.1787/data-00540-en.
(accessed on 9 January 2018)
[4]
OECD (2018), OECD Economic Surveys: Czech Republic 2018, OECD Publishing, Paris,
http://dx.doi.org/10.1787/eco_surveys-cze-2018-en.
[30]
OECD (2018), “Pharmaceutical market”, OECD Health Statistics (database),
http://dx.doi.org/10.1787/data-00545-en.
(accessed on 5 February 2018)
[26]
OECD (2017), Health at a Glance 2017: OECD Indicators, OECD Publishing, Paris,
http://dx.doi.org/10.1787/health_glance-2017-en.
[2]
OECD (2017), Tackling Wasteful Spending on Health, OECD Publishing, Paris. [16]
ECO/WKP(2018)70 │ 61
IMPROVING THE CZECH HEALTH CARE SYSTEM Unclassified
OECD (2016), Better Ways to Pay for Health Care, OECD Health Policy Studies, OECD
Publishing, Paris, http://dx.doi.org/10.1787/9789264258211-en.
[17]
OECD (2016), Consumption Tax Trends 2016: VAT/GST and excise rates, trends and policy
issues, OECD Publishing, Paris, http://dx.doi.org/10.1787/ctt-2016-en.
[47]
OECD (2015), Fiscal Sustainability of Health Systems: Bridging Health and Finance
Perspectives, OECD Publishing, Paris, http://dx.doi.org/10.1787/9789264233386-en.
[14]
Sassi, F. (ed.) (2015), Tackling Harmful Alcohol Use: Economics and Public Health Policy,
OECD Publishing, Paris, http://dx.doi.org/10.1787/9789264181069-en.
[44]
OECD (2014), OECD Reviews of Health Care Quality: Czech Republic 2014: Raising
Standards, OECD Reviews of Health Care Quality, OECD Publishing, Paris,
http://dx.doi.org/10.1787/9789264208605-en.
[15]
OECD (2010), Obesity and the Economics of Prevention: Fit not Fat, OECD Publishing, Paris,
http://dx.doi.org/10.1787/9789264084865-en.
[51]
OECD and European Observatory on Health Systems and Policies (2017), State of Health in the
EU - Czech Republic: Country Health Profile 2017.
[19]
Porter, M. and E. Teisberg (2004), “Redefining Competition in Health Care”, Harvard Business
Review, http://www.hbr.org (accessed on 20 March 2018).
[38]
Sassi, F. (2016), “Taxing sugar.”, BMJ (Clinical research ed.), Vol. 352, p. h6904,
http://dx.doi.org/10.1136/BMJ.H6904.
[48]
Sassi, F. (2009), “Improving Lifestyles, Tackling Obesity: The Health and Economic Impact of
Prevention Strategies”, Vol. 48, http://dx.doi.org/10.1787/18152015.
[52]
Sassi, F., A. Belloni and C. Capobianco (2013), “The Role of Fiscal Policies in Health
Promotion”, OECD Health Working Papers, No. 66, OECD Publishing, Paris,
http://dx.doi.org/10.1787/5k3twr94kvzx-en.
[49]
Serrano Rodriguez, N. and N. Rodríguez Derecho (2009), Health and the Roma Community,
analysis of the situation in Europe: Bulgaria, Czech Republic, Greece, Portugal, Romania,
Slovakia, Spain, Fundación Secretariado Gitano, Madrid,
http://ec.europa.eu/justice/discrimination/files/roma_health_en.pdf (accessed on
11 December 2017).
[9]
SUKL (2018), Pricing and Reimbursement, http://www.sukl.eu/file/74580_1_2. [28]
Úřad vlády ČR (2017), Zpráva o stavu romské menšiny v České republice za rok 2016. [8]
ÚZIS (2018), Long-term programme for increasing the capacity of medical faculties in the
Czech Republic: Explanatory memorandum..
[23]
Úzis (2017), Zdravotnická ročenka České republiky 2016 [Czech Health Statistics Yearbook
2016], http://www.uzis.cz/system/files/zdrroccz2016.pdf.
[29]
62 │ ECO/WKP(2018)70
IMPROVING THE CZECH HEALTH CARE SYSTEM Unclassified
Votápková, J. and P. Žílová (2016), “Determinants of Generic Substitution in the Czech
Republic”, Working Papers IES, https://ideas.repec.org/p/fau/wpaper/wp2016_05.html
(accessed on 05 February 2018).
[27]
World Health Organisation (2014), Global Status Report on Alcohol and Health 2014 - Czech
Republic,
http://www.who.int/substance_abuse/publications/global_alcohol_report/profiles/cze.pdf
(accessed on 10 January 2018).
[45]
Zápal, J. (2010), “Doctor-Visit Co-Payment Exemption for Children: First Look at the Data”,
Finance a Uver: Czech Journal of Economics and Finance, Vol. 60/1, pp. 57-72.
[36]
Žílová, P. and J. Votápková (2012), “The Effect of the Abolition of User Charges on the Demand
for Ambulatory Doctor Visits”, IES Working Paper, No. 30/2012, Charles University, Prague.
[37]