improving performance and drainage of coalescing filters
TRANSCRIPT
IMPROVING PERFORMANCE AND DRAINAGE OF COALESCING FILTERS
A Dissertation
Presented to
The Graduate Faculty of The University of Akron
In Partial Fulfillment
of the Requirements for the Degree
Doctor of Philosophy
Shagufta Usman Patel
August, 2010

ii
IMPROVING PERFORMANCE AND DRAINAGE OF COALESCING FILTERS
Shagufta Usman Patel
Dissertation
Approved: Accepted: _________________________ _________________________ Advisor Department Chair Dr. George G. Chase Dr. Lu-Kwang Ju _________________________ _________________________ Committee Member Dean of the College Dr. Lingyun Liu Dr. George K. Haritos _________________________ _________________________ Committee Member Dean of the Graduate School Dr. H. Michael Cheung Dr. George R. Newkome _________________________ _________________________ Committee Member Date Dr. Kevin L. Kreider _________________________ Committee Member Dr. Subramaniya I. Hariharan

iii
ABSTRACT
Pure air or gas is very critical to many industrial applications. Gas streams contain
impurities in the form of solid and liquid aerosols of micron and submicron sizes. It is
very important to remove these aerosols for improving the economy and reliability of
industrial processes and equipment as well as protecting our health and environment.
Among different filters being used, coalescing filters are effectively used to remove
liquid aerosols from gas streams and hence has numerous industrial applications. The
performance of the filter affects the economy of the process.
A coalescing filter captures the oil droplets and the captured liquid typically
drains from the filter by action of gravity. The saturation or hold-up of liquid in the filter
constricts the gas flow, increases pressure drop, and increases the operating costs of the
filter. The filter loaded with liquid droplet indicates limited filter life and needs to be
replaced which increases the cost of process. Filter performance and filter life can be
improved if the liquid saturation is reduced without reduction in capture efficiency. In
this research work filter media are modified with drainage structures to reduce saturation
and to reduce drag resistance. The media are tested in horizontal and vertical orientations
to determine whether their orientation with gravity influences the performance. The
experimental results show that with no drainage channels the media oriented with flow
vertically downward operates the best whereas with drainage channels the horizontally

iii
oriented media had the best performance. The results also show filter geometries
developed by embedding low surface energy woven drainage channels at 45 degree
downward angles have the overall best performance. Adding nanofibers to improve the
performance of the filter media is an effective way of improving filter media’s capture
efficiency with moderate increase in pressure drop. Nanofiber augmented filter media
indicated higher pressure drop but when the drainage channels are incorporated in the
filter, the increase in the pressure drop is significantly low. The pressure drop increase
will be significant for a nanofiber augmented filter media without the drainage channels.
Filter geometries developed by incorporating drainage channels at downward angles
indicate significantly low pressure drop, the drainage channels create a path of lower
resistance and hence maximum flow goes through the drainage channel improving the
filter performance and drainage.
This research work allows to develop cost effective filter geometries which will
significantly increase filter performance as compared to the glass fiber filter media which
are commonly used in the industry.

iv
DEDICATION
I would like to dedicate this work to my parents Mr. Usman C. Patel and Mrs. Badrunisa
U. Patel.

v
ACKNOWLEDGEMENTS
I would like to sincerely acknowledge and thank the following people who helped
me achieve my goal. I would like to express my sincere gratitude towards Professor
George Chase for extending support and encouragement throughout the course of this
degree. He has been a great mentor and guide throughout the course of my research. I
would like to thank my committed members; Dr. Lingyun Liu, Dr. H. Michael Cheung,
Dr. Kevin L. Kreider and Dr. Subramaniya I. Hariharan for their valuable advice,
assistance, and encouragement. I will like to thank Mr. Frank Pelc for helping me in
building my experimental assembly and helping me cutting my filter samples. Mr. Pelc’s
help and suggestions in cutting the filter media are greatly appreciated. I would like to
thank all the multiphase group members for their help. I would like to acknowledge
Coalescence Filtration Nanomaterials Consortium for their financial support and
encouragement.
I would like to thank my parents and my brother Mr. Sarfaraz U. Patel for their
constant support, unwavering belief in my abilities, and encouragement. Special thanks to
my friend Mr. Prashant S. Kulkarni who was with me since the beginning of my journey
and encouraged me at every stage. He was always there when I needed him.

vi
TABLE OF CONTENTS
Page
LIST OF TABLES ........................................................................................................... xiii
LIST OF FIGURES ......................................................................................................... xiv
CHAPTER
I. INTRODUCTION ...................................................................................................1
1.1. Theory of filtration .................................................................................1
1.2. Types of filtration ...................................................................................2
1.3. Coalescing filters ....................................................................................2
1.4. Hypothesis ...............................................................................................3
1.4.1. Flow orientation .........................................................................3
1.4.2. Drainage channel incorporated filter media ...............................5
1.4.3. Composite filter media ...............................................................7
1.5. Research Objectives ...............................................................................8
1.6. Benefits of current work .........................................................................9
1.7. Dissertation outline ...............................................................................10
II. LITERATURE REVIEW ON COALESCENCE FILTRATION .........................12
vii
2.1. Aerosol filtration ..................................................................................12
2.2. Sources of liquid aerosol ......................................................................13
2.1.1. Mechanical atomization ...........................................................13
2.1.2. Evaporation–condensation .......................................................13
2.1.3. Entrainment by gas flow in liquid–gas contactors ...................14
2.1.4. Crankcase ventilation (CCV) ...................................................14
2.3. Coalescing filters ...................................................................................15
2.4. Capture mechanisms ..............................................................................17
2.5. Coalescence filtration and drainage channel design ..............................20
2.6. Fiber orientation and filter performance ...............................................22
2.7. Saturation of filter media .......................................................................23
2.8. Nanofibers in coalesce filtration ............................................................25
2.9. Modeling of fibrous filters ....................................................................26
III. DEVELOPING AND CHARACTERIZING FILTER MEDIA ............................27
3.1. Introduction ..........................................................................................27
3.2. Steps involved in filter media preparation ...........................................27
3.2.1. Glass fiber media ....................................................................27
3.2.2. Nanofiber augmented micro glass fiber filter media ..............31
3.2.3. Composite filter media ............................................................32
3.3. Vacuum molding set-up .......................................................................33

viii
3.4. Filter media characterization technique ...............................................35
3.4.1. Porosity measurement .............................................................36
3.4.2. Permeability measurement ......................................................38
3.4.3. Hardness or strength measurement .........................................41
IV. DEVELOPING FILTER GEOMETRIES .............................................................43
4.1. Introduction ..........................................................................................43
4.2. Filter media cutter saw .........................................................................43
4.3. Drainage channels ................................................................................46
4.4. Filter geometries ....................................................................................48
4.4.1. Horizontal orientation .............................................................48
4.4.2. Vertical orientation .................................................................50
4.5. Composite filter media ..........................................................................51
V. COALESCENCE FILTRATION SETUP .............................................................52
5.1. Experimental set-up and procedure for coalescence tests ....................52
5.1.1. Prefiltration ..............................................................................52
5.1.2. Aerosol generation ..................................................................55
5.1.3. Filter holder .............................................................................56
5.1.3.1. Horizontal flow orientation filter holder ...............56
5.1.3.2. Vertical flow orientation filter media ...................57
5.1.4. Measurement equipments ........................................................59
ix
VI. EXPERIMENTAL RESULTS OF GLASS FIBER FILTER GEOMETRIES......62
6.1. Polypropylene woven drainage channels .............................................62
6.1.1. Capture efficiency ...................................................................64
6.1.2. Pressure drop ...........................................................................66
6.1.3. Quality factor ..........................................................................68
6.1.4. Saturation ................................................................................70
6.1.4.1. Saturation profile of no-drainage filter media .......74
6.1.5. Performance comparison of filter geometries developed with woven drainage channel ................................................77
6.1.6. Factors affecting coalescence filtration ...................................79
6.1.7. Effect of number of drainage channels in inclined angle filter media and upward inclination .................................................81
6.1.8. Effect of pore size and filament thickness of drainage
channel ....................................................................................87
6.1.9. Filter bed length ......................................................................90
6.2. Nonwoven drainage channels ...............................................................93
6.2.1. Capture efficiency ...................................................................94
6.2.2. Pressure drop ...........................................................................95
6.2.3. Quality factor ..........................................................................97
6.2.4. Saturation ................................................................................99
6.2.5. Effect of basis weight of drainage channel ...........................102
x
6.2.6. Performance comparison of filter geometries developed with woven and nonwoven drainage channels ......................106
6.3. Effect of surface wettabilty of drainage channel ................................108
6.3.1. Capture efficiency ................................................................111
6.3.2. Pressure drop .........................................................................114
6.3.3. Quality factor ........................................................................115
6.3.4. Saturation ..............................................................................117
6.3.5. Performance comparison of filter geometries ........................118
6.4. Composite filter media .......................................................................121
VII. NANOFIBER AUGMENTED FILTER GEOMETRIES ...................................125
7.1. Introduction .......................................................................................125
7.2. Electrospinning ...................................................................................126
7.2.1. Electrospinning setup .............................................................127
7.2.2. NanospiderTM .........................................................................129
7.2.2.1. Principle of NanospiderTM technology .................129
7.3. Production of nylon nanofibers ..........................................................132
7.4. Experimental results of nanofiber augmented filter media modified with woven drainage channels of varying surface wettability ...........134
7.4.1. Capture efficiency .................................................................134
7.4.2. Pressure drop .........................................................................137
7.4.3. Quality factor ........................................................................139

xi
7.4.4. Saturation ..............................................................................141
7.4.5. Performance comparison of nanofiber augmented filter geometries .............................................................................143
VIII. MODELLING OF DRAINAGE CHANNEL INCORPORATED FIBROUS
FILTER MEDIA ..................................................................................................145
8.1. Multiphase theory in porous media .....................................................146
8.2. Volume average theory .....................................................................146
8.3. Conservation equations ......................................................................148
8.3.1 Mass and momentum balaces ...............................................148
8.3.2 Mass and momentum jump balances .....................................150
8.4 Assumptions .......................................................................................151
8.5 Permeability of media and Darcy’s law .............................................153
8.6 Simplified conservation equations .....................................................158
8.6.1 Mass and momentum balances ..............................................158
8.6.2 Mass and momentum jump balances .....................................159
8.7 Boundary conditions ............................................................................160
8.8 Grid generation ...................................................................................160
8.8.1 Goals of grid generation .........................................................161
8.8.2 Grid mapping .........................................................................162
8.9 Algorithm ............................................................................................166

xii
8.10 Results .................................................................................................168
8.10.1 Optimizing the grid size .........................................................168
8.10.2 Velocity profile of isotropic filter media without drainage
channel ...................................................................................170
8.10.3 Velocity profile of anisotropic drainage channel incorporated filter media .......................................................172
8.10.4 Parametric study.....................................................................174
8.10.4.1 Varying the angle of drainage channel ................174
8.10.4.2 Changing the thickness of drainage channel ........175
8.10.4.3 Exchanging porosity and permeability of media and drainage channel ................................176
IX. CONCLUSION ....................................................................................................181
X. FUTURE WORK ................................................................................................188
BIBILOGRAPHY ............................................................................................................190
APPENDICES
APPENDIX A. EXPERIMENTAL RESULTS FOR DRAINAGE CHANNEL INCORPORATED FILTER MEDIA MADE BY USING CARBOSET 560 BINDER ..........................................................................................................................201
APPENDIX B. FORTRAN CODE FOR DRAINAGE CHANNEL INCORPORATED FILTER MEDIA .............................................................................203
APPENDIX C. NOMENCLATURE ...............................................................................225
xiii
LIST OF TABLES
Table Page
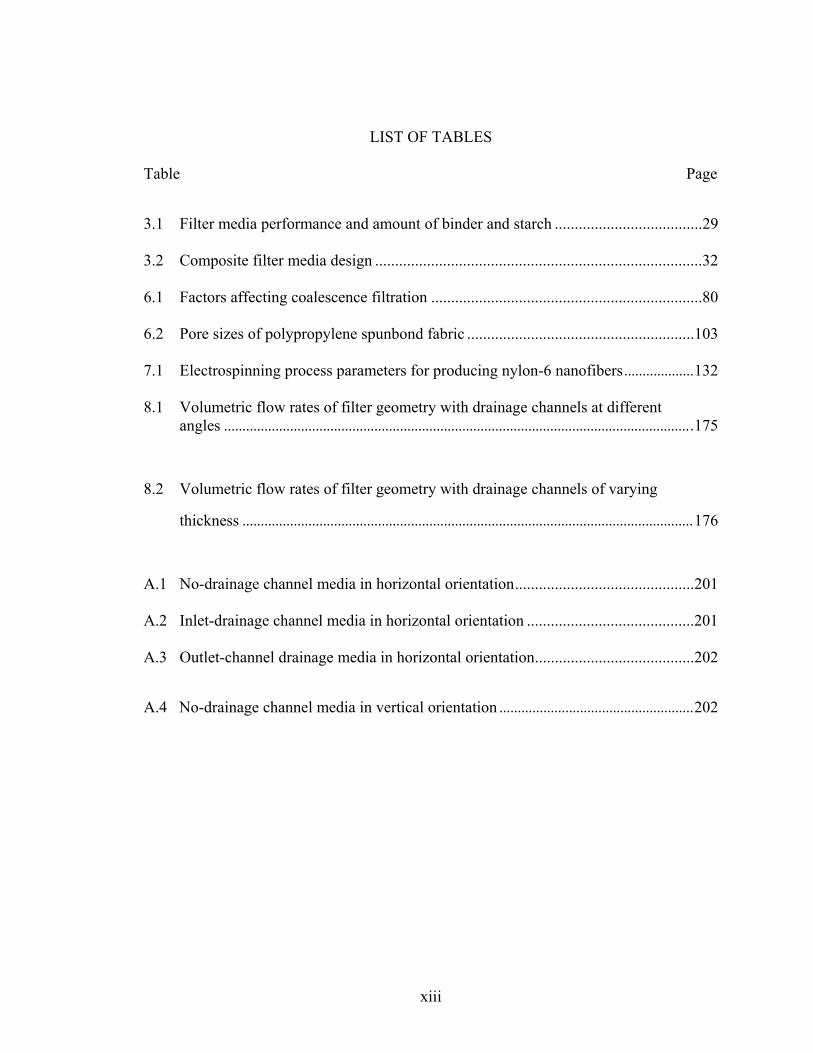
3.1 Filter media performance and amount of binder and starch .....................................29
3.2 Composite filter media design ..................................................................................32
6.1 Factors affecting coalescence filtration ....................................................................80
6.2 Pore sizes of polypropylene spunbond fabric .........................................................103
7.1 Electrospinning process parameters for producing nylon-6 nanofibers ................... 132
8.1 Volumetric flow rates of filter geometry with drainage channels at different angles ................................................................................................................................ 175
8.2 Volumetric flow rates of filter geometry with drainage channels of varying
thickness ........................................................................................................................... 176
A.1 No-drainage channel media in horizontal orientation .............................................201
A.2 Inlet-drainage channel media in horizontal orientation ..........................................201
A.3 Outlet-channel drainage media in horizontal orientation ........................................202
A.4 No-drainage channel media in vertical orientation ..................................................... 202
xiv
LIST OF FIGURES
Figure Page
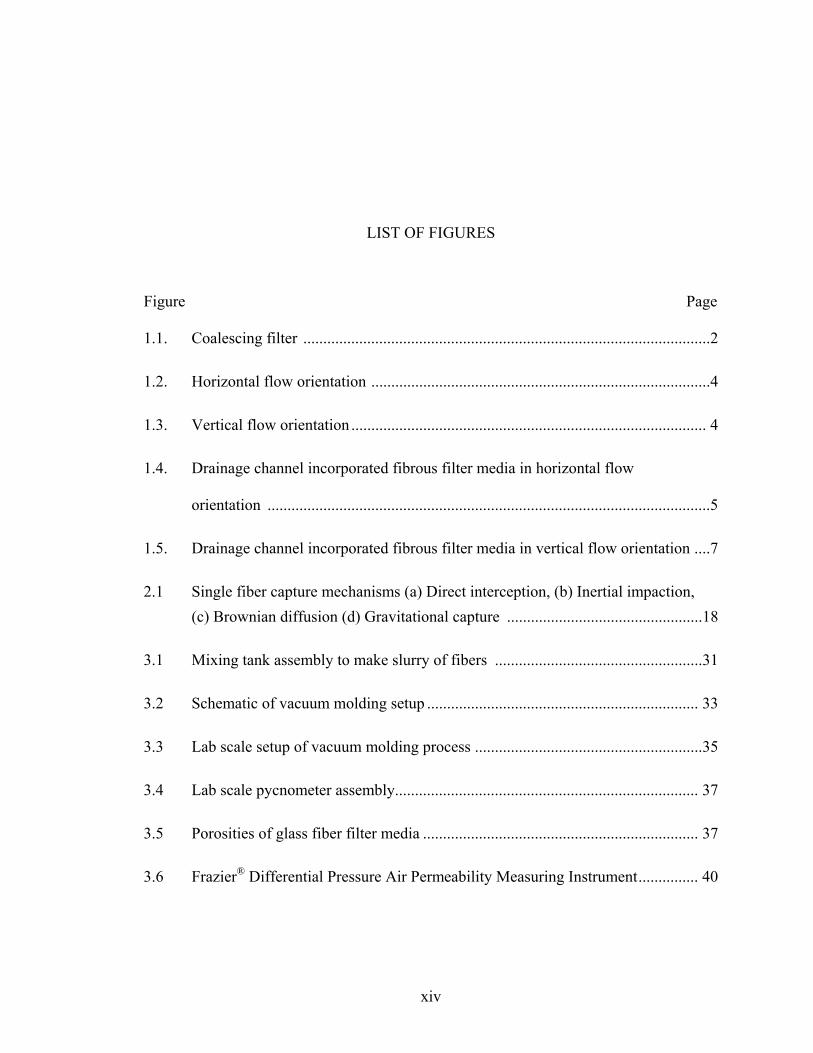
1.1. Coalescing filter ......................................................................................................2
1.2. Horizontal flow orientation .....................................................................................4
1.3. Vertical flow orientation ......................................................................................... 4
1.4. Drainage channel incorporated fibrous filter media in horizontal flow
orientation ...............................................................................................................5
1.5. Drainage channel incorporated fibrous filter media in vertical flow orientation ....7
2.1 Single fiber capture mechanisms (a) Direct interception, (b) Inertial impaction, (c) Brownian diffusion (d) Gravitational capture .................................................18
3.1 Mixing tank assembly to make slurry of fibers ....................................................31
3.2 Schematic of vacuum molding setup .................................................................... 33
3.3 Lab scale setup of vacuum molding process .........................................................35
3.4 Lab scale pycnometer assembly............................................................................ 37
3.5 Porosities of glass fiber filter media ..................................................................... 37
3.6 Frazier® Differential Pressure Air Permeability Measuring Instrument ............... 40

xv
3.7 Components of Frazier® Differential Pressure Air Permeability Measuring Instrument (a) Sample holder (b) Manometer to read pressure drop (c) Orifice (d) Pump and pump control (e) Different orifice opening...........................................40
3.8 Air permeability of glass fiber filter media ........................................................... 41
3.9 Lab scale Durometer ............................................................................................. 42
4.1 Filter media band saw and cutter assembly (a) band saw (b) filter holder ........... 44
4.2 Filter holder to cut filter sample by using the cutter saw ...................................... 45
4.3 Filter media sample (a) Thick filter media (b) Filter media cut by using filter
media cutter saw ...................................................................................................45
4.4 Woven drainage channels (a) Polypropylene circular shaped woven drainage channel (b) Microscopic image of woven polypropylene drainage channel ........ 46
4.5 Nonwoven drainage channels (a) Polypropylene circular shaped nonwoven drainage channel (b) Microscopic image of nonwoven polypropylene drainage channel .................................................................................................................. 46
4.6 (a) Nylon nanofibers electrospun on Teflon® woven mesh of 500 µm pore opening (b) Microscopic image of Nylon nanofibers on Teflon® woven mesh ...48
4.7 Filter geometries in horizontal orientation (a) No-drainage (b) Inlet-drainage (c) Middle-drainage (d) Outlet-drainage (e) Both-End-Drainage (f) Inclined-angle- drainage .................................................................................................................49
4.8 Filter geometries in vertical orientation (a) No-drainage (b) Inlet-drainage (c) Middle-drainage (d) Outlet-drainage (e) Both-End-Drainage (f) Inclined-angle- drainage .................................................................................................................50
4.9 Composite filter media .......................................................................................... 51

xvi
5.1 Schematic of the coalescing filter testing set up ................................................... 53
5.2 Lab scale coalescence filtration setup ................................................................... 54
5.3 (a) Surge tank (b) Prefilters................................................................................... 54
5.4 (a) Laskin nozzle (b) Mixing chamber .................................................................. 55
5.5 Heater .................................................................................................................... 56
5.6 Horizontal flow orientation filter holder (a) Filter holder parts (b) Filter holder assembly ................................................................................................................ 57
5.7 Filter holder assembly in vertical orientation (a) Filter holder assembly (b) Filter holder fixed to the filter holder assembly (c) Filter holder and the wire mesh .....58
5.8 (a) Pressure gauge (b) Photometer ........................................................................ 60
5.9 (a) Rotameter (b) Downstream HEPA filter ......................................................... 60
5.10 SMPS and CPC ..................................................................................................... 61
6.1 Upstream and downstream droplet size distribution of no-drainage channel filter media ..................................................................................................................... 63
6.2 Pressure and downstream concentration profile of no-drainage channel filter media ..................................................................................................................... 64
6.3 Capture efficiency of filter geometries with polypropylene woven drainage channels................................................................................................................. 65
6.4 Pressure drop of filter geometries with polypropylene woven drainage channels................................................................................................................. 67

xvii
6.5 Quality factor of filter geometries with polypropylene woven drainage channels................................................................................................................. 69
6.6 Saturation of filter geometries with polypropylene woven drainage channels ..... 71
6.7 Tested filter media (a) no-drainage channel filter media in horizontal orientation
(b) Both-end-drainage filter media in horizontal orientation. The green colored oil is collected near the bottom edge of the filter medium ...................................... 72
6.8 Quality factor versus average saturation of all filter geometries with polypropylene woven drainage channels .............................................................. 74
6.9 Measurement of saturation profile of no-drainage filter media
in horizontal orientation ........................................................................................ 75
6.10 Saturation profile of no-drainage channel filter media in horizontal orientation . 76
6.11 Relative quality factor of no-drainage filter media in horizontal and vertical orientation ............................................................................................................. 77
6.12 Relative Quality Factor of filter geometry with polypropylene woven drainage channels in horizontal and vertical orientation ..................................................... 78
6.13 Effect of number of channels on capture efficiency of 450 downward inclination filter geometry in horizontal orientation ............................................................... 81
6.14 Effect of number of Channels on pressure drop of 450 downward inclination filter geometry in horizontal orientation ........................................................................ 82
6.15 Effect of number of channels on quality factor of 450 downward inclination filter geometry in horizontal orientation ........................................................................ 82

xviii
6.16 Effect of number of channels on saturation of 450 downward inclination filter geometry in horizontal orientation ........................................................................ 83
6.17 Filter geometry developed with three equally spaced polypropylene woven drainage channel at 450 upward inclination .......................................................... 84
6.18 Capture efficiency of three drainage channels at 45 degree upward inclination and experimental control ............................................................................................. 85
6.19 Pressure drop of three drainage channels at 45 degree upward inclination and experimental control ............................................................................................. 85
6.20 Quality factor of three drainage channels at 45 degree upward inclination and experimental control ............................................................................................. 86
6.21 Saturation of three drainage channels at 45 degree upward inclination and experimental control ............................................................................................. 86
6.22 Capture efficiency of filter media equipped with woven drainage channel of different pore openings ......................................................................................... 88
6.23 Pressure drop of filter media equipped with woven drainage channel of different pore openings ........................................................................................................ 88
6.24 Quality factor of filter media equipped with woven drainage channel of different pore openings ........................................................................................................ 89
6.25 Saturation of filter media equipped with woven drainage channel of different pore openings ................................................................................................................ 89
6.26 Flow pattern in the filter geometry with three equally spaced drainage channels at 450 downward inclination ..................................................................................... 90
xix
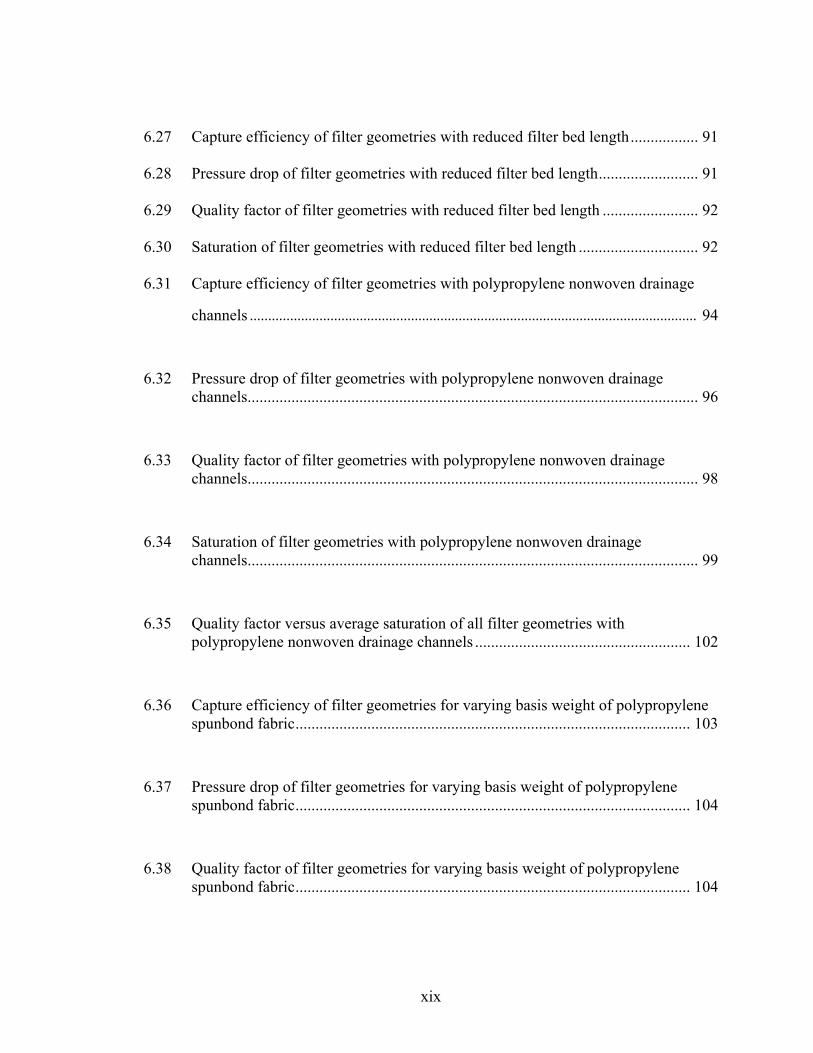
6.27 Capture efficiency of filter geometries with reduced filter bed length ................. 91
6.28 Pressure drop of filter geometries with reduced filter bed length ......................... 91
6.29 Quality factor of filter geometries with reduced filter bed length ........................ 92
6.30 Saturation of filter geometries with reduced filter bed length .............................. 92
6.31 Capture efficiency of filter geometries with polypropylene nonwoven drainage
channels .......................................................................................................................... 94
6.32 Pressure drop of filter geometries with polypropylene nonwoven drainage channels................................................................................................................. 96
6.33 Quality factor of filter geometries with polypropylene nonwoven drainage channels................................................................................................................. 98
6.34 Saturation of filter geometries with polypropylene nonwoven drainage channels................................................................................................................. 99
6.35 Quality factor versus average saturation of all filter geometries with polypropylene nonwoven drainage channels ...................................................... 102
6.36 Capture efficiency of filter geometries for varying basis weight of polypropylene spunbond fabric ................................................................................................... 103
6.37 Pressure drop of filter geometries for varying basis weight of polypropylene spunbond fabric ................................................................................................... 104
6.38 Quality factor of filter geometries for varying basis weight of polypropylene spunbond fabric ................................................................................................... 104

xx
6.39 Saturation of filter geometries for varying basis weight of polypropylene spunbond fabric ................................................................................................. 105
6.40 Relative Quality Factor of filter geometry with polypropylene nonwoven drainage channels in both horizontal and vertical orientation ........................................... 107
6.41 RQF of woven and nonwoven drainage channel incorporated filter geometries in horizontal and vertical orientation ...................................................................... 108
6.42 Sullube® 32 oil contact angle on plane surfaces (a) Nylon, (b) Polypropylene and
(c) Teflon® .................................................................................................................... 110
6.43 Sullube 32® oil contact angle on woven surfaces (a) Polypropylene and
(b) Teflon® .................................................................................................................... 111
6.44 Capture efficiency of filter geometries developed with varying surface wettability of drainage channels ........................................................................................... 113
6.45 Pressure drop of filter geometries developed with varying surface wettability of drainage channels ................................................................................................ 114
6.46 Quality factor of filter geometries developed with varying surface wettability of drainage channels ................................................................................................ 116
6.47 Saturation of filter geometries developed with varying surface wettability of drainage channels ................................................................................................ 117
6.48 RQF of filter geometries developed with woven and nonwoven drainage channels of varying surface wettability ............................................................................. 119
6.49 Height between drainage channels for different angles of the inclined angle

xxi
experiments .................................................................................................................. 120
6.50 Capture efficiency of composite filter media ...................................................... 121
6.51 Pressure drop of composite filter media ............................................................. 122
6.52 Quality factor of composite filter media ............................................................. 122
6.53 Saturation of composite filter media ................................................................... 123
7.1. Schematic of single jet electrospinning .............................................................. 128
7.2. Lab scale set up of single jet electrospinning ..................................................... 128
7.3. Lab scale NanospiderTM module ......................................................................... 131
7.4. Wire electrode and solution bath ........................................................................ 131
7.5. SEM images of nylon nanofibers (a) 6 wt% (b) 8 wt% (c) 12 wt% (d) 20 wt% 133
7.6. SEM image of nanofiber augmented glass fiber filter media ............................. 134
7.7. Capture efficiency of nanofiber augmented glass fiber filter media incorporated with nylon and polypropylene woven drainage channels ................................... 135
7.8. Pressure drop of nanofiber augmented glass fiber filter media incorporated with
nylon and polypropylene woven drainage channels ........................................... 137
7.9. Quality factor of nanofiber augmented glass fiber filter media incorporated with nylon and polypropylene woven drainage channels ........................................... 140
7.10. Saturation of nanofiber augmented glass fiber filter media incorporated with nylon and polypropylene woven drainage channels ........................................... 141
7.11. Quality factor versus average saturation of all nanofiber augmented filter geometries with nylon and polypropylene woven drainage channels ............... 143
xxii
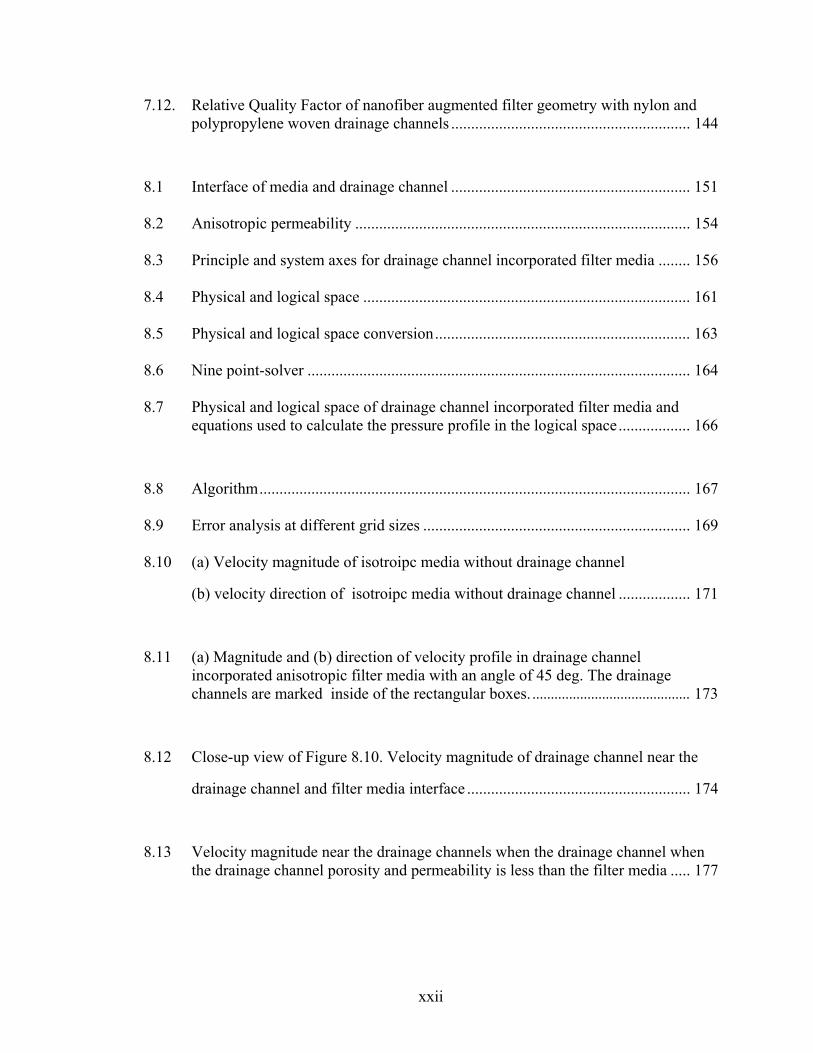
7.12. Relative Quality Factor of nanofiber augmented filter geometry with nylon and polypropylene woven drainage channels ............................................................ 144
8.1 Interface of media and drainage channel ............................................................ 151
8.2 Anisotropic permeability .................................................................................... 154
8.3 Principle and system axes for drainage channel incorporated filter media ........ 156
8.4 Physical and logical space .................................................................................. 161
8.5 Physical and logical space conversion ................................................................ 163
8.6 Nine point-solver ................................................................................................ 164
8.7 Physical and logical space of drainage channel incorporated filter media and equations used to calculate the pressure profile in the logical space .................. 166
8.8 Algorithm ............................................................................................................ 167
8.9 Error analysis at different grid sizes ................................................................... 169
8.10 (a) Velocity magnitude of isotroipc media without drainage channel
(b) velocity direction of isotroipc media without drainage channel .................. 171
8.11 (a) Magnitude and (b) direction of velocity profile in drainage channel incorporated anisotropic filter media with an angle of 45 deg. The drainage channels are marked inside of the rectangular boxes. ........................................... 173
8.12 Close-up view of Figure 8.10. Velocity magnitude of drainage channel near the
drainage channel and filter media interface ........................................................ 174
8.13 Velocity magnitude near the drainage channels when the drainage channel when the drainage channel porosity and permeability is less than the filter media ..... 177

xxiii
8.14 Velocity direction near the drainage channels when the drainage channel porosity and permeability is less than the filter media ...................................................... 177
8.15 Velocity (a) magnitude and (b) directions in drainage channel and media when porosity and permeability of filter media is higher than drainage channels ....... 178
8.16 Drop motion through drainage channel and media ............................................. 179

1
CHAPTER I
INTRODUCTION
1.1 Theory of filtration
Filtration is a mechanical process in which a dispersed phase is separated from a
continuous phase by allowing it to flow through a porous material. The dispersed phase
can be solid or liquid and continuous phase can either be a liquid or a gas. The filtration
process can be used to remove unwanted impurities as well as to recover expensive
dispersed phase from the fluid. When the continuous phase flows through the filter
medium, the dispersed phase fluid or solid is captured either on the surface when the
dispersed phase particle size is larger than the pores or on the pores inside the filter
medium when the particle size is smaller than the pores. The filter medium is the core
part of any filtration process. It is defined as a permeable medium which allows the
continuous phase to pass through and captures the dispersed phase i.e. the liquid or solid
impurities. The flow through the filter medium is due to the pressure difference between
the inlet and outlet surfaces. The efficiency of the filtration process depends mainly on
the effectiveness of the filter medium in removing the impurities. The selection of filter
medium is an important aspect of filtration.

2
1.2 Types of filtration
Filtration can be classified as surface and depth filtration. When the dispersed
phase particle size is bigger than the pore size of the filter medium, most of the filtration
occurs at the inlet surface of the medium. No particle can pass through the medium. In
depth filtration, the dispersed phase particle size is often less than the pore size of the
filter media [1, 2]. The particles penetrate into the medium and get captured due to the
mechanisms like interception, impaction, diffusion, gravitational deposition etc.
Depending on the application, filtration is divided into solid-gas, liquid-gas, solid-liquid,
and liquid-liquid filtration.
1.3 Coalescing filters
Figure 1.1 Coalescing filter.
Gas flow in Gas flow out
Drainage
Gravity

3
Coalescence is the agglomeration and growth of small liquid droplets to form
bigger drops. The coalescing filtration is a depth filtration process in which liquid is
removed from a gas stream or another liquid stream. When a liquid is removed from a
gas stream, it is called air or gas filtration. When a liquid is removed from another liquid
stream, it is called liquid-liquid filtration. In coalescing filtration, the dispersed liquid
droplets enter with the continuous phase, strike the fibers due to various capture
mechanisms, coalesce with other drops, grow big and eventually drain out of the filter
medium as shown in Figure 1.1. The dominating mechanisms of this filtration process are
direct interception, inertial impaction, diffusion deposition, gravity settling and
electrostatic capture.
1.4 Hypothesis
1.4.1 Flow orientation
In the coalescing filter, when the droplets are captured on the fibers, coalesce and
move from fiber to fiber, they experience gravitational force. Hence the droplets moving
from fiber to fiber in horizontal flow orientation do not follow the straight line path
(Figure 1.2). When the flow is in direction of gravity, i.e. in the vertical flow orientation,
the droplets follow straight line path (Figure 1.3). Available experimental or theoretical
information is unable to tell which of the flow orientation will perform better. When the
flow is in the direction of gravity, the gravitational force can help to drain the big
coalesced drops faster and can enhance the performance of the filter in terms of quality
factor and saturation.

4
Figure 1.2 Horizontal flow orientation.
Figure 1.3 Vertical flow orientation
Drainage
Gas flow
Gas flow out Gravity
Gas flow in Gas flow out
Drainage
Gravity
5
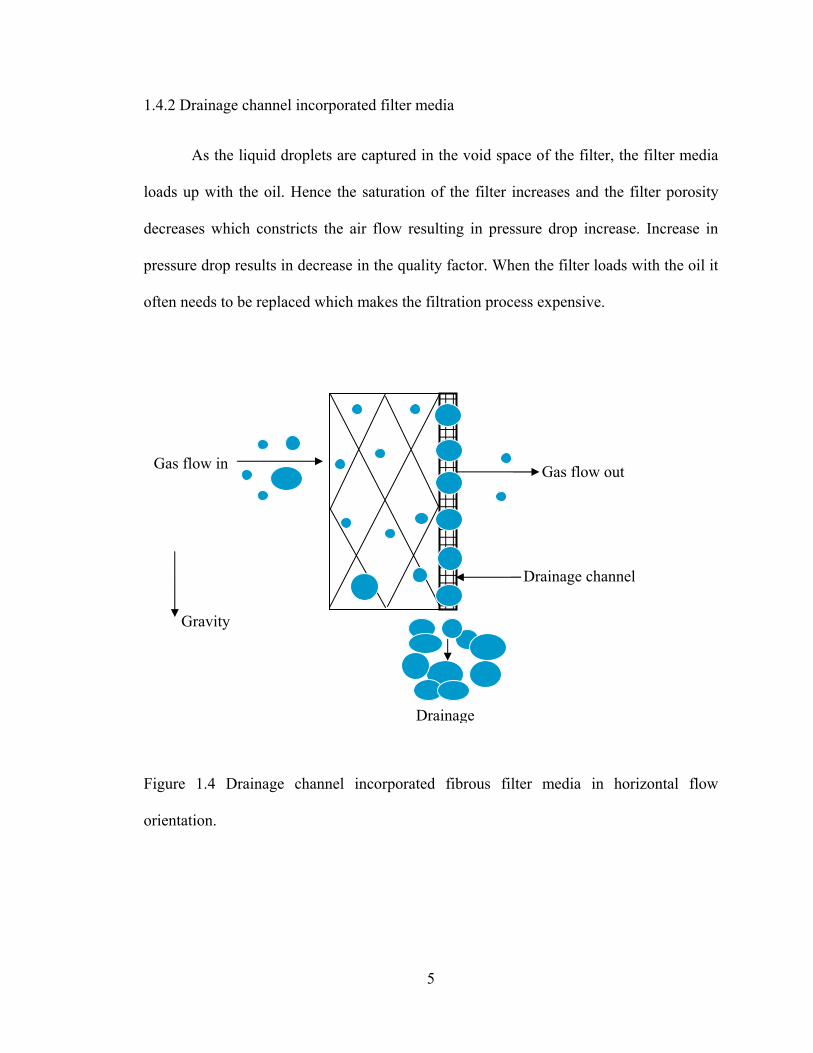
1.4.2 Drainage channel incorporated filter media
As the liquid droplets are captured in the void space of the filter, the filter media
loads up with the oil. Hence the saturation of the filter increases and the filter porosity
decreases which constricts the air flow resulting in pressure drop increase. Increase in
pressure drop results in decrease in the quality factor. When the filter loads with the oil it
often needs to be replaced which makes the filtration process expensive.
Figure 1.4 Drainage channel incorporated fibrous filter media in horizontal flow
orientation.
Gas flow in Gas flow out
Drainage
Gravity
Drainage channel

6
Drainage channels can be incorporated in the filter media to enhance drainage and
reduce saturation of the filter media. The drainage channels are open and porous
structures of varying surface energy. The drainage channel provides a path of low
resistance hence the oil droplets can drain very easily from the filter media. Hence the
filter media will have higher drainage and lower saturation. This filter media can remain
porous for longer time and can capture more droplets. Hence the filter can remain
functional for longer time and filter life will be enhanced. The schematic of drainage
channel incorporated filter media is horizontal flow orientation is shown in Figure 1.4.
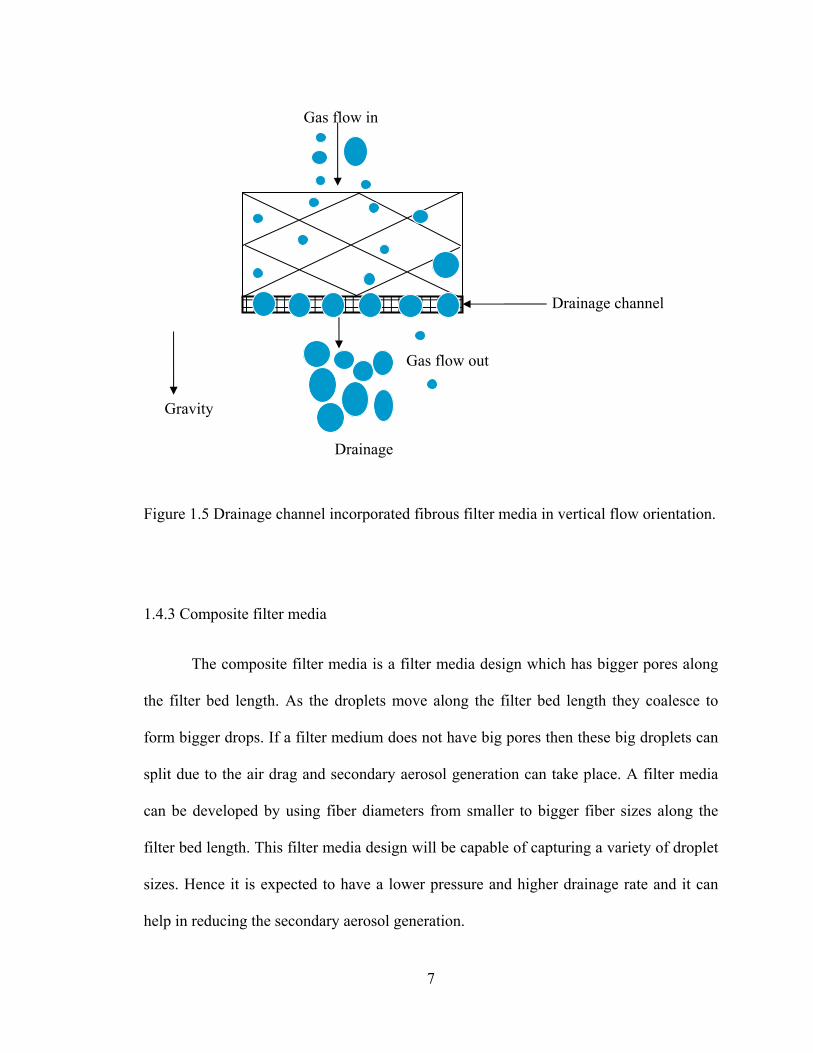
The drainage channel incorporated filter media in vertical orientation shows
improved performance because of the available gravitational force will help in draining
the bigger coalesced drops faster from the filter media and usually has a reduced
saturation. Hence the filter will remain porous for a longer time and will have a higher
quality factor and longer filter life.
7
Figure 1.5 Drainage channel incorporated fibrous filter media in vertical flow orientation.
1.4.3 Composite filter media
The composite filter media is a filter media design which has bigger pores along
the filter bed length. As the droplets move along the filter bed length they coalesce to
form bigger drops. If a filter medium does not have big pores then these big droplets can
split due to the air drag and secondary aerosol generation can take place. A filter media
can be developed by using fiber diameters from smaller to bigger fiber sizes along the
filter bed length. This filter media design will be capable of capturing a variety of droplet
sizes. Hence it is expected to have a lower pressure and higher drainage rate and it can
help in reducing the secondary aerosol generation.
Drainage
Gas flow in
Gas flow out
Gravity
Drainage channel
8
1.5 Research objectives
Following are the primary objectives of the research work.
a. Study the effect of gravitational force to improve the quality factor and drainage
of coalescing filters.
b. Develop different filter geometries by incorporating woven and nonwoven
drainage channels in the coalescing filters for air liquid coalescence process. The
filter media used to develop drainage channel incorporated filter geometries will
have similar properties.
c. Evaluate the performance of the drainage channel incorporated filter media
experimentally.
d. Study the parameters affecting on the performance of the drainage channel
incorporated filter media and improve the filter media design.
e. Develop nanofiber augmented filter media and study the performance of
nanofiber augmented filter geometries. The nanofiber augmented filter media will
have similar properties.
f. Develop a composite filter media design of varying fiber diameters and evaluate
its performance experimentally.
g. Develop a mathematical model of the drainage channel incorporated filter
geometry to predict pressure and velocity profile with no oil drops present at
steady state.
9
1.6 Benefits of current work
Coalescing filters are widely used in industry to remove liquid droplets from air
stream. The coalescing filters are fibrous and hence they have internal pores of different
sizes. When theses filters capture the liquid droplets these pores are filled with the liquid.
Hence the filter media saturates with the liquid droplets and possess higher pressure drop.
The filter having higher pressure drop requires more energy for the air to flow through
the media making the process energy expensive. Once the filter loads up with the liquid
droplet it has to be replaced. The time period for which the filter is functional is known as
filter life. Hence the filter life is dependent upon pressure drop and saturation.
Current research work utilizes the available gravitational force to improve the
performance and drainage of filter media. Effect of gravitational force on the
performance of filter media is studied by changing the air flow direction. The
gravitational force will help removing the bigger coalesced drop faster from the filter
media. Hence the filter media will have low saturation and low pressure drop. Filter can
remain porous for longer time and hence can have higher capture efficiency as well as
longer filter life.
Current research work is also associated with developing a filter media design
which will effectively drain the saturated liquid from the filter media. These filter designs
are developed by incorporating woven and nonwoven drainage channels. These drainage
channels are porous open structures and possess lower surface energy as compared to the
glass fiber filter media. Hence these drainage channels will improve the liquid drainage
from the filter media and the filter media will have low saturation and hence low pressure
10
drop with a high capture efficiency. This will help in keeping the filtration process energy
efficient. The filter geometry having lower saturation and lower pressure drop will
remain porous for longer time. Hence the filter can capture more droplets and remain
functional for longer time and will have longer filter life.
1.7 Dissertation outline
a. Chapter I gives an introduction to coalescence filtration theory, hypothesis and
objectives of this work, and its benefits.
b. Chapter II reviews the background information on aerosol filtration, prior
literature on coalescing filter media with drainage channels and industrial
applications of coalescence filtration.
c. Chapter III explains fabrication and characterization of fibrous filter media.
d. Chapter IV explains the woven and nonwoven drainage channels and procedure
of developing different filter geometries.
e. Chapter V describes the experimental setup of coalescence filtration and
procedure to test the filter geometries.
f. Chapter VI presents the experimental results and performance comparison of
woven and nonwoven drainage channel incorporated filter geometries. It also
explains the effect of different parameters on the performance of the filter
geometries.
g. Chapter VII describes the process of making nanofibers, experimental results
and performance comparison of nanofiber augmented woven and nonwoven
drainage channel incorporated filter geometries.

11
h. Chapter VIII explains the modeling approach and modeling results of drainage
channel incorporated filter media with no oil drops at steady state.
i. Chapter IX presents the conclusion of this dissertation work based on the
experimental and modeling results.
j. Chapter X presents the future direction of experimental and modeling work of
filter geometries.
12
CHAPTER II
LITERATURE REVIEW ON COALESCENCE FILTRATION
This chapter reviews the aerosol filtration, sources of liquid aerosol generation,
prior work on coalescing filters and drainage channel incorporated coalescing filter, and
the industrial applications of these types of filter media.
2.1 Aerosol filtration
An aerosol is a suspension of solid particles or liquid droplets in air. Air is the
bulk transportation medium for transmission of particulate contaminants. The control
over airborne solid and liquid contaminants, hazardous biological agents, allergens and
pollutants is a key issue in many industries like the metal-cutting, automobile,
semiconductor, food, pharmaceuticals and biotechnology processes as these businesses
require centralized air conditioning in production environment, clean gases and
effluent/waste treatment. The particle size of particulate matter is determined by the
process that generates the particles. The processes that generate liquid aerosols are
described below.

13
2.2. Sources of liquid aerosol
Liquid aerosols mainly originate from following different processes.
2.2.1 Mechanical atomization
Liquids in contact with high rotation rate equipment acquire mechanic energy
high enough to be sheared into small droplets [1] and are differentiated from droplets
generated by impaction and centrifugal forces [2]. Metal working fluids are used to
lubricate the components of metal cutting processes [3, 4]. Droplets from these lubricants
disperse into the air from the metal cutting operations. The oil droplets are formed during
shearing action between moving surfaces. The average droplet diameter of metal working
fluid is about 5-8 μm [5, 6].
Oil is also used to lubricate and remove excess heat generated in compressed air
systems. During the compression process, tiny droplets of oil are introduced in the air
stream. Even with no oil lubrication, oil droplets are introduced in the air stream as the
atmospheric air contains 20-30 ppm of hydrocarbon aerosols [7]. Apart from these
applications, removing liquid aerosols from a gas stream is important in other industries
like, petroleum refineries, natural gas industries, and the nuclear power industries.
2.2.2 Evaporation–condensation
At sufficiently high temperature conditions, a liquid can evaporate and
spontaneously re-condense around liquid nuclei in locations of slightly lower temperature
[8]. The heat is generated during high temperature metal working processes which
evaporates the oil. The oil vapors can condense on dust particles to form small oil
droplets [9]. For instance, combustion particles are usually in the 10-50 nm size range,
but when they combine with other particles like the oil, water or solvent mist they

14
agglomerate to form larger particulates. The agglomerate particles may be broken down
into smaller particles and released into air. It is difficult to break down such particles
smaller than 0.5 µm [10].
2.2.3 Entrainment by gas flow in liquid–gas contactors
Flowing gases in spray towers, cooling towers, and plate columns, can entrain
droplets from the liquid phase [6]. Compressed air is important in many industrial
applications. Some of the main applications include pneumatic conveying, spray paint
equipment, breathing air, laboratory air use, gas separator systems, aeration in
pharmaceutical and chemical processes, air bearings for mechanical power transmission
etc. The typical water drops are 0.05-10 µm and oil droplets are 0.1-10 µm in diameter
[11]. The liquid droplets are carried with the air in the above mentioned applications and
are harmful for the workers. The impurities in the air affect the downstream processes
and process equipments as well. Filtration is required to improve the overall quality of
the processes and the reliability of the process equipments.
2.2.4 Crankcase ventilation (CCV)
Liquid aerosols are also generated in internal combustion engines and are released
into the environment through crank case ventilation. The crankcase encloses many of the
moving parts of the engine that are lubricated by oil circulated from the oil pan. The
impurities are introduced in the gas in two ways. First, oil droplets are formed due to the
shearing action of moving parts in the crankcase. Second, the gases inside the combustion
chamber leak out of the piston and enter crankcase. The droplet size distribution is 0.1-10
µm and soot particles are 0.3-0.5 µm [12]. Regulations require removal of these
impurities to achieve overall emission standards for the engines. The other applications of

15
filtration in automotive industry are tank venting, engine intake air, engine exhaust gas,
cabin air, coolant system, gearbox oil and engine oil [13].
The typical aerosol droplets of interest have sizes ranging from about 0.01 µm to
50 µm. Aerosols generated during the above mentioned processes represent a significant
waste stream as well as a health hazard to humans. The metal working fluids affect the
health of the people when they are exposed for long duration of time. Medical evidence
has linked worker exposure to cutting fluid mist with respiratory ailments and several
types of cancers [4]. Respiratory illnesses associated with inhalation of above mentioned
aerosols include respiratory irritation, bronchitis, occupational asthma, and loss of lung
function. Several epidemiological studies have also shown statistically significant
increases in cancer of the esophagus, stomach, pancreas, larynx, colon, and rectum due to
prolonged exposure to cutting fluid mists [14]. To reduce worker exposure common mist
control strategies include enclosing the machine tool, using air filters and mist collectors,
and adding antimisting agents to the cutting fluid.
2.3 Coalescing filters
Coalescing filters are used to remove small liquid droplets from air streams. They
have numerous industrial applications e.g. dehumidification, cabin air filtration, gas
compressors, removal of liquid aerosols from metal cutting, CCV and agricultural
processes [4, 10, 11, 14]. Coalescence filtration is a process in which droplets carried by
a flowing gas are captured by the fibers of a filter medium. Ensuing droplets carried by
the gas collide and coalesce with the prior drops. Coalescence occurs when two or more
liquid droplets come into contact with each other with sufficient energy to overcome
surface tension for the drops to merge [15]. The coalesced drops grow in size in the filter

16
medium until drag of the moving gas or gravity force are strong enough to cause the
enlarged drops to drain out of the filter [16]. The critical size of the drop after which it
detaches from the fiber depends on the local velocity, fiber size, interfacial tension and
contact angle. It has also been observed that if the contact angle of the drop on the fiber is
small the drop does not break away from the fiber but is conducted along the fiber
direction of fluid stream [17-21].
Increasing the gas-liquid separation efficiency of a filter is usually accompanied
by an increase in pressure drop across the filter [22]. The increase in the pressure drop
can be divided into three stages. When a critical oil mass is trapped in the filter, the
pressure drop rises quickly and then stabilizes and a steady state characterized by an
equilibrium between the drainage and liquid flow entering in the filter is established.
Finally, the pressure drop becomes constant and a steady state is reached. From this
moment on, the oil mass stored in the filter is constant and the rate of drainage exiting the
filter balances the liquid droplet capture rate [23]. The separation efficiency depends
upon the drop size, liquid viscosity, gas velocity, pressure, temperature of the gas,
structure of the filter medium (fiber diameter, fiber orientations and packing density),
surface properties of the fibers, binder content, and filter thickness. The surface tension of
the liquid has a crucial influence on the formation of the droplets, although it is difficult
to separate the influences of the surface tension and the viscosity of the liquid because
they vary proportionately with temperature [24]. Purchas [25] provides a comprehensive
list of filtration-specific properties, machine-oriented properties, and application-oriented
properties that are important in the selection of filter media.
17
The filter performance is characterized by the combined performance of pressure
drop and separation efficiency. The performance measure has several equivalent
definitions such as filtration index [26], figure of merit [27, 28], or quality factor [29, 30].
Liquid gas coalescers are very effective in removing liquid droplets down to 0.1
μm with higher gas velocity than other methods and much lower pressure drop with
effective drainage mechanism. The liquid droplets of an aerosol are caught on the fibers,
coalesce with each other and drain out of the filter media. A variety of fibers are used for
various applications. High efficiency particulate air, or HEPA, filter is a type of high-
efficiency air filter made up of randomly arranged glass fibers. According to the standard
adopted by most industries, it removes at least 99.97% of airborne particles of 0.3 µm in
diameter. The fibrous filters capture particles by following capture mechanisms as
described below.
2.4 Capture mechanisms
As the aerosol passes through the filter media the particles are captured in the
depth of the fiber media. There are several mechanisms that contribute to the capture of
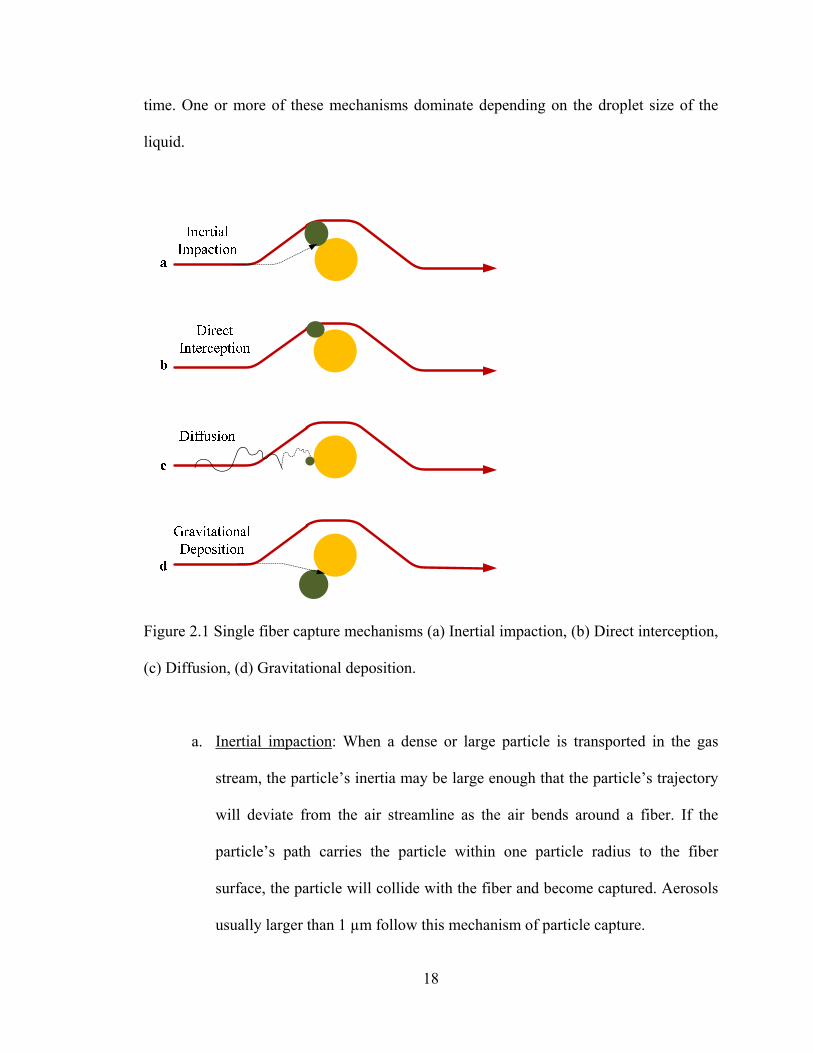
particles [29]. Submicron size droplets and particles are captured by four dominant
capture mechanisms as shown in Fig. 2.1. These mechanisms are called the single fiber
capture mechanisms. The capture on a single fiber is considered to be dependent upon the
local flow conditions around the fiber and in when the filter properties are uniform the
capture on a single fiber is a representation of the entire filter medium. The main
assumption of the single fiber concept is that all fibers are identical [24]. The single fiber
mechanism has been widely accepted by the filtration industry as it leads to comparable
results with experiments. All of these mechanisms occur simultaneously at any point of
18
time. One or more of these mechanisms dominate depending on the droplet size of the
liquid.
Figure 2.1 Single fiber capture mechanisms (a) Inertial impaction, (b) Direct interception,
(c) Diffusion, (d) Gravitational deposition.
a. Inertial impaction: When a dense or large particle is transported in the gas
stream, the particle’s inertia may be large enough that the particle’s trajectory
will deviate from the air streamline as the air bends around a fiber. If the
particle’s path carries the particle within one particle radius to the fiber
surface, the particle will collide with the fiber and become captured. Aerosols
usually larger than 1 µm follow this mechanism of particle capture.

19
b. Direct interception: Particles in the range of 0.3-1 µm in diameter usually
follow the air streamline; they will intercept a fiber if the distance of stream
line approaches to less than the particle’s radius to the fiber surface.
c. Diffusion: Particles smaller than 0.3 µm have very little mass. As a result they
travel in random motion superimposed upon the stream line flow due to
collisions with air molecules, similar to molecular diffusion. The random
motion increases the likelihood that they will come in contact with the fibers
and will be captured.
d. Gravitational deposition: When the velocities within the filter medium are
very low, the aerosol droplets of 20-50 µm in diameter may fall out of the air
stream before reaching the media. If they do reach the media they continue to
fall as they pass through the media. This vertical motion increases the
likelihood that they will bump into the fiber and be captured.
While the capture mechanisms described here are most effective on particles on a
certain size range, an increase or decrease in the air velocity can cause the capture
efficiency to vary [29]. The comprehensive view of fibrous filtration and its theory,
efficiency of fibrous filters, comparison of fibrous filters with other filtration, loading
characteristics of solid particles, and forces controlling the filtration process is given by
Brown [29] and Davies [30,31]. Stenhouse and Trotter [32] studied the loading of
submicron solid particles on fibrous filters.
The fiber sizes, fiber orientation, surface energy of the fibers and the filter,
surface tension of the liquid droplets, aerosol flow rate are key parameters which affects
the performance of the filter media. Liquid saturation and pressure drop of the filter
20
media are important parameters which need to be measured and controlled for the filter
media to indicate higher filter life. Filter life and the filter media performance can be
improved by lowering the saturation and pressure drop with high capture efficiency. One
of the easy ways of improving filter life is to incorporate drainage channels in the
coalescing filters.
2.5 Coalescence filtration and drainage channel design
Incorporating drainage channels in the coalescing filters have been reported in the
literature. Miller et al. [25] designed a composite filter media made up of coalescing and
drainage layers at the inlet and outlet surfaces of the filter. The coalescing layer was
made up of micro glass fibers of 0.5 µm to 10 µm diameters and the drainage layer was
made of coarser fibers than the coalescing layer. Both of these layers were positioned in
face to face contact with each other with the coalescing layer facing the flow. The
coalescing layer and drain layer were separated by an open metal mesh having 70 % open
area. The composite medium had capture efficiency greater than 99% for capture of 0.01
µm to 10 µm size oil droplets with an inlet concentration of 400 milligrams per cubic
meter. The drainage layer received the oil from the coalescing layer and provided a path
for oil to flow by gravity from the filter. The drainage layers were either an open plastic
foam of polyester, polyethylene or polyurethane with 80 pores per inch or a felt of fibers
with diameters in the range of 10-20 µm loosely bonded together with an oleophobic
binder. The coalescing layer was bonded with an oleophilic binder. Experiments were
conducted with or without the drainage layers impregnated with a low surface energy
fluorocarbon material. The fluorocarbon impregnated drainage layers had better
21
performance in terms of reduced oil carry over and in removing the oil from the filter
media by providing a flow path for oil to flow by gravity from the filter.
Cylindrical pleated filter media made up of three layers of fibers having different
fiber diameters and surface energies are discussed in references [33, 34]. In their designs
the upstream and downstream layers had larger pore openings as compared to the
intermediate layer made up of fibers having diameters from 0.1 µm to 20 µm. The filter
media were made of polyolefins or fluorochemical materials to modify the surface
properties. The fluorochemical treated and untreated media were tested for separating
mineral oil droplets from an air stream and the pressure drop of the filter media was
reported. Their experimental results indicated that the untreated filter structure had a
much higher pressure drop as compared to the treated filter structure. The filters without
surface treatment had high oil concentrations in the downstream air which at some point
was above the accurate measurement range of the sampling equipment while the surface
treated media had much lower oil carry over [34].
Hunter [35, 36] developed a filter media design with a coalescing layer of
borosilicate glass microfibers and a drainage layer made up of open-celled foam plastic
material. The open-celled foam plastic material had a lower surface energy as compared
to the glass microfibers. He observed that drainage channel incorporated filter media
have better drainage and a lower oil wetted area which lowered the possibility of
reentrainment of oil drops into the gas stream.
Spencer [37] developed a tubular filter medium with a coalescing layer and a low
surface energy drainage layer located downstream of the coalescing layer. The coalescing
layer was made up of 0.5-10 µm size microglassfibers while the drainage layer was made

22
of polyester spunbond 40-60 micron diameter fibers. The polyester fibers have a lower
surface energy than the glass fibers. The coalescing layer used an acrylic binder while the
drainage layer used 15 % bicomponent polyethylene terephthalate fibers as binder which
had a lower melting point than the polyester fibers. The drainage layer was a 5 mm sleeve
made from 200 g/m2 spunbond fabric which surround the coalescing layer. The
spunbond fibers, being larger than the glass fibers, had larger pore openings that reduced
capillary action to retain liquid in the medium.
Waltl [38] modified the filter design by incorporating inner and outer drainage
layers. The inner drainage layer was made of two layers of spunbond polyester while
outer drainage layer was made of polyester bi-component nonwoven fleece material. The
authors detected the oil carry over by using Gelman filter paper and observed that the low
surface energy drainage channel equipped filter media has significant reduced oil carry
over and pressure drop.
2.6 Fiber orientation and filter performance
The fibers in nonwoven filter medium tend to lie with their axes approximately
perpendicular to gravity but randomly oriented in the horizontal plane when made by
using the vacuum molding process which is also known as a wet-laid process in the
industry. Because of this, filter media cut at different angles from a large vacuum formed
filter cake have different orientations (angles) relative to the inlet surface. Filter
performance relative to the fiber orientation have been reported [39-41].
Chokdeepanich [39] experimented with media cut from a large filter cake of glass
micro fibers to construct media of the same fibers and same porosity but with different
fiber orientations. He tested filter samples made of two sandwiched layers of equal

23
thickness in liquid aerosol filtration. The layers were combinations of capture and
drainage layers. The capture layers were constructed of glass micro fibers with the fibers
predominately perpendicular to the direction of gas flow. Drainage layers were
constructed of the same glass microfibers with the same packing fraction (porosity) but
with the fibers oriented with their axes at angles more closely aligned with the direction
of flow. The fiber orientation in the drainage layer had less flow resistance for the
captured liquid drops and less flow resistance to the gas flow. Filters were assembled as
combinations of capture and drainage layers or two layers of the same type. The layers
were oriented normal to the flow, with the flow passing through each layer in succession.
The filter samples with a capture layer at the inlet surface followed by a drainage layer
gave better quality factor performance compared to the other combinations.
2.7 Saturation of the filter media
Liquid saturation of the filter medium is the volume fraction of the pores filled by
the liquid phase. It is dependent upon many of the above parameters and it directly
affects the pressure drop and local gas velocity within the medium. The mass of a liquid
captured by a filter medium is typically measured gravimetrically by subtracting the mass
of a filter medium before an experiment from the mass of the medium at the end of an
experiment. The liquid mass is converted to volume using the liquid density and the
average saturation is determined as the ratio of liquid volume to void volume. By
constructing a filter medium as a stack of thin layers, Andan [42, 43] experimentally
demonstrated that local saturation in a filter varies with position. A continuum model
shows that the average saturation and the variation in local saturation affect the pressure
drop [44]. In general, the greater the saturation the higher is the pressure drop. However,
24
it is plausible that a locally high saturation can cause a high pressure drop in a filter
medium that has a low average saturation.
Local saturation has been investigated by models and experiments [42-44]. In
their continuum model Andan et al. [44] show that the local saturation profile affects the
pressure drop across the filter medium by restricting the flow and causing an increased
local gas velocity. Experimental measurements show the saturation in a medium of
uniform properties is higher near the inlet and outlet surfaces and lower in the interior of
the medium [42-46]. They propose this is due to the small size of the drops carried by
the gas at the inlet and the smaller drops tend to move slower than larger drops on fibers
as those found in the interior [43] The increase in saturation at the exit is not well
understood but it is suspected that it is due to the capillary forces holding the liquid to the
fibers and the resistance to flow of the liquid to drain vertically down the outside of a
horizontal flow oriented filter, causing the saturation to be higher at the exit surface. The
saturation was observed to decrease as the flow velocity increased [46-49] as expected
because of higher drag forces that cause the drops to move faster and the mass continuity
balance requires a decrease in the saturation at higher drop flow rates. In the interior of
the filter, larger drops will flow faster than the drops at the inlet which due to the mass
balance should similarly cause a decrease in the saturation in the interior as indicated
above [43, 44]. Contal et al [21] measured the saturation with respect to time during
various stages of liquid loading. Authors [48-50] describe the saturation and drainage
processes in terms of the Washburn equation. They consider that there is more drainage
when the saturation is high. At the exit boundary, saturation builds up due to a barrier
effect. The liquid drops have high resistance at the exit boundary due to surface tension.

25
The resistance acts as a barrier for the liquid flow and increases the saturation at the
boundary.
2.8 Nanofibers in coalescence filtration
Nanofibers are small sized solid fibers with diameters less than 1 μm. The
nonwoven industry generally considers nanofibers as having a diameter of less than one
micron, although the National Science Foundation (NSF) defines nanofibers as having at
least one dimension of 100 nanometer (nm) or less [51]. Nanofibers possess large surface
area per unit mass and form mats of small pore size. Nanofiber augmented filter media
showed lower energy consumption and easier maintenance, higher filter life, increased
contaminate holding capacity and enhance filtration efficiency [16, 52-59]. The
nanofiber based filtering media, made up of fibers of diameter ranging from 100 to 1000
nm, can be conveniently produced by electrospinning technique [60] and the fiber
diameter depends upon solution properties and concentration, hydrostatic pressure in
capillary tube, electric potential at the capillary tip, the tip-to-collector distance [57-60].
Zhang et al. [61] studied effect of nylon nanofiber diameter fabricated using the
electrospinning process on the performance of the filter media. Kim et al. [62] showed
the possible application of electrospinning in producing nylon nanofiber filtering media
specifically designed for capturing particles smaller than 50 nm. Fine-tuning of fiber size
distribution by controlling the spinning process is thought to facilitate the application in
this area [52, 58]. The pressure drop of a Nylon 6 nanofiber filter linearly increases with
the increasing face velocity [62]. An electrospun Nylon 6 nanofiber filter (mean fiber
diameter: 100 nm) shows a much lower pressure drop performance relative to the
commercial HEPA filter media when the filtration efficiency of the Nylon 6 nanofiber

26
filter and the HEPA filter are over 99.98% with test particles of 0.02-1.0 m in diameter.
The particle capture efficiency decreases with the increasing fiber diameter.
2.9 Modeling of fibrous filters
The pressure drop caused by fibrous filters has been studied for many years and
numerous analytical, numerical and empirical correlations are available for such media.
In almost all of these models, a filter is assumed to be made up of fibers of one size [64-
71]. Authors [71, 72] studied the effect of fiber diameter and developed a correlation for
pressure drop of filter media with fiber diameter which is a function of fiber diameter
ratio and their number fractions. The capture mechanisms for solid particles and liquid
droplets are quite similar, but the efficiency and pressure drop profiles are different for
both processes [21]. Brown [73] developed a model to predict pressure drop when the
particle are captured by inertial impaction by assuming all fibers are symmetric and
arranged parallel to each other. Authors [73-77] divided coalescence filtration in to four
stages according to the changes in pressure drop. The pressure drop increases during the
first three stages and during the final stage, equilibrium is reached between liquid
loading, drainage and re-entrainment and the pressure drop does not change thereafter.
Also, he made a comparison between the pressure drop profiles of filters with solid and
liquid aerosols. They also found that the fiber size, filtration velocity and surface tension
effect the clogging of fibrous filter.

27
CHAPTER III
DEVELOPING AND CHARACTERIZING FILTER MEDIA
3.1 Introduction
Developing and characterizing filter media for developing different filter
geometries is objective of this research work. This chapter focuses on filter media
preparation recipe, technique and characterization techniques.
3.3 Steps involved in filter media preparation
All the filter samples are prepared by vacuum molding process following the below
mentioned steps.
3.2.1 Glass fiber filter media
Glass fiber filter media are widely used in industries for various coalescing
filtration applications. Different grades of glass fibers are available for a variety of
applications. Silica is the base ingredient for most forms of glass fibers. Higher flow rates
and effective filtration of micron/submicron droplets can be achieved through glass fiber
media. B-Glass media has been widely used for coalescing type filtration applications
and the same media has been used for this experimental work. Glass fibers of average
fiber diameter 3 µm are used to prepare the nonwoven glass fiber filter media by using

28
the vacuum molding process. The various steps involved in making the glass fiber filter
media are as follows.
1. Selecting a binder and starch: Carboset® 560 (The Lubrizol Coorporation) was
previously used as a test binder. Carboset® 560 is an acrylic polymer dispersed in
water which has milky white appearance [78]. It has a density of 1.0-1.2 kg/m3 [78].
The disadvantage of working with Carboset® 560 is that it requires mixing for 24
hours to interact with the glass fibers and to avoid clogging the metal screen during
the vacuum molding operation. The filter media made using Carboset® 560 softens
after about 2 hours of exposure to the Sullube 32® liquid aerosol in the coalescence
filtration experiment [74]. Filter media showed significant decrease in the structural
strength after coalescence filtration testing which indicated that the filter media is not
inert to the aerosol. On an industrial scale, the filter media must perform for many
hours after attaining steady state. Hence Megasol® S50 (Wesbond Corporation) was
selected as the binder along with the Westar+ starch (Wesbond Corporation).
Westar+ is a cationic flake corn starch which is specifically developed for bonding
silica based fibers to form vacuum formed composites and shapes [79]. This starch is
pre-cooked, disperses evenly and dissolves readily in cold water; hence it can create
more uniform structures [79]. Westar+ requires 30% less colloidal silica for optimum
flocking hence less binder is required, which reduces the cost of making filter
samples [79]. Megasol® S50 is a colloidal silica binder with the colloidal particles of
size 70 nm [80]. Megasol® S50’s unique physical properties result in higher packing
densities and stronger bonds [80]. Westar+ and Megasol® S50 both can react well
with the glass fibers at pH 7. Hence there is no need to maintain a specific pH which

29
saves addition of acid or base. Hence filtered tap water was used to make the filter
sample which further reduces the cost of filter media making. A numbers of trial
experiments are run to formulate the ideal binder content. Table 1 indicates the
amount of binder and starch content and the media performance.
Table 3.1 Filter media performance and amount of binder and starch
Amount
of glass
fibers
(gm)
Amount
of starch
Westar+
(gm)
Amount
of Binder
Megasol®
S50 (ml)
Capture
Efficiency
(%)
Pressure
drop
(kPa)
Quality
factor
(1/kPa)
Comments
5 0.15 1 70.24* 7.58* 0.13* Filters did
not reach
steady
state
5 0.15 1.5 72.34* 8.16* 0.13*
5 0.15 2.0 75.67* 8.28* 0.13*
5 0.15 2.5 76.89* 8.31* 0.13*
5 0.15 3.0 77.16* 8.58* 0.13*
5 0.15 3.5 78.12* 8.81* 0.14*
5 0.15 4.0 82.23* 9.13* 0.16*
5 0.15 4.5 85.12* 9.28* 0.16*
5 0.15 5.0 87.87 9.64 0.18 Filters
reached
steady
state
5 0.15 5.5 90.12 12.78 0.14
5 0.15 6.0 92.34 14.45 0.12
* indicate the final capture efficiency, pressure drop and quality factor values since
the filters did not reach steady state.

30
Every data point in table 3.1 is an average of three filter samples made with the
respective amount of starch and binder and tested for three hours in the lab scale
coalescence filtration setup. Filters labeled with an asterisk did not reach steady state.
This possible reason can be insufficient amount of binder. The fibers were not bonded
well together and were not stationary. They might have relative motion. These filters
had less structural stability and had fiber shedding problem as compared to the filters
which reached steady state. The amount of starch content was kept constant based on
the fiber to starch ratio of 1: 0.03 by weight as suggested by the company.
2. To make the slurry of fibers, 5 grams of B-glass fibers are soaked in 3 liters of
water for about 30 minutes. Uniform diluted slurry of fibers is made by using the
mechanical blender and adding 6 liters of water. 0.15 grams of Westar+ starch
was added and well dispersed by using the mechanical stirrer for 5 minutes.
Surface charge, good dispersion, and water solubility of Westar+ significantly
reduces the stirring time. 5 milliliter of Megasol® S50 was added and the slurry
was agitated for another 10 minutes. A mixing tank with mechanical stirrer to
make the slurry of fibers is shown in Figure 3.1. From Fig. 3.1, it can be seen that
the mixing tank is completely covered to prevent external particle contamination
of the slurry. This slurry is poured into the vacuum molding tank of the vacuum
molding process for making disc shaped filter media.
3. To form the filter media discs, a vacuum molding process is used to form the disc
shaped filters of 6 cm in diameter and 1.4 cm thick. The wet medium is dried in
an oven at 1500 C for 3 hours to remove the moisture and bind the media. The lab
scale vacuum molding assembly is described in section 3.3.

31
Figure 3.1 Mixing tank assembly to make slurry of fibers.
3.2.2 Nanofiber augmented micro glass fiber filter media
A vacuum molding process is used to make a nylon nanofiber micro glass fiber
filter media. Nylon nanofibers are made by dissolving nylon-6 (Sigma-Aldrich) in
formic acid (Sigma-Aldrich) and the polymer solution is electrospun by using
NanospiderTM and single jet electrospinning as described in Chapter VII. Electrospun
nylon nanofibers are measured and roughly chopped by scissor and then are finely
chopped and mixed with water using a mechanical blender. This nanofiber slurry is
mixed with the thick slurry of micro glass fibers soaked in 3 liters of water. Nylon
nanofiber micro glass fiber filter media are made by following the above mentioned
procedure. Srinivasan [81] showed that the optimum filter performance occurs with a
nanofiber to microfiber area ratio of about one. The area ratio is the ratio of the external
surface area of nanofibers to surface area of glass fibers estimated from the diameters of
Mechanical Stirrer
Mixing tank
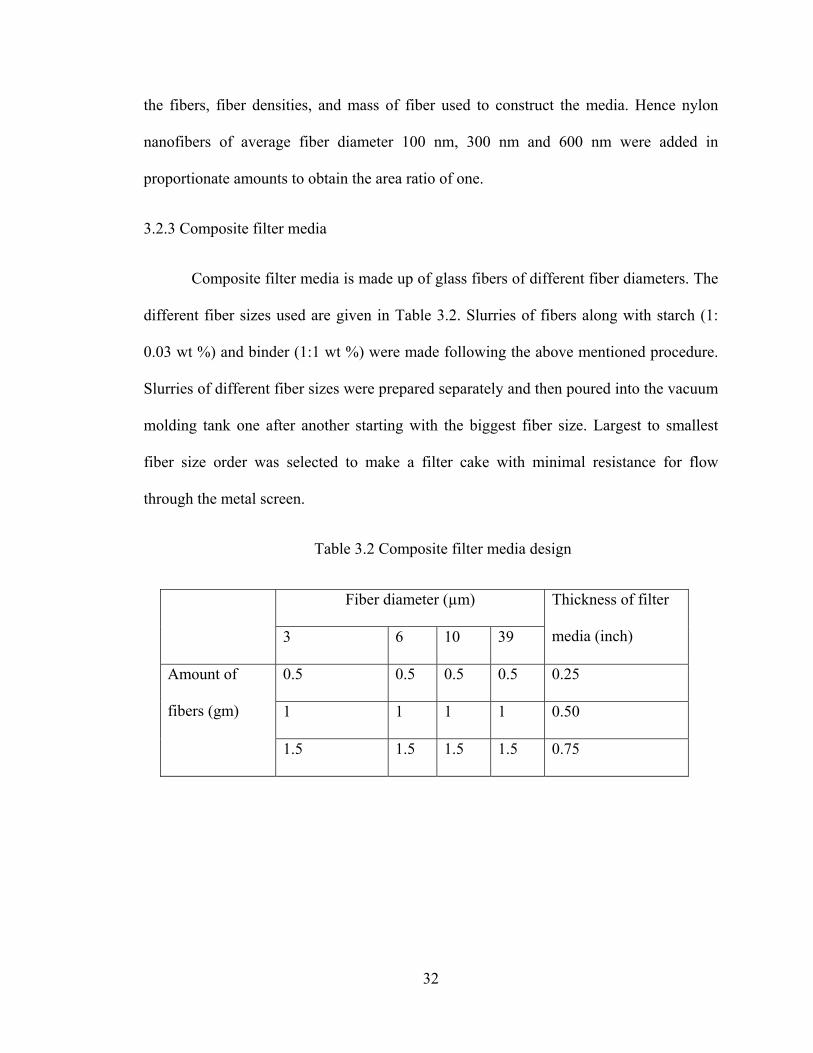
32
the fibers, fiber densities, and mass of fiber used to construct the media. Hence nylon
nanofibers of average fiber diameter 100 nm, 300 nm and 600 nm were added in
proportionate amounts to obtain the area ratio of one.
3.2.3 Composite filter media
Composite filter media is made up of glass fibers of different fiber diameters. The
different fiber sizes used are given in Table 3.2. Slurries of fibers along with starch (1:
0.03 wt %) and binder (1:1 wt %) were made following the above mentioned procedure.
Slurries of different fiber sizes were prepared separately and then poured into the vacuum
molding tank one after another starting with the biggest fiber size. Largest to smallest
fiber size order was selected to make a filter cake with minimal resistance for flow
through the metal screen.
Table 3.2 Composite filter media design
Fiber diameter (µm) Thickness of filter
media (inch) 3 6 10 39
Amount of
fibers (gm)
0.5 0.5 0.5 0.5 0.25
1 1 1 1 0.50
1.5 1.5 1.5 1.5 0.75

33
3.3 Vacuum molding setup
AIR
AIR
AIR
AIR
Figure 3.2 Schematic of vacuum molding setup.
Schematic and lab scale set up of vacuum molding process is shown in Figure 3.2
and 3.3 respectively. The vacuum molding tank, mold to make 6 cm diameter disc filters
and a vacuum pump are three major parts of the vacuum molding setup. The slurry is first

34
poured in to the vacuum molding tank of the assembly. Air is passed though the slurry
through various ports available in the vacuum molding tank to agitate the slurry and to
prevent the fibers from settling down. The mold to make 6 cm disc filter is fixed in at the
bottom of the vacuum molding tank along with a metal screen to prevent fibers from
passing through. The mold is then connected to the vacuum pump through a vacuum tank
which serves as a temporary storage of drain liquid. The vacuum pump can generate
around 100 to 500 mm of mercury vacuum pressure. The vacuum is applied through the
vacuum tank to the slurry tank. The liquid is sucked through the metal screen and stored
in the vacuum tank. The metal screen is covered with the filter paper on which the disc
shaped filter cakes are build up. The vacuum is controlled to maintain uniform structure
of filter cake. Higher vacuum will create a non-uniform as well as less porous filter cake
while lower vacuum will not generate a proper driving force for liquid to pass through the
buildup cake of fibers. The mold is removed from the slurry tank and the filter medium is
removed from it. The liquid stored in the vacuum tank is drained out to get it ready for
the next run. The filter media made using the process is a filter disc 6 cm in diameter and
1.4 cm in thickness. The nonwoven micro B-glass fiber filter media were made using the
vacuum molding process described above had irregular shaped pores on the order of 10 to
20 microns in diameter.

35
Figure 3.3 Lab scale setup of vacuum molding process.
3.4 Filter media characterization techniques
There are various techniques to characterize filter media. Filter media
characterization are important to understand the properties of media. The filter media are
characterized to obtain porosity, air permeability and strength. The experimental
procedures to measure porosity by using pycnometer, air permeability using The
Frazier® Differential Pressure Air Permeability Measuring Instrument and strength or
hardness by using the Durometer are described below.
Metal screen
Filter mold parts
Tubes for creating air bubbles
Vacuum molding tank
Vacuum pipe attached to Mixing tank
Vacuum tank
Vacuum pipe attached to vacuum
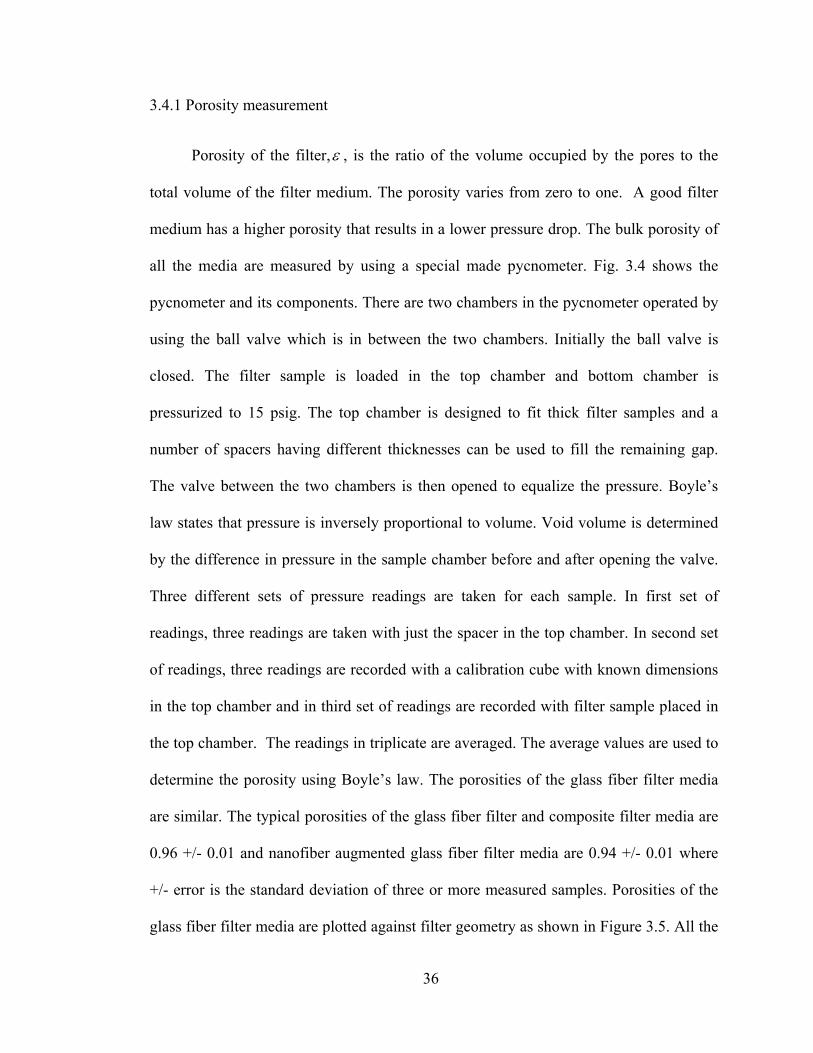
36
3.4.1 Porosity measurement
Porosity of the filter,ε , is the ratio of the volume occupied by the pores to the
total volume of the filter medium. The porosity varies from zero to one. A good filter
medium has a higher porosity that results in a lower pressure drop. The bulk porosity of
all the media are measured by using a special made pycnometer. Fig. 3.4 shows the
pycnometer and its components. There are two chambers in the pycnometer operated by
using the ball valve which is in between the two chambers. Initially the ball valve is
closed. The filter sample is loaded in the top chamber and bottom chamber is
pressurized to 15 psig. The top chamber is designed to fit thick filter samples and a
number of spacers having different thicknesses can be used to fill the remaining gap.
The valve between the two chambers is then opened to equalize the pressure. Boyle’s
law states that pressure is inversely proportional to volume. Void volume is determined
by the difference in pressure in the sample chamber before and after opening the valve.
Three different sets of pressure readings are taken for each sample. In first set of
readings, three readings are taken with just the spacer in the top chamber. In second set
of readings, three readings are recorded with a calibration cube with known dimensions
in the top chamber and in third set of readings are recorded with filter sample placed in
the top chamber. The readings in triplicate are averaged. The average values are used to
determine the porosity using Boyle’s law. The porosities of the glass fiber filter media
are similar. The typical porosities of the glass fiber filter and composite filter media are
0.96 +/- 0.01 and nanofiber augmented glass fiber filter media are 0.94 +/- 0.01 where
+/- error is the standard deviation of three or more measured samples. Porosities of the
glass fiber filter media are plotted against filter geometry as shown in Figure 3.5. All the

37
filter media indicate similar porosities. It is desirable to study the performance of filter
geometries and effect of gravitational force on the performance of the filter media
solely. The porosity of drainage channels is obtained by using the density bottle. The
porosity of the drainage channel is 0.986.
Figure 3.4 Lab scale pycnometer assembly.
Figure 3.5 Porosities of glass fiber filter media.
0.95
0.95 0.96
0.950.96
0.95
0.95 0.96
0.95
0.95
0.95 0.96
0.96
0.95
0.95 0.96
0.95 0.96
0.95
0.950.96
0.96
0.00
0.10
0.20
0.30
0.40
0.50
0.60
0.70
0.80
0.90
1.00
H-N H-I H-M H-O H-B . H-0 H-15 H-30 H-40 H-45 H-50 H-60 V-N V-I V-M V-O V-B . V-0 V-15 V-30 V-45 V-60 .
Poro
sity
Filter geometry
H-HORIZONTAL ORIENTATIONH-N : No drainage channelH-I : Inlet drainage channelH-M : Middle drainage channelH-O : Outlet drainage channelH-B : Drainage channel at Both ends
V-VERTICAL ORIENTATIONV-N : No drainage channelV-I : Inlet drainage channelV-M : Middle drainage channelV-O : Outlet drainage channelV-B : Drainage channel at Both ends
V-VERTICAL ORIENTATIONV-0 : Drainage at 00 (three cut)V-15 : Drainage at 150 (three cut)V-30 : Drainage at 300 (three cut)V-45 : Drainage at 450 (three cut)V-60 : Drainage at 600 (three cut)
H-HORIZONTAL ORIENTATIONH-0 : Drainage at 00 (three cut)H-15 : Drainage at 150 (three cut)H-30 : Drainage at 300 (three cut)H-40 : Drainage at 400 (three cut)H-45 : Drainage at 450 (three cut)H-50 : Drainage at 500 (three cut)H-60 : Drainage at 600 (three cut)
Sample chamber
Ball valve
Vent
Air inlet
Pressure gauge
38
3.4.2. Permeability measurement
Permeability is a measure of the ease of a fluid that passes through the filter
medium. A number of techniques can be used to measure the permeability. Frazier®
Differential Pressure Air Permeability Measuring Instrument (Frazier Precision
Instrument Company, Inc.) is used for permeability measurement. A filter medium should
be highly permeable to the fluid flow. If the filter medium has low fluid permeability,
then filter media will indicate high pressure drop. Generally, permeability is measured by
passing a fluid through the medium at a known pressure drop and observing the flow rate.
For fibrous filters, the fluid permeability is given by Darcy’s Law [3, 81].
LPGk
AQ Δ=
μ (3.1)
where Q = volumetric flow rate
A = cross section area of the exit surface
G = shape factor
k = permeability
ΔP = pressure drop
L = media thickness
In this work, the Frazier® Differential Pressure Air Permeability Measuring
Instrument, shown in Figures 3.6 and 3.7, is used to measure air permeability of all filter
samples. Air permeability of the filter media has a unit of m2. The filter medium is
placed in the sample holder. The filter medium must fit snuggly in the sample holder to

39
avoid any air flow along the sides of the sample. Air flow along the sides of the medium
will produce erroneous results because the air is not flowing through the medium itself.
Different orifice openings are tested and specific orifice opening is selected to obtain the
pressure drop at 0.5 psig as the test is designed to produce accurate result at 0.5 psig
pressure drop. Three sets of readings are taken for each sample. The Frazier® Differential
Pressure Air Permeability Measuring Instrument is designed to measure air permeability
of thin samples where the shape factor is 1. For other samples, the shape factor is read
from a correlation and is incorporated in the permeability calculation. The air
permeability (measured with flow perpendicular to the mesh) of Nylon, Polypropylene
and Teflon® woven mesh and B-glass fiber filter media are 3.39x10⁻⁹ m2 +/- 0.04x10⁻⁹
m2, 5.67x10⁻⁹ m2 +/- 0.02x10⁻⁹ m2, 8.67x10⁻⁹ m2 +/- 0.01x10⁻⁹ m2 and 2.24x10⁻¹⁰ m2
+/- 0.03x10⁻¹⁰ m2, respectively where the +/- error is the standard deviation of three or
more measured samples. The air permeability of polymeric woven meshes were ten times
higher than the air permeability of the glass microfiber filter medium. The air
permeability of Nylon and Polypropylene spunbond fabric was 4.54x10⁻⁹ m2
+/- 0.01x10⁻⁹ m2 and 6.54x10⁻⁹ m2 +/- 0.02x10⁻⁹ m2 while the Nylon electropsun
nanofiber on Teflon® mesh drainage channel had an air permeability of 4.81x10⁻¹⁰ m2
+/- 0.03x10⁻¹⁰ m2.

40
Figure 3.6 Frazier® Differential Pressure Air Permeability Measuring Instrument.
Figure 3.7 Components of Frazier® Differential Pressure Air Permeability Measuring
Instrument (a) Sample holder (b) Manometer to read pressure drop (c) Orifice (d) Pump
and pump control (e) Different orifice opening.
e
a b c
d
Pump
Manometer
Different orifice
Pump control
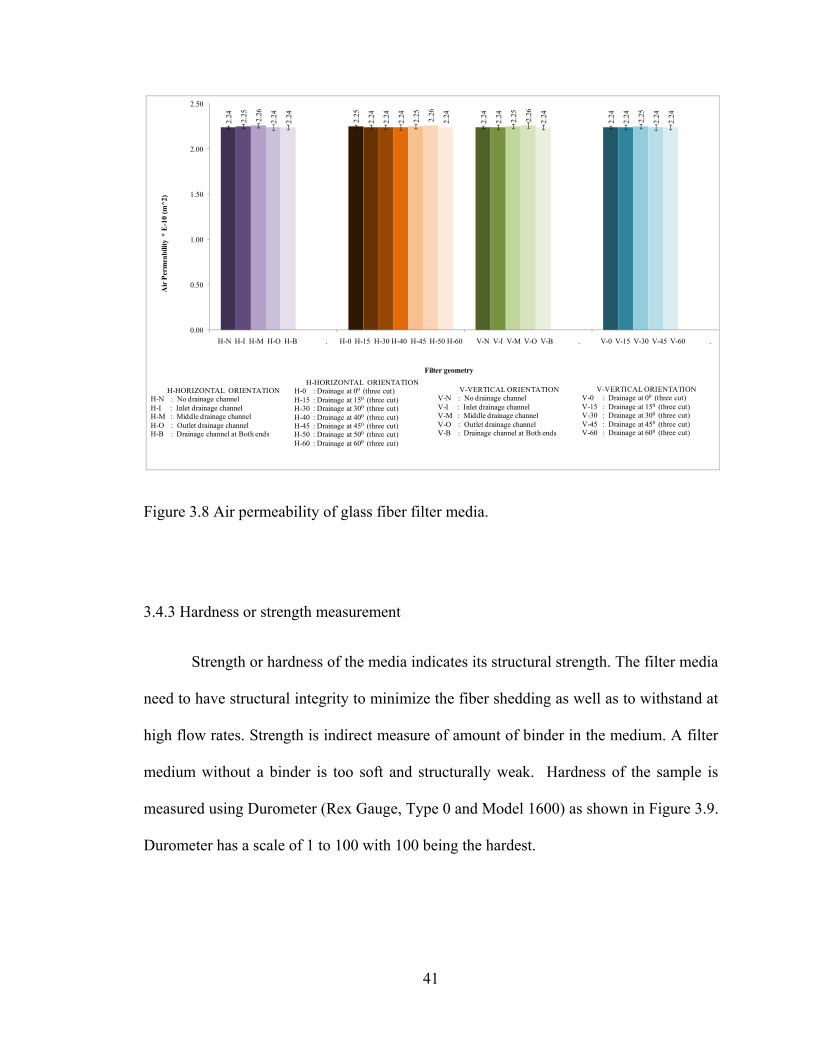
41
Figure 3.8 Air permeability of glass fiber filter media.
3.4.3 Hardness or strength measurement
Strength or hardness of the media indicates its structural strength. The filter media
need to have structural integrity to minimize the fiber shedding as well as to withstand at
high flow rates. Strength is indirect measure of amount of binder in the medium. A filter
medium without a binder is too soft and structurally weak. Hardness of the sample is
measured using Durometer (Rex Gauge, Type 0 and Model 1600) as shown in Figure 3.9.
Durometer has a scale of 1 to 100 with 100 being the hardest.
2.24 2.25
2.24
2.242.25
2.24
2.24
2.242.26
2.24 2.25
2.25
2.24
2.24 2.26
2.24
2.24 2.25
2.24
2.242.26
2.24
0.00
0.50
1.00
1.50
2.00
2.50
H-N H-I H-M H-O H-B . H-0 H-15 H-30 H-40 H-45 H-50 H-60 V-N V-I V-M V-O V-B . V-0 V-15 V-30 V-45 V-60 .
Air
Per
mea
bilit
y *
E-1
0 (m
^2)
Filter geometry
H-HORIZONTAL ORIENTATIONH-N : No drainage channelH-I : Inlet drainage channelH-M : Middle drainage channelH-O : Outlet drainage channelH-B : Drainage channel at Both ends
V-VERTICAL ORIENTATIONV-N : No drainage channelV-I : Inlet drainage channelV-M : Middle drainage channelV-O : Outlet drainage channelV-B : Drainage channel at Both ends
V-VERTICAL ORIENTATIONV-0 : Drainage at 00 (three cut)V-15 : Drainage at 150 (three cut)V-30 : Drainage at 300 (three cut)V-45 : Drainage at 450 (three cut)V-60 : Drainage at 600 (three cut)
H-HORIZONTAL ORIENTATIONH-0 : Drainage at 00 (three cut)H-15 : Drainage at 150 (three cut)H-30 : Drainage at 300 (three cut)H-40 : Drainage at 400 (three cut)H-45 : Drainage at 450 (three cut)H-50 : Drainage at 500 (three cut)H-60 : Drainage at 600 (three cut)
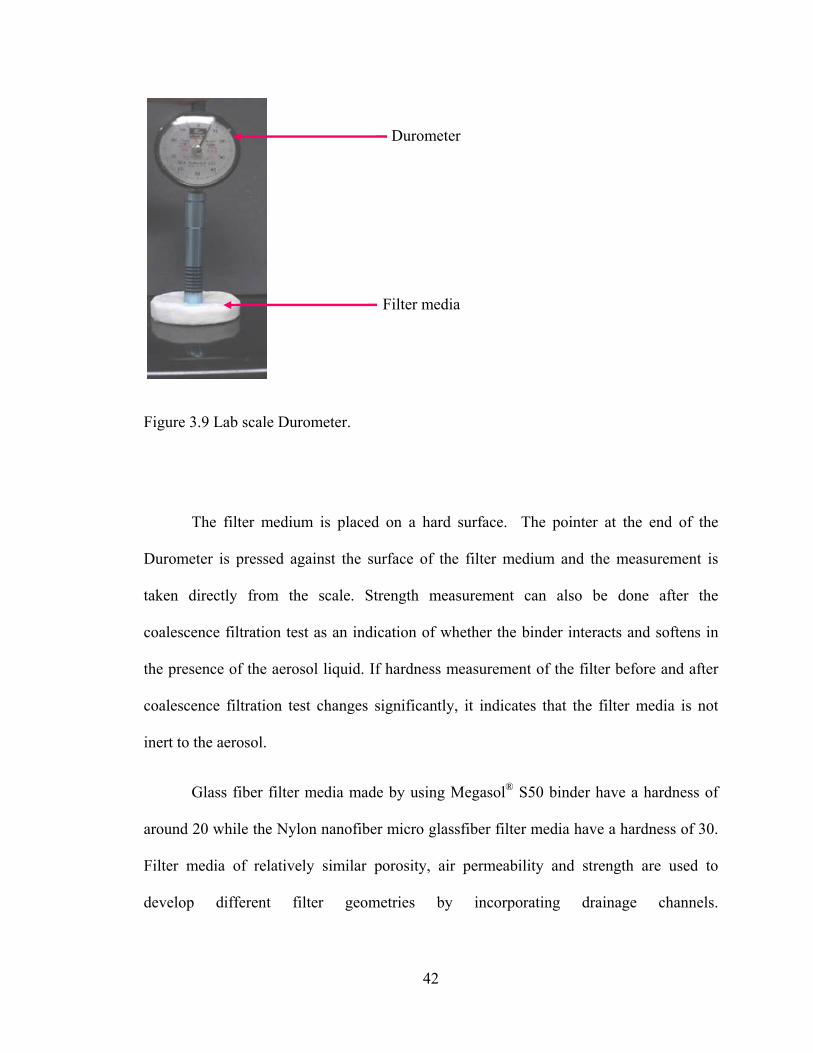
42
Figure 3.9 Lab scale Durometer.
The filter medium is placed on a hard surface. The pointer at the end of the
Durometer is pressed against the surface of the filter medium and the measurement is
taken directly from the scale. Strength measurement can also be done after the
coalescence filtration test as an indication of whether the binder interacts and softens in
the presence of the aerosol liquid. If hardness measurement of the filter before and after
coalescence filtration test changes significantly, it indicates that the filter media is not
inert to the aerosol.
Glass fiber filter media made by using Megasol® S50 binder have a hardness of
around 20 while the Nylon nanofiber micro glassfiber filter media have a hardness of 30.
Filter media of relatively similar porosity, air permeability and strength are used to
develop different filter geometries by incorporating drainage channels.
Durometer
Filter media

43
CHAPTER IV
DEVELOPING FILTER GEOMETRIES
4.1 Introduction
Developing different filter geometries to improve the performance and drainage
of coalescing filter is objective of this research work. Different filter geometries are
developed by incorporating woven and nonwoven drainage channels of varying surface
energies in the glass fiber filter media. The effect of pore opening as well as filament
thickness of woven drainage channel is studied on the performance of filter media. The
effect of different basis weight of nonwoven drainage channel on the performance of the
filter media is also studied. The effect of wettability or surface energy of the woven and
nonwoven drainage channel on the performance of the filter geometries is also studied.
The effect of gravitational force on the performance of the filter media is studied by
changing the flow orientation.
4.2 Filter media cutter saw
Nonwoven disc shaped glass fiber filter media are made by using the vacuum
molding process as described in Chapter 3. These filter samples are cut by using a
dedicated band saw at various locations along the filter bed length and drainage channels
are incorporated to develop different filter geometries. The filter media cutter saw is
shown in Figure 4.1. A hard back carbon steel blade of 1/8 inch thickness and 32 teeth

44
per inch is used to cut the filter sample. This is the thinnest and finest blade available in
the market which cuts the filter samples without ripping off fibers from the media. The
filter media is spongy in nature and squeezes easily hence it is important to use a fine
blade to cut the filter media without losing its structural stability.
Figure 4.1 Filter media band saw and cutter assembly (a) band saw (b) filter holder.
A plexiglass filter holder is made to hold the filter samples of different
thicknesses. The filter holder is shown in Figure 4.2. Filter holder is equipped with a
screw which allows adjustment to change the thickness of the sample holder and hence
enables a filter medium to be cut at the desired thickness. The filter holder is also
equipped with a compass and a guiding ruler which helps in keeping the holder parallel
as well as at different angles respective to the cutter saw blade. Filter media are cut by
Filter holder
Band saw
Blade
a
b

u
F
w
F
F
m
sing the cut
igure 4.3. F
without losing
igure 4.2 Fil
igure 4.3 Fi
media cutter s
a
tter saw whe
Figure 4.3 in
g the structu
lter holder to
ilter media s
saw.
en the filter
ndicates that
ural strength
o cut filter sa
sample (a) T
45
r holder is p
t the filter s
of the filter
ample by usi
Thick filter m
parallel to th
samples can
medium.
ing the cutte
media (b) Fil
b
S
Co
S
G
he cutting bl
n be cut of d
er saw.
lter media c
Sample cham
ompass
Screw
Guiding ruler
lade as show
desired thick
ut by using
mber
r
wn in
kness
filter

46
4.3 Drainage channels
Drainage channels are woven and nonwoven polymeric materials. Drainage
channels are open porous structures and the materials have low surface energy compared
to the glass fiber filter media. Polypropylene woven mesh, (Spectrum Laboratories) is
used as a drainage channel shown in Figures 4.4 (a) and 4.4 (b). All of the filter media
samples are cylindrical in shape; hence many drainage channels are circular in nature as
shown in Figure 4.4 (a).
Figure 4.4 Woven drainage channels (a) Polypropylene circular shaped woven drainage
channel (b) Microscopic image of woven polypropylene drainage channel.
Figure 4.4 (b) is the microscopic image of the polypropylene woven drainage
channel indicating uniform pore opening of about 500 µm and filament thickness of 600
µm. Polypropylene spunbond (Spunfab Ltd.) used as drainage channels is shown in
a b

47
Figures 4.5 (a) and (b). Because the filter media samples are disc shaped, the nonwoven
drainage channels are circular as shown in Figure 4.5 (a). Figure 4.5 (b) is the
microscopic image of the polypropylene nonwoven fabric commonly known as spunbond
which shows non-uniform pores with the filament thickness of the 50 µm. Along with
polypropylene, woven meshes of nylon (Dexmet Corporation) and Teflon® (Dexmet
Corporation) as well as nonwoven nylon spunbond (Spunfab Ltd.) were used as drainage
channels to develop filter geometries to study the effect of surface properties and pore
opening of drainage channels on the performance of filter media.
Figure 4.5 Nonwoven drainage channels (a) Polypropylene circular shaped nonwoven
drainage channel (b) Microscopic image of nonwoven polypropylene drainage channel.
Figure 4.6 (a) indicates circular shaped nylon (NF) +Teflon® drainage channel
which is made up by electrospinning nylon-6 (Sigma-Aldrich) nanofibers on the surface
of the Teflon® woven mesh of 500 µm pore opening and 600 µm filament thickness.
a b

48
Figure 4.6 (b) shows the non uniform pore opening of the (NF) + Teflon® drainage
channel. The pores of the nylon nanofiber mat are significantly smaller as compared to
the pores of polypropylene woven and nonwoven drainage channels.
Figure 4.6 (a) Nylon nanofibers electrospun on Teflon® woven mesh of 500 µm pore
opening (b) Microscopic image of Nylon nanofibers on Teflon® woven mesh.
4.4 Filter geometries
4.4.1 Horizontal orientation
Filter media are cut with the help of the filter media cutter saw and woven as well
as nonwoven drainage channels are incorporated in the filter media and different filter
geometries are developed. These filter geometries are made up of a nonwoven coalescing
layer of glass fibers having smaller pores and woven as well as nonwoven drainage
channels having big pores. The glass fiber coalescing media has a higher surface energy
than the materials forming the drainage channels. Glass fiber filter media is an oleophilic
a b a

49
and hydrophilic, hence it aids in coalescence. Smaller drops coalescence to form big
drops in the glass fiber media and these big drops drain very effectively from the filter
media through the low surface energy porous drainage channels. Different filter
geometries developed and tested in horizontal orientation are shown in Figure 4.7.
Figure 4.7 Filter geometries in horizontal orientation (a) No-drainage (b) Inlet-drainage
(c) Middle-drainage (d) Outlet-drainage (e) Both-End-Drainage (f) Inclined-angle-
drainage.
“No-drainage” channel filter media are glass fiber filter media without any
drainage channels. Filter geometries labeled as “Inlet,” Outlet” and “Middle” drainage
each have one circular drainage channel at the inlet, outlet and in the middle of the filter
media. A filter with drainage channel at both the inlet and outlet surfaces is referred to as
“Both-End-Drainage”. The last design has three equally spaced rectangular drainage
channels inserted at inclined angles within the media. All the drainage channels are
Gas flow
Gravity
f
Drainage channels
G
L
A
S
S
G
L
A
S
S
G
L
A
S
S
c
G
L
A
S
S
b
G
L
A
S
S
d
G
L
A
S
S
e
f θ
θ
θ
a
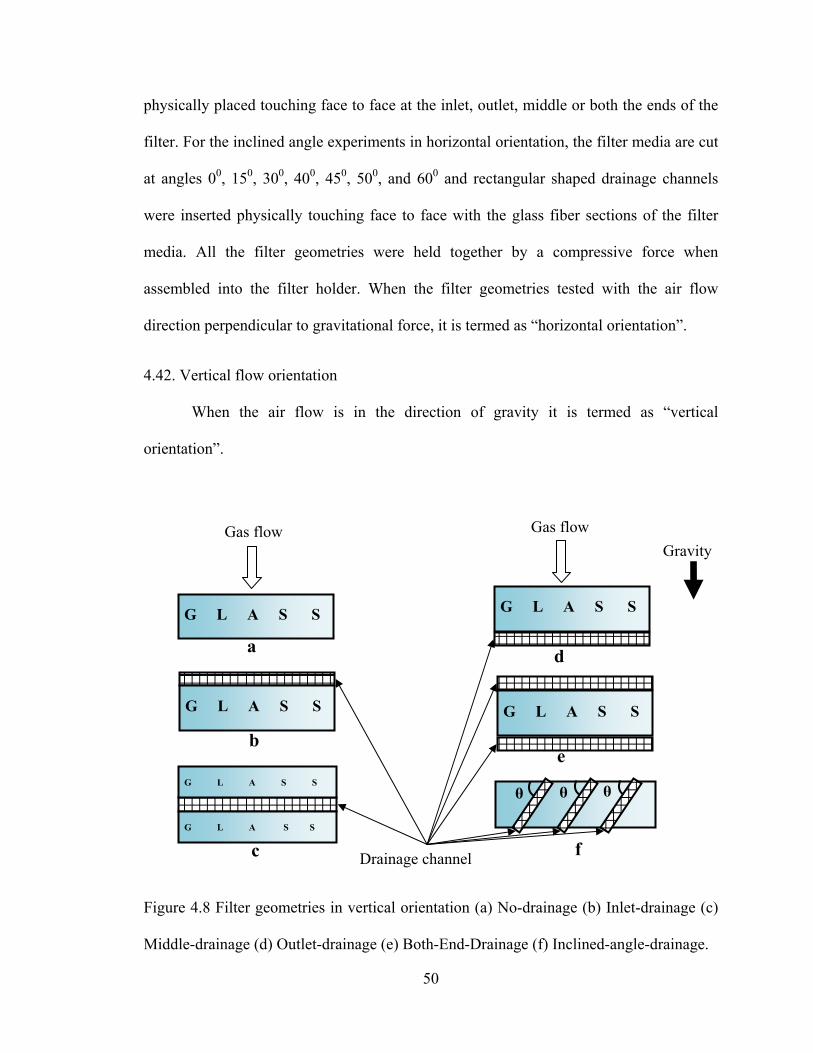
50
physically placed touching face to face at the inlet, outlet, middle or both the ends of the
filter. For the inclined angle experiments in horizontal orientation, the filter media are cut
at angles 00, 150, 300, 400, 450, 500, and 600 and rectangular shaped drainage channels
were inserted physically touching face to face with the glass fiber sections of the filter
media. All the filter geometries were held together by a compressive force when
assembled into the filter holder. When the filter geometries tested with the air flow
direction perpendicular to gravitational force, it is termed as “horizontal orientation”.
4.42. Vertical flow orientation
When the air flow is in the direction of gravity it is termed as “vertical
orientation”.
Figure 4.8 Filter geometries in vertical orientation (a) No-drainage (b) Inlet-drainage (c)
Middle-drainage (d) Outlet-drainage (e) Both-End-Drainage (f) Inclined-angle-drainage.
e
Gas flow Gas flow Gravity
G L A S S
a
G L A S S
b
c
G L A S S
d
G L A S S
θ θ θ
f
G L A S S
G L A S S
Drainage channel

51
Inlet, outlet, middle, both-end and inclined angle experiments were performed in
vertical orientation to study the effect of gravitational force on the performance of the
filter media. For vertical flow orientation experiments the different angles studied were
00, 150, 300, 450, and 600. Filter geometries in vertical orientation are shown in Figure 4.8.
4.5 Composite filter media
Composite filter media is a filter media design which is made up of different fiber
sizes of glass fibers. The different fiber sizes used are 3 µm, 6 µm, 10 µm, and 39 µm.
The filter media is developed to design a filter which will have bigger pores along the
filter bed length. The composite filter media is developed by layering the fibers in the
order of 3 µm, 6 µm, 10 µm, and 39 µm with 3 µm fibers facing the flow. As the droplets
moves along the filter bed length they coalesce to form bigger drops. This filter design
will have smaller to bigger pores along the filter bed length. Hence it will be capable of
capturing variety of droplet sizes and will have lower pressure and higher drainage and it
can help in reducing the secondary aerosol generation. The composite filter media design
is shown in Figure 4.9. Figure 4.9 indicate a filter media design made up of glass fibers of
fiber sizes 3 µm, 6 µm, 10 µm, 39 µm in section 1, 2, 3, and 4 respectively.
Figure 4.9 Composite filter media.
1 2 3 4
52
CHAPTER V
COALESCENCE FILTRATION SETUP
Construction of filter media, their characterization, and developing different filter
geometries by incorporating drainage channels are discussed in previous chapters. This
chapter discusses experimental procedure and setup to test the various filter geometries.
All of the filter geometries as well as the “No drainage” channel filter media are tested in
the lab scale coalescence filtration setup. The coalescence filtration set up is equipped to
obtain the inlet and outlet droplet size distribution, in-situ upstream and downstream
concentration monitoring using a photometer, pressure drop across the filter media, and
flow rates.
5.1 Experimental setup and procedure for coalescing tests
The schematic of the coalescing filter testing set up is shown in Figure 5.1. A
photo of the lab scale setup of coalescence filtration and its major components are shown
in Figures 5.2 and 5.3 respectively. The process is described in four sections in this
chapter.
5.1.1 Prefiltration
Atmospheric air contains various impurities and water vapor. Those impurities are
removed before challenging the air to the coalescing filter medium. A surge tank is used
to dampen effects of fluctuations in house air pressure on the experiment. The
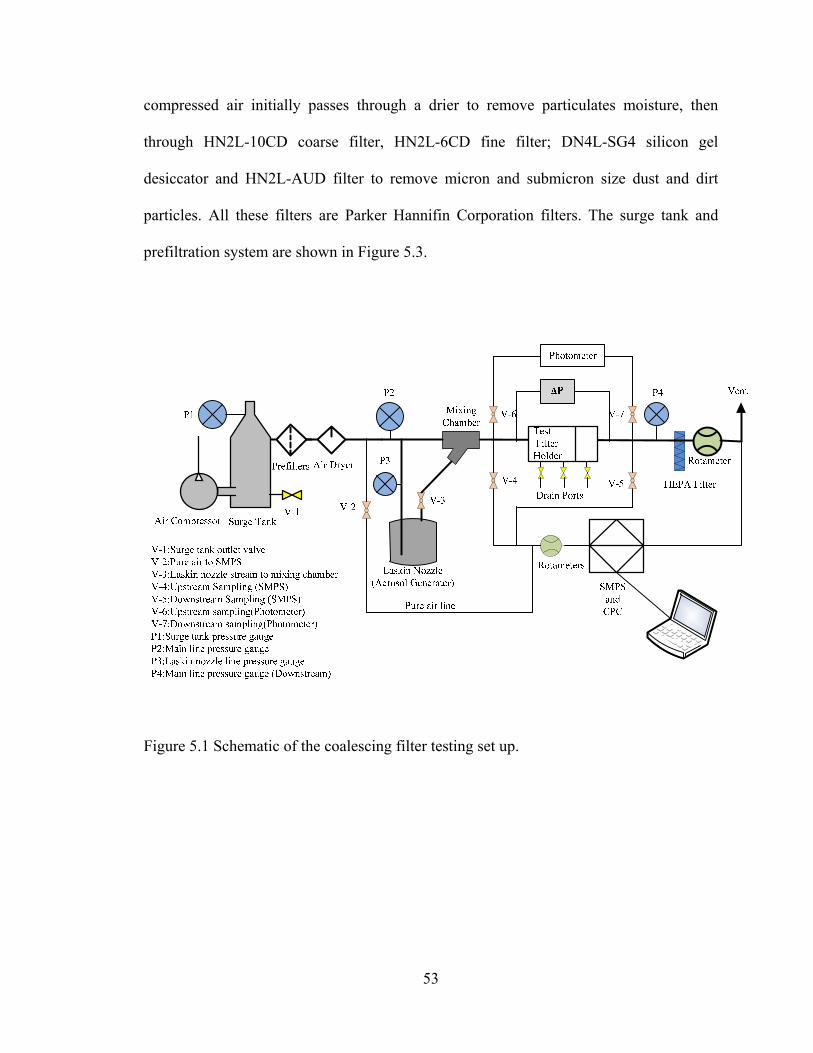
53
compressed air initially passes through a drier to remove particulates moisture, then
through HN2L-10CD coarse filter, HN2L-6CD fine filter; DN4L-SG4 silicon gel
desiccator and HN2L-AUD filter to remove micron and submicron size dust and dirt
particles. All these filters are Parker Hannifin Corporation filters. The surge tank and
prefiltration system are shown in Figure 5.3.
Figure 5.1 Schematic of the coalescing filter testing set up.
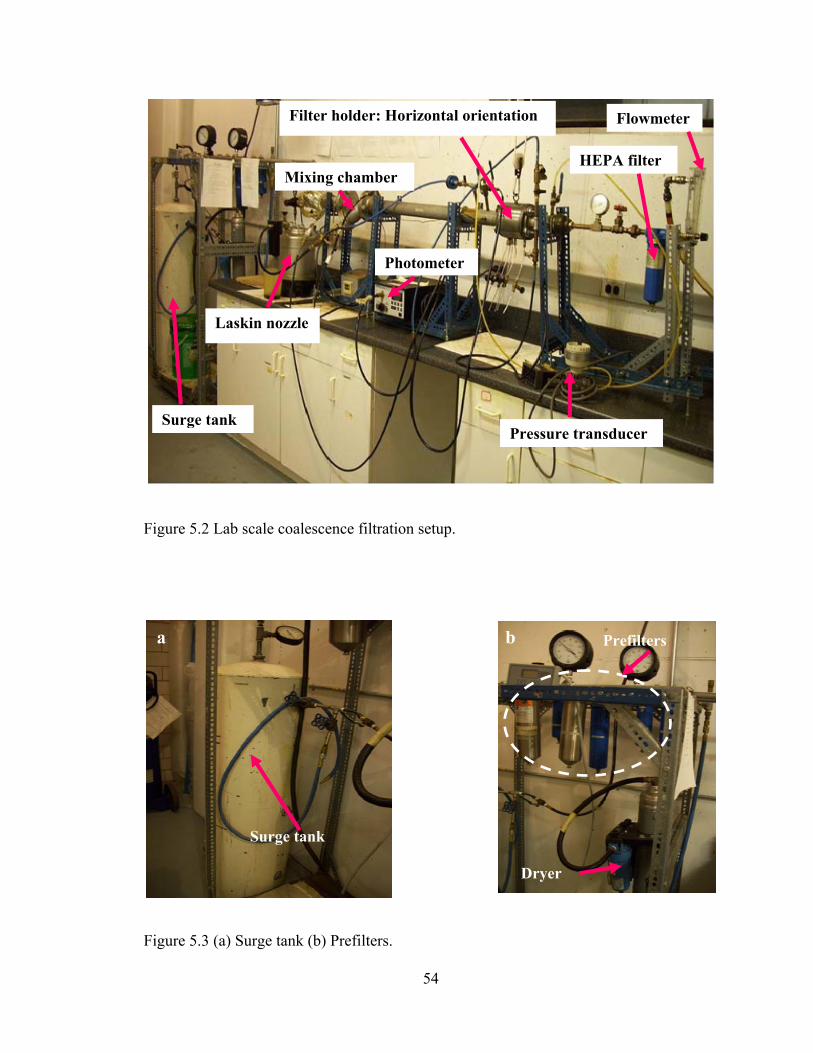
54
Figure 5.2 Lab scale coalescence filtration setup.
Figure 5.3 (a) Surge tank (b) Prefilters.
Surge tank
a
Dryer
Prefilters b
Photometer
Laskin nozzle
Mixing chamber
Filter holder: Horizontal orientation
Pressure transducer
Flowmeter
Surge tank
HEPA filter
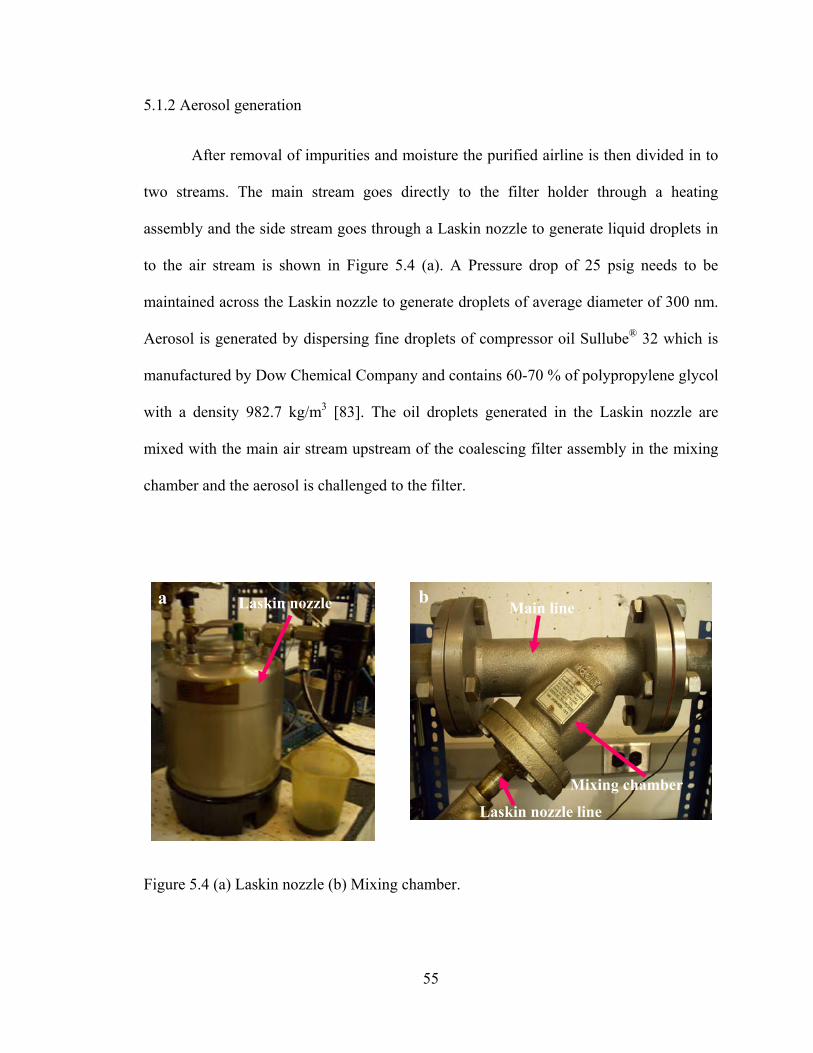
55
5.1.2 Aerosol generation
After removal of impurities and moisture the purified airline is then divided in to
two streams. The main stream goes directly to the filter holder through a heating
assembly and the side stream goes through a Laskin nozzle to generate liquid droplets in
to the air stream is shown in Figure 5.4 (a). A Pressure drop of 25 psig needs to be
maintained across the Laskin nozzle to generate droplets of average diameter of 300 nm.
Aerosol is generated by dispersing fine droplets of compressor oil Sullube® 32 which is
manufactured by Dow Chemical Company and contains 60-70 % of polypropylene glycol
with a density 982.7 kg/m3 [83]. The oil droplets generated in the Laskin nozzle are
mixed with the main air stream upstream of the coalescing filter assembly in the mixing
chamber and the aerosol is challenged to the filter.
Figure 5.4 (a) Laskin nozzle (b) Mixing chamber.
Laskin nozzle a
Mixing chamber
Laskin nozzle line
Main line b

56
Figure 5.5 Heater.
The heating assembly (Refer Figure 5.5) can be used to run the experiments at
elevated temperature. In current research work all the experiments are carried out at room
temperature.
5.1.3 Filter holder
The effect of gravitational force on the performance of the filter media was
studied by changing the flow orientation. The filter geometries were tested in horizontal
as well as vertical flow orientation.
5.1.3.1 Horizontal flow orientation filter holder
The filter holder assembly in horizontal orientation and its parts are shown in
Figure 5.6. The horizontal orientation filter holder is made up of stainless steel so that the
experiment can be carried out at elevated temperature. The filter holder is equipped with
a spacer; hence the filter samples of different thicknesses can be tested. A stainless steel
wire mesh is placed behind the filter medium to protect the medium from deforming due
Heater
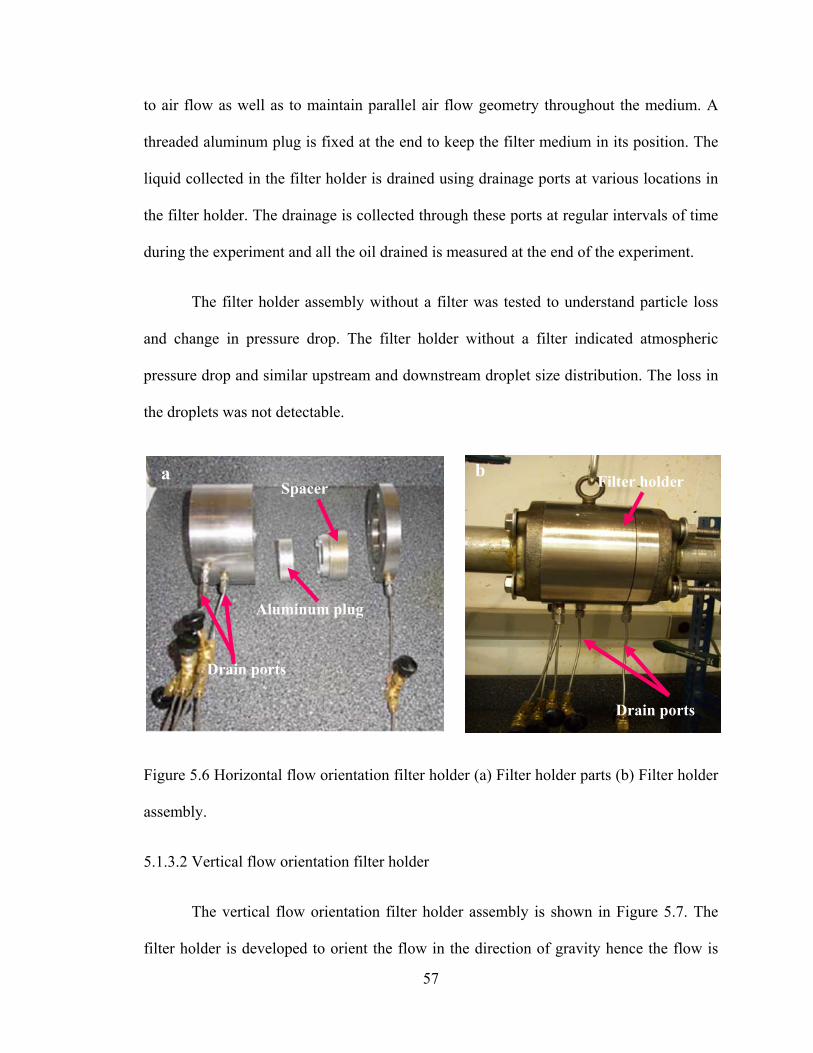
57
to air flow as well as to maintain parallel air flow geometry throughout the medium. A
threaded aluminum plug is fixed at the end to keep the filter medium in its position. The
liquid collected in the filter holder is drained using drainage ports at various locations in
the filter holder. The drainage is collected through these ports at regular intervals of time
during the experiment and all the oil drained is measured at the end of the experiment.
The filter holder assembly without a filter was tested to understand particle loss
and change in pressure drop. The filter holder without a filter indicated atmospheric
pressure drop and similar upstream and downstream droplet size distribution. The loss in
the droplets was not detectable.
Figure 5.6 Horizontal flow orientation filter holder (a) Filter holder parts (b) Filter holder
assembly.
5.1.3.2 Vertical flow orientation filter holder
The vertical flow orientation filter holder assembly is shown in Figure 5.7. The
filter holder is developed to orient the flow in the direction of gravity hence the flow is
a
Drain ports
Filter holder b Spacer
Drain ports
Aluminum plug
a

58
diverted twice in the filter holder assembly. This filter holder assembly is made up of
plexiglass so that the drainage and carrying over of big droplets in downstream can be
visualized. The cylindrical shaped filters are fixed in the filter holder and the holder is
attached to the filter holder assembly. The drained liquid is collected in oil collecting dish
and the downstream is vented. The Filter holder assembly in vertical flow orientation
without a filter was tested to detect changes in pressure drop and droplet concentration.
The filter holder indicated less than 1% loss in droplet size distribution which is
negligibly small and negligible pressure drop for the experimental flow rates.
Figure 5.7 Filter holder assembly in vertical orientation (a) Filter holder assembly (b)
Filter holder fixed to the filter holder assembly (c) Filter holder and the wire mesh.
Filter holder Wire mesh
c
Upstream Downstream
Oil collecting dish Filter holder
a b
Filter holder

59
5.1.4 Measurement equipments
An electronic pressure gauge (Figure 5.8 (a)) is used to measure the pressure drop
across the filter media. Pressure drop is continuously monitored and recorded after every
10 minutes during the experiment. The photometer (Air Techniques International Model
No TDA-2G) is used for in-situ monitoring of the concentration of droplets in the air
stream is shown in Figure 5.8 (b). It can measure the upstream or downstream aerosol
concentration when connected to the appropriate sampling ports. During the experiments
the photometer readings are recorded after every 10 minutes and once the photometer
readings are stable for about one hour it is considered as the filter has reached steady
state. During the experiment normally the pressure drop reaches to steady state in about
one hour from the beginning of the test while the photometer indicates steady
downstream droplet concentration in about two hours from the beginning of the test.
Hence all the tests are run for at least three hours to obtain steady state performance of
the filter media.
The air flow is measured by using a rotameter. The downstream air passes
through the HEPA filter and then is vented. The air flow rate is maintained 5.66 m3/hr at
standard conditions (200 SCFH) at 0oC and 1 atm pressure to obtain the highest face
velocity of 0.6 m/s.

60
Figure 5.8 (a) Pressure gauge (b) Photometer.
Figure 5.9 (a) Rotameter (b) Downstream HEPA filter.
A Scanning Mobility Particle SizerTM (SMPS) (TSI Inc. Model No. 3080) is used
to monitor the upstream and downstream droplet size distributions. The SMPS is setup to
complete one droplet size distribution measurement in 135 seconds and it can count up to
1 million droplets at the same time. To use the equipment below its threshold limit the
Rotameter
a b
HEPA filter
Photometer
Pressure transducer
a b
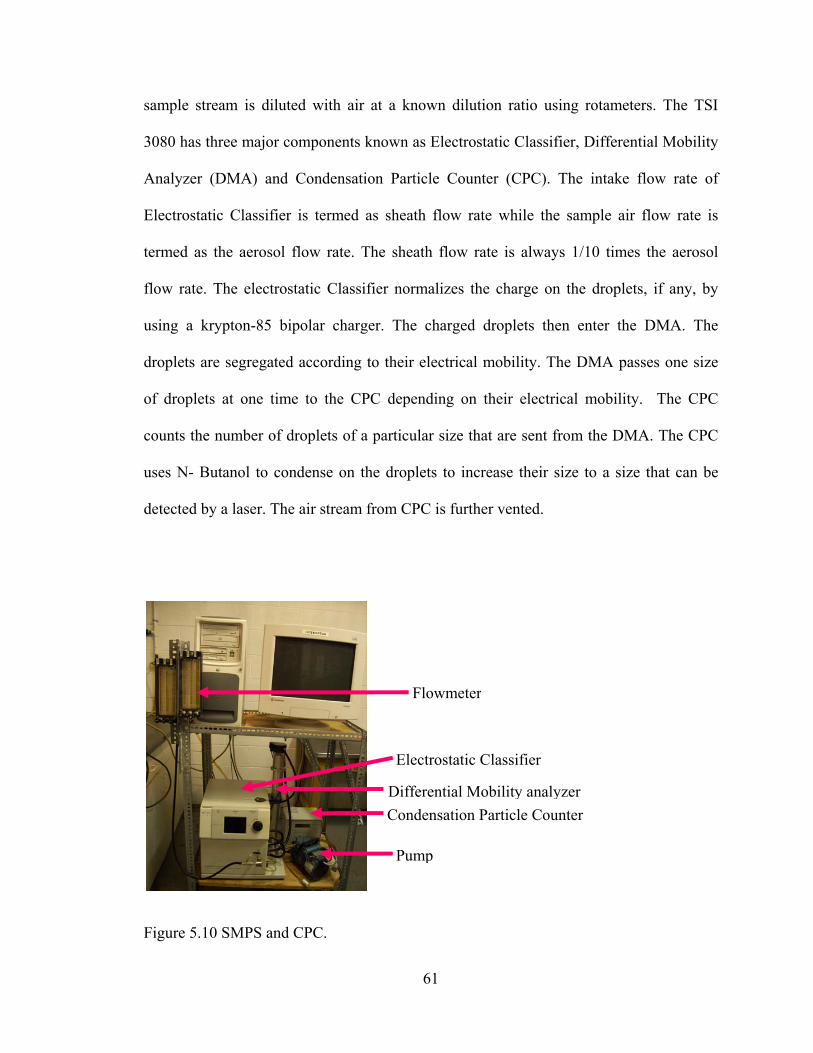
61
sample stream is diluted with air at a known dilution ratio using rotameters. The TSI
3080 has three major components known as Electrostatic Classifier, Differential Mobility
Analyzer (DMA) and Condensation Particle Counter (CPC). The intake flow rate of
Electrostatic Classifier is termed as sheath flow rate while the sample air flow rate is
termed as the aerosol flow rate. The sheath flow rate is always 1/10 times the aerosol
flow rate. The electrostatic Classifier normalizes the charge on the droplets, if any, by
using a krypton-85 bipolar charger. The charged droplets then enter the DMA. The
droplets are segregated according to their electrical mobility. The DMA passes one size
of droplets at one time to the CPC depending on their electrical mobility. The CPC
counts the number of droplets of a particular size that are sent from the DMA. The CPC
uses N- Butanol to condense on the droplets to increase their size to a size that can be
detected by a laser. The air stream from CPC is further vented.
Figure 5.10 SMPS and CPC.
Condensation Particle Counter
Pump
Differential Mobility analyzer
Electrostatic Classifier
Flowmeter

62
CHAPTER VI
EXPERIMENTAL RESULTS OF GLASS FIBER FILTER GEOMETRIES
6.1 Polypropylene woven drainage channels
The coalescence filtration set up is described in Chapter V. All of the filter media
are tested in the coalescence filtration setup. The experimental results for the filter
geometries developed by inserting polypropylene woven mesh of 500 µm pore opening
and 600 µm filament thickness as well as “No drainage” filter media in both horizontal
and vertical orientation are expressed in terms of capture efficiency, pressure drop,
quality factor and saturation. The filter geometry is plotted against capture efficiency,
pressure drop, quality factor and saturation with no-drainage filter media being the
experimental control. The filter performance is characterized by the combined
performance of pressure drop and separation efficiency. The filter performance is
characterized by a figure of merit (quality factor) which accounts for capture efficiency
and pressure drop [29]. A higher quality factor indicates better filter performance. The
quality factor (QF) is defined by
QF=- ln Cout
Cin∆P
(6.1)
where outC and inC are the outlet and inlet droplet concentrations respectively and ∆ is
the pressure drop across the filter. The capture efficiency is given by
η C CC
(6.2)

63
where the inlet and outlet (upstream and downstream) concentrations are calculated from
the particle size distribution
∑ (6.3)
where C is the total mass concentration, Ni is the number of droplets of diameter di, and
ρOil is the liquid mass density. The number of droplets in the inlet and outlet is obtained
by using the SMPS. The upstream and downstream droplet distribution for the no-
drainage channel filter media is shown in Figure 6.1.
Figure 6.1 Upstream and downstream droplet size distribution of no-drainage channel
filter media.
-20000
0
20000
40000
60000
80000
100000
120000
140000
160000
0 100 200 300 400 500 600 700 800 900 1000
No.
of D
ropl
ets (
#/cm
^3)
Droplet Diameter (nanometer)
Cout Cin

64
The pressure drop and upstream and downstream droplet size distribution are
monitored and recorded regularly during the experiment. The pressure drop and
downstream concentration profile of no-drainage channel filter media are shown in
Figure 6.2. The pressure drop and concentration both increases exponentially and then
becomes steady indicating the filter has reached steady state. The upstream and
downstream oil concentration is calculated by using equation 6.3.
Figure 6.2 Pressure and downstream concentration profile of no-drainage channel filter
media.
6.1.1 Capture efficiency
Filter geometries are plotted against capture efficiency as shown in Figure 6.3.
All filter media were constructed in triplicate and the experimental results show the
0
5E-09
1E-08
1.5E-08
2E-08
2.5E-08
3E-08
3.5E-08
0
2
4
6
8
10
12
0 20 40 60 80 100 120 140 160 180 200
Cou
t (gm
/cm
^3)
Pres
sure
Dro
p (k
Pa)
Time (minutes)
Pressure drop Cout

65
steady state values averaged over the three samples. The error bars in the plots indicate
one standard deviation of the three averaged points.
Figure 6.3 Capture efficiency of filter geometries with polypropylene woven drainage
channels.
The plots are divided in two sections. The first section is horizontal flow
orientation and the second section is vertical flow orientation. Each of these are further
divided into two subsections. Horizontal orientation data with and without drainage
channels in the order of no-drainage, inlet-drainage, middle-drainage, outlet-drainage and
both-end-drainage are plotted in first subsection. Inclined-angle-drainage channel
experiments in horizontal orientation are plotted in second subsection in the order of 00,
150, 300, 400, 450, 500, and 600. The 00 horizontal orientation case study filter media is
equipped with three equally spaced drainage channels in the direction of flow. The next
subsection shows vertical orientation data with and without drainage channels in the same
87.87
36.20
99.48
38.57
98.31
59.0156.29
37.59
88.92
60.52
53.26
29.00
98.62
57.32
93.45
27.45
98.7293.28
63.90
35.06
61.23
45.81
0.00
10.00
20.00
30.00
40.00
50.00
60.00
70.00
80.00
90.00
100.00
H-N H-I H-M H-O H-B . H-0 H-15 H-30 H-40 H-45 H-50 H-60 V-N V-I V-M V-O V-B . V-0 V-15 V-30 V-45 V-60 .
Eff
icie
ncy
(%)
Filter geometry
H-HORIZONTAL ORIENTATIONH-N : No drainage channelH-I : Inlet drainage channelH-M : Middle drainage channelH-O : Outlet drainage channelH-B : Drainage channel at Both ends
V-VERTICAL ORIENTATIONV-N : No drainage channelV-I : Inlet drainage channelV-M : Middle drainage channelV-O : Outlet drainage channelV-B : Drainage channel at Both ends
V-VERTICAL ORIENTATIONV-0 : Drainage at 00 (three cut)V-15 : Drainage at 150 (three cut)V-30 : Drainage at 300 (three cut)V-45 : Drainage at 450 (three cut)V-60 : Drainage at 600 (three cut)
H-HORIZONTAL ORIENTATIONH-0 : Drainage at 00 (three cut)H-15 : Drainage at 150 (three cut)H-30 : Drainage at 300 (three cut)H-40 : Drainage at 400 (three cut)H-45 : Drainage at 450 (three cut)H-50 : Drainage at 500 (three cut)H-60 : Drainage at 600 (three cut)

66
order as the horizontal orientation experimental results while the fourth subsection has
the experimental results of inclined angle experiments in vertical orientation in the order
of 00, 150, 300, 450, and 600.
In the horizontal orientation when the drainage channel is placed at the inlet,
outlet, and both ends, the capture efficiency is about 98 %. For the inclined angle
experiments the 450 media had capture efficiency of 93 % but for the other inclined angle
media the efficiencies were in the 30 to 60% range. The drainage channel experiments in
horizontal orientation had capture efficiencies of 87 % or greater. The capture efficiency
of experiments without any filter but two drainage channels was only 30 %. These results
show that the filter media modified with drainage channels had higher capture
efficiencies than media without drainage channels and higher efficiency than drainage
channels alone. In the vertical orientation the outlet-drainage indicates capture efficiency
of 93%. The improved efficiency with drainage channels may be due to more fiber
surface area being exposed due to the reduced saturation (decreased latter) plus the large
drop may fill the pore forcing the gas flow through the smaller pores.
The capture efficiency of the middle-drainage channel is slightly higher as
compared to the no-drainage channel experiments. It could be because of insufficient
filter bed length on the either side of the drainage channel to cause coalescence as
relatively greater concentration of smaller droplets was observed in downstream particle
size distribution. More likely in the middle of the medium the saturation is normally
lower than at the boundaries and insertion of the drainage channel at this location does
not significantly change the saturation.

67
6.1.2 Pressure drop
The pressure drop of the all the drainage channel incorporated filter media as well
as no drainage channel filter media were recorded. Filter geometries are plotted against
pressure drop as shown in Figure 6.4. This plot is obtained by plotting pressure drop
against filter geometries in similar manner as Figure 6.3. All filter media were
constructed in triplicate and the experimental results show the steady state values
averaged over the three samples. The error bars in the plots indicate one standard
deviation of the three averaged points.
Figure 6.4 Pressure drop of filter geometries with polypropylene woven drainage
channels.
9.64
4.11
9.79
2.83
10.59
4.61
7.87
4.44
9.79
4.68
9.19
3.66
10.60
4.73
10.00
3.80
10.48
4.534.85
2.69
4.68 4.92
0.00
2.00
4.00
6.00
8.00
10.00
12.00
H-N H-I H-M H-O H-B . H-0 H-15 H-30 H-40 H-45 H-50 H-60 V-N V-I V-M V-O V-B . V-0 V-15 V-30 V-45 V-60 .
Pres
sure
Dro
p (K
Pa)
Filter geometry
H-HORIZONTAL ORIENTATIONH-N : No drainage channelH-I : Inlet drainage channelH-M : Middle drainage channelH-O : Outlet drainage channelH-B : Drainage channel at Both ends
V-VERTICAL ORIENTATIONV-N : No drainage channelV-I : Inlet drainage channelV-M : Middle drainage channelV-O : Outlet drainage channelV-B : Drainage channel at Both ends
V-VERTICAL ORIENTATIONV-0 : Drainage at 00 (three cut)V-15 : Drainage at 150 (three cut)V-30 : Drainage at 300 (three cut)V-45 : Drainage at 450 (three cut)V-60 : Drainage at 600 (three cut)
H-HORIZONTAL ORIENTATIONH-0 : Drainage at 00 (three cut)H-15 : Drainage at 150 (three cut)H-30 : Drainage at 300 (three cut)H-40 : Drainage at 400 (three cut)H-45 : Drainage at 450 (three cut)H-50 : Drainage at 500 (three cut)H-60 : Drainage at 600 (three cut)

68
In the horizontal orientation when the drainage channel is placed at the inlet,
outlet, and both ends, the pressure drop of the filter media slightly increases. An increase
in pressure drop usually accompanies an increase in the gas-liquid separation efficiency
of a filter [22]. The inclined angle experiments in horizontal orientation indicate
significantly low pressure drop. These filter geometries indicate half pressure drop as
compared to the no drainage channel filter media. These filter geometries have three
equally spaced woven drainage channels. The drainage channels are porous and open
structures and have 10 times higher air permeability as compared to the glass fiber filter
media which makes the filter geometry very porous structure as compared to the no
drainage channels filter media. These drainage channels are embedded at different
downward angles which aids in draining the oil faster from the filter media and hence
these filter media indicate significantly lower pressure drops.
In the vertical orientation the no drainage channel as well as the outlet drainage
indicate higher pressure drop as compared to the no drainage channel filter media in
horizontal orientation, these could be because of the improved capture efficiency of the
filter. The inclined angle experiments in vertical orientation indicate lower pressure drop
as compared to the no drainage channel filter media in horizontal orientation but these
filters indicate lower capture efficiencies.
6.1.3 Quality factor
Quality factor of the all the drainage channel incorporated filter media as well as
no drainage channel filter media was calculated by using Eq. 6.1 and are plotted against
filter geometry as shown in Figure 6.5. This plot is plotted in similar manner as Figure
6.3.

69
Figure 6.5 Quality factor of filter geometries with polypropylene woven drainage
channels.
For horizontal orientation, inlet-drainage, outlet-drainage and both-end-drainage
indicate improved quality factor as compared to the no drainage channel filter media. The
middle drainage channel filter media in horizontal orientation indicate slightly higher
quality factor as compared to the no drainage channel filter media in horizontal
orientation. The best performance was observed for the 450 downward inclined angle
experiments in horizontal orientation in terms of quality factor, saturation and drainage.
The capture efficiency of the 450 inclined angle samples was not the highest among all
the case studies but the pressure drop of these experiments were significantly lower
compared to the no-drainage, inlet-drainage, middle-drainage and both-end-drainage
channel samples in horizontal and vertical orientation. The reduced pressure drop results
in the 450 inclined angle media having the highest quality factor.
0.180.13
0.48
0.16
0.360.30
0.17
0.02
0.190.26
0.090.03
0.36
0.20 0.23
0.09
0.45
0.77
0.220.16
0.3 0.28
0.00
0.10
0.20
0.30
0.40
0.50
0.60
0.70
0.80
0.90
H-N H-I H-M H-O H-B . H-0 H-15 H-30 H-40 H-45 H-50 H-60 V-N V-I V-M V-O V-B . V-0 V-15 V-30 V-45 V-60 .
Qua
lity
Fact
or(K
Pa-1
)
Filter geometry
H-HORIZONTAL ORIENTATIONH-N : No drainage channelH-I : Inlet drainage channelH-M : Middle drainage channelH-O : Outlet drainage channelH-B : Drainage channel at Both ends
V-VERTICAL ORIENTATIONV-N : No drainage channelV-I : Inlet drainage channelV-M : Middle drainage channelV-O : Outlet drainage channelV-B : Drainage channel at Both ends
V-VERTICAL ORIENTATIONV-0 : Drainage at 00 (three cut)V-15 : Drainage at 150 (three cut)V-30 : Drainage at 300 (three cut)V-45 : Drainage at 450 (three cut)V-60 : Drainage at 600 (three cut)
H-HORIZONTAL ORIENTATIONH-0 : Drainage at 00 (three cut)H-15 : Drainage at 150 (three cut)H-30 : Drainage at 300 (three cut)H-40 : Drainage at 400 (three cut)H-45 : Drainage at 450 (three cut)H-50 : Drainage at 500 (three cut)H-60 : Drainage at 600 (three cut)

70
Vertical orientation no drainage filter media indicate significantly high quality
factor and lower saturation as compared to the no drainage channel filter media in
horizontal orientation which proves that gravitational force helps in removing the oil
droplets from the filter media.
6.1.4 Saturation
Liquid saturation of the filter medium is the volume fraction of the pores filled by
the liquid phase. It directly affects the pressure drop and local gas velocity within the
medium. Saturation of filter media is calculated by using following formula.
(6.4)
Average saturations of all the filter geometries as well as no-drainage channel
filter media in horizontal and vertical orientation are plotted in Figure 6.6. This plot is
plotted in similar manner as Figure 6.3. All the filter geometries in the horizontal as well
as vertical orientation indicate lower saturation and higher drainage as compared to the
experimental control. Inlet, outlet and both-end drainage channel filter media in
horizontal orientation indicate higher capture efficiencies, higher drainage and lower
saturation than the experimental control. The 450 downward inclined angle filter
geometry indicate lowest saturation and hence the filter media indicate significantly low
pressure drop. This filter geometry indicates capture efficiency of 93 %. It indicates that
the drainage channels incorporated at 450 downward inclination helps in draining the
bigger coalesced drops faster from the filter media. Hence this filter media has lower
saturation and the filter can remain porous for a longer time with high capture efficiency
which increases filter life. The both end filter media in the horizontal orientation indicate

71
significantly lower saturation and higher quality factor as compared to the experimental
control.
Figure 6.6 Saturation of filter geometries with polypropylene woven drainage channels.
The no-drainage channel filter media in vertical orientation indicate lower
saturation and higher drainage with very high capture efficiency. While inlet and both-
end drainage channel filter geometries in vertical orientation indicate lower capture
efficiencies, drainage and relatively higher saturation. Outlet drainage in vertical
orientation indicates 93 % capture efficiency but also has higher pressure drop than the
control. These filter geometries indicate low quality factor and high saturation. The
inclined angle filter geometries in vertical orientation indicate lower capture efficiency,
lower drainage but higher saturations which indicate these filter geometries do not drain
0.37
0.2
0.17
0.32
0.27
0.23
0.34
0.3
0.220.24
0.3 0.31
0.27 0.28 0.29
0.36
0.24
0.12
0.34 0.34
0.230.21
0
0.05
0.1
0.15
0.2
0.25
0.3
0.35
0.4
H-N H-I H-M H-O H-B . H-0 H-15 H-30 H-40 H-45 H-50 H-60 V-N V-I V-M V-O V-B . V-0 V-15 V-30 V-45 V-60 .
Satu
ratio
n
Filter Geometry
H-HORIZONTAL ORIENTATIONH-N : No drainage channelH-I : Inlet drainage channelH-M : Middle drainage channelH-O : Outlet drainage channelH-B : Drainage channel at Both ends
V-VERTICAL ORIENTATIONV-N : No drainage channelV-I : Inlet drainage channelV-M : Middle drainage channelV-O : Outlet drainage channelV-B : Drainage channel at Both ends
V-VERTICAL ORIENTATIONV-0 : Drainage at 00 (three cut)V-15 : Drainage at 150 (three cut)V-30 : Drainage at 300 (three cut)V-45 : Drainage at 450 (three cut)V-60 : Drainage at 600 (three cut)
H-HORIZONTAL ORIENTATIONH-0 : Drainage at 00 (three cut)H-15 : Drainage at 150 (three cut)H-30 : Drainage at 300 (three cut)H-40 : Drainage at 400 (three cut)H-45 : Drainage at 450 (three cut)H-50 : Drainage at 500 (three cut)H-60 : Drainage at 600 (three cut)

72
the droplets effectively from the filter media. Hence the filter media gets clogged with the
droplets faster and hence indicate lower capture efficiencies.
To understand the effect of the change of filter orientation and drainage structures
on the performance of the filter media qualitatively, the filters were dissected. It was
observed that the drainage channel equipped filter media had a more uniform oil
distribution with less oil concentrated at the bottom of the filter media (i.e., the lowest
point in the direction of gravity) while the filters without drainage channels had higher
liquid saturations at the bottom of the media plus the saturation was higher at the inlet
and outlet surfaces compared to the middle of the media (Refer Figure 6.7). Filter media
equipped with three equally spaced drainage channels at different angles had more or less
uniform distribution of liquid with a very small region of high saturation at the bottom.
This is likely the reason for the lower pressure drop of these filter media.
Figure 6.7 Tested filter media (a) no-drainage channel filter media in horizontal
orientation (b) Both-end-drainage filter media in horizontal orientation. The green
colored oil is collected near the bottom edge of the filter medium.
a b
73
When the filter media are oriented for horizontal flow, the liquid drainage must
move through the filter and down the exit surface of the filter before it collects at the
bottom of the filter holder. The presence of this liquid reduces the space available for gas
flow and thus causes an increase in pressure drop. Furthermore, filters with horizontal
flow are often observed to have a small part of the filter at the bottom to be saturated with
liquid, through which no gas can flow. This restriction causes the gas to move through a
reduced area of the filter and hence with a greater face velocity. The capture mechanisms
are sensitive to the face velocity and the capture efficiencies may decrease. The presence
of the drainage channels of the filter medium provide greater pore openings to allow
faster drainage and can reduce some of the flow restriction. The filters with flow oriented
vertically, on the other hand, do not have the problem of liquid filling the pores at the exit
surface as the liquid drains from the filter. When the liquid reaches the exit the surface of
the filter the liquid drips from the filter and the net result is more space available for gas
flow.
The plot in Figure 6.8 shows there is a strong connection between saturation and
quality factor regardless of the filter orientation and drainage channel geometric structure.
The 450 downward inclination filter geometry in horizontal orientation indicate highest
quality factor and lowest saturation. The no-drainage channel filter media in vertical
orientation indicate second best quality factor and hence slightly higher saturation as
compared to the 450 downward inclination filter geometry in horizontal orientation. The
experimental results indicate that performance of the filter media can be enhanced by
reducing the saturation by developing drainage channel incorporated filter geometries.

74
Figure 6.8 Quality factor versus average saturation of all filter geometries with
polypropylene woven drainage channels.
6.1.4.1 Saturation profile of no-drainage channel filter media
The saturation profile along the filter media bed length for no-drainage channel
filter media was obtained. The schematic of the process is shown in Figure 6.9. The glass
fiber filter media was constructed using the vacuum molding process. The filter media
was characterized to obtain porosity, air permeability and strength. The filter media was
cut in five thin slices of same thickness by using the filter media cutter saw. The mass of
every slice was recorded and these slices were assembled and tested in the coalescence
450
No-drainage
0.00
0.10
0.20
0.30
0.40
0.50
0.60
0.70
0.80
0.90
0 0.05 0.1 0.15 0.2 0.25 0.3 0.35 0.4
Qua
lity
Fact
or (1
/kPa
)
Saturation
Horizontal Horizontal-angle Vertical Vertical-angle

75
filtration setup. The weight of the filter slices was recorded after the experiment and the
saturation was calculated using Eq. 6.4.
Figure 6.9 Schematic of experimental measurement of saturation profile of no-drainage
filter media in horizontal orientation.
Gas inlet
Gas outlet
Glass fiber filter Thin slices of filter media
Measure mass
Assemble layers
Filter test Measure mass Calculate saturation
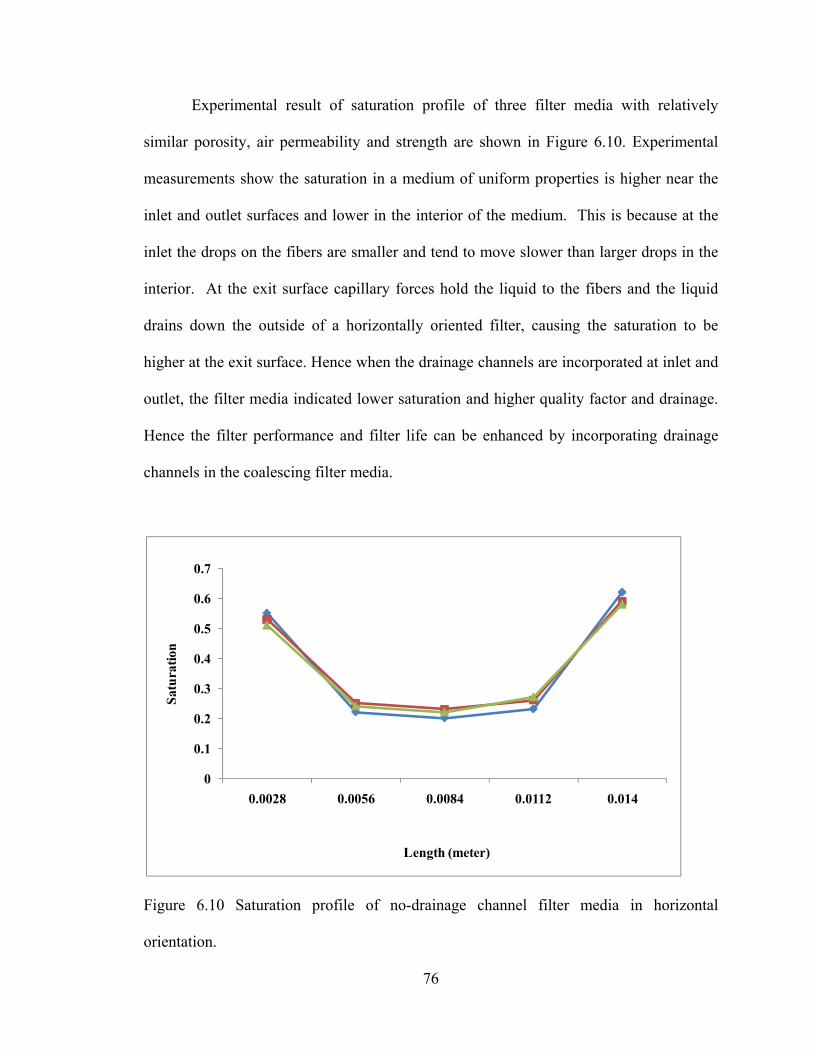
76
Experimental result of saturation profile of three filter media with relatively
similar porosity, air permeability and strength are shown in Figure 6.10. Experimental
measurements show the saturation in a medium of uniform properties is higher near the
inlet and outlet surfaces and lower in the interior of the medium. This is because at the
inlet the drops on the fibers are smaller and tend to move slower than larger drops in the
interior. At the exit surface capillary forces hold the liquid to the fibers and the liquid
drains down the outside of a horizontally oriented filter, causing the saturation to be
higher at the exit surface. Hence when the drainage channels are incorporated at inlet and
outlet, the filter media indicated lower saturation and higher quality factor and drainage.
Hence the filter performance and filter life can be enhanced by incorporating drainage
channels in the coalescing filter media.
Figure 6.10 Saturation profile of no-drainage channel filter media in horizontal
orientation.
0
0.1
0.2
0.3
0.4
0.5
0.6
0.7
0.0028 0.0056 0.0084 0.0112 0.014
Satu
ratio
n
Length (meter)

77
6.1.5. Performance comparison of filter geometries developed with woven drainage
channels
Filter media performance is quantified in terms of quality factor. The
improvement in quality factor is quantified by the relative quality factor (RQF) given by
(6.5)
where the control medium is the horizontal no-drainage channel filter media.
Performance comparison in terms of RQF of the no-drainage filter media in
horizontal and vertical orientation is shown in Figure 6.11. When the air flow is in the
direction of gravity the filter media indicate a RQF of 2.67 and lower saturation which
means that the gravitational force helps in removing the oil droplets faster from the filter
medium.
Figure 6.11 Relative quality factor of no-drainage filter media in horizontal and vertical
orientation.
1
2.67
0
0.5
1
1.5
2
2.5
3
Horizontal Vertical
Rel
ativ
e Q
ualit
y Fa
ctor
(RQ
F)
Filter Geometry (No-drainage)

78
RQF of all the filter geometries and no-drainage channel filter media both in
horizontal orientation and vertical orientation are shown in Figure 6.12. The horizontal
no-drainage channel filter media is the experimental control.
Figure 6.12 Relative Quality Factor of filter geometry with polypropylene woven
drainage channels in horizontal and vertical orientation.
RQF of all the filter geometries are plotted in Figure 6.12. This plot is plotted in
similar manner as Figure 6.3. Inlet, outlet, middle and both-end drainage filter geometries
in the horizontal orientation have increased RQF. Filter media equipped with three
equally spaced drainage channels in horizontal orientation at angles of 150, 300, 400, 450,
500, and 600 degrees had increased RQF with the 450 inclined angle media having the
1.00
0.73
2.61
0.84
1.95
1.63
0.91
0.13
1.01
1.42
0.49
0.16
1.95
1.091.23
0.50
2.46
4.28
1.16
0.89
1.631.52
0.00
0.50
1.00
1.50
2.00
2.50
3.00
3.50
4.00
4.50
H-N H-I H-M H-O H-B . H-0 H-15 H-30 H-40 H-45 H-50 H-60 V-N V-I V-M V-O V-B . V-0 V-15 V-30 V-45 V-60 .
Rel
ativ
e Q
ualit
y Fa
ctor
(RQ
F)
Filter Geometry
H-HORIZONTAL ORIENTATIONH-N : No drainage channelH-I : Inlet drainage channelH-M : Middle drainage channelH-O : Outlet drainage channelH-B : Drainage channel at Both ends
V-VERTICAL ORIENTATIONV-N : No drainage channelV-I : Inlet drainage channelV-M : Middle drainage channelV-O : Outlet drainage channelV-B : Drainage channel at Both ends
H-HORIZONTAL ORIENTATIONH-0 : Drainage at 00 (three cut)H-15 : Drainage at 150 (three cut)H-30 : Drainage at 300 (three cut)H-40 : Drainage at 400 (three cut)H-45 : Drainage at 450 (three cut)H-50 : Drainage at 500 (three cut)H-60 : Drainage at 600 (three cut)
V-VERTICAL ORIENTATIONV-0 : Drainage at 00 (three cut)V-15 : Drainage at 150 (three cut)V-30 : Drainage at 300 (three cut)V-45 : Drainage at 450 (three cut)V-60 : Drainage at 600 (three cut)

79
greatest RQF and lowest saturation. Outlet-drainage and both-end drainage in vertical
orientation indicate improved RQF. These filter geometries also indicate lower saturation.
The inclined angle experiments in vertical orientation did not show improvement
in RQF.
6.1.6 Factors affecting coalescence filtration
Drainage channel incorporated filter geometries indicate improved performance.
All the parameters which can affect the performance of the filter geometries are listed in
Table 6.1. The highlighted cells are the important parameters of filter media design which
are explored to study their effect on the performance of the geometries.
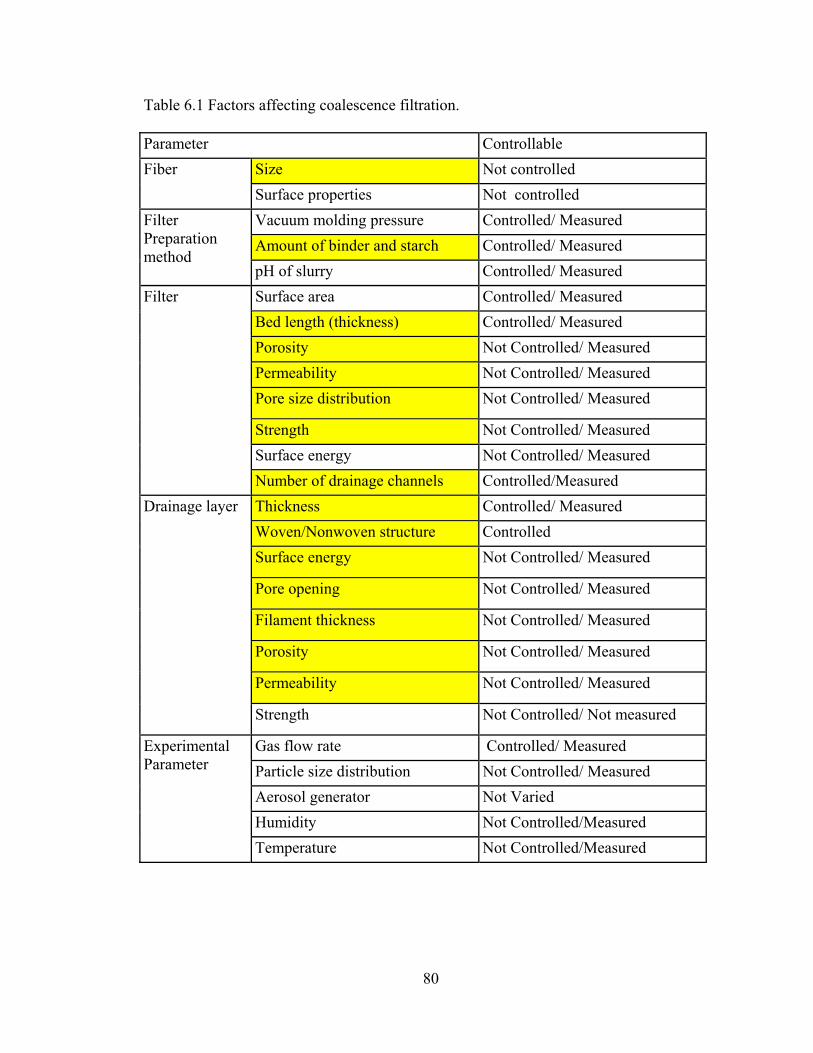
80
Table 6.1 Factors affecting coalescence filtration.
Parameter Controllable Fiber Size Not controlled
Surface properties Not controlled Filter Preparation method
Vacuum molding pressure Controlled/ Measured Amount of binder and starch Controlled/ Measured pH of slurry Controlled/ Measured
Filter Surface area Controlled/ Measured Bed length (thickness) Controlled/ Measured Porosity Not Controlled/ Measured Permeability Not Controlled/ Measured Pore size distribution Not Controlled/ Measured
Strength Not Controlled/ Measured Surface energy Not Controlled/ Measured Number of drainage channels Controlled/Measured
Drainage layer Thickness Controlled/ Measured Woven/Nonwoven structure Controlled Surface energy Not Controlled/ Measured
Pore opening Not Controlled/ Measured
Filament thickness Not Controlled/ Measured
Porosity Not Controlled/ Measured
Permeability Not Controlled/ Measured
Strength Not Controlled/ Not measured
Experimental Parameter
Gas flow rate Controlled/ Measured Particle size distribution Not Controlled/ Measured Aerosol generator Not Varied Humidity Not Controlled/Measured Temperature Not Controlled/Measured

81
6.1.7: Effect of number of drainage channels in inclined angle filter media and upward
inclination
Number of drainage channels in the inclined angle filter media has impact on the
performance of the filter geometry. 450 downward inclination filter geometry with three
equally spaced polypropylene woven drainage channels (500 µm pore opening and 600
µm filament thickness) in horizontal orientation indicated highest quality factor. Filter
geometries with one and two drainage channel at 450 downward inclination were
developed and tested in the horizontal orientation in coalescence filtration setup. The
experimental results in terms of capture efficiency, pressure drop, quality factor and
saturation are shown in Figure 6.13, 6.14, 6.15 and 6.16 respectively.
Figure 6.13 Effect of number of channels on capture efficiency of 450 downward
inclination filter geometry in horizontal orientation.
89.12
91.23
93.28
868788899091929394
1 2 3
Eff
icie
ncy
(%)
No of drainage channels
Filter geometry: 45 degree downward inclination

82
Figure 6.14 Effect of number of Channels on pressure drop of 450 downward inclination
filter geometry in horizontal orientation.
Figure 6.15 Effect of number of channels on quality factor of 450 downward inclination
filter geometry in horizontal orientation.
9.89
6.23
4.53
0
2
4
6
8
10
12
1 2 3
Pres
sure
dro
p (k
Pa)
No of drainage channels
Filter geometry: 45 degree downward inclination
0.47
0.61
0.77
00.10.20.30.40.50.60.70.80.9
1 2 3
Qua
lity
fact
or (1
/kPa
)
No of drainage channels
Filter geometry: 45 degree downward inclination

83
Figure 6.16 Effect of number of channels on saturation of 450 downward inclination filter
geometry in horizontal orientation.
The experimental results indicate that as the number of drainage channels
increases the filter geometry indicate higher capture efficiency, lower pressure drop,
lower saturation hence higher quality factor. The drainage channels are porous and have
lower surface energy as compared to the filter media. As the droplets reach the drainage
channels they bead up and are easily removed from the open drainage channel structure.
Hence as the number of drainage channels increases the porosity of the filter media
increases which helps in lowering the pressure drops. Drainage channel incorporated
filter media indicate higher drainage hence the filter can remain porous for longer time
and can capture more number of droplets. Hence as the number of drainage channels
increases the quality factor and drainage of the media increases while the saturation
decreases. The filter media having three equally spaced woven polypropylene drainage
channels indicate highest quality factor and can have higher filter life.
0.160.14
0.12
00.020.040.060.08
0.10.120.140.160.18
1 2 3
Satu
ratio
n
No of drainage channels
Filter geometry: 45 degree downward inclination

84
To study the effect of gravitational force on the performance of the filter media,
filter geometries were developed by adding three equally spaced polypropylene woven
drainage channels at 450 upward inclination (Refer Figure 6.17). The experimental results
in terms of capture efficiency, pressure drop, quality factor and saturation are shown in
Figure 6.18, 6.19, 6.20, and 6.21 respectively.
Figure 6.17 Filter geometry developed with three equally spaced polypropylene woven
drainage channel at 450 upward inclination.
Air flow
450
450
450
Gravity

85
Figure 6.18 Capture efficiency of three drainage channels at 45 degree upward inclination
and experimental control.
Figure 6.19 Pressure drop of three drainage channels at 45 degree upward inclination and
experimental control.
87.87
81.12
76
78
80
82
84
86
88
90
No drainage 45 degree upward
Eff
icie
ncy
(%)
Filter Geometry
No Drainage 45 Degree Upward
9.64
15.61
02468
1012141618
No drainage 45 degree upward
Pres
sure
Dro
p (k
Pa)
Filter Geometry
No Drainage 45 Degree Upward
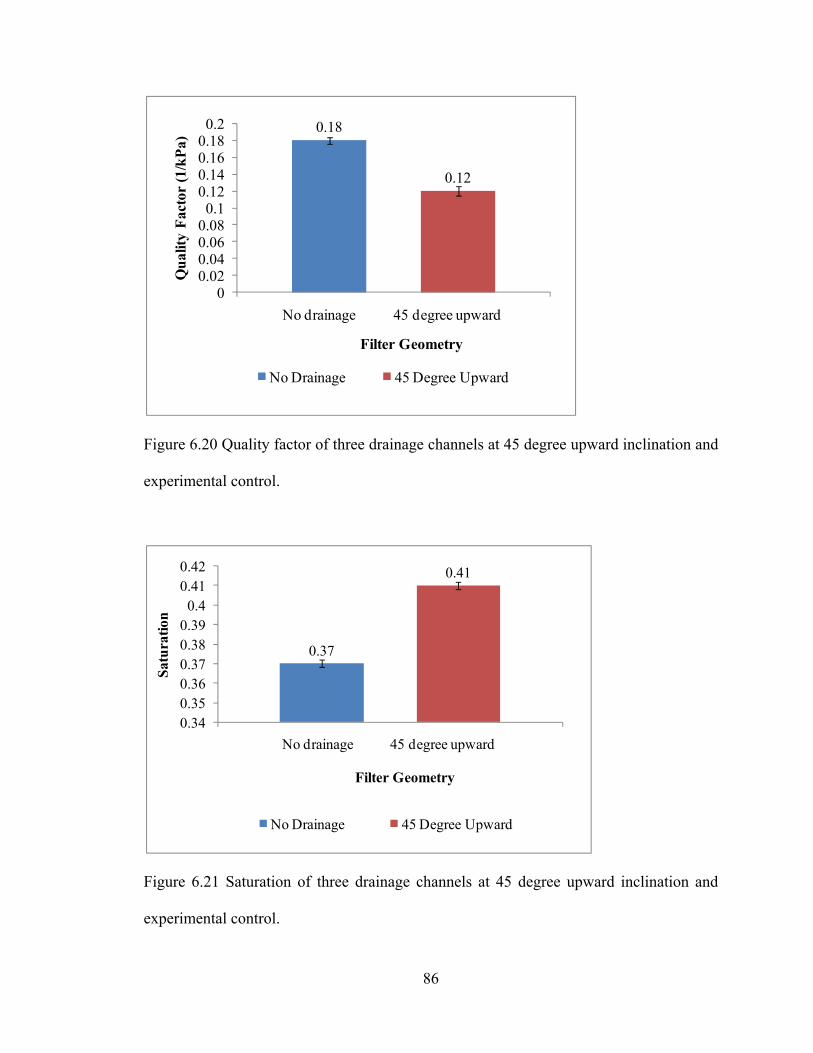
86
Figure 6.20 Quality factor of three drainage channels at 45 degree upward inclination and
experimental control.
Figure 6.21 Saturation of three drainage channels at 45 degree upward inclination and
experimental control.
0.18
0.12
00.020.040.060.080.1
0.120.140.160.180.2
No drainage 45 degree upward
Qua
lity
Fact
or (1
/kPa
)
Filter Geometry
No Drainage 45 Degree Upward
0.37
0.41
0.340.350.360.370.380.39
0.40.410.42
No drainage 45 degree upward
Satu
ratio
n
Filter Geometry
No Drainage 45 Degree Upward

87
Capture efficiency of the filter geometry with three equally spaced drainage
channels at 450 upward inclination is less than the no drainage channel filter media. This
filter geometry also indicates higher pressure drop and higher saturation, hence a lower
quality factor. It could be because the droplets tend to take the path of lower resistance
i.e. they try to move through the drainage channels and the drainage channels in upward
direction are forcing the droplets to move against the gravitational force and hence this
filter geometry indicates lower drainage and higher saturation and hence a lower quality
factor.
6.1.8. Effect of pore size and filament thickness of drainage channel
The pore sizes and filament sizes of the mesh in the drainage channels can affect
the drainage performance. To study the effect of pore opening and thickness of drainage
channel, polypropylene meshes of 210 µm pore opening and 308 µm filament thickness
as well as 1000 µm pore opening and 1024 µm filament thickness were tested in the filter
geometry with the 450 inclined angle media and with drainage channels at both ends with
the media in horizontal orientation. The experimental results are given in Figures 6.22,
6.23, 6.24, and 6.25 respectively. Every data point on the graph is the average of three
filters and error bar indicated one standard deviation.
The results show all of the performances were very similar, indicating that a wider
range in pore sizes should be explored in future work. It also indicates that the drainage
layer performance may not be very sensitive to the mesh size in this pore size range but
may be more sensitive to the surface properties of the mesh such as its contact angle or
surface tension.

88
Figure 6.22 Capture efficiency of filter media equipped with woven drainage channel of
different pore openings.
Figure 6.23 Pressure drop of filter media equipped with woven drainage channel of
different pore openings.
98.23
92.48
98.53
93.38
97.83
92.83
88
90
92
94
96
98
100
210 μm 500 μm 1000 μm (H-B)
210 μm 500 μm 1000 μm (H-45)
Eff
icie
ncy
(%)
Filter GeometryH-HORIZONTAL ORIENTATION
H-B: Drainage channel at Both ends H-45: Drainage at 450 (three cut)
11.96
6.47
10.48
4.68
10.38
5.25
0
2
4
6
8
10
12
14
210 μm 500 μm 1000 μm (H-B)
210 μm 500 μm 1000 μm (H-45)
Pres
sure
Dro
p (k
Pa)
Filter Geometry
H-HORIZONTAL ORIENTATION
H-B: Drainage channel at Both ends H-45: Drainage at 450 (three cut)
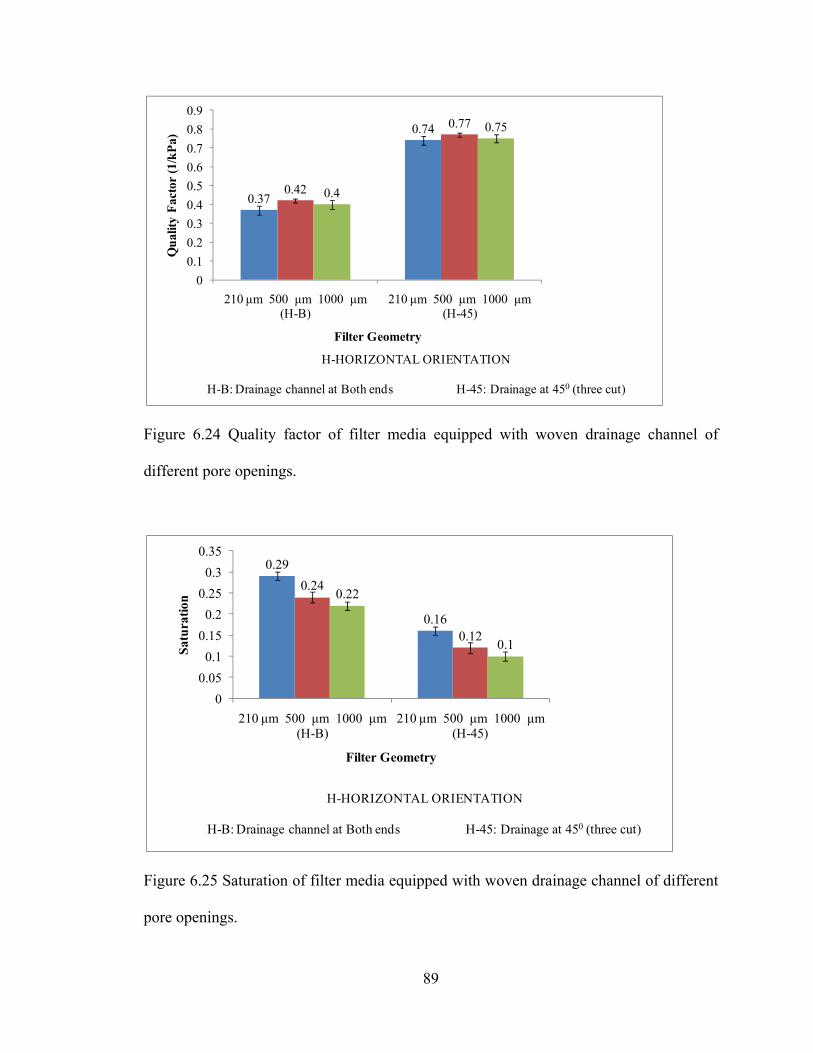
89
Figure 6.24 Quality factor of filter media equipped with woven drainage channel of
different pore openings.
Figure 6.25 Saturation of filter media equipped with woven drainage channel of different
pore openings.
0.37
0.74
0.42
0.77
0.4
0.75
00.10.20.30.40.50.60.70.80.9
210 μm 500 μm 1000 μm (H-B)
210 μm 500 μm 1000 μm (H-45)
Qua
lity
Fact
or (1
/kPa
)
Filter Geometry
H-HORIZONTAL ORIENTATION
H-B: Drainage channel at Both ends H-45: Drainage at 450 (three cut)
0.29
0.16
0.24
0.12
0.22
0.1
00.05
0.10.15
0.20.25
0.30.35
210 μm 500 μm 1000 μm (H-B)
210 μm 500 μm 1000 μm (H-45)
Satu
ratio
n
Filter Geometry
H-HORIZONTAL ORIENTATION
H-B: Drainage channel at Both ends H-45: Drainage at 450 (three cut)

90
6.1.9 Filer bed length
The filter geometry developed with three equally spaced polypropylene woven
drainage channels at 450 downward inclination filter media were dissected after testing
and the filter media indicated dry fiber patches in region as shown in Figure 6.26. Hence
it seems that the flow is going through the drainage channels. Hence the filter bed length
was reduced to half so that the flow can pass straight through the filter media. The
experimental results in terms of capture efficiency, pressure drop, quality factor and
saturation are given in Figure 6.27, 6.28, 6.29 and 6.30 respectively. The experimental
results of the filter geometry compared to the results of no-drainage channel filter media
of same filter bed length.
Figure 6.26 Flow pattern in the filter geometry with three equally spaced drainage
channels at 450 downward inclination.
Air flow
Dry fibers

91
Figure 6.27 Capture efficiency of filter geometries with reduced filter bed length.
Figure 6.28 Pressure drop of filter geometries with reduced filter bed length.
83.66
86.28
82.0082.5083.0083.5084.0084.5085.0085.5086.0086.5087.00
H-N H-45
Eff
icie
ncy
(%)
Filter Geometry
H-HORIZONTAL ORIENTATION
H-N: No drainage channel H-45: Drainage at 450 (three cut)
6.48
2.80
0.00
1.00
2.00
3.00
4.00
5.00
6.00
7.00
8.00
H-N H-45
Pres
sure
dro
p (k
Pa)
Filter Geometry
H-HORIZONTAL ORIENTATION
H-N: No drainage channel H-45: Drainage at 450 (three cut)

92
Figure 6.29 Quality factor of filter geometries with reduced filter bed length.
Figure 6.30 Saturation of filter geometries with reduced filter bed length.
Experimental results indicate that when the filter bed length is reduced to half the
capture efficiency of no drainage as well as 450 downward inclination filter geometry
0.28
0.60
0.00
0.10
0.20
0.30
0.40
0.50
0.60
0.70
H-N H-45
Qua
lity
fact
or (1
/kPa
)
Filter Geometry
H-HORIZONTAL ORIENTATION
H-N: No drainage channel H-45: Drainage at 450 (three cut)
0.29
0.09
0.00
0.05
0.10
0.15
0.20
0.25
0.30
0.35
H-N H-45
Saur
atio
n
Filter Geometry
H-HORIZONTAL ORIENTATION
H-N: No drainage channel H-45: Drainage at 450 (three cut)

93
decreases. The pressure drop of both the filter geometries also decreases specifically the
450 downward inclination filter geometry indicate significantly low pressure drop and
saturation as compared to the experimental control. Hence this filter geometry has
significantly high quality factor irrespective of its moderate capture efficiency. These
filters indicate very less dry fiber region as compared to the filters which had double the
filter bed length.
6.2 Nonwoven drainage channels
Polypropyelene nonwoven fabric commonly known as polypropylene spunbond is
used as a drainage channel to study the effect of nonwoven drainage channels on the
performance of filter media. Spunbond nonwovens are fabrics produced by depositing
extruded, spun filaments onto a collecting belt in a uniform but random manner followed
by bonding the fibers [84, 85]. The fibers are separated during the web laying process by
air jets or electrostatic charges. Bonding is formed by applying heated rolls or hot needles
to partially melt the polymer and fuse the fibers together [84, 85]. Spunbond fabric is
nonwoven in nature and characterized by its basis weight. Basis weight of spunbond
indicate amount of fibers present in per square meter of fabric and the unit of basis
weight is grams per square meter (gsm). The nonwoven fabric has non uniform size of
pores. The mean and maximum pore sizes of different basis weight polypropylene
spunbond fabric are given in table 6.2 [86]. Polypropylene woven mesh has uniform pore
size of 500 µm and filament thickness of 600 µm while the filament thickness of
polypropylene spunbond is 50 µm. All the filter geometries were developed by
incorporating nonwoven spunbond of 17 gsm basis weight. The effect of basis weight of
drainage channels on the performance of the filter geometries was also studied. The
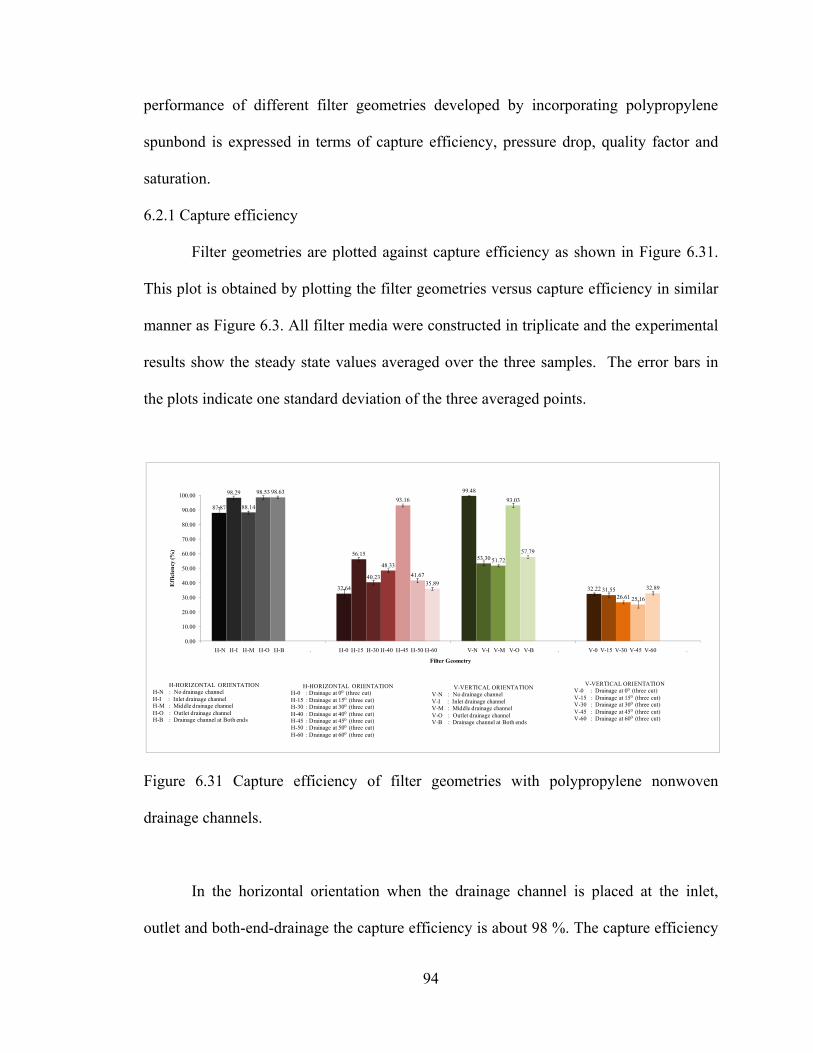
94
performance of different filter geometries developed by incorporating polypropylene
spunbond is expressed in terms of capture efficiency, pressure drop, quality factor and
saturation.
6.2.1 Capture efficiency
Filter geometries are plotted against capture efficiency as shown in Figure 6.31.
This plot is obtained by plotting the filter geometries versus capture efficiency in similar
manner as Figure 6.3. All filter media were constructed in triplicate and the experimental
results show the steady state values averaged over the three samples. The error bars in
the plots indicate one standard deviation of the three averaged points.
Figure 6.31 Capture efficiency of filter geometries with polypropylene nonwoven
drainage channels.
In the horizontal orientation when the drainage channel is placed at the inlet,
outlet and both-end-drainage the capture efficiency is about 98 %. The capture efficiency
87.87
32.64
99.48
32.22
98.29
56.1553.30
31.55
88.14
40.23
51.72
26.61
98.53
48.33
93.03
25.16
98.6393.16
57.79
32.89
41.6735.89
0.00
10.00
20.00
30.00
40.00
50.00
60.00
70.00
80.00
90.00
100.00
H-N H-I H-M H-O H-B . H-0 H-15 H-30 H-40 H-45 H-50 H-60 V-N V-I V-M V-O V-B . V-0 V-15 V-30 V-45 V-60 .
Eff
icie
ncy
(%)
Filter Geometry
H-HORIZONTAL ORIENTATIONH-N : No drainage channelH-I : Inlet drainage channelH-M : Middle drainage channelH-O : Outlet drainage channelH-B : Drainage channel at Both ends
V-VERTICAL ORIENTATIONV-N : No drainage channelV-I : Inlet drainage channelV-M : Middle drainage channelV-O : Outlet drainage channelV-B : Drainage channel at Both ends
V-VERTICAL ORIENTATIONV-0 : Drainage at 00 (three cut)V-15 : Drainage at 150 (three cut)V-30 : Drainage at 300 (three cut)V-45 : Drainage at 450 (three cut)V-60 : Drainage at 600 (three cut)
H-HORIZONTAL ORIENTATIONH-0 : Drainage at 00 (three cut)H-15 : Drainage at 150 (three cut)H-30 : Drainage at 300 (three cut)H-40 : Drainage at 400 (three cut)H-45 : Drainage at 450 (three cut)H-50 : Drainage at 500 (three cut)H-60 : Drainage at 600 (three cut)

95
of the middle-drainage channel is slightly higher as compared to the no-drainage channel
experiments. For the inclined angle experiments the 450 media had capture efficiency of
93 % but for the other inclined angle media the efficiencies were in the 30 to 60% range.
The capture efficiency of experiments without any filter but two nonwoven drainage
channels was only 27 %. In the vertical orientation the outlet-drainage indicated a capture
efficiency of 93%.
These results show that the filter media modified with nonwoven drainage
channels had higher capture efficiencies than media without drainage channels and higher
efficiency than drainage channels alone. These experiments indicate similar trend as the
filter geometries developed with the woven polypropylene drainage channels.
6.2.2 Pressure drop
Pressure drop of the all the drainage channel incorporated filter media as well as
no-drainage channel filter media were recorded. Filter geometries are plotted against
pressure drop as shown in Figure 6.32. This plot is obtained by plotting pressure drop
against filter geometries in similar manner as Figure 6.3. All filter media were
constructed in triplicate and the experimental results show the steady state values
averaged over the three samples. The error bars in the plots indicate one standard
deviation of the three averaged points.
In the horizontal orientation when the drainage channel is placed at the inlet,
outlet, and both ends, the pressure drop of the filter media slightly increases might be due
to improved capture efficiency of these filters. The inclined angle filter geometries
indicate significantly low pressure drop as compared to the no-drainage channel filter

96
media. These filter geometries have three equally spaced nonwoven drainage channels.
The drainage channels are porous and open structures and have 10 times higher air
permeability as compared to the glass fiber filter media which makes the filter geometry
very porous structure as compared to the no drainage channels filter media. These
drainage channels are embedded at different downward angles which aids in draining the
oil faster from the filter media and hence these filter media indicate significantly lower
pressure drops.
Figure 6.32 Pressure drop of filter geometries with polypropylene nonwoven drainage
channels.
The inclined angle experiments in horizontal orientation developed with
nonwoven drainage channel indicate significantly low pressure drop as compared to the
no-drainage channel filter media. But these filter geometries indicate slightly higher
9.64
6.08
9.79
6.33
10.85
7.11
9.36
5.03
10.08
6.78
9.65
5.63
10.88
6.10
10.36
6.39
10.66
5.32
6.99 6.89
5.12
6.59
0.00
2.00
4.00
6.00
8.00
10.00
12.00
H-N H-I H-M H-O H-B . H-0 H-15 H-30 H-40 H-45 H-50 H-60 V-N V-I V-M V-O V-B . V-0 V-15 V-30 V-45 V-60 .
Pres
sure
Dro
p (K
Pa)
Filter Geometry
H-HORIZONTAL ORIENTATIONH-N : No drainage channelH-I : Inlet drainage channelH-M : Middle drainage channelH-O : Outlet drainage channelH-B : Drainage channel at Both ends
V-VERTICAL ORIENTATIONV-N : No drainage channelV-I : Inlet drainage channelV-M : Middle drainage channelV-O : Outlet drainage channelV-B : Drainage channel at Both ends
V-VERTICAL ORIENTATIONV-0 : Drainage at 00 (three cut)V-15 : Drainage at 150 (three cut)V-30 : Drainage at 300 (three cut)V-45 : Drainage at 450 (three cut)V-60 : Drainage at 600 (three cut)
H-HORIZONTAL ORIENTATIONH-0 : Drainage at 00 (three cut)H-15 : Drainage at 150 (three cut)H-30 : Drainage at 300 (three cut)H-40 : Drainage at 400 (three cut)H-45 : Drainage at 450 (three cut)H-50 : Drainage at 500 (three cut)H-60 : Drainage at 600 (three cut)

97
pressure drop as compared to the inclined angle filter geometries of woven drainage
channels.
In the vertical orientation the outlet drainage indicate higher pressure drop as
compared to the no drainage channel filter media in horizontal orientation, it could be
because of the improved capture efficiency of the filter. The inclined angle experiments
in vertical orientation indicate lower pressure drop as compared to the no drainage
channel filter media in horizontal orientation but these filters indicate lower capture
efficiencies. The filter geometries developed with nonwoven drainage channels in
horizontal as well as vertical orientation indicate similar trend as that of the woven
drainage channel filter media. The nonwoven drainage channel incorporated filter
geometries indicate higher saturation and higher pressure drop than the woven drainage
channel incorporated filter geometries.
6.2.3 Quality factor
Quality factor of the all the drainage channel incorporated filter media as well as
no drainage channel filter media are plotted against filter geometry as shown in Figure
6.33. This plot is obtained by plotting quality factor against filter geometries in similar
manner as Figure 6.3.

98
Figure 6.33 Quality factor of filter geometries with polypropylene nonwoven drainage
channels.
For horizontal orientation, inlet-drainage, outlet-drainage and both-end-drainage
indicate improved quality factor as compared to the no drainage channel filter media. The
middle drainage channel filter media in horizontal orientation indicate slightly higher
quality factor as compared to the no-drainage channel filter media in horizontal
orientation. The best performance was observed for the 450 downward inclined angle
experiments in horizontal orientation in terms of quality factor, saturation and drainage.
The capture efficiency of the 450 inclined angle samples was not the highest among all
the case studies but the pressure drop of these experiments were significantly lower
compared to the no-drainage, inlet-drainage, middle-drainage and both-end-drainage
channel samples in horizontal and vertical orientation. The reduced pressure drop results
0.180.12
0.48
0.15
0.350.29
0.15
0.02
0.190.25
0.070.02
0.35
0.190.22
0.05
0.42
0.76
0.21
0.13
0.28 0.26
0.00
0.10
0.20
0.30
0.40
0.50
0.60
0.70
0.80
0.90
H-N H-I H-M H-O H-B . H-0 H-15 H-30 H-40 H-45 H-50 H-60 V-N V-I V-M V-O V-B . V-0 V-15 V-30 V-45 V-60 .
Qua
lity
Fact
or(1
/kPa
)
Filter Geometry
H-HORIZONTAL ORIENTATIONH-N : No drainage channelH-I : Inlet drainage channelH-M : Middle drainage channelH-O : Outlet drainage channelH-B : Drainage channel at Both ends
V-VERTICAL ORIENTATIONV-N : No drainage channelV-I : Inlet drainage channelV-M : Middle drainage channelV-O : Outlet drainage channelV-B : Drainage channel at Both ends
V-VERTICAL ORIENTATIONV-0 : Drainage at 00 (three cut)V-15 : Drainage at 150 (three cut)V-30 : Drainage at 300 (three cut)V-45 : Drainage at 450 (three cut)V-60 : Drainage at 600 (three cut)
H-HORIZONTAL ORIENTATIONH-0 : Drainage at 00 (three cut)H-15 : Drainage at 150 (three cut)H-30 : Drainage at 300 (three cut)H-40 : Drainage at 400 (three cut)H-45 : Drainage at 450 (three cut)H-50 : Drainage at 500 (three cut)H-60 : Drainage at 600 (three cut)

99
in the 450 inclined angle media having the highest quality factor. The filter geometries
developed with nonwoven drainage channel indicate slightly lower quality factor as
compared to the respective filter geometries developed by incorporating woven drainage
channels. This is because the nonwoven drainage channel incorporated filter geometries
indicate higher pressure drop and higher saturation corresponding to their woven
counterparts.
6.2.4 Saturation
Average saturation of all the filter geometries in horizontal and vertical
orientation is calculated using Eq. 6.4. Filter geometries are plotted against the saturation
in Figure 6.34 in the similar manner as Figure 6.3.
Figure 6.34 Saturation of filter geometries with polypropylene nonwoven drainage
channels.
0.37
0.24
0.17
0.33
0.30.28
0.36
0.32
0.25
0.3
0.340.32
0.29 0.3 0.3
0.37
0.26
0.14
0.35 0.35
0.250.26
0
0.05
0.1
0.15
0.2
0.25
0.3
0.35
0.4
H-N H-I H-M H-O H-B . H-0 H-15 H-30 H-40 H-45 H-50 H-60 V-N V-I V-M V-O V-B . V-0 V-15 V-30 V-45 V-60 .
Satu
ratio
n
Filter Geometry
H-HORIZONTAL ORIENTATIONH-N : No drainage channelH-I : Inlet drainage channelH-M : Middle drainage channelH-O : Outlet drainage channelH-B : Drainage channel at Both ends
V-VERTICAL ORIENTATIONV-N : No drainage channelV-I : Inlet drainage channelV-M : Middle drainage channelV-O : Outlet drainage channelV-B : Drainage channel at Both ends
V-VERTICAL ORIENTATIONV-0 : Drainage at 00 (three cut)V-15 : Drainage at 150 (three cut)V-30 : Drainage at 300 (three cut)V-45 : Drainage at 450 (three cut)V-60 : Drainage at 600 (three cut)
H-HORIZONTAL ORIENTATIONH-0 : Drainage at 00 (three cut)H-15 : Drainage at 150 (three cut)H-30 : Drainage at 300 (three cut)H-40 : Drainage at 400 (three cut)H-45 : Drainage at 450 (three cut)H-50 : Drainage at 500 (three cut)H-60 : Drainage at 600 (three cut)

100
All the filter geometries in the horizontal as well as vertical orientation indicate
lower saturation and higher drainage as compared to the experimental control. Inlet,
outlet and both-end drainage channel filter media in horizontal orientation indicate higher
capture efficiencies, higher drainage and lower saturation than the experimental control.
The both-end-drainage channel filter media in the horizontal orientation indicate
significantly lower saturation and higher quality factor as compared to the experimental
control. The 450 downward inclined angle filter geometry indicate lowest saturation and
hence the filter media indicate significantly lower pressure drop. This filter geometry
indicates capture efficiency of 93 %. It indicates that the drainage channels incorporated
at 450 downward inclination help in draining the bigger coalesced drops faster from the
filter media. Hence this filter media has lower saturation and the filter can remain porous
for longer time with high capture efficiency which increases filter life. As shown in
Figure 6.10, in the middle of the medium the saturation is normally lower than at the
boundaries and insertion of the drainage channel at this location does not significantly
change the saturation.
Inlet and both-end drainage channel filter geometries in vertical orientation
indicate lower capture efficiencies, drainage and relatively higher saturation. The inclined
angle filter geometries in vertical orientation also indicate lower capture efficiency, lower
drainage but higher saturations which indicate these filter geometries do not drain the
droplets effectively from the filter media. Hence the filter media gets loaded with the
droplets faster and becomes less porous. So there are less pores remaining in the filter to
capture droplets and hence the filter media indicate lower capture efficiencies.

101
Nonwoven drainage channel incorporated filter geometries indicate higher
saturation, hence higher pressure drop and lower quality factor. The possible reason could
be these drainage channels have smaller pores and a pore size distribution as compared to
the woven drainage channels. Hence some of the bigger drops might not be draining
efficiently due to the small pore sizes of the drainage channels. Hence these filters
indicate slightly higher average saturation as compared to the average saturation of the
filter geometries developed by incorporating woven drainage channels.
Figure 6.35 indicate a strong connection between the quality factor and saturation.
Higher quality factor correspond to lower saturation. The 450 media indicate lowest
saturation and highest quality factor. The second best performance is indicated by the no-
drainage channel filter media in vertical orientation which indicate higher saturation than
the 450 media in horizontal orientation. To understand the effect of drainage structures on
the performance of the filter media qualitatively, these filters were dissected. It was
observed that the drainage channel equipped filter media had a more uniform oil
distribution with less oil concentrated at the bottom of the filter media similar to the filter
geometries developed by incorporating woven drainage channels. The filter geometries
developed with nonwoven drainage channels indicate similar trends in terms of filter
media performance as indicated by the woven drainage channel incorporated filter
geometries. The only difference is these filter geometries indicate higher pressure drop
and higher saturation hence slightly lower quality factor compared to respective woven
drainage channel incorporated filter geometries. These experimental results indicate that
to improve the performance of the filter media the woven drainage channels are effective
than the nonwoven drainage channels because of their uniform and bigger pore sizes.

102
Figure 6.35 Quality factor versus average saturation of all filter geometries with
polypropylene nonwoven drainage channels.
6.2.5 Effect of basis weight of drainage channels
Basis weight of the spunbond fabric is related to its pore size. As the basis weight
of the spunbond fabric increases the pore sizes decreases because of more material
addition in the same area. Effect of change in pore sizes of drainage channel is studied by
using different basis weight drainage channels. The different basis weight drainage
channels used are 17, 34, 51 and 68 gsm of spunbond fabric. The basis weight of
polypropylene spunbond fabric and their mean and maximum pore sizes are shown in
table 6.2. Both-end drainage and 450 downward inclination filter geometries were
developed by incorporating the drainage channels of varying basis weight and tested in
horizontal orientation. The performance of the filter geometries is plotted in terms of
450
No-drainage
0.00
0.10
0.20
0.30
0.40
0.50
0.60
0.70
0.80
0 0.05 0.1 0.15 0.2 0.25 0.3 0.35 0.4
Qua
lity
Fact
or (1
/kPa
)
Saturation
Horizontal Horizontal-angle Vertical Vertical-angle

103
capture efficiency, pressure drop, quality factor and saturation as shown in Figure 6.36,
6.37, 6.38 and 6.39 respectively.
Table 6.2 Pore sizes of polypropylene spunbond fabric [88].
Sr. No. Basis weigh of polypropylene
spunbond fabric (gsm)
Pore size (µm)
Mean pore size Maximum pore size
1. 17 135 230
2. 34 110 190
3. 51 60 100
4. 68 30 60
Figure 6.36 Capture efficiency of filter geometries for varying basis weight of
polypropylene spunbond fabric.
98.63
93.16
98.58
92.11
98.50
92.01
98.47
91.18
86.00
88.00
90.00
92.00
94.00
96.00
98.00
100.00
17 34 51 68 (H-B)
17 34 51 68 (H-45)
Eff
icie
ncy
(%)
Filter Geometry
H-HORIZONTAL ORIENTATION
H-B: Drainage channel at Both ends H-45: Drainage at 450 (three cut)

104
Figure 6.37 Pressure drop of filter geometries for varying basis weight of polypropylene
spunbond fabric.
Figure 6.38 Quality factor of filter geometries for varying basis weight of polypropylene
spunbond fabric.
10.66
5.32
10.76
5.67
10.98
6.11
11.28
6.89
0.00
2.00
4.00
6.00
8.00
10.00
12.00
14.00
17 34 51 68 (H-B)
17 34 51 68 (H-45)
Pres
sure
Dro
p (1
/kPa
)
Filter Geometry
H-HORIZONTAL ORIENTATION
H-B: Drainage channel at Both ends H-45: Drainage at 450 (three cut)
0.42
0.76
0.41
0.73
0.41
0.71
0.37
0.68
0.00
0.10
0.20
0.30
0.40
0.50
0.60
0.70
0.80
0.90
17 34 51 68 (H-B)
17 34 51 68 (H-45)
Qua
lity
Fact
or (1
/kPa
)
Filter GeometryH-HORIZONTAL ORIENTATION
H-B: Drainage channel at Both ends H-45: Drainage at 450 (three cut)
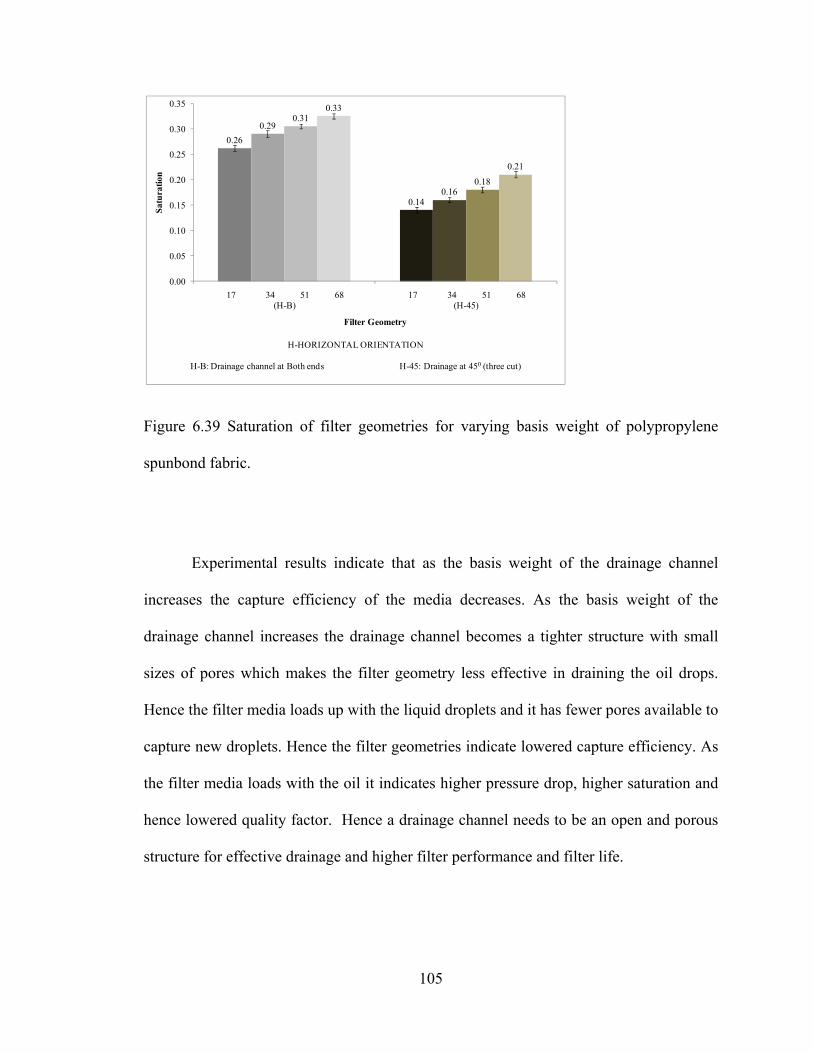
105
Figure 6.39 Saturation of filter geometries for varying basis weight of polypropylene
spunbond fabric.
Experimental results indicate that as the basis weight of the drainage channel
increases the capture efficiency of the media decreases. As the basis weight of the
drainage channel increases the drainage channel becomes a tighter structure with small
sizes of pores which makes the filter geometry less effective in draining the oil drops.
Hence the filter media loads up with the liquid droplets and it has fewer pores available to
capture new droplets. Hence the filter geometries indicate lowered capture efficiency. As
the filter media loads with the oil it indicates higher pressure drop, higher saturation and
hence lowered quality factor. Hence a drainage channel needs to be an open and porous
structure for effective drainage and higher filter performance and filter life.
0.26
0.14
0.29
0.16
0.31
0.18
0.33
0.21
0.00
0.05
0.10
0.15
0.20
0.25
0.30
0.35
17 34 51 68 (H-B)
17 34 51 68 (H-45)
Satu
ratio
n
Filter Geometry
H-HORIZONTAL ORIENTATION
H-B: Drainage channel at Both ends H-45: Drainage at 450 (three cut)

106
6.2.6 Performance comparison of filter geometries developed with woven and nonwoven
drainage channels
The improvement in quality factor is quantified by the relative quality factor
(RQF) and is calculated by using Eq. 6.5. RQF of all the filter geometries developed by
incorporating nonwoven drainage channels and no-drainage channel filter media both in
horizontal orientation and vertical orientation are shown in Figure 6.40. The horizontal
no-drainage channel filter media is the experimental control. This plot is plotted in
similar manner as Figure 6.3.
All of the filter geometries in the horizontal orientation with drainage channels
had increased RQF compared to the control. Filter media equipped with three equally
spaced drainage channels in horizontal orientation at angles of 150, 300, 400, 450, 500, and
600 had increased relative quality factor with the 450 inclined angle media having the
greatest RQF and lowest saturation. Outlet-drainage and both-end drainage in vertical
orientation indicate improved RQF. These filter geometries also indicate lower saturation.
The inclined angle experiments in vertical orientation did not show improvement in
relative quality factor.

107
Figure 6.40 Relative Quality Factor of filter geometry with polypropylene nonwoven
drainage channels in both horizontal and vertical orientation.
Performance comparison of filter geometries developed with woven and
nonwoven drainage channels is indicated in terms of RQF as shown in Figure 6.41. The
nonwoven drainage channel incorporated filter geometries indicate improved quality
factor as compared to the experimental control but indicated lower quality factor as
compared to the respective filter geometries developed by incorporating woven drainage
channels. The possible reason behind this could be the smaller pores and non-uniform
pore size distribution is not efficient as compared to the bigger size pores as well as a
regular structure of the woven drainage channels resulting in similar size pores. Hence
the nonwoven drainage channel incorporated filter geometries indicate higher saturation
hence higher pressure drop and lower quality factor compared to woven drainage channel
1.00
0.65
2.61
0.81
1.90
1.57
0.83
0.08
1.01
1.36
0.380.11
1.90
1.011.19
0.28
2.28
4.22
1.11
0.73
1.52 1.41
0.00
0.50
1.00
1.50
2.00
2.50
3.00
3.50
4.00
4.50
H-N H-I H-M H-O H-B . H-0 H-15 H-30 H-40 H-45 H-50 H-60 V-N V-I V-M V-O V-B . V-0 V-15 V-30 V-45 V-60 .
Rel
ativ
e Q
ualit
y Fc
ator
(RQ
F)
Filter Geometry
H-HORIZONTAL ORIENTATIONH-N : No drainage channelH-I : Inlet drainage channelH-M : Middle drainage channelH-O : Outlet drainage channelH-B : Drainage channel at Both ends
V-VERTICAL ORIENTATIONV-N : No drainage channelV-I : Inlet drainage channelV-M : Middle drainage channelV-O : Outlet drainage channelV-B : Drainage channel at Both ends
H-HORIZONTAL ORIENTATIONH-0 : Drainage at 00 (three cut)H-15 : Drainage at 150 (three cut)H-30 : Drainage at 300 (three cut)H-40 : Drainage at 400 (three cut)H-45 : Drainage at 450 (three cut)H-50 : Drainage at 500 (three cut)H-60 : Drainage at 600 (three cut)
V-VERTICAL ORIENTATIONV-0 : Drainage at 00 (three cut)V-15 : Drainage at 150 (three cut)V-30 : Drainage at 300 (three cut)V-45 : Drainage at 450 (three cut)V-60 : Drainage at 600 (three cut)

108
incorporated filter geometries. Hence these filters will have shorter filter life as compared
to the woven drainage channel incorporated filter geometries. But the nonwoven
spunbond fabric is inexpensive as compared to the woven meshes. Hence developing
filter geometries by incorporating nonwoven drainage channels is a cost effective way of
improving the filter media performance and filter life.
Figure 6.41 RQF of woven and nonwoven drainage channel incorporated filter
geometries in horizontal and vertical orientation.
6.3 Effect of surface wettability of drainage channels
Surface wettability is vital in separating the oil droplets from the air streams. The
wettability of the drainage channels can be varied by using low, intermediate and high
1.00
1.95
1.03
1.95
2.46
0.73
1.63
1.42
1.09
4.28
1.63
1.52
2.61
0.91
0.49
1.23
1.16
0.84
0.13 0.16
0.50
0.89
1.90
1.01
1.90
2.28
0.65
1.57
1.36
1.03
4.22
1.52
1.41
0.83
0.38
1.19
1.11
0.81
0.08 0.11 0.
28
0.73
0.00
0.50
1.00
1.50
2.00
2.50
3.00
3.50
4.00
4.50
H-N H-I H-M H-O H-B H-0 H-15 H-30 H-40 H-45 H-50 H-60 V-N V-I V-M V-O V-B V-0 V-15 V-30 V-45 V-60
Rel
ativ
e Q
ualit
y Fc
ator
(RQ
F)
Filter Geometry
Polypropylene woven drainage channels Polypropylene nonwoven drainage channels
H-HORIZONTAL ORIENTATIONH-N : No drainage channelH-I : Inlet drainage channelH-M : Middle drainage channelH-O : Outlet drainage channelH-B : Drainage channel at Both ends
H-HORIZONTAL ORIENTATIONH-0 : Drainage at 00 (three cut)H-15 : Drainage at 150 (three cut)H-30 : Drainage at 300 (three cut)H-40 : Drainage at 400 (three cut)H-45 : Drainage at 450 (three cut)H-50 : Drainage at 500 (three cut)H-60 : Drainage at 600 (three cut)
V-VERTICAL ORIENTATIONV-0 : Drainage at 00 (three cut)V-15 : Drainage at 150 (three cut)V-30 : Drainage at 300 (three cut)V-45 : Drainage at 450 (three cut)V-60 : Drainage at 600 (three cut)
V-VERTICAL ORIENTATIONV-N : No drainage channelV-I : Inlet drainage channelV-M : Middle drainage channelV-O : Outlet drainage channelV-B : Drainage channel at Both ends

109
surface energy materials. Polypropylene is intermediate wetting material; hence to study
the effect of surface wettability of drainage channels on the performance of the filter
geometries, low surface energy, Teflon®, and high surface energy nylon, were used as
drainage channels. Polypropylene woven and nonwoven drainage channel experiments
indicated highest quality factor for 500 µm pore openings meshes. Hence nylon and
Teflon® meshes of 500 µm pore openings and 600 µm filament thickness were used as
woven drainage channels. Along with the woven meshes nylon spunbond fabric of 17
grams per meter basis weight and nylon-6 nanofibers electrospun on Teflon® mesh were
used as nonwoven drainage channels. Filter geometries developed by incorporating
polypropylene spunbond fabric of 17 grams per meter basis weight indicated highest
quality factor among other basis weight experiments. Hence the nylon spunbond fabric of
17 grams per meter basis weight was used as drainage channels. It has larger pores as
compared to glass fiber filter media. The mean pore size of the 17 grams per meter square
basis weight nylon spunbond fabric is 140 µm while the maximum size of the pore is 220
µm [86]. The nylon electrospun nanofiber on Teflon® mesh has smaller pore opening as
compared to the glass fiber filter media.
Glass is hydrophilic and more oleophilic than nylon, polypropylene and Teflon®.
Nylon is hydrophilic and oleophilic while polypropylene is weak hydrophobic and
oleophobic and Teflon® is hydrophobic and oleophobic. Surface energy of the drainage
channels were evaluated by measuring the Sullube® 32 oil’s contact angle on drainage
channels. Figure 6.42 and 6.43 indicate the contact angle images on nylon,
polypropylene and Teflon® plane surfaces as well as drainage channels. Nylon,
polypropylene and Teflon® were melted on glass slides and the oil contact angle was

110
measured on the plane surface. The oil contact angle was also measured directly on the
drainage channel porous surfaces. The oil contact angle of nylon, polypropylene and
Teflon® plane surfaces were 40, 460 and 950 respectively. The oil contact angle on the
polypropylene and Teflon® woven drainage channels were 760 and 1250. The oil spreads
on the nylon mesh hence it was very difficult to measure the contact angle on nylon
mesh. The contact angle on the mesh was increased as compared to the contact angle on
the plane surface it could be because of formation of the composite surface of air and
polymer material. It can be compared to the Cassie-Baxter case. The Cassie-Baxter case
explains the increase in contact angle due to surface roughness and formation of a
composite surface which is usually made up by trapping the air underneath the roughness
or features of the surface [87].
Figure 6.42 Sullube® 32 oil contact angle on plane surfaces (a) Nylon, (b) Polypropylene
and (c) Teflon®.
b
c
a
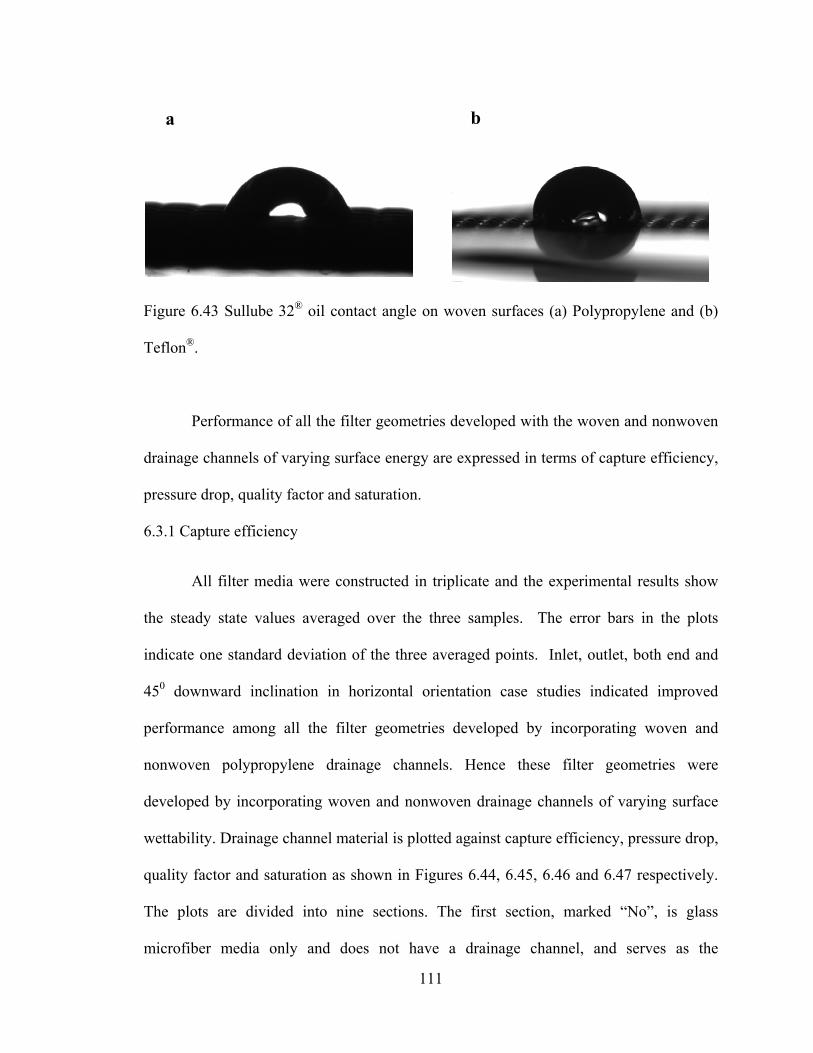
111
Figure 6.43 Sullube 32® oil contact angle on woven surfaces (a) Polypropylene and (b)
Teflon®.
Performance of all the filter geometries developed with the woven and nonwoven
drainage channels of varying surface energy are expressed in terms of capture efficiency,
pressure drop, quality factor and saturation.
6.3.1 Capture efficiency
All filter media were constructed in triplicate and the experimental results show
the steady state values averaged over the three samples. The error bars in the plots
indicate one standard deviation of the three averaged points. Inlet, outlet, both end and
450 downward inclination in horizontal orientation case studies indicated improved
performance among all the filter geometries developed by incorporating woven and
nonwoven polypropylene drainage channels. Hence these filter geometries were
developed by incorporating woven and nonwoven drainage channels of varying surface
wettability. Drainage channel material is plotted against capture efficiency, pressure drop,
quality factor and saturation as shown in Figures 6.44, 6.45, 6.46 and 6.47 respectively.
The plots are divided into nine sections. The first section, marked “No”, is glass
microfiber media only and does not have a drainage channel, and serves as the
a b

112
experimental control. The second and third sections report results for woven meshes of
nylon and Teflon® respectively. The fourth and fifth sections are nylon + Teflon® and
Teflon® + nylon where both nylon and Teflon® woven mesh of 500 µm pore opening are
used as drainage channel with nylon and Teflon® facing the flow respectively. The sixth
and seventh sections are nylon (spundbond) + Teflon® and Teflon® + nylon (spunbond).
These sections show results for nylon spunbond and Teflon® mesh both used as drainage
channels in which nylon and Teflon® facing the flow respectively. The eighth and ninth
sections are nylon (NF) +Teflon® and Teflon® + nylon (NF) respectively. These sections
indicate the performance of filter media equipped with nylon nanofibers electrospun on
Teflon® woven mesh of 500 µm pore opening, used as drainage channels with the nylon
nanofibers facing the incoming flow or the Teflon® facing the incoming flow
respectively. All the drainage channels are 600 µm thick. All the sections on the plot
except the first section have the filter geometries plotted in the order of “Inlet-Drainage”,
“Outlet-Drainage”, “Both-End-Drainage” and 450 downward inclination with three
equally spaced drainage channels respectively.
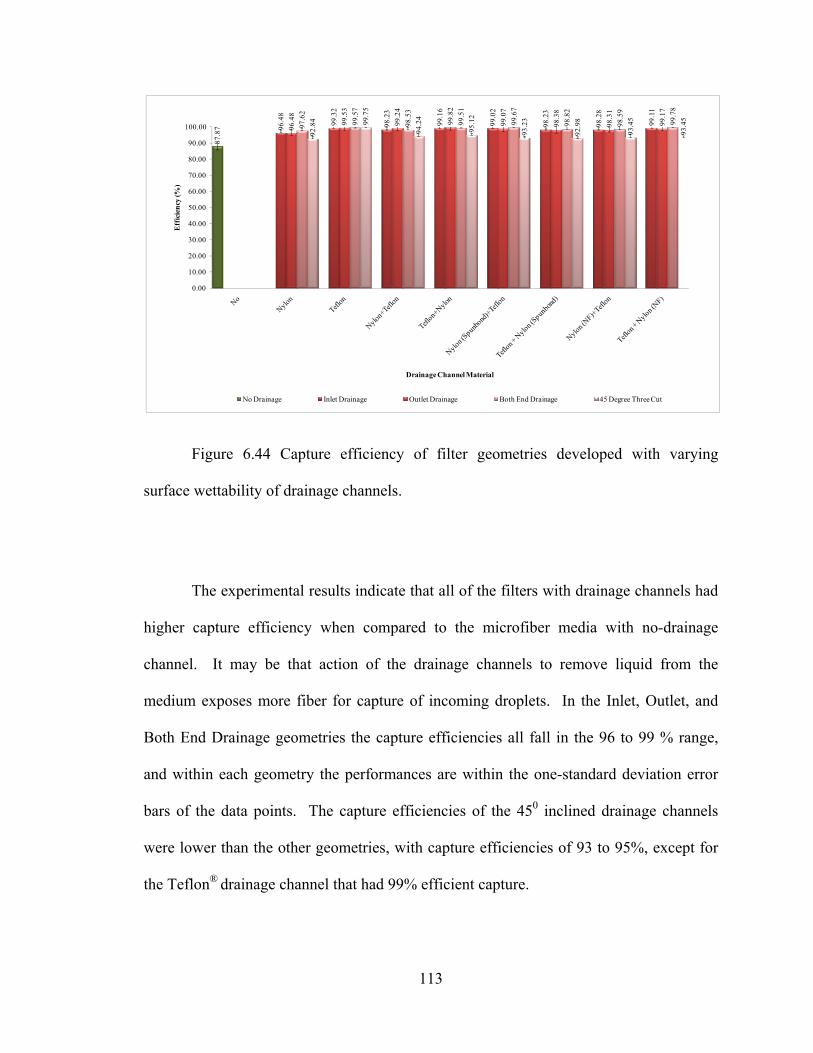
113
Figure 6.44 Capture efficiency of filter geometries developed with varying
surface wettability of drainage channels.
The experimental results indicate that all of the filters with drainage channels had
higher capture efficiency when compared to the microfiber media with no-drainage
channel. It may be that action of the drainage channels to remove liquid from the
medium exposes more fiber for capture of incoming droplets. In the Inlet, Outlet, and
Both End Drainage geometries the capture efficiencies all fall in the 96 to 99 % range,
and within each geometry the performances are within the one-standard deviation error
bars of the data points. The capture efficiencies of the 450 inclined drainage channels
were lower than the other geometries, with capture efficiencies of 93 to 95%, except for
the Teflon® drainage channel that had 99% efficient capture.
87.8
7 96.4
8
99.3
2
98.2
3
99.1
6
99.0
2
98.2
3
98.2
8
99.1
1
96.4
8
99.5
3
99.2
4
99.8
2
99.0
7
98.3
8
98.3
1
99.1
7
97.6
2
99.5
7
98.5
3
99.5
1
99.6
7
98.8
2
98.5
9
99.7
8
92.8
4 99.7
5
94.2
4
95.1
2
93.2
3
92.9
8
93.4
5
93.4
5
0.00
10.00
20.00
30.00
40.00
50.00
60.00
70.00
80.00
90.00
100.00
Eff
icie
ncy
(%)
Drainage Channel Material
No Drainage Inlet Drainage Outlet Drainage Both End Drainage 45 Degree Three Cut
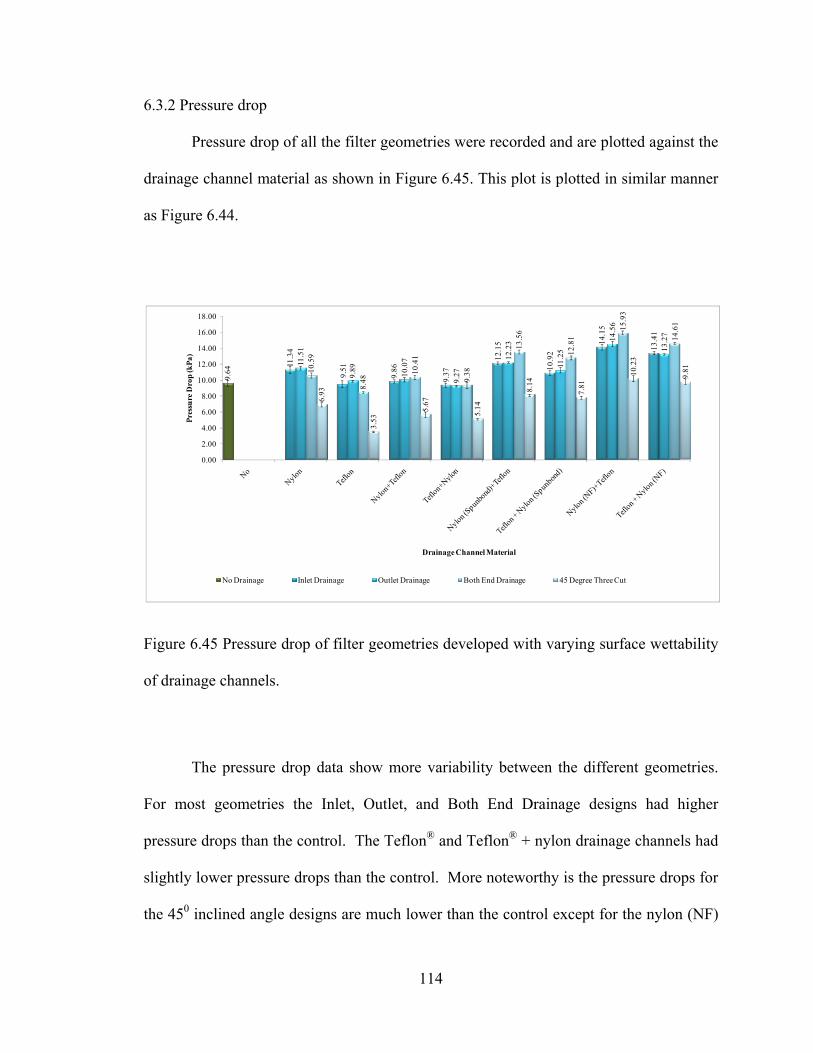
114
6.3.2 Pressure drop
Pressure drop of all the filter geometries were recorded and are plotted against the
drainage channel material as shown in Figure 6.45. This plot is plotted in similar manner
as Figure 6.44.
Figure 6.45 Pressure drop of filter geometries developed with varying surface wettability
of drainage channels.
The pressure drop data show more variability between the different geometries.
For most geometries the Inlet, Outlet, and Both End Drainage designs had higher
pressure drops than the control. The Teflon® and Teflon® + nylon drainage channels had
slightly lower pressure drops than the control. More noteworthy is the pressure drops for
the 450 inclined angle designs are much lower than the control except for the nylon (NF)
9.64
11.3
4
9.51
9.86
9.37
12.1
5
10.9
2
14.1
5
13.4
1
11.5
1
9.89 10.0
7
9.27
12.2
3
11.2
5
14.5
6
13.2
7
10.5
9
8.48
10.4
1
9.38
13.5
6
12.8
1
15.9
3
14.6
1
6.93
3.53
5.67
5.14
8.14
7.81
10.2
3
9.81
0.00
2.00
4.00
6.00
8.00
10.00
12.00
14.00
16.00
18.00
Pres
sure
Dro
p (k
Pa)
Drainage Channel Material
No Drainage Inlet Drainage Outlet Drainage Both End Drainage 45 Degree Three Cut
115
+ Teflon® and the Teflon® + nylon (NF) drainage channels. The exception may be due to
the small pore sizes associated with the nanofiber layer. The mean and maximum pore
size of the nylon (NF) + Teflon® are 0.5 µm and 5 µm respectively. The general trend is
the drainage channels with larger pores and lower surface energy than the control
medium results in lower pressure drop. The lowest pressure drop was obtained for the
450 inclined drainage channels made of Teflon® woven mesh.
6.3.3 Quality factor
The quality factor of all the geometries are plotted against drainage channel
material as shown in Figure 6.46. This plot is plotted in similar manner as Figure 6.44.
This figure shows all drainage channel incorporated filter geometries indicate increased
quality factor compared to the control. Low surface energy Teflon® woven mesh
incorporated filter media indicate higher quality factor for respective geometries as
compared to the high surface energy nylon or intermediate surface energy polypropylene
incorporated filter geometries. The woven drainage channel incorporated filter
geometries have higher quality factor than the nonwoven drainage channel incorporated
filter geometries. As the pore size of the drainage channel decreases the quality factor
decreases. Hence the nylon (NF) + Teflon® and Teflon® + nylon (NF) drainage channel
incorporated filter geometries indicate low quality factor as compared to the big pore
opening woven and nonwoven drainage channels. The 450 filter geometry indicated best
performance in terms of quality factor and saturation in all the experiments but for high
surface energy and smaller pore opening the 450 filter geometry’s performance is
comparable to the other filter geometries (Refer Figure 6.46). One configuration in
particular stands out among all of the others, the Teflon 450 inclined drainage channels.

116
The Teflon 450 inclined drainage channels had a significantly higher quality factor due to
the high capture efficiency and the low pressure drop. This geometry is developed by
incorporating low surface energy and big pore opening drainage channels.
Figure 6.46 Quality factor of filter geometries developed with varying surface wettability
of drainage channels.
These results show that the filter media performance can be enhanced by
incorporating woven low surface energy drainage channels. These drainage channels are
porous and open structures and have low surface energy that enhances liquid drainage
from the filter.
0.18
0.35
0.49
0.38 0.40
0.33
0.34
0.28 0.300.
36
0.52
0.39 0.42
0.34
0.35
0.30 0.320.
38
0.71
0.41 0.
47
0.36
0.37
0.34
0.350.
40
1.60
0.43 0.
54
0.38 0.40
0.37 0.39
0.00
0.20
0.40
0.60
0.80
1.00
1.20
1.40
1.60
1.80
Qua
lity
Fact
or (1
/kPa
)
Drainage Channel Material
No Drainage Inlet Drainage Outlet Drainage Both End Drainage 45 Degree Three Cut

117
6.3.4 Saturation
The average saturation of different filter geometries were calculated by using Eq. 6.4 and
plotted against drainage channel material as shown in Figure 6.47. This plot is plotted in
similar manner as Figure 6.44.
Figure 6.47 Saturation of filter geometries developed with varying surface wettability of
drainage channels.
The saturation data show the saturation levels in all of the filter geometries were
lower than the control. The least saturations occurred for the 450 inclined drainage
channel geometries in each configuration. Comparison of the saturations with the
pressure drops show that in general lower saturation may contribute to a lower pressure
drop but other factors including the drainage channel geometry, surface energies, and
fiber structures are also important.
0.37
0.3
0.25
0.3
0.27
0.34
0.32
0.31
0.290.
305
0.25
0.31
0.27
0.34
0.32
0.3
0.29
0.28
0.2
0.31
0.24
0.3
0.28
0.27
0.26
0.18
0.09
0.18
0.12
0.2
0.18
0.17
0.16
0
0.05
0.1
0.15
0.2
0.25
0.3
0.35
0.4
Satu
ratio
n
Drainage Channel Material
No Drainage Inlet Drainage Outlet Drainage Both End Drainage 45 Degree Three Cut
118
6.3.5 Performance comparison of filter geometries
The improvement in quality factor is quantified by the RQF and is calculated by
using Equation 6.5. RQF of all the filter geometries developed by incorporating woven
and nonwoven drainage channels of varying wettability and no-drainage channel filter
media in horizontal orientation are shown in Figure 6.48. This plot is plotted in similar
manner as Figure 6.44. The horizontal no-drainage channel filter media is the
experimental control. All the filter geometries indicate higher RQF as compared to the
experimental control. The woven mesh incorporated filter geometries indicate higher
RQF as compared to the filter geometries developed with nonwoven drainage channels.
The 450 downward inclination filter geometry indicate higher RQF as compared to other
filter geometries. The Teflon® woven mesh incorporated drainage channels indicate
higher quality factor as compared to the respective filter geometries developed with the
nylon drainage channels. The nylon (NF) + Teflon® indicate lowest quality factor. Nylon
is olephilic and nylon (NF) + Teflon® has smallest pore sizes and being olephilic in
nature the drainage channel has tendency to hold the oil. Hence these filter geometries
indicate higher saturation and lower quality factor. Hence these filters will have lower
filter life as compared to the other filter geometries.

119
Figure 6.48 RQF of filter geometries developed with woven and nonwoven drainage
channels of varying surface wettability.
Experimental results indicate that the filter media equipped with three equally
spaced drainage channels at 450 downward inclination performs better than other inclined
angle experiments. The filter media is 6 cm filter disc with 1.4 cm thickness. For the
inclined angle filter geometries the drainage channels are incorporated in the filter to
keep the filter geometry symmetric and height or the distance between the drainage
channels is decided to get the effect of drainage channels over the entire media height.
1
1.93
2.72
2.11 2.22
1.83
1.89
1.56 1.672.
00
2.88
2.17 2.33
1.89
1.94
1.67 1.782.
11
3.94
2.28 2.
61
2.00 2.11
1.89
1.942.
22
8.89
2.39
3.00
2.11 2.22
2.06 2.17
0
1
2
3
4
5
6
7
8
9
10
Rel
ativ
e Qua
lity
Fact
or (R
QF)
Drainage Channel Material
H-N H-I H-O H-B H-45
H-HORIZONTAL ORIENTATION
H-N : No drainage channel H-I : Inlet drainage channel H-O : Outlet drainage channel H-B : Drainage channel at Both ends H-45 : Drainage at 450 (three cut)

120
Figure 6.49 Height between drainage channels for different angles of the inclined angle
experiments.
The height or distance between the drainage channels is plotted against the angle
in Figure 6.49. Figure 6.49 indicate that the height is maximum for the 450 filter
geometry. Based on the current filter geometry designs of all the inclined angle case
studies, it is difficult to explain why the 450 works better than the other angles. Distance
between the drainage channels contributes to the performance of the filter geometry.
Hence distance between the drainage channels needs to be optimized which will also
allow adding more than three drainage channels to develop new filter geometries. The
addition of more than three drainage channels as well as optimizing the distance between
the drainage channels will help in understanding why 450 filter geometry works better
than other inclined angle filter geometries.
0
0.002
0.004
0.006
0.008
0.01
0.012
0.014
0.016
0.018
0.02
0 10 20 30 40 50 60 70
Hei
ght (
Met
er)
Angle (Degree)
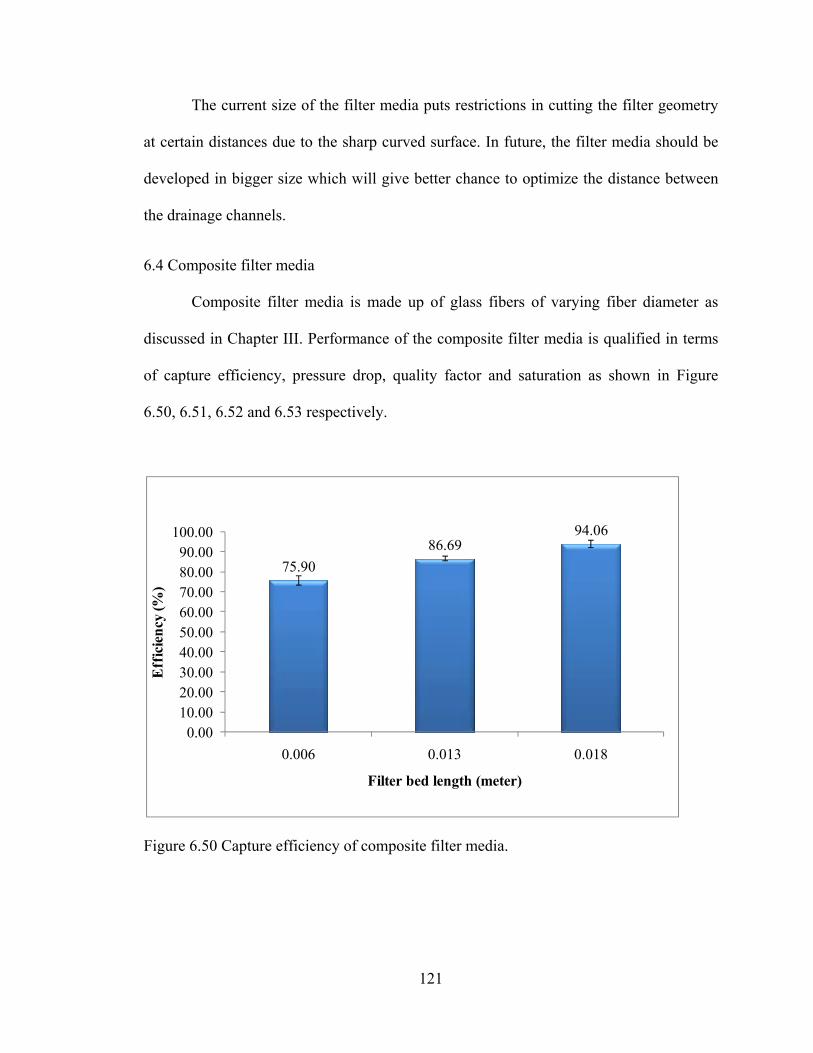
121
The current size of the filter media puts restrictions in cutting the filter geometry
at certain distances due to the sharp curved surface. In future, the filter media should be
developed in bigger size which will give better chance to optimize the distance between
the drainage channels.
6.4 Composite filter media
Composite filter media is made up of glass fibers of varying fiber diameter as
discussed in Chapter III. Performance of the composite filter media is qualified in terms
of capture efficiency, pressure drop, quality factor and saturation as shown in Figure
6.50, 6.51, 6.52 and 6.53 respectively.
Figure 6.50 Capture efficiency of composite filter media.
75.9086.69
94.06
0.0010.0020.0030.0040.0050.0060.0070.0080.0090.00
100.00
0.006 0.013 0.018
Eff
icie
ncy
(%)
Filter bed length (meter)

122
Figure 6.51 Pressure drop of composite filter media.
Figure 6.52 Quality factor of composite filter media.
27.5129.82
37.48
0.005.00
10.0015.0020.0025.0030.0035.0040.0045.00
0.006 0.013 0.018
Pres
sure
Dro
p (k
Pa)
Filter bed length (meter)
0.05
0.120.13
0.00
0.02
0.04
0.06
0.08
0.10
0.12
0.14
0.16
0.006 0.013 0.018
Qua
lity
Fact
or (1
/kPa
)
Filter bed length (meter)

123
Figure 6.53 Saturation of composite filter media.
Experimental results indicate that as the filter bed length of the filter media
increases the capture efficiency, pressure drop and saturation increases. Hence the quality
factor of the filter media decreases. Even the glass fibers exhibit different surface
wettability because of their significantly different way synthesis. To study local
saturation qualitatively the filters were dissected and the filter media indicated that the
fibers of fiber diameter 6 µm being most oleophilic in nature indicated the highest
saturation while the 3 µm fiber diameter fibers indicated less amount of oil saturation as
compared to the 6 µm fiber diameter while the 10 µm and 39 µm indicated no oil
saturation. The filter media was designed with 3 µm fibers facing the air flow followed
by 6 µm, 10 µm and 39 µm fibers. The oil saturation was observed in 3 µm and 6 µm
fiber diameter area of the filter while the 10 µm and 39 µm indicated no oil saturation
hence all the filters indicated significantly high pressure drop as the droplets were not
able to move to the exit boundary and drain from the filter. Hence the filter geometry
0.310.35
0.42
0.00
0.05
0.10
0.15
0.20
0.25
0.30
0.35
0.40
0.45
0.006 0.013 0.018
Satu
ratio
n
Filter bed length (meter)

124
needs to have optimum wettability along with the optimum pore sizes to have efficient oil
drainage from the filter media and to obtain higher performance and higher filter life.
125
CHAPTER VII
NANOFIBER AUGMENTED FILTER GEOMETRIES
7.1 Introduction
Drainage channel incorporated micro glass fiber filter media indicated improved
performance. Filter geometry with three equally spaced drainage channels at 450
downward inclination in horizontal orientation indicated the best performance among all
the filter geometries. These filter geometries indicate significantly low pressure drops
compared to the experimental control with moderate capture efficiencies except the
Teflon® woven drainage channel incorporated filter geometries which indicate 99.75 %
capture efficiency. The capture efficiencies of the nylon and polypropylene woven and
nonwoven drainage channel incorporated filter geometries at 450 downward inclination in
horizontal orientation are in the range of 92-95 % and can be enhanced by adding
nanofibers. By augmenting micro glass fiber media with nanofibers, a wide range of
micron and sub-micron (0.3 to 0.8 micron) droplets can be effectively captured [81]. The
glass fibers, being olephilic and high surface energy material, aids in coalescence hence
high surface energy nanofibers needs to be incorporated in glass fiber media to enhance
the coalescence. Hence nylon nanofibers of varying fiber diameter were incorporated to
enhance the performance of the filter media and the effect of fiber diameter of nanofibers
was studied on the performance of drainage channel incorporated nanofiber augmented
glass fiber filter media. The nanofiber augmented glass fiber filter media making process

126
in discussed in Chapter III. The presence of the nanofibers increases the surface area
available for capture of the droplets but because the diameters are so small the gas phase
“slips” around the fibers and the corresponding increase in pressure drop is not as large as
when micron size fibers are used. The net effect is an increased quality factor with the
use of nanofibers [88-89].
7.2 Electrospinning
Electrospinning is a simple process that uses an electric field to make polymer
nanofibers of submicron and nanometer sizes. In electrospinning, solid fibers of small
diameters are produced as a result of stretching of the electrified jet [90]. Generally, the
suspended drop starts to stretch and form a Taylor cone as a result of an electric field
being applied to the solution [91-93]. A droplet at the tip of the syringe needle, when
electrified, experiences two types of electrostatic forces- the electrostatic repulsion
between the surface charges and the Coulombic force by external electric field [92]. The
distortion of this solution drop is caused by the balance of the repulsive forces induced on
the drop due to the charge distribution and the surface tension of the liquid. When the
voltage reaches a critical value, the electric force overcomes the surface tension and
viscoelastic forces of the deformed drop in the suspended polymer solution formed at the
tip of the syringe [93, 94]. Then a jet can be produced. The electrified jet undergoes
stretching and bending, eventually forming into a continuous thread. After the jet travels
through the air, the polymer fibers are produced by the evaporation of the solvent and are
collected at an electrically grounded target. The surface morphology of the electrospun
fiber is affected by many parameters, such as the polymer concentration, applied voltage,
spinning distance, air friction, gravity, temperature, and ambient parameters [91-99]. In

127
electrospinning, the spinning of fibers is achieved largely by the charges placed on the jet
by the applied field, which move with the jet.
7.2.1 Electrospinning setup
The schematic and lab scale setup of electrospinning process is shown in Figure
7.1 and 7.2 respectively.
The electrospinning setup mainly consists of a syringe, a high voltage power
supply and a collector. The polymer is usually dissolved in suitable solvent. Nanofibers
in the range of 10 to 2000 nm diameter can be achieved by choosing the appropriate
polymer solvent system [89, 100]. The syringe is filled with the polymer solution. A
syringe pump is used to pump the solution at a constant flow rate. The polymer solution
is electrified by applying a high voltage, usually in the range of 1-30 kV. The fibers are
deposited onto a collector which is grounded. The diameter of the deposited fiber can be
controlled through electrospinning parameters like solution viscosity, applied voltage,
distance between the syringe needle tip and collector surface and many others [92].

128
Figure 7.1 Schematic of single jet electrospinning.
Figure 7.2 Lab scale set up of single jet electrospinning.
Syringe pump
Grounded collector High voltage supply
Needle
High voltage terminal Syringe
Teflon® tubing connecting syringe and needle
129
7.2.2 NanospiderTM
NanospiderTM is a patented, needle-less, high voltage, free liquid surface
electrospinning process enabling the production of nanofibers on an industrial scale
[101]. NanospiderTM technology allows the production of nanofibers from polymers
dissolved in water, acids or bipolar solvents as well as from melted polymers and is
suitable for the production of organic and inorganic fibers of differing diameters from
nanometer to micrometer [102]. This technology is modular and versatile in nature and
can be easily adapted to optimize specific properties of the produced nanofibers [102].
Nanospider’sTM free liquid surface electrospinning allows higher fiber packing density
and thus an increased productivity as well as better fiber homogeneity and more
consistent web morphology.
7.2.2.1 Principle of NanospiderTM technology
The principle of NanospiderTM is based on the discovery that it is possible to
create multiple Taylor Cones from a thin layer of polymer solution [103]. So, unlike other
methods, NanospiderTM uses a cylinder, not nozzles or capillaries, to form the fibers. The
cylinder is partially immersed in the polymer solution, and, as it rotates, a defined amount
of the polymer solution is carried to the top part of the cylinder where Taylor Cones are
formed and the multiple jets immerging from multiple Taylor Cones produces the
nanofibers. The Taylor Cones are formed next to each other, throughout the entire length
of the cylinder, resulting in the high production capacity of Nanospider’sTM spinning
head. The streams or jets of polymer solutions become solid nanofibers as the solvent
evaporates and the nanofibers are collected on the opposite collecting electrode. It is free

130
liquid surface electrospinning that allows the electric field to optimize the distance
between Taylor cones. NanospiderTM technology allows optimizing the solution
parameters (conductivity, temperature, surface tension, etc.) as well as the equipment
parameters (voltage, electrode distance, etc.). Advantages of this technology are top
quality of nanofibers and homogeneity of fiber web, ability to control the fiber diameters,
its mechanical simplicity and high throughput. Lab scale NanospiderTM equipment is
shown in Figure 7.3. The wire electrode used to electrospin nylon nanofibers is shown in
Figure 7.4. The wire electrodes have equally spaced 12 stainless steel wires of diameter
0.0002 meter. This electrode can be used to make nanofibers which needs acids as
solvents. The solution bath in which the electrode can be placed is made up of
polypropylene hence a solvent which dissolves polypropylene cannot be used as well as
polypropylene nanofibers cannot be produced using the machine.

131
Figure 7.3 Lab scale NanospiderTM module.
Figure 7.4 Wire electrode and solution bath.
Solution bath
Wire electrode
Top electrode
Bottom electrode immersed in solution bath
Electrode rotation control
Voltage control
Distance between the electrodes
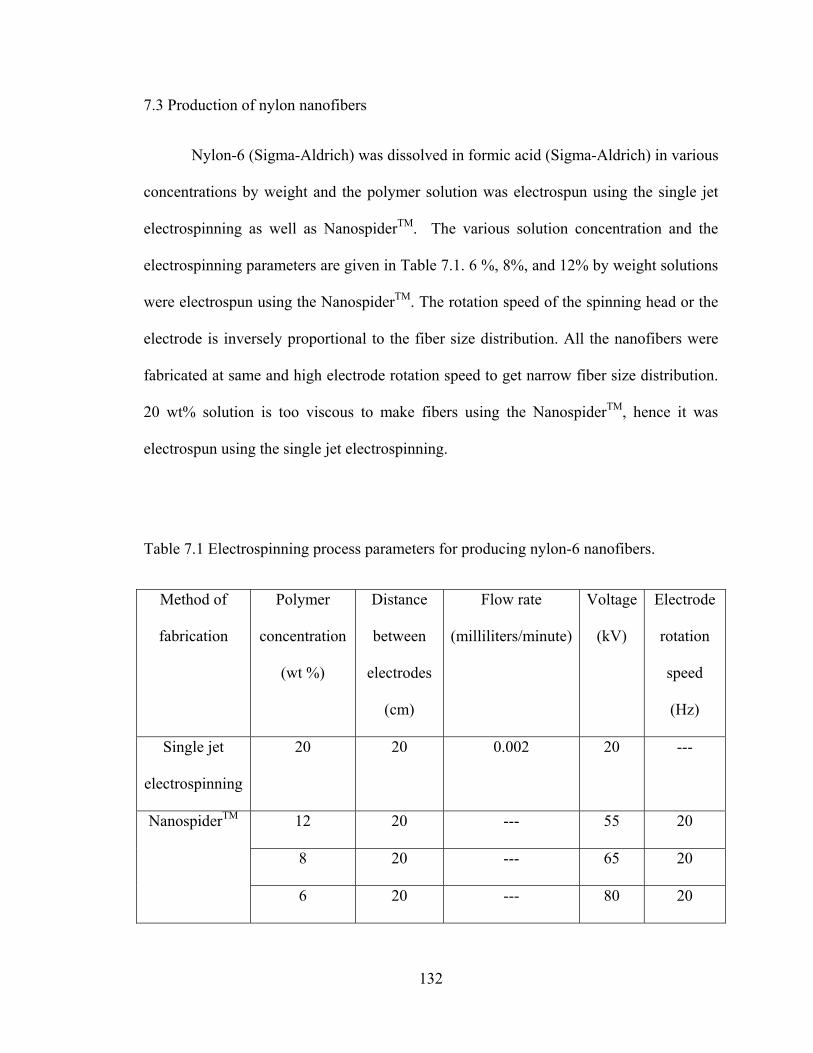
132
7.3 Production of nylon nanofibers
Nylon-6 (Sigma-Aldrich) was dissolved in formic acid (Sigma-Aldrich) in various
concentrations by weight and the polymer solution was electrospun using the single jet
electrospinning as well as NanospiderTM. The various solution concentration and the
electrospinning parameters are given in Table 7.1. 6 %, 8%, and 12% by weight solutions
were electrospun using the NanospiderTM. The rotation speed of the spinning head or the
electrode is inversely proportional to the fiber size distribution. All the nanofibers were
fabricated at same and high electrode rotation speed to get narrow fiber size distribution.
20 wt% solution is too viscous to make fibers using the NanospiderTM, hence it was
electrospun using the single jet electrospinning.
Table 7.1 Electrospinning process parameters for producing nylon-6 nanofibers.
Method of
fabrication
Polymer
concentration
(wt %)
Distance
between
electrodes
(cm)
Flow rate
(milliliters/minute)
Voltage
(kV)
Electrode
rotation
speed
(Hz)
Single jet
electrospinning
20 20 0.002 20 ---
NanospiderTM 12 20 --- 55 20
8 20 --- 65 20
6 20 --- 80 20

133
Figure 7.5 SEM images of nylon nanofibers (a) 6 wt% (b) 8 wt% (c) 12 wt% (d) 20 wt%.
The fiber diameters of the nanofibers were measured using ImageJ software from
the Scanning Electron Microscope (SEM) images. The SEM images of the fibers are
given in Figure 7.5. Figure 7.5 indicate that as the concentration of the polymer increases
the fiber size increases. 6 wt%, 8 wt%, 12 wt%, and 20 wt% nylon solution can produce
100 nanometer (nm), 150 nm, 300 nm and 600 nm size nylon fibers. The nanofiber
augmented micro glass fiber filter media were developed by adding 100, 300 and 600
nanometer size nanofibers in the glass fibers proportionally by keeping the area ratio of
nanofibers to micro glass fiber as one. The amount of nanofiber added to the glass fiber
a b
c d
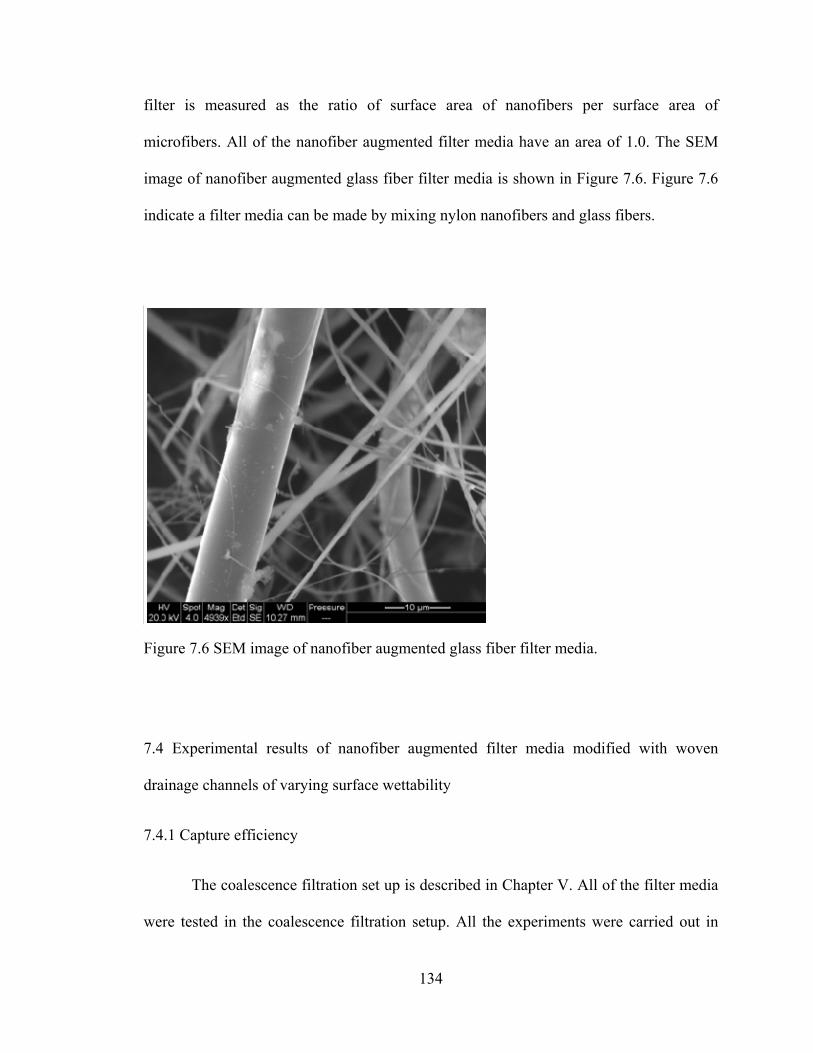
134
filter is measured as the ratio of surface area of nanofibers per surface area of
microfibers. All of the nanofiber augmented filter media have an area of 1.0. The SEM
image of nanofiber augmented glass fiber filter media is shown in Figure 7.6. Figure 7.6
indicate a filter media can be made by mixing nylon nanofibers and glass fibers.
Figure 7.6 SEM image of nanofiber augmented glass fiber filter media.
7.4 Experimental results of nanofiber augmented filter media modified with woven
drainage channels of varying surface wettability
7.4.1 Capture efficiency
The coalescence filtration set up is described in Chapter V. All of the filter media
were tested in the coalescence filtration setup. All the experiments were carried out in
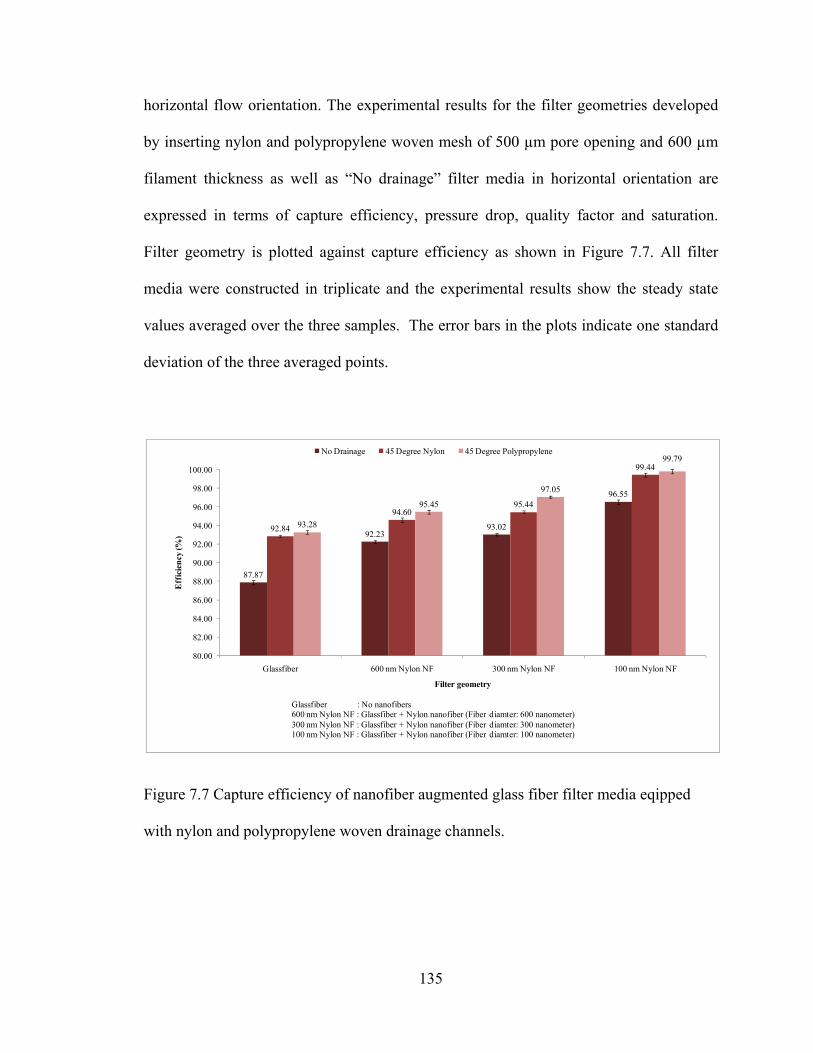
135
horizontal flow orientation. The experimental results for the filter geometries developed
by inserting nylon and polypropylene woven mesh of 500 µm pore opening and 600 µm
filament thickness as well as “No drainage” filter media in horizontal orientation are
expressed in terms of capture efficiency, pressure drop, quality factor and saturation.
Filter geometry is plotted against capture efficiency as shown in Figure 7.7. All filter
media were constructed in triplicate and the experimental results show the steady state
values averaged over the three samples. The error bars in the plots indicate one standard
deviation of the three averaged points.
Figure 7.7 Capture efficiency of nanofiber augmented glass fiber filter media eqipped
with nylon and polypropylene woven drainage channels.
87.87
92.2393.02
96.55
92.84
94.6095.44
99.44
93.28
95.45
97.05
99.79
80.00
82.00
84.00
86.00
88.00
90.00
92.00
94.00
96.00
98.00
100.00
Glassfiber 600 nm Nylon NF 300 nm Nylon NF 100 nm Nylon NF
Eff
icie
ncy
(%)
Filter geometry
No Drainage 45 Degree Nylon 45 Degree Polypropylene
Glassfiber : No nanofibers 600 nm Nylon NF : Glassfiber + Nylon nanofiber (Fiber diamter: 600 nanometer)300 nm Nylon NF : Glassfiber + Nylon nanofiber (Fiber diamter: 300 nanometer)100 nm Nylon NF : Glassfiber + Nylon nanofiber (Fiber diamter: 100 nanometer)

136
The plot is divided in four sections. The first section is only glass fiber filter
media without any nanofibers. Second, third and fourth sections are glass fiber filter
media augmented with nanofibers of fiber diameter 600 nm, 300 nm and 100 nm
respectively. In all the section the filter geometries are plotted in the order of no-drainage,
450 downward inclination with three equally spaced nylon woven drainage channels and
450 downward inclination with three equally spaced polypropylene woven drainage
channels respectively. The no drainage channel glass fiber filter media is the
experimental control.
The no-drainage channel filter media augmented with nanofibers indicate a
capture efficiency of 90-96 % which is improved from 87% for a no nanofiber filter
media. Experimental results indicate that all the filters augmented with oleophilic nylon
nanofibers indicate improved capture efficiency as compared to the experimental control.
As the fiber diameter of the nanofiber decreases, the capture efficiency of the filters
increases, with the 100 nanometer nylon nanofiber incorporated filter media indicating
the highest capture efficiency among all no drainage channel incorporated filter media.
The nylon and polypropylene woven mesh incorporated at 450 downward inclination
filter geometries indicated improved capture efficiency compared to the experimental
control as well as no drainage channel nanofiber augmented filter media. The filter
geometries with polypropylene woven drainage channels at 450 indicate higher capture
efficiency than the nylon woven drainage channel incorporated filter geometries. As the
fiber diameter of the nanofibers decreases, the capture efficiency of the both the nylon
and polypropylene incorporated filter geometries increases. 100 nm nylon nanofiber
augmented filter media equipped with woven polypropylene drainage channels at 450

137
downward inclination indicated highest capture efficiency and the same filter geometry
augmented with nylon woven drainage channels indicated second best capture efficiency.
7.4.2 Pressure drop
Pressure drop of the all the drainage channel incorporated filter media as well as
no drainage channel filter media were recorded. Filter geometries are plotted against
pressure drop as shown in Figure 7.8. This plot is obtained by plotting pressure drop
against filter geometries in similar manner as Figure 7.7. All filter media were
constructed in triplicate and the experimental results show the steady state values
averaged over the three samples. The error bars in the plots indicate one standard
deviation of the three averaged points.
Figure 7.8 Pressure drop of nanofiber augmented glass fiber filter media equipped with
nylon and polypropylene woven drainage channels.
9.64
20.67
16.34
11.52
6.93
10.248.49
7.09
4.68
8.587.43
6.47
0.00
5.00
10.00
15.00
20.00
25.00
Glassfiber 600 nm Nylon NF 300 nm Nylon NF 100 nm Nylon NF
Pres
sure
Dro
p (k
Pa)
Filter geometry
No Drainage 45 Degree Nylon 45 Degree Polyproylene
Glassfiber : No nanofibers 600 nm Nylon NF : Glassfiber + Nylon nanofiber (Fiber diamter: 600 nanometer)300 nm Nylon NF : Glassfiber + Nylon nanofiber (Fiber diamter: 300 nanometer)100 nm Nylon NF : Glassfiber + Nylon nanofiber (Fiber diamter: 100 nanometer)
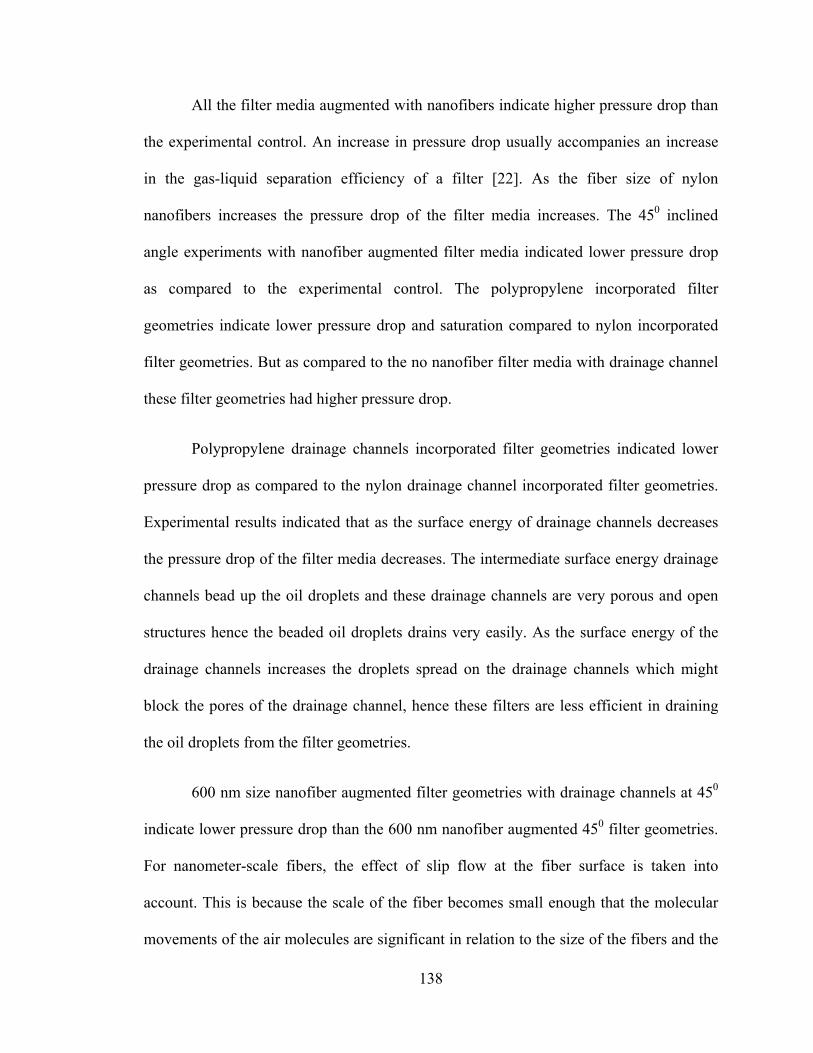
138
All the filter media augmented with nanofibers indicate higher pressure drop than
the experimental control. An increase in pressure drop usually accompanies an increase
in the gas-liquid separation efficiency of a filter [22]. As the fiber size of nylon
nanofibers increases the pressure drop of the filter media increases. The 450 inclined
angle experiments with nanofiber augmented filter media indicated lower pressure drop
as compared to the experimental control. The polypropylene incorporated filter
geometries indicate lower pressure drop and saturation compared to nylon incorporated
filter geometries. But as compared to the no nanofiber filter media with drainage channel
these filter geometries had higher pressure drop.
Polypropylene drainage channels incorporated filter geometries indicated lower
pressure drop as compared to the nylon drainage channel incorporated filter geometries.
Experimental results indicated that as the surface energy of drainage channels decreases
the pressure drop of the filter media decreases. The intermediate surface energy drainage
channels bead up the oil droplets and these drainage channels are very porous and open
structures hence the beaded oil droplets drains very easily. As the surface energy of the
drainage channels increases the droplets spread on the drainage channels which might
block the pores of the drainage channel, hence these filters are less efficient in draining
the oil droplets from the filter geometries.
600 nm size nanofiber augmented filter geometries with drainage channels at 450
indicate lower pressure drop than the 600 nm nanofiber augmented 450 filter geometries.
For nanometer-scale fibers, the effect of slip flow at the fiber surface is taken into
account. This is because the scale of the fiber becomes small enough that the molecular
movements of the air molecules are significant in relation to the size of the fibers and the

139
flow field. The Knudsen number is used to describe the importance of the molecular
movements of air molecules at the fiber surface to the overall flow field. The Knudsen
number can be written as
(7.1)
where “λ” is the gas mean free path (the dimension of the non-continuous nature of the
molecules), and Rf is the mean radius of the fibers. Slip flow generally needs to be
considered when Kn > 0.1. Slip flow definitely needs to be considered when Kn is around
0.25 [11]. For air at standard conditions, the mean free path is 0.066 µm; therefore, for
fibers with diameters smaller than 0.5 µm, slip flow must be considered. In slip flow, the
air velocity at the fiber surface is assumed to be non-zero. Due to the slip at the fiber
surface, drag force on a fiber is smaller than that in the case of non-slip flow, which
translates into lower pressure drop [88]. Hence glass fiber filter media augmented with
100 nm and 300 nm nanofibers indicate moderate increase in pressure drop while the
filter media developed by augmenting 600 nm nanofiber indicate significantly high
pressure drops.
7.4.3 Quality factor
Quality factor of the all the drainage channel incorporated filter media as well as
no drainage channel filter media are calculated using Equation 6.1 and plotted against
filter geometry as shown in Figure 7.9.

140
Figure 7.9 Quality factor of nanofiber augmented glass fiber filter media equipped with
nylon and polypropylene woven drainage channels.
This plot is obtained by plotting quality factor against filter geometries in similar
manner as Figure 7.1. Nanofiber incorporated no drainage channel filter media indicate
improved performance compared to the experimental control. As the fiber size of the
nanofiber decreases the quality factor of the filter media increases. The smaller nanofiber
incorporated filter media indicate significantly higher capture efficiency as compared to
the experimental control but, because of the slip flow condition, the pressure drop of the
filter media increases moderately. The 450 nanofiber augmented filter geometry indicated
significantly higher quality factor as compared to experimental control. As compared to
0.18 0.19 0.23
0.370.40 0.41 0.43
0.690.77 0.78 0.82
1.24
0.00
0.20
0.40
0.60
0.80
1.00
1.20
1.40
Glassfiber 600 nm Nylon NF 300 nm Nylon NF 100 nm Nylon NF
Qua
lity
Fact
or (1
/kPa
)
Filter geometry
No Drainage 45 Degree Nylon 45 Degree Polypropylene
Glassfiber : No nanofibers 600 nm Nylon NF : Glassfiber + Nylon nanofiber (Fiber diamter: 600 nanometer)300 nm Nylon NF : Glassfiber + Nylon nanofiber (Fiber diamter: 300 nanometer)100 nm Nylon NF : Glassfiber + Nylon nanofiber (Fiber diamter: 100 nanometer)

141
the nylon the polypropylene woven drainage channel incorporated filter media indicate
significantly high quality factor.
7.4.4 Saturation
Saturation of the filter geometries and the no drainage channel filter media are
calculated using Eq. 6.4 and plotted in Figure 7.10. This plot is obtained by plotting
saturation against filter geometries in similar manner as Figure 7.1.
Figure 7.10 Saturation of nanofiber augmented glass fiber filter media incorporated with
nylon and polypropylene woven drainage channels.
Nanofiber augmented no drainage channel filter geometries indicate higher
saturation and lower drainage as compared to the experimental control. It is because
0.37
0.410.39 0.38
0.18
0.22 0.210.19
0.120.15 0.14 0.13
0.00
0.05
0.10
0.15
0.20
0.25
0.30
0.35
0.40
0.45
Glassfiber 600 nm Nylon NF 300 nm Nylon NF 100 nm Nylon NF
Satu
ratio
n
Filter geometry
No Drainage 45 Degree Nylon 45 Degree Polypropylene
Glassfiber : No nanofibers 600 nm Nylon NF : Glassfiber + Nylon nanofiber (Fiber diamter: 600 nanometer)300 nm Nylon NF : Glassfiber + Nylon nanofiber (Fiber diamter: 300 nanometer)100 nm Nylon NF : Glassfiber + Nylon nanofiber (Fiber diamter: 100 nanometer)

142
nylon nanofibers are oleophilic in nature and augmenting the filter media with nanofibers
indicated higher capture efficiency. As the fiber size of nanofiber increases the saturation
of the filter media increases. The same trend is observed for the pressure drop. The nylon
drainage channel incorporated nanofiber augmented filter media indicate significantly
lower saturation as compared to the experimental control.
The polypropylene incorporated filter geometries indicated significantly lower
saturation as compared to the nylon incorporated drainage channels as well as no
drainage channel filter media. The polypropylene incorporated filter media indicate lower
pressure drop as compared to the nylon as well as no drainage channel filter media. To
understand the effect of drainage structures on the performance of the nanofiber
augmented filter media qualitatively, the filters were dissected. The filters without
drainage channels had higher liquid saturations at the bottom of the media plus the
saturation was higher at the inlet and outlet surfaces compared to the middle of the media.
Filter media equipped with three equally spaced drainage channels at 450 downward
angle had more or less uniform distribution of liquid with a very small region of high
saturation at the bottom. This is likely the reason for the lower pressure drop of these
filter media. The higher saturation of the nanofiber augmented filter could be the
oleophilic nature of nanofibers. These filters also indicated higher capture efficiencies
and hence higher pressure drop as compared to the no nanofiber filter media. The plot in
Figure 7.11 shows there is a strong connection between saturation and quality factor
regardless of the drainage channel geometric structure. All the filter geometries equipped
with intermediate surface energy polypropylene incorporated filter geometries indicate
higher quality factor and lower saturation.
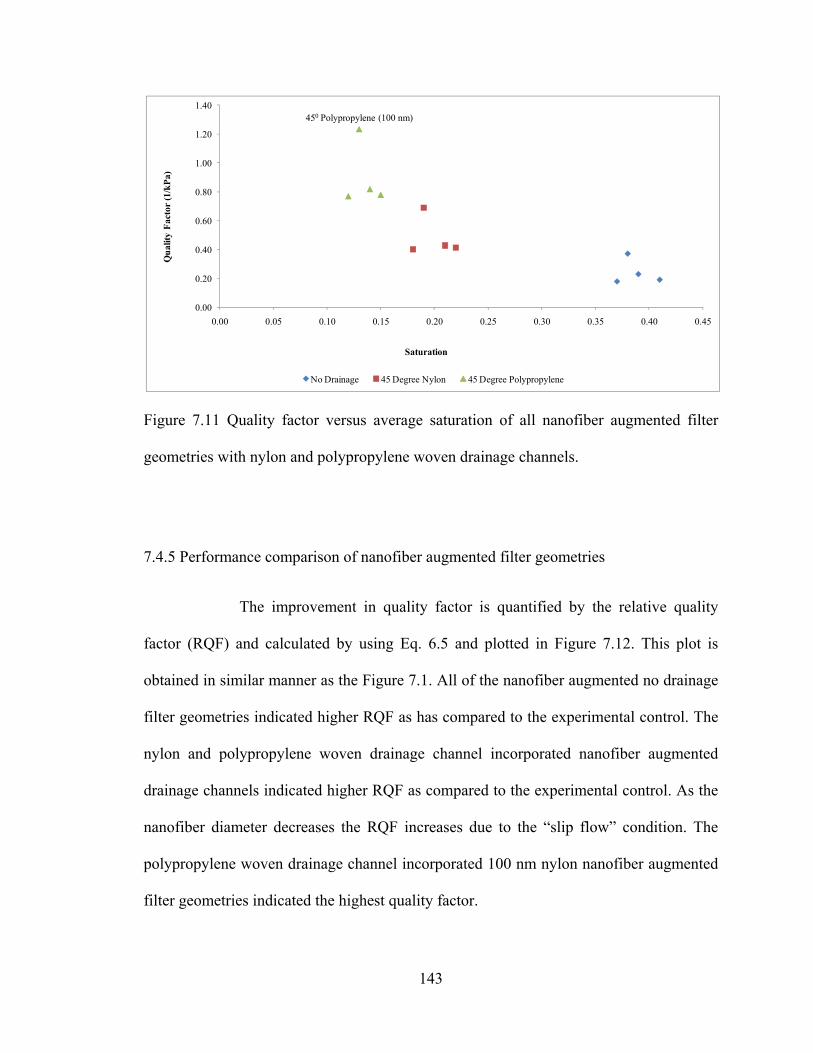
143
Figure 7.11 Quality factor versus average saturation of all nanofiber augmented filter
geometries with nylon and polypropylene woven drainage channels.
7.4.5 Performance comparison of nanofiber augmented filter geometries
The improvement in quality factor is quantified by the relative quality
factor (RQF) and calculated by using Eq. 6.5 and plotted in Figure 7.12. This plot is
obtained in similar manner as the Figure 7.1. All of the nanofiber augmented no drainage
filter geometries indicated higher RQF as has compared to the experimental control. The
nylon and polypropylene woven drainage channel incorporated nanofiber augmented
drainage channels indicated higher RQF as compared to the experimental control. As the
nanofiber diameter decreases the RQF increases due to the “slip flow” condition. The
polypropylene woven drainage channel incorporated 100 nm nylon nanofiber augmented
filter geometries indicated the highest quality factor.
450 Polypropylene (100 nm)
0.00
0.20
0.40
0.60
0.80
1.00
1.20
1.40
0.00 0.05 0.10 0.15 0.20 0.25 0.30 0.35 0.40 0.45
Qua
lity
Fact
or (1
/kPa
)
Saturation
No Drainage 45 Degree Nylon 45 Degree Polypropylene
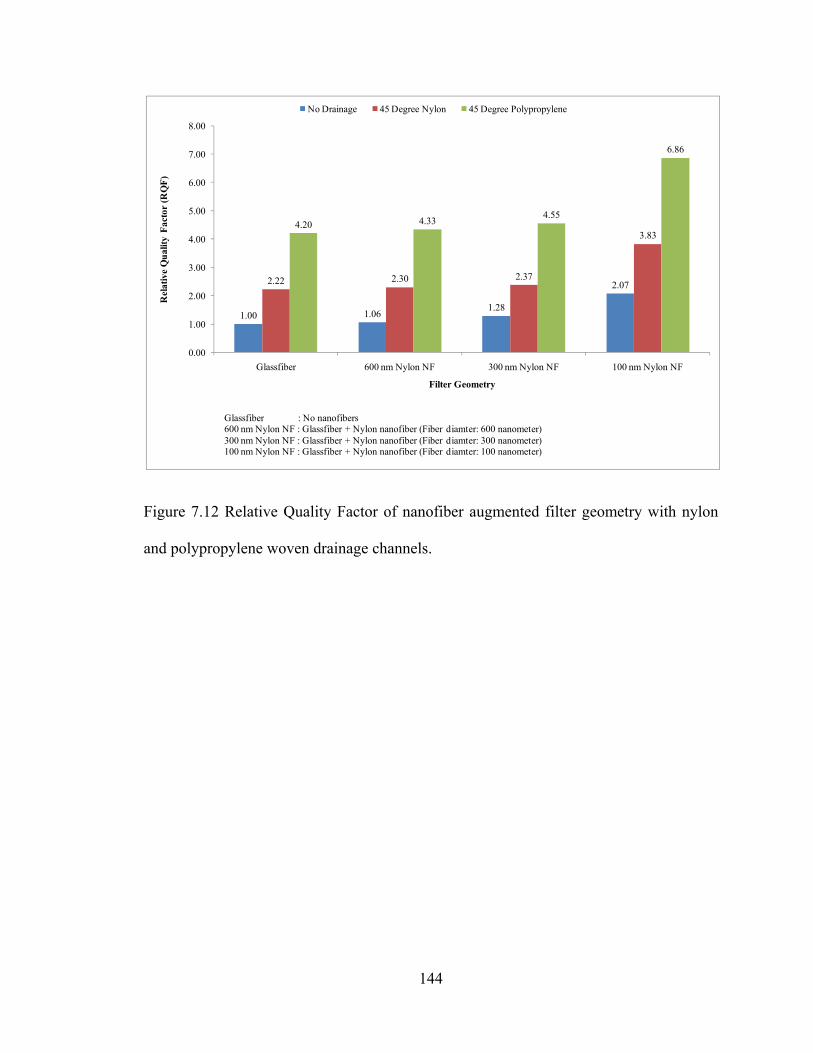
144
Figure 7.12 Relative Quality Factor of nanofiber augmented filter geometry with nylon
and polypropylene woven drainage channels.
1.00 1.061.28
2.072.22 2.30 2.37
3.834.20 4.33 4.55
6.86
0.00
1.00
2.00
3.00
4.00
5.00
6.00
7.00
8.00
Glassfiber 600 nm Nylon NF 300 nm Nylon NF 100 nm Nylon NF
Rel
ativ
e Q
ualit
y Fa
ctor
(RQ
F)
Filter Geometry
No Drainage 45 Degree Nylon 45 Degree Polypropylene
Glassfiber : No nanofibers 600 nm Nylon NF : Glassfiber + Nylon nanofiber (Fiber diamter: 600 nanometer)300 nm Nylon NF : Glassfiber + Nylon nanofiber (Fiber diamter: 300 nanometer)100 nm Nylon NF : Glassfiber + Nylon nanofiber (Fiber diamter: 100 nanometer)

145
CHAPTER VIII
MODELING OF DRAINAGE CHANNEL INCORPORATED FIBROUS FILTER
MEDIA
This chapter focuses on multiphase and volume averaging theories. The
multiphase equations discussed in this chapter are used to model flow through drainage
channel incorporated glass fiber filter media. Pressure and velocity profiles are generated
in the drainage channel incorporated media. Physical space of the media had drainage
channels incorporated at different angles. To smooth the irregularities at the boundaries
of media and drainage channel the physical space is converted to a logical space for the
calculations. The Jacobian transformation is used to transform physical space into logical
space and the pressure profile calculations are done is logical space. The velocity profiles
are developed by using the Darcy’s law calculated from the pressure profile and the
logical space is transformed back to physical space by inverse Jacobian transformation.
This model allows understanding the pressure and velocity profiles of pure air (no
droplets) for the drainage channel incorporated filter media. The pressure and velocity
profile affects the pressure drop of the filter media and ultimately affects the quality
factor of the filter media. The ideal coalescing filter model should account for gas, liquid
flow, capture of droplets and liquid drainage. In the current model the capture of droplets
on fibers, migration of droplets and drainage is not incorporated. We do not have an
adequate model for the movement of captured droplets and drainage of droplets in

146
drainage channel incorporated filter media. Hence this model is limited to determine the
gas flow vectors in an unloaded filter i.e. no capture of droplets. A model which can
predict the velocity and pressure profiles of the drainage channel incorporated filter
media including the capture of droplets, migration and drainage of droplets will be able to
predict the overall performance of a filter. This model is the first step in predicting the
drainage channel incorporated filter media’s performance. Future model including the
capture of droplets, migration and drainage of droplets should build on this model in
cylindrical coordinates for better comparison with the experimental results.
8.1 Multiphase theory in porous media
Multiphase flow deals with the flow of mixture of various phases [104].
Multiphase continuum theory is used to describe a multiphase flow by considering that
the local measurement of a dispersed phase in a multiphase flow is representative of the
averaged effect of all processes at microscale [105]. Volume averaging is a technique
used to develop multiphase continuum equations. In older theories, the interfaces
between phases were considered to be discontinuous in the system which resulted in
inaccurate representation of multiphase systems [106, 107]. It is important that these
interface regions at the microscale be accounted for while developing theories to describe
a system [108]. Knowing the importance of interfaces, the newer multiphase theories
started including interfacial properties for a better representation of a multiphase system.
8.2 Volume average theory
The purpose of volume averaging is to formulate a theoretical structure based on
average values which are equivalent to those that are detected within the field and time

147
scales of a local measurement in a dispersed multiphase material. The balance is
formulated in terms of a phase average, average of a gradient, and average of a time
derivative.
The definition of a locally averaged property must correspond to the value that is
measured locally and must reflect the average of the total amount of the property in the
bulk phases and the interface region. It is implied that the local measurement cannot
isolate the effect of the interface region from that of the bulk phase or detect conditions
within a bulk phase.
The volume averaged for any property for the phase can be written as follows
[109, 110].
( )∂∂
ρ φ ρ φ ρ ρα α α α α α α α α αα α α α
tv i f g E I S G+ ∇ ⋅ + ∇ ⋅ − − + + + + = 0 (8.1)
The excess terms are constrained by
( )E I S Gα α α α
α+ + + =∑ 0 (8.2)
The existing theories for interfacial phenomena are inadequate for describing the
dynamic interactions that occur at an interface. A dynamic model is needed for scaling
up to the continuum scale. The jump balance for a two dimensional surface is developed
by subtracting the balances for the adjoining phases from the balance on a material
volume, containing the surface [111]. The jump balance approach for property for
singular surfaces can be written as follows.
( )[ ] ( )[ ] 122222121111 nivwnivw ⋅−−=⋅−− φρφρ (8.3)

148
Where the velocity of phase 1 and 2 are 1v and 2v respectively and w is the velocity of
the interface. and are the density of phase 1 and 2 respectively.
8.3 Conservation equations
The dispersed multiphase volume averaging theory provides the starting equations
for a continuum analysis [105]. These equations were simplified for modeling the
drainage channel incorporated clean filter media. The continuum theory provides
balances for the conservation of mass, momentum, mechanical energy, thermal energy,
total energy, chemical species, and entropy for each phase present in the system [106].
For evaluation of pressure drop and velocity profile of a clean filter media in sections
only the mass and momentum balances for the gas phase are needed. Mass and
momentum balances were used to model the interior of media and drainage channels
while at the interface of media and drainage channel the mass and momentum jump
balances were used.
8.3.1 Mass and momentum balaces
The heterogeneous scale gas phase mass balance can be written as follows.
∇ . Gv ( )Gm
Gm GE + 0 (8.4)
Where is the accumulation of mass per unit volume
∇ . Gv is the gas phase convection per unit volume
The mass balance has a constraint on its excess terms where
( ) 0=+∑G
Gm
Gm GE (8.5)

149
The superscript G in Equations 8.4 and 8.5 means the quantity represents the gas phase.
The gas phase momentum balance can be written as follows.
( ) ( ) ( ) 0=++++−⋅∇+⋅∇+ GM
GM
GM
GM
GGGGGGGGGGG GSIEgtvvvt
ρεερερε∂∂ (8.6)
where ( )GGG vt
ρε∂∂ is the rate of increase of gas phase momentum per volume,
( )GGGG vvρε⋅∇ is the rate of gas phase momentum gain by convection per unit volume,
GG tε⋅∇ is the rate of gas phase momentum gain by shear and normal stresses per unit
volume, and gGGρε is the gravity force on the gas phase per unit volume.
The interphase transfer excess terms GME , G
MI , GMS and G
MG represent different
mechanisms by which momentum is exchanged between the phases. The term, GME ,
is the rate of momentum transfer due to phase change at the interface between the phases.
The term, GMI , is the rate of momentum transfer due to drag per unit volume between the
phases, GMS is the rate of momentum transfer due to slip across a 3-D interface region
when 3 or more phases are in contact (i.e., due to capillary forces) per unit volume, and
GMG is the momentum transfer due to heterogeneous reaction at the interface between the
phases per unit volume.
In most processes of flows through porous media the dominant forces are the
stresses and drag forces. The stress term is the sum of the normal stress (i.e. pressure)
and the shear (deviatoric) stress term

150
GG Pt τδ += (8.7)
The interphase exchange of momentum due to mass transfer or chemical reaction
are assumed to be insignificant; hence the terms GME and G
MG are dropped from Equation
(8.6). In flows through porous media, as long as the pore sizes are significantly smaller
than the macrodimensions of the medium, then the wall effects are negligible and the
shear term is dropped from the momentum balance. Also the inertial terms are negligible
compared to the pressure and drag terms. The momentum balance reduces to
0=−+∇ gFP GGGG ρεε (8.8)
where
GM
GM
G SIF += (8.9)
represents the effective drag force momentum transfer between the phases. The
constraint on excess terms for the momentum balance requires momentum transfers
across the interface between the phases sum to zero
( ) 0=∑G
GF (8.10)
8.3.2 Mass and momentum jump balances
To develop the pressure and velocity profiles in the drainage channel incorporated filter
media, the mass and momentum jump balances must be applied at the boundaries of the
filter media and drainage channels.
A schematic of a drainage channel incorporated media and the interface between
media and drainage channel is shown in Figure 8.1.

151
Figure 8.1 Interface of media and drainage channel.
The mass jump balance analogous to Eq. (8.3) applied between the multiphase
regions is written as
( )( ) ( )( ) 122
121
nvwnvwG
GGG
G
GGG ⋅⎥⎦
⎤⎢⎣
⎡−=⋅⎥
⎦
⎤⎢⎣
⎡− ∑∑ ρερε (8.11)
Similarly, the momentum jump balance is
( )( )
( )( ) 122
121
ntvwv
ntvwv
G
GG
G
GGGG
G
GG
G
GGGG
⋅⎥⎦
⎤⎢⎣
⎡−−=
⋅⎥⎦
⎤⎢⎣
⎡−−
∑∑
∑∑
ερε
ερε (8.12)
8.4 ASSUMPTIONS
The volume averaged continuum equations are used to model the coalescing filter
performance. The complete sets of equations are complicated and cannot be solved
θ
θ
θ
Interface
Region I Region II
VI VII
Momentum
Interface

152
analytically. The following assumptions simplify the equations to obtain a tractable
solution.
• The process is isothermal.
• The flow is one dimensional (only in the X direction).
• Steady state.
• Filter media is incompressible. Solid phase is rigid and stationary.
• The fibers do not move within the matrix (held stationary by the binder).
• Binder material (i.e. glue) accounts for only a small fraction of the filter
volume and can be neglected.
• The porosity of a new unused media and drainage channels (no oil present)
are uniform and constant. Alternatively, the fiber phase volume fraction of
media and drainage channel are uniform and constant.
• The permeability of a glass fiber media as well as drainage channel is uniform
and anisotropic.
• No chemical reaction.
• No mass transfer.
• Inertial (convection) terms are neglected.
• No property transfer due to slip.
• Viscosity and density of air are constant. No temperature effects.
• Neglect wall stress.
• Interface between the media and drainage channel is stationary.

153
8.5 Permeability of media and Darcy’s law
If the porosity and/or permeability vary in position, the Darcy’s law at the local
scale is used and defines a local permeability as given in equation 8.13.
qk
P= − ∇μ
(8.13)
Hassanizadeh and Gray [109] introduce the constitutive relation
( )SGG vvRF −⋅= (8.14)
where the stationary solid phase velocity, Sv is zero. R is a second order tensor resistance function that is characteristic of the material properties and the flow conditions. Combining equations (8.14) and (8.8) gives the expression for the local volume averaged velocity as
PRv GG ∇⋅−= − ε1 (8.15)
in which R−1 is the inverse of the resistance function tensor.
Darcy’s law may be written at the local scale by substituting the definition for the volume averaged velocity qvGG =ε and letting the permeability vary in position and direction to
have the form
με GG Pk
v∇⋅
−= (8.16)
By inspection it can be seen that the resistance function and the local permeability are
related by
με 21 GRk −= (8.17)
The significance of writing the permeability or resistance function in local form is
that it allows us to account for variations in the magnitude of the permeability (or

154
resistance function) over position. The local permeability depends upon several factors
including the local porosity and the effective wetted surface area [112]. A number of
references provide correlations relating local permeability or resistance functions to
surface area, porosity, particle size, and velocity [113, 114].
The significance of the tensorial nature of the local permeability or the resistance
function is that it provides a way to account for a directional dependence of the direction
to flow. For an isotropic medium it should not matter what direction is the flow and what
direction is the coordinate origin. An anisotropic permeability is characterized by
different permeabilities in each coordinate flow direction. Anisotropic permeability is
applicable to two-dimensional systems shown in Figure 8.2. The Y-direction
permeability, kY, differs from the X-direction permeability, kX, in the 2-D geometry.
Figure 8.2 Anisotropic permeability.
When a material has anisotropic behavior, in a 2-D X-Y planar geometry (i.e., it
has symmetry and uniformity in Z direction) then the permeability tensor can be written
as follows,
kX
kY

155
=k 11 1221 22
(8.18)
where the 1, 2 indices represent the, X, Y coordinate directions, in any orthogonal
coordinate system. A symmetric tensor has equal valued off-diagonal components, such
that 2112 kk = . Normally, anisotropic porous media are assumed to be orthotropic, [109,
115, 116] meaning that there is symmetry in the permeability tensor with respect to two
orthogonal planes [117]. With an orthotropic material it is possible to rotate the
coordinate system to a primed coordinate system , , where the coordinate axes are
aligned with a principal axis of the medium and the off-diagonal components are zero.
When aligned with the principle axes, the permeability tensor is
='k 11 00 22
(8.19)
Figure 8.3 indicates the principle and system axes for the drainage channel
incorporated media. The system axes are X, Y, and Z while the principle axes are X’, Y’,
and Z’. If the material is orthotropic then the principle axes are perpendicular (i.e., the
direction at which the permeability tensor component values are maximum and minimum
are perpendicular) and the coordinate system may be rotated such that the coordinate
directions coincide with the principle axes. In this situation the off diagonal components
are zero. The principle axes of the media coincide with the system axes but for the
drainage channels the principle axes are tilted as indicated by angle θ.

156
Figure 8.3 Principle and system axes for drainage channel incorporated filter media.
The and for the glass fiber media as well as drainage channel were obtained
by using the using the Frazier® Differential Air Permeability Measuring Instrument and
analyzing the data using Darcy’s law. The k’22 and k’11 experimental values for glass
fiber media were 4.47E-10 m2 and 2.24E-10 m2 while k’22 and k’11 experimental values
for drainage channels were 14.24E-9 m2 and 3.389E-9 m2. The k’22 value for the drainage
channel is a good starting value, but the true value is questionable because in order to
make the measurement multiple sheets of the drainage channel materials were stacked
together. This parameter should be fitted between a 3-D numerical model and
experimental measurements of filter samples constructed with drainage channels to
obtain a more reliable value. This is left for future work because the current model is
2-D. The 2-D model only gives accurate results for the disk-shaped filter when the filter
properties are uniform (i.e. symmetric) in the Y-Z plane which only occurs when there
Z’
θ
θ
θ
Y X’
X θ
θ
Y’ Z

157
are no drainage channels; otherwise the computer program must be rewritten in 3
dimensions which is beyond the scope of this particular work.
For the drainage channels, the principle axes are tilted relative to the filter
geometry coordinate origin by angle θ is shown in Figure 8.3. Hence the permeability
tensor in X, Y coordinates of the filter geometry for drainage channel is written as
follows.
(8.20)
Applying coordinate transformations from the primed to unprimed coordinates [117,118].
(8.21)
(8.22)
(8.23)
The permeability tensor for the drainage channel has , hence it is symmetric.
The drainage channels and the media have different porosities also. The
experimental porosity of the media was 0.96 using the pycnometer while the
experimental porosity of drainage channel was obtained gravimetrically by using a
specific gravity bottle. The porosity of the drainage channel is 0.986. Local variations in
medium permeability affect the observed pressure drop. The effective permeability
observed at the macroscale can be correlated with the local variations for models.

158
8.6. Simplified conservation equations
8.6.1 Mass and momentum balances
The assumptions reduce the mass balance equation (Equation 8.4) as follows.
( ) 0=⋅∇ GG vε (8.24)
Equation 8.24 in 2-D rectangular coordinates can be written as follows.
0 (8.25)
Combing Darcy’s law Eq.8.16, with Eq. (8.24) gives
01=⎟
⎟⎠
⎞⎜⎜⎝
⎛∇⋅∇ Pk
μ (8.26)
which can be expanded as
( ) 0..: =∇∇−∇∇ kPPk (8.27)
In regions where k is not a function of position then the 2nd term is zero. In a
system with a jump within the system volume, the second term in Eq. 8.27 becomes
infinite at the jump. Hence a filter with drainage channels must be modeled in separate
regions and the jump balance must be applied across the jump. Within each region Eq.
8.27 reduces to
0: =∇∇ Pk (8.28)
Eq. 8.28 in 2-D rectangular coordinates can be written as
0 (8.29)
We can define the dimensionless pressure as ∆
where ΔP is the pressure drop
across the filter. Equation 8.29 becomes
0 (8.30)

159
8.6.2 Mass and momentum jump balances
The mass jump balance in Eq. 8.11 reduces to
( ) 012 =⋅−−−
nG
II
GII
G
I
GI υευε
(8.31)
Hence, separated into vector components, Eq. 8.31 becomes
i j 0
Both of the bracketed terms are independent. Hence the y-component can be written as
(8.32)
Combining this with Darcy’s law Eq. 8.16, and the definitions of the dimensionless
pressure, we get
(8.33)
which is used to determine the values F at the region boundaries between the medium
and the drainage channels. Equations 8.30 and 8.33 are solved in discretized form over
the volume of the filter medium to determine the pressure profile. The pressure data are
applied with Darcy’s law to determine the local velocities. The momentum jump balance,
Eq. 8.12 with Eq. 8.7, the convection terms and the shear terms are negligible compared
to the pressure terms. Hence the momentum jump balance reduces to
122
121
nPnPG
G
G
G ⋅⎥⎦
⎤⎢⎣
⎡∂=⋅⎥
⎦
⎤⎢⎣
⎡∂ ∑∑ εε (8.34)
which ultimately reduces to
(8.35)
at the jump interfaces. This proves the pressure at the boundary between the regions
when approached from region I equals the pressure at the boundary when approached
from region II.

160
8.7 Boundary conditions
The top and bottom boundaries of the filter are impermeable hence the 0 at
both the B.Cs and hence 0 at these boundaries. The dimensionless pressure at the
outlet is zero and the dimensionless pressure at the inlet is unity.
8.8 Grid generation
Drainage channels are incorporated at different angles into the filter bed length.
Hence the boundaries between the regions do not parallel rectangular grid lines if a
rectangular grid system is used to model the geometry. To get the grid lines to coincide
with the boundaries, the solution grid must be deformed. Knupp and Steinberg [116]
describe how the grid transformations are obtained using the Jacobian. The Jacobian is
used to convert from X, Y coordinate system to u, v coordinate system by the following
expression.
( ) ( ) ( )[ ] ( )( ) dudv
VUYXvugvufdXdYYX
GA ,,,,,,
∂∂
= ∫∫∫∫ φφ (8.36)
The Jacobian matrix j can be defined as follows.
(8.37)
The Jacobian determinant, also known as Jacobian, is the determinant of the
Jacobian matrix i.e. ( )jJ det= . The Jacobian matrix need not be square. If the
dimensions of the physical objects equal the dimensions of the physical space i.e. the
object is not a curve or non-flat surface, then the Jacobian is square. The schematic of the
grid transformation is shown in Figure 8.4.

161
Figure 8.4 Physical and logical space.
The Jacobean of the transformation is required to be non-zero, and consequently
the transformation has an inverse. Grids are first chosen in logical space and then mapped
to physical space.
8.8.1 Goals of grid generation
1. Avoid a folded transformation (to preserve physical and math properties).
2. Produce smooth grids where spacing varies smoothly and angles do not become
too small (to minimize the error).
3. PDEs representing the physical phenomena such as fluid flow or heat transfer are
known as hosted equations. If the solution of the hosted equations varies rapidly
in some part of the physical region, choose a finer grid in that part of the region
(to reduce error in the math solution).
X
Z η
ξ
Transformation
Inverse Transformation
Logical space Physical space

162
8.8.2 Grid mapping
1. Each point in physical space is the image of a unique point in logical space.
2. Each point in logical space maps to a unique point in physical space.
3. The corners of the logical space must map with to the corners of the physical
object. Coordinate functions ( )ξX
must be continuous and have continuous
derivative in the interior of Uk and on the boundary of Uk.
4. Use grid to solve the PDEs in irregular region.
5. PDE must be transformed to the logical space.
6. The hosted equation is invariant under general nonsingular coordinate
transformation i.e. the physics is preserved.
Figure 8.5 shows a section of the media in physical as well as logical space. The
top and the bottom sections of the media in physical space are trapezoids except for the 00
angle media. The section between the drainage channels are parallelograms. For the 00
angle media the media has rectangular shaped four sections separated by equally spaced
three drainage channels. The logical space will have same dimension of the physical
space.

163
Figure 8.5 Physical and logical space conversion.
The , values are the physical locations of the corners of the physical
trapezoidal region. To convert from the logical space coordinates , to the physical
space coordinates (X, Y), the following relations are used
, 1 1 , 1 , 1 , , (8.38)
, 1 1 , 1 , 1 , , (8.39)
X0 X1 Y0
Y
X , ,
, ,
, ,
, ,
Physical space
ξ
η
0 0
Logical space
1
1
Inlet Outlet

164
The Jacobian of the bilinear map is computed as follows.
1 , , 1 , , (8.40)
1 , 1 , , , (8.41)
1 , , 1 , , (8.42)
1 , 1 , , , (8.43)
PDES are written in discretized form by finite differencing. The pressure profile is
calculated at local points by using a nine point solver and the Gauss Seidel iterative
approach is used to solve the pressure profile over all of the points in the grid space. The
nine point solver uses values at grid points surrounding each (i ,j) point in the logical grid
space, as indicated in Figure 8.6.
Figure 8.6 Nine point-solver.
1, 1
1,
1, 1
, 1
,
, 1
1, 1
1,
1, 1

165
Using the nine point-solver, the value at point (i, j) is calculated from the
surrounding 8 points. The tridiagonal matrix is applied to calculate the pressures at local
points. A FORTRAN program published by Knupp and Stteinberg [116] gives a code for
solving the nine-point solver. This code is used in the FORTRAN program (Appendix B)
to calculate the pressure and velocity profile for the filter geometries described above.
The boundary condition at an impermeable surface (at the top and bottom surfaces
of the filter) requires that the gradient in the pressure at the surface be zero, 0.
A first order approximation to this boundary condition is applied, where
, , (8.44)
Eq. 8.30 is used to calculate the pressure profile in the media and drainage
channel region and Eq. 8.33 is used calculate pressure profile at the interface of the media
and drainage channel. To smoothen the irregularities at the boundary of media and
drainage channel, the physical space is transferred to logical space by using the Jacobian
transformation. In section I to VII Eq. 8.30 is used and at all the media and drainage
channel interface Eq. 8.33 is used to calculate the pressure profile. The schematic of
physical and logical space for the drainage channel incorporated filter media and the
equations used to calculate the pressure profile for the media and drainage channel and at
the interface of the media and drainage channel is shown in Figure 8.7.
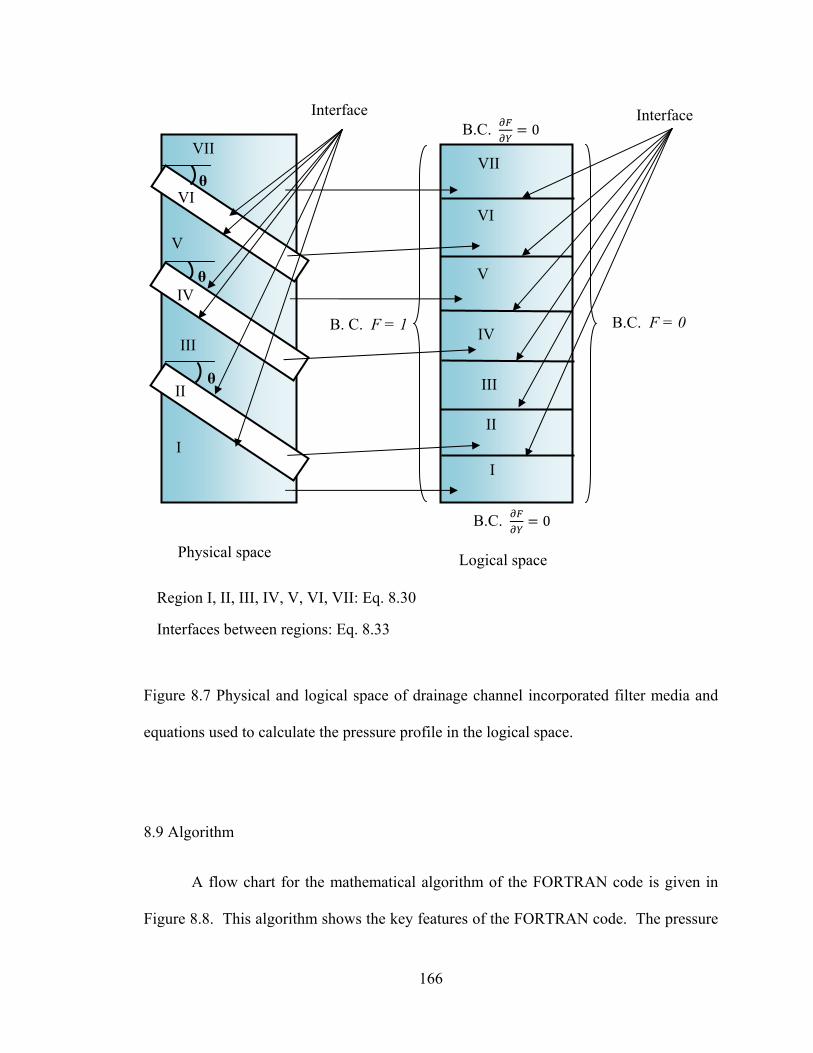
166
Figure 8.7 Physical and logical space of drainage channel incorporated filter media and
equations used to calculate the pressure profile in the logical space.
8.9 Algorithm
A flow chart for the mathematical algorithm of the FORTRAN code is given in
Figure 8.8. This algorithm shows the key features of the FORTRAN code. The pressure
IV
III
VII
II
I
V
VI
Interface
Logical space
B.C. 0
B.C. 0
B.C. F = 0
Interface
I
V
II
IV
III
VI
VII
Region I, II, III, IV, V, VI, VII: Eq. 8.30
Interfaces between regions: Eq. 8.33
Physical space
B. C. F = 1
θ
θ
θ
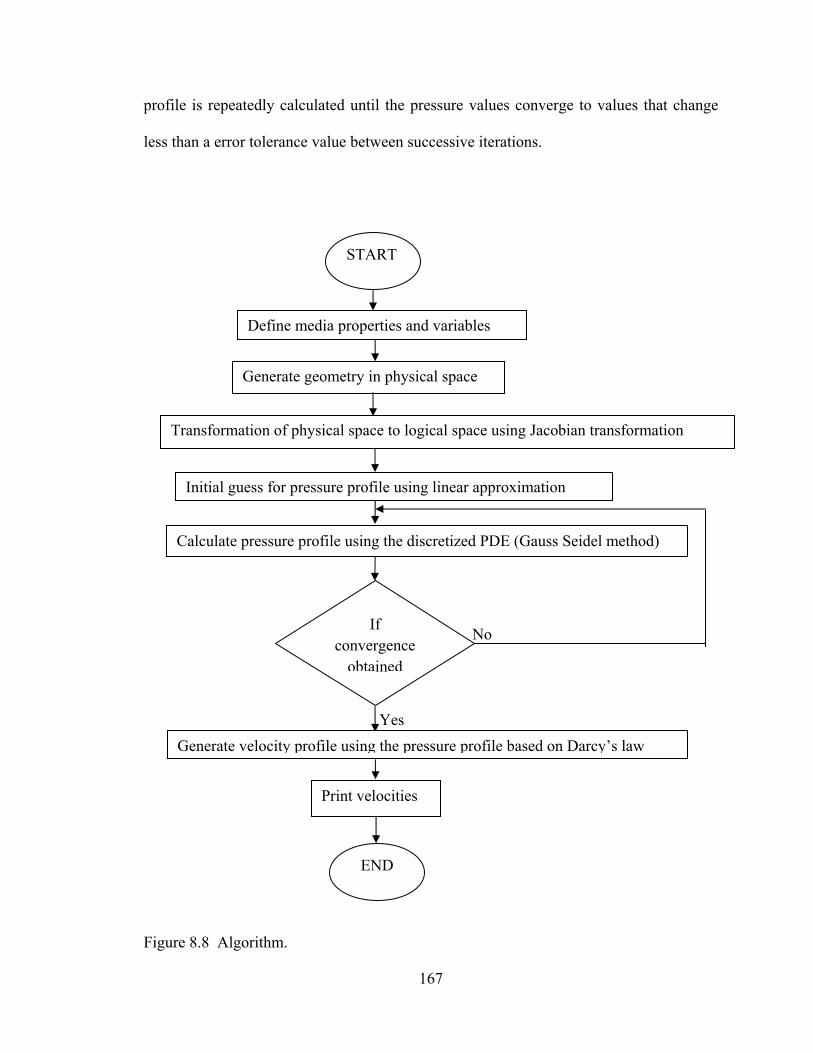
167
profile is repeatedly calculated until the pressure values converge to values that change
less than a error tolerance value between successive iterations.
Figure 8.8 Algorithm.
Yes Generate velocity profile using the pressure profile based on Darcy’s law
Print velocities
END
Transformation of physical space to logical space using Jacobian transformation
Generate geometry in physical space
Define media properties and variables
START
Initial guess for pressure profile using linear approximation
Calculate pressure profile using the discretized PDE (Gauss Seidel method)
If convergence
obtained
No

168
8.10 Results
8.10.1 Optimizing the grid size
For the analytical solution to be independent of grid size, the optimum grid size
was determined that minimizes error in the calculations. For glass fiber isotropic media
the grid size was varied by keeping the grid spacing the same, ∆ ∆ . The volumetric
flow rate, given by
(8.45)
is calculated using trapezoidal rule to evaluate the integral over the exit surface. Here W
and H are the width and height of the media respectively (assuming a square face area
filter media). is the porosity of the media. vX is the velocity in X direction.
The flow rate was calculated for a special case solution of an isotropic medium
for which an analytical solution is available. The analytical volumetric flow rate, i.e.
QAnal, was obtained by solving the macro scale Darcy’s law for the special case. The
QAnal was obtained from the Frazier test Analyzer. The QAnal can only be obtained for an
isotropic media by solving the macro scale Darcy’s law using the Frazier® Differential
Pressure Air Permeability Measuring Instrument. The experimental procedure is similar
which is described in Chapter III. The model calculated, flow rate QCalc for the same filter
size, geometry, properties, and pressure drop as the analytical solution. The difference
between the two flow rates defines the error in the calculation. The error is plotted in
Figure 8.9 as a function of the grid size. The error is calculated by using following
formula
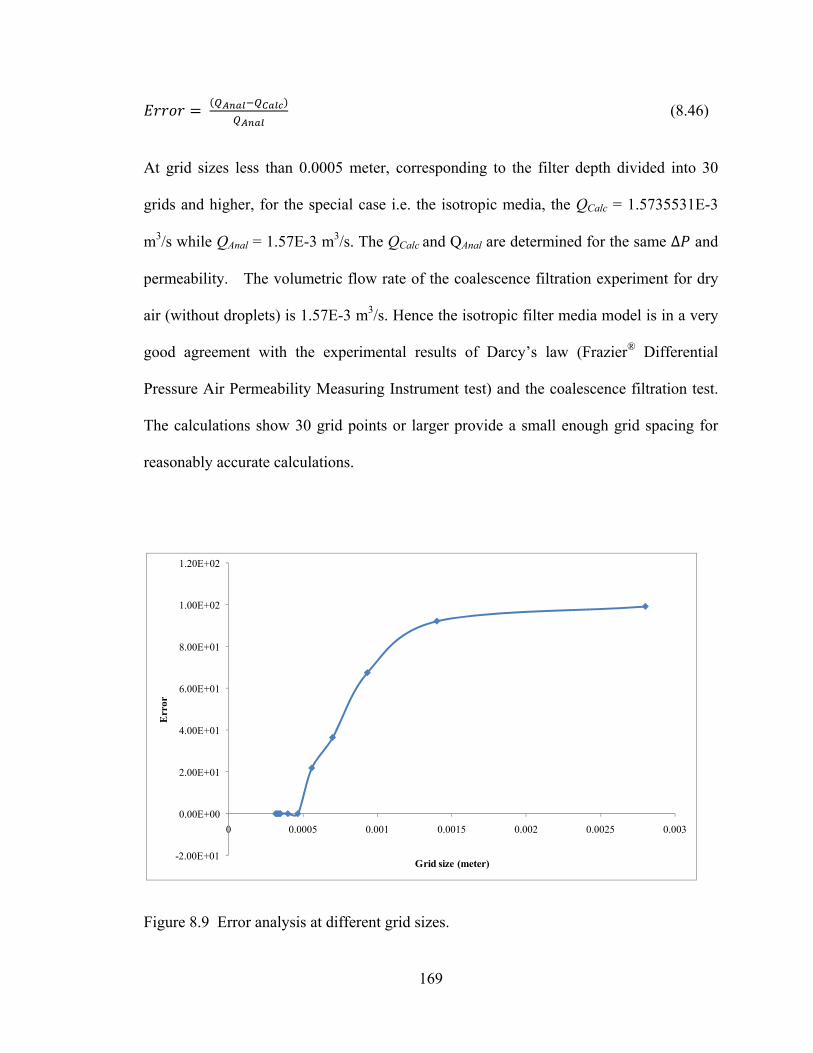
169
(8.46)
At grid sizes less than 0.0005 meter, corresponding to the filter depth divided into 30
grids and higher, for the special case i.e. the isotropic media, the QCalc = 1.5735531E-3
m3/s while QAnal = 1.57E-3 m3/s. The QCalc and QAnal are determined for the same ∆ and
permeability. The volumetric flow rate of the coalescence filtration experiment for dry
air (without droplets) is 1.57E-3 m3/s. Hence the isotropic filter media model is in a very
good agreement with the experimental results of Darcy’s law (Frazier® Differential
Pressure Air Permeability Measuring Instrument test) and the coalescence filtration test.
The calculations show 30 grid points or larger provide a small enough grid spacing for
reasonably accurate calculations.
Figure 8.9 Error analysis at different grid sizes.
-2.00E+01
0.00E+00
2.00E+01
4.00E+01
6.00E+01
8.00E+01
1.00E+02
1.20E+02
0 0.0005 0.001 0.0015 0.002 0.0025 0.003
Err
or
Grid size (meter)

170
The current model is optimized for the grid size for comparing to the analytical
solution of special case i.e. the isotropic filter media. But the pressure and velocity
profiles are developed for the anisotropic media. Analytical solution is not available for
the anisotropic media. Hence in future the grid size needs to be optimized by converging
the QCalc for the anisotropic media.
8.10.2 Velocity profile of isotropic filter media without drainage channel
The velocity profiles were calculated in the FORTRAN Code by evaluating
Darcy’s Law using 1st and 2nd order discretized approximations of the pressure gradients.
The velocity vectors were plotted on the grid by using a vector plot code [119]. The
vector plot code generates two plots, a velocity magnitude plot and a velocity direction
plot. The velocity magnitude plot gives information about the magnitude and direction of
the velocity along the filter bed length. In the velocity magnitude plot, the lengths of the
arrows indicate the magnitude of the velocity and the directions of arrows indicate the
direction of velocity. The velocity direction plot only shows the velocity directions, hence
the arrow in the velocity direction plot are of similar length.
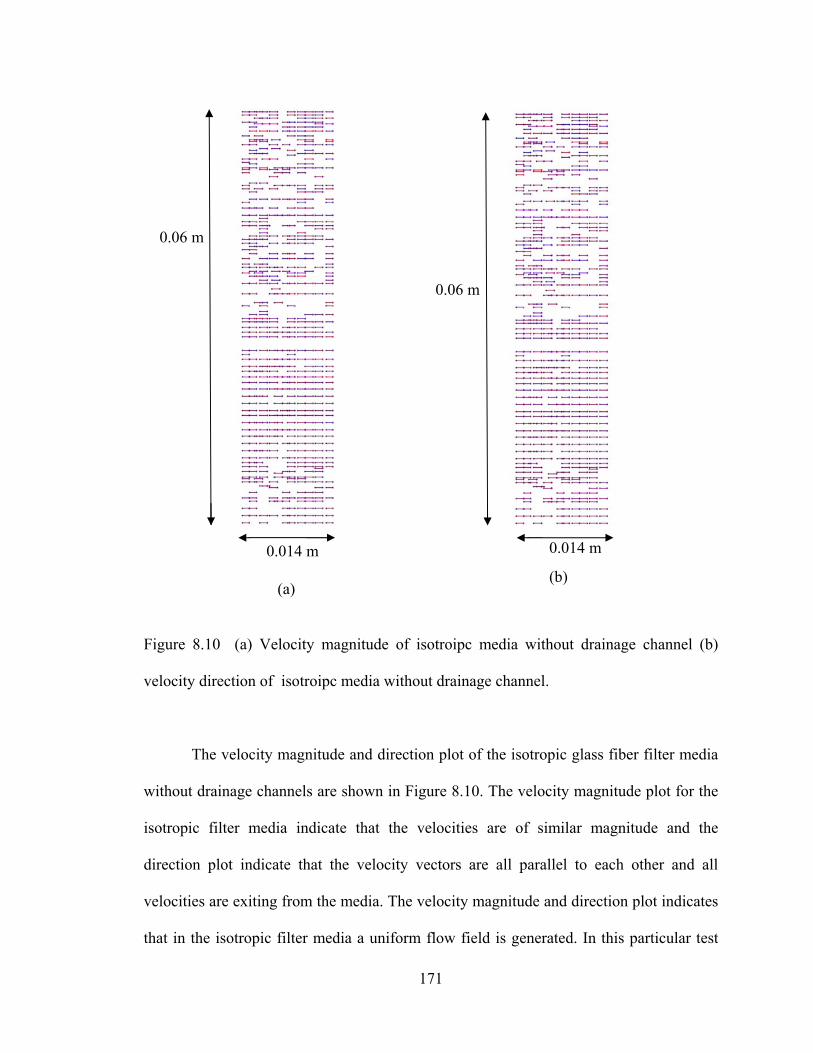
171
Figure 8.10 (a) Velocity magnitude of isotroipc media without drainage channel (b)
velocity direction of isotroipc media without drainage channel.
The velocity magnitude and direction plot of the isotropic glass fiber filter media
without drainage channels are shown in Figure 8.10. The velocity magnitude plot for the
isotropic filter media indicate that the velocities are of similar magnitude and the
direction plot indicate that the velocity vectors are all parallel to each other and all
velocities are exiting from the media. The velocity magnitude and direction plot indicates
that in the isotropic filter media a uniform flow field is generated. In this particular test
(a)
0.014 m
0.06 m
0.06 m
0.014 m
(b)

172
case the media and drainage channels had the same isotropic permeabililties. As
expected the velocities are nearly uniform and have y-components that are very small.
8.10.3 Velocity profile of anisotropic drainage channel incorporated filter media
The velocity magnitude and direction plot of drainage channel incorporated filter
media of 0.06 m height and 0.014 m thickness at 450 downward inclination are shown in
Figure 8.11 (a) and (b) respectively. In both figures, the drainage channels are boxed for
better visualization. Both the figures show the velocity magnitude and directions by blue
and red arrows for the drainage channels and media respectively. The length of the arrow
indicates the magnitude and the direction of arrow indicate velocity direction. It is
evident that the magnitude of velocity flowing through the drainage channel is a lot
bigger than the magnitude of the velocity flowing through the filer media. Figure 8.12
shows the closer view of the two different sections of media at the media and drainage
channels interface. The velocity in the drainage channel is indicated by blue arrows while
the magnitude of velocity in the filter media is shown with the red dots. The red dots are
actually red arrows but because the magnitude of velocity in that region is very small
they are seen as dots. The direction plot shows that all the velocities at the top and
bottom boundary are straight pointing towards exit which indicates that the upper and
lower boundaries of the media are impermeable to flow because the filter is enclosed in
the filter holder.

173
Figure 8.11 (a) Magnitude and (b) direction of velocity profile in drainage channel
incorporated anisotropic filter media with an angle of 45 deg. The drainage channels are
marked inside of the rectangular boxes.
(a)
0.06 m
0.014 m
0.06 m
(b)
0.014 m
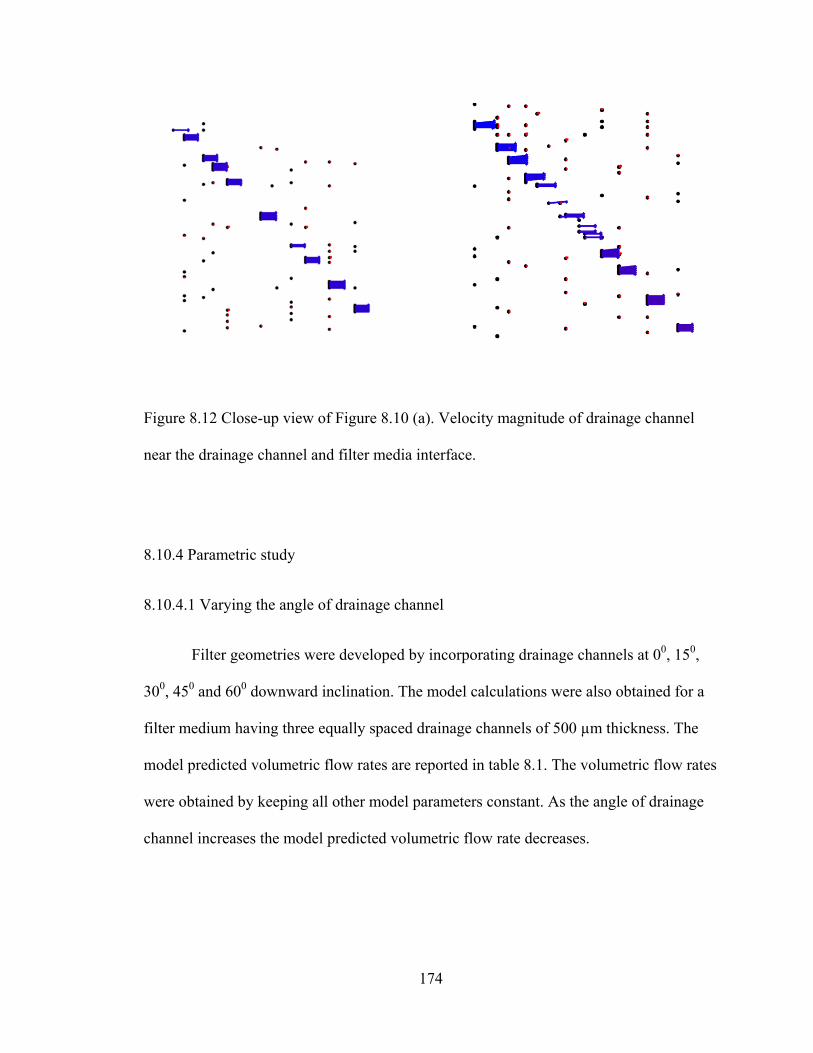
174
Figure 8.12 Close-up view of Figure 8.10 (a). Velocity magnitude of drainage channel
near the drainage channel and filter media interface.
8.10.4 Parametric study
8.10.4.1 Varying the angle of drainage channel
Filter geometries were developed by incorporating drainage channels at 00, 150,
300, 450 and 600 downward inclination. The model calculations were also obtained for a
filter medium having three equally spaced drainage channels of 500 µm thickness. The
model predicted volumetric flow rates are reported in table 8.1. The volumetric flow rates
were obtained by keeping all other model parameters constant. As the angle of drainage
channel increases the model predicted volumetric flow rate decreases.

175
Table 8.1 Volumetric flow rates of filter geometry with drainage channels at different
angles
Sr. No Angle of drainage channel Volumetric flow rate (m3/s)
1. 00 3.31E-02
2. 150 3.07E-02
3. 300 2.93E-02
4. 450 2.35E-02
5. 600 9.31E-03
8.10.4.2 Changing the thickness of drainage channel
The thickness of drainage channel was varied from 500 µm to 1000 µm and 7200 µm by
keeping all other model parameters constant. The model predicted flow rate of varying
drainage channel thickness are given in Table 8.2. As the thickness of the drainage
channel is increased the volumetric flow rate increases. The drainage channel are porous
than the media hence when the thickness of the drainage channel increases the volumetric
flow rate increases as expected. According to Darcy’s law if these flow rates were the
same as the QAnal, then the pressure drop of the media will be significantly lower as
compared to the isotropic no drainage channel filter media.
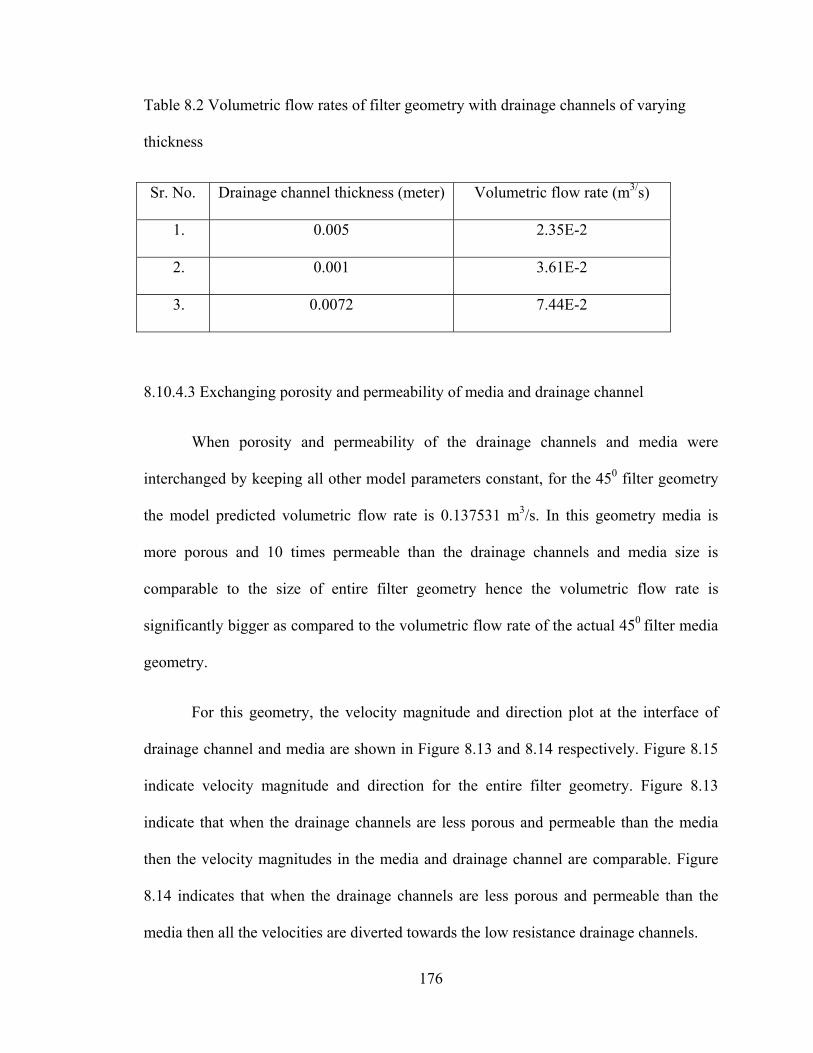
176
Table 8.2 Volumetric flow rates of filter geometry with drainage channels of varying
thickness
Sr. No. Drainage channel thickness (meter) Volumetric flow rate (m3/s)
1. 0.005 2.35E-2
2. 0.001 3.61E-2
3. 0.0072 7.44E-2
8.10.4.3 Exchanging porosity and permeability of media and drainage channel
When porosity and permeability of the drainage channels and media were
interchanged by keeping all other model parameters constant, for the 450 filter geometry
the model predicted volumetric flow rate is 0.137531 m3/s. In this geometry media is
more porous and 10 times permeable than the drainage channels and media size is
comparable to the size of entire filter geometry hence the volumetric flow rate is
significantly bigger as compared to the volumetric flow rate of the actual 450 filter media
geometry.
For this geometry, the velocity magnitude and direction plot at the interface of
drainage channel and media are shown in Figure 8.13 and 8.14 respectively. Figure 8.15
indicate velocity magnitude and direction for the entire filter geometry. Figure 8.13
indicate that when the drainage channels are less porous and permeable than the media
then the velocity magnitudes in the media and drainage channel are comparable. Figure
8.14 indicates that when the drainage channels are less porous and permeable than the
media then all the velocities are diverted towards the low resistance drainage channels.

177
Figure 8.13 Velocity magnitude near the drainage channels when the drainage channel
porosity and permeability is less than the filter media
Figure 8.14 Velocity direction near the drainage channels when the drainage channel
porosity and permeability is less than the filter media.
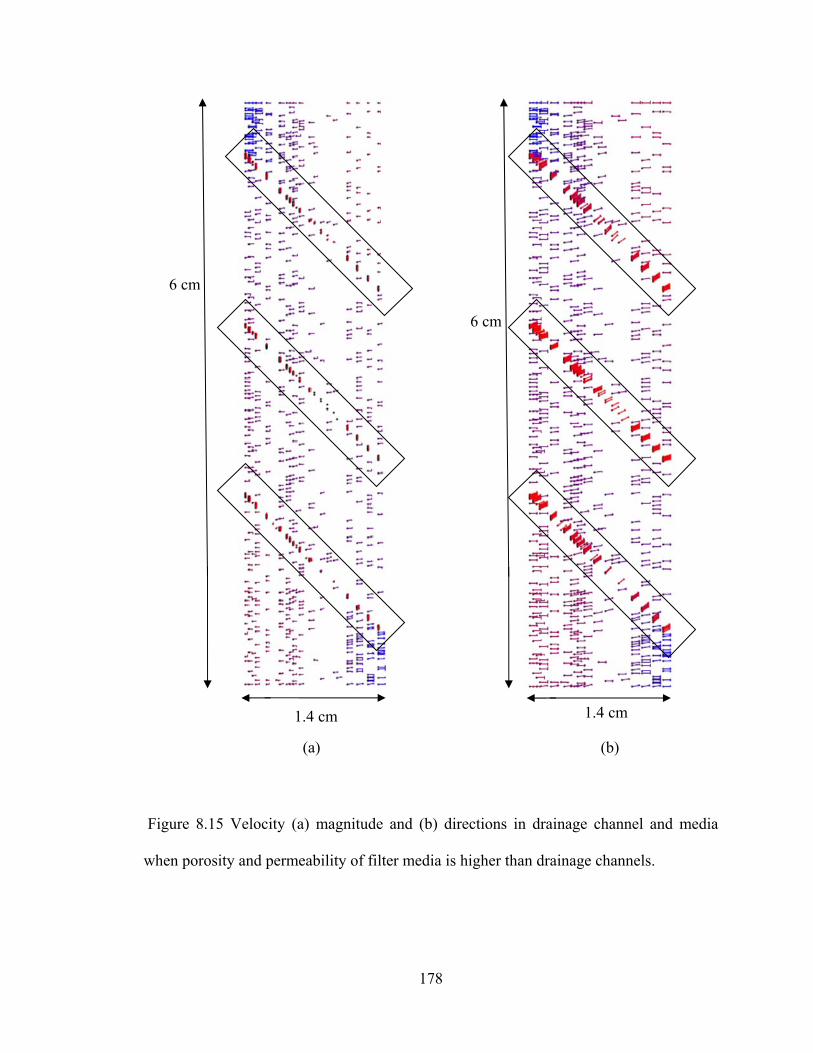
178
Figure 8.15 Velocity (a) magnitude and (b) directions in drainage channel and media
when porosity and permeability of filter media is higher than drainage channels.
(b)
1.4 cm
(a)
6 cm
6 cm
1.4 cm

179
The velocity profiles are useful to help to visualize how the gas moves through
the medium at the start of the filtration process and gives an indication of where liquid
may collect fastest (i.e. at larger velocities). The model results indicate that the velocity
magnitude is higher in the drainage channel region as compared to the filter media which
will promote drainage. The velocity profile of the media has effect on the performance of
the filter. Hence it is important to study the velocity profile of the filter media. When the
droplet capture, migration and drainage will be accounted in the model the model will
able to predict the performance of filter media better. But to find out why the 450 media
in horizontal orientation works better more work is needed.
Figure 8.16 Drop motion through drainage channel and media.
In the parametric study of the model, when the drainage channels have lower
porosity and permeability than the filter media the velocity direction plot indicate that the
Gas flow in Gas flow out
Drainage

180
velocity is moving towards the media. In this case study, the media offer lower resistance
to flow compared to the drainage channels, hence the velocities are going towards media.
Even though we consider the filter media has higher porosity and permeability than the
drainage channel, the pore sizes of the filter media are smaller than the drainage channels.
There will be some resistance for the big oil droplets to move from larger pores to smaller
pores. But they will tend to drain from the filter media through the drainage channels
because of the bigger pores of the drainage channels will provide an easier path for the
drops. The small droplets might get carried to the media with the air flow where they will
coalesce which will improve the rate of coalescence (Refer Figure 8.16). The drainage
channels are incorporated at downward angles hence the droplet draining from the
drainage channels will also get an added advantage of the gravitational force. Hence a
media with larger pores than drainage channels needs to be tested in future. A
microscopic study of drainage channel incorporated filter media needs to be done to
observe the droplet motion in the media and drainage channels. The microscopic results
will be helpful for incorporating the droplets capture, droplet migration and drainage
mechanisms in the mathematical model.
The model also needs to be modified to account for wettability, pore sizes,
geometry effects along with the droplet capture, droplet migration and drainage. Current
model indicates the velocity profile of the dry air. The velocity profile of the air flow has
effect on the droplet capture, migration and drainage of droplets hence it is important to
know the velocity profile in the filter media. But in future the model needs to account for
the droplet capture, droplet migration and drainage in cylindrical coordinates for better
comparison with the experimental results.

181
CHAPTER IX
CONCLUSIONS
This dissertation focuses on improving performance and drainage of coalescing
filters. The objectives of the research work are as follows.
a. Improve performance and drainage of coalescing filters by utilizing the
gravitational force.
b. Develop different filter geometries by incorporating woven and nonwoven
drainage channels. Develop filter geometries by using glass fiber filter media
of similar porosity, permeability and strength.
c. Study the parameters affecting on the improvement of the drainage channel
incorporated filter media and improve the filter media design.
d. Improve the performance of the filter media by developing nanofiber
augmented filter geometries and study the performance of nanofiber
augmented filter geometries experimentally.
e. Develop a composite filter media design. The composite filter media will be
made up of different fiber sizes and it will indicate higher performance than a
filter media made with one size fibers. Evaluate the performance of composite
filter media experimentally.

182
f. Develop a mathematical model of the drainage channel incorporated filter
geometry to predict pressure and velocity profile with no oil drops present at
steady state.
The glass fiber filter media with similar porosity, permeability and strength were
made by adding Megasol® S50 binder by using the vacuum molding process. All The
filter geometries were developed by adding the drainage channels at various positions
along the filter bed length. The middle-drainage and the inclined angle geometries were
developed by cutting the filter discs at different positions and the drainage channel were
incorporated to develop the filter geometries. All filter geometries were tested in
coalescence filtration setup in horizontal and vertical flow orientation to study the effect
of gravitational force on the performance of the filter media. The filter media
performance was expressed in terms of quality factor and saturation. Drainage channel
incorporated filter geometries indicated improved quality factor and drainage. Hence
factors affecting the performance of the filter geometries were experimentally evaluated.
A mathematical model was developed to predict the pressure and velocity profile of the
45 degree filter geometry and was compared with other inclined angle geometries in
horizontal flow orientation.
The results of each work are documented in respective chapters. Several
conclusions are drawn based on those results which are summarized as follows.
• Experimental results indicate that when the air flow is in the direction of
gravitational force the no-drainage channel glass fiber filter media had higher
183
quality factor and lower saturation. Experimental results indicate that gravitational
force helps in enhancing the drainage and performance of filter media.
• No-drainage channel filter media had higher saturation at the inlet and outlet and
low saturation in the middle of the filter media. Hence when drainage channels
are incorporated at the inlet and outlet as well as both-end of the filter media the
filter geometry had higher quality factor and lower saturation.
• Filter geometries developed with three equally spaced drainage channels at 150,
300, 400, 450, 500 and 600 in horizontal flow orientation indicated improved
performance. The Filter geometries equipped with three equally spaced drainage
channels at 450 downward inclination in horizontal flow orientation indicated the
highest quality factor and lowest saturation among all of the filter geometries.
• Filter geometries developed with polypropylene woven drainage channel of 500
µm pore opening and 600 µm filament thickness had best performance among
other polypropylene woven drainage channel filter media that were tested.
• Filter geometries developed with nonwoven drainage channels indicated
improved performance as compared to no-drainage channel filter media.
• Filter geometries developed with polypropylene woven drainage channels of 500
µm pore opening and 600 µm filament thickness indicate better performance than
filter geometries developed with polypropylene spunbond fabric used as drainage
channels. The experimental results showed that regular spaced porous woven
drainage channel are effective in draining the oil droplets from the filter media
compared to the nonuniform pore opening nonwoven drainage channels.

184
• The pore sizes of the drainage channels affect significantly the performance of the
filter geometries. As the basis weight of the spunbond fabric increases the pore
sizes decreases. Hence the basis weight of the drainage channels indicates an
effect on the performance of the filter geometries. As the pore size of the drainage
channel decreases the pressure drop and saturation increases and the quality factor
decreases. Hence the low basis weight drainage channel incorporated filter media
performed better than higher basis weight drainage channels incorporated filter
media. Hence the drainage channel needs to be open structure for draining the
coalesced drops faster from the filter media.
• Surface energy of the drainage channels affects the performance of the filter
geometries significantly. The low surface energy Teflon® incorporated drainage
channels had higher quality factor and lower saturation as compared to the
respective filter geometries developed by incorporating intermediate surface
energy polypropylene. The intermediate surface energy polypropylene
incorporated drainage channels had higher quality factor and drainage and lower
saturation as compared to the respective filter geometries developed by
incorporating high surface energy nylon. Experimental results indicate that low
surface energy drainage channels are effective in draining the oil from the filter
media. It could be the oil droplets beads up on the surface of the low surface
energy drainage channels and due to the porous and open structure of drainage
channels the droplets drains very effectively while for the high surface energy
drainage channels the oil spreads on the drainage channel possibly blocking the
pores of the drainage channels.

185
• Nanofiber incorporated glass fiber filter media had improved quality factor. The
fiber diameter of the nanofiber affect the performance of the nanofiber augmented
filter geometries. Nanofiber incorporated filter geometries had higher capture
efficiency, but as the diameter of the nanofiber decreases the pressure drop
increases moderately due to the “slip flow” condition. Hence as the nanofiber
diameter decreases the quality factor of the filter media increases. Nanofiber
augmented 450 downward inclination filter geometries had significantly higher
quality factor and lower saturation than the no-drainage channel glass fiber as
well as no-drainage channel nanofiber augmented filter media. The 450 downward
inclination filter geometries developed with intermediate surface energy
polypropylene had higher quality factor and lower saturation as compared to the
high surface energy nylon incorporated 450 downward inclination filter
geometries. Experimental results indicate that as the surface energy of the
drainage channel decreases the performance of the nanofiber augmented filter
geometries increases.
• 450 downward inclination filter geometry indicated highest quality factor and
drainage among all the filter geometries developed. Polypropylene woven
drainage channel incorporated 450 geometry indicated relative quality factor of
4.20 while the same geometry with Teflon® woven drainage channels indicated
relative quality factor of 8.89. The 100 nm nanofiber augmented 450 filter
geometry with polypropylene woven drainage channels indicated relative quality
factor of 6.86 while the same geometry with nylon woven drainage channels
indicated a relative quality factor of 3.83.

186
• Composite filter media indicated significantly high pressure drop. The fibers were
layered by changing wettability from high to low along the filter bed length.
olepophilic fibers being at the inlet accumulated the oil droplets. Less oleophilic
fibers were layered after these fibers. Due to the less olephilic nature of the fibers
in the exit side of the filter the oil droplets remained accumulated in the filter
instead of migrating towards the exit boundary and draining from the filter. Hence
the filter media had very less drainage and significantly higher pressure drop.
• 450 downward inclination with three equally spaced drainage channel filter
geometry was modeled using the volume averaging continuum theory. Pressure
and velocity profiles of the drainage channel incorporated filter media were
developed for air flow. The velocity profile of the filter geometry indicates that
the velocity magnitude in the drainage channel is significantly high as compared
to the filter media. Because the drainage channels have lower flow resistance to
air. Hence the pressure drop of 450 downward inclination filter geometry are
significantly lower than the no-drainage channel filter media.
• The 450 filter geometry: The 450 filter geometry in horizontal orientation works
best among all the filter geometries that were developed. The filter geometry
indicates high capture efficiency and significantly low average saturation. The
low average saturation of the media results in significantly low pressure drop
which improves the quality factor of the filter media. We do not fully understand
why the 450 filter geometry works so much better than the other inclined angle
geometries. The performance of the filter media is certainly a function of filter
size, filter geometry, pore sizes, saturation and wettability. In general, but not in

187
every case when the saturation is low, pressure drop is low. Low saturation of the
filter geometry is due to liquid drain faster through the drainage channels. Further
work needs to be done to explain improved performance of the 450 filter geometry
than other filter geometries by studying filter size, filter geometry, spacing
between drainage channels, pore sizes and wettability effects.
188
CHAPTER X
FUTURE WORK
1. Develop filter geometries by incorporating more than three drainage channels at
inclined angles and evaluate the filter media performance. The thickness of the
filter media sections or height between the drainage channels needs to be
optimized to study its effect on the performance of the filter geometries as well as
to further enhance the filter geometry performance.
2. Perform microscopic study to observe drop motion in drainage channel
incorporated filter media when the permeability of drainage channels is higher
than media as well as when the permeability of media is higher than drainage
channels. Filter geometries developed with filter media having high porosity and
permeability but smaller pore sizes as compared to the drainage channels needs to
be tested.
3. Cartridge filters and conical filters are commonly used in industry. Along with
disc shaped media the cartridge shaped and conical shaped filters can be used to
develop new filter geometries.
4. Wettability of drainage channel has proven effect on the performance of the filter
media. Hence filter geometries can be developed by incorporating different
surface energy material drainage channels. Filter can also be made by using fibers

189
of varying surface energy and fiber sizes and the gradient in surface energy of
filter and drainage channel can be studied.
5. Composite filter media with fibers of oleophilic and olephobic nature can be
developed to enhance the performance and drainage of the filter media.
6. The current capture model needs to be optimized for the grid size of anisotropic
media. It also needs to be modified to account for wettability, pore sizes of media
and drainage channel, geometry effects, and size of the filter. Along with these
parameters the model needs to account the capture of droplets, droplet migration
and drainage to predict the overall performance of the media in cylindrical
coordinates for better comparison with the experimental results.

190
BIBLIOGRAPHY
1. Rebours, A., Boulaud, D., Renoux, A. (1992). Production of monodispersed aerosol by evaporation and condensation of vapor under control process. Journal of Aerosol Science, 23 (Suppl. 1), 189.
2. Schaber, K. J., Körber, O., Ofenloch, R., Ehrig, P. D. (2002). Aerosol formation
in gas–liquid contact devices—nucleation, growth and particle dynamics. Chemical Engineering Science, 57 (20), 4345.
3. Gina, L. J., Raynor P. C., Schumann, R. L. (2003). Selecting Fiber Materials to
Improve Mist Filters. Aerosol Science, 34, 1481. 4. Thornburg, J. (2000). Size Distribution of Mist Generated During Metal
Machining. Applied Occupational and Environmental Hygiene, 15(8), 618. 5. Woskie, S. R., Smith, T. J., Hallock, M. F., Hammond, S. K., Rosenthal, F.,
Eisen, E. (1994). Size-Selective Pulmonary Dose Indices for Metal Working Fluid Aerosols in Machining and Grinding Operations in the Automobile Manufacturing Industry. American Industrial Hygiene Association Journal, 55, 20.
6. Gillespie, T., Rideal, E. (1955). On the adhesion of drops and particles on impact
at solid surfaces. Journal of Colloid and Interface Science, 11(10), 281. 7. Retrieved 22 October 2009, from http://www.parker.com 8. Piacitelli, G. M. (2001). Metalworking Fluid Exposures in Small Machine Shops:
An overview. American Industrial Hygiene Association Journal, 62(3), 356. 9. Leith, D., Raynor, P. C., Boundy, M. G., Cooper, S. J. (1996). Performance of
Industrial Equipment to Collect Coolant Mist. American Industrial Hygiene Association Journal, 57, 1142.
10. Leith, D., Leith, F. A., Boundy, M. G. (1996). Laboratory measurements of oil
mist concentrations using filters and an electrostatic precipitator. American Industrial Hygiene Association Journal, 57 (12), 1137.
11. Barhate R.S., Ramakrishna S. (2007). Nanofibrous filtering media: Filtration
problems and solutions from tiny materials, Journal of Membrane Science 296, 1.

191
12. Hei, W. A., Yacher, M., Deye, G. J., Spencer, A. B. (2000). Mist control at a machining center. Part 1: mist characterization. American Industrial Hygiene Association Journal, 61, 275.
13. http://www.parker.com/literature/Racor/7678%20(CCV%20Technical%20Brochu
re).pdf accessed on 26 April 2010. 14. Jandos, E., Lebrun, M., Brezezinski, C., Canizares, S. C. (2007). Filtration
Technologies in the Automotive Industry. Multifunctional barriers for flexible structure, Berlin: Springer, 269.
15. Gunter, K. L., Sutherland, J. W. (1999). An experimental investigation into the
effects of process conditions on the mass concentration of cutting fluid mist in turning. Journal of Cleaner Production, 7, 341.
16. Mehta, K., Chase, G. G., Liu, J., Rangarajan, S. (1999). Development of novel
filter media for coalescence and compressed air filtration. Advances in Filtration and Separation Technology, 13(B), 933.
17. Fochtman, E. J., (1982). Coalescence of water from oil: Single fiber studies,
World Congress III, 654. 18. Jodi, W., Chase, G. G. (1982). Water-based polymer binders for coalescing filters,
Advances in Filtration and Separation Technology, American Filtration and Separations Society, Vol 10, 40.
19. Read, B. (1998). Introduction to coalescence and separation, Advances in
filtration and separation technology, American Filtration and Separations Society, Vol 12, 449.
20. Sherony, D. E., Kintner, R. C., Wasan, D. T. (1978). Coalescence of Secondary
Emulsions in Fibrous Bed. Surface Colloid Science, 10, 99. 21. Viraraghavan, T., Mathavan, G. N., Scoular G. N., Kurucz J. R. L. (1995)
Coalescence/filtration of water-in-oil emulsions, advances in filtration and separation technology, American Filtration and Separations Society, Vol 9, 747.
22. Contal, P., Simao, J., Thomas, D., Frising, T. S., Callé, J. C. (2004). Clogging of
fiber filters by submicron droplets. Phenomena and influence of operating conditions. Journal of Aerosol Science, 35 (2), 245.
23. Moldavsky, L., Fichman, M., Gutfinger, C. (2006). Enhancing the performance
of fibrous filters by means of acoustic waves. Aerosol Science 37, 528.

192
24. Charvet, A., Gonthier, Y., Bernis, A., Gonze E. (2008). Filtration of liquid aerosols with a horizontal fibrous filter, Chemical engineering research and design, 86, 569.
25. Miller, D., Koslow, E. E., Williamson, K. M. (Jul 26, 1988). Coalescing filter for
removal of liquid aerosols from gaseous streams, US Patent 4759782. 26. Juvinall, R. A., Kessin, R. W., Steindler, M. J. (June 1978). Sand-bed filtration of
aerosol: a review of published information of their use in industrial and atomic energy facilities, ANL-7683, Argonne National Laboratory, Argonne, IL.
27. Wang, J., Kim, S. C., Pui, D. Y. H. (2008). Figure of merit of composite filters
with micrometer and nanometer fibers, Aerosol Science and Technology, 42, 722. 28. Liu B. Y. H., Rubow, K. L. (June 1990). Efficiency, pressure drop and figure of
merit of high efficiency fibrous and membrane filter media, 5th World filtration Congress, 112, Paris, France.
29. Brown, R.C. (1993). Air Filtration: An Integrated Approach to the Theory and
Applications of Fibrous Filters, Pergamon Press, New York. 30. Davies, C. N. (1973). Air Filtration. Academic Press Inc, London. 31. Davies, C. N. (1952). The separation of airborne dust and particles, Proceedings
of the Institute of Mechanical Engineers, 18, 185. 32. Stenhouse, J. I. T., Trottier, R. (1991). The Loading of Fibrous Filters with
Submicron Particles. Journal of Aerosol Science, 22 (Suppl. 1), 777. 33. Hunter, G. S., Chalmers, A. G. (Jul 14, 1992). Oil coalescing filter and filtering
process, US Patent 5129923. 34. Hunter, G. S. (July 16, 2002). Coalescing filters, US Patent 6419721 B1. 35. Hunter, A. G. (October 11, 1995). Filter for purification of gas, European patent
618835 B1. 36. Hunter, A. G. (October 14, 1999). Improvements in coalescing filters, WO 51319. 37. Spencer, D. M. (December 4, 2008). The improvements in coalescing filters, WO
146045 A1. 38. Waltl, H. G. A. (October 23, 2008). Improvements in coalescing filters, WO
125885 A2.

193
39. Chokdeepanich, S. (2002). Coalescence filtration and drainage design. Ph.D. dissertation, The University of Akron, Akron, Ohio, USA.
40. Bharadwaj, R., Patel, A., Chokdeepanich, S., Chase, G.G. (2008). Oriented fiber
filter media. Journal of Engineered Fibers and Fabrics, Special Issue 2008 – Filtration, 29.
41. Chase, G.G., Beniwal, V., Venkataraman, C. (2000). Measurement of uni-axial
fiber angle in non-woven fibrous media. Chemical Engineering Science, 55 (12), 2151.
42. Andan S., Hariharan S. I., Chase G. G. (May 2008). Modeling of saturation in
coalescence filtration. American Filtration and Separations Society, 22th annual conference, Valley Forge, PA, USA.
43. S. Andan, S. (2010). Modeling of drainage in coalescing filters. PhD Dissertation,
The University of Akron, Akron, Ohio, USA. 44. Andan, S., Hariharan, S. I., Chase, G. G. (2008). Continuum model evaluation of
the effect of saturation on coalescence filtration, Separation Science and Technology, 43, 1955.
45. Richardson, J. G., Kerver, J. L., Hafford, J. A., Osaba, J. (1952). Laboratory
measurements of relative permeability, AIME transactions, 195. 46. Bitten, J. F., Fochtman, E. G. (1971). Water distribution in Fibrous bed
coalescers. Journal of Colloid and Interface Science, 37(2), 312. 47. Dawar, S., Chase, G. G. (2010). Correlations for transverse motion of liquid drops
on fibers. Separation and Purification Technology, 72, 282. 48. Dawar, S. Chase, G. G. (2008). Drag correlation for axial motion of drops on
fibers. Separation and Purification Technology 60, 6. 49. Mullins, B. J., Braddock, A., Roger, D. and Agranovski, I. E. (2004). Particle
Capture Processes and Evaporation on a Microscopic Scale in Wet Filters. Journal of Colloid and Interface Science, 279, 213.
50. Mead-Hunter, R., Mullins, B. J., Kampa, D., Kasper, G. (2009). Predicting
saturation in coalescing filters-capillary based model. American Filtration and Separations Society Conference, Bloomington, Minnesota, USA.
51. http://www.engr.utk.edu/mse/Textiles/Nanofiber%20Nonwovens.htm accessed on
28 May 2010.
194
52. Kosmider K., Scott J. (July/August 2002). Polymeric nanofibers exhibit an enhanced air filtration performance. Filtration + Separation. Featured article, Vol.39 (6), 20.
53. Shin, C., Chase, G. G. (2006). Separation of liquid drops from air by glass fiber filters augmented with polystyrene nanofibers. Journal of Dispersion Science and Technology, 27, 5.
54. Dharmanolla S. (2007). A computer program for filter media design optimization.
Master’s thesis, The University of Akron, Akron, Ohio, USA. 55. Rangarajan S. (2001). Nanofibers in coalescer filter media. Master’s thesis, The
University of Akron, Akron, Ohio, USA. 56. Srinivasan, P., Chase, G. G. (2005). Steady State Filter Media Performance
Modeling with and without Nanofibers. American Filtration and Separations Society: 18th Annual Conference, Atlanta, Georgia, USA.
57. George, J. (March 2007). Nanofiber manufacturing processes for filtration media.
American Filtration & Separation Society Annual Conference, Orlando, Florida, USA.
58. Gopal R., Kaur, S., Maa, Z., Chanc, C., Ramakrishna, S., Matsuura, T. (2006).
Electrospun nanofibrous filtration membrane. Journal of Membrane Science 281, 581.
59. Yoon, K., Hsiao, B. S., Chu, B. (2008). Functional nanofibers for environmental
applications. Journal of Materials Chemistry, 18, 5326. 60. Wang, H., Fu, G, Li, X. (2009). Functional Polymeric Nanofibers from
Electrospinning. Recent Patents on Nanotechnology, 3, 21. 61. Zhang, S., Shim, W. S., Kim, S. J. (2009). Design of ultra-fine nonwovens via
electrospinning of Nylon 6: spinning parameters and filtration efficiency, materials and design. Korean Journal of Chemical Engineering, 30, 3659.
62. Kim, G. T., Ahn, Y. C., Le, J. K. (2008). Characteristics of Nylon 6 nanofilter for
removing ultra fine particles. Korean Journal of Chemical Engineering, 25(2), 368.
63. Bitten, J. F., Fochtman, E. G. (1971). Water Distribution in Fibrous Bed
Coalescers. Journal of Colloid and Interface Science, 37(2), 312. 64. Happel J. (1959). Viscous flow relative to arrays of cylinders, American Institute
of Chemical Engineers, Journal 5 (2), 174.

195
65. Kuwabara, S. (1959). The forces experienced by randomly distributed parallel
circular cylinders of spheres in a viscous flow at small Reynolds number. Journal of the Physical Society of Japan, 14 (4), 527.
66. Hasimoto, H. (1959). On the periodic fundamental solutions of the Stokes
equations and their application to viscous flow past a cubic array of spheres. Journal of Fluid Mechanics, 5 (A335), 355.
67. Spielman, L., Goren, S. L. (1968). Model for predicting pressure drop and
filtration efficiency in fibrous media. Environmental Science and Technology, 2, 279.
68. Krisch, A. A., Fuchs, N. A. (1967). The fluid flow in a system of parallel
cylinders perpendicular to the flow direction at small Reynolds numbers, Journal of Fluid Mechanics, 22, 1251.
69. Davies, C. N. (1952). The separation of airborne dust and particle. Proceedings of
Institute of Mechanical Engineers, B1 185, London, United Kingdom. 70. Jackson G. W., James D. F. (1984). The permeability of fibrous porous media,
Canadian Journal of Chemical Engineering 64 (3), 364. 71. Jaganathan S., Vahedi Tafreshi H., Pourdeyhimi B. (2008). On the pressure drop
prediction of filter media composed of fibers with bimodal diameter distributions, Powder Technology 181, 89.
72. Frising T., Thomas D., Contal1 P., Bé mer D., Leclerc D. (2003). Influence of
filter fiber size distribution on filter efficiency calculations, Trans I ChemE, Vol 81, Part A, 1179.
73. Brown R. C. (1984). A many-fiber model for airflow through a fibrous filter,
Journal of Aerosol Science Vol. 15, 583. 74. Walsh, D., Stenhouse, I. (1996). Experimental Studies of Electrically Active
Fibrous Filter Loading. Particle & Particle Systems Characterization, 13(1), 47. 75. Vasudevan G. (2005). Modeling and testing of the transient phase of coalescence
filtration PhD Dissertation, The University of Akron, Akron, Ohio, USA. 76. Vasudevan, G., Shin, C.G., Raber, B., Suthar A., Chase, G.G. (2002). Modeling
the startup stage of coalescence filtration, Fluid Particle Separation Journal, 14(3), 169.

196
77. Vasudevan, G., S.I. Hariharan, S. I., Chase, G. G. (2005). Modeling the loading stage in coalescence filtration, Journal of Porous Media, 8(3), 299.
78. Retrieved on 1 June 2010, from http://www.lubrizonl.com. 79. http://www.wesbond.com/westar+.htm accessed on 10 May 2010.
80. http://www.wesbond.com/megasol_s50.htm accessed on 12 April 2010.
81. Srinivasan, P. (2005). Nanofiber incorporated glass fiber filter media, The University of Akron, Akron, Ohio, USA.
82. Jodi W. (1999). Permeability study on laboratory scale water-based coalescing filter, Master’s thesis, The University of Akron, Akron, Ohio.
83. http://www.drgair.com/Sullube-MSDS.pdf accessed on 10 May 2010.
84. http://www2.dupont.com/Separation_Solutions/en_US/tech_info/spunbonded/spu
nbound_poly.html accessed on 24 May 2010.
85. http://www.ktnonwoven.com/ accessed on 24 May 2010.
86. http://www.spunfab.com/products/index.html accessed on 25 May 2010.
87. Cassie, A.B. D., Baxter, S. (1944). Wettability of Porous Surfaces. Transactions of Faraday Society, 40, 546.
88. Chase, G. G. (April 2007). Improved microfiber filter performance by augmentation with nanofibers, Society of Automotive Engineers, Detroit, Michigan, USA.

197
89. Davies C.N. (1948). Fibrous filters for dust and smoke, Proceedings of 9th International Medical Congress, London, United Kingdom.
90. Taylor, G. I. (1964). Disintegration of water drops in an electric field. Proceedings of Royal Society of London, London, United Kingdom.
91. Yarin, A. L., Koombhongse, S., Reneker, D. H. (2001). Taylor Cone and Jetting from Liquid droplets in Electrospinning of Nanofibers, Physics of Fluids, 90 (9).
92. Reneker D. H., Yarin A.L., Fong H., Koombhongse S. (2000). Bending Instability of electrically charged liquid jets of polymer solutions in electrospinning, Journal of Applied Physics, 87, 4531.
93. Doshi, J., Reneker, D. H. (1995). Electrospinning process and application of electrospun fibers. Journal of Electrostatics, 35, 151.
94. Renekar D. H., Yarin, A. L., Hao, F., Koombhongse. S. (2000). Bending instability of electrically charged liquid jets of polymer solutions in electrospinning. Journal of Applied Physics, 87, 4531.
95. Deitzwl, J. M., Kleinmeyer, J. D., Harris D., Becktan, N. C. (2001). The effect of processing variables on the morphology of electrospun nanofibers and textiles. Polymer, 42, 261.
96. Ahn, Y. C., Park, S. K., Kim, G. T., Hwang, Y. J., Lee, C. G., Shin H. S., Lee, J. K. (2006). Development of high efficiency nanofilters made of nanofibers. Current Applied Physics, 6 (6), 1030.
97. Pedicini A., Farris R. J. (2004). Thermally induced color change in electrospun fiber mats. Journal of Polymer Science Part B: Polymer Physics, 42(5), 752.

198
98. Deitze, J. M., Kosik, W., McKnight, S. H., Beak-Tan N. C., Desimone J. M., Crette S. (2002). Electrospinning of polymer nanofibers with specific surface chemistry. Polymer, 43(3), 1025.
99. Dai, H., Gong, J., Kim, H. Y., Lee, D. R. (2002). A novel method for preparing ultra-fine alumina-borate oxide fibres via an electrospinning technique, Nanotechnology, 13, 674.
100. Fong, H., Reneker, D. H. (1999). Elastomeric nanofibers of styrene-butadiene-styrene triblock copolymer, Journal of Polymer Science B: Polymer Physics 37, 3488.
101. http://www.nanopeutics.net/nanospider.html accessed on 31 May 2010.
102. http://www.elmarco.cz/technology/nanospider%3Csup%3Etm%3Csup%3E-technology/ accessed on 31 May 2010.
103. Graham, K., Ouyang, M., Raether, T. Grafe, B. McDonald T., Knauf, P. (April 2002). Polymeric nanofibers in air filtration applications, 15th Annual Technical Conference & Expo of the American Filtration & Separations Society, Galveston, Texas, USA.
104. Bachmat, Y., Bear, J. (1972). Macroscopic Modeling of Transport Phenomena in Porous Media. Transport in Porous Media, 1, 213.
105. Hassanizadeh S. M., Gray, W. G. (1980). General Conservation Equations for Multi-phase Systems: 3. Constitutive Theory for Porous Media Flow, Advances in Water Resources, 3 (1), 25.
106. Bear, J. (1972). Dynamics of Fluids in Porous Media, American Elsevier Publishing Company, New York.

199
107. Gray, W. G., Hassanizadeh, S. M. (1998). Macroscale Continuum Mechanics for Multiphase Porous Media flow Including Phases, Interfaces, Common Lines and Common Points, Advances in Water Resources, 21, 261.
108. Willis, M. S., Tosun, I., Choo, W., Chase, G. G., Desai, F. (1991). A Dispersed Multiphase Theory and its Application to Filtration. In M. Y. Corapcioglu (Ed.), Advances in porous media, Elsevier, Amsterdam.
109. Hassanizadeh, M., Gray, W. G. (1979). General Conservation Equations for Multi-phase Systems: 1 Averaging Procedure, Advances in Water Resources, 2, (3), 131.
110. Hassanizadeh, M. Gray, W. G. (1979). General Conservation Equations for Multi-phase Systems: 2, Mass, Momentum, Energy, and Entropy Equations. Advances in Water Resources, 2, (4), 191.
111. Whitaker, S. (1969). Advances in theory of fluid motion in porous media, Industrial and Engineering Chemistry, 61(12), 14.
112. Dullien, F. A. L. (1992). Porous Media: Fluid Transport and Pore Structure, Academic Press, San Diego.
113. Coulson, J. M., Richardson, J. F., Backhurst, J. R., Harker, J. H. (1991). Chemical Engineering, Volume 2, Particle Technology and Separation Processes, Pergamon, Oxford.
114. Guin, J. A., Kessler, D. P., Greenkorn, R. A. (1971). The permeability tensor for anisotropic non-uniform porous media, Chemical Engineering Science, 26, 1475.
115. Slattery, J. C. (1981). Momentum, Energy, and Mass Transfer in Continua, Krieger, Huntington.

200
116. Knupp, P., Steinberg, S. (1993). Fundamentals of grid generation, CRC Press, Bocaraton.
117. Spiegel, M. R. (1959). Vector Analysis, Schaum’s Outline Series, McGraw-Hill, New York.
118. Eringen, A. C. (1980). Mechanics of Continua, Krieger, Huntington.
119. http://people.sc.fsu.edu/~burkardt/f_src/vector_plot/vector_plot.html accessed on 16 June, 2010.
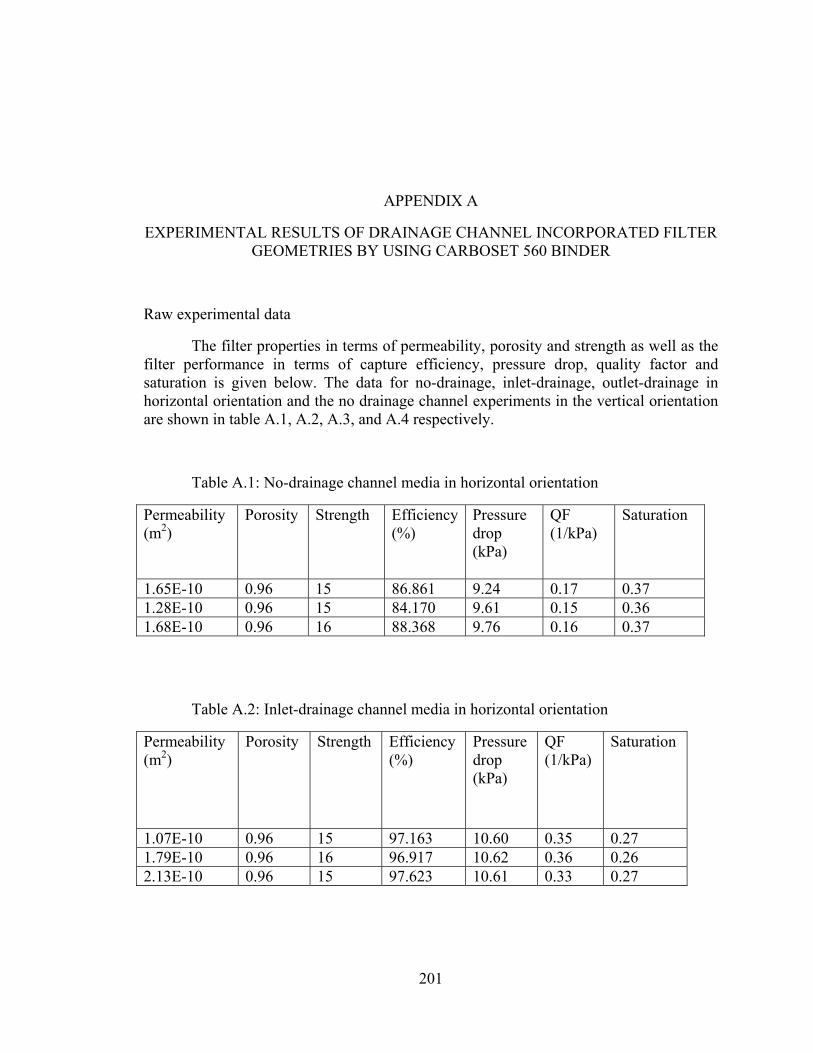
201
APPENDIX A
EXPERIMENTAL RESULTS OF DRAINAGE CHANNEL INCORPORATED FILTER GEOMETRIES BY USING CARBOSET 560 BINDER
Raw experimental data
The filter properties in terms of permeability, porosity and strength as well as the filter performance in terms of capture efficiency, pressure drop, quality factor and saturation is given below. The data for no-drainage, inlet-drainage, outlet-drainage in horizontal orientation and the no drainage channel experiments in the vertical orientation are shown in table A.1, A.2, A.3, and A.4 respectively.
Table A.1: No-drainage channel media in horizontal orientation
Permeability (m2)
Porosity Strength Efficiency (%)
Pressure drop (kPa)
QF (1/kPa)
Saturation
1.65E-10 0.96 15 86.861 9.24 0.17 0.37 1.28E-10 0.96 15 84.170 9.61 0.15 0.36 1.68E-10 0.96 16 88.368 9.76 0.16 0.37
Table A.2: Inlet-drainage channel media in horizontal orientation
Permeability (m2)
Porosity Strength Efficiency (%)
Pressure drop (kPa)
QF (1/kPa)
Saturation
1.07E-10 0.96 15 97.163 10.60 0.35 0.27 1.79E-10 0.96 16 96.917 10.62 0.36 0.26 2.13E-10 0.96 15 97.623 10.61 0.33 0.27

202
Table A.3: Outlet-channel drainage media in horizontal orientation
Permeability (m2)
Porosity Strength Efficiency (%)
Pressure drop (kPa)
QF (1/kPa)
Saturation
3.81E-10 0.95 16 98.112 10.65 0.36 0.26 1.35E-10 0.96 17 95.516 10.66 0.35 0.26 1.06E-10 0.95 16 94.390 10.63 0.35 0.27
Table A.4: No-drainage channel media in vertical orientation
Permeability (m2)
Porosity Strength Efficiency (%)
Pressure drop (kPa)
QF (1/kPa)
Saturation
1.49E-10 0.96 17 98.933 10.51 0.45 0.24 1.01E-10 0.96 15 98.859 10.53 0.44 0.25 1.17E-10 0.96 15 98.669 10.48 0.44 0.24

203
APPENDIX B
FORTRAN CODE FOR DRAINAGE CHANNEL INCORPORATED FILTER MEDIA
! PROGRAM THREE DRAINAGE CHANNELS ! George G Chase and Shagufta U Patel ! THIS PROGRAM SOLVES THE 2D MASS AND MOMENTUM BALANCES FOR ! PERMEABLE FLOW THROUGH A POROUS MEDIUM WITH THREE DRAINAGE ! CHANNELS ! IMPERMEABLE ! SURFACE ! X07, Y07 +**********+ X17, Y17 THE DIAGRAM SHOWS THE ! +...................+ LOCATION OF THE CORNER ! +...................+ POINTS OF EACH REGION ! +...................+ OUTLET REGIONS: MEDIUM, CHANNEL ! X06, Y06 ++.MEDIUM.+ PRESSURE ! +.+.............+ SURFACE ! X05, Y05 +.+..+...........+ POUT ! +...+..+........+ MEDIUM => REGION 7 ! INLET +.....+..+......+ ! PRESSURE +.......+..+....+ ! SURFACE +.........+..+..+ ! PIN +...........+..++ X16,Y16 ! X04, Y04 ++............+.+ CHANNEL => REGION 6 ! +..+............+ X15,Y15 ! X03, Y03 +.+..+..........+ ! +...+..+........+ ! +.....+..+......+ MEDIUM => REGION 5 ! +.......+..+....+ ! +.........+..+..+ ! X02, Y02 ++..........+..++ X14, Y14 ! +.+...........+.+ CHANNEL => REGION 4 ! X01, Y01 ++..+...........+ X13, Y13 ! +..+..+.........+ ! +....+..+.......+ MEDIUM => REGION 3 ! +......+..+.....+ ! +........+..+...+ ! +..........+..+.+ X12,Y12 ! +MEDIUM.+. CHANNEL => REGION 2 ! +...............++ X11, Y11

204
! +................+ ! +................+ MEDIUM => REGION 1 ! X00, Y00 +********+ X10,Y10 ! IMPERMEABLE SURFACE ! THE PROGRAM IS BASED UPON THE PROGRAMS DESCRIBED IN ! P KNUPP, S STEINBERG, FUNDAMENTALS OF GRID GENERATION, ! CRC PRESS, BOCA RATON, 1993. ! RUN THIS PROGRAM TO CALCULATE THE PRESSURE FIELD AND THE VELOCITY ! PROFILES. RUN VECTOR_PLOT TO CREATE FILES THAT SHOW THE VELOCITY VECTORS. ! THE PROGRAM SOLVES THE MASS AND MOMENTUM BALANCES IN THE FORM ! ! MASS del(por v) = 0 por=porosity, v=pore avg velocity ! ! MOMENTUM por v = PERMX K del P / vis DARCY'S LAW ! k=dimensionless permeability = perm/permx ! P=pressure ! |K11 K12| vis = viscosity ! K= |K21 K22| K=DIMENSIONLESS anisotropic permeability ! F=P/PDROP dimensionless pressure ! ! COMBINED EQUATIONS ! del( k del f)=g g=forcing function (g=0 in this application) ! ! THE ANISOTROPIC PERMEABILITY IS PROGRAMMED AS A FUNCTION OF POSITION ! WHERE ! K11=ALP(X,Y), K12=K21=BET(X,Y), K22=GAM(X,Y) ! ! THE COMPUTER CODE SOLVES THE COMBINED EQUATION IN THE FORM ! L(F) = g (where g=0) ! WHERE ! L(F) = (alp * f_x)_x f_x is df/dx, etc. ! + (bet * f_x)_y F IS THE DIMENSIONLESS PRESSURE ! + (bet * f_y)_x ! + (gam * f_y)_y ! ! THE VELOCITY PROFILE IS DETERMINED FROM THE PRESSURE FIELD ! BY APPLYING DARCY'S LAW ! UNITS !PRESSURE IS IN Pa BUT F = DIMENSIONLESS PRESSURE, F = P/PRESSURE DROP ! X, Y LENGTHS IN m ! VISCOSITY IN kg/m/s ! PERMEABILITY IN m^2 ALP, BET, GAM = DIMENSIONLESS PERMEABILITY ! = PERM/PERMX ! VELOCITY IN m/s !***************************************************************************** ! MAIN PROGRAM
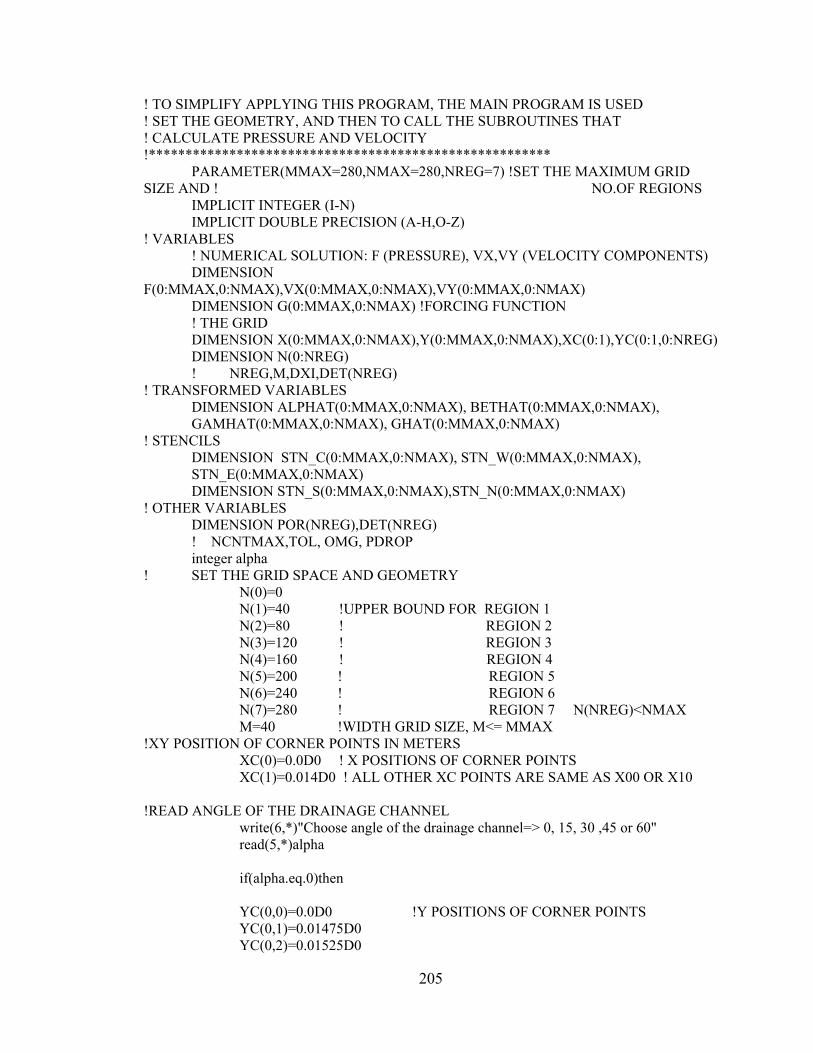
205
! TO SIMPLIFY APPLYING THIS PROGRAM, THE MAIN PROGRAM IS USED ! SET THE GEOMETRY, AND THEN TO CALL THE SUBROUTINES THAT ! CALCULATE PRESSURE AND VELOCITY !******************************************************* PARAMETER(MMAX=280,NMAX=280,NREG=7) !SET THE MAXIMUM GRID SIZE AND ! NO.OF REGIONS IMPLICIT INTEGER (I-N) IMPLICIT DOUBLE PRECISION (A-H,O-Z) ! VARIABLES ! NUMERICAL SOLUTION: F (PRESSURE), VX,VY (VELOCITY COMPONENTS) DIMENSION F(0:MMAX,0:NMAX),VX(0:MMAX,0:NMAX),VY(0:MMAX,0:NMAX) DIMENSION G(0:MMAX,0:NMAX) !FORCING FUNCTION ! THE GRID DIMENSION X(0:MMAX,0:NMAX),Y(0:MMAX,0:NMAX),XC(0:1),YC(0:1,0:NREG) DIMENSION N(0:NREG)
! NREG,M,DXI,DET(NREG) ! TRANSFORMED VARIABLES
DIMENSION ALPHAT(0:MMAX,0:NMAX), BETHAT(0:MMAX,0:NMAX), GAMHAT(0:MMAX,0:NMAX), GHAT(0:MMAX,0:NMAX)
! STENCILS DIMENSION STN_C(0:MMAX,0:NMAX), STN_W(0:MMAX,0:NMAX), STN_E(0:MMAX,0:NMAX)
DIMENSION STN_S(0:MMAX,0:NMAX),STN_N(0:MMAX,0:NMAX) ! OTHER VARIABLES DIMENSION POR(NREG),DET(NREG) ! NCNTMAX,TOL, OMG, PDROP integer alpha ! SET THE GRID SPACE AND GEOMETRY N(0)=0 N(1)=40 !UPPER BOUND FOR REGION 1 N(2)=80 ! REGION 2 N(3)=120 ! REGION 3 N(4)=160 ! REGION 4 N(5)=200 ! REGION 5 N(6)=240 ! REGION 6 N(7)=280 ! REGION 7 N(NREG)<NMAX M=40 !WIDTH GRID SIZE, M<= MMAX !XY POSITION OF CORNER POINTS IN METERS XC(0)=0.0D0 ! X POSITIONS OF CORNER POINTS XC(1)=0.014D0 ! ALL OTHER XC POINTS ARE SAME AS X00 OR X10 !READ ANGLE OF THE DRAINAGE CHANNEL write(6,*)"Choose angle of the drainage channel=> 0, 15, 30 ,45 or 60" read(5,*)alpha if(alpha.eq.0)then YC(0,0)=0.0D0 !Y POSITIONS OF CORNER POINTS YC(0,1)=0.01475D0 YC(0,2)=0.01525D0

206
YC(0,3)=0.02975D0 YC(0,4)=0.03025D0 YC(0,5)=0.04475D0 YC(0,6)=0.04525D0 YC(0,7)=0.06D0 YC(1,0)=Y(0,0) YC(1,1)=0.01475D0 YC(1,2)=0.01525D0 YC(1,3)=0.02975D0 YC(1,4)=0.03025D0 YC(1,5)=0.04475D0 YC(1,6)=0.04525D0 YC(1,7)=0.060D0 PDROP=2150.0D0 ! PRESSURE DROP, Pa Angle=atan((XC(1)-XC(0))/(YC(0,1)-YC(1,1))) !Angle in radians else if(alpha.eq.15)then YC(0,0)=0.0D0 !Y POSITIONS OF CORNER POINTS YC(0,1)=0.014D0 YC(0,2)=0.0145D0 YC(0,3)=0.03162D0 YC(0,4)=0.03212D0 YC(0,5)=0.04925D0 YC(0,6)=0.04975D0 YC(0,7)=0.06D0 YC(1,0)=Y(0,0) YC(1,1)=0.01025D0 YC(1,2)=0.01075D0 YC(1,3)=0.02787D0 YC(1,4)=0.02837D0 YC(1,5)=0.0455D0 YC(1,6)=0.0460D0 YC(1,7)=0.060D0 PDROP=2150.0D0 ! PRESSURE DROP, Pa Angle=atan((XC(1)-XC(0))/(YC(0,1)-YC(1,1))) !Angle in radians else if(alpha.eq.30)then YC(0,0)=0.0D0 !Y POSITIONS OF CORNER POINTS YC(0,1)=0.01835D0 YC(0,2)=0.01885D0 YC(0,3)=0.0338D0 YC(0,4)=0.0343D0 YC(0,5)=0.04925D0 YC(0,6)=0.04975D0 YC(0,7)=0.06D0

207
YC(1,0)=Y(0,0) YC(1,1)=0.01025D0 YC(1,2)=0.01075D0 YC(1,3)=0.0257D0 YC(1,4)=0.0262D0 YC(1,5)=0.04115D0 YC(1,6)=0.04165D0 YC(1,7)=0.060D0 PDROP=2150.0D0 ! PRESSURE DROP, Pa Angle=(atan((XC(1)-XC(0))/(YC(0,1)-YC(1,1)))) !Angle in radians else if(alpha.eq.60)then YC(0,0)=0.0D0 !Y POSITIONS OF CORNER POINTS YC(0,1)=0.0293D0 YC(0,2)=0.0298D0 YC(0,3)=0.0419D0 YC(0,4)=0.0424D0 YC(0,5)=0.0545D0 YC(0,6)=0.055D0 YC(0,7)=0.06D0 YC(1,0)=Y(0,0) YC(1,1)=0.005D0 YC(1,2)=0.0055D0 YC(1,3)=0.0176D0 YC(1,4)=0.0181D0 YC(1,5)=0.0302D0 YC(1,6)=0.0307D0 YC(1,7)=0.060D0 PDROP=2150.0D0 ! PRESSURE DROP, Pa Angle=(atan((XC(1)-XC(0))/(YC(0,1)-YC(1,1)))) !Angle in radians else if(alpha.eq.45)then YC(0,0)=0.0D0 !Y POSITIONS OF CORNER POINTS YC(0,1)=0.01925D0 YC(0,2)=0.01975D0 YC(0,3)=0.03675D0 YC(0,4)=0.03725D0 YC(0,5)=0.05425D0 YC(0,6)=0.05475D0 YC(0,7)=0.06D0 YC(1,0)=Y(0,0) YC(1,1)=0.00525D0 YC(1,2)=0.00575D0 YC(1,3)=0.02275D0

208
YC(1,4)=0.02325D0 YC(1,5)=0.04025D0 YC(1,6)=0.04075D0 YC(1,7)=0.060D0 PDROP=2150.0D0 ! PRESSURE DROP, Pa Angle=(atan((XC(1)-XC(0))/(YC(0,1)-YC(1,1)))) !Angle in radians end if ! CALCULATE THE GRID SPACING XM=M DXI=1.0D0/XM DO K = 1,NREG XN=N(K)-N(K-1) DET(K)=1.0D0/XN ENDDO ! ! SOLVER PARAMETERS NCNTMAX=5000000 ! MAXIMUM NUMBER OF ITERATIONS IN THE CALCULATIONS TOL = 1.D-12 ! ERROR TOLERANCE FOR CONVERGENCE OF POINTS IN ITERATIONS OMG = 1.2D0 ! RELAXATION PARAMETER TO SPEED UP CONVERGENCE ! ! CREATE THE GRID FOR EACH REGION DO K=1,NREG CALL GRID_GEN(M,MMAX,N,NMAX,NREG,X,Y,DXI,DET,XC,YC,K) ENDDO ! ! SET THE FORCING FUNCTION, G DO J=0,N(NREG) DO I=0,M G(I,J)=0.0D0 ENDDO ENDDO ! ! MEDIUM MATERIAL AND OPERATING CONDIIONS POR(1)=0.96D0 ! POROSITY OF EACH REGION POR(2)=0.9864D0 POR(3)=0.96D0 POR(4)=0.9864D0 POR(5)=0.96D0 POR(6)=0.9864D0 POR(7)=0.96D0 VIS=0.00001D0 ! VISCOSITY, Kg/m/s, AIR PERMX=3.389D-09 ! PERMEABILITY SCALE FACTOR TO MAKE ! DIMENSIONLESS PERMEABILITY ABOUT 0 - 1

209
write(6,*)"Calculating..." ! SET UP FIXED BOUDARY CONDITIONS DO J=0,N(NREG) F(0,J)=1.0D0 !INLET DIMENSIONLESS PRESSURE F(M,J)=0.0D0 !OUTLET DIMENSIONLESS PRESSURE ENDDO ! ! INITIAL GUESS FOR F INTERIOR POINTS DO I=1,M-1 DO J=0,N(NREG) !ASSUME A LINEAR APPROXIMATION D=I ! DISTANCE=D, SLOPE=(FMJ-F0J)/1.0 D=D*DXI ! INTERCEPT = F0J F(I,J)=(F(M,J)-F(0,J))*D+F(0,J) ENDDO ENDDO ! ! CALCULATE THE TRANSFORMED COEFFICIENTS DO K=1,NREG CALL TRANS(M,MMAX,N,NMAX,NREG,X,Y,G,DXI,DET, & ALPHAT,BETHAT,GAMHAT,GHAT,K,ANGLE) ENDDO ! LOAD THE STENCILS DO K=1,NREG call stencils(m, mmax, n, nmax,NREG,K,& alphat, bethat, gamhat,det,dxi,& stn_c,& stn_w, stn_e, stn_s, stn_n,& stn_ne, stn_nw, stn_se, stn_sw) ENDDO ! ! SOLVE THE LINEAR SYSTEM OF EQUATIONS call sor_9pt(m, mmax, n, nmax, NREG, ncntmax, tol, omg,& stn_c,& stn_w, stn_e, stn_s, stn_n,& stn_ne, stn_nw, stn_se, stn_sw, ghat, f,X,Y,& ANGLE) ! ! CALCULATE THE VELOCITY PROFILES call velocity(m,mmax,n,nmax,NREG,f,x,y,& det,dxi,PDROP,POR,PERMX,VIS,ANGLE) ! ! OUTPUT RESULTS call results(m,mmax,n,nmax,NREG,f) ! end ! ! ********************************************************************
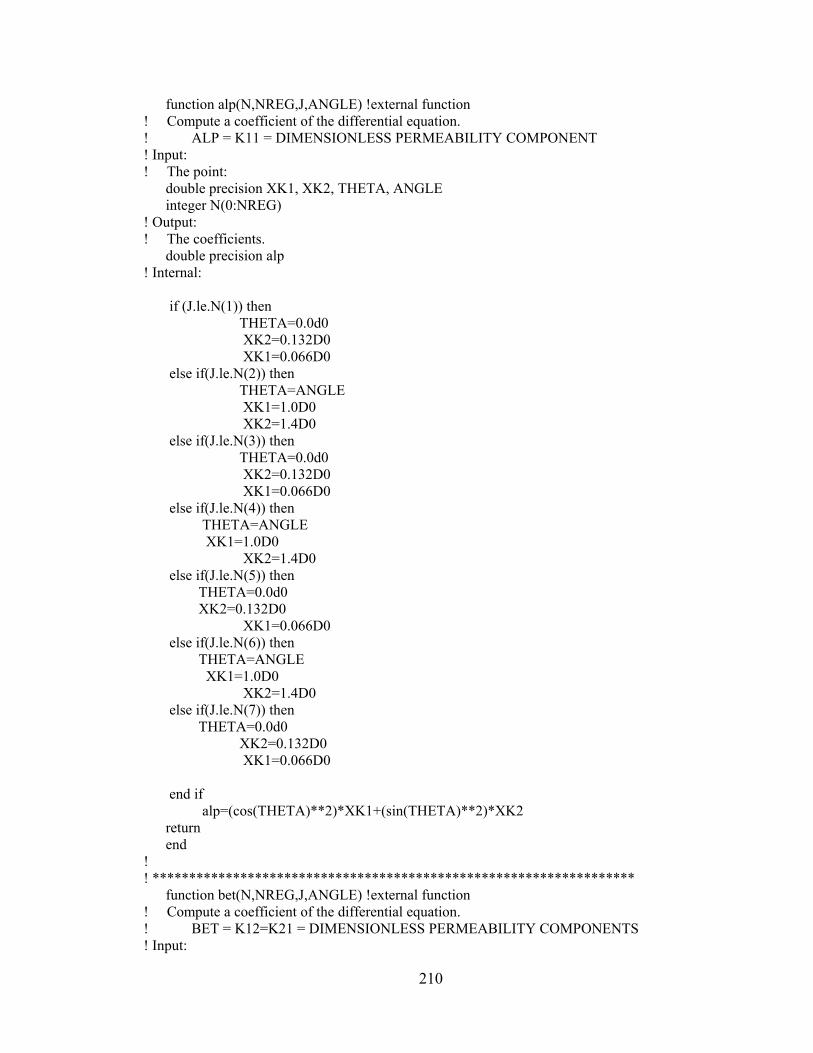
210
function alp(N,NREG,J,ANGLE) !external function ! Compute a coefficient of the differential equation. ! ALP = K11 = DIMENSIONLESS PERMEABILITY COMPONENT ! Input: ! The point: double precision XK1, XK2, THETA, ANGLE integer N(0:NREG) ! Output: ! The coefficients. double precision alp ! Internal: if (J.le.N(1)) then THETA=0.0d0 XK2=0.132D0 XK1=0.066D0 else if(J.le.N(2)) then THETA=ANGLE XK1=1.0D0 XK2=1.4D0 else if(J.le.N(3)) then THETA=0.0d0 XK2=0.132D0 XK1=0.066D0 else if(J.le.N(4)) then THETA=ANGLE XK1=1.0D0 XK2=1.4D0 else if(J.le.N(5)) then THETA=0.0d0 XK2=0.132D0 XK1=0.066D0 else if(J.le.N(6)) then THETA=ANGLE XK1=1.0D0 XK2=1.4D0 else if(J.le.N(7)) then THETA=0.0d0 XK2=0.132D0 XK1=0.066D0 end if alp=(cos(THETA)**2)*XK1+(sin(THETA)**2)*XK2 return end ! ! ****************************************************************** function bet(N,NREG,J,ANGLE) !external function ! Compute a coefficient of the differential equation. ! BET = K12=K21 = DIMENSIONLESS PERMEABILITY COMPONENTS ! Input:

211
! The point: double precision XK1, XK2, THETA, ANGLE integer N(0:NREG) ! Output: ! The coefficient double precision bet ! Internal: ! if (J.le.N(1)) then THETA=0.0d0 XK2=0.132D0 XK1=0.066D0 else if(J.le.N(2)) then THETA=ANGLE XK1=1.0D0 XK2=1.4D0 else if(J.le.N(3)) then THETA=0.0d0 XK2=0.132D0 XK1=0.066D0 else if(J.le.N(4)) then THETA=ANGLE XK1=1.0D0 XK2=1.4D0 else if(J.le.N(5)) then THETA=0.0d0 XK2=0.132D0 XK1=0.066D0 else if(J.le.N(6)) then THETA=ANGLE XK1=1.0D0 XK2=1.4D0 else if(J.le.N(7)) then THETA=0.0d0 XK2=0.132D0 XK1=0.066D0 end if bet=(cos(THETA)*sin(THETA)*(XK2-XK1)) return end ! ! ******************************************************************************* function gam(N,NREG,J,ANGLE) !external function ! GAM = K22 DIMENSIONLESS PERMEABILITY COMPONENT ! ! Input: ! The point: double precision XK1, XK2, THETA, ANGLE integer N(0:NREG)
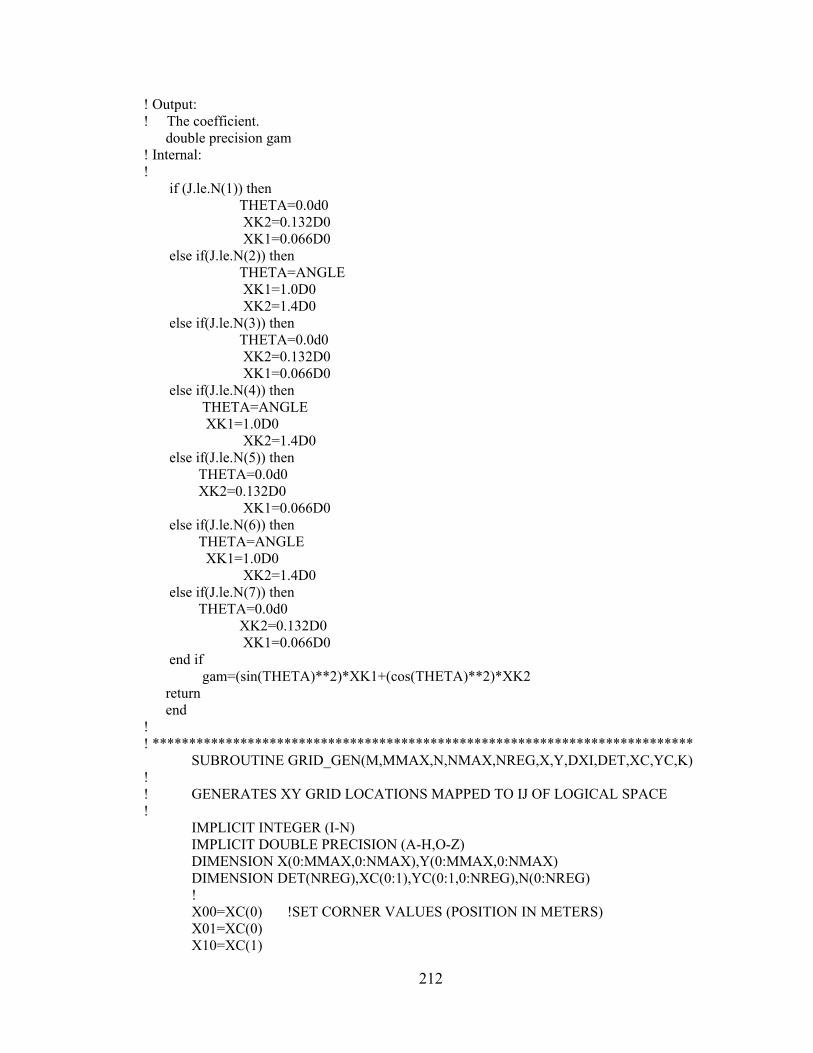
212
! Output: ! The coefficient. double precision gam ! Internal: ! if (J.le.N(1)) then THETA=0.0d0 XK2=0.132D0 XK1=0.066D0 else if(J.le.N(2)) then THETA=ANGLE XK1=1.0D0 XK2=1.4D0 else if(J.le.N(3)) then THETA=0.0d0 XK2=0.132D0 XK1=0.066D0 else if(J.le.N(4)) then THETA=ANGLE XK1=1.0D0 XK2=1.4D0 else if(J.le.N(5)) then THETA=0.0d0 XK2=0.132D0 XK1=0.066D0 else if(J.le.N(6)) then THETA=ANGLE XK1=1.0D0 XK2=1.4D0 else if(J.le.N(7)) then THETA=0.0d0 XK2=0.132D0 XK1=0.066D0 end if gam=(sin(THETA)**2)*XK1+(cos(THETA)**2)*XK2 return end ! ! ************************************************************************** SUBROUTINE GRID_GEN(M,MMAX,N,NMAX,NREG,X,Y,DXI,DET,XC,YC,K) ! ! GENERATES XY GRID LOCATIONS MAPPED TO IJ OF LOGICAL SPACE ! IMPLICIT INTEGER (I-N) IMPLICIT DOUBLE PRECISION (A-H,O-Z) DIMENSION X(0:MMAX,0:NMAX),Y(0:MMAX,0:NMAX) DIMENSION DET(NREG),XC(0:1),YC(0:1,0:NREG),N(0:NREG) ! X00=XC(0) !SET CORNER VALUES (POSITION IN METERS) X01=XC(0) X10=XC(1)
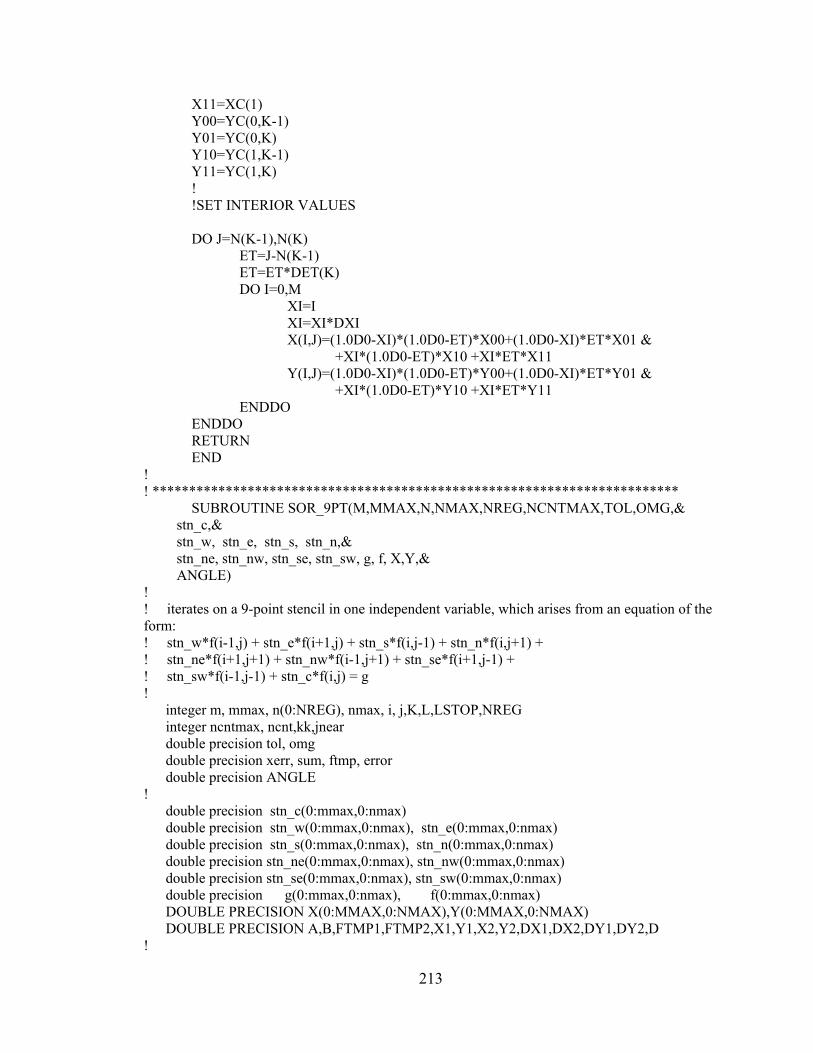
213
X11=XC(1) Y00=YC(0,K-1) Y01=YC(0,K) Y10=YC(1,K-1) Y11=YC(1,K) ! !SET INTERIOR VALUES DO J=N(K-1),N(K) ET=J-N(K-1) ET=ET*DET(K) DO I=0,M XI=I XI=XI*DXI X(I,J)=(1.0D0-XI)*(1.0D0-ET)*X00+(1.0D0-XI)*ET*X01 & +XI*(1.0D0-ET)*X10 +XI*ET*X11 Y(I,J)=(1.0D0-XI)*(1.0D0-ET)*Y00+(1.0D0-XI)*ET*Y01 & +XI*(1.0D0-ET)*Y10 +XI*ET*Y11 ENDDO ENDDO RETURN END ! ! ************************************************************************
SUBROUTINE SOR_9PT(M,MMAX,N,NMAX,NREG,NCNTMAX,TOL,OMG,& stn_c,& stn_w, stn_e, stn_s, stn_n,& stn_ne, stn_nw, stn_se, stn_sw, g, f, X,Y,& ANGLE) ! ! iterates on a 9-point stencil in one independent variable, which arises from an equation of the form: ! stn_w*f(i-1,j) + stn_e*f(i+1,j) + stn_s*f(i,j-1) + stn_n*f(i,j+1) + ! stn_ne*f(i+1,j+1) + stn_nw*f(i-1,j+1) + stn_se*f(i+1,j-1) + ! stn_sw*f(i-1,j-1) + stn_c*f(i,j) = g ! integer m, mmax, n(0:NREG), nmax, i, j,K,L,LSTOP,NREG integer ncntmax, ncnt,kk,jnear double precision tol, omg double precision xerr, sum, ftmp, error double precision ANGLE ! double precision stn_c(0:mmax,0:nmax) double precision stn_w(0:mmax,0:nmax), stn_e(0:mmax,0:nmax) double precision stn_s(0:mmax,0:nmax), stn_n(0:mmax,0:nmax) double precision stn_ne(0:mmax,0:nmax), stn_nw(0:mmax,0:nmax) double precision stn_se(0:mmax,0:nmax), stn_sw(0:mmax,0:nmax) double precision g(0:mmax,0:nmax), f(0:mmax,0:nmax) DOUBLE PRECISION X(0:MMAX,0:NMAX),Y(0:MMAX,0:NMAX) DOUBLE PRECISION A,B,FTMP1,FTMP2,X1,Y1,X2,Y2,DX1,DX2,DY1,DY2,D !

214
ncnt = 0 1 ncnt = ncnt+1 !iteration count xerr = 0. ! ! SET IMPERMEABLE LOWER BOUNDARY AT Y(0,J) DO I=1,M-1 F(I,0)=F(I,1) ENDDO ! DO K=1,NREG ! SOLVE ONE REGION AT A TIME ! CALCULATE INTERIOR POINTS DO J=N(K-1)+1,N(K)-1 DO I=1,M-1 sum = stn_w(i,j)*f(i-1,j)+& stn_e(i,j)*f(i+1,j)+& stn_s(i,j)*f(i,j-1)+& stn_n(i,j)*f(i,j+1) +& stn_ne(i,j)*f(i+1,j+1)+& stn_nw(i,j)*f(i-1,j+1)+& stn_se(i,j)*f(i+1,j-1)+& stn_sw(i,j)*f(i-1,j-1) ! ftmp = ( g(i,j) - sum )/stn_c(i,j) ! ftmp = f(i,j) + omg*( ftmp - f(i,j) ) error=abs( (ftmp-f(i,j))) xerr = max( xerr, error) f(i,j) = ftmp ! ENDDO ENDDO ! SET UPPER BOUNDARY OF K REGION IF(K.EQ.NREG)THEN ! SET IMPERMEABLE UPPER BOUNDARY AT Y(NMAX,J) DO I=1,M-1 F(I,NMAX)=F(I,NMAX-1) ENDDO ELSE ! SET MASS JUMP BAL FOR INTERMEDIATE BOUNDARY J=N(K) DO I=1,M-1 DX1=X(I,J)-X(I-1,J) DY1=Y(I,J)-Y(I,J-1) DX2=X(I+1,J)-X(I,J) DY2=Y(I,J+1)-Y(I,J) !FIND FTMP1 LSTOP=N(K-1) DO L=J,N(K-1),-1 IF(Y(I-1,L+1).GE.Y(I,J).AND.& Y(I-1,L).LE.Y(I,J))LSTOP=L ENDDO D=(Y(I-1,LSTOP+1)-Y(I,J))/(Y(I-1,LSTOP+1)-Y(I-1,LSTOP))

215
FTMP1=D*F(I-1,LSTOP)+(1.0D0-D)*F(I-1,LSTOP+1) !FIND FTMP2 LSTOP=N(K+1) DO L=J,N(K+1) IF(Y(I+1,L+1).GE.Y(I,J).AND.& Y(I+1,L).LE.Y(I,J))LSTOP=L ENDDO D=(Y(I+1,LSTOP+1)-Y(I,J))/(Y(I+1,LSTOP+1)-Y(I+1,LSTOP)) FTMP2=D*F(I+1,LSTOP)+(1.0D0-D)*F(I+1,LSTOP+1) ! CALCULATE BOUNDARY PRESSURE ! A=((BET(N,NREG,J-1,ANGLE)/DX1& +GAM(N,NREG,J-1,ANGLE)/DY1& +BET(N,NREG,J+1,ANGLE)/DX2& +GAM(N,NREG,J+1,ANGLE)/DY2)) B=((BET(N,NREG,J-1,ANGLE)*FTMP1/DX1& +GAM(N,NREG,J-1,ANGLE)*F(I,J-1)/DY1& +BET(N,NREG,J+1,ANGLE)*FTMP2/DX2& +GAM(N,NREG,J+1,ANGLE)*F(I,J+1)/DY2)) F(I,J)=B/A ENDDO ENDIF ENDDO if ( (xerr .gt. tol) .and. (ncnt .lt. ncntmax) ) go to 1 ! if (xerr .gt. tol) then print*, "" write(6,*) ' sor tol not satisfied after ', ncntmax pause else print*, "" write(6,*) ' sor tol satisfied after ', ncnt pause end if ! return end ! ! ************************************************************************* subroutine stencils(m, mmax, n, nmax,NREG,K,& alphat, bethat, gamhat,det,dxi,& stn_c,& stn_w, stn_e, stn_s, stn_n,& stn_ne, stn_nw, stn_se, stn_sw) ! ! Initializes the stencils. ! Input: ! Array and problem sizes and indices. integer m, mmax, N(0:NREG), nmax, i, j,NREG,K ! The transformed coefficients:

216
double precision alphat(0:mmax,0:nmax) double precision bethat(0:mmax,0:nmax) double precision gamhat(0:mmax,0:nmax) ! Output: ! The stencils: double precision stn_c(0:mmax,0:nmax) double precision stn_w(0:mmax,0:nmax), stn_e(0:mmax,0:nmax) double precision stn_s(0:mmax,0:nmax), stn_n(0:mmax,0:nmax) double precision stn_ne(0:mmax,0:nmax), stn_nw(0:mmax,0:nmax) double precision stn_se(0:mmax,0:nmax), stn_sw(0:mmax,0:nmax) ! Internal variables. double precision dxi, det(NREG) ! ! DO J = N(K-1)+1, N(K)-1 DO I = 1, M-1 stn_w(i,j) = alphat(i,j)/(dxi**2) stn_e(i,j) = alphat(i+1,j)/(dxi**2) stn_s(i,j) = gamhat(i,j)/(det(K)**2) stn_n(i,j) = gamhat(i,j+1)/(det(K)**2) stn_ne(i,j) = bethat(i+1,j+1)/(2.0d0*dxi*det(K)) stn_nw(i,j) = - bethat(i,j+1)/(2.0d0*dxi*det(K)) stn_se(i,j) = - bethat(i+1,j)/(2.0d0*dxi*det(K)) stn_sw(i,j) = bethat(i,j)/(2.0d0*dxi*det(K)) stn_c(i,j) = - ( stn_w(i,j) + stn_e(i,j) + & stn_s(i,j) + stn_n(i,j) + & stn_ne(i,j) + stn_nw(i,j) + & stn_se(i,j) + stn_sw(i,j) ) ENDDO ENDDO ! RETURN END ! ! ********************************************************************* SUBROUTINE TRANS(M,MMAX,N,NMAX,NREG,X,Y,G,DXI,DET,& ALPHAT,BETHAT,GAMHAT,GHAT,K,& ANGLE) ! ! Compute the transfomred coefficients. ! ! Input: ! Array size, problem size, and indices. integer m, mmax, n(0:NREG), nmax, i, j,K,NREG ! The transformation. double precision x(0:mmax,0:nmax), y(0:mmax,0:nmax) ! The coefficient definitions. external alp, bet, gam double precision alp, bet, gam double precision ANGLE ! The right-hand side. double precision g(0:mmax,0:nmax)
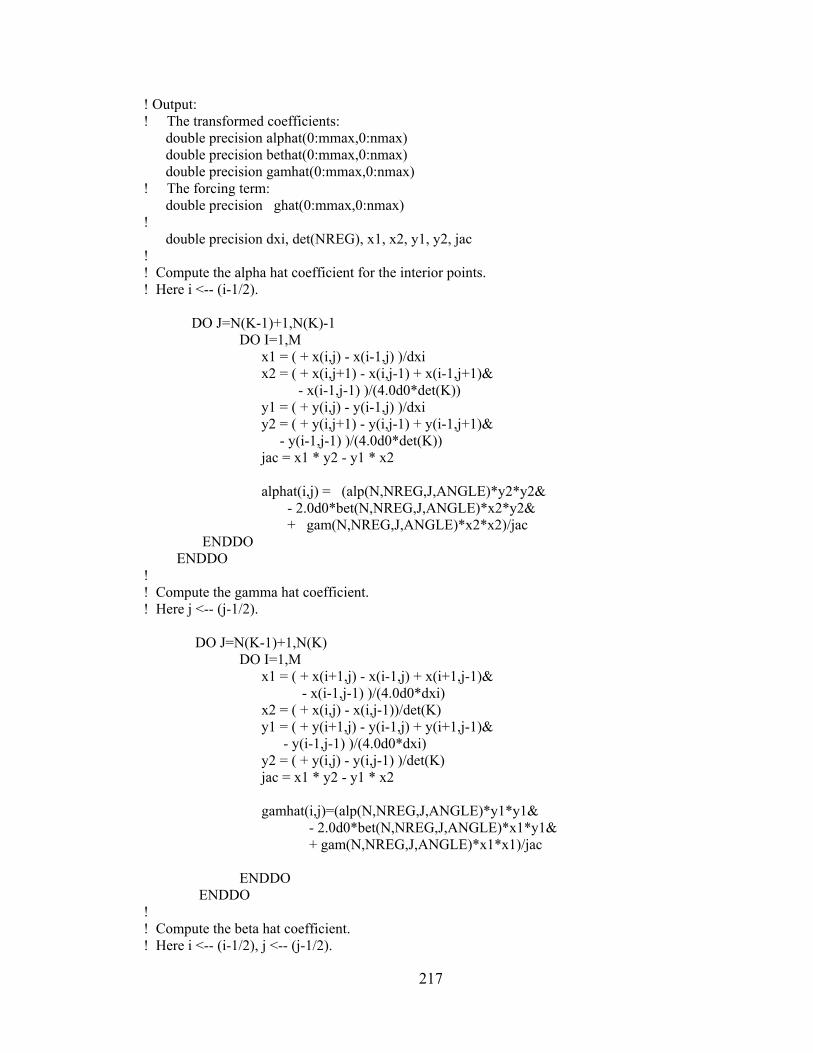
217
! Output: ! The transformed coefficients: double precision alphat(0:mmax,0:nmax) double precision bethat(0:mmax,0:nmax) double precision gamhat(0:mmax,0:nmax) ! The forcing term: double precision ghat(0:mmax,0:nmax) ! double precision dxi, det(NREG), x1, x2, y1, y2, jac ! ! Compute the alpha hat coefficient for the interior points. ! Here i <-- (i-1/2). DO J=N(K-1)+1,N(K)-1 DO I=1,M x1 = ( + x(i,j) - x(i-1,j) )/dxi x2 = ( + x(i,j+1) - x(i,j-1) + x(i-1,j+1)& - x(i-1,j-1) )/(4.0d0*det(K)) y1 = ( + y(i,j) - y(i-1,j) )/dxi y2 = ( + y(i,j+1) - y(i,j-1) + y(i-1,j+1)& - y(i-1,j-1) )/(4.0d0*det(K)) jac = x1 * y2 - y1 * x2 alphat(i,j) = (alp(N,NREG,J,ANGLE)*y2*y2& - 2.0d0*bet(N,NREG,J,ANGLE)*x2*y2& + gam(N,NREG,J,ANGLE)*x2*x2)/jac ENDDO ENDDO ! ! Compute the gamma hat coefficient. ! Here j <-- (j-1/2). DO J=N(K-1)+1,N(K) DO I=1,M x1 = ( + x(i+1,j) - x(i-1,j) + x(i+1,j-1)& - x(i-1,j-1) )/(4.0d0*dxi) x2 = ( + x(i,j) - x(i,j-1))/det(K) y1 = ( + y(i+1,j) - y(i-1,j) + y(i+1,j-1)& - y(i-1,j-1) )/(4.0d0*dxi) y2 = ( + y(i,j) - y(i,j-1) )/det(K) jac = x1 * y2 - y1 * x2 gamhat(i,j)=(alp(N,NREG,J,ANGLE)*y1*y1& - 2.0d0*bet(N,NREG,J,ANGLE)*x1*y1& + gam(N,NREG,J,ANGLE)*x1*x1)/jac ENDDO ENDDO ! ! Compute the beta hat coefficient. ! Here i <-- (i-1/2), j <-- (j-1/2).
218
DO J=N(K)+1,N(K) DO I=1,M x1 = ( + x(i,j) + x(i,j-1) - x(i-1,j) - x(i-1,j-1))/(2.0d0*dxi) x2 = ( + x(i,j) - x(i,j-1) + x(i-1,j) - x(i-1,j-1))/(2.0d0*det(K)) y1 = ( + y(i,j) + y(i,j-1) - y(i-1,j) - y(i-1,j-1))/(2.0d0*dxi) y2 = ( + y(i,j) - y(i,j-1) + y(i-1,j) - y(i-1,j-1))/(2.0d0*det(K)) jac = x1 * y2 - y1 * x2 bethat(i,j) = - (alp(N,NREG,J,ANGLE)*y1*y2& - bet(N,NREG,J,ANGLE)*(x1*y2+x2*y1)& + gam(N,NREG,J,ANGLE)*x1*x2)/jac ENDDO ENDDO ! ! Compute the g hat coefficient. DO J=N(K-1)+1,N(K)-1 DO I=1,M-1 x1 = (x(i+1,j)-x(i-1,j))/(2.0d0*dxi) x2 = (x(i,j+1)-x(i,j-1))/(2.0d0*det(K)) y1 = (y(i+1,j)-y(i-1,j))/(2.0d0*dxi) y2 = (y(i,j+1)-y(i,j-1))/(2.0d0*det(K)) jac = x1 * y2 - y1 * x2 ghat(i,j) = jac*g(i,j) ENDDO ENDDO RETURN END ! ! *************************************************************************** subroutine results(m,mmax,n,nmax,NREG,f) integer m, mmax, N(0:NREG),NREG, nmax, i, j double precision f(0:mmax,0:nmax) ! OPEN(UNIT=11, FILE='Pressure.OUT',STATUS='UNKNOWN') ! initially, just write results to screen do i=0,m do j=0,N(NREG) write(11,*)i,f(i,j) write(6,*)i,j,f(i,j) enddo enddo pause return end !**********************************************************************

219
subroutine velocity (m,mmax,n,nmax,NREG,f,x,y,det,dxi,PDROP,POR,PERMX,VIS,ANGLE) IMPLICIT DOUBLE PRECISION (A-H,O-Z) IMPLICIT INTEGER (I-N) DIMENSION f(0:mmax,0:nmax) DIMENSION x(0:mmax,0:nmax), y(0:mmax,0:nmax) DIMENSION vx(0:mmax,0:nmax), vy(0:mmax,0:nmax) DIMENSION det(NREG),POR(NREG),N(0:NREG) DIMENSION q(0:mmax,0:NREG) double precision ANGLE ! Z=0.0d0 !FLOW RATE AT THE EXIT BOUNDRY, INITIALLY SET TO ZERO ! NEEDS MODIFIED FOR REGIONS, BE SURE TO INCLUDE DIFFERENT POROSITIES FOR EACH REGION ! POR V = (K11 FX + K22 FY) PDROP PERMX /POR / VIS ! ! ZERO ALL POINTS DO J=0,N(NREG) DO I = 0,M VX(I,J)=0.0 VY(I,J)=0.0 ENDDO ENDDO ! CALCULATE INTERIOR POINTS OF EACH REGION ! BOUNDARIES BETWEEN REGIONS ARE NOT CALCULATED DO K=1,NREG DO J=N(K-1)+1,N(K)-1 DO I = 1,m-1 ip=i+1 im=i-1 jp=j+1 jm=j-1 sx=2.0d0 se=2.0d0 call fyfx(x,y,f,fx,fy,jac,ip,i,j,im,& jp,jm,sx,se,mmax,nmax,dxi,det,K,NREG) ! Calculate velocities vx(i,j)=-(alp(N,NREG,J,ANGLE)*fx+bet(N,NREG,J,ANGLE)*fy)& *PERMX*PDROP/(POR(K)*VIS) vy(i,j)=-(bet(N,NREG,J,ANGLE)*fx+gam(N,NREG,J,ANGLE)*fy)& *PERMX*PDROP/(POR(K)*VIS) ENDDO ENDDO ENDDO ! EXTERNAL BOUNDARIES ! TOP K=NREG J=N(NREG)
220
do i=1,m-1 ip=i+1 im=i-1 jp=1 jm=0 sx=2.0d0 se=1.0d0 call fyfx(x,y,f,fx,fy,jac,ip,i,j,im,& jp,jm,sx,se,mmax,nmax,dxi,det,K,NREG) ! Calculate velocities vx(i,j)=-(alp(N,NREG,J,ANGLE)*fx+bet(N,NREG,J,ANGLE)*fy)& *PERMX*PDROP/(POR(K)*VIS) vy(i,j)=-(bet(N,NREG,J,ANGLE)*fx+gam(N,NREG,J,ANGLE)*fy)& *PERMX*PDROP/(POR(K)*VIS) enddo ! BOTTOM J=0 K=1 do i=1,m-1 ip=i+1 im=i-1 jp=n(K) jm=n(K)-1 sx=2.0d0 se=1.0d0 call fyfx(x,y,f,fx,fy,jac,ip,i,j,im,& jp,jm,sx,se,mmax,nmax,dxi,det,K,NREG) ! Calculate velocities vx(i,j)=-(alp(N,NREG,J,ANGLE)*fx+bet(N,NREG,J,ANGLE)*fy)& *PERMX*PDROP/(POR(K)*VIS) vy(i,j)=-(bet(N,NREG,J,ANGLE)*fx+gam(N,NREG,J,ANGLE)*fy)& *PERMX*PDROP/(POR(K)*VIS) enddo ! INLET AND OUTLET ! i=0 AND i=m DO K=1,NREG I=0 DO J=1,N(K)-1 ip=1 im=0 jp=j+1 jm=j-1 sx=1.0d0 se=2.0d0 call fyfx(x,y,f,fx,fy,jac,ip,i,j,im,& jp,jm,sx,se,mmax,nmax,dxi,det,K,NREG) ! Calculate velocities vx(i,j)=-(alp(N,NREG,J,ANGLE)*fx+bet(N,NREG,J,ANGLE)*fy)& *PERMX*PDROP/(POR(K)*VIS)

221
vy(i,j)=-(bet(N,NREG,J,ANGLE)*fx+gam(N,NREG,J,ANGLE)*fy)& *PERMX*PDROP/(POR(K)*VIS) ENDDO i=m do j=1,N(NREG)-1 ip=m im=m-1 jp=j+1 jm=j-1 sx=1.0d0 se=2.0d0 call fyfx(x,y,f,fx,fy,jac,ip,i,j,im,& jp,jm,sx,se,mmax,nmax,dxi,det,K,NREG) ! Calculate velocities vx(i,j)=-(alp(N,NREG,J,ANGLE)*fx+bet(N,NREG,J,ANGLE)*fy)& *PERMX*PDROP/(POR(K)*VIS) vy(i,j)=-(bet(N,NREG,J,ANGLE)*fx+gam(N,NREG,J,ANGLE)*fy)& *PERMX*PDROP/(POR(K)*VIS) ENDDO ENDDO ! CORNERS i=0 j=0 K=1 ip=1 im=0 jp=1 jm=0 sx=1.0d0 se=1.0d0 call fyfx(x,y,f,fx,fy,jac,ip,i,j,im,& jp,jm,sx,se,mmax,nmax,dxi,det,K,NREG) ! Calculate velocities vx(i,j)=-(alp(N,NREG,J,ANGLE)*fx+bet(N,NREG,J,ANGLE)*fy)& *PERMX*PDROP/(POR(K)*VIS) vy(i,j)=-(bet(N,NREG,J,ANGLE)*fx+gam(N,NREG,J,ANGLE)*fy)& *PERMX*PDROP/(POR(K)*VIS) I=0 J=N(NREG) K=NREG ip=1 im=0 jp=n(K) jm=n(K)-1 sx=1.0d0 se=1.0d0 call fyfx(x,y,f,fx,fy,jac,ip,i,j,im,& jp,jm,sx,se,mmax,nmax,dxi,det,K,NREG) ! Calculate velocities vx(i,j)=-(alp(N,NREG,J,ANGLE)*fx+bet(N,NREG,J,ANGLE)*fy)&

222
*PERMX*PDROP/(POR(K)*VIS) vy(i,j)=-(bet(N,NREG,J,ANGLE)*fx+gam(N,NREG,J,ANGLE)*fy)& *PERMX*PDROP/(POR(K)*VIS) i=m j=0 K=1 ip=m im=m-1 jp=1 jm=0 sx=1.0d0 se=1.0d0 call fyfx(x,y,f,fx,fy,jac,ip,i,j,im,& jp,jm,sx,se,mmax,nmax,dxi,det,K,NREG) ! ! Calculate velocities vx(i,j)=-(alp(N,NREG,J,ANGLE)*fx+bet(N,NREG,J,ANGLE)*fy)& *PERMX*PDROP/(POR(K)*VIS) vy(i,j)=-(bet(N,NREG,J,ANGLE)*fx+gam(N,NREG,J,ANGLE)*fy)& *PERMX*PDROP/(POR(K)*VIS) I=M J=N(NREG) K=NREG ip=m im=m-1 jp=n(K) jm=n(K)-1 sx=1.0d0 se=1.0d0 call fyfx(x,y,f,fx,fy,jac,ip,i,j,im,& jp,jm,sx,se,mmax,nmax,dxi,det,K,NREG) ! Calculate velocities vx(i,j)=-(alp(N,NREG,J,ANGLE)*fx+bet(N,NREG,J,ANGLE)*fy)& *PERMX*PDROP/(POR(K)*VIS) vy(i,j)=-(bet(N,NREG,J,ANGLE)*fx+gam(N,NREG,J,ANGLE)*fy)& *PERMX*PDROP/(POR(K)*VIS) ! ! write results to file OPEN(UNIT=7, FILE='xy.OUT',STATUS='UNKNOWN') !Grid file OPEN(UNIT=8, FILE='uv.OUT',STATUS='UNKNOWN') !Velocities vx, vy do i=0,m do j=0,N(NREG) write(7,*)x(i,j),y(i,j) write(8,*)vx(i,j),vy(i,j) enddo enddo ! Calculate Flow rate at the exit boundary OPEN(UNIT=10, FILE='Q.OUT',STATUS='UNKNOWN') w=0.0471D0 ! ! !Calculate flow rate at bottom corner point
223
q(m,0)=POR(1)*vx(m,0)*((y(m,1)-y(m,0))/2)*w !Calculate flow rate at exit boundry do j=1,N(NREG)-1 if (j.lt.N(1))then K=1 q(m,j)=POR(K)*vx(m,j)*(((y(m,j)-y(m,j-1))/2)+((y(m,j+1)-y(m,j))/2))*w else if (j.lt.N(2))then K=2 q(m,j)=POR(K)*vx(m,j)*(((y(m,j)-y(m,j-1))/2)+((y(m,j+1)-y(m,j))/2))*w else if (j.lt.N(3))then K=3 q(m,j)=POR(K)*vx(m,j)*(((y(m,j)-y(m,j-1))/2)+((y(m,j+1)-y(m,j))/2))*w else if (j.lt.N(4))then K=4 q(m,j)=POR(K)*vx(m,j)*(((y(m,j)-y(m,j-1))/2)+((y(m,j+1)-y(m,j))/2))*w else if (j.lt.N(5))then K=5 q(m,j)=POR(K)*vx(m,j)*(((y(m,j)-y(m,j-1))/2)+((y(m,j+1)-y(m,j))/2))*w else if (j.lt.N(6))then K=6 q(m,j)=POR(K)*vx(m,j)*(((y(m,j)-y(m,j-1))/2)+((y(m,j+1)-y(m,j))/2))*w else if (j.lt.N(7))then K=7 q(m,j)=POR(K)*vx(m,j)*(((y(m,j)-y(m,j-1))/2)+((y(m,j+1)-y(m,j))/2))*w end if enddo !Calculate flow rate at upper corner q(m,N(NREG))=POR(7)*vx(m,N(NREG))*((y(m,N(NREG))-y(m,(N(NREG)-1)))/2)*w ! !Total flow rate at the exit boundry do j=0, N(NREG) Z=Z+q(m,j) write(10,*)q(m,j) enddo write(10,*) "Flow rate and grid width are" write(10,*)Z, m return end ! ! *********************************************************************** ! SUBROUTINE fyfx(x,y,f,fx,fy,jac,ip,i,j,im,jp,jm,sx,se,mmax,nmax,dxi,det,K,NREG) double precision f(0:mmax,0:nmax)

224
double precision x(0:mmax,0:nmax), y(0:mmax,0:nmax) double precision jac,x1,x2,y1,y2,fx,fy,sx,se,dxi,det(NREG) integer i,j,ip,im,jp,jm,nmax,mmax,NREG,K x1 = (x(ip,j)-x(im,j))/(sx*dxi) x2 = (x(i,jp)-x(i,jm))/(se*det(K)) y1 = (y(ip,j)-y(im,j))/(sx*dxi) y2 = (y(i,jp)-y(i,jm))/(se*det(K)) jac = x1 * y2 - y1 * x2 !jacobian ! if(abs(jac).lt.1.0d-10)then !rectangular square grid fx=(f(ip,j)-f(im,j))/dxi fy=(f(i,jp)-f(i,jm))/det(K) else ! fx=( f(ip,j)*(y(ip,jp)-y(ip,jm))& - f(im,j)*(y(im,jp)-y(im,jm))& - f(i,jp)*(y(ip,jp)-y(im,jp))& + f(i,jm)*(y(ip,jm)-y(im,jm)))& /sx/se/jac/dxi/det(K) fy=( -f(ip,j)*(x(ip,jp)-x(ip,jm))& + f(im,j)*(x(im,jp)-x(im,jm))& + f(i,jp)*(x(ip,jp)-x(im,jp))& - f(i,jm)*(x(ip,jm)-x(im,jm)))& /sx/se/jac/dxi/det(K) Endif return end !*********************************************************

225
APPENDIX C
NOMENCLATURE
= Density of α phase
αv = Velocity of α phase
ε = Porosity of filter medium
= Gas volume fraction
= Gas phase density
g = Gravity
αi = Flux of property φ of α phase
GME = Rate of momentum transfer due to phase change
GMI = Rate of momentum transfer due to drag per unit volume between the
phases
GMS = Rate of momentum transfer due to slip per unit volume
GMG = Momentum transfer due to heterogeneous reaction at the interface between
the phases per unit volume
226
Gτ = Shear stress for gas phase
w = Velocity of the interface
1v = Velocity of phase 1
2v = Velocity of phase 2
Gv = Local volume averaged velocity
P∇ = Pressure drop
µ = Viscosity of gas
k = Air permeability