improvement of cultivation medium for enhanced production of coenzyme q10 by photosynthetic...
TRANSCRIPT
G
B
Ib
Ya
b
a
ARRAA
KCRRM
1
vcsca[twCdd[im
o4
1d
ARTICLE IN PRESSModel
EJ-5174; No. of Pages 7
Biochemical Engineering Journal xxx (2010) xxx–xxx
Contents lists available at ScienceDirect
Biochemical Engineering Journal
journa l homepage: www.e lsev ier .com/ locate /be j
mprovement of cultivation medium for enhanced production of coenzyme Q10y photosynthetic Rhodospirillum rubrum
uting Tiana,b, Tianli Yuea, Yahong Yuana,b, Pavan K. Somab, Y. Martin Loa,b,∗
College of Food Science and Engineering, Northwest A&F University, Yangling, Shaanxi, PR ChinaDepartment of Nutrition and Food Science, University of Maryland, College Park, MD, USA
r t i c l e i n f o
rticle history:eceived 18 January 2010eceived in revised form 5 May 2010ccepted 18 June 2010vailable online xxx
a b s t r a c t
Coenzyme Q10 (CoQ10), a potent antioxidative dietary supplement, was produced by submerged fermen-tation using an anaerobic photosynthetic bacteria Rhodospirillum rubrum ATCC 25852 instead of chemicalsynthesis or solvent extraction. Five nutritional factors, including malic acid, yeast extract, (NH4)2SO4,MgSO4·7H2O, and ferric citrate, were optimized for CoQ10 production using response surface method-ology (RSM) in static test tube cultures. The optimal medium for CoQ10 production were (g/l): malic
eywords:oenzyme Q10hodospirillum rubrumesponse surface methodologyedium optimization
acid, 2.5; yeast extract, 1.29; (NH4)2SO4, 1.34; MgSO4·7H2O, 0.20; 0.90 g/l K2HPO4, 0.90; KH2PO4, 0.60;ferric citrate, 0.08; and EDTA, 0.02. The highest yield of CoQ10 was 9.76 mg/l, in agreement with theRSM predicted yield (9.63 mg/l). The yield of CoQ10 in a 3-l fermentor was higher than that achieved inthe static culture and reached 10.81 mg/l, which could be attributed to the constant agitation (400 rpm)that enhanced cell–substrate contact throughout the fermentation. The optimal medium compositionsacquired in the present study provide a solid foundation for further improvement and optimization offermentation processes that can be suitable for industrial-scale production of CoQ10.
© 2010 Elsevier B.V. All rights reserved.
. Introduction
Coenzyme Q10, aka ubiquinone or CoQ10, is an oil-soluble,itamin-like substance containing 10 units of the isoprenoid side-hain [1]. It is an essential component of the electron transferystem in the plasma membrane of prokaryotes and the inner mito-hondrial membrane of eukaryotes, where it plays a key role asn electron donor/acceptor between complex I/II and complex III2]. Known functions of CoQ10 include boosting energy, enhancinghe immune system, and acting as a free radical scavenger [3,4],hereas positive clinical evidences continue to accumulate whenoQ10 is supplemented for treatment of hypertension and heartisease [5,6], breast cancer [7–9], and Alzheimer’s and Parkinson’s
Please cite this article in press as: Y. Tian, et al., Improvement of cultivation mRhodospirillum rubrum, Biochem. Eng. J. (2010), doi:10.1016/j.bej.2010.06.0
isease [10,11]. Superior bioavailability of CoQ10 via oral ingestion12] has made it a popular dietary supplement, consequently lead-ng to extensive attempts to increase the production of CoQ10 to
eet the growing demands.
∗ Corresponding author at: Department of Nutrition and Food Science, Universityf Maryland, 0112 Skinner Building, College Park, MD 20742, USA. Tel.: +1 301 405509; fax: +1 301 314 3313.
E-mail address: [email protected] (Y.M. Lo).
369-703X/$ – see front matter © 2010 Elsevier B.V. All rights reserved.oi:10.1016/j.bej.2010.06.011
CoQ10 can be produced by chemical synthesis [13], semi-chemical synthesis [14], extraction from biological tissues [15],and microorganism fermentation [16]. In the wake of environ-mental awareness the first three options became least desirabledue to the inherent uses of solvents and chemicals in the process.Microbial fermentation, on the contrary, offers an environmen-tally benign option based on the enzymatic catalysis at the cellularlevel for CoQ10 assembly. Moreover, this approach is attractiveto the industry because the process is easy to control at a rela-tively low production cost [17,18]. A variety of microorganismshave been employed to produce CoQ10, including bacteria (e.g.Pseudomonas, Agrobacterium, Paracoccus) [16,19,20], molds (e.g.Neurospora, Aspergillus) [21], and yeasts (e.g. Candida, Rhodotorula,Saitoella) [22]. Via screening of wild-type strains it has been demon-strated that photosynthetic bacteria (PSB) such as Rhodospirillum[23,24], Rhodobacter [16,25–27] and Pseudomonas [19] are supe-rior CoQ10 producers, with the highest CoQ10 content reached inRhodospirillum rubrum [28]. R. rubrum is a purple non-sulfur photo-
edium for enhanced production of coenzyme Q10 by photosynthetic11
synthetic bacterium, which was widely used to produce hydrogen[29,30]. Currently, economical production of CoQ10 by microbeshas become more important because of the growing demands ofthe pharmaceutical industry [26]. To date, there have been somestudies of the CoQ10 fermentation using PBS such as Rhodobacter
ING
B
2 ineerin
su
tmtuw[staMsTafdtf
2
2
a9b(Ktat00v0Atft−
2
iseaaw
TL
R
ARTICLEModel
EJ-5174; No. of Pages 7
Y. Tian et al. / Biochemical Eng
phaeroides [25–27], but few studies of the CoQ10 fermentationsing R. rubrum with the highest CoQ10 content.
It is well recognized that, when developing industrial fermen-ation, optimization of all elements involved for the growth of the
icroorganism and production of the bioproduct in question ishe primary task because they could strongly impact the prod-ct yield [31]. The composition of carbon and nitrogen sources, asell as inorganic salts and growth factors should all be considered
32]. Ha et al. [20] investigated the effect of carbon and nitrogenources for CoQ10 production by Agrobacterium tumefaciens usinghe one-factor-at-a-time approach. However, the statistical inter-ctions between carbon and nitrogen sources were not attained.oreover, other important nutritional factors, including inorganic
alts and growth factors, were not investigated in their study.herefore, the objective of this research was to systematically char-cterize the effects of carbon and nitrogen sources as well as growthactors and inorganic salts on the growth of R. rubrum and the pro-uction of CoQ10. The medium composition was optimized usinghe response surface methodology (RSM) to handle the multipleactors that affect CoQ10 production.
. Materials and methods
.1. Microorganism and media
Freeze-dried R. rubrum ATCC 25852 (ATCC, Manassas, VA),n anaerobic photosynthetic bacterium, was hydrated withml sterilized water and inoculated into ATCC medium. Thease medium contained (g/l): malic acid 2.5, yeast extract 1,NH4)2SO4 1.25, MgSO4·7H2O 0.2, CaCl2·2H2O 0.07, K2HPO4 0.9,H2PO4 0.6, ferric citrate 0.01, and EDTA 0.02. One milliliter
race element solution and 7.5 ml vitamin solution were alsodded to each liter of ATCC medium. The trace element solu-ion contained (g/l): ferric citrate 0.3, MnSO4·H2O 0.002, H3BO3.001, CuSO4·5H2O 0.001, (NH4)6Mo7O24·4H2O 0.002, ZnSO4.001, EDTA 0.05, and CaCl2·2H2O 0.02. The composition ofitamin solution was (g/l): nicotinic acid 0.2, nicotinamide.2, thiamine·HCl 0.4, and biotin 0.008. After incubation innaeroGen system (AN0025, Columbia, HBA, Oxoid) under a
ungsten lamp (100 W, luminous flux = 1130 lumens) at 35 ◦Cor 48 h, the stock of R. rubrum was prepared by mixinghe broth with sterilized glycerol (10%, v/v) and stored at70 ◦C.
.2. Batch fermentation
Initial optimizations were conducted using test tubes contain-ng 10 ml medium sterilized at 121 ◦C for 15 min. The trace element
Please cite this article in press as: Y. Tian, et al., Improvement of cultivation mRhodospirillum rubrum, Biochem. Eng. J. (2010), doi:10.1016/j.bej.2010.06.0
olution and the vitamin solution were supplemented by filtrationmploying a 0.22 �m membrane. The composition of the mediumnd the quantities of constituents used in the medium variedccording to the design of the matrix (see below). The initial pHas maintained at 6.9. The culture was statically incubated in an
able 1evels of the variables and statistical analysis of Plackett–Burman design.
Factors (mg/l) Code Low level (−1) High level (+1)
MgSO4 x1 100 200ZnSO4 x2 70 140Ferric citrate x3 50 100EDTA x4 20 60CuSO4 x5 0.1 0.4CaCl2 x6 70 100MnSO4 x7 0.2 0.8KH2PO4 x8 600 900
2(adj) = 84.65%; R2 = 95.81%.
PRESSg Journal xxx (2010) xxx–xxx
anaerobic atmosphere generation system (AN0025, Columbia, HBA,Oxoid) under a tungsten lamp at 35 ◦C for 96 h.
The optimal medium compositions identified above were con-firmed using a 3 l fermentor (Applikon, Schiedam, Netherlands).After sterilization (121 ◦C for 15 min), the medium was cooled toscheduled temperature (35 ◦C) and the trace element solution andthe vitamin solution were supplemented by filtration employinga 0.22 �m membrane. The medium was inoculated with 5% (v/v)inoculum. The fermentor was operated under a tungsten lamp at35 ◦C for 96 h. The agitation speed was 400 rpm. Carbon dioxidewas introduced at a rate of 1 l/min to keep the anaerobic conditioninside the fermentor.
2.3. Optimization of fermentation medium
2.3.1. Carbon and nitrogen sourcesThe effects of carbon and nitrogen sources on CoQ10
synthesis were evaluated using single factor design. Differ-ent carbon sources at concentration of 2 g/l, namely glu-cose, sodium acetate, malic acid, sucrose, citric acid, andfructose, were employed. Various nitrogen sources at con-centration of 2 g/l commonly used in microbial fermenta-tion, including yeast extract, casitone, ammonium sulfate,tryptone, proteose peptone, yeast extract + ammonium sulfate,casitone + ammonium sulfate, and tryptone + ammonium sulfatewere studied.
2.3.2. Mineral sourcesScreening of the most significant mineral sources affecting
CoQ10 production was performed using the Plackett–Burmandesign [33]. Based on Plackett–Burman design, each independentvariable was tested at high (+1) and low (−1) levels. Table 1 illus-trates the experimental with eight variables, whereas, Table 2shows the design matrix. In the present study, 12 experimentalruns were conducted.
2.3.3. Concentration optimization of screened componentsA Box–Behnken design [34] of RSM was conducted in the opti-
mum vicinity to locate the true optimum concentrations of malicacid, yeast extraction, ammonium sulfate, MgSO4·7H2O and ferriccitrate for CoQ10 production. The range and center point values ofthese five factors are shown in Table 3. The Box–Behnken designconsisted of 46 experiments including six replicates of the centralpoint (Table 4). For statistical calculations, the relation between thecoded values and real values are described as follows:
Xi − X0
edium for enhanced production of coenzyme Q10 by photosynthetic11
xi =�X
where xi is dimensionless coded value of the variable Xi, X0 is thereal value of the Xi at the center point; and �X is the step change ofvariable. The behavior of the system was explained by the following
Effect Coefficient t-Value P-Value
2.3500 1.1750 7.06 0.006−0.1267 −0.0630 −0.38 0.729−1.2000 −0.6000 −3.61 0.037
0.0233 0.0117 0.07 0.949−0.1900 −0.0950 −0.57 0.608
0.5400 0.2700 1.62 0.203−0.2267 −0.1133 −0.68 0.545
0.4967 0.2483 1.49 0.232
ARTICLE IN PRESSG Model
BEJ-5174; No. of Pages 7
Y. Tian et al. / Biochemical Engineering Journal xxx (2010) xxx–xxx 3
Table 2The Plackett–Burman design variables (in coded levels) with CoQ10 as response.
Run Variables/levels CoQ10 (mg/l)
x1 x2 x3 x4 x5 x6 x7 x8
1 1 −1 −1 −1 1 1 1 −1 6.012 −1 −1 −1 1 1 1 −1 1 5.063 −1 −1 −1 −1 −1 −1 −1 −1 3.854 −1 −1 1 1 1 −1 1 1 2.635 −1 1 1 1 −1 1 1 −1 2.676 −1 1 1 −1 1 −1 −1 −1 2.557 1 1 −1 1 1 −1 1 −1 6.218 1 −1 1 −1 −1 −1 1 1 5.619 1 −1 1 1 −1 1 −1 −1 5.97
−−
q
Y
wec
2
tsTaCec
BaA(ppuTpCWcrtcM
TTB
All analyses were performed in triplicate. The experimentalresults obtained were expressed as means ± SD. Statistical analy-sis was performed using the SPSS package (version 11.5, SPSS Inc.,
Table 4Experimental design and result of factors chosen for the trials of Box–Behnken.
Run X1 X2 X3 X4 X5 Y (mg/l)
Experimental Predicted
1 0 0 1 1 0 8.34 8.612 −1 0 0 −1 0 2.23 2.023 −1 1 0 0 0 4.55 4.674 0 0 −1 1 0 8.99 9.045 0 0 0 0 0 7.77 7.606 0 0 0 0 0 7.44 7.607 0 0 1 −1 0 2.78 2.988 0 0 0 0 0 7.67 7.609 0 −1 0 0 −1 7.36 7.62
10 0 −1 0 0 1 7.36 7.5211 0 1 0 0 1 5.64 5.6112 0 1 −1 0 0 5.32 5.4513 0 0 0 0 0 7.54 7.6014 0 −1 −1 0 0 8.00 8.0515 0 −1 0 1 0 9.62 9.5516 1 0 1 0 0 6.30 6.1917 0 0 0 1 −1 9.51 9.4518 0 0 0 0 0 7.62 7.6019 0 1 1 0 0 5.99 5.8420 0 0 0 1 1 8.78 8.8621 −1 0 −1 0 0 5.63 5.7822 1 −1 0 0 0 7.36 7.3023 0 0 1 0 1 6.36 6.2524 0 1 0 −1 0 2.62 2.5025 1 1 0 0 0 5.13 5.3826 1 0 0 −1 0 3.40 3.49
10 1 1 −1 111 −1 1 −1 −112 1 1 1 −1
uadratic equation:
= ˇ0 +∑
ˇixi +∑
ˇiix2i +
∑ˇijxixj
here Y is the predicted response, ˇ0 the intercept term, ˇi the lin-ar coefficient, ˇii the squared coefficient, and ˇij is the interactionoefficient.
.4. Analytical methods
The cell mass concentration was determined using a calibra-ion curve correlating optical density at 620 nm (ThermoSpectronicpectrophotometer, Rochester, NY) and the dry cell weight (DCW).he DCW was determined after the culture broth was centrifugedt 10,000 rpm (9159.4 × g) for 30 min under 4 ◦C using a Beckmanoulter L7 Ultracentrifuge (Beckman Coulter, Inc., Fullerton, CA)quipped with a Type 70.1 Ti rotor to precipitate the suspendedells.
To quantify CoQ10 produced from the fermentation, the celLytic(Sigma–Aldrich Co., St. Louis, MO) solution of 0.5 ml was added tocell pellet, which was prepared by centrifugation of culture broth.fter 30 min incubation, a solvent mixture of propanol and hexane
1:2, v/v) was added and mixed vigorously. The solution of solventhase and that obtained by second extraction from the aqueoushase were combined and evaporated to dry using a speed vac-um concentrator (Heidolph Laborota 4001, Schwabach, Germany).he dry residue was dissolved in ethanol and applied to a high-erformance liquid chromatography (HPLC) (LC-2010A, Shimadzu,olumbia, MD) with a �Bondapak C18 (10 �m, 3.9 mm × 300 mm,aters, Milford, MA) coupled to a UV detector (Waters 486). The
olumn was eluted with ethanol and methanol (9:1, v/v) at a flow
Please cite this article in press as: Y. Tian, et al., Improvement of cultivation mRhodospirillum rubrum, Biochem. Eng. J. (2010), doi:10.1016/j.bej.2010.06.0
ate of 0.6 ml/min and a chromatogram was obtained by monitoringhe absorbance at 275 nm identified and quantified by known con-entrations of authentic CoQ10 standard (Sigma–Aldrich, St. Louis,O).
able 3he levels of variables employed in the present study for the construction ofox–Behnken design.
Variables Levels
−1 0 +1
Malic acid X1, g/l 2.0 2.5 3.0Yeast extract X2, g/l 1.0 1.5 2.0Ammonium sulfate X3, g/l 1.0 1.5 2.0Magnesium sulfate X4, g/l 0.10 0.15 0.20Ferric citrate X5, g/l 0.07 0.11 0.14
1 −1 −1 1 6.281 1 1 1 4.941 1 −1 1 5.72
2.5. Statistical analysis
edium for enhanced production of coenzyme Q10 by photosynthetic11
27 0 0 0 −1 1 3.52 3.5828 −1 0 1 0 0 4.76 4.9229 0 1 0 0 −1 6.26 6.3330 0 0 −1 0 1 7.11 6.9531 −1 0 0 0 −1 5.88 5.9232 1 0 0 1 0 8.36 8.5033 0 −1 1 0 0 6.68 6.4434 −1 0 0 0 1 5.36 5.4335 0 0 0 0 0 7.55 7.6036 0 0 −1 0 −1 7.36 7.2737 −1 −1 0 0 0 6.15 5.9638 0 1 0 1 0 8.3 8.0339 0 0 −1 −1 0 3.79 3.7740 1 0 0 0 1 6.62 6.5441 0 0 0 −1 −1 3.89 3.8142 0 −1 0 −1 0 4.10 4.1843 −1 0 0 1 0 8.06 7.9144 0 0 1 0 −1 6.78 6.7545 1 0 −1 0 0 6.68 6.5646 1 0 0 0 −1 6.98 6.87
ARTICLE IN PRESSG Model
BEJ-5174; No. of Pages 7
4 Y. Tian et al. / Biochemical Engineering Journal xxx (2010) xxx–xxx
Table 5Effect of various carbon sources on cell growth and CoQ10 production.
Carbon source DCW (g/l) CoQ10 production (mg/l) Specific CoQ10 content(mg/g-DCW)
Glucose 1.29 ± 0.076 d 4.01 ± 0.169 bc 3.10 ± 0.143 ab
Sodium acetate 1.73 ± 0.117 a 4.55 ± 0.492 b 2.63 ± 0.385 cd
Malic acid 1.56 ± 0.097 b 5.16 ± 0.234 a 3.32 ± 0.099 a
Sucrose 1.32 ± 0.085 d 3.86 ± 0.270 c 3.03 ± 0.025 bc
cd 3.12 d e
3.80
D re not
CDab
3
3
mawtawoabfatwopstcatMbldpta
bsi
TE
D
Citric acid 1.39 ± 0.101Fructose 1.52 ± 0.098 b
ata are shown as mean ± SD (n = 3). Means within a column with the same letter a
hicago, IL), MINITAB 14.13 (Minitab Inc., Pennsylvania, USA) andesign-Expert® 7.1.3 (Stat-Ease Inc., Minneapolis, MN). Data werenalyzed by analysis of variance (p < 0.05) and the means separatedy Duncan’s multiple range test.
. Results and discussion
.1. Optimization of carbon and nitrogen sources
The bacterium was grown on various carbon sources for deter-ination of the effect of these carbon sources on R. rubrum growth
nd CoQ10 production. In these experiments yeast extract (2 g/l)as used as nitrogen source. The results are shown in Table 5. Of
he six carbon sources (2 g/l) investigated, sodium acetate and maliccid were the two best carbon sources for the growth of R. rubrumith biomass reached 1.73 and 1.56 g/l, respectively, after 96 h
f cultivation. The higher cell growth rate achieved with sodiumcetate than malic acid is in agreement with the work conductedy Najafpour et al. [35] that acetate served as a good carbon sourceor R. rubrum to produce hydrogen from synthesis gas. Najafpournd Younesi [29] also reported that R. rubrum on malate was unableo produce hydrogen. However, CoQ10 production was the highesthen malic acid was used as a carbon source, reaching 5.16 mg/l in
ur study. It is indicative that CoQ10 production was not directlyroportional to the accumulation of R. rubrum biomass. As can behown in Table 5, specific CoQ10 contents differed depending onhe carbon sources. Malic acid produced the highest specific CoQ10ontent (3.32 mg/g-DCW) among the carbon sources. The resultsre in agreement with Carr and Exell [36]. Their study indicatedhat the higher CoQ10 content achieved with malate than acetate.
oreover, R. rubrum is able to grow chemotrophically (i.e. aero-ically in the darek) or phototrophically (i.e. anaerobically in the
ight) [23]. And cells adapt from chemotrophic to phototrophic con-itions, the cellular CoQ10 content increased [36]. Malic acid as ahotosynthetic reductant plays a critical role in the noncyclic pho-ophosphorylation of R. rubrum [37]. So malic acid was then chosen
Please cite this article in press as: Y. Tian, et al., Improvement of cultivation mRhodospirillum rubrum, Biochem. Eng. J. (2010), doi:10.1016/j.bej.2010.06.0
s the carbon source for further experiments.The effects of different nitrogen sources on CoQ10 production
y R. rubrum were investigated using malic acid (2 g/l) as carbonource. The results of biomass and CoQ10 production are shownn Table 6. It was found that the complex nitrogen sources (yeast
able 6ffect of various nitrogen sources on cell growth and CoQ10 production.
Nitrogen source DCW (g/l) CoQ
Yeast extract 1.56 ± 0.097 b 5.1Casitone 1.30 ± 0.111 d 3.3Ammonium sulfate 1.21 ± 0.132 d 3.7Tryptone 1.52 ± 0.087 bc 4.0Proteose peptone 1.27 ± 0.080 d 3.3Yeast extract + ammonium sulfate 1.75 ± 0.096 a 5.9Casitone + ammonium sulfate 1.36 ± 0.061 cd 3.4Tryptone + ammonium sulfate 1.53 ± 0.086 bc 4.3
ata are shown as mean ± SD (n = 3). Means within a column with the same letter are not
± 0.155 2.29 ± 0.094± 0.390 c 2.49 ± 0.141 de
significantly different as indicated by Duncan’s multiple range test (P < 0.05).
extract + ammonium sulfate) were more desirable than a singlenitrogen source. The highest CoQ10 production (5.95 mg/l) wasobtained with 2 g/l of yeast extract + ammonium sulfate (1:1, w/w),and the highest biomass (1.75 g/l) was also produced using thecomplex nitrogen sources. Comprising of the water soluble compo-nents of yeast cells, yeast extract is made primarily of amino acids,peptides, carbohydrates, and salts. The rich nitrogen, vitamins andother growth stimulating compounds in yeast extract make it anideal ingredient in microbial growth media [38]. Ammonium sul-fate, on the other hand, is less popular than yeast extract as a growthmedium. However, Knowles and Redfearn [39] found that the con-centration of CoQ10 increased when electron transport particlesderived from cells of Azotobacter vinelandii were grown on ammo-nium medium. Kuratsu et al. [40] reported that the ammonium ionaffected not only cell frowth and CoQ10 prodcution but also brothviscosity with Agrobacterium sp. Their studies are in agreementwith the findings in the present study. The presence of ammoniummedium can increase the specific CoQ10 content (Table 6).
Moreover, when malic acid was used as the carbon source, usingcomplex nitrogen sources resulted in the highest specific CoQ10content within the cell biomass, reaching 3.40 mg/g, superior tothat obtained when yeast extract or ammonium sulfate was usedas a single nitrogen source. Therefore, malic acid, yeast extract, andammonium sulfate were selected to further optimize the fermen-tation conditions for CoQ10 production.
3.2. Evaluation of mineral sources on CoQ10 production
Besides carbon and nitrogen sources, the relative significanceof eight mineral sources, including MgSO4·7H2O, ZnSO4, ferric cit-rate, EDTA, CuSO4·5H2O, CaCl2·2H2O, MnSO4·H2O, and KH2PO4,was investigated by Plackett–Burman design. As shown in Table 1,the main effect of each variable upon CoQ10 production was esti-mated as the difference between both averages of measurementmade at the high level (+1) and the low level (−1) of that fac-
edium for enhanced production of coenzyme Q10 by photosynthetic11
tor. It was found that MgSO4·7H2O, EDTA, CaCl2·2H2O and KH2PO4showed a positive effect on CoQ10 production, while ZnSO4, ferriccitrate, CuSO4·5H2O, and MnSO4·H2O resulted in a negative effecton CoQ10 production. The variables with confidence levels greaterthan 95% were considered significant.
10 production (mg/l) Specific CoQ10 content (mg/g-DCW)
6 ± 0.234 b 3.32 ± 0.099 ab
6 ± 0.383 e 2.59 ± 0.074 de
2 ± 0.400 de 3.08 ± 0.111 bc
8 ± 0.420 cd 2.68 ± 0.178 de
1 ± 0.185 e 2.47 ± 0.013 e
5 ± 0.370 a 3.40 ± 0.036 a
6 ± 0.232 e 2.54 ± 0.170 de
2 ± 0.339 c 2.82 ± 0.344 cd
significantly different as indicated by Duncan’s multiple range test (P < 0.05).
ARTICLE IN PRESSG Model
BEJ-5174; No. of Pages 7
Y. Tian et al. / Biochemical Engineering Journal xxx (2010) xxx–xxx 5
Table 7Analysis of variance (ANOVA) for regression equation.
Source Sum of square d.f. Mean square F-Value Prob > F
Model 153.78 20.00 7.69 224.27 <0.0001Residual 0.86 25.00 0.03Lack of fit 0.79 20.00 0.04 3.00 0.1131Pure error 0.07 5.00 0.01
cCfiafiiCo
coieeaa[pfpwtaporeamo
TT
Cor total 154.64 45
Both MgSO4·7H2O and ferric citrate were significant (>98%onfidence levels) for CoQ10 production, whereas EDTA,aCl2·2H2O, and KH2PO4 were insignificant with positive coef-cients for CoQ10 production. Moreover, ZnSO4, CuSO4·5H2O,nd MnSO4·H2O were found insignificant with negative coef-cients for CoQ10 production, which would not be included
n the next optimization experiments. Thus, only EDTA,aCl2·2H2O, and KH2PO4 were chosen in the low level for furtherptimization.
It is known that decaprenyl diphosphate synthase (DPPS) canatalyze the synthesis of the CoQ10 side-chain. The biosynthesisf the side-chain appears to be a rate-limiting step and criticaln CoQ10 production [17,41]. The addition of Mg2+ could increasenzymatic activity [42] because it was an essential element in thenzyme system involved in CoQ10 pathway. A gene encoding forDPPS (Rsdds) was cloned from R. sphaeroides in Escherichia coli,
nd Mg2+ was found to be essential for Rsdds enzymatic activity41]. Ferrous iron is known to be an electron carrier in the res-iration chain [43]. It has been demonstrated that generation oferrous iron for transport by the transmembrane electron trans-ort would be possible only if a form of iron such as ferric citrateould be present [44]. Moreover, it was reported that the varia-
ion in CoQ10 content of photosynthetically grown organisms isccompanied by similar changes in the content of photosyntheticigment, such as bacteriochlorophyll (BChl) [23,36]. The insertionf Mg2+ or Fe2+ at the point of metal-ion insertion plays a crucial
Please cite this article in press as: Y. Tian, et al., Improvement of cultivation mRhodospirillum rubrum, Biochem. Eng. J. (2010), doi:10.1016/j.bej.2010.06.0
ole in the Bchl synthesis [45,46]. Because of the aforementionedffect of Mg2+ and Fe2+ on CoQ10 synthesis, both MgSO4·7H2Ond ferric citrate were the most significant among the eightineral sources studied. Thus, they were selected to be further
ptimized.
able 8est of significance for regression coefficient.
Model term Coefficientestimate
d.f. Standard e
Intercept 7.60 1 0.076X1 0.51 1 0.046X2 −0.80 1 0.046X3 −0.31 1 0.046X4 2.73 1 0.046X5 −0.20 1 0.046X1X2 −0.16 1 0.093X1X3 0.12 1 0.093X1X4 −0.22 1 0.093X1X5 0.04 1 0.093X2X3 0.50 1 0.093X2X4 0.04 1 0.093X2X5 −0.16 1 0.093X3X4 0.09 1 0.093X3X5 −0.04 1 0.093X4X5 −0.09 1 0.093X1X1 −1.18 1 0.063X2X2 −0.59 1 0.063X3X3 −0.56 1 0.063X4X4 −0.94 1 0.063X5X5 −0.23 1 0.063
R = 0.9972 R2 = 0.9945 R2(Adj) = 0.9900
3.3. Optimization of CoQ10 production by RSM
Five variables X1 (malic acid), X2 (yeast extract), X3 (ammoniumsulfate), X4 (MgSO4·7H2O), and X5 (ferric citrate) were selected andfurther optimized using Box–Behnken design in RSM to determinethe optimal values for each of the factors. The levels of the vari-ables and the experimental design are shown in Tables 3 and 4. Theresults were analyzed by standard analysis of variance (ANOVA)and the Box–Behnken design was fitted with the second-orderpolynomial equation:
Y = 7.60 + 0.51X1 − 0.80X2 − 0.31X3 + 2.73X4 − 0.20X5
− 0.16X1X2 + 0.12X1X3 − 0.22X1X4 + 0.040X1X5
+ 0.50X2X3 + 0.040X2X4 − 0.16X2X5 + 0.090X3X4
− 0.042X3X5 − 0.090X4X5 − 1.18X1 X1 − 0.59X2 X2
− 0.56X3X3 − 0.94X4X4 − 0.23X5X5 (1)
The fit of the model was checked by the coefficient of deter-mination (R2), which was calculated to be 0.9945, indicating that99.45% of the total variability in the response could be explained bythis model. The statistical significance of the model was evaluatedby the F-test ANOVA, which revealed that this regression was sta-tistically significant (P < 0.0001) at a 99% confidence level. Values
edium for enhanced production of coenzyme Q10 by photosynthetic11
of ‘Prob > F’ less than 0.0500 indicate model terms are significant(Table 7).
Table 8 shows the significance of the regression coefficientsof the model. It indicated that malic acid, yeast extract, ammo-nium sulfate, MgSO4·7H2O, and ferric citrate had high significance
rror 95% CI low 95% CI upper Prob > F
7.44 7.750.42 0.61 <0.0001
−0.90 −0.71 <0.0001−0.40 −0.21 <0.0001
2.63 2.82 <0.0001−0.30 −0.11 0.0002−0.35 0.03 0.1013−0.07 0.31 0.1978−0.41 −0.03 0.0270−0.15 0.23 0.6694
0.31 0.69 <0.0001−0.15 0.23 0.6694−0.35 0.04 0.1066−0.10 0.28 0.3403−0.23 0.15 0.6502−0.28 0.10 0.3403−1.31 −1.05 <0.0001−0.72 −0.46 <0.0001−0.69 −0.43 <0.0001−1.07 −0.81 <0.0001−0.36 −0.10 0.0010
ARTICLE IN PRESSG Model
BEJ-5174; No. of Pages 7
6 Y. Tian et al. / Biochemical Engineering Journal xxx (2010) xxx–xxx
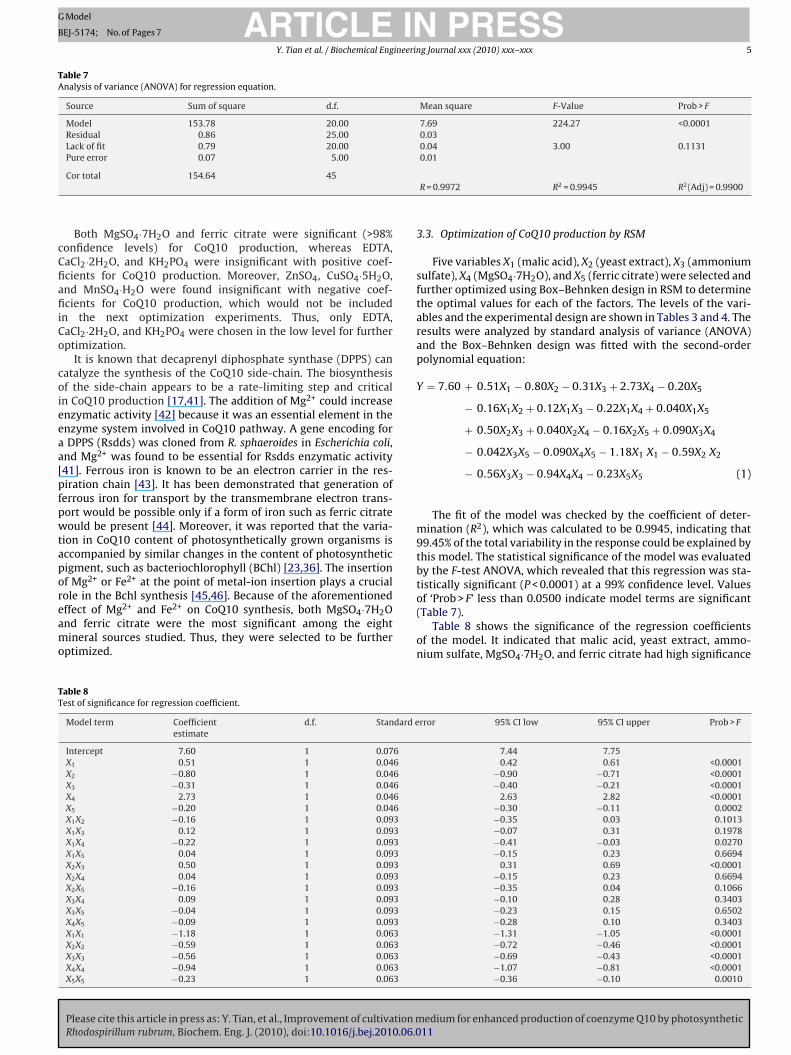
F r mutual interactions on CoQ10 production: (a) Y = f (X1, 1.29, 1.34, X4, 0.08); (b) Y = f (2.50,X (g/l); X3, ammonium sulfate (g/l); X4, magnesium sulfate (g/l); X5, ferric citrate (g/l).
(tse
pv(bpnaarfsa
3
fareow
3
pytsei1thOd4RsRi
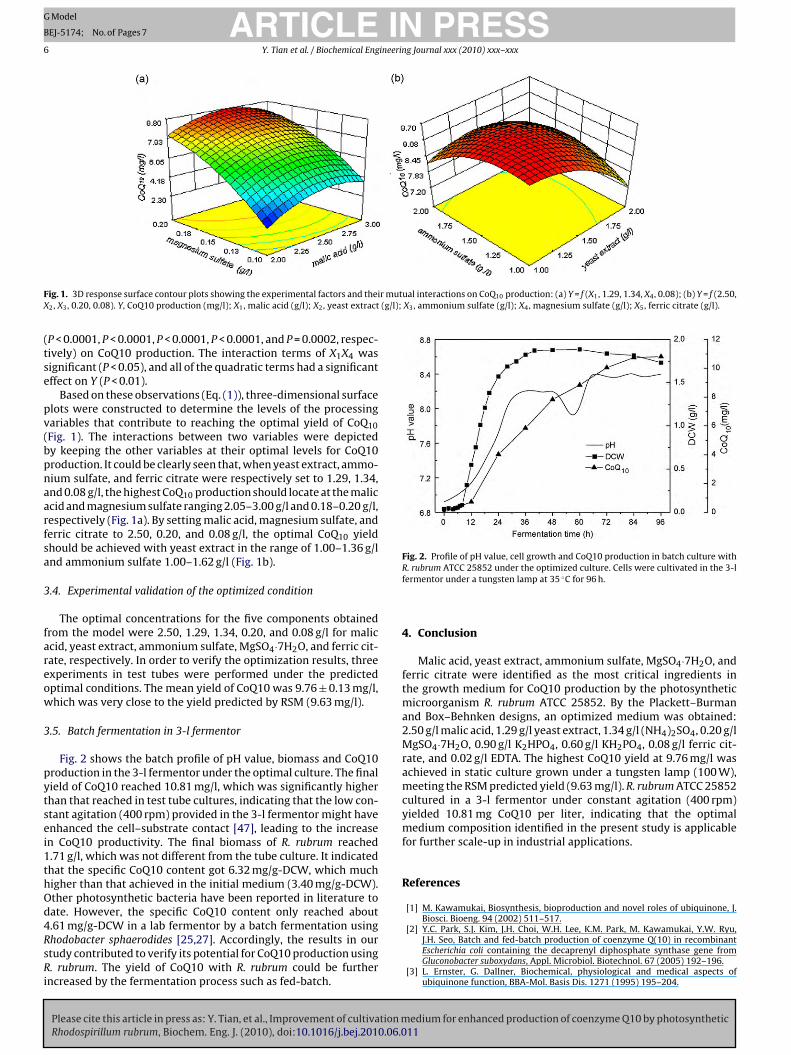
Fig. 2. Profile of pH value, cell growth and CoQ10 production in batch culture with
Biosci. Bioeng. 94 (2002) 511–517.
ig. 1. 3D response surface contour plots showing the experimental factors and thei2, X3, 0.20, 0.08). Y, CoQ10 production (mg/l); X1, malic acid (g/l); X2, yeast extract
P < 0.0001, P < 0.0001, P < 0.0001, P < 0.0001, and P = 0.0002, respec-ively) on CoQ10 production. The interaction terms of X1X4 wasignificant (P < 0.05), and all of the quadratic terms had a significantffect on Y (P < 0.01).
Based on these observations (Eq. (1)), three-dimensional surfacelots were constructed to determine the levels of the processingariables that contribute to reaching the optimal yield of CoQ10Fig. 1). The interactions between two variables were depictedy keeping the other variables at their optimal levels for CoQ10roduction. It could be clearly seen that, when yeast extract, ammo-ium sulfate, and ferric citrate were respectively set to 1.29, 1.34,nd 0.08 g/l, the highest CoQ10 production should locate at the maliccid and magnesium sulfate ranging 2.05–3.00 g/l and 0.18–0.20 g/l,espectively (Fig. 1a). By setting malic acid, magnesium sulfate, anderric citrate to 2.50, 0.20, and 0.08 g/l, the optimal CoQ10 yieldhould be achieved with yeast extract in the range of 1.00–1.36 g/lnd ammonium sulfate 1.00–1.62 g/l (Fig. 1b).
.4. Experimental validation of the optimized condition
The optimal concentrations for the five components obtainedrom the model were 2.50, 1.29, 1.34, 0.20, and 0.08 g/l for maliccid, yeast extract, ammonium sulfate, MgSO4·7H2O, and ferric cit-ate, respectively. In order to verify the optimization results, threexperiments in test tubes were performed under the predictedptimal conditions. The mean yield of CoQ10 was 9.76 ± 0.13 mg/l,hich was very close to the yield predicted by RSM (9.63 mg/l).
.5. Batch fermentation in 3-l fermentor
Fig. 2 shows the batch profile of pH value, biomass and CoQ10roduction in the 3-l fermentor under the optimal culture. The finalield of CoQ10 reached 10.81 mg/l, which was significantly higherhan that reached in test tube cultures, indicating that the low con-tant agitation (400 rpm) provided in the 3-l fermentor might havenhanced the cell–substrate contact [47], leading to the increasen CoQ10 productivity. The final biomass of R. rubrum reached.71 g/l, which was not different from the tube culture. It indicatedhat the specific CoQ10 content got 6.32 mg/g-DCW, which muchigher than that achieved in the initial medium (3.40 mg/g-DCW).ther photosynthetic bacteria have been reported in literature toate. However, the specific CoQ10 content only reached about
Please cite this article in press as: Y. Tian, et al., Improvement of cultivation mRhodospirillum rubrum, Biochem. Eng. J. (2010), doi:10.1016/j.bej.2010.06.0
.61 mg/g-DCW in a lab fermentor by a batch fermentation usinghodobacter sphaerodides [25,27]. Accordingly, the results in ourtudy contributed to verify its potential for CoQ10 production using. rubrum. The yield of CoQ10 with R. rubrum could be further
ncreased by the fermentation process such as fed-batch.
R. rubrum ATCC 25852 under the optimized culture. Cells were cultivated in the 3-lfermentor under a tungsten lamp at 35 ◦C for 96 h.
4. Conclusion
Malic acid, yeast extract, ammonium sulfate, MgSO4·7H2O, andferric citrate were identified as the most critical ingredients inthe growth medium for CoQ10 production by the photosyntheticmicroorganism R. rubrum ATCC 25852. By the Plackett–Burmanand Box–Behnken designs, an optimized medium was obtained:2.50 g/l malic acid, 1.29 g/l yeast extract, 1.34 g/l (NH4)2SO4, 0.20 g/lMgSO4·7H2O, 0.90 g/l K2HPO4, 0.60 g/l KH2PO4, 0.08 g/l ferric cit-rate, and 0.02 g/l EDTA. The highest CoQ10 yield at 9.76 mg/l wasachieved in static culture grown under a tungsten lamp (100 W),meeting the RSM predicted yield (9.63 mg/l). R. rubrum ATCC 25852cultured in a 3-l fermentor under constant agitation (400 rpm)yielded 10.81 mg CoQ10 per liter, indicating that the optimalmedium composition identified in the present study is applicablefor further scale-up in industrial applications.
References
[1] M. Kawamukai, Biosynthesis, bioproduction and novel roles of ubiquinone, J.
edium for enhanced production of coenzyme Q10 by photosynthetic11
[2] Y.C. Park, S.J. Kim, J.H. Choi, W.H. Lee, K.M. Park, M. Kawamukai, Y.W. Ryu,J.H. Seo, Batch and fed-batch production of coenzyme Q(10) in recombinantEscherichia coli containing the decaprenyl diphosphate synthase gene fromGluconobacter suboxydans, Appl. Microbiol. Biotechnol. 67 (2005) 192–196.
[3] L. Ernster, G. Dallner, Biochemical, physiological and medical aspects ofubiquinone function, BBA-Mol. Basis Dis. 1271 (1995) 195–204.
ING
B
ineerin
[
[
[
[
[
[
[
[
[
[
[
[
[
[
[
[
[
[
[
[
[
[
[
[
[
[
[
[
[
[
[
[
[
[
[[
ARTICLEModel
EJ-5174; No. of Pages 7
Y. Tian et al. / Biochemical Eng
[4] F.M. Sohet, A.M. Neyrinck, B.D. Pachikian, F.C. de Backer, L.B. Bindels, P.Niklowitz, T. Menke, P.D. Cani, N.M. Delzenne, Coenzyme Q10 supplementationlowers hepatic oxidative stress and inflammation associated with diet-inducedobesity in mice, Biochem. Pharmacol. 78 (2009) 1391–1400.
[5] R.B. Singh, M.A. Niaz, S.S. Rastogi, S.P. Verma, Coenzyme Q10 and its role inheart disease, J. Clin. Biochem. Nutr. 26 (1999) 109–118.
[6] A. Kumar, H. Kaur, P. Devi, V. Mohan, Role of coenzyme Q10 (CoQ10) in cardiacdisease, hypertension and Meniere-like syndrome, Pharmacol. Therapeut. 124(2009) 259–268.
[7] O. Portakal, O. Ozkaya, M.E. Inal, B. Bozan, M. Kosan, I. Sayek, Coenzyme Q10concentrations and antioxidant status in tissues of breast cancer patients, Clin.Biochem. 33 (2000) 279–284.
[8] V.G. Premkumar, S. Yuvaraj, K. Vijayasarathy, S. Govindaswamy, D. Gangadaran,P. Sachdanandam, Serum cytokine levels of interleukin-1 beta, -6, -8, tumournecrosis factor-alpha and vascular endothelial growth factor in breast can-cer patients treated with tamoxifen and supplemented with co-enzyme Q(10),riboflavin and niacin, Basic Clin. Pharmacol. 100 (2007) 387–391.
[9] H. Greenlee, D.L. Hershman, J.S. Jacobson, Use of antioxidant supplements dur-ing breast cancer treatment: a comprehensive review, Breast Cancer Res. Tr.115 (2009) 437–452.
10] M.F. Beal, Mitochondrial dysfunction and oxidative damage in Alzheimer’s andParkinson’s diseases and coenzyme Q(10) as a potential treatment, J. Bioenerg.Biomembr. 36 (2004) 381–386.
11] T.L. Wadsworth, J.A. Bishop, A.S. Pappu, R.L. Woltjer, J.F. Quinn, Evaluation ofcoenzyme Q as an antioxidant strategy for Alzheimer’s disease, J. AlzheimersDis. 14 (2008) 225–234.
12] H.N. Bhagavan, R.K. Chopra, Plasma coenzyme Q10 response to oral ingestionof coenzyme Q10 formulations, Mitochondrion 7 (2007) S78–S88.
13] E. Keinan, D. Eren, Total synthesis of polyprenoid natural products via Pd(0)-catalyzed oligomerizations, Pure Appl. Chem. 60 (1998) 89–98.
14] B.H. Lipshutz, P. Mollard, S.S. Pfeiffer, W. Chrisman, A short, highly efficientsynthesis of coenzyme Q10, J. Am. Chem. Soc. 124 (2002) 14282–14283.
15] S. Laplante, N. Souchet, P. Bry, Comparison of low-temperature processes foroil and coenzyme Q10 extraction from mackerel and herring, Eur. J. Lipid Sci.Technol. 111 (2009) 135–141.
16] H. Yoshida, Y. Kotani, K. Ochiai, K. Araki, Production of ubiquinone-10 usingbacteria, J. Gen. Appl. Microbiol. 44 (1998) 19–26.
17] J.H. Choi, Y.W. Ryu, J.H. Seo, Biotechnological production and applications ofcoenzyme Q10, Appl. Microbiol. Biotechnol. 68 (2005) 9–15.
18] C.P. Cluis, A.M. Burja, V.J.J. Martin, Current prospects for the production ofcoenzyme Q10 in microbes, Trends Biotechnol. 25 (2007) 514–521.
19] Y. Natori, T. Nagasaki, Enhancement of coenzyme Q10 accumulation by muta-tion and effects of medium components on the formation of coenzyme Qhomologs by Pseudomonas N842 and mutants, Agric. Biol. Chem. 45 (1981)2175–2182.
20] S.J. Ha, S.Y. Kim, J.H. Seo, D.K. Oh, J.K. Lee, Optimization of culture conditionsand scale-up to pilot and plant scales for coenzyme Q10 production by Agrobac-terium tumefaciens, Appl. Microbiol. Biotechnol. 74 (2007) 974–980.
21] K. Kondo, Y. Yamada, K. Mitzugi, S. Otsuka, Method of producing coenzyme Q10by microorganisms, Ajinomoto Co., Inc. (Tokyo, JA), United States, 1973.
22] K. Hata, K. Ohshima, I. Kano, M. Matsui, T. Sato, Process for producing coenzymeQ10, Jujo Paper Co., Ltd. (Tokyo, JP), United States, 1981.
23] J. Oelze, W. Pahlke, S. Bohm, Ubiquinone 10 formation in Rhodospirillum rubrum
Please cite this article in press as: Y. Tian, et al., Improvement of cultivation mRhodospirillum rubrum, Biochem. Eng. J. (2010), doi:10.1016/j.bej.2010.06.0
under different culture conditions, Arch. Microbiol. 102 (1975) 65–69.24] H. Grammel, R. Ghosh, Redox-state dynamics of ubiquinone-10 imply coop-
erative regulation of photosynthetic membrane expression in Rhodospirillumrubrum, J. Bacteriol. 190 (2008) 4912–4921.
25] H.W. Yen, T.Y. Shih, Coenzyme Q(10) production by Rhodobacter sphaeroides instirred tank and in airlift bioreactor, Bioproc. Biosyst. Eng. 32 (2009) 711–716.
[
[
PRESSg Journal xxx (2010) xxx–xxx 7
26] N.B. Kien, I. Kong, M. Lee, J.K. Kim, Coenzyme Q10 production in a 150-l reactorby a mutant strain of Rhodobacter sphaeroides, J. Ind. Microbiol. Biotechnol. 37(2010) 521–529.
27] H.W. Yen, C.H. Chiu, The influences of aerobic-dark and anaerobic-light cul-tivation on CoQ(10) production by Rhodobacter sphaeroides in the submergedfermenter, Enzyme Microb. Technol. 41 (2007) 600–604.
28] C. Sasikala, C.V. Ramana, Biotechnological potentials of anoxygenic pho-totrophic bacteria. I, in: S.L. Neidleman, A.I. Laskin (Eds.), Advances in AppliedMicrobiology, Academic Press, New York, 2000, p. 199.
29] G.D. Najafpour, H. Younesi, Effect of culture’s initial pH on hydrogen produc-tion from synthesized gas by Rhodospirillum rubrum INZYNIERIA MINERALNA,J. Polish Miner. Eng. Soc. IV (2/11) (2003) 29–40.
30] H. Younesi, G. Najafpour, K.S. Ku Ismail, A.R. Mohamed, A.H. Kamaruddin, Bio-hydrogen production in a continuous stirred tank bioreactor from synthesisgas by anaerobic photosynthetic bacterium: Rhodopirillum rubrum, Bioresour.Technol. 99 (2008) 2612–2619.
31] V. Deepak, K. Kalishwaralal, S. Ramkumarpandian, S.V. Babu, S.R. Senthilkumar,G. Sangiliyandi, Optimization of media composition for Nattokinase productionby Bacillus subtilis using response surface methodology, Bioresour. Technol. 99(2008) 8170–8174.
32] C.H. Zhang, Y.J. Ma, F.X. Yang, W. Liu, Y.D. Zhang, Optimization of mediumcomposition for butyric acid production by Clostridium thermobutyricum usingresponse surface methodology, Bioresour. Technol. 100 (2009) 4284–4288.
33] R.L. Plackett, J.P. Burman, The design of optimum multifactorial experiments,Biometrika 33 (1946) 305–325.
34] G.E.P. Box, D.W. Behnken, Some new three level designs for the study of quan-titative variables, Technometrics 2 (1960) 455–475.
35] G. Najafpour, H. Younesi, A.R. Mohamed, Effect of organic substrate on hydrogenproduction from synthesis gas using Rhodospirillum rubrum, in batch culture,Biochem. Eng. J. 21 (2004) 123–130.
36] N.G. Carr, G. Exell, Ubiquinone concentrations in Athiorhodaceae grown undervarious environmental conditions, Biochem. J. 96 (1965) 688–692.
37] K.S. Stenn, Cation transport in a photosynthetic bacterium, J. Bacteriol. 96(1968) 862–864.
38] M.S. Kalil, H.S. Alshiyab, W.M.W. Yusoff, Effect of nitrogen source and carbon tonitrogen ratio on hydrogen production using C. acetobutylicum, Am. J. Biochem.Biotechnol. 4 (2008) 393–401.
39] C.J. Knowles, E.R. Redfearn, The effect of combined-nitrogen sources on the syn-thesis and function of the electron transport system of Azotobacter vinelandii,Biochim. Biophys. Acta Bioenerg. 162 (1968) 348–355.
40] Y. Kuratsu, H. Hagino, K. Inuzuka, Effect of ammonium ion on coenzyme Q10fermentation by Agrobacterium species, Agric. Biol. Chem. 48 (1984) 1347–1348.
41] H.S. Zahiri, K.A. Noghabi, Y.C. Shin, Biochemical characterization of thedecaprenyl diphosphate synthase of Rhodobacter sphaeroides for coenzymeQ(10) production, Appl. Microbiol. Biotechnol. 73 (2006) 796–806.
42] T. Koyama, H. Fujii, K. Ogura, Enzymatic hydrolysis of polyprenyl pyrophos-phates, Methods Enzymol. 110 (1985) 153–155.
43] R.A. Leppick, I.G. Young, F. Gibson, Membrane-associated reactions inubiquinone biosynthesis in Escherichia coli 3-octaprenyl-4-hydroxybenzoatecarboxylyase, Biochim. Biophys. Acta Bioenerg. 436 (1976) 800–810.
44] F.L. Crane, New functions for coenayme Q, Protoplasma 213 (2000) 127–133.45] M.D. Moody, H.A. Dailey, Ferric iron reductase of Rhodopseudomonas
edium for enhanced production of coenzyme Q10 by photosynthetic11
sphaeroides, J. Bacteriol. 163 (1985) 1120–1125.46] C.J. Walker, R.D. Willows, Mechanism and regulation of Mg-chelatase, Biochem.
J. 327 (1997) 321–333.47] Y.M. Lo, C.H. Hsu, S.T. Yang, D.B. Min, Oxygen transfer characteristics of a cen-
trifugal, packed-bed reactor during viscous xanthan fermentation, Bioproc.Biosyst. Eng. 24 (2001) 187–193.