imported skill-biased technological change in developing countries
TRANSCRIPT

IMPORTED SKILL-BIASED TECHNOLOGICAL CHANGE INDEVELOPING COUNTRIES
Andrea CONTE1 and Marco VIVARELLI2,3
1Directorate-General for Economic and Financial Affairs, European Commission, Brussels,Belgium; 2Catholic University of Milano, Italy; Institute for the Study of Labor (IZA),
Bonn, Germany; and 3Centre for the Study of Globalisation and Regionalisation (CSGR),Warwick University, Coventry, UK
First version received October 2009; final version accepted July 2010
This paper discusses the occurrence of skill-enhancing technology import, namely, therelationship between imports of embodied technology and widening skill-basedemployment differentials in low- and middle-income countries. Generalized method ofmoments (GMM) techniques are applied to an original panel dataset comprising 28manufacturing sectors for 23 countries over a decade. Econometric results providerobust evidence of the determinants of widening employment differentials in low- andmiddle-income countries. In particular, the proposed empirical evidence indicatescapital–skill complementarity as a possible source of skill bias, while imported skill-enhancing technology emerges as an additional driver of increasing demand for theskilled workers in these countries.
Keywords: Skill-biased technological change; Capital–skill complementarity; GMMestimation; General industrial statistics; World trade analyzerJEL classification: F16, J23, J24, O33
I. INTRODUCTION
S ince the beginning of the 1980s, a growing wage and employment dividebetween skilled and unskilled workers has been documented in the UnitedStates (Juhn, Murphy, and Pierce 1993), in the United Kingdom (Machin
1996), in Japan (Katz and Revenga 1990), and in other OECD countries (Nickelland Bell 1996).
Many scholars have applied the insights of the classical Stolper–Samuelson(S–S) theorem and related the rising trend of inequality in high-income countriesto trade with low- and middle-income (LMICs) economies (Wood 1995).1 On the
1 The Stolper–Samuelson (S–S) theorem suggests that—under some economic assumptions (i.e.,perfect competition, constant returns)—a rise (fall) in the relative price of a good will lead to a rise(fall) in the return to that factor which is used most intensively in the production of the good, and
The Developing Economies 49, no. 1 (March 2011): 36–65
© 2011 The AuthorsThe Developing Economies © 2011 Institute of Developing Economies
doi: 10.1111/j.1746-1049.2010.00121.x
contrary, technology-based explanations have emphasized the role of skill-biasedtechnological change (SBTC) in shifting relative employment levels betweenskilled and unskilled labor (Bound and Johnson 1992). While much economicliterature has dealt with the determinants of within-country inequality in OECDeconomies (Katz and Autor 1999), recent contributions have started to assess theinequality-enhancing effect of the contemporaneous occurrence of economic inte-gration and technology diffusion in LMICs (Vivarelli 2004). Indeed, both trade-based and technology-based explanations suggest an increase in within-countryinequality in high-income countries while they imply an opposite theoreticalprediction in low- and middle-income countries since trade integration shouldfavor an increase in the relative demand for unskilled labor and therefore reducewithin-country inequality (while technology diffusion works in the oppositedirection).
This paper discusses the occurrence of skill-enhancing technology import(SETI), namely, the relationship between imports of embodied technology and theemployment of skilled and unskilled labor in LMICs. The aim is to empirically testthe skill-bias effect of international technology transfer in countries which relymainly on this channel for their technological upgrading.
Three aspects make this paper different from other empirical studies in this field.First, it provides an original detailed measure of SETI, while previous research hasfocused only on indirect proxies of technology transfer across countries. Asdescribed in Section III.B, the advantage of this indicator refers to its accountabil-ity, which in turn allows a detailed analysis of technological trade flows acrosscountries. Second, this study offers a unified multi-country analysis by using anoriginal time-series cross-sectional dataset of 4,934 observations at the sector levelfor 23 LMICs. In turn, this allows us to overcome the limitations which charac-terize country-specific research, namely, the possible occurrence of institutional orother country-specific factors which may affect the results obtained. Finally, theempirical analysis verifies the hypotheses of “SETI” and “capital–skill comple-mentarity,” where the latter investigates the relationship between capitalinvestment and the employment of skilled labor by looking at two separateemployment equations for skilled and unskilled workers rather than using a single-equation framework. In turn, this allows to identify the separate effects of capital
conversely, to a fall (rise) in the return to the other factor. If skilled and unskilled labor representthese two factors, trade specialization and FDI inflows will increase the international demand forunskilled labor in low- and middle-income countries (where this is the abundant factor) and, thus,decrease wage dispersion and inequality in these countries. The opposite will occur in high-incomecountries, namely, an increase in the demand for the relative abundant factor (skilled labor), andthus an increase in the level of within-country inequality (Wood 1994, p. 59).
imported skill-biased technological change 37
© 2011 The AuthorsThe Developing Economies © 2011 Institute of Developing Economies

and SETI on the two categories of labor (skilled and unskilled), and thus verify theoccurrence of absolute or relative skill bias.2
The remainder of the paper is organized as follows: a discussion about thetheoretical framework (Section II) is followed by a description of the data (SectionIII) and the adopted econometric methodology (Section IV). Subsequently, theempirical results obtained from the descriptive analysis (Section V) and the econo-metric estimates (Section VI) are discussed. Section VII concludes the paper bysummarizing the main findings.
II. INTERPRETATIVE BACKGROUND
Two main streams of literature have provided competing theoretical frameworksfor assessing the employment evolution of skills over time (Moore and Ranjan2005). On the one hand, some scholars have focused on the employment effect oftrade and foreign direct investment (FDI) by stressing the role of recipient econo-mies in the international division of labor. On the other hand, technology-basedexplanations have pointed to the intrinsic factor bias of technological change whileneglecting the effect of international trade and/or a country’s relative factor endow-ments. The core of the disagreement between these two approaches refers to thedegree of endogeneity between technological change and trade, namely, whichfactor has to be declared ultimately responsible for the increase in within-countryinequality worldwide. Although starting from different perspectives, these twolines of research have sometimes converged over time in the assessment of theemployment effect of international technology transfer.
A. The Employment Effect of Economic Integration
The classical Heckscher–Ohlin (H–O) and Stolper–Samuelson (S–S) trade theo-rems provide an analytical framework consistent with the expansion ofinternational trade and widening skill-based inequality in high-income countries(Burtless 1995). However, its predicted egalitarian effect in low- and middle-income countries appears at odds with available empirical evidence of increasedwithin-country inequality (Revenga 1997).
The basic dichotomic framework depicted by the H–O/S–S theorem has beenextended in three main directions (Slaughter 1998). These research lines haverelated the degree of within-country inequality to the distributive outcome of acountry’s specific trade flows. For instance, the skill-based tripartite distinction of
2 Absolute skill bias indicates an opposite effect of capital and/or SETI on the two labor categories(i.e., negative on unskilled labor and positive on skilled labor). On the contrary, relative skill biasindicates a similar effect—but different magnitude—on skilled and unskilled labor (i.e., positiveand greater for the former).
38 the developing economies
© 2011 The AuthorsThe Developing Economies © 2011 Institute of Developing Economies

the workforce proposed by Wood (1994, p. 213) allows for the possibility thatinternational trade may lead to different within-country inequality trends in low-and middle-income countries (Meschi and Vivarelli 2009). In a similar way, therepresentation of countries along a skill-supply continuum, rather than in a stan-dard North–South framework, suggests that the direction of a country’s trade flowswill determine the final distributional outcome (Davis 1996). A final departurefrom the standard H–O/S–S theorem is represented by the classification of tradedgoods according to their embodied (skill-related) technological content(Dornbusch, Fischer, and Samuelson 1980). Indeed, this setting allows for thepossible counter-effects of economic integration on within-country inequalitywhile promoting technological upgrading in low- and middle-income countries.Trade economists have advocated the H–O/S–S theorem as a suitable analyticalframework for explaining long-run distributional dynamics, whereas competingtrade-based factors, such as the occurrence of defensive endogenous innovation(Leamer 1996), “market-stealing” effects and/or “crowding-out” of domestic pro-duction (Beyer, Rojas, and Vergara 1999), explain the upward short-run inequalitytrend in low- and middle-income countries.
B. The Employment Effect of Technological Change
Economic research on the employment effect of technological change hasfocused mainly on the occurrence of a mismatched technology-based explanationof unemployment and the effectiveness of compensation mechanisms in the labormarkets (Vivarelli and Pianta 2000). Research has since moved into the employ-ment impact of technological change on different skills by providing a significantamount of evidence for the occurrence of SBTC among OECD countries (Machinand Van Reenen 1998). The SBTC hypothesis implies that the exogenous adoptionof a new technology will result in a relative employment shift from unskilled toskilled workers which raises both relative wage and employment levels.3 Severalfindings support the SBTC hypothesis against competing explanations of within-country inequality. First, the predominance of the within-industry component ofthe overall employment shift of different skills is more consistent with SBTC thanwith changes in product demand, trade patterns, or Hicks-neutral sector-biasedtechnological change. The latter, on the contrary, favor between-industry realloca-tions towards skill-intensive sectors (Katz and Murphy 1992). Second, suchwithin-industry employment shifts, coupled with available evidence of higherrelative wages, are consistent with the occurrence of a pervasive phenomenonacross industries and countries such as the diffusion of SBTC (Bresnahan and
3 Indeed, this definition does not require an absolute decline in the demand for unskilled workers oran absolute increase in the demand for skilled workers (Berman, Bound, and Machin 1998).
imported skill-biased technological change 39
© 2011 The AuthorsThe Developing Economies © 2011 Institute of Developing Economies

Trajtenberg 1995).4 Finally, some authors support the occurrence of SBTC byproviding evidence of within-industry correlations between measures of techno-logical change and skilled employment (Autor, Katz and Krueger 1998).
While the bulk of economic research on the employment effect of technologicalchange has focused on high-income countries, there has been a growing recogni-tion of the role of skill-biased technological change in raising within-countryinequality in low- and middle-income countries (Pavcnik 2003). Trade- andtechnology-based explanations of within-country inequality have found commonanalytical patterns in the assessment of the effects of technology transfers to low-and middle-income countries.
C. The Employment Effect of Technology Transfer
International technology transfer represents a crucial determinant of technologi-cal upgrading and economic growth in low- and middle-income countries, giventhe negligible level of aggregate R&D investment in these economies (Coe,Helpman, and Hoffmaister 1997). The economic literature has discussed severalchannels of international technology diffusion, such as trade and FDI, licensing,scientific journals, internet, and other sources of cross-border communication(Schiff, Wang, and Olarreaga 2002). From a theoretical perspective, the relaxationof the H–O hypothesis of technological homogeneity among countries opens theway to the assessment of the within-country inequality effect of technology trans-fer in low- and middle-income countries (Acemoglu 1998).
The extent and the timing of the employment effect of technology transfer inthese countries depend on the interaction between their degree of economic inte-gration, the characteristics of the imported technologies and some specific“absorptive capacities” of recipient economies (Cohen and Levinthal 1989; Leeand Vivarelli 2004, 2006).5 In turn, the extent of the inequality-enhancing effects oftechnology transfer depends on the intrinsic labor-saving and skill-bias features ofimported technologies, and it may be reinforced by trade-based adverse competi-tive effects over time. Indeed, integration among markets increases internationalcompetitive pressures and the need for firms in low- and middle-income countriesto modernize. On the one hand, this may stimulate investments in human capitaland therefore the occurrence of defensive skill bias (Thoenig and Verdier 2003). Onthe other hand, firms in these countries may invest more in the imports of capital
4 At the same time, such pervasive effects weaken competing explanations of within-countryinequality based on country-specific shifts in domestic labor demand/supply (Wood 1994, p. 171)or institutional variables, such as the decline in trade union membership and the extent of pay-setting norms (DiNardo, Fortin, and Lemieux 1996).
5 These capacities are strongly related to a country’s labor market institutions (Acemoglu 2003), skillsupply (Schiff and Wang 2004) and the extent of skill-biased organizational changes (Caroli,Greenan, and Guellec 2001).
40 the developing economies
© 2011 The AuthorsThe Developing Economies © 2011 Institute of Developing Economies

goods from high-income countries. Trade liberalization therefore shows a skill-enhancing effect in low- and middle-income countries (Robbins 2003) since itinduces both capital deepening, which increases relatively skilled employmentbecause of capital–skill complementarities, and skill-biased technological changediffusion (Berman and Machin 2000, 2004). The economic literature does notprovide clear-cut evidence on the relative importance of these two factors inexplaining skill upgrading in low- and middle-income countries. The methodologyand the econometric analysis adopted in this paper aim at providing an answer tothis question.
III. DATASET AND INDICATORS
The empirical analysis in this paper is based on an original panel dataset charac-terized by an unbalanced structure comprising 4,934 observations representative of28 three-digit International Standard Industrial Classification (ISIC) Rev. 2 manu-facturing sectors (Major Division 3) of 23 low- and middle-income countries overthe period 1980–91. The main original data source is the United Nations GeneralIndustrial Statistics, Volume 1: 1953–1993 (UN-GIS Vol. 1), which providesannual sector data on employment and wage by production categories, valueadded, and capital formation. These variables are merged with the SETI indicator(Section III.B), which is computed on data obtained from Statistics Canada’sWorld Trade Analyzer. This dataset allows us to track the economic value ofbilateral trade flows worldwide since 1980 at the four-digit level of StandardInternational Trade Classification (SITC) Rev. 2 classification. Finally, purchasingpower parity and the GDP deflator are taken from Penn World Table 6.1 and theWorld Bank’s World Development Indicators, 2004, respectively.
Table 1 provides a list of the variables employed in the empirical analysis andtheir definitions. Appendix I describes these indicators in more detail.
A. Methodological Issues
The absence of exhaustive sources of innovation and employment data in low-and middle-income countries represents a common problem faced by appliedresearch in this field. This issue becomes critical in the context of a multi-countrystudy, since the lack of comparability between different national data sourcesrestricts the choice of data providers to international agencies only. In particular,the only available dataset which offers data for “operative” and “nonoperative”workers at the sector level is the UN-GIS Vol. 1.6 Therefore, the UN-GIS Vol. 1
6 After 1993, the collection of industrial statistics passed from the United Nations to the UnitedNations Industrial Development Organization (UNIDO). However, the new dataset, whose namebecame UNIDO Industrial Statistics, did not comprise data for “operative” workers, providing,
imported skill-biased technological change 41
© 2011 The AuthorsThe Developing Economies © 2011 Institute of Developing Economies

represents a unique and valuable source of information regarding the labor marketof many low- and middle-income countries in a very informative decade—the1980s—which has witnessed the appearance of the globalization process in termsof an exponential increase in total real trade between high-income countries andlow- and middle-income countries (Wood 1998). This data source therefore allowsus to gain useful insights into the occurrence of some structural relationshipsbetween economic variables, such as the impact of technology transfer on within-country inequality, as described in this paper. Indeed, precisely this approachjustifies the recent use of this dataset among scholars (Berman and Machin 2000,2004; Zhu 2005).
The lack of primary data does not represent the only problem the empiricalresearcher has to deal with. The procedure for merging different available datasetsdoes allow us to overcome the absence of a specific data source on innovation andemployment in low- and middle-income countries. However, the absence of adirect one-to-one conversion table between trade and sector classifications repre-sents a serious challenge for the empirical definition of a measure of technologytransfer. In the next section we discuss a suitable solution to this problem byoffering an original procedure for creating a meaningful one-to-one conversiontable of SITC-ISIC values.
B. Skill-Enhancing Technology Import (SETI)
The methodological problems discussed in the previous section have affectedeconomic research in two ways. First, many studies dealing with technological
instead, an aggregate variable “employees” only. Such a methodological shift has resulted in thedisturbing lack of updated cross-country statistics on relative employment and wage by productioncategories.
TABLE 1
List of Variables and Definitions
BC Number of employees engaged in production activities (or “blue collar”)WC Number of employees engaged in non-production activities (or “white collar”)WBC Per-capita wage/payment made to BC workersWWC Per-capita wage/payment made to WC workersVA Value added—value of census output less the value of census inputKA Gross fixed capital formationSETI Trade value of technology importKD Capital deepening, namely, KAcit/VAcit
TID SETI deepening, namely, SETIcit/VAcit
Sectors International Standard Industrial Classification Rev. 2, 28 manufacturing sectorsCountries 23 low- and middle-income countries; the World Bank Development Indicators;
classification at 1980Years Annual observations; time period: 1980–91
42 the developing economies
© 2011 The AuthorsThe Developing Economies © 2011 Institute of Developing Economies

change and employment in low- and middle-income countries have adopted acountry-specific approach.7 This may represent a limitation if country-specificfactors, such as the institutions in the labor market, may affect results on therelationship between technology and skill adoption. Second, empirical researchadopting a multi-country perspective has been based mainly upon indirect tests.8
Although this line of research has advocated the occurrence (and pervasiveness) ofskill-biased technology transfer in low- and middle-income countries, it does infact lack a direct measure of technology transfer, and thus, the technologiestransferred, the transmission channels adopted, and, finally, the actual directemployment impact of technology transfer on different skills in low- and middle-income countries. To summarize, the key issue is that “. . . about low incomecountries we know very little. Our data are not particularly informative abouttechnology transfer” (Berman and Machin 2004, p. 66). The absence of a directmeasure of technology transfer inevitably weakens empirical analysis. Such anideal indicator would allow a more reliable and straightforward assessment of thecausal relationship between technological change and employment of differentskills in low- and middle-income countries.
This paper provides an original measure of SETI, which aims precisely atovercoming the use of indirect proxies of technology transfer. This indicator isdirect and accountable since it comprises the annual sum of the economic value oftrade flows from high-income countries to each low- and middle-income countryof those capital goods which reasonably incorporate technological upgrading. Inparticular, SETI will include the import of industrial machinery and equipment,power-generating machinery, electrical machinery and apparatus, and informationand communication technology (ICT) capital goods such as office machines,automatic data-processing equipment, and telecommunication apparatus (TLC).9
The indicator of SETI therefore permits a detailed analysis of such trade flows,since traded goods are selected at the highest available level of detail, namely, thefour-digit level of the SITC Rev. 2 taxonomy.
Three motivations sustain the strategy adopted in the construction of this vari-able. First, capital goods are selected in line with previous economic literaturewhich underlines the importance of “general purpose technologies” (Bresnahanand Trajtenberg 1995) for technological upgrading in many economic sectors.
7 Some examples are Robbins and Gindling (1999) for Costa Rica; Feliciano (2001) for Mexico;Kang and Hong (2002) for South Korea; Attanasio, Goldberg, and Pavcnik (2004) for Colombia;Berman, Somanathan, and Tan (2005) for India.
8 In particular, technology transfer has been proxied by the occurrence of pair-wise correlations ofwithin-industry skill upgrading in different countries and by cross-country correlations betweenskill upgrading in low- and middle-income countries and current and lagged technological variablesin OECD countries (Berman and Machin 2004).
9 For a detailed list of the four-digit goods used to construct the SETI variable, see Appendix II.
imported skill-biased technological change 43
© 2011 The AuthorsThe Developing Economies © 2011 Institute of Developing Economies
Since they embody newer technologies and are widely used across different eco-nomic sectors, these capital goods are very likely to affect labor market dynamics(Piva 2003)—as, for instance, in the case of ICT (Keller 2002). Second, high-income countries are also those economies which produce and employ the mostadvanced technologies.10 Finally, low- and middle-income countries have a negli-gible level of R&D and innovative investment and their (almost) unique channel oftechnological upgrading is represented by the import of technological change fromhigh-income countries (see Section II.C).
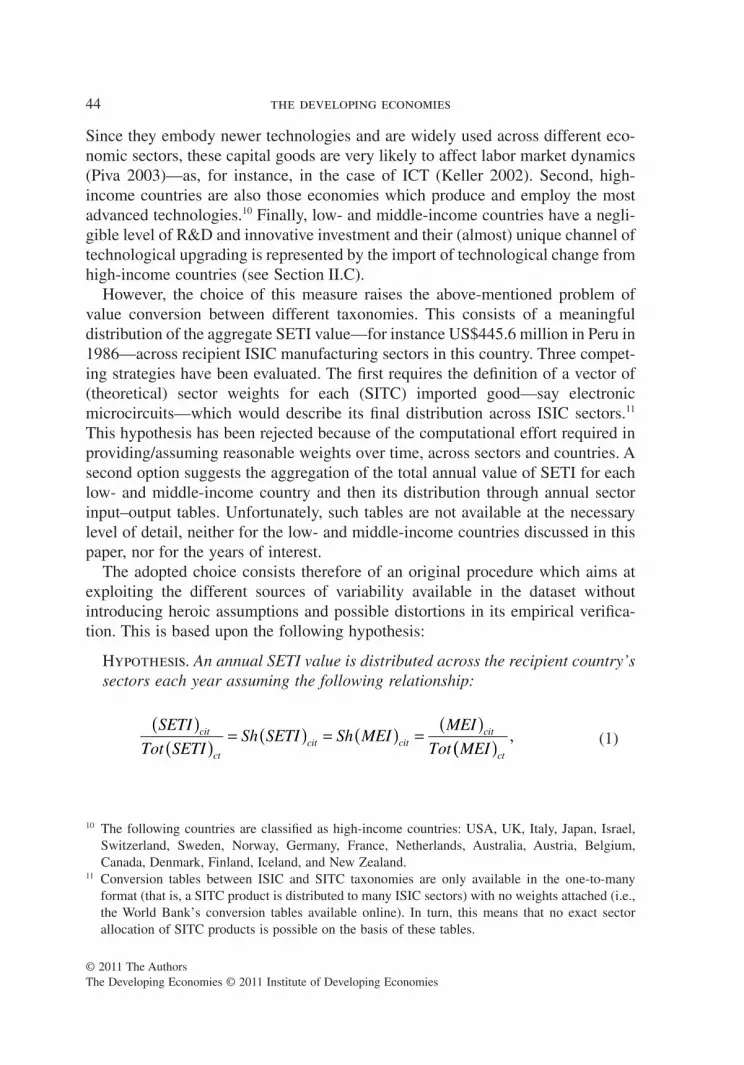
However, the choice of this measure raises the above-mentioned problem ofvalue conversion between different taxonomies. This consists of a meaningfuldistribution of the aggregate SETI value—for instance US$445.6 million in Peru in1986—across recipient ISIC manufacturing sectors in this country. Three compet-ing strategies have been evaluated. The first requires the definition of a vector of(theoretical) sector weights for each (SITC) imported good—say electronicmicrocircuits—which would describe its final distribution across ISIC sectors.11
This hypothesis has been rejected because of the computational effort required inproviding/assuming reasonable weights over time, across sectors and countries. Asecond option suggests the aggregation of the total annual value of SETI for eachlow- and middle-income country and then its distribution through annual sectorinput–output tables. Unfortunately, such tables are not available at the necessarylevel of detail, neither for the low- and middle-income countries discussed in thispaper, nor for the years of interest.
The adopted choice consists therefore of an original procedure which aims atexploiting the different sources of variability available in the dataset withoutintroducing heroic assumptions and possible distortions in its empirical verifica-tion. This is based upon the following hypothesis:
Hypothesis. An annual SETI value is distributed across the recipient country’ssectors each year assuming the following relationship:
SETI
Tot SETISh SETI Sh MEI
MEI
Tot MEIcit
ctcit cit
cit( )( )
= ( ) = ( ) =( )
(( )ct
, (1)
10 The following countries are classified as high-income countries: USA, UK, Italy, Japan, Israel,Switzerland, Sweden, Norway, Germany, France, Netherlands, Australia, Austria, Belgium,Canada, Denmark, Finland, Iceland, and New Zealand.
11 Conversion tables between ISIC and SITC taxonomies are only available in the one-to-manyformat (that is, a SITC product is distributed to many ISIC sectors) with no weights attached (i.e.,the World Bank’s conversion tables available online). In turn, this means that no exact sectorallocation of SITC products is possible on the basis of these tables.
44 the developing economies
© 2011 The AuthorsThe Developing Economies © 2011 Institute of Developing Economies

where Sh(SETI)cit and Sh(MEI)cit represent the annual share (over total manu-facturing) of SETI and total machinery and equipment investment (MEI),respectively, for each sector i of country c in year t. Therefore, the sectordistribution of MEI is used to distribute the annual value of SETI across thedifferent manufacturing sectors within the recipient country. This assumptionimplies that cross-sectoral differences in SETI, in each country and each year,may be reasonably proxied by the inter-sectoral shares of total machinery andequipment investment. In turn, this means that sectors with a relatively highshare of total machinery and equipment investment are also those sectors witha higher proportion of SETI in each country.12
IV. ECONOMETRIC ISSUES
This section provides a framework for the theoretical specification of an employ-ment equation and its econometric analysis. The SETI hypothesis, namely, therelative increase in skilled employment in low- and middle-income countries dueto imports of embodied technology from richer countries is verified throughgeneralized method of moments (GMM) techniques applied to two distinct equa-tions for skilled and unskilled labor.
A. Model Specification
The starting framework for the empirical estimation of an employment equationis given by the consideration of a perfectly competitive industry operating underthe following general constant elasticity of substitution (CES) production function:
Y H AL BK= ( ) + ( )⎡⎣⎢
⎤⎦⎥
− − −σσ
σσ
σσ1 1 1
, (2)
where Y is the output, L and K represent conventional inputs such as labor andcapital; H, A, and B distinguish a Hicks-neutral, a labor-augmenting, and a capital-augmenting technology, respectively. The first-order profit-maximization conditionfor labor—when a distinction is made between “blue-collar” (BC) and “white-collar” (WC) workers—allows us to express the previous equation as follows:
ln ln ln ln ,BC Y WBC ABC BC( ) = ( ) − ( ) + −( ) ( )σ σ 1 (3)
12 Unfortunately, data on MEI—obtained from the UN-GIS dataset—are available only in 2,500cases out of the overall 4,934 observations. Where missing, a country’s sector distribution of SETIhas been obtained from total capital investment shares rather than from total machinery andequipment investment shares. This appears as a safe alternative option due to the strong significantcorrelation between total capital and machinery investments (0.88).
imported skill-biased technological change 45
© 2011 The AuthorsThe Developing Economies © 2011 Institute of Developing Economies
ln ln ln ln ,WC Y WWC AWC WC( ) = ( ) − ( ) + −( ) ( )σ σ 1 (4)
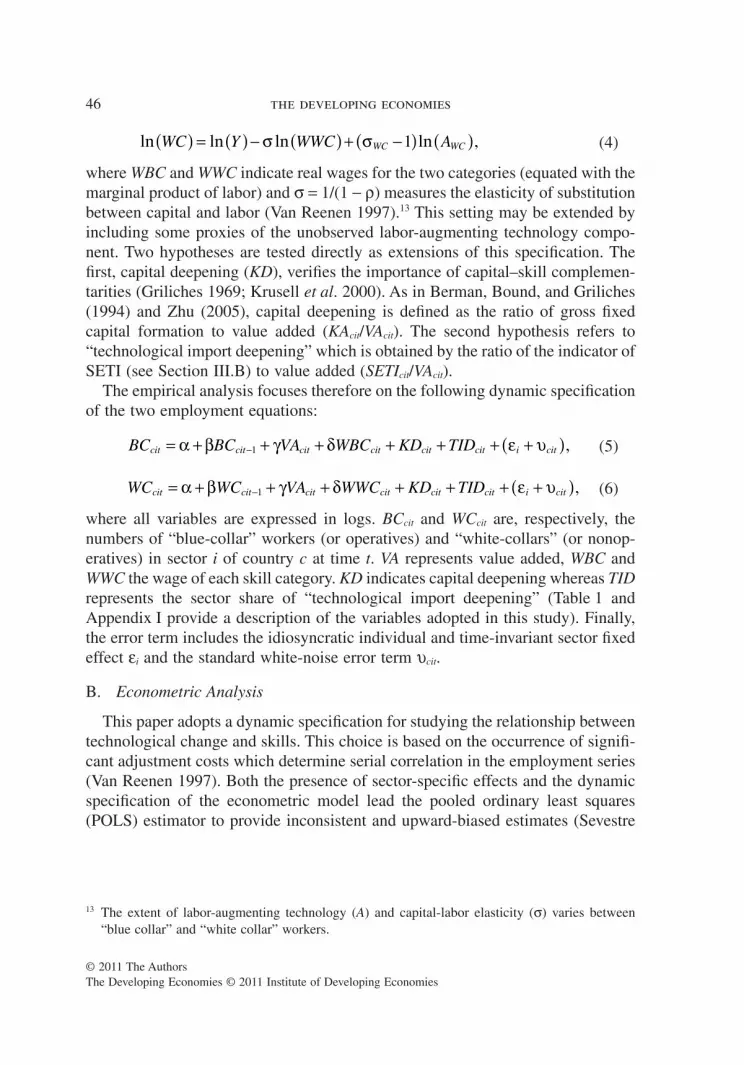
where WBC and WWC indicate real wages for the two categories (equated with themarginal product of labor) and s = 1/(1 - r) measures the elasticity of substitutionbetween capital and labor (Van Reenen 1997).13 This setting may be extended byincluding some proxies of the unobserved labor-augmenting technology compo-nent. Two hypotheses are tested directly as extensions of this specification. Thefirst, capital deepening (KD), verifies the importance of capital–skill complemen-tarities (Griliches 1969; Krusell et al. 2000). As in Berman, Bound, and Griliches(1994) and Zhu (2005), capital deepening is defined as the ratio of gross fixedcapital formation to value added (KAcit/VAcit). The second hypothesis refers to“technological import deepening” which is obtained by the ratio of the indicator ofSETI (see Section III.B) to value added (SETIcit/VAcit).
The empirical analysis focuses therefore on the following dynamic specificationof the two employment equations:
BC BC VA WBC KD TIDcit cit cit cit cit cit i cit= + + + + + + +( )−α β γ δ ε υ1 , (5)
WC WC VA WWC KD TIDcit cit cit cit cit cit i cit= + + + + + + +( )−α β γ δ ε υ1 , (6)
where all variables are expressed in logs. BCcit and WCcit are, respectively, thenumbers of “blue-collar” workers (or operatives) and “white-collars” (or nonop-eratives) in sector i of country c at time t. VA represents value added, WBC andWWC the wage of each skill category. KD indicates capital deepening whereas TIDrepresents the sector share of “technological import deepening” (Table 1 andAppendix I provide a description of the variables adopted in this study). Finally,the error term includes the idiosyncratic individual and time-invariant sector fixedeffect ei and the standard white-noise error term ucit.
B. Econometric Analysis
This paper adopts a dynamic specification for studying the relationship betweentechnological change and skills. This choice is based on the occurrence of signifi-cant adjustment costs which determine serial correlation in the employment series(Van Reenen 1997). Both the presence of sector-specific effects and the dynamicspecification of the econometric model lead the pooled ordinary least squares(POLS) estimator to provide inconsistent and upward-biased estimates (Sevestre
13 The extent of labor-augmenting technology (A) and capital-labor elasticity (s) varies between“blue collar” and “white collar” workers.
46 the developing economies
© 2011 The AuthorsThe Developing Economies © 2011 Institute of Developing Economies

and Trognon 1985).14 While the presence of sector-specific effects does not affectthe within-group (WG) estimator, the violation of the assumption of strict exoge-neity makes this estimator inconsistent and downwards-biased (Nickell 1981).15 Amore effective solution to obtain consistent estimates in a dynamic panel frame-work is therefore to consider a first-difference transformation (Anderson and Hsiao1981) which wipes out time-invariant sector effects and provides consistent esti-mators with an instrumental variable (IV) procedure.16 The availability ofadditional moment conditions when the time dimension increases can be used toincrease the efficiency of the estimator by means of a GMM procedure (Ahn andSchmidt 1995). Based on Arellano (1989), who compares the use of instruments indifference and level, Arellano and Bond (1991) define the first-differenced GMM(GMM-DIF) where standard deviations and t-statistics are based on aheteroskedasticity-robust covariance matrix (White 1980) and each instrumentdepends on the specific assumption made about endogeneity, predetermination,and exogeneity of the corresponding instrumented variable. However, two condi-tions weaken the efficiency of the GMM-DIF estimator, namely, a short timedimension of the panel and/or a strong persistence in the time series. If one of thesecircumstances applies, the available instruments are only weakly correlated withthe variables in first differences and the GMM-DIF estimate is close to its WGestimate (Bond, Hoeffler, and Temple 2001). In this case, an efficiency improve-ment may be obtained through the addition of the original equations in level,instrumented by their own first differences, to the equations in first differenceswhich are instrumented as in the GMM-DIF case (Arellano and Bover 1995).17
Indeed, this new estimator, called system GMM (GMM-SYS), exploits all avail-able information through these additional moment conditions and is based on theassumption that E(Ducitei) = 0 (Bond 2002). The (robust) Hansen J statistic, which
14 In particular, the former determine the correlation between the lagged dependent variable ycit–1 andthe individual fixed effect ei. The latter implies the violation of the assumption of strict exogeneityof the regressors due to the presence of an endogenous first-order lagged dependent variable.
15 Kiviet (1995) provides a correction of the WG estimator bias which declines as the time dimensionapproaches infinity. Nevertheless, the limited time dimension of the panel adopted in this analysisdoes not allow a satisfactory use of a WG estimator.
16 IV techniques are necessary since the lagged difference of the dependent variable Dycit–1 iscorrelated by construction with the differenced error term Ducit. Generally, further lags from thelagged level (ycit–2) or difference (Dycit–2) can be used as instruments if there is no serial correlationin the ucit. process.
17 Blundell and Bond (1999) and Blundell, Bond, and Windmeijer (2000) verify the efficiencyimprovement of the GMM-SYS estimator for the AR(1) model by using Monte Carlo analyses.GMM-DIF and GMM-SYS are connected by the common presence of the equations in differencesand by a general rule which applies to the instruments of both estimators: in particular, Dxcit–s
represents a good instrument for the equations in levels if it is not correlated with ei and xcit–(s+1) isa valid instrument for the first-difference equations.
imported skill-biased technological change 47
© 2011 The AuthorsThe Developing Economies © 2011 Institute of Developing Economies

is the minimized value of the two-step GMM criterion function, replaces theSargan statistic in both a one-step GMM robust estimation and a two-step GMMestimation, since the latter is not robust to either heteroskedasticity or autocorre-lation. A two-step GMM estimation results in asymptotically more efficientstandard errors than a one-step GMM estimation. Although these may be stronglybiased downwards in the presence of a small sample size and/or heteroskedasticity(Blundell and Bond 1998), a small-sample variance correction suggested byWindmeijer (2000) eliminates such bias and suggests therefore the adoption of thistwo-step estimator in the following econometric estimates.
V. DESCRIPTIVE ANALYSIS
A first assessment of the sources of variability in the dataset comes from the resultsof Table 2. In particular, an analysis of variance (ANOVA) indicates that all threedimensions which characterize the data sample, that is, countries, sectors, and year,are relevant for explaining the observed variability in the relevant variables.
A detailed summary of the main features of the data is provided in Tables 3 and4, which provide the growth rates of the variables adopted in the econometricanalysis at the sector and country levels, respectively.18
18 Growth rates at the country level are computed for the available period on data for the totalmanufacturing sector (“Major Division 3”). Other industrial sectors, such as mining and quarrying(“Major Division 2”) and electricity, gas, and water (“Major Division 4”), do not form part of thedataset. In contrast, the unbalanced structure of the panel makes the analysis of annual growth ratesmore meaningful at the sector level. These growth rates are weighted by the sector’s share of totalmanufacturing employment.
TABLE 2
Factorial ANOVA of Key Variables
Country Industry Year
BC 974.90** 498.93** 3.44**WC 1,091** 536.44** 12.66**WBC 18,664** 250.31** 55.85**WWC 24,507** 194.49** 55.69**VA 3,717** 429.27** 39.91**KD 312.10** 146.33** 8.59**TID 3,451** 118.23** 19.84**
Note: Data are weighted by the annual sector number ofemployees.** represents statistical significance at the 1% level.
48 the developing economies
© 2011 The AuthorsThe Developing Economies © 2011 Institute of Developing Economies

TAB
LE
3
Sect
orA
nnua
lG
row
thR
ates
ofK
eyV
aria
bles
ISIC
(Rev
.2)
Sect
ors
Tech
nolo
gyIn
tens
ity†
BC
WC
Rel
ativ
eW
age
VAK
DT
ID
3110
:Fo
odpr
oduc
tsL
ow-0
.006
9-0
.000
20.
0055
0.09
470.
0265
0.01
8831
30:
Bev
erag
esL
ow0.
0084
0.01
760.
0303
0.08
230.
0594
0.02
3031
40:
Toba
cco
Low
0.01
67-0
.011
00.
0709
0.01
980.
3144
0.07
8932
10:
Text
iles
Low
-0.0
155
-0.0
050
0.00
130.
0121
0.05
190.
0045
3220
:Wea
ring
appa
rel
Low
0.04
630.
0783
0.00
230.
0960
0.13
600.
0081
3230
:L
eath
erpr
oduc
tsL
ow0.
0320
0.06
38-0
.000
10.
0943
0.13
060.
0406
3240
:Fo
otw
ear
Low
0.00
680.
0460
0.01
040.
0311
0.27
110.
0194
3310
:Woo
dpr
oduc
tsL
ow0.
0084
-0.0
014
0.02
230.
0496
0.16
940.
0466
3320
:Fu
rnitu
re,fi
xtur
esM
ediu
m–L
ow0.
0245
0.05
340.
0239
0.06
510.
1327
0.04
0434
10:
Pape
rpr
oduc
tsL
ow0.
0078
0.01
490.
0111
0.05
630.
2125
0.05
5134
20:
Prin
ting,
publ
ishi
ngL
ow0.
0067
0.03
320.
0153
0.06
700.
1810
0.06
6735
10:
Indu
stri
alch
emic
als
Med
ium
–Hig
h0.
0165
0.02
080.
0064
0.11
710.
0867
0.00
5735
20:
Oth
erch
emic
als
Hig
h0.
0119
0.02
30-0
.004
10.
0651
0.10
620.
0481
3530
:Pe
trol
eum
refin
erie
sM
ediu
m–L
ow0.
0242
0.07
29-0
.041
50.
2425
0.39
780.
0097
3540
:Pe
trol
eum
&co
alpr
oduc
tsM
ediu
m–L
ow0.
0302
0.01
710.
0281
0.24
370.
6071
0.12
8235
50:
Rub
ber
prod
ucts
Med
ium
–Low
0.04
340.
0637
-0.0
174
0.10
720.
1504
0.03
5335
60:
Plas
ticpr
oduc
tsM
ediu
m–L
ow0.
0513
0.08
41-0
.004
40.
1053
0.08
780.
0406
3610
:Po
ttery
,chi
na,e
tc.
Med
ium
–Low
0.02
590.
0532
0.02
250.
0806
0.28
930.
0997
3620
:G
lass
and
prod
ucts
Med
ium
–Low
0.00
070.
0231
0.02
270.
0693
0.38
640.
0727
3690
:N
onm
etal
prod
ucts
Med
ium
–Low
0.01
600.
0331
0.03
370.
0797
0.18
260.
0222
3710
:Ir
onan
dst
eel
Med
ium
–Low
0.00
190.
0031
0.01
330.
0650
0.16
650.
0873
3720
:N
onfe
rrou
sm
etal
sM
ediu
m–L
ow0.
0158
0.04
760.
0090
0.15
280.
3035
0.03
9438
10:
Met
alpr
oduc
tsM
ediu
m–L
ow0.
0097
0.02
540.
0061
0.07
050.
0689
0.05
5138
20:
Mac
hine
ryM
ediu
m–H
igh
0.02
300.
0430
0.00
190.
0824
0.06
05-0
.013
238
30:
Ele
ctri
cal
mac
hine
ryM
ediu
m–H
igh
0.04
590.
0519
0.01
100.
1214
0.08
040.
0349
3840
:T
rans
port
equi
pmen
tM
ediu
m–H
igh
0.01
470.
0169
0.00
620.
0818
0.08
510.
0498
3850
:Pr
ofes
sion
algo
ods
Hig
h0.
0416
0.06
860.
0042
0.11
660.
2508
0.03
7839
00:
Oth
erin
dust
ries
Low
0.03
000.
0510
-0.0
064
0.08
980.
1852
0.02
19
†Te
chno
logi
cali
nten
sity
isde
fined
byO
EC
DSc
ienc
e,Te
chno
logy
and
Indu
stry
Scor
eboa
rdw
hich
clas
sifie
sIS
ICse
ctor
sac
cord
ing
toth
eth
ree-
digi
tRev
.3ta
xono
my
(atf
our-
digi
tfor
som
esp
ecifi
csu
bsec
tors
).Se
ctor
conv
ersi
onfr
omIS
ICR
ev.3
toIS
ICR
ev.2
ispr
ovid
edby
the
auth
or.A
noth
erso
urce
ofeq
uiva
lent
info
rmat
ion
onte
chno
logi
cal
inte
nsity
ispr
ovid
edby
Kel
ler
(200
2)w
hich
finds
that
abou
t80
%of
all
man
ufac
turi
ngex
pend
iture
inR
&D
isco
nduc
ted
inth
efo
llow
ing
indu
stri
es:
Che
mic
alpr
oduc
ts(3
510/
3520
),el
ectr
ical
and
non-
elec
tric
alm
achi
nery
(382
0/38
30),
and
tran
spor
tatio
neq
uipm
ent
(384
0).
imported skill-biased technological change 49
© 2011 The AuthorsThe Developing Economies © 2011 Institute of Developing Economies

TAB
LE
4
Gro
wth
Rat
esof
Key
Var
iabl
esby
Cou
ntry
BC
WC
Rel
ativ
eW
age
VAK
DT
IDPe
riod
Mid
dle-
inco
me
coun
trie
sC
hile
0.43
990.
4530
0.00
990.
6412
0.02
560.
1334
1980
–90
Cyp
rus
0.24
750.
3128
0.02
800.
4755
-0.2
804
0.08
3819
80–9
1G
reec
e-0
.208
90.
2698
-0.0
911
-0.0
572†
-0.3
007
0.47
6819
80–9
0Ir
elan
d-0
.197
1-0
.004
50.
0601
0.73
72†
-0.4
396
-0.0
396
1980
–89
Mal
aysi
a0.
7560
0.13
870.
3295
0.99
55†
0.81
490.
0064
1983
–90
Mal
ta-0
.092
60.
1536
0.00
800.
2150
0.73
390.
0888
1980
–88
Mex
ico
-0.1
640
0.26
170.
4151
-0.0
418
0.33
191.
4537
1986
–91
Pana
ma
-0.1
080
-0.0
216
-0.1
908
-0.1
951
-0.7
022
-0.2
147
1981
–89
Port
ugal
-0.0
966
-0.0
164
0.14
150.
1059
-0.2
573
0.12
5019
80–8
7So
uth
Kor
ea0.
4213
0.64
20-0
.098
42.
1222
0.03
82-0
.080
419
80–9
0Sp
ain
-0.2
256
-0.0
861
0.16
71-0
.030
8†0.
4927
2.02
2319
80–9
0T
urke
y0.
1408
0.81
46-0
.113
91.
0770
0.71
040.
3889
1980
–90
Ven
ezue
la0.
1223
0.48
46-0
.016
10.
2558
0.10
93-0
.342
919
81–9
1To
tal–
MIC
s‡0.
1118
0.31
790.
0757
0.79
530.
2526
0.65
4719
80–9
1L
ow-i
ncom
eco
untr
ies
Ban
glad
esh
0.14
430.
0226
0.00
360.
2634
0.10
95-0
.529
919
81–8
8C
olom
bia
-0.1
168
0.17
75-0
.018
90.
2931
0.94
45-0
.251
719
80–9
0E
gypt
0.14
530.
3548
-0.0
509
0.86
56-0
.526
2-0
.195
119
80–8
8E
thio
pia
0.18
890.
6340
-0.1
211
0.16
460.
1559
0.68
0019
80–8
8G
uate
mal
a-0
.314
90.
1082
-0.1
966
-0.2
287
-0.4
480
0.39
1619
80–8
8In
dia
-0.0
207
0.03
02-0
.076
30.
5922
†0.
1043
0.06
2419
80–8
8Pa
kist
an0.
1347
0.15
930.
2015
0.67
04-0
.218
80.
3641
1981
–88
Peru
0.06
630.
2056
0.15
520.
4197
-0.4
205
-0.6
732
1980
–88
Phili
ppin
es-0
.238
61.
1727
-0.4
131
0.31
89-0
.383
2-0
.573
319
80–8
8Ta
nzan
ia-0
.112
30.
0894
0.10
49-0
.291
0†0.
1432
-0.0
751
1980
–85
Tota
l–L
ICs‡
-0.0
145
0.18
50-0
.078
70.
5452
0.01
18-0
.058
619
80–9
0To
tal‡
0.04
380.
2463
-0.0
074
0.66
060.
1229
0.27
05
Not
es:
1.C
hile
:19
87–8
8;C
ypru
s:19
87;
Mal
aysi
a:19
84no
tav
aila
ble.
2.M
alta
:Pu
rcha
sing
pow
erpa
rity
from
the
Wor
ldB
ank
Dev
elop
men
tIn
dica
tors
2004
.3.
Mex
ico:
Eco
nom
etri
can
alys
isfo
rth
epe
riod
1980
–91
(198
6no
tav
aila
ble)
.E
stim
ates
ofto
tal
man
ufac
turi
ngin
vest
men
tfo
rm
issi
ngye
ars
are
com
pute
din
orde
rto
calc
ulat
ese
ctor
shar
esth
roug
ha
thre
e-ye
arba
ckw
ard
mov
ing
aver
age.
VAan
dK
Afr
omU
NID
OIn
dust
rial
Stat
istic
sD
atab
ase
2002
.4.
Paki
stan
:19
85;
Pana
ma:
1986
,198
7,an
d19
88no
tav
aila
ble.
5.Pe
ru:
Em
ploy
men
tfr
omU
NID
OIn
dust
rial
Stat
istic
sD
atab
ase
2002
.†
Valu
ead
ded
base
don
fact
orpr
ices
,oth
erw
ise
mea
sure
don
prod
ucer
’spr
ices
.‡
Wei
ghte
dby
aco
untry
’ssh
are
ofto
tale
mpl
oym
enta
vera
ged
over
the
initi
alan
dfin
alpe
riod.
Valu
esar
eob
tain
edfr
omda
taon
aggr
egat
em
anuf
actu
ring.
50 the developing economies
© 2011 The AuthorsThe Developing Economies © 2011 Institute of Developing Economies
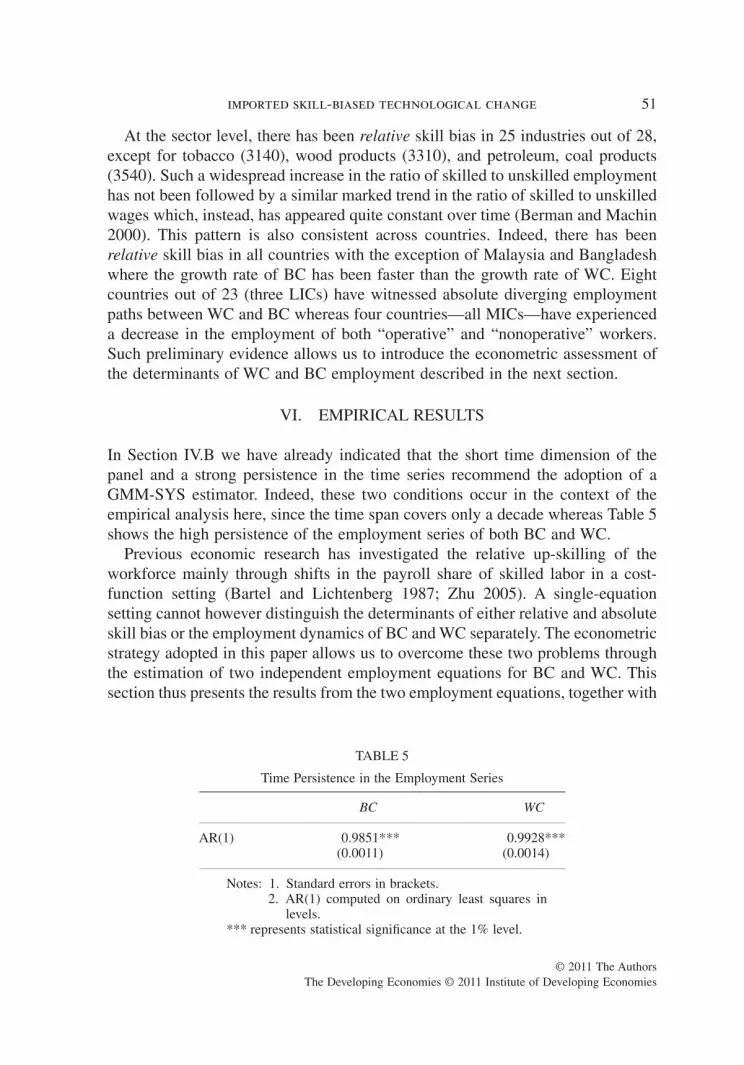
At the sector level, there has been relative skill bias in 25 industries out of 28,except for tobacco (3140), wood products (3310), and petroleum, coal products(3540). Such a widespread increase in the ratio of skilled to unskilled employmenthas not been followed by a similar marked trend in the ratio of skilled to unskilledwages which, instead, has appeared quite constant over time (Berman and Machin2000). This pattern is also consistent across countries. Indeed, there has beenrelative skill bias in all countries with the exception of Malaysia and Bangladeshwhere the growth rate of BC has been faster than the growth rate of WC. Eightcountries out of 23 (three LICs) have witnessed absolute diverging employmentpaths between WC and BC whereas four countries—all MICs—have experienceda decrease in the employment of both “operative” and “nonoperative” workers.Such preliminary evidence allows us to introduce the econometric assessment ofthe determinants of WC and BC employment described in the next section.
VI. EMPIRICAL RESULTS
In Section IV.B we have already indicated that the short time dimension of thepanel and a strong persistence in the time series recommend the adoption of aGMM-SYS estimator. Indeed, these two conditions occur in the context of theempirical analysis here, since the time span covers only a decade whereas Table 5shows the high persistence of the employment series of both BC and WC.
Previous economic research has investigated the relative up-skilling of theworkforce mainly through shifts in the payroll share of skilled labor in a cost-function setting (Bartel and Lichtenberg 1987; Zhu 2005). A single-equationsetting cannot however distinguish the determinants of either relative and absoluteskill bias or the employment dynamics of BC and WC separately. The econometricstrategy adopted in this paper allows us to overcome these two problems throughthe estimation of two independent employment equations for BC and WC. Thissection thus presents the results from the two employment equations, together with
TABLE 5
Time Persistence in the Employment Series
BC WC
AR(1) 0.9851*** 0.9928***(0.0011) (0.0014)
Notes: 1. Standard errors in brackets.2. AR(1) computed on ordinary least squares in
levels.*** represents statistical significance at the 1% level.
imported skill-biased technological change 51
© 2011 The AuthorsThe Developing Economies © 2011 Institute of Developing Economies

some sensitivity checks. Each specification also includes country and sectordummies to check for the robustness of the results obtained. Time dummies arealways included, to take into account possible macroeconomic shocks common toall the considered variables. As far as the instrumentation of the included regres-sors is concerned, we assume the conservative hypothesis of considering all thevariables as endogenous. Indeed, it may well be the case that in most low- andmiddle-income countries—highly dependent on the global economic climate andon the occurrence of external unobserved shocks—employment, wages, invest-ments, and sales may be jointly determined. Accordingly, all the regressors havebeen instrumented starting from the two-lags instrumental variables, which is theGMM procedure for dealing with endogenous variables. This methodologicalchoice not only puts us on the safe side in terms of the possible endogeneity of theincluded variables, but is also supported by a battery of Hansen tests. In fact, all thesix joint Hansen tests—reported in Tables 6 and 7—indicate that the null hypoth-esis of adequate instruments is never rejected. Moreover, in Appendix Table 1 each
TABLE 6
Employment Equation of “Blue Collar” Workers(Dependent Variable: Employment “Blue Collar” Workers)
VariableGMM-SYS
(1) (2) (3)
Lag_Employment 0.775*** 0.829*** 0.861***(0.062) (0.050) (0.035)
BC wages -0.194*** -0.277*** -0.112***(0.052) (0.086) (0.026)
Value added 0.195*** 0.142*** 0.124***(0.056) (0.045) (0.033)
Capital deepening 0.082*** 0.120*** 0.058***(0.020) (0.045) (0.012)
SETI deepening 0.010 -0.085 0.016(0.010) (0.045) (0.010)
Constant -1.418*** -1.054*** -0.884***(0.447) (0.352) (0.268)
Country dummies 2.54***Sector dummies 1.52**Time dummies 7.49*** 5.24*** 5.78***Wald test 6.16*** 4.78***Hansen test 16.93 14.30 11.24AR(1) -6.61*** -6.68*** -7.02***AR(2) -0.82 -1.91* -0.84Observations 3,468 3,468 3,468
Notes: 1. White-robust standard errors in brackets.2. Wald test applied to the joint significance of the dummies.
*** , ** , and * represent statistical significance at the 1%, 5%, and 10% level, respectively.
52 the developing economies
© 2011 The AuthorsThe Developing Economies © 2011 Institute of Developing Economies

instrument for each specification is tested separately (5 regressors times 6 speci-fications, equal to 30 Hansen tests). As can be seen, the null hypothesis of correctinstrumentation is never rejected, with only two partial exceptions.19
Table 6 provides the GMM-SYS estimator for the BC equation. All the threeestimates give similar and significant results. The high persistence of the employ-ment series and the predictable behavior of the coefficients of BC wages and valueadded are confirmed. In particular, wages depict the usual negative relationshipconsistent with a demand for labor specification. On the contrary—and notsurprisingly—the expansion of a sector’s value added affects the demand for bluecollars positively. An interesting pattern emerges from the comparison of thecoefficients of capital deepening and SETI deepening, since they show different
19 These concern the wages of the white collars in the specifications with the additional dummies;however, even in these cases, the Hansen test is never significant at the 99% level of confidence.
TABLE 7
Employment Equation of “White Collar” Workers(Dependent Variable: Employment “White Collar” Workers)
VariableGMM-SYS
(1) (2) (3)
Lag_Employment 0.824*** 0.769*** 0.820***(0.036) (0.047) (0.038)
BC Wages -0.075*** -0.146*** -0.071***(0.027) (0.051) (0.026)
Value Added 0.132*** 0.194*** 0.132***(0.031) (0.043) (0.031)
Capital Deepening 0.095*** 0.058* 0.105***(0.021) (0.035) (0.024)
SETI Deepening 0.049*** 0.065** 0.050***(0.015) (0.027) (0.015)
Constant -0.930*** -1.474*** -0.851***(0.253) (0.375) (0.251)
Country dummies 2.88**Sector dummies 1.68**Time dummies 4.57*** 2.95*** 3.45***Wald test 3.40*** 2.67***Hansen test 55.81 63.17 59.11AR(1) -7.92*** -9.47*** -9.01***AR(2) -0.06 -0.56 -0.21Observations 3,468 3,468 3,468
Notes: 1. White-robust standard errors in brackets.2. Wald test applied to the joint significance of the dummies.
*** , ** , and * represent statistical significance at the 1%, 5%, and 10% level, respectively.
imported skill-biased technological change 53
© 2011 The AuthorsThe Developing Economies © 2011 Institute of Developing Economies

impacts on the employment of BC workers. This result appears to be at odds withthe homogeneous treatment of capital stock and technology commonly adopted inempirical literature. In particular, “generic” capital displays a positive and signifi-cant coefficient: sectoral gross investments are positively correlated with thedemand for blue collars. However, the coefficient of SETI deepening, namely, ofthose capital goods which embody the technological level of the most advancedcountries, exhibits a nonsignificant (even negative in one case out of three) impacton the employment of the unskilled workers.
All these results appear robust to the introduction of country and sector dummieswhich, in turn, are jointly significant (see Table 6).20 As already discussed, theHansen tests advocate the validity of the GMM instruments, while the AR testssupport the overall validity of the model by providing evidence of a significantnegative AR(1) and the absence of AR(2).21
Table 7 provides the GMM-SYS estimator for the WC equation. In this case too,the three estimates give consistent results, while the Hansen tests and the AR testsvalidate the Table 7 models. As expected, the coefficient of the lagged dependentvariable indicates a high persistence of the employment series of WC. The coef-ficients of WC wages and value added are similar to those in the BC equation,showing a negative and a positive sign, respectively. The coefficient of capitaldeepening is positive and larger than that in the BC equation (in two out of threeestimations).22 This evidence suggests that capital deepening may affect the rela-tive skill bias of the employment series, since it increases the labor demand forboth BC and WC, the latter more intensively. This result is consistent with a lineof economic research which has related the employment of skills in low- andmiddle-income countries to the capital–skill complementarity hypothesis (Goldinand Katz 1998; Flug and Hercowitz 2000).23 By contrast, SETI deepening deter-
20 A Wald test, asymptotically distributed as c2 where the degrees of freedom (DOF) equate to thenumber of restricted coefficients, allows us to test the overall significance of the independentvariables and both time and individual effects.
21 Since the consistency of the GMM estimates requires non–serial-correlated errors ucit, Arellanoand Bond (1991) provide a Lagrange multiplier (LM)–based test of autocorrelation which isapplied to the residuals of the first-difference equation in order to drop the time-invariant fixedeffect ei. This test, distributed as N(0, 1) under the H0 of no autocorrelation, provides strongevidence of AR(1) in first differences because of the correlation between the first differences of the(uncorrelated) errors Ducit and Ducit-1 due to the common term ucit-1. Finally, the absence of AR(2)supports the consistency of the GMM estimator.
22 Indeed, in column 2 of Table 7 the capital deepening coefficient turns out to be barely significantand this impedes a common ground comparison with the correspondent column in Table 6.
23 For instance, Berman and Machin (2000, 2004) verify the occurrence of SBTC in low- andmiddle-income countries through changes in capital–labor ratios (based on the capital–skillscomplementarity hypothesis) whereas Wood (1994, p. 224) controls for the average ratio ofinvestment to GDP.
54 the developing economies
© 2011 The AuthorsThe Developing Economies © 2011 Institute of Developing Economies

mines absolute skill bias since it affects the employment of the white collarspositively and significantly, while at the same time its coefficient in the BCequation was never significant, even being negative in one case.
The skill-biased role of the SETI variable is reinforced by the findings presentedin Appendix Table 3. In line with the findings discussed in Tables 6 and 7, thisvariable turns out to be one of the crucial factors affecting the up-skilling of thelabor force in the relative employment equation while no similar effect appears inthe case of capital deepening (see Appendix Tables 2 and 3). Indeed, the coefficientof SETI deepening in a single-equation setting points out the effect of technologyimport on the relative demand for skills, and thus confirms the evidence of thetwo-equation framework where the two coefficients of this variable—on whitecollars and blue collars—indicate the occurrence of skill bias.24
To sum up, the econometric results highlight the fact that technology transferfrom high-income countries seems to drive the tendency towards a greater employ-ment divide in low- and middle-income countries. Indeed, given the importance oftechnology transfer as a major determinant of economic growth and technologicalcatching-up in low- and middle-income countries, policies favoring internationaltechnology diffusion have to be complemented in recipient economies by thedesign of more comprehensive labor market policies—including issues such asskill mismatch and continuous training—which have been generally neglected sofar.
VII. CONCLUDING REMARKS
This paper has discussed the employment impact of SETI in a sample of low- andmiddle-income countries. We have provided a detailed measure of direct technol-ogy transfer across countries, which in turn is obtained by an original procedure forthe conversion of trade data into sector values, which may be valuable for futureresearch in this field.
Our econometric analysis has tested the SETI and capital–skill complementarityhypotheses through an unbalanced panel dataset comprising 4,934 observations for28 manufacturing sectors of 23 low- and middle-income countries in the period1980–91.
GMM-SYS techniques have been applied to the estimation of two similaremployment equations for both BC and WC. This has allowed us to distinguish thedeterminants of the relative and the absolute skill biases of employment over time.
24 An additional robustness check has been made by re-running all the regressions presented in thissection on a smaller dataset, that is, by excluding those countries and sectors with the highest valueof TID. The outcome of this test confirms the evidence presented in this section (results availableon request).
imported skill-biased technological change 55
© 2011 The AuthorsThe Developing Economies © 2011 Institute of Developing Economies

Econometric results indicate that capital deepening is responsible for relative shiftstowards skilled labor. In contrast, SETI appears to be the crucial determinant of anabsolute diverging path between skilled and unskilled employment in low- andmiddle-income countries. Indeed, the transferred technology embodied in importsof industrial machinery, equipment, and ICT capital goods involves a significantincrease in the demand for skilled workers, while it has no significant impact on thedemand for the unskilled.
REFERENCES
Acemoglu, Daron. 1998. “Why Do New Technologies Complement Skills? Directed Tech-nical Change and Wage Inequality.” Quarterly Journal of Economics 113, no. 4:1055–89.
———. 2003. “Patterns of Skill Premia.” Review of Economic Studies 70, no. 2: 199–230.Ahn, Seung C., and Peter Schmidt. 1995. “Efficient Estimation of Models for Dynamic
Panel Data.” Journal of Econometrics 68, no. 1: 5–27.Anderson, T. W., and Cheng Hsiao. 1981. “Estimation of Dynamic Models with Error
Components.” Journal of the American Statistical Association 76, no. 375: 598–606.Arellano, Manuel. 1989. “A Note on the Anderson-Hsiao Estimator for Panel Data.”
Economics Letters 31, no. 4: 337–41.Arellano, Manuel, and Stephen Bond. 1991. “Some Tests of Specification for Panel Data:
Monte Carlo Evidence and an Application to Employment Equations.” Review ofEconomic Studies 58, no. 2: 277–97.
Arellano, Manuel, and Olympia Bover. 1995. “Another Look at the Instrumental VariablesEstimation of Error-Components Models.” Journal of Econometrics 68, no. 1: 29–51.
Attanasio, Orazio; Pinelopi K. Goldberg; and Nina Pavcnik. 2004. “Trade Reforms andWage Inequality in Colombia.” Journal of Development Economics 74, no. 2: 331–66.
Autor, David H.; Lawrence F. Katz; and Alan B. Krueger. 1998. “Computing Inequality:Have Computers Changed the Labor Market? ” Quarterly Journal of Economics 113,no. 4: 1169–1213.
Bartel, Ann P., and Frank R. Lichtenberg. 1987. “The Comparative Advantage of EducatedWorkers in Implementing New Technology.” Review of Economics and Statistics 69,no. 1: 1–11.
Berman, Eli; John Bound; and Zvi Griliches. 1994. “Changes in the Demand for SkilledLabor within U.S. Manufacturing: Evidence from the Annual Survey of Manufactures.”Quarterly Journal of Economics 109, no. 2: 367–97.
Berman, Eli; John Bound; and Stephen Machin. 1998. “Implications of Skill-BiasedTechnological Change: International Evidence.” Quarterly Journal of Economics 113,no. 4: 1245–79.
Berman, Eli, and Stephen Machin. 2000. “Skill-Biased Technology Transfer around theWorld.” Oxford Review of Economic Policy 16, no. 3: 12–22.
———. 2004. “Globalization, Skill-Biased Technological Change and Labour Demand.”In Understanding Globalization, Employment and Poverty Reduction, ed. Eddy Leeand Marco Vivarelli. Basingstoke: Palgrave Macmillan.
Berman, Eli; Rohini Somanathan; and Hong W. Tan. 2005. “Is Skill-Biased TechnologicalChange Here Yet? Evidence from Indian Manufacturing in the 1990.” Policy ResearchWorking Paper no. 3761. Washington, D.C.: World Bank.
56 the developing economies
© 2011 The AuthorsThe Developing Economies © 2011 Institute of Developing Economies

Beyer, Harald; Patricio Rojas; and Rodrigo Vergara. 1999. “Trade Liberalization and WageInequality.” Journal of Development Economics 59, no. 1: 103–23.
Blundell, Richard, and Stephen Bond. 1998. “Initial Conditions and Moment Restrictionsin Dynamic Panel Data Models.” Journal of Econometrics 87, no. 1: 115–43.
———. 1999. “GMM Estimation with Persistent Panel Data: An Application to ProductionFunctions.” IFS Working Papers no. 99/04. London: Institute for Fiscal Studies.
Blundell, Richard; Steve Bond; and Frank Windmeijer. 2000. “Estimation in DynamicPanel Data Models: Improving on the Performance of the Standard GMM Estimators.”IFS Working Papers no. 00/12. London: Institute for Fiscal Studies.
Bond, Stephen. 2002. “Dynamic Panel Data Models: A Guide to Micro Data Methods andPractice.” CEMMAP Working Paper no. CWP09/02. London: Centre for MicrodataMethods and Practice.
Bond, Stephen Roy; Anke Hoeffler; and Jonathan Temple. 2001. “GMM Estimation ofEmpirical Growth Models.” CEPR Discussion Paper no. 3048. London: Centre forEconomic Policy Research.
Bound, John, and George Johnson. 1992. “Changes in the Structure of Wages in the 1980’s:An Evaluation of Alternative Explanations.” American Economic Review 82, no. 3:371–92.
Bresnahan, Timothy F., and Manuel Trajtenberg. 1995. “General Purpose Technologies:‘Engines of Growth’? ” Journal of Econometrics 65, no. 1: 83–108.
Burtless, Gary. 1995. “International Trade and the Rise in Earnings Inequality.” Journal ofEconomic Literature 33, no. 2: 800–16.
Caroli, Eve; Nathalie Greenan; and Dominique Guellec. 2001. “Organizational Change andSkill Accumulation.” Industrial and Corporate Change 10, no. 2: 481–506.
Coe, David T.; Elhanan Helpman; and Alexander W. Hoffmaister. 1997. “North-SouthR&D Spillovers.” Economic Journal 107, no. 440: 134–49.
Cohen, Wesley M., and Daniel A. Levinthal. 1989. “Innovation and Learning: The TwoFaces of R&D.” Economic Journal 99, no. 397: 569–96.
Davis, Donald R. 1996. “Trade Liberalization and Income Distribution.” NBER WorkingPaper no. 5693. Cambridge, Mass.: National Bureau of Economic Research.
DiNardo, John; Nicole M. Fortin; and Thomas Lemieux. 1996. “Labor Market Institutionsand the Distribution of Wages, 1973–1992: A Semiparametric Approach.” Economet-rica 64, no. 5: 1001–44.
Dornbusch, Rudiger; Stanley Fischer; and Paul A. Samuelson. 1980. “Heckscher-OhlinTrade Theory with A Continuum of Goods.” Quarterly Journal of Economics 95, no. 2:203–24.
Feliciano, Zadia. 2001. “Workers and Trade Liberalization: The Impact of Trade Reformsin Mexico on Wages and Employment.” Industrial and Labor Relations Review 55, no.1: 95–115.
Flug, Karnit, and Zvi Hercowitz. 2000. “Equipment Investment and the Relative Demandfor Skilled Labor: International Evidence.” Review of Economic Dynamics 3, no. 3:461–85.
Goldin, Claudia, and Lawrence F. Katz. 1998. “The Origins of Technology Skill Comple-mentarity.” Quarterly Journal of Economics 113, no. 3: 693–732.
Griliches, Zvi. 1969. “Capital–Skill Complementarity.” Review of Economics and Statis-tics 51, no. 4: 465–68.
Juhn, Chinhui; Kevin M. Murphy, and Brooks Pierce. 1993. “Wage Inequality and the Risein Returns to Skill.” Journal of Political Economy 101, no. 3: 410–42.
imported skill-biased technological change 57
© 2011 The AuthorsThe Developing Economies © 2011 Institute of Developing Economies

Kang, Seoghoon, and Dong-Pyo Hong. 2002. “Technological Change and Demand forSkills in Developing Countries: An Empirical Investigation of the Republic of Korea’sCase.” Developing Economies 40, no. 2: 188–207.
Katz, Lawrence F., and David H. Autor. 1999. “Changes in the Wage Structure andEarnings Inequality.” In Handbook of Labor Economics, Vol. 3A, ed. Orley Ashenfelterand David Card. Amsterdam: Elsevier.
Katz, Lawrence F., and Kevin M. Murphy. 1992. “Changes in Relative Wages, 1963–1987:Supply and Demand Factors.” Quarterly Journal of Economics 107, no. 1: 35–78.
Katz, Lawrence F., and Ana L. Revenga. 1990. “Changes in the Structure of Wages: TheU.S. Versus Japan.” NBER Working Paper no. 3021. Cambridge, Mass.: NationalBureau of Economic Research.
Keller, Wolfgang. 2002. “Geographic Localization of International Technology Diffusion.”American Economic Review 92, no. 1: 120–42.
Kiviet, Jan F. 1995. “On Bias, Inconsistency, and Efficiency of Various Estimators inDynamic Panel Data Models.” Journal of Econometrics 68, no. 1: 53–78.
Krusell, Per; Lee E. Ohanian; José-Victor Rios-Rull; and Giovanni L. Violante. 2000.“Capital-Skill Complementarity and Inequality: A Macroeconomic Analysis.” Econo-metrica 68, no. 5: 1029–53.
Leamer, Edward E. 1996. “Wage Inequality from International Competition and Techno-logical Change: Theory and Country Experience.” American Economic Review 86, no.2: 309–14.
Lee, Eddy, and Marco Vivarelli, eds. 2004. Understanding Globalization, Employment andPoverty Reduction. Basingstoke: Palgrave MacMillan.
———. 2006. “The Social Impact of Globalization in the Developing Countries.” Inter-national Labour Review 145, no. 3: 167–84.
Machin, Stephen. 1996. “Wage Inequality in the UK.” Oxford Review of Economic Policy12, no. 1: 47–64.
Machin, Stephen, and John Van Reenen. 1998. “Technology and Changes in Skill Struc-ture: Evidence from Seven OECD Countries.” Quarterly Journal of Economics 113, no.4: 1215–44.
Meschi, Elena, and Marco Vivarelli. 2009. “Trade and Income Inequality in DevelopingCountries.” World Development 37, no. 2: 287–302.
Moore, Mark P., and Priya Ranjan. 2005. “Globalisation vs Skill-Biased TechnologicalChange: Implications for Unemployment and Wage Inequality.” Economic Journal115, no. 503: 391–422.
Nickell, Stephen. 1981. “Biases in Dynamic Models with Fixed Effects.” Econometrica 49,no. 6: 1417–26.
Nickell, Stephen, and Brian Bell. 1996. “Changes in the Distribution of Wages and Unem-ployment in OECD Countries.” American Economic Review 86, no. 2: 302–8.
Pavcnik, Nina. 2003. “What Explains Skill Upgrading in Less Developed Countries?”Journal of Development Economics 71, no. 2: 311–28.
Piva, Mariacristina. 2003. “The Impact of Technology Transfer on Employment andIncome Distribution in Developing Countries: A Survey of Theoretical Models andEmpirical Studies.” Working Paper no. 15. Geneva: International Labour Organization.
Revenga, Ana. 1997. “Employment and Wage Effects of Trade Liberalization: TheCase of Mexican Manufacturing.” Journal of Labor Economics 15, no. 3, part 2:S20–S43.
58 the developing economies
© 2011 The AuthorsThe Developing Economies © 2011 Institute of Developing Economies

Robbins, Donald J. 2003. “The Impact of Trade Liberalization upon Inequality in Devel-oping Countries: A Review of Theory and Evidence.” Working Paper no. 13. Geneva:International Labour Organization.
Robbins, Donald, and T. H. Gindling. 1999. “Trade Liberalization and the Relative Wagesfor More-Skilled Workers in Costa Rica.” Review of Development Economics 3, no. 2:140–54.
Schiff, Maurice, and Yanling Wang. 2004. “Education, Governance and Trade-RelatedTechnology Diffusion in Latin America.” Discussion Paper no. 1028. Bonn: Institutefor the Study of Labor (IZA).
Schiff, Maurice; Yanling Wang; and Marcelo Olarreaga. 2002. “Trade-Related TechnologyDiffusion and the Dynamics of North-South and South-South Integration.” PolicyResearch Working Paper no. 2861. Washington, D.C.: World Bank.
Sevestre, P., and A. Trognon. 1985. “A Note on Autoregressive Error Components Models.”Journal of Econometrics 28, no. 2: 231–45.
Slaughter, Matthew J. 1998. “International Trade and Labour-Market Outcomes: Results,Questions and Policy Options.” Economic Journal 108, no. 450: 1452–62.
Thoenig, Mathias, and Thierry Verdier. 2003. “A Theory of Defensive Skill-Biased Inno-vation and Globalization.” American Economic Review 93, no. 3: 709–28.
Van Reenen, John. 1997. “Employment and Technological Innovation: Evidence from UKManufacturing Firms.” Journal of Labor Economics 15, no. 2: 255–84.
Vivarelli, Marco. 2004. “Globalization, Skills and Within-Country Income Inequality inDeveloping Countries.” Understanding Globalization, Employment and PovertyReduction. ed. Eddy Lee and Marco Vivarelli. Basingstoke: Palgrave MacMillan.
Vivarelli, Marco, and Mario Pianta, eds. 2000. The Employment Impact of Innovation:Evidence and Policy. London: Routledge.
White, Halbert. 1980. “A Heteroskedasticity-Consistent Covariance Matrix Estimator anda Direct Test for Heteroskedasticity.” Econometrica 48, no. 4: 817–38.
Windmeijer, Frank. 2000. “A Finite Sample Correction for the Variance of Linear Two-Step GMM Estimators.” IFS Working Papers no. 00/19. London: Institute for FiscalStudies.
Wood, Adrian. 1994. North-South Trade, Employment and Inequality: Changing Fortunesin a Skill-Driven World. Oxford: Clarendon Press.; NewYork: Oxford University Press.
———. 1995. “How Trade Hurt Unskilled Workers.” Journal of Economic Perspectives 9,no. 3: 57–80.
———. 1998. “Globalisation and the Rise in Labour Market Inequalities.” EconomicJournal 108, no. 450: 1463–82.
Zhu, Susan Chun. 2005. “Can Product Cycles Explain Skill Upgrading? ” Journal ofInternational Economics 66, no. 1: 131–55.
APPENDIX I
VARIABLES DEFINITION AND DATA SOURCE
Number of Operatives / Blue Collars (BC): All employees engaged in produc-tion or the related activities of the establishment, including any clerical or working
imported skill-biased technological change 59
© 2011 The AuthorsThe Developing Economies © 2011 Institute of Developing Economies

supervisory personnel whose function is to record or expedite any step in theproduction process. Source: United Nations General Industrial Statistics, Volume1: 1953–1993 (UN-GIS Vol. 1).25
Number of Nonoperatives / White Collars (WC): All persons engaged other thanworking proprietors, active business partners, unpaid family workers and opera-tives. Source: UN-GIS Vol. 1.
Wage: All payments in cash or in kind made to “operatives” or “nonoperatives”during the reference year. The payments include: (a) direct wages and salaries; (b)remuneration for time not worked; (c) bonuses and gratuities; (d) housing allow-ances and family allowances paid directly by the employer; and (e) payments inkind. Excluded are the employer’s contributions in respect of their employees paidto social security, pension, and insurance schemes, as well as the benefits receivedby employees under these schemes and severance and termination pay. Source:UN-GIS Vol. 1.
Value Added (VA): The value of census output less the value of census input,which covers: (a) value of materials and supplies for production (including cost ofall fuel and purchased electricity); and (b) cost of industrial services received(mainly payments for contract and commission work and repair and maintenancework). The valuation may be in factor values or in producers’ prices, depending onthe treatment of indirect taxes and subsidies. Source: UN-GIS Vol. 1.
Gross Fixed Capital Formation (KA): The value of purchases and own-accountconstruction of fixed assets during the reference year less the value of correspond-ing sales. The fixed assets covered are those, whether new or used, with aproductive life of one year or more which are intended for the use of the estab-lishment, including fixed assets made by the establishment’s own labor force for itsown use. Major additions, alterations, and improvements to existing assets whichextend with normal economic life or raise their productivity are also included.Source: UN-GIS Vol. 1.
Skill-Enhancing Technology Import (SETI): The annual value of the importfrom high-income countries (HICs) of a detailed list of capital goods whichembody a technological component (Appendix II). Source: World Trade Analyzer(WTA).
25 The economic literature adopts two competing definitions of skills based on either the wage levelof the workers or the amounts of education, training, and experience they possess. The twoindicators are often correlated, but they can also diverge (Wood 1994, p. 47). The concept of skillsthroughout this paper refers to the latter concept, namely, human capital accumulated througheducation which is assumed to be reflected by the dichotomic distinction between occupationalcategories in this empirical analysis. A craftsman with a low level of education is thereforeclassified among blue collars and he will be loosely considered as an “unskilled” worker.
60 the developing economies
© 2011 The AuthorsThe Developing Economies © 2011 Institute of Developing Economies

Purchasing Power Parity: The number of currency units required to buy goodsequivalent to what can be bought with one unit of the base country (US). Source:Penn World Tables 6.1.
US GDP Deflator: Rate of price change in the economy as a whole. The GDPimplicit deflator is the ratio of GDP in current local currency to GDP in constantlocal currency (Base year = 1986). Source: World Bank Development Indicators2004.
APPENDIX II
SKILL-ENHANCING TECHNOLOGY IMPORT (SETI)
SETI is created through the sum of the following SITC Revision 2 codes.
SITC Description
71 POWER GENERATING MACHINERY AND EQUIPMENT711 Steam and other vapour generating boilers, and parts711.1 Steam and other vapour generating boilers711.2 Auxiliary plant for use with boilers, condensors711.9 Parts of boilers and auxiliary plant of 711.1- and 711.2-712 Steam or other vapour power units, steam engines, and parts712.6 Steam or other vapour power units, steam engines712.9 Parts of the power units of 712.6-713 Internal combustion piston engines, and parts713.1 Internal combustion piston engines for aircraft713.2 Internal combustion piston engines for propelling vehicles713.3 Internal combustion piston engines for marine propulsion713.8 Internal combustion piston engines, n.e.s.713.9 Parts of internal combustion piston engines of 713.2-, 713.3-, and 713.8-714 Engines and motors, non-electric714.4 Reaction engines714.8 Gas turbines, n.e.s.714.9 Parts of the engines and motors of 714- and 718.8-716 Rotating electric plant and parts716.1 Motors and generators, direct current716.2 Electric motors and generators, generating sets716.3 Rotary converters716.9 Parts of rotating electric plant718 Other power generating machinery and parts718.7 Nuclear reactors, and parts718.8 Engines and motors, n.e.s., such as water turbines etc.72 MACHINERY SPECIALIZED FOR PARTICULAR INDUSTRIES724 Textile and leather machinery, and parts724.3 Sewing machines, furniture for sewing machines, and parts724.4 Machines for extruding man-made textiles, and parts724.5 Weaving, knitting machines for preparing yarns, parts724.6 Auxiliary machinery for headings 724.51/52/53
imported skill-biased technological change 61
© 2011 The AuthorsThe Developing Economies © 2011 Institute of Developing Economies

APPENDIX II (Continued)
SITC Description
724.7 Machines for washing, cleaning, drying, bleaching textiles724.8 Machinery for preparing, tanning, or working hides725 Paper and pulp mill machinery, machinery for manufacture of paper725.1 Machinery for making or finishing cellulosic pulp, paper, paperboard725.2 Paper and paperboard cutting machines of all kinds725.9 Parts of the machines of 725-726 Printing and bookbinding machinery, and parts726.3 Machinery, apparatus, accessories for type-founding or setting726.4 Printing presses726.7 Other printing machinery for uses ancillary to printing726.8 Bookbinding machinery, and parts726.9 Parts of the machines of 726.31, 726.4-, 726.7-727 Food-processing machines and parts727.1 Machinery for working of cereals or dried vegetables727.2 Other food-processing machinery, and parts728 Machinery and equipment specialized for particular industries728.1 Machine-tools for specialized particular industries728.3 Machinery for sorting, screening, separating, washing ore728.4 Machinery and appliances for specialized particular industries73 METALWORKING MACHINERY736 Machine-tools for working metal or metal carbides and parts736.1 Metal cutting machine-tools736.2 Metal forming machine-tools736.7 Other machine-tools for working metal or metal carbides736.8 Work holders, self-opening dieheads, and tool holders736.9 Parts of the machine-tools of 736-737 Metalworking machinery, and parts737.1 Converters, ladles, ingot moulds, and casting machines737.2 Rolling mills, rolls therefor, and parts737.3 Welding, brazing, cutting, soldering machines, and parts74 GENERAL INDUSTRIAL MACHINERY AND EQUIPMENT, AND PARTS741 Heating and cooling equipment and parts741.1 Producer gas and water gas generators, and parts741.2 Furnace burners for liquid fuel, and parts741.3 Industrial and laboratory furnaces and ovens, and parts741.4 Refrigerators and refrigerating equipment, excluding household type, parts741.5 Air conditioning machines, self-contained, and parts741.6 Machinery plant and similar laboratory equipment involving a temperature change742 Pumps for liquids, liquid elevators, and parts742.1 Reciprocating pumps, other than 742.81742.2 Centrifugal pumps, other than 742.81742.3 Rotary pumps, other than 742.81742.8 Other pumps for liquids and liquid elevators742.9 Parts of the pumps and liquid elevators of 742-743 Pumps and compressors, fans and blowers, centrifuges743.1 Air pumps, vacuum pumps, and compressors743.2 Parts of the pumps and compressors of 743.1-743.3 Free-piston generators for gas turbines, parts
62 the developing economies
© 2011 The AuthorsThe Developing Economies © 2011 Institute of Developing Economies

APPENDIX II (Continued)
SITC Description
743.4 Fans, blowers, and the like, and parts743.5 Centrifuges743.6 Filtering and purifying machinery for liquids and gases743.9 Parts of the machines of 743.5-, 743.6-744 Mechanical handling equipment, parts744.1 Work trucks, mechanically propelled, for short distance744.2 Lifting, handling, loading machinery, conveyors744.9 Parts of the machinery of 744.2-745 Other non-electrical machinery, tools, apparatus, and parts745.1 Tools for working in the hand, pneumatic, parts745.2 Other non-electrical machines, and parts749 Non-electric parts and accessories of machines749.1 Ball, roller or needle roller bearings749.2 Taps, cocks, valves, etc. for pipes, tanks, vats, etc.749.3 Transmission shafts, cranks, bearing housings, etc.749.9 Other non-electric parts and accessories of machinery75 OFFICE MACHINES AND AUTOMATIC DATA PROCESSING MACHINES751 Office machines751.1 Typewriters; cheque-writing machines751.2 Calculating machines, cash registers, ticket-issuing machines, and similar machines751.8 Office machines, n.e.s.752 Automatic data processing machines and units thereof752.1 Analogue and hybrid data processing machines752.2 Complete digital data processing machines752.3 Complete digital central processing units752.4 Digital central storage units, separately consigned752.5 Peripheral units, including control and adapting units752.8 Off-line data processing equipment, n.e.s.759 Parts of and accessories suitable for 751- or 752-759.1 Parts of and accessories suitable for 751.1-, 751.8-759.9 Parts of and accessories suitable for 751.2-, 752-76 TELECOMMUNICATIONS AND SOUND RECORDING APPARATUS764 Telecommunications equipment, and parts764.1 Electrical line telephonic and telegraphic apparatus764.2 Microphones, loudspeakers, amplifiers764.3 Radiotelegraphic and radiotelephonic transmitters764.8 Telecommunications equipment764.9 Parts of apparatus of division 76-77 ELECTRICAL MACHINERY, APPARATUS, and APPLIANCES, N.E.S.771 Electric power machinery and parts thereof771.1 Transformers, electrical771.2 Other electric power machinery, parts of 771-772 Electrical apparatus such as switches, relays, fuses, plugs, etc.772.1 Electrical apparatus such as switches, relays, fuses, plugs, etc.772.2 Printed circuits and parts thereof772.3 Resistors, fixed or variable, and parts773 Equipment for distributing electricity773.1 Insulated, electric wire, cable, bars, strip, and the like
imported skill-biased technological change 63
© 2011 The AuthorsThe Developing Economies © 2011 Institute of Developing Economies

APPENDIX II (Continued)
SITC Description
773.2 Electric insulating equipment776.4 Electronic microcircuits778 Electrical machinery and apparatus, n.e.s.778.1 Batteries and accumulators, and parts778.2 Electrical filament lamps and discharge lamps778.3 Electrical equipment for internal combustion engines, parts778.4 Tools for working in the hand with electric motor778.8 Other electrical machinery and equipment
APPENDIX TABLE 1
Difference in Hansen Tests of Exogeneity of Instruments
Dependent Variable: Employment “Blue Collar” Workers(Null hypothesis = Correct instrument specification)
(1) (2) (3)
Lag_Employment χ 92( ) = 3.09 χ 9
2( ) = 7.51 χ 9
2( ) = 3.41
BC Wages χ 12( ) = 0.05 χ 1
2( ) = 0.22 χ 1
2( ) = 0.08
Value Added χ 12( ) = 0.02 χ 1
2( ) = 0.39 χ 1
2( ) = 0.18
Capital Deepening χ 22( ) = 1.86 χ 2
2( ) = 3.52 χ 2
2( ) = 1.92
SETI Deepening χ 12( ) = 0.26 χ 1
2( ) = 2.39 χ 1
2( ) = 0.84
Dependent Variable: Employment “White Collar” Workers(Null hypothesis = Correct instrument specification)
(1) (2) (3)
Lag_Employment χ 442( ) = 44.14 χ 44
2( ) = 47.63 χ 44
2( ) = 47.54
BC Wages χ 202( ) = 25.06 χ 20
2( ) = 34.83** χ 20
2( ) = 29.89*
Value Added χ 12( ) = 0.18 χ 1
2( ) = 1.66 χ 1
2( ) = 0.50
Capital Deepening χ 12( ) = 0.66 χ 1
2( ) = 1.00 χ 1
2( ) = 3.43*
SETI Deepening χ 12( ) = 0.27 χ 1
2( ) = 0.27 χ 1
2( ) = 0.41
Note: Columns (1), (2), and (3) refer to the same econometric specifications described in thetext, namely: (1) estimates with yearly dummies, (2) years + countries, and (3) years +industries.
64 the developing economies
© 2011 The AuthorsThe Developing Economies © 2011 Institute of Developing Economies

APPENDIX TABLE 2
Time Persistence in the Relative Employment Series
Relative Employment
AR(1) 0.9759***(0.0011)
Notes: 1. Standard errors in brackets.2. AR(1) computed on ordinary least squares in levels.
*** represents statistical significance at the 1% level.
APPENDIX TABLE 3
Relative Employment Equation(Dependent Variable: Relative Employment)
VariableGMM-SYS
(1) (2) (3)
Lag_Relative Employment 0.693*** 0.391*** 0.691***(0.062) (0.081) (0.059)
Relative Wages -0.101*** -0.407*** -0.095***(0.019) (0.043) (0.019)
Value Added 0.133*** 0.071 0.158***(0.045) (0.073) (0.056)
Capital Deepening -0.133*** -0.075 -0.201(0.047) (0.071) (0.069)
SETI Deepening 0.126*** 0.116** 0.154***(0.047) (0.055) (0.058)
Constant -2.059*** -1.151** -2.688***(0.556) (0.859) (0.801)
Country dummies 5.56***Sector dummies 0.91Time dummies 2.24** 0.98 2.16**Wald test 4.95*** 1.66**Hansen test 7.68 12.95 8.37AR(1) -9.64*** -7.35*** -9.49***AR(2) -0.97 -1.24 -1.37Observations 4,154 4,154 4,154
Notes: 1. White-robust standard errors in brackets.2. Wald test applied to the joint significance of the dummies.
*** , ** , and * represent statistical significance at the 1%, 5%, and 10% level, respectively.
imported skill-biased technological change 65
© 2011 The AuthorsThe Developing Economies © 2011 Institute of Developing Economies