implementation initiatives of the mechanistic-empirical pavement design guides in indiana
TRANSCRIPT

Implementation Initiatives of the Mechanistic-Empirical Pavement Design Guides in Indiana
by
Tommy Nantung, Ph.D., P.E., Section Manager INDOT, Research Division 1205 Montgomery Street West Lafayette, Indiana 47906 Phone: (765) 463-1521 ext. 248 [email protected] Ghassan Chehab, Ph.D., Assistant Professor Pennsylvania State University Civil and Environmental Engineering Department 212 Sacket Building University Park, PA 16802 Phone: (814) 863-2936 [email protected] Scott Newbolds, PE, Section Manager INDOT, Research Division 1205 Montgomery Street West Lafayette, Indiana 47906 Phone: (765) 463-1521 ext. 253 [email protected] Khaled Galal, Ph.D., Research Scientist Virginia Transportation Research Council 530 Edgemont Road Charlottesville, VA 22903 Tel: (434) 293-1979 [email protected] Shuo Li, Ph.D., PE, Transportation Research Engineer INDOT, Research Division 1205 Montgomery Street West Lafayette, Indiana 47906 Phone: (765) 463-1521 ext. 247 [email protected] Dae Hyeon Kim, Ph.D., PE, Geotechnical Engineer INDOT, Research Division 1205 Montgomery Street West Lafayette, Indiana 47906 Phone: (765) 463-1521 ext. 244 [email protected] Word count: 5623 words + 4 figures + 3 tables = 7373 words November 15, 2004

ABSTRACT
The release of the Mechanistic-Empirical Design Guide for New and Rehabilitated Pavement Structures generates a new paradigm in designing and analyzing pavement structures and is anticipated to replace the commonly used empirical design methodologies. The M-E Design Guide utilizes a comprehensive suite of input parameters that are deemed necessary to design pavements with high reliability and to realistically predict pavement performance and distresses. However, the considerable amount of input needed and the selection of the corresponding reliability level for each can potentially present State Highway Agencies (SHA) with complexities and challenges in its implementation. Presented in this paper is an overview of on-going investigative studies, sensitivity analyses, and pre-implementation initiatives conducted by the Indiana Department of Transportation (INDOT) in an effort to accelerate the adoption of the new pavement design guide by efficiently utilizing existing design parameters and determining those that influence the predicted performance the most. Once the sensitive inputs are identified, the large amount of other required design input parameters can be reduced significantly to a manageable level for implementation purposes. A matrix of trial runs conducted using the M-E Design Guide software suggest that a higher design level input does not necessarily guarantee a higher accuracy in predicting pavement performance. The software runs also confirmed the need for using input values obtained from local rather than national calibration. Such findings are very important for SHA’s such as INDOT in drafting initiatives for implementing the M-E Design Guide.

1
INTRODUCTION
The transportation community is entering into a new paradigm of pavement design and analysis with the release of the Mechanistic-Empirical Design Guides for New and Rehabilitated Pavement Structures or the M-E Design Guide. Not only is this M-E Design Guide changing the process, type, and number of the design inputs to be provided, but also the way engineers think and implement strategies for more effective and efficient pavement design. A large number of design inputs related to subgrade, materials, environment, traffic, drainage, and pavement shoulders need to be considered to be able to analyze and design a pavement. In addition, most of those inputs are inter-related in certain ways such that comprehensive treatment of pavement layers “as a whole pavement system” has become an inevitable requirement. As a result of the Design Guide’s introduction of the performance-related design concept, a pavement designer has the capability and flexibility to incorporate several design features and material properties to a certain pavement site and its conditions to meet the key distresses and smoothness performance requirements.(1) The M-E Design Guide inputs are grouped under separate modules that correspond to the disciplines mentioned above. However, analytical processes in the software depend, in many cases, on interactions of the design inputs in all modules. Therefore, a team approach and a thorough knowledge of the pavement system are important to be able to implement this M-E Design Guide to achieve a “rational” design. In the empirical design method, a validity of a pavement design is based on reliability, which is generally the ability of the pavement to carry an estimated traffic load during a design life at a certain serviceability level. The M-E Design Guide processes demand a designer’s knowledge of both pavement design inputs and pavement performance. For that purpose, a team of traffic engineers, materials engineers, geotechnical engineers, and pavement structural engineers need to communicate and cooperate fully to implement the M-E Design Guide to a greater accuracy. The higher the importance of a specific roadway in terms of economy and safety, the more critical it is for the pavement design to provide the design life with the needed performance. Accuracy in pavement design, therefore, is the ability of the designed pavement to perform well at a certain reliability level based on a pre-determined performance level and efficiency in construction, maintenance, and user’s costs. An over-designed pavement can always meet a certain reliability level. However, an over-designed pavement may in certain cases negatively influence its performance, such as a thicker concrete pavement that generates higher curling stresses. The first important activity in implementing this M-E Design Guide is to review the “State-Of-Knowledge” of an agency’s pavement team of design engineers. The hierarchical approach to design inputs is an important feature in the M-E Design Guide. A decision to choose a higher input level from the start of the design process in many cases may not result in a more efficient design. The hierarchical design inputs should be selected in a case by case basis after a thorough evaluation of all the design modules and sensitivity analysis. In addition, adopting the hierarchical design input constitutes one of the critical factors in the implementation effort because not only does it determine the amount of data to be collected but also determines the level of knowledge in pavement engineering that that the design team has to possess or acquire. The second important activity is to review the readiness and availability of field and laboratory testing resources, collect and review existing data for design inputs, pre-process the data, and form a strategic alliance with staff from other divisions in an agency, such as from research, roadway management, materials and tests, and planning. Familiarity in sampling and testing protocols needed is an inevitable task needed to accelerate the adoption of the M-E Design Guide. Champions from each civil engineering discipline incorporated in the new design methodology have to be assigned to accelerate the implementation and adoption of the M-E Design Guide.
GENERAL IMPLEMENTATION PLAN
Implementation plans will differ from one agency to the other due to different organizational structures, policies, conditions, and situations in each agency. Agencies with more Long Term Pavement Performance (LTPP) sites will benefit from the relatively less effort required in calibrating the pavement performance and distress prediction models. Agencies with integrated departmental functions in pavement design, materials, and research can easily withdraw experts and champions to implement this M-E Design Guides. Indiana Department of Transportation (INDOT) has a unique way of performing pavement design. Most of the pavement designs are approved by the INDOT Pavement Steering Committee, and so are policies and procedures related to pavement. The members of the steering committee include representatives from Materials and Tests Division, Research Division, Program Development Division (Roadway Management), Contracts and Construction Division, Design Division, and the Federal Highway Administration (FHWA). The coordinated effort from this Committee proposed implementation initiatives for the M-E Design Guide. An implementation team was formed

2
from members of this Committee with full commitment from the executive staff. The following is the implementation plan as laid out by INDOT:
1. Review the existing state-of-knowledge in pavement engineering and management. This is a very crucial step in the implementation plan since the M-E Design Guide provides the designer with several alternatives, some of which are appropriate while others are not.
2. Review and document hierarchical design input parameters for each level of design accuracy. The main principle of this implementation activity is to document sensitive design inputs that influence the key distresses and smoothness the most. The trigger value of each design input in each design input module has to be clearly understood to be able to find correlations with other design inputs in other modules. Understanding those trigger values becomes very crucial in determining the design input for a specific project. This implementation activity includes reviewing the performance and performance prediction models in the M-E Design Guide and software.
3. Review and document existing data in the Department and from the LTPP database that are relevant and readily available for use in the M-E Design Guide. Sensitive data to the key distresses and smoothness are to be collected first. Some data need validation; others need modification; some have to be converted; while some have to be correlated to the design inputs.
4. Review the readiness of the laboratory and field equipment needed for higher level design input to achieve higher design accuracy and acquire the needed equipment to develop a testing program for sensitive design inputs. This activity will resolve the problem of lack of data necessary to achieve high design levels and/or a less conservative yet appropriate design.
5. Develop and execute a strategic plan to establish local calibration and validation of distress models, to establish regions and segments for traffic input module, and to populate more environmental and climatic data for the software. Since INDOT has less LTPP data in the database it has to practically establish a “mini LTPP” program to accurately calibrate the performance models. In the traffic module, regions and segments have to be developed based on traffic and freight studies. Having a large number of WIM stations is an advantage but developing load spectra regions and segments is a must. Areas within the state with large temperature differences between north and south regions and less climatic data in the design module have to establish weather stations to avoid “rough” interpolation in the design module.
6. Provide technology and knowledge transfer complemented with the necessary training of the M-E Design Guide to other Divisions, Districts, Local Agencies, contractors, and consultants.
After completing steps 1 to 4 in the general implementation plan, INDOT has started the development of a strategic plan to establish local calibration and validation of the distress models by proposing a “mini LTPP” program. Correlations and equations for soil resilient modulus are under development with very promising preliminary results. For the traffic module, a study has been developed to generate load spectra regions and segments based on existing WIM and AVC data. Software with Geographical Information System (GIS) and Global Positioning System (GPS) capability is under development to help pavement designers easily migrate collected traffic data to the traffic design input module in the M-E Design software.
IMPLEMENTATION INITIATIVES IN TRAFFIC DESIGN INPUTS
Identifying Issues of Fulfilling Axle Load Spectra Data Requirements
The number and type of design inputs depend on design input level, but regardless of design level the design process will have an outcome of load spectra. While the use of axle load spectra are much more complex than Equivalent Single Axle Loads (ESALs), several advantages of using the axle load spectra data have been identified. In general, the axle load spectra data can generate more accurate prediction of pavement cracking and rutting.(1)
The axle load spectra data is required at three different levels in terms of the data accuracy. The traffic inputs at Level 1 are the most accurate inputs generated from project or segment specific weigh-in-motion (WIM) and automatic vehicle classification (AVC) data. The traffic inputs at Level 2 use regional WIM and AVC data and

3
provide intermediate accuracy. The traffic design inputs consist of regional or statewide default values and provide poor accuracy. The main issues of implementing the axle load spectra are summarized as follows:
• WIM and AVC systems (hardware and software) from different vendors are not compatible in collecting and handling data.
• WIM and AVC raw data files are usually encrypted and can only be processed by using each vendor’s software.(12)
• WIM and AVC data are usually very large.
• WIM and AVC sites are distributed statewide that require a strategy to generate geographical and functional regions and segments.
Assessing Technologies for Axle Load Spectra Data Requirements
In order to meet the traffic design input requirements for the M-E Design Guides, emerging technologies such GPS and GIS have been utilized to manage and process traffic data collected at the WIM and AVC sites. GPS provides coordinates of all WIM and AVC sites while GIS provides necessary GIS maps and visual access to the WIM and AVC sites and tabular data. It becomes possible to combine all functions, technologies, and databases together to work as an integral unit to general traffic regions and segments.
Figure 1 shows a screen shot of software under development by the INDOT Research Division to visualize WIM and AVC sites and provide traffic data access in their corresponding level of design inputs by selecting on corresponding nodes provided in the left panel. The right panel provides a selectable WIM and AVC sites and their corresponding information. Pavement engineers can exercise their experience and engineering judgment to select relevant traffic data for pavement projects when no site specific WIM and AVC data are available. The format of all data files can be designed so that the data files can be exported directly to the M-E Design Guides software.
Initiatives in Traffic Design Inputs
The INDOT Research Division has generated implementation initiatives in collecting and analyzing traffic data. The initiatives are summarized below:
• Implement sensitivity studies to identify the influence traffic design inputs.
• Generate WIM and AVC GIS maps.
• Analyze WIM and AVC data to generate axle load spectra.
IMPLEMENTATION INITIATIVES IN CONCRETE PAVEMENT DESIGN INPUTS
The M-E Design Guides contains over 30 parameters that are specifically related to the JPCP layer. Parameters include material properties such as concrete flexural strength as well as design features such as slab thickness. In order to develop calibration recommendations it was necessary to evaluate these parameters to see which are sensitive in the design process. The methodology for the sensitivity analysis was to develop a base design using parameters similar to those used in current INDOT practice. Currently INDOT only designs JPCP, therefore the analysis was limited to this pavement type. The results of the base design were used to compare with subsequent trials in which one parameter was varied independently. Distresses and performance indicator include: faulting, cracking, and roughness (IRI). Their monthly values over the design life of the pavement are an output of the program. These values were used as the basis of comparison between the base and varied cases.
Design Base Case
The pavement was designed as an interstate with a 30 year service life. The initial traffic level was 10,000 AADTT with a 4 percent compounded growth. Climate information was taken from the South Bend, Indiana climate model.

4
The cross section of the pavement consisted of four different layers. The bottom layer was a semi-infinite, A-6 classified soil. The next layer was 152.4 mm (6 inches) of dense graded crushed stone. Over this layer was 76.2 mm (3 inches) of an open graded crushed stone. The base layer was considered to be very erosion resistant. Properties of these layers were entered as Level 3 inputs.
The final layer was the JPCP. The layer is PCC with a thickness of 381 mm (15 inches). Joint Spacing was 5.5 m (18 feet). Joints were doweled with the 38.1 mm (1.5 inch) dowels spaced at 304.8 mm (12 inches). Edge support was provided by a tied shoulder. Long-term load transfer efficiency was assumed to be 40 percent. Bonding was assumed between the JPCP layer and the aggregate layer below.
Level 3 was chosen for the strength data inputs in the base case. A value of 4.826 MPa (700 psi) was chosen for the 28-day modulus of rupture. The 28-day modulus of elasticity was determined by the program. The additional parameters used in the base case are presented in Table 1.
Variables
Seventeen design inputs were chosen for evaluation in the sensitivity analysis. Strength values required in the Design Guide varied depending on the chosen design level. Level 3 analysis requires either 28-day concrete modulus of rupture or 28-day concrete compressive strength. The 28-day concrete modulus of elasticity is either calculated from these inputs by the Design Guide or can be input based on user experience. Level 2 requires input of concrete compressive strength data at 7, 14, 28, and 90 days. Additionally, a value for 20-year/28-day strength ratio is required. There is no option to input concrete modulus of rupture or modulus of elasticity in Level 2 design.
Level 1 requires the input of concrete modulus of rupture and modulus of elasticity at 7, 14, 28, and 90 days. Similar to the Level 2 requirements, a value for 20-year/28-day strength ratio is also required for both the modulus of rupture and modulus of elasticity in Level 1 design. In Level 1 design there is no option to input concrete compressive strength.
Table 2a contains a list of the strength values used in the sensitivity analysis. For strength parameters at 7, 14, 28, and 90 days, the values used in an individual analysis should be read in sequence. For example, using Level 2 the compressive strength data, a single trial would use 13.789 MPa (2000 psi), 20.684 MPa (3000 psi), 31.026 MPa (4500 psi), and 37.921 MPa (5500 psi) for the 7, 14, 28, and 90 day strengths, respectively. Three different strength data sets were evaluated for Level 2 (low, medium, and high strength) and five different strength data sets were evaluated for Level 1 (low, low-medium, medium, medium-high, and high). Each data set was then varied with the 20-year/28-day strength ratio. The remaining variables evaluated and their respective values are presented in Table 2b. Selection of values for the evaluation was based on the ranges recommended by the program. This was done to see the sensitivity over the recommended range.
Results
To compare each parameter to the base case the calculated distresses were plotted as a function of each parameter evaluated. The effect of each parameter was then evaluated and subjectively rated in one of four categories: not sensitive, moderately sensitive, sensitive, or very sensitive.
The results of the hierarchical strength analysis provided the following insight in regards to the strength (all levels), the 20-year/28-day strength ratio (Level 1 and Level 2), and the modulus of elasticity (Level 1). At all design levels, the IRI was “sensitive” to these parameters. The faulting was found to be “not sensitive” to these variables. And, the percent slabs cracked was found to be “very sensitive” to these parameters.
The remaining parameters were also evaluated and rated based on their sensitivity. Table 3 contains a summary of these ratings. In general, the parameters that had the greatest impact on the distresses were the permanent curl/warp effective temperature difference, the joint spacing, pavement thickness, coefficient of thermal expansion, and thermal conductivity. The remaining parameters either had only a moderate effect or had no effect on the distresses.
A comparison of the different design levels was also performed to evaluate the benefit of designing at a higher level. Level 3 allowed the input of either compressive strength or modulus of rupture. Since Level 2 allowed only input of compressive strength and Level 1 only allowed the input of modulus of rupture, Levels 2 and 3 cannot be directly compared. Therefore, the results of Level 3 analysis based on modulus of rupture were compared to results of the Level 1 analysis based on modulus of rupture. A 20-year/28-day strength ratio equal to 1.2 (recommended value) was used for the comparison.

5
Figure 2 shows a comparison between Level 3 and Level 1 designs using IRI as a basis of comparison. As can be seen in the figure, there is no apparent benefit in going to a higher level of design when using comparable input values. Both the IRI value is the same for Level 3 and Level 1. Also, the IRI value at 95 percent reliability is the same for both Level 3 and Level 1. Similar results were obtained for a comparison of Levels 1 and 3 based on faulting (although not sensitive to strength) and cracking. Thus, based on this brief comparison, the benefit in going to a higher level of design appears to be merely based on the knowledge of having better data with which to design.
Initiatives in Concrete Pavement Design Inputs
Given the large number of inputs required in the design method it was of interest to see which parameters were sensitive. The results of the sensitivity analysis indicate that some of the parameters are very sensitive in the design. Thus, it will be of benefit to study these parameters more closely. Additionally, INDOT currently uses the 28-day value for the concrete modulus of rupture for the strength value in pavement design. This corresponds to a Level 3 design. Although limited analysis shows no benefit of designing at a higher design level, better knowledge of the properties of the mixtures used in construction as they relate to design will still be beneficial. As such, it is desirable to obtain the accurate data for use in the design program. However, the use of design hierarchical strength parameters requires data that are not routinely collected for pavement mix designs. This section explores different methods that are recommended to obtain the needed information.
• Data mining for strength data will not provide all the data necessary for higher design levels. As such, it is recommended that a laboratory study be undertaken to provide design values. Since laboratory work is needed to produce these data it would be the same effort to produce Level 2 data as it would to produce Level 1 data. Thus, it is recommended that Level 1 strength parameters be studied. Additionally, the laboratory study can be used to evaluate the other mixture parameters (e.g. coefficient of thermal expansion) that are not currently available.
• For calibration purposes, it will be of benefit to evaluate the data contained in INDOT’s Pavement Management System (PMS). Design information can be obtained and input into the new design software. The observed distresses that are contained in the PMS can be compared to the distresses that are calculated by the design program. Calibration adjustments can be made to the distress models used in the design program in order to tailor the program for use in Indiana.
• Test sections are recommended to evaluate the non-materials related design parameters. INDOT has constructed such a test site on I-65 near Clarksville, Indiana. The section has been fitted with strain gages, temperature gages, tilt meters, and moisture gages. A weather station and traffic counters/classifiers were also installed on the site. Additionally, mixture parameters and strength data have been obtained. This project will be used to evaluate parameters such as joint spacing, slab thickness and temperature differentials and their effect on curling and warping of the concrete slabs. Additional test sites are recommended to evaluate these parameters under the different environmental conditions at different locations within the state.
IMPLEMENTATION INITIATIVES IN HOT MIX ASPHALT PAVEMENT DESIGN INPUTS
The newly introduced M-E Design Guides offers a mechanistic-empirical procedure for design incorporating more fundamental material properties and constitutive mathematical relationships, especially in assessing the pavement response due to loading. For HMA pavement sections, the M-E Design Guides allows for the design of new pavement sections, specifically, conventional thin HMA pavements, full-depth HMA pavements, and Semi-Rigid pavements in addition to various rehabilitation strategies using HMA overlays whether on top of existing HMA pavements or on top of intact, Rubblized, and Crack and Seated PCC pavements.
The focus of these HMA implementation initiatives is to present a brief overview in assessing the impact and sensitivity of various design inputs on pavement response and distresses. All other design inputs related to traffic, climate, and unbound layers were held constant. The results of this study would help determine the extent to which the various HMA design inputs need to be incorporated and further evaluated in INDOT’s local calibration and implementation plan.
A reference design input file was created where the values of the all the design inputs (traffic, climate, structure, and materials) were typical in designing for pavements located on major Interstate and US highways in the

6
Northwest region of Indiana. In the subsequent runs, the values of the HMA material inputs were varied to represent the design used for pavements constructed in different regions of Indiana. The Design Level of inputs was not pre-selected; rather, it varied from one parameter to the other based on the data available and that is currently used for design by INDOT. The variation in the distresses at the end of a 20-year design life with the change in design input is based on the comparison of distresses resulting from the design inputs in the reference file. It is assumed that no maintenance or rehabilitation occurs within the 20-years of service life.
Effect of HMA Design Inputs on Key Distresses
The major key distresses experienced in HMA pavement sections include: rutting (permanent deformation), fatigue bottom-up cracking, longitudinal top-down cracking, and reflective cracking. The M-E Design Guides currently does not evaluate a reflective cracking distress.(1,2) For that purpose, the effect of particular design inputs on all the key distresses excluding reflective cracking will be evaluated.
Effect of HMA Thickness
To study the effect of HMA overall and individual layer thicknesses, four design trials were conducted. The reference run consisted of a 25.4 mm (1 inch) surface course, 101.6 mm (4 inch) intermediate, and (203.2 mm (8 inch) base course to constitute a 330.2 mm (13 inch) total HMA thickness. In two other trials the individual layer thicknesses were varied with the total thickness remaining constant at 330.2 mm (13 inches); while, in the last trials the total thickness was varied to 355.6 mm (14 inches) by increasing the surface layer thickness by 25.4 mm (1 inch). The results shown in Figure 3a suggest the increase in longitudinal cracking with the increase in surface layer thickness with no particular trend observed for the other stresses. When the total thickness is increased, both rutting and fatigue cracking decreased while the longitudinal cracking increased.
Effect of As-Constructed Air Void (AV) Content
In most HMA project in Indiana, the as-constructed AV content of pavements averages 6%. Several AV contents delivered by paving contractors were investigated with a maximum content of 10%, a value that is above the maximum tolerance of an 8% AV content according to INDOT’s specifications. The output results shown in Figure 3b confirm the expected trend of increase in distresses as the AV content increases from 4 to 10%. However, there is a significant exponential increase in longitudinal cracking as the AV content exceeds 7%.
Effect of Asphalt Binder Grade
Selecting AC-20 as a reference binder, three other binder inputs were investigated. In two of the trial designs, the Level 3 binder type input was PG 64-22 and PG 76-28. In the other trial, the shear modulus and phase angle, G* and δ respectively, of an RTFO AC-20 binder were input. Such design input meets the Level 1 and Level 2 design input requirements. Important observations made from Figure 3c include:
• Significant difference in distress resulting from Level 1 inputs for AC-20 compared to those of Level 3.
• Decrease in fatigue and rutting when a PG 76-28 is used, an expected result.
Effect of HMA Design Inputs on Thermal Cracking
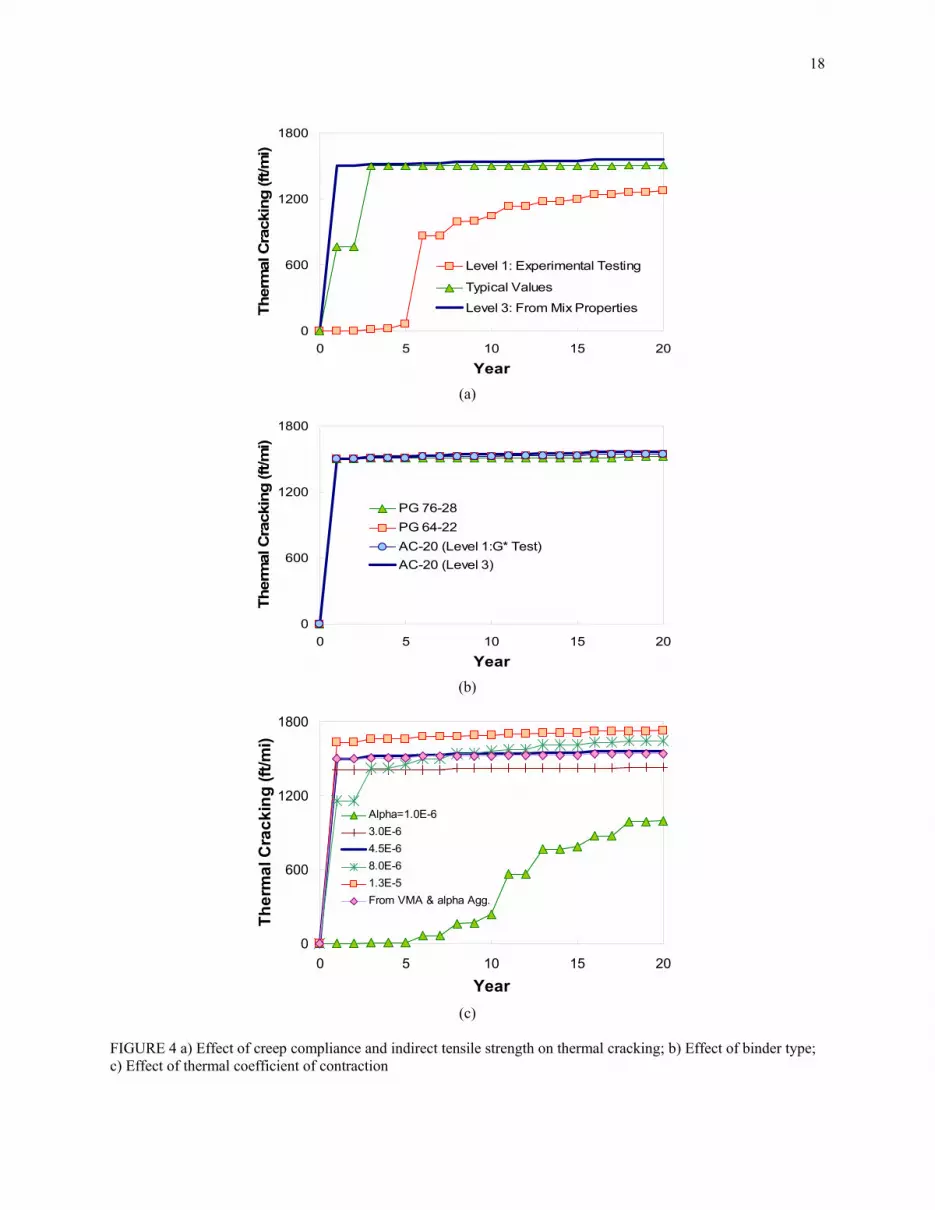
Preliminary trials show that the performance of thermal cracking is greatly influenced by the mixture creep compliance D(t), mixture indirect tensile strength (IDT), and mixture coefficient of thermal contraction, with the latter exhibiting the most. Several program runs were made to evaluate the effect of those properties on the thermal cracking performance. The binder grade was also studied since it affects the creep compliance and IDT strength when design input Level 3 is chosen.
Figure 4a shows the variation in thermal cracking resulting from: a) design inputs Level 1 (mix-specific D(t) and IDT strength) obtained from experimental testing, b) typical values from research data and literature, and c) M-E Design Guides default values (Level 3) derived using regression equations an empirical relationships from mixture and binder properties. Figure 4b illustrates the effect of the binder type and its properties from test results; while Figure 4c shows the effect of the mixture coefficient of thermal contraction. From these figures the following observations can be made:

7
• Thermal cracking performance is significantly affected by the level of input parameters, and coefficient of thermal contraction; and
• When only considering the effect of the binder grades, PG 76-28 exhibited better performance with regard to thermal cracking than the PG 64-22 and the AC-20 grade.
Initiatives in HMA Pavement Design Inputs
The research results presented above are a subset of a more comprehensive study on the effect and sensitivity of material design inputs. The draft framework presented herein could be considered a road map to be followed in more comprehensive and in-depth research work that would pave the way to a smooth transition for INDOT in implementing the M-E Design Guides. The followings are the HMA pavement initiatives:
• Generate a database for dynamic modulus, creep compliance, and IDT strength of common HMA mixtures.
• Re-design existing LTPP and other test sections using the M-E Design Guides, and compare predicted performance to the measured. Then, determine distress model calibration factors if necessary.
• Validate calibrated models using INDOT APT and the future Indiana Mini-LTPP sections.
IMPLEMENTATION INITIATIVES IN UNBOUND MATERIALS DESIGN INPUTS
Since the AASHTO 1986 Guide for Design of Pavement Structures recommended agencies to use a resilient modulus (Mr) value obtained from a repeated triaxial test for the design of subgrades, numerous efforts have been made to obtain more accurate, straightforward, and appropriate Mr values which are representative of the field conditions. Over the past 10 years, INDOT has advanced the characterization of subgrade materials by using the resilient modulus testing, as the most ideal repeated triaxial testing for subgrade behavior subject to repeated traffic loadings. An on-going study has objectives to generate database of Mr values for Indiana subgrade, simplify the resilient modulus testing procedure, and develop a predictive model for Mr values using soil variables.
Subgrade Design Input Level 3
In design input Level 3, a modulus value for unbound material is required. There are two options to determine the modulus: ICM Calculated Modulus, and User Input Modulus (i.e., Representative Modulus). The ICM Calculated Modulus allows seasonal variation in the moduli for different months while the User Input Modulus remains constant for the entire design period. Therefore, it is desirable to use the ICM input module. In addition, a general equation between the Mr and CBR values is provided. Typical CBR values for most of untreated fine-grained soils in Indiana are in the range of 3 to 15% corresponding to Mr values from 34.060 MPa to 89.425 MPa (4,940 to 12,970 psi). This range of Mr appears to be reasonable in the design input Level 3.
Subgrade Design Input Level 2
In design input Level 2, the following properties: Mr, CBR, R-value, DCPT, layer coefficient and PI and gradation can be selected. There are three design input options: ICM input, representative value, and seasonal input. Several analyses revealed that similar outputs are observed in both Level 3 and Level 2 when a resilient modulus is selected using the ICM module. For seasonal design input option, monthly resilient moduli are required.
Subgrade Design Input Level 1
In design input Level 1, non-linear coefficients k1, k2, and k3 are required. In order to generate a Mr predictive model, available testing data from an on-going INDOT research project were analyzed. The following INDOT equations are to estimate the k1, k2, and k3 values: Log k1=6.660876-0.22136xOMC-0.04437xMC-0.92743xMCR-0.06133xDD+10.64862x%comp+0.328465xSATU-
0.04434x%sand-0.04349x%SILT-0.01832x%CLAY+0.027832xLL-0.01665xPI

8
k2=3.952635-0.33897xOMC+0.076116xMC-2.45921xMCR-
0.06462xDD+6.012966x%comp+1.559769xSATU+0.020286x%sand+0.002321x%SILT+0.011056x%CLAY+0.077436xLL-0.05367xPI
k3=2.634084+0.124471xOMC-0.09277xMC+0.366778xMCR-0.01168xDD-1.32637x %comp+1.297904xSATU-
0.01226x%sand-0.00512x%SILT-0.00492x%CLAY-0.05083xLL+0.018864xPI where; OMC (Optimum Moisture Content), MC (Moisture Content), MCR (Moisture Content Ratio = Moisture Content/ Optimum Moisture Content), DD (Dry Density), SATU (Degree of Saturation), %sand (Percent Sand in Particle Size Distribution Curve), %CLAY (Percent Clay in Particle Size Distribution Curve), LL (Liquid Limit) and PI (Plasticity Index).
Initiatives in Unbound Material Design Inputs
In characterizing subgrade in Indiana, INDOT is proposing Mr testing program for both design inputs Level 2 and Level 1. In addition, the following initiatives will be conducted to enhance characterization of subgrade:
• Mr monthly variation laboratory testing to simulate freeze-thaw in the subgrade.
• Mr long term laboratory simulation to consider permanent strain for pavement rehabilitation.
• Correlation between Mr and FWD data for non-destructive testing evaluation.
CONCLUSION
The M-E Design Guides provide a performance based design to the transportation community. In addition, it has the capability to analyze in-situ pavement and predict the remaining life with performance prediction. With that capability, it is a design guide that will reach more users in academia and industry. However, time and resources are needed to accomplish a rational and accurate design and analysis using the M-E Design Guide. The current AASHTO Pavement Design Guide is more or less comparable to the Level 2 design in the M-E Design Guide. Therefore, many State agencies will likely implement at least design input Level 2. However, in determining the sensitive design inputs, it was found that some combinations of design input levels rather than setting all Level 2 design inputs yield more rational results. In the traffic load spectra, the default values in Level 3 design input are too general that design accuracy may not be achieved. The existing empirical design method may give a better result since many state agencies already have databases about performance of pavement in ESALs that are comparable to that of Level 3 traffic load. Loads and load distribution are very important in both HMA and concrete pavement performance. Therefore, strength parameters on both types of pavement are very sensitive to the design accuracy. At least a traffic design input Level 2 has to be implemented in the State Route and higher road classifications. In jointed plain concrete pavement, all parameters related to concrete strength and curling stresses are very sensitive to the performance parameter, especially the mid-panel cracking. Temperature differential between top and bottom of the slab, joint spacing, and coefficient of thermal expansion are extremely sensitive to the percent slab cracked. Failure to recognize these parameters by using the default values may result in a pavement design that indicates it is excessively over-designed while in fact it is not. Since temperature differential, joint spacing, and coefficient of thermal expansion are not in the hierarchical input design modules, moving from design input Level 3 to Level 1 will not have significant differences in terms of design accuracy. In the hot mix asphalt pavement, longitudinal cracking model is very sensitive to the HMA layer thickness, air voids, and asphalt binder type. The thermal cracking model in the HMA design module is very sensitive to mixture creep compliance, indirect tensile strength, and coefficient of thermal contraction parameters. Since these parameters are in the hierarchical design input modules, moving from Level 3 to Level 1 makes very significant differences in terms of design accuracy. The unbound material design input module depends on “completeness” of soil testing data to determine the hierarchical design input levels. For an agency that has already adopted resilient modulus testing, the more complete testing parameters, in terms of frequency of testing during the season, the higher the design accuracy that can be

9
achieved by moving to higher design input levels. Therefore, moving from design input Level 3 to Level 1 will have significant differences in terms of design accuracy. More concentrated efforts need to be given to the understanding of the M-E Design Guides with regards to key distresses and performance parameters, sensitivity in, within, and between the design modules, combinations of design input levels in between modules, and local calibration.
ACKNOWLEDGEMENT
The authors acknowledge the support of the Indiana Department of Transportation Pavement Steering Committee. The authors also would like to thank Victor L. Gallivan of FHWA Indiana Division, Kumar Dave of the INDOT Materials and Tests Division, and William Flora of the INDOT Program Development Division for their assistance in advising the implementation initiatives.

10
REFERENCES
1. Transportation Research Board, National Cooperative Highway Research Program, NCHRP 1-37A, Mechanistic-Empirical Design of New and Rehabilitated Pavement Structures, Design Guide and Supplemental Documentation, Transportation Research Board, July 2004
2. Transportation Research Board, National Cooperative Highway Research Program, NCHRP 1-37A, Mechanistic-Empirical Design of New and Rehabilitated Pavement Structures, Software, Transportation Research Board, April 2004
3. American Association of State Highway and Transportation Officials, AASHTO Guide For Design of Pavement Structures, American Association of State Highway and Transportation Officials, 1986
4. American Association of State Highway and Transportation Officials, AASHTO Guide For Design of Pavement Structures, American Association of State Highway and Transportation Officials, 1993
5. American Association of State Highway and Transportation Officials, AASHTO Guide For Design of Pavement Structures, Supplemental, American Association of State Highway and Transportation Officials, 1998
6. Indiana Department of Transportation, Design Manual, Part V, Road Design, Volume I and II, Indiana Department of Transportation, Indianapolis
7. Y. H. Huang, Pavement Analysis and Design, Prentice Hall, Englewood Cliffs, NJ 07632, 1993 8. E. J. Yoder and M.W. Witczak, Principle of Pavement Design, John Wiley & Sons Inc., 1975 9. Federal Highway Administration, Long Term Pavement Performance Study 10. Federal Highway Administration, Office of Highway Policy Information, Traffic Monitoring Guide,
Federal Highway Administration, U.S. Department of Transportation, 2001. 11. International Road Dynamics Inc., Software Users’ Manual, IRD Weigh-In-Motion (WIM) Data Collection
System, Version 7.5.0, 1999.

11
LIST OF TABLES AND FIGURES
TABLE 1 Design Base Case Parameters for Jointed Plain Concrete Pavement TABLE 2 Strength Variables at Different Levels and Other Variables Evaluated in Sensitivity Analysis TABLE 3 Sensitivity Analysis Results for Hierarchical Parameters FIGURE 1 Software for Managing and Processing WIM and AVC Data to Generate Traffic Regions and Segments FIGURE 2 Comparison of Jointed Plain Concrete Pavement Level 1 and Level 3 FIGURE 3 a) Effect of HMA thickness on mechanical distresses; b) Effect of AV%; c) Effect of AC type FIGURE 4 a) Effect of creep compliance and indirect tensile strength on thermal cracking; b) Effect of binder type; c)Effect of thermal coefficient of contraction

12
TABLE 1 Design Base Case Parameters for Jointed Plain Concrete Pavement
Parameter Value
Permanent Curl/Warp Effective Temperature Difference (Fº) -30 Joint Spacing (feet) 18 Joint Sealant Type Silicone Dowel Bar Diameter (inch) 1.5 Dowel Bar Spacing (inch) 12 Long-term LTE (percent) 40 Surface Shortwave Absorptivity 0.85 Infiltration Minor Drainage Path Length (feet) 12 Cross Slope (percent) 2 Pavement Thickness (inches) 15 Unit Weight (pcf) 145 Poisson’s Ratio 0.15 Coefficient of Thermal Expansion (per Fº x 10-6) 5 Thermal Conductivity (Btu/hr*ft*Fº) 1.1 Heat Capacity (Btu/lb*ft) 0.28 Cement Type Type I Cement Content (pcy) 440 Water/Cement Ratio 0.42 Aggregate Type Limestone PCC Zero Stress Temperature (Fº) 85 Reversible Shrinkage (percent ultimate) 50 Time to Develop 50 Percent Shrinkage (days) 35 Curing Method Curing Compound
Unit conversion: Cº= 5/9(Fº - 32), 1 foot = 30.48 cm, 1 inch = 25.4 mm, 1 pcf = 7489.151 kg/m3, 1 pcy = 832.128 kg/m3, 1 Btu = 0.292 Watt-hour

13
TABLE 2 Strength Variables at Different Levels and Other Variables Evaluated in Sensitivity Analysis
(a) Strength Variables at Different Levels
Parameter Values
Level 3 Modulus of Rupture (psi) 450, 700, 825, 1200 Compressive Strength (psi) 3000, 5500, 8000
Level 2
7-day Compressive Strength (psi) 2000, 3500, 5000 14-day Compressive Strength (psi) 3000, 4500, 6000 28-day Compressive Strength (psi) 4500, 6000, 7500 90-day Compressive Strength (psi) 5500, 7500, 10000 20-year/28-day Strength Ratio 1, 1.25, 1.5, 1.75, 2
Level 1
7-day Modulus of Rupture (psi) 400, 485, 570, 610, 650 14-day Modulus of Rupture (psi) 500, 575, 650, 710, 775 28-day Modulus of Rupture (psi) 550, 625, 700, 790, 875 90-day Modulus of Rupture (psi) 600, 675, 750, 850, 950 7-day Modulus of Elasticity x106 (psi) 2.43, 2.94, 3.46, 3.70, 3.94 14-day Modulus of Elasticity x106 (psi) 3.03, 3.49, 3.94, 4.31, 4.70 28-day Modulus of Elasticity x106 (psi) 3.34, 3.79, 4.24, 4.79, 5.31 90-day Modulus of Elasticity x106 (psi) 3.64, 4.09, 4.55, 5.16, 5.76 20-year/28-day Strength Ratio 1, 1.25, 1.5, 1.75, 2
(b) Other Variables Evaluated in Sensitivity Analysis
Parameter Value
Permanent Curl/Warp Effective Temperature Difference (Fº) 0, -10, -15, -20, -25, -27.5, -30 Joint Spacing (feet) 10, 12, 15,18, 20 Dowel Bar Diameter (inch) 1, 1.25, 1.5, 1.75 Pavement Thickness† (inches) 10, 11, 12, 13, 14, 15, 16, 17, 18 Poisson’s Ratio 0.13, 0.15, 0.17, 0.19, 0.21 Coefficient of Thermal Expansion (per Fº x 10-6) 3, 4, 5, 6, 7 Thermal Conductivity (Btu/hr*ft*Fº) 1.1, 1.3, 1.6, 1.8, 2.0 Heat Capacity (Btu/lb*ft) 0.2, 0.23, 0.26, 0.28 Cement Content* (pcy) 440, 500, 550, 600 Water/Cement Ratio* 0.33, 0.39, 0.42, 0.45 Aggregate Type Limestone, Dolomite PCC Zero Stress Temperature (Fº) 70, 85, 100, 125 Reversible Shrinkage (percent ultimate) 30, 50, 80 Time to Develop 50 Percent Shrinkage (days) 35, 50 Ultimate Shrinkage 300, 400, 483, 500, 600, 1000
Notes: †When the thickness was varied, the effective temperature difference was also recalculated based on a value of -2Fº/inch as was done in the base case. *These parameters affect the ultimate shrinkage. The ultimate shrinkage was not held constant when these parameters were varied. Unit conversion: 1 psi = 6.895 KPa, Cº= 5/9(Fº - 32), 1 foot = 30.48 cm, 1 inch = 25.4 mm, 1 pcy = 832.128 kg/m3, 1 Btu = 0.292 Watt-hour

14
TABLE 3 Sensitivity Analysis Results for Hierarchical Parameters
(a) Sensitivity Analysis Results for Hierarchical Strength Parameters
Parameter Roughness Faulting Percent Slabs Cracked
Level 3 Modulus of Rupture S NS VS Compressive Strength S NS VS
Level 2
Compressive Strength S NS VS 20-year/28-day Ratio S NS VS
Level 1 Modulus of Rupture S NS VS Modulus of Elasticity S NS VS 20-year/28-day Ratio S NS VS
(b) Sensitivity Analysis Results for Other Parameters (Level 3 Analysis)
Parameter Roughness Faulting Percent Slabs Cracked
Permanent Curl/Warp Effective Temperature Difference VS VS VS
Joint Spacing VS VS VS Dowel Bar Diameter MS MS NS Pavement Thickness S MS VS Poisson’s Ratio MS MS S Coefficient of Thermal Expansion VS VS VS Thermal Conductivity S MS VS Heat Capacity NS NS MS Cement Content NS NS NS Water/Cement Ratio NS NS NS Aggregate Type NS NS NS PCC Zero Stress Temperature NS NS NS Reversible Shrinkage NS NS NS Time to Develop 50-Percent Shrinkage NS NS NS
Ultimate Shrinkage NS NS NS Note: NS = Not Sensitive MS = Moderately Sensitive S = Sensitive VS = Very Sensitive

15
FIGURE 1 Software for Managing and Processing WIM and AVC Data to Generate Traffic Regions and Segments

16
200
300
400
500 600 700 800 90028 day Flexural Strength (psi)
IRI (
in/m
i)
Level 1 IRILevel 1 IRI ReliabilityLevel 3 IRILevel 3 IRI ReliabiltyLimit
FIGURE 2 Comparison of Jointed Plain Concrete Pavement Level 1 and Level 3 Unit conversion: 1 psi = 6.895 KPa

17
-50%
0%
50%
100%
1 - 4 - 8 1.5 - 3.5 - 8 2 - 4 - 7 2 - 4 - 8
HMA Layer Thickness (inches)
% C
hang
e
AC Rutting
Fatigue Cracking
Longitudinal Cracking
(a)
-100%
100%
300%
3% 5% 7% 9% 11%
AV%
% C
hang
e
-1000%
2000%
5000%
8000%AC Rutting
Fatigue Cracking
Longitudinal Cracking (Right Y-axis)
(b)
-110%
-55%
0%
55%
110%
AC-20 AC-20 G* PG 64-22 PG 76-28Asphalt Binder
% C
hang
e
AC RuttingFatigue Cracking
Longitudinal Cracking
(c)
FIGURE 3 a) Effect of HMA thickness on mechanical distresses; b) Effect of AV%; c) Effect of AC type Unit Conversion: 1 inch = 25.4 mm.
18
0
600
1200
1800
0 5 10 15 20
Year
Ther
mal
Cra
ckin
g (ft
/mi)
Level 1: Experimental Testing
Typical Values
Level 3: From Mix Properties
(a)
0
600
1200
1800
0 5 10 15 20
Year
Ther
mal
Cra
ckin
g (ft
/mi)
PG 76-28PG 64-22AC-20 (Level 1:G* Test)AC-20 (Level 3)
(b)
0
600
1200
1800
0 5 10 15 20
Year
Ther
mal
Cra
ckin
g (ft
/mi)
Alpha=1.0E-63.0E-64.5E-68.0E-61.3E-5From VMA & alpha Agg.
(c)
FIGURE 4 a) Effect of creep compliance and indirect tensile strength on thermal cracking; b) Effect of binder type; c) Effect of thermal coefficient of contraction