implementation and first-year impacts of the uk employment retention and advancement (era)...
TRANSCRIPT
WestminsterResearch http://www.wmin.ac.uk/westminsterresearch Implementation and first-year impacts of the UK Employment Retention and Advancement (ERA) demonstration. Richard Dorsett1, Verity Campbell-Barr1 , Gayle Hamilton2, Lesley Hoggart1, Alan Marsh1, Cynthia Miller2, Joan Phillips1, Kathryn Ray1, James A Riccio2, Sarah Rich2, Sandra Vegeris1 1 Policy Studies Institute, University of Westminster 2 MDRC
This is a reproduction of DWP research report, 412, ISBN 9781847121523, published for the Department for Work and Pensions under licence from the Controller of Her Majesty’s Stationery Office by Corporate Document Services, Leeds. © Crown Copyright 2007. The report is available online: http://www.dwp.gov.uk/asd/asd5/rports2007-2008/rrep412.pdf The WestminsterResearch online digital archive at the University of Westminster aims to make the research output of the University available to a wider audience. Copyright and Moral Rights remain with the authors and/or copyright owners. Users are permitted to download and/or print one copy for non-commercial private study or research. Further distribution and any use of material from within this archive for profit-making enterprises or for commercial gain is strictly forbidden. Whilst further distribution of specific materials from within this archive is forbidden, you may freely distribute the URL of WestminsterResearch. (http://www.wmin.ac.uk/westminsterresearch).

In case of abuse or copyright appearing without permission e-mail [email protected].
Department for Work and Pensions
Research Report No 412
Corporate Document Services
Implementation and first-year impacts of the UKEmployment Retention andAdvancement (ERA)demonstration
Richard Dorsett, Verity Campbell-Barr, Gayle Hamilton, Lesley Hoggart,Alan Marsh, Cynthia Miller, Joan Phillips, Kathryn Ray, James A. Riccio,Sarah Rich and Sandra Vegeris
A report of research carried out on behalf of the Department for Work andPensions by a research consortium consisting of three British organisations (thePolicy Studies Institute, the Office for National Statistics and the Institute forFiscal Studies) and MDRC, a US-based non-profit social policy research firm,which is leading the consortium.

© Crown Copyright 2007. Published for the Department for Work and Pensionsunder licence from the Controller of Her Majesty’s Stationery Office by CorporateDocument Services, Leeds.
Application for reproduction should be made in writing to The Copyright Unit, HerMajesty’s Stationery Office, St Clements House, 2-16 Colegate, Norwich NR3 1BQ.
First Published 2007.
ISBN 978 1 84712 152 3
Views expressed in this report are not necessarily those of the Department for Workand Pensions or any other Government Department.
Printed by Corporate Document Services.
iiiContents
ContentsAcknowledgements ....................................................................................... xi
The Authors ................................................................................................ xiii
Glossary of terms .......................................................................................... xv
Abbreviations and acronyms ....................................................................... xvii
Summary ....................................................................................................... 1
1 Introduction ........................................................................................... 131.1 Introduction .................................................................................. 13
1.2 Policy background ......................................................................... 14
1.3 Research on retention and advancement in work........................... 16
1.4 Design of the ERA programme ...................................................... 17
1.5 The three target groups................................................................. 19
1.5.1 New Deal for Lone Parents ............................................... 19
1.5.2 New Deal 25 Plus............................................................. 20
1.5.3 Lone parents receiving Working Tax Credit ....................... 21
1.6 The ERA service model .................................................................. 21
1.6.1 Work-related services ....................................................... 23
1.6.2 Financial incentives .......................................................... 23
1.7 The random assignment design and the intake process.................. 24
1.8 Implementing ERA......................................................................... 26
1.8.1 The ERA sites ................................................................... 26
1.8.2 Technical Advisers ............................................................ 28
1.8.3 Timeline of ERA implementation ...................................... 28
1.9 The evaluation of ERA ................................................................... 29
1.10 The scope and coverage of this report ........................................... 30
iv Contents
2 Sample and sites ..................................................................................... 332.1 Introduction .................................................................................. 33
2.2 National economic context during the implementation of ERA ....... 33
2.2.1 Employment and unemployment trends ........................... 34
2.2.2 Benefits receipt trends ..................................................... 35
2.3 Site selection ................................................................................. 36
2.4 Local economic and demographic trends ....................................... 37
2.4.1 Population in the ERA districts ......................................... 39
2.4.2 Major industries ............................................................... 40
2.4.3 Unemployment in the ERA districts .................................. 40
2.4.4 Benefits receipt levels and trends ..................................... 41
2.4.5 Summary of economic and demographic trendsacross the districts ........................................................... 41
2.5 The research sample for this report ................................................ 42
2.5.1 Characteristics by target group......................................... 42
2.5.2 Characteristics in each district by target group.................. 45
2.6 Data sources ................................................................................. 47
2.7 Summary and conclusions ............................................................. 50
3 ERA implementation ............................................................................... 513.1 Introduction .................................................................................. 51
3.2 ERA implementation across the districts ......................................... 53
3.2.1 The target culture and the profile of ERA withinJobcentre Plus .................................................................. 54
3.2.2 Management and structure ............................................. 58
3.2.3 Staff support ................................................................... 60
3.3 Delivery of ERA: working with customers ....................................... 63
3.3.1 The ERA treatment: pre-employment support .................. 64
3.3.2 The ERA treatment: post-employment support ................. 67
3.3.3 Staff views on their new role and their ERA customers ..... 73
3.4 District differences ......................................................................... 76
3.5 Conclusions: implementation issues ............................................... 77
4 ERA participants’ recall of advice received and action taken toremain and advance in work ................................................................... 794.1 Introduction .................................................................................. 79
4.2 New Deal for Lone Parents ............................................................ 82
4.2.1 Overall contact with Jobcentre Plus .................................. 83
4.2.2 Help and advice received and steps taken while notin work ............................................................................ 83
vContents
4.2.3 Help and advice received and steps taken while in work ... 84
4.2.4 Achievement of training or education credentials ............. 88
4.2.5 Awareness and receipt of ERA employment retentionand training bonuses and other financial assistance ......... 88
4.2.6 District differences ........................................................... 90
4.2.7 Summary ......................................................................... 92
4.3 New Deal 25 Plus .......................................................................... 92
4.3.1 Overall contact with Jobcentre Plus .................................. 92
4.3.2 Help and advice received and steps taken whilenot in work...................................................................... 93
4.3.3 Help and advice received and steps takenwhile in work................................................................... 95
4.3.4 Achievement of training or education credentials ............. 96
4.3.5 Awareness and receipt of ERA employment retentionand training bonuses and other financial assistance ......... 96
4.3.6 District differences ........................................................... 97
4.3.7 Summary ......................................................................... 98
4.4 Lone parents receiving Working Tax Credit .................................. 100
4.4.1 Overall contact with Jobcentre Plus ................................ 100
4.4.2 Help and advice received and steps taken while notin work .......................................................................... 101
4.4.3 Help and advice received and steps taken while inwork.............................................................................. 103
4.4.4 Achievement of training or education credentials ........... 105
4.4.5 Awareness and receipt of ERA employment retentionand training bonuses and other financial assistance ....... 106
4.4.6 Summary ....................................................................... 107
4.5 Attitudes towards work and Jobcentre Plus staff .......................... 107
4.5.1 Attitudes towards work ................................................. 108
4.5.2 Attitudes towards Jobcentre Plus staff ............................ 108
4.6 Conclusions ................................................................................ 109
5 Impacts on employment, earnings, and benefits ................................... 1115.1 Introduction ................................................................................ 111
5.1.1 The expected early effect of ERA .................................... 112
5.1.2 An overview of the main findings .................................. 113
5.2 Findings for the New Deal for Lone Parents target group ............. 115
5.2.1 Employment and earnings for the NDLP control group:the counterfactual ......................................................... 115
5.2.2 Effects of ERA for the pooled NDLP sample acrossdistricts .......................................................................... 117
vi Contents
5.2.3 Effects of ERA on NDLP customers by district ................. 121
5.2.4 Effects of ERA for subgroups of NDLP customers ............ 127
5.3 Findings for the New Deal 25 Plus target group ........................... 128
5.3.1 Employment and earnings for the ND25+ control group:the counterfactual ......................................................... 128
5.3.2 Effects of ERA for the pooled ND25+ sample acrossdistricts .......................................................................... 129
5.3.3 Effects of ERA on ND25+ customers, by district .............. 133
5.3.4 Effects of ERA for subgroups of ND25+ customers ......... 140
5.4 Findings for the Working Tax Credit group .................................. 140
5.4.1 Effects of ERA on WTC customers inthe East Midlands .......................................................... 141
5.4.2 Effects of ERA on WTC customers in other districts ........ 146
5.4.3 Effects of ERA for the pooled WTC sample acrossdistricts .......................................................................... 149
5.5 Conclusions ................................................................................ 152
Appendix A Baseline characteristics of the programme and controlgroups ................................................................................. 153
Appendix B Implementation features of the six ERA districts .................... 155
Appendix C Selected assistance estimates for the programme group........ 159
Appendix D Help received and participation impacts ................................ 163
Appendix E Employment impacts from administrative records data .......... 183
Appendix F Subgroup analysis................................................................. 185
Appendix G Non-response analysis in the 12-month survey ...................... 193
Appendix H Survey respondent sample size, by district ............................. 207
References ................................................................................................. 209
List of tables
Table 1 ERA’s first-year impacts on New Deal customer groups’average total earnings, by district.............................................. 9
Table 1.1 Staff and services available to ERA (programme group) andnon-ERA (control group) customers ........................................ 22
Table 2.1 Population, unemployment rates, benefit receipt, andJobcentre Plus characteristics in the six ERA districts ................ 37
Table 2.2 Demographic profile of all customers randomly assignedbetween December 2003 and November 2004 ....................... 43
vii
Table 2.3 Selected characteristics of all customers by district at the timeof random assignment, December 2003 to November 2004 ... 46
Table 2.4 Data sources used for this report ............................................ 48Table 3.1 Selected responses from the January 2006 survey of ERA
ASAs ...................................................................................... 55Table 4.1 Advice/help received and participation in activities: summary
measures, New Deal for Lone Parents customers..................... 85Table 4.2 Advice/help received and participation in activities: summary
measures, New Deal 25 Plus customers .................................. 94Table 4.3 Advice/help received and participation in activities: summary
measures, Working Tax Credit customers – East Midlandsonly ...................................................................................... 102
Table 5.1 Effects of ERA on employment and earnings, New Deal forLone Parents customers ........................................................ 118
Table 5.2 Effects of ERA on benefit receipt, New Deal for Lone Parentscustomers............................................................................. 120
Table 5.3 Effects of ERA on employment, earnings, and benefit receipt,by district, New Deal for Lone Parents customers .................. 124
Table 5.4 Effects of ERA on employment and earnings,New Deal 25 Plus customers ................................................. 130
Table 5.5 Effects of ERA on benefit receipt, New Deal 25 Pluscustomers............................................................................. 132
Table 5.6 Effects of ERA on employment, earnings, andbenefit receipt, by district, New Deal 25 Plus customers ........ 136
Table 5.7 Effects of ERA on employment and earnings, Working TaxCredit customers – East Midlands ......................................... 142
Table 5.8 Effects of ERA on benefit receipt, Working Tax Creditcustomers – East Midlands.................................................... 145
Table 5.9 Effects of ERA on employment, earnings, andbenefit receipt, by district, Working Tax Credit customers ..... 146
Table 5.10 Effects of ERA on employment and earnings, Working TaxCredit customers .................................................................. 149
Table 5.11 Effects of ERA on benefit receipt, Working Tax Creditcustomers............................................................................. 151
Table A.1 Selected characteristics of members of the programme andcontrol groups at the time of random assignment, for thoserandomly assigned between December 2003 and November2004 .................................................................................... 153
Table B.1 Implementation features of the six ERA districts .................... 155Table C.1 Percentage of ERA programme group members who
received ERA support while out of work, by district ............... 159Table C.2 Among ERA programme group members who worked,
percentage who received ERA in-work assistance,by district ............................................................................. 160
Contents
viii
Table D.1 While not in work: advice/help received and participation inactivities, New Deal for Lone Parents customers .................... 163
Table D.2 While in work: advice/help received and participation inactivities, New Deal for Lone Parents customers .................... 165
Table D.3 While in work: advice/help received and participation inactivities, by district, New Deal for Lone Parents customers ... 166
Table D.4 While not in work: advice/help received and participation inactivities, New Deal 25 Plus customers .................................. 172
Table D.5 While in work: advice/help received and participation inactivities, New Deal 25 Plus customers .................................. 173
Table D.6 While in work: advice/help received and participation inactivities, by district, New Deal 25 Plus customers ................. 174
Table D.7 While not in work: advice/help received and participation inactivities, Working Tax Credit customers – East Midlandsonly ...................................................................................... 180
Table D.8 While in work: advice/help received and participation inactivities, Working Tax Credit customers – East Midlandsonly ...................................................................................... 181
Table E.1 Effect of ERA on number of months worked as recorded inadministrative records, by customer group ............................ 183
Table F.1 Benefit receipt impacts for ERA study enrollees:New Deal for Lone Parents customers ................................... 186
Table F.2 Benefit receipt impacts for ERA study enrollees:New Deal 25 Plus customers ................................................. 189
Table G.1 Survey response rates ........................................................... 196Table G.2 Comparison of impacts on the benefit receipt and
employment of the full sample and the respondent sample .. 197Table G.3 Comparison of the baseline characteristics of the sample,
New Deal for Lone Parents customers ................................... 198Table G.4 Comparison of the baseline characteristics of the sample,
New Deal 25 Plus customers ................................................. 200Table G.5 Comparison of the baseline characteristics of the sample,
Working Tax Credit customers .............................................. 202Table G.6 Treatment/control status as a predictor of survey response .... 204Table H.1 Survey respondent sample size, by customer group and
district .................................................................................. 207
Contents
ix
List of figures
Figure 1 ERA’s first-year impacts on average total earnings, bycustomer group ........................................................................ 8
Figure 2 ERA’s impacts on the likelihood of working full time at theend of year 1, by customer group ............................................. 9
Figure 3 ERA’s impacts on the likelihood of benefit receipt at theend of year 1, by customer group ........................................... 11
Figure 1.1 Random assignment process ................................................... 25Figure 1.2 Map of the six ERA districts .................................................... 27Figure 1.3 Timeline and national policy context of the ERA
demonstration, 2003 - 2006................................................... 29Figure 2.1 Timeline of collection and coverage of primary data used in
this report .............................................................................. 34Figure 2.2 Unemployment rate in the UK, 1999 through 2005 ................ 35Figure 2.3 Unemployment rate in the six ERA districts ............................. 41Figure 3.1 Percentage of ERA customers that reported awareness and
receipt of training and retention bonuses within 12 monthsof random assignment, by work status and target group ........ 66
Figure 3.2 Percentage of ERA customers that reported gettingemployment help or advice within 12 months of random ...........assignment, by work status and target group ......................... 72
Figure 4.1 Activities while in work, by district, New Deal for Lone Parentscustomers............................................................................... 91
Figure 4.2 Activities while in work, by district, New Deal 25 Pluscustomers............................................................................... 99
Figure 4.3 Activities while in work, by district, Working Tax Creditcustomers............................................................................. 104
Figure 5.1 Employment rates for the control group, New Deal for LoneParents customers ................................................................ 116
Figure 5.2 Effects of ERA on the percentage working full time at month12, New Deal for Lone Parents customers ............................. 121
Figure 5.3 Effects of ERA on earnings in year 1, New Deal for LoneParents customers ................................................................ 122
Figure 5.4 Effects of ERA on Income Support benefits received in year 1,New Deal for Lone Parents customers ................................... 123
Figure 5.5 Employment rates for the control group, New Deal 25 Pluscustomers............................................................................. 129
Figure 5.6 Effects of ERA on the percentage working full timeat month 12, New Deal 25 Plus customers ............................ 133
Figure 5.7 Effects of ERA on earnings in year 1,New Deal 25 Plus customers ................................................. 134
Figure 5.8 Effects of ERA on Jobseeker’s Allowance benefits receivedin year 1, New Deal 25 Plus customers .................................. 135
Contents
x
List of boxes
Box 1.1 Description of the US Employment and Retention andAdvancement project and the Work Advancement andSupport Centers demonstration .............................................. 19
Box 2.1 Local economic and demographic trends in the sixERA districts ........................................................................... 38
Box 3.1 Periods covered by data source ............................................... 52Box 4.1 How to read the tables in this report ...................................... 80Box 4.2 The activities of individuals while not in work.......................... 84Box 4.3 The activities of individuals while in work ................................ 87
Contents

xiAcknowledgements
AcknowledgementsMany people have contributed towards this research report. Particular thanks aredue to all members of the research sample who consented to be part of the study,many of whom also participated in the customer surveys; to the Jobcentre Plus staffwho shared their experiences in implementing Employment Retention andAdvancement (ERA) in individual and group interviews; and to the TechnicalAdvisers for their help in facilitating the research and for their own participation ininterviews. At the Department for Work and Pensions (DWP), we would like to thankthe ERA Project Team and the DWP Evaluation Team, including Jenny Carrino, JaneHall, Karl Olsen, Ellenor Brooks and Aisha Riaz. In addition, we want to thank theERA Evaluation Steering Group for their review of the report. Thank you also toKaren MacKinnon at the Policy Studies Institute for her work on ERA.
At MDRC, our thanks go to Gordon Berlin, Fred Doolittle, Sharon Rowser, and JohnHutchins, who provided insightful comments on previous drafts of the report, and toHoward Bloom and Charles Michalopoulos for statistical advice. Thanks also toElectra Small and Jared Smith for their work on data management and programming,to Tatiana Homonoff for her programming efforts, to Jeffrey Berman for productionassistance, to Diane Singer and Judy Betances for assistance in producing theexhibits, to Stephanie Cowell for preparing the report for publication, and toMargaret Bald for editing the report.


xiiiThe Authors
The AuthorsRichard Dorsett is a Principal Research Fellow and Head of Quantitative Research atthe Policy Studies Institute. He has directed a number of large-scale welfare-to-workevaluations and is currently leading the evaluations of Pathways to Work and NewDeal 25 Plus for the over-50s, the latter being a random assignment experiment.
Verity Campbell-Barr is a Research Officer at the Policy Studies Institute. She iscurrently involved in the qualitative evaluation of Employment Retention andAdvancement (ERA). Her research interests include the provision and consumptionof childcare, welfare to work, and young people’s perspectives on policy.
Gayle Hamilton is a Senior Fellow at MDRC. She has designed, implemented, anddirected numerous large-scale evaluations and demonstrations of programmesintended to improve the well-being of low-income populations. She is currentlydirecting a large national US study that is investigating various strategies for helpinglow-income workers retain and advance in their jobs, and is a researcher on the UKERA study.
Lesley Hoggart is a Senior Research Fellow at the Policy Studies Institute. She iscurrently managing the qualitative evaluation of ERA. Her research interests includewelfare-to-work, sexual health, teenage pregnancy, and young people’s perspectiveson social exclusion.
Alan Marsh is Professor of Social Policy at the University of Westminster and DeputyDirector of the Policy Studies Institute. His work on low-income families, theunemployed, and disabled people has contributed substantially to the developmentof welfare-to-work policies in the UK.
Cynthia Miller is an economist and Senior Research Associate at MDRC. Shecurrently serves as research director for a multi-site US project studying the effect ofjoining the workforce and human services systems to provide low-wage workerswith better access to financial work supports and services for career advancement.She is also a lead investigator on the UK ERA study and a similar study in the US.
xivxiv The Authors
Joan Phillips is currently a qualitative Research Fellow at the Policy Studies Institute.Since joining Policy Studies Institute, Joan has been involved in a number of researchprojects, including ERA. Her research interests centre on the experiences of genderand ethnicity on work, migration and sexuality.
Kathryn Ray is a Research Fellow at the Policy Studies Institute. Her researchinterests centre on parents’ labour market choices and work-life balance policies,and racisms, ethnicities and identities.
James A. Riccio is Director of MDRC’s Low-Wage Workers and Working CommunitiesPolicy Area and Project Director for the UK ERA evaluation.
Sarah Rich is a Research Analyst at MDRC. She has been involved in both theresearch and operations aspects of the UK ERA demonstration. She is alsoconducting qualitative research for several other projects centred on welfare andworkforce development issues.
Sandra Vegeris is a Senior Research Fellow at the Policy Studies Institute. She iscontributing to the process study and cost study strands of the ERA evaluation. Herresearch interests include labour market disadvantage and mixed-methodsapproaches to policy and evaluation research.
xvGlossary of terms
Glossary of termsAdvancement Support Employment specialist holding a positionAdviser (ASA) specifically created as part of ERA. These
individuals provide ERA participants withcontinuing advice and assistance intended tohelp them overcome obstacles to steadyemployment and find pathways to better jobopportunities and higher wages.
Employment Retention and A demonstration programme offering aAdvancement (ERA) combination of employment counsellingprogramme services and financial supports to certain
recipients of government benefits or loneparents claiming Working Tax Credit. Itspurpose is to help people stabilise and improvetheir work situations.
Income Support (IS) Benefit available to low-income adults workingless than 16 hours per week.
Jobcentre Plus The UK governmental institution, an agency ofthe Department for Work and Pensions, whichprovides help and advice on employment andtraining for people who can work and financialsupport for those of working age who cannot.
Jobseeker’s Allowance (JSA) Benefit available to unemployed individualswho are actively seeking work.
New Deal programme The UK’s main welfare-to-work initiative. NewDeal services include the development ofindividual action plans outlining customers’work goals, and job search assistance andtraining to help them achieve these goals.
xvi Glossary of terms
New Deal 25 Plus (ND25+) Mandatory New Deal programme that serveslonger-term unemployed people (mostly males)over the age of 25, specifically those who havebeen unemployed and receiving Jobseeker’sAllowance for at least 18 out of 21 months.
New Deal for Lone Parents Voluntary New Deal programme that serves(NDLP) lone parents (mostly females) who are in receipt
of Income Support.
Personal Adviser (PA) Employment specialists, working in JobcentrePlus offices, who provide job advice andassistance to New Deal customers who werenot randomly assigned to the ERA programmegroup.
Post-Employment Team (PET) A group of Advancement Support Adviserswhose sole task in the ERA programme is towork with in-work customers.
Technical Adviser (TA) Staff position specifically created as part ofERA. These individuals, posted in each ERAdistrict, ensure that ERA services are deliveredin accordance with the policy design andprovide general support for the evaluationeffort.
Working Tax Credit (WTC) Lone parents working less than 30 hours perweek are eligible to receive this credit.
xviiAbbreviations and acronyms
Abbreviations and acronymsADF Adviser Discretion Fund
ASA Advancement Support Adviser
CTC Child Tax Credit
DWP Department for Work and Pensions
EDF Emergency Discretion Fund
ERA Employment Retention and Advancementprogramme
FACS Families and Children Society
FC Family Credit
FIS Family Income Supplement
GCSE General Certificate of Secondary Education
GMS Generalised Matching Service
HB Housing Benefit
IAP Intensive Activity Period
IB Incapacity Benefit
IS Income Support
JSA Jobseeker’s Allowance
JUVOS Joint Unemployment and Vacancies OperatingSystem
ND25+ New Deal 25 Plus

xviii
NDLP New Deal for Lone Parents
PA Personal Adviser
PET Post-Employment Team
TA Technical Adviser
US United States
WASC Work Advancement and Support Centers
WFTC Working Families’ Tax Credit
WPLS Work and Pensions Longitudinal Study
WTC Working Tax Credit
Abbreviations and acronyms
1Summary
Summary
Introduction
This report presents findings on the implementation and early effects of Britain’sEmployment Retention and Advancement (ERA) demonstration, which is beingcarefully evaluated though a large-scale randomised control trial. Aimed at helpinglow-income individuals sustain employment and progress in work, ERA is distinguishedby a combination of job coaching and financial incentives that it offers toparticipants once they are working. It is administered by Jobcentre Plus in six regionsof the country: East Midlands, London, North East England, North West England,Scotland, and Wales. At the present time, there is no government commitment tooperate ERA on a national basis. A decision on whether to do so is to be informed bylong-term evidence on the project’s effectiveness.
The current report addresses three main questions: First, how well have the districtsimplemented the ERA model, particularly its extended job coaching and financialincentives for customers who enter work? Second, as a result of ERA, did customersreceive substantially more advice and assistance from Jobcentre Plus to help themsucceed once in work, and were they more likely to have combined work andtraining activities? And third, has ERA begun to produce any improvement incustomers’ employment and earnings and any reductions in their reliance ongovernment benefits?
The initial results, covering individuals’ first 12 months after they began the ERAprogramme, are encouraging. Despite the districts’ early difficulties in operating theprogramme, and although not all customer groups in all districts have benefitedfrom it so far, ERA has had a number of positive effects. Across various types ofpeople and places, it has increased the receipt of services and training for workingcustomers, increased participants’ average earnings, and produced some reductionsin their benefit receipt. Still, it is much too soon to draw firm conclusions about ERA’seffectiveness. Progression in work is a gradual process that can take several years tounfold. Furthermore, many ERA customers were just entering work during the firstfollow-up year or were still preparing for jobs, and none could yet have taken full
2 Summary
advantage of the programme’s offer of up to two years of in-work guidance andincentives.
The Department for Work and Pensions (DWP), working with Jobcentre Plus staff ineach of the study districts, is managing the overall implementation of ERA and isoverseeing the evaluation. The study is being conducted by a research consortiumthat includes the Policy Studies Institute, the Institute for Fiscal Studies, the Office forNational Statistics, and MDRC (a New York City-based research organisationexperienced in conducting large-scale random assignment tests of new socialpolicies).
What is ERA?
Launched in 2003, ERA was envisioned as a ‘next step’ in British welfare-to-workpolicies. A centrepiece of those policies is the New Deal programme, which offersjob placement help from a Personal Adviser (PA) and other pre-employmentassistance to out-of-work recipients of government benefits. The New Dealprogramme is operated by Jobcentre Plus, a network of government offices thatadminister cash benefits and employment services. To the existing pre-employmentNew Deal services ERA adds a new set of financial incentives and job coachingfollowing customers’ entry into work. It is aimed at three groups that have difficultygetting and keeping full-time work or advancing to more secure and better-paidpositions:
1 lone parents (mostly women) who receive Income Support (IS) and volunteerfor the New Deal for Lone Parents (NDLP) programme;
2 longer-term unemployed people over the age of 25 (mostly men) who receiveJobseeker’s Allowance (JSA) and are mandated to enter the New Deal 25 Plus(ND25+) programme; and
3 lone parents who are already working part-time (between 16 and 29 hours aweek) and are receiving Working Tax Credit (WTC).
For the two New Deal customer groups, ERA begins with job placement and otherpre-employment assistance, largely following the same procedures as the regularNew Deal programme. This assistance is expected to last up to nine months. Theprogramme then continues into a unique two-year post-employment or ‘in-work’phase. During that phase, ERA’s job coaches, known as Advancement SupportAdvisers (ASAs), aim to help customers avoid some of the early pitfalls thatsometimes cause new jobs to be short-lived, and to help them advance to positionsof greater job security and better pay and conditions – at their current employer or anew one. ERA also offers special cash incentives and other resources to promotethese goals, including:
3
• an employment retention bonus of £400 three times a year for two years forstaying in full-time work (at least 30 hours per week for 13 out of every 17weeks, which is about 75 per cent of the time);
• training tuition assistance (up to £1,000) and a bonus (also up to £1,000) forcompleting training while employed; and
• access to emergency payments to overcome short-term barriers to staying inwork.
Members of the WTC group, who are already working when they enter ERA, beginimmediately with the post-employment phase. They are offered the same forms ofin-work support and incentives, plus help getting re-employed if they leave their jobsor their jobs end.
The random assignment process
Qualifying members of the three target groups were invited to volunteer for ERA.Because the number of available slots in this programme was limited, assignment toERA was made through a lottery-like process of random assignment. After completingan informed consent process, half of the volunteers were assigned to the ERAprogramme group, and the remainder to a control group. Individuals assigned to thecontrol group could continue to receive whatever provisions they were normallyentitled to receive from Jobcentre Plus. Thus, controls in the two New Deal customergroups went on to receive regular New Deal pre-employment services. In contrast,controls in the WTC customer group, who would not normally enter the New Dealprogramme because they were not receiving IS or JSA, were not offered any specialservices or incentives. However, as always, they could seek other services or trainingon their own.
For all three groups, the success of ERA is determined by comparing the outcomes ofthe programme group (e.g. future average earnings) with the outcomes of thecontrol group. Because of random assignment, any statistically significant differencein these outcomes can be attributed with confidence to ERA. Such differences arereferred to here as the programme’s effects, or ‘impacts’.
Intake into the study began in October 2003 and continued through the end of2004 for most customers; it was completed for all by early 2005. Over 16,000 peoplewere randomly assigned through this process, making this study one of the largestrandomised social policy trials ever undertaken in Britain. It is also important to notethat although all six districts recruited WTC customers, only the East Midlandsmanaged to enrol an adequate number to support a reliable district-specific analysisfor this target group. In this report, the analysis of the WTC group focuses primarilyon those in the East Midlands.
This report uses data from a first-wave customer survey of over 6,000 respondentsthat covers the experiences of the programme group and the control group during
Summary
4
the first 12 months following individuals’ date of random assignment, with mostinterviews occurring from December 2004 to November 2005. It also examines dataon employment and benefits receipt from administrative records.1 To provide aricher understanding of the experience of implementing ERA, the report draws oninformation from qualitative field research on ERA programme operations coveringa longer period – from the initiative’s inception to mid-2006 – and data from specialsurveys of Jobcentre Plus staff.
ERA implementation and customers’ receipt of in-workassistance• Because the normal organisational culture of Jobcentre Plus focused so
strongly on meeting job entry targets, it was challenging to re-orientthe ERA staff to focus on employment retention and advancement.
Implementing the ERA programme within Jobcentre Plus offices required thedistricts and DWP to address a number of critical organisational issues. Theseincluded: (1) training frontline staff for the newly created role of ASA, whose jobcoaching responsibilities continue for two years after customers become employed;(2) contending with a powerful Jobcentre Plus job entry targeting system that madeit difficult, early on, for ERA staff to earn recognition for their post-employment jobcoaching; and (3) equipping ERA supervisors to manage against a new set ofemployment objectives focused on retention and advancement – outcomes forwhich ‘success’ is not nearly as easy to achieve, or even to define, as placing peoplein jobs. The struggle to address these organisational challenges meant thatimplementing the full vision behind the ERA model would be an evolving process.
DWP had provided the districts with additional resources to pay for extra staff so thatthey could operate ERA without undermining their ability to meet their demandingjob entry targets. Initially, however, these resources were not used by the districtsexclusively for ERA, and, consequently, the job coaching that ERA was expected toprovide after customers entered work was generally not well executed during theprogramme’s first year of operation. Most attention remained focused on meetingjob entry targets, with too little effort expended on ERA’s goals of sustainability andprogression in work. This prompted DWP to initiate a number of corrective actions.Among these were the institution of stricter DWP guidelines and accountabilitymechanisms for ‘ring-fencing’ ERA funds from 2005, plus new approaches totraining frontline staff and their managers.
Summary
1 Administrative records data on the full sample of over 16,000 people will beanalysed in future reports.
5
• During the first year, ERA staff ensured that most programme customerswere aware of the employment retention bonus, but they were lesssuccessful in building awareness of the training incentive and insupporting job progression.
When interviewed 12 months after entering the study, most ERA customers (70 percent to 80 per cent, depending on the customer group) said they knew about theemployment retention bonus. Roughly 20 per cent had already received a bonuspayment during that first follow-up year (which required finding and then sustainingfull-time work for at least four months). Awareness and use of the incentives forcompleting a training course while in work were much lower, especially among thetwo New Deal groups, roughly half of whom recalled this programme feature. Thissuggests the need for a better information marketing effort by staff, especially of thetraining bonus. However, among customers in the WTC group, most knew aboutthe training incentive, and a sizeable share of them (21 per cent of those in the EastMidlands) received the in-work training completion bonus. Qualitative data suggestthat the training incentive was an important part of ERA’s appeal for many WTCcustomers. In contrast, among the New Deal customers, finding a job was theimmediate focus after entering the programme, and this may help explain why theywere less likely to recall the incentive for participating in training courses while inwork.
• Despite ERA’s early implementation difficulties, ERA customers overallwere more likely than the control group to get help or advice fromJobcentre Plus staff on progressing in work.
Among New Deal ERA customers, roughly half of those who got jobs within the firstfollow-up year said that, while in work, they received help or advice from JobcentrePlus (meaning primarily the ERA programme) that was related to staying employedor advancing. Although this rate is noteworthy, and although the rate was higher forthe WTC group, the fact that so many working customers did not report receivingin-work assistance indicates that considerable room remained for improving thedelivery of this important feature of ERA.
Nonetheless, ERA customers did receive more in-work support than the controlgroup, as intended by the programme design. First, consider that among all NDLPand ND25+ controls, 62 per cent and 49 per cent, respectively, had worked duringthe first 12 months after entering the study. Then consider that only 15 per cent and12 per cent, respectively, of all controls both worked and got any advancement-related help or advice while in work. (Among the controls, post-employment helpfrom Jobcentre Plus staff was likely to have been obtained through customer-initiated, informal interactions, since this was not a funded element of the regularNew Deal programme.) Against these benchmarks, ERA made a difference. As aresult of its more deliberate focus on in-work assistance, ERA increased the rate ofreceiving in-work help or advice among the NDLP customers to 36 per cent of theprogramme group, reflecting a gain of 21 percentage points over the control grouprate. For the ND25+ customers, it increased the rate to over 22 per cent of the
Summary
6
programme group, for a gain of almost 11 percentage points over the control grouprate. Among the WTC customers (in East Midlands), who were already employedand not involved with Jobcentre Plus when they came to ERA, the increasegenerated by ERA in the proportion of customers who got in-work help or advicewas much larger. Eighty-five per cent of the programme group received in-workhelp or advice, compared with only 22 per cent of the controls – an increase of 63percentage points. (All of these differences are statistically significant.)
• ERA customers – especially WTC lone parents – were more likely thanthe control group to combine education or training with employment.
Among the East Midlands WTC target group, 58 per cent of those assigned to ERAcombined training or education with work during the first year, compared withabout 45 per cent among the control group, for a statistically significant increase of14 percentage points. This difference may have been a response to ERA’s offer of thein-work training bonus and staff help in finding or enrolling in an appropriatecourse. The absolute differences were smaller, though still statistically significant,for the two New Deal customer groups, among whom employment rates werelower during the first year after entering the study, as previously noted. For NDLPcustomers (with all districts combined), ERA increased the likelihood of combiningwork and training to 21 per cent, an increase of five percentage points over thecontrol group rate of 16 per cent. Among ND25+ customers, 11 per cent of the ERAgroup combined work and training, which is three percentage points more than thecontrol group rate of eight per cent.
• By the second year of operations, the six districts substantially improvedtheir delivery of advancement-related services, demonstrating moreclearly the feasibility of operating ERA as a Jobcentre Plus initiative.
The evaluation’s qualitative field research, which, for this report, covers programmeimplementation through spring 2006, shows that ERA operations grew strongerover time. The turning point came in mid- to late 2005 (near the end of the periodcovered by the customer survey, the main source of data for determining the effectof the intervention in this report). The districts’ focus on in-work services steadilyincreased and improved in quality as more participants entered work, as frontlinestaff and managers acquired more training, and as ERA resources were morecarefully ring-fenced. ERA staff increasingly accommodated customers’ workingschedules by contacting them outside normal Jobcentre Plus work hours, and oftenaway from the Jobcentre Plus offices. They also tried to re-engage those who haddrifted away from the programme, and they were better prepared to offersubstantive advancement-related help and advice. Many Jobcentre Plus staff whobecame ERA ASAs came to embrace their new role with considerable enthusiasm,especially where management support for ERA was strong, and reported quite highlevels of job satisfaction in a special staff survey administered in January 2006.
Since these improvements most fully took hold after the period covered by the12-month survey for most sample members, that survey could not fully capture the
Summary
7
effects that those improvements may have had on customers’ receipt of ERA servicesand incentives, or on ERA’s labour market and benefit outcomes. At the same time,it should be recognised that keeping working customers engaged in the programmeand supporting their efforts to progress in work was a persistent challenge.
ERA’s impacts on work, earnings, and benefits
The random assignment design for the ERA evaluation was well executed andmakes it possible to provide highly credible estimates of the programme’s impactson important customer outcomes, which will be tracked over several years. Theresults available so far offer only a first look, with one year of follow-up data, atwhether the programme is achieving its aims.
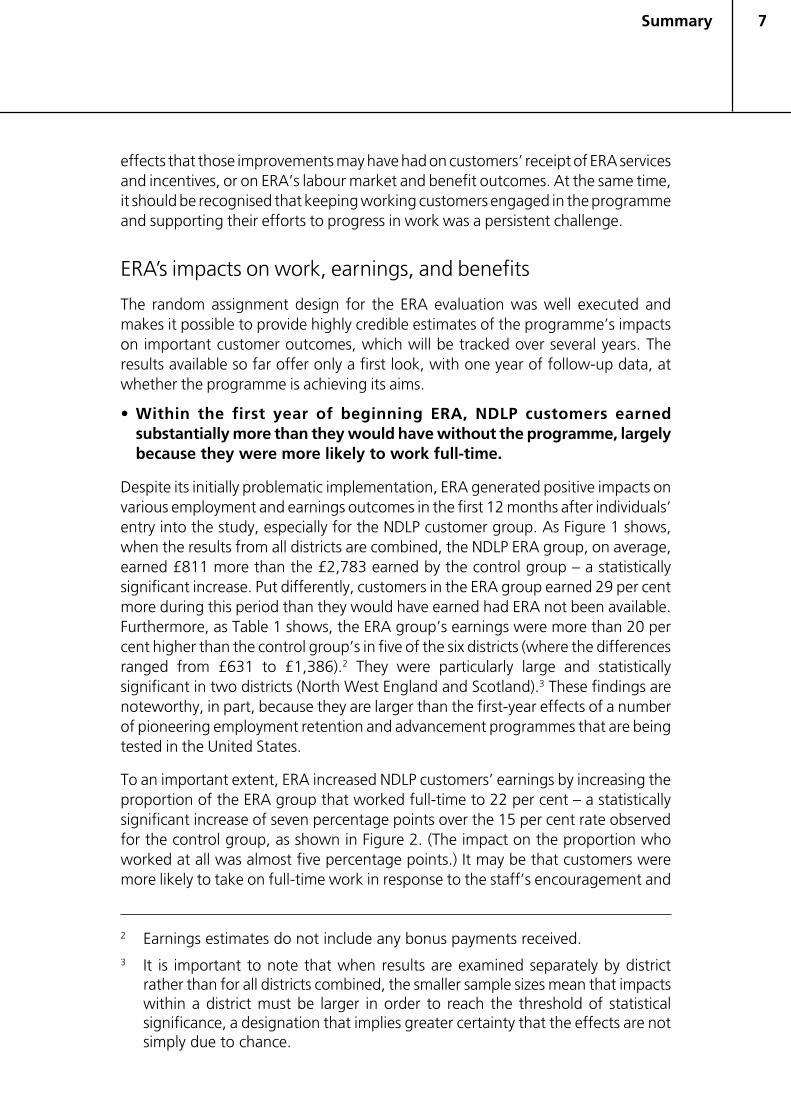
• Within the first year of beginning ERA, NDLP customers earnedsubstantially more than they would have without the programme, largelybecause they were more likely to work full-time.
Despite its initially problematic implementation, ERA generated positive impacts onvarious employment and earnings outcomes in the first 12 months after individuals’entry into the study, especially for the NDLP customer group. As Figure 1 shows,when the results from all districts are combined, the NDLP ERA group, on average,earned £811 more than the £2,783 earned by the control group – a statisticallysignificant increase. Put differently, customers in the ERA group earned 29 per centmore during this period than they would have earned had ERA not been available.Furthermore, as Table 1 shows, the ERA group’s earnings were more than 20 percent higher than the control group’s in five of the six districts (where the differencesranged from £631 to £1,386).2 They were particularly large and statisticallysignificant in two districts (North West England and Scotland).3 These findings arenoteworthy, in part, because they are larger than the first-year effects of a numberof pioneering employment retention and advancement programmes that are beingtested in the United States.
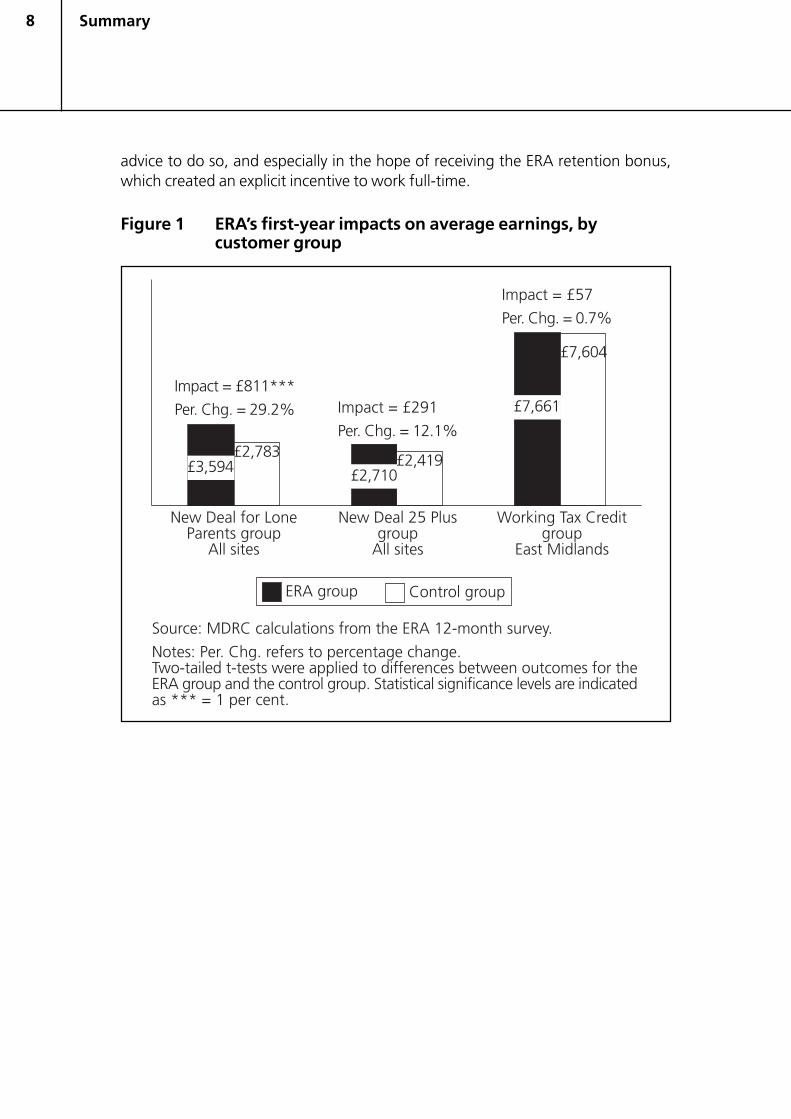
To an important extent, ERA increased NDLP customers’ earnings by increasing theproportion of the ERA group that worked full-time to 22 per cent – a statisticallysignificant increase of seven percentage points over the 15 per cent rate observedfor the control group, as shown in Figure 2. (The impact on the proportion whoworked at all was almost five percentage points.) It may be that customers weremore likely to take on full-time work in response to the staff’s encouragement and
Summary
2 Earnings estimates do not include any bonus payments received.3 It is important to note that when results are examined separately by district
rather than for all districts combined, the smaller sample sizes mean that impactswithin a district must be larger in order to reach the threshold of statisticalsignificance, a designation that implies greater certainty that the effects are notsimply due to chance.
8
advice to do so, and especially in the hope of receiving the ERA retention bonus,which created an explicit incentive to work full-time.
Figure 1 ERA’s first-year impacts on average earnings, bycustomer group
Summary
9
Table 1 ERA’s first-year impacts on New Deal customer groups’average total earnings, by district
North NorthEast East West
Group and measure Midlands London England England Scotland Wales
New Deal for Lone Parents
ERA group (£) 2,879 3,609 3,326 3,853 4,175 3,652
Control group (£) 2,736 2,869 2,695 2,467 3,173 3,004
Earnings difference (impact) (£) 142 740 631 1,386 *** 1,002 ** 648
Percentage change (%) 5.2 25.8 23.4 56.2 31.6 21.6
New Deal 25 Plus
ERA group (£) 3,347 2,507 3,131 2,468 2,475 2,159
Control group (£) 2,456 1,782 2,955 1,908 2,245 3,172
Earnings difference (impact) (£) 891 ** 725 177 560 230 -1,013*
Percentage change (%) 36.3 40.7 6.0 29.3 10.2 -31.9
Source: MDRC calculations from the ERA 12-month survey.
Notes: Two-tailed t-tests were applied to differences between outcomes for the ERA group andthe control group. Statistical significance levels are indicated as: * = 10 per cent; ** = 5 per centand *** = 1 per cent.
Figure 2 ERA’s impacts on the likelihood of working full-time atthe end of year 1, by customer group
Summary
10
• ERA’s first-year impacts on earnings were smaller, more mixed, and lesscertain for the ND25+ customer group than for the NDLP group.
Among the long-term unemployed ND 25+ group, made up mostly of adult men,ERA’s earnings effect during the first 12 months of follow-up is estimated to be £291– a 12 per cent increase over the control group average of £2,419. However, thisdifference is not statistically significant, meaning that there is less assurance that it isnot due to chance. At the same time, the pattern of results is positive across alldistricts except Wales, measuring £177 to £891 per person, with the difference inone district (East Midlands) reaching statistical significance. (See Table 1.) AlthoughERA had no effect on the employment rate of ND25+ customers for all districtscombined, it did produce a small but statistically significant increase in their averagenumber of hours worked per week by the last month of the 12-month follow-upperiod.
Included in the all-district average for the ND25+ group is a large (and statisticallysignificant) negative impact on earnings detected in Wales. The reason for thisanomalous result cannot be established with certainty. However, part of it may haveto do with particular administrative problems that may have caused the ERA ND25+group in Wales to receive a delayed and weaker set of New Deal pre-employmentservices than they normally would have received.4 The negative result does notappear to stem from ERA’s distinctive in-work strategies.
• ERA did not substantially increase first-year earnings among the WTClone parent group, although it did increase their likelihood of workingfull-time by the end of that period.
The best opportunity for estimating ERA’s impacts on the WTC lone parent group ispresented by the East Midlands district, which, as previously noted, was the onlydistrict to recruit a substantial number of such customers. It will be recalled that WTCcustomers were already working part-time when they entered ERA (which is whythey had much higher cumulative earnings during the first year than the othercustomer groups, as shown in Figure 1). In the East Midlands district, nearly 28 percent of the ERA group were working full-time at the time of the 12-month survey, fora statistically significant increase of ten percentage points over the 18 per cent ratefor the control group (see Figure 2). However, this increase had not yet translatedinto a substantial earnings gain – for reasons that are not yet entirely clear and arestill being investigated.
4 For example, in a pattern that was not intended by the ERA programme design,customer caseloads for the New Deal job placement staff serving the ERA groupwere much higher than for those serving the control group, allowing the controlsto receive more intensive pre-employment assistance. This factor, plus certainother unintended hurdles in getting the programme group through the variousstages of the New Deal programme, may help explain why the control groupentered work more quickly and accumulated more earnings during the firstfollow-up year than the ERA group.
Summary
11
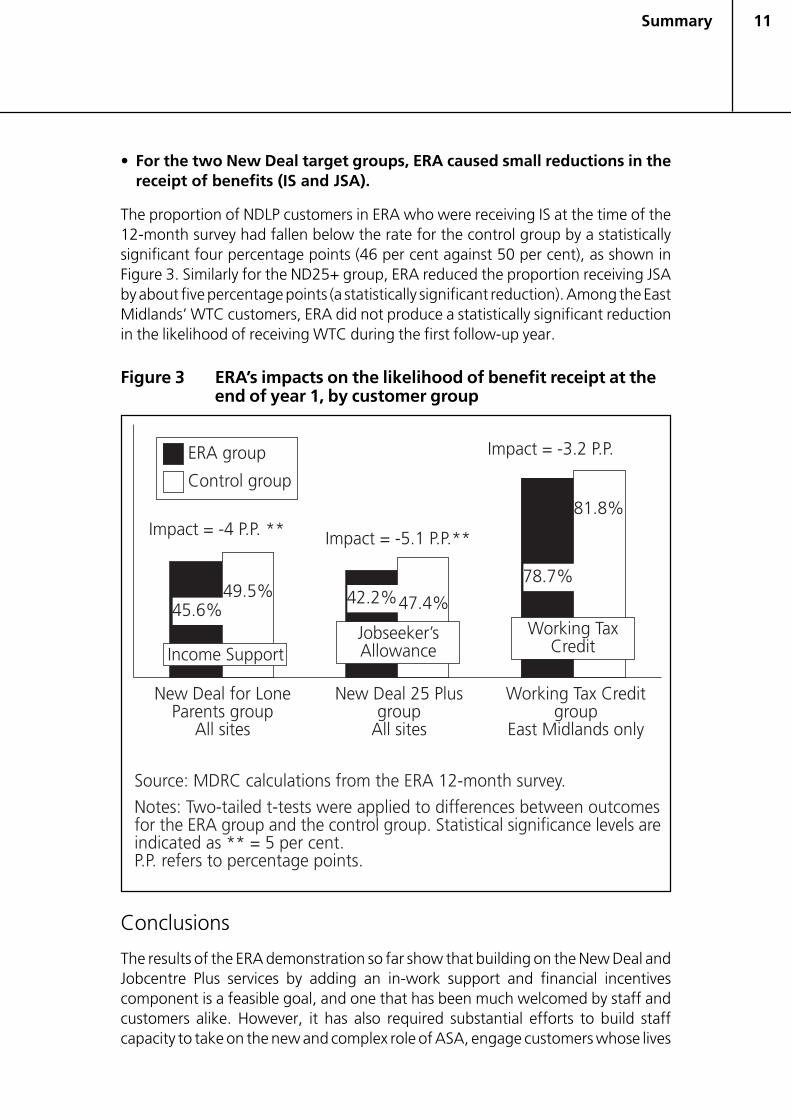
• For the two New Deal target groups, ERA caused small reductions in thereceipt of benefits (IS and JSA).
The proportion of NDLP customers in ERA who were receiving IS at the time of the12-month survey had fallen below the rate for the control group by a statisticallysignificant four percentage points (46 per cent against 50 per cent), as shown inFigure 3. Similarly for the ND25+ group, ERA reduced the proportion receiving JSAby about five percentage points (a statistically significant reduction). Among the EastMidlands’ WTC customers, ERA did not produce a statistically significant reductionin the likelihood of receiving WTC during the first follow-up year.
Figure 3 ERA’s impacts on the likelihood of benefit receipt at theend of year 1, by customer group
Conclusions
The results of the ERA demonstration so far show that building on the New Deal andJobcentre Plus services by adding an in-work support and financial incentivescomponent is a feasible goal, and one that has been much welcomed by staff andcustomers alike. However, it has also required substantial efforts to build staffcapacity to take on the new and complex role of ASA, engage customers whose lives
Summary
12
get busier once they enter work, and to contend with a Jobcentre Plus culture thatmainly rewards job placement. Early on, doubts were raised about how well the ERAdesign would be realised in practice. Since that time, much progress has been made.Although room for improvement remains, the districts were able to deliver aconsiderably stronger ERA intervention as time went on. Much of that improvementoccurred after the period covered by the 12-month survey, which is the foundationfor this report’s impact analysis. Whether the encouraging early effects of theprogramme continue to grow as a results of those improvements will be discussed infuture reports, including a report on ERA’s two-year impacts scheduled for early2008.
Summary
13Introduction
1 Introduction
1.1 Introduction
This report discusses the implementation and early results of the UK EmploymentRetention and Advancement (ERA) demonstration, a programme designed to test amethod of improving unemployed individuals’ and low-paid workers’ labourmarket prospects. It targets three groups: unemployed lone parents receivinggovernment benefits, long-term unemployed individuals receiving benefits, andlow-paid employed lone parents receiving tax credits to supplement their families’income. The ERA programme attempts to go beyond the typical services offered tothese groups to help participants retain and advance in work. In addition to jobplacement and assistance, it offers job coaching to support customers while they arein work and financial incentives designed to encourage job retention and take-up oftraining opportunities while they are employed.
The programme is being implemented in six regions across the UK. Its effectivenessis being evaluated using a random assignment research design. Eligible participantsin these regions were randomly assigned to a programme group, which is offeredthe new ERA services, or to a control group, which is not. By comparing outcomessuch as the employment, earnings, and benefits receipt patterns of the programmegroup with those of the control group, the evaluation will indicate the extent towhich ERA achieved its core goals.
The UK Department for Work and Pensions (DWP) is managing the overallimplementation of ERA and is overseeing the evaluation. A research consortiumheaded by MDRC (headquartered in New York City), and including the PolicyStudies Institute (PSI), the Institute for Fiscal Studies, and the Office for NationalStatistics, is conducting the study.
This introductory chapter, much of which is drawn from earlier reports on ERA (Hallet al., 2004; Hoggart et al., 2006; Walker, Hoggart, and Hamilton, 2006), explainsthe policy background to ERA and reviews the literature previously published onretention and advancement; describes the groups’ ERA targets, the service deliverymodel, and the random assignment design; and explains the various methods thatwill be used to evaluate the programme.
14 Introduction
This report describes, in full, the implementation of the programme and its earlyeffects (or ‘impacts’) during customers’ first year after entering the study. Theimplementation analysis discusses the evolution of the programme over time,whether it was operated as envisioned in the design, and the major challenges facedin putting it into practice. The impact analysis examines the programme’s effects onindividuals’ service receipt, employment, earnings, and benefits receipt over a12-month follow-up period by comparing these outcomes for the programmegroup with those of the control group.
The findings presented in later reports may show different results. This 12-monthfollow-up period is relatively short for an intervention focused on long-termemployment goals. The ERA service period is significantly longer than one year, andits services are designed to encourage customers to take steps that will improve theirlonger-term outcomes. The delivery of ERA services also evolved significantly overtime, and the services that customers received during the later periods, as theprogramme matured, will not be reflected in the early period covered in this report.A report on the programme’s two-year impacts will be published in 2008, andlonger-term follow-up may be conducted, with the results published in later reports.
1.2 Policy background
ERA was envisioned as a next step in Britain’s ‘welfare-to-work’ policy, which hasbeen evolving since the early 1970s, when the government began instituting wagesupplementation policies to help families with children overcome the cycle ofunemployment and in-work poverty. Increasingly generous out-of-work benefitsand falling tax thresholds had left many families with only a small differencebetween their incomes in or out of work.5 The Family Income Supplement (FIS), anin-work benefit available to families with children, was introduced in 1971 toincrease the value of working. This benefit remained in place for 17 years, markingthe start of a strong British commitment to wage supplementation. In 1988, theFamily Credit (FC) was instituted to improve upon the FIS. It offered higher rates ofin-work benefit and lower qualifying hours. The FC remained in place for about 13years.
In 1997, facing a quarter to a third of children living in poverty – a rate that hadtripled between 1979 and 1995 – and over half of lone parents still out of work, thenewly elected Labour Government made two important pledges:
• to halve the child poverty rate by 2010, and to eliminate child poverty by 2020;and
• to get 70 per cent of lone parents into paid work for at least some hours eachweek by 2010.
5 An administrative device called the ‘wage stop’ prevented families from receivingmore in benefit than they had had in wages, but did not count in-work expensessuch as travel.
15
The policies that have ensued – particularly those directed at lone parents – werelargely aimed at meeting these goals.
Beginning in 1999, the government shifted in-work financial support from thebenefits system to the tax system. Tax credits are designed to ‘make work pay’ byproviding enough incentive to work while meeting the increasing challenge ofkeeping low-paid workers’ standards of living in sync with those of the workingmajority who have higher earnings. In 1999, the government introduced theWorking Families’ Tax Credit (WFTC), which offered more generous wagesupplements, as well as a credit to help cover the cost of childcare. It was alsounderpinned by the National Minimum Wage, which took effect in the same year. In2003, the WFTC was replaced by the Working Tax Credit (WTC), which was the firstmajor tax credit also available to working individuals without children, and the ChildTax Credit (CTC), which simplifies support for families with children so that parentshave a clearer idea of how much they can expect to receive.
Tax credits remain a primary policy instrument to combat child poverty, as they aimto increase parents’ incentives to become and remain employed. The Labouradministration’s welfare-to-work policy also included two other major components:
• Active case management delivered through the New Deal, or welfare-to-work,programmes. The programmes include mandatory requirements for long-termunemployed people to actively seek work, as well as increased access for loneparents to work-focused advice and encouragement. These services are deliveredthrough Jobcentre Plus, Britain’s public benefits and workforce developmentsystem.
• New services such as Sure Start, a programme designed to improve earlyeducation, and the National Childcare Strategy, which focuses on improving thequality, accessibility, and affordability of childcare.
Evaluative research on these aspects of the welfare-to-work strategy has beenbroadly supportive of the policies. Research showed that the FC drew more loneparents into work, particularly by fitting short-hours jobs around school hours.Reports of the effectiveness of FC led to a strengthening of these provisions underthe new tax credit rules. One report estimated that the introduction of tax creditsboosted lone parents’ employment by almost five percentage points, comparedwith the FC regime (Brewer, Clark, and Myck, 2001). There is also evidence thathigher payments under the tax credit strategy met needs that FC had notsuccessfully addressed (Vegeris and Perry, 2003).
Nonetheless, there was growing concern about the sustainability of the low-wagepositions that long-term unemployed people and lone parents often take, and theirpotential for income growth. For example, the New Deal programmes focus on jobplacement, but offer only limited, if any, in-work support to help customers retainand advance in their work.
Introduction
16
ERA builds on the successes of the tax credits and the New Deal services, but shiftsthe focus of service delivery towards sustaining and progressing in employment, inaddition to job placement. The ERA programme offers both pre-employment and in-work support to assist low-wage and unemployed individuals in maintaining full-time, steady jobs with better working conditions, at the same time helping them toleave the cycle of relying on government benefits.
ERA’s policy relevance has grown since its design was conceived. A paper publishedby DWP in mid-2004 emphasises the continuing importance of targeting servicestowards lone parents and delivering case management services tailored to individualneeds (DWP, 2004). Another paper published in October 2005, acknowledgesspecifically the importance of retention and progression in work, in addition to jobplacement, as the next stage in welfare reform (DWP, 2005). In October 2006, apaper discussing the importance of both pre-employment and in-work supportexplicitly recommended rolling out ERA nationally, should the evaluation find it to besuccessful (Harker, 2006). In December 2006, the final report of the Leitch Review ofSkills, which considers the UK’s long-term skills needs, signalled the importance offocusing on sustainability and progression in work and called attention to the ERAproject (HM Treasury, 2006).
1.3 Research on retention and advancement in work
A literature review conducted prior to the start of the demonstration found that,although some research existed about low-wage workers’ retention and advancementin work, as described in this section, relatively little was known, especially for peoplerecently on benefits (Morris et al., 2003). Nonetheless, job retention and advancementare important concerns for a significant portion of the labour force. While aboutnine out of ten workers remain in work steadily (Young, 2001), recurringunemployment and lack of advancement are common among disadvantaged andlow-paid workers. Many become entrenched in a ‘low-pay/no-pay cycle,’ in whichthey shift repeatedly between low-wage work and unemployment. Often theseindividuals seek government benefits to supplement their income.
Individuals who struggle to retain employment and advance in work, frequently facea multitude of barriers to finding and keeping well-paid jobs. Many have loweducation levels and/or have difficulty accessing transportation. Some live in socialhousing (housing owned by local government or a private housing association).Some are also in poor health; studies of large samples of longer-term unemployedpeople have found that, although many are not disabled enough to be eligible fordisability benefits, they nonetheless have health conditions that make it difficult toretain steady work. In addition, frequent cycling between work and benefits mayhave a ‘scarring’ effect, as individuals who spend more than a few weeksunemployed have been shown to experience chronic difficulty in re-establishingthemselves in the labour market (Arulampalam et al., 2001).
Introduction
17
The literature on job retention indicates that the reasons that low-wage workersleave employment vary. They sometimes work under short-term contracts, whichare often undertaken involuntarily when the labour market seems to offer few otheropportunities. However, there is also evidence that many leave work voluntarily.Some low-wage workers indicate a disconnect between the types of jobs they feelable to do and the types of jobs they get. Many of those who return to Jobseeker’sAllowance (JSA) (cash benefits available in Britain to unemployed individuals activelyseeking work) say simply that the job did not suit them. In addition, the literaturesuggests that individuals’ barriers to employment often persist after they areemployed, and that new barriers to work can arise that push some new workers toleave their jobs. Many lone parents who return to Income Support (IS) (benefitsavailable to low-income adults who are not working or work less than 16 hours perweek) cite ‘voluntary’ reasons for leaving work. These reasons can include, forexample, unexpected problems with the cost and reliability of childcare andtransport, difficulties balancing work and childcare responsibilities, and employerswho are unwilling to accommodate employees’ family responsibilities.
There is also a growing concern regarding low-wage workers’ prospects foradvancement. Wage inequality in the UK has risen since the 1980s (Machin, 1999),while wage mobility has declined (Dickens, 2000b; Stewart and Swaffield, 1999).These trends indicate that low-wage workers are largely not moving into better jobs.Low-paid jobs are generally at a junior level and do not require high skills, are oftenpart-time or temporary, and frequently offer few opportunities for training (Dickens,2000a). Conditions such as these often present barriers to advancing in work.Research also shows that employees earning the lowest wages and whose workingconditions are poor are generally less able to negotiate better working conditions forthemselves (Dex and Smith, 2001) and are more likely to return to benefits than toimprove their earnings (Dickens, 2000b). Poor prospects for advancement are alsoassociated with decisions to leave work, which worsen the ‘scarring’ effect and thushave further implications for future labour market participation.
1.4 Design of the ERA programme
The ERA programme was designed to test a method to improve job retention andadvancement among low-income individuals. The primary policy aims of the ERAprogramme were to:
• promote a work-based welfare policy, building on the progress made byincreased wage supplementation and the active case management of the NewDeal;
• break the ‘low-pay/no-pay cycle’ and so lessen the ‘scarring effect’ ofunemployment;
• improve ‘job matching’ by placing customers in work that is likely to suit themin the longer term, which may include changing employers after beginning work;
Introduction
18
• provide longer-term ‘treatment’ for barriers to work by continuing toprovide support after customers begin working and encounter barriers, such astransport, childcare, or reversals in health;
• reduce in-work poverty by promoting work advancement and trainingopportunities; and
• increase (even further) financial incentives to work by adding to wages anadditional incentive to work full-time hours for a period after entering work.
The primary hypothesis of the ERA programme’s design is that a mix of job coachingand financial incentives, including support both before employment and duringwork, can have a positive impact on individuals’ job retention and advancement.Before entering employment, customers would be advised to find good jobs withprospects for advancement; and once they were in work, they would be offeredcontinuous close support as well as financial incentives to stay in work and take uptraining opportunities. The in-work support would also help them to continue toresolve their barriers to work. The design team envisioned that these strategieswould result in higher retention and would make advancement more likely.
The development of the programme was inspired by a similar demonstration, theUnited States (US) ERA programme, which was already being implemented in theUS. Launched in 1999, the US ERA project tests a variety of retention andadvancement programmes and has many features that are similar to the UKdemonstration (see Box 1.1). The US ERA demonstration is directed by MDRC, whichalso leads the consortium conducting the UK ERA evaluation. Many of the earlyfindings from the US project have informed the implementation of the UKprogramme.
A related project, the Work Advancement and Support Centers (WASC)demonstration, got under way in the US in 2005, two years after the UK ERAprogramme began (see Box 1.1). MDRC designed and is evaluating WASC, andfindings from both ERA programmes have informed its implementation.
Introduction
19
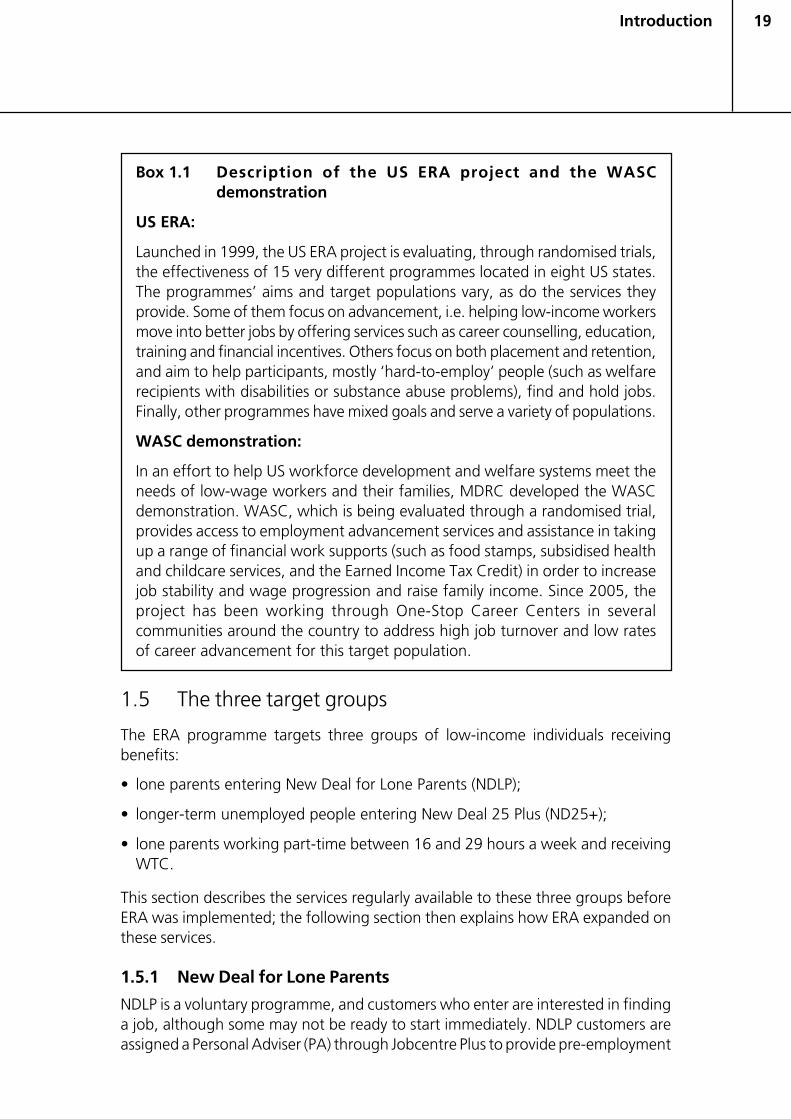
Box 1.1 Description of the US ERA project and the WASCdemonstration
US ERA:
Launched in 1999, the US ERA project is evaluating, through randomised trials,the effectiveness of 15 very different programmes located in eight US states.The programmes’ aims and target populations vary, as do the services theyprovide. Some of them focus on advancement, i.e. helping low-income workersmove into better jobs by offering services such as career counselling, education,training and financial incentives. Others focus on both placement and retention,and aim to help participants, mostly ‘hard-to-employ’ people (such as welfarerecipients with disabilities or substance abuse problems), find and hold jobs.Finally, other programmes have mixed goals and serve a variety of populations.
WASC demonstration:
In an effort to help US workforce development and welfare systems meet theneeds of low-wage workers and their families, MDRC developed the WASCdemonstration. WASC, which is being evaluated through a randomised trial,provides access to employment advancement services and assistance in takingup a range of financial work supports (such as food stamps, subsidised healthand childcare services, and the Earned Income Tax Credit) in order to increasejob stability and wage progression and raise family income. Since 2005, theproject has been working through One-Stop Career Centers in severalcommunities around the country to address high job turnover and low ratesof career advancement for this target population.
1.5 The three target groups
The ERA programme targets three groups of low-income individuals receivingbenefits:
• lone parents entering New Deal for Lone Parents (NDLP);
• longer-term unemployed people entering New Deal 25 Plus (ND25+);
• lone parents working part-time between 16 and 29 hours a week and receivingWTC.
This section describes the services regularly available to these three groups beforeERA was implemented; the following section then explains how ERA expanded onthese services.
1.5.1 New Deal for Lone Parents
NDLP is a voluntary programme, and customers who enter are interested in findinga job, although some may not be ready to start immediately. NDLP customers areassigned a Personal Adviser (PA) through Jobcentre Plus to provide pre-employment
Introduction
20
job coaching services. PAs can offer job search assistance and may address anybarriers customers have that present challenges to finding work. They also advisecustomers on their likely in-work income at differing hours of work, and help themaccess education or training.
The majority of NDLP customers are women, and many face an array of labourmarket disadvantages, such as lack of work skills and experience, poor family health,financial disincentives to working, lack of confidence, problems with transport, lackof job opportunities, and employer prejudices (Millar and Ridge, 2002). Many loneparents also struggle to balance work and care for their children, which often resultsin employment instability. Findings from interviews in 1999 and 2000 showed that17 per cent of lone parents in employment left for either unemployment or inactivity(Marsh, 2001). Research on NDLP has also found that 20 per cent of lone parentswho left IS returned within about ten months (Hales et al., 2000), and that loneparents have higher job exit rates than non-lone parents and single childlesswomen, even after personal and job characteristics are controlled for (Evans,Harkness, and Arigoni Ortiz, 2004).
1.5.2 New Deal 25 Plus
New Deal 25 Plus (ND25+) is a national mandatory programme introduced in 1998to assist long-term unemployed people aged 25 and over back into work. Theprogramme targets individuals who have been on JSA for 18 months or more(although about a quarter are given ‘Early Entry’ on special grounds, such as recentrelease from prison or exceptional leave to stay in the UK).
ND25+ has two key objectives:
• to help long-term unemployed people into jobs and to improve their prospectsof staying and progressing in employment; and
• to increase the long-term employability of long-term unemployed people, therebymaking a positive contribution to sustainable levels of employment and to areduction in social exclusion.
ND25+ customers also work with a Jobcentre Plus PA, where they are given practicalhelp and opportunities to equip them to re-enter employment. Unlike the NDLPgroup, until ND25+ participants begin employment they are required to participatein four stages of job preparation:
• an initial interview and assessment;
• a four-month Gateway period during which the PA offers job search help andsupport;
• an Intensive Activity Period (IAP) lasting 13 to 26 weeks that can involve trainingcourses, work experience placements, intensive job search assistance, and otherspecialist help; and
• a six-week Follow-Through period involving intensive job search and access toGateway-type provision.
Introduction
21
Nationally, most ND25+ customers are men. Many face severe labour marketdisadvantages, such as a lack of skills and/or outdated skills, a lack of suitabletraining, a short or patchy work history, transport difficulties, a lack of confidence, alack of motivation to work, and employer prejudices regarding age and workhistory. Data from the long-term unemployed pilot programme indicated that 26per cent are in poor health or have a disability, 24 per cent lack qualifications(i.e. have low education levels), and 29 per cent lack personal transportation(Lissenburgh, 2000). Some also have criminal records, drug or alcohol dependence,learning difficulties, mental or physical health problems, personality disorders, or aresimply resistant to re-engagement in paid work. About 38 per cent of those inND25+ who leave for paid jobs are unemployed again a year later.6
1.5.3 Lone parents receiving Working Tax Credit
Low-wage working adults in the UK whose employment conditions meet certaincriteria are eligible to receive WTC (similar to the Earned Income Tax Credit in theUS). Those receiving WTC generally do not receive services through Jobcentre Plusbecause they do not receive IS or JSA.
ERA programme eligibility was open to a certain subset of those receiving WTC: loneparents working between 16 and 29 hours per week. Because this target group isnot traditionally served by Jobcentre Plus, comparable data on their demographiccharacteristics and barriers to work were not available. However, data from the2001 Families and Children Survey (FACS) indicate that they, too, are disadvantagedand often face employment challenges (for example, many lack transport and/or livein social housing), although to a lesser extent than the lone parents receiving NDLP.
1.6 The ERA service model
A team established by the Cabinet Office devised the ERA demonstration project tooffer services beyond those already offered by the New Deal.7 Table 1.1 summarisesthe staff and services available through ERA, as compared with the services availableto customers who are not in ERA.
6 This figure comes from a re-analysis of survey data from the evaluation of theND25+ specifically undertaken for the ERA demonstration design project.
7 This design process, including all the background and theoretical considerations,was published in detail in a previous report (Morris et al., 2003).
Introduction
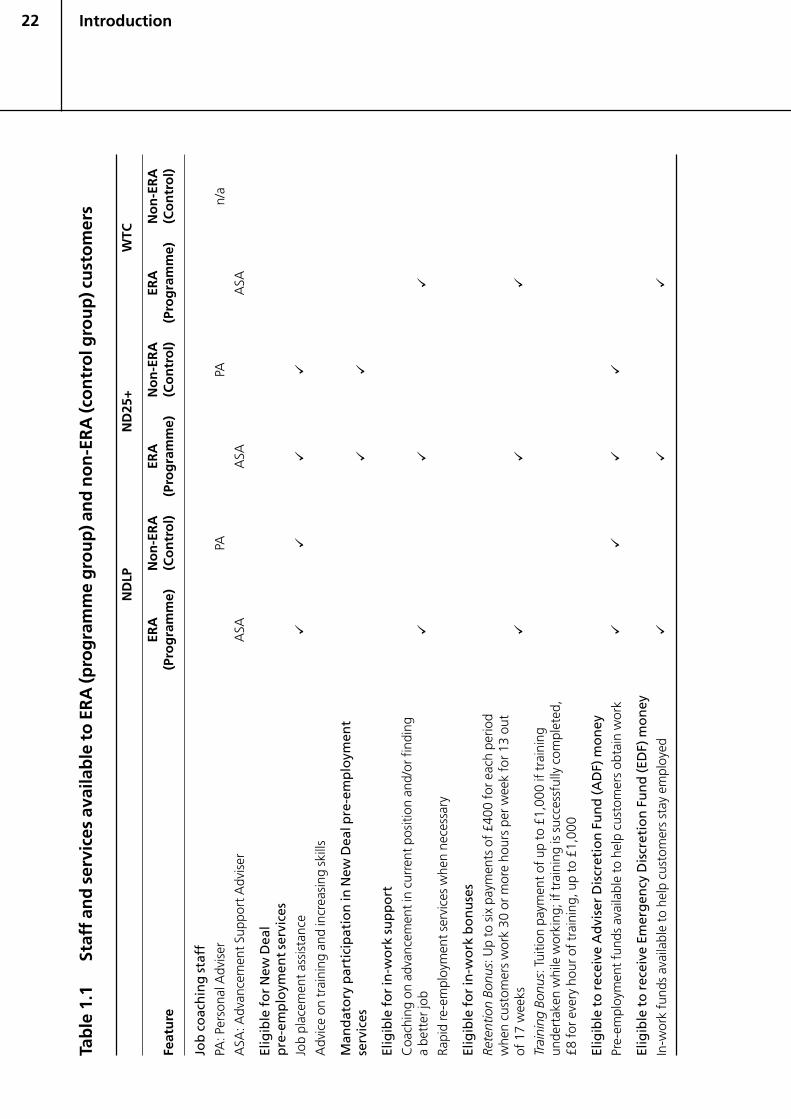
22
Tab
le 1
.1St
aff
and
ser
vice
s av
aila
ble
to
ER
A (p
rog
ram
me
gro
up
) an
d n
on
-ER
A (c
on
tro
l gro
up
) cu
sto
mer
s
ND
LPN
D25
+W
TC
ERA
No
n-E
RA
ERA
No
n-E
RA
ERA
No
n-E
RA
Feat
ure
(Pro
gra
mm
e)(C
on
tro
l)(P
rog
ram
me)
(Co
ntr
ol)
(Pro
gra
mm
e)(C
on
tro
l)
Job
co
ach
ing
sta
ff
PA: P
erso
nal A
dvis
erPA
PAn/
a
ASA
: Adv
ance
men
t Sup
port
Adv
iser
ASA
ASA
ASA
Elig
ible
fo
r N
ew D
eal
pre
-em
plo
ymen
t se
rvic
es
Job
plac
emen
t ass
ista
nce
��
��
Adv
ice
on tr
aini
ng a
nd in
crea
sing
ski
lls
Man
dat
ory
par
tici
pat
ion
in N
ew D
eal p
re-e
mp
loym
ent
serv
ices
��
Elig
ible
fo
r in
-wo
rk s
up
po
rt
Coa
chin
g on
adv
ance
men
t in
curr
ent p
ositi
on a
nd/o
r fin
ding
a be
tter
job
��
�
Rapi
d re
-em
ploy
men
t ser
vice
s w
hen
nece
ssar
y
Elig
ible
fo
r in
-wo
rk b
on
use
s
Rete
ntio
n Bo
nus:
Up
to s
ix p
aym
ents
of £
400
for e
ach
perio
dw
hen
cust
omer
s w
ork
30 o
r mor
e ho
urs
per w
eek
for 1
3 ou
tof
17
wee
ks�
��
Trai
ning
Bon
us: T
uitio
n pa
ymen
t of u
p to
£1,
000
if tr
aini
ngun
dert
aken
whi
le w
orki
ng; i
f tra
inin
g is
suc
cess
fully
com
plet
ed,
£8 fo
r eve
ry h
our o
f tra
inin
g, u
p to
£1,
000
Elig
ible
to
rec
eive
Ad
vise
r D
iscr
etio
n F
un
d (A
DF)
mo
ney
Pre-
empl
oym
ent f
unds
ava
ilabl
e to
hel
p cu
stom
ers
obta
in w
ork
��
��
Elig
ible
to
rec
eive
Em
erg
ency
Dis
cret
ion
Fu
nd
(ED
F) m
on
ey
In-w
ork
fund
s av
aila
ble
to h
elp
cust
omer
s st
ay e
mpl
oyed
��
�
Introduction
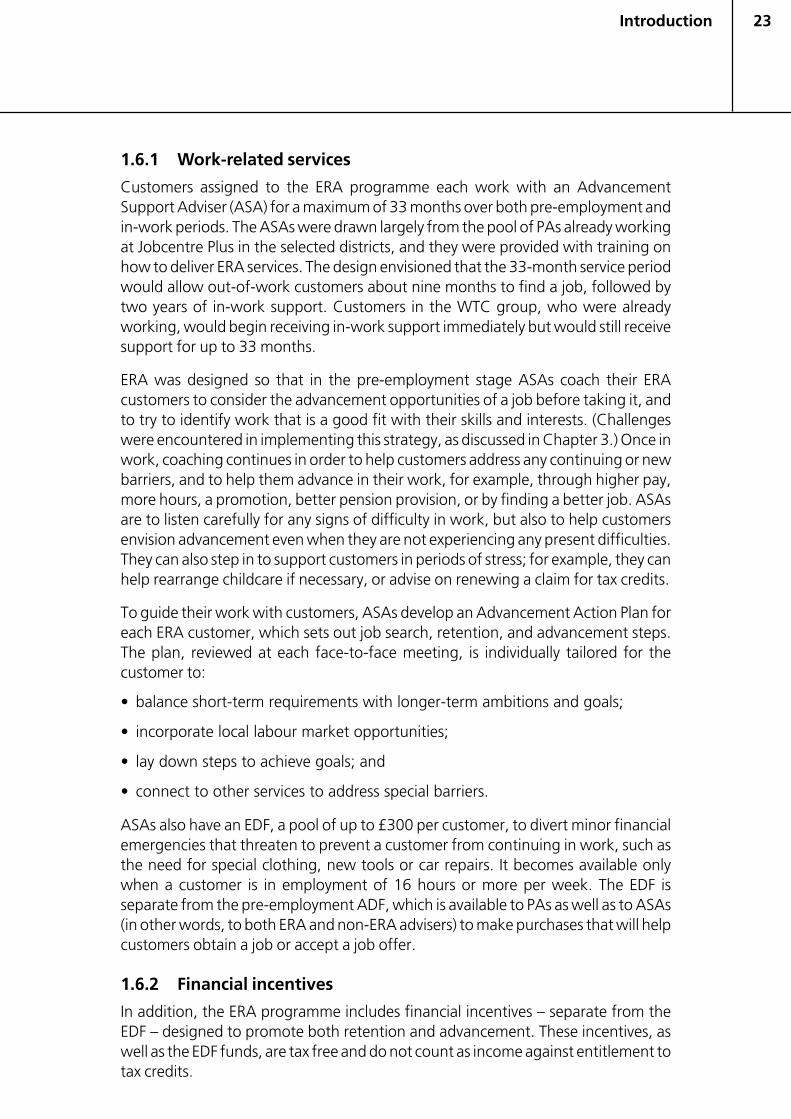
23
1.6.1 Work-related services
Customers assigned to the ERA programme each work with an AdvancementSupport Adviser (ASA) for a maximum of 33 months over both pre-employment andin-work periods. The ASAs were drawn largely from the pool of PAs already workingat Jobcentre Plus in the selected districts, and they were provided with training onhow to deliver ERA services. The design envisioned that the 33-month service periodwould allow out-of-work customers about nine months to find a job, followed bytwo years of in-work support. Customers in the WTC group, who were alreadyworking, would begin receiving in-work support immediately but would still receivesupport for up to 33 months.
ERA was designed so that in the pre-employment stage ASAs coach their ERAcustomers to consider the advancement opportunities of a job before taking it, andto try to identify work that is a good fit with their skills and interests. (Challengeswere encountered in implementing this strategy, as discussed in Chapter 3.) Once inwork, coaching continues in order to help customers address any continuing or newbarriers, and to help them advance in their work, for example, through higher pay,more hours, a promotion, better pension provision, or by finding a better job. ASAsare to listen carefully for any signs of difficulty in work, but also to help customersenvision advancement even when they are not experiencing any present difficulties.They can also step in to support customers in periods of stress; for example, they canhelp rearrange childcare if necessary, or advise on renewing a claim for tax credits.
To guide their work with customers, ASAs develop an Advancement Action Plan foreach ERA customer, which sets out job search, retention, and advancement steps.The plan, reviewed at each face-to-face meeting, is individually tailored for thecustomer to:
• balance short-term requirements with longer-term ambitions and goals;
• incorporate local labour market opportunities;
• lay down steps to achieve goals; and
• connect to other services to address special barriers.
ASAs also have an EDF, a pool of up to £300 per customer, to divert minor financialemergencies that threaten to prevent a customer from continuing in work, such asthe need for special clothing, new tools or car repairs. It becomes available onlywhen a customer is in employment of 16 hours or more per week. The EDF isseparate from the pre-employment ADF, which is available to PAs as well as to ASAs(in other words, to both ERA and non-ERA advisers) to make purchases that will helpcustomers obtain a job or accept a job offer.
1.6.2 Financial incentives
In addition, the ERA programme includes financial incentives – separate from theEDF – designed to promote both retention and advancement. These incentives, aswell as the EDF funds, are tax free and do not count as income against entitlement totax credits.
Introduction
24
Retention Bonus
To motivate customers to enter full-time work or to make the transition from part-time to full-time work, and to encourage them to do so earlier than they might haveconsidered, ERA offers up to six payments of £400 for each period when customerswork 30 or more hours per week for 13 out of 17 weeks.8 This totals to £2,400 fora customer who receives all six payments.9 Customers are required to provideevidence of their employment and hours, i.e. by showing wage slips, and to comeinto the office to claim the Retention Bonus (which provides another opportunity forface-to-face contact with their ASA).
Training Bonus
ERA customers can also receive financial incentives to combine work with training.This is intended to encourage investment in their own human capital development,which, in turn, may further promote their long-term career progression. While inwork for at least 16 hours per week, customers can qualify for tuition payments ofup to £1,000 for approved courses that reflect the agreed goals in the AdvancementAction Plans and correspond with local labour market needs. These payments aremade directly to the training providers.
In addition, if a customer successfully completes an approved course, they mayreceive an additional bonus of £8 for every hour of training completed, up to amaximum of £1,000 (or 125 hours). It can be paid only within the 33-month ERAservice period, so the courses must be completed within this time frame forcustomers to receive the bonus.
1.7 The random assignment design and the intake process
The ERA programme was implemented as a random assignment demonstration,meaning that customers who volunteered for the programme were assigned atrandom – regardless of their background characteristics – to a programme group,which was enrolled in ERA, or to a control group, which was not enrolled in ERA butcontinued to receive the standard NDLP or ND25+ services, as appropriate, or toreceive WTC. This design resulted in two groups that were similar at the outset; theonly difference was that one group was offered ERA services and incentives, whilethe other was not (the services that the control group was eligible for arerepresented in the non-ERA column in Table 1.1). Thus, in comparing the outcomesof the two groups over time, differences that emerge can most likely be attributed toERA.
8 This provision accommodates the likelihood that many workers may lose jobs,and offers an incentive for quick re-employment.
9 At the currency exchange rate in effect on 1 December 2006, these retentionbonus payments were equivalent to US$782 and US$4,690, respectively.
Introduction
25
Figure 1.1 illustrates the random assignment process, which varied somewhatbetween the New Deal and WTC target groups. Entering into the programme wasvoluntary for customers in all three groups. When customers came into JobcentrePlus offices, basic demographic information was recorded, and they were told of thepossible advantages of participating in the ERA programme. They were then invitedto enter the demonstration and told that they had a 50 per cent chance of beingselected for ERA services. Some customers declined to undergo random assignment,but most accepted and were assigned by a computerised algorithm to theprogramme group or to the control group.10
Figure 1.1 Random assignment process
10 A special study conducted by the Institute for Fiscal Studies, as part of thisevaluation, carefully examines the issue of non-participation and its implicationsfor interpreting the results of the main impact study. The study is scheduled tobe released in spring 2007.
Introduction
A For NDLP and ND25+ groups:
JOBRandom
assignment atJobcentre Plus
Programmegroup (ERA)
A For WTC group:
Control group
In-work supportfrom ASAs and
financial incentives
Randomassignment
at NewDeal
intake atJobcentre
Plus
Programmegroup(ERA)
Controlgroup
• New Deal
• Job coachingand placementfrom ASAs
• Advancementfocus
• New Deal
• Regular jobplacementassistance fromPAs
In-worksupport and
financialincentives
JOB
JOB
26
Approximately 16,000 customers were randomly assigned; around 41 per centwere NDLP customers, 41 per cent were ND25+ customers and 17 per cent werelone parents receiving WTC.11
The random assignment process occurred successfully. As a result, programme andcontrol group members share similar characteristics, on average. This helps ensurethat the control group will provide unbiased estimates of how programme groupparticipants would have progressed over time had they never encountered ERA.
The ERA demonstration represents the first time in the UK that a random assignmentsocial policy evaluation has been carried out on such a large scale. The design wasinfluenced by random assignment evaluations done in the United States. Given thepioneering nature of this initiative, a special study, published in 2006, wasundertaken to describe and capture lessons from the implementation of the randomassignment process itself, including staff and customers’ reactions (Walker, Hoggart,and Hamilton, 2006). The study found that, although the process was not withoutits challenges and there were procedures that, in hindsight, could have beenimplemented better, given the scale of random assignment in the ERA demonstration,it proceeded well. It created a sufficiently large research sample of similar programmeand control groups, and most customers and staff viewed the process as justifiedand fair. This finding ensures that the results produced by the ERA evaluation will betrustworthy, and establishes that random assignment is practical in a UK context.This has encouraging implications, even beyond the ERA demonstration.
1.8 Implementing ERA
The DWP is responsible for managing the implementation of the ERA demonstration.DWP was in charge of overseeing site selection, establishing guidance on servicedelivery, overseeing a training strategy, selecting and overseeing the evaluators, andmonitoring service delivery in the sites. It developed a special Project Team to carryout the programme implementation functions and to work closely with the sites. Italso assigned an Evaluation Team to work with the research contractors and monitorthe evaluation.
This section describes some of the key implementation decisions made prior to thestart of the demonstration, including the sites in which ERA was rolled out and thespecial staff that were hired to assist in ensuring that random assignment wascarried out properly and services were delivered as envisioned. It also provides atimeline of programme implementation dates and how they correspond with othernational policies relevant to Jobcentre Plus.
1.8.1 The ERA sites
The ERA demonstration was rolled out in six Jobcentre Plus districts (areas of varyingsizes and populations demarcated across the UK by DWP) within six UK regions.
Introduction
11 Due to rounding, percentages may not sum to 100 per cent.
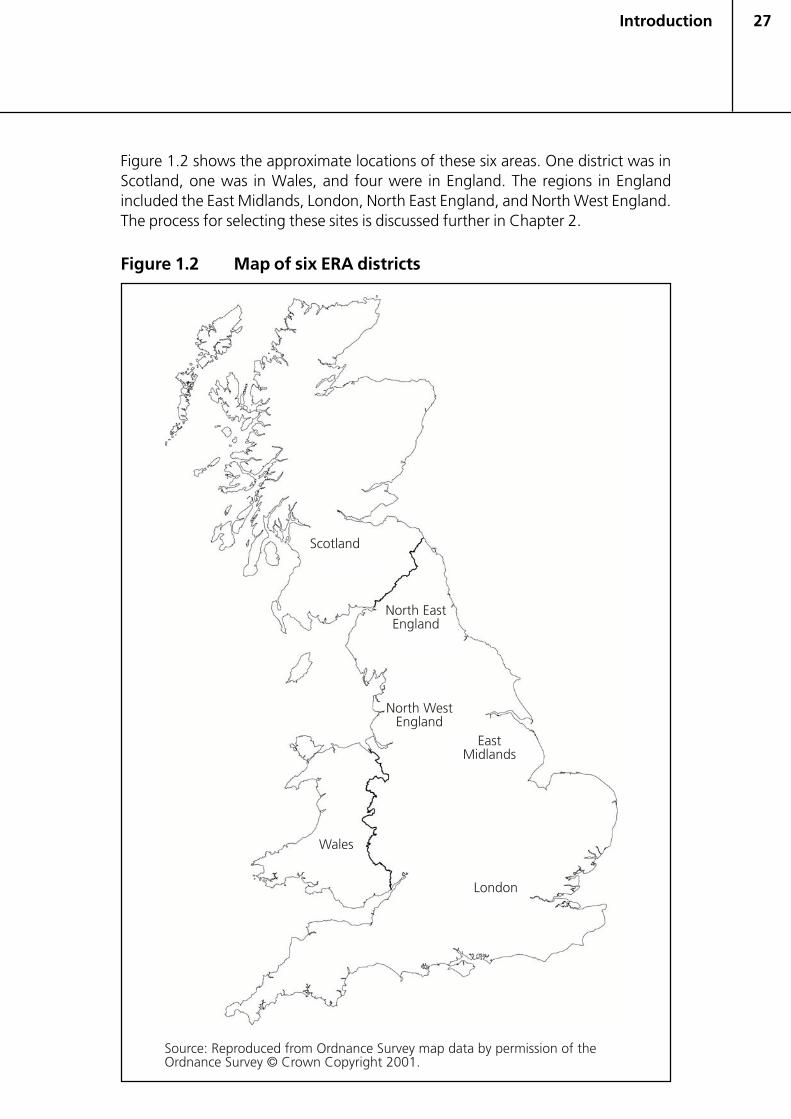
27
Figure 1.2 shows the approximate locations of these six areas. One district was inScotland, one was in Wales, and four were in England. The regions in Englandincluded the East Midlands, London, North East England, and North West England.The process for selecting these sites is discussed further in Chapter 2.
Figure 1.2 Map of six ERA districts
Introduction
28
1.8.2 Technical Advisers
In order to help ensure that the implementation of random assignment and of ERAservices and incentives went as planned, six Technical Advisers (TAs) – one for eachsite – were recruited by the evaluation consortium to work on the project. They wererecruited largely from among Jobcentre Plus staff but were placed on the payroll ofPSI, one of the research partners. Working closely with the DWP Project Team, theTAs spent most of their two years on the project in the district offices. They assistedin monitoring random assignment procedures as well as in training local staff on ERAprocedures and contributing ‘good practice’ ideas. Their post outside the JobcentrePlus management structure allowed them to contribute an additional perspectiveon how the project was progressing at a local level. At the same time, theirexperience of working in Jobcentre Plus ensured that they were able to give advicewhich took full account of operational realities, enhancing their credibility.
1.8.3 Timeline of ERA implementation
Random assignment began in October 2003 in five of the six ERA sites, and inJanuary 2004 in the sixth site (see Figure 1.3). Intake for the New Deal groups endedabout a year later. Intake for the WTC group was extended until January 2005 toincrease the number of customers in this group (there were unique challenges inrecruiting WTC customers into the sample because they were not already cominginto the Jobcentre Plus offices for services; additional efforts to recruit WTCcustomers were made in the East Midlands district, and this region has by far thelargest WTC sample). Following their 33-month service period, the first customersmoved off the programme beginning in July 2006, and the last customers will phaseout in September 2007.
Several other policies affecting Jobcentre Plus coincided with the implementation ofERA. Figure 1.3 highlights a few of the major policies that may have affected howERA was implemented. In 2003 and 2004, the Pathways to Work pilot, anemployment programme for disabled recipients of Incapacity Benefit (IB), began inthree of the six ERA districts. Although this intervention does not directly affect ERAcustomers, it was a priority programme for districts and district resources, and somay have affected the attention and funding dedicated to ERA.
In addition, in 2006, DWP implemented important changes in staffing andperformance goals. In January 2006, Jobcentre Plus underwent an organisationalreview, which resulted in staffing declines and reorganisation. Some of thequalitative analysis used in Chapter 3 was carried out in 2006, during this period ofturnover. Although the follow-up period for the impact analysis in this report ends inNovember 2005, anticipation of the changes began affecting staff before they wereimplemented, and may have affected service delivery.
Introduction
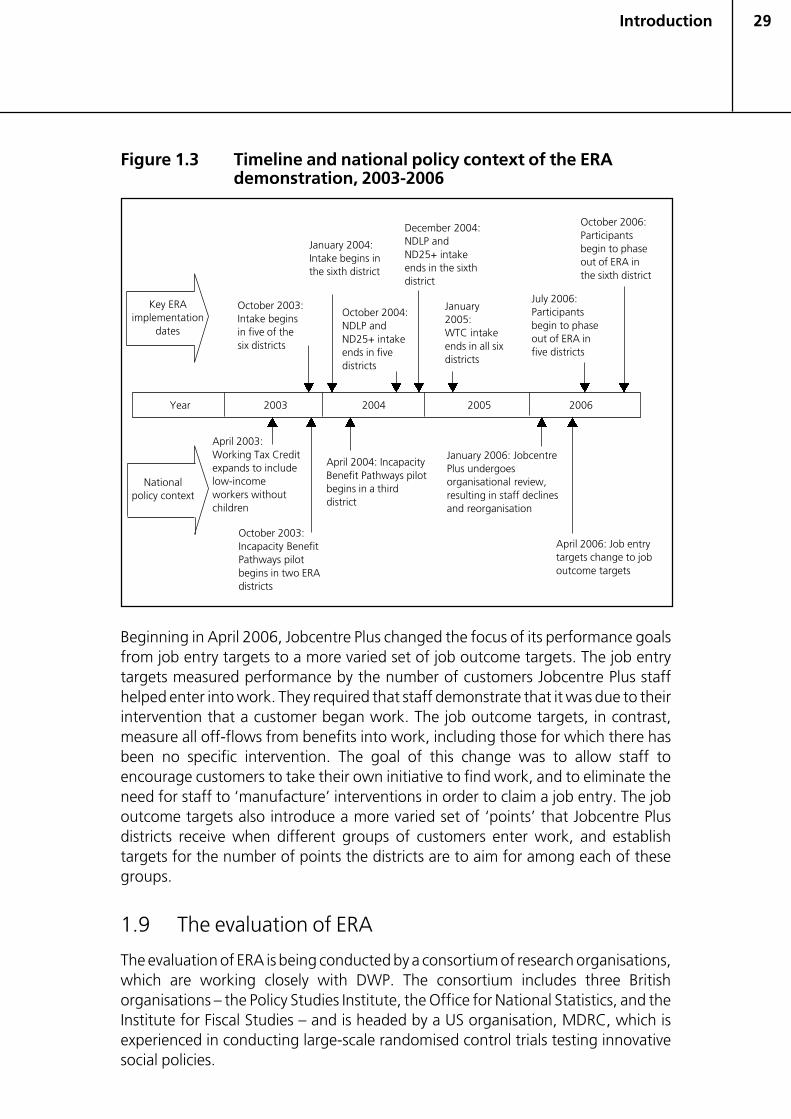
29
Figure 1.3 Timeline and national policy context of the ERAdemonstration, 2003-2006
Beginning in April 2006, Jobcentre Plus changed the focus of its performance goalsfrom job entry targets to a more varied set of job outcome targets. The job entrytargets measured performance by the number of customers Jobcentre Plus staffhelped enter into work. They required that staff demonstrate that it was due to theirintervention that a customer began work. The job outcome targets, in contrast,measure all off-flows from benefits into work, including those for which there hasbeen no specific intervention. The goal of this change was to allow staff toencourage customers to take their own initiative to find work, and to eliminate theneed for staff to ‘manufacture’ interventions in order to claim a job entry. The joboutcome targets also introduce a more varied set of ‘points’ that Jobcentre Plusdistricts receive when different groups of customers enter work, and establishtargets for the number of points the districts are to aim for among each of thesegroups.
1.9 The evaluation of ERA
The evaluation of ERA is being conducted by a consortium of research organisations,which are working closely with DWP. The consortium includes three Britishorganisations – the Policy Studies Institute, the Office for National Statistics, and theInstitute for Fiscal Studies – and is headed by a US organisation, MDRC, which isexperienced in conducting large-scale randomised control trials testing innovativesocial policies.
Introduction
October 2003:Intake beginsin five of thesix districts
January 2004:Intake begins inthe sixth district
October 2004:NDLP andND25+ intakeends in fivedistricts
December 2004:NDLP andND25+ intakeends in the sixthdistrict
January2005:WTC intakeends in all sixdistricts
July 2006:Participantsbegin to phaseout of ERA infive districts
October 2006:Participantsbegin to phaseout of ERA inthe sixth district
April 2003:Working Tax Creditexpands to includelow-incomeworkers withoutchildren
October 2003:Incapacity BenefitPathways pilotbegins in two ERAdistricts
April 2004: IncapacityBenefit Pathways pilotbegins in a thirddistrict
January 2006: JobcentrePlus undergoesorganisational review,resulting in staff declinesand reorganisation
April 2006: Job entrytargets change to joboutcome targets
Key ERAimplementation
dates
Year 2003 2004 2005 2006
Nationalpolicy context
30
The evaluation of ERA is divided into three research strands:
• A process study: The purpose of the process study is to understand how ERAwas implemented ‘on the ground’ – whether it was implemented as envisionedin the design, particular implementation challenges, and any differences in servicedelivery across the six sites. It also may provide insight into possible reasons forthe programme’s impacts.
• An impact study: The impact study uses customer surveys as well asadministrative records to compare the service receipt, employment, earnings,benefits receipt, and other outcomes for ERA customers with those of the controlgroup customers. For example, it examines whether more programme groupcustomers than control group customers worked at some point during the ERAservice period, and whether the earnings of the programme group were higherthan those of the control group.
• A cost and cost-benefit study: The cost study examines the total cost ofimplementing ERA, by adding up the total expenditures associated with operatingit. The cost study will also provide a foundation for a possible cost-benefit study,which would seek to understand the net economic gains or losses generated byERA by comparing the costs of the programme with the financial benefits itinduces.
This report focuses on the first two strands: It describes the implementation of ERAand examines early impacts across the sites during the first 12 months after eachcustomer’s date of random assignment. Reports scheduled to be published in 2008will discuss the two-year impacts, a longer-term implementation analysis, andfindings from the cost study. DWP will also consider whether to conduct longer-term impact analyses, as well as a cost-benefit study and a non-experimentalanalysis estimating the possible effects, costs and benefits of the programme if itwere rolled out nationally.
In examining the results from the UK ERA demonstration, it is also important toconsider the project within a broader context of retention and advancementprogrammes. Early results are available from the US ERA demonstration (see reportsonline at www.mdrc.org). Special note might be taken of the Texas US ERAprogramme, which is perhaps the most similar to the UK ERA programme. Ittargeted low-income families applying for or receiving cash benefits (similar to theNDLP group). It offered pre-employment job search and job placement assistance,in-work job coaching and in-work stipends for combining work and training,available after four months of employment (Martinson and Hendra, 2006).
1.10 The scope and coverage of this report
The period examined in the implementation analysis in this report extends throughmid-2006, somewhat beyond the period covered in the report’s impact analysis,which ended in November 2005. Many changes in service delivery observed in the
Introduction
31
later period of the implementation analysis are, therefore, not reflected in theimpact analysis.
The data used for the impact analysis are drawn largely from a customer surveyadministered one year after each customer’s random assignment date.12
Administrative records were used to examine benefit receipt and employment forthe sample surveyed, but administrative records showing earnings and othermeasures were not available for analysis in this report. Subsequent reports will useadministrative records data more extensively, and will include customers who werenot part of the survey sample.
The remainder of this report is organised as follows:
• Chapter 2 describes national economic trends as well as the local economic anddemographic context in which the demonstration was launched in each of thesix sites. It also discusses the characteristics of the three target groups and selectedcharacteristics of the sample by site. Finally, it describes in more detail the datasources used in the report.
• Chapter 3 discusses programme operations and explores whether the programmewas implemented as designed and the challenges faced in doing so. It focuses,in particular, on how the programme evolved over time, especially in terms ofthe extent to which staff understood the ERA model, the level of managementsupport for it and the modifications made to the model in response to theimplementation challenges confronted.
• Chapter 4 reports on the effects of the programme on participation and servicereceipt over a 12-month follow-up period, examining the extent to which ERAcustomers received ERA services, the extent to which they sought and tried tomaintain employment and the steps they took to advance. It compares theprogramme group customers’ outcomes with behaviour observed among thecontrol group customers. It focuses on the compiled results across all six districts,but describes site differences as well.
• Chapter 5 describes the impacts of the programme on employment, earningsand benefits over the 12-month follow-up period. It discusses the results foreach target group as a whole as well as for each target group by district. For theWTC group, it focuses on the district with the largest WTC sample.
12 Most customers were surveyed from December 2004 to November 2005.However, a very small number of customers could not be located on their one-year anniversary date. Therefore, the data collection period for these fewextended to February 2006.
Introduction

33Sample and sites
2 Sample and sites
2.1 Introduction
The Employment Retention and Advancement (ERA) demonstration was launchedin six regions across the UK, each with a particular set of economic circumstancesand varying demographic profiles. As discussed in Chapter 1, ERA has beenimplemented in a political climate in which increasing employment among loneparents and benefit recipients, and making work pay for low-wage earners, wereimportant priorities. This chapter describes the national and local economic contextin which the demonstration was launched more fully. It begins with a briefdiscussion of recent national economic trends in the UK. It then discusses how theregions in which the programme was implemented were chosen. The chapterprovides local economic and demographic information on each of these six regions,including data on the population, racial/ethnic composition, major industries,unemployment trends and benefit receipt. These regional differences are importantbecause a goal of the demonstration is to determine whether the programme can beeffective across a variety of local environments; they may also provide insight intothe implementation and impacts findings presented later in this report. The chapterthen turns to a discussion of the sample members in each target group, showinghow selected characteristics of the three groups vary by region as well. Finally, itconcludes with a discussion of the data sources used in the following chapters.
2.2 National economic context during the implementationof ERA
In order to understand broadly the economic context in which the demonstrationwas tested, it is important to consider the national employment and benefits receipttrends that relate to the target population. Figure 2.1 presents a timeline of randomassignment and data collection, as a reference against which these trends can becompared. As the figure shows, the follow-up period for the quantitative analysispresented in this report is drawn primarily from customer survey and administrativerecords data covering 12 months after each customer’s random assignment date.
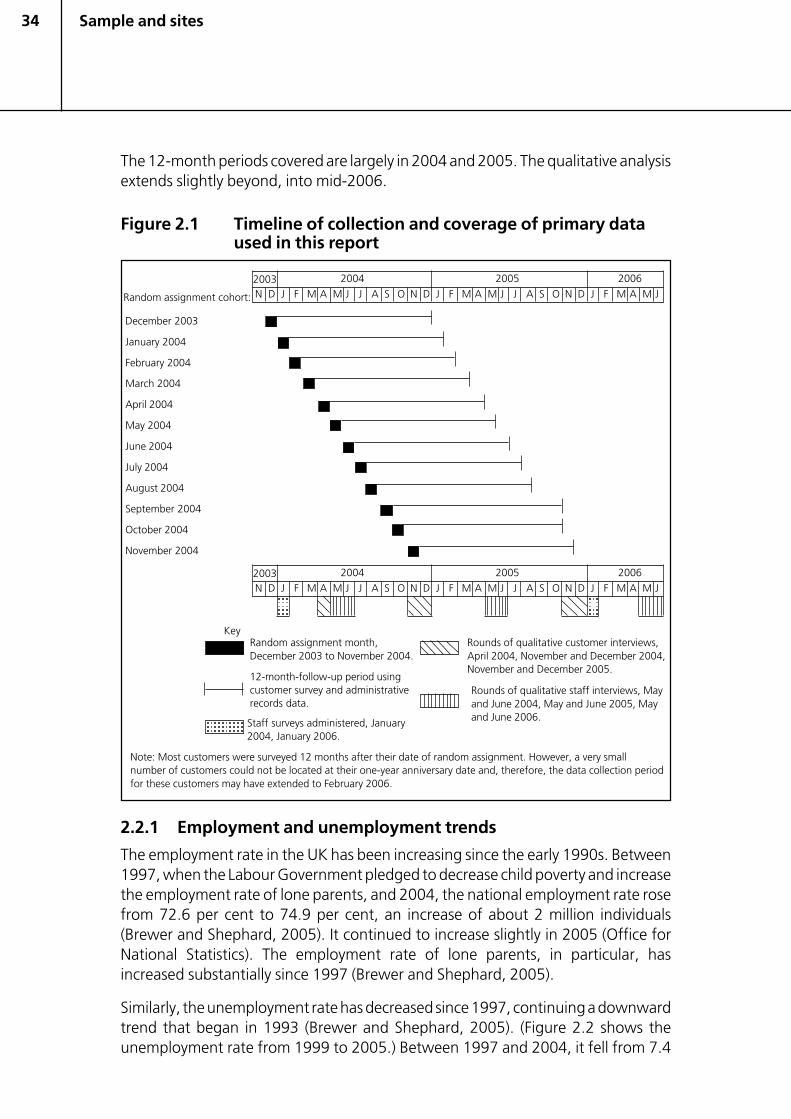
34 Sample and sites
The 12-month periods covered are largely in 2004 and 2005. The qualitative analysisextends slightly beyond, into mid-2006.
Figure 2.1 Timeline of collection and coverage of primary dataused in this report
2.2.1 Employment and unemployment trends
The employment rate in the UK has been increasing since the early 1990s. Between1997, when the Labour Government pledged to decrease child poverty and increasethe employment rate of lone parents, and 2004, the national employment rate rosefrom 72.6 per cent to 74.9 per cent, an increase of about 2 million individuals(Brewer and Shephard, 2005). It continued to increase slightly in 2005 (Office forNational Statistics). The employment rate of lone parents, in particular, hasincreased substantially since 1997 (Brewer and Shephard, 2005).
Similarly, the unemployment rate has decreased since 1997, continuing a downwardtrend that began in 1993 (Brewer and Shephard, 2005). (Figure 2.2 shows theunemployment rate from 1999 to 2005.) Between 1997 and 2004, it fell from 7.4
Random assignment cohort:
2003 2004 2005 2006
N D J F M A M J J A S O N D J F M A M J J A S O N D J F M A M J
December 2003
January 2004
February 2004
March 2004
April 2004
May 2004
June 2004
July 2004
August 2004
September 2004
October 2004
November 2004
2003 2004 2005 2006
N D J F M A M J J A S O N D J F M A M J J A S O N D J F M A M J
KeyRandom assignment month,December 2003 to November 2004.
12-month-follow-up period usingcustomer survey and administrativerecords data.
Staff surveys administered, January2004, January 2006.
Rounds of qualitative customer interviews,April 2004, November and December 2004,November and December 2005.
Rounds of qualitative staff interviews, Mayand June 2004, May and June 2005, Mayand June 2006.
Note: Most customers were surveyed 12 months after their date of random assignment. However, a very smallnumber of customers could not be located at their one-year anniversary date and, therefore, the data collection periodfor these customers may have extended to February 2006.
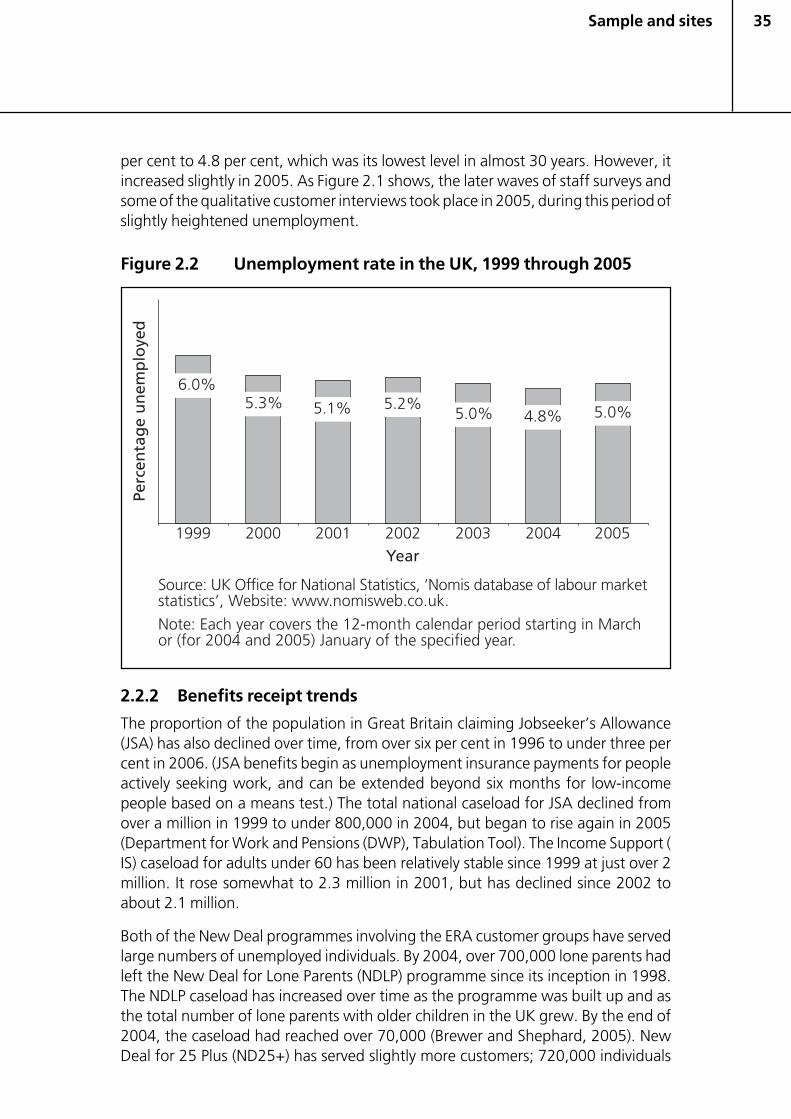
35
per cent to 4.8 per cent, which was its lowest level in almost 30 years. However, itincreased slightly in 2005. As Figure 2.1 shows, the later waves of staff surveys andsome of the qualitative customer interviews took place in 2005, during this period ofslightly heightened unemployment.
Figure 2.2 Unemployment rate in the UK, 1999 through 2005
2.2.2 Benefits receipt trends
The proportion of the population in Great Britain claiming Jobseeker’s Allowance(JSA) has also declined over time, from over six per cent in 1996 to under three percent in 2006. (JSA benefits begin as unemployment insurance payments for peopleactively seeking work, and can be extended beyond six months for low-incomepeople based on a means test.) The total national caseload for JSA declined fromover a million in 1999 to under 800,000 in 2004, but began to rise again in 2005(Department for Work and Pensions (DWP), Tabulation Tool). The Income Support (IS) caseload for adults under 60 has been relatively stable since 1999 at just over 2million. It rose somewhat to 2.3 million in 2001, but has declined since 2002 toabout 2.1 million.
Both of the New Deal programmes involving the ERA customer groups have servedlarge numbers of unemployed individuals. By 2004, over 700,000 lone parents hadleft the New Deal for Lone Parents (NDLP) programme since its inception in 1998.The NDLP caseload has increased over time as the programme was built up and asthe total number of lone parents with older children in the UK grew. By the end of2004, the caseload had reached over 70,000 (Brewer and Shephard, 2005). NewDeal for 25 Plus (ND25+) has served slightly more customers; 720,000 individuals
Sample and sites
36
had gone through the programme by the end of 2004. However, the ND25+caseload has declined over time, and in 2004 was approximately 50,000 (Brewerand Shephard, 2005). That was because ND25+ had been successful in eradicatinglong-term adult unemployment.
2.3 Site selection
Six Jobcentre Plus districts were chosen to be a part of the demonstration. Suchdistricts cover areas of varying sizes demarcated by the DWP (in 2006, there were 50Jobcentre Plus districts throughout the UK). Rather than rolling out the programmenationally, DWP and the research consortium selected a limited number of specifieddistricts to allow evaluation of new ERA services and financial incentives todetermine how effective (and cost effective) such an intervention would be. Theyselected districts strategically in order to ensure that the programme would betested in several different types of areas. This section discusses the selection process.
At the time districts were selected for the ERA programme, only some Jobcentre Plusdistricts had adopted its new service delivery model. It was decided that the ERAdistricts would be drawn from those where the new model had been operating fora minimum of six months prior to the start of ERA. This ensured that they would berelatively stable administratively by the time ERA commenced. The six districts in thedemonstration were chosen from among the 25 scheduled to be rolled out by April2003. The consortium worked to identify those that met the following criteria:
• all were to be districts with a large number of customers expected to enterND25+ and NDLP;
• some were to be districts with a substantial proportion of ND25+ and NDLPentrants from an ethnic minority background;13
• the districts were to be spread across varied regions encompassing some urban,some semi-urban, and some rural areas.
Based on these criteria, one district was chosen in each of the following areas:
• East Midlands;
• London;
• North East England;
• North West England;
• Scotland;
• Wales.
Sample and sites
13 Information on the number of ethnic minority customers by Jobcentre Plusdistrict was obtained from the New Deal Evaluation Database.
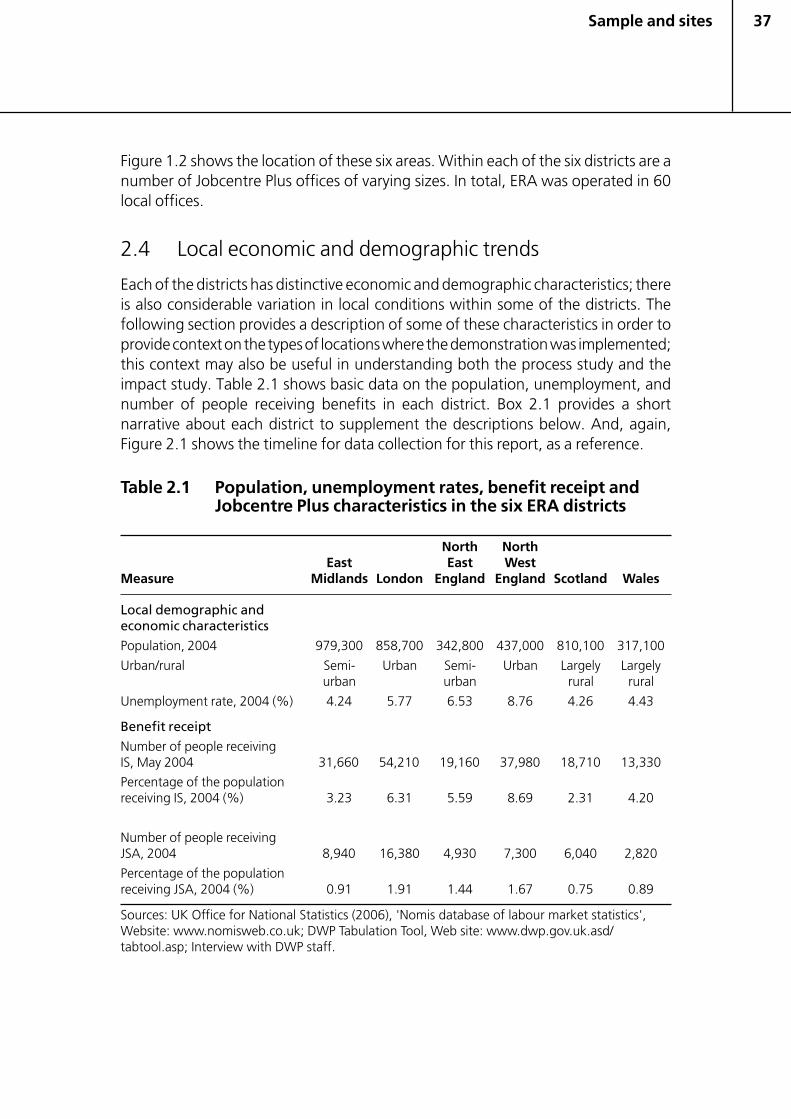
37
Figure 1.2 shows the location of these six areas. Within each of the six districts are anumber of Jobcentre Plus offices of varying sizes. In total, ERA was operated in 60local offices.
2.4 Local economic and demographic trends
Each of the districts has distinctive economic and demographic characteristics; thereis also considerable variation in local conditions within some of the districts. Thefollowing section provides a description of some of these characteristics in order toprovide context on the types of locations where the demonstration was implemented;this context may also be useful in understanding both the process study and theimpact study. Table 2.1 shows basic data on the population, unemployment, andnumber of people receiving benefits in each district. Box 2.1 provides a shortnarrative about each district to supplement the descriptions below. And, again,Figure 2.1 shows the timeline for data collection for this report, as a reference.
Table 2.1 Population, unemployment rates, benefit receipt andJobcentre Plus characteristics in the six ERA districts
North NorthEast East West
Measure Midlands London England England Scotland Wales
Local demographic andeconomic characteristics
Population, 2004 979,300 858,700 342,800 437,000 810,100 317,100
Urban/rural Semi- Urban Semi- Urban Largely Largelyurban urban rural rural
Unemployment rate, 2004 (%) 4.24 5.77 6.53 8.76 4.26 4.43
Benefit receipt
Number of people receivingIS, May 2004 31,660 54,210 19,160 37,980 18,710 13,330
Percentage of the populationreceiving IS, 2004 (%) 3.23 6.31 5.59 8.69 2.31 4.20
Number of people receivingJSA, 2004 8,940 16,380 4,930 7,300 6,040 2,820
Percentage of the populationreceiving JSA, 2004 (%) 0.91 1.91 1.44 1.67 0.75 0.89
Sources: UK Office for National Statistics (2006), 'Nomis database of labour market statistics',Website: www.nomisweb.co.uk; DWP Tabulation Tool, Web site: www.dwp.gov.uk.asd/tabtool.asp; Interview with DWP staff.
Sample and sites
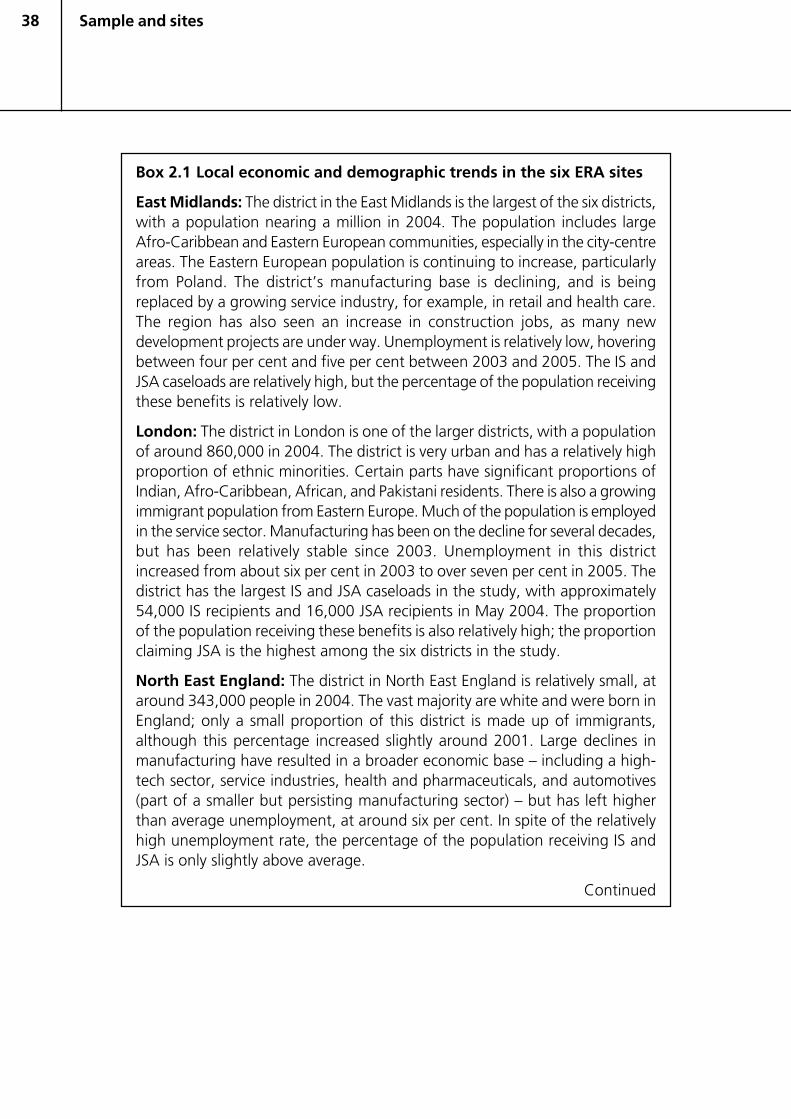
38
Box 2.1 Local economic and demographic trends in the six ERA sites
East Midlands: The district in the East Midlands is the largest of the six districts,with a population nearing a million in 2004. The population includes largeAfro-Caribbean and Eastern European communities, especially in the city-centreareas. The Eastern European population is continuing to increase, particularlyfrom Poland. The district’s manufacturing base is declining, and is beingreplaced by a growing service industry, for example, in retail and health care.The region has also seen an increase in construction jobs, as many newdevelopment projects are under way. Unemployment is relatively low, hoveringbetween four per cent and five per cent between 2003 and 2005. The IS andJSA caseloads are relatively high, but the percentage of the population receivingthese benefits is relatively low.
London: The district in London is one of the larger districts, with a populationof around 860,000 in 2004. The district is very urban and has a relatively highproportion of ethnic minorities. Certain parts have significant proportions ofIndian, Afro-Caribbean, African, and Pakistani residents. There is also a growingimmigrant population from Eastern Europe. Much of the population is employedin the service sector. Manufacturing has been on the decline for several decades,but has been relatively stable since 2003. Unemployment in this districtincreased from about six per cent in 2003 to over seven per cent in 2005. Thedistrict has the largest IS and JSA caseloads in the study, with approximately54,000 IS recipients and 16,000 JSA recipients in May 2004. The proportionof the population receiving these benefits is also relatively high; the proportionclaiming JSA is the highest among the six districts in the study.
North East England: The district in North East England is relatively small, ataround 343,000 people in 2004. The vast majority are white and were born inEngland; only a small proportion of this district is made up of immigrants,although this percentage increased slightly around 2001. Large declines inmanufacturing have resulted in a broader economic base – including a high-tech sector, service industries, health and pharmaceuticals, and automotives(part of a smaller but persisting manufacturing sector) – but has left higherthan average unemployment, at around six per cent. In spite of the relativelyhigh unemployment rate, the percentage of the population receiving IS andJSA is only slightly above average.
Continued
Sample and sites
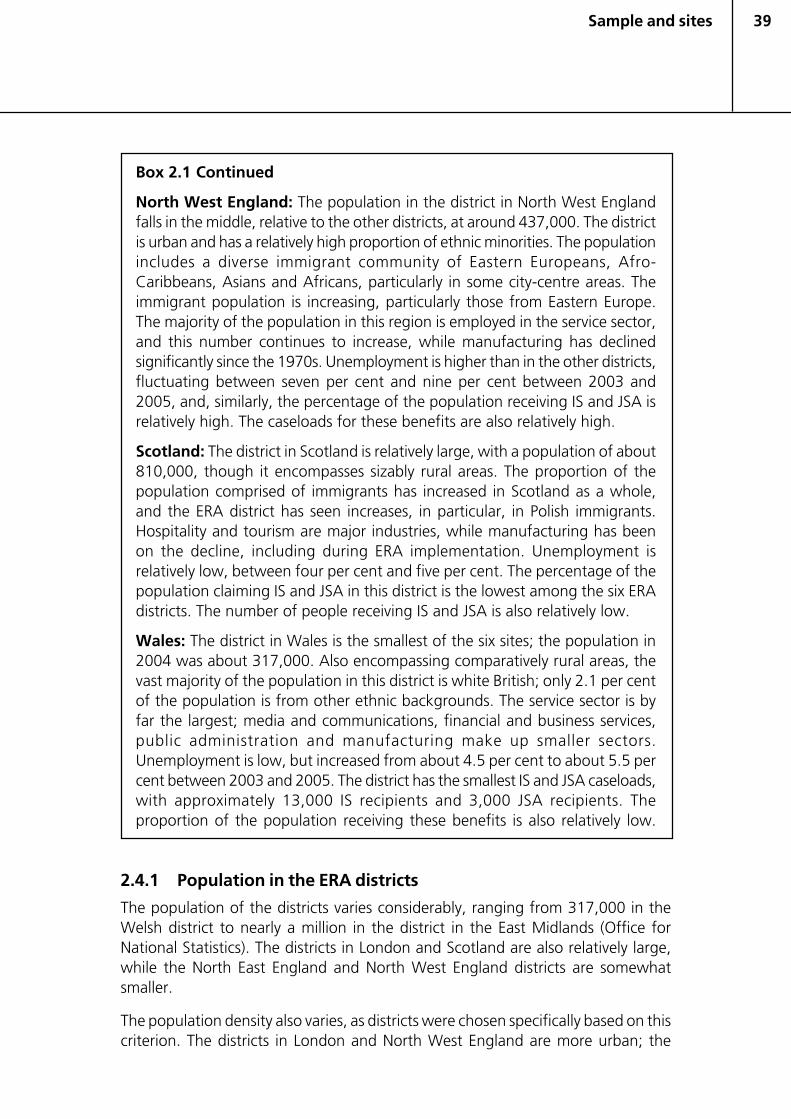
39
Box 2.1 Continued
North West England: The population in the district in North West Englandfalls in the middle, relative to the other districts, at around 437,000. The districtis urban and has a relatively high proportion of ethnic minorities. The populationincludes a diverse immigrant community of Eastern Europeans, Afro-Caribbeans, Asians and Africans, particularly in some city-centre areas. Theimmigrant population is increasing, particularly those from Eastern Europe.The majority of the population in this region is employed in the service sector,and this number continues to increase, while manufacturing has declinedsignificantly since the 1970s. Unemployment is higher than in the other districts,fluctuating between seven per cent and nine per cent between 2003 and2005, and, similarly, the percentage of the population receiving IS and JSA isrelatively high. The caseloads for these benefits are also relatively high.
Scotland: The district in Scotland is relatively large, with a population of about810,000, though it encompasses sizably rural areas. The proportion of thepopulation comprised of immigrants has increased in Scotland as a whole,and the ERA district has seen increases, in particular, in Polish immigrants.Hospitality and tourism are major industries, while manufacturing has beenon the decline, including during ERA implementation. Unemployment isrelatively low, between four per cent and five per cent. The percentage of thepopulation claiming IS and JSA in this district is the lowest among the six ERAdistricts. The number of people receiving IS and JSA is also relatively low.
Wales: The district in Wales is the smallest of the six sites; the population in2004 was about 317,000. Also encompassing comparatively rural areas, thevast majority of the population in this district is white British; only 2.1 per centof the population is from other ethnic backgrounds. The service sector is byfar the largest; media and communications, financial and business services,public administration and manufacturing make up smaller sectors.Unemployment is low, but increased from about 4.5 per cent to about 5.5 percent between 2003 and 2005. The district has the smallest IS and JSA caseloads,with approximately 13,000 IS recipients and 3,000 JSA recipients. Theproportion of the population receiving these benefits is also relatively low.
2.4.1 Population in the ERA districts
The population of the districts varies considerably, ranging from 317,000 in theWelsh district to nearly a million in the district in the East Midlands (Office forNational Statistics). The districts in London and Scotland are also relatively large,while the North East England and North West England districts are somewhatsmaller.
The population density also varies, as districts were chosen specifically based on thiscriterion. The districts in London and North West England are more urban; the
Sample and sites
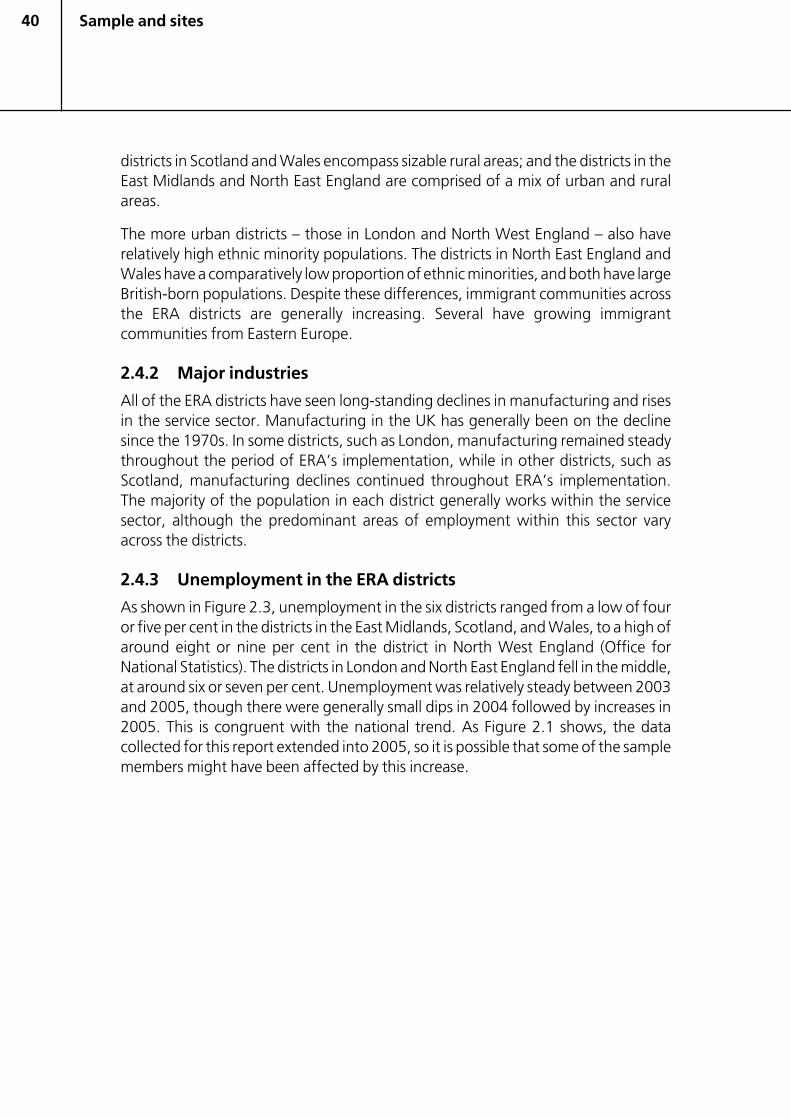
40
districts in Scotland and Wales encompass sizable rural areas; and the districts in theEast Midlands and North East England are comprised of a mix of urban and ruralareas.
The more urban districts – those in London and North West England – also haverelatively high ethnic minority populations. The districts in North East England andWales have a comparatively low proportion of ethnic minorities, and both have largeBritish-born populations. Despite these differences, immigrant communities acrossthe ERA districts are generally increasing. Several have growing immigrantcommunities from Eastern Europe.
2.4.2 Major industries
All of the ERA districts have seen long-standing declines in manufacturing and risesin the service sector. Manufacturing in the UK has generally been on the declinesince the 1970s. In some districts, such as London, manufacturing remained steadythroughout the period of ERA’s implementation, while in other districts, such asScotland, manufacturing declines continued throughout ERA’s implementation.The majority of the population in each district generally works within the servicesector, although the predominant areas of employment within this sector varyacross the districts.
2.4.3 Unemployment in the ERA districts
As shown in Figure 2.3, unemployment in the six districts ranged from a low of fouror five per cent in the districts in the East Midlands, Scotland, and Wales, to a high ofaround eight or nine per cent in the district in North West England (Office forNational Statistics). The districts in London and North East England fell in the middle,at around six or seven per cent. Unemployment was relatively steady between 2003and 2005, though there were generally small dips in 2004 followed by increases in2005. This is congruent with the national trend. As Figure 2.1 shows, the datacollected for this report extended into 2005, so it is possible that some of the samplemembers might have been affected by this increase.
Sample and sites
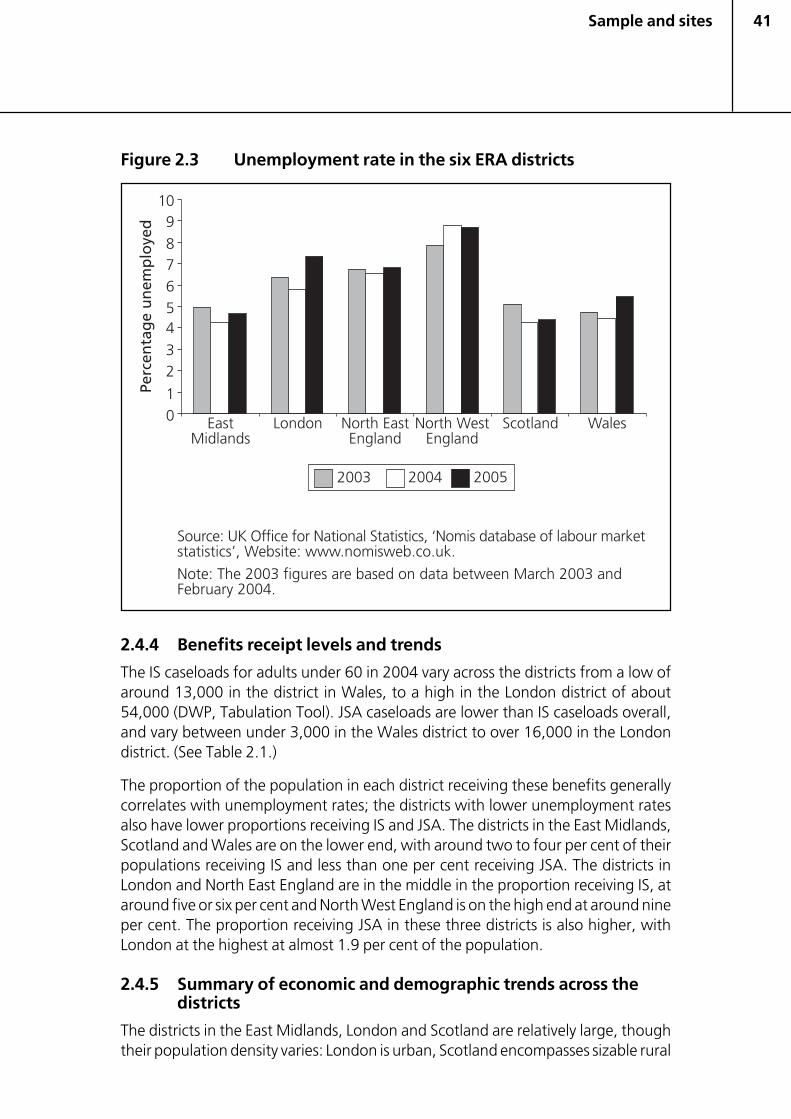
41
Figure 2.3 Unemployment rate in the six ERA districts
2.4.4 Benefits receipt levels and trends
The IS caseloads for adults under 60 in 2004 vary across the districts from a low ofaround 13,000 in the district in Wales, to a high in the London district of about54,000 (DWP, Tabulation Tool). JSA caseloads are lower than IS caseloads overall,and vary between under 3,000 in the Wales district to over 16,000 in the Londondistrict. (See Table 2.1.)
The proportion of the population in each district receiving these benefits generallycorrelates with unemployment rates; the districts with lower unemployment ratesalso have lower proportions receiving IS and JSA. The districts in the East Midlands,Scotland and Wales are on the lower end, with around two to four per cent of theirpopulations receiving IS and less than one per cent receiving JSA. The districts inLondon and North East England are in the middle in the proportion receiving IS, ataround five or six per cent and North West England is on the high end at around nineper cent. The proportion receiving JSA in these three districts is also higher, withLondon at the highest at almost 1.9 per cent of the population.
2.4.5 Summary of economic and demographic trends across thedistricts
The districts in the East Midlands, London and Scotland are relatively large, thoughtheir population density varies: London is urban, Scotland encompasses sizable rural
Sample and sites
42
areas, and the East Midlands falls in between. The three smaller districts also vary interms of their population density: North West England is urban, Wales hascomparatively more rural areas and North East England is in between. The two urbandistricts – London and North West England – also have relatively large ethnicminority populations.
The districts in the East Midlands, Scotland and Wales generally show strongereconomic trends; their unemployment rates are relatively low and small proportionsof the population claim JSA and IS benefits. The district in North West England, bycontrast, shows relatively weak economic trends; it has a high unemployment rateand a large proportion of its population claims benefits. The districts in London andNorth East England fall more in the middle.
2.5 The research sample for this report14
Within each district, the characteristics of the sample members vary as well. Thissection first provides a description of the overall sample for this report (which iscustomers randomly assigned between December 2003 and November 2004) bytarget group. It then provides details on some selected characteristics of the samplemembers in each district. A portion of these customers were interviewed for thecustomer survey, from which most of the data for the impact analysis in this reportis drawn. Overall, of the more than 16,000 people randomly assigned, over 13,000were randomly assigned between December 2003 and November 2004. Of thatgroup, 6,161 people responded (out of 7,412 sampled) to the 12-month customersurvey, and they are the main focus of the analyses presented in this chapter. Asmentioned in Chapter 1, the random assignment process worked correctly,15 and asseen in Table A.1, the characteristics of the programme and control group memberswere similar.
2.5.1 Characteristics by target group
For all the districts combined, among the 13,604 individuals randomly assignedbetween December 2003 and November 2004, the numbers entering the ERAsample from NDLP and ND25+ were almost identical; each made up around 45 percent of ERA entrants. About 11 per cent entered the research sample as lone parentsreceiving Working Tax Credit (WTC).16 These three groups have relatively differentsocial compositions, as the profile summarised in Table 2.2 shows.
14 Much of this section is drawn from an earlier report on the implementation ofERA (Hall et al., 2004).
15 The DWP published a report about the random assignment process in the ERAdemonstration (Walker, Hoggart and Hamilton, 2006) and a forthcoming reportwill investigate the issue of non-participation and its implications for interpretingthe results of the main impact study.
16 Due to rounding, percentages may not sum to 100 per cent.
Sample and sites

43
Table 2.2 Demographic profile of all customers randomly assignedbetween December 2003 and November 2004
New Deal for New Deal WorkingCharacteristic Lone Parents 25 Plus Tax Credit
Gender (%)
Male 4.9 81.2 2.8
Female 95.1 18.8 97.2
Age (%)
Under 30 41.2 16.0 15.7
30-39 39.8 36.7 49.4
40 or older 19.1 47.3 34.9
Race/ethnicity (%)
Non-white 14.8 21.3 5.8
White 85.2 78.7 94.2
Education (highest qualification obtained)a (%)
None 23.2 36.6 13.9
GCSE 47.8 26.6 47.5
A-level 21.6 23.5 29.8
Other 7.4 13.3 8.7
Housing statusb (%)
Family 7.5 22.3 5.3
Social 66.3 44.4 41.1
Private 25.4 30.2 52.7
Other 0.8 3.1 0.8
Number of months worked in three yearsprior to random assignment (%)
None 50.8 45.9 1.4
1-12 22.7 33.5 13.7
13+ 26.4 20.6 84.9
No driving license or lack of access to vehicle (%) 67.9 76.9 36.0
Has barriers to workc (%) 65.0 63.1 65.8
Sample size 6,066 6,074 1,464
Source: MDRC calculations from baseline information forms completed by DWP staff.
Notes: Rounding may cause slight discrepancies in calculating sums and differences.Percentages shown are unweighted estimates.a Participants who have General Certificate of Secondary Education (GCSE) qualifications are
those who have passed a series of examinations in a variety of subjects, usually taken at age 15or 16. Participants with A-level qualifications have passed a series of more advancedexaminations usually taken around age 18 or older. Those with no qualifications havecompleted neither series of examinations.
b Family housing refers to situations where the customer is living with his/her parents, or otherfriends or relatives. Social housing refers to housing in which the Local Authority (localgovernment) or a private housing association is the landlord. Private housing refers to owner-occupied housing or housing that the customer rents privately.
c Barriers to work include housing, transport, childcare, health, basic skills or other problems.
Sample and sites
44
NDLP customers
NDLP customers are mostly young to middle-aged women; about 95 per cent arefemale. Over 80 per cent are under 40, and 21 per cent are non-white. This generallyaligns with the demographics of NDLP entrants nationwide.
NDLP customers face significant barriers to work. About a quarter have noeducational qualifications and just under half have reached GCSE level. Two-thirdslive in social housing (housing owned by the local authority or a private housingassociation), and only about a quarter live in privately-owned or privately-rentedaccommodation.17 Over two-thirds do not have a driving licence or access to avehicle, and almost two-thirds cite barriers to work (which can include housing,transport, childcare, health, basic skills, or other problems). Over half did not work atall in the three years prior to random assignment, and just over a quarter worked 13months or more during this period.
ND25+ customers
ND25+ customers in the research sample are largely older men – 81 per cent aremale, nearly half are age 40 or older, and 84 per cent are age 30 or older. Twenty-one per cent are non-white. These figures also generally align with national data onthe demographics of all ND25+ entrants. This group has a higher proportion of non-whites than either of the other two target groups.
The ND25+ group also faces significant barriers to work. More than a third – agreater proportion than the NDLP group – have no educational qualifications at all.A substantial proportion (44 per cent) live in social housing, although this is a smallerpercentage than the NDLP group and a greater percentage (30 per cent) live inprivate housing compared with the NDLP group. Less than a quarter of the ND25+customers have a driving licence and access to a vehicle. Two-thirds, a similarproportion to the NDLP group, cite that they have barriers to work. Almost half citeno work experience in the three years prior to random assignment, and only 20 percent say they worked more than a year during that time. Among a groupunemployed for 18 months or more, the duration of unemployment itself alsoconstitutes a considerable barrier to work.
WTC customers
Almost all of the WTC customers in the research sample are women. Nearly half arein their 30s, and another 35 per cent are age 40 or older.
17 The social housing sector now on the whole accommodates fewer than one infour British families with dependent children. Social housing provided by thegovernment is declining in the UK. However, housing subsidised by privatehousing associations is increasing, and demand for subsidised housing remainshigh as the cost of private homes is rising.
Sample and sites
45
The lone parents receiving WTC differ from the two non-employed New Deal groupsin ways that underscore the differences between groups who have been out of workand those who have worked more steadily. Over 80 per cent of the WTC groupreported working 13 months or more in the three years prior to random assignment.As they had to be working at the time of random assignment to enter ERA in theWTC group, very few reported no work experience in the three years prior torandom assignment.
This group also reported better qualifications than the two New Deal groups – abouta half to a third as many have no qualifications at all, and a greater percentage havequalifications beyond GSCE. Over half live in privately-owned or privately-rentedhousing, a proportion much greater than among the New Deal participants. Theyhave fewer transportation barriers as well; only one-third reported no driving licenceor access to a vehicle, compared with two-thirds of the out-of-work lone parentsand three-quarters of ND25+ sample members. However, the working lone parentswere equally likely to report that they faced barriers to work; in their case, they seemto have overcome these barriers.
It is difficult to compare the ERA evaluation’s sample of lone parents working part-time and receiving WTC with their equivalents elsewhere, as Jobcentre Plus does nothold data on this customer group. However, a comparison with an equivalent groupinterviewed for the 2001 Families and Children Survey (FACS) indicates that theyface similar housing and transportation barriers.
2.5.2 Characteristics in each district by target group
Much of the analysis in this report is conducted at the district level. In order tounderstand the characteristics of sample members across the districts, Table 2.3presents selected data regarding customers’ educational experience, housingsituations, and prior work experience, broken down by target group and district.
NDLP customers
The NDLP group varies somewhat across the districts in terms of customers’educational experience and housing situations, and varies more so in terms of theirprior work experience. However, none of the districts stands out as having the mostor least disadvantaged NDLP customers. The Scottish district is notable for itsrelatively high percentage of customers with more extensive work experience, whileLondon stands out for its high percentage with little work experience. However,customers in London are generally better educated and it is the customers in Waleswho are the most likely not to have any educational qualifications. A higherproportion of customers in North East England and North West England live in socialhousing, while a lower proportion in the East Midlands live in social housing.
Sample and sites
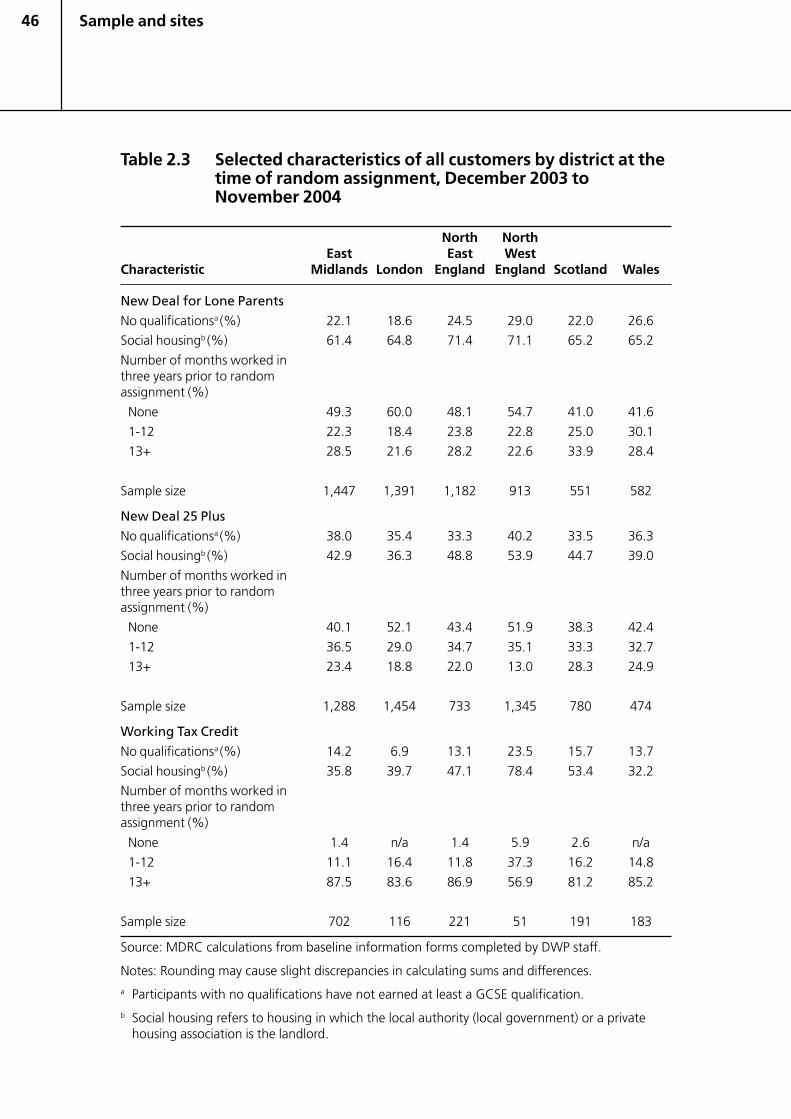
46
Table 2.3 Selected characteristics of all customers by district at thetime of random assignment, December 2003 toNovember 2004
North NorthEast East West
Characteristic Midlands London England England Scotland Wales
New Deal for Lone Parents
No qualificationsa (%) 22.1 18.6 24.5 29.0 22.0 26.6
Social housingb (%) 61.4 64.8 71.4 71.1 65.2 65.2
Number of months worked inthree years prior to randomassignment (%)
None 49.3 60.0 48.1 54.7 41.0 41.6
1-12 22.3 18.4 23.8 22.8 25.0 30.1
13+ 28.5 21.6 28.2 22.6 33.9 28.4
Sample size 1,447 1,391 1,182 913 551 582
New Deal 25 Plus
No qualificationsa (%) 38.0 35.4 33.3 40.2 33.5 36.3
Social housingb (%) 42.9 36.3 48.8 53.9 44.7 39.0
Number of months worked inthree years prior to randomassignment (%)
None 40.1 52.1 43.4 51.9 38.3 42.4
1-12 36.5 29.0 34.7 35.1 33.3 32.7
13+ 23.4 18.8 22.0 13.0 28.3 24.9
Sample size 1,288 1,454 733 1,345 780 474
Working Tax Credit
No qualificationsa (%) 14.2 6.9 13.1 23.5 15.7 13.7
Social housingb (%) 35.8 39.7 47.1 78.4 53.4 32.2
Number of months worked inthree years prior to randomassignment (%)
None 1.4 n/a 1.4 5.9 2.6 n/a
1-12 11.1 16.4 11.8 37.3 16.2 14.8
13+ 87.5 83.6 86.9 56.9 81.2 85.2
Sample size 702 116 221 51 191 183
Source: MDRC calculations from baseline information forms completed by DWP staff.
Notes: Rounding may cause slight discrepancies in calculating sums and differences.a Participants with no qualifications have not earned at least a GCSE qualification.b Social housing refers to housing in which the local authority (local government) or a private
housing association is the landlord.
Sample and sites
47
ND25+ customers
ND25+ customers vary little across the districts in their educational background butvary more in their housing status and prior work experience. Again, none of thedistricts has clearly more or fewer disadvantaged customers. However, customers inNorth West England may be slightly more disadvantaged; relatively high percentageslive in social housing and lack significant prior work experience. Both North WestEngland and North East England have a high proportion of ND25+ customers livingin social housing (around half), while London is on the low end at around a third.North West England and London have high proportions of customers who did notwork any months in the three years prior to random assignment. They also have thesmallest proportion of customers who worked only 13 months or less. These twodistricts – the more urban districts – also have higher concentrations of non-whiteND25+ customers (not shown in Table 2.3). Customers in Scotland, on the otherhand, show relatively high levels of work experience; over a quarter reported thatthey worked 13 months or more in the three years prior to random assignment.
WTC customers
The WTC sample is not balanced evenly throughout the districts. Because there werechallenges in recruiting WTC sample members – as this group was not previouslyserved by Jobcentre Plus – WTC intake was relatively low across the districts. Variousmarketing measures were undertaken to increase intake, particularly in the EastMidlands district. This district also saw the greatest response to its outreach efforts;hence, almost half of the entire WTC sample is concentrated there.
There is wider variation in WTC customers’ educational experience, housing statusand prior work experience across the districts than there is for the other two targetgroups; because the sample sizes were small in five of the districts, district-levelanalysis was not undertaken extensively for the WTC target group. The analysisfocuses almost exclusively on the East Midlands district. Compared with the otherdistricts, WTC participants in the East Midlands district have somewhat more workexperience, and a relatively small proportion living in social housing. This makesthem perhaps somewhat more advantaged than WTC customers in the other fivedistricts. The proportion with no educational qualifications falls in the middlecompared with the other districts.
2.6 Data sources
This report discusses the implementation of the ERA programme, as well as earlyimpacts. In addition to the baseline data used above to describe the characteristics ofthe sample in this chapter, it makes use of a rich and varied set of quantitative andqualitative data. Table 2.4 shows each of these data sources in detail.
Sample and sites
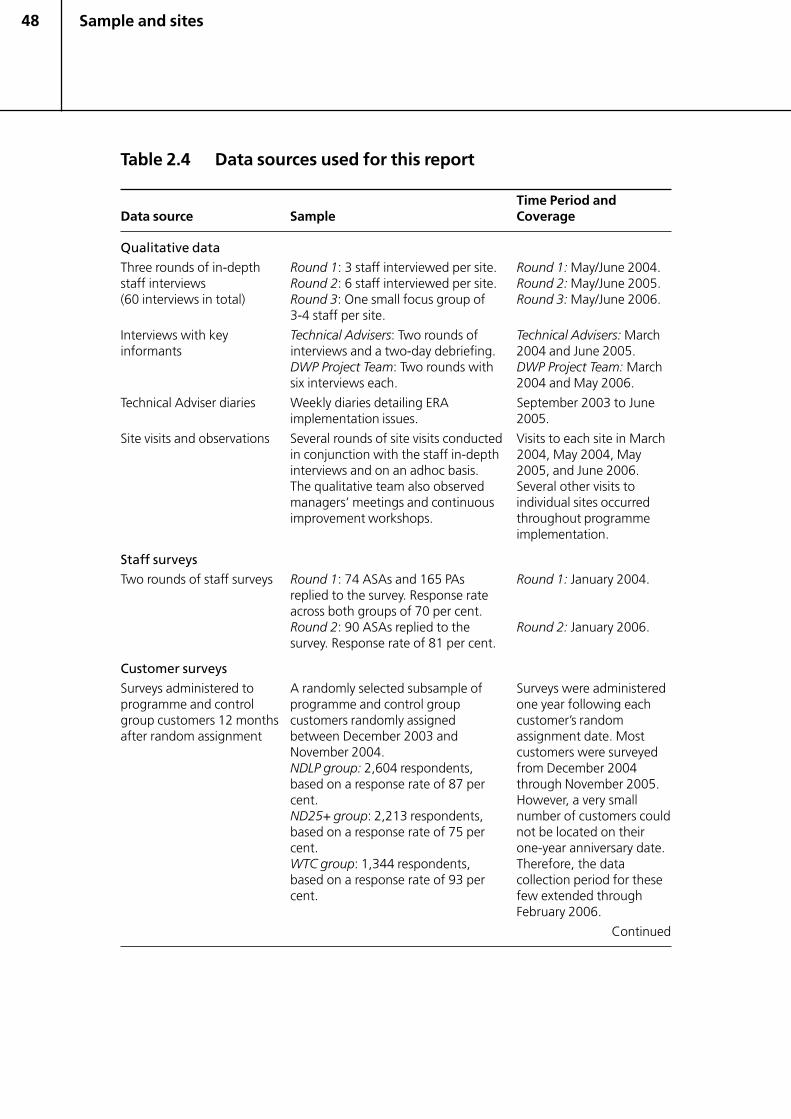
48
Table 2.4 Data sources used for this report
Time Period andData source Sample Coverage
Qualitative dataThree rounds of in-depth Round 1: 3 staff interviewed per site. Round 1: May/June 2004.staff interviews Round 2: 6 staff interviewed per site. Round 2: May/June 2005.(60 interviews in total) Round 3: One small focus group of Round 3: May/June 2006.
3-4 staff per site.
Interviews with key Technical Advisers: Two rounds of Technical Advisers: Marchinformants interviews and a two-day debriefing. 2004 and June 2005.
DWP Project Team: Two rounds with DWP Project Team: Marchsix interviews each. 2004 and May 2006.
Technical Adviser diaries Weekly diaries detailing ERA September 2003 to Juneimplementation issues. 2005.
Site visits and observations Several rounds of site visits conducted Visits to each site in Marchin conjunction with the staff in-depth 2004, May 2004, Mayinterviews and on an adhoc basis. 2005, and June 2006.The qualitative team also observed Several other visits tomanagers’ meetings and continuous individual sites occurredimprovement workshops. throughout programme
implementation.
Staff surveysTwo rounds of staff surveys Round 1: 74 ASAs and 165 PAs Round 1: January 2004.
replied to the survey. Response rateacross both groups of 70 per cent.Round 2: 90 ASAs replied to the Round 2: January 2006.survey. Response rate of 81 per cent.
Customer surveysSurveys administered to A randomly selected subsample of Surveys were administeredprogramme and control programme and control group one year following eachgroup customers 12 months customers randomly assigned customer’s randomafter random assignment between December 2003 and assignment date. Most
November 2004. customers were surveyedNDLP group: 2,604 respondents, from December 2004based on a response rate of 87 per through November 2005.cent. However, a very smallND25+ group: 2,213 respondents, number of customers couldbased on a response rate of 75 per not be located on theircent. one-year anniversary date.WTC group: 1,344 respondents, Therefore, the databased on a response rate of 93 per collection period for thesecent. few extended through
February 2006.
Continued
Sample and sites
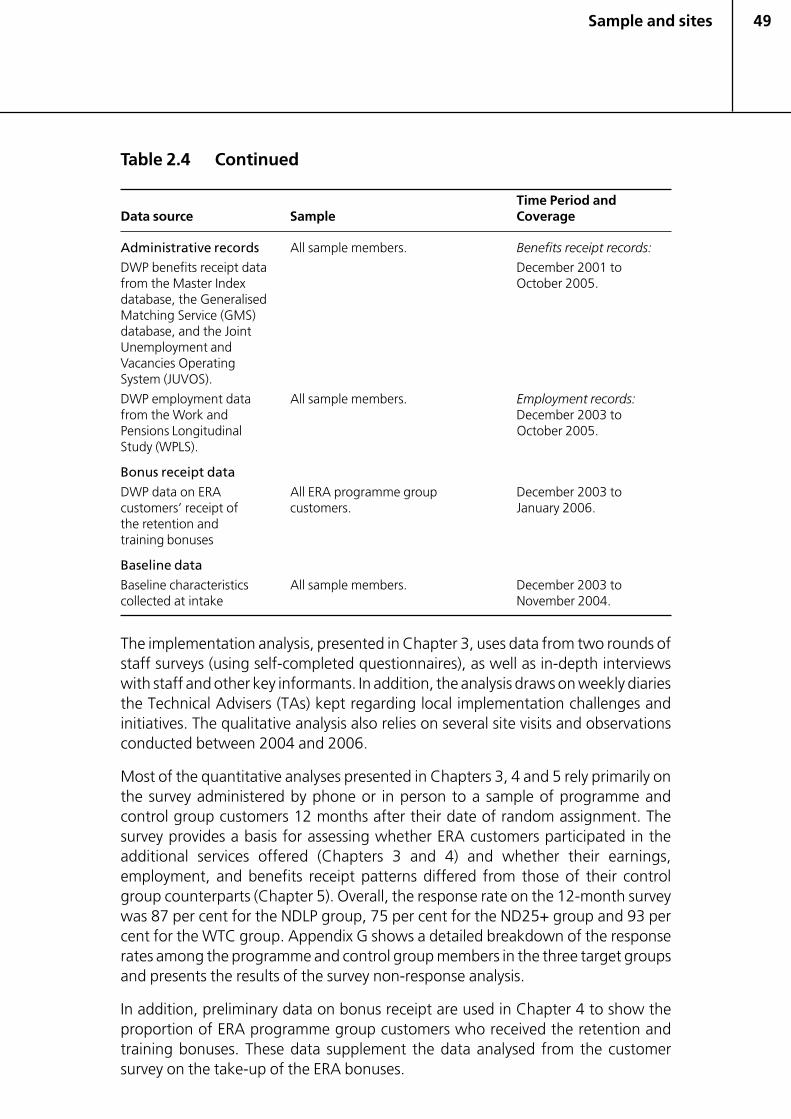
49
Table 2.4 Continued
Time Period andData source Sample Coverage
Administrative records All sample members. Benefits receipt records:
DWP benefits receipt data December 2001 tofrom the Master Index October 2005.database, the GeneralisedMatching Service (GMS)database, and the JointUnemployment andVacancies OperatingSystem (JUVOS).
DWP employment data All sample members. Employment records:from the Work and December 2003 toPensions Longitudinal October 2005.Study (WPLS).
Bonus receipt data
DWP data on ERA All ERA programme group December 2003 tocustomers’ receipt of customers. January 2006.the retention andtraining bonuses
Baseline data
Baseline characteristics All sample members. December 2003 tocollected at intake November 2004.
The implementation analysis, presented in Chapter 3, uses data from two rounds ofstaff surveys (using self-completed questionnaires), as well as in-depth interviewswith staff and other key informants. In addition, the analysis draws on weekly diariesthe Technical Advisers (TAs) kept regarding local implementation challenges andinitiatives. The qualitative analysis also relies on several site visits and observationsconducted between 2004 and 2006.
Most of the quantitative analyses presented in Chapters 3, 4 and 5 rely primarily onthe survey administered by phone or in person to a sample of programme andcontrol group customers 12 months after their date of random assignment. Thesurvey provides a basis for assessing whether ERA customers participated in theadditional services offered (Chapters 3 and 4) and whether their earnings,employment, and benefits receipt patterns differed from those of their controlgroup counterparts (Chapter 5). Overall, the response rate on the 12-month surveywas 87 per cent for the NDLP group, 75 per cent for the ND25+ group and 93 percent for the WTC group. Appendix G shows a detailed breakdown of the responserates among the programme and control group members in the three target groupsand presents the results of the survey non-response analysis.
In addition, preliminary data on bonus receipt are used in Chapter 4 to show theproportion of ERA programme group customers who received the retention andtraining bonuses. These data supplement the data analysed from the customersurvey on the take-up of the ERA bonuses.
Sample and sites
50
The survey data are supplemented by some data from DWP administrative records,particularly for benefit payments and employment rates. Earnings data fromadministrative records were not available at the time of analysis. Benefit receipt data,which were available and were determined to be reliable, are used in the impactanalysis in Chapter 5 to add detail to similar measures obtained from the survey.Employment data from the administrative records are also used in some impactsestimates for the NDLP and ND25+ groups, shown in Appendices E and G.
For the impact analysis in this report, data from the benefit receipt and employmentadministrative records were used only for the survey sample so that the populationsfrom all data sources would be consistent. Subsequent ERA reports will useadministrative records data more extensively and will include the full evaluationsample, as well as administrative data on earnings.
2.7 Summary and conclusions
ERA was launched in six regions across the UK during a period in which the Britisheconomy was relatively strong, though it declined somewhat in 2005. The localcharacteristics of the districts varied considerably in size, population density andracial/ethnic composition. They also differed in their unemployment trends. Thedistricts in the East Midlands, Scotland and Wales generally showed strongereconomic trends, while the district in North West England showed relatively weakeconomic trends. However, all of the districts faced a similar pattern of a decliningmanufacturing base and a large and increasing service sector.
In general, ERA customers faced significant barriers to work, such as low educationalqualifications and limited prior work experience. The majority of customers in allthree groups had no educational qualifications or only a basic qualification. Aparticularly high proportion of the ND25+ group had no qualifications at all. Both ofthe New Deal groups had little recent work experience; about half in each group hadnot worked at all in the three years prior to random assignment. The WTC group hadsignificantly more work experience. In addition, customers in the WTC group werefar more likely than those in the New Deal groups to live in privately-owned orprivately-rented housing. By contrast, almost two-thirds of the NDLP customerslived in social housing. There were some similarities and some differences across thedistricts in the proportion of customers with these barriers but no district stood outas having customers who were particularly disadvantaged.
Sample and sites

51ERA implementation
3 ERA implementation
3.1 Introduction
The previous chapters have demonstrated the rationale for Employment Retentionand Advancement (ERA) and outlined the details of the ERA design. This chapterassesses how the essential elements of the ERA model were implemented across thedistricts. ERA was innovative in that it aimed to extend the assistance that JobcentrePlus advisers gave customers beyond their entry into work. In ERA the idea was tocontinue to assist people while in work with incentives for full-time work andincentives for training, plus to provide in-work job-coaching to help customersretain work and advance. This was a major departure for Jobcentre Plus and anentirely new area of work for advisers.
Whereas Personal Advisers (PAs) worked with out-of-work customers, helping themtrain and find work, ERA’s Advancement Support Advisers (ASAs) continued tosupport customers after they entered work. Establishing this in-work supportfunction was the most challenging aspect of ERA’s implementation. The ASA was atotally new position in Jobcentre Plus. In the discussion that follows there is a strongfocus on understanding how well the ASAs were able to move beyond the typicaljob placement functions required of PAs and the relatively straightforward task ofadministering the incentive payments to fully embrace this post-employmentsupport role.
This chapter draws upon a number of different data sources (including the customersurvey, staff surveys, and qualitative interviews with staff) to reach a thoroughunderstanding of how the different districts delivered this new programme. It looksat the organisational structures put in place and the challenges that emerged duringthe course of implementation.
The qualitative data collected and analysed for this chapter extend from September2003 (one month before intake began) to the third set of qualitative interviews withERA staff ending in June 2006. These data thus extend beyond the time duringwhich early impacts have been measured in the following two chapters (see Box3.1). The reason for this is that it is important to show how the delivery of ERA has
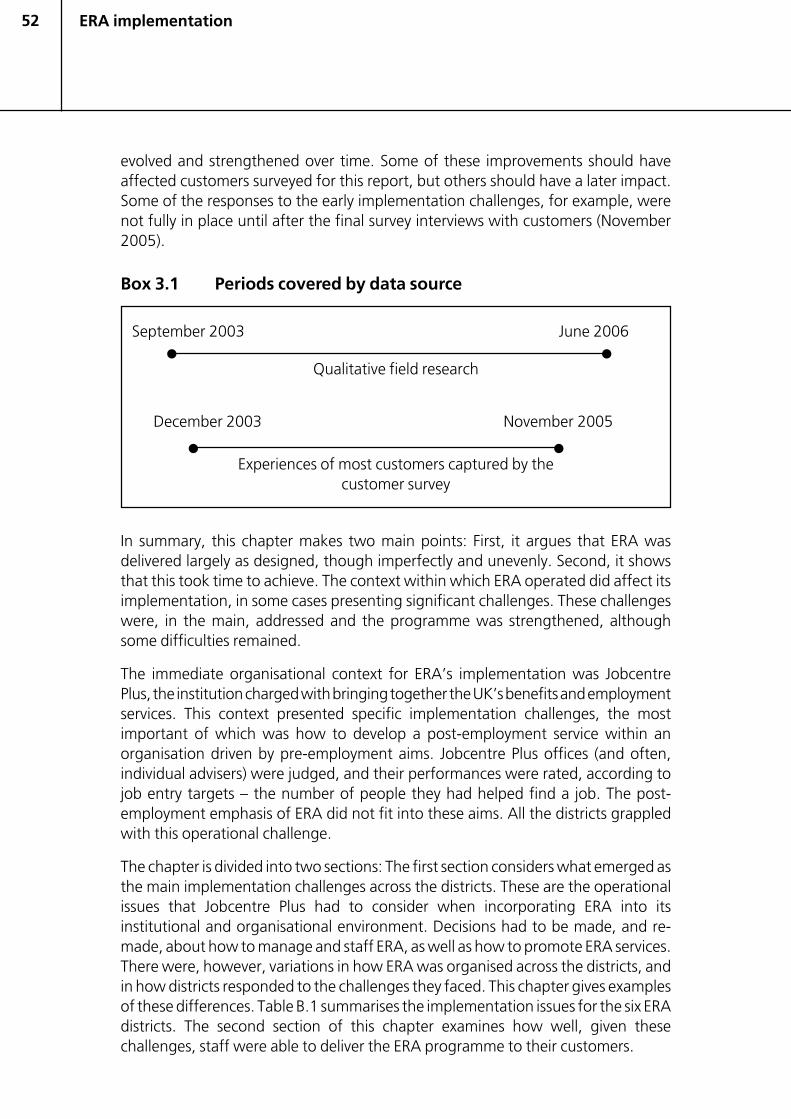
52
evolved and strengthened over time. Some of these improvements should haveaffected customers surveyed for this report, but others should have a later impact.Some of the responses to the early implementation challenges, for example, werenot fully in place until after the final survey interviews with customers (November2005).
Box 3.1 Periods covered by data source
September 2003 June 2006
� �
December 2003 November 2005
� �
In summary, this chapter makes two main points: First, it argues that ERA wasdelivered largely as designed, though imperfectly and unevenly. Second, it showsthat this took time to achieve. The context within which ERA operated did affect itsimplementation, in some cases presenting significant challenges. These challengeswere, in the main, addressed and the programme was strengthened, althoughsome difficulties remained.
The immediate organisational context for ERA’s implementation was JobcentrePlus, the institution charged with bringing together the UK’s benefits and employmentservices. This context presented specific implementation challenges, the mostimportant of which was how to develop a post-employment service within anorganisation driven by pre-employment aims. Jobcentre Plus offices (and often,individual advisers) were judged, and their performances were rated, according tojob entry targets – the number of people they had helped find a job. The post-employment emphasis of ERA did not fit into these aims. All the districts grappledwith this operational challenge.
The chapter is divided into two sections: The first section considers what emerged asthe main implementation challenges across the districts. These are the operationalissues that Jobcentre Plus had to consider when incorporating ERA into itsinstitutional and organisational environment. Decisions had to be made, and re-made, about how to manage and staff ERA, as well as how to promote ERA services.There were, however, variations in how ERA was organised across the districts, andin how districts responded to the challenges they faced. This chapter gives examplesof these differences. Table B.1 summarises the implementation issues for the six ERAdistricts. The second section of this chapter examines how well, given thesechallenges, staff were able to deliver the ERA programme to their customers.
ERA implementation
Qualitative field research
Experiences of most customers captured by thecustomer survey
53
3.2 ERA implementation across the districts
This section considers the implementation of ERA within Jobcentre Plus. As notedabove, ERA was a new programme that was not easily accommodated within theexisting structure. We, therefore, consider in more detail how such a departure from‘business as usual’ was organised within Jobcentre Plus, any difficulties that arose,and how these difficulties were dealt with.
In December 2002, the Cabinet Office design team handed responsibility forimplementing ERA to the Department for Work and Pensions (DWP), whichestablished a Project Team, to oversee the implementation of the programme, andan Evaluation Team. Districts had a certain amount of autonomy in how theyimplemented ERA, within the requirements of the programme and subject tooverview and monitoring by the Project Team. The role of six Technical Advisers(TAs) was also central to the implementation of ERA. The evaluation consortiumemployed the TAs, and they were independent of Jobcentre Plus. Continuing overthe first two years of ERA, the TAs were involved in all the key aspects of the project.They contributed to training, overseeing random assignment, and moving businessforward to concentrate on post-employment services, and generally functioned asthe ‘eyes and ears’ of the implementation and evaluation effort.
Through analysis of qualitative interviews with ERA district staff, managers, and keyinformants, as well as analysis of observational data, TAs’ diaries, and the staffsurvey, several themes can be identified as implementation challenges:
• targets: how to implement a non-target-driven service within a target-driveninstitution;
• project profile: the difficulty of attaining a high enough profile (i.e. organisationalpriority) for a new service that has different aims from the host institution;
• management and structure: how to manage a new service, with new staff postsand management, within a pre-existing structure;
• staff support: how to train and support staff in a new and challenging role.
Each of these areas must be considered within the context of Jobcentre Plus, whereERA was a ‘new’ and ‘different’ service. It was also an additional amount of work forthe districts to absorb, and had to be managed alongside everyday Jobcentre Plusactivities. The districts were given extra resources for ERA so that the project wouldnot undermine the work of Jobcentre Plus. However, these resources were not ring-fenced18 in the first year, and were often used to fund non-ERA work.
ERA implementation
18 Ring-fencing, as the name implies, involved setting aside staff and/or resourcesspecifically for ERA. If ring-fenced funds come into a district, the District Managercannot use these funds for any other Jobcentre Plus work. Likewise, an ERAring-fenced ASA should not be allowed to undertake any other Jobcentre Plusactivities.
54
There are many similarities in the challenges the districts faced, but there are alsodifferences, particularly in how districts dealt with these issues. Clear changes canalso be seen over time, as managers and staff developed new strategies and beganto understand how best to develop and deliver ERA services.
3.2.1 The target culture and the profile of ERA withinJobcentre Plus
Jobcentre Plus had a target-driven culture centred on job entry. Not all of the workassociated with ERA was seen to contribute towards these targets. This posed aproblem for Jobcentre Plus districts, which were tasked with the delivery of ERAwhile also having to meet job entry targets (that were not altered in any way due tothe presence of ERA). This tension resulted in competing demands and resources,even though, as discussed below, ERA districts were allocated additional resourcesfor the extra work.
Within Jobcentre Plus, PAs help New Deal customers find and enter work. Theyoften specialise according to the type of customer they are employed to help. Theirprincipal work involves job searching, although this can extend to finding appropriatetraining courses. However, under their prescribed role, they offer only limited post-employment assistance to customers. PAs gain points (varying by the type ofcustomer) for each customer who enters work. These points contribute towardstheir own performance targets, as well as towards the office and district targets bywhich Jobcentre Plus offices are monitored. The post-employment work of ERA didnot contribute towards these targets. On the contrary, it had the potential to takestaff away from job entry activities. Although this system later changed, discussionswill show that the targets system created problems relating to ERA’s profile, staffingand management.
In the 2006 staff survey, ASAs agreed that targets had adversely affected their abilityto fulfil their ERA role. As shown in Table 3.1, which presents responses to selectedsurvey questions from the January 2006 staff survey, when asked how much jobentry targets had made it difficult for them to regularly contact working ERAcustomers, 29 per cent said ‘a lot’ or ‘a great deal’. These tensions contributed to lowjob satisfaction of some ASAs, especially among those who divide their time withother adviser duties. Among these last, one said:
‘ERA should have been ring-fenced from the beginning. ASAs [were] pulled todo other NDLP work, and having to concentrate on job entries has had adetrimental effect on the ethos of ERA. Smaller caseloads and only coveringone site would have meant better customer service.’
ERA implementation
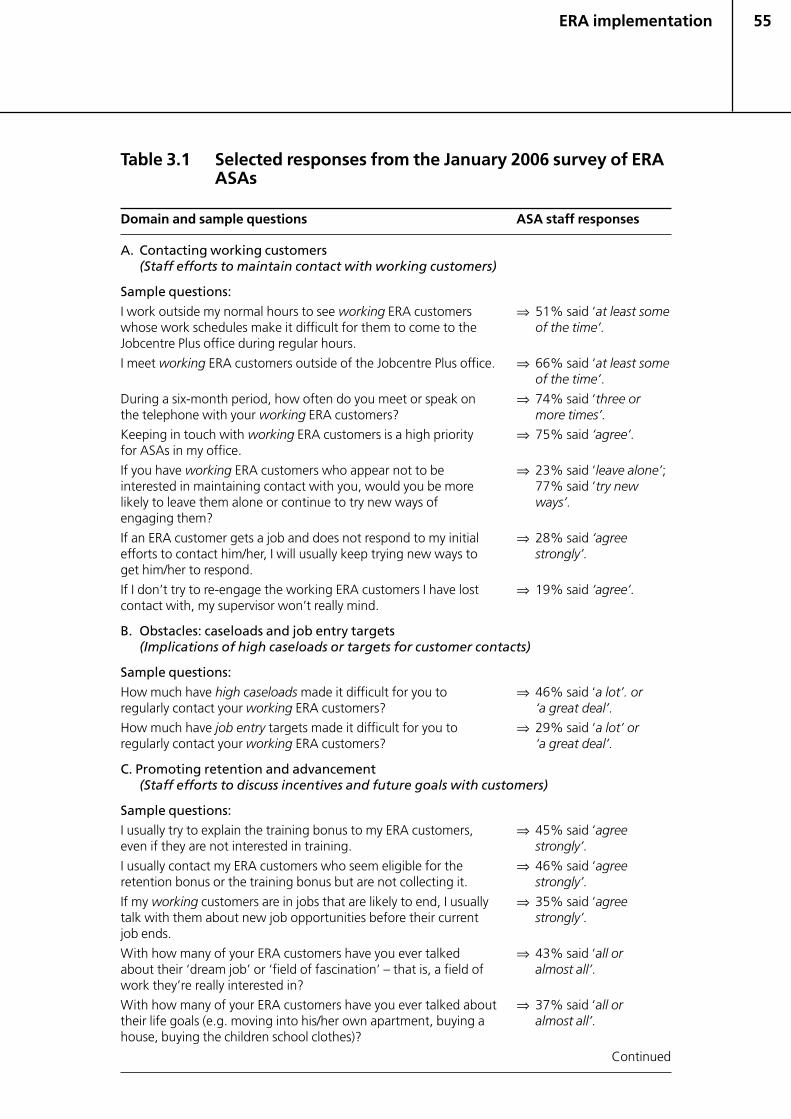
55
Table 3.1 Selected responses from the January 2006 survey of ERAASAs
Domain and sample questions ASA staff responses
A. Contacting working customers(Staff efforts to maintain contact with working customers)
Sample questions:
I work outside my normal hours to see working ERA customers ⇒ 51% said ‘at least somewhose work schedules make it difficult for them to come to the of the time’.Jobcentre Plus office during regular hours.
I meet working ERA customers outside of the Jobcentre Plus office. ⇒ 66% said ‘at least someof the time’.
During a six-month period, how often do you meet or speak on ⇒ 74% said ‘three orthe telephone with your working ERA customers? more times’.
Keeping in touch with working ERA customers is a high priority ⇒ 75% said ‘agree’.for ASAs in my office.
If you have working ERA customers who appear not to be ⇒ 23% said ‘leave alone’;interested in maintaining contact with you, would you be more 77% said ‘try newlikely to leave them alone or continue to try new ways of ways’.engaging them?
If an ERA customer gets a job and does not respond to my initial ⇒ 28% said ‘agreeefforts to contact him/her, I will usually keep trying new ways to strongly’.get him/her to respond.
If I don’t try to re-engage the working ERA customers I have lost ⇒ 19% said ‘agree’.contact with, my supervisor won’t really mind.
B. Obstacles: caseloads and job entry targets(Implications of high caseloads or targets for customer contacts)
Sample questions:
How much have high caseloads made it difficult for you to ⇒ 46% said ‘a lot’. orregularly contact your working ERA customers? ‘a great deal’.
How much have job entry targets made it difficult for you to ⇒ 29% said ‘a lot’ orregularly contact your working ERA customers? ‘a great deal’.
C. Promoting retention and advancement(Staff efforts to discuss incentives and future goals with customers)
Sample questions:I usually try to explain the training bonus to my ERA customers, ⇒ 45% said ‘agreeeven if they are not interested in training. strongly’.
I usually contact my ERA customers who seem eligible for the ⇒ 46% said ‘agreeretention bonus or the training bonus but are not collecting it. strongly’.
If my working customers are in jobs that are likely to end, I usually ⇒ 35% said ‘agreetalk with them about new job opportunities before their current strongly’.job ends.
With how many of your ERA customers have you ever talked ⇒ 43% said ‘all orabout their ‘dream job’ or ‘field of fascination’ – that is, a field of almost all’.work they’re really interested in?
With how many of your ERA customers have you ever talked about ⇒ 37% said ‘all ortheir life goals (e.g. moving into his/her own apartment, buying a almost all’.house, buying the children school clothes)?
Continued
ERA implementation
56
Table 3.1 Continued
Domain and sample questions ASA staff responses
D. Priority on retention/advancement(Priority given in practice to retention/advancement goals)
Sample questions:In practice, what level of priority do you think these differentaspects of ASAs’ work with ERA customers have in their day-to-daywork?
Helping working ERA customers get promotions, pay rises, or ⇒ 43% said ‘a lot’ orbetter jobs ‘the highest priority’.
Helping working ERA customers engage in a training or education ⇒ 56% said ‘a lot’ orcourse without giving up their job ‘the highest priority’.
Helping working ERA customers keep jobs ⇒ 58% said ‘a lot’ or‘the highest priority’.
In your office what level of priority is given by management tothese different aspects of ERA work by ASAs?
Helping working ERA customers increase their job skills ⇒ 40% said ‘a lot’ or‘the highest priority’.
Helping working ERA customers get promotions, pay rises, or ⇒ 45% said ‘very little’better jobs or ‘none’.
E. Job satisfaction(Staff perceptions of their jobs)
Sample questions:
Taking everything into account, how satisfied or dissatisfied do you ⇒ 75% said ‘veryfeel about the work you do in this post? satisfied’ or ‘fairly
satisfied’.
My job makes good use of my abilities. ⇒ 78% said ‘agree’ or‘agree strongly’.
I feel valued by my line manager. ⇒ 66% said ‘agree’ or‘agree strongly’.
How would you rate the training you have received to help ERA ⇒ 55% said ‘excellent’ orcustomers keep jobs and advance in work? ‘good’; 45% said ‘fair’
or ‘poor’.
Staff also raised the question of performance targets in the qualitative interviews asa significant issue throughout all of the districts, and strongly felt that the JobcentrePlus practice of measuring staff performance by job entries had implications forwork with ERA customers.
Although not all ERA staff had individual job entry targets, most felt the demands ofworking within a firmly entrenched system that measured performance by jobentries, and in which ASAs had to contribute towards achieving their districts’ jobentry targets, distracted them from their work on ERA. Even when ASAs were notexpected to contribute towards district job entry targets, staff sometimes werepulled off ERA work to cover absences of staff who were contributing towardstargets.
ERA implementation
57
Most significantly, the target-driven culture restricted the amount of post-employmentwork that could be undertaken. As more ERA programme customers moved intoemployment, advisers were not able to spend as much time as was required becausethis post-employment assistance did not help staff achieve their targets. This did notexclude all post-employment work, and did not seem to affect the administration ofthe retention bonus, but it did make it difficult to give full attention to the supportiverole called for by the ERA model. Certainly in the first year (roughly 2004), and to alesser extent in the second, staff felt that they were not delivering the ERA‘treatment’ effectively, particularly for post-employment customers, largely as aresult of targets.
In April 2006, job entry targets were replaced with job outcome targets. The aim ofthese was to encourage advisers and customers to aim for better jobs rather thanjust any job. It remains to be seen whether this affected ERA.
The emphasis on job entry targets within Jobcentre Plus had implications for howthe project was regarded within the district – the profile of ERA. When ERA was notjudged to be a central aspect of the work of Jobcentre Plus, it was difficult for it toattain a high profile, in which advisory staff and managers at all levels activelypromoted the programme within the districts. In turn, ERA’s relatively weak profilemade it difficult for the programme to operate effectively. As ERA competed forresources within the districts, it would have needed vigorous promotion and acorrespondingly high profile to ensure that sufficient resources, principally stafftime, were available. This became rather a vicious circle. Some staff attributed theweak profile of ERA to the job entry ethos:
‘I don’t think it’s got the kudos because retention and advancement ofcustomers do not bring in the points that Jobcentres work to.’
All districts encountered problems related to lack of senior management support forERA at some point over the two years of implementation, and staff saw this asimpeding the successful delivery of ERA. Three of the districts were also runningIncapacity Benefit (IB) pilots (East Midlands, Scotland and North East England). Inthese cases, ERA staff always felt that the IB pilots had the highest profile and talkedabout district managers conveying a central government message that these pilotswere more important than ERA.
The perception of poor senior manager support impacted on morale and left stafffeeling ERA did not have the profile it deserved. Where, and when, the profile of ERAwas higher, staff felt that it was more likely to be well resourced. This varied acrossdistricts and over time. Factors that influenced the degree of senior managementsupport for ERA included individual changes in managers, district restructuring, andchanging understandings of ERA. Changing such understandings was one task ofthe central DWP Project Team. In 2004, this team identified weak senior managersupport for ERA and an accompanying lack of resources as an early implementationproblem. Project Team members, with varying degrees of success, continuouslytried to convince senior managers of the value and importance of ERA. One earlyeffort was judged to be partially effective. At a District Managers’ meeting in August
ERA implementation
58
2004, managers generally acknowledged that they had not realised the prioritygiven to ERA, partly because they had not ‘seen Ministers’ backing the launch ofERA. One manager commented:
‘The IB Reform is the number one priority; it’s the Government’s priority andit’s the number one priority in the district.’
The problem of a lack of senior management ‘buy-in’ to ERA impacted upon theeffectiveness of ERA managers who had been assigned the role of managing ERAadvisers and running the programme. They were themselves new to the ideas andaims of ERA, and struggled to establish the new programme within Jobcentre Plus.
3.2.2 Management and structure
How the management of ERA itself was integrated into existing Jobcentre Plusoperations varied, and decisions about how ERA was to be managed correspondedto district decisions about the structure of ERA. The ERA design had envisaged thata dedicated ERA manager would run ERA with a team of ASAs who would work onlyon ERA. In practice, this was difficult to achieve. The ways in which the districtsdiverged from this model (connected to the profile of ERA) reinforced the difficultythat staff had in undertaking their ERA work. If their immediate line manager wasnot dedicated to ERA, it was difficult to prioritise their work with ERA customers,especially those who had entered work. Management structures, however, changedover time, even within districts.
The districts adopted variations of centralised or decentralised managementstructures. The centralised system is closer to the ERA model. One ERA managercovers the whole district, with local ASA managers operating at the office level. Thiswas the most common approach. However, even in districts where ERA managersmanaged the ERA staff, the Jobcentre Plus Business Managers19 in their officesmight also line-manage the staff (a dual management structure). The staff were,therefore, answerable to two different managers. This was particularly difficult forthe ERA staff who worked as both ERA and non-ERA advisers. It is here that many ofthe tensions around implementation developed, not least in relation to determininghow ASAs spent their time.
Under the decentralised system, non-ERA managers managed ERA staff at officelevel. There was thus a tendency, given competing demands and the target structurediscussed above, for ERA’s assistance to working customers to be sidelined.
The role of line management was explored in the staff survey. In January 2006, eventhough three-quarters of the staff surveyed said that staying in contact with workingERA customers was a priority for ASAs in their office, 19 per cent said their supervisorwould not mind if they did not try to re-engage working customers with whom theyhad lost contact (see Table 3.1). Staff perceptions of management support for their
ERA implementation
19 Business Managers were responsible for all the business conducted by individualJobcentre Plus offices.
59
ERA work have the potential to affect ERA’s delivery (see the staff survey report inSupplemental Appendix AA.)20 This issue was therefore also explored in thequalitative interviews with staff.
In districts where there was no centralised management structure, ERA staff felt thatthis weakened the implementation of ERA. This was particularly stark in the onedistrict where two structures operated. In London, staff felt that the New Deal 25Plus (ND25+) ERA team would have been better off with the type of centralisedmanagement adopted by the New Deal for Lone Parents (NDLP) team. There was astrong view throughout all the districts that the optimum structure and managementof ERA was centralised management and dedicated ERA teams. This would haveinvolved ring-fencing ERA resources and work, as had been envisaged in the originalERA design.
Staff also felt that, even in some of the centralised management systems, ERAmanagers sometimes struggled with the implementation of ERA. This may bebecause they lacked a background in advising and the necessary skills to supportASAs, or when they had no authority over Business Managers who were alsomanaging ASAs at the office level (dual management structure). Because ERAmanagers were often at the same grade as local Business Managers, they wereunable to override local decisions regarding time spent on non-ERA work. WhereERA staff were also line-managed in this way at the office level, ERA managers oftenstruggled to supervise the work of the ASAs. As an ASA in North West Englandcommented on the consequences of being line-managed at office level:
‘She [the ERA manager] can say so much, you come back to your office, it’swithin the office whether they allow you to do that.’
When non-ERA managers managed ERA staff, staff felt that they continuallystruggled to prioritise ERA work, and were often called away to help with otheroffice work. This was especially true for post-employment work.
The ‘pure’ centralised management system that staff preferred was adopted by onlytwo districts: Wales and the East Midlands. Only one of these districts (EastMidlands), however, also employed ring-fencing consistently. The ring-fencingensured that ASAs were employed only to work on ERA-related tasks. This ensuredthat ASAs not only were excused from the responsibility of contributing towardstargets and were no longer involved in the day-to-day operations of ERA, but alsothat they answered to only one management structure.
London and North West England also attempted to reduce the pressures of non-ERA-related work on ASAs by organising staff into new teams: Post-EmploymentTeams (PETs) worked solely with ERA post-employment customers. ASAs in theseteams, in theory, were not involved in the day-to-day operations of the JobcentrePlus office and did not have to contribute towards targets. The sole task of ASAs in
ERA implementation
20 Supplemental appendices: implementation and first-year impacts of the UKERA demonstration is found on the DWP Website in conjunction with this report.
60
such teams was to work with ERA customers only after they had moved into work.ASAs would either work with all three customer groups (generalists) or specialise inone or more group (specialists). North East England also tried this approach, only tofind that it did not complement their existing Jobcentre Plus management structureand had to be abandoned.
Caseloads
In the qualitative interviews, many staff complained of high caseloads, and thoseASAs with high caseloads said that they were not able to deliver ERA according toguidelines. Customer intake and staff ratios varied widely across districts as,therefore, did ASA caseloads. Some ASAs reported caseloads of as many as 120 ERAcustomers, although the Project Team had specified an optimum of 70, in line withstandard Jobcentre Plus guidance (and therefore applied to control group customers).
Most districts took time to build up what they thought was a satisfactory number ofstaff, although some districts suffered more than most. One of the districts, forexample, noted that it did not have anything approaching a full complement ofadvisers until summer 2005:
‘I think that come July of this year we will have something like 37 fully trainedadvisers. But that’s taken a year and eight months.’
An additional problem was that in more rural districts, caseloads built up in largeoffices, but ASAs in smaller offices were underoccupied. This was dealt with eitherby ASAs undertaking non-ERA work, or by ASAs covering more than one office. Thiswas particularly acute in Wales, where at one point (spring 2004) there were onlytwo ND25+ ASAs covering all the offices; therefore, some staff were covering threeor four offices and had to spend a significant amount of time travelling as well asmanaging comparatively high caseloads.
The obvious implications of some of the management structures adopted by thedistricts were that staff felt many pressures on their time and struggled to deliverpost-employment services. In 2004-05, these pressures were exacerbated by theperceived need to reduce staff within Jobcentre Plus, and therefore, generalpressure on limited resources. A summary of the different structures for the districtsis provided in Table B.1.
3.2.3 Staff support
ERA, especially the post-employment element of the programme, was a completelynew area of work for Jobcentre Plus. There was thus a need for ERA advisers (andmanagers) to receive training and continuing support so that implementation couldproceed smoothly. The complexity of this task was illustrated by the staff responsesto their training and support. On the whole, the training was well received, but staffwould have appreciated more training and at an earlier stage. Likewise, they werepositive about the support they received, principally from the TAs, but would haveliked more. This was particularly the case for the post-employment support workthey were being asked to undertake.
ERA implementation
61
Training
In the January 2006 staff survey, ASAs were asked to rate the training they received‘to help working ERA customers keep jobs and advance in work’. Although morethan half rated the training as either excellent or good, 45 per cent rated it as fair orpoor (see Table 3.1). Written comments associated poor ratings with the timing ofthe training as opposed to its content. In particular, it was felt that the training onadvancement was delivered too late (see Supplemental Appendix AA).
Training was delivered to meet the different stages of ERA, such as intake, and later,post-employment work. When interviewed, staff identified two areas as creatingparticular problems for ERA’s delivery: training new staff and post-employmenttraining. They saw training new staff, particularly those who were new to JobcentrePlus, as creating problems because of the amount of time it could take. Their copingstrategies included new staff shadowing existing staff and managers offeringinterim training. New staff training can be identified as a significant problembecause there is a high turnover of staff working on ERA, as in Jobcentre Plusgenerally (a problem the Project Team also identified).
Staff mentioned ERA’s advancement element as a particular area where they feltthat they had not had sufficient training and support at an early stage of ERAoperations. Two formal phases of post-employment training, organised by theProject Team and the TAs, sought to address this need. The first, a ContinuousImprovement Workshop, held in March 2004, included a training session with aspecialist trainer from the United States. In a second round of post-employmenttraining, held in January 2005, the same trainer ran sessions in each of the sixdistricts. In addition to these nationally organised activities, the TAs and ERAmanagers organised additional training locally.
Some ASAs thought that the March 2004 workshop had been held too soon, beforethey were delivering post-employment services, and talked about forgetting themessages. Most of the staff interviewed who had attended this training, however,thought that it was rather late. They recounted how it was only after this workshopthat they began to understand how they might work on advancement withcustomers.
The delivery of the second round of specialist training was widely welcomed andpraised, as it addressed the identified need to build ASA’s capacity to provide in-work assistance focused on advancement. Many felt that this training should havebeen offered sooner, as ASAs had already begun delivering a post-employmentservice that they had developed by learning on their feet.
Technical Advisers
Much of this ‘learning on their feet’ was aided by other sources of support availableto the ASAs, primarily the TAs. ASAs and their immediate managers saw the TA roleas a vital source of support and ASAs, in particular, felt that the implementation ofERA would have been much weaker without the TAs. Managers highlighted the
ERA implementation
62
value of the TA as someone who could feed back information from a position ‘on theground’ within offices, and also valued TAs’ independence from Jobcentre Plus aswell as their level of experience and competence.
However, there were some issues regarding the role of the TAs. Staff expressedsome uncertainties about whether the TAs were focusing too strongly on theresearch side of the role rather than helping the successful implementation of theprogramme. They also identified tensions in the demarcation of the TA role vis-à-visthat of ERA managers. It was not always clear, for example, where the TA advisoryrole ended, and how far TAs could, and perhaps should, help with the managementof ERA. The TAs responded in different ways to this pressure, with at least one caseof conflict that proved problematic. The Project Team felt that the TAs, at times, gotin the way of effective management of the ASAs; at least one member of the ProjectTeam believed that the TAs acted as a buffer to managers’ involvement with ERA.Despite these tensions, the work of the TAs contributed towards the continualimprovements made in the delivery of ERA, and the functions they fulfilled would beneeded for the successful implementation of a programme as ambitious as ERA. Thisis primarily because of the intensive early training and support needs of the staff. Itis also noteworthy that four of the six districts eventually hired the TAs to work onERA after their term as TAs had expired.
ERA staff also cited district ERA meetings, attended by all ERA staff and held in all thedistricts with varying frequency, as an important form of support. They highly valuedthese meetings as a forum where they could air problems and issues arising in day-to-day ERA work and collectively find solutions. They also valued them as opportunitiesto share experiences, provide mutual support and deliver continuing training.Informal contact among ASAs and with managers (such as being in the same officeor making phone calls to one another) was another common form of support.
The DWP Project Team also sought to promote peer learning across districts.Towards that end, it initiated quarterly in-person meetings of the ERA managers todiscuss best practices and other issues of mutual concern.
Staff performance measures
It was evident that staff struggled with the challenge of developing a new role withinJobcentre Plus. One aspect of this was the difficulty of working in a target-drivenculture when there were no performance benchmarks specific to ERA. The ProjectTeam addressed this in Continuous Improvement Workshops and by encouragingthe development of benchmarks.
Managers saw the lack of targets for ERA as making it difficult to assess the work ofASAs. In particular, as there were no measures for assessing the post-employmentdelivery of ERA at the outset, ERA managers commented that it was difficult toassess work that could not be quantified, especially in relation to advancement.
By the second round of qualitative staff interviews, there was more evidence ofbenchmarks for ASAs to work towards, although this was not found across all the
ERA implementation
63
districts (see Table B.1). In the East Midlands, for example, in early 2005 a benchmarkfor post-employment contact was introduced (a once-a-month minimum). This waslater relaxed, as it was seen as quite rigid, but at the time it had proved an importantspur in encouraging proactive post-employment work. In the same district in April2005, key work objectives, based on the three elements of ERA, were introduced.ERA managers wanted to see that staff were actively engaging all ERA customers,helping them retain employment and encouraging them to actively advancetowards long-term job goals. The evidence they considered included: customertake-up of the retention bonus, training fees and training bonus, and also detailsfrom customers’ individual files, such as whether they were increasing their hours,getting higher wages or achieving promotion.
Monitoring also included managers sitting in on interviews, checking diaries,looking at customer feedback, examining what training was being offered and usedand checking spreadsheets (e.g. to identify customer contacts). Such monitoringwas more evident in the second stage of interviewing, when staff were less likely tobe assessed by job entry points. However, even where monitoring was occurring,ASAs were not always aware of it, and its frequency varied among districts. Still, bythe time of the 2006 staff survey, only half of ASAs said they had benchmarks ortargets for how soon or how often they should make contact with workingcustomers (see Supplemental Appendix AA).
The data sources all draw attention to the complex nature of the ERA programme inoperation. The implementation of ERA was not straightforward, and theorganisational context often limited the resources, predominantly time, that werecommitted to the programme. This situation improved considerably over time, butwas always fragile. We now turn to a consideration of how the programme wasdelivered to ERA customers.
3.3 Delivery of ERA: working with customers
As noted earlier, the ERA treatment delivered ‘on the ground’ in Jobcentre Plusoffices often differed across and within the districts from the design outlined inChapter 1. There were also variations by customer group, and, more importantly,variations over time, as the programme became embedded and as the Project Teamand the TAs sought to make continual improvements in ERA’s delivery. This sectionbegins by discussing how staff worked with ERA customers, first considering pre-employment support and second, post-employment support. It then discusses whatstaff have learnt about the attitudes of different customer groups towards theprogramme. The qualitative staff interview data drawn on were collected at threepoints in time: in the spring of 2004, 2005 and 2006, and show clear change overtime in the delivery of ERA. The staff surveys were conducted in January 2004 andJanuary 2006. The quantitative data on participation from the customer survey werecollected throughout 2005.
ERA implementation
64
3.3.1 The ERA treatment: pre-employment support21
For the New Deal customers, those in the ERA programme group received essentiallythe same pre-employment intervention as their counterparts in the control group.However, it was hoped that, for the programme group, the pre-employment phasewould initiate a longer-term relationship with ERA ASAs, who would begin toprompt customers to think about retention and advancement even before theystarted work. The implementation research indicates that ASAs found this difficult,especially during the first year (roughly 2004) of ERA operations when they had littleor no practical experiences of supporting customers in the post-employment phase.The first task facing advisers was how to engage ERA customers. They then had to tryto ensure that they were aware of all that ERA had to offer.
Because the two New Deal programmes are quite different, the two customergroups had a different experience of the ERA programme. ND25+ is a mandatoryprogramme with a prescribed timetable of structured activities (Gateway, IntensiveActivity Period and Follow-Through), whereas NDLP is a voluntary programme led bythe needs or wishes of the customer.22
Particularly during the early stages of the ERA programme, advisers had difficultymaintaining contact with ND25+ customers who had finished the New Dealprogramme (the pre-employment phase of ERA) without finding work and hadreturned to the ‘mainstream’, which entails fortnightly visits to Jobcentre Plus toclaim benefits but does not require contact with an adviser. They also struggled tokeep in touch with ND25+ customers who moved from Jobseeker’s Allowance (JSA)to a different benefit (e.g. IB) and had, therefore, moved to a different section inJobcentre Plus. In both cases, advisers had to be considerably proactive to maintaincontact, and many such out-of-work customers became disengaged. With NDLPcustomers, given the voluntary nature of the programme, there was a risk ofcustomers changing their minds about wanting to work and ‘drifting away’ from theprogramme, usually because family circumstances had changed.
In the first year of the programme, in contrast to the ERA model outlined in Chapter1, the majority of ASAs saw ERA as an in-work programme. They were doing little topromote retention and advancement to customers before they found work, otherthan reminding them about the financial incentives that would become availableonce they entered work. In 2004, ASAs reported that they felt it premature to askcustomers to start thinking about advancement until they were settled into a job.They often viewed work retention as a precondition for advancement, andexpressed reluctance to ‘push’ their customers too hard in the first months of workuntil they were perceived to be ready to take the ‘next steps’. ERA programme group
ERA implementation
21 Pre-employment also refers to customers who may have entered work at somestage, but have not retained their jobs and have, therefore, entered thepre-employment stage again.
22 See Chapter 1 for a more detailed account of ND25+ and NDLP.
65
customers were, therefore, treated little differently, before entering work, than theircontrol or non-ERA counterparts (participating in the same New Deal programmes).
By and large, ASAs did not encourage customers to be selective when it came tofinding a job. Similarly, ASAs also said that they undertook job searches for ERAcustomers in much the same way as they did (or had done previously) for other NewDeal customers. Some, particularly those who had non-ERA customers on theircaseload, saw this as a question of ‘fairness’, expressing an ethical commitment todo ‘the best’ for all of their customers.
This ‘business as usual’ approach was also reflected in action planning. AdvancementAction Plans were supposed to be used by ASAs to record customers’ long-termaspirations for advancement at the time of their initial enrolment on the programme.However, advisers were also required to complete a (shorter and simpler) New DealAction Plan, containing immediate job goals, for each customer. Many advisers feltthat these two plans duplicated one another, and in the interests of time, simplyused the New Deal Action Plan until customers entered work. Thus, a procedurewhich should have ensured that advisers would encourage customers to think aboutadvancement from the start was not initially utilised.
The qualitative data also reveal considerable variation in the types of support offeredto ERA programme group customers, both by customer group and, more significantly,over time. By 2005, things had changed dramatically, due to staff training andorganisational changes. While there were some differences across districts and staffmembers, by and large, advisers encouraged customers to think about advancementfrom the time they entered the programme. Advisers used a wider and more subtledefinition of advancement, and were more proactively engaging with customersand encouraging them to think about their long-term goals, including plans foradvancement, before they entered work. These changes were reflected in the 2005interviews, when ASAs were at least aware that Advancement Action Plans shouldbe completed for all customers from the outset, and most were in the process ofworking through a backlog of cases.
The customer participation data give some indication of how well this message wasgetting through to customers. Figure 3.1 shows that for the two New Deal customergroups (who never worked in year 1), awareness of the retention bonus was muchhigher, at around three-quarters of the sample, compared with the training bonus(more relevant for advancement), which was known about by only about half of thesample. (See Table C.1 for figures by district.) The picture is thus mixed of howsuccessful advisers were in ensuring that out-of-work customers were aware ofeverything ERA could offer after they started work. It is worth bearing in mind thatthe improvements in ERA delivery to customers would not necessarily be evident inthis participation data (as the final interviews with customers took place inNovember 2005).
ERA implementation
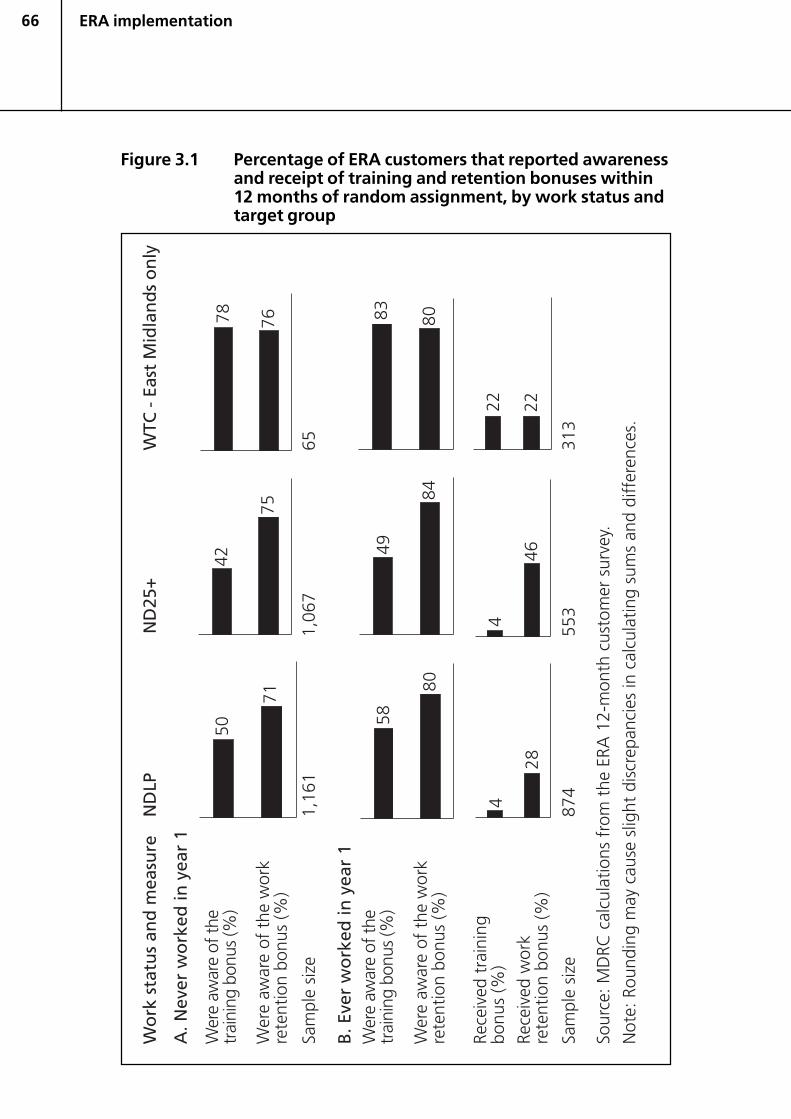
66
Figure 3.1 Percentage of ERA customers that reported awarenessand receipt of training and retention bonuses within12 months of random assignment, by work status andtarget group
ERA implementation
67
3.3.2 The ERA treatment: post-employment support
Post-employment support first requires that advisers maintain contact with ERAcustomers. It then requires working with customers to resolve their retentionproblems and trying to help them advance. Differences by customer groupcontinued once customers had entered work. Staff talked about differences in thetype of support offered to different customers, depending upon the types of workthey were in, their attitudes to work and their caring obligations.
Once again, the delivery of ERA improved considerably over time. In the firstimplementation year, although staff viewed ERA as a post-employment service,many struggled to maintain contact with all their ERA customers and felt they lackedthe skills they needed to provide post-employment support effectively.
Maintaining contact with customers
In the 2004 staff survey (ASA responses only) when the programme was quite new,more than half (56 per cent) of lone parent ASAs said they stayed in contact withemployed lone parents. Only one in six (17 per cent) of the ND25+ ASAs, however,said they stayed in contact with their working customers (see SupplementalAppendix AA).
By the time of the second staff survey (January 2006), there had been progress. Moststaff (78 per cent) said they usually contact their working customers within their firstweek of starting work (not in Table 3.1), and most (74 per cent) are in contact withtheir customers at least three times within a six-month period. Even though themajority (77 per cent) said they continue to try new ways of engaging customers whodo not appear to be interested in maintaining contact, 23 per cent said they generallywould leave those customers alone (see Table 3.1). There were no differences in thelevel of contact reported with working ND25+ customers or working lone parents.However, a substantial minority were still finding it difficult to engage workingcustomers with the support offered through ERA; some did not feel supported by theirmanagement; some were distracted from their ERA work by mainstream JobcentrePlus duties, high caseloads and job entry targets (see Table 3.1).
ASAs were quick to agree that keeping in touch with their ERA customers was a highpriority and affirmed that their supervisors would be concerned if they didn’tmanage to do so, though only half said they had formal benchmarks for how oftenthey made such contact. Most said they made their first contact with customerswithin a couple of weeks of their entering work, though a quarter said they wouldgive up on working customers who shied away from regular contact after this. ASAsregarded activities that took them beyond their immediate brief, such as advising onnon-work areas of customers’ lives or contacting them outside hours or off-site, in amore qualified way. But the great majority said they did these things at least some ofthe time, though rarely ‘a lot’ (see Supplemental Appendix AA).
ERA implementation
68
The qualitative research allows us to assess how and when these changes tookplace. In the first round of qualitative interviews (2004), ASAs reported fewsystematic attempts to engage with their working customers and displayed uncertaintyabout how they should do this. As noted earlier, they were not confident about howto proceed, and pointed out that there were no pre-existing guidelines or practicesto structure customer engagement. ASAs tended to contact customers by letter ortelephone on an ad hoc basis when they found the time. There were few attempts tobe proactive, and advisers often waited for their customers to decide when and howthey preferred to be contacted. Some ASAs contacted their customers as often asonce a week; some not at all.
Few ASAs reported ‘strategies’ for maintaining contact, and many reported abacklog of working customers with whom they had not been in contact. Thereasons for the lack of contact also included the organisational and resource issuesalready discussed. When staff were short of time, they were more likely to put offdoing the type of work in which they lacked confidence in their own abilities. It is fairto assume that, on the whole, a sizeable proportion of working customers receivedlittle job retention and advancement support during the first year of the programme(roughly 2004), because of limited contact with advisers.
With experience and further training, and as post-employment caseloads grew andresource issues sometimes eased, ASAs started to report more proactive contactwith their in-work customers, as well as greater variety in their means of contact,including the use of text messaging and e-mails. Sometimes they visited them atwork. As can be seen in the 2006 staff survey, 51 per cent of ASAs said they worked‘at least some of the time’ outside their normal office hours in order to see workingERA customers (Table 3.1). This was an important innovation. All these strategieswere aided by organisational or technical changes, such as the use of a database forrecording and prompting customer contacts, ring-fencing resources, and theestablishment of PETs in some districts.
All districts reported particular difficulties in engaging Working Tax Credit (WTC)customers. Because take-up of the programme by WTC customers was slow to gainmomentum, there was little engagement with these customers until the second yearof implementation. ASAs also felt at a disadvantage with this customer groupbecause they had not had the opportunity to establish a rapport with them. Even inthe second year of the programme, ASAs expressed their frustration with the lowresponse rate to letters and phone calls in their attempts to re-engage WTCcustomers. Low intake in most of the districts meant that most ASAs had limitedexperience with WTC customers, and some had only a handful of WTC customers intheir caseloads.
Retention and advancement
The second staff survey (2006) sought to examine how far ASAs went beyondroutine contact with customers to apply the motivational techniques they had beentrained to use to interest ERA participants in retention and advancement opportunities.
ERA implementation
69
These activities include explaining retention and training bonuses and advancementissues at every opportunity, chasing up those who do not at first respond and takingthese conversations into more long-term considerations of their customers’ lifegoals. One area of the questionnaire (Section 4), which concerned their workingpriorities, divided the respondents more widely than others. For example, 40 percent thought that management gave ‘the highest’ or ‘a lot’ of priority to ‘Helpingworking ERA customers increase their job skills’, while a third thought they gave‘very little’ priority or ‘none’ (not in table). There was a tendency to say that ASAsgave a little higher priority than management, but the division of opinion amongASAs remained striking (see Table 3.1).
In the answers to some questions, the balance of opinion took a negative shade. Forexample, 45 per cent of ASAs said that their management gave ‘very little’ priority or‘none’ to ‘Helping working ERA customers get promotions, pay rises, or better jobs’.(see Table 3.1). This is quite an unsettling finding, though it may reflect no more thana broader judgement that their Jobcentre Plus office as a whole gave little priority toERA goals.
Turning to the qualitative data, it is clear that work on retention and advancementdeveloped over time. In 2004, given the relatively small numbers of customers inwork (especially ND25+) and the difficulties of engaging with in-work customers,ASAs carried out little retention work other than the administration of retentionbonuses. ASAs did report making use of the Emergency Discretion Fund (EDF) toaddress financial ‘teething problems’ when customers entered work; however, suchwork was restricted largely to customers who proactively sought assistance.
In 2005 and 2006, ASAs were undertaking more retention work, both because in-work caseloads had grown and because new engagement strategies had beendeveloped. In 2006, ASAs still considered the EDF to be one of the most utilised andeffective features of ERA because of its impact on job retention (see Chapter 1 andTable 1.1 for more information on this fund). However, they were more proactive inits use, and viewed their role as anticipating issues that posed a threat to jobretention in advance and then offering solutions. They considered the fund avaluable resource for financing the extra costs associated with the first weeks andmonths of work, such as childcare costs, rent arrears and general living expenses,until customers managed to reach a financial ‘even keel’.
Over time, ASAs were also dealing with ERA customers who had entered work butsubsequently become unemployed again. It was understood that in some casesretention problems were beyond the advisers’ control, for example, local labourmarket conditions (contract work and redundancy), unsatisfactory workingconditions, or changes in personal circumstances (see Hoggart et al., 2006). In theearly months of the programme, many such customers were effectively lost fromcaseloads. However, as engagement practices generally were strengthened, ASAswere more likely to maintain contact, seeing their role as to bolster customerconfidence and ensure that they found another job quickly.
ERA implementation
70
Advancement
It was in the area of advancement work that ASAs’ understanding and practiceschanged most markedly. In 2004, ASAs tended to define advancement narrowly asenhancing skills through training, working more hours, increasing pay or gaining apromotion. By the second year of the programme, however, there was a markedchange regarding the possible meanings and forms advancement could take. Theseunderstandings were expanded to include moving to a different job, job satisfaction,achieving a work-life balance, developing a career and simply keeping a job. SomeASAs also reported that advancement through ERA could be something that wasexternal to the job, such as heightened self-esteem, buying your own house or goingon holiday. As one adviser stated, reflecting on changes in her own understandingof advancement:
‘Prior to working here, I thought advancement would have been gaining newqualifications, promotion in work, that would be it really…This has made mesee that all of it really is advancement…It’s different to everyone; for somepeople it will be because they like the material things, but for other people, justgetting up and going to work every day, having enough money to pay yourbills and live comfortably, they’re happy enough.’
By the time of the 2006 focus groups, ASAs had developed complex understandingsof how to apply the concept of advancement with very different customers, notingthat meanings of advancement varied according to the customer. These improvementsin understanding and confidence had an effect on ASAs’ practices. In 2005 and2006, advisers spoke of encouraging customers to think about different routestowards their long-term goals. A common approach was to encourage customers totake a less preferable job than their ideal, and then work towards their goal throughtraining. Advisers felt that this was a useful tactic for customers to make use of theERA incentives, since these were not available until a customer entered work.
There were again differences among ASAs in how they approached advancementthrough training: Some advocated it as part of a package tailored to the customer’sneeds, while others focused on it more rigidly. There were also differences amongASAs in how comfortable they felt with a complex definition of advancement. A fewcontinued to define advancement quite narrowly as undertaking training courses.More confident advisers used a variety of advancement approaches, dependingupon their customers’ employment circumstances. They became partners with thecustomer and developed a plan that catered to the customer’s specific needs andwants.
Despite these positive developments in the provision of advancement support, still,in 2005, both management and advisers reported that high caseloads and the lackof ring-fencing were detracting from the effectiveness of the advancement supportoffered. Too often, ASAs did not have the time to engage with their workingcaseloads because they were diverted to mainstream Jobcentre Plus activity. Theseissues were less apparent, though, in the districts that had established PETs (NorthWest England and London) and where ASAs were more effectively ring-fenced (EastMidlands).
ERA implementation
71
It is possible to quantify the types of support that customers received once they werein work by looking at the participation data (Figure 3.2). As can be seen, around halfof ND25+ and NDLP customers who were in work at some point in the 12-monthfollow-up period, received some form of in-work support, compared with overthree-quarters of WTC customers (in the East Midlands). (See Table C.2 for figuresby district.) The most common forms of in-work support received for all groups werehelp finding education and training, assistance determining career goals, and helpfinding a better job. In addition, NDLP and WTC customers commonly receivedassistance increasing their work hours. The least common forms of support receivedwere assistance securing a promotion or a pay rise, or negotiating better job terms.
Thus, the types of in-work assistance that advisers were offering were directlyassociated with the ERA incentives (help securing training and increasing hours inorder to be eligible for the retention bonus) or directed at advancement by movingjobs (determining career goals and help finding a better job). ASAs appeared to beless successful in helping customers to negotiate advancement within a job(negotiating a pay rise, promotion or better job terms).
Across the customer groups, approximately 80 per cent of those who had everworked during the 12 months after random assignment were aware of the retentionbonus, a figure which is slightly higher than for awareness among those who hadnever worked during that period (see Figure 3.2). Slightly higher numbers of thosewho had worked (compared with those who had not worked) were also aware ofthe training bonus. Roughly half of ND25+ and NDLP customers who had workedwere aware of the training bonus, compared with 83 per cent of WTC customers.
ERA implementation
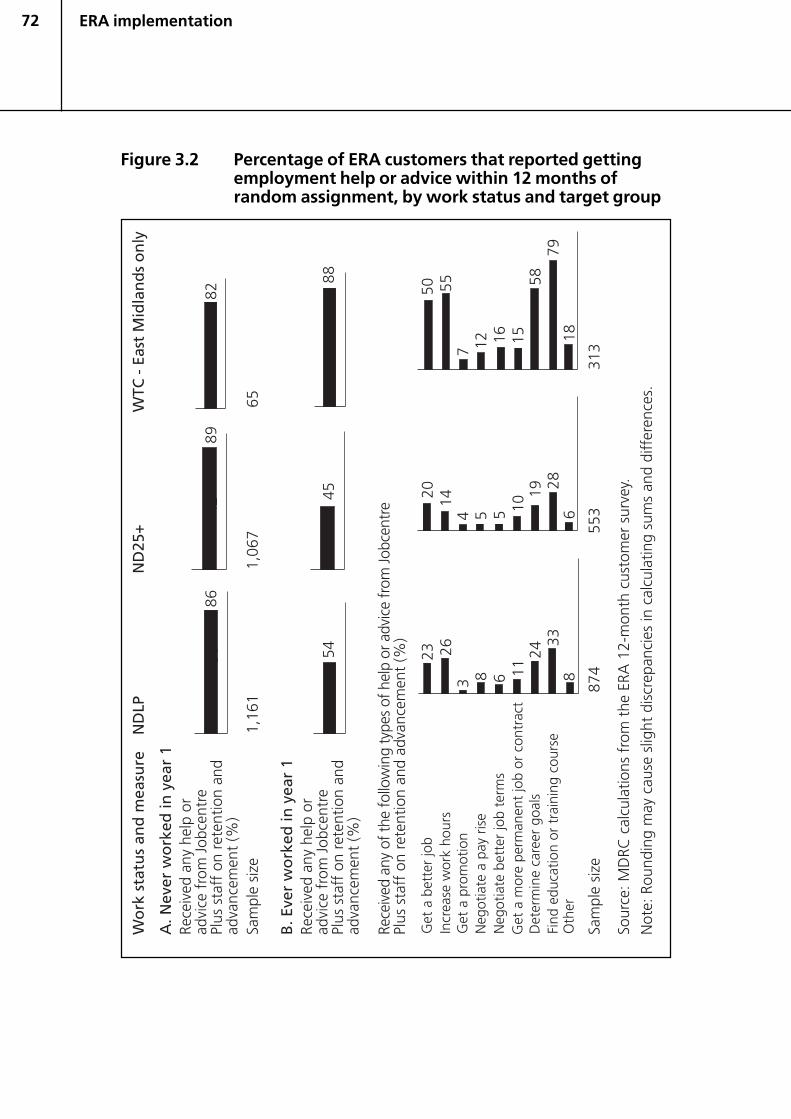
72
Figure 3.2 Percentage of ERA customers that reported gettingemployment help or advice within 12 months ofrandom assignment, by work status and target group
ERA implementation
73
3.3.3 Staff views on their new role and their ERA customers
This section focuses on the views and cumulative experiences of the ASAs withrespect to how ERA could help the three customer groups and also their assessmentsof their own roles.
The ASAs gained a great deal of insight into the needs and perspectives of the threecustomer groups to whom they delivered the programme. They were asked, in thequalitative interviews, how the different customer groups responded to elements inthe ERA package of support. The responses did not substantially vary across districtsbut did vary according to customer group. Generally, staff felt that the two loneparent groups, NDLP and WTC, were more responsive to ERA than the ND25+customer group.
What changed most significantly over time was that staff became more positiveabout the possibilities of their intervention making a difference with respect toretention and advancement. By spring 2005, staff were mostly more confidentabout working ‘creatively’ with customers in addressing possible barriers toretention and advancement and by 2006, they were able to give numerousexamples of how customers had responded positively to their support, either byretaining jobs or by advancing.
New Deal for Lone Parents customers
Generally, staff thought that ERA appealed more to lone parents than ND25+customers. This was a clear finding from the 2004 staff survey, which was echoed inthe qualitative interviews in which staff were able to give reasons for their views.They thought that because lone parents volunteered for the New Deal they werealready more receptive to work than ND25+ customers, that when they moved intowork they were more reliable workers and that they were more likely to be receptiveto advancement because of their commitment to provide for their children and bepositive role models.
ERA staff also recognised, however, that there were differences within this customergroup. In particular, ASAs pointed out that many lone parents may not want to workfull-time hours; they prefer part-time and school-term hours that allow time withtheir children. Some ASAs commented that the only lone parents who had increasedtheir hours to 30 because of ERA were those who were already working 20-25 ormore hours. This does not mean that staff were opposed to the notion of loneparents working full-time. In the 2004 staff survey, most staff thought that,provided childcare was available, lone parents should not be discouraged fromworking full-time hours, even those with pre-school children. But in the qualitativeinterviews, staff also made it clear that they resisted lone parents being pressed toundertake full-time work when the parents did not wish to do so.
For these reasons, ASAs often promoted the ERA training bonus over the retentionbonus with their NDLP customers, believing that these customers were moreinterested in enhancing their skills and qualifications than working full-time. Many
ERA implementation
74
felt, however, that lone parents would become more receptive to advancementfurther down the line, and thus, the timing of advancement work with NDLPcustomers was very important. Both ASAs and managers expressed this view. Theyalso said that some lone parents preferred to train first and then enter work later (asis traditionally offered through NDLP) rather than combining the two. Many adviserstalked about having to proceed slowly with lone parents who had been out of workfor a long time, suggesting that they needed to settle into work and build up theirconfidence first. The advisers considered it a major first step for a customer to startwork of 16 hours a week.
For the most part, ASAs perceived NDLP customers as in greater need of retentionservices and as more receptive to this kind of help than the other customer groups.This help tended to focus on childcare and tax credit/benefit issues.
New Deal 25 Plus customers
In both the staff survey and the qualitative interviews, staff differentiated betweenND25+ customers who want to work and those whom they felt might be avoidingwork, or who were ‘hard to help’. For those who want to work, staff felt ERA wasbeneficial, especially the retention bonus. In the qualitative interviews, ASAsprovided examples of customers who entered work more quickly in order to receivethe bonus and others who stayed in work while job searching rather than going backon benefits between jobs.
Some staff also expressed caution about the receptivity of ND25+ customers to thein-work support offered. Some advisers said that their ND25+ customers were opento seeking post-employment support but others noted a resistance among some tokeeping in contact, which they felt was related either to negative attitudes towardsJobcentre Plus or to a desire for ‘independence’ from the state. Advisers made thispoint to explain why some customers were not collecting retention bonuses eventhough advisers had told the customers about them.
ASAs also felt that many ND25+ customers were not interested in advancement, butwere rather seeking stable and secure work, particularly if they were older. They alsoexpressed the view that some customers wished to disassociate themselves fromJobcentre Plus once in work. This observation was more prevalent for ND25+working customers. Several ASAs reported that some ND25+ working customerswere not interested in training and reskilling, especially men in their 50s. Staff feltthat ERA, as a post-employment service, had little to offer those who wereunconnected to the labour market, or those who were resistant to work.
However, some ASAs referred to ND25+ customers who had become morereceptive to advancement after they had been in work for a while and gave someexamples of customers who were motivated by the training bonus, particularlythose who had a specific area of work in mind for which they could not get trainingthrough New Deal.
ERA implementation
75
Working Tax Credit customers
ASAs noted that, in contrast to their working NDLP customers, WTC customers weremore established in work and were less likely to experience problems retaining jobs.They were less likely to contact advisers for EDF support because they had already‘settled in’ to work. While those with older children might be more amenable toincreasing their work hours, staff thought that many were in a ‘comfort zone’ andwere resistant to change that would disrupt their work-life balance.
Many ASAs stated that WTC customers found the Jobcentre Plus environment off-putting and ‘alien’ and one referred to WTC customers as ‘aloof’. Some workedaround this by meeting with customers outside of the office. Some advisers,however, felt that it was easier to engage with WTC customers because they aremore motivated to work and to advance and have a strong ‘work ethic’. One advisercommented, ‘it’s like talking to a colleague rather than interviewing a customer’.They also said that WTC customers were more qualified and therefore morereceptive to training. Other advisers described WTC customers as ‘demanding’ and‘proactive’ in making as much use of the programme’s services as possible.
While advisers noted that WTC customers were generally making good use ofservices (mainly training), some felt that such customers would be likely to advanceanyway ‘on their own steam’ even if they had not been introduced to ERA. The datafrom the customer survey (Chapter 4), however, indicate that ERA was able to boostthe proportion of WTC customers who accessed training. This may indicate that it isquite difficult for working low-paid lone parents to organise and access on theirown, the type of in-work training that ERA facilitates.
The ASA role
Two years into the programme, it is clear that most ASAs had grown in confidenceand felt they were providing a good basic ERA service. They maintained contact withmany of their customers after they had started working and made sure they knewabout the opportunities that ERA offers. The 2006 staff survey, however, did showthat significant minorities felt that they were unable to stretch their work and reachout to customers in more enterprising ways. They said that they did not have thewholehearted support of management to achieve the main ERA goals and that highcaseloads and job entry targets made it unnecessarily hard to achieve them.
None of this should detract from the positive views expressed by ASAs in the open-ended section of the survey. Some wrote of their work as ‘…the best advising jobwithin the Jobcentre’ and as ‘…the best job I have ever had’. They were particularlyfocused on the very different relationship that it creates with customers, forexample: ‘…for the first time feel I am making changes to people’s lives and theirfamilies. I no longer have angry and dejected customers, but customers that actuallycontact me, feel confident I am always available’. Despite a few misgivings about thesupport they have received, many ASAs have embraced their role with greatenthusiasm:
ERA implementation
76
‘ERA has been the most rewarding role I have undertaken in my career. I haveseen myself grow as a person, my skills developed and enhanced, allowing meto focus on my customers, their needs and in turn watch them move frombenefit, keep their jobs, train and advance in the world of work.’
Such sentiments were repeated in the May/June focus groups with staff.
3.4 District differences
The picture of marked improvement over time is true for all of the districts. However,it is also the case that ERA implementation did differ across the districts. Some ofthese differences are summarised in Table B.1. All districts delivered an ERAtreatment while having different sets of strengths and weaknesses. While somedistricts may have worked more effectively on advancement at an earlier stage thanothers, for example, other implementation problems may have weakened theirdelivery of ERA services. The following examples give an indication of thesevariations.
Only one district (East Midlands) achieved a substantial intake of WTC customers,most of whom entered the programme during the latter months of intake.However, because of staffing shortages and high caseloads, some of thesecustomers were not effectively engaged following random assignment andsubsequently became disengaged.
One of the more significant variations concerned whether ERA was managedcentrally with its resources ring-fenced. This, however, changed over time in anumber of districts, with only one district maintaining this model throughout theperiod (East Midlands).
In two districts (East Midlands and Wales), there was some evidence that advisersworked on advancement more effectively at an earlier stage in the evolution of ERAthan the other districts. However, it should be noted that there was also somevariation among the approaches of advisers within districts. The more confidentand experienced advisers encouraged customers, from their initial enrolment on theprogramme, to think about their long-term aspirations. They then worked withcustomers to develop routes towards these goals. It should also be noted that thispromising approach in Wales was more than offset for the ND25+ ASAs by theirexceptionally high caseloads across offices. This led, at one stage, to the possibilitythat control group customers were receiving a better pre-employment service thanERA programme group customers (see Chapter 5 for more discussion of this issue).Thus, in Wales, a resource issue may well have undermined the first stage of the ERAintervention for that target group.
These examples serve to illustrate the complexity of the district variations. Thiscomplexity means it is not possible, at this stage, to rank the districts according totheir overall success of delivery.
ERA implementation
77
3.5 Conclusions: implementation issues
Two implementation issues were particularly significant, especially during the firstyear of ERA: First, the main implementation challenge concerned how to incorporateERA into the other activities of Jobcentre Plus. It is clear that there were tensionsbetween ERA and maintaining ‘business as usual’. In particular, ERA competed forresources, principally staff time, at most stages of implementation. Second, andclearly related, ERA’s programme of post-employment support was very new, and insome respects alien, to an organisation with the task of placing people in work. ERAis a post-employment service nested in a pre-employment organisation andtherefore, it took time for ERA staff to move beyond the administration of thefinancial bonuses.
Specific factors that impinged on ERA post-employment support were commonacross all districts: resources, job entry targets, and ASA capacity (Jobcentre Plusethos and emphasis on getting people into jobs, lack of experience and confidence).The practice of delivering services to working customers was new to Jobcentre Plusadvisers and it took time and experience of in-work support for ASAs to buildconfidence in the role. As Jobcentre Plus is traditionally an unemployment service,ASAs had no previous experience of actively helping people in work.
During the first year of implementation, ASAs’ capacity to deliver in-work supportgrew as more customers entered work and received the in-work elements of ERA.All staff, including senior managers, needed time to understand the shift inorganisational culture. Most districts struggled to deliver the post-employmentaspects of ERA while intake was also underway. This was a question of time but alsoof appropriate training and the development of an understanding of what wasneeded to make ERA work. Some of these improvements have been captured by theimpact data (Chapter 5). Future ERA survey work will show whether receipt of helpand advice and awareness of the incentives have increased as the programmedelivery has improved.
One of the main challenges was ensuring that ERA resources allocated to thedistricts were actually reaching ERA. When ERA resources were not used to staffERA, post-employment work suffered. The other two main resource issues wereERA staff also dealing with non-ERA customers and ERA staff covering more thanone office and losing time while travelling. These challenges were confronted indifferent ways, and by the time of the second round of qualitative interviews withstaff and then the staff survey, progress had been made.
By 2006, it was clear that the level of staff enthusiasm and understanding of ERA hadgrown significantly. But the delivery of ERA could still be improved. This is because,even though by early 2006 staff largely understood the nature of the treatment theyshould be providing in ERA, they were still constrained by the limited time they hadto do so. The resources allocated to ERA had increased, but this was uneven andfragile. ERA was certainly being delivered as designed, but imperfectly.
ERA implementation
78
This chapter has emphasised how the delivery of ERA differed among districts,offices, and even advisers, and also how the delivery changed over time. Althoughthese considerations complicate the implementation story, they also show how sucha programme can be successfully – even if imperfectly – implemented in a variety ofvery different settings. It might look very different depending on the place underscrutiny but the logic of the ERA model will still apply.
ERA implementation
79ERA participants’ recall of advice received and action taken to remain and advance in work
4 ERA participants’ recall ofadvice received and actiontaken to remain andadvance in work
4.1 Introduction
The previous chapter described how the Employment Retention and Advancement(ERA) programme was implemented in the six districts chosen for this initiative, andincluded statistics showing the extent to which individuals in the ERA programmegroup received advice and help from their Advancement Support Advisers (ASAs)during periods when they were, and were not, in work. This chapter examines ERAprogramme implementation through a different lens. It examines additionalquantitative measures of programme experiences, taking into account all randomlyassigned programme group members (regardless of whether they worked or not),and compares the experiences of programme group members with those of controlgroup members during the 12-month period following random assignment for eachsample member.
The chapter describes the extent to which ERA programme group members receivedJobcentre Plus help and advice and/or took steps to find, keep and advance in jobs,incrementally more than control group members. These programme-controlgroup differences are crucial to understanding why ERA did or did not have effectson employment, earnings and benefits outcomes, the topic of Chapter 5. (See Box4.1 for an explanation of how to read the tables in this report that show the impactsof the ERA programme on various outcomes). The 12-month follow-up period usedin this analysis is identical to the one used in that chapter’s economic impact analysis.This follow-up period covers some, but not all, of the period covered by thequalitative research presented in the previous chapter and it should be considered tobe a picture of programme operations early in the roll-out of ERA operations.
80 ERA participants’ recall of advice received and action taken to remain and advance in work
Box 4.1 How to read the tables in this report
Most tables in this report use a similar format, illustrated below. The top panelshows a series of participation outcomes for the ERA group and the controlgroup for the New Deal for Lone Parents (NDLP) customer group. For example,the table shows that about 76 (76.3) per cent of ERA group members andabout 73 (72.5) per cent of the control group members were not in work andreceived help or advice from Jobcentre Plus staff while not working.
Because individuals were assigned randomly either to the ERA programme orto the control group, the effects of the programme can be estimated by thedifference in outcomes between the two groups. The ‘Difference’ column inthe table shows the difference between the two groups on several outcomes.These differences represent the programme’s impact on various outcomes.For example, the impact on receiving help or advice from Jobcentre Plus staffwhile not in work can be calculated by subtracting 72.5 from 76.3, yielding3.8 percentage points. Thus, ERA increased the likelihood that people wouldreceive advice or help while not in work.
Differences marked with asterisks are ‘statistically significant’, meaning that itis quite unlikely that the differences arose by chance. The number of asterisksindicates whether the impact is statistically significant at the one per cent, fiveper cent, or ten per cent level (the lower the level, the less likely that theimpact is due to chance). For example, as shown below, the ERA programmehad a statistically significant impact of 3.8 percentage points at the 5 per centlevel on customers receiving help or advice from the Jobcentre Plus staff whilethey were not in work. (One asterisk corresponds to the ten per cent level;two asterisks, the five per cent level; and three asterisks, the one per centlevel.) The P-value indicates the probability that the difference arose by chance.
Some measures in Chapter 5 are shown in italics and are considered ‘non-experimental’ because they include only a subset of the full report sample.Because participants in the ERA group may have different characteristics thanparticipants in the control group, differences in these outcomes may not beattributable to the ERA programme. Statistical significance tests are notconducted for these measures.
Continued
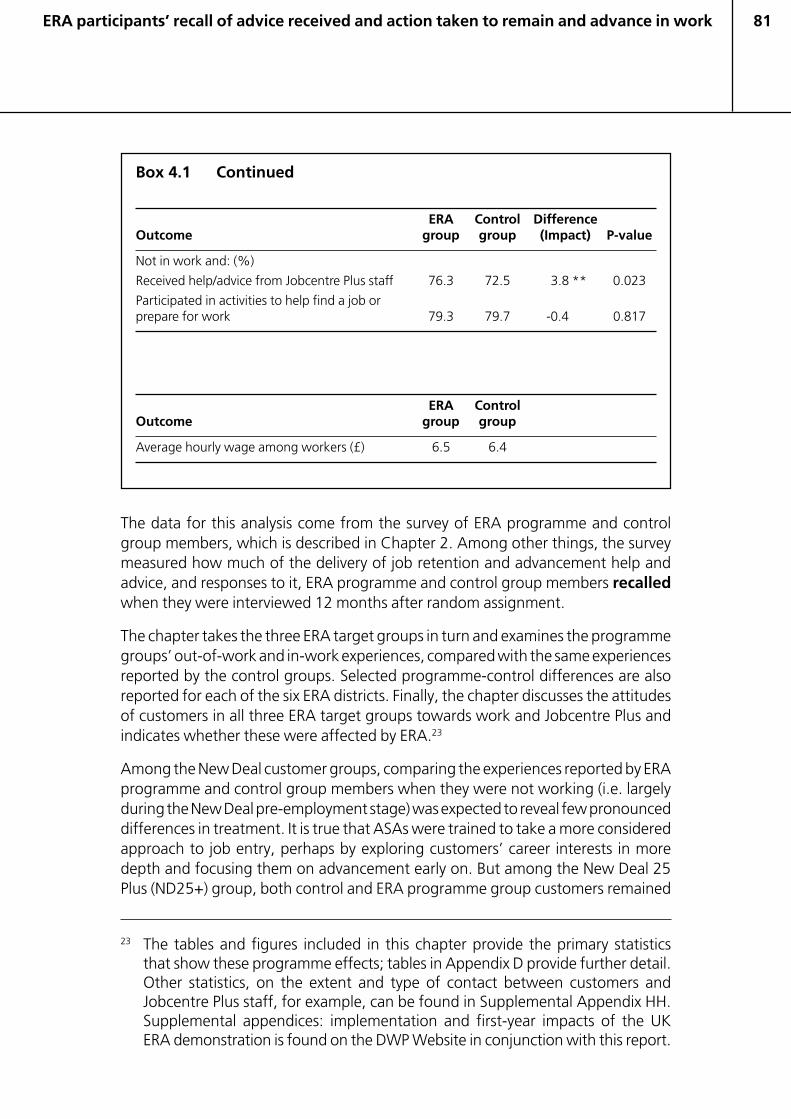
81
Box 4.1 Continued
ERA Control Difference Outcome group group (Impact) P-value
Not in work and: (%)
Received help/advice from Jobcentre Plus staff 76.3 72.5 3.8 ** 0.023
Participated in activities to help find a job orprepare for work 79.3 79.7 -0.4 0.817
ERA ControlOutcome group group
Average hourly wage among workers (£) 6.5 6.4
The data for this analysis come from the survey of ERA programme and controlgroup members, which is described in Chapter 2. Among other things, the surveymeasured how much of the delivery of job retention and advancement help andadvice, and responses to it, ERA programme and control group members recalledwhen they were interviewed 12 months after random assignment.
The chapter takes the three ERA target groups in turn and examines the programmegroups’ out-of-work and in-work experiences, compared with the same experiencesreported by the control groups. Selected programme-control differences are alsoreported for each of the six ERA districts. Finally, the chapter discusses the attitudesof customers in all three ERA target groups towards work and Jobcentre Plus andindicates whether these were affected by ERA.23
Among the New Deal customer groups, comparing the experiences reported by ERAprogramme and control group members when they were not working (i.e. largelyduring the New Deal pre-employment stage) was expected to reveal few pronounceddifferences in treatment. It is true that ASAs were trained to take a more consideredapproach to job entry, perhaps by exploring customers’ career interests in moredepth and focusing them on advancement early on. But among the New Deal 25Plus (ND25+) group, both control and ERA programme group customers remained
ERA participants’ recall of advice received and action taken to remain and advance in work
23 The tables and figures included in this chapter provide the primary statisticsthat show these programme effects; tables in Appendix D provide further detail.Other statistics, on the extent and type of contact between customers andJobcentre Plus staff, for example, can be found in Supplemental Appendix HH.Supplemental appendices: implementation and first-year impacts of the UKERA demonstration is found on the DWP Website in conjunction with this report.
82
in the same mandatory programme that prescribed their pre-employment contactswith Jobcentre Plus and its service providers. NDLP customers, for their part, wereentering voluntarily into a service designed to help them find work, and it wasexpected that the more enterprising customers in both the ERA programme andcontrol groups would take full advantage of the Jobcentre Plus pre-employmentservices on offer to them.
In terms of in-work experiences, more pronounced programme-control differenceswere expected, since post-employment ERA services are provided only to the ERAprogramme group customers. But it is not quite as clear cut as that. Control groupmembers can access Jobcentre Plus services after they enter employment, certainlyover a period as long as 12 months. Some customers, typically lone parents, are intouch with their advisers soon after entering work to ask for help sorting out their in-work income package, particularly doubts and delays concerning Housing Benefit(HB) and tax credits or faltering childcare arrangements. Control group memberswho enter work but who later believe they may be about to lose their new jobs, willreturn to their local Jobcentre Plus office for advice. If the worst should come to theworst, they sign on again, claim benefit and receive more Jobcentre Plus services.
The important difference between ERA and control group members once they enterwork is that the ERA group’s ASAs are trained to be alert to their customers’ worksituations and, if they can, anticipate problems. Through regular contact, they aresupposed to be aware if their customers’ security of employment is poor and act tofind them another and hopefully better, job before unemployment overtakes themagain. Before this point is reached, ASAs should also be feeding their customers asteady diet of information and encouragement designed to make customersthemselves more alert to the need to reinforce their newly gained place in the labourmarket. ASAs are also to advise customers on how to identify, prepare for andpursue advancement opportunities, either with their current employer or anotheremployer. What then do customers remember of these efforts to assist them andwhat efforts have they made to advance?
4.2 New Deal for Lone Parents
NDLP customers in the ERA study voluntarily joined the New Deal, as they wereinterested in finding a job even if some were not ready to begin employmentimmediately. Unlike most of the ND25+ sample members but similar to the WorkingTax Credit (WTC) sample members, these lone parents must balance eventual workhours and schedules with family responsibilities. This may limit the ability of many ofthem to meet the work requirement of 30 hours a week to qualify for the jobretention bonus and, more generally, may affect their advancement goals andstrategies.
ERA participants’ recall of advice received and action taken to remain and advance in work
83
4.2.1 Overall contact with Jobcentre Plus
The experiences of the control group can be taken as a guide to how NDLPcustomers interact with Jobcentre Plus normally, i.e. in the absence of ERA. Havingsigned up for NDLP and consented to random assignment, 28 per cent of the controlgroup had no further contact with Jobcentre Plus.
Overall, rates of Jobcentre Plus contact were significantly higher among the NDLPERA group than the NDLP control group: 85 per cent of the ERA group had somecontact, compared with 72 per cent of the control group. Three-quarters of allprogramme group members had in-person contacts and more than half of allprogramme group members had telephone contacts, compared with 64 per centand 36 per cent, respectively, among controls. Such contacts were significantlymore frequent among programme group members, too, adding up to a greatervolume of contact between the ERA group and their ASAs, compared with thattotalled by the control group and their Personal Advisers (PAs). NDLP programmegroup members, however, were not more likely than their control group counterpartsto have initiated meetings with Jobcentre Plus staff.
4.2.2 Help and advice received and steps taken while not in work
While out of work, control group members who remained in contact with JobcentrePlus received the volume and range of pre-employment help and advice you wouldexpect from New Deal advisers (Table D.1). Most were taken through the details ofjob vacancies, and received other help finding or preparing for work. Many wereassisted with applications and prospective childcare arrangements and others weredirected to training courses or given other advice concerning their long-term goalsand future prospects. (See Box 4.2 for a summary of the types of out-of-work helpand advice captured in the customer survey.)
The out-of-work help and advice recalled by ERA customers was substantially thesame as that recalled by the control group. There were, though, some small signs ofthe more considered approach to job placement intended for ERA: A few more ERAprogramme group members, compared with control group members, spent timediscussing longer-term career aims, advancement issues and prospects for training(see Table D.1 for more detail).
ERA participants’ recall of advice received and action taken to remain and advance in work
84
Box 4.2 The activities of individuals while not in work
The analysis in this chapter divides ERA programme activities for individualswhile they were not in work into two main categories. Following are thecategories and which activities fell into each:
Received help and/or advice from Jobcentre Plus staff: The individual,while not in work, reported that they received help and/or advice with at leastone of the following activities: looking at job vacancies, applying for a job,working out long-term career goals, help pertaining to holding or advancingin future jobs, help finding out about childcare arrangements, looking foreducation/training opportunities, looking for volunteer work, setting up theirown business or any other type of help specified by the individual but notlisted above.
Participated in activities to help in finding a job or preparing for work:The individual, while not in work, reported that they attended job club/programme centre classes or meetings, put their name on the books of aprivate recruitment agency, went to a career office or career advice departmentor used the Connexions service, looked for a job on their own, did unpaidwork through a government programme, did voluntary work, attended aneducation or training course, did something to set up their own business ordid something else to find a job.
4.2.3 Help and advice received and steps taken while in work
In interpreting the results that follow, it is important to take into account anydifference in the proportion of NDLP programme and control group members whoentered work at some point in the 12-month follow-up period. Otherwise, it ispossible that differences between the two groups in receiving help or advice whileworking might reflect differences in eventual employment rates, as opposed todifferences in the provision of ERA services. As described in the notes at the bottomof Table 4.1 (and discussed more fully in Chapter 5), NDLP programme groupmembers were, in fact, somewhat more likely than control group members to be inpaid work at some point during the 12-month follow-up period. This suggests thatmore of the programme group customers could take advantage of the in-workservices of ERA, compared with the number of control group members who couldseek out in-work services independently.
ERA participants’ recall of advice received and action taken to remain and advance in work
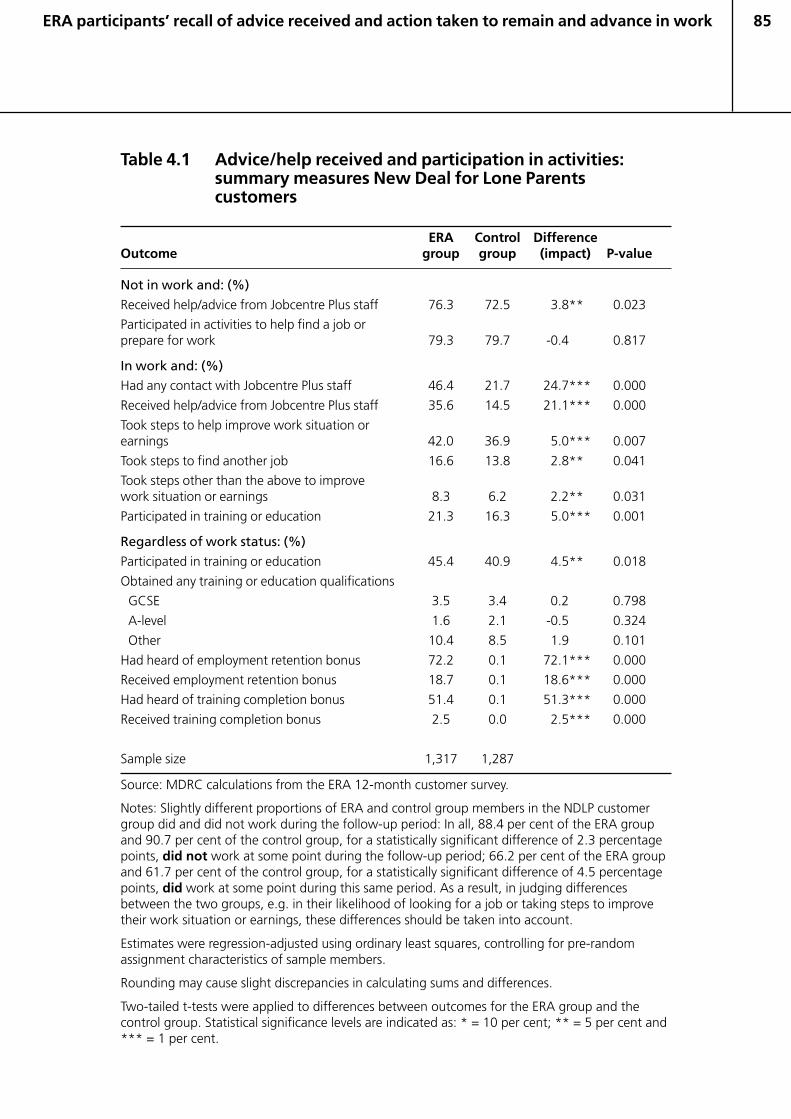
85
Table 4.1 Advice/help received and participation in activities:summary measures New Deal for Lone Parentscustomers
ERA Control DifferenceOutcome group group (impact) P-value
Not in work and: (%)
Received help/advice from Jobcentre Plus staff 76.3 72.5 3.8** 0.023
Participated in activities to help find a job orprepare for work 79.3 79.7 -0.4 0.817
In work and: (%)Had any contact with Jobcentre Plus staff 46.4 21.7 24.7*** 0.000
Received help/advice from Jobcentre Plus staff 35.6 14.5 21.1*** 0.000
Took steps to help improve work situation orearnings 42.0 36.9 5.0*** 0.007
Took steps to find another job 16.6 13.8 2.8** 0.041
Took steps other than the above to improvework situation or earnings 8.3 6.2 2.2** 0.031
Participated in training or education 21.3 16.3 5.0*** 0.001
Regardless of work status: (%)
Participated in training or education 45.4 40.9 4.5** 0.018
Obtained any training or education qualifications
GCSE 3.5 3.4 0.2 0.798
A-level 1.6 2.1 -0.5 0.324
Other 10.4 8.5 1.9 0.101
Had heard of employment retention bonus 72.2 0.1 72.1*** 0.000
Received employment retention bonus 18.7 0.1 18.6*** 0.000
Had heard of training completion bonus 51.4 0.1 51.3*** 0.000
Received training completion bonus 2.5 0.0 2.5*** 0.000
Sample size 1,317 1,287
Source: MDRC calculations from the ERA 12-month customer survey.
Notes: Slightly different proportions of ERA and control group members in the NDLP customergroup did and did not work during the follow-up period: In all, 88.4 per cent of the ERA groupand 90.7 per cent of the control group, for a statistically significant difference of 2.3 percentagepoints, did not work at some point during the follow-up period; 66.2 per cent of the ERA groupand 61.7 per cent of the control group, for a statistically significant difference of 4.5 percentagepoints, did work at some point during this same period. As a result, in judging differencesbetween the two groups, e.g. in their likelihood of looking for a job or taking steps to improvetheir work situation or earnings, these differences should be taken into account.
Estimates were regression-adjusted using ordinary least squares, controlling for pre-randomassignment characteristics of sample members.
Rounding may cause slight discrepancies in calculating sums and differences.
Two-tailed t-tests were applied to differences between outcomes for the ERA group and thecontrol group. Statistical significance levels are indicated as: * = 10 per cent; ** = 5 per cent and*** = 1 per cent.
ERA participants’ recall of advice received and action taken to remain and advance in work
86
Contact
The survey provides valuable evidence that, even in the absence of a scheme such asERA, NDLP customers do continue contact with their PAs and other Jobcentre Plusstaff after they enter work: 22 per cent of the entire NDLP control group maintainedsuch post-employment contact (Table 4.1); expressed another way, this is more thana third of those who had entered work. This reinforces a view that favoured ERA inthe first place: ERA services appear to be an extension – in their frequency, the periodof time during which they can occur, and their intensity – of services that sometimesare received under ‘normal’ Jobcentre Plus conditions. Interestingly, 28 per cent ofthe control group said they would have welcomed more contact with Jobcentre Plusstaff – while in or out of work.
Overall, the NDLP ERA programme customers maintained far more post-employmentcontact with Jobcentre Plus than did control group members: 46 per cent of all ERAcustomers – or 70 per cent of those who entered work during the 12-month follow-up period – had such contact. In this way, ERA more than doubled the proportion ofNDLP customers who had Jobcentre Plus contact while they were in work. There wasalso evidence that such contact was more frequent among ERA customers,compared with the control group, so the total volume of in-work interaction withERA programme customers was much larger than that sought out on their ownbehalf by control group members. The quality of the contacts differed, too: six out often of the ERA group recalled an Advancement Action Plan being drawn up forthem; these plans were not done for control group members.
Help and advice while in work
Not all those who had had in-work ‘contact’ with Jobcentre Plus could recall havingreceived actual help and advice from staff, since some of these contacts wereexchanges of forms, checks of details and efforts to take care of other routinematters that would not be thought of as help and advice. (See Box 4.3 for a summaryof the types of in-work help and advice captured in the customer survey.) Theproportion of the control group in work at some point and recalling ‘non-routine’job-related help or advice from Jobcentre Plus staff while they were in work was just15 per cent (Table 4.1). Of those control group members receiving advice while inwork, about half recalled receiving advice on getting a better job and/or findingtraining (Table D.2). This is in-work advice that, under the rules of NDLP andregardless of ERA, former benefit recipients are perfectly entitled to receive, evenencouraged to obtain, sooner rather than later, lest they slip back into unemployment.But it typically comes at the initiative of the customers themselves.
Notably, however, nine per cent of the entire control group (15 per cent of thosewho had jobs) were offered in-work help and advice from their PA without askingfor it. Thus, some in-work assistance was already in place for NDLP customers priorto the start of ERA. It is also possible that the habit of providing in-work help andadvice rubbed off from ASAs onto PAs, who, after all, worked in the same offices.
ERA participants’ recall of advice received and action taken to remain and advance in work
87
Box 4.3 The activities of individuals while in work
The analysis in this chapter divides ERA programme activities for individualswhile they were in work into several categories. Following are the categoriesand which activities fell into each:
Had any contact with Jobcentre Plus staff: Talked in person or by telephonewith Jobcentre Plus staff for any reason while in work.
Received help and/or advice from Jobcentre Plus staff: The individual,while in work, received help and/or advice in regards to getting a higher payingjob, increasing hours of work, negotiating a pay raise, negotiating better jobterms (e.g. more convenient hours), getting a promotion, getting a morepermanent job or contract, working out long-term career goals, finding aneducation or training course or any other type of help specified by the individualbut not listed above.
Took steps to help improve work situation or earnings: The individual,while in work, attempted to increase their their hours at work, get a pay raise,negotiate better job terms, change to a different sort of work with the sameemployer or get a better job with a different employer.
Took steps to find another job: The individual, while in work, put theirname on the books of a private recruitment agency, went to a career office orcareer advice department or used the Connexions service, looked for anotherjob on their own or did something else to find another job.
Took steps other than the above to improve work situation or earnings.
Participated in training or education while in work.
In contrast, the proportion of the programme group members in work at some pointwho recalled receiving in-work help and advice was 36 per cent (54 per cent of thosewho ever had jobs) (Table 4.1). This is more than twice the proportion for the controlgroup. A good deal of this extra help was concentrated on finding education andtraining courses and on long-term career planning, as the design of ERA intended(Table D.2). And four out of ten of those in work received in-work advice they hadnot sought, almost three times the proportion among controls.
Participation in job search, education and training and advancementactivities while in work
More than a third of the NDLP control group – more than half of those in work – saidthey had taken steps to improve their situation at work during the 12-month follow-up period, in that they tried to increase their hours, get a pay rise or negotiate betterterms and conditions (Table 4.1). Failing these, they sought new and better jobs;more than a fifth of those employed said they did this while in work, seeking newjobs on their own account or with the help of private agencies, rather than returning
ERA participants’ recall of advice received and action taken to remain and advance in work
88
to Jobcentre Plus, it seems. Furthermore, 16 per cent of the controls (a quarter ofthose ever in work) had participated in training or education courses while in work.(Notably, 41 per cent of all NDLP controls participated in education or trainingcourses while in or out of work, but only about a quarter of this training wasarranged by Jobcentre Plus staff).
A higher percentage of NDLP programme group members, compared with controlgroup members, reported that they had taken steps to improve their work situation.Overall, 42 per cent of the programme group (or 63 per cent of those in work) – hadtaken such steps, compared with 37 per cent of the control group (Table 4.1).Though small, this difference was statistically significant and suggests that theprogramme group members were beginning to translate the advice they receivedwhile in work into greater action towards advancement (even though they had beenworking less than a year). Not surprisingly, in view of the bonuses on offer, much ofthis difference was accounted for by attempts to increase work hours.
NDLP programme group customers were also more likely, compared with controlgroup members, to participate in training, both overall and while in work. Among allNDLP programme group members, 21 per cent said they had ‘…ever participated ina training or education class while working’, compared with 16 per cent among thecontrols. Thus, ERA increased the likelihood of NDLP customers combining workand training by a statistically significant five percentage points (see Table 4.1).Notably, this type of training or education could potentially qualify one for the ERAtraining bonus. Overall, regardless of whether their participation took place whilethey were in work or out of work, 45 per cent of all NDLP programme groupcustomers participated in education or training courses. In about a third of the cases,the courses had been arranged by Jobcentre Plus staff.
4.2.4 Achievement of training or education credentials
While many NDLP sample members (in the control and programme groups)participated in training, the outcomes in terms of new qualifications were meagre –at least during the follow-up period covered by this report. About three per centoverall (or about eight per cent of those taking training) obtained a GeneralCertificate of Secondary Education (GCSE) qualification or its equivalent in the 12months following random assignment. Fewer got any higher qualifications butabout one in ten overall obtained one of a wide variety of mainly vocationalqualifications. Comparing the NDLP ERA customers with the control group, theproportions receiving new qualifications were the same (Table 4.1).
4.2.5 Awareness and receipt of ERA employment retention andtraining bonuses and other financial assistance
As discussed in Chapter 3, almost three-quarters of the NDLP programme group hadheard of the employment retention bonus (Table 4.1). (The bonus offers up to sixpayments of £400 for each period when customers work 30 or more hours per weekfor 13 out of 17 weeks.) Overall, 19 per cent of the programme group members
ERA participants’ recall of advice received and action taken to remain and advance in work
89
reported that they had received the bonus within the 12-month follow-up period –a figure roughly matched by data maintained by ERA district staff. Expressedanother way, this is 28 per cent of those who held a job at some point during thefollow-up period.
There are several reasons why the employment retention bonus receipt rate was nothigher: Some individuals apparently had not heard of the bonus; about a third didnot work during the follow-up period; some, if they did work, did not work therequired number of weeks and/or the required number of hours per week; and somewere close to or in the process of getting the bonus.
Preliminary data that detail bonus receipt beyond the 12-month follow-up period (toJanuary 2006, regardless of when a customer was randomly assigned) suggest thatabout two-thirds of the NDLP customers who had received an employmentretention bonus as of early 2006 had received one or two bonuses; less than one-third had received three or more.
Claiming the employment retention bonus involved a visit to the Jobcentre Plusoffice to have the claim verified. This requirement was added to the design of ERA toprovide an opportunity for ASAs to engage with their customers face-to-face onissues concerning their progress in work. About two-thirds of the NDLP retentionbonus claimants, representing just one in about ten of the NDLP ERA group as awhole, talked with Jobcentre Plus staff about work or work prospects when visitingthe office to receive their bonus. Those who were engaged in this way recalleddiscussing a range of topics with their ASAs regarding training and seeking betterpay and conditions, often in a new job.
Four out of ten of those receiving the employment retention bonus said that it hadhad ‘a lot’ of influence in deciding the hours they would work. This is interestingsince lone parents tend more than other groups leaving benefit, to work in jobswhose hours range from 16 to 30 hours per week, a range that does not qualifythem for the bonus under ERA.
NDLP ERA customers were less aware of the ERA training bonus that was available tothose who successfully completed a training course while they were employed: Halfhad heard something about it and just three per cent had received one. About halfof the few NDLP customers who received the bonus said that it influenced theirdecision to start training ‘a lot’ and a third said it influenced their decision tocontinue in training ‘a lot’.
Other financial resources were also available to ERA customers. While in work, theycould qualify for assistance that would pay a capped amount towards the fees of anapproved training course. Preliminary files containing data to January 2006,regardless of when a customer was randomly assigned, suggest that about five percent of all NDLP customers received such assistance with tuition fees. The amountspaid towards fees varied widely but averaged around £450 among those whoreceived this assistance.
ERA participants’ recall of advice received and action taken to remain and advance in work
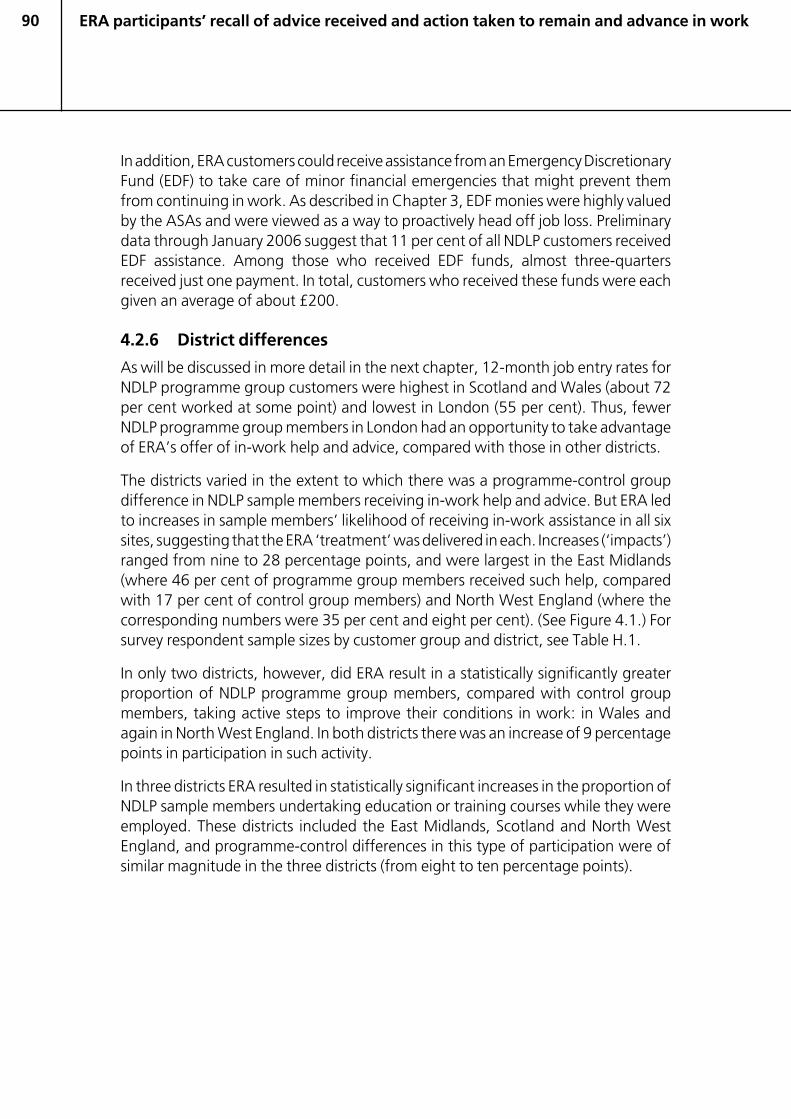
90
In addition, ERA customers could receive assistance from an Emergency DiscretionaryFund (EDF) to take care of minor financial emergencies that might prevent themfrom continuing in work. As described in Chapter 3, EDF monies were highly valuedby the ASAs and were viewed as a way to proactively head off job loss. Preliminarydata through January 2006 suggest that 11 per cent of all NDLP customers receivedEDF assistance. Among those who received EDF funds, almost three-quartersreceived just one payment. In total, customers who received these funds were eachgiven an average of about £200.
4.2.6 District differences
As will be discussed in more detail in the next chapter, 12-month job entry rates forNDLP programme group customers were highest in Scotland and Wales (about 72per cent worked at some point) and lowest in London (55 per cent). Thus, fewerNDLP programme group members in London had an opportunity to take advantageof ERA’s offer of in-work help and advice, compared with those in other districts.
The districts varied in the extent to which there was a programme-control groupdifference in NDLP sample members receiving in-work help and advice. But ERA ledto increases in sample members’ likelihood of receiving in-work assistance in all sixsites, suggesting that the ERA ‘treatment’ was delivered in each. Increases (‘impacts’)ranged from nine to 28 percentage points, and were largest in the East Midlands(where 46 per cent of programme group members received such help, comparedwith 17 per cent of control group members) and North West England (where thecorresponding numbers were 35 per cent and eight per cent). (See Figure 4.1.) Forsurvey respondent sample sizes by customer group and district, see Table H.1.
In only two districts, however, did ERA result in a statistically significantly greaterproportion of NDLP programme group members, compared with control groupmembers, taking active steps to improve their conditions in work: in Wales andagain in North West England. In both districts there was an increase of 9 percentagepoints in participation in such activity.
In three districts ERA resulted in statistically significant increases in the proportion ofNDLP sample members undertaking education or training courses while they wereemployed. These districts included the East Midlands, Scotland and North WestEngland, and programme-control differences in this type of participation were ofsimilar magnitude in the three districts (from eight to ten percentage points).
ERA participants’ recall of advice received and action taken to remain and advance in work
91
Figure 4.1 Activities while in work, by district, New Deal for LoneParents customers
ERA participants’ recall of advice received and action taken to remain and advance in work
92
4.2.7 Summary
Among the NDLP sample, the ERA programme, compared with the situationexperienced by the control group, slightly increased the proportion of customerswho received help and advice from Jobcentre Plus staff while they were out of work.But ERA did not increase NDLP sample members’ likelihood of participating inactivities to help them find a job or prepare for work in the first place.
The ERA programme doubled the likelihood that NDLP sample members would havecontact with Jobcentre Plus staff while they were working and more than doubledthe likelihood that NDLP customers would receive help or advice while they were inwork, relative to what customers would have experienced without ERA. Notably, asurprising number of control group members also had contact with Jobcentre Plusstaff while they were working and received some help and advice from them.
ERA produced small increases in the chances that NDLP sample members, while inwork, would actually take steps to improve their work situation or find another job.ERA also slightly increased the likelihood that NDLP sample members wouldparticipate in a training or education course while they were employed. Theseincreases were generally large enough to suggest that they were driven more byincreases in service provision than by the eventual difference in employment ratesbetween programme and control group members found for NDLP customers(discussed early in this section and in more detail in Chapter 5).
Available data indicate that, 12 months after entering the study, most NDLPprogramme group members recalled having been informed of the employmentretention bonus but fewer recalled having heard of the training completion bonus.Receipt of these bonuses was relatively low, although 12 months after entering thestudy is an early point at which to measure bonus receipt.
4.3 New Deal 25 Plus
The ND25+ customers in the ERA study represent a group of older long-termunemployed people, mostly men, many of whom have multiple barriers to gettingpaid work. For these individuals, unlike for NDLP customers, participation in NewDeal services while they are out of work is mandatory and they move into the ND25+programme when they have been out of work for about 18 months.
Compared with the NDLP and WTC groups, the ND25+ group would be expected tohave more difficulty securing jobs, even with the added incentive of employmentretention or training bonuses. Given that these are long-term benefit recipients,however, the financial payoff for the New Deal would be large if ERA moved only asmall additional portion of them into work and kept them in their new jobs longer.
4.3.1 Overall contact with Jobcentre Plus
Looking first at the control group, more than three-quarters of the ND25+ controlgroup members had some contact with Jobcentre Plus staff following random
ERA participants’ recall of advice received and action taken to remain and advance in work
93
assignment. It is fair to wonder why this figure is not closer to 100 per cent, giventhat ND25+ is a mandatory programme. Those who had no contact were likely to bethose who had dropped out of the programme right away because they got a job,were discovered to have one already or ceased to claim benefits for some otherreason.
ERA programme group customers were more likely than control group members tohave had contact with Jobcentre Plus staff and this six percentage point differencewas statistically significant. Face-to-face contact was a little more likely among theERA customers, and telephone conversations were far more likely (41 per cent of theERA group experienced these, compared to 28 per cent of the control group) andmore frequent, reflecting ASAs’ preferred method of keeping in touch with theirERA customers. In addition, ERA customers were more likely than their controlcounterparts to initiate meetings with Jobcentre Plus staff.
4.3.2 Help and advice received and steps taken while not in work
Help and advice while not in work
As expected, most ND25+ control group members reported that they had receivedout-of-work help and advice from a Jobcentre Plus adviser (Table 4.2). Most of thisadvice was directed to finding work, though about half had help finding trainingcourses, which can be part of the ND25+ programme (Table D.4).
Although the experiences of the ND25+ ERA programme group differed little inthese respects from those of the control group, since the pre-employment phase ofERA was essentially the same New Deal programme to which the controls wereassigned, there were some small signs of ERA’s more considered approach to jobplacement while people were out of work. Slightly greater fractions of the ERAprogramme group recalled advice about staying in work or advancing in the futureand working out long-term career goals, for example, even if those receiving suchadvice when not working remained in a minority. In addition, slightly greaterfractions of the ERA group recalled receiving help looking for education or trainingcourses.
Participation in job search, education, and training
The data give a strong impression that when they were out of work, ND25+customers – in the programme or control group – were as active in job search andrelated activities as the New Deal programme expects them to be and showed agood deal of enterprise beyond the programme’s mandatory requirements. Over athird of those in both research groups, for example, put their names on the books ofa private recruitment agency and more attended job clubs, while nearly all searchedfor work independently (Table D.4). Moreover, a third attended training courseswhile not in work. Finally, as was true among NDLP customers, only a smallproportion recalled being advised to pass up an opportunity for employment infavour of the chance of a better offer in the future.
ERA participants’ recall of advice received and action taken to remain and advance in work
94
ERA generally did not produce any differences in ‘out-of-work’ activities for ND25+customers: Programme and control groups had very similar rates of participation injob search or education and training activities.
Table 4.2 Advice/help received and participation in activities:summary measures New Deal 25 Plus customers
ERA Control DifferenceOutcome group group (impact) P-value
Not in work and: (%)
Received help/advice from Jobcentre Plus staff 85.1 85.0 0.1 0.964
Participated in activities to help find a job orprepare for work 89.3 91.1 -1.8 0.153
In work and: (%)Had any contact with Jobcentre Plus staff 30.9 13.9 17.0*** 0.000
Received help/advice from Jobcentre Plus staff 22.3 11.7 10.6*** 0.000
Took steps to help improve work situation orearnings 28.7 29.8 -1.1 0.552
Took steps to find another job 13.3 12.2 1.1 0.445
Took steps other than the above to improve worksituation or earnings 7.9 7.8 0.1 0.908
Participated in training or education 10.9 7.7 3.2*** 0.007
Regardless of work status: (%)
Participated in training or education 43.9 44.3 -0.3 0.874
Obtained any training or education qualifications
GCSE 3.0 3.1 -0.1 0.866
A-level 1.4 1.0 0.4 0.380
Other 9.2 10.2 -1.0 0.439
Had heard of employment retention bonus 75.1 0.2 74.9*** 0.000
Received employment retention bonus 22.5 0.2 22.4*** 0.000
Had heard of training completion bonus 42.5 0.2 42.3*** 0.000
Received training completion bonus 1.8 0.0 1.8*** 0.000
Sample size 1,121 1,092
Source: MDRC calculations from the ERA 12-month customer survey.
Notes: Very similar proportions of ERA and control group members in the New Deal 25 Pluscustomer group did and did not work during the follow-up period: In all, 95.2 per cent of theERA group and 96.0 per cent of the control group did not work at some point during the follow-up period; 49.4 per cent of the ERA group and 49.1 per cent of the control group did work atsome point during the follow-up period. Thus, New Deal 25 Plus customers in the ERA andcontrol groups had equal opportunity to avail themselves of not-in-work and in-work services.
Estimates were regression-adjusted using ordinary least squares, controlling for pre-randomassignment characteristics of sample members.
Rounding may cause slight discrepancies in calculating sums and differences.
Two-tailed t-tests were applied to differences between outcomes for the ERA group and thecontrol group. Statistical significance levels are indicated as: * = 10 per cent; ** = 5 per cent and*** = 1 per cent.
ERA participants’ recall of advice received and action taken to remain and advance in work
95
4.3.3 Help and advice received and steps taken while in work
As was the case with the NDLP results, it is important to take into account anydifference in the proportion of ND25+ programme and control group memberswho eventually entered work, as this might affect the interpretation of any researchgroup differences in receiving in-work help or advice. In the case of the ND25+customers, however, no such employment differences were found (as described inthe notes at the bottom of Table 4.2 and discussed more fully in Chapter 5). Thus,ND25+ customers in the programme and control groups had equal opportunity toavail themselves of in-work services.
Contact
Fourteen per cent of all ND25+ control group members had any contact withJobcentre Plus staff while working (Table 4.2). Expressed another way, this is 28 percent of those who had had a job at some point in the 12 months of follow-up.Furthermore, eight per cent of the entire ND25+ control group (16 per cent of thosewho had jobs) were offered in-work help and advice from their PA without askingfor it. Thus, even in the absence of ERA, some ND25+ recipients did access JobcentrePlus services while in work. More of these contacts were face-to-face than on thetelephone, and the majority of those who had face-to-face contact were in aJobcentre Plus office more than once or twice.
ND25+ participants’ eligibility for ERA more than doubled their likelihood of havingin-work contact, compared with the control group: 31 per cent of the programmegroup members (63 per cent of just those who worked at all during the follow-upperiod) had contact with Jobcentre Plus staff while they were employed, comparedto 14 per cent of control group members, yielding a 17 percentage point impact onhaving in-work contact. Moreover, programme group members’ contacts weremore frequent. Programme group members’ rates of telephone contact, forexample, were roughly three times higher than the rates for control group members.
Help and advice while in work
Few – 12 per cent – of ND25+ control group members reported that they receivedactual help or advice while in work (Table 4.2). For those who received it, this helpand advice was more than a practical sorting out of detail soon after entry into work.These control group members received advice on training courses and on aspects ofwork that are recognisably advancement and retention issues, too, such as gettinga better or more permanent job, increasing their hours and even negotiating betterpay and conditions and working out long-term career goals (Table D.5).
Compared with the control group, the ERA programme group was more likely tohave been in work and to recall receiving in-work help and advice: 22 per cent overall(45 per cent of those in work at some point) were in this situation, which is twice therate of the control group. In the case of the ERA programme group, the in-work helpand advice was more likely to emphasise getting a better job, increasing their hoursand getting more education or training, which corresponds to the likely effects ofthe cash bonuses available for full-time sustained work and training.
ERA participants’ recall of advice received and action taken to remain and advance in work
96
It must also be remembered, however, that 78 per cent of all those in the ND25+ ERAgroup (55 per cent of those who were in work at some point) recalled no in-workhelp or advice. Thus, while ERA provided in-work help and advice to manyindividuals who otherwise would not have received it, there was opportunity toprovide it to many more.
Participation in job search, education and training and advancementactivities while in work
The control group results show that, once in work, people leaving ND25+ have amore enterprising approach to their new jobs than they are commonly creditedwith. Thirty per cent of all control group members (or 61 per cent of those who hadhad jobs at some point in the 12-month follow-up period) said they ‘…took steps…’to help improve their work situation or earnings (Table 4.2). These efforts wereconcentrated on attempts to increase hours and look for a better job, usually with anew employer, though about one in seven in work tried to negotiate a pay rise orbetter conditions of service.
Table 4.2 suggests that the additional in-work help and advice reported by ERAprogramme group members had not yet led to additional action on their part, atleast during the 12-month follow-up period. Programme group members’ reportsof activity to improve their working conditions or seek better jobs elsewhere werealmost identical to those of the control group. The sole exception was a small butstatistically significant increase in in-work education and training undertaken by theND25+ ERA programme group compared with controls (11 per cent compared toeight per cent). In other words, ERA increased the likelihood that ND25+ customerswould combine work and training by 3.2 percentage points. This probably reflects,in part, the cash bonuses associated with ERA in-work training not available tomembers of the control group.
4.3.4 Achievement of training or education credentials
The outcomes in terms of new qualifications ND25+ sample members earned sincerandom assignment were very similar, and as meagre, as those found for the NDLPsample members. More than four out of ten ND25+ customers had participated intraining but only about three per cent overall (or about seven per cent of thosetaking training) obtained a GCSE qualification or its equivalent in the 12 monthsfollowing random assignment. Fewer got any higher qualifications but about one inten, overall, obtained one of a wide variety of mainly vocational qualifications.Again, the proportions receiving new qualifications were the same among ND25+ERA customers as among the control group (Table 4.2).
4.3.5 Awareness and receipt of ERA employment retention andtraining bonuses and other financial assistance
As shown in Table 4.2, three-quarters of the ND25+ ERA programme groupreported that they had heard of the employment retention bonus. Overall, 23 percent of all ND25+ programme group members reported that they had received the
ERA participants’ recall of advice received and action taken to remain and advance in work
97
employment retention bonus within the 12-month follow-up period – a figure thatis roughly matched by spreadsheets maintained by ERA district staff. This figurerepresents 46 per cent of those who held a job at some point during the follow-upperiod.
Preliminary data that detail bonus receipt beyond the 12-month follow-up period, toJanuary 2006, suggest that, among those ND25+ sample members who received anemployment retention bonus, about three-quarters had received one or twobonuses by early 2006; less than one-quarter had received three or more. A littlemore than half (54 per cent) of the ND25+ programme group members whoreported receiving the bonus within the 12-month follow-up period recalled havingmet with their ASA when they claimed their bonus, representing just 12 per cent ofthe ND25+ ERA group as a whole.
Only a third of those who had received the employment retention bonus said that ithad had ‘a lot’ of influence in deciding the hours they would work, presumably sinceworkers usually leave ND25+ for full-time jobs whose hours are prescribed by theirnew employers. Only slightly more said the bonus had had ‘a lot’ of influence ontheir decision to stay in full-time work.
ND25+ customers were even less aware than NDLP customers of the ERA trainingcompletion bonus available: 42 per cent had heard something about it and just twoper cent had received one. The survey data give the impression that the majority ofthose few receiving this bonus may have taken a training course and stayed with itregardless of the bonus; only a third said it influenced their decision ‘a lot’ to starttraining or continue in it.
ND25+ ERA customers, like their NDLP counterparts, were also eligible for monetaryassistance to pay the fees of approved training courses. Preliminary data filescontaining information on payments through January 2006 suggest that less thanfour per cent of all ND25+ ERA customers received such assistance with tuition feesand that these payments averaged about £450 among those who received them.
Receipt of EDF monies among ND25+ ERA customers was more common: almostseven per cent of all ND25+ ERA customers received payments to take care of minorfinancial emergencies that might interfere with employment retention. Preliminarydata to January 2006 suggest that ND25+ ERA customers who received these fundswere each given an average of about £200.
4.3.6 District differences
When examining district differences, it is important to take into account thediffering proportions of sample members in each site who had time in work duringthe 12-month follow-up period. Notably, there was wide variation in this outcome:Job entry rates for ND25+ ERA customers were highest in the East Midlands (56 percent) and strikingly, lowest in London (36 per cent), suggesting that fewer ERAprogramme group members in London had an opportunity to take advantage of
ERA participants’ recall of advice received and action taken to remain and advance in work
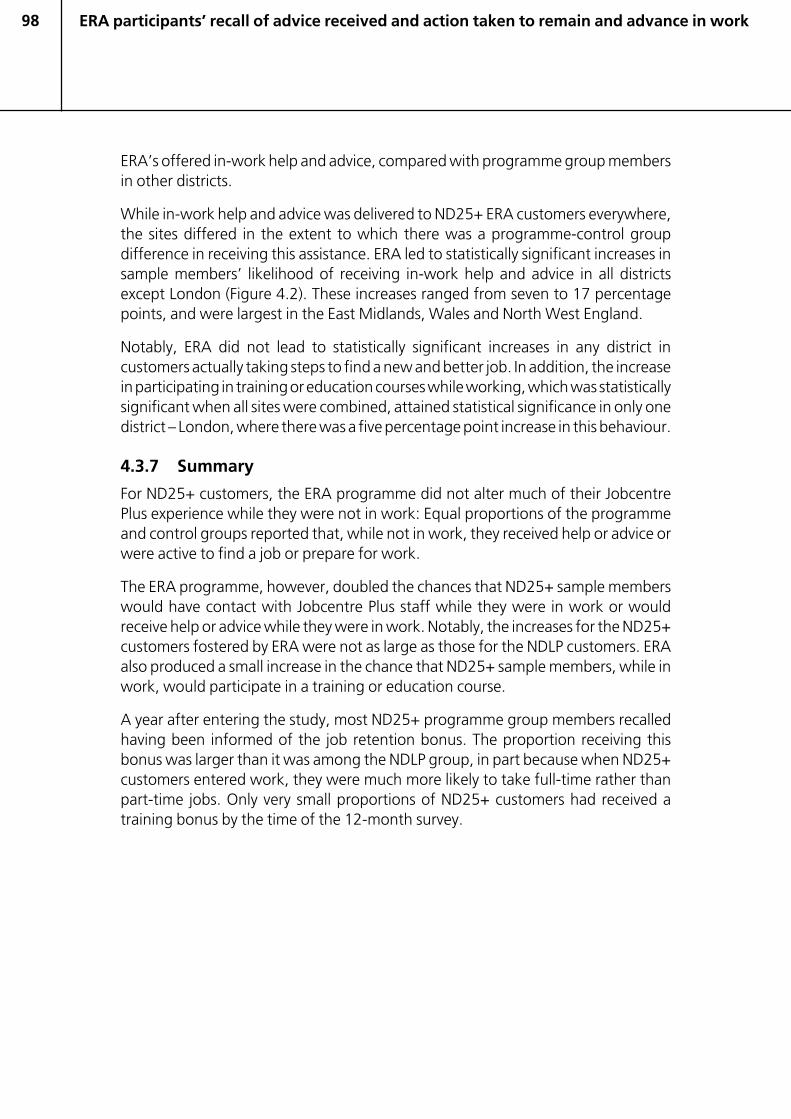
98
ERA’s offered in-work help and advice, compared with programme group membersin other districts.
While in-work help and advice was delivered to ND25+ ERA customers everywhere,the sites differed in the extent to which there was a programme-control groupdifference in receiving this assistance. ERA led to statistically significant increases insample members’ likelihood of receiving in-work help and advice in all districtsexcept London (Figure 4.2). These increases ranged from seven to 17 percentagepoints, and were largest in the East Midlands, Wales and North West England.
Notably, ERA did not lead to statistically significant increases in any district incustomers actually taking steps to find a new and better job. In addition, the increasein participating in training or education courses while working, which was statisticallysignificant when all sites were combined, attained statistical significance in only onedistrict – London, where there was a five percentage point increase in this behaviour.
4.3.7 Summary
For ND25+ customers, the ERA programme did not alter much of their JobcentrePlus experience while they were not in work: Equal proportions of the programmeand control groups reported that, while not in work, they received help or advice orwere active to find a job or prepare for work.
The ERA programme, however, doubled the chances that ND25+ sample memberswould have contact with Jobcentre Plus staff while they were in work or wouldreceive help or advice while they were in work. Notably, the increases for the ND25+customers fostered by ERA were not as large as those for the NDLP customers. ERAalso produced a small increase in the chance that ND25+ sample members, while inwork, would participate in a training or education course.
A year after entering the study, most ND25+ programme group members recalledhaving been informed of the job retention bonus. The proportion receiving thisbonus was larger than it was among the NDLP group, in part because when ND25+customers entered work, they were much more likely to take full-time rather thanpart-time jobs. Only very small proportions of ND25+ customers had received atraining bonus by the time of the 12-month survey.
ERA participants’ recall of advice received and action taken to remain and advance in work
99
Figure 4.2 Activities while in work, by district, New Deal 25 Pluscustomers
ERA participants’ recall of advice received and action taken to remain and advance in work
����
�������� ���� ���� ��
������ ����
���
100
4.4 Lone parents receiving Working Tax Credit
The lone parents randomly assigned when they were working 16 to 29 hours a weekand receiving WTC, have a special value in this evaluation because they all had paidwork at the start of the scheme. In-work services could be offered to them straightaway. Not all of them, however, remained in work throughout the next 12 months.Almost a quarter spent some of that time not working, which is itself a clearindicator of the need for in-work support.
Compared with the NDLP and ND25+ groups, the WTC group might be expected tohave members who were more responsive to ERA for two reasons: They wererecruited on the basis of the advantages ERA might immediately offer them and theywere interested enough to volunteer for random assignment. Equally, though, theWTC control group is composed of working lone parents who were also keen onwhat ERA might offer but were denied ERA services by chance. So they, too, mayrepresent the more enterprising kinds of working lone parents.
As described in Chapter 2, WTC sample members interviewed as part of the 12-month survey are disproportionately from the East Midlands – almost half of theWTC sample members in the whole programme are from this site. This section of thechapter therefore focuses primarily on the ERA ‘treatment’ for WTC samplemembers as it unfolded in that district. Where different patterns were observed forthe smaller samples of WTC survey respondents in the other five districts, it isnoted.24
4.4.1 Overall contact with Jobcentre Plus
Around one-quarter of the East Midlands WTC control group had some contact withJobcentre Plus staff during the 12 months following their random assignment; morethan half of these had at least one face-to-face contact. Almost all of the WTCcontrol group customers who had any in-person contacts initiated at least one of thecontacts themselves, as Jobcentre Plus staff would have had little reason to contactthem. Moreover, these East Midlands WTC control group members did not visit theJobcentre Plus office just once; over one-third of those who visited the office did soat least three times.
24 Unlike the method used in Chapter 5, this chapter, while focusing on the WTCEast Midlands results, also references WTC results for North West England, inaddition to the other districts. North West England has a customer survey samplesize, combining the programme and control group, of 45, whereas the othernon-East Midlands districts have survey sample sizes ranging from 102 to 192.North West England’s small sample also inexplicably includes a number ofcustomers who did not report being employed as of random assignment. Sinceover three-quarters of the sample reported employment at some point duringthe 12-month follow-up period, however, and the broad participation outcomesdiscussed in this section are tied to having at least some time ‘in work’, WTCresults for North West England were included in this chapter’s analysis.
ERA participants’ recall of advice received and action taken to remain and advance in work
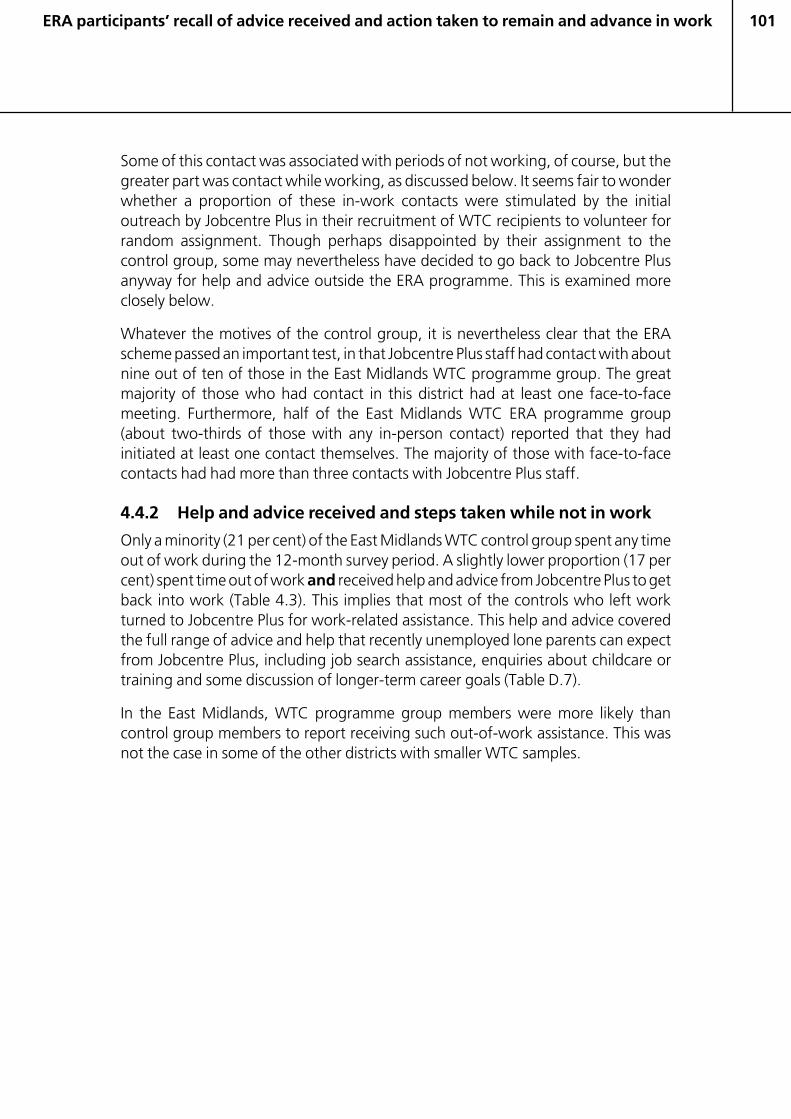
101
Some of this contact was associated with periods of not working, of course, but thegreater part was contact while working, as discussed below. It seems fair to wonderwhether a proportion of these in-work contacts were stimulated by the initialoutreach by Jobcentre Plus in their recruitment of WTC recipients to volunteer forrandom assignment. Though perhaps disappointed by their assignment to thecontrol group, some may nevertheless have decided to go back to Jobcentre Plusanyway for help and advice outside the ERA programme. This is examined moreclosely below.
Whatever the motives of the control group, it is nevertheless clear that the ERAscheme passed an important test, in that Jobcentre Plus staff had contact with aboutnine out of ten of those in the East Midlands WTC programme group. The greatmajority of those who had contact in this district had at least one face-to-facemeeting. Furthermore, half of the East Midlands WTC ERA programme group(about two-thirds of those with any in-person contact) reported that they hadinitiated at least one contact themselves. The majority of those with face-to-facecontacts had had more than three contacts with Jobcentre Plus staff.
4.4.2 Help and advice received and steps taken while not in work
Only a minority (21 per cent) of the East Midlands WTC control group spent any timeout of work during the 12-month survey period. A slightly lower proportion (17 percent) spent time out of work and received help and advice from Jobcentre Plus to getback into work (Table 4.3). This implies that most of the controls who left workturned to Jobcentre Plus for work-related assistance. This help and advice coveredthe full range of advice and help that recently unemployed lone parents can expectfrom Jobcentre Plus, including job search assistance, enquiries about childcare ortraining and some discussion of longer-term career goals (Table D.7).
In the East Midlands, WTC programme group members were more likely thancontrol group members to report receiving such out-of-work assistance. This wasnot the case in some of the other districts with smaller WTC samples.
ERA participants’ recall of advice received and action taken to remain and advance in work
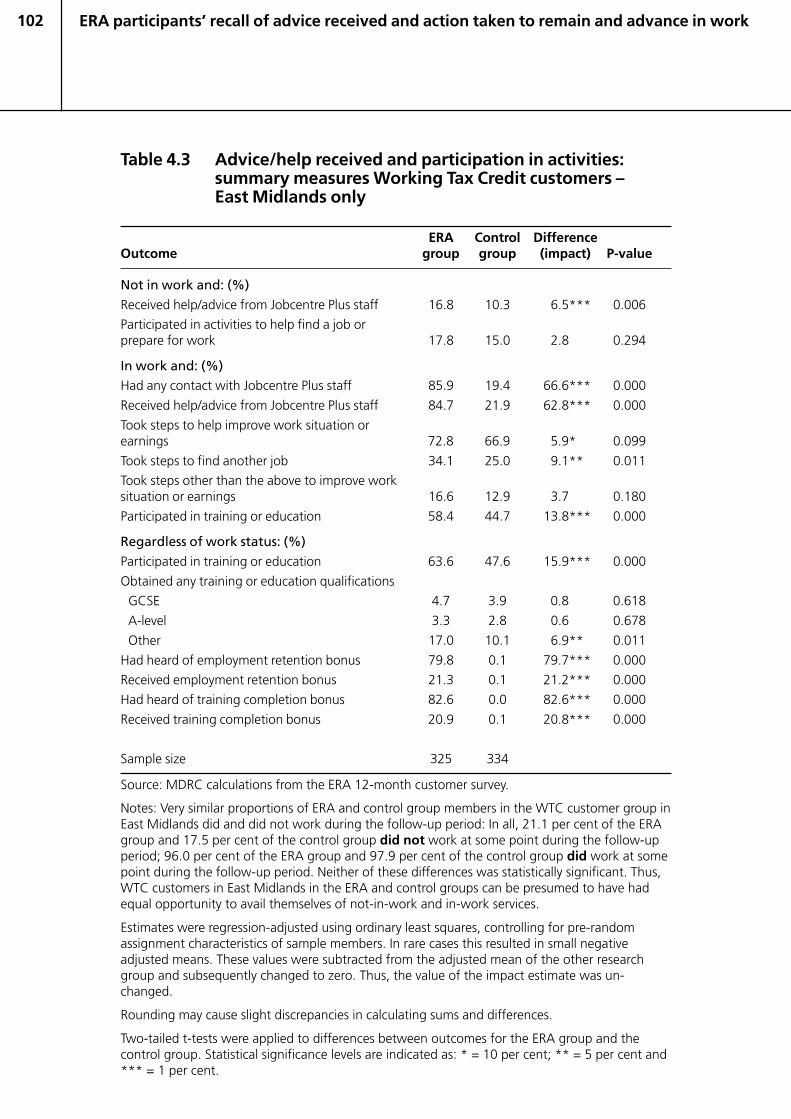
102
Table 4.3 Advice/help received and participation in activities:summary measures Working Tax Credit customers –East Midlands only
ERA Control DifferenceOutcome group group (impact) P-value
Not in work and: (%)
Received help/advice from Jobcentre Plus staff 16.8 10.3 6.5*** 0.006
Participated in activities to help find a job orprepare for work 17.8 15.0 2.8 0.294
In work and: (%)Had any contact with Jobcentre Plus staff 85.9 19.4 66.6*** 0.000
Received help/advice from Jobcentre Plus staff 84.7 21.9 62.8*** 0.000
Took steps to help improve work situation orearnings 72.8 66.9 5.9* 0.099
Took steps to find another job 34.1 25.0 9.1** 0.011
Took steps other than the above to improve worksituation or earnings 16.6 12.9 3.7 0.180
Participated in training or education 58.4 44.7 13.8*** 0.000
Regardless of work status: (%)
Participated in training or education 63.6 47.6 15.9*** 0.000
Obtained any training or education qualifications
GCSE 4.7 3.9 0.8 0.618
A-level 3.3 2.8 0.6 0.678
Other 17.0 10.1 6.9** 0.011
Had heard of employment retention bonus 79.8 0.1 79.7*** 0.000
Received employment retention bonus 21.3 0.1 21.2*** 0.000
Had heard of training completion bonus 82.6 0.0 82.6*** 0.000
Received training completion bonus 20.9 0.1 20.8*** 0.000
Sample size 325 334
Source: MDRC calculations from the ERA 12-month customer survey.
Notes: Very similar proportions of ERA and control group members in the WTC customer group inEast Midlands did and did not work during the follow-up period: In all, 21.1 per cent of the ERAgroup and 17.5 per cent of the control group did not work at some point during the follow-upperiod; 96.0 per cent of the ERA group and 97.9 per cent of the control group did work at somepoint during the follow-up period. Neither of these differences was statistically significant. Thus,WTC customers in East Midlands in the ERA and control groups can be presumed to have hadequal opportunity to avail themselves of not-in-work and in-work services.
Estimates were regression-adjusted using ordinary least squares, controlling for pre-randomassignment characteristics of sample members. In rare cases this resulted in small negativeadjusted means. These values were subtracted from the adjusted mean of the other researchgroup and subsequently changed to zero. Thus, the value of the impact estimate was un-changed.
Rounding may cause slight discrepancies in calculating sums and differences.
Two-tailed t-tests were applied to differences between outcomes for the ERA group and thecontrol group. Statistical significance levels are indicated as: * = 10 per cent; ** = 5 per cent and*** = 1 per cent.
ERA participants’ recall of advice received and action taken to remain and advance in work
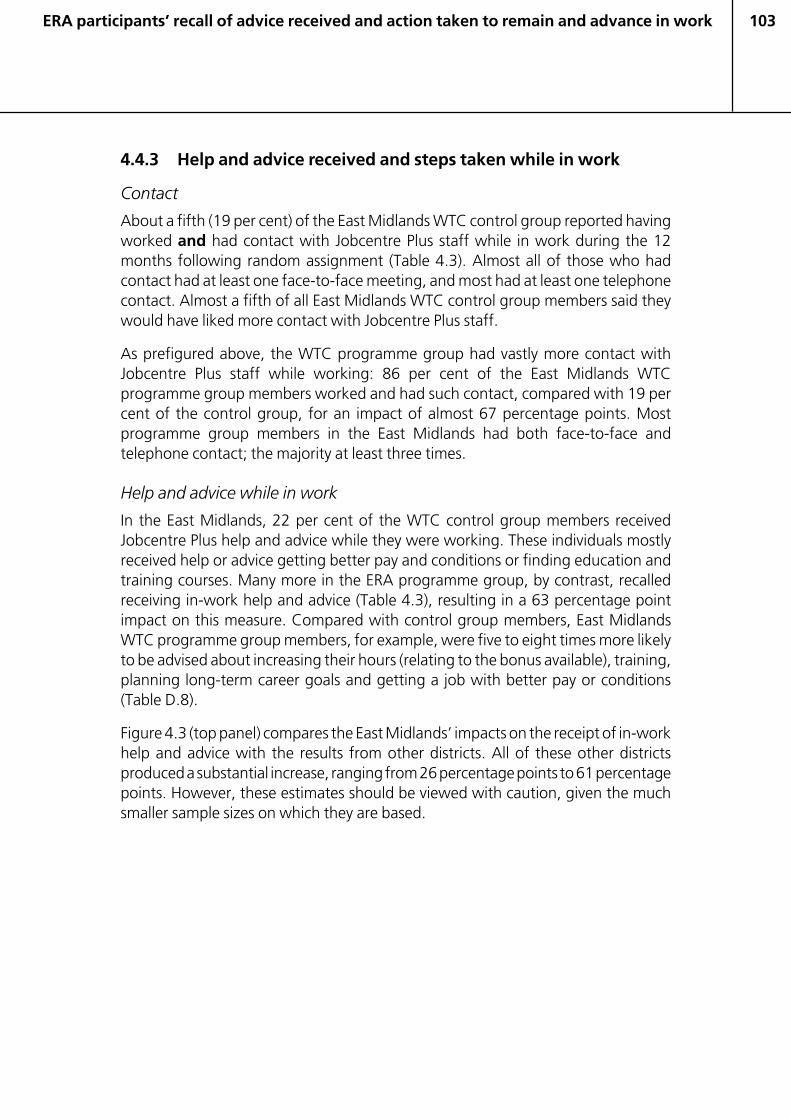
103
4.4.3 Help and advice received and steps taken while in work
Contact
About a fifth (19 per cent) of the East Midlands WTC control group reported havingworked and had contact with Jobcentre Plus staff while in work during the 12months following random assignment (Table 4.3). Almost all of those who hadcontact had at least one face-to-face meeting, and most had at least one telephonecontact. Almost a fifth of all East Midlands WTC control group members said theywould have liked more contact with Jobcentre Plus staff.
As prefigured above, the WTC programme group had vastly more contact withJobcentre Plus staff while working: 86 per cent of the East Midlands WTCprogramme group members worked and had such contact, compared with 19 percent of the control group, for an impact of almost 67 percentage points. Mostprogramme group members in the East Midlands had both face-to-face andtelephone contact; the majority at least three times.
Help and advice while in work
In the East Midlands, 22 per cent of the WTC control group members receivedJobcentre Plus help and advice while they were working. These individuals mostlyreceived help or advice getting better pay and conditions or finding education andtraining courses. Many more in the ERA programme group, by contrast, recalledreceiving in-work help and advice (Table 4.3), resulting in a 63 percentage pointimpact on this measure. Compared with control group members, East MidlandsWTC programme group members, for example, were five to eight times more likelyto be advised about increasing their hours (relating to the bonus available), training,planning long-term career goals and getting a job with better pay or conditions(Table D.8).
Figure 4.3 (top panel) compares the East Midlands’ impacts on the receipt of in-workhelp and advice with the results from other districts. All of these other districtsproduced a substantial increase, ranging from 26 percentage points to 61 percentagepoints. However, these estimates should be viewed with caution, given the muchsmaller sample sizes on which they are based.
ERA participants’ recall of advice received and action taken to remain and advance in work
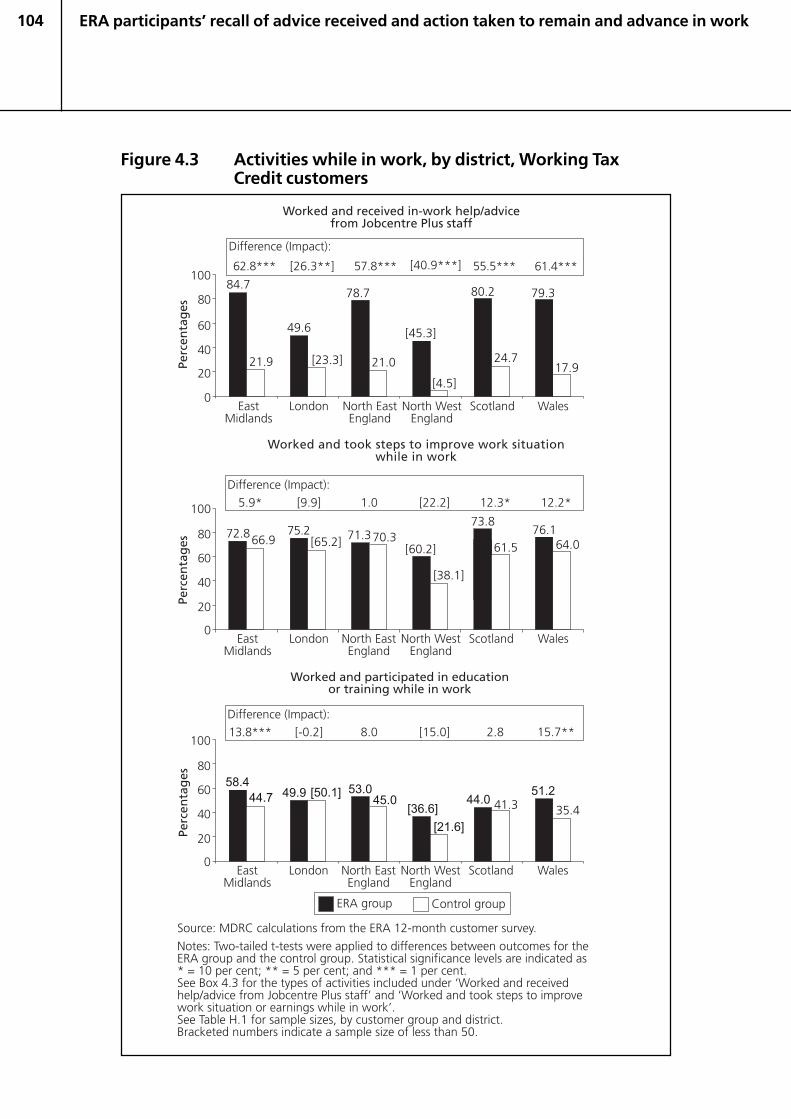
104
Figure 4.3 Activities while in work, by district, Working TaxCredit customers
ERA participants’ recall of advice received and action taken to remain and advance in work
�������� ����
���������
������ ���������
����
105
Participation in job search, education and training and advancementactivities while in work
Almost 67 per cent of the East Midlands WTC control group said they had takensteps to help improve their work situation or earnings while in work – a rate muchhigher than the 37 per cent rate among the NDLP control group and 30 per centamong the ND25+ control group. This suggests either that the ERA recruitmentprocess selected a particularly motivated enterprising group of lone parents or thatthe WTC customers had been in work longer when they entered ERA, so they weremore ready to focus on advancement.
More than a third of the control group members reported that they had tried toincrease their hours of work, this even in the absence of an offer of an employmentretention bonus in their case.25 Over one in six had tried to get a pay rise, more triedto negotiate better terms and conditions and 26 per cent had sought better workelsewhere, all while working. Forty-five per cent had undertaken a training coursewhile working, a proportion almost three times greater than in the NDLP controlgroup (16 per cent).
Though the in-work enterprise shown by the WTC control group is noteworthy, theWTC ERA group showed a little more. There was a six percentage point increase inthe proportion taking steps to improve their work situation in the East Midlands(slightly higher in a few other districts but with no statistically significant differencein some – see Figure 4.3). These attempts at improvement were focused onincreasing hours and trying to get a better job with another employer (Table D.8). Inaddition, in the East Midlands, the WTC ERA programme group was 14 percentagepoints more likely than the control group to participate in education or training whilein work. (A similar result was found in only one other district, Wales.)
4.4.4 Achievement of training or education credentials
Again, the outcomes in terms of new qualifications received since random assignmentwere similar to those found for the NDLP and ND25+ sample members, even thoughmore of the WTC customers had participated in training. About five per cent overall(or about seven per cent of those taking training) obtained a GCSE qualification or itsequivalent and fewer got any higher qualifications. However, just as more WTCprogramme group members, compared with WTC control group members,participated in training, so they were also more likely than the control group to getone of a wide variety of mainly vocational qualifications (17 per cent compared toten per cent; see Table 4.3).
25 As described in Chapter 2, an incentive of about £12 a week in additional taxcredits associated with working more than 29 hours a week is available to allclaimants, including individuals in the ERA control group.
ERA participants’ recall of advice received and action taken to remain and advance in work
106
4.4.5 Awareness and receipt of ERA employment retention andtraining bonuses and other financial assistance
Almost 80 per cent of the East Midlands WTC programme group members said theyhad heard of the employment retention bonus and 21 per cent reported that theyhad received at least one such payment within the 12-month follow-up – a figureroughly matched by ERA district data.
Given that almost all of the WTC sample members started off already in work andappeared to have greater enterprise and interest in immediate advancement relativeto the ND25+ and NDLP sample members, it is surprising that the bonus receipt ratefor the WTC group is not higher. Preliminary data that detail bonus receipt beyondthe 12-month follow-up period suggest, further, that WTC sample members werenot more likely than sample members in the other two targets groups to receiveadditional employment retention bonuses. Regardless of district, about three-quarters of those who received a bonus got one or two through early 2006; theremaining one-quarter received three or more.
About 83 per cent of the East Midlands WTC ERA customers were aware of thetraining completion bonus. This is substantially more than the rates observed amongthe NDLP and ND25+ ERA customers (51 per cent and 43 per cent, respectively).There is evidence from staff interviews that it was the prospect of generous supportfor training that most attracted the WTC customers to volunteer for randomassignment in the first place. According to staff, this opportunity was valued evenmore than the prospect of the employment retention bonus, which involved anincrease in their working hours that many did not welcome at that point. Many had,after all, only recently chosen to work no more than 29 hours a week and they hadmade this choice for considered reasons. WTC programme group membersreceiving the training completion bonus were also much more likely than those inthe other two ERA groups to say that this bonus had influenced them ‘a lot’ to beginand to continue training.
Overall, 21 per cent of the WTC ERA customers in the East Midlands received atraining completion bonus – a much higher proportion than among the NDLP andND25+ customers. This is perhaps reflective, in part, of ERA’s effect of increasing, inthe East Midlands, WTC customers’ likelihood of participating in training oreducation while working. Regardless of district, preliminary data suggest that over90 per cent of those receiving a training completion bonus got one or two to early2006. The average training completion bonus issued was about £370; the averagetotal amount of this bonuses received per person was about £450.
WTC customers were also eligible for help in paying the fees of approved trainingcourses that they took while they were employed. Almost 16 per cent of WTC ERAcustomers received this type of assistance, according to preliminary data to January2006, that covers all six districts. This is a much higher receipt rate of training feeassistance than observed for the NDLP or ND25+ customer groups. Among WTCcustomers, these payments averaged about £360 per person among those who
ERA participants’ recall of advice received and action taken to remain and advance in work
107
received them, a lower average amount than that found for the other two customergroups.
A higher proportion of WTC customers, compared with the other two customergroups, also received EDF monies. Almost 14 per cent of all WTC ERA customers(across all six districts) received such payments to deal with financial emergenciesthat might prevent employment retention. Preliminary data to January 2006suggest that WTC customers who received these funds were, like those in the othertwo customer groups, each given an average of about £200.
4.4.6 Summary
Among WTC customers, about one-fifth spent any time during the 12-monthfollow-up period not in work. For these individuals, the ERA programme did notsubstantially alter their experiences with Jobcentre Plus while they were not in work,although there were some district variations in this finding.
The ERA programme did substantially alter WTC sample members’ experienceswhile they were in work. ERA programme group members were about four timesmore likely than control group members to have had contact with Jobcentre Plusstaff while they were working and to have received help or advice while they were inwork. These increases were much larger than those found for the NDLP or ND25+customers. ERA also produced a small increase in the chance that WTC samplemembers, while in work, would take steps to improve their work situation or findanother job and a larger increase in the chance that they would participate in a trainingor education course while in work. They gathered a few more qualifications, too.
A year after entering the study, most WTC programme group members recalledhaving been informed of both the job retention bonus and the training bonus. As ofthis same point in time, the proportion of the WTC programme group that hadreceived the job retention bonus was similar to that found for the ND25+programme group but somewhat higher than the rate for the NDLP programmegroup. However, the likelihood of receiving the training completion bonus or tuitionassistance was much higher for the WTC group than for the two New Dealcustomers groups in ERA.
4.5 Attitudes towards work and Jobcentre Plus staff
It might be unrealistic to expect large impacts upon behaviour during individuals’first 12 months of ERA. However, customers’ orientation to work and advancementand to Jobcentre Plus, might be affected by their having a full-time ASA when theywere both in and out of work and by their awareness of the availability ofemployment retention and training completion bonuses. This section examinesthese attitudes and knowledge and highlights any programme-control groupdifferences in attitudinal measures.
ERA participants’ recall of advice received and action taken to remain and advance in work
108
4.5.1 Attitudes towards work
For those working at the time of the interview, the customer survey probed whetherthey were interested in advancing in work. About half of the then-employed NDLPand ND25+ control group members said they had a general desire to advance – toget on and improve their pay and conditions as quickly as possible. Among theothers – who reported that they wanted to stay as they were for now – most thoughtthey might want to improve their pay and terms six months or a year or more into thefuture. Among the ND25+ control group members, the most common reasons fortheir lack of enthusiasm to advance immediately included the view that they werehappy as they were at the moment or felt they needed better skills and moreexperience. Unlike the ND25+ group, the NDLP group tended to name childcare asthe main obstacle to immediate advancement, though many said they were happywith their present situation.
Reflecting a higher degree of enterprise, WTC control group members were muchmore likely than NDLP control group members to say they had a desire to get on andimprove their pay and conditions as quickly as possible. Like the NDLP group,however, those preferring to defer their advancement cited childcare responsibilitiesor a general contentment with their present circumstances as reasons for their lackof desire to immediately advance.
At the 12-month follow-up point, there is no evidence that the ND25+ or WTC ERAprogramme groups had developed an enthusiasm for advancement greater thanthat expressed by their respective control groups. Among the NDLP customers, ERAprogramme group members were slightly more likely than control group membersto report that they wanted to get on and improve their pay and terms as quickly aspossible.26
4.5.2 Attitudes towards Jobcentre Plus staff
Other research has shown that Jobcentre Plus customers generally think well of theirPAs. This finding is supported by findings from the ERA customer survey as well.
For both New Deal groups, roughly half of the control group members said theyliked to seek out a particular member of staff at the Jobcentre Plus office. This wastrue even among the ND25+ control group members, who were on a mandatoryprogramme.
Among those who sought out a particular staff person, nearly all NDLP and ND25+control group members said that this person had made at least ‘some’ and usually ‘alot’ of effort to get to know them and had given corresponding levels of support.Even among those who felt they had received only minimal encouragement from
26 These are non-experimental comparisons, as the characteristics of programmeand control group customers who were employed as of the 12-month customerinterview may differ.
ERA participants’ recall of advice received and action taken to remain and advance in work
109
their advisers while they were working, over three-quarters thought that they wouldhave received more if they had sought it.
Overall, considering all those who had any contact with Jobcentre Plus staff duringthe 12-month follow-up period, the majority of NDLP and ND25+ control groupmembers rated the help and advice they received as ‘very’ or ‘quite’ helpful.
The NDLP and ND25+ ERA programme group members shared this generousopinion of Jobcentre Plus staff but were much more likely to say they had a specialperson they sought out, presumably their ASA, and to say that this person had giventhem ‘a lot’ of support while they were in work. In addition, considering all thosewho had any contact with Jobcentre Plus staff, ERA customers were more likely thancontrol group members to rate the help and advice they received as ‘very helpful’.27
As might be expected, relatively few WTC control group members sought out aparticular staff member at Jobcentre Plus. In contrast, over two-thirds of the WTCERA programme group customers who had contact with Jobcentre Plus hadidentified a particular person, presumably their ASA, as the person they should seeat the office. Like those in the other two target groups, the WTC ERA customerswere more likely than their control group counterparts to say that the help andadvice they received was indeed helpful.
4.6 Conclusions
Not surprisingly, the ERA programme, compared with the situation experienced bythe control group, had only a small or no impact on increasing the proportions ofNDLP and ND25+ customers receiving out-of-work advice, or on their propensityto engage in activities that would help them find or prepare for work. This is becausethe pre-employment New Deal services were largely the same for the programmeand control groups.
The ERA programme produced a much greater impact on the proportion ofcustomers who received in-work help and advice across all three customer groups,though surprising numbers of control group members obtained such advice in theabsence of ERA. There was evidence that the advice given to ERA customers wasmore pointed towards retention and advancement issues, especially increasinghours and obtaining new training.
More of the ERA lone parents, compared with their control group counterparts,took steps while working to improve their earnings and terms of employment,especially seeking to increase their hours. These differences in in-work activity were
27 Again, these are non-experimental comparisons, as the characteristics ofprogramme and control group customers who had contact with Jobcentre Plusstaff may differ.
ERA participants’ recall of advice received and action taken to remain and advance in work
110
small but statistically significant. ERA also increased for all three target groupcustomers’ participation in training or education courses while they were working.This impact was particularly large for the WTC group.
ERA’s effects on the likelihood that customers would receive in-work help andadvice from Jobcentre Plus staff or would take action to remain in and advance inwork were fairly similar across the six districts included in the study. If any districtsstood out from the rest, they would be the East Midlands and North West Englandfor the NDLP sample.
ERA is a post-employment programme and can be effective only to the extent that itscustomers are in work. Only half of the ND25+ group and two-thirds of the NDLPgroup had any paid work during the 12-month survey period. As previouslydiscussed in Chapter 3, not all ERA customers who worked during the first 12months of follow-up received the expected in-work supports from ERA. In fact, 46per cent of the working NDLP customers, 55 per cent of the working ND25+customers and 12 per cent of the working WTC recipients did not receive thein-work support and advice that ERA was designed to provide. Nevertheless, thesignificance of this shortfall in the delivery of in-work help and advice to workingERA customers is a matter for judgement: the shortfall may have occurred, in part,because:
• a proportion of these had only recently entered work and their ASA had not yetbeen in touch to arrange a meeting;
• only a minority of the full samples were receiving the employment retention ortraining completion bonuses that would have pulled them into the office toclaim, where they would receive more help and advice;
• other contact might have been made but forgotten during the telephoneinterview.
Still, these figures on not receiving in-work support remain quite high, especiallyperhaps in the case of NDLP customers. It will be important to see whether thestrengthening of the delivery of ERA (described in the previous chapter), whichoccurred most intensely during the period beyond that examined in this chapter,enabled programme staff to contact and deliver services to those not ‘touched’ bythe programme in the first year of follow-up, and to improve on the intensity andrange of services delivered to all ERA customers. Results from a subsequentcustomer survey, which is being administered 24 months after customers enteredthe study, will be important evidence.
ERA participants’ recall of advice received and action taken to remain and advance in work
111Impacts on employment, earnings and benefits
5 Impacts on employment,earnings and benefits
5.1 Introduction
This chapter provides the first evidence of whether Employment Retention andAdvancement (ERA) achieved its key objectives of increasing employment retentionand advancement. These are early findings and will be built upon when moreinformation becomes available from the second wave of survey interviews and fromadditional administrative records. Retention and advancement are, after all, intrinsicallylong-term concepts.
As discussed in Chapter 2, roughly 16,000 individuals were randomly assigned inthe course of the experiment. While it is possible to use linked administrative recordsto estimate impacts on all those randomly assigned, at the time of writing, theaccuracy and completeness of national employment-related administrative datahad not been fully established (to date, these data have only rarely been used inevaluation research in Britain).28 A particular drawback is that information onearnings is not yet available. Furthermore, only those earning more than £4,895 in2005/06 (£5,035 in 2006/07) are captured in the administrative data. In view of the‘work-in-progress’ nature of these data, the results in this chapter are basedpredominantly on responses to the survey questionnaire. By the time of the second-stage report, it is anticipated that some of the uncertainties surrounding theadministrative employment data will be resolved so that results for all thoseparticipating in the experiment will be possible.29
28 The administrative records data on employment are taken from the Work andPensions Longitudinal Study (WPLS) and originate from information reportedby employers to HM Revenue and Customs for tax purposes.
29 For now, the only use that is made of these data is to act as a sensitivity test forthe survey-based results (Table E.1) and to examine the extent to which surveynon-response may affect impact estimates (Table G.2).
112
A consequence of using survey responses is that the sample size is reduced to thenumber responding to the survey – about 6,000 people. In Appendix G, thepossibility is investigated that focusing on this smaller sample may yield differentestimates from those based on the full sample. No evidence is found to suggest thatrestricting analysis to the smaller sample would bias estimates. An importantadvantage of concentrating on the survey sample is that the impact analysis resultsare based on the same sample as used for the analysis in Chapter 4.
As discussed in Chapter 2, customers randomly assigned between 1 December2003 and 30 November 2004 were interviewed 12 months later, so the survey dataallow the effect of ERA over the period of a year to be observed for all thoseinterviewed. It should be noted that the outcomes that are considered are mostlythose provided by the survey. The exceptions are some of the results on benefitreceipt (the administrative records are better understood and more reliable forbenefit receipt than they are for employment and earnings, so their use in thisanalysis is less uncertain). The tables in this chapter always identify those results thatare based on administrative records.
5.1.1 The expected early effect of ERA
To provide a context for the interpretation of the results, it is helpful to first considerwhat effects one might expect to see. Some customers – those in the New Deal forLone Parents (NDLP) and New Deal 25 Plus (ND25+) groups – were out of work orworking fewer than 16 hours per week at the time of random assignment. For them,ERA is being compared with services offered through the New Deal programme, andmay influence job search behaviour in two key ways: First, advisers may encouragethose looking for employment to identify jobs that are more likely to be long term orto offer potential for advancement. Restricting the type of eligible jobs in this waymay extend the period of job search. Second, the bonus payments provided by ERAalter the financial incentives for looking for work. Specifically, the retention bonusincreases the reward for employment and may encourage individuals to considerjobs that otherwise they might have considered as too poorly paid. This may expandthe pool of potential jobs considered and therefore, speed up the job search process.The combined effect of these two potentially opposing influences on moving intoemployment is difficult to predict. However, since the retention bonus is payableonly to those working 30 or more hours per week, and there is nothing in the designof ERA to act against this incentive, an expected effect is that ERA will promptindividuals to favour full-time rather than part-time work. For customers who werealready working 16 or more hours per week at the time of random assignment – theWorking Tax Credit (WTC) group – the retention bonus should again encourage amove from part-time to full-time work.
It does not immediately follow, however, that moving from part-time to full-timework will increase ERA customers’ earnings. Clearly, if individuals simply work morehours at the same wage, their earnings will increase. But individuals may choose towork full-time but at a lower wage because it suits their personal objectives. Thismay be because the combination of earnings and the retention bonus leaves them
Impacts on employment, earnings and benefits
113
better off, or the lower-paying job may have particular characteristics that areattractive. For example, it may be located more conveniently or may offer improvedemployment benefits.
Clearly, there are differences among the groups that will influence how ERA willaffect them. The ND25+ group consists primarily of childless unemployed men whoare mandated to participate in the New Deal programme. Because part-time work isrelatively rare among this population, ERA is unlikely to have much effect onencouraging a move from part-time to full-time work. The NDLP group, on the otherhand, largely comprises women receiving Income Support (IS), all of whom enteredthe programme by first attending the Jobcentre Plus office, voluntarily seeking outservices. The WTC group is also made up of lone parents, mostly female. Amongboth lone parent groups, part-time work is common, so one would expect ERA to bemore instrumental in increasing hours worked.
In addition to the effects expected from the design of ERA, it is also important to takeaccount of the way ERA was implemented, as discussed in detail in Chapter 3.Problems were encountered in the early period of ERA, while Jobcentre Plusmanagement, who were struggling to meet job entry targets, gave less attentionand support to ERA than they might have given. Furthermore, AdvancementSupport Advisers (ASAs) were not familiar with the provision of post-employmentservices, and many felt they had received insufficient training in this regard. Indeed,ASAs’ conceptualisation of advancement took some time to evolve. Once customerswere in work, ASAs found it difficult to maintain contact. All these implementationproblems are relevant when trying to understand the observed effect of ERA.
Perhaps the most important point to bear in mind is that the delivery of ERAappeared to improve over time. It is extremely difficult to identify with any precisionhow these differences in implementation might affect outcomes, or precisely whenparticular obstacles to effective operation were overcome. However, the broadpoint remains that ASAs were on a learning curve as they started to implement ERA,and that, initially at least, delivery was not without its problems. For this reason, thelonger-term effects of ERA will be of great interest. Not only are retention andadvancement more likely to be observable in the longer term, but the fact that thedelivery of ERA took some time to mature means that these longer-term results willalso capture more closely the effects of ERA as it was designed. Results from Chapter3 suggest that it was not until mid- to late 2005 that the early problems with thedelivery of ERA were overcome. A consequence of this is that, for some, the impactsreported in this chapter are those associated with a period of imperfect ERA delivery.
5.1.2 An overview of the main findings
The results in this chapter are shown for the six demonstration districts as a whole, aswell as district by district. The effects for the six demonstration districts as a whole arecalculated as a simple average of the six district-level results.30 In effect, this average
Impacts on employment, earnings and benefits
30 A different approach was used for the WTC group. This is explained in somedetail in Section 5.4.
114
represents an estimate of how ERA might operate in a range of circumstances,acknowledging that there may be district-level variations in the way ERA isoperationalised. As such, it provides a convenient way of summarising the broadeffects of ERA. The result for each district provides a separate test of ERA. Becauseeach such test is equally valid as an estimate of how ERA may affect outcomes in aparticular context, each district is given the same weight when calculating theoverall summary effect. This summary effect can therefore be seen to represent theaverage effect of six separate tests of ERA.31
Consideration of the district-level results allows the observed effects to be linkedmore directly with a specific type of delivery, so that variations in effects can beexplored more thoroughly. As will be seen, there is considerable variation acrossdistricts in the effects of ERA. As discussed above, this may be due to differences inhow ERA is implemented. It may also reflect local differences in the characteristics ofthe population or local economic conditions.
Consideration of the district-level results also shows whether ERA can be effective indifferent places. Similarly, subgroup analysis is informative of whether ERA can beeffective for different types of people. Ideally, ERA would help everybody regardlessof their location or characteristics. However, knowing which segments of thepopulation are most likely to benefit from ERA may be important information whenlater considering any redesign or fine-tuning of ERA.
To preview the main findings:
• For the NDLP group as a whole, ERA increased the proportion in work at somepoint during the year, although there was no effect on the proportion inemployment in month 12. The main effect was to encourage full-time ratherthan part-time work and, as a result of this, to increase earnings during year 1and reduce the use of IS benefits. The increase in full-time work and earningswas seen in all districts, although the effects were not always statisticallysignificant. North West England stands out for its very large increases inemployment and earnings in year 1.
Impacts on employment, earnings and benefits
31 Rather than weighting each district equally, an alternative way to proceed wouldbe not to weight the data, so that the results for larger districts would contributemore to the overall average. This has some appeal as a means of achieving anestimate that is representative of the six pilot areas as a whole. However, thereare two reasons why this approach has not been followed: First, the six pilotareas do not combine to represent a meaningful whole, so the issue ofrepresentativeness becomes less informative. Second, it does not follow thatsimply because a district is large, the results of testing ERA in that district willapply more generally than the results in smaller districts. We have seen evidencein previous chapters of differences across districts in their implementation ofERA, and there is nothing to suggest a correlation between type ofimplementation and size of district.
115
• For the ND25+ group as a whole, ERA caused a slight but statistically significantincrease in the number of hours worked, but no overall change in the likelihoodof working. Its effect on earnings is smaller, more mixed, and less certain thanfor the NDLP customers. ERA reduced levels of Jobseeker’s Allowance (JSA) receipt.The broad pattern of positive effects on earnings was common to all districts(although not always statistically significant), with the exception of Wales, wherethose eligible for ERA had lower earnings and higher benefit receipt than thosenot eligible. There is some evidence to suggest that the test of ERA in Wales forthe ND25+ group was problematic, making the interpretation of the results inthis district – and therefore, the pooled results for the ND25+ group as a whole– more difficult.
• For the WTC target group, small sample sizes meant that it was possible toachieve a robust estimate only for the East Midlands. Here, ERA had no effect onthe probability of working but did cause a substantial move from part-time tofull-time work. There was no corresponding increase in earnings, since full-timework for those in the programme group was less well-paid relative to the controlgroup than was the case with part-time work.
5.2 Findings for the New Deal for Lone Parents targetgroup
5.2.1 Employment and earnings for the NDLP control group: thecounterfactual
Outcomes for the control group are the benchmark used to judge the effects of ERA,since they represent what would have happened to the ERA group in the absence ofthe programme. They are helpful to examine because they illustrate the levels theprogramme will have to surpass in order to generate effects. Figure 5.1 presentsmonthly employment rates for the NDLP control group for the first year after randomassignment, or study entry. Recall that this group entered the evaluation afterhaving attended a Jobcentre Plus office to enquire, for example, about benefits,joining the New Deal, or receiving employment assistance. For this reason, it isexpected that their employment rates would be low at and around the month ofrandom assignment. In fact, the proportion who reported being in work doubledfrom 25 per cent in the month of random assignment to 50 per cent by month 12.Upward trends in employment for a control group are common, particularly for apopulation that has voluntarily participated in a labour market programme such asNDLP and thereby demonstrated an interest in finding work. These data clearlyindicate that many of the lone parents who entered New Deal would have gone towork even in the absence of the special attention and incentives that ERA offered.Thus, ERA has a high hurdle to surmount if it is to increase the fraction of loneparents who go to work during the first year.
However, a key policy concern with lone parents and other less-skilled groups is thelow-pay/no-pay cycle, or high amounts of employment instability. Data for the
Impacts on employment, earnings and benefits
116
control group bear this out. Figure 5.1 shows that although 62 per cent of loneparents in the control group worked at some point during the year, as mentionedalready, only half of them were employed in month 12. Thus, 20 per cent of thosewho had worked in the first year were not working by month 12.32 This is a fairamount of job loss during this first year. Thus, there appears to be more room forERA to affect overall employment by helping lone parents who go to work stayemployed.
Figure 5.1 Employment rates for the control group, New Deal forLone Parents customers
In terms of advancement, low weekly hours and hourly wage rates also suggestroom for ERA to have effects. Among the lone parents in the control group workingat month 12, for example, 70 per cent worked fewer than 30 hours per week, andnearly a third earned less than £5 per hour (not shown in the tables).33 Averageearnings over the year were £2,783, although this figure includes zero amounts forthose who did not work. Earnings among those who did work, however, were still
Impacts on employment, earnings and benefits
32 Using the information from Figure 5.1: (.617-.495)/.617.33 The national minimum wage for adult (age 22 or over) workers was £4.50 per
hour from 1 October 2003; it increased to £4.85 per hour on 1 October 2004and to £5.05 on 1 October 2005 (www.lowpay.gov.uk/).
117
quite low, at £4,511.34 Although increasing wage rates is a longer-term advancementstrategy and is unlikely to occur within the first year of follow-up, ERA may affectearnings in the short term by helping lone parents increase their hours worked or byincreasing the percentage employed.
5.2.2 Effects of ERA for the pooled NDLP sample across districts
Table 5.1 presents the effects of ERA on lone parents’ employment and earningsduring year 1, as reported by respondents to the 12-month survey.35 Consider, first,employment during the year. ERA increased the percentage of lone parents whoworked at some point during the first 12 months, from 61.7 per cent for the controlgroup to 66.2 per cent for the ERA group, for a statistically significant impact of 4.5percentage points.36 It is interesting to see such an effect, given the broad similaritybetween the programme and control group in the service they received while out ofwork. However, as described earlier, it is important to remember that the possibilityof receiving the retention bonus increases the incentive to work, irrespective of thehelp and advice provided by advisers. Chapter 4 showed a high level of awareness ofthe retention bonus. On average, the ERA group worked half a month more than thecontrol group over the period, as shown by the effect on number of months worked.In addition, all of this new employment was full-time work, since the effects onnumber of months worked full-time is also just over half a month. In other words,the data suggest that all of the lone parents who went to work because of ERAworked full-time.
Impacts on employment, earnings and benefits
34 This was calculated as the average earnings among the control group over theyear (£2,783) divided by the proportion of those in the control group whoworked at any time during the year (0.617).
35 Employment results based on administrative records taken from the WPLS arereported in Table E.1. These results, presented for the purpose of comparison,are not always consistent with the survey-based estimates. As discussed earlierin this chapter, investigation into the reliability of the employment informationin administrative records is still underway. It should be noted, however, thatneither data set reveals large effects on the average number of months workingduring year 1.
36 Estimated impacts are regression-adjusted to control for random differencesbetween the programme and control groups at the time of random assignment.Characteristics controlled for in this way include district, random assignmentdate, sex, education level, number of children and work and benefit history.
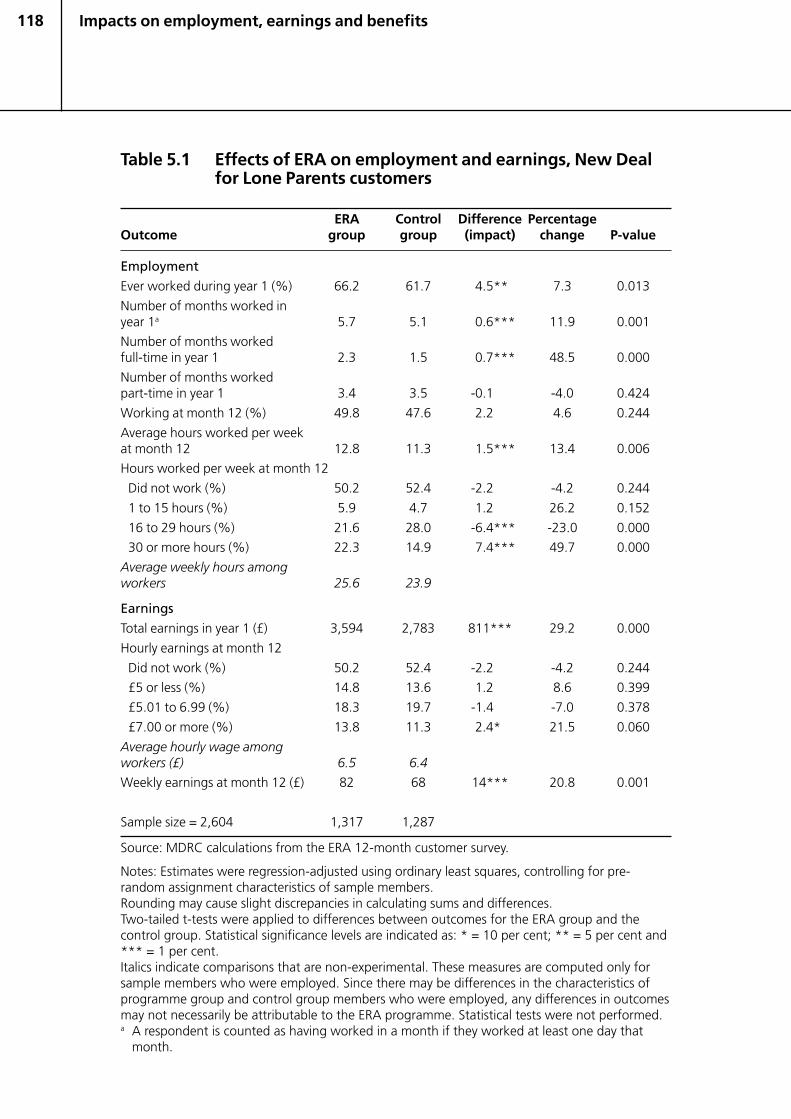
118
Table 5.1 Effects of ERA on employment and earnings, New Dealfor Lone Parents customers
ERA Control Difference PercentageOutcome group group (impact) change P-value
Employment
Ever worked during year 1 (%) 66.2 61.7 4.5** 7.3 0.013
Number of months worked inyear 1a 5.7 5.1 0.6*** 11.9 0.001
Number of months workedfull-time in year 1 2.3 1.5 0.7*** 48.5 0.000
Number of months workedpart-time in year 1 3.4 3.5 -0.1 -4.0 0.424
Working at month 12 (%) 49.8 47.6 2.2 4.6 0.244
Average hours worked per weekat month 12 12.8 11.3 1.5*** 13.4 0.006
Hours worked per week at month 12
Did not work (%) 50.2 52.4 -2.2 -4.2 0.244
1 to 15 hours (%) 5.9 4.7 1.2 26.2 0.152
16 to 29 hours (%) 21.6 28.0 -6.4*** -23.0 0.000
30 or more hours (%) 22.3 14.9 7.4*** 49.7 0.000
Average weekly hours amongworkers 25.6 23.9
Earnings
Total earnings in year 1 (£) 3,594 2,783 811*** 29.2 0.000
Hourly earnings at month 12
Did not work (%) 50.2 52.4 -2.2 -4.2 0.244
£5 or less (%) 14.8 13.6 1.2 8.6 0.399
£5.01 to 6.99 (%) 18.3 19.7 -1.4 -7.0 0.378
£7.00 or more (%) 13.8 11.3 2.4* 21.5 0.060
Average hourly wage amongworkers (£) 6.5 6.4
Weekly earnings at month 12 (£) 82 68 14*** 20.8 0.001
Sample size = 2,604 1,317 1,287
Source: MDRC calculations from the ERA 12-month customer survey.
Notes: Estimates were regression-adjusted using ordinary least squares, controlling for pre-random assignment characteristics of sample members.Rounding may cause slight discrepancies in calculating sums and differences.Two-tailed t-tests were applied to differences between outcomes for the ERA group and thecontrol group. Statistical significance levels are indicated as: * = 10 per cent; ** = 5 per cent and*** = 1 per cent.Italics indicate comparisons that are non-experimental. These measures are computed only forsample members who were employed. Since there may be differences in the characteristics ofprogramme group and control group members who were employed, any differences in outcomesmay not necessarily be attributable to the ERA programme. Statistical tests were not performed.a A respondent is counted as having worked in a month if they worked at least one day that
month.
Impacts on employment, earnings and benefits
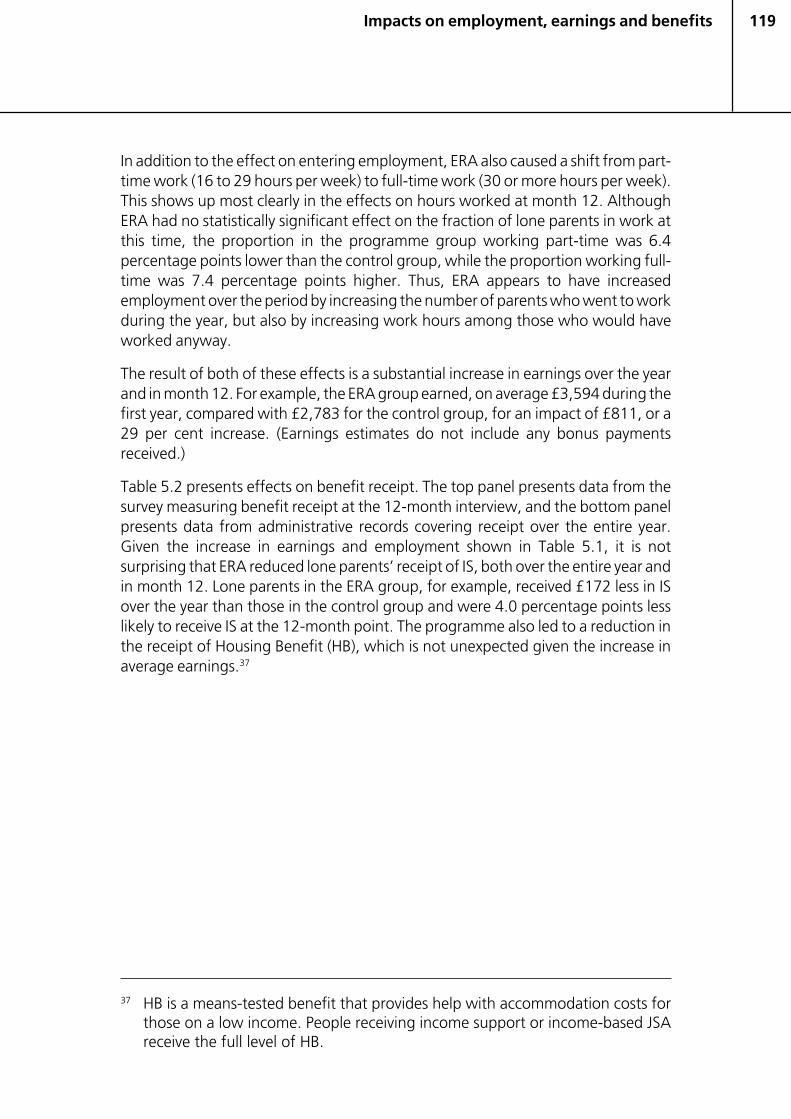
119
In addition to the effect on entering employment, ERA also caused a shift from part-time work (16 to 29 hours per week) to full-time work (30 or more hours per week).This shows up most clearly in the effects on hours worked at month 12. AlthoughERA had no statistically significant effect on the fraction of lone parents in work atthis time, the proportion in the programme group working part-time was 6.4percentage points lower than the control group, while the proportion working full-time was 7.4 percentage points higher. Thus, ERA appears to have increasedemployment over the period by increasing the number of parents who went to workduring the year, but also by increasing work hours among those who would haveworked anyway.
The result of both of these effects is a substantial increase in earnings over the yearand in month 12. For example, the ERA group earned, on average £3,594 during thefirst year, compared with £2,783 for the control group, for an impact of £811, or a29 per cent increase. (Earnings estimates do not include any bonus paymentsreceived.)
Table 5.2 presents effects on benefit receipt. The top panel presents data from thesurvey measuring benefit receipt at the 12-month interview, and the bottom panelpresents data from administrative records covering receipt over the entire year.Given the increase in earnings and employment shown in Table 5.1, it is notsurprising that ERA reduced lone parents’ receipt of IS, both over the entire year andin month 12. Lone parents in the ERA group, for example, received £172 less in ISover the year than those in the control group and were 4.0 percentage points lesslikely to receive IS at the 12-month point. The programme also led to a reduction inthe receipt of Housing Benefit (HB), which is not unexpected given the increase inaverage earnings.37
Impacts on employment, earnings and benefits
37 HB is a means-tested benefit that provides help with accommodation costs forthose on a low income. People receiving income support or income-based JSAreceive the full level of HB.
120
Table 5.2 Effects of ERA on benefit receipt, New Deal for LoneParents customers
ERA Control Difference PercentageOutcome group group (impact) change P-value
Survey dataReceiving JSA at month 12 (%) 2.3 2.1 0.3 13.1 0.639JSA average per week (£) 1 1 0 -0.5 0.987Receiving WTC at month 12 (%) 42.4 41.3 1.1 2.6 0.574WTC average per week (£) 23 23 0 2.2 0.726Receiving CTC at month 12 (%) 66.3 65.1 1.2 1.8 0.508CTC average per week (£) 39 37 2 5.2 0.212Receiving IS at month 12 (%) 45.6 49.5 -4.0** -8.0 0.037IS average per week (£) 38 40 -2 -4.7 0.307Receiving housing benefit atmonth 12 (%) 54.5 61.3 -6.8*** -11.1 0.000Receiving other state benefit atmonth 12 (%) 5.9 8.1 -2.2** -27.1 0.028Other state benefit amountper week (£) 3 3 0 -12.0 0.504
Records dataNumber of months received JSAin year 1 0.2 0.1 0.0 36.3 0.234Total JSA received in year 1 (£) 40 29 11 35.8 0.303Number of months received IS inyear 1 7.3 7.7 -0.5*** -6.2 0.005Total IS received in year 1 (£) 2,860 3,031 -172* -5.7 0.053Number of months received IS orJSA in year 1 7.4 7.9 -0.4*** -5.6 0.009Total IS and JSA received inyear 1 (£) 2,899 3,060 -161* -5.3 0.069Number of months received IB inyear 1 0.4 0.4 0.0 3.3 0.855Ever received IB in year 1 (%) 6.5 6.5 -0.1 -1.2 0.934
Sample size = 2,604 1,317 1,287
Source: MDRC calculations from the ERA 12-month customer survey and benefit receipt records.
Notes: JSA = Jobseeker's Allowance; IS = Income Support; WTC = Working Tax Credit;CTC = Child Tax Credit; IB = Incapacity Benefit.
Estimates were regression-adjusted using ordinary least squares, controlling for pre-randomassignment characteristics of sample members.
Rounding may cause slight discrepancies in calculating sums and differences.
Two-tailed t-tests were applied to differences between outcomes for the ERA group and thecontrol group. Statistical significance levels are indicated as: * = 10 per cent; ** = 5 per cent and*** = 1 per cent.
Impacts on employment, earnings and benefits
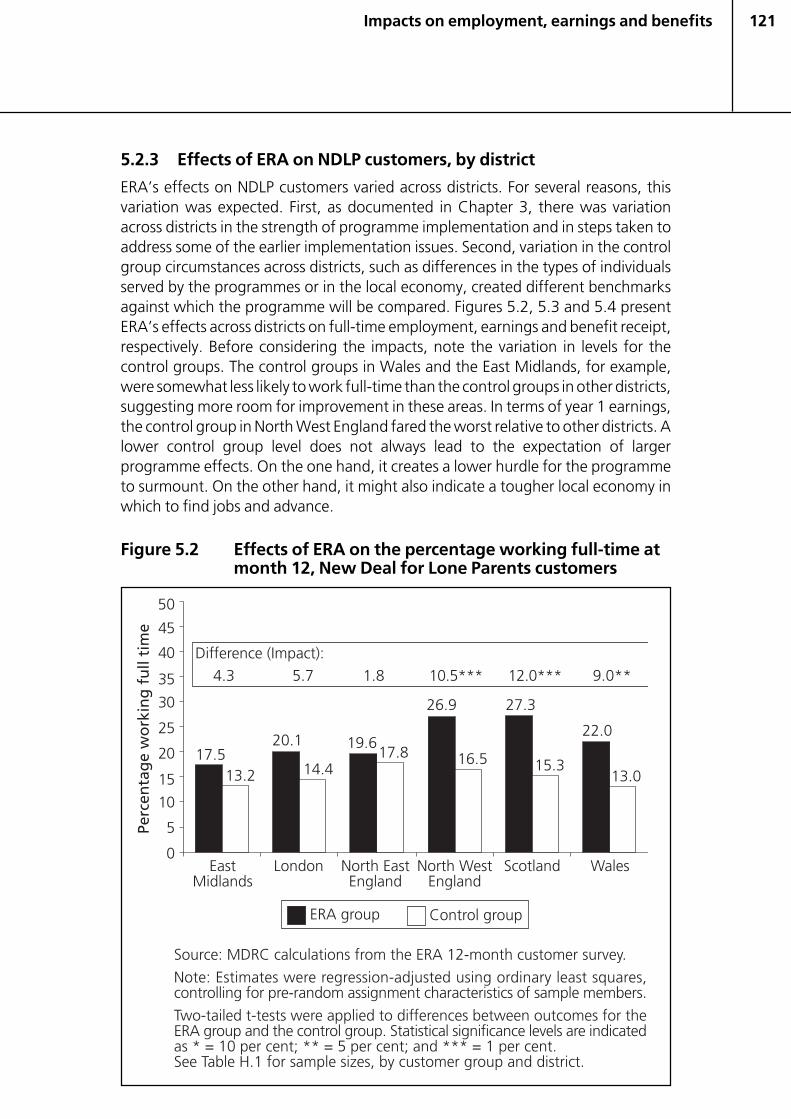
121
5.2.3 Effects of ERA on NDLP customers, by district
ERA’s effects on NDLP customers varied across districts. For several reasons, thisvariation was expected. First, as documented in Chapter 3, there was variationacross districts in the strength of programme implementation and in steps taken toaddress some of the earlier implementation issues. Second, variation in the controlgroup circumstances across districts, such as differences in the types of individualsserved by the programmes or in the local economy, created different benchmarksagainst which the programme will be compared. Figures 5.2, 5.3 and 5.4 presentERA’s effects across districts on full-time employment, earnings and benefit receipt,respectively. Before considering the impacts, note the variation in levels for thecontrol groups. The control groups in Wales and the East Midlands, for example,were somewhat less likely to work full-time than the control groups in other districts,suggesting more room for improvement in these areas. In terms of year 1 earnings,the control group in North West England fared the worst relative to other districts. Alower control group level does not always lead to the expectation of largerprogramme effects. On the one hand, it creates a lower hurdle for the programmeto surmount. On the other hand, it might also indicate a tougher local economy inwhich to find jobs and advance.
Figure 5.2 Effects of ERA on the percentage working full-time atmonth 12, New Deal for Lone Parents customers
Impacts on employment, earnings and benefits
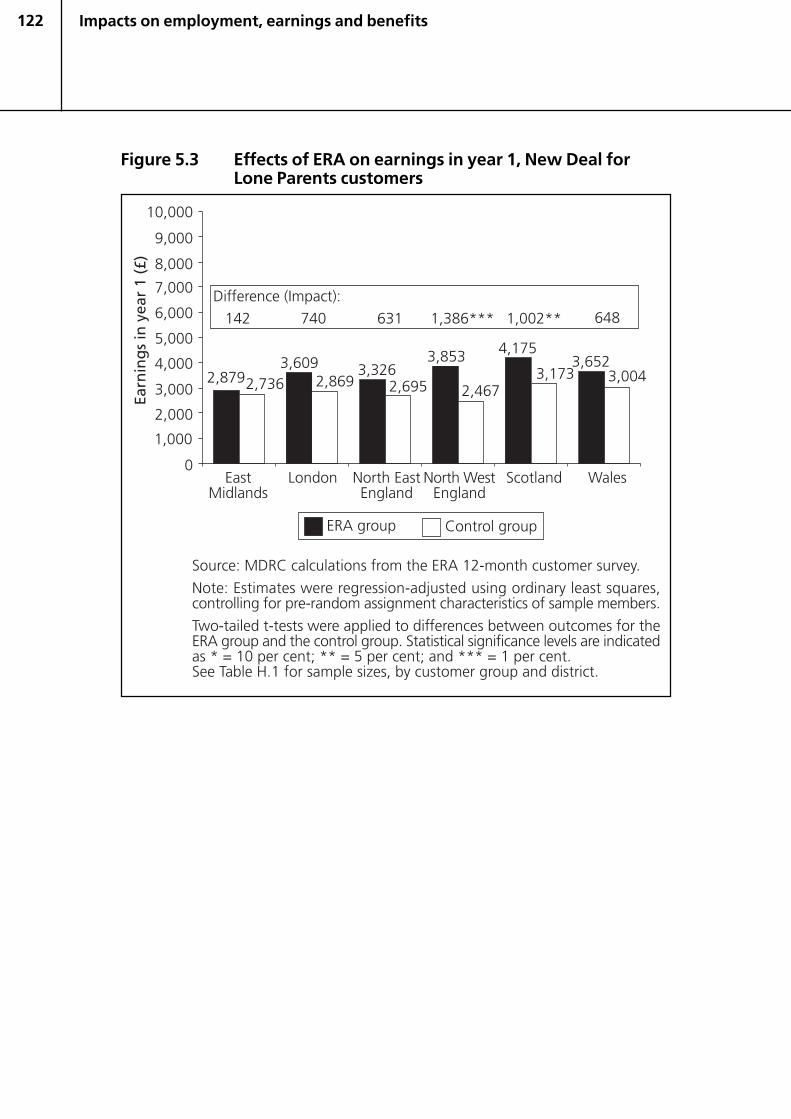
122
Figure 5.3 Effects of ERA on earnings in year 1, New Deal forLone Parents customers
Impacts on employment, earnings and benefits
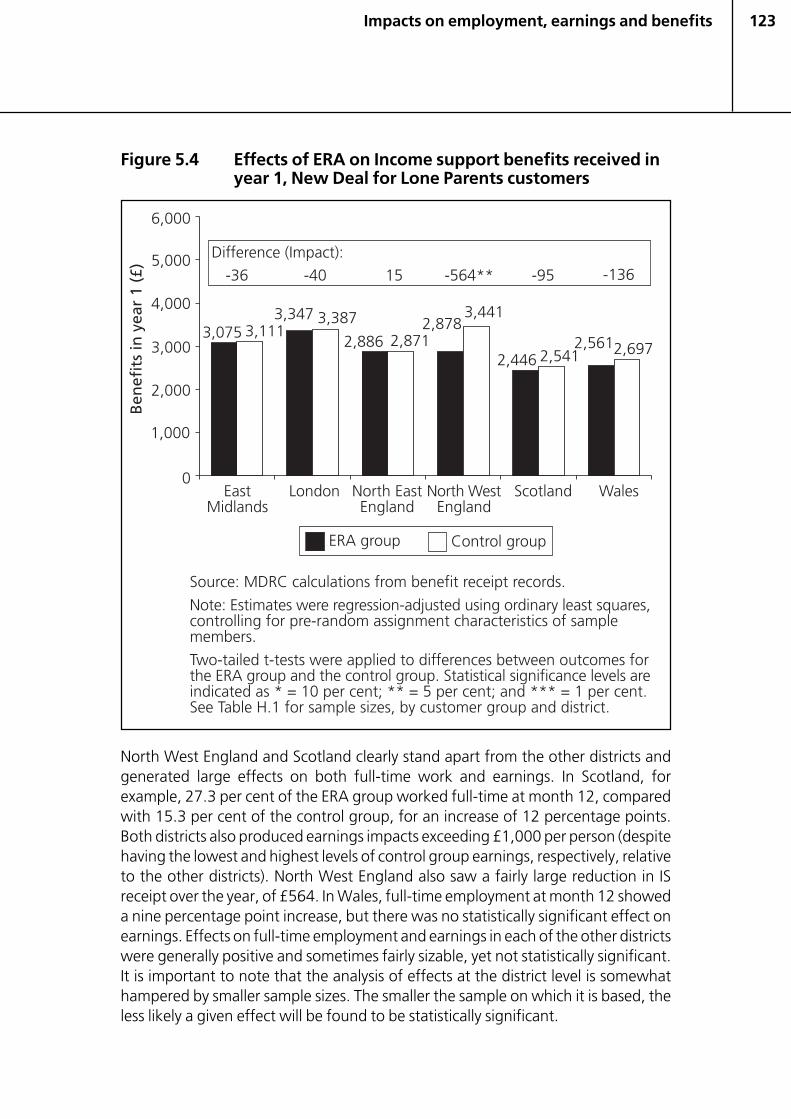
123
Figure 5.4 Effects of ERA on Income support benefits received inyear 1, New Deal for Lone Parents customers
North West England and Scotland clearly stand apart from the other districts andgenerated large effects on both full-time work and earnings. In Scotland, forexample, 27.3 per cent of the ERA group worked full-time at month 12, comparedwith 15.3 per cent of the control group, for an increase of 12 percentage points.Both districts also produced earnings impacts exceeding £1,000 per person (despitehaving the lowest and highest levels of control group earnings, respectively, relativeto the other districts). North West England also saw a fairly large reduction in ISreceipt over the year, of £564. In Wales, full-time employment at month 12 showeda nine percentage point increase, but there was no statistically significant effect onearnings. Effects on full-time employment and earnings in each of the other districtswere generally positive and sometimes fairly sizable, yet not statistically significant.It is important to note that the analysis of effects at the district level is somewhathampered by smaller sample sizes. The smaller the sample on which it is based, theless likely a given effect will be found to be statistically significant.
Impacts on employment, earnings and benefits
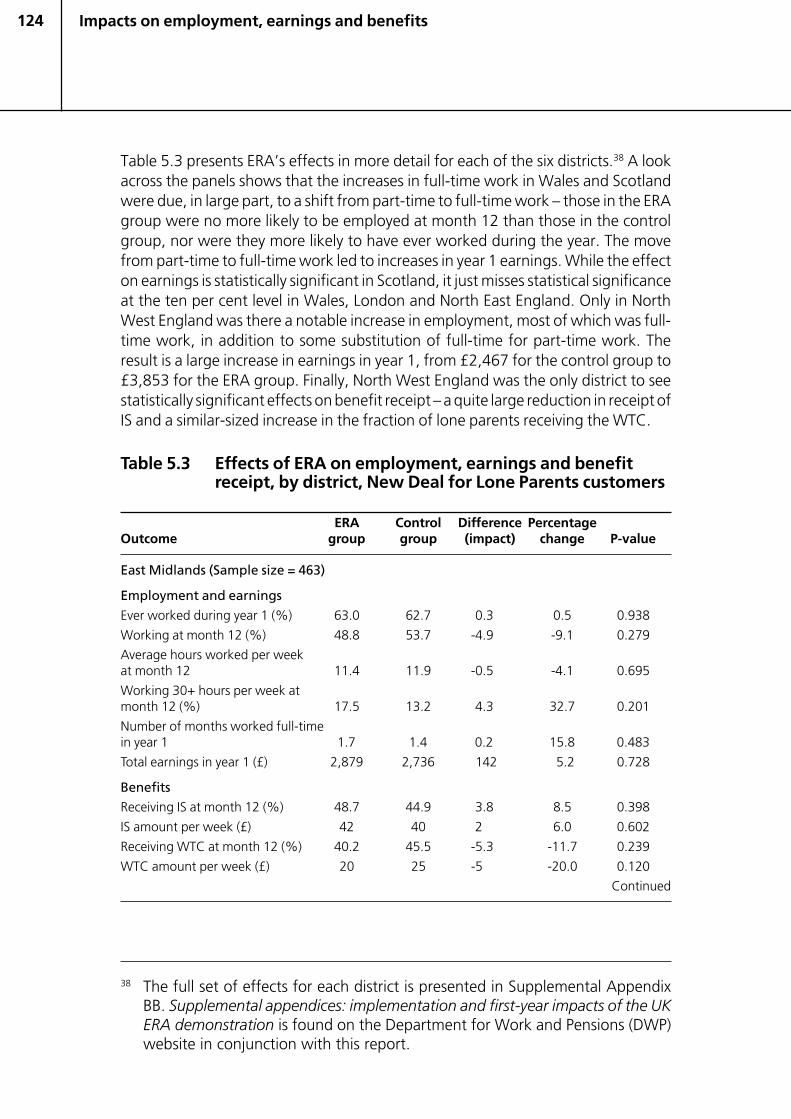
124
Table 5.3 presents ERA’s effects in more detail for each of the six districts.38 A lookacross the panels shows that the increases in full-time work in Wales and Scotlandwere due, in large part, to a shift from part-time to full-time work – those in the ERAgroup were no more likely to be employed at month 12 than those in the controlgroup, nor were they more likely to have ever worked during the year. The movefrom part-time to full-time work led to increases in year 1 earnings. While the effecton earnings is statistically significant in Scotland, it just misses statistical significanceat the ten per cent level in Wales, London and North East England. Only in NorthWest England was there a notable increase in employment, most of which was full-time work, in addition to some substitution of full-time for part-time work. Theresult is a large increase in earnings in year 1, from £2,467 for the control group to£3,853 for the ERA group. Finally, North West England was the only district to seestatistically significant effects on benefit receipt – a quite large reduction in receipt ofIS and a similar-sized increase in the fraction of lone parents receiving the WTC.
Table 5.3 Effects of ERA on employment, earnings and benefitreceipt, by district, New Deal for Lone Parents customers
ERA Control Difference PercentageOutcome group group (impact) change P-value
East Midlands (Sample size = 463)
Employment and earnings
Ever worked during year 1 (%) 63.0 62.7 0.3 0.5 0.938
Working at month 12 (%) 48.8 53.7 -4.9 -9.1 0.279
Average hours worked per weekat month 12 11.4 11.9 -0.5 -4.1 0.695
Working 30+ hours per week atmonth 12 (%) 17.5 13.2 4.3 32.7 0.201
Number of months worked full-timein year 1 1.7 1.4 0.2 15.8 0.483
Total earnings in year 1 (£) 2,879 2,736 142 5.2 0.728
BenefitsReceiving IS at month 12 (%) 48.7 44.9 3.8 8.5 0.398
IS amount per week (£) 42 40 2 6.0 0.602
Receiving WTC at month 12 (%) 40.2 45.5 -5.3 -11.7 0.239
WTC amount per week (£) 20 25 -5 -20.0 0.120
Continued
Impacts on employment, earnings and benefits
38 The full set of effects for each district is presented in Supplemental AppendixBB. Supplemental appendices: implementation and first-year impacts of the UKERA demonstration is found on the Department for Work and Pensions (DWP)website in conjunction with this report.
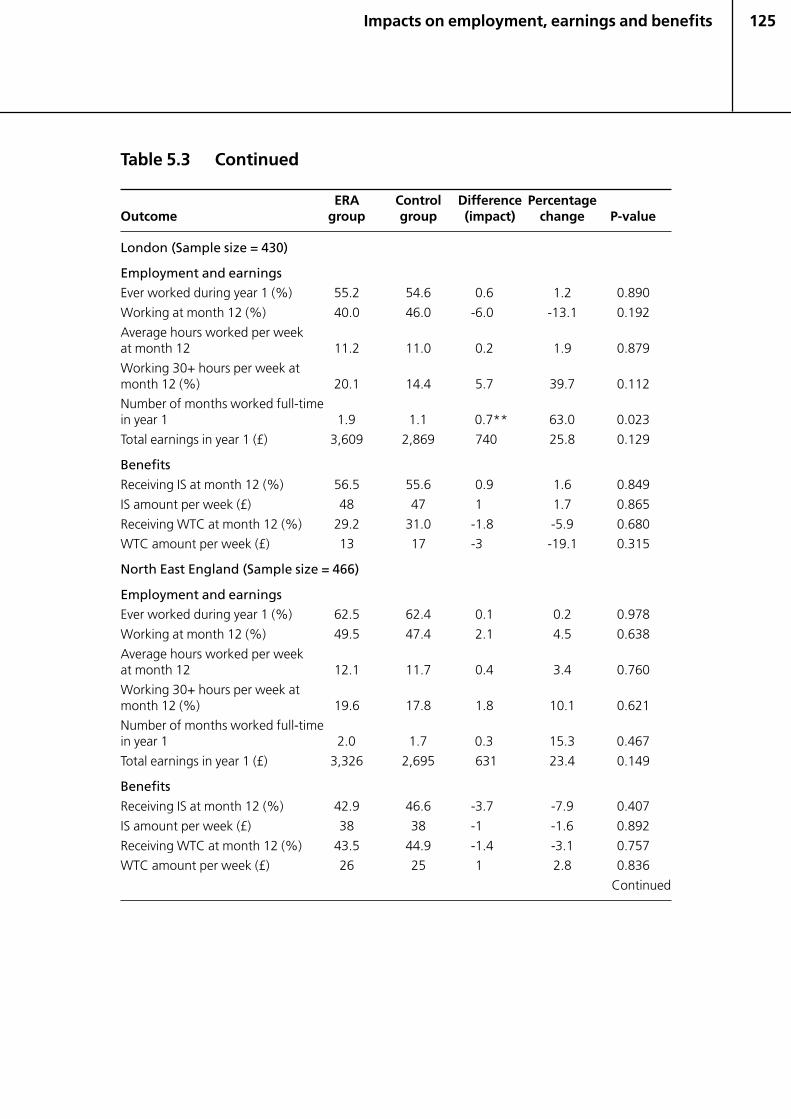
125
Table 5.3 Continued
ERA Control Difference PercentageOutcome group group (impact) change P-value
London (Sample size = 430)
Employment and earningsEver worked during year 1 (%) 55.2 54.6 0.6 1.2 0.890
Working at month 12 (%) 40.0 46.0 -6.0 -13.1 0.192
Average hours worked per weekat month 12 11.2 11.0 0.2 1.9 0.879
Working 30+ hours per week atmonth 12 (%) 20.1 14.4 5.7 39.7 0.112
Number of months worked full-timein year 1 1.9 1.1 0.7** 63.0 0.023
Total earnings in year 1 (£) 3,609 2,869 740 25.8 0.129
Benefits
Receiving IS at month 12 (%) 56.5 55.6 0.9 1.6 0.849
IS amount per week (£) 48 47 1 1.7 0.865
Receiving WTC at month 12 (%) 29.2 31.0 -1.8 -5.9 0.680
WTC amount per week (£) 13 17 -3 -19.1 0.315
North East England (Sample size = 466)
Employment and earningsEver worked during year 1 (%) 62.5 62.4 0.1 0.2 0.978
Working at month 12 (%) 49.5 47.4 2.1 4.5 0.638
Average hours worked per weekat month 12 12.1 11.7 0.4 3.4 0.760
Working 30+ hours per week atmonth 12 (%) 19.6 17.8 1.8 10.1 0.621
Number of months worked full-timein year 1 2.0 1.7 0.3 15.3 0.467
Total earnings in year 1 (£) 3,326 2,695 631 23.4 0.149
Benefits
Receiving IS at month 12 (%) 42.9 46.6 -3.7 -7.9 0.407
IS amount per week (£) 38 38 -1 -1.6 0.892
Receiving WTC at month 12 (%) 43.5 44.9 -1.4 -3.1 0.757
WTC amount per week (£) 26 25 1 2.8 0.836
Continued
Impacts on employment, earnings and benefits
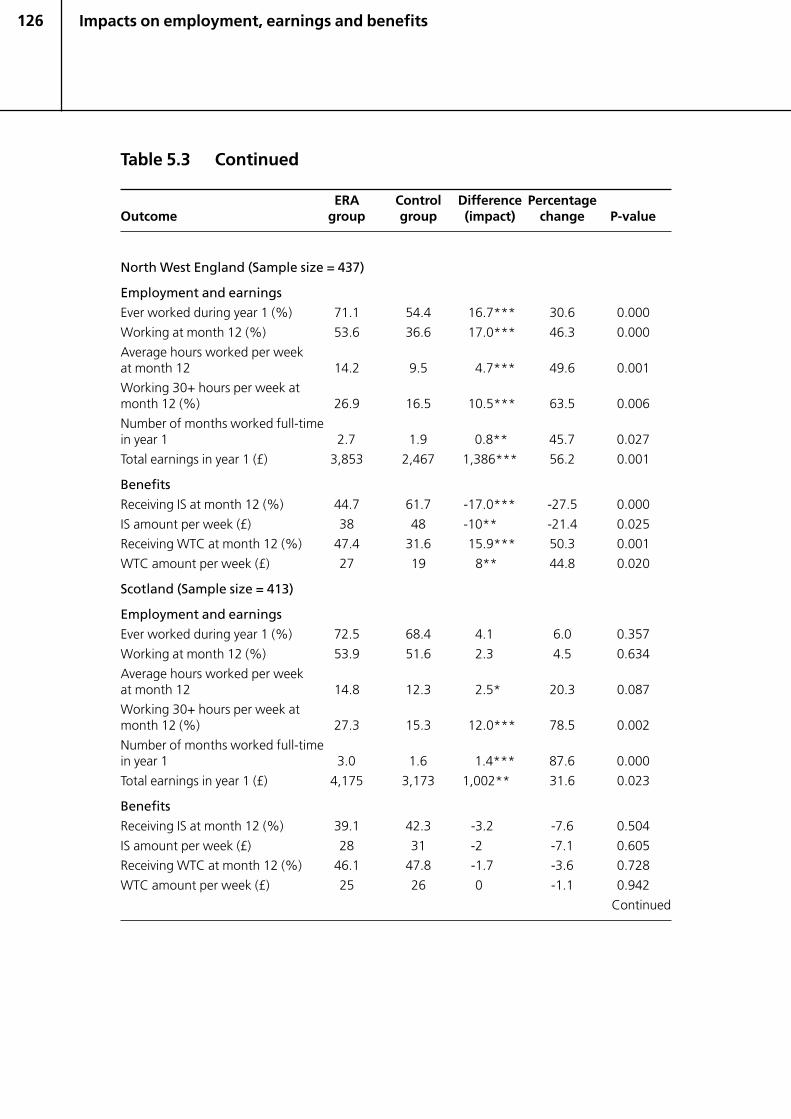
126
Table 5.3 Continued
ERA Control Difference PercentageOutcome group group (impact) change P-value
North West England (Sample size = 437)
Employment and earnings
Ever worked during year 1 (%) 71.1 54.4 16.7*** 30.6 0.000
Working at month 12 (%) 53.6 36.6 17.0*** 46.3 0.000
Average hours worked per weekat month 12 14.2 9.5 4.7*** 49.6 0.001
Working 30+ hours per week atmonth 12 (%) 26.9 16.5 10.5*** 63.5 0.006
Number of months worked full-timein year 1 2.7 1.9 0.8** 45.7 0.027
Total earnings in year 1 (£) 3,853 2,467 1,386*** 56.2 0.001
Benefits
Receiving IS at month 12 (%) 44.7 61.7 -17.0*** -27.5 0.000
IS amount per week (£) 38 48 -10** -21.4 0.025
Receiving WTC at month 12 (%) 47.4 31.6 15.9*** 50.3 0.001
WTC amount per week (£) 27 19 8** 44.8 0.020
Scotland (Sample size = 413)
Employment and earnings
Ever worked during year 1 (%) 72.5 68.4 4.1 6.0 0.357
Working at month 12 (%) 53.9 51.6 2.3 4.5 0.634
Average hours worked per weekat month 12 14.8 12.3 2.5* 20.3 0.087
Working 30+ hours per week atmonth 12 (%) 27.3 15.3 12.0*** 78.5 0.002
Number of months worked full-timein year 1 3.0 1.6 1.4*** 87.6 0.000
Total earnings in year 1 (£) 4,175 3,173 1,002** 31.6 0.023
Benefits
Receiving IS at month 12 (%) 39.1 42.3 -3.2 -7.6 0.504
IS amount per week (£) 28 31 -2 -7.1 0.605
Receiving WTC at month 12 (%) 46.1 47.8 -1.7 -3.6 0.728
WTC amount per week (£) 25 26 0 -1.1 0.942
Continued
Impacts on employment, earnings and benefits
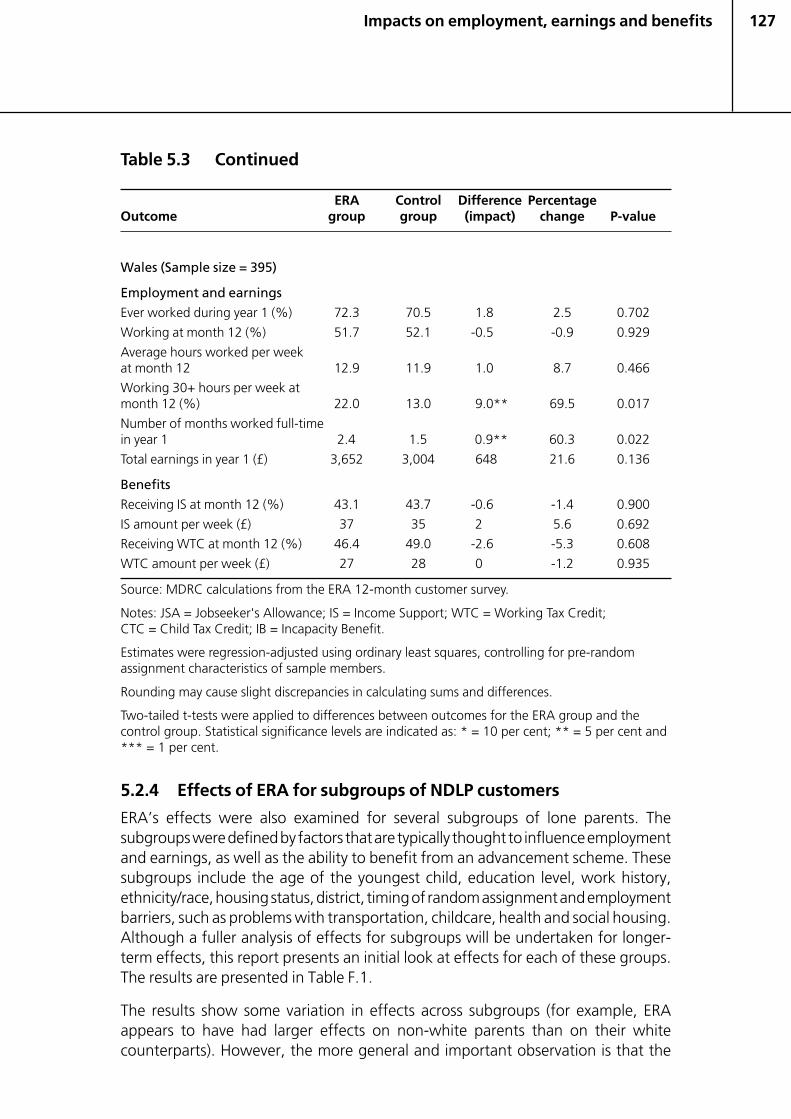
127Impacts on employment, earnings and benefits
Table 5.3 Continued
ERA Control Difference PercentageOutcome group group (impact) change P-value
Wales (Sample size = 395)
Employment and earnings
Ever worked during year 1 (%) 72.3 70.5 1.8 2.5 0.702
Working at month 12 (%) 51.7 52.1 -0.5 -0.9 0.929
Average hours worked per weekat month 12 12.9 11.9 1.0 8.7 0.466
Working 30+ hours per week atmonth 12 (%) 22.0 13.0 9.0** 69.5 0.017
Number of months worked full-timein year 1 2.4 1.5 0.9** 60.3 0.022
Total earnings in year 1 (£) 3,652 3,004 648 21.6 0.136
Benefits
Receiving IS at month 12 (%) 43.1 43.7 -0.6 -1.4 0.900
IS amount per week (£) 37 35 2 5.6 0.692
Receiving WTC at month 12 (%) 46.4 49.0 -2.6 -5.3 0.608
WTC amount per week (£) 27 28 0 -1.2 0.935
Source: MDRC calculations from the ERA 12-month customer survey.
Notes: JSA = Jobseeker's Allowance; IS = Income Support; WTC = Working Tax Credit;CTC = Child Tax Credit; IB = Incapacity Benefit.
Estimates were regression-adjusted using ordinary least squares, controlling for pre-randomassignment characteristics of sample members.
Rounding may cause slight discrepancies in calculating sums and differences.
Two-tailed t-tests were applied to differences between outcomes for the ERA group and thecontrol group. Statistical significance levels are indicated as: * = 10 per cent; ** = 5 per cent and*** = 1 per cent.
5.2.4 Effects of ERA for subgroups of NDLP customers
ERA’s effects were also examined for several subgroups of lone parents. Thesubgroups were defined by factors that are typically thought to influence employmentand earnings, as well as the ability to benefit from an advancement scheme. Thesesubgroups include the age of the youngest child, education level, work history,ethnicity/race, housing status, district, timing of random assignment and employmentbarriers, such as problems with transportation, childcare, health and social housing.Although a fuller analysis of effects for subgroups will be undertaken for longer-term effects, this report presents an initial look at effects for each of these groups.The results are presented in Table F.1.
The results show some variation in effects across subgroups (for example, ERAappears to have had larger effects on non-white parents than on their whitecounterparts). However, the more general and important observation is that the
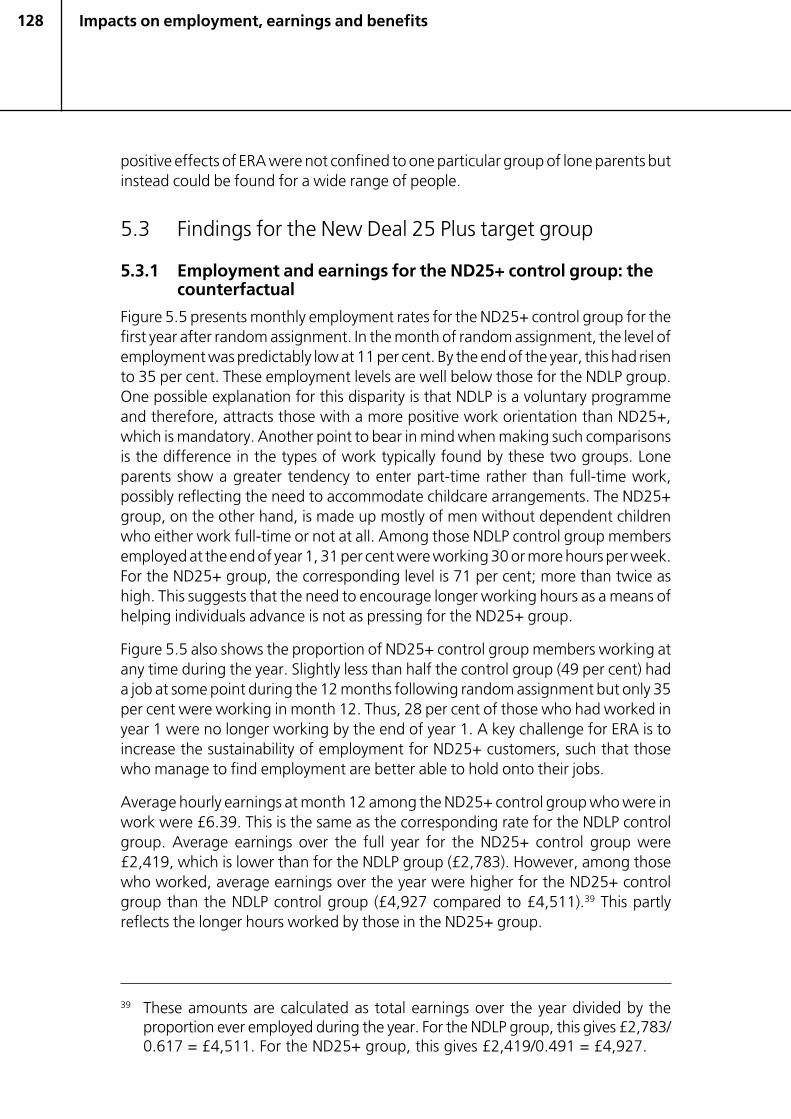
128 Impacts on employment, earnings and benefits
positive effects of ERA were not confined to one particular group of lone parents butinstead could be found for a wide range of people.
5.3 Findings for the New Deal 25 Plus target group
5.3.1 Employment and earnings for the ND25+ control group: thecounterfactual
Figure 5.5 presents monthly employment rates for the ND25+ control group for thefirst year after random assignment. In the month of random assignment, the level ofemployment was predictably low at 11 per cent. By the end of the year, this had risento 35 per cent. These employment levels are well below those for the NDLP group.One possible explanation for this disparity is that NDLP is a voluntary programmeand therefore, attracts those with a more positive work orientation than ND25+,which is mandatory. Another point to bear in mind when making such comparisonsis the difference in the types of work typically found by these two groups. Loneparents show a greater tendency to enter part-time rather than full-time work,possibly reflecting the need to accommodate childcare arrangements. The ND25+group, on the other hand, is made up mostly of men without dependent childrenwho either work full-time or not at all. Among those NDLP control group membersemployed at the end of year 1, 31 per cent were working 30 or more hours per week.For the ND25+ group, the corresponding level is 71 per cent; more than twice ashigh. This suggests that the need to encourage longer working hours as a means ofhelping individuals advance is not as pressing for the ND25+ group.
Figure 5.5 also shows the proportion of ND25+ control group members working atany time during the year. Slightly less than half the control group (49 per cent) hada job at some point during the 12 months following random assignment but only 35per cent were working in month 12. Thus, 28 per cent of those who had worked inyear 1 were no longer working by the end of year 1. A key challenge for ERA is toincrease the sustainability of employment for ND25+ customers, such that thosewho manage to find employment are better able to hold onto their jobs.
Average hourly earnings at month 12 among the ND25+ control group who were inwork were £6.39. This is the same as the corresponding rate for the NDLP controlgroup. Average earnings over the full year for the ND25+ control group were£2,419, which is lower than for the NDLP group (£2,783). However, among thosewho worked, average earnings over the year were higher for the ND25+ controlgroup than the NDLP control group (£4,927 compared to £4,511).39 This partlyreflects the longer hours worked by those in the ND25+ group.
39 These amounts are calculated as total earnings over the year divided by theproportion ever employed during the year. For the NDLP group, this gives £2,783/0.617 = £4,511. For the ND25+ group, this gives £2,419/0.491 = £4,927.
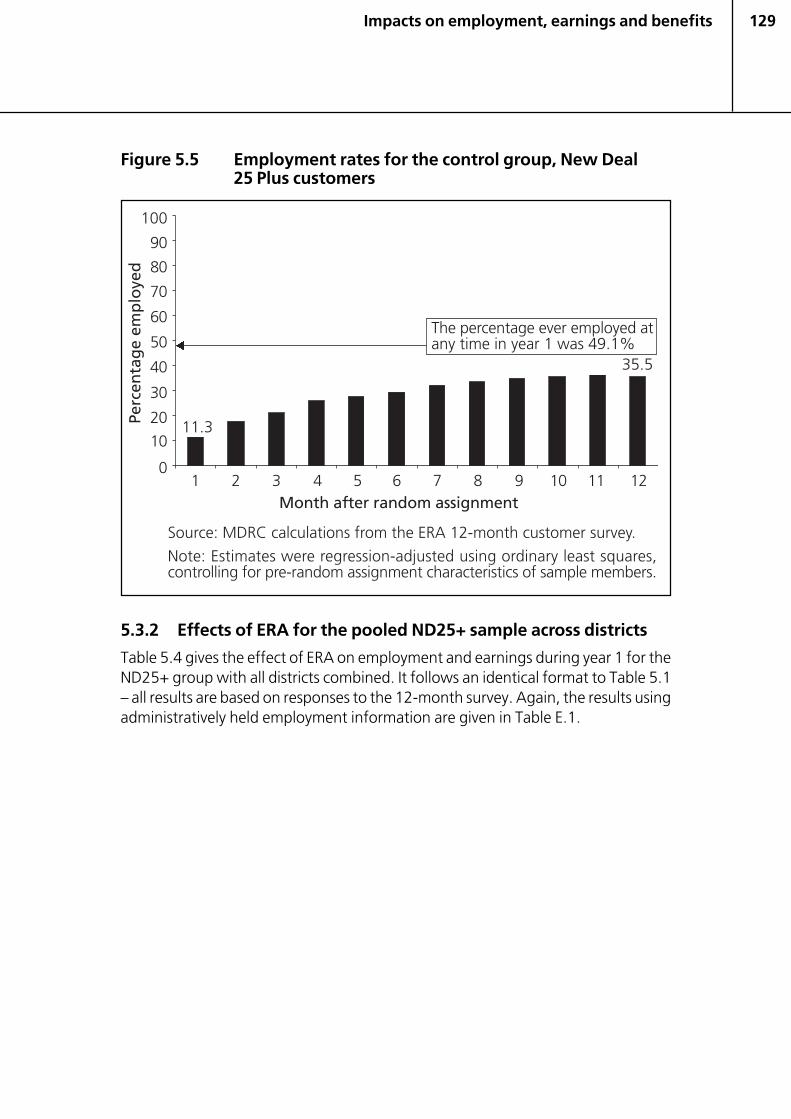
129Impacts on employment, earnings and benefits
Figure 5.5 Employment rates for the control group, New Deal25 Plus customers
5.3.2 Effects of ERA for the pooled ND25+ sample across districts
Table 5.4 gives the effect of ERA on employment and earnings during year 1 for theND25+ group with all districts combined. It follows an identical format to Table 5.1– all results are based on responses to the 12-month survey. Again, the results usingadministratively held employment information are given in Table E.1.
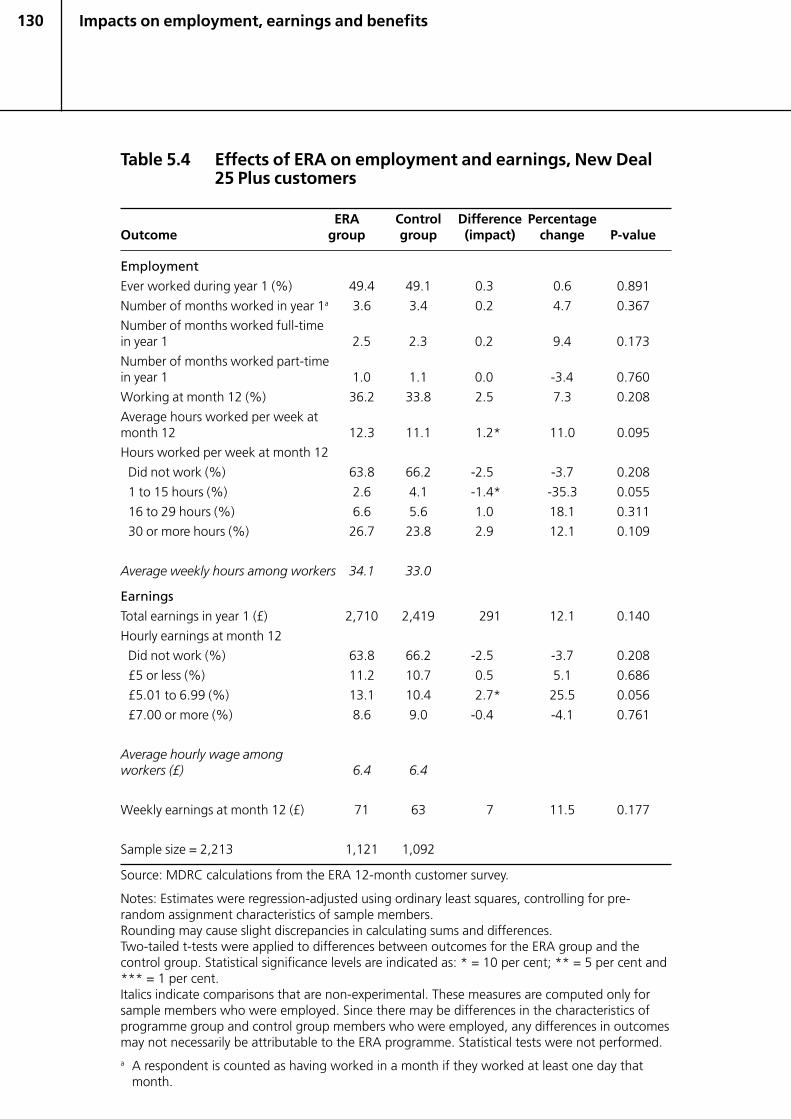
130 Impacts on employment, earnings and benefits
Table 5.4 Effects of ERA on employment and earnings, New Deal25 Plus customers
ERA Control Difference PercentageOutcome group group (impact) change P-value
Employment
Ever worked during year 1 (%) 49.4 49.1 0.3 0.6 0.891
Number of months worked in year 1a 3.6 3.4 0.2 4.7 0.367
Number of months worked full-timein year 1 2.5 2.3 0.2 9.4 0.173
Number of months worked part-timein year 1 1.0 1.1 0.0 -3.4 0.760
Working at month 12 (%) 36.2 33.8 2.5 7.3 0.208
Average hours worked per week atmonth 12 12.3 11.1 1.2* 11.0 0.095
Hours worked per week at month 12
Did not work (%) 63.8 66.2 -2.5 -3.7 0.208
1 to 15 hours (%) 2.6 4.1 -1.4* -35.3 0.055
16 to 29 hours (%) 6.6 5.6 1.0 18.1 0.311
30 or more hours (%) 26.7 23.8 2.9 12.1 0.109
Average weekly hours among workers 34.1 33.0
Earnings
Total earnings in year 1 (£) 2,710 2,419 291 12.1 0.140
Hourly earnings at month 12
Did not work (%) 63.8 66.2 -2.5 -3.7 0.208
£5 or less (%) 11.2 10.7 0.5 5.1 0.686
£5.01 to 6.99 (%) 13.1 10.4 2.7* 25.5 0.056
£7.00 or more (%) 8.6 9.0 -0.4 -4.1 0.761
Average hourly wage amongworkers (£) 6.4 6.4
Weekly earnings at month 12 (£) 71 63 7 11.5 0.177
Sample size = 2,213 1,121 1,092
Source: MDRC calculations from the ERA 12-month customer survey.
Notes: Estimates were regression-adjusted using ordinary least squares, controlling for pre-random assignment characteristics of sample members.Rounding may cause slight discrepancies in calculating sums and differences.Two-tailed t-tests were applied to differences between outcomes for the ERA group and thecontrol group. Statistical significance levels are indicated as: * = 10 per cent; ** = 5 per cent and*** = 1 per cent.Italics indicate comparisons that are non-experimental. These measures are computed only forsample members who were employed. Since there may be differences in the characteristics ofprogramme group and control group members who were employed, any differences in outcomesmay not necessarily be attributable to the ERA programme. Statistical tests were not performed.a A respondent is counted as having worked in a month if they worked at least one day that
month.
131Impacts on employment, earnings and benefits
The results for the ND25+ group, as a whole, show no effect of ERA on employment.Nearly half of the programme group (49.4 per cent) had worked at some pointduring the year and this level was closely matched by the control group (49.1 percent). Similarly, there was no statistically significant difference between theprogramme and control groups when considering employment at the time of thesurvey. It did appear that ERA caused a slight increase in the number of hoursworked. The average hours worked for the programme group at the time of thesurvey was 12.3, compared with 11.1 for the control group – a statisticallysignificant difference of 1.2 hours per week. These are the average hours worked forall individuals, regardless of employment status.
Average annual earnings for the ND25+ programme group (£2,710) were higherthan those of the control group (£2,419), by £291. However, this difference is notstatistically significant.
Table 5.5 presents the effects on benefit receipt among the ND25+ group.Responses to the survey show that ERA caused a statistically significant reduction inthe probability of claiming JSA a year after random assignment. Levels of JSA receiptwere 42.2 per cent for the programme group and 47.4 per cent for the controlgroup, a difference of 5.1 percentage points. Consistent with this, ERA reduced theaverage JSA amount received per week. For the programme group as a whole, theaverage amount received was £26 per week, while for the control group it was £28per week. It is worth considering that although the earnings gains mentionedpreviously did not reach statistical significance, they may in fact be contributing tothe reduction in ND25+ customers’ reliance on JSA benefits. At the same time, therealso appeared to be an effect on claiming other – though unspecified – benefits. Forthe programme group, the level of receipt of other benefits was 9.9 per cent,compared with 6.9 per cent for the control group. Hence, ERA had a positive impactof three percentage points on the probability of claiming other benefits.
Some insight into the changing pattern of JSA claims is possible by considering theresults on the number of months during the year in which respondents claimed JSA.The results show little difference between the programme and control groups in thisregard – both spent an average of about eight months claiming. However, as wehave seen, ERA reduced the probability of claiming JSA at the end of year 1 by aboutfive percentage points. This suggests that the ERA effect did not emerge untiltowards the end of the year.
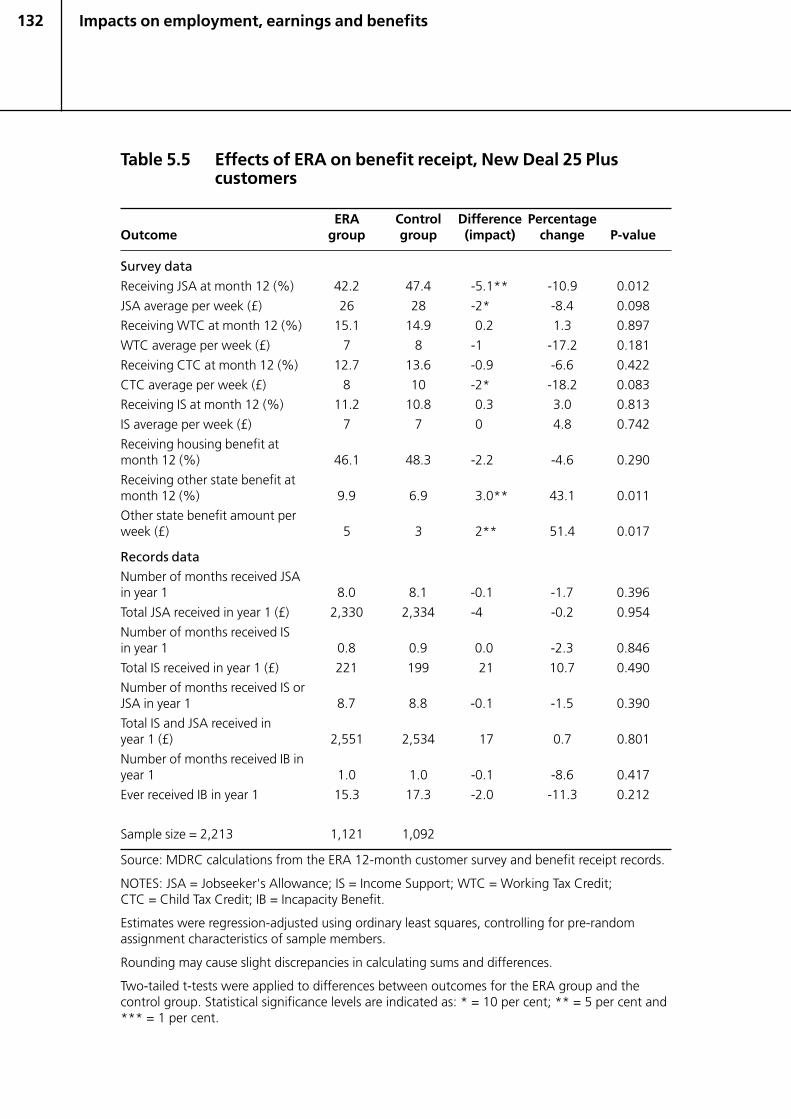
132 Impacts on employment, earnings and benefits
Table 5.5 Effects of ERA on benefit receipt, New Deal 25 Pluscustomers
ERA Control Difference PercentageOutcome group group (impact) change P-value
Survey data
Receiving JSA at month 12 (%) 42.2 47.4 -5.1** -10.9 0.012
JSA average per week (£) 26 28 -2* -8.4 0.098
Receiving WTC at month 12 (%) 15.1 14.9 0.2 1.3 0.897
WTC average per week (£) 7 8 -1 -17.2 0.181
Receiving CTC at month 12 (%) 12.7 13.6 -0.9 -6.6 0.422
CTC average per week (£) 8 10 -2* -18.2 0.083
Receiving IS at month 12 (%) 11.2 10.8 0.3 3.0 0.813
IS average per week (£) 7 7 0 4.8 0.742
Receiving housing benefit atmonth 12 (%) 46.1 48.3 -2.2 -4.6 0.290
Receiving other state benefit atmonth 12 (%) 9.9 6.9 3.0** 43.1 0.011
Other state benefit amount perweek (£) 5 3 2** 51.4 0.017
Records dataNumber of months received JSAin year 1 8.0 8.1 -0.1 -1.7 0.396
Total JSA received in year 1 (£) 2,330 2,334 -4 -0.2 0.954
Number of months received ISin year 1 0.8 0.9 0.0 -2.3 0.846
Total IS received in year 1 (£) 221 199 21 10.7 0.490
Number of months received IS orJSA in year 1 8.7 8.8 -0.1 -1.5 0.390
Total IS and JSA received inyear 1 (£) 2,551 2,534 17 0.7 0.801
Number of months received IB inyear 1 1.0 1.0 -0.1 -8.6 0.417
Ever received IB in year 1 15.3 17.3 -2.0 -11.3 0.212
Sample size = 2,213 1,121 1,092
Source: MDRC calculations from the ERA 12-month customer survey and benefit receipt records.
NOTES: JSA = Jobseeker's Allowance; IS = Income Support; WTC = Working Tax Credit;CTC = Child Tax Credit; IB = Incapacity Benefit.
Estimates were regression-adjusted using ordinary least squares, controlling for pre-randomassignment characteristics of sample members.
Rounding may cause slight discrepancies in calculating sums and differences.
Two-tailed t-tests were applied to differences between outcomes for the ERA group and thecontrol group. Statistical significance levels are indicated as: * = 10 per cent; ** = 5 per cent and*** = 1 per cent.
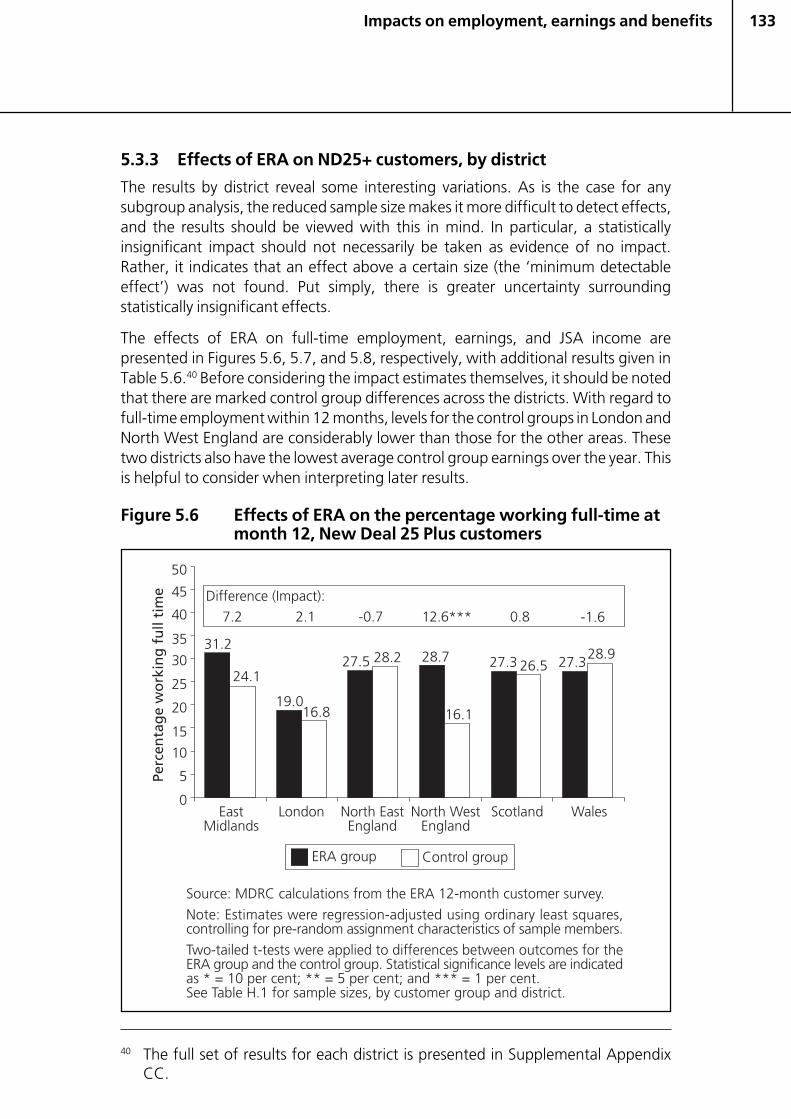
133
5.3.3 Effects of ERA on ND25+ customers, by district
The results by district reveal some interesting variations. As is the case for anysubgroup analysis, the reduced sample size makes it more difficult to detect effects,and the results should be viewed with this in mind. In particular, a statisticallyinsignificant impact should not necessarily be taken as evidence of no impact.Rather, it indicates that an effect above a certain size (the ‘minimum detectableeffect’) was not found. Put simply, there is greater uncertainty surroundingstatistically insignificant effects.
The effects of ERA on full-time employment, earnings, and JSA income arepresented in Figures 5.6, 5.7, and 5.8, respectively, with additional results given inTable 5.6.40 Before considering the impact estimates themselves, it should be notedthat there are marked control group differences across the districts. With regard tofull-time employment within 12 months, levels for the control groups in London andNorth West England are considerably lower than those for the other areas. Thesetwo districts also have the lowest average control group earnings over the year. Thisis helpful to consider when interpreting later results.
Figure 5.6 Effects of ERA on the percentage working full-time atmonth 12, New Deal 25 Plus customers
Impacts on employment, earnings and benefits
40 The full set of results for each district is presented in Supplemental AppendixCC.
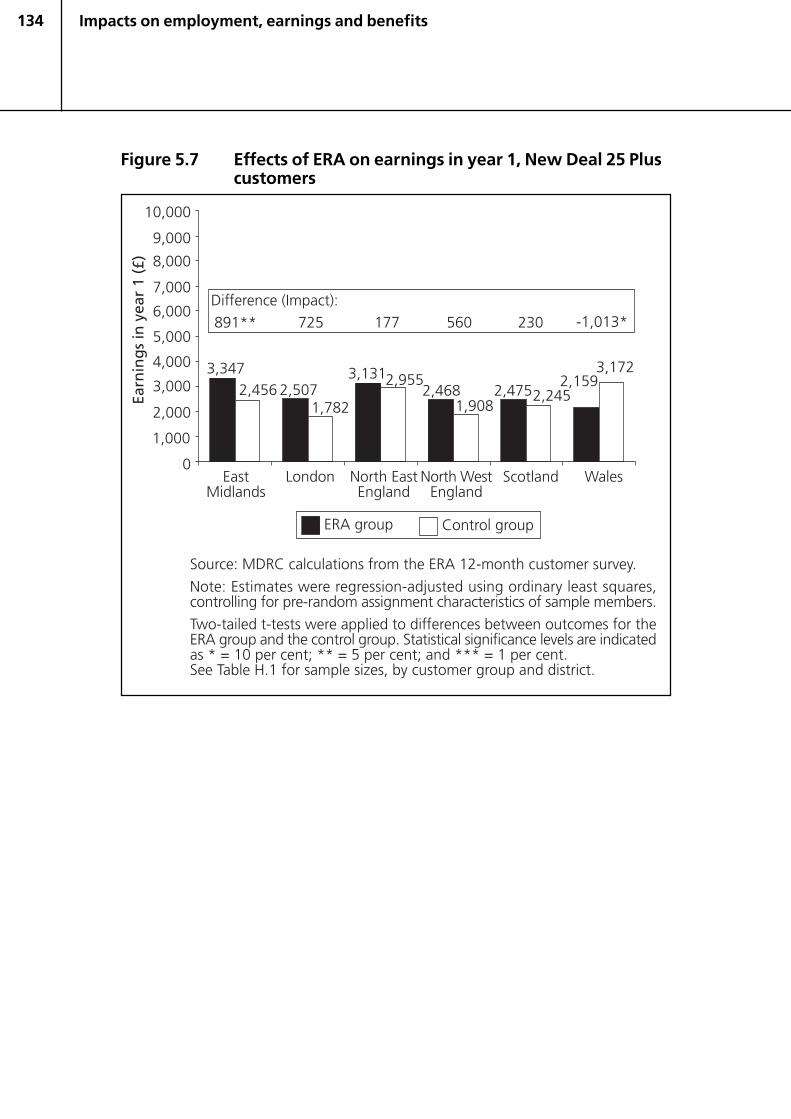
134
Figure 5.7 Effects of ERA on earnings in year 1, New Deal 25 Pluscustomers
Impacts on employment, earnings and benefits
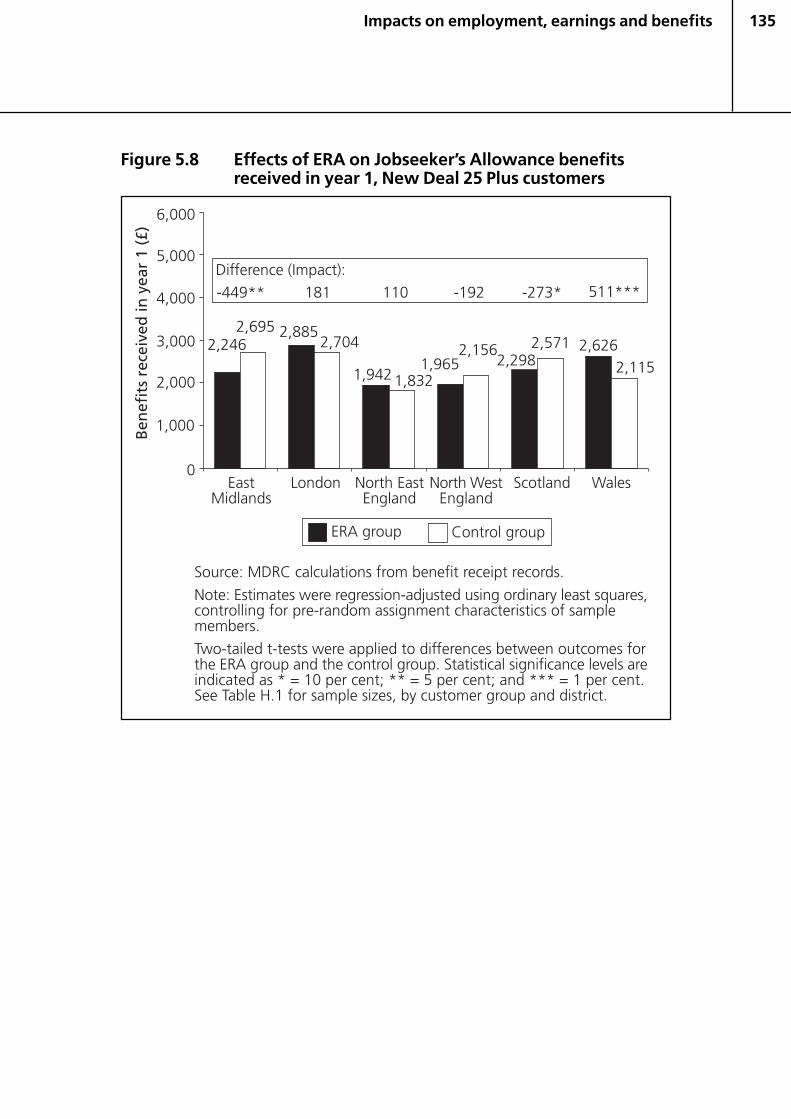
135
Figure 5.8 Effects of ERA on Jobseeker’s Allowance benefitsreceived in year 1, New Deal 25 Plus customers
Impacts on employment, earnings and benefits
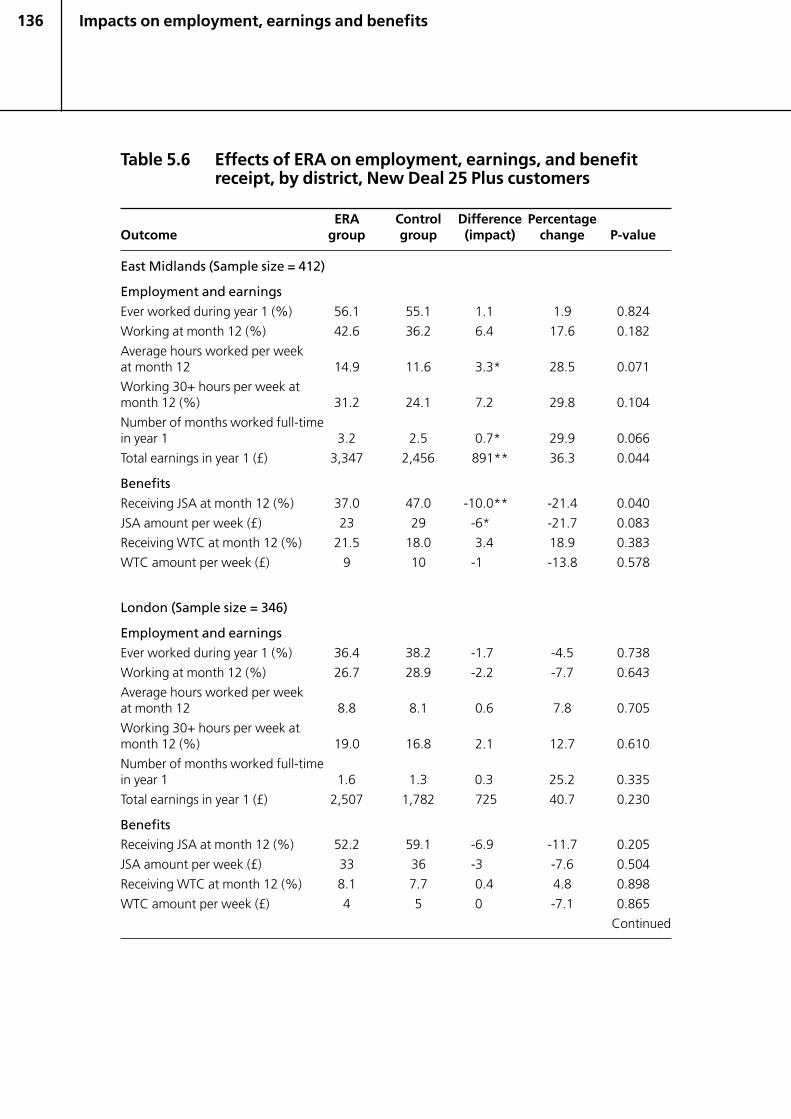
136
Table 5.6 Effects of ERA on employment, earnings, and benefitreceipt, by district, New Deal 25 Plus customers
ERA Control Difference PercentageOutcome group group (impact) change P-value
East Midlands (Sample size = 412)
Employment and earnings
Ever worked during year 1 (%) 56.1 55.1 1.1 1.9 0.824
Working at month 12 (%) 42.6 36.2 6.4 17.6 0.182
Average hours worked per weekat month 12 14.9 11.6 3.3* 28.5 0.071
Working 30+ hours per week atmonth 12 (%) 31.2 24.1 7.2 29.8 0.104
Number of months worked full-timein year 1 3.2 2.5 0.7* 29.9 0.066
Total earnings in year 1 (£) 3,347 2,456 891** 36.3 0.044
Benefits
Receiving JSA at month 12 (%) 37.0 47.0 -10.0** -21.4 0.040
JSA amount per week (£) 23 29 -6* -21.7 0.083
Receiving WTC at month 12 (%) 21.5 18.0 3.4 18.9 0.383
WTC amount per week (£) 9 10 -1 -13.8 0.578
London (Sample size = 346)
Employment and earnings
Ever worked during year 1 (%) 36.4 38.2 -1.7 -4.5 0.738
Working at month 12 (%) 26.7 28.9 -2.2 -7.7 0.643
Average hours worked per weekat month 12 8.8 8.1 0.6 7.8 0.705
Working 30+ hours per week atmonth 12 (%) 19.0 16.8 2.1 12.7 0.610
Number of months worked full-timein year 1 1.6 1.3 0.3 25.2 0.335
Total earnings in year 1 (£) 2,507 1,782 725 40.7 0.230
BenefitsReceiving JSA at month 12 (%) 52.2 59.1 -6.9 -11.7 0.205
JSA amount per week (£) 33 36 -3 -7.6 0.504
Receiving WTC at month 12 (%) 8.1 7.7 0.4 4.8 0.898
WTC amount per week (£) 4 5 0 -7.1 0.865
Continued
Impacts on employment, earnings and benefits
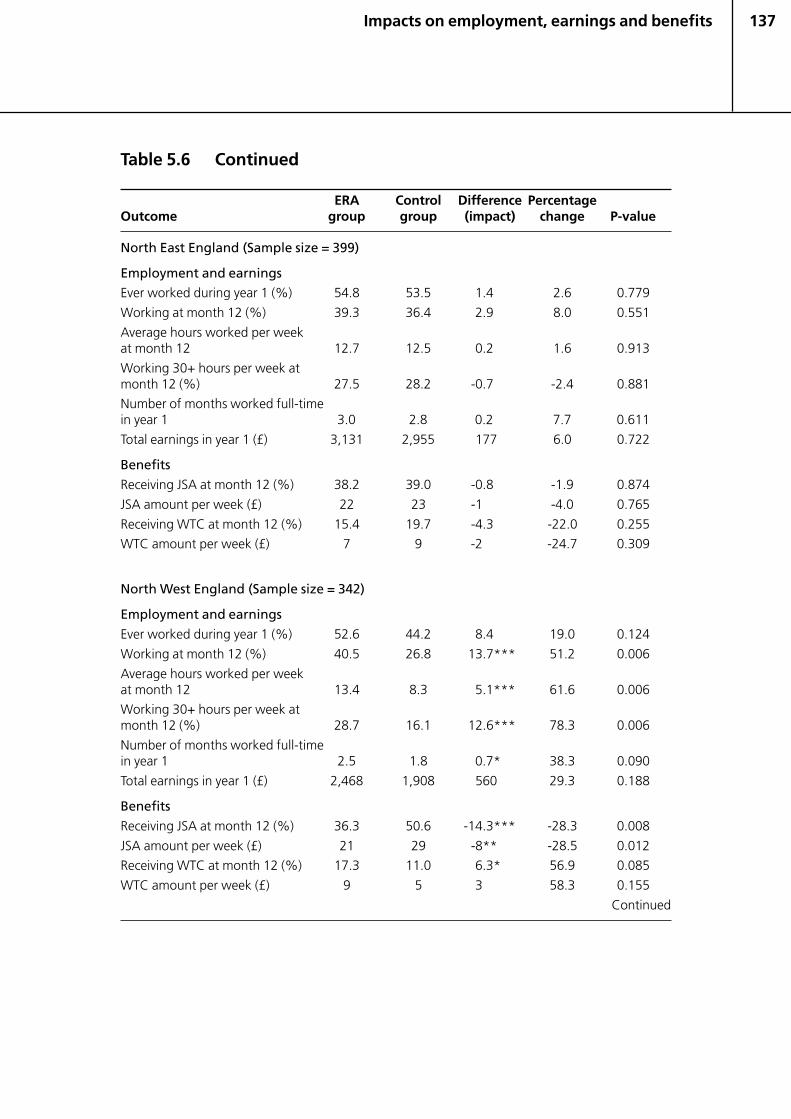
137
Table 5.6 Continued
ERA Control Difference PercentageOutcome group group (impact) change P-value
North East England (Sample size = 399)
Employment and earningsEver worked during year 1 (%) 54.8 53.5 1.4 2.6 0.779
Working at month 12 (%) 39.3 36.4 2.9 8.0 0.551
Average hours worked per weekat month 12 12.7 12.5 0.2 1.6 0.913
Working 30+ hours per week atmonth 12 (%) 27.5 28.2 -0.7 -2.4 0.881
Number of months worked full-timein year 1 3.0 2.8 0.2 7.7 0.611
Total earnings in year 1 (£) 3,131 2,955 177 6.0 0.722
Benefits
Receiving JSA at month 12 (%) 38.2 39.0 -0.8 -1.9 0.874
JSA amount per week (£) 22 23 -1 -4.0 0.765
Receiving WTC at month 12 (%) 15.4 19.7 -4.3 -22.0 0.255
WTC amount per week (£) 7 9 -2 -24.7 0.309
North West England (Sample size = 342)
Employment and earnings
Ever worked during year 1 (%) 52.6 44.2 8.4 19.0 0.124
Working at month 12 (%) 40.5 26.8 13.7*** 51.2 0.006
Average hours worked per weekat month 12 13.4 8.3 5.1*** 61.6 0.006
Working 30+ hours per week atmonth 12 (%) 28.7 16.1 12.6*** 78.3 0.006
Number of months worked full-timein year 1 2.5 1.8 0.7* 38.3 0.090
Total earnings in year 1 (£) 2,468 1,908 560 29.3 0.188
Benefits
Receiving JSA at month 12 (%) 36.3 50.6 -14.3*** -28.3 0.008
JSA amount per week (£) 21 29 -8** -28.5 0.012
Receiving WTC at month 12 (%) 17.3 11.0 6.3* 56.9 0.085
WTC amount per week (£) 9 5 3 58.3 0.155
Continued
Impacts on employment, earnings and benefits

138
Table 5.6 Continued
ERA Control Difference PercentageOutcome group group (impact) change P-value
Scotland (Sample size = 374)
Employment and earningsEver worked during year 1 (%) 51.5 48.4 3.2 6.6 0.511
Working at month 12 (%) 35.7 32.7 3.0 9.0 0.530
Average hours worked per weekat month 12 11.9 11.2 0.7 6.7 0.676
Working 30+ hours per week atmonth 12 (%) 27.3 26.5 0.8 3.0 0.860
Number of months worked full-timein year 1 2.4 2.5 -0.1 -3.9 0.792
Total earnings in year 1 (£) 2,475 2,245 230 10.2 0.574
Benefits
Receiving JSA at month 12 (%) 43.3 52.2 -8.9* -17.1 0.077
JSA amount per week (£) 25 29 -4 -13.4 0.232
Receiving WTC at month 12 (%) 14.7 11.4 3.4 29.8 0.336
WTC amount per week (£) 6 5 1 23.0 0.554
Wales (Sample size = 340)
Employment and earnings
Ever worked during year 1 (%) 44.2 51.8 -7.6 -14.6 0.117
Working at month 12 (%) 33.2 38.7 -5.5 -14.2 0.255
Average hours worked per weekat month 12 12.2 13.7 -1.5 -11.0 0.443
Working 30+ hours per week atmonth 12 (%) 27.3 28.9 -1.6 -5.5 0.737
Number of months worked full-timein year 1 2.3 2.7 -0.5 -17.6 0.237
Total earnings in year 1 (£) 2,159 3,172 -1,013* -31.9 0.059
Benefits
Receiving JSA at month 12 (%) 46.0 39.4 6.6 16.7 0.204
JSA amount per week (£) 29 24 6 23.9 0.130
Receiving WTC at month 12 (%) 13.5 19.6 -6.1 -31.1 0.124
WTC amount per week (£) 6 14 -8* -56.6 0.058
Source: MDRC calculations from the ERA 12-month customer survey.
Notes: JSA = Jobseeker's Allowance; IS = Income Support; WTC = Working Tax Credit;CTC = Child Tax Credit; IB = Incapacity Benefit.
Estimates were regression-adjusted using ordinary least squares, controlling for pre-randomassignment characteristics of sample members.
Rounding may cause slight discrepancies in calculating sums and differences.
Two-tailed t-tests were applied to differences between outcomes for the ERA group and thecontrol group. Statistical significance levels are indicated as: * = 10 per cent; ** = 5 per cent and*** = 1 per cent.
Impacts on employment, earnings and benefits
139
Considering full-time employment at month 12, the biggest effect is observed inNorth West England, where 28.7 per cent of the programme group worked full-time, compared with 16.1 per cent of the control group. The difference (12.6percentage points) is statistically significant. The other sizeable effect is in the EastMidlands. Here, 31.2 per cent of the programme group worked full-time, comparedwith 24.1 per cent of the control group. The difference of 7.2 percentage pointsnarrowly fails to attain statistical significance.
Examination of the number of hours worked each week suggests that employmententry, rather than an increase in hours among individuals previously working part-time, caused the increase in full-time employment in North West England and theEast Midlands. Again, this result is more definite in North West England than in theEast Midlands. However, even in North West England, no effect was detectable onthe probability of ever having worked during the year. This suggests that the bigemployment effects evident at month 12 may have emerged relatively recently. Inboth districts, ERA appears to have caused an additional 0.7 months in full-timeemployment over the course of the year.
Figure 5.7 presents the effects of ERA on earnings over the year. While there was astatistically significant increase in the East Midlands of £891 (£3,347 in theprogramme group, compared with £2,456 in the control group), no such effect wasevident for North West England. The results shown in Figure 5.8 for the effect of ERAon the amount of benefit received during the year are consistent with these resultsfor earnings. No statistically significant effect is found for North West England, whilein the East Midlands ERA reduced the amount of benefit by £449 to a level of£2,246. There also appears to have been a reduction in Scotland of £273.
One district deserves special mention since it presents puzzling results. Detailedresults presented in Supplemental Appendix CC show that those in the ND25+programme group in Wales worked less over the course of the year than those in thecontrol group, earned less and received more in benefits (JSA). Furthermore, theseeffects were large. Those in the programme group spent roughly one month less inwork over the year and one month more on JSA than those in the control group.Average earnings for the programme group over the year were £2,159, comparedwith £3,172 for the control group, a statistically significant reduction of £1,013.Benefit income for the programme group over the year was £2,626, compared with£2,115 for the control group – an increase of £511.
While this ‘rogue’ result – which substantially reduces the pooled impact estimatesfor the ND25+ group – may simply reflect the sort of random variation inherent inthis type of analysis, there is also a possibility that there was something about howthe experiment was carried out in Wales that undermines its validity as a test of thekey principles of ERA. In particular, there is qualitative evidence of staffing shortagesduring the New Deal stage for the ND25+ programme group in Wales but not for thecontrol group (or, indeed, for the NDLP group), such that the intensity of New Dealservices for the control group was greater than that for the programme group.Moreover, progression through the various stages of the ND25+ programme was
Impacts on employment, earnings and benefits
140
slower for the ERA group than for the control group for reasons wholly unrelated tothe design of ERA. At the same time, Personal Advisers (PAs) in Wales were underincreased pressure to get their customers into work, since the district was notmeeting its job entry targets. However, ASAs – and therefore individuals in theprogramme group – were to some extent shielded from this pressure.
During the pre-employment stage, the ERA model called for both the programmeand control groups to receive the same New Deal services, although with somegreater encouragement for the programme group to consider advancement goalsand job quality from the start. As previous chapters have explained, this pre-employment distinction was at best minimal across all districts and target groups,including Wales. In the case of Wales, however, certain other pre-employmentdifferences emerged in the treatment delivered to programme and control groupsthat were not called for by the ERA model and may have contributed to the negativeimpact in that district. The end result is that differences in outcomes between theprogramme and control group cannot be attributed to the ERA model – especiallyanything intrinsic to its in-work incentives and services – but rather must be viewedas the effect of a combination of factors.41
5.3.4 Effects of ERA for subgroups of ND25+ customers
The extent to which the effects of ERA varied across potentially important subgroupswas examined. The results are presented in Appendix F. Statistically significantpositive impacts are evident for a variety of subgroups. However, the range ofsubgroups with positive effects is narrower than within the NDLP group.
5.4 Findings for the Working Tax Credit group
A practical difficulty was encountered when analysing the WTC group; the samplesize was much smaller than for either of the New Deal groups. This reduces thepower of statistical tests. Consequently, it is especially important to bear in mind thatthe correct interpretation of the absence of a statistically significant effect is notnecessarily that there is no effect, but that there is no effect that is sufficiently large
Impacts on employment, earnings and benefits
41 Information from the ND25+ administrative files suggests that progressionthrough the ND25+ programme was slower for the ERA group than the controlgroup. Whereas 59 per cent of those in the ERA group participated in theGateway during the month of random assignment, the corresponding levelamong the control group was 89 per cent – a difference of 30 percentagepoints. Furthermore, only 20 per cent of the ERA group participated in thesecond (Option) stage of ND25+ within six months of random assignment,compared with 36 per cent of the control group – a difference of 16 percentagepoints. An additional relevant detail is that an operational oversight meant thata number of those in the ERA group who did not find work during Gatewaywere not moved into the Option stage.
141
to be detected with a given level of certainty. With a small sample, ‘sufficiently large’may in fact be quite large. The problem is particularly evident when consideringresults at the district level. It was only in the East Midlands that the sample was of asufficient size to allow district-level results to be considered reasonably reliable.Consequently, the main focus in this chapter is on the East Midlands.
When analysing the results for all the districts, the approach used for the New Dealgroups was to regard the district-level results as separate tests of ERA and to giveeach such test equal weight in calculating the overall effect. The small sample sizeforced a different approach with the WTC group. Specifically, because the economicimpacts for districts other than the East Midlands are likely to be less reliablyestimated, to accord them the same weight as the East Midlands impacts – which arebased on a much larger sample size – could be misleading. To reflect this, the pooledresults are unweighted in this chapter. Furthermore, unlike the analysis in Chapter 4,the results for North West England are not considered at all in this chapter and areexcluded from the pooled results. The reason for this is that, apart from having anextremely small sample size of only 45 individuals, only 59 per cent and 35 per cent(not in the tables) of the programme and control groups, respectively, report beingemployed in the month of random assignment. This is clearly worrying, sinceeverybody in the WTC group should have been employed as of study entry. Thisraises additional concerns over the proper interpretation of ERA results for the WTCgroup in North West England.
This different approach to calculating the overall effect of ERA yields a differentinterpretation of the resulting summary estimate. Rather than providing the effectof ERA averaged equally over six separate tests, it provides an estimate of the effectof ERA in which the contribution of any given district’s results to the pooled estimatereflects the relative size of the district’s sample (which, in the first place, partlyreflects the level of effort that was made to recruit WTC customers). While theresulting pooled estimates are less intuitive than the summary measures calculatedfor the New Deal groups, they are presented in the spirit of a sensitivity test to showwhether the results found for the East Midlands are likely to hold more broadly. Andwhile the East Midlands sample is by far the largest, adding the other districts(excluding North West England) nearly doubles the sample size for estimating theimpact of ERA on the WTC group, raising it from 659 to 1,299.
5.4.1 Effects of ERA on WTC customers in the East Midlands
Table 5.7 shows the estimated effects of ERA on employment and earnings for WTCcustomers in the East Midlands in year 1. All individuals should have been working atthe time of random assignment, so it is not surprising that nearly all the programmeand control group participants reported being employed at some point in the courseof the year. More informative is to consider employment status at the time of thesurvey interview. By this time, employment levels remained high (about 90 per cent),but there is no statistically significant difference between the programme andcontrol groups. However, ERA does increase the probability of working full-time. In
Impacts on employment, earnings and benefits
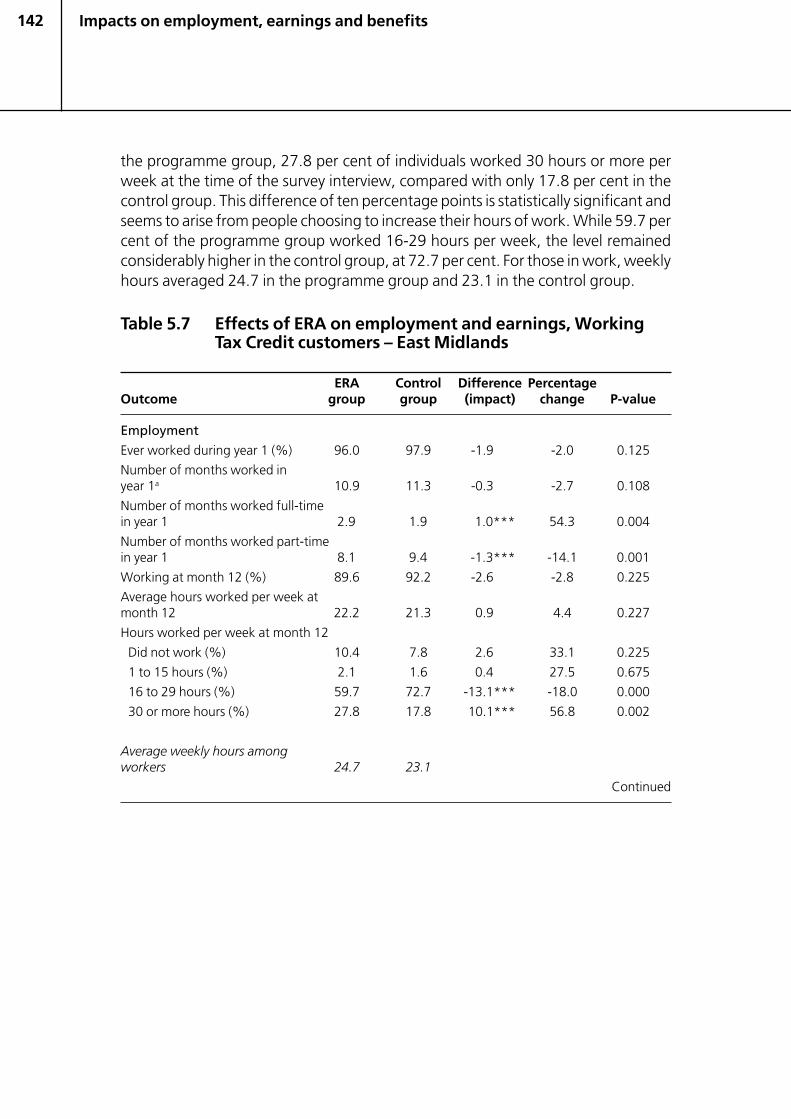
142
the programme group, 27.8 per cent of individuals worked 30 hours or more perweek at the time of the survey interview, compared with only 17.8 per cent in thecontrol group. This difference of ten percentage points is statistically significant andseems to arise from people choosing to increase their hours of work. While 59.7 percent of the programme group worked 16-29 hours per week, the level remainedconsiderably higher in the control group, at 72.7 per cent. For those in work, weeklyhours averaged 24.7 in the programme group and 23.1 in the control group.
Table 5.7 Effects of ERA on employment and earnings, WorkingTax Credit customers – East Midlands
ERA Control Difference PercentageOutcome group group (impact) change P-value
Employment
Ever worked during year 1 (%) 96.0 97.9 -1.9 -2.0 0.125
Number of months worked inyear 1a 10.9 11.3 -0.3 -2.7 0.108
Number of months worked full-timein year 1 2.9 1.9 1.0*** 54.3 0.004
Number of months worked part-timein year 1 8.1 9.4 -1.3*** -14.1 0.001
Working at month 12 (%) 89.6 92.2 -2.6 -2.8 0.225
Average hours worked per week atmonth 12 22.2 21.3 0.9 4.4 0.227
Hours worked per week at month 12
Did not work (%) 10.4 7.8 2.6 33.1 0.225
1 to 15 hours (%) 2.1 1.6 0.4 27.5 0.675
16 to 29 hours (%) 59.7 72.7 -13.1*** -18.0 0.000
30 or more hours (%) 27.8 17.8 10.1*** 56.8 0.002
Average weekly hours amongworkers 24.7 23.1
Continued
Impacts on employment, earnings and benefits
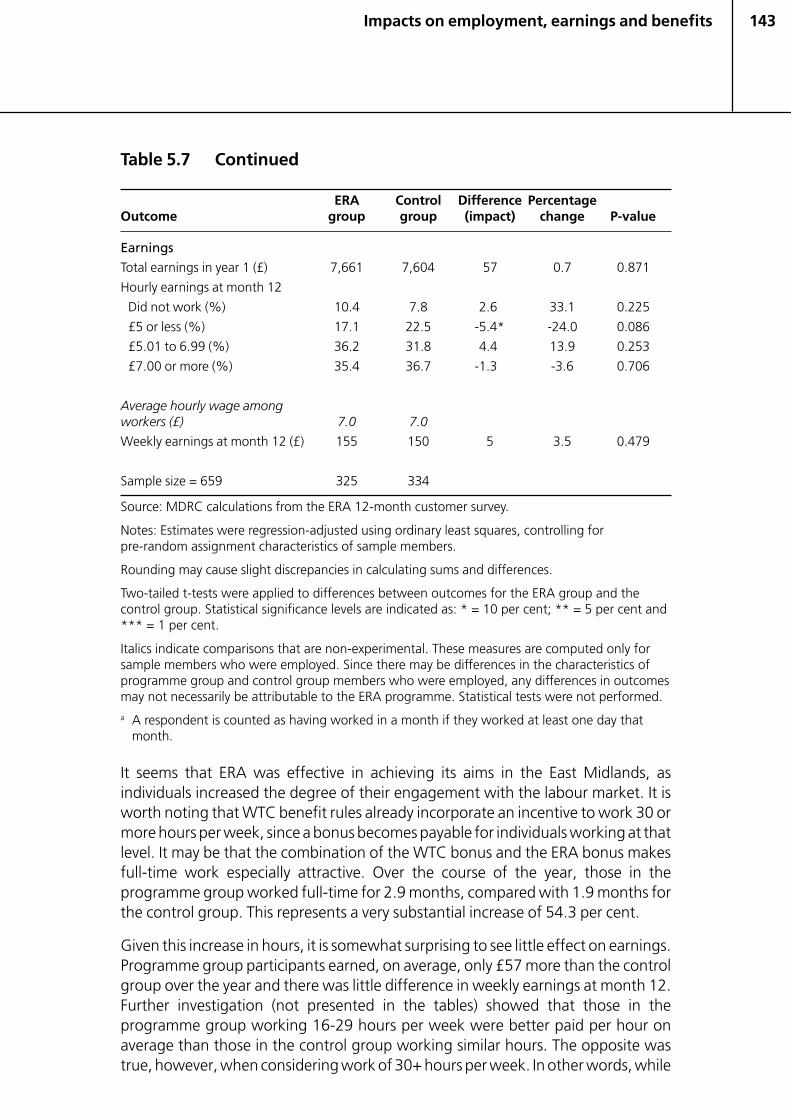
143
Table 5.7 Continued
ERA Control Difference PercentageOutcome group group (impact) change P-value
EarningsTotal earnings in year 1 (£) 7,661 7,604 57 0.7 0.871
Hourly earnings at month 12
Did not work (%) 10.4 7.8 2.6 33.1 0.225
£5 or less (%) 17.1 22.5 -5.4* -24.0 0.086
£5.01 to 6.99 (%) 36.2 31.8 4.4 13.9 0.253
£7.00 or more (%) 35.4 36.7 -1.3 -3.6 0.706
Average hourly wage amongworkers (£) 7.0 7.0
Weekly earnings at month 12 (£) 155 150 5 3.5 0.479
Sample size = 659 325 334
Source: MDRC calculations from the ERA 12-month customer survey.
Notes: Estimates were regression-adjusted using ordinary least squares, controlling forpre-random assignment characteristics of sample members.
Rounding may cause slight discrepancies in calculating sums and differences.
Two-tailed t-tests were applied to differences between outcomes for the ERA group and thecontrol group. Statistical significance levels are indicated as: * = 10 per cent; ** = 5 per cent and*** = 1 per cent.
Italics indicate comparisons that are non-experimental. These measures are computed only forsample members who were employed. Since there may be differences in the characteristics ofprogramme group and control group members who were employed, any differences in outcomesmay not necessarily be attributable to the ERA programme. Statistical tests were not performed.a A respondent is counted as having worked in a month if they worked at least one day that
month.
It seems that ERA was effective in achieving its aims in the East Midlands, asindividuals increased the degree of their engagement with the labour market. It isworth noting that WTC benefit rules already incorporate an incentive to work 30 ormore hours per week, since a bonus becomes payable for individuals working at thatlevel. It may be that the combination of the WTC bonus and the ERA bonus makesfull-time work especially attractive. Over the course of the year, those in theprogramme group worked full-time for 2.9 months, compared with 1.9 months forthe control group. This represents a very substantial increase of 54.3 per cent.
Given this increase in hours, it is somewhat surprising to see little effect on earnings.Programme group participants earned, on average, only £57 more than the controlgroup over the year and there was little difference in weekly earnings at month 12.Further investigation (not presented in the tables) showed that those in theprogramme group working 16-29 hours per week were better paid per hour onaverage than those in the control group working similar hours. The opposite wastrue, however, when considering work of 30+ hours per week. In other words, while
Impacts on employment, earnings and benefits
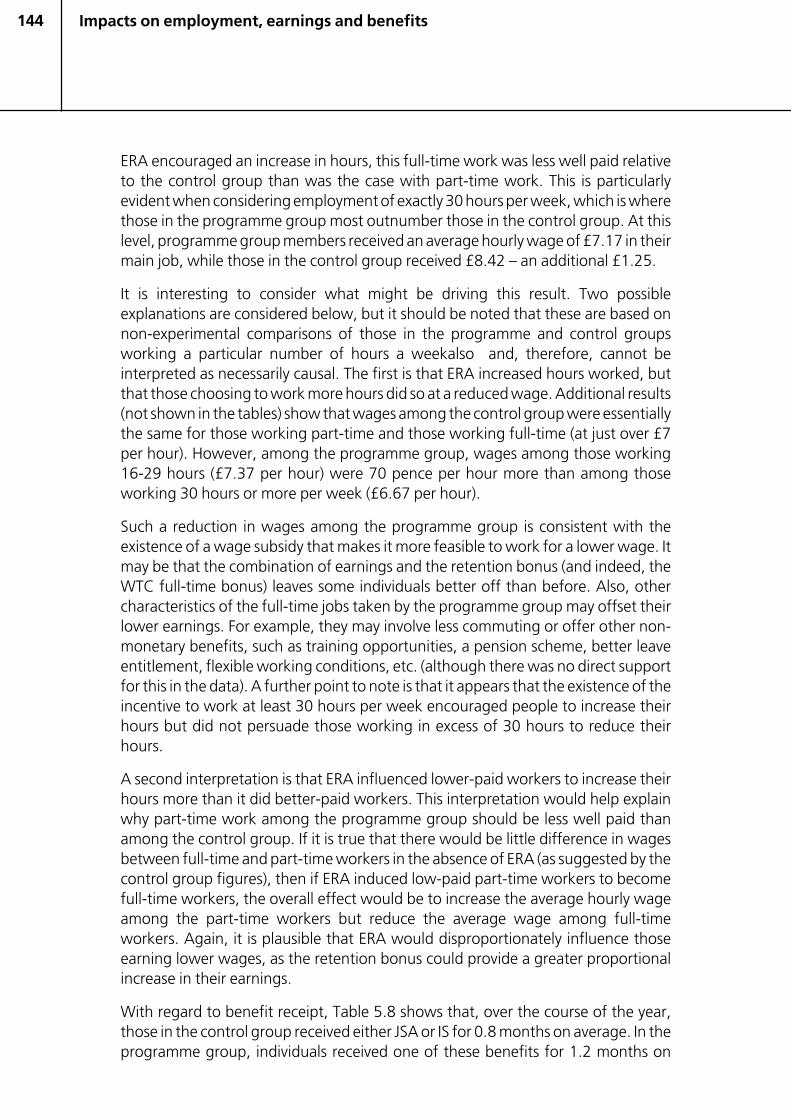
144
ERA encouraged an increase in hours, this full-time work was less well paid relativeto the control group than was the case with part-time work. This is particularlyevident when considering employment of exactly 30 hours per week, which is wherethose in the programme group most outnumber those in the control group. At thislevel, programme group members received an average hourly wage of £7.17 in theirmain job, while those in the control group received £8.42 – an additional £1.25.
It is interesting to consider what might be driving this result. Two possibleexplanations are considered below, but it should be noted that these are based onnon-experimental comparisons of those in the programme and control groupsworking a particular number of hours a weekalso and, therefore, cannot beinterpreted as necessarily causal. The first is that ERA increased hours worked, butthat those choosing to work more hours did so at a reduced wage. Additional results(not shown in the tables) show that wages among the control group were essentiallythe same for those working part-time and those working full-time (at just over £7per hour). However, among the programme group, wages among those working16-29 hours (£7.37 per hour) were 70 pence per hour more than among thoseworking 30 hours or more per week (£6.67 per hour).
Such a reduction in wages among the programme group is consistent with theexistence of a wage subsidy that makes it more feasible to work for a lower wage. Itmay be that the combination of earnings and the retention bonus (and indeed, theWTC full-time bonus) leaves some individuals better off than before. Also, othercharacteristics of the full-time jobs taken by the programme group may offset theirlower earnings. For example, they may involve less commuting or offer other non-monetary benefits, such as training opportunities, a pension scheme, better leaveentitlement, flexible working conditions, etc. (although there was no direct supportfor this in the data). A further point to note is that it appears that the existence of theincentive to work at least 30 hours per week encouraged people to increase theirhours but did not persuade those working in excess of 30 hours to reduce theirhours.
A second interpretation is that ERA influenced lower-paid workers to increase theirhours more than it did better-paid workers. This interpretation would help explainwhy part-time work among the programme group should be less well paid thanamong the control group. If it is true that there would be little difference in wagesbetween full-time and part-time workers in the absence of ERA (as suggested by thecontrol group figures), then if ERA induced low-paid part-time workers to becomefull-time workers, the overall effect would be to increase the average hourly wageamong the part-time workers but reduce the average wage among full-timeworkers. Again, it is plausible that ERA would disproportionately influence thoseearning lower wages, as the retention bonus could provide a greater proportionalincrease in their earnings.
With regard to benefit receipt, Table 5.8 shows that, over the course of the year,those in the control group received either JSA or IS for 0.8 months on average. In theprogramme group, individuals received one of these benefits for 1.2 months on
Impacts on employment, earnings and benefits
145
average, a statistically significant increase. Given this result, it is not surprising thatthe average amount of benefit received over the course of the year by theprogramme group (£244) was somewhat higher than that for the control group(£171), for a statistically significant £72 per year.
Table 5.8 Effects of ERA on benefit receipt, Working Tax Creditcustomers – East Midlands
ERA Control Difference PercentageOutcome group group (impact) change P-value
Survey data
Receiving JSA at survey (%) 0.6 0.0 0.6 n/a 0.149
JSA average per week (£) 0 0 0 n/a 0.149
Receiving WTC at survey (%) 78.7 81.8 -3.2 -3.9 0.293
WTC average per week (£) 37 39 -3 -6.7 0.270
Receiving CTC at survey (%) 90.7 89.6 1.1 1.3 0.621
CTC average per week (£) 54 50 4* 8.7 0.074
Receiving IS at survey (%) 8.9 6.0 2.8 47.0 0.143
IS average per week (£) 4 3 1 24.4 0.442
Receiving housing benefit at survey (%) 16.8 21.7 -4.9* -22.7 0.090
Receiving other state benefit atsurvey (%) 7.2 8.0 -0.8 -10.5 0.685
Other state benefit amount perweek (£) 4 4 0 -10.1 0.747
Records data
Number of months received JSA inyear 1 0.1 0.0 0.0 234.7 0.220
Total JSA received in year 1 (£) 10 2 8 444.3 0.158
Number of months received IS in year 1 1.2 0.8 0.4** 51.2 0.036
Total IS received in year 1 (£) 233 169 64 37.9 0.125
Number of months received IS or JSAin year 1 1.2 0.8 0.4** 55.1 0.024
Total IS and JSA received in year 1 (£) 244 171 72* 42.4 0.088
Number of months received IB in year 1 0.1 0.1 0.0 39.6 0.583
Ever received IB in year 1 (%) 2.3 2.2 0.1 3.0 0.954
Sample size = 659 325 334
Source: MDRC calculations from the ERA 12-month customer survey and benefit receipt records.
Notes: JSA = Jobseeker's Allowance; IS = Income Support; WTC = Working Tax Credit;CTC = Child Tax Credit; IB = Incapacity Benefit.
Estimates were regression-adjusted using ordinary least squares, controlling for pre-randomassignment characteristics of sample members.
Rounding may cause slight discrepancies in calculating sums and differences.
Two-tailed t-tests were applied to differences between outcomes for the ERA group and thecontrol group. Statistical significance levels are indicated as: * = 10 per cent; ** = 5 per cent and*** = 1 per cent.
Impacts on employment, earnings and benefits
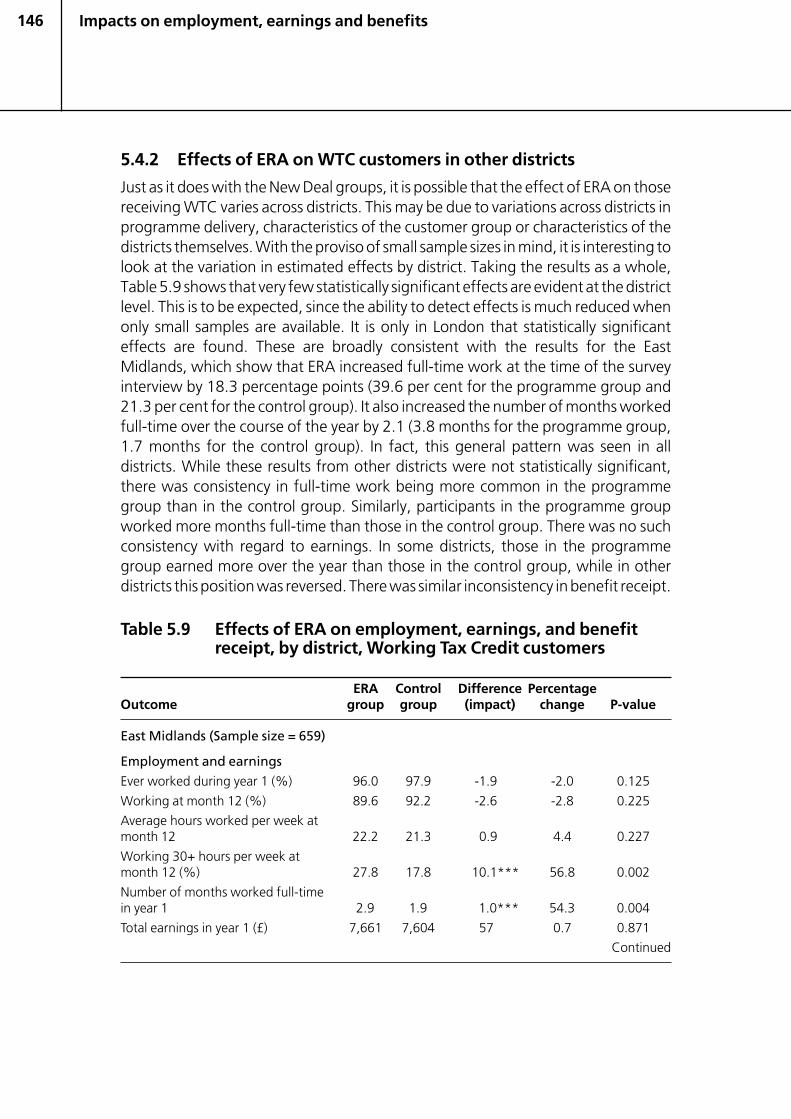
146
5.4.2 Effects of ERA on WTC customers in other districts
Just as it does with the New Deal groups, it is possible that the effect of ERA on thosereceiving WTC varies across districts. This may be due to variations across districts inprogramme delivery, characteristics of the customer group or characteristics of thedistricts themselves. With the proviso of small sample sizes in mind, it is interesting tolook at the variation in estimated effects by district. Taking the results as a whole,Table 5.9 shows that very few statistically significant effects are evident at the districtlevel. This is to be expected, since the ability to detect effects is much reduced whenonly small samples are available. It is only in London that statistically significanteffects are found. These are broadly consistent with the results for the EastMidlands, which show that ERA increased full-time work at the time of the surveyinterview by 18.3 percentage points (39.6 per cent for the programme group and21.3 per cent for the control group). It also increased the number of months workedfull-time over the course of the year by 2.1 (3.8 months for the programme group,1.7 months for the control group). In fact, this general pattern was seen in alldistricts. While these results from other districts were not statistically significant,there was consistency in full-time work being more common in the programmegroup than in the control group. Similarly, participants in the programme groupworked more months full-time than those in the control group. There was no suchconsistency with regard to earnings. In some districts, those in the programmegroup earned more over the year than those in the control group, while in otherdistricts this position was reversed. There was similar inconsistency in benefit receipt.
Table 5.9 Effects of ERA on employment, earnings, and benefitreceipt, by district, Working Tax Credit customers
ERA Control Difference PercentageOutcome group group (impact) change P-value
East Midlands (Sample size = 659)
Employment and earnings
Ever worked during year 1 (%) 96.0 97.9 -1.9 -2.0 0.125
Working at month 12 (%) 89.6 92.2 -2.6 -2.8 0.225
Average hours worked per week atmonth 12 22.2 21.3 0.9 4.4 0.227
Working 30+ hours per week atmonth 12 (%) 27.8 17.8 10.1*** 56.8 0.002
Number of months worked full-timein year 1 2.9 1.9 1.0*** 54.3 0.004
Total earnings in year 1 (£) 7,661 7,604 57 0.7 0.871
Continued
Impacts on employment, earnings and benefits
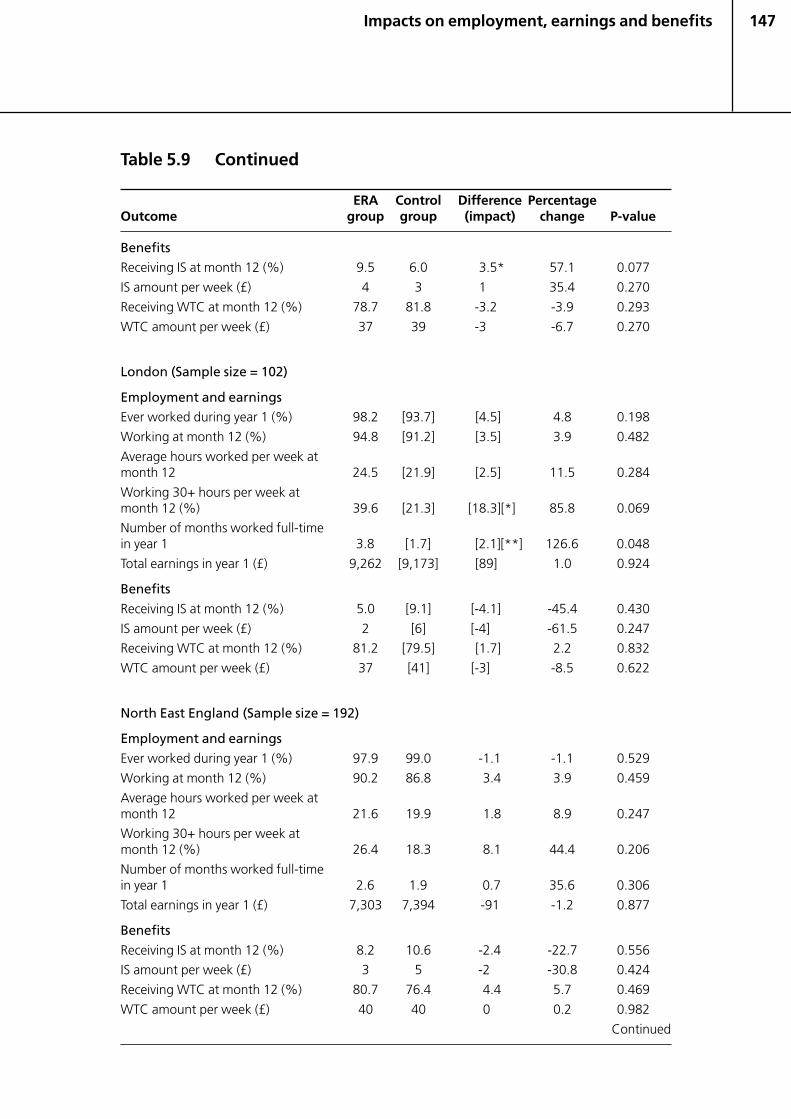
147
Table 5.9 Continued
ERA Control Difference PercentageOutcome group group (impact) change P-value
BenefitsReceiving IS at month 12 (%) 9.5 6.0 3.5* 57.1 0.077
IS amount per week (£) 4 3 1 35.4 0.270
Receiving WTC at month 12 (%) 78.7 81.8 -3.2 -3.9 0.293
WTC amount per week (£) 37 39 -3 -6.7 0.270
London (Sample size = 102)
Employment and earningsEver worked during year 1 (%) 98.2 [93.7] [4.5] 4.8 0.198
Working at month 12 (%) 94.8 [91.2] [3.5] 3.9 0.482
Average hours worked per week atmonth 12 24.5 [21.9] [2.5] 11.5 0.284
Working 30+ hours per week atmonth 12 (%) 39.6 [21.3] [18.3][*] 85.8 0.069
Number of months worked full-timein year 1 3.8 [1.7] [2.1][**] 126.6 0.048
Total earnings in year 1 (£) 9,262 [9,173] [89] 1.0 0.924
Benefits
Receiving IS at month 12 (%) 5.0 [9.1] [-4.1] -45.4 0.430
IS amount per week (£) 2 [6] [-4] -61.5 0.247
Receiving WTC at month 12 (%) 81.2 [79.5] [1.7] 2.2 0.832
WTC amount per week (£) 37 [41] [-3] -8.5 0.622
North East England (Sample size = 192)
Employment and earnings
Ever worked during year 1 (%) 97.9 99.0 -1.1 -1.1 0.529
Working at month 12 (%) 90.2 86.8 3.4 3.9 0.459
Average hours worked per week atmonth 12 21.6 19.9 1.8 8.9 0.247
Working 30+ hours per week atmonth 12 (%) 26.4 18.3 8.1 44.4 0.206
Number of months worked full-timein year 1 2.6 1.9 0.7 35.6 0.306
Total earnings in year 1 (£) 7,303 7,394 -91 -1.2 0.877
Benefits
Receiving IS at month 12 (%) 8.2 10.6 -2.4 -22.7 0.556
IS amount per week (£) 3 5 -2 -30.8 0.424
Receiving WTC at month 12 (%) 80.7 76.4 4.4 5.7 0.469
WTC amount per week (£) 40 40 0 0.2 0.982
Continued
Impacts on employment, earnings and benefits
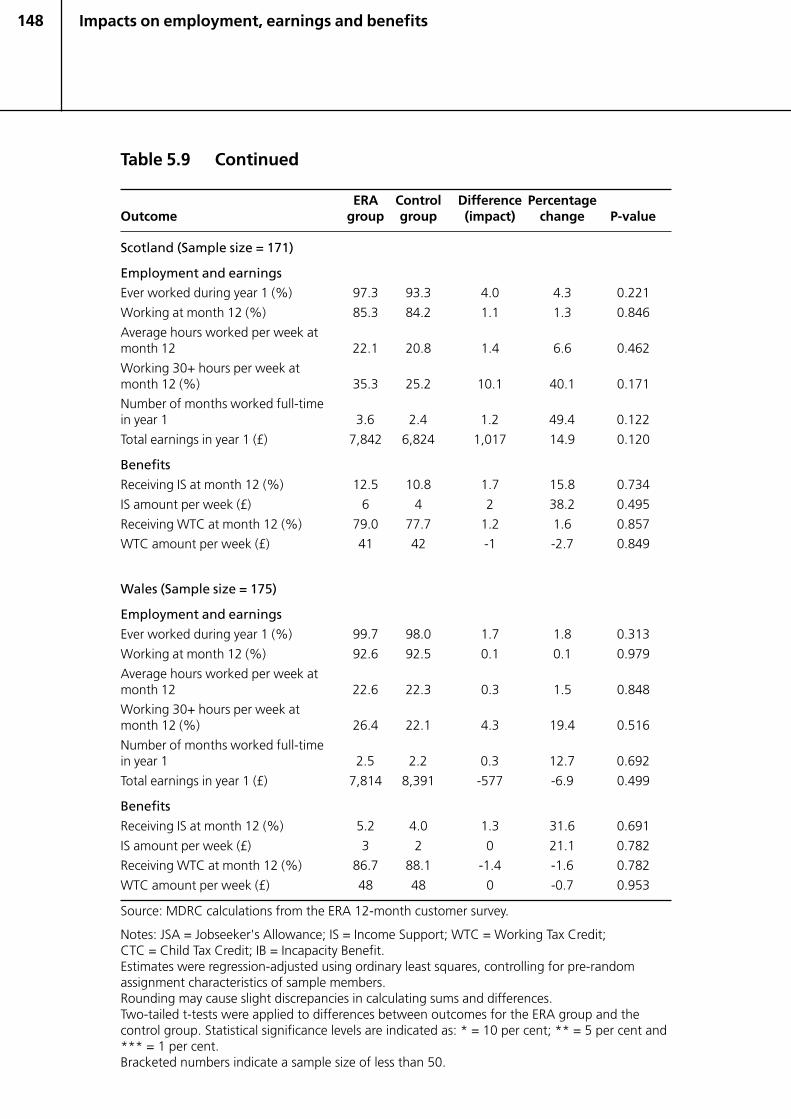
148
Table 5.9 Continued
ERA Control Difference PercentageOutcome group group (impact) change P-value
Scotland (Sample size = 171)
Employment and earningsEver worked during year 1 (%) 97.3 93.3 4.0 4.3 0.221
Working at month 12 (%) 85.3 84.2 1.1 1.3 0.846
Average hours worked per week atmonth 12 22.1 20.8 1.4 6.6 0.462
Working 30+ hours per week atmonth 12 (%) 35.3 25.2 10.1 40.1 0.171
Number of months worked full-timein year 1 3.6 2.4 1.2 49.4 0.122
Total earnings in year 1 (£) 7,842 6,824 1,017 14.9 0.120
Benefits
Receiving IS at month 12 (%) 12.5 10.8 1.7 15.8 0.734
IS amount per week (£) 6 4 2 38.2 0.495
Receiving WTC at month 12 (%) 79.0 77.7 1.2 1.6 0.857
WTC amount per week (£) 41 42 -1 -2.7 0.849
Wales (Sample size = 175)
Employment and earnings
Ever worked during year 1 (%) 99.7 98.0 1.7 1.8 0.313
Working at month 12 (%) 92.6 92.5 0.1 0.1 0.979
Average hours worked per week atmonth 12 22.6 22.3 0.3 1.5 0.848
Working 30+ hours per week atmonth 12 (%) 26.4 22.1 4.3 19.4 0.516
Number of months worked full-timein year 1 2.5 2.2 0.3 12.7 0.692
Total earnings in year 1 (£) 7,814 8,391 -577 -6.9 0.499
Benefits
Receiving IS at month 12 (%) 5.2 4.0 1.3 31.6 0.691
IS amount per week (£) 3 2 0 21.1 0.782
Receiving WTC at month 12 (%) 86.7 88.1 -1.4 -1.6 0.782
WTC amount per week (£) 48 48 0 -0.7 0.953
Source: MDRC calculations from the ERA 12-month customer survey.
Notes: JSA = Jobseeker's Allowance; IS = Income Support; WTC = Working Tax Credit;CTC = Child Tax Credit; IB = Incapacity Benefit.Estimates were regression-adjusted using ordinary least squares, controlling for pre-randomassignment characteristics of sample members.Rounding may cause slight discrepancies in calculating sums and differences.Two-tailed t-tests were applied to differences between outcomes for the ERA group and thecontrol group. Statistical significance levels are indicated as: * = 10 per cent; ** = 5 per cent and*** = 1 per cent.Bracketed numbers indicate a sample size of less than 50.
Impacts on employment, earnings and benefits
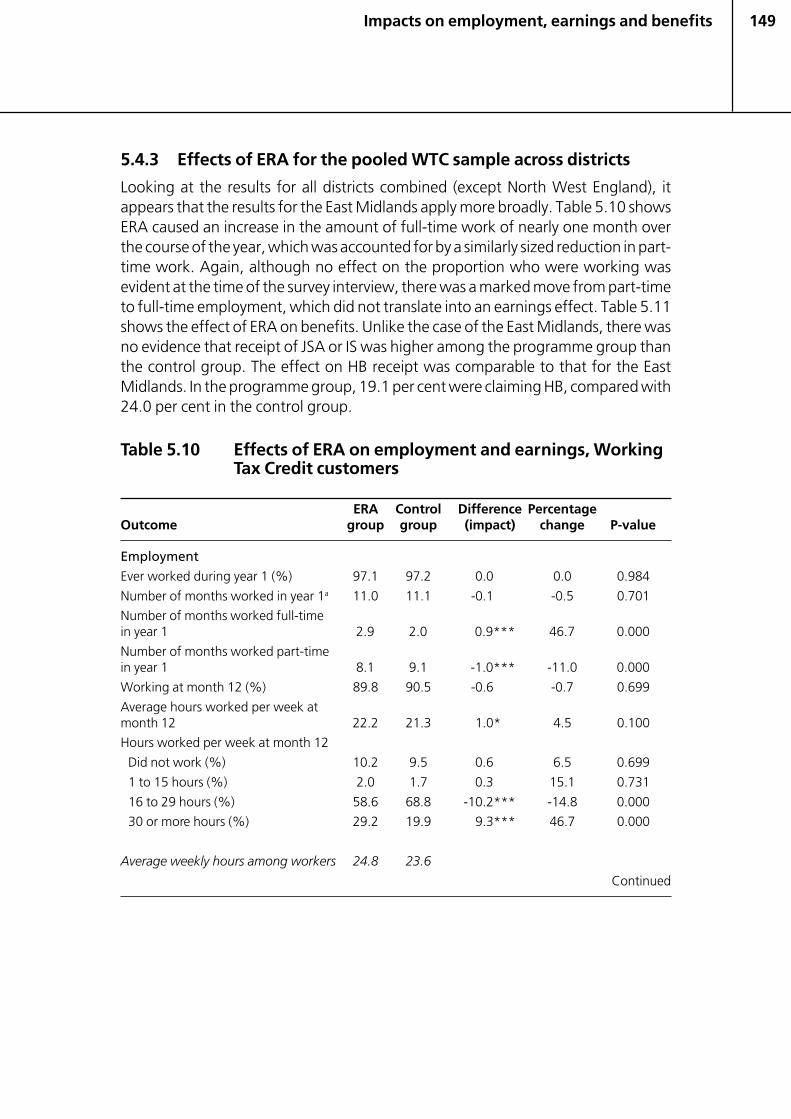
149
5.4.3 Effects of ERA for the pooled WTC sample across districts
Looking at the results for all districts combined (except North West England), itappears that the results for the East Midlands apply more broadly. Table 5.10 showsERA caused an increase in the amount of full-time work of nearly one month overthe course of the year, which was accounted for by a similarly sized reduction in part-time work. Again, although no effect on the proportion who were working wasevident at the time of the survey interview, there was a marked move from part-timeto full-time employment, which did not translate into an earnings effect. Table 5.11shows the effect of ERA on benefits. Unlike the case of the East Midlands, there wasno evidence that receipt of JSA or IS was higher among the programme group thanthe control group. The effect on HB receipt was comparable to that for the EastMidlands. In the programme group, 19.1 per cent were claiming HB, compared with24.0 per cent in the control group.
Table 5.10 Effects of ERA on employment and earnings, WorkingTax Credit customers
ERA Control Difference PercentageOutcome group group (impact) change P-value
Employment
Ever worked during year 1 (%) 97.1 97.2 0.0 0.0 0.984
Number of months worked in year 1a 11.0 11.1 -0.1 -0.5 0.701
Number of months worked full-timein year 1 2.9 2.0 0.9*** 46.7 0.000
Number of months worked part-timein year 1 8.1 9.1 -1.0*** -11.0 0.000
Working at month 12 (%) 89.8 90.5 -0.6 -0.7 0.699
Average hours worked per week atmonth 12 22.2 21.3 1.0* 4.5 0.100
Hours worked per week at month 12
Did not work (%) 10.2 9.5 0.6 6.5 0.699
1 to 15 hours (%) 2.0 1.7 0.3 15.1 0.731
16 to 29 hours (%) 58.6 68.8 -10.2*** -14.8 0.000
30 or more hours (%) 29.2 19.9 9.3*** 46.7 0.000
Average weekly hours among workers 24.8 23.6
Continued
Impacts on employment, earnings and benefits
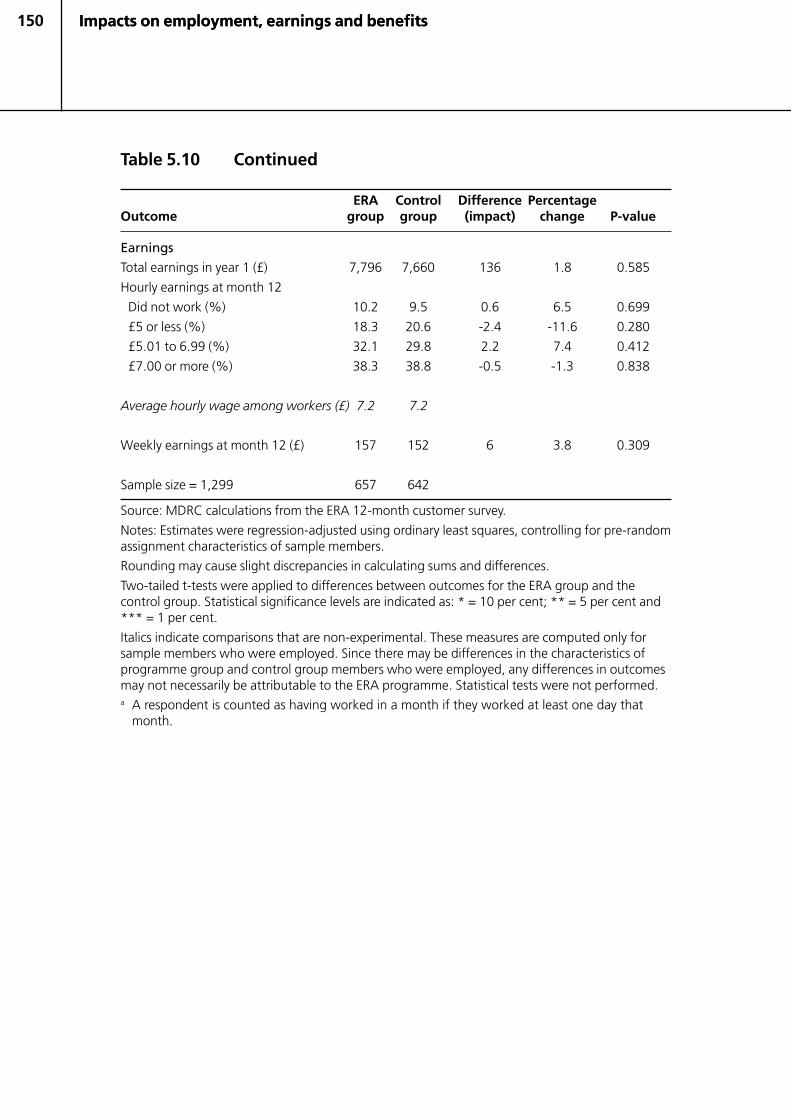
150
Table 5.10 Continued
ERA Control Difference PercentageOutcome group group (impact) change P-value
EarningsTotal earnings in year 1 (£) 7,796 7,660 136 1.8 0.585
Hourly earnings at month 12
Did not work (%) 10.2 9.5 0.6 6.5 0.699
£5 or less (%) 18.3 20.6 -2.4 -11.6 0.280
£5.01 to 6.99 (%) 32.1 29.8 2.2 7.4 0.412
£7.00 or more (%) 38.3 38.8 -0.5 -1.3 0.838
Average hourly wage among workers (£) 7.2 7.2
Weekly earnings at month 12 (£) 157 152 6 3.8 0.309
Sample size = 1,299 657 642
Source: MDRC calculations from the ERA 12-month customer survey.
Notes: Estimates were regression-adjusted using ordinary least squares, controlling for pre-randomassignment characteristics of sample members.
Rounding may cause slight discrepancies in calculating sums and differences.
Two-tailed t-tests were applied to differences between outcomes for the ERA group and thecontrol group. Statistical significance levels are indicated as: * = 10 per cent; ** = 5 per cent and*** = 1 per cent.
Italics indicate comparisons that are non-experimental. These measures are computed only forsample members who were employed. Since there may be differences in the characteristics ofprogramme group and control group members who were employed, any differences in outcomesmay not necessarily be attributable to the ERA programme. Statistical tests were not performed.a A respondent is counted as having worked in a month if they worked at least one day that
month.
Impacts on employment, earnings and benefitsImpacts on employment, earnings and benefits
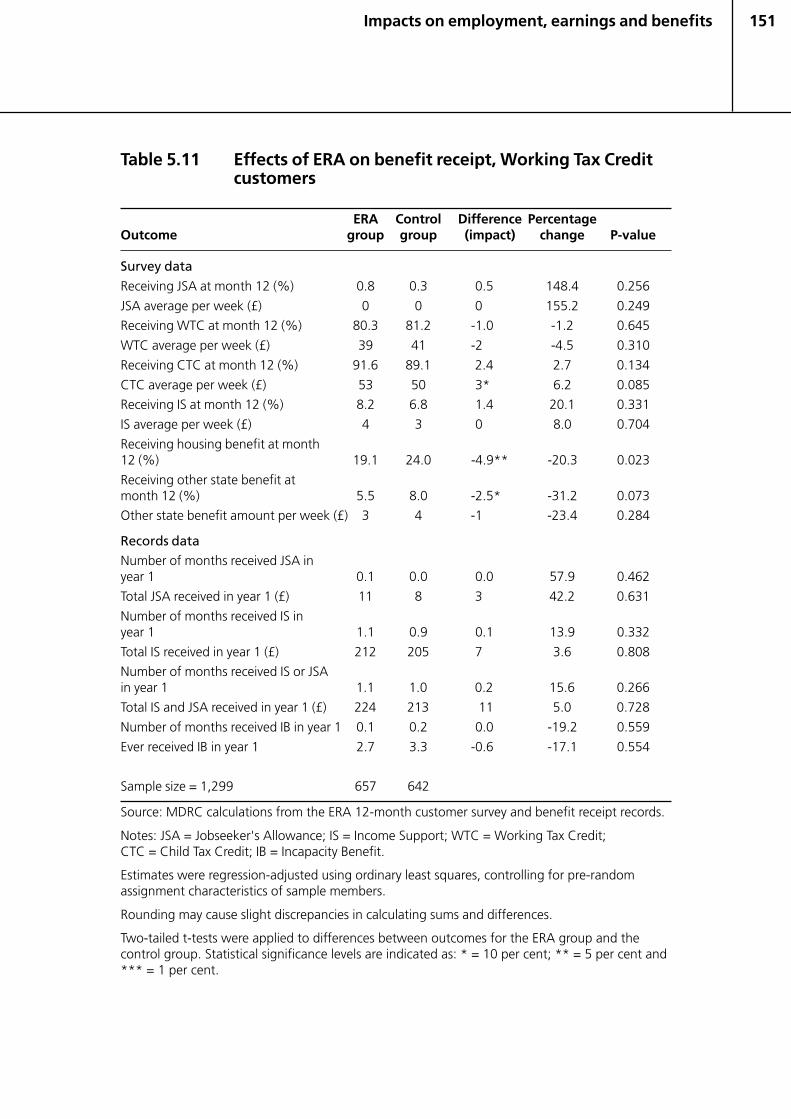
151
Table 5.11 Effects of ERA on benefit receipt, Working Tax Creditcustomers
ERA Control Difference PercentageOutcome group group (impact) change P-value
Survey data
Receiving JSA at month 12 (%) 0.8 0.3 0.5 148.4 0.256
JSA average per week (£) 0 0 0 155.2 0.249
Receiving WTC at month 12 (%) 80.3 81.2 -1.0 -1.2 0.645
WTC average per week (£) 39 41 -2 -4.5 0.310
Receiving CTC at month 12 (%) 91.6 89.1 2.4 2.7 0.134
CTC average per week (£) 53 50 3* 6.2 0.085
Receiving IS at month 12 (%) 8.2 6.8 1.4 20.1 0.331
IS average per week (£) 4 3 0 8.0 0.704
Receiving housing benefit at month12 (%) 19.1 24.0 -4.9** -20.3 0.023
Receiving other state benefit atmonth 12 (%) 5.5 8.0 -2.5* -31.2 0.073
Other state benefit amount per week (£) 3 4 -1 -23.4 0.284
Records dataNumber of months received JSA inyear 1 0.1 0.0 0.0 57.9 0.462
Total JSA received in year 1 (£) 11 8 3 42.2 0.631
Number of months received IS inyear 1 1.1 0.9 0.1 13.9 0.332
Total IS received in year 1 (£) 212 205 7 3.6 0.808
Number of months received IS or JSAin year 1 1.1 1.0 0.2 15.6 0.266
Total IS and JSA received in year 1 (£) 224 213 11 5.0 0.728
Number of months received IB in year 1 0.1 0.2 0.0 -19.2 0.559
Ever received IB in year 1 2.7 3.3 -0.6 -17.1 0.554
Sample size = 1,299 657 642
Source: MDRC calculations from the ERA 12-month customer survey and benefit receipt records.
Notes: JSA = Jobseeker's Allowance; IS = Income Support; WTC = Working Tax Credit;CTC = Child Tax Credit; IB = Incapacity Benefit.
Estimates were regression-adjusted using ordinary least squares, controlling for pre-randomassignment characteristics of sample members.
Rounding may cause slight discrepancies in calculating sums and differences.
Two-tailed t-tests were applied to differences between outcomes for the ERA group and thecontrol group. Statistical significance levels are indicated as: * = 10 per cent; ** = 5 per cent and*** = 1 per cent.
Impacts on employment, earnings and benefits
152
5.5 Conclusions
This chapter provides the first evidence of whether ERA achieved its key objectives ofincreasing employment retention and advancement. A second report, due in early2008, will consider longer-term effects, as well as results for the full population ofindividuals taking part in the experiment. These longer-term results promise to bevery informative since they will reflect the improvement over time in theimplementation of ERA described in Chapter 3.
For lone parents – whether they were NDLP participants or lone parents who wereworking and receiving WTC at the time of random assignment – the most notableeffect of ERA over the first year of its implementation has been to encourage a movefrom part-time to full-time work. ERA also caused a small increase in hours workedamong ND25+ participants. For NDLP participants, the increase in hours wasaccompanied by an increase in earnings but this was not the case for all districts. Adegree of local variation is to be expected since districts vary in their characteristicsand delivery of ERA. The effect on earnings was positive for ND25+ participants inmost districts, although statistically significant for only one (East Midlands).
There was evidence of ERA increasing employment. Among NDLP participants,there was a higher probability of having worked at some point during the year(although this was mainly driven by a strong employment effect in North WestEngland), while, among ND25+ participants, no such effect was found. However, astatistically significant increase in the probability of being in work at the end of year1 was found in one district (again, the North West). It is perhaps somewhatsurprising that ERA should have an effect on employment entry, given the fact thatthe pre-employment service provided by advisers differed little between the ERAgroup and the control group. However, it is important to bear in mind that theavailability of the retention bonus could itself change the job search process for theERA group, since it increases the range of jobs an individual could consider applyingfor and increases the financial payoff to work. Chapter 4 has shown that awarenessof the retention bonus is high (roughly three-quarters of those eligible for ERA,regardless of target group, were aware of the bonus). While actual receipt of thebonus appears low, it should be borne in mind that receipt among those who havealready been working full-time for a long enough period to qualify for receipt of thebonus may be considerably higher. It seems inevitable that penetration of theretention bonus will have grown by the time of the second report.
Mostly, the observed results were consistent with the design of ERA. However, it isimportant to bear in mind the distinction between pre-employment and post-employment treatment. For the two New Deal groups, getting a job represents ahurdle they have to clear before concerns relating to retention and advancementcan be fully considered. The key focus of ERA is on in-work treatment and the secondreport will be able to focus more squarely on the effects of this.
Impacts on employment, earnings and benefits
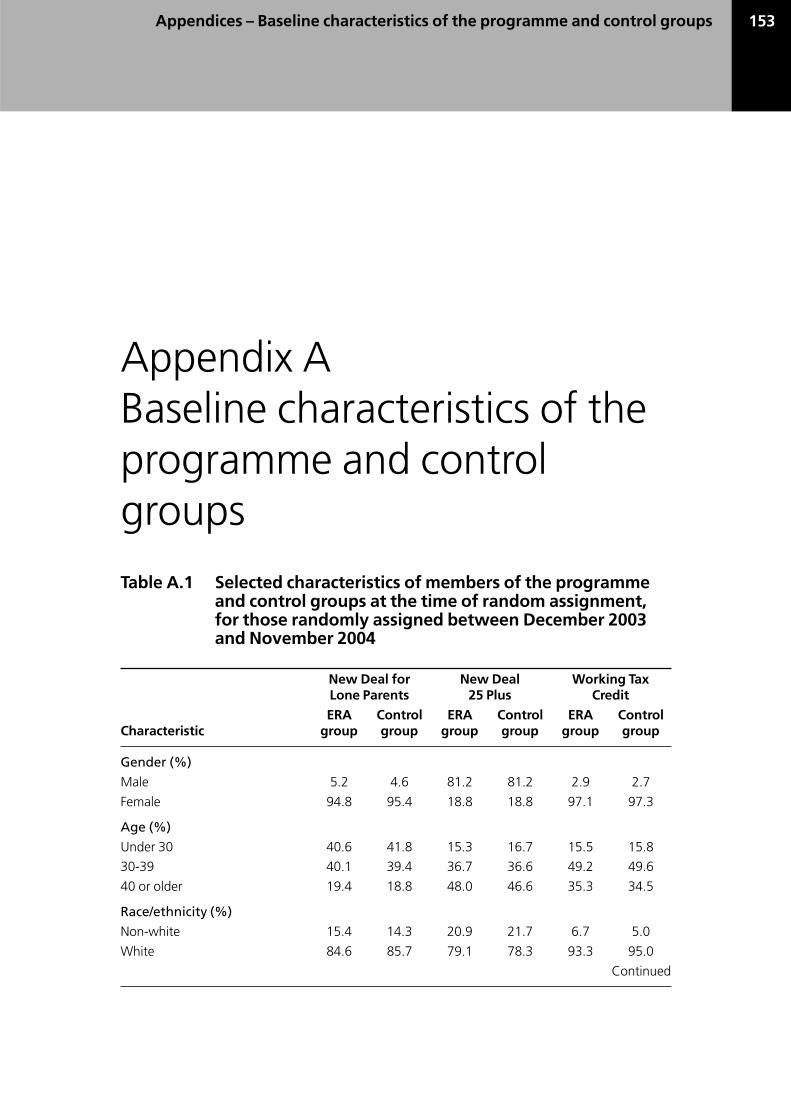
153Appendices – Baseline characteristics of the programme and control groups
Appendix ABaseline characteristics of theprogramme and controlgroups
Table A.1 Selected characteristics of members of the programmeand control groups at the time of random assignment,for those randomly assigned between December 2003and November 2004
New Deal for New Deal Working TaxLone Parents 25 Plus Credit
ERA Control ERA Control ERA ControlCharacteristic group group group group group group
Gender (%)
Male 5.2 4.6 81.2 81.2 2.9 2.7
Female 94.8 95.4 18.8 18.8 97.1 97.3
Age (%)
Under 30 40.6 41.8 15.3 16.7 15.5 15.8
30-39 40.1 39.4 36.7 36.6 49.2 49.6
40 or older 19.4 18.8 48.0 46.6 35.3 34.5
Race/ethnicity (%)
Non-white 15.4 14.3 20.9 21.7 6.7 5.0
White 84.6 85.7 79.1 78.3 93.3 95.0
Continued
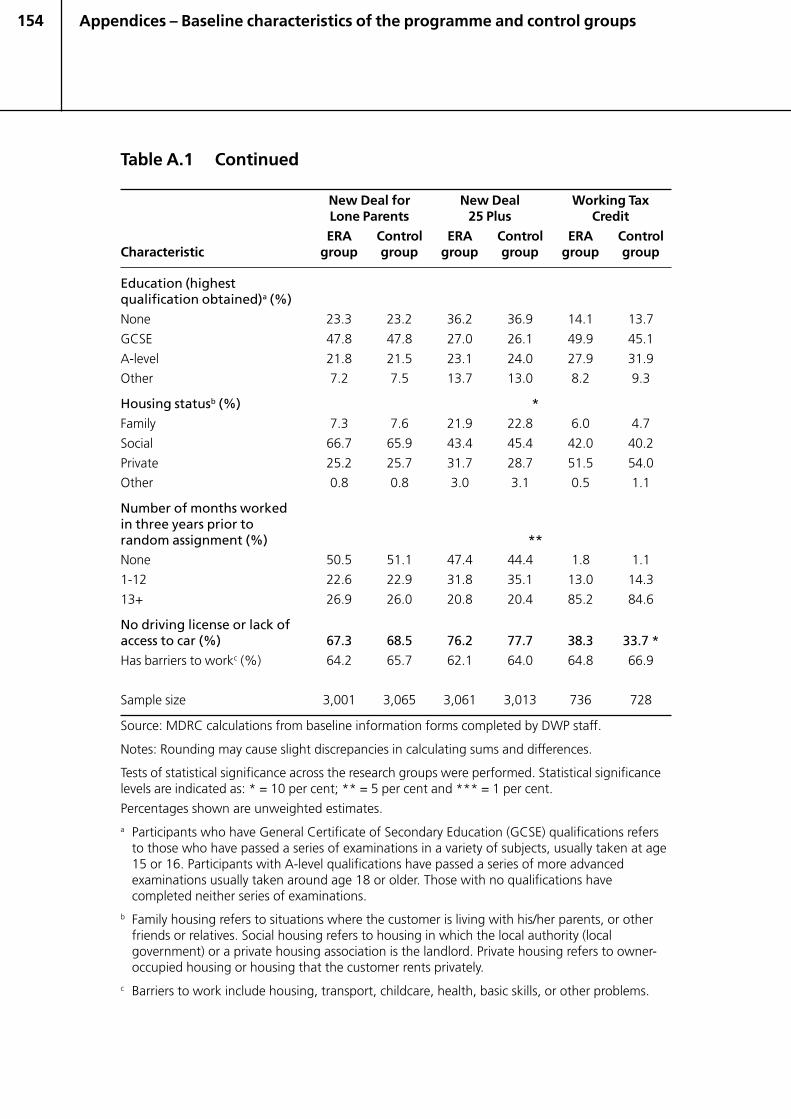
154 Appendices – Baseline characteristics of the programme and control groups
Table A.1 Continued
New Deal for New Deal Working TaxLone Parents 25 Plus Credit
ERA Control ERA Control ERA ControlCharacteristic group group group group group group
Education (highestqualification obtained)a (%)
None 23.3 23.2 36.2 36.9 14.1 13.7
GCSE 47.8 47.8 27.0 26.1 49.9 45.1
A-level 21.8 21.5 23.1 24.0 27.9 31.9
Other 7.2 7.5 13.7 13.0 8.2 9.3
Housing statusb (%) *
Family 7.3 7.6 21.9 22.8 6.0 4.7
Social 66.7 65.9 43.4 45.4 42.0 40.2
Private 25.2 25.7 31.7 28.7 51.5 54.0
Other 0.8 0.8 3.0 3.1 0.5 1.1
Number of months workedin three years prior torandom assignment (%) **None 50.5 51.1 47.4 44.4 1.8 1.1
1-12 22.6 22.9 31.8 35.1 13.0 14.3
13+ 26.9 26.0 20.8 20.4 85.2 84.6
No driving license or lack ofaccess to car (%) 67.3 68.5 76.2 77.7 38.3 33.7 *
Has barriers to workc (%) 64.2 65.7 62.1 64.0 64.8 66.9
Sample size 3,001 3,065 3,061 3,013 736 728
Source: MDRC calculations from baseline information forms completed by DWP staff.
Notes: Rounding may cause slight discrepancies in calculating sums and differences.
Tests of statistical significance across the research groups were performed. Statistical significancelevels are indicated as: * = 10 per cent; ** = 5 per cent and *** = 1 per cent.
Percentages shown are unweighted estimates.a Participants who have General Certificate of Secondary Education (GCSE) qualifications refers
to those who have passed a series of examinations in a variety of subjects, usually taken at age15 or 16. Participants with A-level qualifications have passed a series of more advancedexaminations usually taken around age 18 or older. Those with no qualifications havecompleted neither series of examinations.
b Family housing refers to situations where the customer is living with his/her parents, or otherfriends or relatives. Social housing refers to housing in which the local authority (localgovernment) or a private housing association is the landlord. Private housing refers to owner-occupied housing or housing that the customer rents privately.
c Barriers to work include housing, transport, childcare, health, basic skills, or other problems.
155Appendices – Implementation features of the six ERA districts
Appendix BImplementation features ofthe six ERA districts
Table B.1 Implementation features of the six ERA districts
East Midlands
Structure Centralised management through Employment Retention and Advancement(ERA) District Manager. Three regional Advancement Support Adviser (ASA)Managers phased in between 2004 and 2005, covering 19 offices amongthem.
Staffing Initially, ASAs were specialists for ERA customer groups but increasingly servedall customer groups. A single ASA worked in smaller offices. Some peripateticadvisers experienced downtime travelling between multiple offices. Centralmanagement negated the need for ring-fencing adviser resources, althoughin smaller offices advisers performed mainstream adviser duties.
Intake Mainstream New Deal advisers performed random assignment and passed onprogramme group customers to ASAs. Intake of Working Tax Credit (WTC)customer group largest of all districts, concentrated at end-of-intake period.
Targets Little pressure on ASAs to contribute to job entry targets meant more timecould be devoted to delivering ERA. ASA benchmarks for job entry and post-employment contact introduced in early 2005.
ERA profile ERA considered to have lower profile than Incapacity Benefit (IB) Pathwayspilot. Given centralised management, less support from Business Managers.
Events Regional ASA managers phased in between 2004 and 2005 due to large sizeof district. New ERA Manager assigned in Autumn 2004. New DistrictManager appointed in early 2005. Due to pressure of space, ASAs in largeroffices co-located in centralised units in early 2005.
Issues Large geographical district made staffing and management difficult. Largecustomer caseloads in bigger offices detracted from ERA delivery, with majorpressure on staffing during summer 2004. Large proportion of ASAs had noprevious advisory experience.
Continued
156 Appendices – Implementation features of the six ERA districts
Table B.1 Continued
Achievements Centralised ERA management structure effective for maintaining andprotecting programme resources. Innovative marketing to attract sufficientnumbers to the WTC customer group. Promoted work retention andadvancement concepts early in the implementation. In spring 2004established innovative advancement materials for use with non-workingcustomers and set benchmarks for contacting working customers.
London
Structure Management structure differed depending on the New Deal customer group.The New Deal for Lone Parents (NDLP) and WTC group ASAs werecoordinated and managed centrally. The New Deal 25 Plus (ND25+) ASAswere coordinated at the district level but line-managed at the office level.
Staffing Initially, some resistance to staffing ERA. ASAs were specialists by ERAcustomer groups. NDLP ASAs served both control and programme group.Ring-fencing of a Post-Employment Team (PET) started in early 2005.
Intake Lone parents randomly assigned by NDLP advisers (who also delivered ERA).ND25+ randomly assigned by mix of ASAs and support staff.
Targets Same job entry targets applied to ASAs, which detracted from ERA delivery.Once the PET was formed, ASAs were assigned benchmarks and key workobjectives.
ERA profile Perceived to be low because post-employment delivery of ERA does notcontribute to job-entry targets.
Events New District Manager in spring 2004. PET formed in early 2005.
Issues Tension with job entry targets. Large customer caseloads and mainstreamJobcentre Plus work.
Achievements In spring 2005, District Manager agreed to commit more resources to ERA.Established PET in 2005. Developed innovative customer re-engagementpublicity materials.
North East England
Structure Centralised ERA District Manager but ASAs locally line-managed at the officelevel.
Staffing ASAs were specialists by ERA customer groups. Ring-fencing of ASAs phasedin during 2005 but no longer in effect by early 2006. Therefore, all ASAs had,at times, served non-ERA as well as ERA customers.
Intake Random assignment performed by mix of New Deal and ERA advisers.
Targets ASAs expected to contribute to district job entry targets but targets applied toASAs were half those for New Deal advisers. Eventually, ASAs who wereassigned separate ERA objectives placed added pressure on staff.
ERA Profile Perceived to be low; IB Pathways pilot given more priority.
Events District without Technical Adviser (TA) support during spring 2004.Ring-fencing of all ASAs introduced in 2005 but phased out by 2006. Districtreorganisation in spring 2006.
Issues Tension with job entry targets. Large customer caseloads and mainstreamJobcentre Plus work.
Achievements ASAs ring-fenced during 2005. Some advisers developed innovativeengagement and advancement techniques, but these were not consistentlyimplemented across the district.
Continued
157Appendices – Implementation features of the six ERA districts
Table B.1 Continued
North West England
Structure Centralised ERA District Manager but ASAs locally line-managed at the officelevel.
Staffing Pre-employment: ASAs mainly specialised, working either with NDLP orND25+ customers. They all worked with WTC customers. Ring-fencing of aPET started in 2005 when working customer caseloads were assigned toASAs, while non-working customers were initially assigned to ASAs and laterto administrative staff who performed job search activities.
Intake Random assignment performed by mix of New Deal and ERA advisers, thoughall were trained on ERA intake.
Targets Same job entry targets applied to ASAs, which detracted from ERA delivery.Once the PET was formed, ASAs were assigned benchmarks and key workobjectives.
ERA profile Perceived to be low because post-employment delivery of ERA does notcontribute to job entry targets.
Events Delayed start, three months later than other districts. District reorganisation inApril 2005. New District Manager in mid-2005. PET started in July 2005.
Issues Decentralised line management detracted from ERA delivery. Tensions withjob entry targets. TA was sometimes asked to cover other districts.
Achievements Established PET in 2005. Developed innovative customer re-engagementpublicity materials, including newsletter and free prize draw. ‘End of an ERA’information pack distributed to customers nearing the end of their 33 monthsof support.
Scotland
Structure Management and budget decentralised to office level. No ERA DistrictManager.
Staffing Some mixed, some specialist ASAs. Most offices had only one ASA. ASAsring-fenced in two offices in spring 2005, while remaining served non-ERA aswell as ERA customers.
Intake Random assignment performed by various New Deal, ASA and support staff.
Targets Same job entry targets applied to ASAs, which detracted from ERA delivery.No ERA-specific benchmarks.
ERA profile Perceived to be low. Upper and some local managers tended to favour IBPathways pilot.
Events District reorganised in 2004. New District Manager in spring 2004.
Issues Decentralised line management detracted from ERA delivery. Officegeographical distribution awkward for support and meetings. Tensions withjob entry targets. Large customer caseloads and mainstream Jobcentre Pluswork. Other pilot given more priority.
Achievements ASAs in some offices ring-fenced during 2005. Some advisers developedinnovative engagement and advancement techniques, but these were notconsistently implemented across the district.
Continued
158 Appendices – Implementation features of the six ERA districts
Table B.1 Continued
Wales
Structure Centralised management. ERA District Manager also responsible for deliveryof NDLP across the district.
Staffing ASAs were specialists by ERA customer groups. A single ASA worked insmaller offices. Some peripatetic advisers experienced downtime travellingbetween multiple offices. ASA staffing levels affected by long-term sick leave.
Intake Mainstream New Deal advisers performed random assignment and passed onprogramme group customers to ASAs.
Targets Job entry targets applied to ASAs, which detracted from ERA delivery.Benchmarks for post-employment contact and key work objectives aroundadvancement and retention from April 2004.
ERA profile ERA perceived to be supported at office level but devalued at uppermanagement level due to tensions with job entry targets.
Events Achieved 100 per cent NDLP intake April 2004.
Issues Tension with job entry targets. Limited number of ND25+ ASAs.Understaffing, large customer caseloads and mainstream Jobcentre Pluswork.
Achievements Promoted work retention and advancement concepts early in theimplementation. In spring 2004 established innovative advancement materialsfor use with non-working customers and set benchmarks for contactingworking customers.
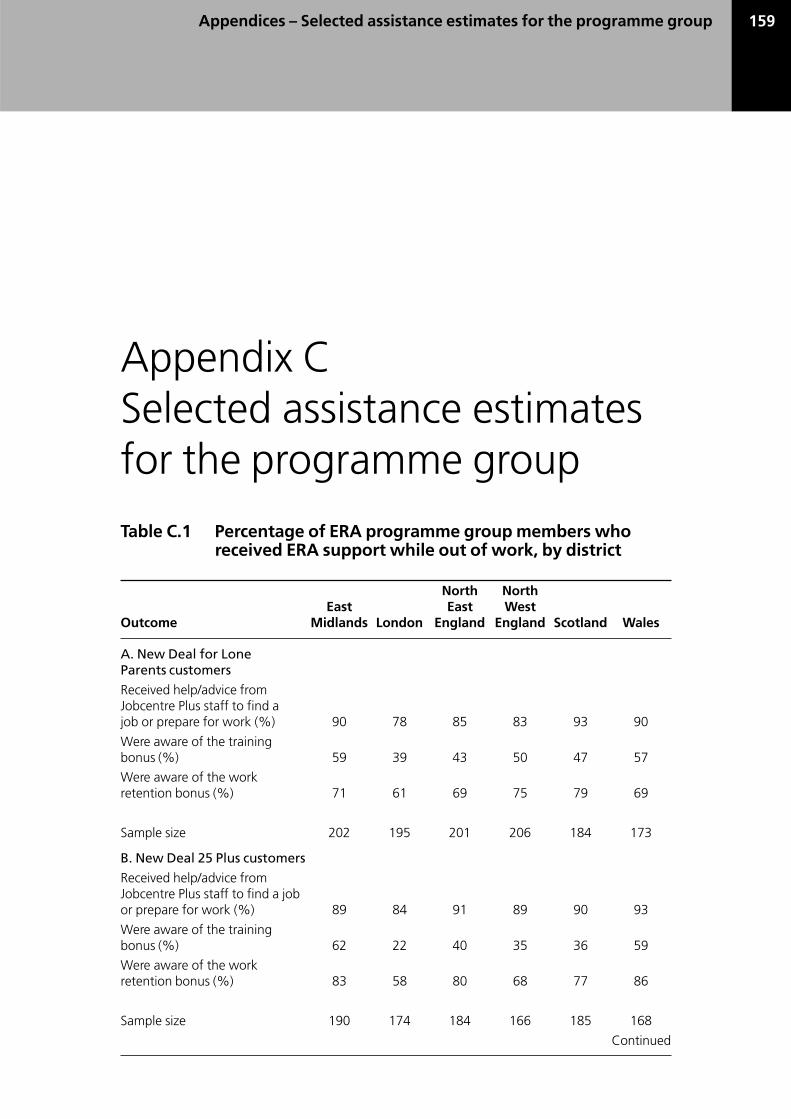
159Appendices – Selected assistance estimates for the programme group
Appendix CSelected assistance estimatesfor the programme group
Table C.1 Percentage of ERA programme group members whoreceived ERA support while out of work, by district
North NorthEast East West
Outcome Midlands London England England Scotland Wales
A. New Deal for LoneParents customers
Received help/advice fromJobcentre Plus staff to find ajob or prepare for work (%) 90 78 85 83 93 90
Were aware of the trainingbonus (%) 59 39 43 50 47 57
Were aware of the workretention bonus (%) 71 61 69 75 79 69
Sample size 202 195 201 206 184 173
B. New Deal 25 Plus customers
Received help/advice fromJobcentre Plus staff to find a jobor prepare for work (%) 89 84 91 89 90 93
Were aware of the trainingbonus (%) 62 22 40 35 36 59
Were aware of the workretention bonus (%) 83 58 80 68 77 86
Sample size 190 174 184 166 185 168
Continued
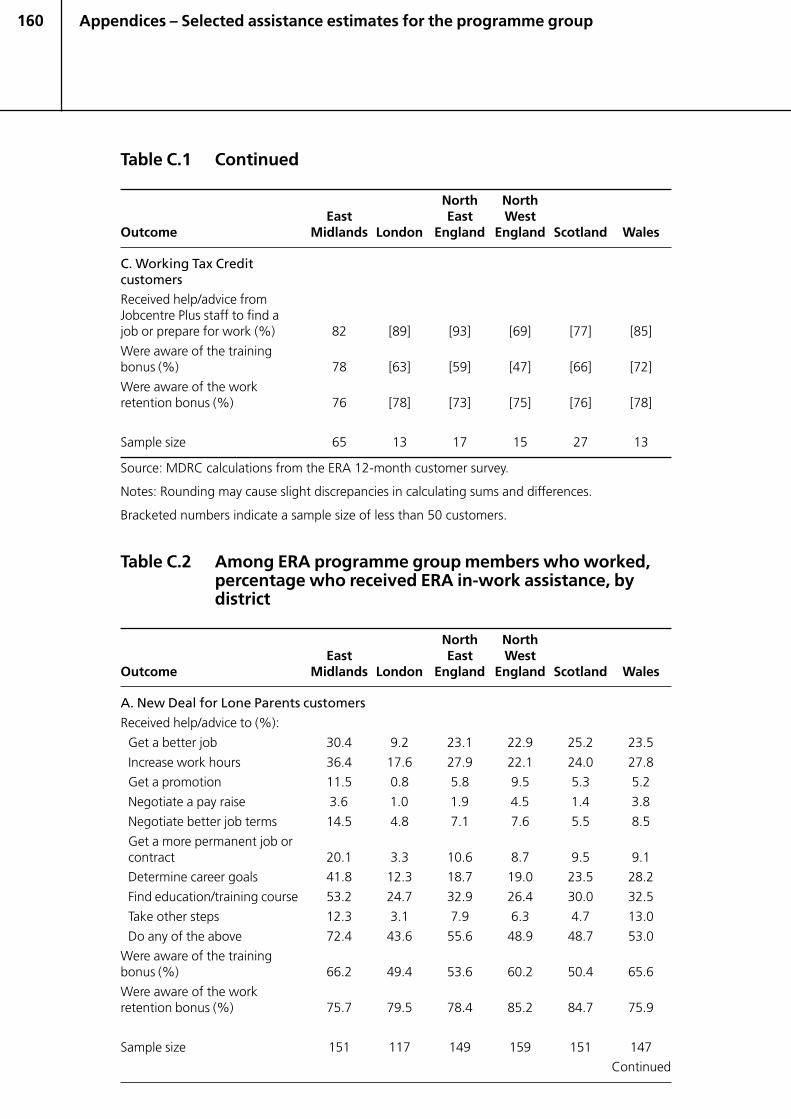
160 Appendices – Selected assistance estimates for the programme group
Table C.1 Continued
North NorthEast East West
Outcome Midlands London England England Scotland Wales
C. Working Tax CreditcustomersReceived help/advice fromJobcentre Plus staff to find ajob or prepare for work (%) 82 [89] [93] [69] [77] [85]
Were aware of the trainingbonus (%) 78 [63] [59] [47] [66] [72]
Were aware of the workretention bonus (%) 76 [78] [73] [75] [76] [78]
Sample size 65 13 17 15 27 13
Source: MDRC calculations from the ERA 12-month customer survey.
Notes: Rounding may cause slight discrepancies in calculating sums and differences.
Bracketed numbers indicate a sample size of less than 50 customers.
Table C.2 Among ERA programme group members who worked,percentage who received ERA in-work assistance, bydistrict
North NorthEast East West
Outcome Midlands London England England Scotland Wales
A. New Deal for Lone Parents customers
Received help/advice to (%):
Get a better job 30.4 9.2 23.1 22.9 25.2 23.5
Increase work hours 36.4 17.6 27.9 22.1 24.0 27.8
Get a promotion 11.5 0.8 5.8 9.5 5.3 5.2
Negotiate a pay raise 3.6 1.0 1.9 4.5 1.4 3.8
Negotiate better job terms 14.5 4.8 7.1 7.6 5.5 8.5
Get a more permanent job orcontract 20.1 3.3 10.6 8.7 9.5 9.1
Determine career goals 41.8 12.3 18.7 19.0 23.5 28.2
Find education/training course 53.2 24.7 32.9 26.4 30.0 32.5
Take other steps 12.3 3.1 7.9 6.3 4.7 13.0
Do any of the above 72.4 43.6 55.6 48.9 48.7 53.0
Were aware of the trainingbonus (%) 66.2 49.4 53.6 60.2 50.4 65.6
Were aware of the workretention bonus (%) 75.7 79.5 78.4 85.2 84.7 75.9
Sample size 151 117 149 159 151 147
Continued
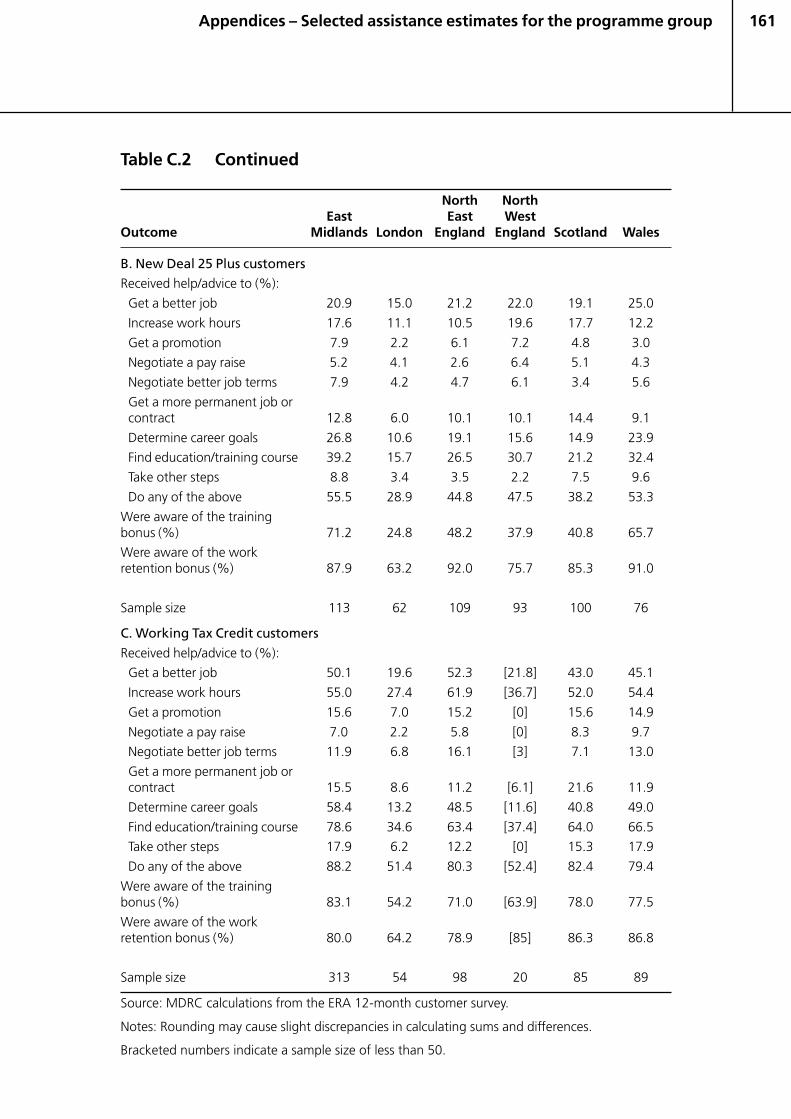
161
Table C.2 Continued
North NorthEast East West
Outcome Midlands London England England Scotland Wales
B. New Deal 25 Plus customersReceived help/advice to (%):
Get a better job 20.9 15.0 21.2 22.0 19.1 25.0
Increase work hours 17.6 11.1 10.5 19.6 17.7 12.2
Get a promotion 7.9 2.2 6.1 7.2 4.8 3.0
Negotiate a pay raise 5.2 4.1 2.6 6.4 5.1 4.3
Negotiate better job terms 7.9 4.2 4.7 6.1 3.4 5.6
Get a more permanent job orcontract 12.8 6.0 10.1 10.1 14.4 9.1
Determine career goals 26.8 10.6 19.1 15.6 14.9 23.9
Find education/training course 39.2 15.7 26.5 30.7 21.2 32.4
Take other steps 8.8 3.4 3.5 2.2 7.5 9.6
Do any of the above 55.5 28.9 44.8 47.5 38.2 53.3
Were aware of the trainingbonus (%) 71.2 24.8 48.2 37.9 40.8 65.7
Were aware of the workretention bonus (%) 87.9 63.2 92.0 75.7 85.3 91.0
Sample size 113 62 109 93 100 76
C. Working Tax Credit customers
Received help/advice to (%):
Get a better job 50.1 19.6 52.3 [21.8] 43.0 45.1
Increase work hours 55.0 27.4 61.9 [36.7] 52.0 54.4
Get a promotion 15.6 7.0 15.2 [0] 15.6 14.9
Negotiate a pay raise 7.0 2.2 5.8 [0] 8.3 9.7
Negotiate better job terms 11.9 6.8 16.1 [3] 7.1 13.0
Get a more permanent job orcontract 15.5 8.6 11.2 [6.1] 21.6 11.9
Determine career goals 58.4 13.2 48.5 [11.6] 40.8 49.0
Find education/training course 78.6 34.6 63.4 [37.4] 64.0 66.5
Take other steps 17.9 6.2 12.2 [0] 15.3 17.9
Do any of the above 88.2 51.4 80.3 [52.4] 82.4 79.4
Were aware of the trainingbonus (%) 83.1 54.2 71.0 [63.9] 78.0 77.5
Were aware of the workretention bonus (%) 80.0 64.2 78.9 [85] 86.3 86.8
Sample size 313 54 98 20 85 89
Source: MDRC calculations from the ERA 12-month customer survey.
Notes: Rounding may cause slight discrepancies in calculating sums and differences.
Bracketed numbers indicate a sample size of less than 50.
Appendices – Selected assistance estimates for the programme group

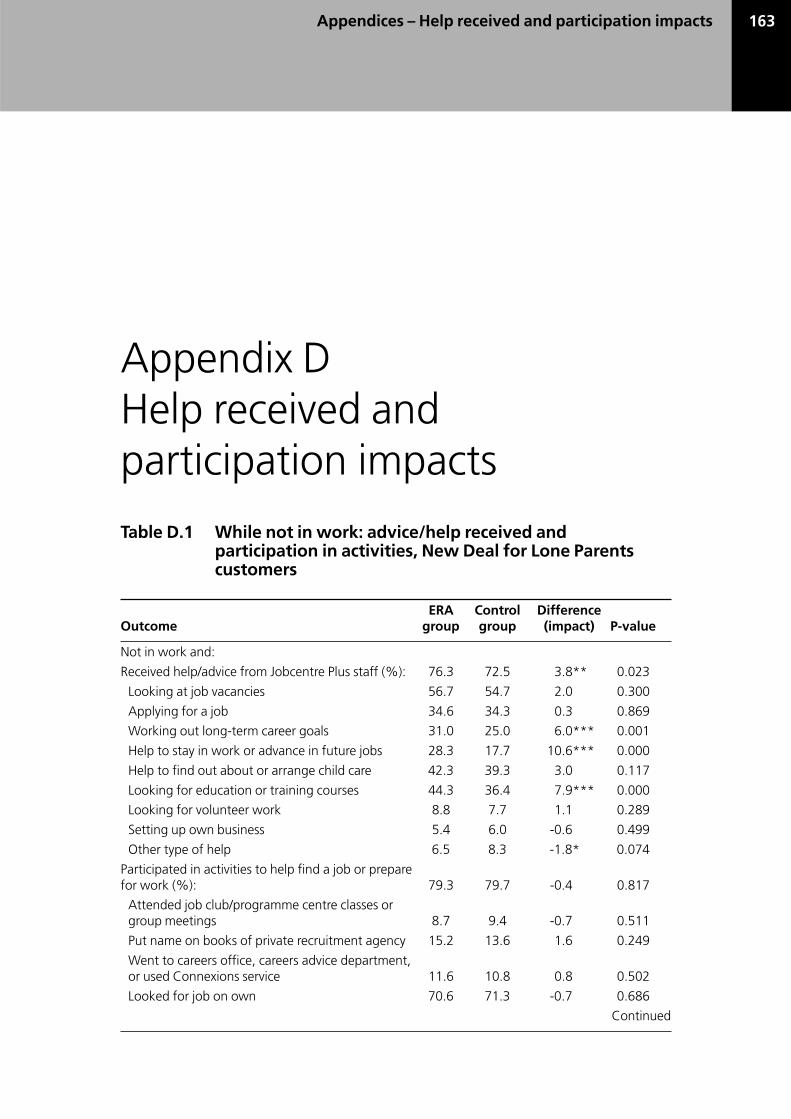
163Appendices – Help received and participation impacts
Appendix DHelp received andparticipation impacts
Table D.1 While not in work: advice/help received andparticipation in activities, New Deal for Lone Parentscustomers
ERA Control DifferenceOutcome group group (impact) P-value
Not in work and:
Received help/advice from Jobcentre Plus staff (%): 76.3 72.5 3.8** 0.023
Looking at job vacancies 56.7 54.7 2.0 0.300
Applying for a job 34.6 34.3 0.3 0.869
Working out long-term career goals 31.0 25.0 6.0*** 0.001
Help to stay in work or advance in future jobs 28.3 17.7 10.6*** 0.000
Help to find out about or arrange child care 42.3 39.3 3.0 0.117
Looking for education or training courses 44.3 36.4 7.9*** 0.000
Looking for volunteer work 8.8 7.7 1.1 0.289
Setting up own business 5.4 6.0 -0.6 0.499
Other type of help 6.5 8.3 -1.8* 0.074
Participated in activities to help find a job or preparefor work (%): 79.3 79.7 -0.4 0.817
Attended job club/programme centre classes orgroup meetings 8.7 9.4 -0.7 0.511
Put name on books of private recruitment agency 15.2 13.6 1.6 0.249
Went to careers office, careers advice department,or used Connexions service 11.6 10.8 0.8 0.502
Looked for job on own 70.6 71.3 -0.7 0.686
Continued
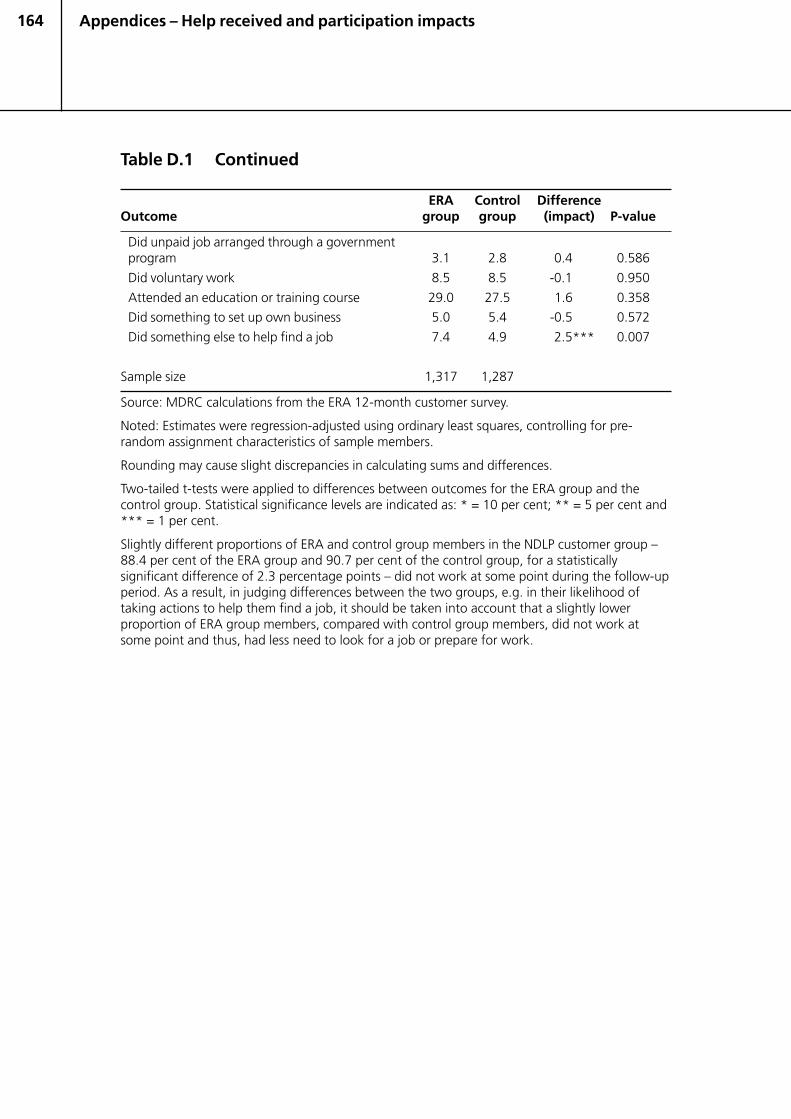
164 Appendices – Help received and participation impacts
Table D.1 Continued
ERA Control DifferenceOutcome group group (impact) P-value
Did unpaid job arranged through a governmentprogram 3.1 2.8 0.4 0.586
Did voluntary work 8.5 8.5 -0.1 0.950
Attended an education or training course 29.0 27.5 1.6 0.358
Did something to set up own business 5.0 5.4 -0.5 0.572
Did something else to help find a job 7.4 4.9 2.5*** 0.007
Sample size 1,317 1,287
Source: MDRC calculations from the ERA 12-month customer survey.
Noted: Estimates were regression-adjusted using ordinary least squares, controlling for pre-random assignment characteristics of sample members.
Rounding may cause slight discrepancies in calculating sums and differences.
Two-tailed t-tests were applied to differences between outcomes for the ERA group and thecontrol group. Statistical significance levels are indicated as: * = 10 per cent; ** = 5 per cent and*** = 1 per cent.
Slightly different proportions of ERA and control group members in the NDLP customer group –88.4 per cent of the ERA group and 90.7 per cent of the control group, for a statisticallysignificant difference of 2.3 percentage points – did not work at some point during the follow-upperiod. As a result, in judging differences between the two groups, e.g. in their likelihood oftaking actions to help them find a job, it should be taken into account that a slightly lowerproportion of ERA group members, compared with control group members, did not work atsome point and thus, had less need to look for a job or prepare for work.
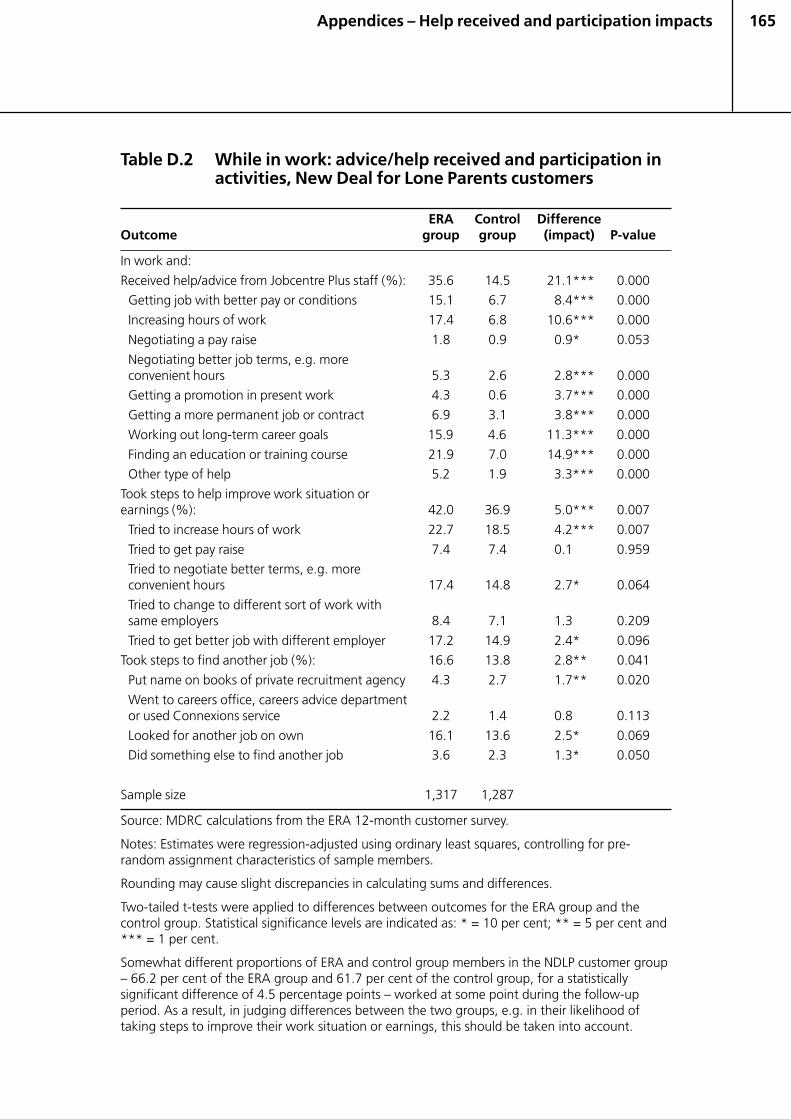
165
Table D.2 While in work: advice/help received and participation inactivities, New Deal for Lone Parents customers
ERA Control DifferenceOutcome group group (impact) P-value
In work and:
Received help/advice from Jobcentre Plus staff (%): 35.6 14.5 21.1*** 0.000
Getting job with better pay or conditions 15.1 6.7 8.4*** 0.000
Increasing hours of work 17.4 6.8 10.6*** 0.000
Negotiating a pay raise 1.8 0.9 0.9* 0.053
Negotiating better job terms, e.g. moreconvenient hours 5.3 2.6 2.8*** 0.000
Getting a promotion in present work 4.3 0.6 3.7*** 0.000
Getting a more permanent job or contract 6.9 3.1 3.8*** 0.000
Working out long-term career goals 15.9 4.6 11.3*** 0.000
Finding an education or training course 21.9 7.0 14.9*** 0.000
Other type of help 5.2 1.9 3.3*** 0.000
Took steps to help improve work situation orearnings (%): 42.0 36.9 5.0*** 0.007
Tried to increase hours of work 22.7 18.5 4.2*** 0.007
Tried to get pay raise 7.4 7.4 0.1 0.959
Tried to negotiate better terms, e.g. moreconvenient hours 17.4 14.8 2.7* 0.064
Tried to change to different sort of work withsame employers 8.4 7.1 1.3 0.209
Tried to get better job with different employer 17.2 14.9 2.4* 0.096
Took steps to find another job (%): 16.6 13.8 2.8** 0.041
Put name on books of private recruitment agency 4.3 2.7 1.7** 0.020
Went to careers office, careers advice departmentor used Connexions service 2.2 1.4 0.8 0.113
Looked for another job on own 16.1 13.6 2.5* 0.069
Did something else to find another job 3.6 2.3 1.3* 0.050
Sample size 1,317 1,287
Source: MDRC calculations from the ERA 12-month customer survey.
Notes: Estimates were regression-adjusted using ordinary least squares, controlling for pre-random assignment characteristics of sample members.
Rounding may cause slight discrepancies in calculating sums and differences.
Two-tailed t-tests were applied to differences between outcomes for the ERA group and thecontrol group. Statistical significance levels are indicated as: * = 10 per cent; ** = 5 per cent and*** = 1 per cent.
Somewhat different proportions of ERA and control group members in the NDLP customer group– 66.2 per cent of the ERA group and 61.7 per cent of the control group, for a statisticallysignificant difference of 4.5 percentage points – worked at some point during the follow-upperiod. As a result, in judging differences between the two groups, e.g. in their likelihood oftaking steps to improve their work situation or earnings, this should be taken into account.
Appendices – Help received and participation impacts
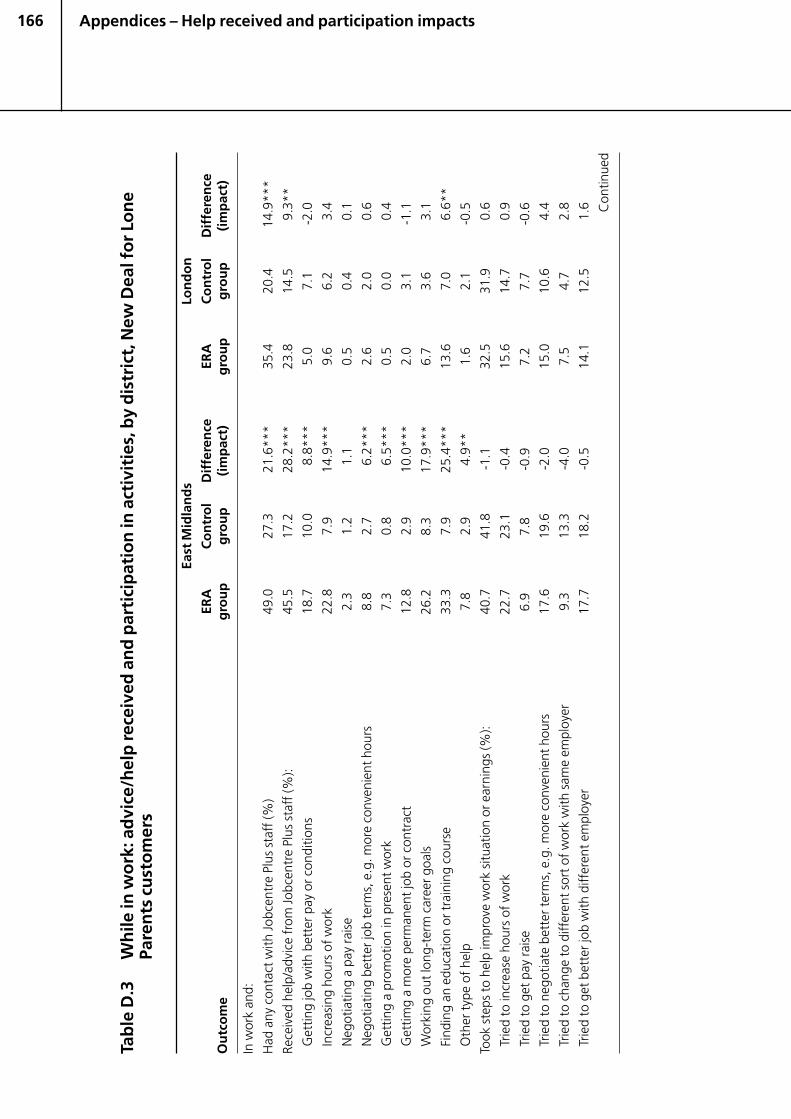
166
Tab
le D
.3W
hile
in w
ork
: ad
vice
/hel
p re
ceiv
ed a
nd
par
tici
pat
ion
in a
ctiv
itie
s, b
y d
istr
ict,
New
Dea
l fo
r Lo
ne
Pare
nts
cu
sto
mer
s
East
Mid
lan
ds
Lon
do
n
ERA
Co
ntr
ol
Dif
fere
nce
ERA
Co
ntr
ol
Dif
fere
nce
Ou
tco
me
gro
up
gro
up
(im
pac
t)g
rou
pg
rou
p(i
mp
act)
In w
ork
and:
Had
any
con
tact
with
Jobc
entr
e Pl
us s
taff
(%)
49.0
27.3
21.6
***
35.4
20.4
14.9
***
Rece
ived
hel
p/ad
vice
from
Jobc
entr
e Pl
us s
taff
(%):
45.5
17.2
28.2
***
23.8
14.5
9.3*
*
Get
ting
job
with
bet
ter p
ay o
r con
ditio
ns18
.710
.08.
8***
5.0
7.1
-2.0
Incr
easi
ng h
ours
of w
ork
22.8
7.9
14.9
***
9.6
6.2
3.4
Neg
otia
ting
a pa
y ra
ise
2.3
1.2
1.1
0.5
0.4
0.1
Neg
otia
ting
bett
er jo
b te
rms,
e.g
. mor
e co
nven
ient
hou
rs8.
82.
76.
2***
2.6
2.0
0.6
Get
ting
a pr
omot
ion
in p
rese
nt w
ork
7.3
0.8
6.5*
**0.
50.
00.
4
Get
timg
a m
ore
perm
anen
t job
or c
ontr
act
12.8
2.9
10.0
***
2.0
3.1
-1.1
Wor
king
out
long
-ter
m c
aree
r goa
ls26
.28.
317
.9**
*6.
73.
63.
1
Find
ing
an e
duca
tion
or tr
aini
ng c
ours
e33
.37.
925
.4**
*13
.67.
06.
6**
Oth
er ty
pe o
f hel
p7.
82.
94.
9**
1.6
2.1
-0.5
Took
ste
ps to
hel
p im
prov
e w
ork
situ
atio
n or
ear
ning
s (%
):40
.741
.8-1
.132
.531
.90.
6
Trie
d to
incr
ease
hou
rs o
f wor
k22
.723
.1-0
.415
.614
.70.
9
Trie
d to
get
pay
rais
e6.
97.
8-0
.97.
27.
7-0
.6
Trie
d to
neg
otia
te b
ette
r ter
ms,
e.g
. mor
e co
nven
ient
hou
rs17
.619
.6-2
.015
.010
.64.
4
Trie
d to
cha
nge
to d
iffer
ent s
ort o
f wor
k w
ith s
ame
empl
oyer
9.3
13.3
-4.0
7.5
4.7
2.8
Trie
d to
get
bet
ter j
ob w
ith d
iffer
ent e
mpl
oyer
17.7
18.2
-0.5
14.1
12.5
1.6 Con
tinue
d
Appendices – Help received and participation impacts
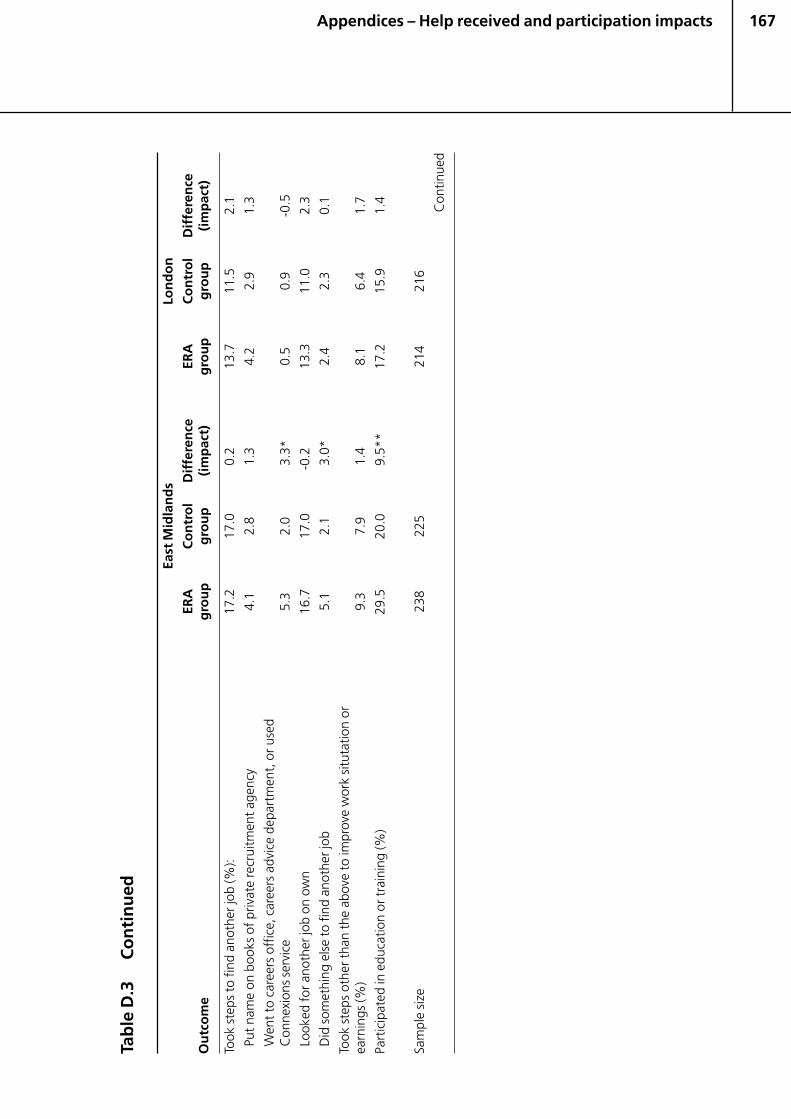
167
Tab
le D
.3C
on
tin
ued
East
Mid
lan
ds
Lon
do
n
ERA
Co
ntr
ol
Dif
fere
nce
ERA
Co
ntr
ol
Dif
fere
nce
Ou
tco
me
gro
up
gro
up
(im
pac
t)g
rou
pg
rou
p(i
mp
act)
Took
ste
ps to
find
ano
ther
job
(%):
17.2
17.0
0.2
13.7
11.5
2.1
Put n
ame
on b
ooks
of p
rivat
e re
crui
tmen
t age
ncy
4.1
2.8
1.3
4.2
2.9
1.3
Wen
t to
care
ers
offic
e, c
aree
rs a
dvic
e de
part
men
t, o
r use
dC
onne
xion
s se
rvic
e5.
32.
03.
3*0.
50.
9-0
.5
Look
ed fo
r ano
ther
job
on o
wn
16.7
17.0
-0.2
13.3
11.0
2.3
Did
som
ethi
ng e
lse
to fi
nd a
noth
er jo
b5.
12.
13.
0*2.
42.
30.
1
Took
ste
ps o
ther
than
the
abov
e to
impr
ove
wor
k si
tuta
tion
orea
rnin
gs (%
)9.
37.
91.
48.
16.
41.
7
Part
icip
ated
in e
duca
tion
or tr
aini
ng (%
)29
.520
.09.
5**
17.2
15.9
1.4
Sam
ple
size
238
225
214
216
Con
tinue
d
Appendices – Help received and participation impacts
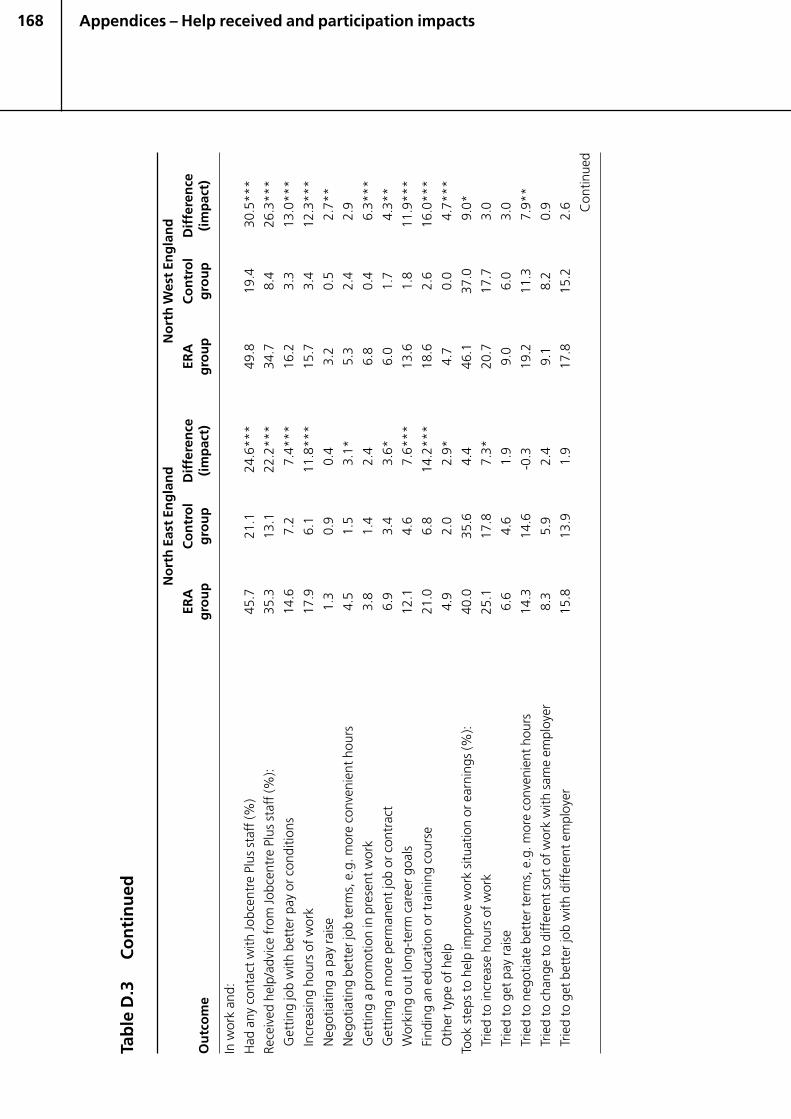
168
Tab
le D
.3C
on
tin
ued
No
rth
Eas
t En
gla
nd
No
rth
Wes
t En
gla
nd
ERA
Co
ntr
ol
Dif
fere
nce
ERA
Co
ntr
ol
Dif
fere
nce
Ou
tco
me
gro
up
gro
up
(im
pac
t)g
rou
pg
rou
p(i
mp
act)
In w
ork
and:
Had
any
con
tact
with
Jobc
entr
e Pl
us s
taff
(%)
45.7
21.1
24.6
***
49.8
19.4
30.5
***
Rece
ived
hel
p/ad
vice
from
Jobc
entr
e Pl
us s
taff
(%):
35.3
13.1
22.2
***
34.7
8.4
26.3
***
Get
ting
job
with
bet
ter p
ay o
r con
ditio
ns14
.67.
27.
4***
16.2
3.3
13.0
***
Incr
easi
ng h
ours
of w
ork
17.9
6.1
11.8
***
15.7
3.4
12.3
***
Neg
otia
ting
a pa
y ra
ise
1.3
0.9
0.4
3.2
0.5
2.7*
*
Neg
otia
ting
bett
er jo
b te
rms,
e.g
. mor
e co
nven
ient
hou
rs4.
51.
53.
1*5.
32.
42.
9
Get
ting
a pr
omot
ion
in p
rese
nt w
ork
3.8
1.4
2.4
6.8
0.4
6.3*
**
Get
timg
a m
ore
perm
anen
t job
or c
ontr
act
6.9
3.4
3.6*
6.0
1.7
4.3*
*
Wor
king
out
long
-ter
m c
aree
r goa
ls12
.14.
67.
6***
13.6
1.8
11.9
***
Find
ing
an e
duca
tion
or tr
aini
ng c
ours
e21
.06.
814
.2**
*18
.62.
616
.0**
*
Oth
er ty
pe o
f hel
p4.
92.
02.
9*4.
70.
04.
7***
Took
ste
ps to
hel
p im
prov
e w
ork
situ
atio
n or
ear
ning
s (%
):40
.035
.64.
446
.137
.09.
0*
Trie
d to
incr
ease
hou
rs o
f wor
k25
.117
.87.
3*20
.717
.73.
0
Trie
d to
get
pay
rai
se6.
64.
61.
99.
06.
03.
0
Trie
d to
neg
otia
te b
ette
r ter
ms,
e.g
. mor
e co
nven
ient
hou
rs14
.314
.6-0
.319
.211
.37.
9**
Trie
d to
cha
nge
to d
iffer
ent s
ort o
f wor
k w
ith s
ame
empl
oyer
8.3
5.9
2.4
9.1
8.2
0.9
Trie
d to
get
bet
ter j
ob w
ith d
iffer
ent e
mpl
oyer
15.8
13.9
1.9
17.8
15.2
2.6 Con
tinue
d
Appendices – Help received and participation impacts
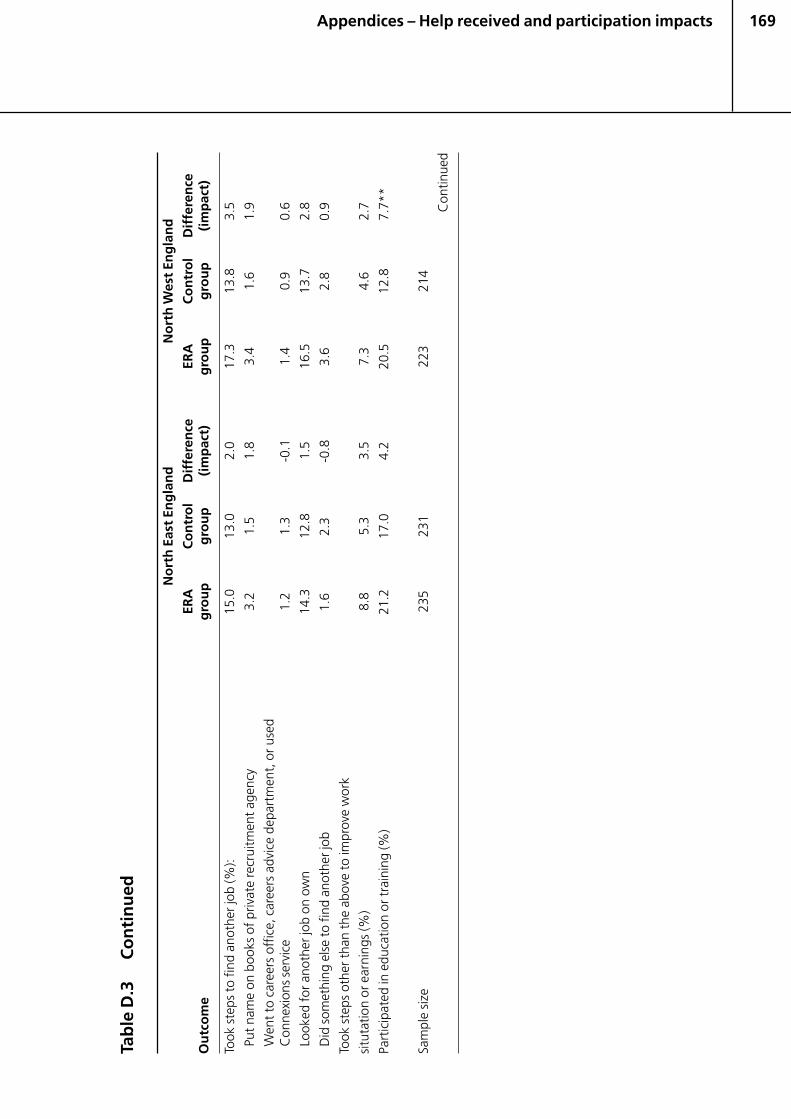
169
Tab
le D
.3C
on
tin
ued
No
rth
Eas
t En
gla
nd
No
rth
Wes
t En
gla
nd
ERA
Co
ntr
ol
Dif
fere
nce
ERA
Co
ntr
ol
Dif
fere
nce
Ou
tco
me
gro
up
gro
up
(im
pac
t)g
rou
pg
rou
p(i
mp
act)
Took
ste
ps to
find
ano
ther
job
(%):
15.0
13.0
2.0
17.3
13.8
3.5
Put n
ame
on b
ooks
of p
rivat
e re
crui
tmen
t age
ncy
3.2
1.5
1.8
3.4
1.6
1.9
Wen
t to
care
ers
offic
e, c
aree
rs a
dvic
e de
part
men
t, o
r use
dC
onne
xion
s se
rvic
e1.
21.
3-0
.11.
40.
90.
6
Look
ed fo
r ano
ther
job
on o
wn
14.3
12.8
1.5
16.5
13.7
2.8
Did
som
ethi
ng e
lse
to fi
nd a
noth
er jo
b1.
62.
3-0
.83.
62.
80.
9
Took
ste
ps o
ther
than
the
abov
e to
impr
ove
wor
k
situ
tatio
n or
ear
ning
s (%
)8.
85.
33.
57.
34.
62.
7
Part
icip
ated
in e
duca
tion
or tr
aini
ng (%
)21
.217
.04.
220
.512
.87.
7**
Sam
ple
size
235
231
223
214
Con
tinue
d
Appendices – Help received and participation impacts
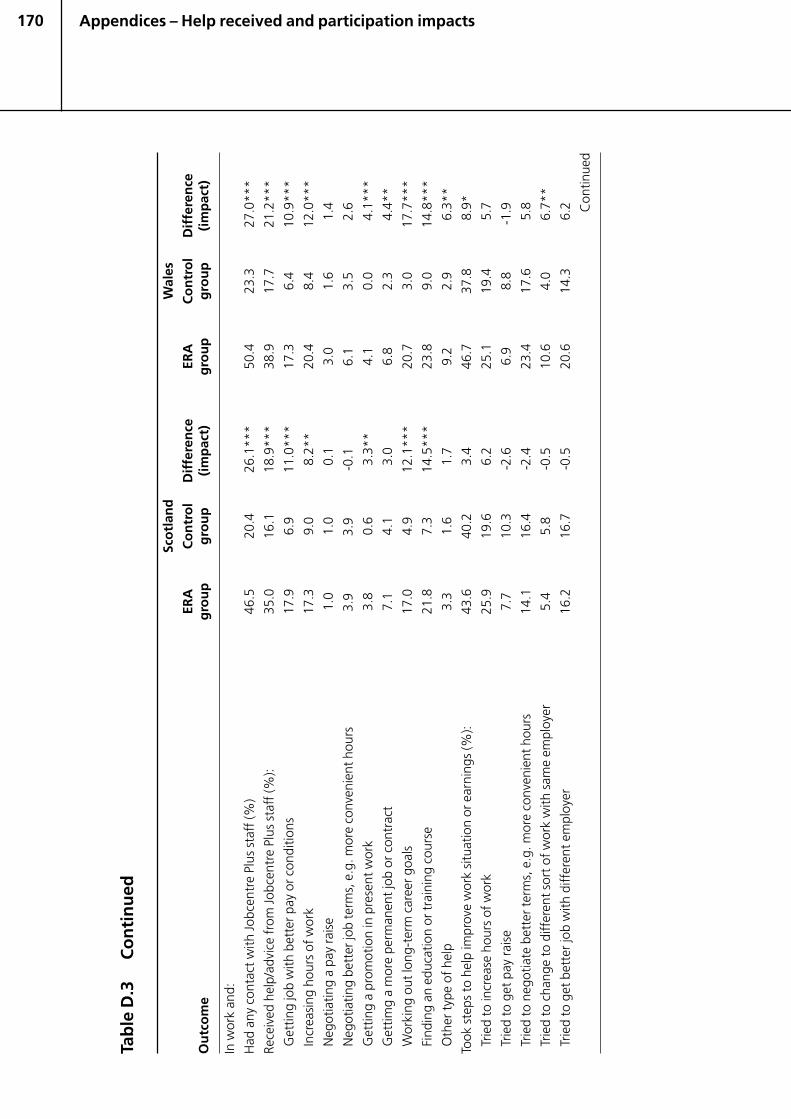
170
Tab
le D
.3C
on
tin
ued
Sco
tlan
dW
ales
ERA
Co
ntr
ol
Dif
fere
nce
ERA
Co
ntr
ol
Dif
fere
nce
Ou
tco
me
gro
up
gro
up
(im
pac
t)g
rou
pg
rou
p(i
mp
act)
In w
ork
and:
Had
any
con
tact
with
Jobc
entr
e Pl
us s
taff
(%)
46.5
20.4
26.1
***
50.4
23.3
27.0
***
Rece
ived
hel
p/ad
vice
from
Jobc
entr
e Pl
us s
taff
(%):
35.0
16.1
18.9
***
38.9
17.7
21.2
***
Get
ting
job
with
bet
ter p
ay o
r con
ditio
ns17
.96.
911
.0**
*17
.36.
410
.9**
*
Incr
easi
ng h
ours
of w
ork
17.3
9.0
8.2*
*20
.48.
412
.0**
*
Neg
otia
ting
a pa
y ra
ise
1.0
1.0
0.1
3.0
1.6
1.4
Neg
otia
ting
bett
er jo
b te
rms,
e.g
. mor
e co
nven
ient
hou
rs3.
93.
9-0
.16.
13.
52.
6
Get
ting
a pr
omot
ion
in p
rese
nt w
ork
3.8
0.6
3.3*
*4.
10.
04.
1***
Get
timg
a m
ore
perm
anen
t job
or c
ontr
act
7.1
4.1
3.0
6.8
2.3
4.4*
*
Wor
king
out
long
-ter
m c
aree
r goa
ls17
.04.
912
.1**
*20
.73.
017
.7**
*
Find
ing
an e
duca
tion
or tr
aini
ng c
ours
e21
.87.
314
.5**
*23
.89.
014
.8**
*
Oth
er ty
pe o
f hel
p3.
31.
61.
79.
22.
96.
3**
Took
ste
ps to
hel
p im
prov
e w
ork
situ
atio
n or
ear
ning
s (%
):43
.640
.23.
446
.737
.88.
9*
Trie
d to
incr
ease
hou
rs o
f wor
k25
.919
.66.
225
.119
.45.
7
Trie
d to
get
pay
rai
se7.
710
.3-2
.66.
98.
8-1
.9
Trie
d to
neg
otia
te b
ette
r ter
ms,
e.g
. mor
e co
nven
ient
hou
rs14
.116
.4-2
.423
.417
.65.
8
Trie
d to
cha
nge
to d
iffer
ent s
ort o
f wor
k w
ith s
ame
empl
oyer
5.4
5.8
-0.5
10.6
4.0
6.7*
*
Trie
d to
get
bet
ter j
ob w
ith d
iffer
ent e
mpl
oyer
16.2
16.7
-0.5
20.6
14.3
6.2 Con
tinue
d
Appendices – Help received and participation impacts
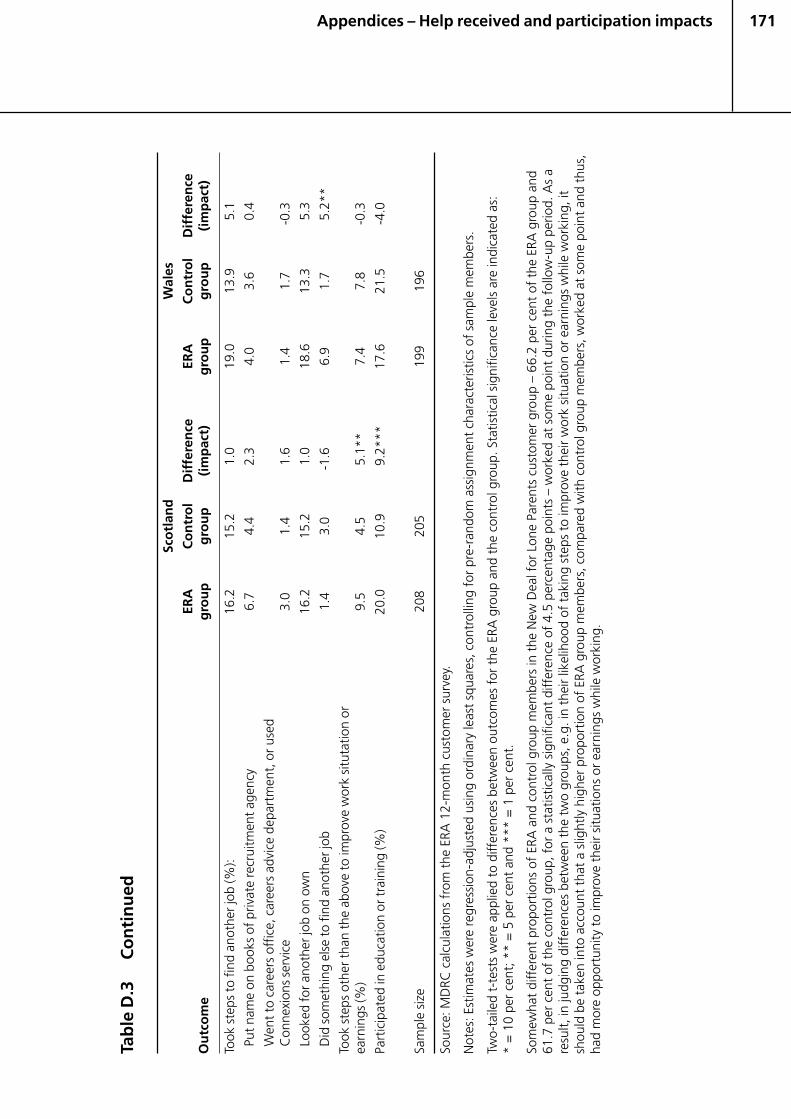
171
Tab
le D
.3C
on
tin
ued
Sco
tlan
dW
ales
ERA
Co
ntr
ol
Dif
fere
nce
ERA
Co
ntr
ol
Dif
fere
nce
Ou
tco
me
gro
up
gro
up
(im
pac
t)g
rou
pg
rou
p(i
mp
act)
Took
ste
ps to
find
ano
ther
job
(%):
16.2
15.2
1.0
19.0
13.9
5.1
Put n
ame
on b
ooks
of p
rivat
e re
crui
tmen
t age
ncy
6.7
4.4
2.3
4.0
3.6
0.4
Wen
t to
care
ers
offic
e, c
aree
rs a
dvic
e de
part
men
t, o
r use
dC
onne
xion
s se
rvic
e3.
01.
41.
61.
41.
7-0
.3
Look
ed fo
r ano
ther
job
on o
wn
16.2
15.2
1.0
18.6
13.3
5.3
Did
som
ethi
ng e
lse
to fi
nd a
noth
er jo
b1.
43.
0-1
.66.
91.
75.
2**
Took
ste
ps o
ther
than
the
abov
e to
impr
ove
wor
k si
tuta
tion
orea
rnin
gs (%
)9.
54.
55.
1**
7.4
7.8
-0.3
Part
icip
ated
in e
duca
tion
or tr
aini
ng (%
)20
.010
.99.
2***
17.6
21.5
-4.0
Sam
ple
size
208
205
199
196
Sour
ce: M
DRC
cal
cula
tions
fro
m t
he E
RA 1
2-m
onth
cus
tom
er s
urve
y.
Not
es: E
stim
ates
wer
e re
gres
sion
-adj
uste
d us
ing
ordi
nary
leas
t sq
uare
s, c
ontr
ollin
g fo
r pr
e-ra
ndom
ass
ignm
ent
char
acte
ristic
s of
sam
ple
mem
bers
.
Two-
taile
d t-
test
s w
ere
appl
ied
to d
iffer
ence
s be
twee
n ou
tcom
es f
or t
he E
RA g
roup
and
the
con
trol
gro
up. S
tatis
tical
sig
nific
ance
leve
ls a
re in
dica
ted
as:
* =
10
per
cent
; **
= 5
per
cen
t an
d **
* =
1 p
er c
ent.
Som
ewha
t di
ffer
ent
prop
ortio
ns o
f ER
A a
nd c
ontr
ol g
roup
mem
bers
in t
he N
ew D
eal f
or L
one
Pare
nts
cust
omer
gro
up –
66.
2 pe
r ce
nt o
f th
e ER
A g
roup
and
61.7
per
cen
t of
the
con
trol
gro
up, f
or a
sta
tistic
ally
sig
nific
ant
diff
eren
ce o
f 4.
5 pe
rcen
tage
poi
nts
– w
orke
d at
som
e po
int
durin
g th
e fo
llow
-up
perio
d. A
s a
resu
lt, in
judg
ing
diff
eren
ces
betw
een
the
two
grou
ps, e
.g. i
n th
eir
likel
ihoo
d of
tak
ing
step
s to
impr
ove
thei
r w
ork
situ
atio
n or
ear
ning
s w
hile
wor
king
, it
shou
ld b
e ta
ken
into
acc
ount
tha
t a
slig
htly
hig
her
prop
ortio
n of
ERA
gro
up m
embe
rs, c
ompa
red
with
con
trol
gro
up m
embe
rs, w
orke
d at
som
e po
int
and
thus
,ha
d m
ore
oppo
rtun
ity t
o im
prov
e th
eir
situ
atio
ns o
r ea
rnin
gs w
hile
wor
king
.
Appendices – Help received and participation impacts
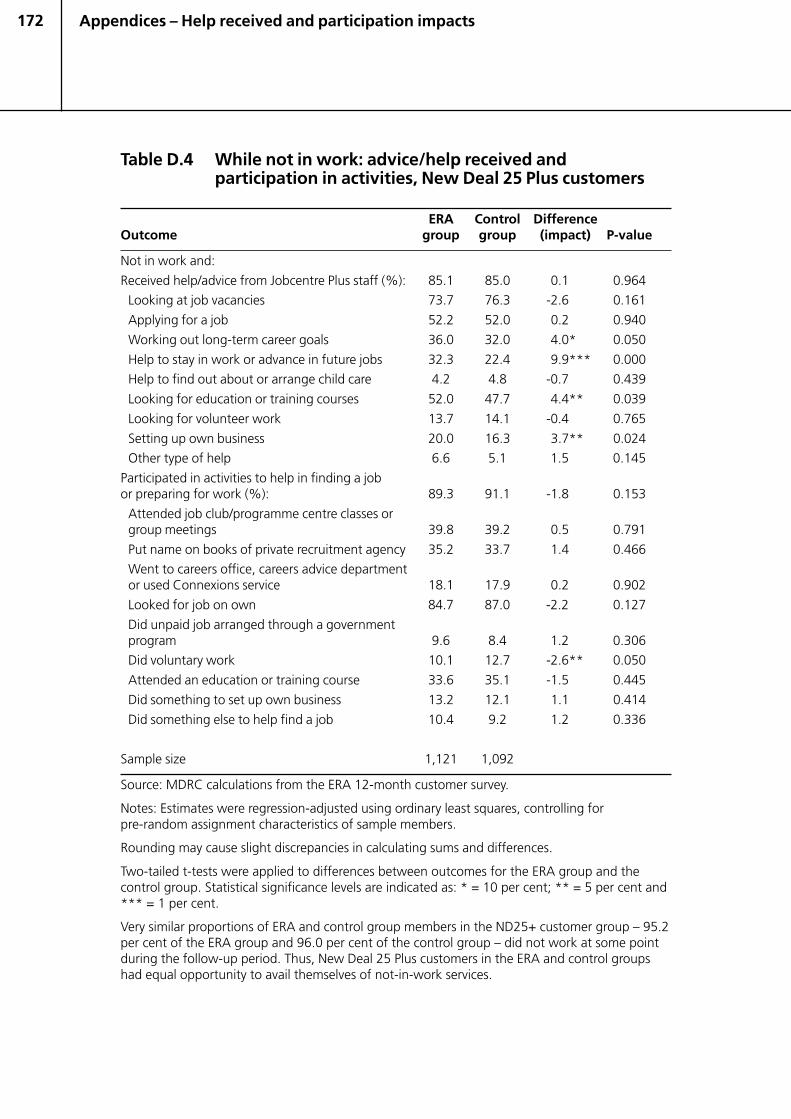
172
Table D.4 While not in work: advice/help received andparticipation in activities, New Deal 25 Plus customers
ERA Control DifferenceOutcome group group (impact) P-value
Not in work and:
Received help/advice from Jobcentre Plus staff (%): 85.1 85.0 0.1 0.964
Looking at job vacancies 73.7 76.3 -2.6 0.161
Applying for a job 52.2 52.0 0.2 0.940
Working out long-term career goals 36.0 32.0 4.0* 0.050
Help to stay in work or advance in future jobs 32.3 22.4 9.9*** 0.000
Help to find out about or arrange child care 4.2 4.8 -0.7 0.439
Looking for education or training courses 52.0 47.7 4.4** 0.039
Looking for volunteer work 13.7 14.1 -0.4 0.765
Setting up own business 20.0 16.3 3.7** 0.024
Other type of help 6.6 5.1 1.5 0.145
Participated in activities to help in finding a jobor preparing for work (%): 89.3 91.1 -1.8 0.153
Attended job club/programme centre classes orgroup meetings 39.8 39.2 0.5 0.791
Put name on books of private recruitment agency 35.2 33.7 1.4 0.466
Went to careers office, careers advice departmentor used Connexions service 18.1 17.9 0.2 0.902
Looked for job on own 84.7 87.0 -2.2 0.127
Did unpaid job arranged through a governmentprogram 9.6 8.4 1.2 0.306
Did voluntary work 10.1 12.7 -2.6** 0.050
Attended an education or training course 33.6 35.1 -1.5 0.445
Did something to set up own business 13.2 12.1 1.1 0.414
Did something else to help find a job 10.4 9.2 1.2 0.336
Sample size 1,121 1,092
Source: MDRC calculations from the ERA 12-month customer survey.
Notes: Estimates were regression-adjusted using ordinary least squares, controlling forpre-random assignment characteristics of sample members.
Rounding may cause slight discrepancies in calculating sums and differences.
Two-tailed t-tests were applied to differences between outcomes for the ERA group and thecontrol group. Statistical significance levels are indicated as: * = 10 per cent; ** = 5 per cent and*** = 1 per cent.
Very similar proportions of ERA and control group members in the ND25+ customer group – 95.2per cent of the ERA group and 96.0 per cent of the control group – did not work at some pointduring the follow-up period. Thus, New Deal 25 Plus customers in the ERA and control groupshad equal opportunity to avail themselves of not-in-work services.
Appendices – Help received and participation impacts
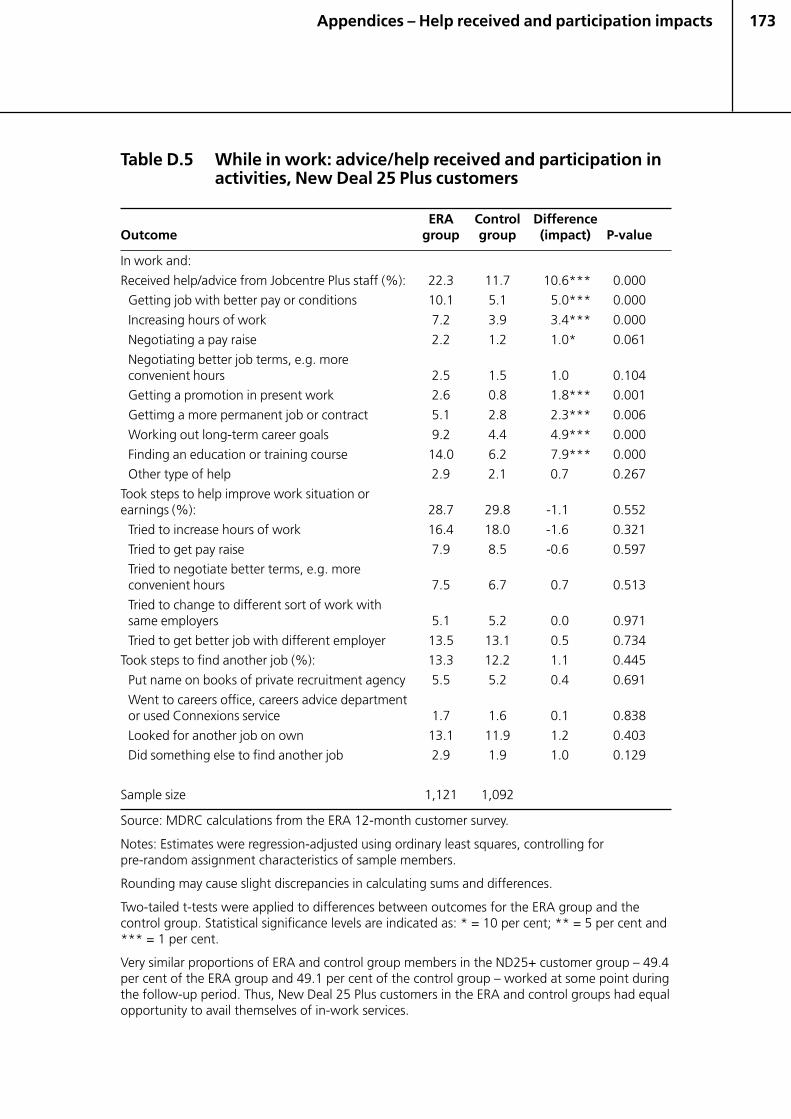
173
Table D.5 While in work: advice/help received and participation inactivities, New Deal 25 Plus customers
ERA Control DifferenceOutcome group group (impact) P-value
In work and:
Received help/advice from Jobcentre Plus staff (%): 22.3 11.7 10.6*** 0.000
Getting job with better pay or conditions 10.1 5.1 5.0*** 0.000
Increasing hours of work 7.2 3.9 3.4*** 0.000
Negotiating a pay raise 2.2 1.2 1.0* 0.061
Negotiating better job terms, e.g. moreconvenient hours 2.5 1.5 1.0 0.104
Getting a promotion in present work 2.6 0.8 1.8*** 0.001
Gettimg a more permanent job or contract 5.1 2.8 2.3*** 0.006
Working out long-term career goals 9.2 4.4 4.9*** 0.000
Finding an education or training course 14.0 6.2 7.9*** 0.000
Other type of help 2.9 2.1 0.7 0.267
Took steps to help improve work situation orearnings (%): 28.7 29.8 -1.1 0.552
Tried to increase hours of work 16.4 18.0 -1.6 0.321
Tried to get pay raise 7.9 8.5 -0.6 0.597
Tried to negotiate better terms, e.g. moreconvenient hours 7.5 6.7 0.7 0.513
Tried to change to different sort of work withsame employers 5.1 5.2 0.0 0.971
Tried to get better job with different employer 13.5 13.1 0.5 0.734
Took steps to find another job (%): 13.3 12.2 1.1 0.445
Put name on books of private recruitment agency 5.5 5.2 0.4 0.691
Went to careers office, careers advice departmentor used Connexions service 1.7 1.6 0.1 0.838
Looked for another job on own 13.1 11.9 1.2 0.403
Did something else to find another job 2.9 1.9 1.0 0.129
Sample size 1,121 1,092
Source: MDRC calculations from the ERA 12-month customer survey.
Notes: Estimates were regression-adjusted using ordinary least squares, controlling forpre-random assignment characteristics of sample members.
Rounding may cause slight discrepancies in calculating sums and differences.
Two-tailed t-tests were applied to differences between outcomes for the ERA group and thecontrol group. Statistical significance levels are indicated as: * = 10 per cent; ** = 5 per cent and*** = 1 per cent.
Very similar proportions of ERA and control group members in the ND25+ customer group – 49.4per cent of the ERA group and 49.1 per cent of the control group – worked at some point duringthe follow-up period. Thus, New Deal 25 Plus customers in the ERA and control groups had equalopportunity to avail themselves of in-work services.
Appendices – Help received and participation impacts
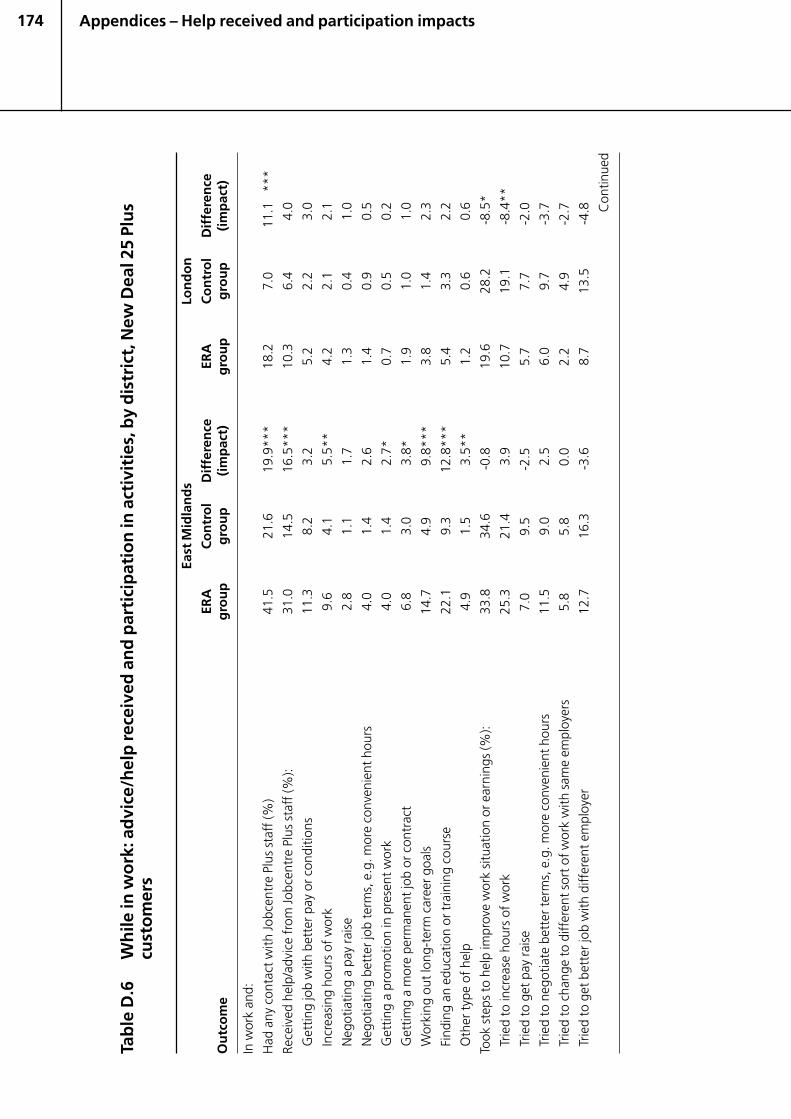
174
Tab
le D
.6W
hile
in w
ork
: ad
vice
/hel
p re
ceiv
ed a
nd
par
tici
pat
ion
in a
ctiv
itie
s, b
y d
istr
ict,
New
Dea
l 25
Plu
scu
sto
mer
s
East
Mid
lan
ds
Lon
do
n
ERA
Co
ntr
ol
Dif
fere
nce
ERA
Co
ntr
ol
Dif
fere
nce
Ou
tco
me
gro
up
gro
up
(im
pac
t)g
rou
pg
rou
p(i
mp
act)
In w
ork
and:
Had
any
con
tact
with
Jobc
entr
e Pl
us s
taff
(%)
41.5
21.6
19.9
***
18.2
7.0
11.1
***
Rece
ived
hel
p/ad
vice
from
Jobc
entr
e Pl
us s
taff
(%):
31.0
14.5
16.5
***
10.3
6.4
4.0
Get
ting
job
with
bet
ter p
ay o
r con
ditio
ns11
.38.
23.
25.
22.
23.
0
Incr
easi
ng h
ours
of w
ork
9.6
4.1
5.5*
*4.
22.
12.
1
Neg
otia
ting
a pa
y ra
ise
2.8
1.1
1.7
1.3
0.4
1.0
Neg
otia
ting
bett
er jo
b te
rms,
e.g
. mor
e co
nven
ient
hou
rs4.
01.
42.
61.
40.
90.
5
Get
ting
a pr
omot
ion
in p
rese
nt w
ork
4.0
1.4
2.7*
0.7
0.5
0.2
Get
timg
a m
ore
perm
anen
t job
or c
ontr
act
6.8
3.0
3.8*
1.9
1.0
1.0
Wor
king
out
long
-ter
m c
aree
r goa
ls14
.74.
99.
8***
3.8
1.4
2.3
Find
ing
an e
duca
tion
or tr
aini
ng c
ours
e22
.19.
312
.8**
*5.
43.
32.
2
Oth
er ty
pe o
f hel
p4.
91.
53.
5**
1.2
0.6
0.6
Took
ste
ps to
hel
p im
prov
e w
ork
situ
atio
n or
ear
ning
s (%
):33
.834
.6-0
.819
.628
.2-8
.5*
Trie
d to
incr
ease
hou
rs o
f wor
k25
.321
.43.
910
.719
.1-8
.4**
Trie
d to
get
pay
rais
e7.
09.
5-2
.55.
77.
7-2
.0
Trie
d to
neg
otia
te b
ette
r ter
ms,
e.g
. mor
e co
nven
ient
hou
rs11
.59.
02.
56.
09.
7-3
.7
Trie
d to
cha
nge
to d
iffer
ent s
ort o
f wor
k w
ith s
ame
empl
oyer
s5.
85.
80.
02.
24.
9-2
.7
Trie
d to
get
bet
ter j
ob w
ith d
iffer
ent e
mpl
oyer
12.7
16.3
-3.6
8.7
13.5
-4.8 C
ontin
ued
Appendices – Help received and participation impacts
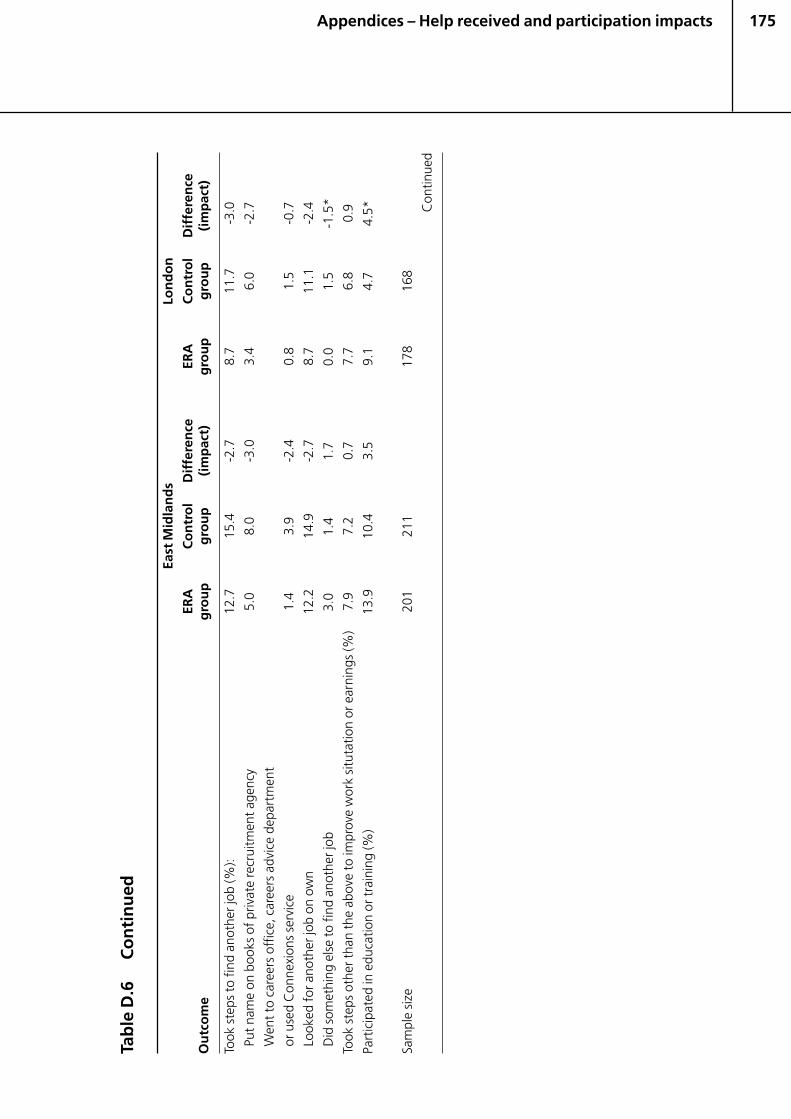
175
Tab
le D
.6C
on
tin
ued
East
Mid
lan
ds
Lon
do
n
ERA
Co
ntr
ol
Dif
fere
nce
ERA
Co
ntr
ol
Dif
fere
nce
Ou
tco
me
gro
up
gro
up
(im
pac
t)g
rou
pg
rou
p(i
mp
act)
Took
ste
ps to
find
ano
ther
job
(%):
12.7
15.4
-2.7
8.7
11.7
-3.0
Put n
ame
on b
ooks
of p
rivat
e re
crui
tmen
t age
ncy
5.0
8.0
-3.0
3.4
6.0
-2.7
Wen
t to
car
eers
off
ice,
car
eers
adv
ice
depa
rtm
ent
or u
sed
Con
nexi
ons
serv
ice
1.4
3.9
-2.4
0.8
1.5
-0.7
Look
ed fo
r ano
ther
job
on o
wn
12.2
14.9
-2.7
8.7
11.1
-2.4
Did
som
ethi
ng e
lse
to fi
nd a
noth
er jo
b3.
01.
41.
70.
01.
5-1
.5*
Took
ste
ps o
ther
than
the
abov
e to
impr
ove
wor
k si
tuta
tion
or e
arni
ngs
(%)
7.9
7.2
0.7
7.7
6.8
0.9
Part
icip
ated
in e
duca
tion
or tr
aini
ng (%
)13
.910
.43.
59.
14.
74.
5*
Sam
ple
size
201
211
178
168
Con
tinue
d
Appendices – Help received and participation impacts

176
Tab
le D
.6C
on
tin
ued
No
rth
Eas
t En
gla
nd
No
rth
Wes
t En
gla
nd
ERA
Co
ntr
ol
Dif
fere
nce
ERA
Co
ntr
ol
Dif
fere
nce
Ou
tco
me
gro
up
gro
up
(im
pac
t)g
rou
pg
rou
p(i
mp
act)
In w
ork
and:
Had
any
con
tact
with
Jobc
entr
e Pl
us s
taff
(%)
36.4
13.1
23.3
***
30.6
7.6
23.1
***
Rece
ived
hel
p/ad
vice
from
Jobc
entr
e Pl
us s
taff
(%):
24.1
13.7
10.4
***
25.0
12.2
12.8
***
Get
ting
job
with
bet
ter p
ay o
r con
ditio
ns11
.45.
36.
1**
11.4
4.2
7.2*
*
Incr
easi
ng h
ours
of w
ork
5.2
3.9
1.4
10.4
5.3
5.2*
Neg
otia
ting
a pa
y ra
ise
1.4
0.6
0.8
3.2
1.5
1.7
Neg
otia
ting
bett
er jo
b te
rms,
e.g
. mor
e co
nven
ient
hou
rs2.
41.
70.
73.
42.
50.
9
Get
ting
a pr
omot
ion
in p
rese
nt w
ork
3.4
1.1
2.3
4.2
0.0
4.2*
**
Get
ting
a m
ore
perm
anen
t job
or c
ontr
act
5.3
5.3
0.1
5.7
2.4
3.4
Wor
king
out
long
-ter
m c
aree
r goa
ls10
.35.
44.
9*8.
14.
73.
5
Find
ing
an e
duca
tion
or tr
aini
ng c
ours
e14
.87.
47.
4**
15.9
7.3
8.6*
*
Oth
er ty
pe o
f hel
p2.
01.
50.
51.
11.
9-0
.8
Took
ste
ps to
hel
p im
prov
e w
ork
situ
atio
n or
ear
ning
s (%
):30
.033
.1-3
.131
.026
.54.
4
Trie
d to
incr
ease
hou
rs o
f wor
k15
.916
.2-0
.215
.716
.1-0
.3
Trie
d to
get
pay
rai
se8.
76.
32.
411
.310
.40.
9
Trie
d to
neg
otia
te b
ette
r ter
ms,
e.g
. mor
e co
nven
ient
hou
rs5.
24.
40.
811
.16.
44.
6
Trie
d to
cha
nge
to d
iffer
ent s
ort o
f wor
k w
ith s
ame
empl
oyer
s4.
46.
6-2
.25.
37.
2-1
.9
Trie
d to
get
bet
ter j
ob w
ith d
iffer
ent e
mpl
oyer
12.5
17.1
-4.6
15.8
8.6
7.2*
*
Con
tinue
d
Appendices – Help received and participation impacts
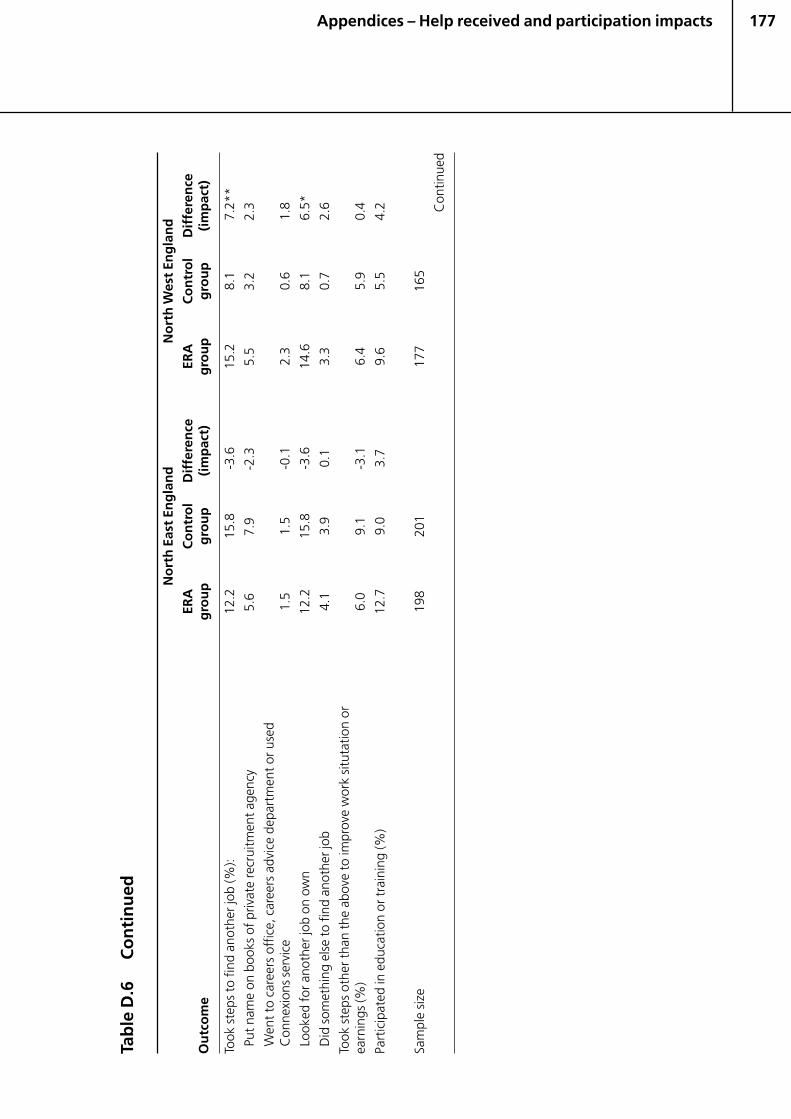
177
Tab
le D
.6C
on
tin
ued
No
rth
Eas
t En
gla
nd
No
rth
Wes
t En
gla
nd
ERA
Co
ntr
ol
Dif
fere
nce
ERA
Co
ntr
ol
Dif
fere
nce
Ou
tco
me
gro
up
gro
up
(im
pac
t)g
rou
pg
rou
p(i
mp
act)
Took
ste
ps to
find
ano
ther
job
(%):
12.2
15.8
-3.6
15.2
8.1
7.2*
*
Put n
ame
on b
ooks
of p
rivat
e re
crui
tmen
t age
ncy
5.6
7.9
-2.3
5.5
3.2
2.3
Wen
t to
care
ers
offic
e, c
aree
rs a
dvic
e de
part
men
t or u
sed
Con
nexi
ons
serv
ice
1.5
1.5
-0.1
2.3
0.6
1.8
Look
ed fo
r ano
ther
job
on o
wn
12.2
15.8
-3.6
14.6
8.1
6.5*
Did
som
ethi
ng e
lse
to fi
nd a
noth
er jo
b4.
13.
90.
13.
30.
72.
6
Took
ste
ps o
ther
than
the
abov
e to
impr
ove
wor
k si
tuta
tion
orea
rnin
gs (%
)6.
09.
1-3
.16.
45.
90.
4
Part
icip
ated
in e
duca
tion
or tr
aini
ng (%
)12
.79.
03.
79.
65.
54.
2
Sam
ple
size
198
201
177
165
Con
tinue
d
Appendices – Help received and participation impacts
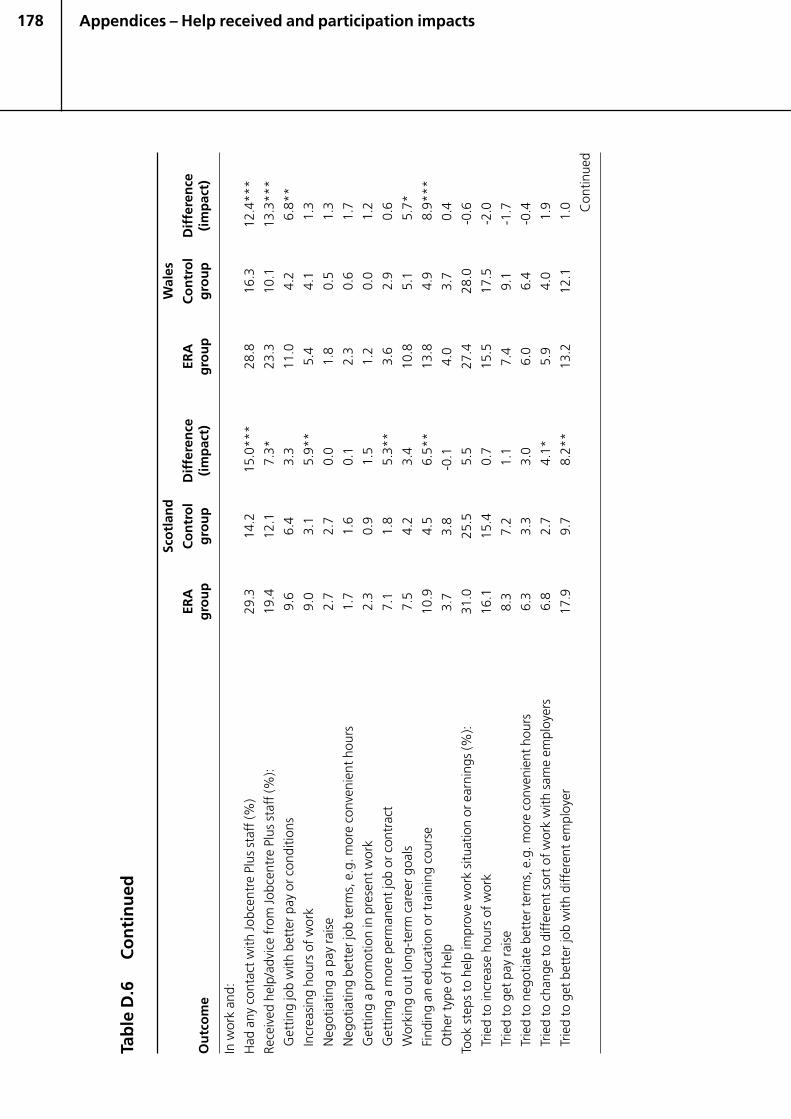
178
Tab
le D
.6C
on
tin
ued
Sco
tlan
dW
ales
ERA
Co
ntr
ol
Dif
fere
nce
ERA
Co
ntr
ol
Dif
fere
nce
Ou
tco
me
gro
up
gro
up
(im
pac
t)g
rou
pg
rou
p(i
mp
act)
In w
ork
and:
Had
any
con
tact
with
Jobc
entr
e Pl
us s
taff
(%)
29.3
14.2
15.0
***
28.8
16.3
12.4
***
Rece
ived
hel
p/ad
vice
from
Jobc
entr
e Pl
us s
taff
(%):
19.4
12.1
7.3*
23.3
10.1
13.3
***
Get
ting
job
with
bet
ter p
ay o
r con
ditio
ns9.
66.
43.
311
.04.
26.
8**
Incr
easi
ng h
ours
of w
ork
9.0
3.1
5.9*
*5.
44.
11.
3
Neg
otia
ting
a pa
y ra
ise
2.7
2.7
0.0
1.8
0.5
1.3
Neg
otia
ting
bett
er jo
b te
rms,
e.g
. mor
e co
nven
ient
hou
rs1.
71.
60.
12.
30.
61.
7
Get
ting
a pr
omot
ion
in p
rese
nt w
ork
2.3
0.9
1.5
1.2
0.0
1.2
Get
timg
a m
ore
perm
anen
t job
or c
ontr
act
7.1
1.8
5.3*
*3.
62.
90.
6
Wor
king
out
long
-ter
m c
aree
r goa
ls7.
54.
23.
410
.85.
15.
7*
Find
ing
an e
duca
tion
or tr
aini
ng c
ours
e10
.94.
56.
5**
13.8
4.9
8.9*
**
Oth
er ty
pe o
f hel
p3.
73.
8-0
.14.
03.
70.
4
Took
ste
ps to
hel
p im
prov
e w
ork
situ
atio
n or
ear
ning
s (%
):31
.025
.55.
527
.428
.0-0
.6
Trie
d to
incr
ease
hou
rs o
f wor
k16
.115
.40.
715
.517
.5-2
.0
Trie
d to
get
pay
rais
e8.
37.
21.
17.
49.
1-1
.7
Trie
d to
neg
otia
te b
ette
r ter
ms,
e.g
. mor
e co
nven
ient
hou
rs6.
33.
33.
06.
06.
4-0
.4
Trie
d to
cha
nge
to d
iffer
ent s
ort o
f wor
k w
ith s
ame
empl
oyer
s6.
82.
74.
1*5.
94.
01.
9
Trie
d to
get
bet
ter j
ob w
ith d
iffer
ent e
mpl
oyer
17.9
9.7
8.2*
*13
.212
.11.
0 Con
tinue
d
Appendices – Help received and participation impacts
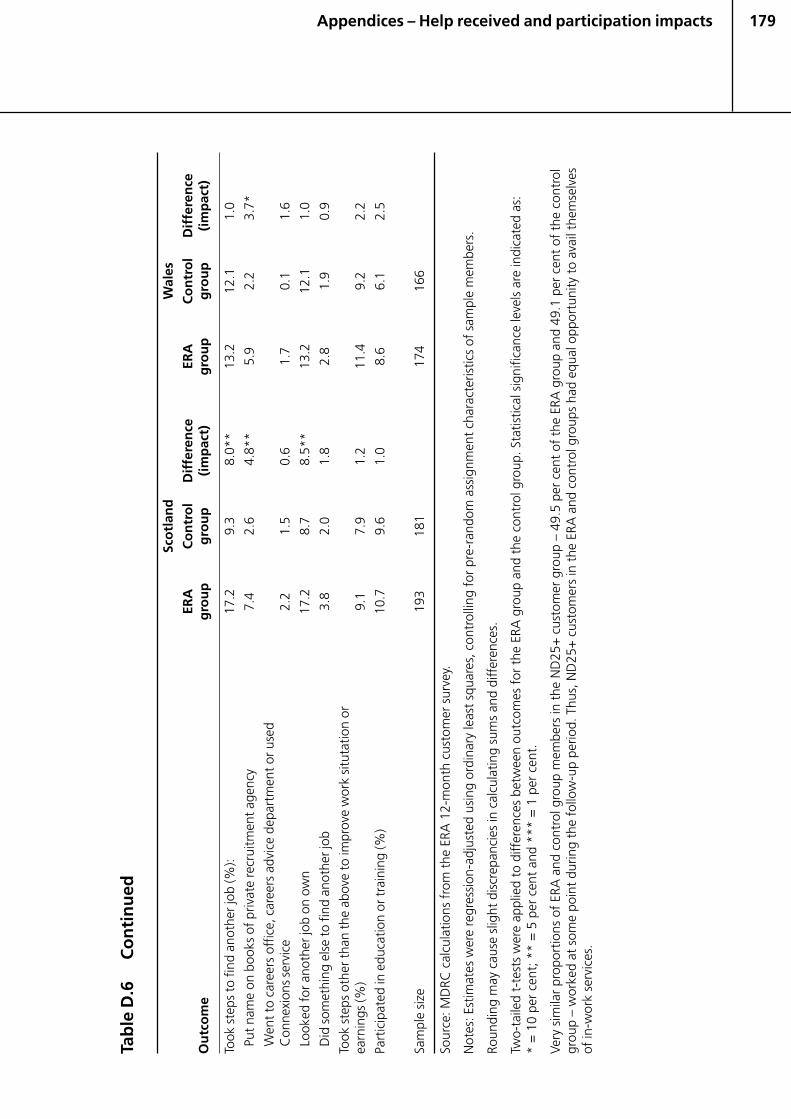
179
Tab
le D
.6C
on
tin
ued
Sco
tlan
dW
ales
ERA
Co
ntr
ol
Dif
fere
nce
ERA
Co
ntr
ol
Dif
fere
nce
Ou
tco
me
gro
up
gro
up
(im
pac
t)g
rou
pg
rou
p(i
mp
act)
Took
ste
ps to
find
ano
ther
job
(%):
17.2
9.3
8.0*
*13
.212
.11.
0
Put n
ame
on b
ooks
of p
rivat
e re
crui
tmen
t age
ncy
7.4
2.6
4.8*
*5.
92.
23.
7*
Wen
t to
care
ers
offic
e, c
aree
rs a
dvic
e de
part
men
t or u
sed
Con
nexi
ons
serv
ice
2.2
1.5
0.6
1.7
0.1
1.6
Look
ed fo
r ano
ther
job
on o
wn
17.2
8.7
8.5*
*13
.212
.11.
0
Did
som
ethi
ng e
lse
to fi
nd a
noth
er jo
b3.
82.
01.
82.
81.
90.
9
Took
ste
ps o
ther
than
the
abov
e to
impr
ove
wor
k si
tuta
tion
orea
rnin
gs (%
)9.
17.
91.
211
.49.
22.
2
Part
icip
ated
in e
duca
tion
or tr
aini
ng (%
)10
.79.
61.
08.
66.
12.
5
Sam
ple
size
193
181
174
166
Sour
ce: M
DRC
cal
cula
tions
fro
m t
he E
RA 1
2-m
onth
cus
tom
er s
urve
y.
Not
es: E
stim
ates
wer
e re
gres
sion
-adj
uste
d us
ing
ordi
nary
leas
t sq
uare
s, c
ontr
ollin
g fo
r pr
e-ra
ndom
ass
ignm
ent
char
acte
ristic
s of
sam
ple
mem
bers
.
Roun
ding
may
cau
se s
light
dis
crep
anci
es in
cal
cula
ting
sum
s an
d di
ffer
ence
s.
Two-
taile
d t-
test
s w
ere
appl
ied
to d
iffer
ence
s be
twee
n ou
tcom
es f
or t
he E
RA g
roup
and
the
con
trol
gro
up. S
tatis
tical
sig
nific
ance
leve
ls a
re in
dica
ted
as:
* =
10
per
cent
; **
= 5
per
cen
t an
d **
* =
1 p
er c
ent.
Very
sim
ilar
prop
ortio
ns o
f ER
A a
nd c
ontr
ol g
roup
mem
bers
in t
he N
D25
+ c
usto
mer
gro
up –
49.
5 pe
r ce
nt o
f th
e ER
A g
roup
and
49.
1 pe
r ce
nt o
f th
e co
ntro
lgr
oup
– w
orke
d at
som
e po
int
durin
g th
e fo
llow
-up
perio
d. T
hus,
ND
25+
cus
tom
ers
in t
he E
RA a
nd c
ontr
ol g
roup
s ha
d eq
ual o
ppor
tuni
ty t
o av
ail t
hem
selv
esof
in-w
ork
serv
ices
.
Appendices – Help received and participation impacts
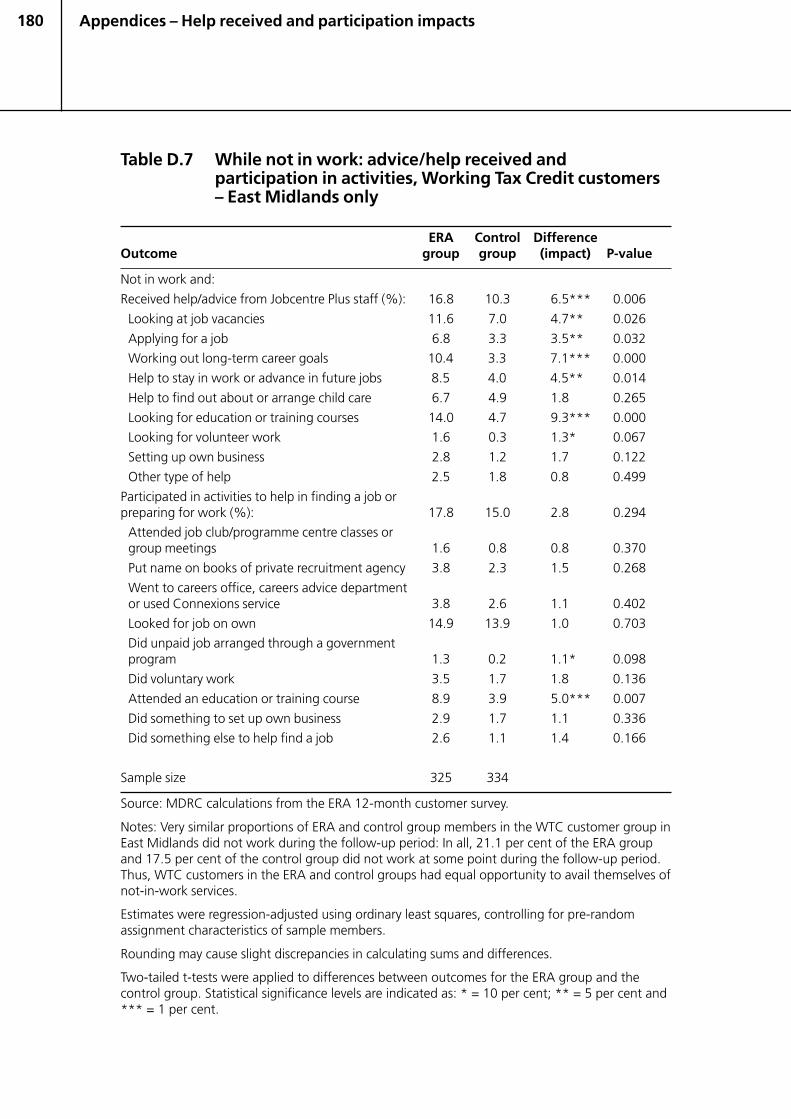
180
Table D.7 While not in work: advice/help received andparticipation in activities, Working Tax Credit customers– East Midlands only
ERA Control DifferenceOutcome group group (impact) P-value
Not in work and:
Received help/advice from Jobcentre Plus staff (%): 16.8 10.3 6.5*** 0.006
Looking at job vacancies 11.6 7.0 4.7** 0.026
Applying for a job 6.8 3.3 3.5** 0.032
Working out long-term career goals 10.4 3.3 7.1*** 0.000
Help to stay in work or advance in future jobs 8.5 4.0 4.5** 0.014
Help to find out about or arrange child care 6.7 4.9 1.8 0.265
Looking for education or training courses 14.0 4.7 9.3*** 0.000
Looking for volunteer work 1.6 0.3 1.3* 0.067
Setting up own business 2.8 1.2 1.7 0.122
Other type of help 2.5 1.8 0.8 0.499
Participated in activities to help in finding a job orpreparing for work (%): 17.8 15.0 2.8 0.294
Attended job club/programme centre classes orgroup meetings 1.6 0.8 0.8 0.370
Put name on books of private recruitment agency 3.8 2.3 1.5 0.268
Went to careers office, careers advice departmentor used Connexions service 3.8 2.6 1.1 0.402
Looked for job on own 14.9 13.9 1.0 0.703
Did unpaid job arranged through a governmentprogram 1.3 0.2 1.1* 0.098
Did voluntary work 3.5 1.7 1.8 0.136
Attended an education or training course 8.9 3.9 5.0*** 0.007
Did something to set up own business 2.9 1.7 1.1 0.336
Did something else to help find a job 2.6 1.1 1.4 0.166
Sample size 325 334
Source: MDRC calculations from the ERA 12-month customer survey.
Notes: Very similar proportions of ERA and control group members in the WTC customer group inEast Midlands did not work during the follow-up period: In all, 21.1 per cent of the ERA groupand 17.5 per cent of the control group did not work at some point during the follow-up period.Thus, WTC customers in the ERA and control groups had equal opportunity to avail themselves ofnot-in-work services.
Estimates were regression-adjusted using ordinary least squares, controlling for pre-randomassignment characteristics of sample members.
Rounding may cause slight discrepancies in calculating sums and differences.
Two-tailed t-tests were applied to differences between outcomes for the ERA group and thecontrol group. Statistical significance levels are indicated as: * = 10 per cent; ** = 5 per cent and*** = 1 per cent.
Appendices – Help received and participation impacts
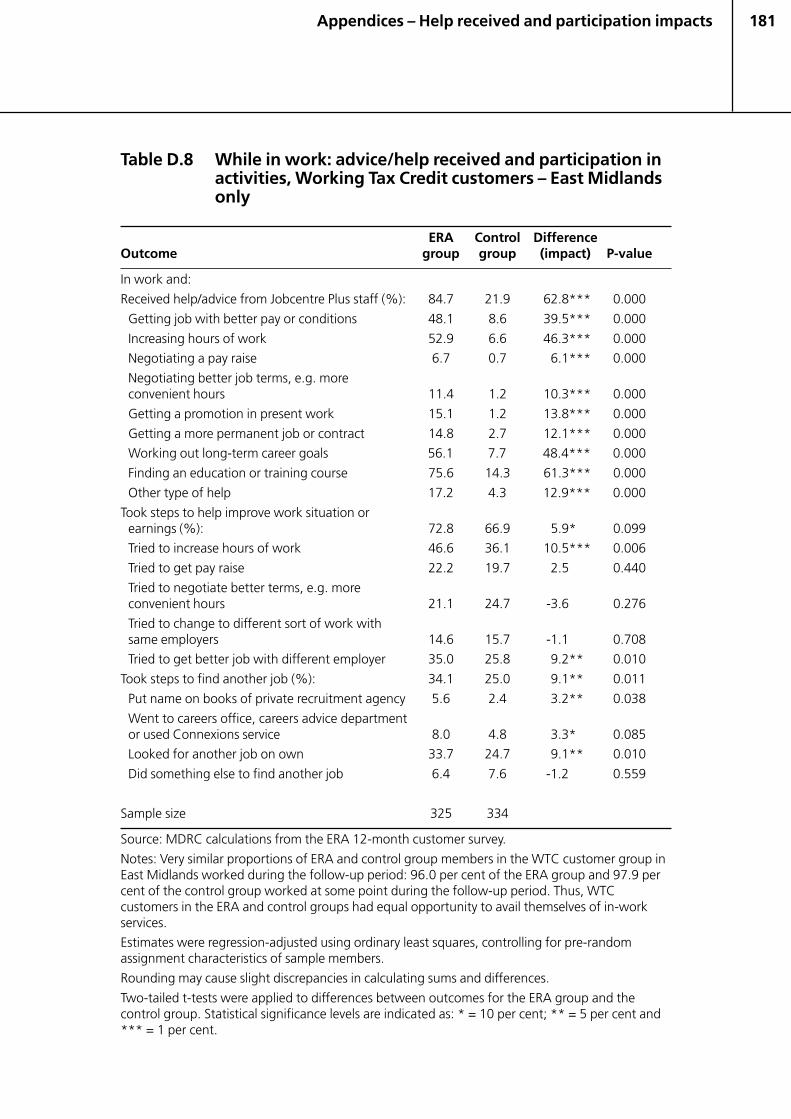
181
Table D.8 While in work: advice/help received and participation inactivities, Working Tax Credit customers – East Midlandsonly
ERA Control DifferenceOutcome group group (impact) P-value
In work and:
Received help/advice from Jobcentre Plus staff (%): 84.7 21.9 62.8*** 0.000
Getting job with better pay or conditions 48.1 8.6 39.5*** 0.000
Increasing hours of work 52.9 6.6 46.3*** 0.000
Negotiating a pay raise 6.7 0.7 6.1*** 0.000
Negotiating better job terms, e.g. moreconvenient hours 11.4 1.2 10.3*** 0.000
Getting a promotion in present work 15.1 1.2 13.8*** 0.000
Getting a more permanent job or contract 14.8 2.7 12.1*** 0.000
Working out long-term career goals 56.1 7.7 48.4*** 0.000
Finding an education or training course 75.6 14.3 61.3*** 0.000
Other type of help 17.2 4.3 12.9*** 0.000
Took steps to help improve work situation orearnings (%): 72.8 66.9 5.9* 0.099
Tried to increase hours of work 46.6 36.1 10.5*** 0.006
Tried to get pay raise 22.2 19.7 2.5 0.440
Tried to negotiate better terms, e.g. moreconvenient hours 21.1 24.7 -3.6 0.276
Tried to change to different sort of work withsame employers 14.6 15.7 -1.1 0.708
Tried to get better job with different employer 35.0 25.8 9.2** 0.010
Took steps to find another job (%): 34.1 25.0 9.1** 0.011
Put name on books of private recruitment agency 5.6 2.4 3.2** 0.038
Went to careers office, careers advice departmentor used Connexions service 8.0 4.8 3.3* 0.085
Looked for another job on own 33.7 24.7 9.1** 0.010
Did something else to find another job 6.4 7.6 -1.2 0.559
Sample size 325 334
Source: MDRC calculations from the ERA 12-month customer survey.
Notes: Very similar proportions of ERA and control group members in the WTC customer group inEast Midlands worked during the follow-up period: 96.0 per cent of the ERA group and 97.9 percent of the control group worked at some point during the follow-up period. Thus, WTCcustomers in the ERA and control groups had equal opportunity to avail themselves of in-workservices.
Estimates were regression-adjusted using ordinary least squares, controlling for pre-randomassignment characteristics of sample members.
Rounding may cause slight discrepancies in calculating sums and differences.
Two-tailed t-tests were applied to differences between outcomes for the ERA group and thecontrol group. Statistical significance levels are indicated as: * = 10 per cent; ** = 5 per cent and*** = 1 per cent.
Appendices – Help received and participation impacts

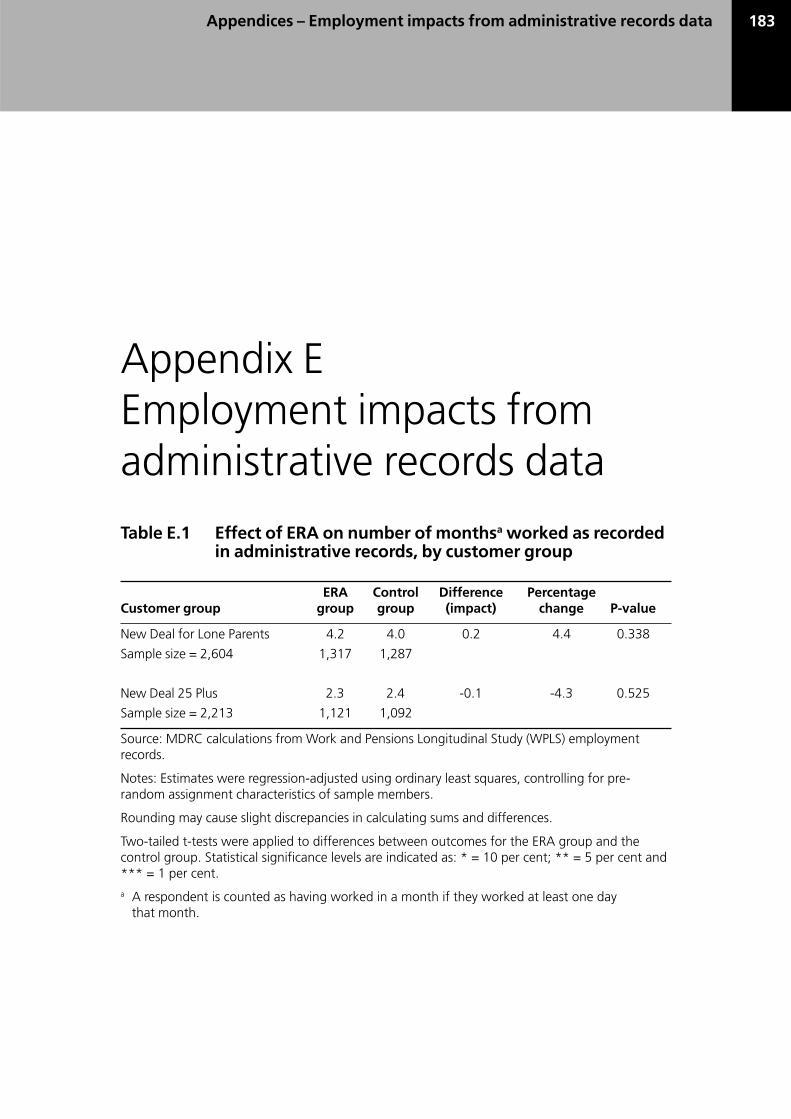
183
Appendix EEmployment impacts fromadministrative records data
Table E.1 Effect of ERA on number of monthsa worked as recordedin administrative records, by customer group
ERA Control Difference PercentageCustomer group group group (impact) change P-value
New Deal for Lone Parents 4.2 4.0 0.2 4.4 0.338
Sample size = 2,604 1,317 1,287
New Deal 25 Plus 2.3 2.4 -0.1 -4.3 0.525
Sample size = 2,213 1,121 1,092
Source: MDRC calculations from Work and Pensions Longitudinal Study (WPLS) employmentrecords.
Notes: Estimates were regression-adjusted using ordinary least squares, controlling for pre-random assignment characteristics of sample members.
Rounding may cause slight discrepancies in calculating sums and differences.
Two-tailed t-tests were applied to differences between outcomes for the ERA group and thecontrol group. Statistical significance levels are indicated as: * = 10 per cent; ** = 5 per cent and*** = 1 per cent.a A respondent is counted as having worked in a month if they worked at least one day
that month.
Appendices – Employment impacts from administrative records data


185
Appendix FSubgroup analysis
Appendices – Subgroup analysis
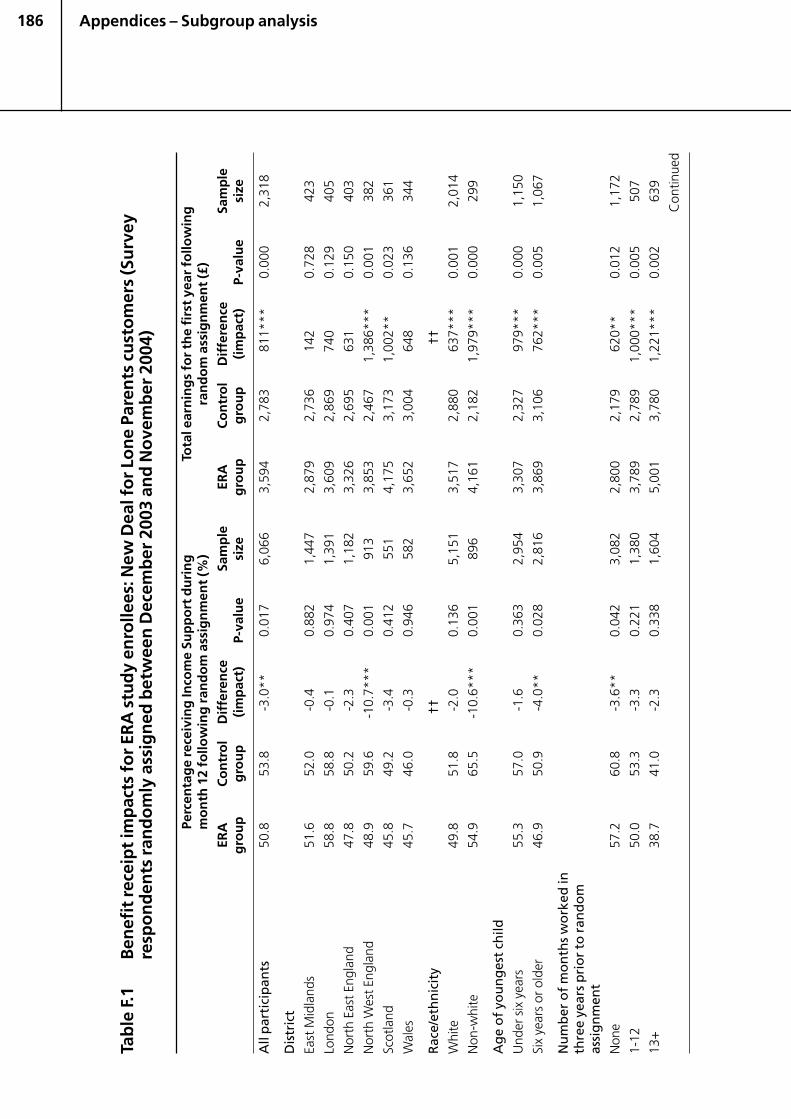
186
Tab
le F
.1B
enef
it r
ecei
pt
imp
acts
fo
r ER
A s
tud
y en
rolle
es: N
ew D
eal f
or
Lon
e Pa
ren
ts c
ust
om
ers
(Su
rvey
resp
on
den
ts r
and
om
ly a
ssig
ned
bet
wee
n D
ecem
ber
200
3 an
d N
ove
mb
er 2
004)
Perc
enta
ge
rece
ivin
g In
com
e Su
pp
ort
du
rin
gTo
tal e
arn
ing
s fo
r th
e fi
rst
year
fo
llow
ing
mo
nth
12
follo
win
g r
and
om
ass
ign
men
t (%
)ra
nd
om
ass
ign
men
t (£
)
ERA
Co
ntr
ol
Dif
fere
nce
Sam
ple
ERA
Co
ntr
ol
Dif
fere
nce
Sam
ple
gro
up
gro
up
(im
pac
t)P-
valu
esi
zeg
rou
pg
rou
p(i
mp
act)
P-va
lue
size
All
par
tici
pan
ts50
.853
.8-3
.0**
0.01
76,
066
3,59
42,
783
811*
**0.
000
2,31
8
Dis
tric
t
East
Mid
land
s51
.652
.0-0
.40.
882
1,44
72,
879
2,73
614
20.
728
423
Lond
on58
.858
.8-0
.10.
974
1,39
13,
609
2,86
974
00.
129
405
Nor
th E
ast E
ngla
nd47
.850
.2-2
.30.
407
1,18
23,
326
2,69
563
10.
150
403
Nor
th W
est E
ngla
nd48
.959
.6-1
0.7*
**0.
001
913
3,85
32,
467
1,38
6***
0.00
138
2
Scot
land
45.8
49.2
-3.4
0.41
255
14,
175
3,17
31,
002*
*0.
023
361
Wal
es45
.746
.0-0
.30.
946
582
3,65
23,
004
648
0.13
634
4
Rac
e/et
hn
icit
y††
††
Whi
te49
.851
.8-2
.00.
136
5,15
13,
517
2,88
063
7***
0.00
12,
014
Non
-whi
te54
.965
.5-1
0.6*
**0.
001
896
4,16
12,
182
1,97
9***
0.00
029
9
Ag
e o
f yo
un
ges
t ch
ild
Und
er s
ix y
ears
55.3
57.0
-1.6
0.36
32,
954
3,30
72,
327
979*
**0.
000
1,15
0
Six
year
s or
old
er46
.950
.9-4
.0**
0.02
82,
816
3,86
93,
106
762*
**0.
005
1,06
7
Nu
mb
er o
f m
on
ths
wo
rked
inth
ree
year
s p
rio
r to
ran
do
mas
sig
nm
ent
Non
e57
.260
.8-3
.6**
0.04
23,
082
2,80
02,
179
620*
*0.
012
1,17
2
1-12
50.0
53.3
-3.3
0.22
11,
380
3,78
92,
789
1,00
0***
0.00
550
7
13+
38.7
41.0
-2.3
0.33
81,
604
5,00
13,
780
1,22
1***
0.00
263
9
Con
tinue
d
Appendices – Subgroup analysis
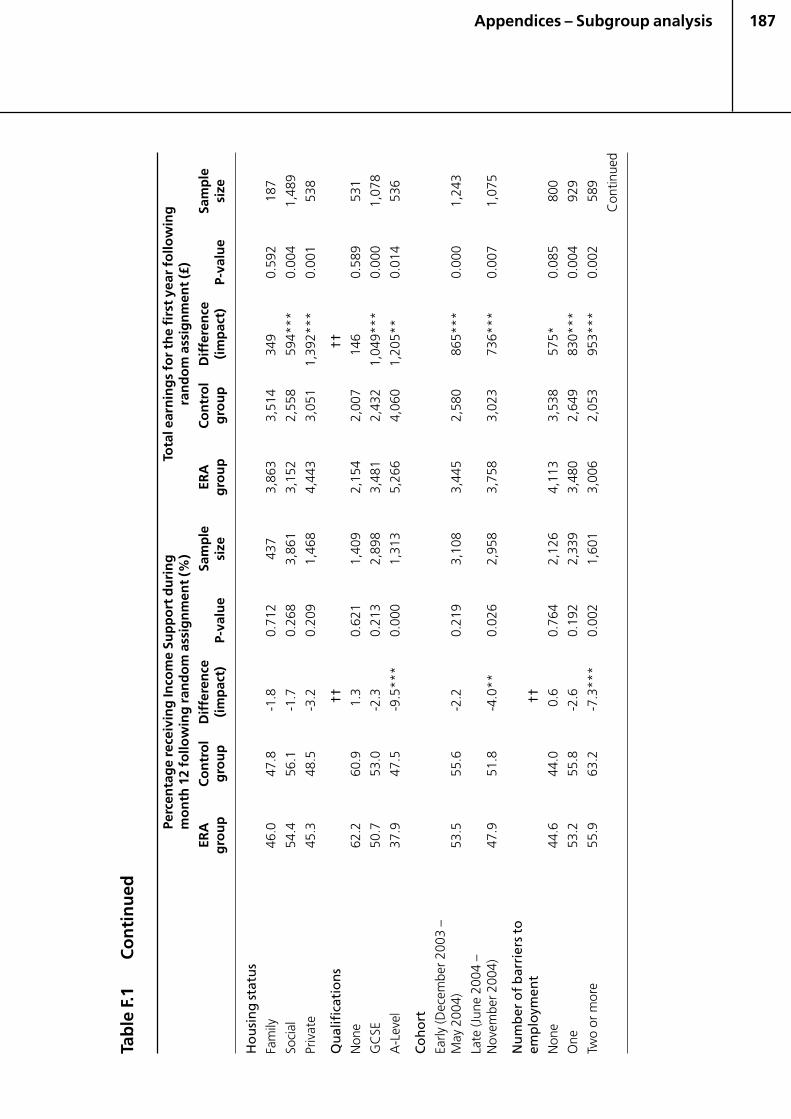
187
Tab
le F
.1C
on
tin
ued
Perc
enta
ge
rece
ivin
g In
com
e Su
pp
ort
du
rin
gTo
tal e
arn
ing
s fo
r th
e fi
rst
year
fo
llow
ing
mo
nth
12
follo
win
g r
and
om
ass
ign
men
t (%
)ra
nd
om
ass
ign
men
t (£
)
ERA
Co
ntr
ol
Dif
fere
nce
Sam
ple
ERA
Co
ntr
ol
Dif
fere
nce
Sam
ple
gro
up
gro
up
(im
pac
t)P-
valu
esi
zeg
rou
pg
rou
p(i
mp
act)
P-va
lue
size
Ho
usi
ng
sta
tus
Fam
ily46
.047
.8-1
.80.
712
437
3,86
33,
514
349
0.59
218
7
Soci
al54
.456
.1-1
.70.
268
3,86
13,
152
2,55
859
4***
0.00
41,
489
Priv
ate
45.3
48.5
-3.2
0.20
91,
468
4,44
33,
051
1,39
2***
0.00
153
8
Qu
alif
icat
ion
s††
††
Non
e62
.260
.91.
30.
621
1,40
92,
154
2,00
714
60.
589
531
GC
SE50
.753
.0-2
.30.
213
2,89
83,
481
2,43
21,
049*
**0.
000
1,07
8
A-L
evel
37.9
47.5
-9.5
***
0.00
01,
313
5,26
64,
060
1,20
5**
0.01
453
6
Co
ho
rt
Early
(Dec
embe
r 200
3 –
May
200
4)53
.555
.6-2
.20.
219
3,10
83,
445
2,58
086
5***
0.00
01,
243
Late
(Jun
e 20
04 –
Nov
embe
r 200
4)47
.951
.8-4
.0**
0.02
62,
958
3,75
83,
023
736*
**0.
007
1,07
5
Nu
mb
er o
f b
arri
ers
toem
plo
ymen
t††
Non
e44
.644
.00.
60.
764
2,12
64,
113
3,53
857
5*0.
085
800
One
53.2
55.8
-2.6
0.19
22,
339
3,48
02,
649
830*
**0.
004
929
Two
or m
ore
55.9
63.2
-7.3
***
0.00
21,
601
3,00
62,
053
953*
**0.
002
589
Con
tinue
d
Appendices – Subgroup analysis
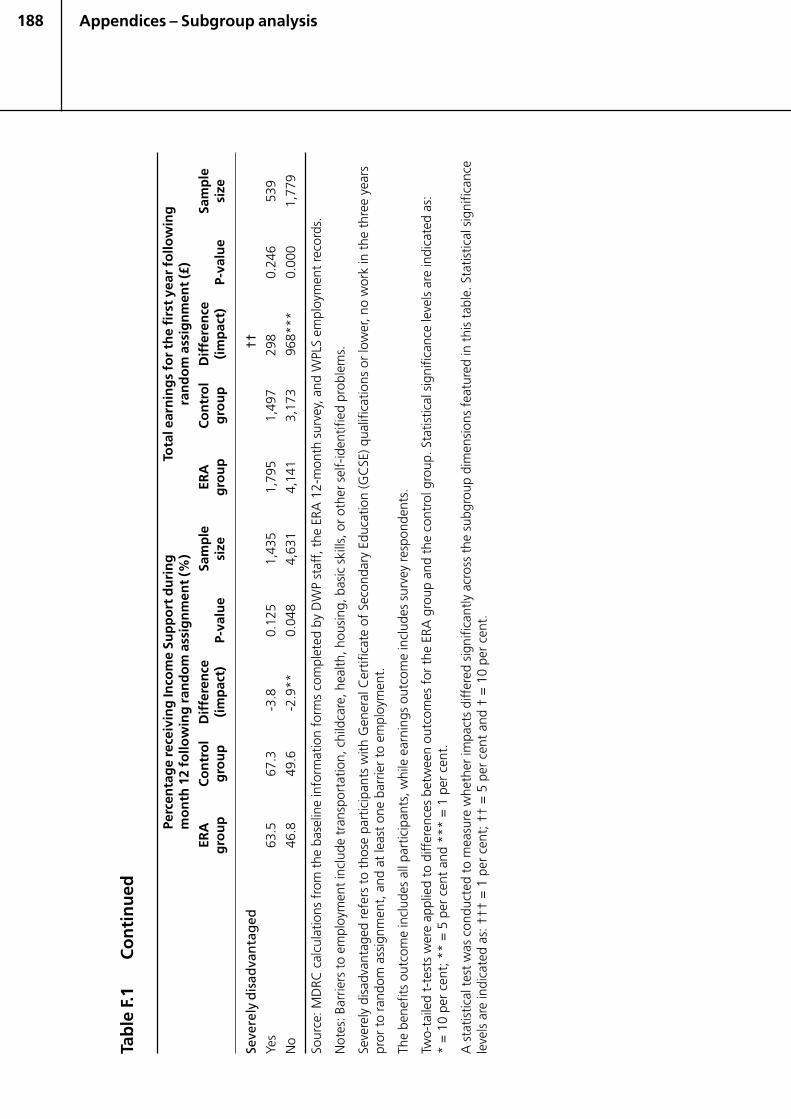
188
Tab
le F
.1C
on
tin
ued
Perc
enta
ge
rece
ivin
g In
com
e Su
pp
ort
du
rin
gTo
tal e
arn
ing
s fo
r th
e fi
rst
year
fo
llow
ing
mo
nth
12
follo
win
g r
and
om
ass
ign
men
t (%
)ra
nd
om
ass
ign
men
t (£
)
ERA
Co
ntr
ol
Dif
fere
nce
Sam
ple
ERA
Co
ntr
ol
Dif
fere
nce
Sam
ple
gro
up
gro
up
(im
pac
t)P-
valu
esi
zeg
rou
pg
rou
p(i
mp
act)
P-va
lue
size
Seve
rely
dis
adva
nta
ged
††
Yes
63.5
67.3
-3.8
0.12
51,
435
1,79
51,
497
298
0.24
653
9
No
46.8
49.6
-2.9
**0.
048
4,63
14,
141
3,17
396
8***
0.00
01,
779
Sour
ce: M
DRC
cal
cula
tions
fro
m t
he b
asel
ine
info
rmat
ion
form
s co
mpl
eted
by
DW
P st
aff,
the
ERA
12-
mon
th s
urve
y, a
nd W
PLS
empl
oym
ent
reco
rds.
Not
es: B
arrie
rs t
o em
ploy
men
t in
clud
e tr
ansp
orta
tion,
chi
ldca
re, h
ealth
, hou
sing
, bas
ic s
kills
, or
othe
r se
lf-id
entif
ied
prob
lem
s.
Seve
rely
dis
adva
ntag
ed r
efer
s to
tho
se p
artic
ipan
ts w
ith G
ener
al C
ertif
icat
e of
Sec
onda
ry E
duca
tion
(GC
SE) q
ualif
icat
ions
or
low
er, n
o w
ork
in t
he t
hree
yea
rspr
or t
o ra
ndom
ass
ignm
ent,
and
at
leas
t on
e ba
rrie
r to
em
ploy
men
t.
The
bene
fits
outc
ome
incl
udes
all
part
icip
ants
, whi
le e
arni
ngs
outc
ome
incl
udes
sur
vey
resp
onde
nts.
Two-
taile
d t-
test
s w
ere
appl
ied
to d
iffer
ence
s be
twee
n ou
tcom
es f
or t
he E
RA g
roup
and
the
con
trol
gro
up. S
tatis
tical
sig
nific
ance
leve
ls a
re in
dica
ted
as:
* =
10
per
cent
; **
= 5
per
cen
t an
d **
* =
1 p
er c
ent.
A s
tatis
tical
tes
t w
as c
ondu
cted
to
mea
sure
whe
ther
impa
cts
diff
ered
sig
nific
antly
acr
oss
the
subg
roup
dim
ensi
ons
feat
ured
in t
his
tabl
e. S
tatis
tical
sig
nific
ance
leve
ls a
re in
dica
ted
as: †
†† =
1 p
er c
ent;
††
= 5
per
cen
t an
d †
= 1
0 pe
r ce
nt.
Appendices – Subgroup analysis
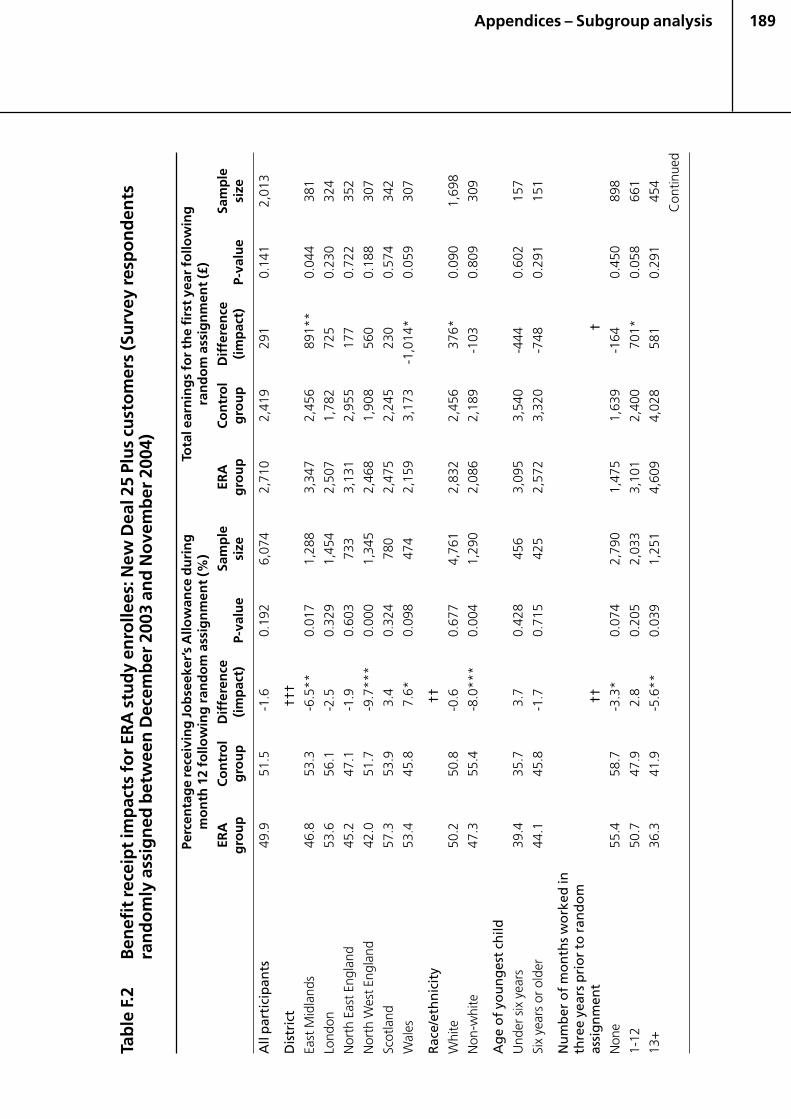
189
Tab
le F
.2B
enef
it r
ecei
pt
imp
acts
fo
r ER
A s
tud
y en
rolle
es: N
ew D
eal 2
5 Pl
us
cust
om
ers
(Su
rvey
res
po
nd
ents
ran
do
mly
ass
ign
ed b
etw
een
Dec
emb
er 2
003
and
No
vem
ber
200
4)
Perc
enta
ge
rece
ivin
g J
ob
seek
er’s
Allo
wan
ce d
uri
ng
Tota
l ear
nin
gs
for
the
firs
t ye
ar f
ollo
win
gm
on
th 1
2 fo
llow
ing
ran
do
m a
ssig
nm
ent
(%)
ran
do
m a
ssig
nm
ent
(£)
ERA
Co
ntr
ol
Dif
fere
nce
Sam
ple
ERA
Co
ntr
ol
Dif
fere
nce
Sam
ple
gro
up
gro
up
(im
pac
t)P-
valu
esi
zeg
rou
pg
rou
p(i
mp
act)
P-va
lue
size
All
par
tici
pan
ts49
.951
.5-1
.60.
192
6,07
42,
710
2,41
929
10.
141
2,01
3
Dis
tric
t††
†
East
Mid
land
s46
.853
.3-6
.5**
0.01
71,
288
3,34
72,
456
891*
*0.
044
381
Lond
on53
.656
.1-2
.50.
329
1,45
42,
507
1,78
272
50.
230
324
Nor
th E
ast E
ngla
nd45
.247
.1-1
.90.
603
733
3,13
12,
955
177
0.72
235
2
Nor
th W
est E
ngla
nd42
.051
.7-9
.7**
*0.
000
1,34
52,
468
1,90
856
00.
188
307
Scot
land
57.3
53.9
3.4
0.32
478
02,
475
2,24
523
00.
574
342
Wal
es53
.445
.87.
6*0.
098
474
2,15
93,
173
-1,0
14*
0.05
930
7
Rac
e/et
hn
icit
y††
Whi
te50
.250
.8-0
.60.
677
4,76
12,
832
2,45
637
6*0.
090
1,69
8
Non
-whi
te47
.355
.4-8
.0**
*0.
004
1,29
02,
086
2,18
9-1
030.
809
309
Ag
e o
f yo
un
ges
t ch
ild
Und
er s
ix y
ears
39.4
35.7
3.7
0.42
845
63,
095
3,54
0-4
440.
602
157
Six
year
s or
old
er44
.145
.8-1
.70.
715
425
2,57
23,
320
-748
0.29
115
1
Nu
mb
er o
f m
on
ths
wo
rked
inth
ree
year
s p
rio
r to
ran
do
mas
sig
nm
ent
†††
Non
e55
.458
.7-3
.3*
0.07
42,
790
1,47
51,
639
-164
0.45
089
8
1-12
50.7
47.9
2.8
0.20
52,
033
3,10
12,
400
701*
0.05
866
1
13+
36.3
41.9
-5.6
**0.
039
1,25
14,
609
4,02
858
10.
291
454
Con
tinue
d
Appendices – Subgroup analysis
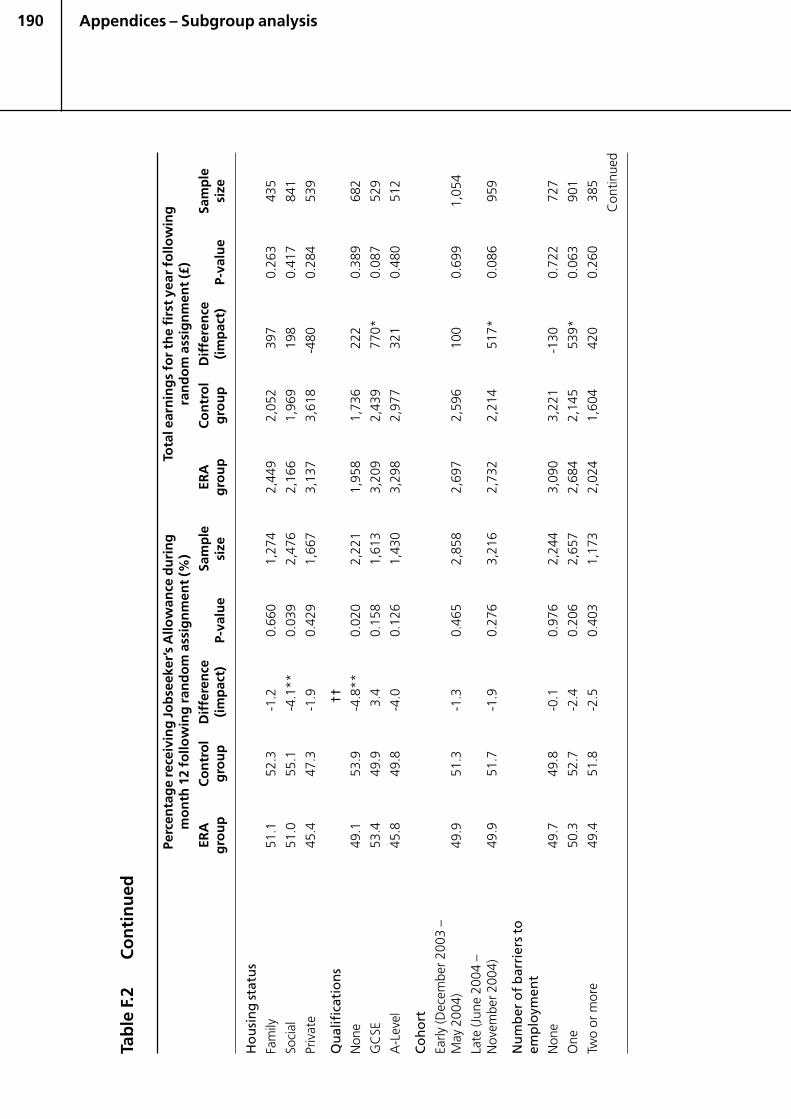
190
Tab
le F
.2C
on
tin
ued
Perc
enta
ge
rece
ivin
g J
ob
seek
er’s
Allo
wan
ce d
uri
ng
Tota
l ear
nin
gs
for
the
firs
t ye
ar f
ollo
win
gm
on
th 1
2 fo
llow
ing
ran
do
m a
ssig
nm
ent
(%)
ran
do
m a
ssig
nm
ent
(£)
ERA
Co
ntr
ol
Dif
fere
nce
Sam
ple
ERA
Co
ntr
ol
Dif
fere
nce
Sam
ple
gro
up
gro
up
(im
pac
t)P-
valu
esi
zeg
rou
pg
rou
p(i
mp
act)
P-va
lue
size
Ho
usi
ng
sta
tus
Fam
ily51
.152
.3-1
.20.
660
1,27
42,
449
2,05
239
70.
263
435
Soci
al51
.055
.1-4
.1**
0.03
92,
476
2,16
61,
969
198
0.41
784
1
Priv
ate
45.4
47.3
-1.9
0.42
91,
667
3,13
73,
618
-480
0.28
453
9
Qu
alif
icat
ion
s††
Non
e49
.153
.9-4
.8**
0.02
02,
221
1,95
81,
736
222
0.38
968
2
GC
SE53
.449
.93.
40.
158
1,61
33,
209
2,43
977
0*0.
087
529
A-L
evel
45.8
49.8
-4.0
0.12
61,
430
3,29
82,
977
321
0.48
051
2
Co
ho
rt
Early
(Dec
embe
r 200
3 –
May
200
4)49
.951
.3-1
.30.
465
2,85
82,
697
2,59
610
00.
699
1,05
4
Late
(Jun
e 20
04 –
Nov
embe
r 200
4)49
.951
.7-1
.90.
276
3,21
62,
732
2,21
451
7*0.
086
959
Nu
mb
er o
f b
arri
ers
toem
plo
ymen
tN
one
49.7
49.8
-0.1
0.97
62,
244
3,09
03,
221
-130
0.72
272
7
One
50.3
52.7
-2.4
0.20
62,
657
2,68
42,
145
539*
0.06
390
1
Two
or m
ore
49.4
51.8
-2.5
0.40
31,
173
2,02
41,
604
420
0.26
038
5
Con
tinue
d
Appendices – Subgroup analysis
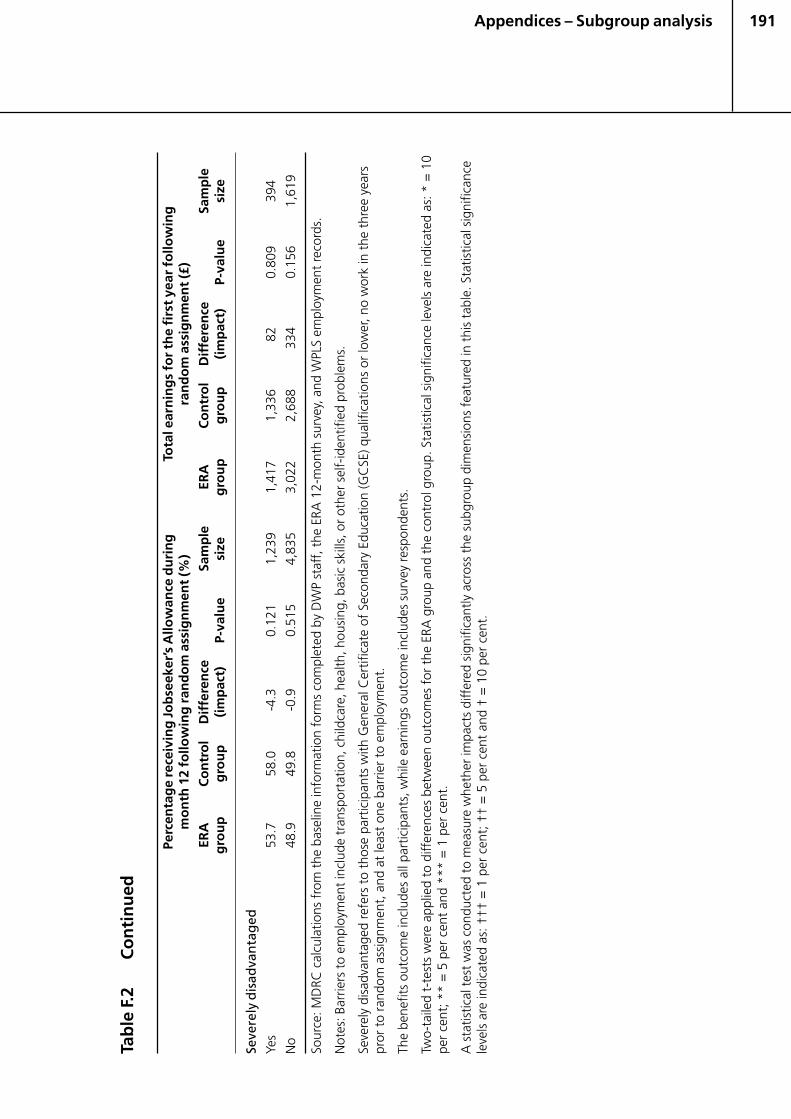
191
Tab
le F
.2C
on
tin
ued
Perc
enta
ge
rece
ivin
g J
ob
seek
er’s
Allo
wan
ce d
uri
ng
Tota
l ear
nin
gs
for
the
firs
t ye
ar f
ollo
win
gm
on
th 1
2 fo
llow
ing
ran
do
m a
ssig
nm
ent
(%)
ran
do
m a
ssig
nm
ent
(£)
ERA
Co
ntr
ol
Dif
fere
nce
Sam
ple
ERA
Co
ntr
ol
Dif
fere
nce
Sam
ple
gro
up
gro
up
(im
pac
t)P-
valu
esi
zeg
rou
pg
rou
p(i
mp
act)
P-va
lue
size
Seve
rely
dis
adva
nta
ged
Yes
53.7
58.0
-4.3
0.12
11,
239
1,41
71,
336
820.
809
394
No
48.9
49.8
-0.9
0.51
54,
835
3,02
22,
688
334
0.15
61,
619
Sour
ce: M
DRC
cal
cula
tions
fro
m t
he b
asel
ine
info
rmat
ion
form
s co
mpl
eted
by
DW
P st
aff,
the
ERA
12-
mon
th s
urve
y, a
nd W
PLS
empl
oym
ent
reco
rds.
Not
es: B
arrie
rs t
o em
ploy
men
t in
clud
e tr
ansp
orta
tion,
chi
ldca
re, h
ealth
, hou
sing
, bas
ic s
kills
, or
othe
r se
lf-id
entif
ied
prob
lem
s.
Seve
rely
dis
adva
ntag
ed r
efer
s to
tho
se p
artic
ipan
ts w
ith G
ener
al C
ertif
icat
e of
Sec
onda
ry E
duca
tion
(GC
SE) q
ualif
icat
ions
or
low
er, n
o w
ork
in t
he t
hree
yea
rspr
or t
o ra
ndom
ass
ignm
ent,
and
at
leas
t on
e ba
rrie
r to
em
ploy
men
t.
The
bene
fits
outc
ome
incl
udes
all
part
icip
ants
, whi
le e
arni
ngs
outc
ome
incl
udes
sur
vey
resp
onde
nts.
Two-
taile
d t-
test
s w
ere
appl
ied
to d
iffer
ence
s be
twee
n ou
tcom
es f
or t
he E
RA g
roup
and
the
con
trol
gro
up. S
tatis
tical
sig
nific
ance
leve
ls a
re in
dica
ted
as: *
= 1
0pe
r ce
nt; *
* =
5 p
er c
ent
and
***
= 1
per
cen
t.
A s
tatis
tical
tes
t w
as c
ondu
cted
to
mea
sure
whe
ther
impa
cts
diff
ered
sig
nific
antly
acr
oss
the
subg
roup
dim
ensi
ons
feat
ured
in t
his
tabl
e. S
tatis
tical
sig
nific
ance
leve
ls a
re in
dica
ted
as: †
†† =
1 p
er c
ent;
††
= 5
per
cen
t an
d †
= 1
0 pe
r ce
nt.
Appendices – Subgroup analysis

193
Appendix GNon-response analysis in the12-month surveyThe analysis in this report focuses on the 13,604 Jobcentre Plus customers who wererandomly assigned to the programme or control group in the UK ERA study between1 December 2003, and 30 November 2004. This group is referred to as the fullsample in the following tables. Most of the impacts presented in this report comefrom responses to a first-year follow-up survey. Due to the time and resourcesrequired to conduct the survey, not every customer who was eligible for the first-year survey was selected to participate. Instead, a subset of the full sample wasrandomly selected to participate in the survey and represent the larger group. Thisgroup is referred to as the fielded sample. However, several customers selected toparticipate in the survey could not be located, refused to participate, or could not beinterviewed. Sample members who were unable to participate in the survey arereferred to as non-respondents, while those members who completed the surveyare referred to as respondents.
This appendix assesses the extent to which the respondent sample is representativeof the full sample and whether the impacts estimated using the responses to thesurvey can be regarded as applying equally to the full sample. To preview the keyresults, the level of survey response was very high and tended to be particularlyassociated with certain characteristics. However, there was no evidence of biasresulting from basing estimates on the respondents sample; on the contrary, theavailable evidence suggests that estimates based on respondents sample agree withestimates based on the full sample.
Response rates
Response rates are very high by conventional standards. This increases confidencethat the results estimated for respondents will hold for the full sample. Table G.1
Appendices – Non-response analysis in the 12-month survey
194
shows that there are 6,066 New Deal for Lone Parents (NDLP) customers in the fullsample. Of those, 2,995 were selected to be in the fielded sample and 2,604 of theseresponded to the survey, yielding an 87 per cent response rate. The New Deal 25 Plus(ND25+) group has a full sample of 6,074, a fielded sample of 2,970, a respondentsample of 2,213 and a response rate of 75 per cent. The Working Tax Credit (WTC)group has a full sample of 1,464, a fielded sample of 1,447, a respondent sample of1,344 and a response rate of 93 per cent.
Comparison of impact estimates from administrative records
Despite these high response rates, it is still possible that impact estimates for thegroup for which survey data are available may not agree with impact estimatesbased on the full sample. Although survey data are not available for the full sample,employment and benefit data from administrative records are. Using theseadministrative records, estimates based on the full sample can be compared withestimates based on the respondent sample. This provides an insight into whetherestimates based on the smaller (respondent) sample can be regarded as unbiasedestimates for the full sample. Should this be the case for the outcomes held inadministrative records, we can be more confident that the impact estimates for theoutcomes available only in the survey data also apply to the full sample.
Table G.2 contains impact estimates for the number of months receiving benefit andthe number of months employed in the first year after random assignment (takenfrom the administrative records data) for the full and respondent samples. The NDLPgroup shows statistically significant negative impacts for benefit receipt andstatistically insignificant positive impacts for employment for both sample groups.The ND25+ group shows statistically insignificant impacts for benefit receipt andemployment for both sample groups. The WTC group shows significant negativeimpacts for benefit receipt for both samples. Employment data from administrativerecords were not available for the WTC group due to reasons mentioned in Chapter5; however, the respondent sample represents 92 per cent of the full sample, so it isless likely that we would see a difference in impacts. Overall, the comparison ofadministrative records shows very similar impact estimates for the full sample andthe respondent sample for both economic outcomes for all three customer groups.This is the best available test of whether the respondent sample is capable ofdelivering unbiased impact estimates and the strong suggestion is that it isreasonable to generalise the survey response findings to the full sample.
Comparison of baseline characteristics
It is of interest to understand the factors influencing whether an individual in thefielded sample responds to the survey. To some extent, this can be explored bycomparing the characteristics of respondents with those of non-respondents. Anysuch differences can be controlled for when estimating programme impacts and sodo not imply a bias in the resulting estimates. Indeed, the results from the previoussection suggest the survey-based estimates to be unbiased.
Appendices – Non-response analysis in the 12-month survey
195
Tables G.3 – G.5 present unadjusted means of selected baseline characteristics bycustomer group for the entire UK ERA sample and for respondents and non-respondents to the survey. Significant differences between the characteristics ofrespondents and non-respondents are denoted by asterisks in the table. Overall,respondents and non-respondents are statistically significantly different in a numberof regards. This is common in surveys and may have a variety of explanations. Forexample, members of the fielded sample who have ties to a community throughfamily are easier to locate for survey participation than those who do not, so it is notsurprising that response rates are higher among those in the ND25+ group withchildren than those without (there is no such pattern among the NDLP and WTCgroups since, by definition, nearly all individuals – respondents and non-respondentsalike – have children).
Since some of these characteristics may be correlated – for example, education andweekly earnings – multiple regression is used to determine which characteristicsdiffer significantly across respondents and non-respondents while taking all othercharacteristics into account. Table G.6 shows the results of regressing an indicator ofresponse status on the characteristics shown in Tables G.3 – G.5, as well as anindicator of research group, in order to better understand the process governingresponse. The ‘parameter estimate’ column captures the effect of each characteristicon the probability of responding to the survey; asterisks denote the significance levelof this effect.
The results show that many of the characteristics that differed by response status inTables G.3 – G.5 were not statistically significant predictors of response status in themultiple regression analysis. The only characteristic that was a statistically significantpredictor of response in all three customer groups was district. For example, those inthe two New Deal groups who live in the East Midlands or North East England aremore likely to respond to the survey than those living in London. This is a standardfinding for surveys in the UK; response rates tend to be lower among those living inLondon. Overall, although some differences in characteristics between therespondents and non-respondents still exist, all of the estimates of the programmeimpacts presented in this report control for such differences.
Conclusion
The survey achieved a remarkably high response rate and the available evidencesuggests that the impact estimates based on the respondents sample hold for thefull sample. As expected, there are some characteristics that differ betweenrespondents and non-respondents but these are accounted for when estimatingimpacts. Taken as a whole, the assessments presented in this appendix support theinterpretation of the impact estimates presented in this report as representative ofthe full sample.
Appendices – Non-response analysis in the 12-month survey
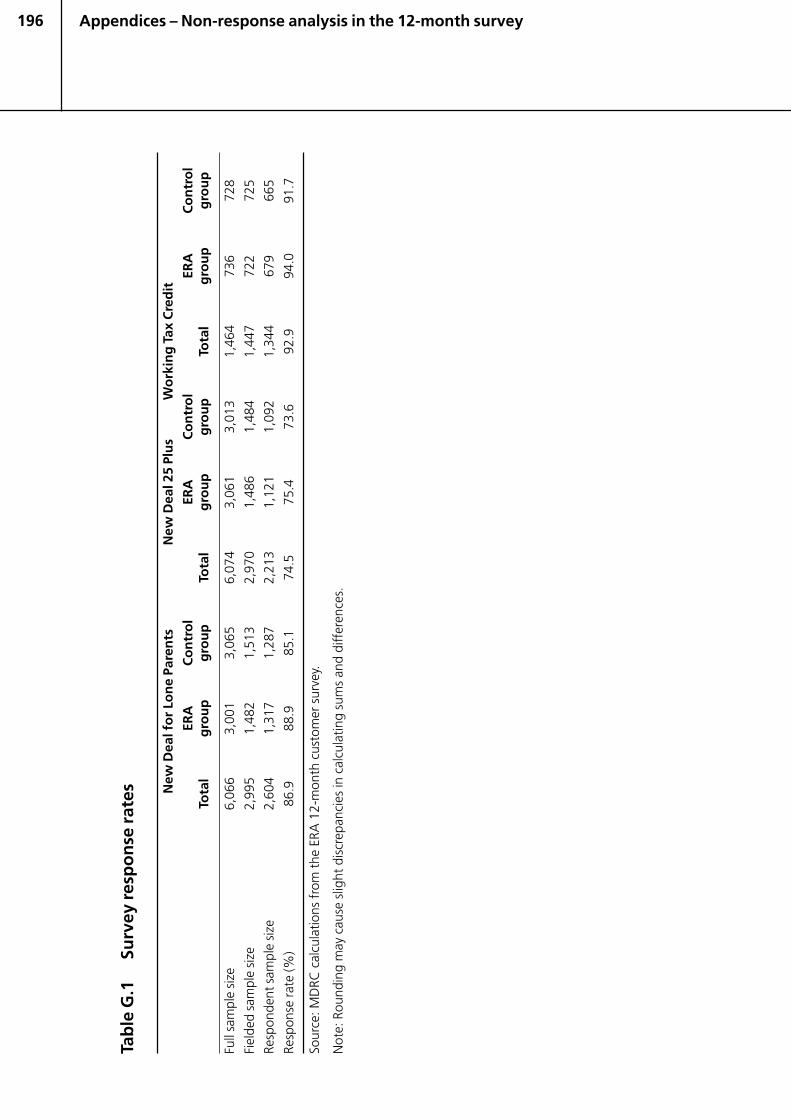
196
Tab
le G
.1Su
rvey
res
po
nse
rat
es New
Dea
l fo
r Lo
ne
Pare
nts
New
Dea
l 25
Plu
sW
ork
ing
Tax
Cre
dit
ERA
Co
ntr
ol
ERA
Co
ntr
ol
ERA
Co
ntr
ol
Tota
lg
rou
pg
rou
pTo
tal
gro
up
gro
up
Tota
lg
rou
pg
rou
p
Full
sam
ple
size
6,06
63,
001
3,06
56,
074
3,06
13,
013
1,46
473
672
8
Fiel
ded
sam
ple
size
2,99
51,
482
1,51
32,
970
1,48
61,
484
1,44
772
272
5
Resp
onde
nt s
ampl
e si
ze2,
604
1,31
71,
287
2,21
31,
121
1,09
21,
344
679
665
Resp
onse
rate
(%)
86.9
88.9
85.1
74.5
75.4
73.6
92.9
94.0
91.7
Sour
ce: M
DRC
cal
cula
tions
fro
m t
he E
RA 1
2-m
onth
cus
tom
er s
urve
y.
Not
e: R
ound
ing
may
cau
se s
light
dis
crep
anci
es in
cal
cula
ting
sum
s an
d di
ffer
ence
s.
Appendices – Non-response analysis in the 12-month survey
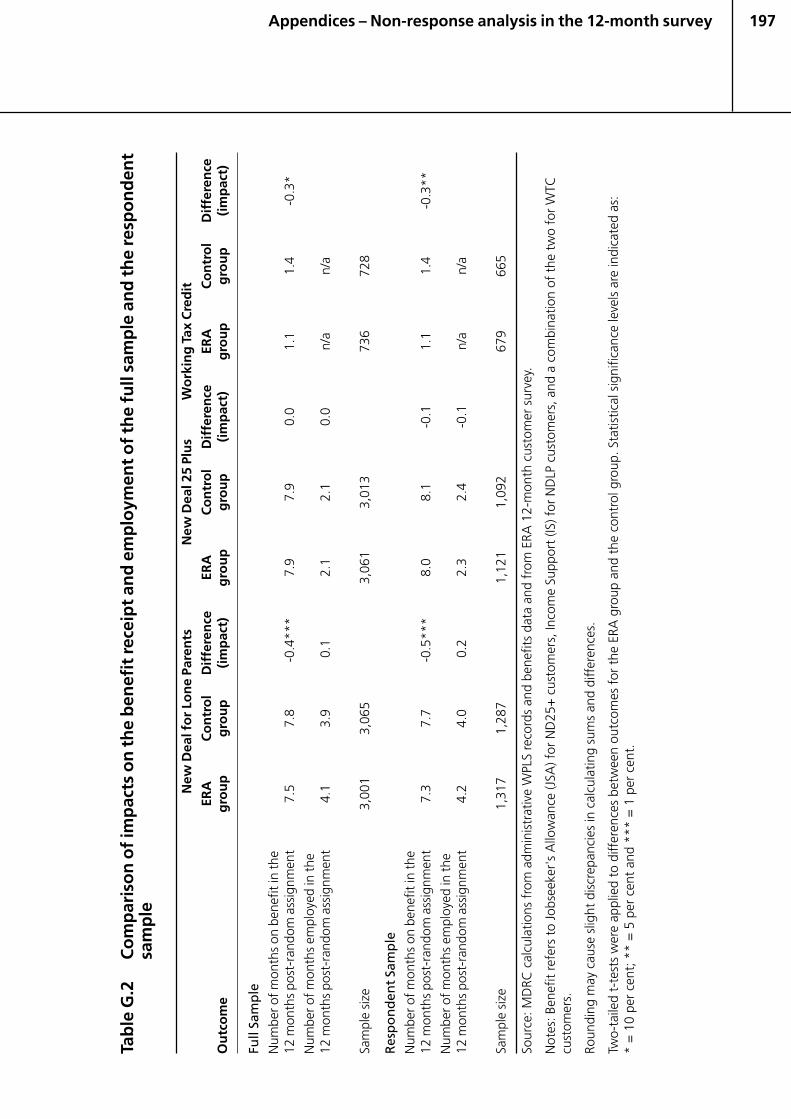
197
Tab
le G
.2C
om
par
iso
n o
f im
pac
ts o
n t
he
ben
efit
rece
ipt
and
em
plo
ymen
t o
f th
e fu
ll sa
mp
le a
nd
th
e re
spo
nd
ent
sam
ple
New
Dea
l fo
r Lo
ne
Pare
nts
New
Dea
l 25
Plu
sW
ork
ing
Tax
Cre
dit
ERA
Co
ntr
ol
Dif
fere
nce
ERA
Co
ntr
ol
Dif
fere
nce
ERA
Co
ntr
ol
Dif
fere
nce
Ou
tco
me
gro
up
gro
up
(im
pac
t)g
rou
pg
rou
p(i
mp
act)
gro
up
gro
up
(im
pac
t)
Full
Sam
ple
Num
ber o
f mon
ths
on b
enef
it in
the
12 m
onth
s po
st-r
ando
m a
ssig
nmen
t7.
57.
8-0
.4**
*7.
97.
90.
01.
11.
4-0
.3*
Num
ber o
f mon
ths
empl
oyed
in th
e12
mon
ths
post
-ran
dom
ass
ignm
ent
4.1
3.9
0.1
2.1
2.1
0.0
n/a
n/a
Sam
ple
size
3,00
13,
065
3,06
13,
013
736
728
Res
po
nd
ent
Sam
ple
Num
ber o
f mon
ths
on b
enef
it in
the
12 m
onth
s po
st-r
ando
m a
ssig
nmen
t7.
37.
7-0
.5**
*8.
08.
1-0
.11.
11.
4-0
.3**
Num
ber o
f mon
ths
empl
oyed
in th
e12
mon
ths
post
-ran
dom
ass
ignm
ent
4.2
4.0
0.2
2.3
2.4
-0.1
n/a
n/a
Sam
ple
size
1,31
71,
287
1,12
11,
092
679
665
Sour
ce: M
DRC
cal
cula
tions
fro
m a
dmin
istr
ativ
e W
PLS
reco
rds
and
bene
fits
data
and
fro
m E
RA 1
2-m
onth
cus
tom
er s
urve
y.
Not
es: B
enef
it re
fers
to
Jobs
eeke
r's
Allo
wan
ce (J
SA) f
or N
D25
+ c
usto
mer
s, In
com
e Su
ppor
t (IS
) for
ND
LP c
usto
mer
s, a
nd a
com
bina
tion
of t
he t
wo
for
WTC
cust
omer
s.
Roun
ding
may
cau
se s
light
dis
crep
anci
es in
cal
cula
ting
sum
s an
d di
ffer
ence
s.
Two-
taile
d t-
test
s w
ere
appl
ied
to d
iffer
ence
s be
twee
n ou
tcom
es f
or t
he E
RA g
roup
and
the
con
trol
gro
up. S
tatis
tical
sig
nific
ance
leve
ls a
re in
dica
ted
as:
* =
10
per
cent
; **
= 5
per
cen
t an
d **
* =
1 p
er c
ent.
Appendices – Non-response analysis in the 12-month survey
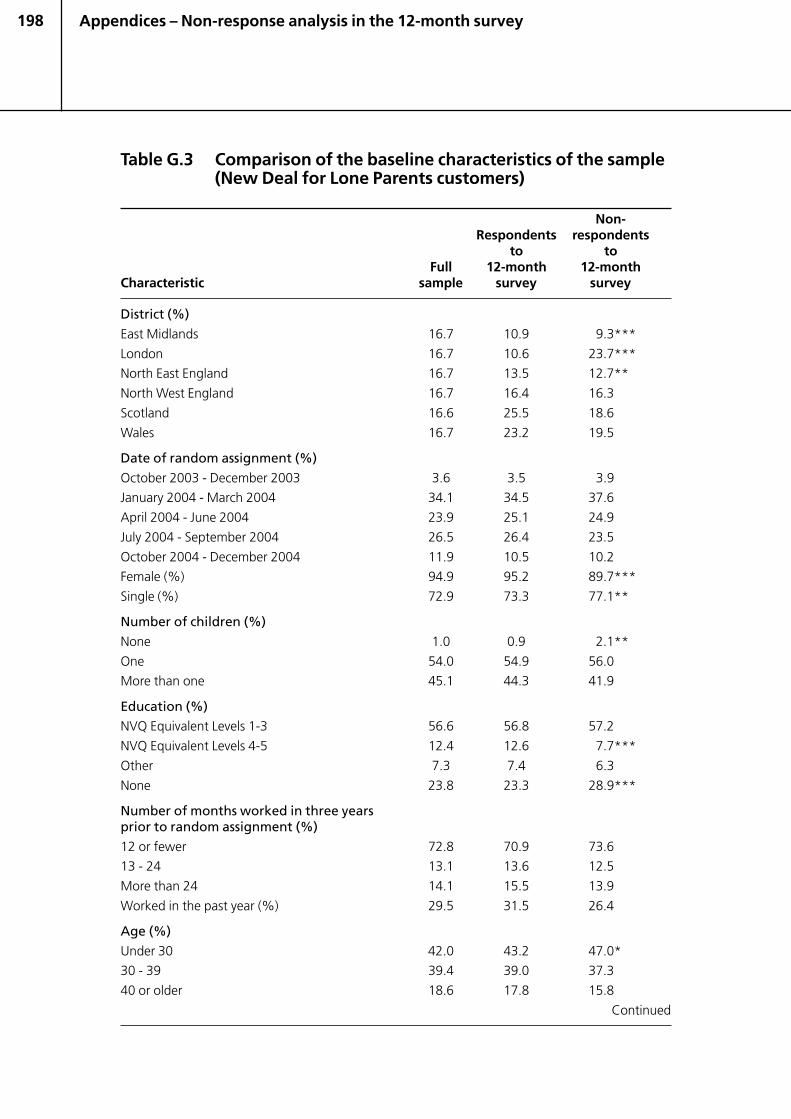
198
Table G.3 Comparison of the baseline characteristics of the sample(New Deal for Lone Parents customers)
Non-Respondents respondents
to toFull 12-month 12-month
Characteristic sample survey survey
District (%)
East Midlands 16.7 10.9 9.3***
London 16.7 10.6 23.7***
North East England 16.7 13.5 12.7**
North West England 16.7 16.4 16.3
Scotland 16.6 25.5 18.6
Wales 16.7 23.2 19.5
Date of random assignment (%)
October 2003 - December 2003 3.6 3.5 3.9
January 2004 - March 2004 34.1 34.5 37.6
April 2004 - June 2004 23.9 25.1 24.9
July 2004 - September 2004 26.5 26.4 23.5
October 2004 - December 2004 11.9 10.5 10.2
Female (%) 94.9 95.2 89.7***
Single (%) 72.9 73.3 77.1**
Number of children (%)
None 1.0 0.9 2.1**
One 54.0 54.9 56.0
More than one 45.1 44.3 41.9
Education (%)NVQ Equivalent Levels 1-3 56.6 56.8 57.2
NVQ Equivalent Levels 4-5 12.4 12.6 7.7***
Other 7.3 7.4 6.3
None 23.8 23.3 28.9***
Number of months worked in three yearsprior to random assignment (%)
12 or fewer 72.8 70.9 73.6
13 - 24 13.1 13.6 12.5
More than 24 14.1 15.5 13.9
Worked in the past year (%) 29.5 31.5 26.4
Age (%)
Under 30 42.0 43.2 47.0*
30 - 39 39.4 39.0 37.3
40 or older 18.6 17.8 15.8
Continued
Appendices – Non-response analysis in the 12-month survey
199
Table G.3 Continued
Non-Respondents respondents
to toFull 12-month 12-month
Characteristic sample survey survey
Age of youngest child (%)Under 6 51.0 52.3 55.5
6 - 18 48.0 46.9 42.4*
Non-white race/ethnicity (%) 12.6 10.0 14.5
Weekly earnings in the past year for current/most recent job (£) 27.90 29.94 26.73
Number of months on benefit in the two yearsprior to random assignment 17.36 17.06 16.95
Sample size 6,066 2,604 391
Source: MDRC calculations from baseline, ERA 12-month customer survey, and administrativerecords benefits data.
Notes: Benefit refers to JSA for ND25+ customers, IS for NDLP customers, and a combination ofthe two for WTC customers.
Rounding may cause slight discrepancies in calculating sums and differences.
Two-tailed t-tests were applied to differences between outcomes for the respondent group andthe non-respondent group. Statistical significance levels are indicated as: * = 10 per cent;** = 5 per cent and *** = 1 per cent.
Appendices – Non-response analysis in the 12-month survey
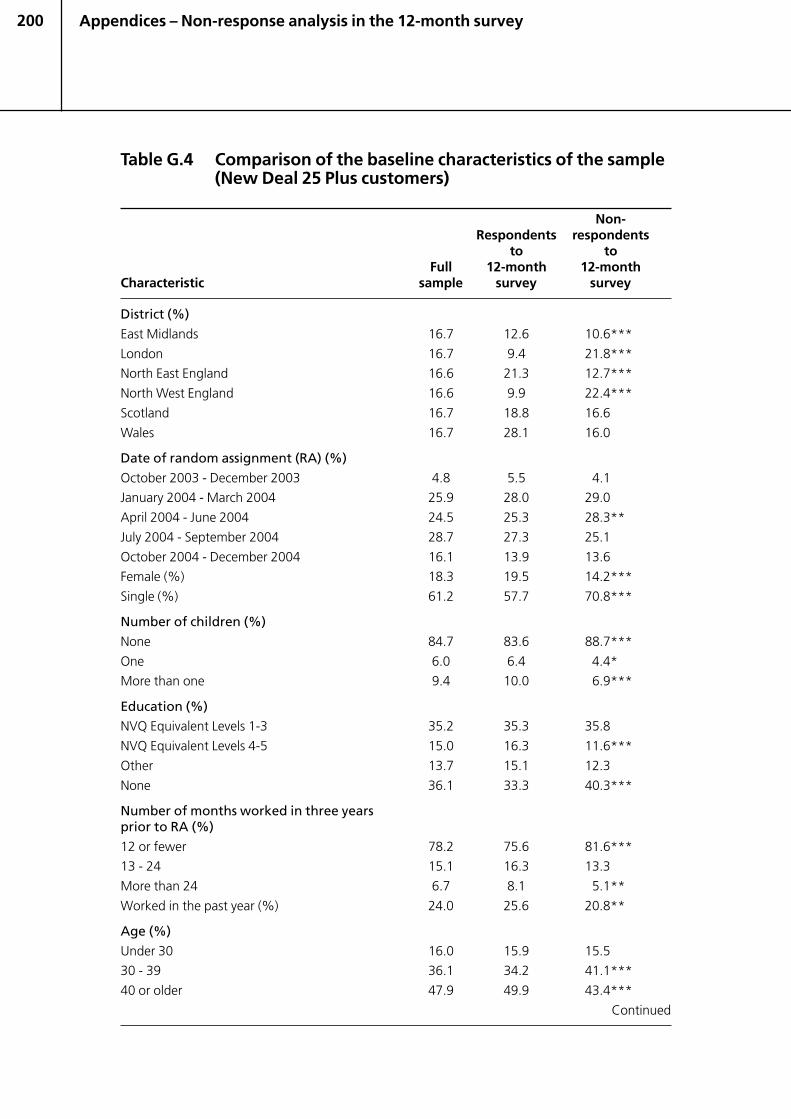
200
Table G.4 Comparison of the baseline characteristics of the sample(New Deal 25 Plus customers)
Non-Respondents respondents
to toFull 12-month 12-month
Characteristic sample survey survey
District (%)
East Midlands 16.7 12.6 10.6***
London 16.7 9.4 21.8***
North East England 16.6 21.3 12.7***
North West England 16.6 9.9 22.4***
Scotland 16.7 18.8 16.6
Wales 16.7 28.1 16.0
Date of random assignment (RA) (%)
October 2003 - December 2003 4.8 5.5 4.1
January 2004 - March 2004 25.9 28.0 29.0
April 2004 - June 2004 24.5 25.3 28.3**
July 2004 - September 2004 28.7 27.3 25.1
October 2004 - December 2004 16.1 13.9 13.6
Female (%) 18.3 19.5 14.2***
Single (%) 61.2 57.7 70.8***
Number of children (%)
None 84.7 83.6 88.7***
One 6.0 6.4 4.4*
More than one 9.4 10.0 6.9***
Education (%)NVQ Equivalent Levels 1-3 35.2 35.3 35.8
NVQ Equivalent Levels 4-5 15.0 16.3 11.6***
Other 13.7 15.1 12.3
None 36.1 33.3 40.3***
Number of months worked in three yearsprior to RA (%)
12 or fewer 78.2 75.6 81.6***
13 - 24 15.1 16.3 13.3
More than 24 6.7 8.1 5.1**
Worked in the past year (%) 24.0 25.6 20.8**
Age (%)
Under 30 16.0 15.9 15.5
30 - 39 36.1 34.2 41.1***
40 or older 47.9 49.9 43.4***
Continued
Appendices – Non-response analysis in the 12-month survey

201
Table G.4 Continued
Non-Respondents respondents
to toFull 12-month 12-month
Characteristic sample survey survey
Age of youngest child (%)Under 6 7.7 8.1 6.9
6 - 18 7.5 8.1 4.4***
Non-white race/ethnicity (%) 16.5 10.8 22.6***
Weekly earnings in the past year for current/most recent job (£) 35.75 37.78 32.31
Number of months on benefit in the two yearsprior to random assignment 19.10 18.77 19.68**
Sample size 6,074 2,213 757
Source: MDRC calculations from baseline, ERA 12-month customer survey, and administrativerecords benefits data.
Notes: Benefit refers to JSA for ND25+ customers, IS for NDLP customers, and a combination ofthe two for WTC customers.
Rounding may cause slight discrepancies in calculating sums and differences.
Two-tailed t-tests were applied to differences between outcomes for the respondent group andthe non-respondent group. Statistical significance levels are indicated as: * = 10 per cent;** = 5 per cent and *** = 1 per cent.
Appendices – Non-response analysis in the 12-month survey
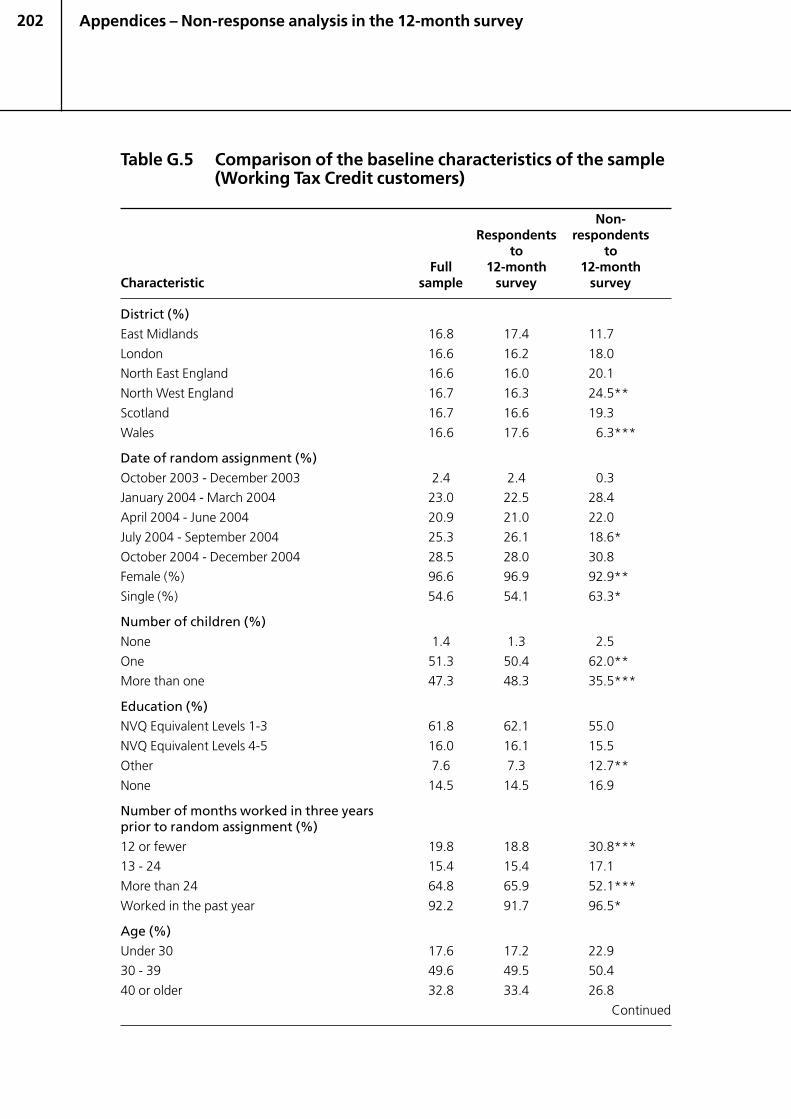
202
Table G.5 Comparison of the baseline characteristics of the sample(Working Tax Credit customers)
Non-Respondents respondents
to toFull 12-month 12-month
Characteristic sample survey survey
District (%)
East Midlands 16.8 17.4 11.7
London 16.6 16.2 18.0
North East England 16.6 16.0 20.1
North West England 16.7 16.3 24.5**
Scotland 16.7 16.6 19.3
Wales 16.6 17.6 6.3***
Date of random assignment (%)
October 2003 - December 2003 2.4 2.4 0.3
January 2004 - March 2004 23.0 22.5 28.4
April 2004 - June 2004 20.9 21.0 22.0
July 2004 - September 2004 25.3 26.1 18.6*
October 2004 - December 2004 28.5 28.0 30.8
Female (%) 96.6 96.9 92.9**
Single (%) 54.6 54.1 63.3*
Number of children (%)
None 1.4 1.3 2.5
One 51.3 50.4 62.0**
More than one 47.3 48.3 35.5***
Education (%)NVQ Equivalent Levels 1-3 61.8 62.1 55.0
NVQ Equivalent Levels 4-5 16.0 16.1 15.5
Other 7.6 7.3 12.7**
None 14.5 14.5 16.9
Number of months worked in three yearsprior to random assignment (%)
12 or fewer 19.8 18.8 30.8***
13 - 24 15.4 15.4 17.1
More than 24 64.8 65.9 52.1***
Worked in the past year 92.2 91.7 96.5*
Age (%)
Under 30 17.6 17.2 22.9
30 - 39 49.6 49.5 50.4
40 or older 32.8 33.4 26.8
Continued
Appendices – Non-response analysis in the 12-month survey

203
Table G.5 Continued
Non-Respondents respondents
to toFull 12-month 12-month
Characteristic sample survey survey
Age of youngest child (%)Under 6 31.8 30.4 47.2***
6 - 18 66.8 68.3 50.3***
Non-white race/ethnicity (%) 11.0 10.5 10.1
Weekly earnings in the past year for current/most recent job (£) 105.62 106.59 92.10***
Number of months on benefit in the two yearsprior to random assignment 4.81 4.61 6.89***
Sample size 1,464 1,344 103
Source: MDRC calculations from baseline, ERA 12-month customer survey, and administrativerecords benefits data.
Notes: Benefit refers to JSA for ND25+ customers, IS for NDLP customers, and a combination ofthe two for WTC customers.
Rounding may cause slight discrepancies in calculating sums and differences.
Two-tailed t-tests were applied to differences between outcomes for the respondent group andthe non-respondent group. Statistical significance levels are indicated as: * = 10 per cent;** = 5 per cent and *** = 1 per cent.
Appendices – Non-response analysis in the 12-month survey
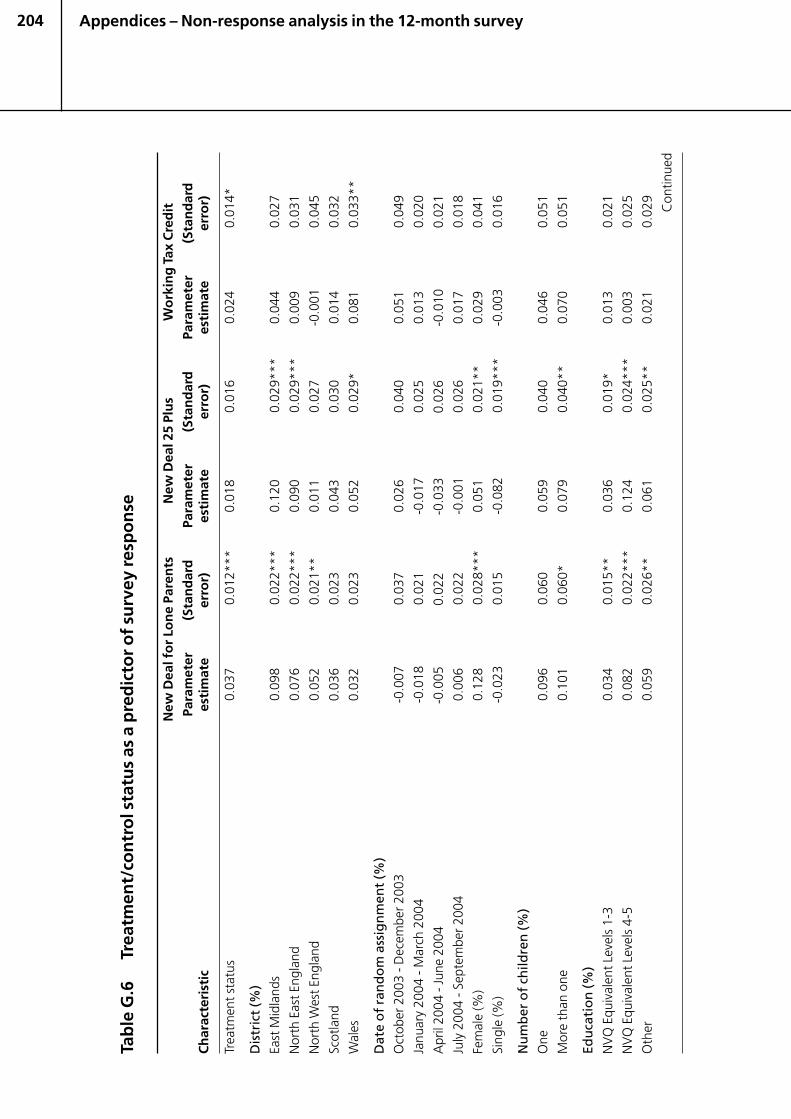
204
Tab
le G
.6Tr
eatm
ent/
con
tro
l sta
tus
as a
pre
dic
tor
of
surv
ey r
esp
on
se
New
Dea
l fo
r Lo
ne
Pare
nts
New
Dea
l 25
Plu
sW
ork
ing
Tax
Cre
dit
Para
met
er(S
tan
dar
dPa
ram
eter
(Sta
nd
ard
Para
met
er(S
tan
dar
dC
har
acte
rist
ices
tim
ate
erro
r)es
tim
ate
erro
r)es
tim
ate
erro
r)
Trea
tmen
t st
atus
0.03
70.
012*
**0.
018
0.01
60.
024
0.01
4*
Dis
tric
t (%
)Ea
st M
idla
nds
0.09
80.
022*
**0.
120
0.02
9***
0.04
40.
027
Nor
th E
ast E
ngla
nd0.
076
0.02
2***
0.09
00.
029*
**0.
009
0.03
1
Nor
th W
est E
ngla
nd0.
052
0.02
1**
0.01
10.
027
-0.0
010.
045
Scot
land
0.03
60.
023
0.04
30.
030
0.01
40.
032
Wal
es0.
032
0.02
30.
052
0.02
9*0.
081
0.03
3**
Dat
e o
f ra
nd
om
ass
ign
men
t (%
)O
ctob
er 2
003
- Dec
embe
r 200
3-0
.007
0.03
70.
026
0.04
00.
051
0.04
9
Janu
ary
2004
- M
arch
200
4-0
.018
0.02
1-0
.017
0.02
50.
013
0.02
0
Apr
il 20
04 -
June
200
4-0
.005
0.02
2-0
.033
0.02
6-0
.010
0.02
1
July
200
4 - S
epte
mbe
r 200
40.
006
0.02
2-0
.001
0.02
60.
017
0.01
8
Fem
ale
(%)
0.12
80.
028*
**0.
051
0.02
1**
0.02
90.
041
Sing
le (%
)-0
.023
0.01
5-0
.082
0.01
9***
-0.0
030.
016
Nu
mb
er o
f ch
ildre
n (%
)
One
0.09
60.
060
0.05
90.
040
0.04
60.
051
Mor
e th
an o
ne0.
101
0.06
0*0.
079
0.04
0**
0.07
00.
051
Edu
cati
on
(%)
NV
Q E
quiv
alen
t Lev
els
1-3
0.03
40.
015*
*0.
036
0.01
9*0.
013
0.02
1
NV
Q E
quiv
alen
t Lev
els
4-5
0.08
20.
022*
**0.
124
0.02
4***
0.00
30.
025
Oth
er0.
059
0.02
6**
0.06
10.
025*
*0.
021
0.02
9
Con
tinue
d
Appendices – Non-response analysis in the 12-month survey
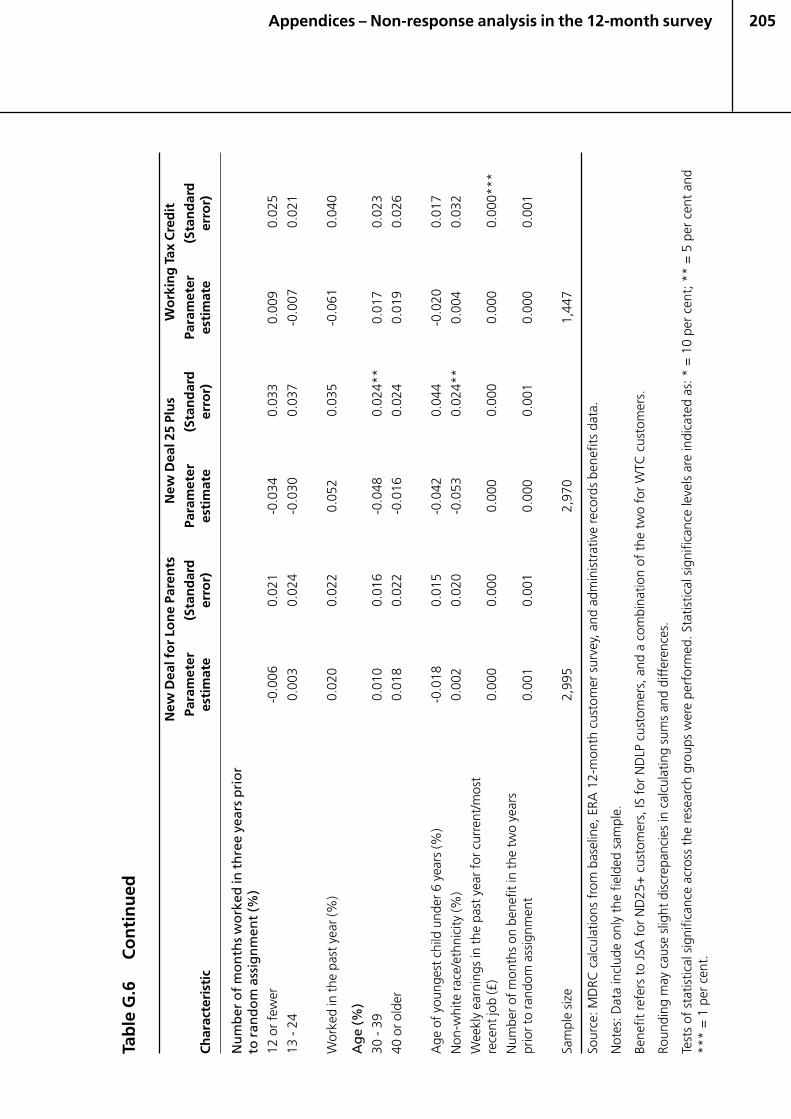
205
Tab
le G
.6C
on
tin
ued
New
Dea
l fo
r Lo
ne
Pare
nts
New
Dea
l 25
Plu
sW
ork
ing
Tax
Cre
dit
Para
met
er(S
tan
dar
dPa
ram
eter
(Sta
nd
ard
Para
met
er(S
tan
dar
dC
har
acte
rist
ices
tim
ate
erro
r)es
tim
ate
erro
r)es
tim
ate
erro
r)
Nu
mb
er o
f m
on
ths
wo
rked
in t
hre
e ye
ars
pri
or
to r
and
om
ass
ign
men
t (%
)12
or f
ewer
-0.0
060.
021
-0.0
340.
033
0.00
90.
025
13 -
240.
003
0.02
4-0
.030
0.03
7-0
.007
0.02
1
Wor
ked
in th
e pa
st y
ear (
%)
0.02
00.
022
0.05
20.
035
-0.0
610.
040
Ag
e (%
)
30 -
390.
010
0.01
6-0
.048
0.02
4**
0.01
70.
023
40 o
r old
er0.
018
0.02
2-0
.016
0.02
40.
019
0.02
6
Age
of y
oung
est c
hild
und
er 6
yea
rs (%
)-0
.018
0.01
5-0
.042
0.04
4-0
.020
0.01
7
Non
-whi
te ra
ce/e
thni
city
(%)
0.00
20.
020
-0.0
530.
024*
*0.
004
0.03
2
Wee
kly
earn
ings
in th
e pa
st y
ear f
or c
urre
nt/m
ost
rece
nt jo
b (£
)0.
000
0.00
00.
000
0.00
00.
000
0.00
0***
Num
ber o
f mon
ths
on b
enef
it in
the
two
year
spr
ior t
o ra
ndom
ass
ignm
ent
0.00
10.
001
0.00
00.
001
0.00
00.
001
Sam
ple
size
2,99
52,
970
1,44
7
Sour
ce: M
DRC
cal
cula
tions
fro
m b
asel
ine,
ERA
12-
mon
th c
usto
mer
sur
vey,
and
adm
inis
trat
ive
reco
rds
bene
fits
data
.
Not
es: D
ata
incl
ude
only
the
fie
lded
sam
ple.
Bene
fit re
fers
to
JSA
for
ND
25+
cus
tom
ers,
IS f
or N
DLP
cus
tom
ers,
and
a c
ombi
natio
n of
the
tw
o fo
r W
TC c
usto
mer
s.
Roun
ding
may
cau
se s
light
dis
crep
anci
es in
cal
cula
ting
sum
s an
d di
ffer
ence
s.
Test
s of
sta
tistic
al s
igni
fican
ce a
cros
s th
e re
sear
ch g
roup
s w
ere
perf
orm
ed. S
tatis
tical
sig
nific
ance
leve
ls a
re in
dica
ted
as: *
= 1
0 pe
r ce
nt; *
* =
5 p
er c
ent
and
***
= 1
per
cen
t.
Appendices – Non-response analysis in the 12-month survey

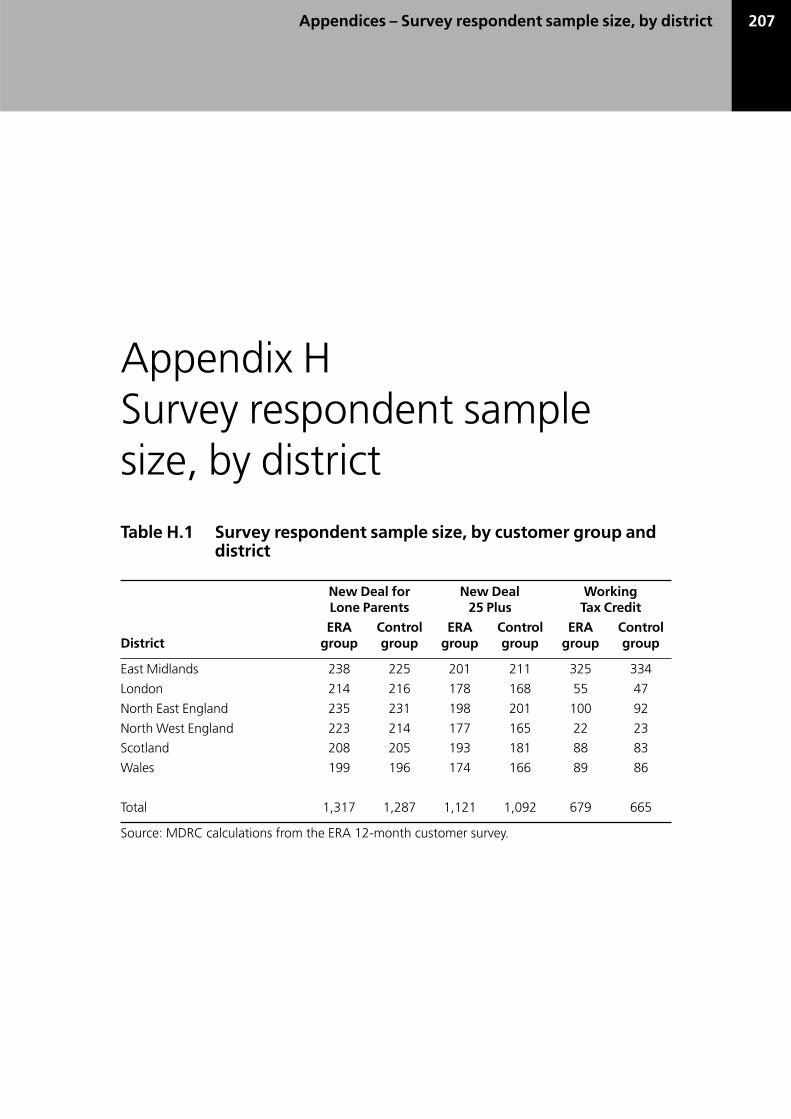
207
Appendix HSurvey respondent samplesize, by district
Table H.1 Survey respondent sample size, by customer group anddistrict
New Deal for New Deal WorkingLone Parents 25 Plus Tax Credit
ERA Control ERA Control ERA ControlDistrict group group group group group group
East Midlands 238 225 201 211 325 334
London 214 216 178 168 55 47
North East England 235 231 198 201 100 92
North West England 223 214 177 165 22 23
Scotland 208 205 193 181 88 83
Wales 199 196 174 166 89 86
Total 1,317 1,287 1,121 1,092 679 665
Source: MDRC calculations from the ERA 12-month customer survey.
Appendices – Survey respondent sample size, by district

209References
ReferencesArulampalam, W. (2001) ‘Is unemployment really scarring? effects of unemploymentexperiences on wages’, Economic Journal, Royal Economic Society, Vol. 111, 475,pp F585-606.
Bloom, D., Hendra, R., Martinson, K. and Scrivener, S. (2005) The EmploymentRetention and Advancement project: early results from four sites, Washington, DC:US Department of Health and Human Services, Administration for Children andFamilies.
Brewer, M., Clark, T. and Myck, M. (2001) Credit where it’s due? an assessment ofthe new tax credits, Commentary 86, London: The Institute for Fiscal Studies.
Brewer, M. and Shephard, A. (2005) Employment and the labour market: electionbriefing 2005, London: The Institute for Fiscal Studies.
Department for Work and Pensions (2004) Building on New Deal: local solutionsmeeting individual needs, Web site: www.dwp.gov.uk/publications/dwp/2004/buildingonnewdeal/mainreport.pdf.
Department for Work and Pensions (2005) Principles of welfare reform: the valuesand principles which shape the government’s vision of the future welfare state, Website: www.dwp.gov.uk/welfarereform/docs/Principles_of_Welfare_Reform.pdf.
Department for Work and Pensions, Tabulation Tool. Web site: www.dwp.gov.uk/asd/tabtool.asp.
Dex, S. and Smith, C. (2001) Employees’ access to family-friendly policies andpractices: analysis of the 1998 Workplace Employee Relations Survey, Cambridge:University of Cambridge.
Dickens, R. (unpublished 2000a) The low pay – no pay cycle: a report for the welfareto work team, HM Treasury, London: Centre for Economic Performance, LondonSchool of Economics.
Dickens, R. (2000b) ‘Caught in a trap? wage mobility in Britain: 1975-1994’,Economica 67, pp 477-497.
210
Evans, M., Harkness, S. and Arigoni Ortiz, R. (2004), Lone parents cycling betweenwork and benefits, Department for Work and Pensions Research Report No. 217,Leeds: Corporate Document Services.
Hales, J., Roth, W., Barnes, M., Millar, J., Lessof, C., Gloyer, M. and Shaw, A. (2000)Evaluation of the New Deal for Lone Parents: Early Lessons from the Phase OnePrototype – Findings of Surveys, Department of Social Security Research Report No.109, Leeds: Corporate Document Services.
Hall, N., Hamilton, G., Hoggart, L., Marsh, A., Phillips, J., Ray, K. and Vegeris, S.(2004) The Employment Retention and Advancement scheme: the first months,Unpublished report.
Harker, L. (2006) Delivering on child poverty: what would it take? Web site:www.dwp.gov.uk/publications/dwp/2006/harker/harker-full.pdf.
HM Treasury (2006) Leitch Review of Skills, Prosperity for all in the global economy– world class skills: final report, London: HM Treasury.
Hoggart, L., Campbell-Barr, V., Ray, K. and Vegeris, S. (2006) Staying in work andmoving up: Evidence from the UK Employment Retention and Advancement (ERA)demonstration, Department for Work and Pensions Research Report No. 381,Leeds: Corporate Document Services.
Lissenburgh, S. (2000) The New Deal for the long-term unemployed pilots:quantitative evaluation using stage 2 survey, Research and Development Report 81,Sheffield: Employment Service.
Machin, S. (1999) Wage inequality in the 1970s, 1980s and 1990s, in Gregg, P. andWadsworth, J. (eds), The state of working Britain, Manchester: Manchester UniversityPress.
Marsh, A. (unpublished 2001) Employment stability among British lone parents:paper II, London: Department for Work and Pensions.
Martinson, K. and Hendra, R. (2006) The Employment Retention and Advancementproject: results from the Texas ERA site, Washington, DC: US Department of Healthand Human Services, Administration for Children and Families.
Millar, J. and Ridge, T. (2002) Families, Poverty, Work and Care: A review of theliterature on lone parents and low-income couple families, Department for Workand Pensions Research Report No. 153, Leeds: Corporate Document Services.
Morris, S., Greenberg, D., Riccio, J., Mittra, B., Green, H., Lissenburgh, S. andBlundell, R. (2003) Designing a demonstration project: an Employment Retentionand Advancement demonstration for Great Britain, London: Cabinet Office.
Office for National Statistics. ‘Nomis database of labour market statistics’, Web site:www.nomisweb.co.uk.
References
211
Scrivener, S., Azurdia, G. and Page, J. (2005) The Employment Retention andAdvancement project: results from the South Carolina ERA site, Washington, DC:US Department of Health and Human Services, Administration for Children andFamilies.
Stewart, M. and Swaffield, J. (1999) ‘Low pay dynamics and transition probabilities’,Economica 66, pp 23-42.
Vegeris, S. and Perry, J. (2003) Families and children 2001: Living standards and thechildren, Department for Work and Pensions Research Report No. 190, Leeds:Corporate Document Services.
Walker, R., Hoggart, L. and Hamilton, G. (2006) Making random assignmenthappen: Evidence from the UK Employment Retention and Advancement (ERA)demonstration, Department for Work and Pensions Research Report No. 330,Leeds: Corporate Document Services.
Young, M. (2001) ‘People leaving employment: characteristics and flows’, LabourMarket Trends 109 (11), pp 515-522.
References


