impact of humate complexation on the adsorption of ree onto fe oxyhydroxide
TRANSCRIPT

f organicandns
ionn anionic
heostever, suchThe present
onstration
Journal of Colloid and Interface Science 277 (2004) 271–279www.elsevier.com/locate/jcis
Impact of humate complexation on the adsorption of REEonto Fe oxyhydroxide
Mélanie Davranche∗, Olivier Pourret, Gérard Gruau, Aline Dia
CAREN, Géosciences Rennes, UMR CNRS 6118, Campus de Beaulieu, 35042 Rennes Cedex, France
Received 19 February 2004; accepted 8 April 2004
Available online 18 May 2004
Abstract
Adsorption experiments of rare-earth elements (REE) onto hydrous ferric oxide (HFO) were performed to evaluate the impact ocomplexation on both REE(III) adsorption and the Ce(III) oxidation rate.Scavenging experiments were performed at pH 5.2 with NaClNaNO3 solutions containing either free REE (III)or REE(III)–humate complexes. The logKREE
d patterns obtained from HFO suspensioexhibit a slight positive Ce anomaly and an M-type lanthanide tetrad effect, in contrast with the partitioning betweenREE(III)–humate com-
plexes and HFO, which yields completely flat distribution patterns. The “organic” partitioning runs yield logKREEorganicd / logKDOC
d ratios(DOC= dissolved organic carbon) close to 1.0, implying that the REE(III) and humate remain bound to each other during the adsorptexperiment. The lack of any positive Ce anomaly or M-type lanthanide tetrad effect in the organic experiments seems to reflect aadsorption of the REE–humate complex. Adsorption onto HFO takes place via the humate side of the REE(III)–humate complexes. Toxidation of Ce(III) by Fe(III) and the proportion of surface hydroxyl groups coordinated to REE(III) at the HFO surface are the two mcommonly invoked processes for explaining the development of positive Ce anomalies and the M-type tetrad lanthanide effect. Howprocesses cannot proceed since the REE are not in direct contact with the HFO suspensions, the latter being shielded by PHA.results further complicate the use of Ce anomalies as reliable paleoredox proxies in natural precipitates. They are also further demthat organic matter may inhibit the lanthanide tetrad effect in geological samples. 2004 Elsevier Inc. All rights reserved.
Keywords: Ce anomaly; REE; Humic acid; Hydrous ferric oxide; Oxidation/scavenging; Ternary surface complex
n-
ase, andmi-
upotion
nts)
hy-ajor
e).
and
tions,l de-anwa-
sses
leim-
Mn–ua-s.can
ng
1. Introduction
Hydrous ferric oxides (HFO) are often thought to cotrol the mobility of trace elements in aqueous systems[1].Due to their large specific surface area, these mineral phare indeed very effective scavengers of trace elementshence they exert a key control on the concentration andgration of trace metals in aqueous systems[2]. Interactionsbetween trace elements and Fe oxyhydroxides dependvarious processes such as adsorption, surface precipitaand, in the particular case of the REE (rare earth elemeoxidation/scavenging[3–5].
Understanding the REE distribution between Fe oxydroxides and aqueous solutions continues to be a missue in REE studies on geochemical processes[6]. Ma-
* Corresponding author. Fax: +33-223-235-787.E-mail address: [email protected] (M. Davranch
0021-9797/$ – see front matter 2004 Elsevier Inc. All rights reserved.doi:10.1016/j.jcis.2004.04.007
s
n,
,
rine ferromanganese crusts are fairly enriched in REEsome of them exhibit large positive Ce anomalies[7–11].Deep-sea ferromanganese nodules, banded iron formaand Fe and Mn concretions in paleosols are geologicaposits of major geochemicalimportance, because they crecord the REE signatures of ancient marine and freshters[8,12–16].
Several authors have examined the adsorption proceof REE onto Fe oxyhydroxides and Mn oxides[3–5,17,18].Koeppenkastrop and De Carlo[3] presented the availabdata on sorption of REE from seawater, noting the close silarity between their experimentally determinedKREE
d val-ues and those estimated from REE analyses of marineFe deposits and seawater samples. More recently, Ba[4]and Ohta and Kawabe[5] reported experimental investigtions of the sorption of REE from low-salinity solutionThese authors showed that (i) Fe and Mn oxyhydroxidesboth oxidize Ce(III) into Ce(IV), even though the resulti

272 M. Davranche et al. / Journal of Colloid and Interface Science 277 (2004) 271–279
tuchatpat-
Fe
r-xy-nr in
(III).e of
ss inndectn-
,zedrsUl-
a-arednceCP-sity
ann)Mi-
tatea-
ly,f theestal-olidapacod,x-kenre-
ithhen o
rede-
eq
po-
tithFO
iccidby
h-tal
le-d10)
ed asinofml
on-EE
eeumto
enialy-exesin-
timesi-byby
t
-0%ontod toht
der
preferential enrichment of Ce as compared to its trivalenREE neighbors (the so-called positive Ce-anomaly) is mlarger with Mn oxide than with Fe oxyhydroxide, and (ii)pH � 5, the M-type lanthanide tetrad effect appears onterns of apparent REE distribution coefficients betweenand Mn oxyhydroxides and aqueous solutions.
However, very little is known about the influence of oganic matter on the sorptive properties of REE on Fe ohydroxides. The speciation of the REE partitioning betweeFe oxyhydroxide and solution governs the REE behavionatural waters, as well as the oxidative scavenging of CeThis behavior has possible major implications on the usCe anomalies as paleo-redox proxies[19–23]. The aim ofthis article is (i) to compare apparentKREE
d between hydrouferric oxide (HFO) suspensions and synthetic solutionwhich the REE(III) occurs alternatively as free REE(III) aREE(III)–humate complexes and (ii) to examine the effof organic complexation on Ce(III) oxidation and tetrad lathanide effects in the presence of HFO.
2. Materials and methods
All chemicals used in this study were of analytical gradeand the solutions were all prepared with doubly deioniwater (Milli-Q system, Millipore). Polyethylene containeused in the adsorption experiments were soaked in 10%trapur HNO3 for 48 h at 60◦C and then rinsed with Milli-Qwater for 24 h at 60◦C to remove all possible REE contmination sources. Synthetic REE solutions were prepfrom nitrate REE standards (10 ppm, Accu Trace RefereStandard). REE concentrations were determined by IMS—HP 4500, Agilent Technologies at Rennes Univer(France) (seeAppendix A).
2.1. HFO: hydrous ferric oxide
The HFO was synthesized according to Schwertmand Cornell[24]. A quantity of 1.5 mol of NaOH (pelletswas added slowly to 1 L of a solution containing 0.5Fe(NO3)3. The solution was continuously bubbled with ntrogen to avoid carbonate precipitation. The HFO precipiwas centrifuged and washed several times with Milli-Q wter, dried at 20◦C, sieved for homogenization, and, finalstored in a dessicator. The crystallographic structure oHFO was checked by X-ray diffraction (XRD). Analysrevealed a two-line ferrihydrite and traces of poorly cryslized goethite. The total number of surface sites of the sphase was estimated using the solid cation exchange city (CEC) determined from the cobalthexammine methISO 11260[25]. Ions bound to the solid surface were echanged with cobalthexammine ions, the CEC being taas equal to the concentration of cobalthexammine ionsmoved from solution. Five grams of HFO were mixed w10 ml of 0.017 M cobalthexammine solution for 3 h. Tsuspension was then centrifuged and the concentratio
-
f
cobalthexammine ion remaining in solution was measuat 470 nm with a Shimadzu 160 A UV spectrophotomter. The CEC of the HFO used in this study is 24.5 m/100 g.
The surface acidity constants were determined fromtentiometric titrations of suspensions of 5 g L−1 HFO withNaOH (0.1 M) or HNO3 (0.1 M), with a 0.1 M NaCl solutionas the supporting electrolyte[26]. Titrations were carried ouwith a Metrohm 794 DMS Titrino apparatus equipped wa Metrohm combined (3 M KCl) glass electrode. The Hacidity constants obtained were pKa1 = 6.77 and pKa2 =8.56, while pHzpc was 7.7.
2.2. REE(III)–humate complexes
Humate, referred to below as PHA (purified humacid), was obtained from the synthetic Aldrich humic a(Aldrich, H1, 675-2) according to the process describedVermeer et al.[27]. The PHA obtained in this way is asfree and in its protonated form, with the following elemencomposition (in weight percent): C= 55.8%, O= 38.9%,H = 4.6%, N= 0.6%. Purified humic acid has a mean mocular weight of 23,000 Da[27]. Prior to use, the freeze-driePHA was resuspended overnight in a NaOH solution (pHto ensure complete dissolution of the sample.
Rare earth element–humate complexes were preparfollows. Twenty mg of dissolved PHA were encloseda 250-ml sodium acetate dialysis bag with a pore size12,000–14,000 Da. The bag was introduced into 1000of a 5-ppb REE solution (corresponding to a molar ccentration range of 36 to 29 nM depending on the Rconsidered), the ionic strength being buffered at 10−3 Mwith NaCl or NaNO3, and the pH at 7 with HNO3. BothNaCl and NaNO3 were used as neutral electrolytes (sbelow). The suspension was stirred for 48 h (equilibritime determined from preliminary kinetic experiments),allow equilibration and partitioning of the REE betwethe aqueous solution and the PHA suspension. The dsis bag was then removed and the REE–PHA complrecovered. The concentrations of REE in solution bothside and outside the dialysis bag were monitored vsto quantify the amount of REE complexed to PHA. Posble REE adsorption onto the dialysis bag was checkedanalyzing the REE content of the membrane (dissolvedacidic digestion with HNO3 14 N). The results show thaaround 95% (≈4.75 ppb REE, with NaCl) or 60% (≈3 ppbREE, with NaNO3) of the REE initially present in the solution were complexed to the PHA. The remaining 5 or 4were left in solution outside the membrane or adsorbedthe dialysis bag. Moreover, complexation rates are founincrease slightly but regularly from the heavy to the ligREE, which is consistent with the constant stability ordetermined by Takahashi et al.[28] for REE(III)–humatecomplexes.

M. Davranche et al. / Journal of Colloid and Interface Science 277 (2004) 271–279 273
ithtwoas-
III)roml
erepe-of
o-nthattheandL
III)and
hirdthe
sing
pre-µm-
or-ub--eraly-
attra-
m-or-be
ua-
ter-OC
III)
er-ithith
yte
inoc-are
-aches
m-
-
dis-
the
e
erres,-
ide
fferm-f-edin-
ha-to
ges
h
2.3. Adsorption procedure
Four time-series experiments were carried out—two wthe REE occurring as REE(III)–humate complexes andwith the REE occurring as free aqueous species—tosess the effects of organic complexation during REE(adsorption onto HFO. All suspensions were made up f100 mg L−1 HFO left to equilibrate with a 0.001 M NaCor NaNO3 aqueous solution at pH 5.2. Experiments wcarried out at room temperature. The pH was monitoredriodically with a pH meter and adjusted to 5.2 by additionHNO3 (4.6 N) or NaOH (4 N). The pH value of 5.2 was chsen because it was sufficientlybasic to promote adsorptioprocesses, but low enough to avoid total REE sorptionmight mask any eventual development of Ce anomaly. Ininorganic experiment, a solution of 5 ppb REE was used,in the organic experiment, concentrations were 20 mg−1
for PHA, ≈4.75 ppb with NaCl, and≈3 ppb with NaNO3for REE, respectively.
The first set of experiments carried out with free REE(was essentially conducted to validate the experimentalanalytical protocol used in this study. In the second and tseries of experiments, the equilibration was made withREE(III)–PHA complexes described above.
We can describe the adsorption behavior of the REE uthe apparent partition coefficientKd, expressed as
(1)Kd = µg REE adsorbed/g HFO
µg ml−1 REE in solution.
Suspension aliquots of about 10 ml were sampled atdetermined time intervals and filtered in-line through 0.2-cellulose acetate membranes (Sartorius). The REE concentrations were then measured to determine theKREE
d vari-ations. Sample aliquots used for REE determination inganic experiments were all immediately digested with sboiled nitric acid (HNO3 14 N) at 100◦C and then resolubilized in 0.4 N HNO3 after complete evaporation in ordto avoid interference with organic matter during mass ansis.
REE concentrations were determined by ICP-MSRennes University. Precision of individual REE concentions and logKd values is estimated at±2% (seeAppen-dix A).
The adsorption behavior of the REE(III)–humate coplexes was also monitored by measuring the dissolvedganic carbon (DOC) content. DOC measurements canconverted into apparent partition coefficients using the eqtion
(2)Kd = µg DOC adsorbed/g HFO
µg ml−1 DOC in solution.
Dissolved organic carbon concentrations were demined at Rennes University using a Shimadzu 5000 Tanalyzer. The precision on DOC contents and logKDOC
d arebetter than±1.5%.
3. Results and discussion
3.1. Description of logKREEd and logKDOC
d patterns
The time dependence of the sorption of free REE(and REE–PHA complexes onto HFO is presented inFigs. 1and 2, respectively. Both the organic and inorganic expiments exhibit a faster adsorption in runs conducted wNaCl solutions as compared with those conducted wNaNO3. However, the composition of the neutral electrol
has no effect on the equilibrium logKREEinorganicd values. Ad-
sorption kinetics were slowed down by a factor of 2organic experiments compared with runs where REE(III)curred as free species. The values of equilibrium log
more closely grouped than the logKREEinorganicd equilibrium
data. Ratios of logKREEorganicd / logKDOC
d are close to 1.0, indicating that the REE(III) and humate remain bound to eother during interaction of the REE(III)–humate complex
with the HFO surface. logKREEinorganicd equilibrium data be-
tween HFO and solutions containing free REE(III) are coparable to earlier values reported by Ohta and Kawabe[5] atsimilar pH conditions.
All inorganic patterns exhibit slight positive Ce anomalies and a clear M-type lanthanide tetrad effect (Fig. 3).The tetrad effect often corresponds to a very smallcrete feature in the REE patterns of geological samples[29].However, in the present study, the total uncertainty onREE and logKREE
d is estimated at 2%. In NaNO3 inor-
ganic experiment, the difference between logKEuinorganicd and
logKGdinorganicd is 0.2, which corresponds to 5.5% of th
logKGdinorganicd value. This relative error of 5.5% is far high
than the uncertainty determined for analytical measuconfirming that the observed tetrad effect reflects a true feature rather than an analytical artifact.
Positive Ce anomalies and a clear M-type lanthantetrad effect were already apparent in the logKREE
d pat-terns obtained by Bau[4] and Ohta and Kawabe[5] undersimilar experimental conditions. Ceinorganic anomaly values(Ce/Ce*) as calculated by logKCe
d −[(logKPrd + logKLa
d )/2]range from 0.11 to 0.15. However, organic patterns dimarkedly from the former in showing no positive Ce anoaly (Ce/Ce*= 0.01) and no M-type lanthanide tetrad efect (Fig. 4). The general lack of a conspicuous M-shaplanthanide tetrad effect in the organic patterns is veryteresting and probably highly significant for the mecnism(s) of adsorption of the REE(III)–PHA complexes onHFO.
The complexation of REE(III) by humic acid has a lareffect onKREE
d equilibrium values. Time-series variation
of logKREEorganicd indicate that equilibrium is modified, 60
under organic conditions vs 40 h in inorganic experiments(Figs. 1 and 2).

274 M. Davranche et al. / Journal of Colloid and Interface Science 277 (2004) 271–279
Fig. 1. logKREEinorganicd values between HFO suspensions and (a) NaCl and (b) NaNO3 aqueous solutions, plotted vs equilibrium time.
dffectMnnotecteinge
ere-III)sed
d toionith
nd
-nd
on
w-facerity
t thehoutithec-
el
oups
end
3.2. Description of mechanisms
Organic complexation may inhibit Ce(III) oxidation anprevent the development of a M-type lanthanide tetrad eduring interaction between dissolved REE(III) and Fe–oxyhydroxides. REE patterns from the organic runs doexhibit any Ce anomaly or M-type lanthanide tetrad effwhatever the supporting electrolyte (Fig. 4). Such results arclearly in strong contrast with the inorganic runs, implythat the mechanisms involvedunder organic conditions ardistinctly different.
Bau [4] and Ohta and Kawabe[5] suggested that thformation and growth of an M-type tetrad effect mightflect a change in the coordination state of the REE(adsorbed onto Fe and Mn oxyhydroxides. They propothat REE(III) adsorbed onto MnO2 are linked with hy-droxyl ions, water molecules, and oxygen that are bounthe Mn(IV). According to these authors, this coordinatwould explain the increase of a convex tetrad effect wpH, by increasing the proportion of hydroxyl ions bou
with REE(III). Similarly, Ce is oxidized to Ce(IV) by an oxidation/scavenging process involving dissolved Ce(III) asolid Mn–Fe oxyhydroxides. Evidence for this oxidatiprocess was given by Ohta and Kawabe[5], who determinedthe redox state of Mn in each of their experiments. Hoever, REE and Ce must be in contact with the solid surto allow both of these features to develop. The simila
of the logKREEorganicd and logKDOC
d patterns (Figs. 1 and 2)show that REE and humate are strongly linked and thabonding between these elements is maintained througthe reaction. Cation ligand complexes, denoted as ML (wM and L representing the cation and the ligand, resptively), can adsorb onto a solid (≡S) to form ternary surfaccomplexes either as≡S–LM (cation linked to the minerasurface over the ligand) or as≡S–O–ML (ligand linked tothe surface over the cation)[30,31]. The formation of bothtypes of complexes depends on whether the surface grof the oxide can participate in exchanging their OH− withthe cation–ligand complex. These reactions strongly dep

M. Davranche et al. / Journal of Colloid and Interface Science 277 (2004) 271–279 275
l
Fig. 2. logKREEinorganicd and logKDOC
d values between HFO suspensions and (a) NaCl and (b) NaNO3 aqueous solutions, plotted vs equilibrium time.
Fig. 3. Patterns of equilibrium logKREEinorganicd values derived from time-series experiments with aqueous solutions of NaNO3 (open symbols) and NaCl (ful
symbols). Note the slight positive Ce anomaly and the conspicuous lanthanide tetrad effect.

276 M. Davranche et al. / Journal of Colloid and Interface Science 277 (2004) 271–279
te
Fig. 4. Patterns of equilibrium logKREEinorganic derived from time-series experiments with solutions of NaNO3 (open symbols) and NaCl (full symbols). Nothe flatness of the logKREEd patterns.
thesorpn
5.2.olid
omde:
nor-
s ine
s-
nd,ob
ical
m-FOirnt-ns
rdlynts.lies-
ructtionydiz-argeesssesex-
itiveons.
thatn.
lieslaynicpat-igu-sis.
bythendar-
os-ect.
on pH. When the pH is lower than the solid pHzpc (the pHat which the solid surface charge is globally neutral; i.e.,positive charges are equal to the negative charges), adtion is of anionic type (≡S–LM). When pH is higher thapHzpc, the cationic type of adsorption (≡S–O–ML) is pro-moted. The HFO used in the experiments exhibits a pHzpc
value of 7.7, while the experiments were carried out atConsequently, this pH condition—much lower than the spHzpc—promotes anionic-type adsorption≡S–PHA–REE,where REE are present as REE/PHA complexes. The cplexes are bound to the HFO surface on their humate si
(3)≡S–OH+ REE–PHA� ≡S–PHA–REE+ OH−.
This process accounts for the modification of logKREEorganicd
values in the organic experiment as compared with the iganic runs (Figs. 1 and 2andFigs. 3 and 4).
Moreover, the tetrad effect expresses the differenceRacah parameters for 4f electron repulsion between thpair of REE complexes. Ohta and Kawabe[5] suggestedthat Racah parameters in REE3+ ions decrease with increaing covalence of bonding of REE3+ with ligands. If theREE–PHA complex is adsorbed onto HFO as≡S–O–ML(cationic adsorption), the Racah parameters are smaller aconsequently, a conspicuous M-type tetrad effect can be
served. Thus, the lack of tetrad effect inKREEorganicd suggests
that REE are bound solely to PHA, confirming the chemmechanism ofEq. (3).
The distribution of REE in the presence of organic coplex is determined by the distribution of humate at the Hsurface. Takahashi et al.[32] obtained the same result in thestudy of the adsorption of Cm(III) fulvate onto an acid momorillonite, even when using relatively low concentratioof organic matter.
-
-
-
3.3. Consequences on using the Ce anomaly asa paleo-redox proxy
The present study shows that the Ce anomaly can habe used as a paleo-redox proxy in organic-rich environmeThis particularly applies to paleosols, where Ce anomahave often been reported[13,16,21]and authors have explored the possibility of using Ce depletions to reconstthe redox state of paleosols at the time of their forma(e.g., [20]). From a paleoclimatic point of view, we maconsider that wet periods lead to the dominance of oxiing conditions in paleosols—due to the continuous rechof the soil solutions by oxygen-rich rainwater—a procthat would stabilize both Mn and Fe oxyhydroxide phain the weathering front. Just considering the inorganicperimental results of Bau[4] and Ohta and Kawabe[5], wewould expect the development of either negative or posCe anomalies in paleosols formed under such conditiHowever, these experimental results lead us to supposeorganic complexation can severely inhibit Ce(III) oxidatioThis calls into question the validity of using Ce anomaas areliable paleo-redox proxy in paleosols. The interpbetween variable redox conditions and the REE(III) orgaspeciation is expected to lead to complex Ce anomalyterns in paleosols. The behavior of Ce might not unambously reflect the redox conditions at time of the soil gene
4. Summary
Scavenging of dissolved REE(III)–PHA complexesHFO was experimentally studied to elucidate furtherrole played by humate ligands in REE(III) adsorption aCe(III) oxidation produced by Fe oxyhydroxides. The appent logKREE
d patterns in HFO suspensions exhibit slight pitive Ce anomalies and an M-type lanthanide tetrad eff

M. Davranche et al. / Journal of Colloid and Interface Science 277 (2004) 271–279 277
edareectarytruc-eentlytheby
raden
om-icalf thims
sis-hisPro-
-MSsityin-
en-tan-g toolu-
ntraiftthelcu-
-
ntalrdandtion
an
urednts.
tionthe
in-spo-Laaly
ms.d/ornot
or-t-fer-be-in
forehere,nt]-65
the
This is in contrast with the distribution patterns obtainbetween REE(III)–humate complexes and HFO, whichcompletely flat. These modifications are believed to reflan anionic adsorption of the organic complex. The terncomplexes formed at the surface of the HFO represent stures in which the binding of the REE(III)–PHA with thHFO surface takes place on the humate side. Consequthe humate ligand physically separates Ce(III) ions fromHFO catalysis surface, thus preventing their oxidationFe(III) and stopping the development of an M-type teteffect. The distribution of REE at the HFO surface is thgoverned by the behavior of humic substances.
These data add further limitations to the use of Ce analies in reconstructing redox conditions in ancient geologsystems. The present results strongly suggest that use oproxy could be rendered impossible in organic-rich systesuch as paleosols.
Acknowledgments
We thank the technical staff in Rennes for their astance during the experimental and analytical work. Tresearch was supported by the INSU–CNRS throughgramme PNSE.
Appendix A. REE analyses
Rare earth concentrations were determined by ICP(Agilent Technologies HP4500) at the Rennes Univer(France). Normal plasma conditions were used, with thestrumental parameters reported inTable 1.
Quantitative analyses were performed using a convtional external calibration procedure. Three external sdard solutions having REE concentrations correspondinthe samples were prepared from a multi-REE standard stion (Accu Trace reference, 10 mg L−1, USA). Indium wasadded to all samples as an internal standard at a concetion of 0.87 µM (100 ppb) to correct for instrumental drand possible matrix effects. Indium was also added toexternal standard solutions. Calibration curves were calated from measured REE/indium intensity ratios.
Table 1Instrumental and data acquisition parameters
RF power 1360 W
Plasma gas 15 L/minAuxiliary gas 1.0 L/minCarrier gas 1.13 L/min
Nebulizer type Cross-flowSpray chamber T◦ 2◦C
Integration time 3 s/mass
CeO+/Ce+ 0.6%Ce++/Ce+ 1%
,
s
-
Detection limits (DL) of the Agilent Technologies ICPMS set up at Rennes University (Table 2) were calculatedusing the following equation:
DL (pmol L−1) = 3SD× C
S − B.
SD is the standard deviation obtained during instrumeblank measurements,C the REE concentration of a standasolution (between 29 and 36 pM depending on the REE),S andB the ion counts measured during standard soluand instrumental blank analyses, respectively.
Chemical blanks of individual REE were all lower th10 pM, which is a negligible value (Table 2), three to fourorders of magnitude lower than the concentrations measin the synthetic solutions used in the adsorption experime
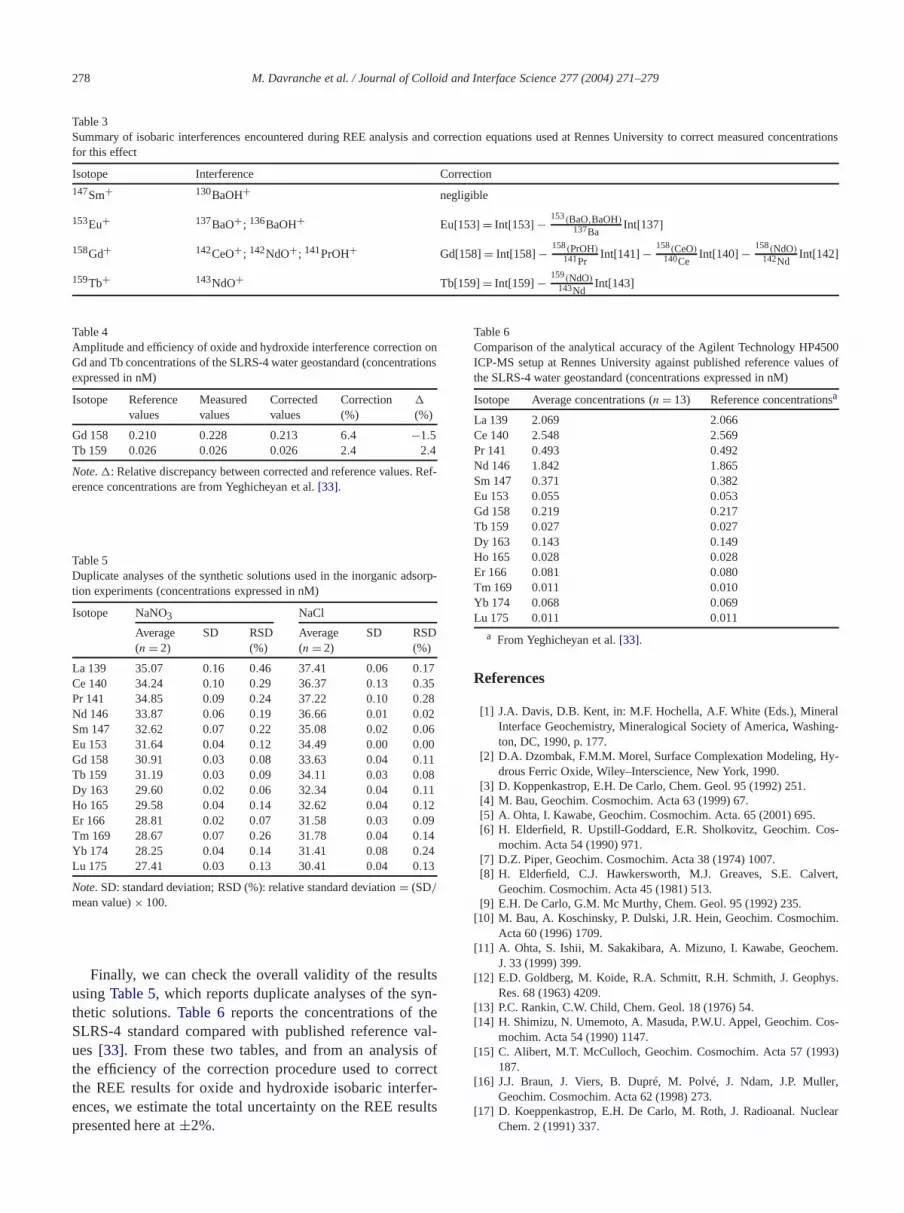
Isobaric interferences due to the formation and ionizaof oxides and/or hydroxides in the ICP-MS can modifydetermination of Sm, Eu, Gd, and Tb concentrations. Theterference list is given inTable 3, along with the equationused at Rennes to correct REE concentrations from thistential source of error. Note that Ce and its neighborsand Pr—and thus the calculated value of the Ce anomas well—are unaffected by isobaric interference probleThere was no need to correct Eu and Sm for BaO anBaOH interference because our synthetic solutions didcontain any Ba.
The amplitude and efficiency of the Gd and Tb crections can be evaluated fromTable 4, where we presenmeasured and corrected concentrations of Gd and Tb measured for the SLRS-4 water geostandard along with reence data[33]. The correction amplitudes are moderate,ing 6% for Gd and only 2% for Tb. The corrected valuesboth cases show relative discrepancies of�2.5%, thus ly-ing within the range of the reference values publishedthe SLRS-4 water geostandard[33]. These values should bregarded as maximum values for the results presentedsince the ratios of [Interfering Element]/[InterferedElemeare close to unity in our synthetic solutions, as against 10in the SLRS-4 geostandard.
Table 2Detection limits (DL) and chemical blanks (in pM) measured duringcourse of the study
Isotope DL Chemical blanks
La 139 1.15 4.37Ce 140 3.21 5.71Pr 141 0.64 2.35Nd 146 3.54 7.28Sm 147 5.52 0.64Eu 153 0.92 0.76Gd 158 2.67 2.07Tb 159 0.38 1.50Dy 163 1.29 2.76Ho 165 0.49 1.08Er 166 1.26 0.88Tm 169 0.59 1.27Yb 174 1.44 1.14Lu 175 0.51 0.85
278 M. Davranche et al. / Journal of Colloid and Interface Science 277 (2004) 271–279
Table 3Summary of isobaric interferences encountered during REE analysis and correction equationsused at Rennes University to correct measured concentrationsfor this effect
Isotope Interference Correction147Sm+ 130BaOH+ negligible
153Eu+ 137BaO+; 136BaOH+ Eu[153] = Int[153] − 153(BaO,BaOH)137Ba
Int[137]158Gd+ 142CeO+; 142NdO+; 141PrOH+ Gd[158]= Int[158]− 158(PrOH)
141PrInt[141]− 158(CeO)
140CeInt[140] − 158(NdO)
142NdInt[142]
159Tb+ 143NdO+ Tb[159]= Int[159] − 159(NdO)143Nd
Int[143]
nns
ef-
sorp-
ltsyn-eval-of
ctfer-sults
500es of
s
aling-
y-
os-
ert,
im.
.
ys.
s-
3)
ller,
r
Table 4Amplitude and efficiency of oxide andhydroxide interference correction oGd and Tb concentrations of the SLRS-4 water geostandard (concentratioexpressed in nM)
Isotope Referencevalues
Measuredvalues
Correctedvalues
Correction(%)
�
(%)
Gd 158 0.210 0.228 0.213 6.4 −1.5Tb 159 0.026 0.026 0.026 2.4 2.4
Note. �: Relative discrepancy between corrected and reference values. Rerence concentrations are from Yeghicheyan et al.[33].
Table 5Duplicate analyses of the synthetic solutions used in the inorganic adtion experiments (concentrations expressed in nM)
Isotope NaNO3 NaCl
Average(n = 2)
SD RSD(%)
Average(n = 2)
SD RSD(%)
La 139 35.07 0.16 0.46 37.41 0.06 0.17Ce 140 34.24 0.10 0.29 36.37 0.13 0.35Pr 141 34.85 0.09 0.24 37.22 0.10 0.28Nd 146 33.87 0.06 0.19 36.66 0.01 0.02Sm 147 32.62 0.07 0.22 35.08 0.02 0.06Eu 153 31.64 0.04 0.12 34.49 0.00 0.00Gd 158 30.91 0.03 0.08 33.63 0.04 0.11Tb 159 31.19 0.03 0.09 34.11 0.03 0.08Dy 163 29.60 0.02 0.06 32.34 0.04 0.11Ho 165 29.58 0.04 0.14 32.62 0.04 0.12Er 166 28.81 0.02 0.07 31.58 0.03 0.09Tm 169 28.67 0.07 0.26 31.78 0.04 0.14Yb 174 28.25 0.04 0.14 31.41 0.08 0.24Lu 175 27.41 0.03 0.13 30.41 0.04 0.13
Note. SD: standard deviation; RSD (%): relative standard deviation= (SD/
mean value)× 100.
Finally, we can check the overall validity of the resuusingTable 5, which reports duplicate analyses of the sthetic solutions.Table 6 reports the concentrations of thSLRS-4 standard compared with published referenceues[33]. From these two tables, and from an analysisthe efficiency of the correction procedure used to correthe REE results for oxide and hydroxide isobaric interences, we estimate the total uncertainty on the REE represented here at±2%.
Table 6Comparison of the analytical accuracy of the Agilent Technology HP4ICP-MS setup at Rennes University against published reference valuthe SLRS-4 water geostandard (concentrations expressed in nM)
Isotope Average concentrations (n = 13) Reference concentrationa
La 139 2.069 2.066Ce 140 2.548 2.569Pr 141 0.493 0.492Nd 146 1.842 1.865Sm 147 0.371 0.382Eu 153 0.055 0.053Gd 158 0.219 0.217Tb 159 0.027 0.027Dy 163 0.143 0.149Ho 165 0.028 0.028Er 166 0.081 0.080Tm 169 0.011 0.010Yb 174 0.068 0.069Lu 175 0.011 0.011
a From Yeghicheyan et al.[33].
References
[1] J.A. Davis, D.B. Kent, in: M.F. Hochella, A.F. White (Eds.), MinerInterface Geochemistry, Mineralogical Society of America, Washton, DC, 1990, p. 177.
[2] D.A. Dzombak, F.M.M. Morel, Surface Complexation Modeling, Hdrous Ferric Oxide, Wiley–Interscience, New York, 1990.
[3] D. Koppenkastrop, E.H. De Carlo, Chem. Geol. 95 (1992) 251.[4] M. Bau, Geochim. Cosmochim. Acta 63 (1999) 67.[5] A. Ohta, I. Kawabe, Geochim. Cosmochim. Acta. 65 (2001) 695.[6] H. Elderfield, R. Upstill-Goddard, E.R. Sholkovitz, Geochim. C
mochim. Acta 54 (1990) 971.[7] D.Z. Piper, Geochim. Cosmochim. Acta 38 (1974) 1007.[8] H. Elderfield, C.J. Hawkersworth, M.J. Greaves, S.E. Calv
Geochim. Cosmochim. Acta 45 (1981) 513.[9] E.H. De Carlo, G.M. Mc Murthy, Chem. Geol. 95 (1992) 235.
[10] M. Bau, A. Koschinsky, P. Dulski, J.R. Hein, Geochim. CosmochActa 60 (1996) 1709.
[11] A. Ohta, S. Ishii, M. Sakakibara, A. Mizuno, I. Kawabe, GeochemJ. 33 (1999) 399.
[12] E.D. Goldberg, M. Koide, R.A. Schmitt, R.H. Schmith, J. GeophRes. 68 (1963) 4209.
[13] P.C. Rankin, C.W. Child, Chem. Geol. 18 (1976) 54.[14] H. Shimizu, N. Umemoto, A. Masuda, P.W.U. Appel, Geochim. Co
mochim. Acta 54 (1990) 1147.[15] C. Alibert, M.T. McCulloch, Geochim. Cosmochim. Acta 57 (199
187.[16] J.J. Braun, J. Viers, B. Dupré, M. Polvé, J. Ndam, J.P. Mu
Geochim. Cosmochim. Acta 62 (1998) 273.[17] D. Koeppenkastrop, E.H. De Carlo, M. Roth, J. Radioanal. Nuclea
Chem. 2 (1991) 337.

M. Davranche et al. / Journal of Colloid and Interface Science 277 (2004) 271–279 279
.51
pa-
c. 80
4
.
terng-
66
z,ry,,
and.
[18] E.H. De Carlo, X.Y. Wen, M.Irving, Aquat. Geochem. 3 (1998) 357[19] J. Wright, H. Schrader, W.T. Holser, Geochim. Cosmochim. Acta
(1987) 631.[20] K.G. Macleod, A.J. Irving,J. Sedimentary Res. 66 (1996) 948.[21] S. Gallet, B.M. Jahn, M. Torii, Chem. Geol. 133 (1996) 67.[22] W.T. Holser, Paleogeol. Paleoclim. Paleoecol. 132 (1997) 309.[23] S. Morad, S. Felitsyn, Sedimentary Geol. 143 (2001) 259.[24] U. Schwertmann, R.M. Cornell, Iron Oxide in the Laboratory, Pre
ration and Characterization, VCH, Weinheim, 1996.[25] AFNOR, Qualité des Sols, AFNOR, Paris, 1994.[26] M. Davranche, S. Lacour, F. Bordas, J.-C. Bollinger, J. Chem. Edu
(2003) 76.[27] A.W.P. Vermeer, W.H. Van Riemdjik, L.K. Koopal, Langmuir 1
(1998) 2810.
[28] Y. Takahashi, Y. Minai, Y. Makide, F. Ambe, Geochim. CosmochimActa 63 (1999) 815.
[29] S.M. McLennan,Geochim. Cosmochim. Acta 58 (1994) 2025.[30] P.W. Schindler, in: M.F. Hochella, A.F. White (Eds.), Mineral–Wa
Interface Geochemistry, Mineralogical Society of America, Washiton, DC, 1990, p. 281.
[31] B. Nowack, L. Sigg, J. Colloid Interface Sci. 177 (1996) 106.[32] Y. Takahashi, T. Kimura, Y. Minai, Geochim. Cosmochim. Acta
(2002) 1.[33] D. Yeghicheyan, J. Carignan, M. Valladon, M. Bouhnik-Le Co
F. Le Cornec, M. Castrec-Rouelle, M. Robert, L. Aquilina, E. AubC. Churlaud, A. Dia, S. Deberdt,B. Dupré, R. Frédier, G. GruauO. Hénin, A.-M. De Kersabiec, P. Petitjean, E. Serrat, GeostNewslett. 25 (2002) 465.