impact of geometry and viewing angle on classification accuracy of 2d based analysis of dysmorphic...
TRANSCRIPT

Available online at www.sciencedirect.com
+ MODEL
European Journal of Medical Genetics 51 (2008) 44e53http://www.elsevier.com/locate/ejmg
Original article
Impact of geometry and viewing angleon classification accuracy of 2D based analysis
of dysmorphic faces
Tobias Vollmar a, Baerbel Maus a, Rolf P. Wurtz b,Gabriele Gillessen-Kaesbach c, Bernhard Horsthemke a,
Dagmar Wieczorek a, Stefan Boehringer a,*
a Institut fur Humangenetik, Universitat Duisburg-Essen, Hufelandstrasse 55, 45122 Essen, Germanyb Institut fur Neuroinformatik, Ruhr-Universitat Bochum, Germany
c Institut fur Humangenetik, Universitat zu Luebeck, Germany
Received 4 June 2007; accepted 6 October 2007
Available online 12 October 2007
Abstract
Digital image analysis of faces has been demonstrated to be effective in a small number of syndromes.In this paper we investigate several aspects that help bringing these methods closer to clinical application.First, we investigate the impact of increasing the number of syndromes from 10 to 14 as compared to anearlier study. Second, we include a side-view pose into the analysis and third, we scrutinize the effect ofgeometry information. Picture analysis uses a Gabor wavelet transform, standardization of landmark co-ordinates and subsequent statistical analysis. We can demonstrate that classification accuracy drops from76% for 10 syndromes to 70% for 14 syndromes for frontal images. Including side-views achieves an ac-curacy of 76% again. Geometry performs excellently with 85% for combined poses. Combination ofwavelets and geometry for both poses increases accuracy to 93%. In conclusion, a larger number of syn-dromes can be handled effectively by means of image analysis.� 2007 Elsevier Masson SAS. All rights reserved.
Keywords: Automated pattern recognition; Computer-assisted diagnosis; Classification; Dysmorphism; Face
* Corresponding author. Tel.: þ49 201 723 4533; fax: þ49 201 723 5900.
E-mail address: [email protected] (S. Boehringer).
1769-7212/$ - see front matter � 2007 Elsevier Masson SAS. All rights reserved.
doi:10.1016/j.ejmg.2007.10.002

45T. Vollmar et al. / European Journal of Medical Genetics 51 (2008) 44e53
1. Introduction
Syndrome diagnosis based on clinical examination of patients is a challenge in everydayclinical practice [16]. Databases are an integral part of this process complementing clinicalexpertise [14,17]. In the past we have shown that computer-based analysis of frontal picturesof faces might be a helpful addition to this process. We introduced a method of computer-basedsyndrome diagnosis based on 2D pictures processed by wavelet picture analysis and subsequentstatistical analysis [3,12]. By means of wavelet analysis, a sparse, yet informative, representa-tion of a picture can be achieved [13,18,19]. To optimize face analysis, information is focusedon certain landmarks in the face (model graph; Fig. 1). Using model graphs, a classificationaccuracy of w75% can be achieved among 10 syndromes [3], which roughly equals the perfor-mance of an ad hoc diagnosis by clinicians in a previous study [12]. As a consequence of grow-ing data complexity accuracy decreases as more syndromes are included (compare [3,12]).Therefore, it seems mandatory to enrich the data set with additional information. It is straight-forward to include side-views of faces which harbor, both, unique clinical features like ear andchin but also contribute three-dimensional information. An additional strategy is to include ge-ometry information, which is based on landmark coordinates. Geometry seems to be an impor-tant feature in human face recognition and processing [2,10,11] and should therefore contributeto the distinction of syndromes. For example the stability of manual landmark placement hasbeen demonstrated [1]. Also, many distances in the skull bone structures show significant her-itability [8,9,15]. Coordinates of landmarks have been successfully employed in the analysis of3D representation of faces [6,7]. In the cited study geometry was the sole information source.From these studies, it seems essential that landmark correspondence is good, i.e., the exactpositioning of nodes at predefined positions like nose-tip, lips, etc. [2,4,5]. This implies thatstandardization is required and manual positioning of landmarks improves results [3]. Wehave therefore opted to include geometry information into our data set by using coordinatesof manually placed landmarks, followed by standardization. We compare the relative impactof wavelet information of frontal and side-views with coordinate information and consider
Fig. 1. Example pictures of used model graphs in front and side-view pose.

46 T. Vollmar et al. / European Journal of Medical Genetics 51 (2008) 44e53
the combined data set. Finally, we use a data set of 14 syndromes which furthers our evaluationof the impact of the inclusion of more syndromes into our ongoing study.
2. Materials and methods
2.1. Probands
We acquired photographs of patients each being affected by one in 14 syndromes (Micro-deletion 22q11.2, WolfeHirschhorn syndrome, Cri-du-chat syndrome, Cornelia de Lange syn-drome, Fragile X syndrome, Mucopolysaccharidosis Type II, Mucopolysaccharidosis Type III,Noonan syndrome, PradereWilli syndrome, Progeria, SmitheLemlieOpitz syndrome, Sotossyndrome, Treacher Collins syndrome, WilliamseBeuren syndrome). Annual meetings ofparent support groups have been visited and written informed consent was given by theprobands or their responsible parents. In total n¼ 200 probands were included. Probands’ages ranged from 1 to 45 years. A breakup for individual syndromes is given in Table 1.This extends our previous data set by four newly added syndromes (WolfeHirschhornsyndrome, Mucopolysaccharidosis Type II, Progeria, Treacher Collins syndrome; Fig. 2; forother syndromes c.f. [3]).
2.2. Picture acquisition and selection
Arrangement of the equipment and illumination of the photographic setting were standard-ized and reproduced as accurately as possible at the different meetings. Three lighting sourcescreated a soft illumination and reduced shadows in the faces, which could otherwise affect lateranalyses. A homogeneous background was used throughout. We acquired, both, frontal andside-view pictures taken with a digital camera (Nikon Coolpix 950, Nikon Coolpix 4500)and a video sequence of a rotation of the proband around a vertical axis (Panasonic NV-MX350EG). Videos allowed for subsequent extraction of still pictures to achieve optimal pic-tures for both poses. Final picture selection was based on pose, sharpness and facial expression.For each individual a single picture was selected per pose.
Table 1
Characterization of the data set
Condition Age range Number of probands
Microdeletion 22q11.2 (22q-) 1.7e16.4 26
WolfeHirschhorn syndrome (4p-) 1.1e40.5 8
Cri-du-chat syndrome (5p-) 1.0e16.8 9
Cornelia de Lange syndrome 7.1e33.7 12
Fragile X syndrome 4.6e13.8 12
Mucopolysaccharidosis II 4.3e20.4 7
Mucopolysaccharidosis III 4.5e15.5 8
Noonan syndrome 0.6e37.2 15
PradereWilli syndrome 5.0e20.9 12
Progeria 5.7e8.4 5
SmitheLemlieOpitz syndrome 0.3e16.3 12
Sotos syndrome 1.0e20.3 15
Treacher Collins syndrome 1.6e45.3 12
WilliamseBeuren syndrome 2.9e45.0 43
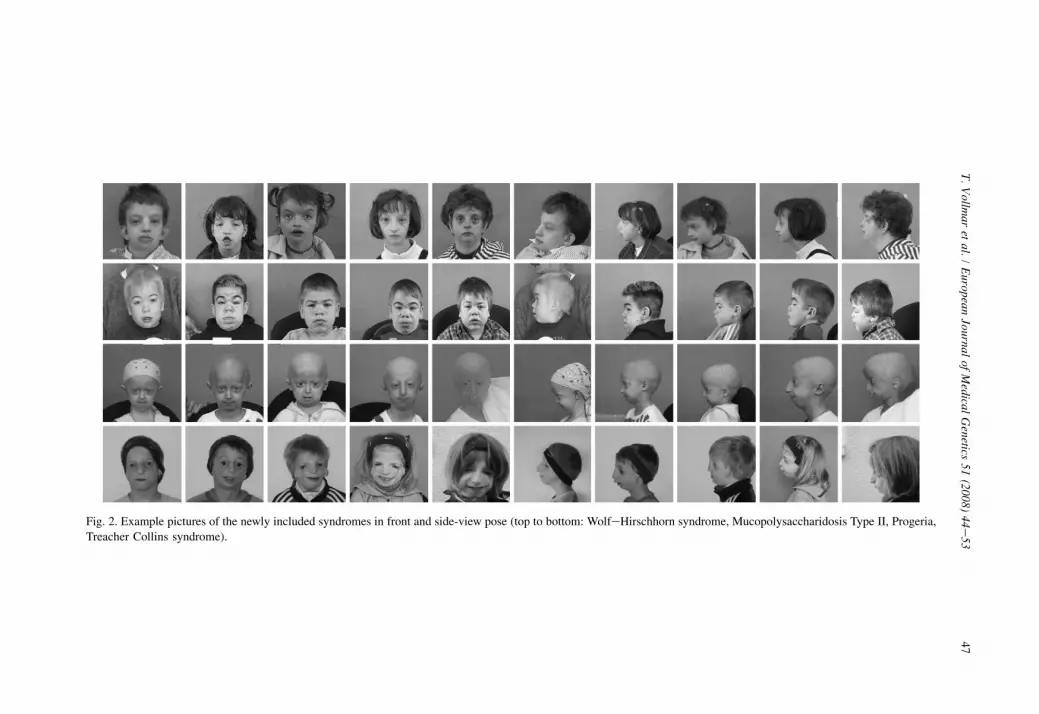
Fig. 2. Example pictures of the newly included syndromes in front and side-view pose (top to bottom: WolfeHirschhorn syndrome, Mucopolysaccharidosis Type II, Progeria,
Treacher Collins syndrome).
47
T.
Vo
llmar
etal.
/E
uropeanJournal
ofM
edicalG
enetics51
(2008)44e
53

48 T. Vollmar et al. / European Journal of Medical Genetics 51 (2008) 44e53
2.3. Picture preparation and analysis
Pictures were converted to a standard format (gray scale, resolution 256� 256 pixels). Ina two-step analysis pictures are re-represented by model graphs which contain Gabor wavelettransforms of important facial features. Details of this process are given elsewhere [12,18]. Inshort, landmarks of the face are located in the picture based on similarity with independent ex-ample pictures and Wavelet coefficients are extracted at each landmark (48 landmarks, 40 co-efficients each). Wavelet representation can be viewed as a form of image compression thatallows to approximate the original image based alone on the coefficients and the position ofthe corresponding landmark (i.e., the model graph) [19].
We have also created versions of the model graphs for which landmarks have been as-signed by a human investigator (hand-labeled model graphs). Previous work has shownthat manual intervention in landmark placement is highly accurate [1] and improves classifi-cation results [3].
2.4. Statistical analysis
In the statistical analysis we used both versions of model graphs (hand-labeled and auto-matic) of frontal and side-views. We have conducted separate and combined analyses of thetwo poses. Additionally, we have also analyzed the geometry and the wavelet components ofmodel graphs separately and in combination.
Coordinates were standardized prior to ensuing analysis. Graph coordinates were rotatedto a standard angle, centered and scaled to unit size. Because of the complexity of the dataset (points and wavelets of both poses comprise 2� 1920þ 2� 96¼ 4032 coordinates persample), dimension reduction techniques have to be employed. We used principal compo-nent analysis (PCA) to reduce dimensionality to ca. 100 coordinates depending on the par-ticular data set. Recall, that PCA orders the resulting coordinates (principal components;PCs) by their relevance in explaining variance of the data set. Whenever we combinedcoordinates and wavelets we combined data after conducting PCA separately on the twocomponents.
We have employed several classification techniques to assess classification accuracy. Thesemethods were linear discriminant analysis (LDA), support vector machines (SVM) and k-thnearest neighbors (kNN). These methods differ in complexity and robustness. LDA uses a hy-perplane to separate different classes. By contrast, SVM uses a maximum-margin hyperplane inconjunction with a non-linear transformation, which allows for non-linear decision boundaries.kNN uses a majority vote of the classes of the k nearest training samples to assign a class to anindependent sample. Classification accuracy was defined by conducting a 10-fold cross valida-tion procedure. Ten-fold cross validation assesses accuracy by repeatedly splitting the data setinto train/test pairs, predicting unseen test samples from the training data and averaging accu-racy over runs. We have averaged accuracy over 20 cross validation runs to minimize effects ofrandom fluctuations due to hold out sample selection. We have used two model selectionschemes to select PCs for classification. First, we selected the first k PCs in the k-th step (blockselection). This allows to compare results with our previous study [3,12]. A more sophisticatedbut also more demanding algorithm in terms of computation time is forward selection. Eachstep adds a new PC to the set of class predictors by choosing the PC that best improves clas-sification accuracy. Forward selection was applied to the first 90 wavelet PCs and the first 60coordinate PCs.

49T. Vollmar et al. / European Journal of Medical Genetics 51 (2008) 44e53
3. Results
3.1. Block selection
Results for block selection in Table 2 can be directly compared to our previous study [3].These classification results do not use coordinate information. Using LDA, classification accu-racy for hand-labeled wavelets is 70.1% for 14 syndromes as compared to 76% for 10 syn-dromes in the previous study. Side-view pictures alone performed at 62.7% and thecombination of both poses performed at 76.1%. Wavelets extracted from the automatic processperformed considerably worse at 52% for frontal views. For side-views an accuracy of 42% wasachieved. We note, however, that we have not updated the process locating the landmarks withmore examples as compared to the previous study. SVM and kNN performed at 63% and 58%,respectively, and are thus worse than LDA as was the case in the previous study. For SVM 1stdegree polynomials were used. kNN is the worst classifier in this study (front, side-view pic-tures or combination; data not shown) with the best accuracy achieved with k¼ 6 neighbors.
Breaking up results for individual syndromes, Fragile X syndrome (100%), progeria (99%)and WilliamseBeuren syndrome (90.9%) were the syndromes with best results. Interestingly,progeria performs at only 63% for side-views alone. Syndromes with the worst accuracieswere Mucopolysaccharidosis Type III in frontal pose (6.3%) and Cri-du-chat syndrome, whichholds for both poses (frontal: 11%, side-view 48%). Interestingly, accuracy of Cri-du-chat syn-drome performs better using only side-views.
3.2. Pairwise comparisons
For deeper insight into which distinctions are difficult to learn for the computer in the cur-rent data set we conducted pairwise classifications for all syndrome pairs. Table 3 reports
Table 2
Classification accuracies using different data sets and classification methods
Classification method LDA SVM kNN
Picture pose Combined Frontal Side-view Frontal Frontal Frontal
Model graph Manual Manual Manual Automatic Manual Manual
Overall (%) 76.1 70.1 62.7 52.5 63.8 58.2
22q- (%) 88.1 75.4 65.0 54.2 79.6 69.8
4p- (%) 53.1 43.3 50.0 25.4 22.5 12.5
5p- (%) 32.2 11.7 48.9 18.3 16.1 0.6
Cornelia de Lange (%) 83.8 74.6 65.4 82.1 58.3 43.4
Fragile X (%) 100.0 94.6 97.5 87.8 91.7 97.6
Mucopolysaccharidosis II (%) 57.9 59.3 60.0 94.3 40.7 32.1
Mucopolysaccharidosis III (%) 6.3 35.6 6.3 0.0 8.1 17.5
Noonan (%) 77.0 79.0 51.0 51.0 58.0 78.3
PradereWilli (%) 83.3 71.2 75.0 74.3 71.2 45.4
Progeria (%) 99.0 98.0 63.0 52.0 67.0 47.0
SmitheLemlieOpitz (%) 59.2 59.6 20.4 25.0 55.4 44.6
Sotos (%) 80.0 71.0 77.7 63.3 61.3 37.3
Treacher Collins (%) 64.2 39.2 34.6 50.8 24.2 35.8
WilliamseBeuren (%) 90.9 91.0 84.2 70.6 93.3 82.0
The third row indicates whether manually corrected or fully automatically created model graphs were used. Results for
SVM use 1st degree polynomials, kNN k¼ 6 neighbors.

Table 3
Results of pairwise classification of frontal views using 26 PCs gained from wavelet coefficients for Microdeletion 22q
(22q-), WolfeHirschhorn (4p-), Cri-du-chat (5p-), Cornelia de Lange (CDL), Fragile X (FraX), Mucopolysaccharidosis
II (MPS2), Mucopolysaccharidosis III (MPS3), Noonan, PradereWilli (PWS), Progeria, SmitheLemlieOpitz Sotos
(SLO), Treacher Collins (TCS) and WilliamseBeuren (WBS)
22q- 4p- 5p- CDL FraX MPS2 MPS3 Noonan PWS Progeria SLO Sotos TCS
4p- (%) 94.3 e e e e e e e e e e e e
5p- (%) 85.0 91.8 e e e e e e e e e e eCDL (%) 95.8 98.0 82.6 e e e e e e e e e e
FraX (%) 99.5 98.2 90.5 76.0 e e e e e e e e e
MPS2 (%) 91.6 98.5 92.8 83.2 97.1 e e e e e e e e
MPS3 (%) 84.1 90.0 63.5 93.5 93.5 54.7 e e e e e e eNoonan (%) 84.8 93.4 81.3 85.2 93.7 87.7 82.0 e e e e e e
PWS (%) 95.5 91.8 80.0 93.3 63.1 96.8 88.0 81.7 e e e e e
Progeria (%) 91.6 82.3 85.0 95.9 99.1 93.5 55.6 98.0 98.6 e e e e
SLO (%) 96.2 96.5 82.6 89.8 98.7 89.4 84.4 81.5 97.7 98.9 e e eSotos (%) 86.9 96.1 65.4 72.6 96.9 85.0 74.1 59.2 93.1 90.4 81.2 e e
TCS (%) 87.7 80.0 89.6 84.0 89.2 92.5 72.2 79.3 77.3 99.0 95.4 74.9 e
WBS (%) 95.5 98.1 95.1 97.2 98.2 98.7 97.5 97.3 94.6 100.0 97.5 91.9 95.8
50 T. Vollmar et al. / European Journal of Medical Genetics 51 (2008) 44e53
accuracies for a hand-labeled data set and wavelet information from frontal pictures. Classifi-cation rates range from 54.7% (MPS II vs. MPS III) up to perfect discrimination (e.g. Progeriavs. WilliamseBeuren syndrome). Most rates range between 80% and 100%. Mucopolysacchar-idosis III is difficult to discriminate from MPS II, Progeria and Cri-du-chat with accuraciesbelow 70%. Cri-du-chat discriminates poorly from MPS III and Sotos syndrome.
3.3. Forward selection
Forward selection was applied to geometry information, wavelets and the combination. Wehere report only on data sets including both poses. Table 4 summarizes the results. It is notable,
Table 4
Classification accuracies for coordinates and wavelets for combined poses (frontal and side-view)
Geometry (%) Wavelets (%) Geometryþwavelets (%)
Overall 85.7 76.9 93.1
Microdeletion 22q 87.7 86.9 94.6
WolfeHirschhorn 80.0 57.5 97.5
Cri-du-chat 78.9 47.8 72.2
Cornelia de Lange 73.3 78.3 82.5
Fragile X 91.7 91.7 100.0
Mucopolysaccharidosis II 70.0 70.0 82.9
Mucopolysaccharidosis III 70.0 22.5 61.3
Noonan 97.3 80.0 93.3
PradereWilli 81.7 76.7 91.7
Progeria 96.0 64.0 100.0
SmitheLemlieOpitz 78.3 63.3 97.8
Sotos 92.0 91.3 89.3
Treacher Collins 83.3 65.8 93.7
WilliamseBeuren 91.2 91.6 97.1
Classification method is LDA using forward selection and model graphs were hand-labeled.

51T. Vollmar et al. / European Journal of Medical Genetics 51 (2008) 44e53
that geometry information performs excellently and an overall accuracy of 85.7% is achieved.Wavelets perform at 76% and the combination at 93%. This indicates that non-overlapping in-formation is contained in coordinates and wavelets, respectively. Cri-du-chat syndrome per-forms at 78% for geometry thereby improving over wavelet results at 47%. Also in MPS III,geometry performs well at 70% as compared to 22% with wavelets. Except for WolfeHirsch-horn syndrome (improvement from 57% to 80%), progeria (64%, 96%) and SmitheLemlieOpitz syndrome (63%, 78%) results were similar when comparing geometry with wavelets.
4. Discussion
One future goal of this study is to enhance databases with capabilities of image analysis. Tobe usable, a large number of syndromes have to be supported. This study gives some insightinto the feasibility of this task. Our previous study performed at 75% for 10 syndromes. Takinginto account that the probability of a correct diagnosis by random choice is 10%, this meansa ratio of 7.5 comparing a-posteriori and a-priori probabilities. In the present study this ratioranged from 8.8 (side-views, hand-labeled wavelets) to 13.0 (combined frontal side-view to-gether with coordinates) supporting the view that significant information is carried by bothside-views and geometry. Also we have shown that classification accuracy does not have to de-teriorate as more syndromes are included e which is a prerequisite to moving forward to theclinical application.
It is interesting to look at the different components of the data set that were used in the clas-sification process. Side-views seem to harbor less information than frontal views in terms ofclassification accuracy. However, this might not be a genuine finding but due to a particularproperty of our data set. For example, hair is an uncontrolled source of noise in our data set.Side-views seem to be more severely affected by this factor. Here, of course, physical exami-nation of a patient could assess relevance much better. It should be mentioned that PradereWilli syndrome and Sotos syndrome are more accurately classified using side-views than fron-tal views. Since the combination of frontal and side-views performs best, non-overlapping,complementary information should be contained in these two parts of the data set, as is ex-pected (ears, side profile). In particular, three-dimensional information about the face can bederived from a pair of frontal and side-view pictures.
The second addition in this study was the inclusion of coordinates after standardization. As-tonishingly, coordinate information results in excellent classification accuracy. This result wasunexpected, since non-standardized coordinates completely failed to classify. There are twomain consequences of this result. Firstly, coordinates do not harbor any texture information.In classification studies that are based on samples not drawn randomly from the populationbut sampled from subgroups, hidden correlations can give rise to spuriously accurate resultsin classification experiments. For example, subtle differences in the picture acquisition processcould be systematically present in one of the groups of patients and could be the true factors forthe correct classification decision. We have gone to great lengths to exclude these factors byinspecting summary statistics of pictures, plausibility checks and visualizations of the decisionprocess [3]. The geometry result is an independent support for the correctness of the previousanalyses. The second aspect is standardization. We have so far not standardized pictures by geo-metric transformation, since Gabor wavelets have some properties that make them robustagainst such transformations [18,19]. Since we want to apply our methods on pictures thatare not as accurately controlled for as the ones we used in this study, we are going to relyon this robustness even more. The geometry results, however, indicate that accuracy using

52 T. Vollmar et al. / European Journal of Medical Genetics 51 (2008) 44e53
wavelets can also be increased by strict standardization. Such a standardization is possible,when landmarks are positioned by hand, since this reveals the true geometry of the face. It re-mains to be seen how well an automated procedure can work, but we consider this to be a prom-ising improvement.
Automatically labeled pictures have not performed well in this study.To explain this result, two aspects are important. Firstly, in rare instances the face was not
localized at all in the automatic process, thereby representing a data point with complete noise.This fact becomes more relevant as more syndromes are included, since the chance that sucha point of noise lies close to one of the other syndromes increases. Therefore, mistakes likethese should be avoided in the training data set that could be used in practice. Secondly, wehave not optimized the localization of landmarks, since for the reasons just mentioned wehave performed manual labeling, anyway. Locating landmarks can be improved by severalmeans, including a well-chosen training set, including faces with variation in syndrome, sizesand rotation. Also algorithmic improvements are possible and currently under investigation. Inconclusion, a completely automatic analysis is not feasible at the moment and landmark place-ment should always be checked and corrected to achieve best results.
In clinical practice, it is certainly possible to adjust landmarks for a single pair of facial pic-tures that is to be analyzed by hand, however, there are additional challenges that have onlypartially been covered thus far. One important issue is the composition of the training dataset. Should only very characteristic probands be included or should also mild phenotypes beincluded? On the one hand, this could drive down classification accuracy in studies like this,on the other hand in practice a ranking of syndromes could be more helpful than a single de-cision. For example, the classifier could be indecisive between several syndromes but could beable to exclude a large number of syndromes. This could also be helpful in practice, and there-fore measures other than pure classification accuracy could be useful.
This study is the first to include geometry information of 2D-pictures. It was astonishing tosee, that accurate standardization can lead to excellent classification results. 3D studies that aresolely based on geometry information, have shown similar results, although the data sets andanalyses are not directly comparable. Combining coordinates from frontal as well as side-viewsseems to recover 3D-information as well, since similar results are achieved with 3D and 2Dcoordinates. It should be noted that 3D coordinates have not been standardized to a unit vol-ume, which seems to be an option for a re-analysis of the 3D data set. One advantage of the3D-approach is that coordinates are absolute, i.e., sizes can be accurately reconstructed. Inour data set we have to rely on surrogate information, like age, for size.
In conclusion, we believe that the current results are promising in terms of improving syn-drome diagnosis in practice. Main outcomes, that are expected by us to reach clinical practicesoon, are that result lists from database queries can be made more significant by excluding syn-dromes that are prototypically too dissimilar and giving meaningful order to lists of suggestedsyndromes. A high level of expertise of the clinician will still be indispensable for an accurateand reliable diagnosis.
Acknowledgments
We thank all patients who took part in the study. We thank Stella Sinigerova for helping withlabeling. This study was supported by DFG grants BO 1955/2-1, WU 314/2-1 and IFORESgrant 107-05860, 107-02270.
53T. Vollmar et al. / European Journal of Medical Genetics 51 (2008) 44e53
References
[1] K. Aldridge, S.A. Boyadjiev, G.T. Capone, V.B. DeLeon, J.T. Richtsmeier, Precision and error of three-dimen-
sional phenotypic measures acquired from 3dMD photogrammetric images, Am. J. Med. Genet. A 138 (2005)
247e253.
[2] J.E. Allanson, Objective techniques for craniofacial assessment: what are the choices? Am. J. Med. Genet. 70
(1997) 1e5.
[3] S. Boehringer, T. Vollmar, C. Tasse, et al., Syndrome identification based on 2D analysis software, Eur. J. Hum.
Genet. 14 (2006) 1082e1089.
[4] T.S. Douglas, Image processing for craniofacial landmark identification and measurement: a review of photogram-
metry and cephalometry, Comput. Med. Imaging Graph 28 (2004) 401e409.
[5] L.G. Farkas, J.C. Posnick, T.M. Hreczko, G.E. Pron, Growth patterns of the nasolabial region: a morphometric
study, Cleft Palate Craniofac. J. 29 (1992) 318e324.
[6] P. Hammond, T.J. Hutton, J.E. Allanson, et al., Discriminating power of localized three-dimensional facial mor-
phology, Am. J. Hum. Genet. 77 (2005) 999e1010.
[7] P. Hammond, T.J. Hutton, J.E. Allanson, et al., 3D analysis of facial morphology, Am. J. Med. Genet. A 126
(2004) 339e348.
[8] R.C. Hauspie, C. Susanne, E. Defrise-Gussenhoven, Testing for the presence of genetic variance in factors of face
measurements of Belgian twins, Ann. Hum. Biol. 12 (1985) 429e440.
[9] L. Kohn, The role of genetics in craniofacial morphology and growth, Annu. Rev. Anthropol. 20 (1991) 261e278.
[10] K. Lee, G. Byatt, G. Rhodes, Caricature effects, distinctiveness, and identification: testing the face-space frame-
work, Psychol. Sci. 11 (2000) 379e385.
[11] D.A. Leopold, I.V. Bondar, M.A. Giese, Norm-based face encoding by single neurons in the monkey inferotem-
poral cortex, Nature 442 (2006) 572e575.
[12] H.S. Loos, D. Wieczorek, R.P. Wurtz, C. von der Malsburg, B. Horsthemke, Computer-based recognition of dys-
morphic faces, Eur. J. Hum. Genet. 11 (2003) 555e560.
[13] K. Ma, T. Xiaoou, Discrete wavelet face graph matching, in: International Conference on Image Processing, The-
ssaloniki, Greece, vol. 2, 2001, pp. 217e220.
[14] C. Marquet, P.O.S.S.U.M. User’s Manual, C.P. Export Pty Ltd., Melbourne, 1987.
[15] J. Peng, H. Deng, C. Cao, M. Ishikawa, Craniofacial morphology in Chinese female twins: a semi-longitudinal
cephalometric study, Eur. J. Orthod. 27 (2005) 556e561.
[16] R.M. Winter, What’s in a face? Nat. Genet. 12 (1996) 124e129.
[17] R.M. Winter, M. Baraitser, London Dysmorphology Database, Oxford University Press, Oxford, 1990.
[18] L. Wiskott, C. von der Malsburg, Recognizing faces by dynamic link matching, Neuroimage 4 (1996) S14eS18.
[19] I.J. Wundrich, C. von der Malsburg, R.P. Wurtz, Image representation by complex cell responses, Neural Comput.
16 (2004) 2563e2575.