impact of dietary polydextrose fiber on the human gut metabolome
TRANSCRIPT
Impact of Dietary Polydextrose Fiber on the Human Gut MetabolomeSantosh Lamichhane,† Christian C. Yde,† Sofia Forssten,‡ Arthur C. Ouwehand,‡ Markku Saarinen,‡
Henrik Max Jensen,§ Glenn R. Gibson,∥ Robert Rastall,∥ Francesca Fava,⊥
and Hanne Christine Bertram*,†
†Department of Food Science, Aarhus University, Kirstinebjergvej 10, DK-5792 Aarslev, Denmark‡Dupont, Nutrition and Health, Sokeritehtaantie 20, 02460 Kantvik, Finland§DuPont Nutrition Biosciences ApS, Edwin Rahrsvej 38, 8220 Brabrand, Aarhus, Denmark∥Department of Food and Nutritional Sciences, The University of Reading, Reading, RG6 6AP, U.K.⊥Nutrition and Nutrigenomics, Department of Food Quality and Nutrition, Centro Ricerca ed Innovazione, Fondazione EdmundMach, Via Mach No. 1, 38010 San Michele all’Adige (Trentino) Italy
*S Supporting Information
ABSTRACT: The aim of the present study was to elucidate the impact of polydextrose PDX an soluble fiber, on the humanfecal metabolome by high-resolution nuclear magnetic resonance (NMR) spectroscopy-based metabolomics in a dietaryintervention study (n = 12). Principal component analysis (PCA) revealed a strong effect of PDX consumption on the fecalmetabolome, which could be mainly ascribed to the presence of undigested fiber and oligosaccharides formed from partialdegradation of PDX. Our results demonstrate that NMR-based metabolomics is a useful technique for metabolite profiling offeces and for testing compliance to dietary fiber intake in such trials. In addition, novel associations between PDX and the levelsof the fecal metabolites acetate and propionate could be identified. The establishment of a correlation between the fecalmetabolome and levels of Bif idobacterium (R2 = 0.66) and Bacteroides (R2 = 0.46) demonstrates the potential of NMR-basedmetabolomics to elucidate metabolic activity of bacteria in the gut.
KEYWORDS: nuclear magnetic resonances, fiber, metabolomics, gut microbiota, gut flora−host interactions,microbial metabolic activity
■ INTRODUCTION
Prebiotics, nondigestible food ingredients, have been shown toselectively stimulate the growth and/or activity of potentiallybeneficial microbes in the colon and provide health benefits forthe host. Thus, prebiotic consumption has been shown toreduce the risk of inflammatory bowel disease and colorectalcancer, in addition to enhancing immune function.1−5
Intriguingly, Polydextrose (PDX), a highly branched polymerof glucose, classified as soluble fiber by the U.S. Food and DrugAdministration (FDA), has been found to have prebioticproperties. In fact, PDX is considered an effective prebiotichaving a unique arrangement of glycoside linkages, thus beingresistant to hydrolysis by human digestive enzymes, passingintact into the colon, where it is partially fermented.6 Theimpact of dietary intake of PDX has been investigated to someextent7−11 but requires further substantiation of the effects, inparticular, on recognized beneficial bacteria and metabolitesproduced.The human gut represents a complex ecosystem and harbors
more than 1000 microbial species accounting up for 1012
bacteria per gram of intestinal contents.12 The microbiotaexhibit spatial patterning; the density is increased markedlyfrom the small intestine to the colon. Diet, lifestyle, hostgenome, and drugs influence the composition and activity ofthese microbial species.13 Currently, there is an increasingawareness that dietary patterns are one of the most essentialfactors contributing to the gut microbial community.14,15
Macronutrients in the diet such as dietary fiber, cellulose,resistant starch, protein, mucus, and sloughed off cells escapingduring digestion through the small intestine are potentialsubstrates for microbes in the colon. These substrates areconverted into a wide range of compounds such as short chainfatty acids (SCFA), branched chain fatty acids, organic acids,biogenic amines, vitamins, ammonia, and phenols by themicrobes. These compounds might have positive or adverseeffects on human health.15,16 Thus, a better understanding ofthe microbial ecology in the human gut, and response to diet, isvital for determining the roles that intestinal microorganismshave in health and disease.During the past decade, metabolomics has emerged in the
food and nutrition field with studies demonstrating theusefulness of untargeted metabolic profiling to improve theunderstanding of the complex relationships between diet andhealth.17 Because feces is formed in the colon and samplecollection is noninvasive, feces is the most relevant biologicalsample for metabolomic studies that aim to explore gut healthstatus. Recent studies based on fecal metabolomics haveprovided an improved insight into the dietary specificmodulation of gut functional ecology,18 interspecies metabolic
Received: July 1, 2014Revised: September 17, 2014Accepted: September 18, 2014Published: September 18, 2014
Article
pubs.acs.org/JAFC
© 2014 American Chemical Society 9944 dx.doi.org/10.1021/jf5031218 | J. Agric. Food Chem. 2014, 62, 9944−9951

differences,19 metabolic effect to dietary intervention,20 andinformation about gut health status.21−23 Thus, assessment ofmetabolic changes in feces using metabolomics may be aunique approach to disect gut microbe interactions in thecomplex gut system and identify metabolic changes induced bythe intake of fibers and prebiotics.The aim of the present study is to extend a previous
investigation evaluating the impact of PDX on fecal microbiotain humans by Costabile et al.24 In this previous study, PDXconsumption was shown to significantly increase butyrate-producing Ruminoccus intestinalis and Clostridium Cluster I, II,and IV. In addition, PDX fermentation was shown to reducethe genotoxicity of fecal water and affect the bowel habits ofhuman subjects. Consequently, the findings from the previousstudy encouraged us to learn more about the effects of PDXintake on the gut metabolome. For this purpose, high-resolution nuclear magnetic resonance (NMR) spectroscopy-based metabolomics was performed on feces from the study byCostabile et al.24 In addition, the relationship between the fecalmetabolome and gut microbial profiles was investigated toelucidate the potential of NMR-based metabolomics todecipher the specific metabolic activity of the gut microbiota.
■ MATERIALS AND METHODSSampling and Sample Material. Samples from an intervention
with a double-blind, randomized, placebo-controlled crossover designwere used.24 A total of 31 volunteers from the area of Reading, UnitedKingdom (U.K.) were involved in the original study; however, becauseof sample scarcity, we could only include samples from 12 healthyvolunteers (4 males and 8 females) aged 18 to 50 years. Foranthropometric measures, see Table 1. During each intervention
period, subjects were not allowed to intake prebiotics, probiotics,antibiotics, or drugs active on gastrointestinal motility, such aslaxatives. All subjects consumed PDX powder (Litesse Ultra, 8 g/day;Danisco UK, Redhill, U.K.) or an equivalent placebo (maltodextrinpowder, 8 g/day, Syral, Marckolsheim, France) for 3 weeks followedby a 3-week washout period, and then crossover occurred. Fecalsamples were collected from each volunteer at five different time
points, before PDX intake at baseline, following PDX treatment,following washout 1, following maltodextrin intake, and followingwashout 2 (Figure 1). The study protocol was approved by the Ethicsand Research Committee of the University of Reading and conductedaccording to the guidelines in the Declaration of Helsinki.
Preparation of Fecal Water Samples. The extraction wasperformed and described previously by Costabile et al.24 Fecal waterwas extracted 1:1 (w/v) in 1 M-ice-cold phosphate buffer saline (PBS,pH 7.4). The samples were homogenized in a stomacher bag for 2min, and the aliquots were ultracentrifuged at 64000 g for 2 h at 4 °C(Beckman Optima L90K Ultracentrifuge; Beckman Limited, HighWycombe, U.K.). The supernatants were carefully removed and storedin a 1.5 mL Eppendorf tube at −70 °C until analysis.
1H NMR Spectroscopic Analyses. Fecal water samples extractedin 1:1 (w/v) PBS were thawed and diluted with an equal amount ofPBS. Further dilution was performed due to the limited amount ofsamples available for NMR analysis. The diluted mixture was vortexed(10 s) and centrifuged at 10000g for 15 min at 4 °C. A volume of 500μL of clear supernatant was transferred to a 5 mM NMR tube and 100μL of deuterium oxide (D2O) containing 0.025 mg/mL of 3-(Trimethylsilyl) propionicacid-d4 sodium salt (TSP) was added as alock solvent. One dimensional NMR experiments were conductedusing a Bruker Advance DRX 600 MHz spectrometer equipped with a5 mm triple resonance (TXI) probe at a temperature of 298 K. TheNoespr1d (90°-d1−90°-dmix-90°-FID, Bruker, Rheinstetten, Germany)sequence was performed to suppress signals from water moleculeswhere d1 is a 4 μs delay time and dmix is the mixing time. The spectrawas acquired with 64 scans, a spectral width of 7288 Hz collected into32K data points, an acquisition time of 2.24 s, and a relaxation delay of5 s. The obtained free induction decay (FID) was multiplied by 0.3 Hzof line broadening before Fourier transformation. The spectra werereferenced to TSP (chemical shift 0 ppm), phased, and baselinecorrected in the Topspin 3.0 software (Bruker). Relative quantificationof selected 1H resonance was performed by integration of peak areasusing Topspin 3.0 (Bruker). The integrals were normalized to theconcentration of TSP added as an external reference. Assignments of1H NMR signals were carried out using Chenomx NMR Suite 7.7(Chenomx, Canada) and according to the Human MetabolomeDatabase25 and the literature.20 In addition, the heteronuclear singlequantum correlation (HSQC) 2D NMR technique was applied toconfirm the identity of the given metabolites. The 2D experiment wasacquired with a spectral width of 6127 Hz in the 1H dimension and27164 Hz in the 13C dimension, a matrix with size of 4096 × 1024,512 transients per increment and a relaxation delay of 2 s.
Data Analysis. NMR spectra were imported to MATLABR2010b(The Mathworks, Inc.), and the misalignments of the spectra werecorrected using the algorithm icoshift based on the correlationalshifting of spectral intervals.26 The spectrum with the highestcorrelation to the rest of the spectra in the matrix was used as areference. The algorithm for icoshift is open-source and available at
Table 1. Anthropometric Characteristics of the Subjectsa
characteristics
age (years) 33.9 ± 8.3BMI (kg/m2) 23.8 ± 2.4waist (cm) 80.66 ± 9.3
aValues are means ± standard deviation.
Figure 1. Schematic of the crossover intervention design. Each box represents a group of human subjects in the crossover design. The first groupconsumed PDX powder for 3 weeks, and then after a 3-week washout period, they consumed the equivalent placebo for 3 weeks. The second groupreceived first the placebo (maltodextrin) for 3 weeks, and then after a 3-week washout period, PDX powder for another 3-week treatment period.The fecal samples were collected at five time points from each subject; before PDX intake at baseline, following PDX treatment, following washout 1,following placebo, and following washout 2.24
Journal of Agricultural and Food Chemistry Article
dx.doi.org/10.1021/jf5031218 | J. Agric. Food Chem. 2014, 62, 9944−99519945
www.model.life.ku.dk/icoshift. Both the unwanted region (12 to 9ppm, 0.5 to −1.2 ppm) and the region containing the water resonance(5 to 4.7 ppm) were removed from the aligned spectra. The spectrawere normalized to unit area and pareto-scaled. Multivariate dataanalysis was performed to explore whether the PDX intervention ledto systematic metabolic changes and to identify which metaboliteswere the most differentiating biomarkers between the PDX treated andplacebo samples.Initially, principal component analysis (PCA) of the preprocessed
NMR spectra (n = 60) was performed to visualize general grouping,trend, and outliers in the data. Subsequently, supervised partial least-squares discriminant analysis (PLS-DA) was performed to discriminatebetween the treated and placebo samples (n = 24). In addition, PLSregressions between NMR spectra from the PDX and placebo-treatedsubjects (X variable) and the bacterial cell count (log10, Y variable)were used to elucidate the relationship between the NMR metabolicprofile and bacterial cell count. PLS-DA and PLS models wereperformed on unit-normalized NMR spectra using full cross validation.Enumeration of bacterial cells was performed and previously describedby Costabile et al.24 PCA, PLSDA, and PLS-regression were conductedusing the PLS Toolbox (eigenvector Research) in MATLAB2009b.Furthermore, statistical total correlation spectroscopy (STOCSY)analysis was performed in multiple samples from PDX treated spectra(n = 12) in MATLABR2010b. Kirill Veselkov, Imperial College 2009,wrote the script for STOCSY.27
■ RESULTSNMR Metabolite Profiles of Fecal Samples. The 1H
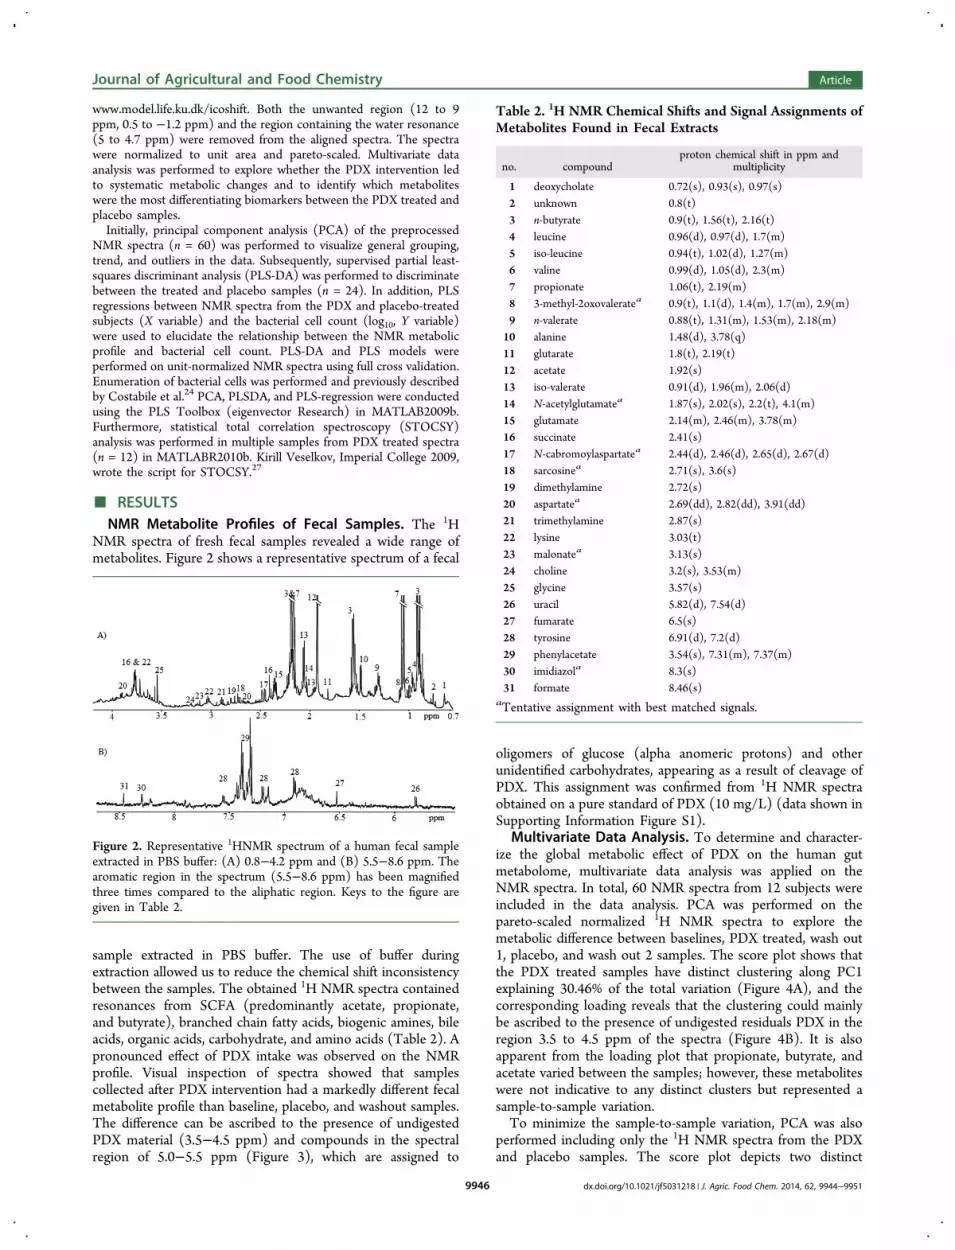
NMR spectra of fresh fecal samples revealed a wide range ofmetabolites. Figure 2 shows a representative spectrum of a fecal
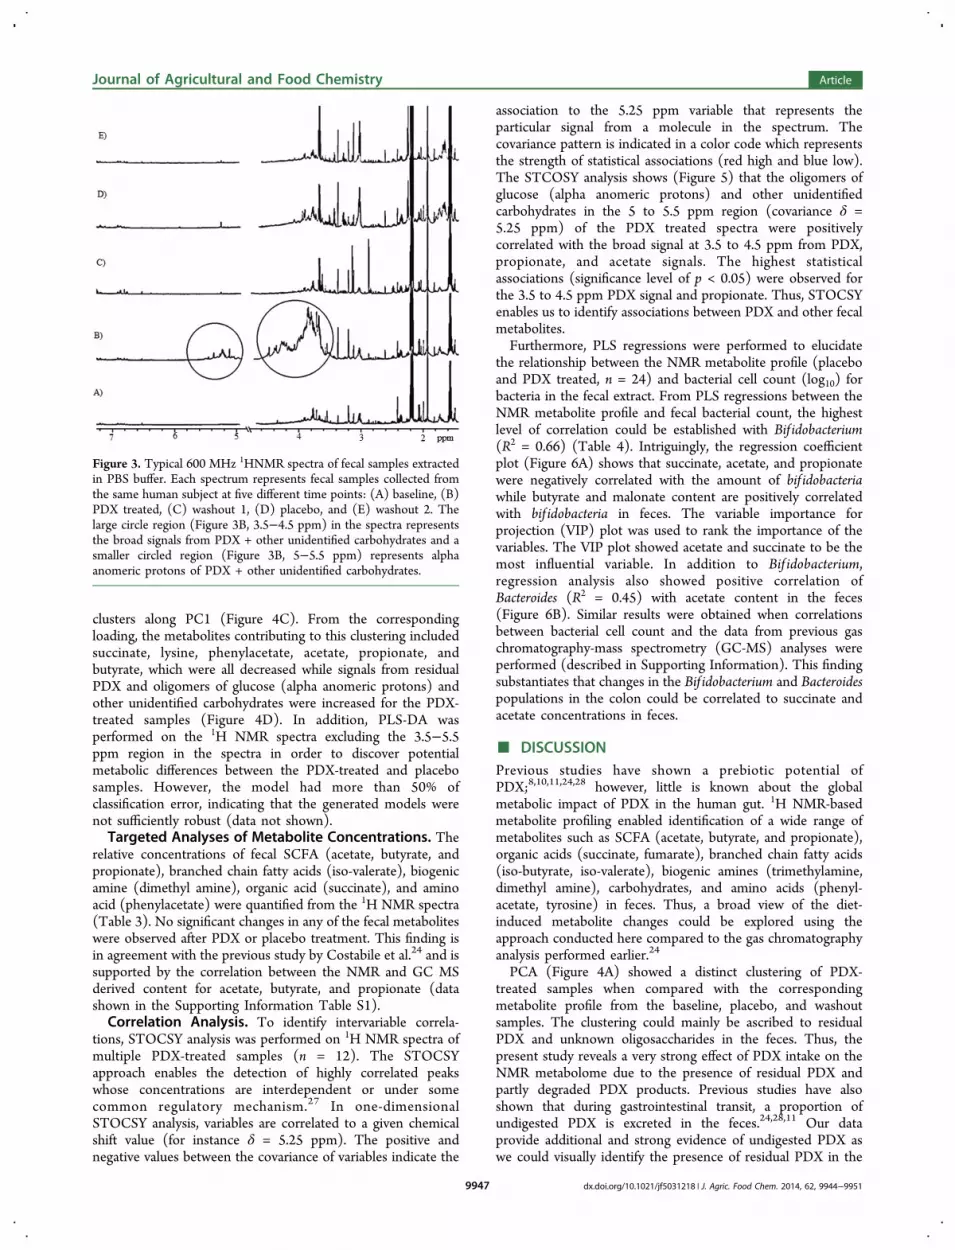
sample extracted in PBS buffer. The use of buffer duringextraction allowed us to reduce the chemical shift inconsistencybetween the samples. The obtained 1H NMR spectra containedresonances from SCFA (predominantly acetate, propionate,and butyrate), branched chain fatty acids, biogenic amines, bileacids, organic acids, carbohydrate, and amino acids (Table 2). Apronounced effect of PDX intake was observed on the NMRprofile. Visual inspection of spectra showed that samplescollected after PDX intervention had a markedly different fecalmetabolite profile than baseline, placebo, and washout samples.The difference can be ascribed to the presence of undigestedPDX material (3.5−4.5 ppm) and compounds in the spectralregion of 5.0−5.5 ppm (Figure 3), which are assigned to
oligomers of glucose (alpha anomeric protons) and otherunidentified carbohydrates, appearing as a result of cleavage ofPDX. This assignment was confirmed from 1H NMR spectraobtained on a pure standard of PDX (10 mg/L) (data shown inSupporting Information Figure S1).
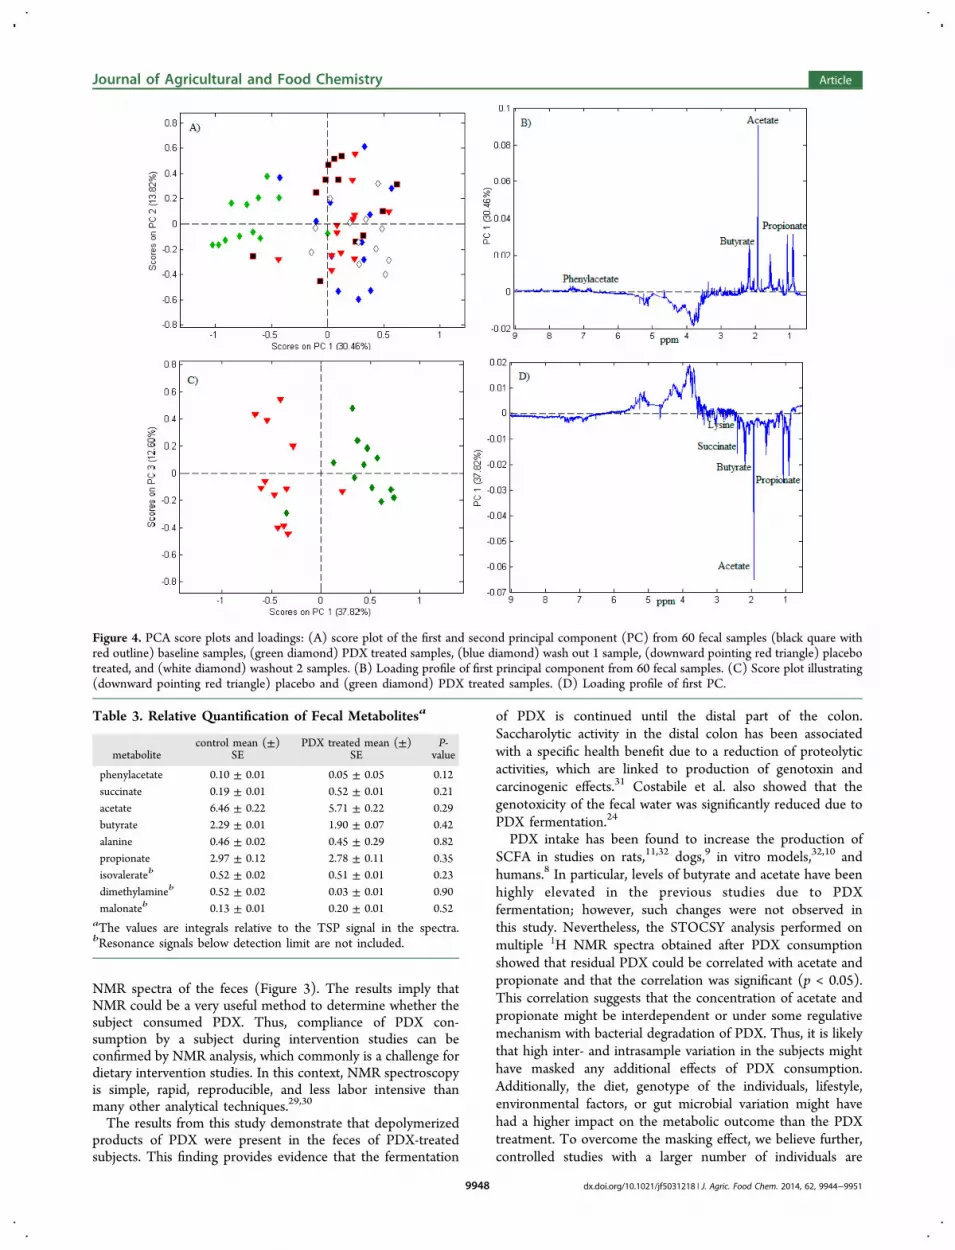
Multivariate Data Analysis. To determine and character-ize the global metabolic effect of PDX on the human gutmetabolome, multivariate data analysis was applied on theNMR spectra. In total, 60 NMR spectra from 12 subjects wereincluded in the data analysis. PCA was performed on thepareto-scaled normalized 1H NMR spectra to explore themetabolic difference between baselines, PDX treated, wash out1, placebo, and wash out 2 samples. The score plot shows thatthe PDX treated samples have distinct clustering along PC1explaining 30.46% of the total variation (Figure 4A), and thecorresponding loading reveals that the clustering could mainlybe ascribed to the presence of undigested residuals PDX in theregion 3.5 to 4.5 ppm of the spectra (Figure 4B). It is alsoapparent from the loading plot that propionate, butyrate, andacetate varied between the samples; however, these metaboliteswere not indicative to any distinct clusters but represented asample-to-sample variation.To minimize the sample-to-sample variation, PCA was also
performed including only the 1H NMR spectra from the PDXand placebo samples. The score plot depicts two distinct
Figure 2. Representative 1HNMR spectrum of a human fecal sampleextracted in PBS buffer: (A) 0.8−4.2 ppm and (B) 5.5−8.6 ppm. Thearomatic region in the spectrum (5.5−8.6 ppm) has been magnifiedthree times compared to the aliphatic region. Keys to the figure aregiven in Table 2.
Table 2. 1H NMR Chemical Shifts and Signal Assignments ofMetabolites Found in Fecal Extracts
no. compoundproton chemical shift in ppm and
multiplicity
1 deoxycholate 0.72(s), 0.93(s), 0.97(s)2 unknown 0.8(t)3 n-butyrate 0.9(t), 1.56(t), 2.16(t)4 leucine 0.96(d), 0.97(d), 1.7(m)5 iso-leucine 0.94(t), 1.02(d), 1.27(m)6 valine 0.99(d), 1.05(d), 2.3(m)7 propionate 1.06(t), 2.19(m)8 3-methyl-2oxovaleratea 0.9(t), 1.1(d), 1.4(m), 1.7(m), 2.9(m)9 n-valerate 0.88(t), 1.31(m), 1.53(m), 2.18(m)10 alanine 1.48(d), 3.78(q)11 glutarate 1.8(t), 2.19(t)12 acetate 1.92(s)13 iso-valerate 0.91(d), 1.96(m), 2.06(d)14 N-acetylglutamatea 1.87(s), 2.02(s), 2.2(t), 4.1(m)15 glutamate 2.14(m), 2.46(m), 3.78(m)16 succinate 2.41(s)17 N-cabromoylaspartatea 2.44(d), 2.46(d), 2.65(d), 2.67(d)18 sarcosinea 2.71(s), 3.6(s)19 dimethylamine 2.72(s)20 aspartatea 2.69(dd), 2.82(dd), 3.91(dd)21 trimethylamine 2.87(s)22 lysine 3.03(t)23 malonatea 3.13(s)24 choline 3.2(s), 3.53(m)25 glycine 3.57(s)26 uracil 5.82(d), 7.54(d)27 fumarate 6.5(s)28 tyrosine 6.91(d), 7.2(d)29 phenylacetate 3.54(s), 7.31(m), 7.37(m)30 imidiazola 8.3(s)31 formate 8.46(s)
aTentative assignment with best matched signals.
Journal of Agricultural and Food Chemistry Article
dx.doi.org/10.1021/jf5031218 | J. Agric. Food Chem. 2014, 62, 9944−99519946
clusters along PC1 (Figure 4C). From the correspondingloading, the metabolites contributing to this clustering includedsuccinate, lysine, phenylacetate, acetate, propionate, andbutyrate, which were all decreased while signals from residualPDX and oligomers of glucose (alpha anomeric protons) andother unidentified carbohydrates were increased for the PDX-treated samples (Figure 4D). In addition, PLS-DA wasperformed on the 1H NMR spectra excluding the 3.5−5.5ppm region in the spectra in order to discover potentialmetabolic differences between the PDX-treated and placebosamples. However, the model had more than 50% ofclassification error, indicating that the generated models werenot sufficiently robust (data not shown).Targeted Analyses of Metabolite Concentrations. The
relative concentrations of fecal SCFA (acetate, butyrate, andpropionate), branched chain fatty acids (iso-valerate), biogenicamine (dimethyl amine), organic acid (succinate), and aminoacid (phenylacetate) were quantified from the 1H NMR spectra(Table 3). No significant changes in any of the fecal metaboliteswere observed after PDX or placebo treatment. This finding isin agreement with the previous study by Costabile et al.24 and issupported by the correlation between the NMR and GC MSderived content for acetate, butyrate, and propionate (datashown in the Supporting Information Table S1).Correlation Analysis. To identify intervariable correla-
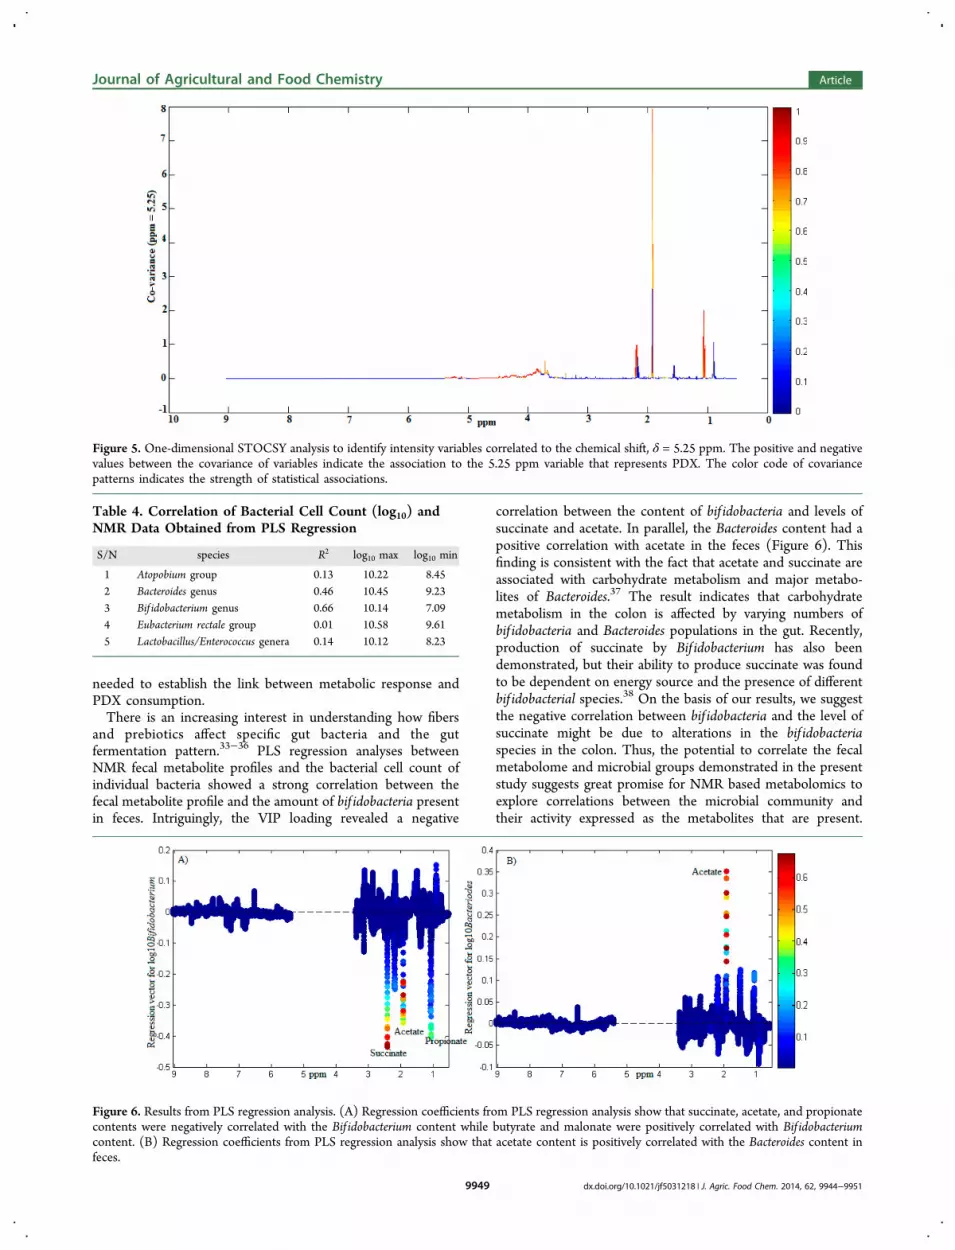
tions, STOCSY analysis was performed on 1H NMR spectra ofmultiple PDX-treated samples (n = 12). The STOCSYapproach enables the detection of highly correlated peakswhose concentrations are interdependent or under somecommon regulatory mechanism.27 In one-dimensionalSTOCSY analysis, variables are correlated to a given chemicalshift value (for instance δ = 5.25 ppm). The positive andnegative values between the covariance of variables indicate the
association to the 5.25 ppm variable that represents theparticular signal from a molecule in the spectrum. Thecovariance pattern is indicated in a color code which representsthe strength of statistical associations (red high and blue low).The STCOSY analysis shows (Figure 5) that the oligomers ofglucose (alpha anomeric protons) and other unidentifiedcarbohydrates in the 5 to 5.5 ppm region (covariance δ =5.25 ppm) of the PDX treated spectra were positivelycorrelated with the broad signal at 3.5 to 4.5 ppm from PDX,propionate, and acetate signals. The highest statisticalassociations (significance level of p < 0.05) were observed forthe 3.5 to 4.5 ppm PDX signal and propionate. Thus, STOCSYenables us to identify associations between PDX and other fecalmetabolites.Furthermore, PLS regressions were performed to elucidate
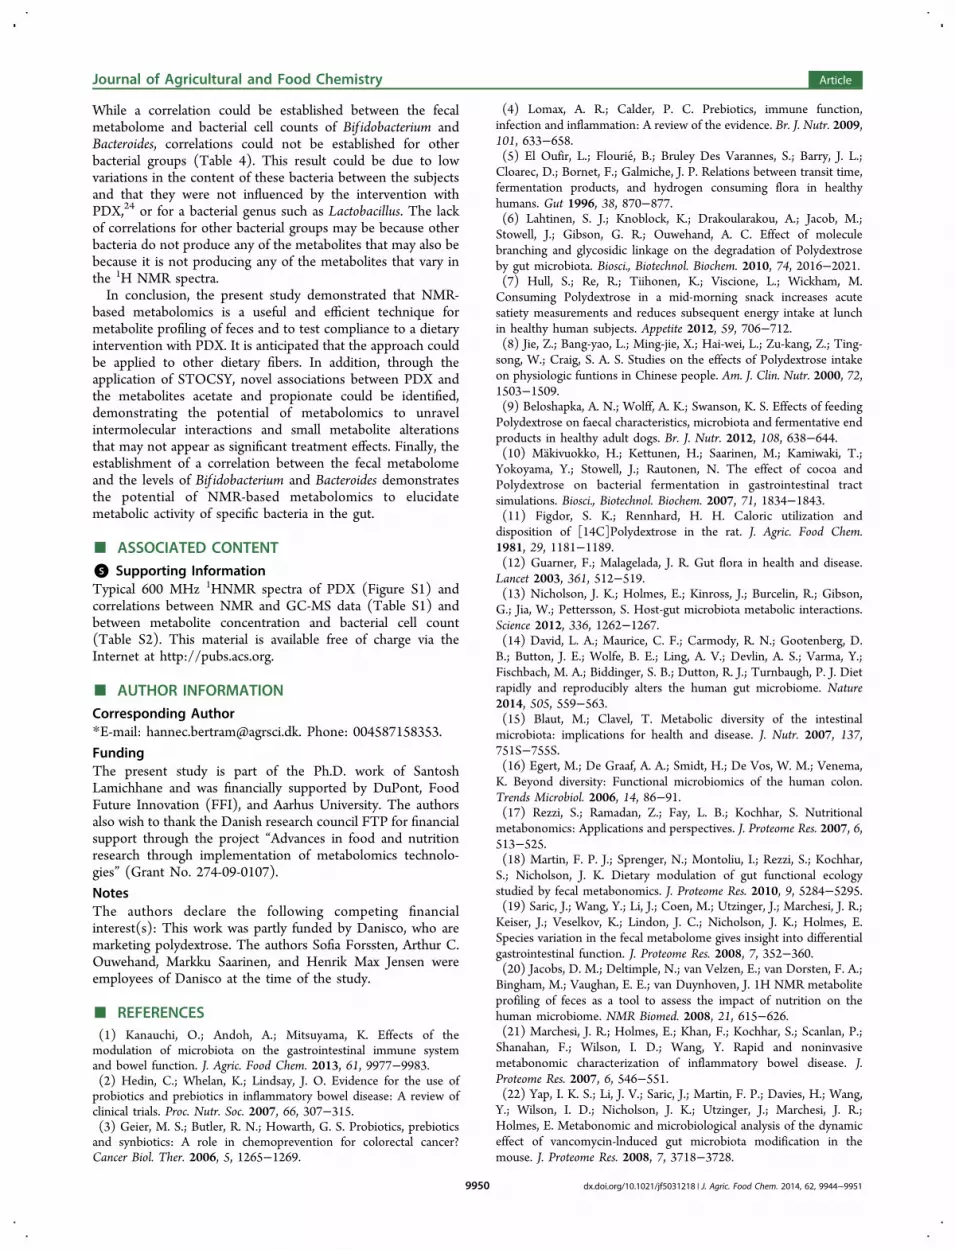
the relationship between the NMR metabolite profile (placeboand PDX treated, n = 24) and bacterial cell count (log10) forbacteria in the fecal extract. From PLS regressions between theNMR metabolite profile and fecal bacterial count, the highestlevel of correlation could be established with Bif idobacterium(R2 = 0.66) (Table 4). Intriguingly, the regression coefficientplot (Figure 6A) shows that succinate, acetate, and propionatewere negatively correlated with the amount of bif idobacteriawhile butyrate and malonate content are positively correlatedwith bif idobacteria in feces. The variable importance forprojection (VIP) plot was used to rank the importance of thevariables. The VIP plot showed acetate and succinate to be themost influential variable. In addition to Bif idobacterium,regression analysis also showed positive correlation ofBacteroides (R2 = 0.45) with acetate content in the feces(Figure 6B). Similar results were obtained when correlationsbetween bacterial cell count and the data from previous gaschromatography-mass spectrometry (GC-MS) analyses wereperformed (described in Supporting Information). This findingsubstantiates that changes in the Bif idobacterium and Bacteroidespopulations in the colon could be correlated to succinate andacetate concentrations in feces.
■ DISCUSSIONPrevious studies have shown a prebiotic potential ofPDX;8,10,11,24,28 however, little is known about the globalmetabolic impact of PDX in the human gut. 1H NMR-basedmetabolite profiling enabled identification of a wide range ofmetabolites such as SCFA (acetate, butyrate, and propionate),organic acids (succinate, fumarate), branched chain fatty acids(iso-butyrate, iso-valerate), biogenic amines (trimethylamine,dimethyl amine), carbohydrates, and amino acids (phenyl-acetate, tyrosine) in feces. Thus, a broad view of the diet-induced metabolite changes could be explored using theapproach conducted here compared to the gas chromatographyanalysis performed earlier.24
PCA (Figure 4A) showed a distinct clustering of PDX-treated samples when compared with the correspondingmetabolite profile from the baseline, placebo, and washoutsamples. The clustering could mainly be ascribed to residualPDX and unknown oligosaccharides in the feces. Thus, thepresent study reveals a very strong effect of PDX intake on theNMR metabolome due to the presence of residual PDX andpartly degraded PDX products. Previous studies have alsoshown that during gastrointestinal transit, a proportion ofundigested PDX is excreted in the feces.24,28,11 Our dataprovide additional and strong evidence of undigested PDX aswe could visually identify the presence of residual PDX in the
Figure 3. Typical 600 MHz 1HNMR spectra of fecal samples extractedin PBS buffer. Each spectrum represents fecal samples collected fromthe same human subject at five different time points: (A) baseline, (B)PDX treated, (C) washout 1, (D) placebo, and (E) washout 2. Thelarge circle region (Figure 3B, 3.5−4.5 ppm) in the spectra representsthe broad signals from PDX + other unidentified carbohydrates and asmaller circled region (Figure 3B, 5−5.5 ppm) represents alphaanomeric protons of PDX + other unidentified carbohydrates.
Journal of Agricultural and Food Chemistry Article
dx.doi.org/10.1021/jf5031218 | J. Agric. Food Chem. 2014, 62, 9944−99519947
NMR spectra of the feces (Figure 3). The results imply thatNMR could be a very useful method to determine whether thesubject consumed PDX. Thus, compliance of PDX con-sumption by a subject during intervention studies can beconfirmed by NMR analysis, which commonly is a challenge fordietary intervention studies. In this context, NMR spectroscopyis simple, rapid, reproducible, and less labor intensive thanmany other analytical techniques.29,30
The results from this study demonstrate that depolymerizedproducts of PDX were present in the feces of PDX-treatedsubjects. This finding provides evidence that the fermentation
of PDX is continued until the distal part of the colon.Saccharolytic activity in the distal colon has been associatedwith a specific health benefit due to a reduction of proteolyticactivities, which are linked to production of genotoxin andcarcinogenic effects.31 Costabile et al. also showed that thegenotoxicity of the fecal water was significantly reduced due toPDX fermentation.24
PDX intake has been found to increase the production ofSCFA in studies on rats,11,32 dogs,9 in vitro models,32,10 andhumans.8 In particular, levels of butyrate and acetate have beenhighly elevated in the previous studies due to PDXfermentation; however, such changes were not observed inthis study. Nevertheless, the STOCSY analysis performed onmultiple 1H NMR spectra obtained after PDX consumptionshowed that residual PDX could be correlated with acetate andpropionate and that the correlation was significant (p < 0.05).This correlation suggests that the concentration of acetate andpropionate might be interdependent or under some regulativemechanism with bacterial degradation of PDX. Thus, it is likelythat high inter- and intrasample variation in the subjects mighthave masked any additional effects of PDX consumption.Additionally, the diet, genotype of the individuals, lifestyle,environmental factors, or gut microbial variation might havehad a higher impact on the metabolic outcome than the PDXtreatment. To overcome the masking effect, we believe further,controlled studies with a larger number of individuals are
Figure 4. PCA score plots and loadings: (A) score plot of the first and second principal component (PC) from 60 fecal samples (black quare withred outline) baseline samples, (green diamond) PDX treated samples, (blue diamond) wash out 1 sample, (downward pointing red triangle) placebotreated, and (white diamond) washout 2 samples. (B) Loading profile of first principal component from 60 fecal samples. (C) Score plot illustrating(downward pointing red triangle) placebo and (green diamond) PDX treated samples. (D) Loading profile of first PC.
Table 3. Relative Quantification of Fecal Metabolitesa
metabolitecontrol mean (±)
SEPDX treated mean (±)
SEP-
value
phenylacetate 0.10 ± 0.01 0.05 ± 0.05 0.12succinate 0.19 ± 0.01 0.52 ± 0.01 0.21acetate 6.46 ± 0.22 5.71 ± 0.22 0.29butyrate 2.29 ± 0.01 1.90 ± 0.07 0.42alanine 0.46 ± 0.02 0.45 ± 0.29 0.82propionate 2.97 ± 0.12 2.78 ± 0.11 0.35isovalerateb 0.52 ± 0.02 0.51 ± 0.01 0.23dimethylamineb 0.52 ± 0.02 0.03 ± 0.01 0.90malonateb 0.13 ± 0.01 0.20 ± 0.01 0.52
aThe values are integrals relative to the TSP signal in the spectra.bResonance signals below detection limit are not included.
Journal of Agricultural and Food Chemistry Article
dx.doi.org/10.1021/jf5031218 | J. Agric. Food Chem. 2014, 62, 9944−99519948
needed to establish the link between metabolic response andPDX consumption.There is an increasing interest in understanding how fibers
and prebiotics affect specific gut bacteria and the gutfermentation pattern.33−36 PLS regression analyses betweenNMR fecal metabolite profiles and the bacterial cell count ofindividual bacteria showed a strong correlation between thefecal metabolite profile and the amount of bif idobacteria presentin feces. Intriguingly, the VIP loading revealed a negative
correlation between the content of bif idobacteria and levels ofsuccinate and acetate. In parallel, the Bacteroides content had apositive correlation with acetate in the feces (Figure 6). Thisfinding is consistent with the fact that acetate and succinate areassociated with carbohydrate metabolism and major metabo-lites of Bacteroides.37 The result indicates that carbohydratemetabolism in the colon is affected by varying numbers ofbif idobacteria and Bacteroides populations in the gut. Recently,production of succinate by Bif idobacterium has also beendemonstrated, but their ability to produce succinate was foundto be dependent on energy source and the presence of differentbif idobacterial species.38 On the basis of our results, we suggestthe negative correlation between bif idobacteria and the level ofsuccinate might be due to alterations in the bif idobacteriaspecies in the colon. Thus, the potential to correlate the fecalmetabolome and microbial groups demonstrated in the presentstudy suggests great promise for NMR based metabolomics toexplore correlations between the microbial community andtheir activity expressed as the metabolites that are present.
Figure 5. One-dimensional STOCSY analysis to identify intensity variables correlated to the chemical shift, δ = 5.25 ppm. The positive and negativevalues between the covariance of variables indicate the association to the 5.25 ppm variable that represents PDX. The color code of covariancepatterns indicates the strength of statistical associations.
Table 4. Correlation of Bacterial Cell Count (log10) andNMR Data Obtained from PLS Regression
S/N species R2 log10 max log10 min
1 Atopobium group 0.13 10.22 8.452 Bacteroides genus 0.46 10.45 9.233 Bif idobacterium genus 0.66 10.14 7.094 Eubacterium rectale group 0.01 10.58 9.615 Lactobacillus/Enterococcus genera 0.14 10.12 8.23
Figure 6. Results from PLS regression analysis. (A) Regression coefficients from PLS regression analysis show that succinate, acetate, and propionatecontents were negatively correlated with the Bif idobacterium content while butyrate and malonate were positively correlated with Bif idobacteriumcontent. (B) Regression coefficients from PLS regression analysis show that acetate content is positively correlated with the Bacteroides content infeces.
Journal of Agricultural and Food Chemistry Article
dx.doi.org/10.1021/jf5031218 | J. Agric. Food Chem. 2014, 62, 9944−99519949
While a correlation could be established between the fecalmetabolome and bacterial cell counts of Bif idobacterium andBacteroides, correlations could not be established for otherbacterial groups (Table 4). This result could be due to lowvariations in the content of these bacteria between the subjectsand that they were not influenced by the intervention withPDX,24 or for a bacterial genus such as Lactobacillus. The lackof correlations for other bacterial groups may be because otherbacteria do not produce any of the metabolites that may also bebecause it is not producing any of the metabolites that vary inthe 1H NMR spectra.In conclusion, the present study demonstrated that NMR-
based metabolomics is a useful and efficient technique formetabolite profiling of feces and to test compliance to a dietaryintervention with PDX. It is anticipated that the approach couldbe applied to other dietary fibers. In addition, through theapplication of STOCSY, novel associations between PDX andthe metabolites acetate and propionate could be identified,demonstrating the potential of metabolomics to unravelintermolecular interactions and small metabolite alterationsthat may not appear as significant treatment effects. Finally, theestablishment of a correlation between the fecal metabolomeand the levels of Bif idobacterium and Bacteroides demonstratesthe potential of NMR-based metabolomics to elucidatemetabolic activity of specific bacteria in the gut.
■ ASSOCIATED CONTENT*S Supporting InformationTypical 600 MHz 1HNMR spectra of PDX (Figure S1) andcorrelations between NMR and GC-MS data (Table S1) andbetween metabolite concentration and bacterial cell count(Table S2). This material is available free of charge via theInternet at http://pubs.acs.org.
■ AUTHOR INFORMATIONCorresponding Author*E-mail: [email protected]. Phone: 004587158353.
FundingThe present study is part of the Ph.D. work of SantoshLamichhane and was financially supported by DuPont, FoodFuture Innovation (FFI), and Aarhus University. The authorsalso wish to thank the Danish research council FTP for financialsupport through the project “Advances in food and nutritionresearch through implementation of metabolomics technolo-gies” (Grant No. 274-09-0107).
NotesThe authors declare the following competing financialinterest(s): This work was partly funded by Danisco, who aremarketing polydextrose. The authors Sofia Forssten, Arthur C.Ouwehand, Markku Saarinen, and Henrik Max Jensen wereemployees of Danisco at the time of the study.
■ REFERENCES(1) Kanauchi, O.; Andoh, A.; Mitsuyama, K. Effects of themodulation of microbiota on the gastrointestinal immune systemand bowel function. J. Agric. Food Chem. 2013, 61, 9977−9983.(2) Hedin, C.; Whelan, K.; Lindsay, J. O. Evidence for the use ofprobiotics and prebiotics in inflammatory bowel disease: A review ofclinical trials. Proc. Nutr. Soc. 2007, 66, 307−315.(3) Geier, M. S.; Butler, R. N.; Howarth, G. S. Probiotics, prebioticsand synbiotics: A role in chemoprevention for colorectal cancer?Cancer Biol. Ther. 2006, 5, 1265−1269.
(4) Lomax, A. R.; Calder, P. C. Prebiotics, immune function,infection and inflammation: A review of the evidence. Br. J. Nutr. 2009,101, 633−658.(5) El Oufir, L.; Flourie, B.; Bruley Des Varannes, S.; Barry, J. L.;Cloarec, D.; Bornet, F.; Galmiche, J. P. Relations between transit time,fermentation products, and hydrogen consuming flora in healthyhumans. Gut 1996, 38, 870−877.(6) Lahtinen, S. J.; Knoblock, K.; Drakoularakou, A.; Jacob, M.;Stowell, J.; Gibson, G. R.; Ouwehand, A. C. Effect of moleculebranching and glycosidic linkage on the degradation of Polydextroseby gut microbiota. Biosci., Biotechnol. Biochem. 2010, 74, 2016−2021.(7) Hull, S.; Re, R.; Tiihonen, K.; Viscione, L.; Wickham, M.Consuming Polydextrose in a mid-morning snack increases acutesatiety measurements and reduces subsequent energy intake at lunchin healthy human subjects. Appetite 2012, 59, 706−712.(8) Jie, Z.; Bang-yao, L.; Ming-jie, X.; Hai-wei, L.; Zu-kang, Z.; Ting-song, W.; Craig, S. A. S. Studies on the effects of Polydextrose intakeon physiologic funtions in Chinese people. Am. J. Clin. Nutr. 2000, 72,1503−1509.(9) Beloshapka, A. N.; Wolff, A. K.; Swanson, K. S. Effects of feedingPolydextrose on faecal characteristics, microbiota and fermentative endproducts in healthy adult dogs. Br. J. Nutr. 2012, 108, 638−644.(10) Makivuokko, H.; Kettunen, H.; Saarinen, M.; Kamiwaki, T.;Yokoyama, Y.; Stowell, J.; Rautonen, N. The effect of cocoa andPolydextrose on bacterial fermentation in gastrointestinal tractsimulations. Biosci., Biotechnol. Biochem. 2007, 71, 1834−1843.(11) Figdor, S. K.; Rennhard, H. H. Caloric utilization anddisposition of [14C]Polydextrose in the rat. J. Agric. Food Chem.1981, 29, 1181−1189.(12) Guarner, F.; Malagelada, J. R. Gut flora in health and disease.Lancet 2003, 361, 512−519.(13) Nicholson, J. K.; Holmes, E.; Kinross, J.; Burcelin, R.; Gibson,G.; Jia, W.; Pettersson, S. Host-gut microbiota metabolic interactions.Science 2012, 336, 1262−1267.(14) David, L. A.; Maurice, C. F.; Carmody, R. N.; Gootenberg, D.B.; Button, J. E.; Wolfe, B. E.; Ling, A. V.; Devlin, A. S.; Varma, Y.;Fischbach, M. A.; Biddinger, S. B.; Dutton, R. J.; Turnbaugh, P. J. Dietrapidly and reproducibly alters the human gut microbiome. Nature2014, 505, 559−563.(15) Blaut, M.; Clavel, T. Metabolic diversity of the intestinalmicrobiota: implications for health and disease. J. Nutr. 2007, 137,751S−755S.(16) Egert, M.; De Graaf, A. A.; Smidt, H.; De Vos, W. M.; Venema,K. Beyond diversity: Functional microbiomics of the human colon.Trends Microbiol. 2006, 14, 86−91.(17) Rezzi, S.; Ramadan, Z.; Fay, L. B.; Kochhar, S. Nutritionalmetabonomics: Applications and perspectives. J. Proteome Res. 2007, 6,513−525.(18) Martin, F. P. J.; Sprenger, N.; Montoliu, I.; Rezzi, S.; Kochhar,S.; Nicholson, J. K. Dietary modulation of gut functional ecologystudied by fecal metabonomics. J. Proteome Res. 2010, 9, 5284−5295.(19) Saric, J.; Wang, Y.; Li, J.; Coen, M.; Utzinger, J.; Marchesi, J. R.;Keiser, J.; Veselkov, K.; Lindon, J. C.; Nicholson, J. K.; Holmes, E.Species variation in the fecal metabolome gives insight into differentialgastrointestinal function. J. Proteome Res. 2008, 7, 352−360.(20) Jacobs, D. M.; Deltimple, N.; van Velzen, E.; van Dorsten, F. A.;Bingham, M.; Vaughan, E. E.; van Duynhoven, J. 1H NMR metaboliteprofiling of feces as a tool to assess the impact of nutrition on thehuman microbiome. NMR Biomed. 2008, 21, 615−626.(21) Marchesi, J. R.; Holmes, E.; Khan, F.; Kochhar, S.; Scanlan, P.;Shanahan, F.; Wilson, I. D.; Wang, Y. Rapid and noninvasivemetabonomic characterization of inflammatory bowel disease. J.Proteome Res. 2007, 6, 546−551.(22) Yap, I. K. S.; Li, J. V.; Saric, J.; Martin, F. P.; Davies, H.; Wang,Y.; Wilson, I. D.; Nicholson, J. K.; Utzinger, J.; Marchesi, J. R.;Holmes, E. Metabonomic and microbiological analysis of the dynamiceffect of vancomycin-lnduced gut microbiota modification in themouse. J. Proteome Res. 2008, 7, 3718−3728.
Journal of Agricultural and Food Chemistry Article
dx.doi.org/10.1021/jf5031218 | J. Agric. Food Chem. 2014, 62, 9944−99519950
(23) Le Gall, G.; Noor, S. O.; Ridgway, K.; Scovell, L.; Jamieson, C.;Johnson, I. T.; Colquhoun, I. J.; Kemsley, E. K.; Narbad, A.Metabolomics of fecal extracts detects altered metabolic activity ofgut microbiota in ulcerative colitis and irritable bowel syndrome. J.Proteome Res. 2011, 10, 4208−4218.(24) Costabile, A.; Fava, F.; Roytio, H.; Forssten, S. D.; Olli, K.;Klievink, J.; Rowland, I. R.; Ouwehand, A. C.; Rastall, R. A.; Gibson, G.R.; Walton, G. E. Impact of Polydextrose on the faecal microbiota: Adouble-blind, crossover, placebo-controlled feeding study in healthyhuman subjects. Br. J. Nutr. 2012, 108, 471−481.(25) Wishart, D. S.; Knox, C.; Guo, A. C.; Eisner, R.; Young, N.;Gautam, B.; Hau, D. D.; Psychogios, N.; Dong, E.; Bouatra, S.;Mandal, R.; Sinelnikov, I.; Xia, J.; Jia, L.; Cruz, J. A.; Lim, E.; Sobsey,C. A.; Shrivastava, S.; Huang, P.; Liu, P.; Fang, L.; Peng, J.; Fradette,R.; Cheng, D.; Tzur, D.; Clements, M.; Lewis, A.; de souza, A.; Zuniga,A.; Dawe, M.; Xiong, Y.; Clive, D.; Greiner, R.; Nazyrova, A.;Shaykhutdinov, R.; Li, L.; Vogel, H. J.; Forsythei, I. HMDB: Aknowledgebase for the human metabolome. Nucleic Acids Res. 2009,37, 603−610.(26) Savorani, F.; Tomasi, G.; Engelsen, S. B. icoshift: A versatile toolfor the rapid alignment of 1D NMR spectra. J. Magn. Reson. 2010, 202,190−202.(27) Cloarec, O.; Dumas, M. E.; Craig, A.; Barton, R. H.; Trygg, J.;Hudson, J.; Blancher, C.; Gauguier, D.; Lindon, J. C.; Holmes, E.;Nicholson, J. Statistical total correlation spectroscopy: An exploratoryapproach for latent biomarker identification from metabolic 1H NMRdata sets. Anal. Chem. 2005, 77, 1282−1289.(28) Achour, L.; Flourie, B.; Briet, F.; Pellier, P.; Marteau, P.;Rambaud, J. C. Gastrointestinal effects and energy value ofPolydextrose in healthy nonobese men. Am. J. Clin. Nutr. 1994, 59,1362−1368.(29) Kim, H. K.; Choi, Y. H.; Verpoorte, R. NMR-based plantmetabolomics: Where do westand, where do we go? Trends Biotechnol.2011, 29, 267−275.(30) Bertram, H. C.; Malmendal, A.; Petersen, B. O.; Madsen, J. C.;Pedersen, H.; Nielsen, N. C.; Hoppe, C.; Mølgaard, C.; Michaelsen, K.F.; Duus, J. Ø. Effect of magnetic field strength on NMR-basedmetabonomic human urine data. Comparative study of 250, 400, 500,and 800 MHz. Anal. Chem. 2007, 79, 7110−7115.(31) Rowland, I. R.; Mallett, A. K.; Wise, A. The effect of diet on themammalian gut flora and its metabolic activities. Crit. Rev. Toxicol.1985, 16, 31−103.(32) Weaver, C. M.; Martin, B. R.; Story, J. A.; Hutchinson, I.;Sanders, L. Novel fibers increase bone calcium content and strengthbeyond efficiency of large intestine fermentation. J. Agric. Food Chem.2010, 58, 8952−8957.(33) Hernot, D. C.; Boileau, T. W.; Bauer, L. L.; Middelbos, I. S.;Murphy, M. R.; Swanson, K. S.; Fahey, G. C., Jr. In vitro fermentationprofiles, gas production rates, and microbiota modulation as affectedby certain fructans, galactooligosaccharides, and Polydextrose. J. Agric.Food Chem. 2009, 57, 1354−1361.(34) Aura, A. M.; Niemi, P.; Mattila, I.; Niemela, K.; Smeds, A.;Tamminen, T.; Faulds, C.; Buchert, J.; Poutanen, K. Release of smallphenolic compounds from Brewer’s spent grain and its lignin fractionsby human intestinal microbiota in vitro. J. Agric. Food Chem. 2013, 61,9744−9753.(35) Koecher, K. J.; Noack, J. A.; Timm, D. A.; Klosterbuer, A. S.;Thomas, W.; Slavin, J. L. Estimation and interpretation offermentation in the Gut: Coupling results from a 24 h batch in vitrosystem with fecal measurements from a human intervention feedingstudy using fructo-oligosaccharides, inulin, gum acacia, and pea fiber. J.Agric. Food Chem. 2014, 62, 1332−1337.(36) Yang, J.; Maldonado-Gomez, M. X.; Hutkins, R. W.; Rose, D. J.Production and in Vitro fermentation of soluble, non-digestible,feruloylated oligo- and polysaccharides from maize and wheat brans. J.Agric. Food Chem. 2014, 62, 159−166.(37) Fischbach, M. A.; Sonnenburg, J. L. Eating for two: Howmetabolism establishes interspecies interactions in the gut. Cell HostMicrobe 2011, 10, 336−347.
(38) Van Der Meulen, R.; Adriany, T.; Verbrugghe, K.; De Vuyst, L.Kinetic analysis of bifidobacterial metabolism reveals a minor role forsuccinic acid in the regeneration of NAD+ through its growth-associated production. Appl. Environ. Microbiol. 2006, 72, 5204−5210.
Journal of Agricultural and Food Chemistry Article
dx.doi.org/10.1021/jf5031218 | J. Agric. Food Chem. 2014, 62, 9944−99519951