immersive media tic update - technicolor
TRANSCRIPT
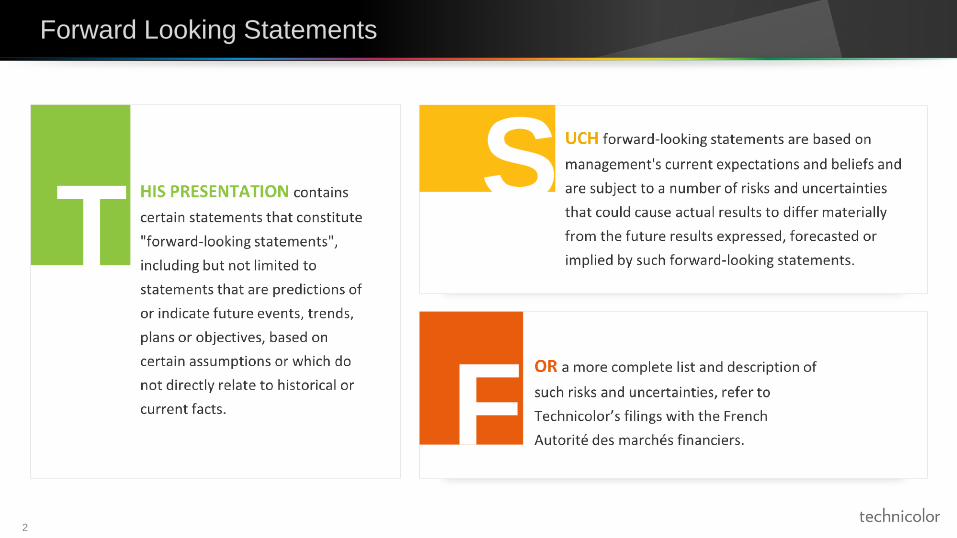
Forward Looking Statements
2
T S
F

Agenda
3
Slide 4 to 18
FY 2014
Financial
Performance
Slide 19 to 26
Amplify 2015
Key
Takeaways
Slide 27 to 31
Drive 2020
Vision &
Strategy
Slide 32 to 46
Drive 2020
Financial
Implications &
Objectives

5
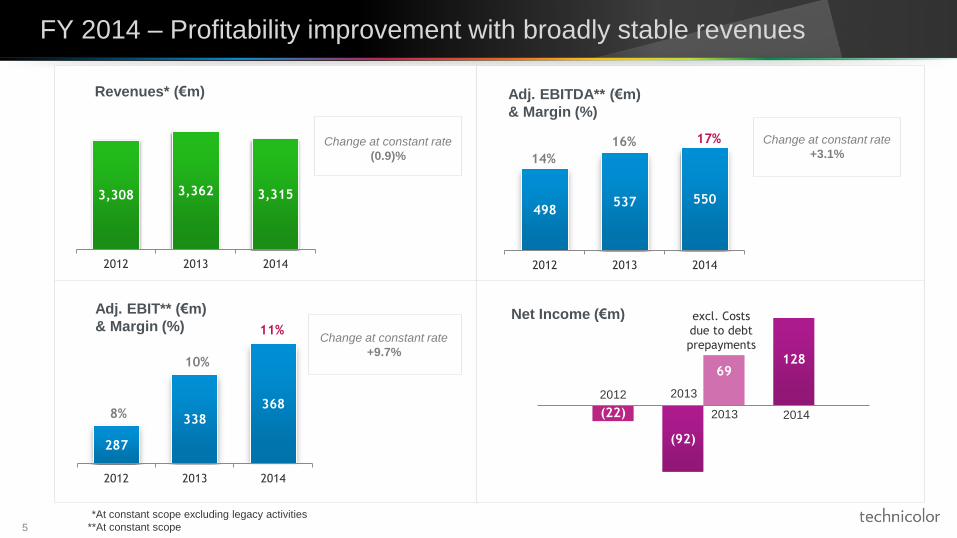
FY 2014 – Profitability improvement with broadly stable revenues
Adj. EBITDA** (€m)
& Margin (%)
Change at constant rate
+3.1%
Adj. EBIT** (€m)
& Margin (%) Change at constant rate
+9.7%
*At constant scope excluding legacy activities
**At constant scope
498 537 550
2012 2013 2014
17% 16%
14%
3,308 3,362 3,315
2012 2013 2014
Net Income (€m)
Change at constant rate
(0.9)%
Revenues* (€m)
excl. Costs
due to debt
prepayments
2012
2013 2014
287
338 368
2012 2013 2014
10%
11%
8%
(92)
128
(22)
69
2013

Cash transformation (€m)
312
374 398
34% 41%
58%
2012 2013 2014
Operating Cash Flow FCF/OCF
Cash conversion rate
6
Strong cash generation and rapid deleveraging
Group FCF (€m)
*Net debt and Adj. EBITDA at constant rate
Nominal
Net Debt (€m)
Net Debt/Adj.
EBITDA
106 153
230
2012 2013 2014
+50%
+45%
839 784
645 567
2012 2013 2014
1.46x
1.18x €(139)m
1.04x*
1.64x
€(55)m

400 353 359
2012 2013 2014
77.8% 72.8% 73.3%
7
Technology – FY 2014
Weaker contribution of MPEG LA
(MPEG-2) resulting from:
45% of revenues vs. 53% in 2013
A one-off adjustment in Q1 2014
Persistent softness in the PC market
during the year
Revenues (€m)
Change at constant rate Key Highlights
Double-digit growth in direct
licensing programs, up 16.5%
Significant new contracts,
particularly in smartphone and
Digital TV:
A second smartphone licensing
agreement with LG in Q1
A Digital TV licensing agreement
with a top tier Asian CE player
in Q4
Solid performance across other
programs and in Trademark
Licensing with the renewal of most of
its existing brand licensees
Adj. EBITDA improvement, mainly
reflecting solid Licensing revenues
Adj. EBITDA margin increase as
Licensing performance compensated
for increased investments in new
business initiatives (Technology
Licensing, Virdata…)
-1%
Adj. EBITDA (€m)
& Margin (%)
515 485 490
2012 2013 2014
-5%
8
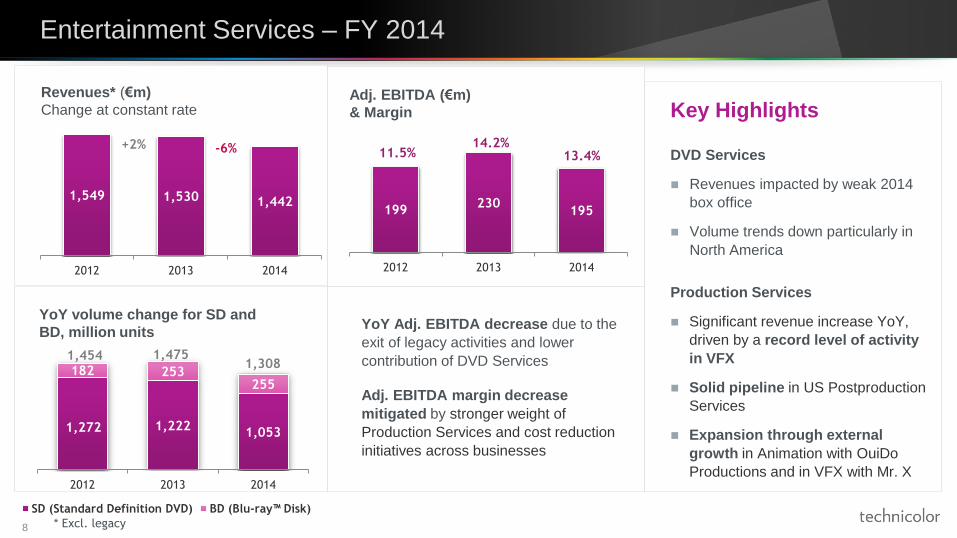
Entertainment Services – FY 2014
Key Highlights
DVD Services
Revenues impacted by weak 2014
box office
Volume trends down particularly in
North America
Production Services
Significant revenue increase YoY,
driven by a record level of activity
in VFX
Solid pipeline in US Postproduction
Services
Expansion through external
growth in Animation with OuiDo
Productions and in VFX with Mr. X
Revenues* (€m)
Change at constant rate Adj. EBITDA (€m)
& Margin
YoY Adj. EBITDA decrease due to the
exit of legacy activities and lower
contribution of DVD Services
Adj. EBITDA margin decrease
mitigated by stronger weight of
Production Services and cost reduction
initiatives across businesses
199 230
195
2012 2013 2014
11.5% 14.2%
13.4%
221 221 204
27 4542
Q2 12 Q2 13 Q2 14
SD (Standard Definition DVD) BD (Blu-ray™ Disk)
262 261279
YoY volume change for SD and
BD, million units
1,272 1,222 1,053
182 253 255
2012 2013 2014
1,475 1,308
1,454
* Excl. legacy
1,549 1,530 1,442
2012 2013 2014
+2% -6%
+16%
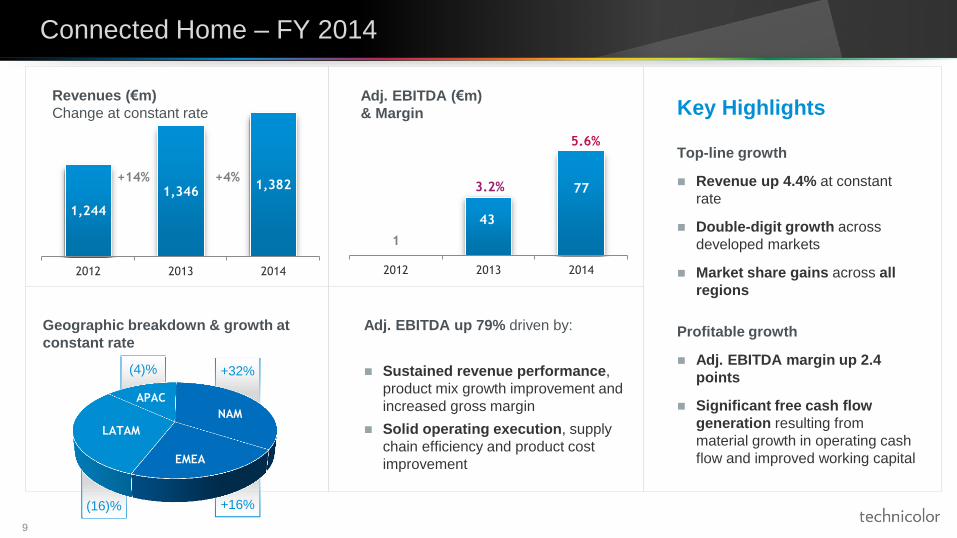
Geographic breakdown & growth at
constant rate
(4)% +32%
(16)%
9
Connected Home – FY 2014
Key Highlights
Top-line growth
Revenue up 4.4% at constant
rate
Double-digit growth across
developed markets
Market share gains across all
regions
Profitable growth
Adj. EBITDA margin up 2.4
points
Significant free cash flow
generation resulting from
material growth in operating cash
flow and improved working capital
Adj. EBITDA up 79% driven by:
Sustained revenue performance,
product mix growth improvement and
increased gross margin
Solid operating execution, supply
chain efficiency and product cost
improvement
Revenues (€m)
Change at constant rate
Adj. EBITDA (€m)
& Margin
1
43
77
2012 2013 2014
5.6%
3.2%
NAM
EMEA
LATAM
APAC
1,244
1,346 1,382
2012 2013 2014
+14% +4%
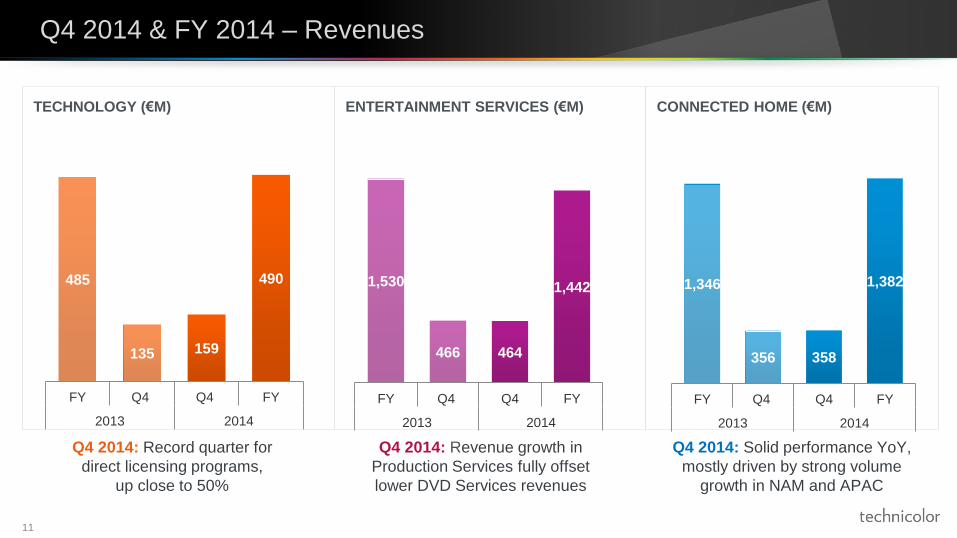
TECHNOLOGY (€M) ENTERTAINMENT SERVICES (€M)
CONNECTED HOME (€M)
11
Q4 2014 & FY 2014 – Revenues
1,530
466 464
1,442
FY Q4 Q4 FY
2013 2014
485
135 159
490
FY Q4 Q4 FY
2013 2014
1,346
356 358
1,382
FY Q4 Q4 FY
2013 2014
Q4 2014: Record quarter for
direct licensing programs,
up close to 50%
Q4 2014: Revenue growth in
Production Services fully offset
lower DVD Services revenues
Q4 2014: Solid performance YoY,
mostly driven by strong volume
growth in NAM and APAC
12
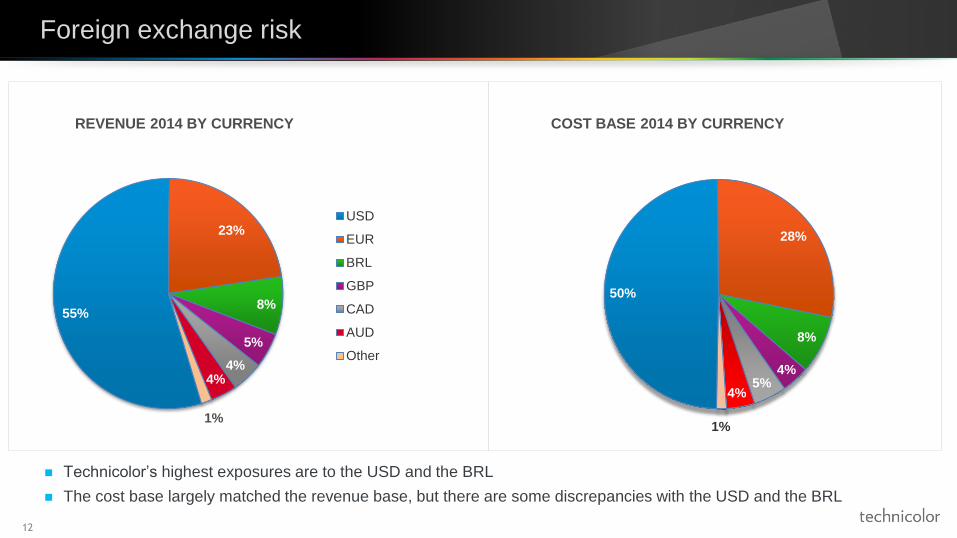
Foreign exchange risk
REVENUE 2014 BY CURRENCY
55%
23%
8%
5%
4% 4%
1%
USD
EUR
BRL
GBP
CAD
AUD
Other
50%
28%
8%
4% 5%
4%
1%
COST BASE 2014 BY CURRENCY
Technicolor’s highest exposures are to the USD and the BRL
The cost base largely matched the revenue base, but there are some discrepancies with the USD and the BRL
13
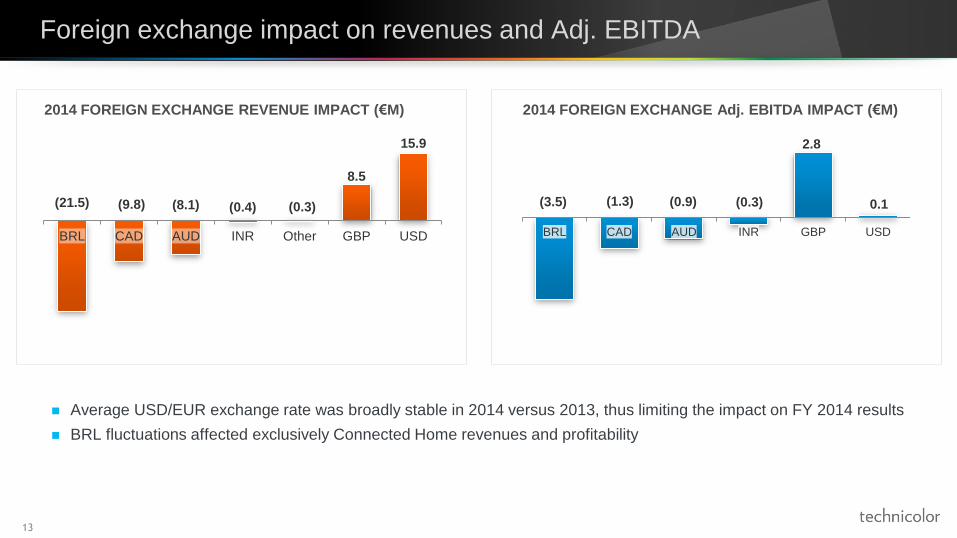
Foreign exchange impact on revenues and Adj. EBITDA
2014 FOREIGN EXCHANGE Adj. EBITDA IMPACT (€M) 2014 FOREIGN EXCHANGE REVENUE IMPACT (€M)
Average USD/EUR exchange rate was broadly stable in 2014 versus 2013, thus limiting the impact on FY 2014 results
BRL fluctuations affected exclusively Connected Home revenues and profitability
0.1 (21.5) (9.8) (8.1) (0.4) (0.3)
8.5
15.9
BRL CAD AUD INR Other GBP USD
(3.5) -1,3 (1.3) (0.9) (0.3)
2.8
BRL CAD AUD INR GBP USD
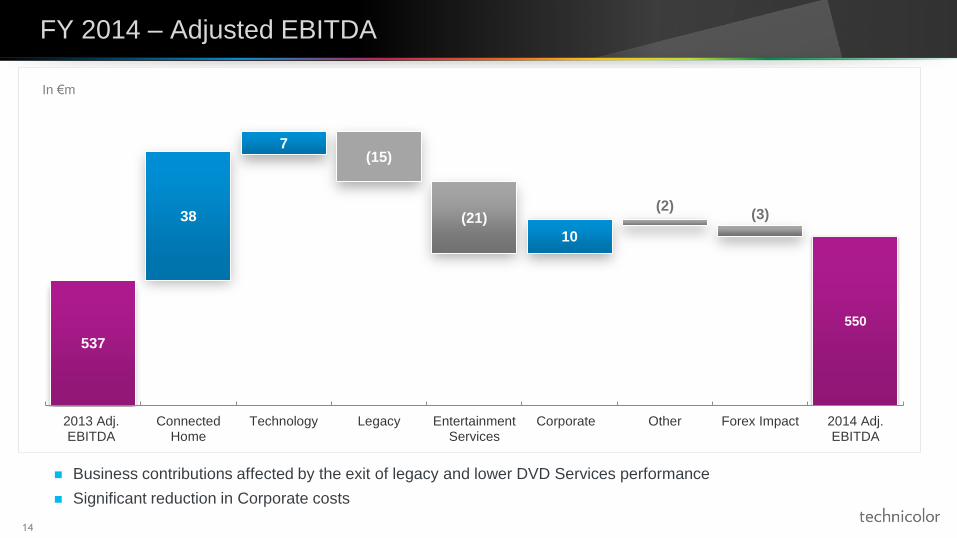
537
550
38
7 (15)
(21)
10
(2) (3)
2013 Adj.EBITDA
ConnectedHome
Technology Legacy EntertainmentServices
Corporate Other Forex Impact 2014 Adj.EBITDA
14
FY 2014 – Adjusted EBITDA
In €m
Business contributions affected by the exit of legacy and lower DVD Services performance
Significant reduction in Corporate costs

15
FY 2014 – Adjusted EBIT
Entertainment Services impacted positively with lower D&A expenses
Increase in D&A in Technology related to development of new businesses, particularly Technology Licensing
338
368
41
(1) (1)
(12) 9
(3) (3)
2013 Adj. EBIT ConnectedHome
EntertainmentServices
Technology Legacy Corporate Other Forex Impact 2014 Adj. EBIT
In €m
16
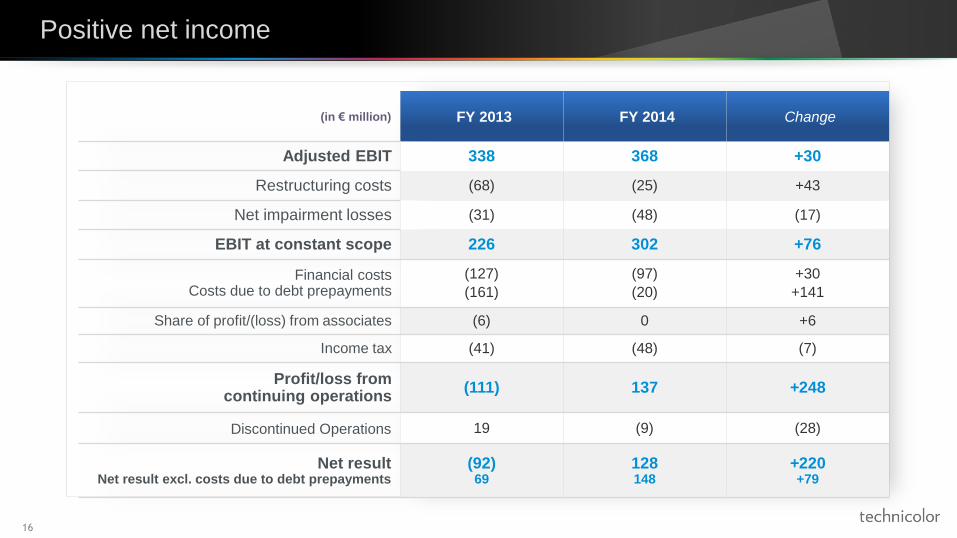
Positive net income
(in € million) FY 2013 FY 2014 Change
Adjusted EBIT 338 368 +30
Restructuring costs (68) (25) +43
Net impairment losses (31) (48) (17)
EBIT at constant scope 226 302 +76
Financial costs Costs due to debt prepayments
(127)
(161)
(97)
(20)
+30
+141
Share of profit/(loss) from associates (6) 0 +6
Income tax (41) (48) (7)
Profit/loss from continuing operations
(111) 137 +248
Discontinued Operations 19 (9) (28)
Net result Net result excl. costs due to debt prepayments
(92) 69
128 148
+220 +79
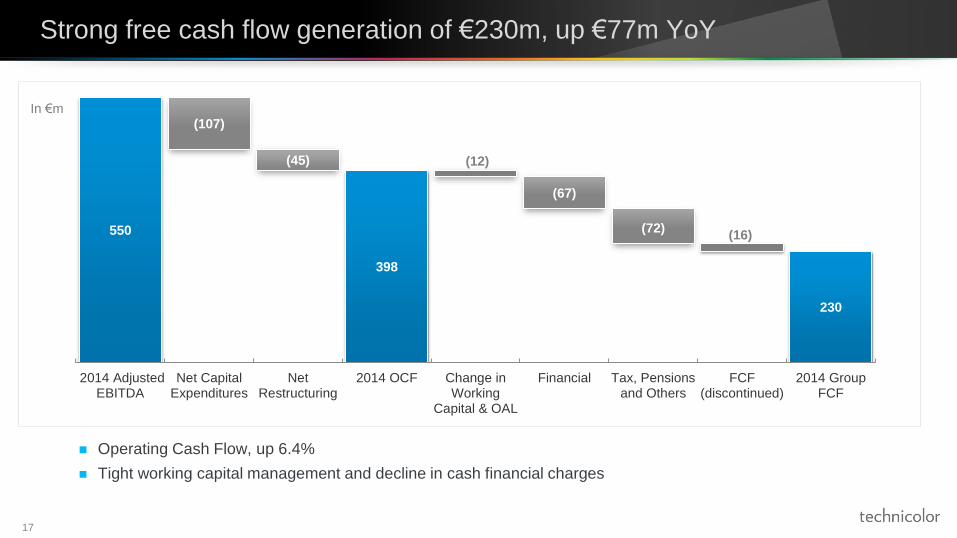
550
398
230
(107)
(45) (12)
(67)
(72) (16)
2014 AdjustedEBITDA
Net CapitalExpenditures
NetRestructuring
2014 OCF Change inWorking
Capital & OAL
Financial Tax, Pensionsand Others
FCF(discontinued)
2014 GroupFCF
17
Strong free cash flow generation of €230m, up €77m YoY
Operating Cash Flow, up 6.4%
Tight working capital management and decline in cash financial charges
In €m
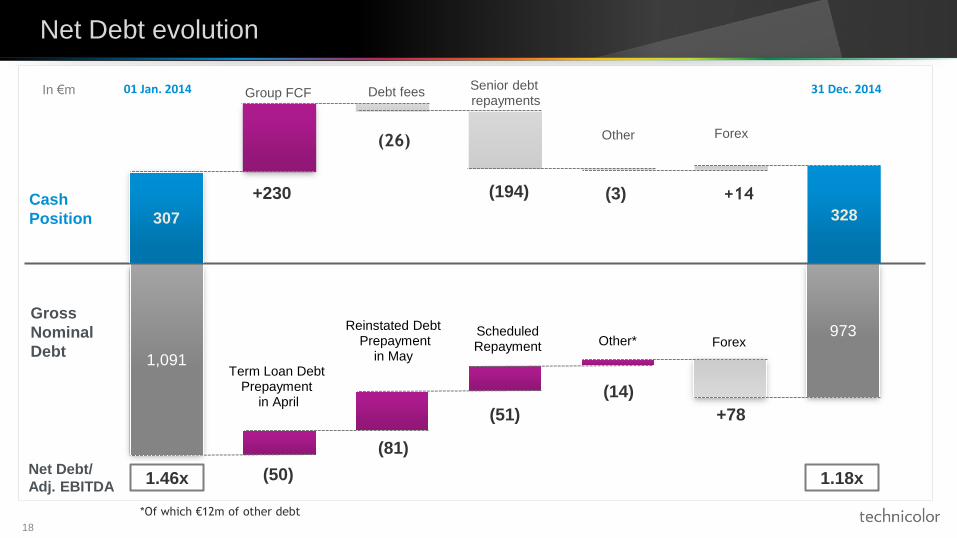
1,091
973
Term Loan Debt Prepayment
in April
Reinstated Debt Prepayment
in May
Scheduled Repayment Other* Forex
(50)
(81)
(51)
(14)
+78
18
Net Debt evolution
307 328
Group FCF Debt fees Senior debt repayments
Other Forex
01 Jan. 2014 31 Dec. 2014
(26)
(3) +14
1.46x 1.18x
Cash
Position
+230
Net Debt/
Adj. EBITDA
Gross
Nominal
Debt
(194)
In €m
*Of which €12m of other debt

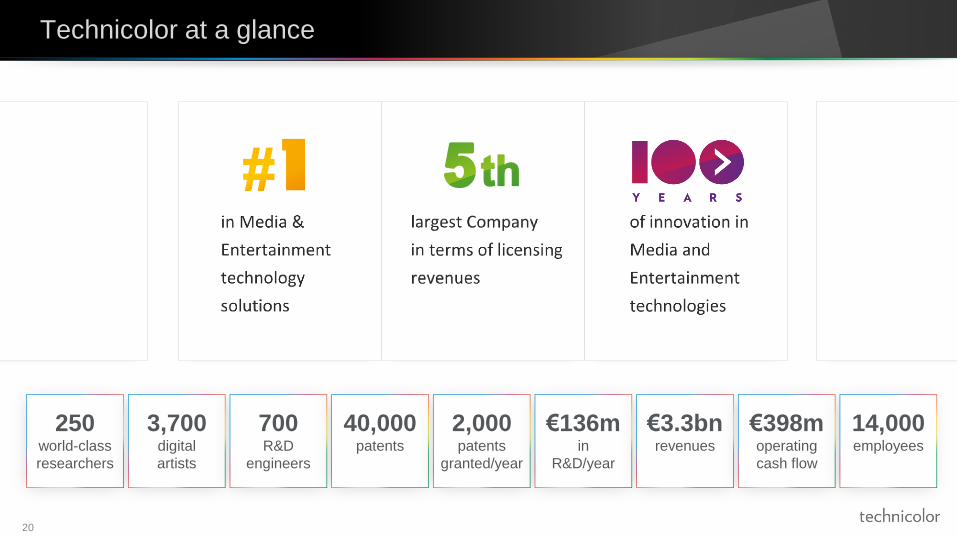
Technicolor at a glance
20
250 world-class
researchers
3,700 digital
artists
700 R&D
engineers
40,000 patents
2,000 patents
granted/year
€136m in
R&D/year
€3.3bn revenues
€398m operating
cash flow
14,000 employees
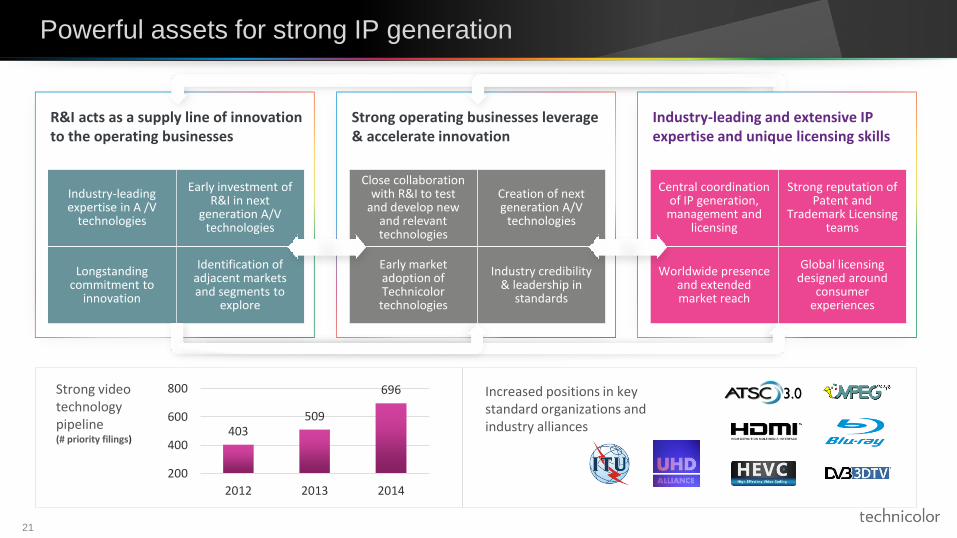
Powerful assets for strong IP generation
21
R&I acts as a supply line of innovation to the operating businesses
Strong operating businesses leverage & accelerate innovation
Close collaboration with R&I to test
and develop new and relevant technologies
Creation of next generation A/V
technologies
Early market adoption of Technicolor technologies
Industry credibility & leadership in
standards
Industry-leading and extensive IP expertise and unique licensing skills
Central coordination of IP generation,
management and licensing
Strong reputation of Patent and
Trademark Licensing teams
Worldwide presence and extended market reach
Global licensing designed around
consumer experiences
Industry-leading expertise in A /V
technologies
Early investment of R&I in next
generation A/V technologies
Longstanding commitment to
innovation
Identification of adjacent markets and segments to
explore
403 509
696
200
400
600
800
2012 2013 2014
Strong video technology pipeline (# priority filings)
Increased positions in key standard organizations and industry alliances
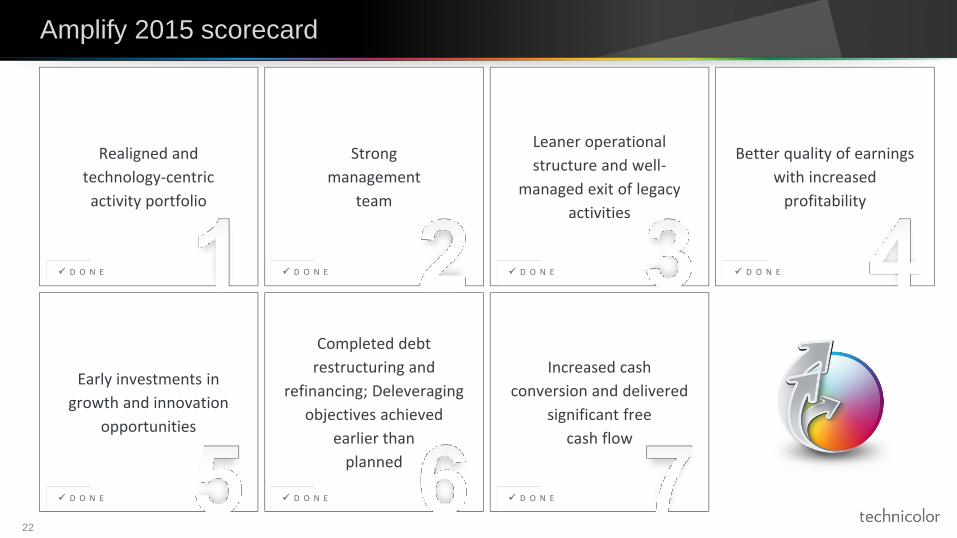
Amplify 2015 scorecard
22
Realigned and
technology-centric
activity portfolio
Strong
management
team
Leaner operational
structure and well-
managed exit of legacy
activities
Better quality of earnings
with increased
profitability
Early investments in
growth and innovation
opportunities
Completed debt
restructuring and
refinancing; Deleveraging
objectives achieved
earlier than
planned
Increased cash
conversion and delivered
significant free
cash flow
D O N E
D O N E
D O N E
D O N E
D O N E
D O N E
D O N E
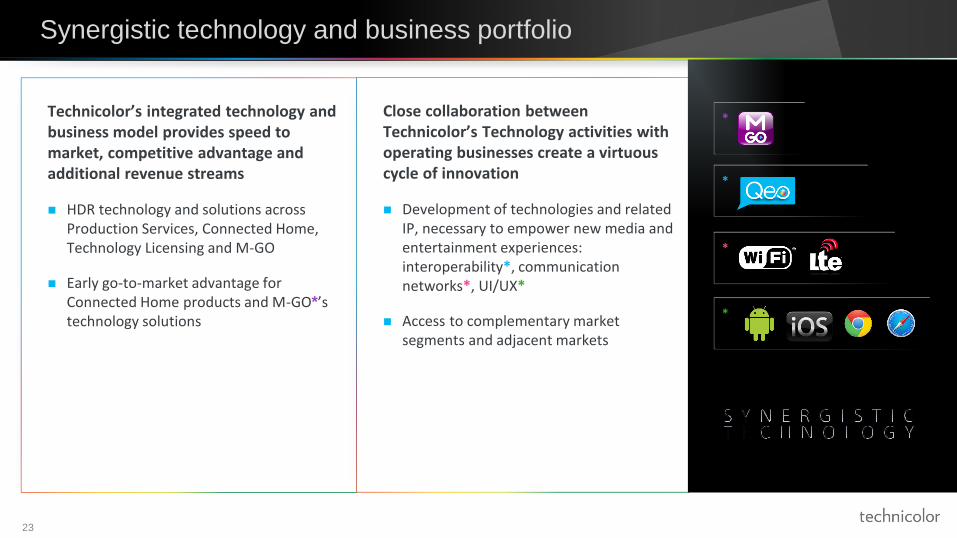
Technicolor’s integrated technology and business model provides speed to market, competitive advantage and additional revenue streams
HDR technology and solutions across Production Services, Connected Home, Technology Licensing and M-GO
Early go-to-market advantage for Connected Home products and M-GO*’s technology solutions
Close collaboration between Technicolor’s Technology activities with operating businesses create a virtuous cycle of innovation
Development of technologies and related IP, necessary to empower new media and entertainment experiences: interoperability*, communication networks*, UI/UX*
Access to complementary market segments and adjacent markets
Synergistic technology and business portfolio
23
*
*
*
*
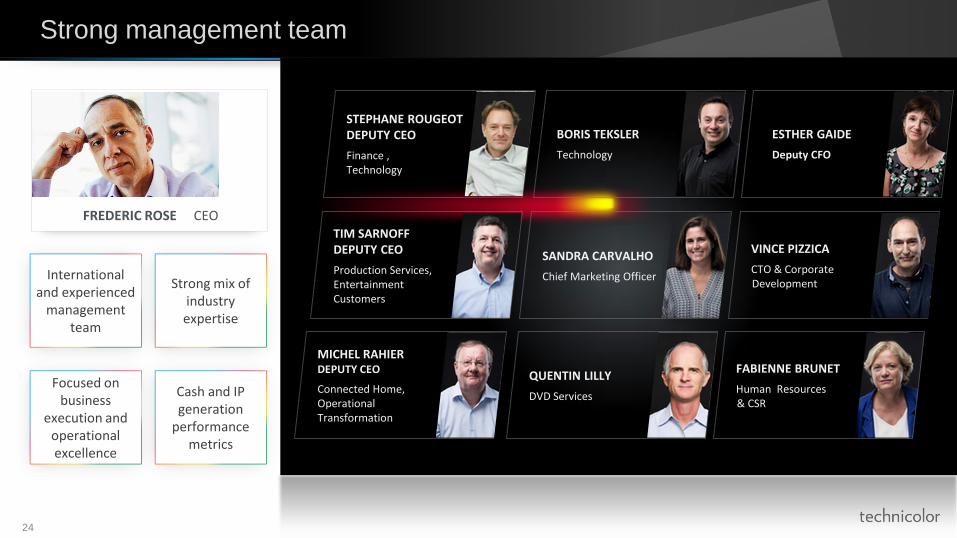
VINCE PIZZICA
CTO & Corporate Development
QUENTIN LILLY
DVD Services
Strong management team
24
International and experienced
management team
Strong mix of industry expertise
Focused on business
execution and operational excellence
Cash and IP generation
performance metrics
STEPHANE ROUGEOT DEPUTY CEO
Finance , Technology
BORIS TEKSLER
Technology
MICHEL RAHIER DEPUTY CEO
Connected Home, Operational Transformation
ESTHER GAIDE
Deputy CFO
FREDERIC ROSE CEO
SANDRA CARVALHO
Chief Marketing Officer
TIM SARNOFF DEPUTY CEO
Production Services, Entertainment Customers
FABIENNE BRUNET
Human Resources & CSR
Better quality of earnings and early investments in growth & innovation
25
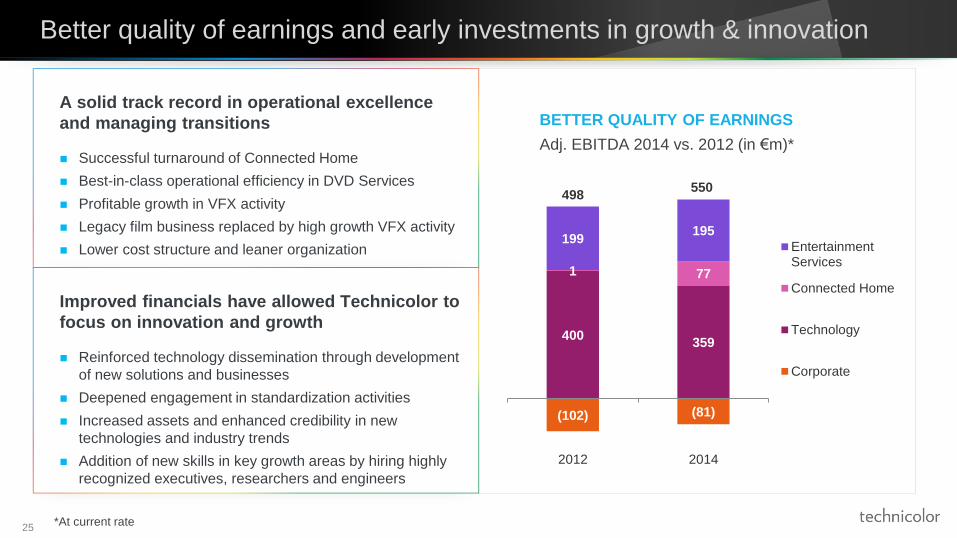
A solid track record in operational excellence
and managing transitions
Successful turnaround of Connected Home
Best-in-class operational efficiency in DVD Services
Profitable growth in VFX activity
Legacy film business replaced by high growth VFX activity
Lower cost structure and leaner organization
Improved financials have allowed Technicolor to
focus on innovation and growth
Reinforced technology dissemination through development
of new solutions and businesses
Deepened engagement in standardization activities
Increased assets and enhanced credibility in new
technologies and industry trends
Addition of new skills in key growth areas by hiring highly
recognized executives, researchers and engineers
BETTER QUALITY OF EARNINGS
Adj. EBITDA 2014 vs. 2012 (in €m)*
(102) (81)
400 359
1 77
199 195
2012 2014
EntertainmentServices
Connected Home
Technology
Corporate
498 550
*At current rate
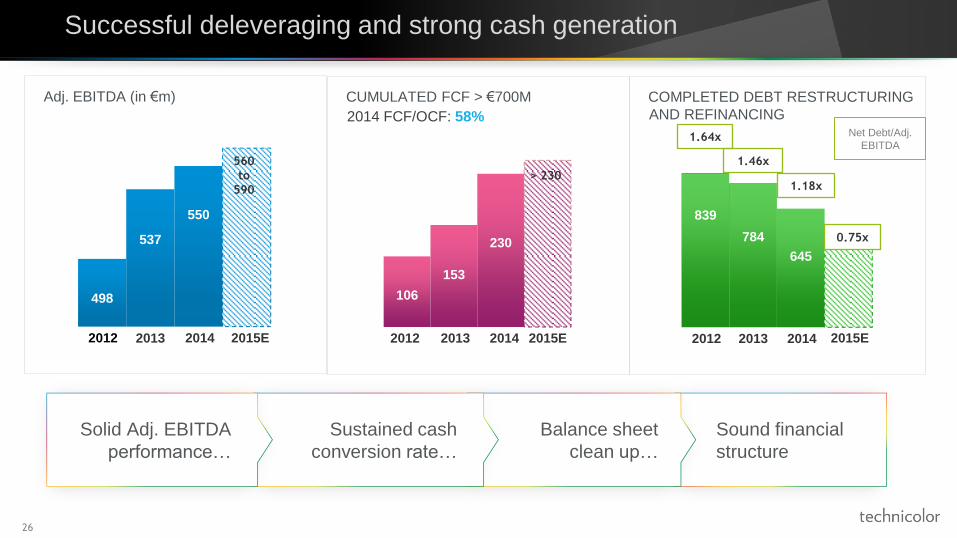
COMPLETED DEBT RESTRUCTURING
AND REFINANCING
CUMULATED FCF > €700M
26
Successful deleveraging and strong cash generation
Sound financial
structure
Balance sheet
clean up…
Sustained cash
conversion rate…
Solid Adj. EBITDA
performance…
2012 2013 2014
Adj. EBITDA (in €m)
106
153
230
2012 2013 2014 2015E
498
537
550
2012 2013 2014 2015E
560
to
590
> 230
2014 FCF/OCF: 58%
839
784
645
1.46x
1.18x
1.64x
2012 2013 2014
0.75x
2015E
Net Debt/Adj.
EBITDA
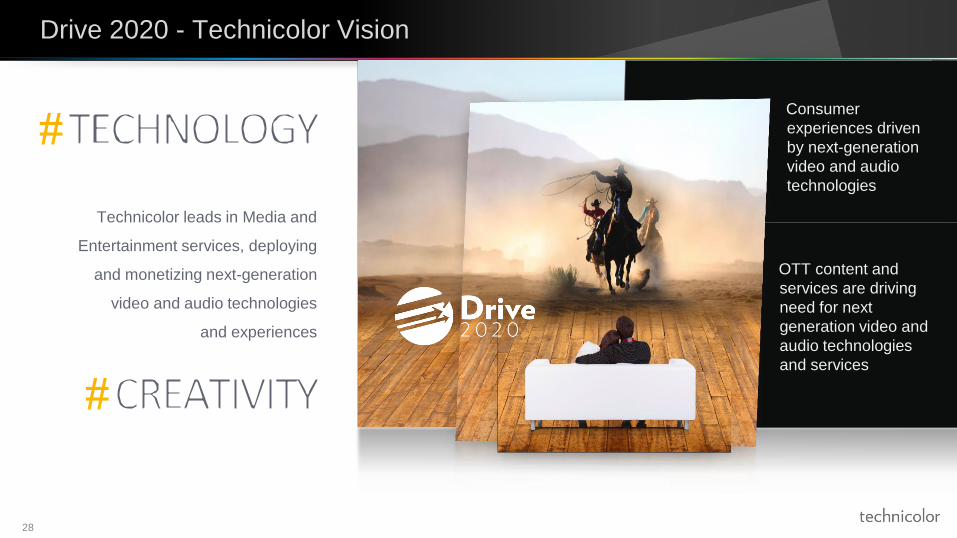
Drive 2020 - Technicolor Vision
28
Technicolor leads in Media and
Entertainment services, deploying
and monetizing next-generation
video and audio technologies
and experiences
Consumer
experiences driven
by next-generation
video and audio
technologies
OTT content and
services are driving
need for next
generation video and
audio technologies
and services
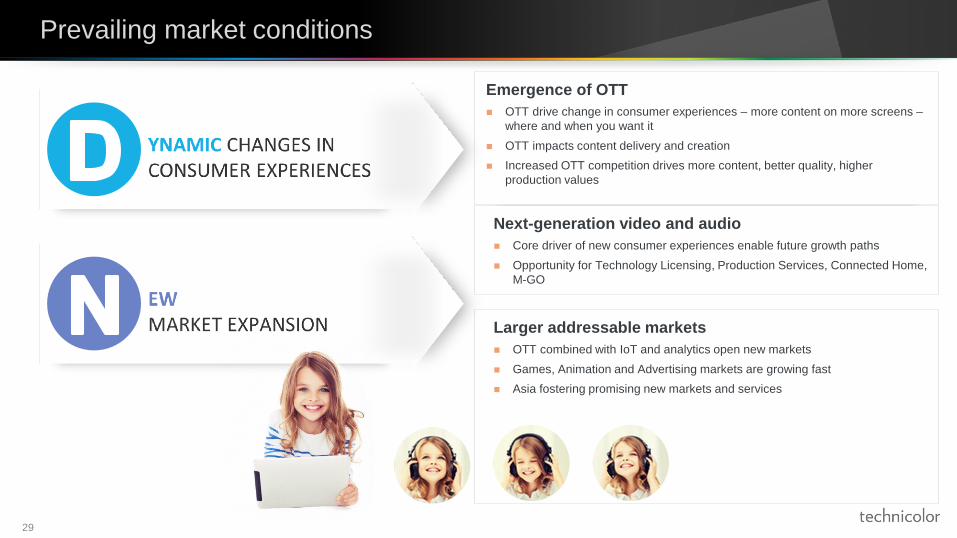
Prevailing market conditions
29
Emergence of OTT
OTT drive change in consumer experiences – more content on more screens –
where and when you want it
OTT impacts content delivery and creation
Increased OTT competition drives more content, better quality, higher
production values
Next-generation video and audio
Core driver of new consumer experiences enable future growth paths
Opportunity for Technology Licensing, Production Services, Connected Home,
M-GO
Larger addressable markets
OTT combined with IoT and analytics open new markets
Games, Animation and Advertising markets are growing fast
Asia fostering promising new markets and services
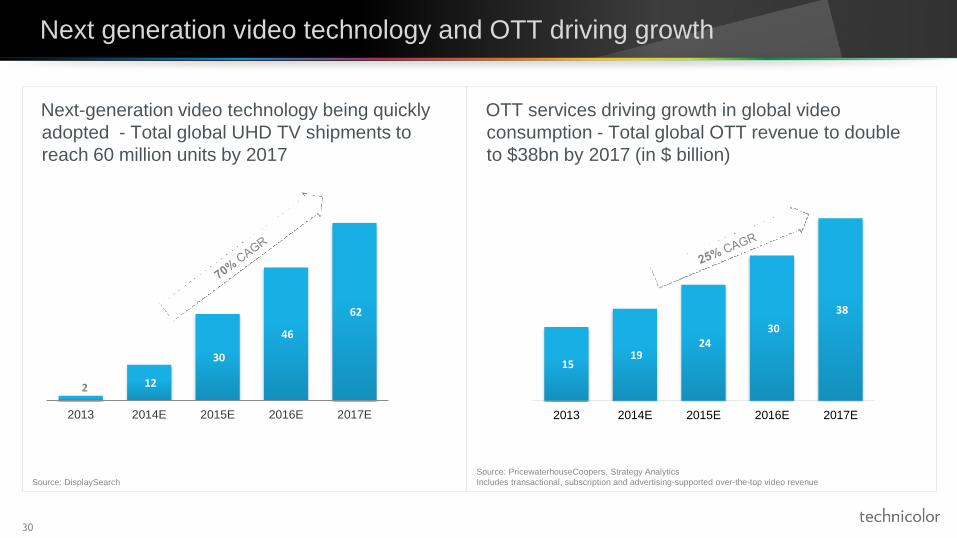
OTT services driving growth in global video
consumption - Total global OTT revenue to double
to $38bn by 2017 (in $ billion)
Next-generation video technology being quickly
adopted - Total global UHD TV shipments to
reach 60 million units by 2017
30
Next generation video technology and OTT driving growth
15 19
24 30
38
2013 2014E 2015E 2016E 2017E
Source: PricewaterhouseCoopers, Strategy Analytics
Includes transactional, subscription and advertising-supported over-the-top video revenue Source: DisplaySearch
2 12
30
46
62
2013 2014E 2015E 2016E 2017E
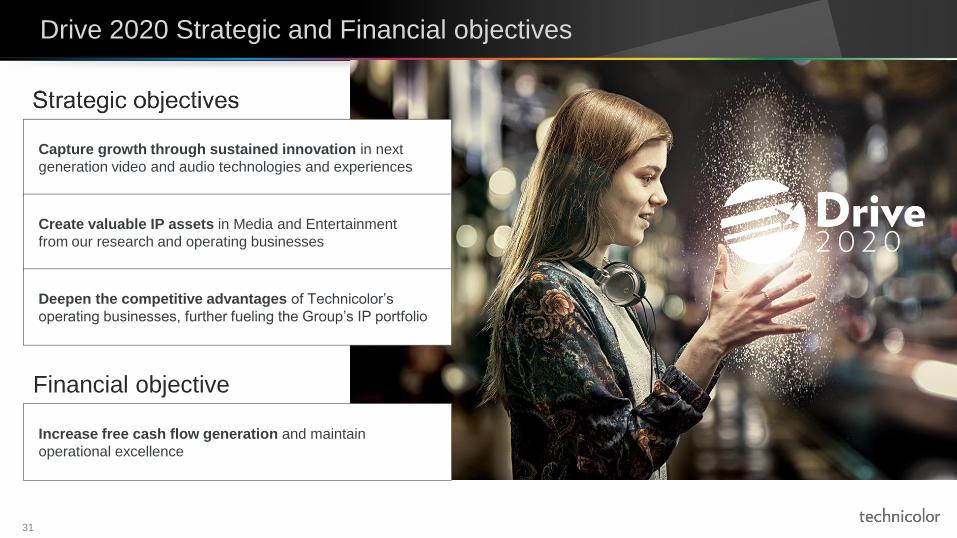
Drive 2020 Strategic and Financial objectives
31
Capture growth through sustained innovation in next
generation video and audio technologies and experiences
Create valuable IP assets in Media and Entertainment
from our research and operating businesses
Deepen the competitive advantages of Technicolor’s
operating businesses, further fueling the Group’s IP portfolio
Financial objective
Increase free cash flow generation and maintain
operational excellence

Technology – An integrated licensing approach
33
* Smartphones, tablets, TVs, PCs, STBS, OTT devices, Blu-ray players – Sources: Park Associates, Gartner, IDC, Informa
3.5 billion consumer
electronic devices* by 2020 CAGR 2015-2020: +4.1%
Growth driven largely by
tablets and smartphones
ADDRESSABLE MARKET
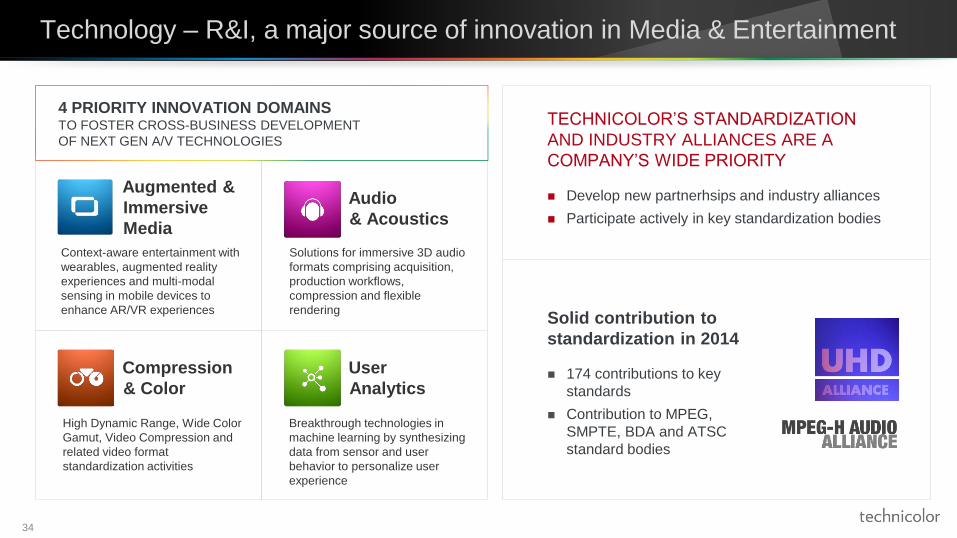
Compression
& Color
Augmented &
Immersive
Media
Audio
& Acoustics
User
Analytics
Technology – R&I, a major source of innovation in Media & Entertainment
34
Context-aware entertainment with
wearables, augmented reality
experiences and multi-modal
sensing in mobile devices to
enhance AR/VR experiences
Solutions for immersive 3D audio
formats comprising acquisition,
production workflows,
compression and flexible
rendering
Breakthrough technologies in
machine learning by synthesizing
data from sensor and user
behavior to personalize user
experience
High Dynamic Range, Wide Color
Gamut, Video Compression and
related video format
standardization activities
4 PRIORITY INNOVATION DOMAINS TO FOSTER CROSS-BUSINESS DEVELOPMENT
OF NEXT GEN A/V TECHNOLOGIES
TECHNICOLOR’S STANDARDIZATION
AND INDUSTRY ALLIANCES ARE A
COMPANY’S WIDE PRIORITY
Develop new partnerhsips and industry alliances
Participate actively in key standardization bodies
Solid contribution to
standardization in 2014
174 contributions to key
standards
Contribution to MPEG,
SMPTE, BDA and ATSC
standard bodies

Technology – Expanding patent Licensing
35
A MARKET LEADING PATENT LICENSING PLATFORM, MONETIZING PATENTS GENERATED BY R&I AND
OPERATING BUSINESSES
Competitive advantages
Best-in-class IP licensing
platform
Industry-leading R&I team,
engaged with the operating
businesses
Scale and relevance of patent
portfolio
First achievements
Pool strategies
IP agent model
IP filings > 600
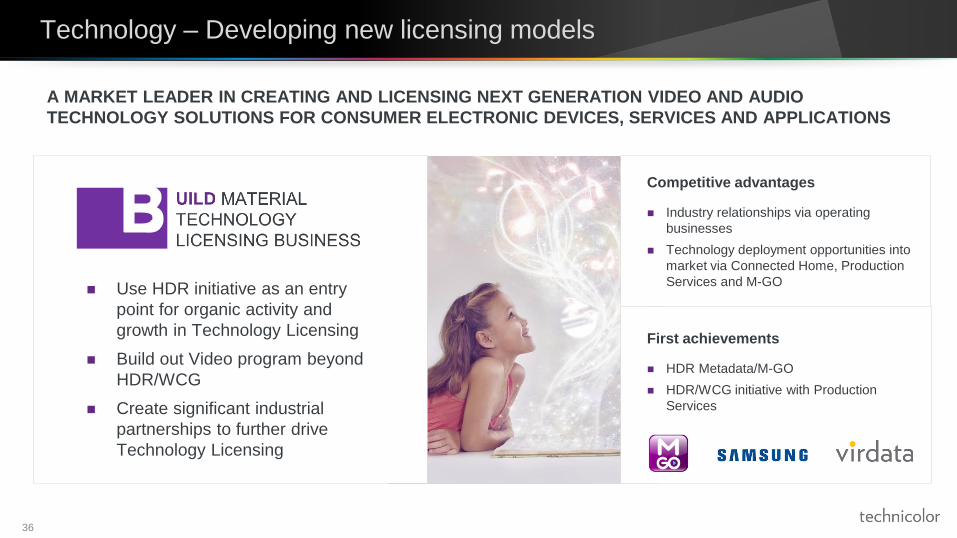
Technology – Developing new licensing models
36
A MARKET LEADER IN CREATING AND LICENSING NEXT GENERATION VIDEO AND AUDIO
TECHNOLOGY SOLUTIONS FOR CONSUMER ELECTRONIC DEVICES, SERVICES AND APPLICATIONS
Competitive advantages
Industry relationships via operating
businesses
Technology deployment opportunities into
market via Connected Home, Production
Services and M-GO
First achievements
HDR Metadata/M-GO
HDR/WCG initiative with Production
Services
Use HDR initiative as an entry
point for organic activity and
growth in Technology Licensing
Build out Video program beyond
HDR/WCG
Create significant industrial
partnerships to further drive
Technology Licensing
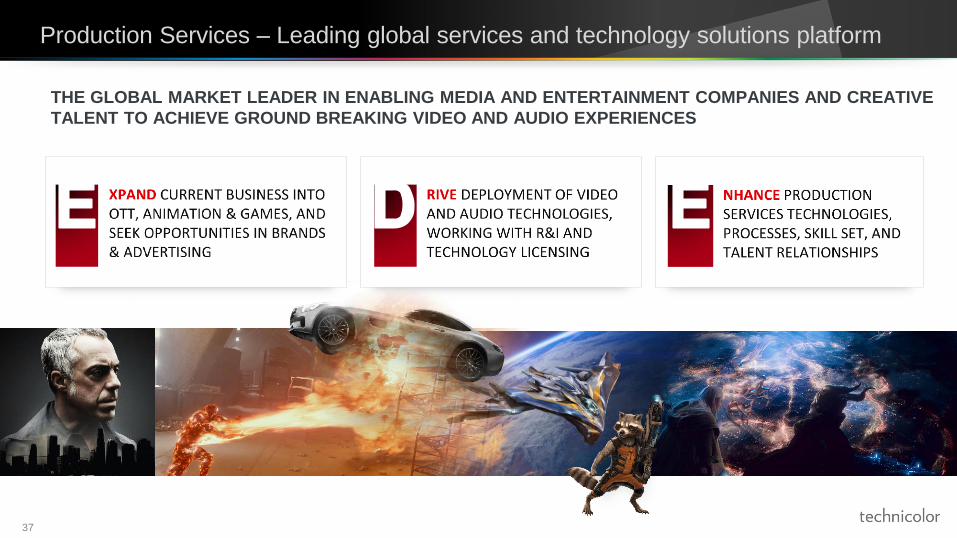
Production Services – Leading global services and technology solutions platform
37
THE GLOBAL MARKET LEADER IN ENABLING MEDIA AND ENTERTAINMENT COMPANIES AND CREATIVE
TALENT TO ACHIEVE GROUND BREAKING VIDEO AND AUDIO EXPERIENCES
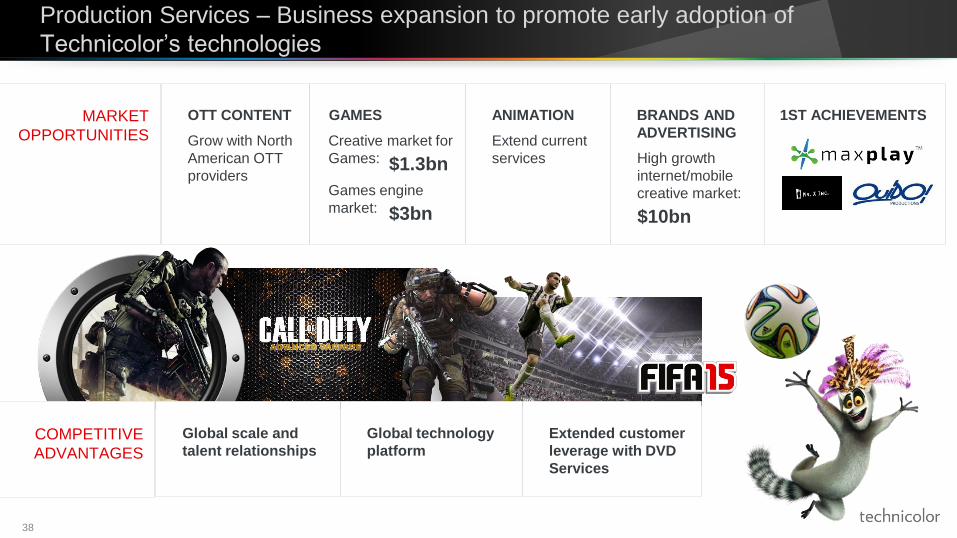
Production Services – Business expansion to promote early adoption of
Technicolor’s technologies
38
OTT CONTENT
Grow with North
American OTT
providers
GAMES ANIMATION
Extend current
services
BRANDS AND
ADVERTISING MARKET
OPPORTUNITIES
Global scale and
talent relationships
Global technology
platform
Extended customer
leverage with DVD
Services
COMPETITIVE
ADVANTAGES
1ST ACHIEVEMENTS
Creative market for
Games: $1.3bn
Games engine
market: $3bn
High growth
internet/mobile
creative market:
$10bn
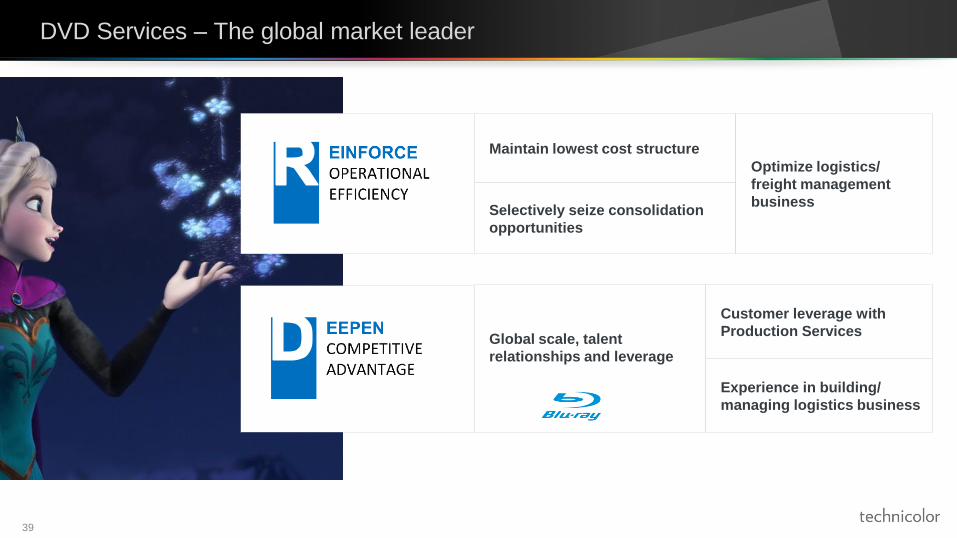
DVD Services – The global market leader
39
Maintain lowest cost structure
Selectively seize consolidation
opportunities
Optimize logistics/
freight management
business
Global scale, talent
relationships and leverage
Customer leverage with
Production Services
Experience in building/
managing logistics business
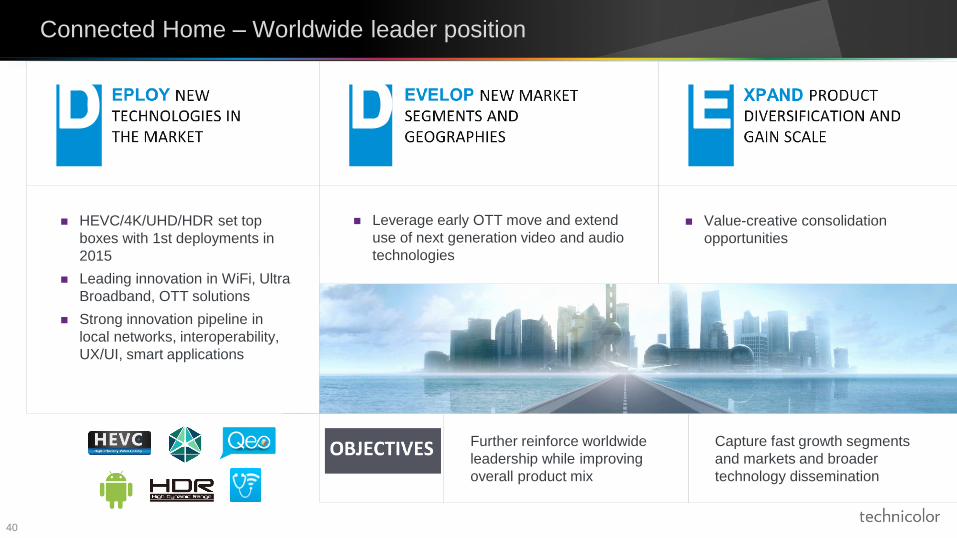
Connected Home – Worldwide leader position
40
HEVC/4K/UHD/HDR set top
boxes with 1st deployments in
2015
Leading innovation in WiFi, Ultra
Broadband, OTT solutions
Strong innovation pipeline in
local networks, interoperability,
UX/UI, smart applications
Value-creative consolidation
opportunities
Leverage early OTT move and extend
use of next generation video and audio
technologies
Capture fast growth segments
and markets and broader
technology dissemination
Further reinforce worldwide
leadership while improving
overall product mix
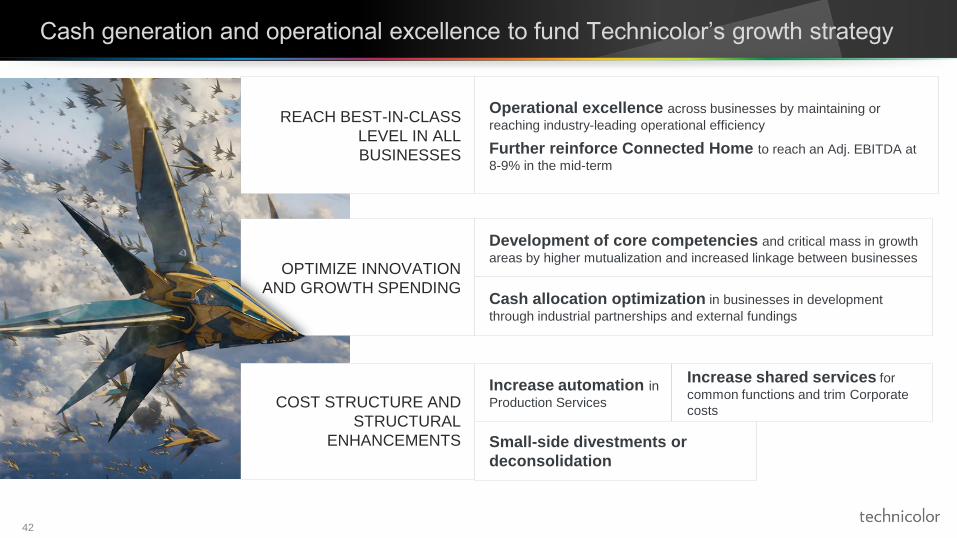
Cash generation and operational excellence to fund Technicolor’s growth strategy
42
REACH BEST-IN-CLASS
LEVEL IN ALL
BUSINESSES
Operational excellence across businesses by maintaining or
reaching industry-leading operational efficiency
Further reinforce Connected Home to reach an Adj. EBITDA at
8-9% in the mid-term
OPTIMIZE INNOVATION
AND GROWTH SPENDING
Development of core competencies and critical mass in growth
areas by higher mutualization and increased linkage between businesses
Cash allocation optimization in businesses in development
through industrial partnerships and external fundings
COST STRUCTURE AND
STRUCTURAL
ENHANCEMENTS
Increase automation in
Production Services
Increase shared services for
common functions and trim Corporate
costs
Small-side divestments or
deconsolidation
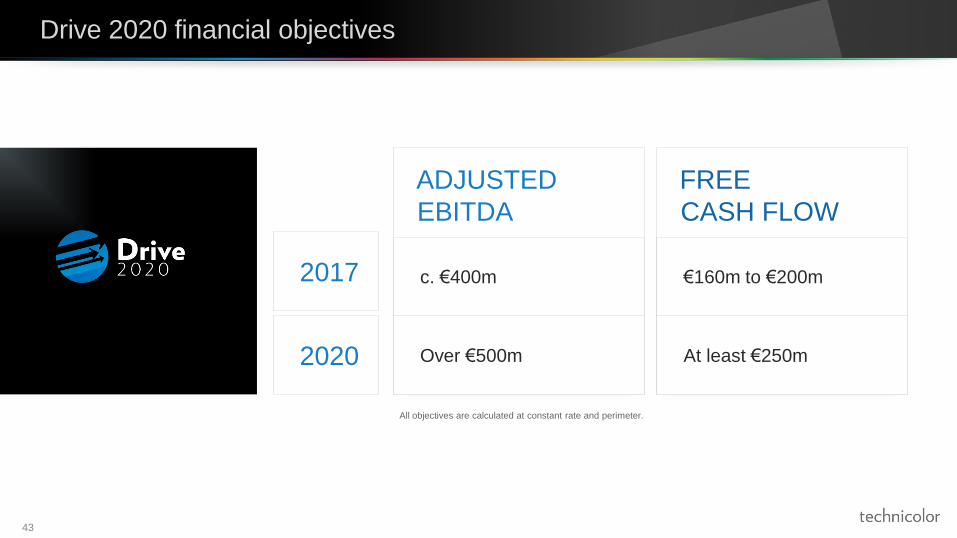
Drive 2020 financial objectives
43
All objectives are calculated at constant rate and perimeter.
ADJUSTED
EBITDA
FREE
CASH FLOW
c. €400m
Over €500m
€160m to €200m
At least €250m 2020
2017
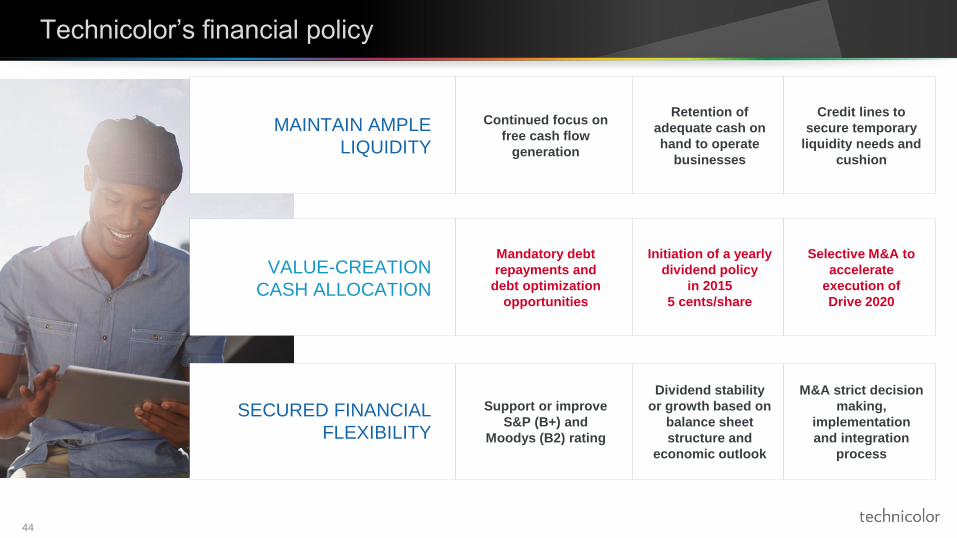
Technicolor’s financial policy
44
MAINTAIN AMPLE
LIQUIDITY
Continued focus on
free cash flow
generation
VALUE-CREATION
CASH ALLOCATION
SECURED FINANCIAL
FLEXIBILITY
Retention of
adequate cash on
hand to operate
businesses
Credit lines to
secure temporary
liquidity needs and
cushion
Mandatory debt
repayments and
debt optimization
opportunities
Initiation of a yearly
dividend policy
in 2015
5 cents/share
Selective M&A to
accelerate
execution of
Drive 2020
Support or improve
S&P (B+) and
Moodys (B2) rating
Dividend stability
or growth based on
balance sheet
structure and
economic outlook
M&A strict decision
making,
implementation
and integration
process
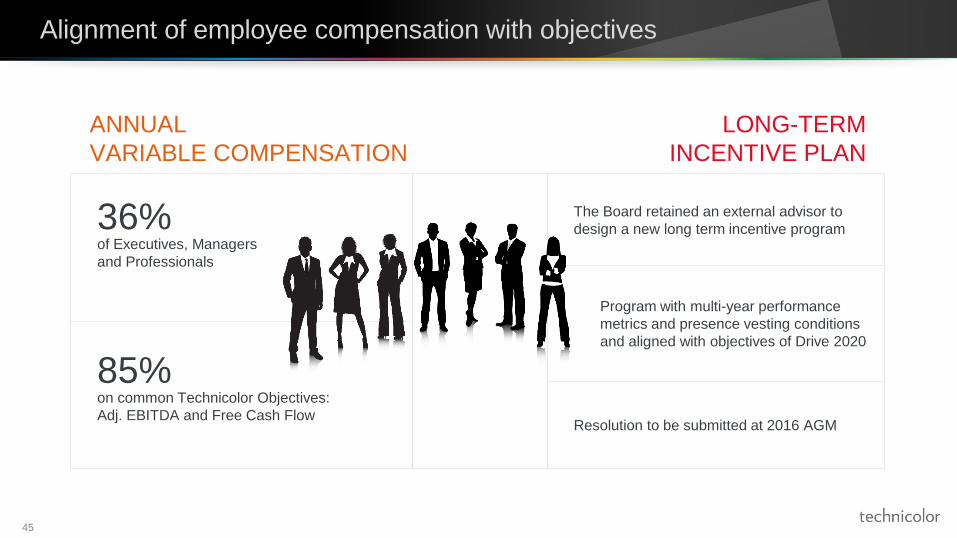
Alignment of employee compensation with objectives
45
36% of Executives, Managers
and Professionals
85% on common Technicolor Objectives:
Adj. EBITDA and Free Cash Flow
The Board retained an external advisor to
design a new long term incentive program
Program with multi-year performance
metrics and presence vesting conditions
and aligned with objectives of Drive 2020
Resolution to be submitted at 2016 AGM
ANNUAL
VARIABLE COMPENSATION
LONG-TERM
INCENTIVE PLAN
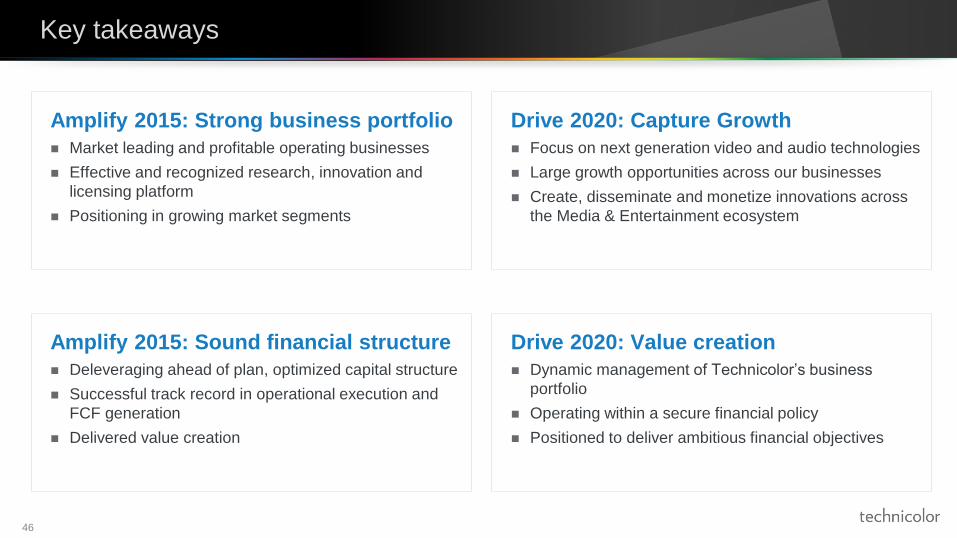
Key takeaways
46
Amplify 2015: Strong business portfolio
Market leading and profitable operating businesses
Effective and recognized research, innovation and
licensing platform
Positioning in growing market segments
Amplify 2015: Sound financial structure
Deleveraging ahead of plan, optimized capital structure
Successful track record in operational execution and
FCF generation
Delivered value creation
Drive 2020: Capture Growth
Focus on next generation video and audio technologies
Large growth opportunities across our businesses
Create, disseminate and monetize innovations across
the Media & Entertainment ecosystem
Drive 2020: Value creation
Dynamic management of Technicolor’s business
portfolio
Operating within a secure financial policy
Positioned to deliver ambitious financial objectives