imatinib mesylate inhibits t-cell proliferation in vitro and delayed-type hypersensitivity in vivo
TRANSCRIPT
doi:10.1182/blood-2003-12-4266Prepublished online April 20, 2004;
Allan B Dietz, Lina Souan, Gaylord J Knutson, Peggy A Bulur, Mark R Litzow and Stanimir Vuk-Pavlovic
in vivohypersensitivity and delayed-typein vitroImatinib mesylate inhibits T cell proliferation
http://bloodjournal.hematologylibrary.org/site/misc/rights.xhtml#repub_requestsInformation about reproducing this article in parts or in its entirety may be found online at:
http://bloodjournal.hematologylibrary.org/site/misc/rights.xhtml#reprintsInformation about ordering reprints may be found online at:
http://bloodjournal.hematologylibrary.org/site/subscriptions/index.xhtmlInformation about subscriptions and ASH membership may be found online at:
digital object identifier (DOIs) and date of initial publication. indexed by PubMed from initial publication. Citations to Advance online articles must include final publication). Advance online articles are citable and establish publication priority; they areappeared in the paper journal (edited, typeset versions may be posted when available prior to Advance online articles have been peer reviewed and accepted for publication but have not yet
Copyright 2011 by The American Society of Hematology; all rights reserved.Hematology, 2021 L St, NW, Suite 900, Washington DC 20036.Blood (print ISSN 0006-4971, online ISSN 1528-0020), is published weekly by the American Society of
For personal use only.on March 27, 2014. by guest bloodjournal.hematologylibrary.orgFrom For personal use only.on March 27, 2014. by guest bloodjournal.hematologylibrary.orgFrom
DIETZ et al IMATINIB MESYLATE SUPPRESSES T CELL FUNCTION
IMMUNOBIOLOGY
Imatinib mesylate inhibits T cell proliferation in vitro and delayed-type
hypersensitivity in vivo
Allan B. Dietz, Lina Souan, Gaylord J. Knutson, Peggy A. Bulur, Mark R. Litzow, and
Stanimir Vuk-Pavlovic
From the Stem Cell Laboratory, Mayo Clinic Cancer Center; Division of Hematology,
Department of Internal Medicine; Division of Transfusion Medicine, Department of
Laboratory Medicine and Pathology, Mayo Clinic; and Department of Biochemistry and
Molecular Biology, Mayo Clinic College of Medicine, Rochester, MN
Supported by grants from Mrs. Adelyn L. Luther, Singer Island, FL; Commonwealth
Cancer Foundation for Research, Richmond, VA and Mayo Clinic Comprehensive
Cancer Center Support Grant CA15083.
Reprints: Allan B. Dietz ([email protected]) or S. Vuk-Pavlovic ([email protected]),
both at Mayo Clinic, 200 First Street SW, Rochester, MN 55905.
Blood First Edition Paper, prepublished online April 20, 2004; DOI 10.1182/blood-2003-12-4266
Copyright (c) 2004 American Society of Hematology
For personal use only.on March 27, 2014. by guest bloodjournal.hematologylibrary.orgFrom

2
Abstract
Imatinib mesylate (STI-571, imatinib, Gleevec®) inhibited DNA synthesis in primary human T
cells stimulated with allogeneic mature dendritic cells or phytohemagglutinin (PHA), but did not
induce apoptosis. The IC50 values for T cell proliferation stimulated by dendritic cells and PHA
were 3.9 µM and 2.9 µM, respectively, i.e., within the concentration range found in
imatinib-treated patients. Interestingly, imatinib did not inhibit expression of T cell activation
markers CD25 and CD69, although it reduced the levels of activated NF-κB and changed
phosphorylation and/or protein levels of Lck, ERK1/2, retinoblastoma protein and cyclin D3.
When T cells were washed free of imatinib, they proliferated in response to PHA demonstrating
that inhibition is reversible. Imatinib treatment led to accumulation of the cells in G0/G1 phase of
the cell cycle. The in vitro observations were confirmed in vivo in a murine model of delayed-
type hypersensitivity (DTH). In imatinib treated mice, DTH was reduced in comparison to sham
injected controls. However, the number of splenic T cells was not reduced showing that,
similarly to in vitro observations, imatinib inhibited T cell response, but did not cause apoptosis.
These findings indicate that long-term administration of high dose imatinib might affect
immunity.
For personal use only.on March 27, 2014. by guest bloodjournal.hematologylibrary.orgFrom
3
Introduction
Imatinib mesylate (imatinib, STI-571, Gleevec®, Novartis, Basel, Switzerland) is a reversible
tyrosine-kinase inhibitor effective in treatment of chronic myelogenous leukemia1 (CML),
gastrointestinal stromal tumors2,3, eosinophilic disorders4 and systemic mast cell disease5 and
has been tried in several other diseases6,7. The drug binds preferentially to ATP-binding sites of
the c-kit protooncogene product, platelet–derived growth factor receptor (PDGF-R), and abelson
kinase (c-ABL)8-10 impeding the ensuing signal transduction (reviewed in ref. 11). Inhibition of
the ABL portion of the BCR-ABL fusion protein, pathognomonic of CML12, is the basis of
imatinib efficacy in inducing hematological and cytogenetic remissions in CML1,13. Inhibition
of c-KIT is considered critical for imatinib effects in gastrointestinal stromal tumors14 and mast
cell disease5.
In our efforts to develop immunotherapy for CML15, we studied imatinib effects on the
development of CML-specific immunity upon administration of autologous mature dendritic
cells (DC)16. Consequently, we measured the effects of imatinib on in vitro correlates of
immunity17. At concentrations of 5 µM, achieved in the serum of patients on the standard
therapeutic dose of 400 mg per day1, the drug was cytostatic, it arrested transit into the S phase
of the cell cycle and impeded in vitro proliferation of human normal and leukemic T cells. We
analyzed imatinib effects on the activity of intracellular signal transduction molecules associated
with the control of T cell function. The drug diminished phosphorylation of Lck, ERK 1/2 and
Rb proteins, reduced the levels of cyclin D3 and of activated the nuclear transcription factor κB
(NF-κB). In addition, imatinib inhibited delayed-type hypersensitivity in mice without affecting
T cell numbers indicating that the drug inhibits T cell response, but does not induce apoptosis.
For personal use only.on March 27, 2014. by guest bloodjournal.hematologylibrary.orgFrom
4
Materials and Methods
Cells and Reagents
T cells were isolated by negative immunoadsorption (Pan T kit; Miltenyi Biotec, Auburn, CA),
pooled from three or more normal donors and cryopreserved until use. Upon thawing, the cells
were incubated in X-VIVO 15 medium (BioWhittaker, Walkersville, MD) supplemented with
1.0 percent human AB serum (Sigma, St. Louis, MO), in a humidified atmosphere of 5.0 percent
CO2 at 37 �C. For experiments longer than one day, the medium contained 1.0 percent
penicillin/streptomycin solution (Sigma, St. Louis, MO) as well. Human acute T cell leukemia
cells Jurkat (ATCC TIB-152), acute T lymphoblastic leukemia cells CCRF-CEM (ATCC
CCL-119) and hematopoietic malignant K-562 cells (ATCC CCL-243), were obtained from
American Type Culture Collection (Manassas, VA) and cultured under the same conditions.
Allogeneic dendritic cells were derived from CD14-positive cells and cultured with T cells as
previously described16. Imatinib (Novartis, Basel, Switzerland) was dissolved in DMSO to a
final concentration of 10 mM. The stock solution was stored at –20�C until use, diluted to the
tenfold final concentration in X-VIVO 15 medium and added to cells immediately.
Cell Proliferation Assays
T cells, 1×10⁵ in 200 µL per well of 96 well microtiter plates (Corning Glass Works, Corning,
NY), were stimulated with dendritic cells or phytohemogglutanin M (PHA-M; 10 µg/mL,
Sigma) and/or platelet-derived growth factor (R&D Systems, Minneapolis, MN) in a final
volume of 0.2 mL per well. The cells were incubated with graded concentrations of imatinib,
incubated for four days, pulsed with 2.0 µCi tritiated thymidine (Amersham, Arlington Heights,
IL) per well, incubated for further 12 hours when they were harvested and incorporated
radioactivity was quantified16.
For personal use only.on March 27, 2014. by guest bloodjournal.hematologylibrary.orgFrom
5
Flow cytometry
We stained T cells with CD25-specific monoclonal antibody conjugated to fluorescein (Clone
M-A251; Pharmingen, San Diego, CA) or CD69-specific monoclonal antibody conjugated to
phycoerythrin (Clone HP-4B3; Ancell, Bayport, MN) and analyzed them by flow cytometry.
Cell cycle distribution was measured by flow cytometry in propidium–iodide stained T cells18
and analyzed by ModFit LT software (Verity Software, Topsham, ME). Apoptosis was
quantified by Anexin-V binding (Annexin-V-FLUOS staining kit; Roche Diagnostics,
Indianapolis, IN).
Caspase 3 activity
The cells were suspended at 1.0×10⁶ cells per mL in 10.0 percent fetal bovine serum (FBS;
Cellgro, Herndon, VA) and 1.0 percent penicillin/streptomycin (Sigma). One-mL aliquots were
placed in 24-well flat bottom cell culture plates (Corning, Corning, NY) and incubated at 37 °C
in 5.0 percent humidified carbon dioxide in the presence or absence of PHA (10.0 µg/mL) plus
IL-2 (500 U/mL; R&D Systems) and imatinib. After a three-day incubation cells were collected
by centrifugation, washed and treated with the fluorogenic caspase 3 substrate PhiPhiLux–G1D2
(OncoImmunin, Gaithersburg, MD) according to manufacturer's instructions. Fluorescence was
quantified by flow cytometry (excitation at 488 nm) and the relative amounts of activated
caspase 3 determined from a calibration curve.
Protein phosphorylation analysis by Western blotting
T-cells (2×10⁶/mL in X-VIVO 15 medium with 1.0 percent human AB serum) were incubated
with imatinib, 10 µM, or an equivalent volume of DMSO at 37 °C for one hour. Then PHA was
added to a final concentration of 10 µg/mL. Six mL of the cell suspension per well were plated in
six-well tissue culture plates. At various intervals following plating, cells from one well were
collected, centrifuged and lysed in 0.5 mL of Laemmli sample buffer followed by heating at 100
�C for five min19. Lysate aliquots, each equivalent to 0.6×10⁶ cells, were resolved by
For personal use only.on March 27, 2014. by guest bloodjournal.hematologylibrary.orgFrom
6
electrophoresis on 7.5 percent or 10 percent polyacrylamide gels. Electrophoresed proteins were
electroblotted onto Trans-Blot nitrocellulose transfer membranes (Bio-Rad Laboratories,
Hercules, CA) in 25 mM Tris, 192 mM glycine buffer, pH 8.3, at 125 V and 4 �C for 2 hours.
Then the membrane was incubated in 5.0 percent nonfat powdered milk in 0.1 M NaCl, 20 mM
Tris, 0.1 percent Tween-20, pH 7.4, (TBS/T) for one hour. Following incubation, the membrane
was washed with TBS/T and incubated with the primary antibody at 4 �C overnight. (All washes
included triplicate five-minute incubations in TBS/T with agitation. All antibodies were used at
dilutions recommended by manufacturers.) The membrane was washed, incubated with the
secondary antibody for one hour at room temperature, and washed again. Thereafter the
membrane was incubated in the SuperSignal West Pico chemiluminescent HRP substrate (Pierce
Biotechnology, Rockford, IL) for five minutes, exposed to X-OMAT AR film (Eastman Kodak,
Rochester, NY) that was developed by an X-OMAT developer (Eastman Kodak). Optical density
of individual bands on the film was registered by a ChemiDoc image acquisition system (Bio-
Rad Laboratories) and quantified by Quantity One 1-D analysis software (Bio-Rad Laboratories).
For detection of proteins and phosphoproteins we used monoclonal antibodies specific
for β-actin (as control of protein loading; Novus Biologicals, Littleton, CO), cyclin D3 (Cell
Signaling Technology, Beverly, MA) and abelson kinase (BD Biosciences, San Diego, CA). In
addition, from Cell Signaling Technology we obtained immunopurified polyclonal rabbit
antibodies specific for c-Kit, c-Kit Y719-PO4, Lck, Lck Y505-PO4, Erk1/2 T202-PO4/Y204-PO4,
Rb S780 and Rb S807/811-PO4. Polyclonal goat antibodies specific for rabbit IgG and mouse
IgG, both coupled to horseradish peroxidase, were from Santa Cruz Biotechnology (Santa Cruz,
CA).
Measuring NF-κB activation by ELISA
T cells were suspended in serum-free medium at 6.0×10⁶ cells/mL, plated in six-well plates and
rested overnight. Following a one-hour incubation at 37 �C, imatinib was added followed by the
addition of PHA (to the final concentration of 10 µg/mL) one hour later. Thereafter, the cells
For personal use only.on March 27, 2014. by guest bloodjournal.hematologylibrary.orgFrom
7
were incubated for additional four hours, resuspended by pipetting and collected by
centrifugation. Nuclear extracts were prepared according to ref. 20. The level of activated NF-κB
in extracts was assessed in a chemiluminescence-detected enzyme-linked immunosorbent assay
according to manufacturer’s (Oxford Biomedical Research, Oxford, MI) directions.
Luminescence was quantified by a ChemiDoc system (Bio-Rad Laboratories). Protein
concentration was measured by the Bio-Rad DC Assay (Bio-Rad Laboratories).
Delayed-type hypersensitivity
Imatinib effect on delayed-type hypersensitivity was quantified with the permission of the Mayo
Clinic Institutional Animal Care and Use Committee and performed as described in refs. 21-23.
Groups of five female B6AF1 mice (Jackson Laboratories, Bar Harbor, ME), 8 to 12 weeks old,
received intraperitoneal injections of imatinib, 50 mg/kg in 10 percent DMSO, for 21
consecutive days. In addition, groups of similar mice received equivalent amount of DMSO
alone (sham injected). Mice were primed on day 14 by a subcutaneous injection in the flank of
50 µL of 4-hydroxy-3-nitrophenyl acetyl O-succinimide ester (NP-O-Su; Biosearch
Technologies, Novato, CA) dissolved in PBS, pH 7.8, at 7.0 g/100 mL. Six days after priming,
mice were injected with the challenge dose of 25 µL NP-O-Su (2.0 g/100 mL) into the right
footpad and with 25 µL of PBS into the left. Footpad thickness was measured 24 hours later by a
digital micrometer.
We prepared single cell suspensions from spleens of these mice by meshing individual
spleens through metal sieves and lysing red blood cells in lysis buffer (1.0 mL per spleen;
Sigma) for five minutes at room temperature. Thereafter, cells were incubated with anti-CD3 and
anti-CD8 antibody (BD Biosciences, Mountain View, CA) for 20 minutes at 4 ºC, washed and
fixed with 1.0 percent paraformaldehyde. Flow cytometry was performed with a FACScan flow
cytometer and CellQuest software (both BD Biosciences).
For personal use only.on March 27, 2014. by guest bloodjournal.hematologylibrary.orgFrom
8
Statistics
All experiments were repeated two to five times with qualitatively same outcome. The
probability that the mean values of two experimental groups were identical was tested by
two-tailed Student’s t-test for paired samples. The level of significance was set at p=0.05. Where
applicable, data are reported as the mean ± standard deviation.
Results
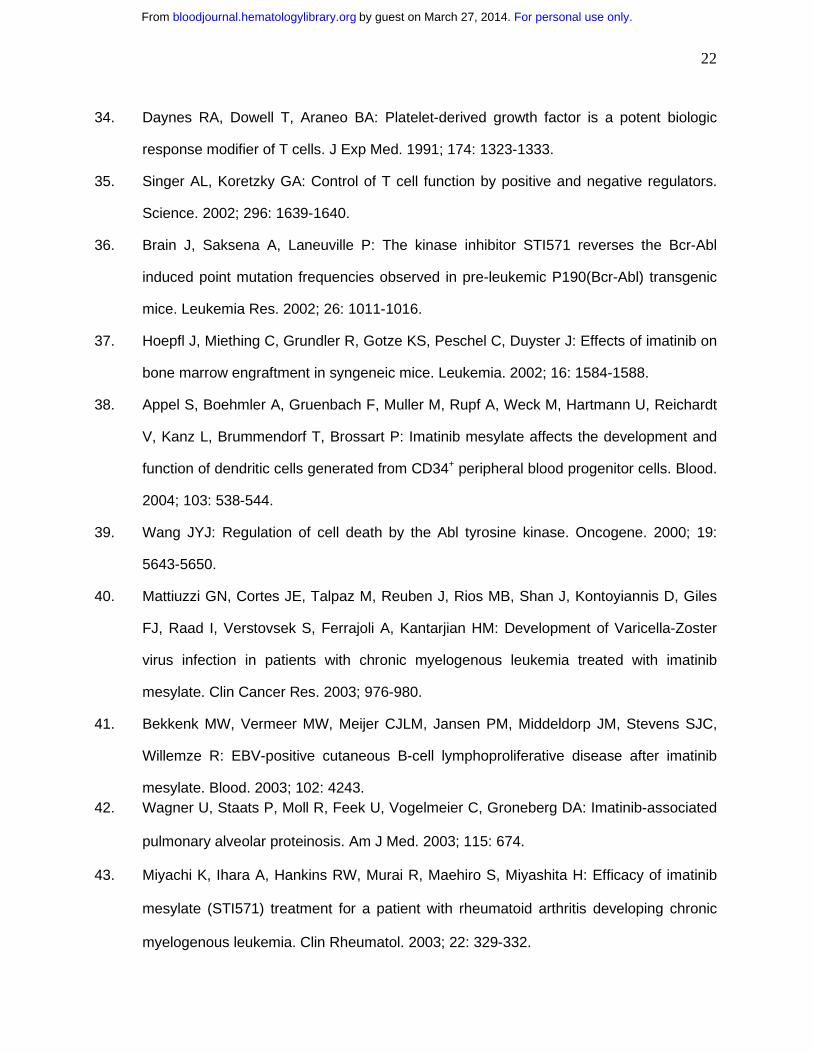
Imatinib inhibits proliferation of human primary T cells and T cell lines
To determine if imatinib affects T cell proliferation, we stimulated the cells with allogeneic
mature dendritic cells or PHA in the presence of imatinib. The drug inhibited T cell proliferation
as a function of concentration (Fig. 1A). The effects were significant at 0.5 µM imatinib for the
cells stimulated by dendritic cells (p=0.002) and at 1.0 µM imatinib for the cells stimulated with
PHA (p=3.93×10⁻⁵). The IC50 values for imatinib-inhibited T cell proliferation stimulated by DC
and PHA were 3.9 µM and 2.9 µM, respectively. Thus, imatinib arrested T cell proliferation in a
dose–dependent manner at concentrations akin to those achieved in the serum of patients on
standard imatinib therapy of 400 mg daily1. Because the effects of PHA and dendritic cells were
similar, for further experiments we selected PHA to simplify interpretation of the results
obtained by electrophoresis and Western blotting.
We quantified imatinib effects on proliferation of transformed human CD3-positive T
cell derived lymphoblastoid line CCL119, T cell leukemia Jurkat line and the BCR-ABL–
positive chronic myelogenous leukemia cell line K562. We incubated the cells with imatinib for
18 hours when we measured the extent of thymidine incorporation. Imatinib inhibited DNA
synthesis of all three transformed cell lines in a dose-dependent fashion, but was less potent than
in normal cells (Fig. 1B). After 18 hours with imatinib none of the cell lines lost viability (as
determined by trypan blue exclusion) and/or increased binding of annexin V (data not shown).
After 48-hours, however, at 1.0 µM imatinib only 28±4 percent of K562 (p=0.005 relative to
imatinib-free control) cells were viable compared to 86±4 percent for CCL-119 cells (p=0.44)
For personal use only.on March 27, 2014. by guest bloodjournal.hematologylibrary.orgFrom
9
and 99±8 percent for Jurkat cells (p=0.92). A quantitative comparison of imatinib effects in
normal T cells and cell lines must await a detailed kinetic analysis of the cell cycle, but
apparently imatinib does not affect normal T cells only.
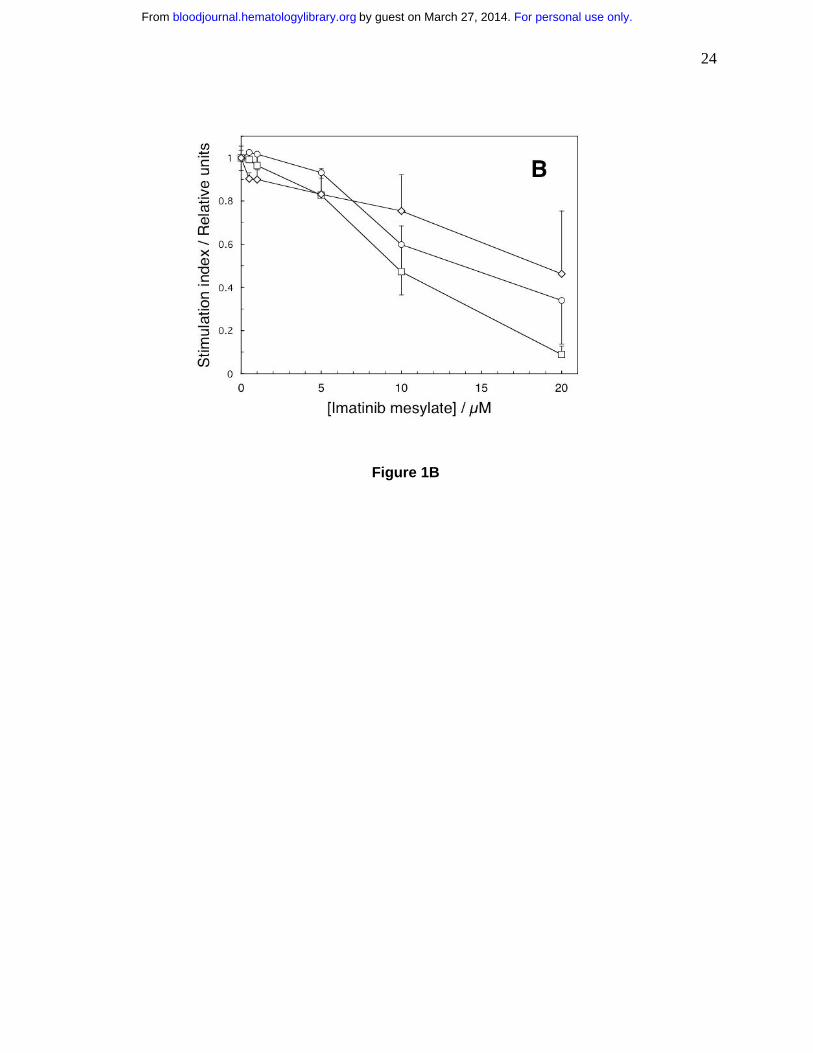
Imatinib neither reduces T cell viability nor stimulates their apoptosis
Imatinib toxicity might provide an explanation for inhibited T cell proliferation. Therefore, we
incubated the cells with imatinib for 72 hours and quantified apoptosis by determining the
fraction of cells demonstrating activated caspase 3 (ref. 24) and the fraction which bound
annexin V25,26. Frequency of cells positive for activated caspase-3 and binding of annexin V
were low in the absence of PHA (Fig. 2). Stimulation by PHA increased the frequency of cells
exhibiting either markers (p<0.001 for both). Imatinib-treated and PHA-activated T cells did not
change their annexin V binding (p=0.10), indicating that the drug did not induce apoptosis under
these conditions. Caspase 3 activation can be used as a marker for apoptosis, but the levels of
enzyme are increased in T cell stimulation27,28. PHA treatment activated caspase 3, but imatinib
inhibited this effect (p=0.03), similarly as it inhibited T cell proliferation. Thus, the PHA- and
imatinib-induced changes in caspase 3 activation may reflect changes in T cell stimulation, rather
than enhanced apoptosis. Consequently, under these conditions imatinib was cytostatic, but not
cytotoxic.
Imatinib treated T cells accumulate in the G0/G1 phase of the cell cycle
As imatinib was not cytotoxic, we postulated that the decrease in DNA synthesis (Fig. 1) results
from imatinib effects on cell cycle progression. To test this hypothesis, we stimulated
imatinib-treated cells with PHA alone or with the combination of PHA (10 µg/mL) and IL-2
(500 U/mL) that stimulates powerfully T cell proliferation29. We measured DNA content 72
hours later. Data in Fig. 3A show that essentially all unstimulated (control) T cells were in the
G0/G1 phase of the cycle. PHA stimulated DNA synthesis and progression into the S phase
(p<0.001 relative to resting cells), an effect inhibited by imatinib (p<0.001 relative to PHA-
For personal use only.on March 27, 2014. by guest bloodjournal.hematologylibrary.orgFrom
10
stimulated cells). Imatinib inhibited T cell cycle progression even in the presence of PHA plus
IL-2 (p<0.01 relative to the cells stimulated by both PHA and IL-2).
A prerequisite for entry of cells into the S phase is phosphorylation of the retinoblastoma
protein (Rb) that is regulated by the cyclin D3/cdk4 complex30,31 (also reviewed in ref. 32). We
quantified the levels of cyclin D3 protein and Rb phosphorylation in the presence of imatinib by
Western blotting. Twelve, 16 and 24 hours after initiation of a typical experiment the amount of
Rb phosphoprotein was reduced to 19, 39 and 77 percent of control, respectively; the amount of
cyclin D was reduced to 28, 32 and 59 percent of control, respectively (data not shown; effects at
later times might have been artificially reduced by the film saturation at the darker control
bands). These effects are consistent with imatinib-induced arrest of the cell cycle before the S
phase.
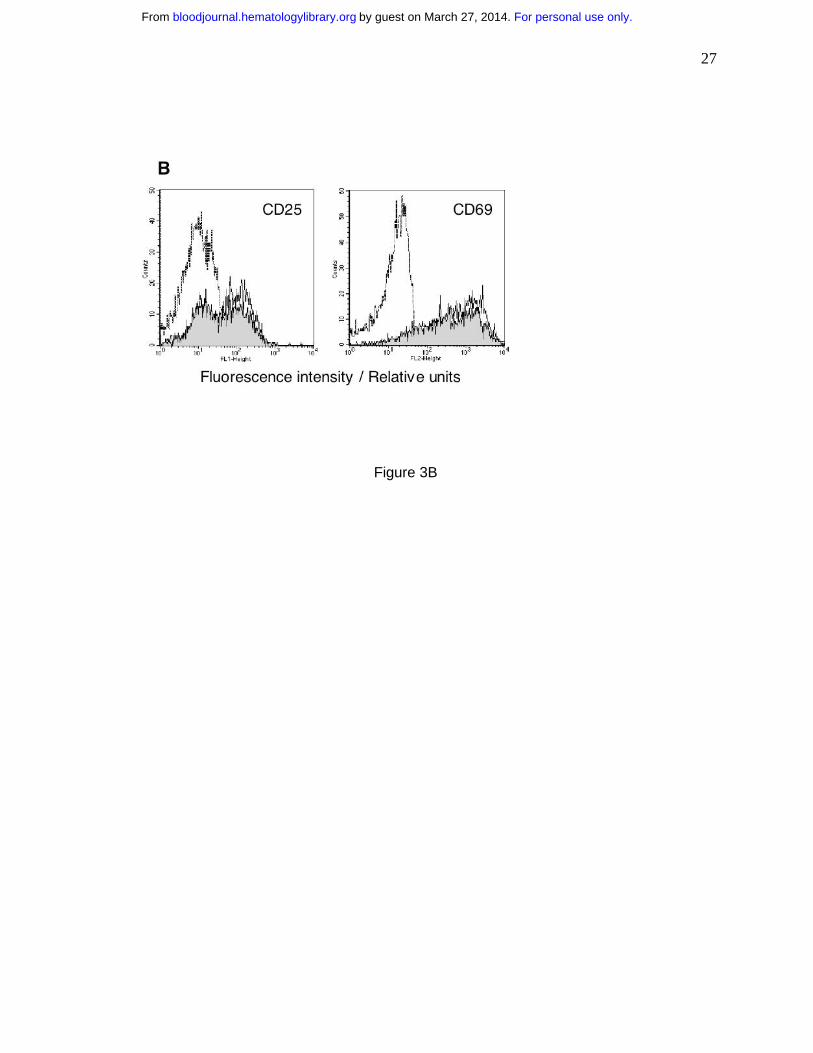
Imatinib does not inhibit expression of T cell activation markers CD25 and CD69
Membrane molecules CD25 and CD69 are expressed as a result of T cell stimulation, but their
expression is not coupled to proliferation33. Hence, these molecules can be viewed as evidence
of early T cell activation33. We measured the levels of CD25 and CD69 in imatinib-treated T
cells activated by PHA. After an 18-hour incubation with PHA, the frequency of cells expressing
CD25 and CD69 markedly increased (Fig. 3B). Imatinib-treated T cells demonstrated similar
increase in CD25 and CD 69 levels characteristic of activated T cells, rather than of resting T
cells. Thus, the combined data in Figs. 1, 2 and 3 show that imatinib selectively inhibits cellular
targets leading to proliferation without effecting T cell activation or apoptosis.
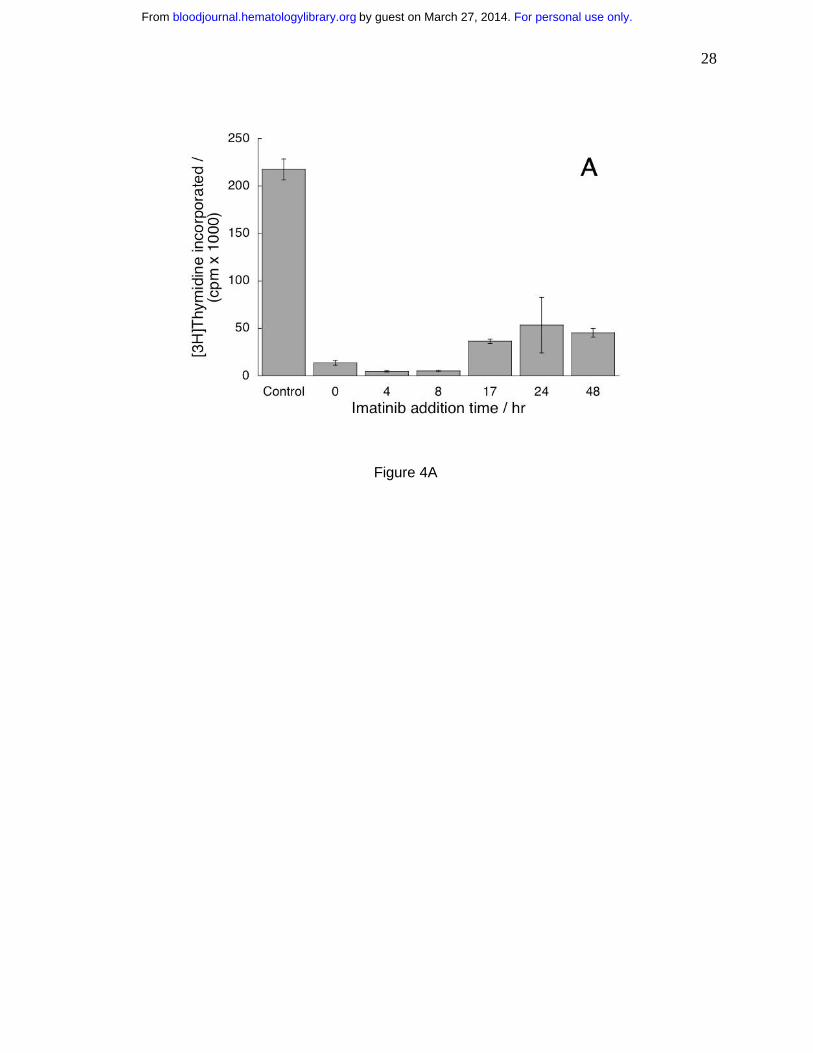
Imatinib can terminate already initiated proliferation signals, but its effects are reversible
Because the mechanisms initiating T cell proliferation and activation are uncoupled33, in
agreement with the data in Figs. 3A and 3B, it is of interest to determine if imatinib can
terminate proliferation signals after they had been initiated. We plated cells without imatinib in
the presence of PHA as in Fig. 2. Imatinib was added at increasing intervals from initiation of
For personal use only.on March 27, 2014. by guest bloodjournal.hematologylibrary.orgFrom
11
culture (Fig. 4A) and determined DNA synthesis. We found that imatinib could inhibit
proliferation of T cells stimulated even forty-eight hours before introduction of the drug (Fig.
4A). Thus, imatinib could terminate already initiated intracellular signaling in the pathways
leading to proliferation.
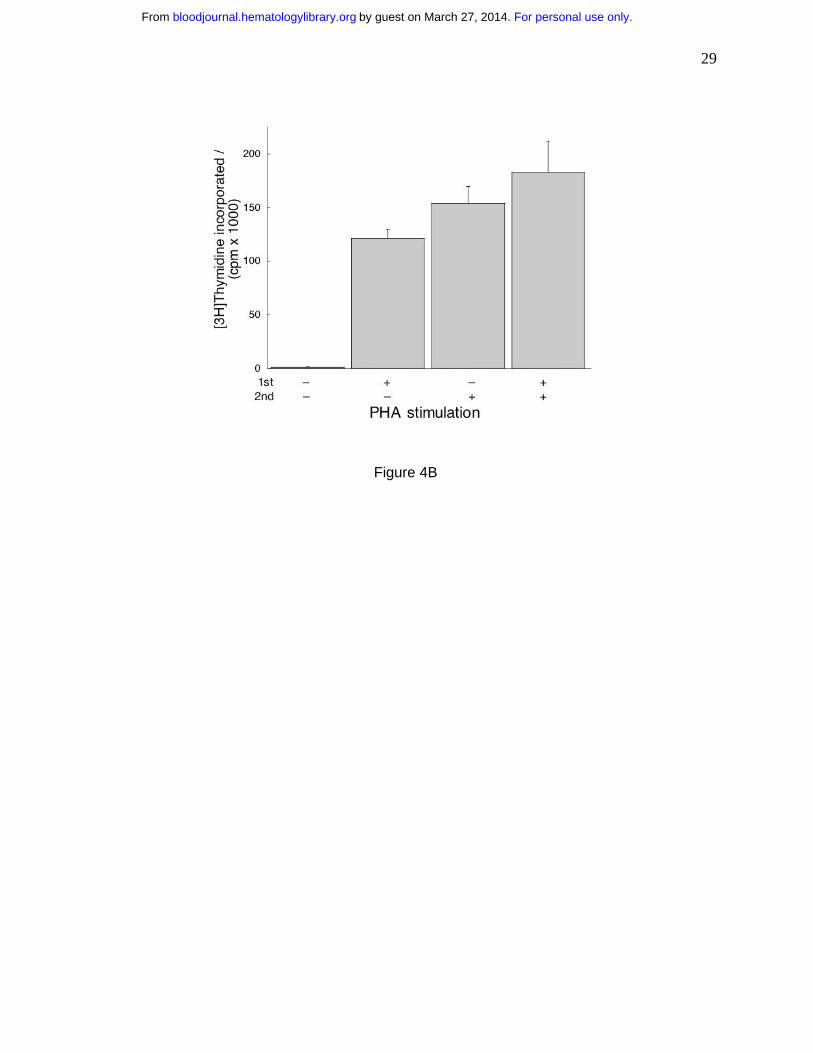
If imatinib inhibits proliferation but does not induce apoptosis, the cells will resume
proliferation upon removal of the drug. To test this hypothesis, we incubated T cells with
imatinib, stimulated one half of the wells with PHA and incubated all cells for 24 hours. Then we
washed the cells, treated one half of the wells from each sample with PHA and incubated all for
additional 96 hours when we measured thymidine incorporation. We found the cells
unstimulated in both incubations did not proliferate (Fig. 4B). The cells stimulated by PHA in
the first incubation proliferated without it in the second, probably due to residual PHA. The cells
stimulated in the second incubation proliferated to the same extent irrespective whether they
were stimulated in the first. These observations demonstrate that imatinib did not impact the
proliferation potential of T cells and that the effects of the drug are reversible.
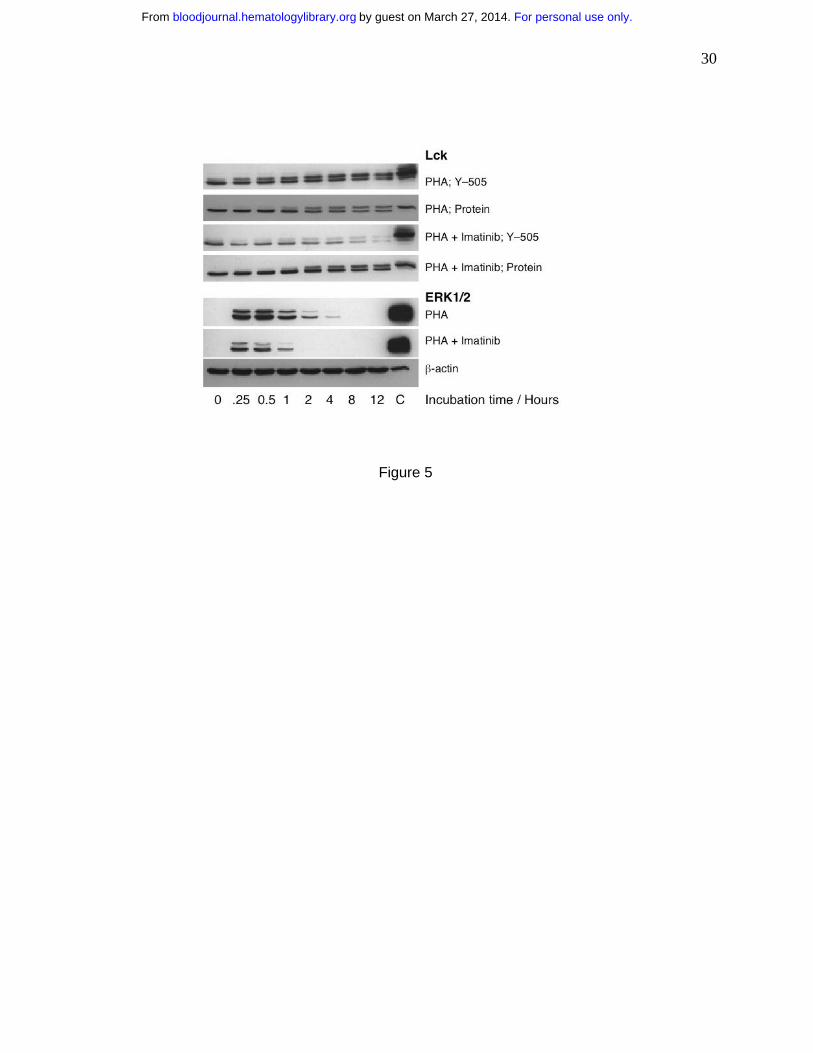
Imatinib reduces levels of phosphorylated Lck and ERK1/2 and of activated NF-κB
Abelson kinase (and its constitutively activated mutant BCR-ABL), c-KIT protein and PDGF-R
are well-documented cellular targets of imatinib10. PDGF, common in human serum, suppresses
T cell activation34. Monoclonal antibodies specific for the extracellular component of c-KIT did
not recognize T cells (data not shown), suggesting that the full-length c-KIT is absent in T cells.
Indeed, we detected no c-KIT and no imatinib-associated change in the levels of c-ABL
phosphorylation by Western blotting (data not shown). Similarly, by functional assays we found
that exogenous PDGF did not affect T cells (data not shown). Apparently c-ABL, c-KIT and
PDGF-R do not play a manifest role in inhibition of T cell proliferation by imatinib. Thus, T
cells must contain other imatinib target(s). In an attempt to identify some imatinib-sensitive
intracellular signaling pathways we measured the levels of phosphorylation of Lck molecule and
For personal use only.on March 27, 2014. by guest bloodjournal.hematologylibrary.orgFrom
12
ERK1/2, both associated with TCR–mediated signaling35 and of activated NF-κB, a
transcription factor activated by numerous pathways including the one initiated at the TCR35.
We exposed PHA-stimulated T cells to imatinib and determined the relative levels of Lck
protein and phosphorylation at its Tyr-505 as a function of time. We found no apparent
difference between drug-treated and control cells in the levels of Lck protein, but the drug
reduced Tyr-505 phosphorylation (Fig. 5). This effect was apparent at the first time point
measured at 15 minutes after stimulation. Similarly, we noticed that imatinib inhibited
phosphorylation of ERK1/2 (Fig. 5). In addition, we determined the level of activated NF-κB in
nuclear extracts of T cells activated by PHA in the presence of increasing imatinib
concentrations and expressed the results as percentage of PHA-stimulated increase in levels of
activated NK-κB. At 4.4 µM imatinib, the amount of activated NK-κB was reduced to 58.7±1.1
percent (p=0.003) and decreased to 38.4±0.9 percent at 17.6 µM. These imatinib effects on
phosphorylation of Lck and ERK1/2 and activation of NF-κB are compatible with the
concentration dependence of the observed inhibition of T cell proliferation and function.
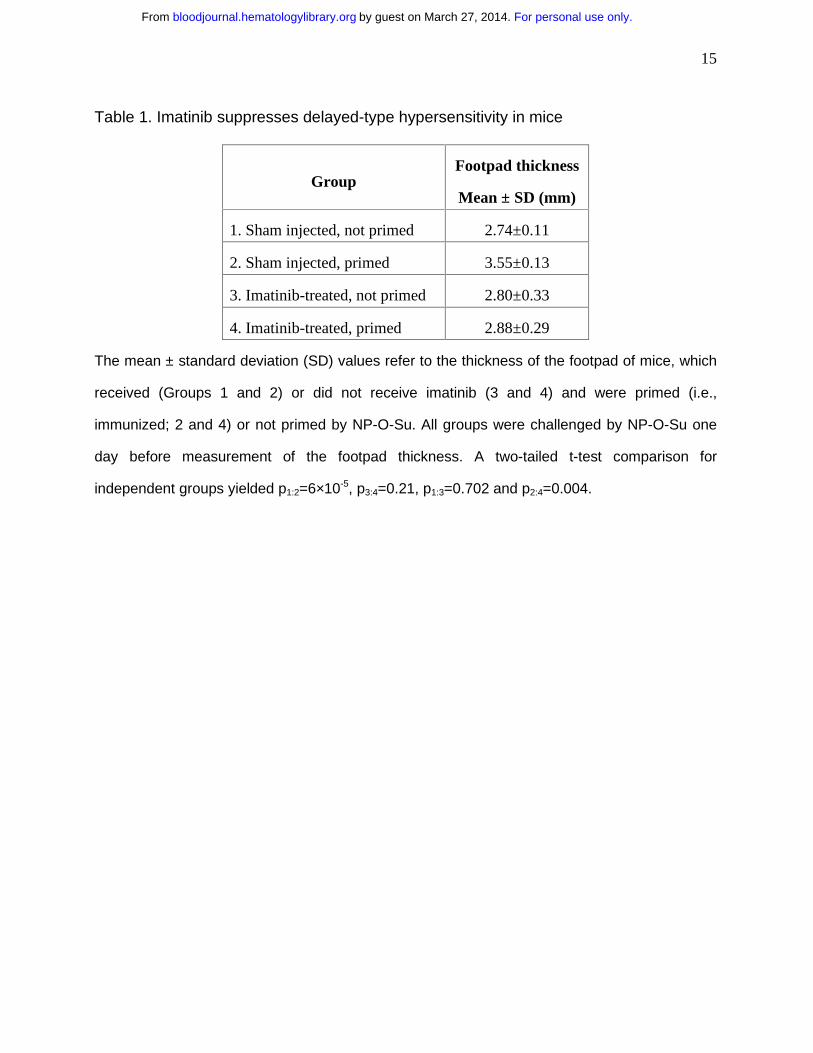
Imatinib inhibits delayed-type hypersensitivity in mice
To determine if imatinib affects T cells in vivo similarly to the effects in vitro, we treated mice
with the drug daily throughout the experiment36,37. After 10 days of treatment, we immunized
mice with NP-O-Su and challenged six days later with a subcutaneous injection of the same
agent into one footpad and of PBS into the other. Twenty-four hours later we quantified the
extent of delayed-type sensitivity by measuring the thickness of the footpads. Footpads of control
animals (no imatinib) thickened considerably upon the challenge with NP-O-Su (Table 1).
Systemic treatment with imatinib abolished this effect (Table 1). In contrast, imatinib had no
effect on the total splenocyte number (p=0.25) and numbers of CD3+ cells (p=0.52) and CD8+
cells (p=0.16; data not shown). Taken together, these data show that the reduced DTH might
result from a systemic inhibition of the T cell response, rather than from the diminished number
of T cells.
For personal use only.on March 27, 2014. by guest bloodjournal.hematologylibrary.orgFrom
13
Discussion
We found that imatinib inhibits T cell proliferation at concentrations similar to those found in
patients treated for CML and GIST3. The effect is manifest both in T cells nonspecifically
stimulated by PHA and in those stimulated by dendritic cells. Imatinib neither prevented
activation of T cells nor killed them, but it inhibited cell cycle progression. In an attempt to
identify the pertinent intracellular pathways targeted by imatinib, we found reduced
phosphorylation and/or protein levels of all molecules we selected for study. This observation
could explain the attenuation of T cell function, but it was not helpful in identification of critical
imatinib targets. Possibly, T cell function is impaired by the cumulative effect of partial
inhibition of numerous phosphonucleotide-binding molecules rather than by the definitive
inhibition of few key molecules (e.g., BCR-ABL or c-KIT). A similar conclusion has been
reached recently in a study of differentiation of CD34-positive hematopoietic cells into dendritic
cells where imatinib suppressed phosphorylation of molecules participating in numerous
intracellular signaling pathways that are independent of c-ABL, c-KIT and PDGF receptor38.
We did detect the presence of c-ABL in T cells and cannot thus completely rule out its
role in imatinib effects. However, there is little evidence for such a role of c-ABL in signal
transduction leading to T cell cycle triggering, although the molecule generally does participate
in regulation of later stages of cell cycle progression39. Our data are compatible with such role
for c-ABL as imatinib inhibited T cell cycle progression, but did not affect T cell activation. This
observation is fully in line with the recent evidence for such uncoupling of activation and cell
cycle progression in human T cells33. In addition, these data demonstrate that imatinib can be
used as a tool in studies of (un)coupling of T cell activation and proliferation.
We found that imatinib was immunosuppressive in an in vivo model of delayed type
hypersensitivity. The clinical relevance of this finding is unclear. As the effects of the drug are
rapidly reversed upon its removal, these effects are likely to be sensitive to imatinib
pharmacokinetics. It is possible, in fact, that the key determinant of the extent of
For personal use only.on March 27, 2014. by guest bloodjournal.hematologylibrary.orgFrom
14
immunosuppression is the nadir in fluctuations of imatinib levels. Thus, sustaining
therapeutically adequate imatinib levels may impede acute inflammatory responses and/or
undermine control of subclinical infections. Nonetheless, information about imatinib effects on
immunity is scarce and circumstantial. Several mostly anecdotal observations of secondary
effects of imatinib in CML patients support the notion that imatinib suppresses immunity in vivo.
For example, imatinib-treated patients experienced a higher incidence of herpes zoster outbursts,
which diminished upon treatment with antiviral drugs40. One patient developed an EBV-positive
B-cell lymphoma41
and another developed pulmonary alveolar proteinosis42
; both complications
receded after imatinib dose reduction or complete discontinuation. Similarly, imatinib-borne
immunosuppression could explain the surprising remission of rheumatoid arthritis in a CML
patient two months upon initiation of imatinib therapy43
. Recent attempts to overcome resistance
to imatinib by higher doses of the drug may provide data for further unraveling of the
relationship of imatinib and immunity. A more definite establishment of immunosuppressive
effects of imatinib may add this well tolerated drug to the list of clinically useful agents for
control of T cell malignancies and autoimmunity.
Acknowledgements
We thank Mr. Troy Voeltz for technical help and Dr. Frank Prendergast for continuing interest
and support.
For personal use only.on March 27, 2014. by guest bloodjournal.hematologylibrary.orgFrom
15
Table 1. Imatinib suppresses delayed-type hypersensitivity in mice
Group Footpad thickness
Mean ± SD (mm)
1. Sham injected, not primed 2.74±0.11
2. Sham injected, primed 3.55±0.13
3. Imatinib-treated, not primed 2.80±0.33
4. Imatinib-treated, primed 2.88±0.29
The mean ± standard deviation (SD) values refer to the thickness of the footpad of mice, which
received (Groups 1 and 2) or did not receive imatinib (3 and 4) and were primed (i.e.,
immunized; 2 and 4) or not primed by NP-O-Su. All groups were challenged by NP-O-Su one
day before measurement of the footpad thickness. A two-tailed t-test comparison for
independent groups yielded p1:2=6×10⁻⁵, p3:4=0.21, p1:3=0.702 and p2:4=0.004.
For personal use only.on March 27, 2014. by guest bloodjournal.hematologylibrary.orgFrom
16
Figure Legends
Figure 1. Imatinib inhibits proliferation of primary human T cells and T cell lines. (A)
Proliferation of 1.5×10⁷ T cells/2.5 mL was stimulated with allogeneic mature dendritic cells
(open circles) or PHA (full circles) and measured as a function of imatinib concentration. The
cells were incubated with imatinib for 96 hours. Then tritiated thymidine was added for 12 hours
when the cells were harvested and incorporated radioactivity was measured. Differences
between positive controls and imatinib–treated cells were apparent at 0.5 µM for the cells
stimulated with DC (p=0.002) and at 1.0 µM for cells stimulated with PHA (p=3.93×10⁻⁵). (B)
Human T cell lines CCRF-CEM (circles) and Jurkat (squares) and chronic myelogenous
leukemia cell line K562 (diamonds) were incubated in graded concentrations of imatinib for 18
hours and evaluated as in panel A. The results are expressed as stimulation indices (mean
value ± standard deviation of radioactivity incorporated in the presence of the drug divided by
the mean value ± standard deviation of radioactivity incorporated in the absence of the drug).
Figure 2. Imatinib neither reduces viability nor stimulates apoptosis in T cells.
Unstimulated T cells and T cells stimulated with PHA were cultured for 72 hours without or with
imatinib (5.0 µM). Then the cells were assayed for activated caspase 3 and for binding of
annexin V. PHA stimulation increased the frequency of cells with activated caspase 3 and cells
binding annexin V (p<0.001 for both). Imatinib induced a decrease of activated caspase 3 levels
(p=0.03), but did not change the frequency of cells binding annexin V (p=0.10).
Figure 3. Imatinib treatment results in T cell accumulation in the G0/G1 phase of the cell
cycle, but does not inhibit T cell activation. (A) Cell cycle distribution of unstimulated T cells
and T cells stimulated with PHA, or the combination of PHA and IL-2 stimulated T cells with and
without imatinib. The cells were stained with propidium iodide 24 hours after initiation of
experiment and analyzed by flow cytometry. Dark areas represent the fraction of cells in G0/G1,
lighter areas stand for the fraction in S phase and white areas correspond to the fraction in G2/M
For personal use only.on March 27, 2014. by guest bloodjournal.hematologylibrary.orgFrom
17
phase. (B) Untreated T cells (dashed line) and T cells activated with PHA (10 µg/mL) in imatinib
absence (solid line) or presence (10 µM; shaded area) were analyzed for expression of CD25 or
CD69 24 hours after initiation of culture.
Figure 4. Imatinib can terminate proliferation signals already initiated, but its effects on T
cells are reversible. (A) Imatinib (10 µM) was added four to forty-eight hours after PHA
stimulation. DNA synthesis was quantified as in Fig. 1. Values measured in the presence of
imatinib at all time points were different from values in imatinib–free cells (p<0.05). (B) First, the
cells were treated with imatinib, one group stimulated by PHA and the other unstimulated. The
cells were incubated for 24 hours, washed free of imatinib and replated without it. Subsequently,
one half of each group was stimulated with PHA and the other half remained unstimulated. After
incubation for an additional 96 hours, DNA synthesis was measured as in Fig. 1. Cells treated
with imatinib and without PHA in the first incubation did not synthesize DNA without PHA in the
second, while those treated with PHA in the first incubation did resume proliferation without
stimulation in the second. However, in the presence of PHA in the second incubation the cells
proliferated similarly (p=0.22) irrespective of whether pretreatment with imatinib took place in
the absence or presence of PHA.
Figure 5. Imatinib inhibits phosphorylation of molecules participating in cellular
signaling. In an attempt to identify imatinib-sensitive intracellular signaling pathways we
measured the levels of phosphorylation of Lck and ERK1/2, both associated with TCR–
mediated signaling. We exposed PHA-stimulated T cells to imatinib (10 µM) and found that the
drug did not affect the levels of Lck protein, but it inhibited Tyr-505 phosphorylation. Similarly,
imatinib inhibited phosphorylation of ERK1/2.
For personal use only.on March 27, 2014. by guest bloodjournal.hematologylibrary.orgFrom
18
References
1. Druker BJ, Talpaz M, Resta DJ, Peng B, Buchdunger E, Ford JM, Lydon NB, Kantarjian
H, Capdeville R, Ohno-Jones S, Sawyers CL: Efficacy and safety of a specific inhibitor of
the BCR-ABL tyrosine kinase in chronic myeloid leukemia. N Engl J Med. 2001; 344:
1031-1037.
2. Joensuu H, Roberts PJ, Sarlomo-Rikala M, Andersson LC, Tervahartiala P, Tuveson D,
Silberman S, Capdeville R, Dimitrijevic S, Druker B, Demetri GD: Effect of the tyrosine
kinase inhibitor STI571 in a patient with a metastatic gastrointestinal stromal tumor. N
Engl J Med. 2001; 344:1052-1056.
3. Berman J, O’Leary TJ: Gastrointestinal stromal tumor workshop. Hum Pathol. 2001; 32:
578-582.
4. Pardanani A, Reeder T, Porrata LF, Li CY, Tazelaar HD, Baxter EJ, Witzig TE, Cross
NC, Tefferi A: Imatinib therapy for hypereosinophilic syndrome and other eosinophilic
disorders. Blood. 2003; 101: 3391-3397.
5. Pardanani A, Elliott M, Reeder T, Li CY, Baxter EJ, Cross NC, Tefferi A: Imatinib for
systemic mast-cell disease. Lancet. 2003; 362: 535-536.
6. Verweij J, van Oosterom A, Blay JY, Judson I, Rodenhuis S, van der Graaf W, Radford
J, Le Cesne A, Hogendoorn PC, di Paola ED, Brown M, Nielsen OS: Imatinib mesylate
(STI-571 Glivec, Gleevec) is an active agent for gastrointestinal stromal tumours, but
does not yield responses in other soft-tissue sarcomas that are unselected for a
molecular target. Results from an EORTC Soft Tissue and Bone Sarcoma Group phase
II study. Eur J Cancer. 2003; 39: 2006-2011.
7. McLaughlin ME, Robson CD, Kieran MW, Jacks T, Pomeroy SL, Cameron S: Marked
regression of metastatic pilocytic astrocytoma during treatment with imatinib mesylate
(STI-571, Gleevec): a case report and laboratory investigation. J Ped Hematol Oncol.
2003; 25:644-648.
For personal use only.on March 27, 2014. by guest bloodjournal.hematologylibrary.orgFrom

19
8. Buchdunger E, Cioffi CL, Law N, Stover D, Ohno-Jones S, Druker BJ, Lydon NB: Abl
protein-tyrosine kinase inhibitor STI571 inhibits in vitro signal transduction mediated by
c-kit and platelet-derived growth factor receptors. J Pharmacol Exp Therap. 2000; 295:
139-145.
9. Heinrich MC, Griffith DJ, Druker BJ, Wait CL, Ott KA, Zigler AJ: Inhibition of c-kit
receptor tyrosine kinase activity by STI 571, a selective tyrosine kinase inhibitor. Blood.
2000; 96: 925-932.
10. Carroll M, Ohno-Jones S, Tamura S, Buchdunger E, Zimmermann J, Lydon NB, Gilliland
DG, Druker BJ: CGP 57148, a tyrosine kinase inhibitor, inhibits the growth of cells
expressing BCR-ABL, TEL-ABL, and TEL-PDGFR fusion proteins. Blood. 1997; 90:
4947-4952.
11. Savage DG, Antman KH: Imatinib mesylate-a new oral targeted therapy. N Engl J Med.
2002; 346: 683-693.
12. Ben-Neriah Y, Daley GQ, Mes-Masson AM, Witte ON, Baltimore D: The chronic
myelogenous leukemia-specific P210 protein is the product of the bcr/abl hybrid gene.
Science. 1986; 233 :212-214.
13. Druker BJ, Sawyers CL, Kantarjian H, Resta DJ, Reese SF, Ford JM, Capdeville R,
Talpaz M: Activity of a specific inhibitor of the BCR-ABL tyrosine kinase in the blast crisis
of chronic myeloid leukemia and acute lymphoblastic leukemia with the Philadelphia
chromosome. N Engl J Med. 2001; 344: 1038-1042.
14. Heinrich MC, Blanke CD, Druker BJ, Corless CL: Inhibition of KIT tyrosine kinase
activity: a novel molecular approach to the treatment of KIT-positive malignancies. J Clin
Oncol. 2002; 20: 1692-1703.
15. Dietz AB, Litzow MR, Gastineau DA, Vuk-Pavlovic´ S: Engineering dendritic cell grafts
for clinical trials in cellular immunotherapy of cancer: example of chronic myelogenous
leukemia. Croat Med J. 2001; 42: 428-435.
For personal use only.on March 27, 2014. by guest bloodjournal.hematologylibrary.orgFrom
20
16. Dietz AB, Bulur PA, Erickson MR, Wettstein PJ, Litzow MR, Wyatt WA, Dewald GW,
Tefferi A, Pankratz VS, Vuk-Pavlovic´ S: Optimizing preparation of normal dendritic cells
and bcr-abl+ mature dendritic cells derived from immunomagnetically purified CD14+
cells. J Hematotherapy Stem Cell Res. 2000; 9: 95-101.
17. Dietz AB, Bulur PA, Knutson GJ, Litzow MR, Vuk-Pavlovic´ S: Imatinib mesylate inhibits
dendritic cell maturation and T cell proliferation (abstract). Blood. 2002; 100: 677a.
18. Banifacino JS, Dasso M, Harford JB, Lippincott-Schwartz J, Yamada KM: Analysis of cell
cycle by flow cytometry, in Morgan KS (ed): Current Protocols in Cell Biology, John
Wiley and Sons, 2002.
19. Laemmli UK: Cleavage of structural proteins during the assembly of the head of
bacteriophage T4. Nature. 1970; 227: 680-685.
20. Pettit AR, Quinn C, MacDonald KP, Cavanagh LL, Thomas G, Townsend W, Handel M,
Thomas R: Nuclear localization of RelB is associated with effective antigen-presenting
cell function. J Immunol. 1997; 159: 3681-3691.
21. Sunday ME, Benacerraf B, Dorf ME: Hapten-specific T cell responses to 4-hydroxy-3-
nitrophenyl acetyl. VI. Evidence for different T cell receptors in cells that mediate H-21-
restricted and H-2D-restricted cutaneous sensitivity responses. J Exp Med. 1980; 152:
1554-1562.
22. Sunday ME, Weinberger JZ, Benacerraf B, Dorf ME: Hapten-specific T cell responses to
4-hydroxy-3-nitrophenyl acetyl. J Immunol. 1980; 125: 1601-1605.
23. Luo Y, Dorf ME: Delayed-type hypersensitvity, in Coligan JE, Kruisbeek AM, Margulies
DH, Shevach EM, Strober W (eds): Current Protocols in Immunology, John Wiley &
Sons, 1996.
24. Fujita N, Nagahashi A, Nagashima K, Rokudai S, Tsuruo T: Acceleration of apoptotic
cell death after the cleavage of Bcl-XL protein by caspase-3-like proteases. Oncogene.
1998; 17: 1295-1304.
For personal use only.on March 27, 2014. by guest bloodjournal.hematologylibrary.orgFrom
21
25. Martin SJ, Reutelingsperger CP, McGahon AJ, Rader JA, van Schie RC, LaFace DM,
Green DR: Early redistribution of plasma membrane phosphatidylserine is a general
feature of apoptosis regardless of the initiating stimulus: inhibition by overexpression of
Bcl-2 and Abl. J Exp Med. 1995; 182: 1545-1556.
26. Vermes I, Haanen C, Steffens-Nakken H, Reutelingsperger C: A novel assay for
apoptosis. Flow cytometric detection of phosphatidylserine expression on early apoptotic
cells using fluorescein labelled Annexin V. J Immunol Meth. 1995; 184: 39-51.
27. Wilhelm S, Wagner H, Hacker G: Activation of caspase-3-like enzymes in non-apoptotic
T cells. Eur J Immunol. 1998; 28: 891-900.
28. Alam A, Cohen LY, Aouad S, Sekaly RP: Early activation of caspases during T
lymphocyte stimulation results in selective substrate cleavage in nonapoptotic cells. J
Exp Med. 1999; 190: 1879-1890.
29. Hayward AR, Kurnick JT, Clarke DR: T cell growth factor-enhanced PHA response of
human thymus cells: requirement for T3+ cells. J Immunol. 1981; 127: 2079-2082.
30. DeCaprio JA, Furukawa Y, Ajchenbaum F, Griffin JD, Livingston DM: The
retinoblastoma-susceptibility gene product becomes phosphorylated in multiple stages
during cell cycle entry and progression. Proc Natl Acad Sci USA. 1992; 89: 1795-1798.
31. Lucas JJ, Szepesi A, Domenico J, Tordai A, Terada N, Gelfand EW: Differential
regulation of the synthesis and activity of the major cyclin-dependent kinases, p34cdc2,
p33cdk2, and p34cdk4, during cell cycle entry and progression in normal human T
lymphocytes. J Cell Physiol. 1995; 165: 406-416.
32. Olashaw N, Pledger WJ: Paradigms of growth control: relation to Cdk activation.
Science’s Stke [Electronic Resource]: Signal Transduction Knowledge Environment.
2002: RE7, 200.
33. Lea NC, Orr SJ, Stoeber K, Williams GH, Lam EW, Ibrahim MA, Mufti GJ, Thomas NS:
Commitment point during G0-->G1 that controls entry into the cell cycle. Mol Cell Biol.
2003; 23: 2351-2361.
For personal use only.on March 27, 2014. by guest bloodjournal.hematologylibrary.orgFrom
22
34. Daynes RA, Dowell T, Araneo BA: Platelet-derived growth factor is a potent biologic
response modifier of T cells. J Exp Med. 1991; 174: 1323-1333.
35. Singer AL, Koretzky GA: Control of T cell function by positive and negative regulators.
Science. 2002; 296: 1639-1640.
36. Brain J, Saksena A, Laneuville P: The kinase inhibitor STI571 reverses the Bcr-Abl
induced point mutation frequencies observed in pre-leukemic P190(Bcr-Abl) transgenic
mice. Leukemia Res. 2002; 26: 1011-1016.
37. Hoepfl J, Miething C, Grundler R, Gotze KS, Peschel C, Duyster J: Effects of imatinib on
bone marrow engraftment in syngeneic mice. Leukemia. 2002; 16: 1584-1588.
38. Appel S, Boehmler A, Gruenbach F, Muller M, Rupf A, Weck M, Hartmann U, Reichardt
V, Kanz L, Brummendorf T, Brossart P: Imatinib mesylate affects the development and
function of dendritic cells generated from CD34+ peripheral blood progenitor cells. Blood.
2004; 103: 538-544.
39. Wang JYJ: Regulation of cell death by the Abl tyrosine kinase. Oncogene. 2000; 19:
5643-5650.
40. Mattiuzzi GN, Cortes JE, Talpaz M, Reuben J, Rios MB, Shan J, Kontoyiannis D, Giles
FJ, Raad I, Verstovsek S, Ferrajoli A, Kantarjian HM: Development of Varicella-Zoster
virus infection in patients with chronic myelogenous leukemia treated with imatinib
mesylate. Clin Cancer Res. 2003; 976-980.
41. Bekkenk MW, Vermeer MW, Meijer CJLM, Jansen PM, Middeldorp JM, Stevens SJC,
Willemze R: EBV-positive cutaneous B-cell lymphoproliferative disease after imatinib
mesylate. Blood. 2003; 102: 4243. 42. Wagner U, Staats P, Moll R, Feek U, Vogelmeier C, Groneberg DA: Imatinib-associated
pulmonary alveolar proteinosis. Am J Med. 2003; 115: 674.
43. Miyachi K, Ihara A, Hankins RW, Murai R, Maehiro S, Miyashita H: Efficacy of imatinib
mesylate (STI571) treatment for a patient with rheumatoid arthritis developing chronic
myelogenous leukemia. Clin Rheumatol. 2003; 22: 329-332.
For personal use only.on March 27, 2014. by guest bloodjournal.hematologylibrary.orgFrom
23
Figure 1A
For personal use only.on March 27, 2014. by guest bloodjournal.hematologylibrary.orgFrom
24
Figure 1B
For personal use only.on March 27, 2014. by guest bloodjournal.hematologylibrary.orgFrom
25
Figure 2
For personal use only.on March 27, 2014. by guest bloodjournal.hematologylibrary.orgFrom

26
Figure 3A
For personal use only.on March 27, 2014. by guest bloodjournal.hematologylibrary.orgFrom
27
Figure 3B
For personal use only.on March 27, 2014. by guest bloodjournal.hematologylibrary.orgFrom
28
Figure 4A
For personal use only.on March 27, 2014. by guest bloodjournal.hematologylibrary.orgFrom
29
Figure 4B
For personal use only.on March 27, 2014. by guest bloodjournal.hematologylibrary.orgFrom
30
Figure 5
For personal use only.on March 27, 2014. by guest bloodjournal.hematologylibrary.orgFrom