image fusion of high resolution terrasar-x and multispectral electro-optical data for improved...
TRANSCRIPT
Carsten Jürgens (Ed.): Remote Sensing - New Challenges of High Resolution, Bochum 2008
ISBN 978-3-925143-79-3 249
IMAGE FUSION OF HIGH RESOLUTION TERRASAR-X AND MULTISPECTRAL ELECTRO-OPTICAL DATA FOR IMPROVED
SPATIAL RESOLUTION
Sascha Klonus1, Pablo Rosso2 and Manfred Ehlers3
1. University of Osnabrück, Institute for Geoinformatic and Remote Sensing, Osnabrück, Ger-many; [email protected]
2. University of Osnabrück, Institute for Geoinformatic and Remote Sensing, Osnabrück, Ger-many; [email protected]
3. University of Osnabrück, Institute for Geoinformatic and Remote Sensing, Osnabrück, Ger-many; [email protected]
ABSTRACT
Image fusion is a technique that is used to combine the spatial structure of a high resolution pan-chromatic image with the spectral information of a low resolution multispectral image to produce a high resolution multispectral image. In this paper, first results of fusion experiments with TerraSAR-X and optical multispectral image data will be presented. To generate fused images, use was made of the Ehlers fusion, a fusion technique that is developed for preserving maximum spectral informa-tion. As a result of a changeable filter setting within the Ehlers fusion, three differently fused im-ages were created. To assess the quality of the fusion process, visually and quantitative analyses were performed. First, each band of the fused image was visually compared to the respective original multispectral band for preservation of the original spectral characteristics. Then, the identi-cal band combinations of the fused and original images were compared, such as true color or false color infrared composites. For the spatial resolution evaluation of the fused images, their spectral bands of the fused images were compared to the high resolution TerraSAR-X image. Particular attention was paid to changes of contrast and gray values near edges like streets and buildings. Due to the fact that visual comparison is very subjective; the fused images were also evaluated using quantitative and statistical methods. Techniques that were employed included correlation analysis, calculation of per-pixel deviation, structure similarity index (SSIM), high pass filtering, and edge detection techniques. Best overall performance was achieved by a filter design that repre-sented a compromise between ultimate spatial enhancement and optimum color preservation.
INTRODUCTION
The EARSeL (European Association of Remote Sensing Laboratories) Special Interest Group on Data fusion defines data fusion as “… a formal framework in which are expressed means and tools for the alliance of data originating from different sources. It aims at obtaining information of greater quality; the exact definition of greater quality will depend upon the application” (i) Image fusion forms a subgroup within this definition, with the objective to generate a single image from multiple image data for the extraction of information of higher quality (ii). Image fusion is used in many fields like military reconnaissance, medical imaging, computer vision, robotic industry and remote sensing (iii). The goals of the fusion process are manifold (cf. iv): to sharpen multispectral images (v, vi), to improve geometric corrections (vii), to provide stereo viewing capabilities for stereophoto-grammetry (viii), to enhance certain features not visible in either of the single datasets alone (ix, x), to complement data sets for improved classification (xi), to detect changes using multitemporal data (xii) to substitute missing information (e.g., clouds-VIR, shadows-SAR) in one image with sig-nals from another sensor image (xiii, xiv), to replace defective data (xv), to produce value added products (e.g. vegetation maps)( xvi, xvii), to improve object recognition and feature extraction (xviii, xix), and to monitor environmental changes (xx). In this paper, we will concentrate on the image sharpening process and the question of quality assessment.

Carsten Jürgens (Ed.): Remote Sensing - New Challenges of High Resolution, Bochum 2008
ISBN 978-3-925143-79-3 250
Many publications have focused on how to fuse high resolution panchromatic images with lower resolution multispectral data to obtain high resolution multispectral imagery while retaining the spectral characteristics of the multispectral data (see, for example xxi, xxii, xxiii, xxiv, xxv, or xxvi). It was evident that the employed methods seem to work well for many applications, especially for single-sensor/single-date fusion. Most methods, however, showed significant color distortions for multitemporal and multisensor case studies (xxvii, v). The fusion technique that we will discuss in the following was designed to overcome these problems and has already proven its superiority over the standard pansharpening techniques such as intensity-hue-saturation (IHS), principal component (PC), Brovey, and multiplicative fusion methods (xxviii, xxix, xxx). It also showed better results than the recently developed more advanced methods such as color normalized spectral sharpening (xxxi), Gram Schmidt spectral sharpening (xxxii) and a modified IHS fusion (xxxiii) (see v for more details).
In this study, TerraSAR-X data are used as panchromatic input for fusion with optical multispectral data from Quickbird. TerraSAR-X is a new German Radar satellite which was launched in June 2007. The satellite is equipped with an advanced high-resolution X-Band Synthetic Aperture Ra-dar. It combines the ability to acquire high resolution images for detailed analysis as well as im-ages with a wider swath width for overview applications. In the spotlight mode, the satellite is able to record data with one meter spatial resolution. First test data are already available for scientific investigators. Using TerraSAR-X data as a panchromatic input for pansharpening is a difficult task due to the differences in the data acquisition process (side-looking radar) and the inherent speckle noise.
STUDY AREA AND DATASETS
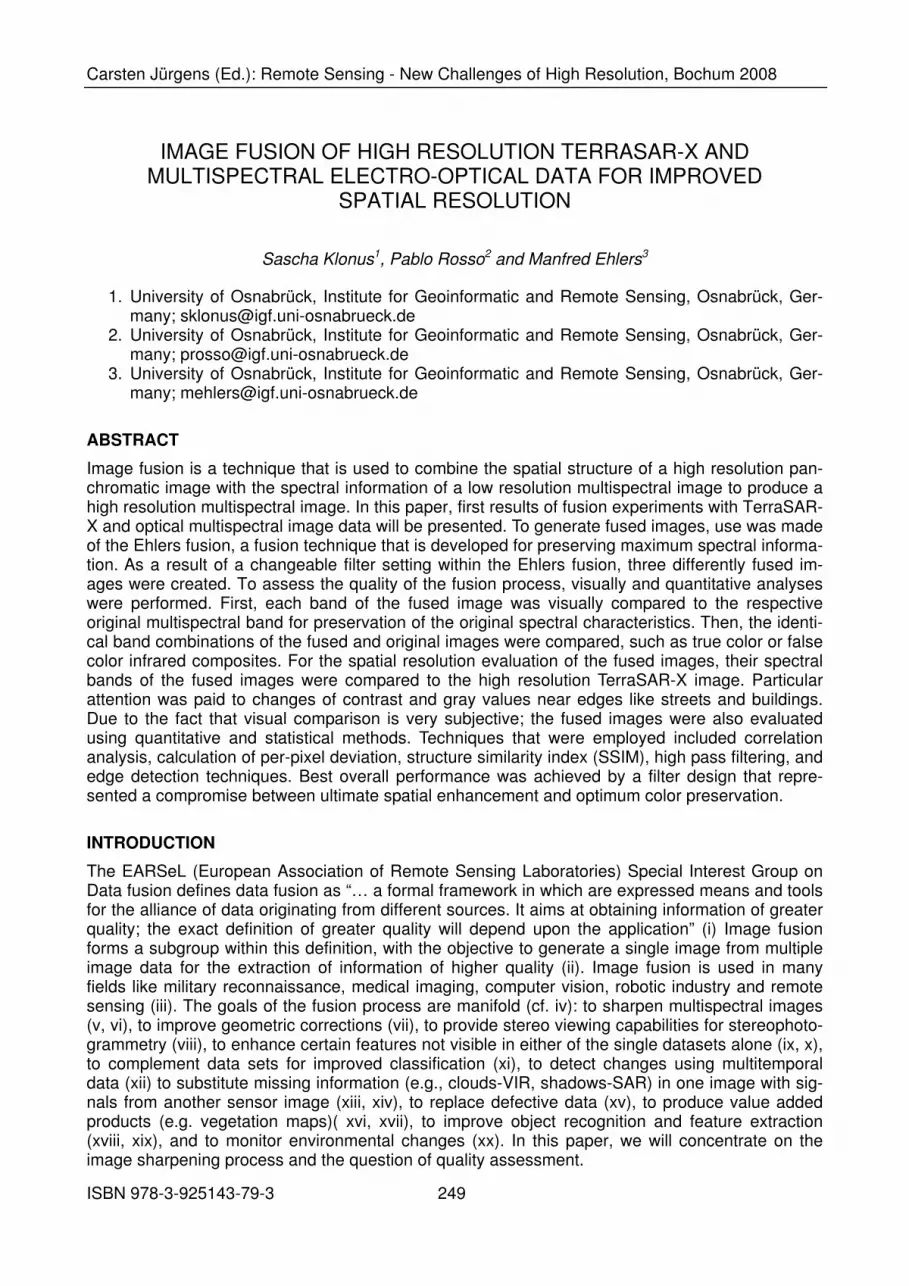
The study area is located in Egypt around the pyramids of Gizeh. The TerraSAR-X image (fig. 1) of this area was provided by the German Aerospace Centre DLR. The image was recorded in high resolution spot mode and acquired on 29 November 2007. The multispectral Quickbird image (fig. 2) was recorded on 2 February 2002 with a ground resolution of 2.40 m. To demonstrate the ef-fects of spatial improvement in the fused image, is was spatially degraded by a factor of 3, i.e. from a ground resolution of 2.40 m to 7.20 m. Before the fusion could be performed, the TerraSAR-X image was despeckled and the degraded Quickbird image resampled to the spatial resolution of the TerraSAR-X image.
DESPECKLING
Speckle noise is generated by the coherent processing of radar signals in high resolution synthetic aperture radar (SAR) images and exists in all types of coherent images systems. Speckle noise reduction is important for SAR images and their applications (xxxiv).
To remove the speckle from the TerraSAR-X image, different despeckle filters were applied, which are implemented in standard image processing software. A median filter (xxxv) with a window of 3x3, 5x5 and 7x7, two different implementations of a Frost filter with a window size of 3x3 and 7x7, an enhanced Frost (xxxvi) filter (window size: 7x7), a Lee sigma filter (xxxvii, xxxviii) and a gamma map filter (xxxix), both with a window size of 7x7, were chosen for comparison.
Carsten Jürgens (Ed.): Remote Sensing - New Challenges of High Resolution, Bochum 2008
ISBN 978-3-925143-79-3 251
Figure 1: TerraSAR-X image of Gizeh recorded in high resolution spot mode, recording data 29 November 2007 ©DLR (2007)

Carsten Jürgens (Ed.): Remote Sensing - New Challenges of High Resolution, Bochum 2008
ISBN 978-3-925143-79-3 252
Figure 2: Multispectral Quickbird image of Gizeh, recording data 2 February 2002, degraded to 7.20 m and resampled to the spatial resolution of the TerraSAR-X image (1 m). The image is dis-played as band combination 4 (nir), 3 (red), 2 (green).
The despeckled images were first visually compared. In order to evaluate the result of filters quan-titatively, the following four parameters (xl) are calculated:
- Noise Mean Value (NMV)
- Noise Variance (NV)
- Mean Square Difference (MSD)
- Equivalent Numbers of Looks (ENL)
NV determines the contents of the speckle in the image. A lower variance gives a “cleaner” image as more speckle is reduced, although it does not necessarily depend on the intensity. The equa-tions for NV and NMV calculation are:
,
( , )
*
d
r c
I r c
NMVR C
=
∑
2
,
( ( , ) )
*
d
r c
I r c NMV
NVR C
−
=
∑
Where R*C are the number of rows and columns, r is the row and c is the column of the despeck-led image (Id).
MSD indicates the average difference of the pixels between the original image (Is) and the despeckled image. A lower MSD indicates a smaller difference between the original TerraSAR-X image and the despeckled image. The MSD is calculated as follows:

Carsten Jürgens (Ed.): Remote Sensing - New Challenges of High Resolution, Bochum 2008
ISBN 978-3-925143-79-3 253
2
,
( ( , ) ( , ))
*
s d
r c
I r c I r c
MSDR C
−
=
∑
The ENL is the ratio of the squared NMV and the NV values. It is measured over a uniform image region. A higher value of ENL usually corresponds to a better filter performance. In this study the grassland area in the upper right part of the image was used for the ENL.
2NMV
ENLNV
=
The results for the calculation of these parameters are shown in Table 1.
Table 1: Comparison of despeckle filter parameters (best results in bold)
Due to the results listed in table 1 and the visual inspection, a median filter with a window size of 7x7 was used for despeckling of the TerraSAR-X image.
EHLERS FUSION
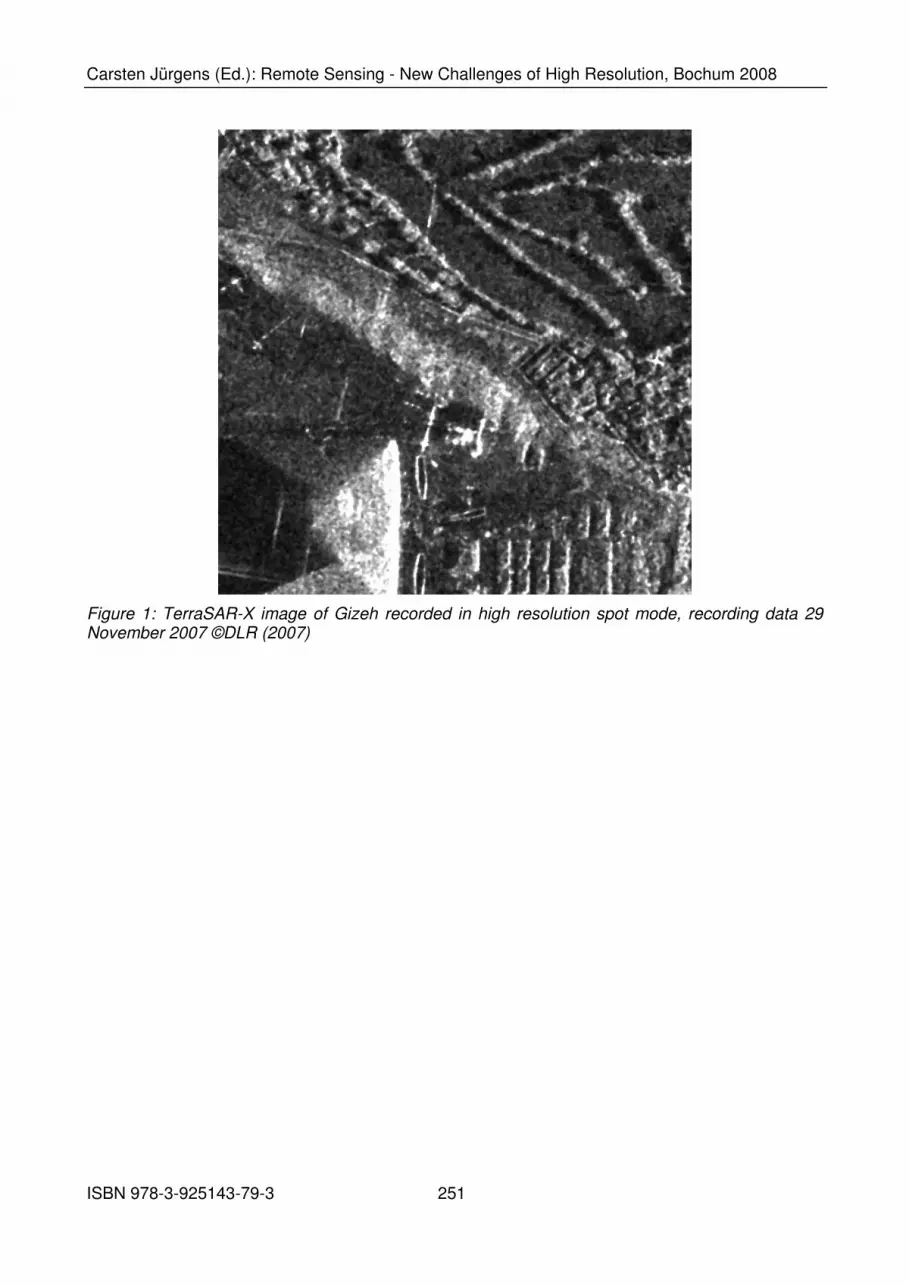
The main principle behind a spectral characteristics preserving image fusion is that the high resolu-tion image has to sharpen the multispectral image without adding new gray level information to its spectral components. An ideal fusion algorithm would enhance the spatial resolution such as edges and gray level changes in an image without altering the multispectral information in homo-geneous regions. To achieve this objective color and spatial information have to be separated. For this separation the Ehlers fusion used a combination of color and Fourier transforms. An overview flowchart of the method is given in fig. 3.
Filter and filter size Statistical Parameter
NMV NV MSD ENL Original image 117.56 10064.10 ----- 6.99 Median 3x3 115.03 8689.97 571.81 10.99 Median 5x5 111.91 7201.22 1527.93 19.57 Median 7x7 109.71 6222.05 2240.02 28.91 Frost 3x3 (Erdas) 116.42 9082.09 158.01 9.53 Frost 7x7 (Erdas) 117.01 8706.76 396.37 14.12 Lee Sigma 7x7 114.48 9122.16 139.25 9.15 GammaMAP7x7 115.56 6176.39 2040.99 27,38 Frost 7x7 (Envi) 115.40 6596.69 NP 29.04 Enhanced Frost 7x7 115.52 6444.88 NP 30.34
Carsten Jürgens (Ed.): Remote Sensing - New Challenges of High Resolution, Bochum 2008
ISBN 978-3-925143-79-3 254
Figure 3: Overview flowchart of the Ehlers Fusion (modified after v).
For optimal color separation an IHS transform is used. This technique is extended to include more than 3 bands by using multiple IHS transforms until the number of bands is exhausted. Conse-quently, the first step is the transformation of the multispectral image into an IHS image working with three bands at each step.
In the next step, the gray value range of the panchromatic image is fitted to the intensity compo-nent of the IHS image. This is necessary; because the intensity component is usually measured in values ranging from 0 to 1, whereas remote sensing images are usually recorded with a radiomet-ric resolution of 8 to 16 bits. For example, the gray values for the TerraSAR-X image vary between 0 and 1000.
After this, the panchromatic image and the intensity component are transformed into the spectral domain using a two-dimensional Fast Fourier Transform (2D FFT). The Fourier transform of the intensity component and the panchromatic image allows an adaptive filter design in the frequency domain. The power spectrum of the Fourier transform provides the information about the distribu-tion of image content along the spatial frequency axes, thus allowing the design of filters that can be adapted to the image content. By applying this technique, the power spectra of both images were used for the design of the appropriate low pass filter for the intensity component and the re-spective high pass filter for the panchromatic image (xli).
The ratio in spatial resolution between the TerraSAR-X image and the reduced multispectral Quickbird image is 1:7.2. Based on this ratio and an image size of 1132 x 1117 pixel, it can be de-rived, that for the intensity component all information in the frequency spectrum above a frequency of N = 157 (≈1132/7.2) for the Quickbird intensity can be regarded as artificial. All frequencies above this cutoff frequency represent artifacts that are usually caused by the resampling process of the multispectral image to the pixel size of the panchromatic image. Consequently, a low pass filter with a cutoff frequency of 157 would not change the image information content. In addition, the filter design depends on the spatial structure of the image and the size of the geoobjects to be
Multispectral
Image
IHS
Panchromatic
Image IHS
Image
Addition Inverse
IHS
Matched
Intensity
Fused
Image
I → FFT→
Low Pass Filter (LP)→FFT-1
→ ILP
Pan → FFT→
High Pass Filter (HP)→FFT-1
→ PanHP

Carsten Jürgens (Ed.): Remote Sensing - New Challenges of High Resolution, Bochum 2008
ISBN 978-3-925143-79-3 255
enhanced. Ideally, the low pass filter for the intensity component of the resampled and transformed multispectral image should be complementary to the high pass filter for the enhancement of edges in the SAR image. It proved to be advantageous, however, to be able to define the cutoff frequen-cies independent from each other (xxix).
The actual final filter design is adapted to the image content. For example, a heterogeneous image of an urban area requires a cutoff frequency which is shifted to the lower values, i.e. a less rigid high pass filter which keeps also lower frequencies. This enhances urban structures. Although the size of buildings and streets are usually known and can be used to define the cutoff frequency, for optimum filter design some interaction is usually required. For a homogeneous image, on the other hand, a stronger high pass filter is used, or otherwise small differences within homogeneous areas will be enhanced and as such might introduce a change of the spectral characteristics. As a default value, the cutoff frequency is calculated by the resolution ratio between the multispectral and the panchromatic image. To avoid artifacts such as the Gibb’s effect (gray value oscillations in the spa-tial domain) after an inverse FFT (xlii, xliii) use is made of a Hanning window to smooth the filter transfer functions.
After filtering, the images are transformed back into the spatial domain with an inverse FFT. The two images are added together to form a fused intensity component with the low frequency infor-mation from the low resolution multispectral image and the high frequency information from the high resolution TerraSAR-X image. In this step, weights can be applied to enforce either the spatial structure in the image or to reduce it, if color changes can still be observed. To achieve this, the filtered TerraSAR-X image is multiplied with a weight factor, before the addition is applied. The fused image is then histogram matched to the original intensity component to map the fused image into the spectral range of the original image. This new intensity component and the original hue and saturation components of the multispectral image are combined to form a new IHS image.
An inverse IHS transformation is finally performed to produce a fused RGB image that contains the spatial information of the TerraSAR-X image and the spectral characteristics of the multispectral image. These steps can be repeated with successive 3-band selections until all bands are fused with the panchromatic image. The order of bands and the inclusion of spectral bands for more than one IHS transform are not critical due to the color preservation of this algorithm. The multispectral layers are combined to form one multispectral image which contains the same number of bands as the original image.
The real advantage of the employed algorithm is the changeable filter setting, which allows that the filter design can be adapted to the image content and the intended application (e.g. maximum color preservation or spatial enhancement of specific geoobjects). If the focus is on color preservation, we can suppress more of the panchromatic information by shifting the filter to the higher frequen-cies of the power spectrum. If the focus is the spatial improvement of selected geoobjects of spe-cific size (e.g. houses or roads), we can shift the filter to the lower frequencies to include more of the high-resolution spatial information of the panchromatic image. By moving the cutoff frequency the user can find a compromise between color preservation and the desired spatial improvement.
This fusion method and the automated calculation of the respective filters are implemented in the Erdas Imagine Version 9.1. A more advanced version will be available soon.
EVALUATION METHODS
First, a visual analysis is performed to compare the quality of the fusion algorithms. In addition we make use of statistical parameters for the evaluation of color preservation and spatial improve-ment. Statistical evaluation procedures have the advantage that they are objective, quantitative, and repeatable.
The employed methods are (xliv, xlv, xlvi):
- correlation between the original and the fused multispectral bands,

Carsten Jürgens (Ed.): Remote Sensing - New Challenges of High Resolution, Bochum 2008
ISBN 978-3-925143-79-3 256
- per-pixel deviation,
- structure similarity index SSIM,
- high pass correlation,
- edge detection,
Correlation Coefficients
The correlation coefficients are calculated between the original multispectral bands and the equiva-lent fused bands. The values range between -1 and 1. The best correspondence between fused and original image data shows the highest correlation values. The correlation coefficient between two variables x and r is calculated as:
cov( , )( , )
( ) ( )
x rCor x r
Var x Var r=
Where x is the fused image and r is the multispectral resampled image.
Per-pixel deviation
To calculate the per-pixel differences, it is necessary to resample the fused image back to the spa-tial resolution of the original image. This image is then subtracted from the original image. The next step is the summation of the difference values. The total sum is then divided by the number of pix-els which is done separately for each band. The result is a single number per band, which repre-sents the average deviation per pixel in gray values:
, ,
1, 1
( )
*
n
R C R C
R C
y d
PPDR C
= =
−
=
∑
Where R and C, are the rows and columns of the image, y represents the original multispectral image and d is the degraded multispectral image.
SSIM
Finally, to evaluate the spectral quality of the image we make use of the structure similarity index which was proposed by (xlv). This method combines a comparison of luminance, contrast and structure and is applied locally for an 8 x 8 square window, which moves pixel-by-pixel over the entire image. At each step, the local statistics and the SSIM index are calculated within the win-dow:
( )
( )( )
1 2
2 2 2 2
1 2
1
(2 )(2 )( , )
( )
1
1
f d fd
f d f d
N
fd i f i d
i
C CSSIM f d
C C
where
f dN
µ µ σ
µ µ σ σ
σ µ µ=
+ +=
+ + + +
= − −−∑
f is the degraded fused image, d is the degraded multispectral image, µ is the respective mean
value, 2σ is the respective variance and Ci are constants.
Edge Detection
For the assessment of the spatial improvement, we make use of two methods. First, a Sobel filter (xlvii) is applied to the images for the detection of edges in the panchromatic and the fused multis-pectral images. Each band is processed independently. After this, the percentage of the detected

Carsten Jürgens (Ed.): Remote Sensing - New Challenges of High Resolution, Bochum 2008
ISBN 978-3-925143-79-3 257
TerraSAR-X edges in the fused bands is calculated. 100 % means all of the edges in the SAR im-age data are detected in the fused image.
High pass correlation
The second algorithm to assess the spatial improvement was proposed by (xlvi) and is based on high pass filtering of the SAR and the fused image. The high pass filter is applied to the SAR im-age data and each of the fused image bands. Then the correlation coefficients between these high pass filtered bands and the high pass filtered TerraSAR-X image are calculated.
RESULTS
The Ehlers fusion was used in three distinct modes to create three different images using the Ter-raSAR-X image as a high spatial resolution input and the Quickbird multispectral image for the spectral information. In the first image (fig. 4) the filter is shifted to the lower frequencies to include more of the TerraSAR-X spatial information. In the second image (fig. 5) the focus was on color preservation. We suppressed more of the panchromatic information by shifting the filter to the higher frequencies of the Fourier spectrum. The third image (fig. 6) presents a compromise be-tween color preservation and strong spatial improvement of the scene.
When compared with the original multispectral image (see fig. 2) it is evident, that figures 5 and 6 display a good color preservation. Fig. 4, however, shows some color distortions. Especially the south side of the pyramid shows a color shift. The same is true for the trees to the North. If only the spatial improvement is considered, however, fig. 4 presents the best result. Fig. 6 features less structure than fig. 4 and fig. 5 shows only a slight improvement of the spatial resolution.
As the visual evaluation is very subjective, a number of statistical analyses were performed, as described above. In the following tables the results for the statistical evaluation are presented. The image in fig. 4 is denoted as spatial, fig. 5 as spectral and fig. 6 as comp. The methods in the table were ordered in the sequence of performance. The method that works best for the respective quantitative test is presented in the first row.

Carsten Jürgens (Ed.): Remote Sensing - New Challenges of High Resolution, Bochum 2008
ISBN 978-3-925143-79-3 258
Figure 4: Fused Multispectral Quickbird/TerraSAR-X image of Gizeh using a low cutoff frequency (mode 1) in the high resolution SAR image (band combination see fig.2).
Figure 5: Fused Multispectral Quickbird/TerraSAR-X of Gizeh using a high cut off frequency (mode 2) in the high resolution SAR image (band combination see fig. 2).
Carsten Jürgens (Ed.): Remote Sensing - New Challenges of High Resolution, Bochum 2008
ISBN 978-3-925143-79-3 259
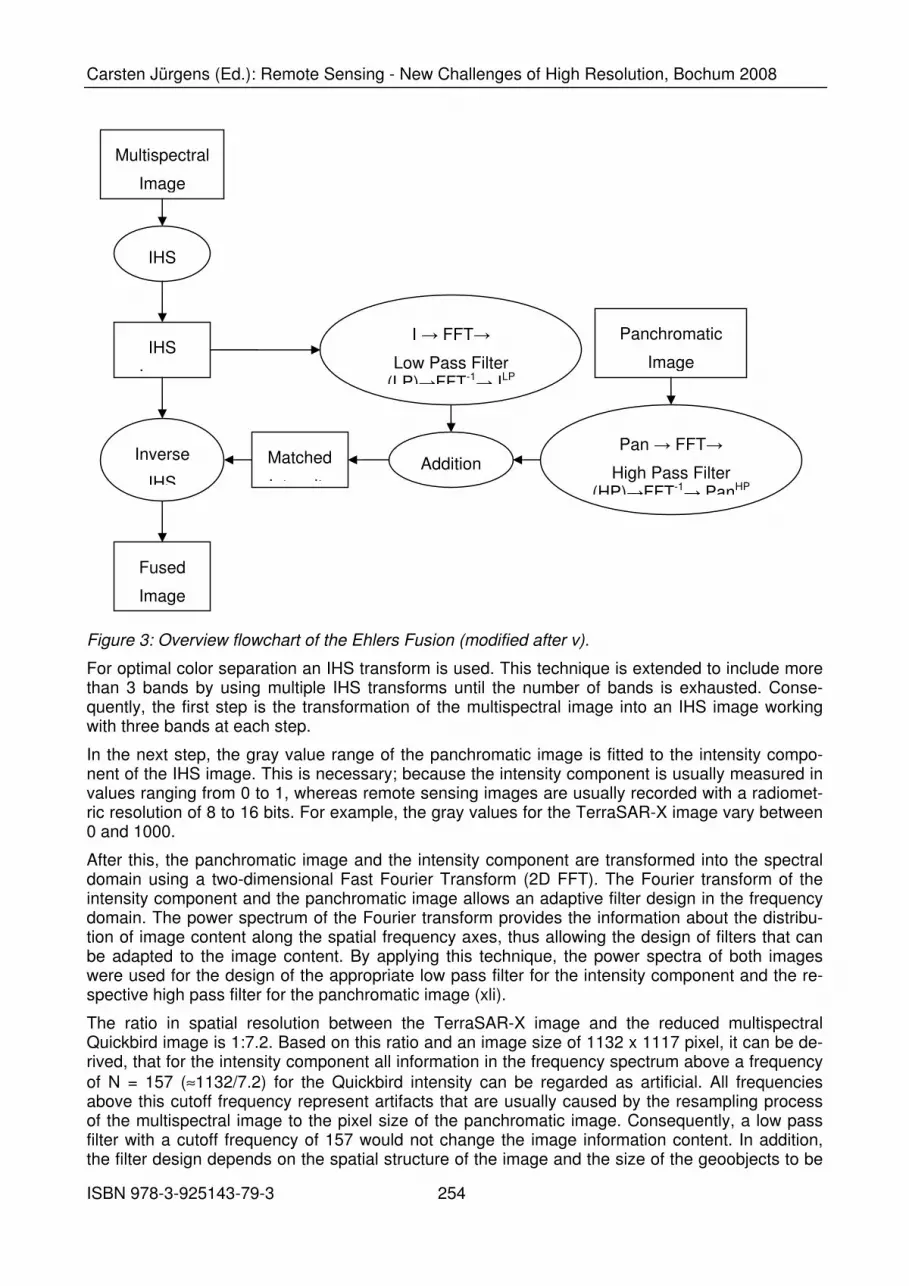
Figure 6: Fused Multispectral Quickbird/TerraSAR-X of Gizeh using a medium cutoff frequency (mode 3) in the high resolution SAR image (band combination see fig.2).
Correlation coefficients are a measure for the spectral preservation. The results presented in table 1 confirm the visual inspection findings. The spectral test image performs best, the comp image shows good to very good results and the spatial image presents results that are not as good as the two others are still above 0.8 which is usually a good result for multisensor/multitemporal fusion.
Table 1: Correlation coefficients for the fused images in comparison with the multispectral Quick-bird image
Spectral Comp Spatial
Band 1 0.9930 0.9770 0.8966 Band 2 0.9929 0.9760 0.8796 Band 3 0.9939 0.9792 0.8951 Band 4 0.9881 0.9600 0.8035 Mean 0.9920 0.9731 0.8687
For the per-pixel deviation (tab. 2) the spectral image again scores best. The comp image still has good values but twice as high as the ones for the spectral image. Although these values might seem high for a per-pixel deviation, the percentage deviation for the comp image is still under 0.5 %. Only the spatial image has an error value of about 2 %. It needs to be investigated, however, if these values would, for example, negatively impact a classification of the images. It should be mentioned that the result for the near infrared band is the lowest (i.e. the best) for all methods. A reason for this is probably that the near infrared band has the lowest gray value range in the origi-nal multispectral image with values between 0 and 928. In contrast to this, the visible bands range from 0 to nearly 65000.

Carsten Jürgens (Ed.): Remote Sensing - New Challenges of High Resolution, Bochum 2008
ISBN 978-3-925143-79-3 260
Table 2: Per-pixel deviation for the fused images in comparison with the multispectral Quickbird image
Spectral Comp Spatial
Band 1 121.7 318.0 1654.8 Band 2 125.6 320.3 1780.6 Band 3 120.7 303.2 1709.6 Band 4 2.1 4.9 27.4 Mean 92.5 236.6 1293.1
The SSIM shows that the similarity with the original image is very low for the spatial image with a mean value of 0.5532. In contrast, the spectral and the comp images present very good results.
Table 3: SSIM for the fused images in comparison with the multispectral Quickbird image
Spectral Comp Spatial
Band 1 0.9909 0.9635 0.5118 Band 2 0.9913 0.9659 0.4942 Band 3 0.9921 0.9700 0.5518 Band 4 0.9936 0.9794 0.6550 Mean 0.9920 0.9697 0.5532
Whereas tables 1 – 3 display the results for spectral preservation, the next tables (tab. 4 – tab. 5) present the results for the analysis of spatial improvement. As anticipated, the spatial image shows here the best results for the edge detection comparison, however, closely followed by the comp and the spectral images.
Table 4: Edge detection results for the fused images in comparison with the TerraSAR-X image (100% means that all edges of the TerraSAR-X image can be depicted in the fused image as well).
Edge Detection Spatial Comp Spectral
Band 1 93.3187 91.0208 91.0361 Band 2 93.0191 90.3663 90.6122 Band 3 92.8611 90.4565 90.4169 Band 4 91.7203 90.5103 90.2485 Mean 92.7298 90.5885 90.5784
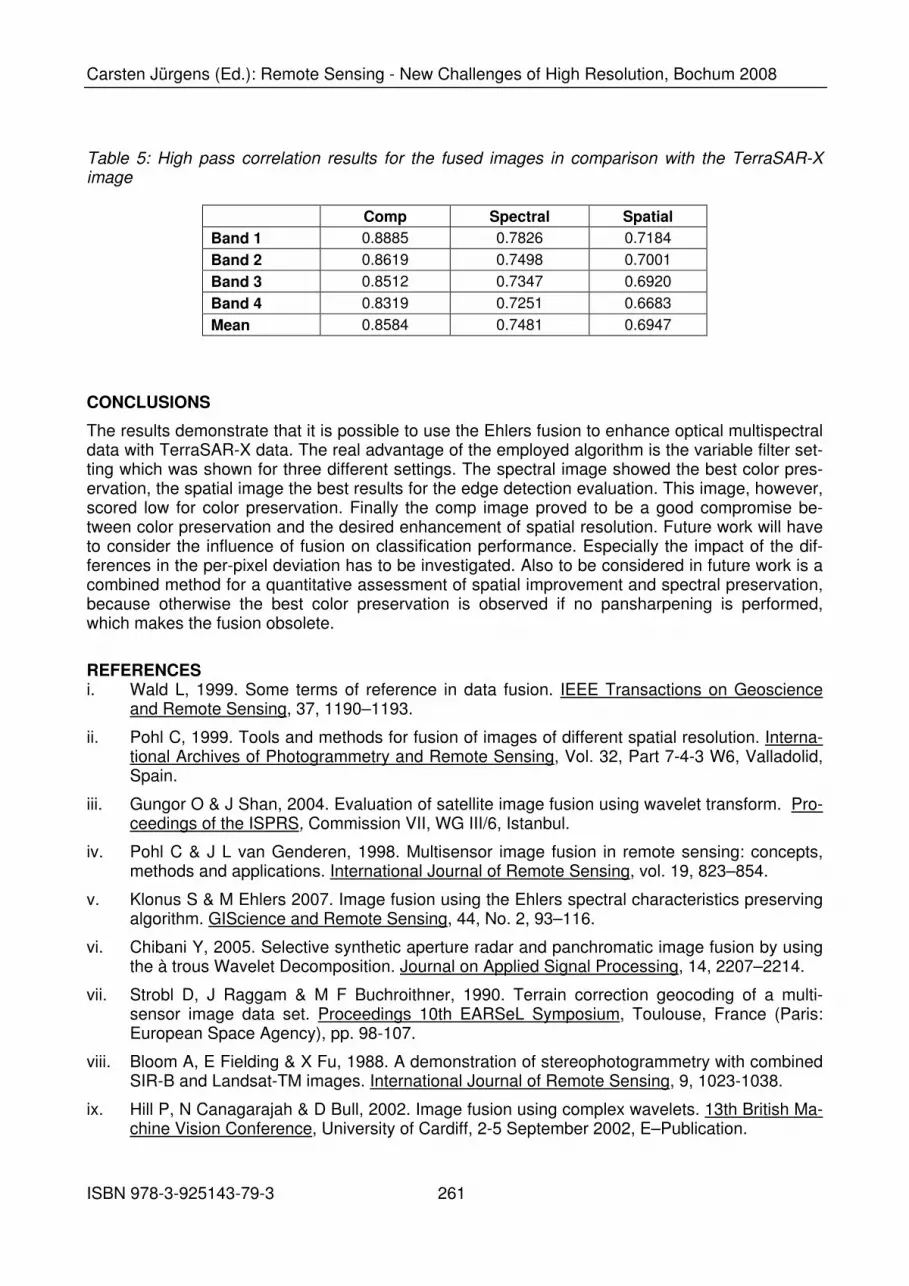
The high pass filter results prove to be different than expected. The spatial image shows the worst instead of the best results. The comp image presents the best results with a mean value of above 0.85. If indeed the high pass filtered images are visually compared with the TerraSAR-X image, the comp and the spectral images show more similarity with the filtered TerraSAR-X image than the spatial image. The reason for this may be the fact that the applied filter in the Fourier domain dur-ing the fusion process was stronger for the spectral and the comp image; this has probably en-hanced the contrast. The spatial image was only high pass filtered during the fusion with a very low cutoff frequency and the contrast was probably reduced through the color injection.
Carsten Jürgens (Ed.): Remote Sensing - New Challenges of High Resolution, Bochum 2008
ISBN 978-3-925143-79-3 261
Table 5: High pass correlation results for the fused images in comparison with the TerraSAR-X image
Comp Spectral Spatial
Band 1 0.8885 0.7826 0.7184 Band 2 0.8619 0.7498 0.7001 Band 3 0.8512 0.7347 0.6920 Band 4 0.8319 0.7251 0.6683 Mean 0.8584 0.7481 0.6947
CONCLUSIONS
The results demonstrate that it is possible to use the Ehlers fusion to enhance optical multispectral data with TerraSAR-X data. The real advantage of the employed algorithm is the variable filter set-ting which was shown for three different settings. The spectral image showed the best color pres-ervation, the spatial image the best results for the edge detection evaluation. This image, however, scored low for color preservation. Finally the comp image proved to be a good compromise be-tween color preservation and the desired enhancement of spatial resolution. Future work will have to consider the influence of fusion on classification performance. Especially the impact of the dif-ferences in the per-pixel deviation has to be investigated. Also to be considered in future work is a combined method for a quantitative assessment of spatial improvement and spectral preservation, because otherwise the best color preservation is observed if no pansharpening is performed, which makes the fusion obsolete.
REFERENCES i. Wald L, 1999. Some terms of reference in data fusion. IEEE Transactions on Geoscience
and Remote Sensing, 37, 1190–1193.
ii. Pohl C, 1999. Tools and methods for fusion of images of different spatial resolution. Interna-tional Archives of Photogrammetry and Remote Sensing, Vol. 32, Part 7-4-3 W6, Valladolid, Spain.
iii. Gungor O & J Shan, 2004. Evaluation of satellite image fusion using wavelet transform. Pro-ceedings of the ISPRS, Commission VII, WG III/6, Istanbul.
iv. Pohl C & J L van Genderen, 1998. Multisensor image fusion in remote sensing: concepts, methods and applications. International Journal of Remote Sensing, vol. 19, 823–854.
v. Klonus S & M Ehlers 2007. Image fusion using the Ehlers spectral characteristics preserving algorithm. GIScience and Remote Sensing, 44, No. 2, 93–116.
vi. Chibani Y, 2005. Selective synthetic aperture radar and panchromatic image fusion by using the à trous Wavelet Decomposition. Journal on Applied Signal Processing, 14, 2207–2214.
vii. Strobl D, J Raggam & M F Buchroithner, 1990. Terrain correction geocoding of a multi-sensor image data set. Proceedings 10th EARSeL Symposium, Toulouse, France (Paris: European Space Agency), pp. 98-107.
viii. Bloom A, E Fielding & X Fu, 1988. A demonstration of stereophotogrammetry with combined SIR-B and Landsat-TM images. International Journal of Remote Sensing, 9, 1023-1038.
ix. Hill P, N Canagarajah & D Bull, 2002. Image fusion using complex wavelets. 13th British Ma-chine Vision Conference, University of Cardiff, 2-5 September 2002, E–Publication.

Carsten Jürgens (Ed.): Remote Sensing - New Challenges of High Resolution, Bochum 2008
ISBN 978-3-925143-79-3 262
x. Yang J & R S Blum, 2004. Image fusion using the expectation-maximization algorithm and a hidden Markov model. Vehicular Technology Conference, 2004. VTC2004-Fall. 2004 IEEE 60th, 6, Issue, 4563–4567.
xi. Schistad-Solberg A H, A K Jain & T Taxt, 1994. Multisource classification of remotely sensed data: fusion of Landsat TM and SAR images. IEEE Transactions on Geoscience and Remote Sensing, 32, 768-778.
xii. Duguay G, G Holder, P Howarth & E LeDrew, 1987. Integrating remotely sensed data from different sensors for change detection. Proceedings of the I.E.E.E. International Geoscience and Remote Sensing Symposium (IGARSS ’87), Ann Arbor, U.S.A., 18-21 May 1987 (New York: I.E.E.E.), 567.
xiii. Young S D, S Kakarlapudi & M U de Haag, 2005. A shadow detection and extraction algo-rithm using digital elevation models and x-band weather radar measurements. International Journal of Remote Sensing, 26, Number 8, 1531–1549.
xiv. Hahn M & F Samadzadegan, 1999. Integration of DTMS using wavelets. Int. Archives of Photogrammetry and Remote Sensing, 32, Part 7-4-3 W6, Valladolid, Spain, 3-4 June, 1999, E–Publication.
xv. Suits G, W Malila & T Weller, 1988. Procedures for using signals from one sensor as substi-tutes for signals of another. Remote Sensing of Environment, 25, 395-408.
xvi. Mayaux P, G F De Grandi, Y Rauste, M Simard & S Saatchi, 2002. Large-scale vegetation maps derived from the combined L-band GRFM and C-band CAMP wide area radar mosaics of Central Africa, International Journal of Remote Sensing, 23, Number 7, 1261–1282.
xvii. Kundur D & D Hatzinakos, 1997. A robust digital image watermarking scheme using the wavelet-based fusion. IEEE International Conference on Image Processing, ICIP 97, Santa Barbara, California, vol. 1, 544–547.
xviii. Zhang Z & R S Blum, 1997. A region based image fusion scheme for concealed weapon de-tection. Proceedings of the Conference on Information Sciences and Systems, Baltimore, MD, 168–173.
xix. Ulfarsson M O, J A Benediktsson & J R Sveinsson, 2003. Data fusion and feature extraction in the wavelet domain. International Journal of Remote Sensing, 24, Issue 20, 3933–3945.
xx. Casanova C, A Romo, E Hernández, J L Casanova & J Sanz, 2005. Rapid response for cloud monitoring through Meteosat VIS-IR and NOAA-A/TOVS image fusion: civil aviation application. A first approach to MSG-SEVIRI. International Journal of Remote Sensing, 26, Number 8, 1699–1716.
xxi. Ehlers M, 1991. Multisensor image fusion techniques in remote sensing. ISPRS Journal of Photogrammetry and Remote Sensing, 46(1), 19 – 30.
xxii. Wald L, T Ranchin & M Mangolini, 1997. Fusion of satellite images of different spatial resolu-tions – assessing the quality of resulting images. Photogrammetric Engineering and Remote Sensing, 63 (6), pp. 691-699.
xxiii. Zhang Y, 1997. Information system for monitoring urban environment based on satellite re-mote sensing – Shanghai as an example, Proceedings of the International Geoscience and Remote Sensing Symposium (IGARSS`97), Singapore, 3-8 August 1997.
xxiv. Alparone L, L Facheris, S Baronti, A Garzelli, & F Nencini, 2004. Fusion of multispectral and SAR Images by intensity modulation. The 7th International Conference on Information Fu-sion, Stockholm, Sweden, II, 637–643.
xxv. Choi M, 2006. A new Intensity-Hue-Saturation fusion approach to image fusion with a trade-off parameter. IEEE Transactions on Geoscience and Remote Sensing, 44, No. 6, 1672–1682.
Carsten Jürgens (Ed.): Remote Sensing - New Challenges of High Resolution, Bochum 2008
ISBN 978-3-925143-79-3 263
xxvi. González-Audícana M, X Otazu, O Fors & J Alvarez-Mozos, 2006. A low computational-cost method to fuse IKONOS images using the spectral response function of its sensors. IEEE Transactions on Geoscience and Remote Sensing, 44, No. 6, 1672–1682.
xxvii. Zhang Y, 1999. A new merging method and its spectral and spatial effects. International Journal of Remote Sensing, 20, Number 10, 2003–2014.
xxviii. Ehlers M, 2004. Spectral characteristics preserving image fusion based on Fourier domain filtering. In: Remote Sensing for Environmental Monitoring, GIS Applications, and Geology IV, Proceedings of SPIE, edited by Ehlers, M., H.J. Kaufmann and U. Michel, Bellingham, WA.
xxix. Ehlers M, & S Klonus, 2004. Erhalt der spektralen Charakteristika bei der Bildfusion durch FFT basierte Filterung. Photogrammetrie, Fernerkundung, Geoinformation 6/2004, 495 – 506.
xxx. Klonus S, 2006. Technical Report – Image Fusion Techniques, European Commission, Joint Research Center, Ispra, Institute for the Protection and the Security of the Citizen, Agricul-ture and Fisheries Unit.
xxxi. Vrabel J, P Doraiswamy, J McMurtrey & A Stern, 2002. Demonstration of the accuracy of improved resolution hyperspectral Imagery. SPIE Symposium Proceedings, 4725, 556–567.
xxxii. Laben C A, V Bernard & W Brower, 2000. Process for enhancing the spatial resolution of multispectral imagery using pan-sharpening. US Patent 6,011,875.
xxxiii. Siddiqui Y., 2003. The modified IHS method for fusing satellite imagery. ASPRS 2003 Annual Conference Proceedings, Anchorage, Alaska.
xxxiv. Ma D, W Li & Z Le, 1999. Fitting polynomial statistics and reduction of speckle in one-looksynthetic aperture radar echo signals. Geoscience and Remote Sensing Symposium, IGARSS 99 Proceedings, IEEE 1999 International Volume 1, 524-526.
xxxv. Pratt W K, 2007. Digital image processing, 4th ed. New York: John Wiley & Sons, Inc.
xxxvi. Lopes A, E Nezry, R Touzi & H Laur, 1990. Maximum a posteriori speckle filtering and first order textural models in SAR images. International Geoscience and Remote Sensing Sym-posium (IGARSS), College Park, Maryland, May 1990, 3:2409-2412.
xxxvii. Lee J S, 1981. Speckle Analysis and Smoothing of Synthetic Aperture Radar Images. Computer Graphics and Image Processing, Vol. 17:24-32.
xxxviii. Lee J S, 1983. Digital image smoothing and the sigma filter. Computer Vision, Graphics and Image Processing, 24, 255–269.
xxxix. Frost V S, J A Stiles, K S Shanmugan & J C Holtzman, 1982. A model for radar images and its application to adaptive digital filtering of multiplicative noise. IEEE Transactions on Pattern Analysis and Machine Intelligence, PAMI-4 (2): 157-166.
xl. Mastriani M, 2006. New wavelet-based superresolution algorithm for speckle reduction in SAR images. International Journal of Computer Science, 1(4): 291 – 298.
xli. Gonzales R C & R E Woods, 2002. Digital image processing, Prentice Hall, Upper Saddle River, New Jersey, 2. Edition.
xlii. Brigham, E O, 1997. FFT Anwendungen, Oldenbourg Verlag, München.
xliii. Oppenheim A V & R W Schafer, 1975. Digital signal processing, Prentice Hall, Inc., Engle-wood Cliff, New Jersey.
xliv. Wald, L., 2002, Data fusion - Definitions and architectures - Fusion of images of different spatial resolutions, École de Mines de Paris.

Carsten Jürgens (Ed.): Remote Sensing - New Challenges of High Resolution, Bochum 2008
ISBN 978-3-925143-79-3 264
xlv. Wang Z, A C Bovik, H R Sheikh & E P Simoncelli, 2004. Image quality assessment: from error visibility to structural similarity. IEEE Transactions on Image Processing, 13, 4, 600–612.
xlvi. Zhou J, D L Civco & J A Silander, 1998. A wavelet transform method to merge Landsat TM and SPOT panchromatic data. International Journal of Remote Sensing, 19, no. 4, 743–757.
xlvii. Jensen J R, 2005. Introductory digital image processing: A remote sensing perspective., Up-per Saddle River, NY, Prentice Hall.