multispectral imaging of paintings
TRANSCRIPT

1053-5888/08/$25.00©2008IEEE IEEE SIGNAL PROCESSING MAGAZINE [27] JULY 2008
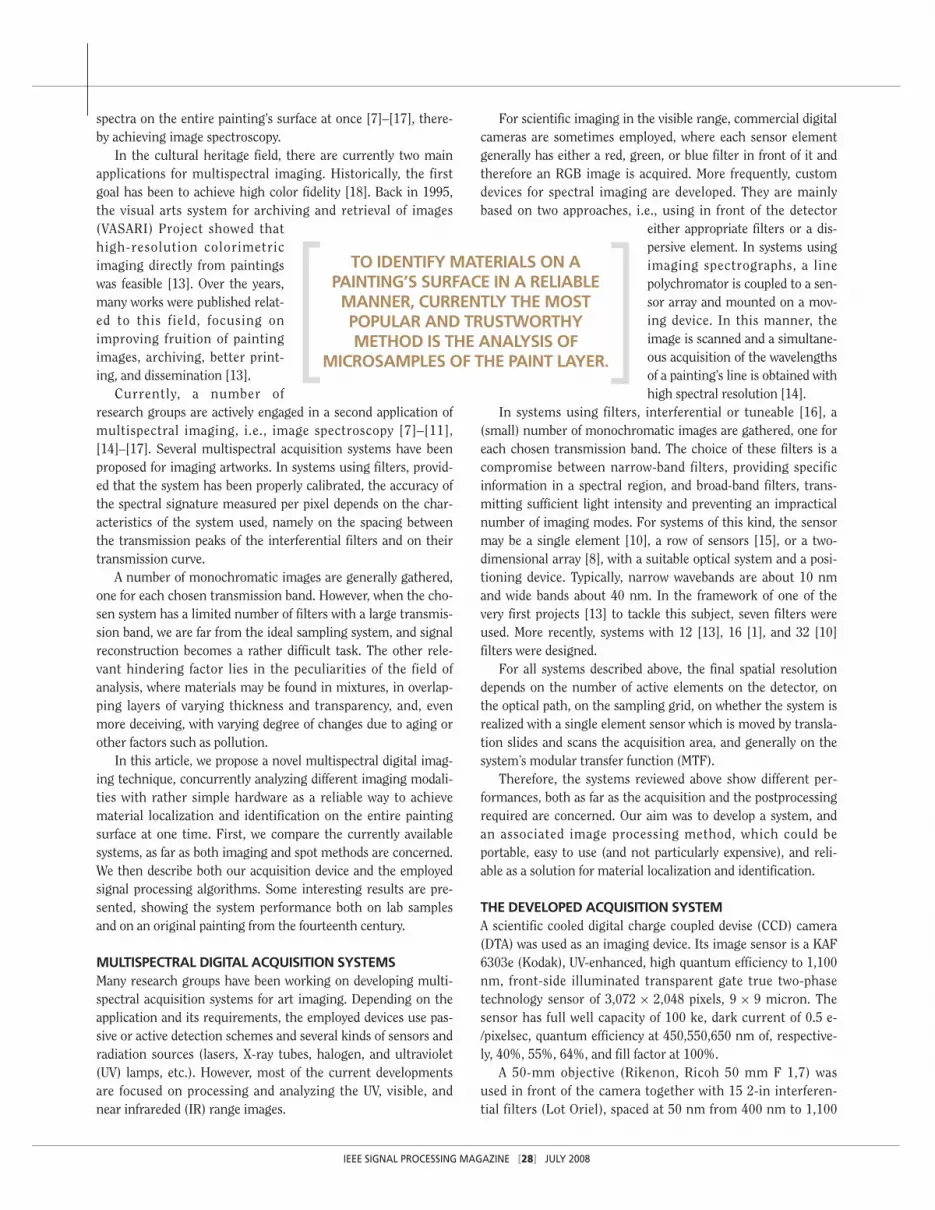
Identifying the materials of a painting is a crucial step in any conservation process. Whenthe objective is to prepare an intervention plan, it is absolutely necessary to understandthe matters the restorer is going to encounter. Also, when the aim is a better under-standing of the artwork, and perhaps an authenticity check, it is highly relevant to knowwhich materials were employed, since they may differ depending on the period
of execution and on the specific artist as well. To identify materials on a painting’s surface in a reliable manner,
currently the most popular and trustworthy method is the analysisof microsamples of the paint layer. However, chemical analyses,although reliable, have a number of drawbacks. The first islinked to the fact that this is an invasive method. Thesamples used need to be detached from the paintingand will not be put back in place. Moreover, theachieved results are in principle—and often also inpractice—valid only for that specific specimenand cannot generally be extended to neighbor-ing areas. This is a rather limiting factor.
This is also true when alternative noninva-sive methods, such as X-rays fluorescence(XRF), laser-induced breakdown spec-troscopy (LIBS), or Raman spectroscopyanalyses, are performed on very small paintareas [24]–[26]. Reflectance spectroscopy alsowas applied for matter investigation on smallspots [1]–[6], [22], [23].
The basic idea of all noninvasive analyses is toinfer image data by exploiting the fact that materi-als reflect, absorb, and emit electromagnetic radia-tion in ways that depend on their molecularcomposition and shape. The reflectance and emissionspectra are generally typical of each substance. However,since it is not practicable to repeat the above-mentioned sin-gle point analysis on all possible positions, it would be ideal tohave a noninvasive method to record reflectance and emission
[Anna Pelagotti, Andrea Del Mastio, Alessia De Rosa, and Alessandro Piva]
Multispectral Imaging of Paintings
Digital Object Identifier 10.1109/MSP.2008.923095
[A way to material identification]
© 1995 MASTER SERIES
IEEE SIGNAL PROCESSING MAGAZINE [28] JULY 2008
spectra on the entire painting’s surface at once [7]–[17], there-by achieving image spectroscopy.
In the cultural heritage field, there are currently two mainapplications for multispectral imaging. Historically, the firstgoal has been to achieve high color fidelity [18]. Back in 1995,the visual arts system for archiving and retrieval of images(VASARI) Project showed thathigh-resolution colorimetricimaging directly from paintingswas feasible [13]. Over the years,many works were published relat-ed to this field, focusing onimproving fruition of paintingimages, archiving, better print-ing, and dissemination [13].
Currently, a number ofresearch groups are actively engaged in a second application ofmultispectral imaging, i.e., image spectroscopy [7]–[11],[14]–[17]. Several multispectral acquisition systems have beenproposed for imaging artworks. In systems using filters, provid-ed that the system has been properly calibrated, the accuracy ofthe spectral signature measured per pixel depends on the char-acteristics of the system used, namely on the spacing betweenthe transmission peaks of the interferential filters and on theirtransmission curve.
A number of monochromatic images are generally gathered,one for each chosen transmission band. However, when the cho-sen system has a limited number of filters with a large transmis-sion band, we are far from the ideal sampling system, and signalreconstruction becomes a rather difficult task. The other rele-vant hindering factor lies in the peculiarities of the field ofanalysis, where materials may be found in mixtures, in overlap-ping layers of varying thickness and transparency, and, evenmore deceiving, with varying degree of changes due to aging orother factors such as pollution.
In this article, we propose a novel multispectral digital imag-ing technique, concurrently analyzing different imaging modali-ties with rather simple hardware as a reliable way to achievematerial localization and identification on the entire paintingsurface at one time. First, we compare the currently availablesystems, as far as both imaging and spot methods are concerned.We then describe both our acquisition device and the employedsignal processing algorithms. Some interesting results are pre-sented, showing the system performance both on lab samplesand on an original painting from the fourteenth century.
MULTISPECTRAL DIGITAL ACQUISITION SYSTEMSMany research groups have been working on developing multi-spectral acquisition systems for art imaging. Depending on theapplication and its requirements, the employed devices use pas-sive or active detection schemes and several kinds of sensors andradiation sources (lasers, X-ray tubes, halogen, and ultraviolet(UV) lamps, etc.). However, most of the current developmentsare focused on processing and analyzing the UV, visible, andnear infrareded (IR) range images.
For scientific imaging in the visible range, commercial digitalcameras are sometimes employed, where each sensor elementgenerally has either a red, green, or blue filter in front of it andtherefore an RGB image is acquired. More frequently, customdevices for spectral imaging are developed. They are mainlybased on two approaches, i.e., using in front of the detector
either appropriate filters or a dis-persive element. In systems usingimaging spectrographs, a linepolychromator is coupled to a sen-sor array and mounted on a mov-ing device. In this manner, theimage is scanned and a simultane-ous acquisition of the wavelengthsof a painting’s line is obtained withhigh spectral resolution [14].
In systems using filters, interferential or tuneable [16], a(small) number of monochromatic images are gathered, one foreach chosen transmission band. The choice of these filters is acompromise between narrow-band filters, providing specificinformation in a spectral region, and broad-band filters, trans-mitting sufficient light intensity and preventing an impracticalnumber of imaging modes. For systems of this kind, the sensormay be a single element [10], a row of sensors [15], or a two-dimensional array [8], with a suitable optical system and a posi-tioning device. Typically, narrow wavebands are about 10 nmand wide bands about 40 nm. In the framework of one of thevery first projects [13] to tackle this subject, seven filters wereused. More recently, systems with 12 [13], 16 [1], and 32 [10]filters were designed.
For all systems described above, the final spatial resolutiondepends on the number of active elements on the detector, onthe optical path, on the sampling grid, on whether the system isrealized with a single element sensor which is moved by transla-tion slides and scans the acquisition area, and generally on thesystem’s modular transfer function (MTF).
Therefore, the systems reviewed above show different per-formances, both as far as the acquisition and the postprocessingrequired are concerned. Our aim was to develop a system, andan associated image processing method, which could beportable, easy to use (and not particularly expensive), and reli-able as a solution for material localization and identification.
THE DEVELOPED ACQUISITION SYSTEMA scientific cooled digital charge coupled devise (CCD) camera(DTA) was used as an imaging device. Its image sensor is a KAF6303e (Kodak), UV-enhanced, high quantum efficiency to 1,100nm, front-side illuminated transparent gate true two-phasetechnology sensor of 3,072 × 2,048 pixels, 9 × 9 micron. Thesensor has full well capacity of 100 ke, dark current of 0.5 e-/pixelsec, quantum efficiency at 450,550,650 nm of, respective-ly, 40%, 55%, 64%, and fill factor at 100%.
A 50-mm objective (Rikenon, Ricoh 50 mm F 1,7) wasused in front of the camera together with 15 2-in interferen-tial filters (Lot Oriel), spaced at 50 nm from 400 nm to 1,100
TO IDENTIFY MATERIALS ON APAINTING’S SURFACE IN A RELIABLEMANNER, CURRENTLY THE MOSTPOPULAR AND TRUSTWORTHYMETHOD IS THE ANALYSIS OF
MICROSAMPLES OF THE PAINT LAYER.

IEEE SIGNAL PROCESSING MAGAZINE [29] JULY 2008
nm, typical peak transmittance of 80–90% and full width athalf maximum (FWHM) of 40–50 nm. We employed thisdevice, associating to it the appropriate lamps and set of fil-ters, to image in three different modalities: visiblereflectance, IR reflectography, and UV-induced fluorescence.In the following, these three modalities are analyzed.
MULTISPECTRALVISIBLE ACQUISITIONSVisible multispectral imaging isgenerally capable of measuring,per pixel, the spectral reflectanceof a painting with an accuracythat is dependent on the systemused. The multispectral data maybe used in an attempt to identifysome of the pigments found in the painting by comparison witha library of spectra obtained from reference pigments. Moreover,interband comparison can help to reveal features of the painting,such as retouchings, that are not visible in trichromatic images.In addition, multispectral data can be used to render a colorimage of the painting under a chosen illuminant [13]. In particu-lar, in our case, the acquisition was performed with the scientificcooled digital CCD camera, a set of eight narrow-band (50-nm)interferential filters, in the 380–780 nm range. The radiationsource was a couple of halogen lamps with a continuous emis-sion spectrum and rich emission in the long wavelength range.The acquisition was performed with a standardized procedure,implying prior calibration of the device, an on-site calibrationusing a certified reflectance standard (Spectralon, LabSphere),stable set-up, sensitivity, filters, and radiation source.
MULTISPECTRAL IR REFLECTOGRAPHYWhile multispectral imaging in the visible range is a commontechnique, multispectral imaging in the near IR range, or IRreflectography, is quite new, although it proved to achieve fairlyinteresting results [21]. IR reflectography generally allows oneto reveal the hidden drawings laying underneath the paint layersand helps to determine the materials used in their creation,clarifying artists’ working methods.
There are several devices currently used to acquire an imageof the IR radiation reflected by a painting. They can be distin-guished, as any imaging method, by attainable spatial resolu-tion, intrinsic geometrical distortion of each acquired image,and dependency on illumination. Moreover, they differentiatethemselves by the waveband characteristic of the sensor used,and therefore the “penetration” inside the paint layers whichcan be reached. Generally speaking, there are two digitaldevices that are quite widespread and three which are less com-mon. The two popular methods are lead sulphide infraredVidicon tube cameras and commercial cameras with the “nightshot” option. The three less common types of devices are planarscanners with indium gallium arsenide (InGaAs) sensor (singlepoint or array), professional cooled CCD cameras, and platinumsilicide cameras.
All these devices can be used to acquire images in a singlelarge band, or several images corresponding to filtering the signalwith interferential filters. In particular, in our case we used thescientific cooled digital CCD camera and a set of eight narrow-band (50-nm) interferential filters in the 780–1,130 nm range.The radiation source was a couple of halogen lamps with a contin-
uous emission spectrum and richemission in the long wavelengthrange. The acquisition was per-formed with a standardized proce-dure, implying prior calibration ofthe device, an on-site calibrationusing a certified reflectance stan-dard (Spectralon, LabSphere) andstable set-up, sensitivity, filters,and radiation source.
MULTISPECTRAL UV-INDUCED VISIBLE FLUORESCENCEFluorescence imaging has been used in the conservation fieldfor more than 80 years to identify different varnishes and over-paintings. Only occasionally it has also been used as a supple-mentary technique to recognize materials. Experiencedconservators receive indications about pigments and dyes bydirect observation of fluorescence intensity and hue. However,currently there is not a widespread method to faithfully recordthe fluorescence emission and therefore document it to enablecomparison with emissions of different objects or of the sameobject over time.
The system we developed [11] is capable of acquiring andrecording digital multispectral (eight bands) fluorescence as wellas reflectance images, providing quantitative rather than qualita-tive data—a drastic improvement over traditional systems. Thenew method allows correcting captured images and calibratingthem, recombining the eight monochrome bands into an RGBimage of a painting under UV light as perceived by an observerand separating the fluorescence component from the componentdue to the reflectance of visible stray light. The challengesimplied in this sort of application are, however, both on theimage acquisition side, since the signal to be collected is ratherlow, and on the radiometric and photometric calibration side.
THE PROPOSED MULTISPECRAL DATA ANALYSIS METHODWhen the system chosen has a limited number of filters, as inour case, we are far from the ideal sampling system, and thereflectance or emission signals cannot be exactly reconstructed.Problems of metamerism may appear, and therefore the materi-al identification algorithm used may not be able to give a correctanswer in all cases. In order to have a more efficient use of a sys-tem with a limited number of filters, we chose to concurrentlyprocess images acquired with different modalities, i.e., visible,near IR, and UV-induced visible fluorescence images.
We aim at clustering areas in the images that show similarreflection, absorption, and emission of electromagnetic radia-tion, since this is directly dependent on the material’s molecularcomposition and shape and is therefore typical of each
WHEN THE AIM IS A BETTERUNDERSTANDING OF THE ARTWORK,
AND PERHAPS AN AUTHENTICITYCHECK, IT IS HIGHLY RELEVANTTO KNOW WHICH MATERIALS
WERE EMPLOYED.

IEEE SIGNAL PROCESSING MAGAZINE [30] JULY 2008
substance. In practice, we attempt to distinguish in an image allof the pixels with the same spectroscopic information, whichmeans similar materials, without respect to the color that is per-ceived for them. Highlighting the similar materials can pointout areas of retouching, or areas with original material. Thiscould be feasible, in principle, adopting an approach that iscommonly used for similar aimsin remote sensing.
To correctly analyze the data,we looked for appropriate similar-ity measures and clustering algo-rithm, as will be described in thefollowing section. To identify thematerials, we then compared theachieved data with available data-bases, or with other resultsobtained on single spots withinthe analyzed region. In this way,we are able to extend the accuracy of the acquired single spotanalysis to the surface of the entire painting.
The algorithm accepts up to eight images for each of thethree modalities:
■ Visible reflectance: the images are acquired in the visiblerange within spectral bands of 50 nm, spaced about 50 nmapart, with peaks from 400 to 750 nm.■ Near IR reflectance: the images are acquired in the IRrange, within spectral bands of 50 nm, spaced about 50 nmapart, with peaks from 800 to 1,100 nm.■ UV visible band fluorescence: the images are acquired inthe visible range within spectral bands of 50 nm, spaced about50 nm apart, with peaks from 400 to 750 nm. The fluores-cence of the artwork, illuminated by means of a high-pressuremercury-vapor lamp emitting in the UV a part of the spec-trum, is recorded; such a UV source excites visible fluores-cence emission of most of the artwork materials.However, it is not necessary to have all of the above-
mentioned images available. The algorithm works also on a sub-set of images, or with images acquired in differently spacedwavebands.
REGISTRATION STEPAll the methods using an optical system in front of the actualsensor very often produce data which are misaligned due tothe different length of the optical path. Since our goal is toexactly compare all data originating from the same point inthe real artwork, data images need to be correctly registeredamong each other.
In our work, we employed an automatic registration tech-nique based on the computation of mutual information (MI),which is a similarity measure from information theory. MI is ameasure of the amount of information one image contains con-cerning another image. The maximization of the MI (MMI)approach states that the MI, computed between two images, ismaximum when the images are correctly registered. This regis-tration technique proved to properly perform also in the case of
images related to different acquisition modalities, and thereforewith significantly different content [19].
TESTED SIMILARITY MEASURES AND CLUSTERING We considered a set of methods, with different similarity meas-ures, for comparing the spectra of different points of the paint-
ing. In the following, a briefdescription of the considered dis-tance metrics is given; in particu-lar, after analyzing a set ofsimilarity measures used inremote sensing, we chose fourmetrics that seemed effective forour purpose. In particular, twodifferent approaches were investi-gated: deterministic measures[namely, the spectral angle map-per (SAM) and the Euclidean dis-
tance (ED)] where the spectrum of the pixel is considered as avector of samples of a deterministic signal, and probabilisticmeasures [the Kolmogorov-Smirnov distance (KSD) and thespectral information divergence (SID)] where the spectrum ofthe pixel is modeled through its probability distribution. In thefollowing, the four analyzed measures are detailed.
SAMThe SAM is a method for directly comparing a spectrum to aknown spectrum. This method treats both spectra as vectors andit calculates the spectral angle between them; two image sam-ples (represented by their own spectrum) are judged to be simi-lar when the angle between them is small enough, i.e., it issmaller than a predefined threshold [27]. Let us consider thereflectance spectra of two different pigments stored in two vec-tors x and y of length N, where N is the number of the consid-ered spectral bands. The angle between them is computedaccording to the following equation:
θ(x, y) = arccos( 〈x, y〉
‖x‖‖y‖)
, 0 ≤ θ ≤ π
2.
Let us note that since SAM uses only the vector direction andnot the vector length, the algorithm is insensitive to illumina-tion changes; however, the information concerning the vectorlength could be used to distinguish lighter and darker colors.
KSDKSD is a statistical test that computes the maximum differencebetween the cumulative distributions of two samples; it is usual-ly applied for verifying if a sample has a certain distribution,through the comparison of the empirical distribution of thegiven sample and the assumed distribution. In the consideredapplication, such a test is used for computing the maximum dis-tance between the cumulative histograms of two samples. Byconsidering their reflectance spectra x and y, the cumulativehistograms (namely the empirical distribution functions Fx andFy) are computed and compared; the two image points are
THE BASIC IDEA OF ALL NONINVASIVEANALYSES IS TO INFER IMAGE DATA
BY EXPLOITING THE FACT THATMATERIALS REFLECT, ABSORB, AND EMIT ELECTROMAGNETIC
RADIATION IN WAYS THAT DEPENDON THEIR MOLECULAR
COMPOSITION AND SHAPE.
considered similar if the maximum distance between Fx and Fy
is smaller than an appropriate threshold:
KSD(x, y) = maxi =1...N
∥∥Fx − Fy∥∥ .
SIDSID is a criterion for spectral similarity derived from the con-cept of divergence arising in information theory [20]. SID con-siders each image sample as a random variable and uses itsspectral histogram to define a probability distribution. Hence, itcomputes the spectral similarity between two samples by meas-uring the discrepancy of the probabilistic behaviors betweentheir spectra. By considering two points with spectra x and y,the probabilities are defined as
px,i = xiN∑
i =1xi
and py,i = yiN∑
i =1yi
,
and by using such probabilities the Kullbak-Leibler divergenceis calculated, that is the relative entropy of y with respect to x(or similarly the relative entropy of x with respect to y):
D(x‖y) =N∑
i =1
px,i log(px,i/py,i) and
D(y‖x) =N∑
i =1
py,i log(py,i/px,i).
Hence, the SID is achieved as
SID(x, y) = D(x‖y) + D(y‖x),
and the results are sufficiently small (i.e., lower than a fixedthreshold), the analyzed pigments are classified as similar.
EDED, also called Euclidean minimum distance (EMD) [27] orL2 norm, measures the shortest distance between two vectorsx and y (here representing the spectra of two image points)and is defined as
ED(x, y) = ‖x − y‖ =√√√√ N∑
i =1
(xi − yi)2.
By imposing a threshold on the output ED, the similaritybetween the two considered pigments (x and y) is evaluated.
The clustering approach we used during the experimentsgroups pixels that have similarity measures below a thresholdvalue fixed experimentally; in particular, pixels belonging to apaint are compared with reference spectra or with spectra of asample of the paint itself. Notwithstanding its simplicity, thisapproach demonstrates valid performance, as will be describedin the “Experimental Results” section.
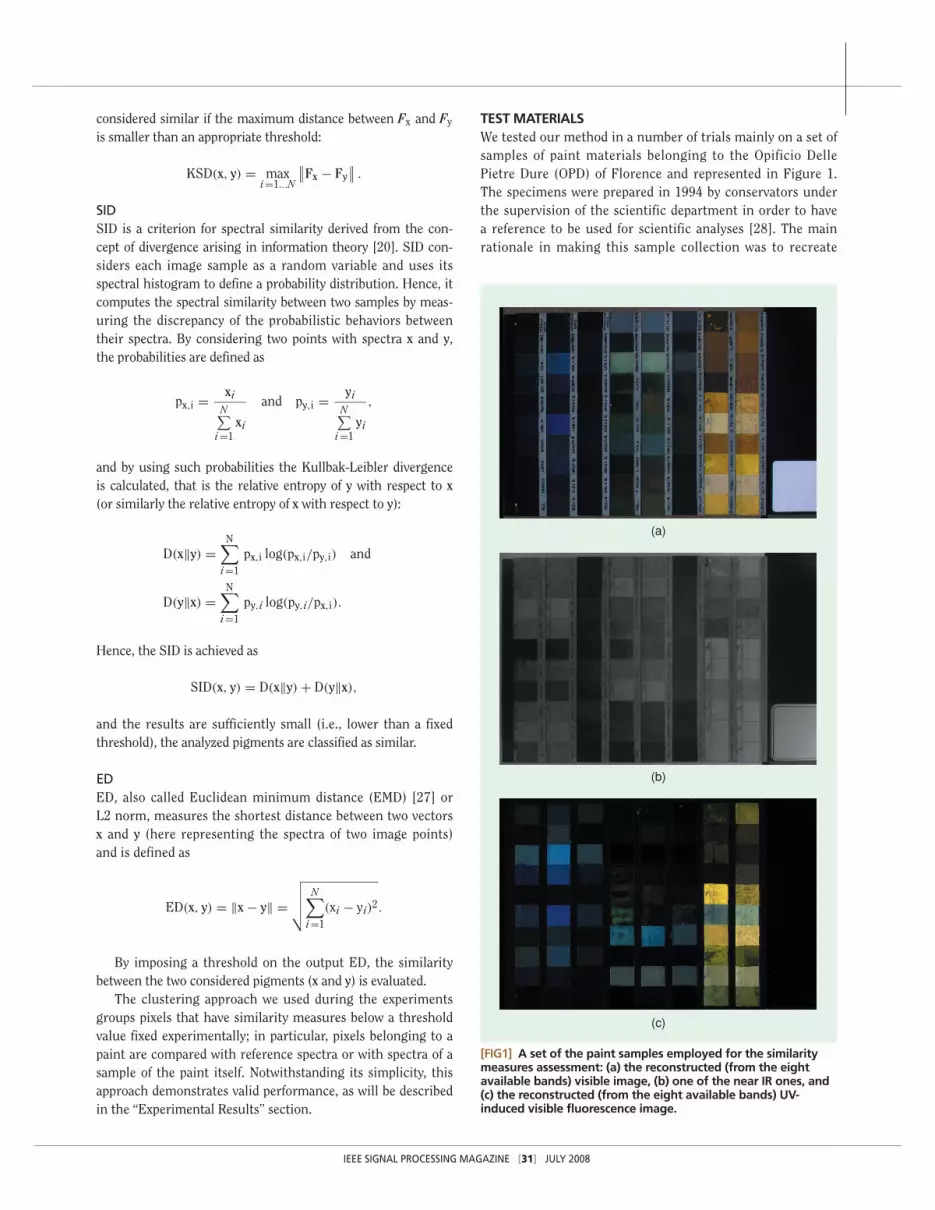
TEST MATERIALSWe tested our method in a number of trials mainly on a set ofsamples of paint materials belonging to the Opificio DellePietre Dure (OPD) of Florence and represented in Figure 1.The specimens were prepared in 1994 by conservators underthe supervision of the scientific department in order to havea reference to be used for scientific analyses [28]. The mainrationale in making this sample collection was to recreate
[FIG1] A set of the paint samples employed for the similaritymeasures assessment: (a) the reconstructed (from the eightavailable bands) visible image, (b) one of the near IR ones, and(c) the reconstructed (from the eight available bands) UV-induced visible fluorescence image.
(a)
(c)
(b)
IEEE SIGNAL PROCESSING MAGAZINE [31] JULY 2008
materials as found in painted works and/or confirmed by“historical” treatises. However, it was deemed important notto limit the research solely to “traditional” materials but alsoto include contemporary paints, as well as those most oftenused in restoration. The pictorial materials were applied tosmall wood panels preparedwith a traditional ground ofgypsum and rabbit skin glue.They varied in order to includepure paint layers, varnishes,film forming materials, andmixture layers. The same pig-ments/dyes were prepared withtwo binding media: either egg-tempera or stand-oil, pure and mixed with lead tin white andivory black pigments.
Having such test samples equipped us with a way tothoroughly check our method, since we were able to assessits performance knowing a priori the exact composition ofall imaged materials.
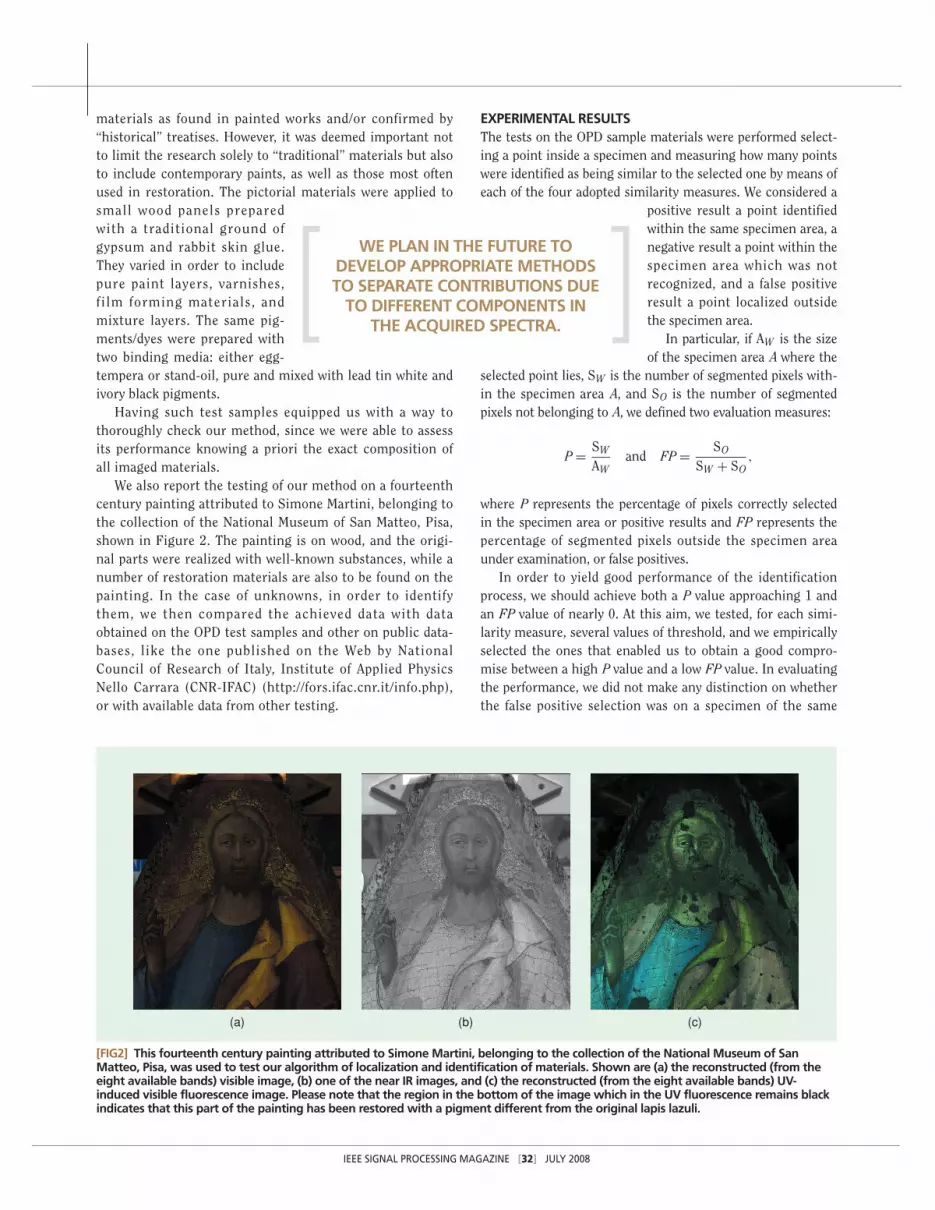
We also report the testing of our method on a fourteenthcentury painting attributed to Simone Martini, belonging tothe collection of the National Museum of San Matteo, Pisa,shown in Figure 2. The painting is on wood, and the origi-nal parts were realized with well-known substances, while anumber of restoration materials are also to be found on thepainting. In the case of unknowns, in order to identifythem, we then compared the achieved data with dataobtained on the OPD test samples and other on public data-bases, like the one published on the Web by NationalCouncil of Research of Italy, Institute of Applied PhysicsNello Carrara (CNR-IFAC) (http://fors.ifac.cnr.it/info.php),or with available data from other testing.
EXPERIMENTAL RESULTS The tests on the OPD sample materials were performed select-ing a point inside a specimen and measuring how many pointswere identified as being similar to the selected one by means ofeach of the four adopted similarity measures. We considered a
positive result a point identifiedwithin the same specimen area, anegative result a point within thespecimen area which was notrecognized, and a false positiveresult a point localized outsidethe specimen area.
In particular, if AW is the sizeof the specimen area A where the
selected point lies, SW is the number of segmented pixels with-in the specimen area A, and SO is the number of segmentedpixels not belonging to A, we defined two evaluation measures:
P = SW
AWand FP = SO
SW + SO,
where P represents the percentage of pixels correctly selectedin the specimen area or positive results and FP represents thepercentage of segmented pixels outside the specimen areaunder examination, or false positives.
In order to yield good performance of the identificationprocess, we should achieve both a P value approaching 1 andan FP value of nearly 0. At this aim, we tested, for each simi-larity measure, several values of threshold, and we empiricallyselected the ones that enabled us to obtain a good compro-mise between a high P value and a low FP value. In evaluatingthe performance, we did not make any distinction on whetherthe false positive selection was on a specimen of the same
[FIG2] This fourteenth century painting attributed to Simone Martini, belonging to the collection of the National Museum of SanMatteo, Pisa, was used to test our algorithm of localization and identification of materials. Shown are (a) the reconstructed (from theeight available bands) visible image, (b) one of the near IR images, and (c) the reconstructed (from the eight available bands) UV-induced visible fluorescence image. Please note that the region in the bottom of the image which in the UV fluorescence remains blackindicates that this part of the painting has been restored with a pigment different from the original lapis lazuli.
(a) (b) (c)
IEEE SIGNAL PROCESSING MAGAZINE [32] JULY 2008
WE PLAN IN THE FUTURE TODEVELOP APPROPRIATE METHODSTO SEPARATE CONTRIBUTIONS DUE
TO DIFFERENT COMPONENTS INTHE ACQUIRED SPECTRA.
material but added with white or black pigment, although thisis obviously less deceptive than a false positive for a totally dif-ferent substance.
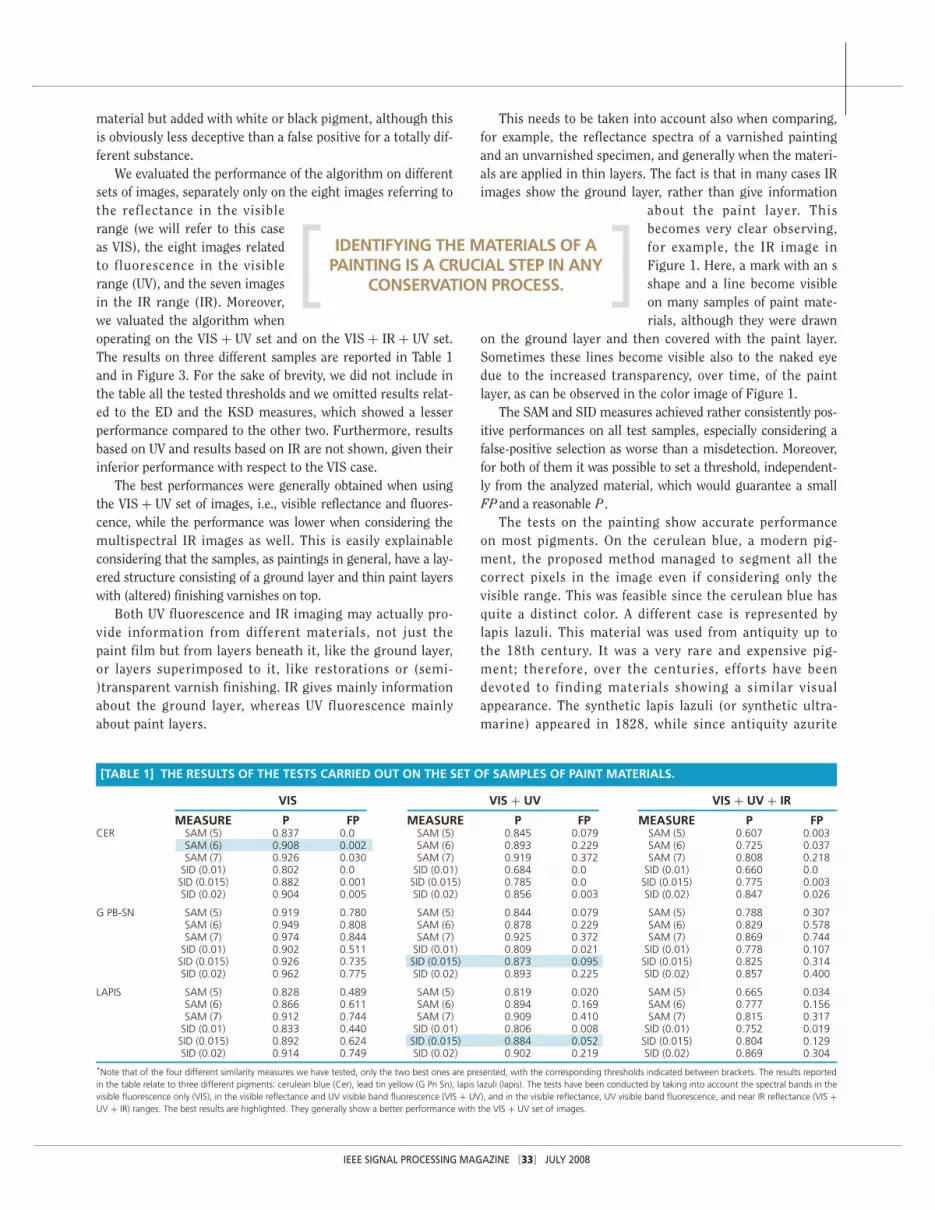
We evaluated the performance of the algorithm on differentsets of images, separately only on the eight images referring tothe reflectance in the visiblerange (we will refer to this caseas VIS), the eight images relatedto fluorescence in the visiblerange (UV), and the seven imagesin the IR range (IR). Moreover,we valuated the algorithm whenoperating on the VIS + UV set and on the VIS + IR + UV set.The results on three different samples are reported in Table 1and in Figure 3. For the sake of brevity, we did not include inthe table all the tested thresholds and we omitted results relat-ed to the ED and the KSD measures, which showed a lesserperformance compared to the other two. Furthermore, resultsbased on UV and results based on IR are not shown, given theirinferior performance with respect to the VIS case.
The best performances were generally obtained when usingthe VIS + UV set of images, i.e., visible reflectance and fluores-cence, while the performance was lower when considering themultispectral IR images as well. This is easily explainableconsidering that the samples, as paintings in general, have a lay-ered structure consisting of a ground layer and thin paint layerswith (altered) finishing varnishes on top.
Both UV fluorescence and IR imaging may actually pro-vide information from different materials, not just thepaint film but from layers beneath it, like the ground layer,or layers superimposed to it, like restorations or (semi-)transparent varnish finishing. IR gives mainly informationabout the ground layer, whereas UV fluorescence mainlyabout paint layers.
This needs to be taken into account also when comparing,for example, the reflectance spectra of a varnished paintingand an unvarnished specimen, and generally when the materi-als are applied in thin layers. The fact is that in many cases IRimages show the ground layer, rather than give information
about the paint layer. Thisbecomes very clear observing,for example, the IR image inFigure 1. Here, a mark with an sshape and a line become visibleon many samples of paint mate-rials, although they were drawn
on the ground layer and then covered with the paint layer.Sometimes these lines become visible also to the naked eyedue to the increased transparency, over time, of the paintlayer, as can be observed in the color image of Figure 1.
The SAM and SID measures achieved rather consistently pos-itive performances on all test samples, especially considering afalse-positive selection as worse than a misdetection. Moreover,for both of them it was possible to set a threshold, independent-ly from the analyzed material, which would guarantee a smallFP and a reasonable P .
The tests on the painting show accurate performanceon most pigments. On the cerulean blue, a modern pig-ment, the proposed method managed to segment all thecorrect pixels in the image even if considering only thevisible range. This was feasible since the cerulean blue hasquite a distinct color. A different case is represented bylapis lazuli. This material was used from antiquity up tothe 18th century. It was a very rare and expensive pig-ment; therefore, over the centuries, efforts have beendevoted to finding materials showing a similar visualappearance. The synthetic lapis lazuli (or synthetic ultra-marine) appeared in 1828, while since antiquity azurite
[TABLE 1] THE RESULTS OF THE TESTS CARRIED OUT ON THE SET OF SAMPLES OF PAINT MATERIALS.
IEEE SIGNAL PROCESSING MAGAZINE [33] JULY 2008
IDENTIFYING THE MATERIALS OF APAINTING IS A CRUCIAL STEP IN ANY
CONSERVATION PROCESS.
VIS VIS + UV VIS + UV + IR
MEASURE P FP MEASURE P FP MEASURE P FPCER SAM (5) 0.837 0.0 SAM (5) 0.845 0.079 SAM (5) 0.607 0.003
SAM (6) 0.908 0.002 SAM (6) 0.893 0.229 SAM (6) 0.725 0.037SAM (7) 0.926 0.030 SAM (7) 0.919 0.372 SAM (7) 0.808 0.218
SID (0.01) 0.802 0.0 SID (0.01) 0.684 0.0 SID (0.01) 0.660 0.0SID (0.015) 0.882 0.001 SID (0.015) 0.785 0.0 SID (0.015) 0.775 0.003SID (0.02) 0.904 0.005 SID (0.02) 0.856 0.003 SID (0.02) 0.847 0.026
G PB-SN SAM (5) 0.919 0.780 SAM (5) 0.844 0.079 SAM (5) 0.788 0.307SAM (6) 0.949 0.808 SAM (6) 0.878 0.229 SAM (6) 0.829 0.578SAM (7) 0.974 0.844 SAM (7) 0.925 0.372 SAM (7) 0.869 0.744
SID (0.01) 0.902 0.511 SID (0.01) 0.809 0.021 SID (0.01) 0.778 0.107SID (0.015) 0.926 0.735 SID (0.015) 0.873 0.095 SID (0.015) 0.825 0.314SID (0.02) 0.962 0.775 SID (0.02) 0.893 0.225 SID (0.02) 0.857 0.400
LAPIS SAM (5) 0.828 0.489 SAM (5) 0.819 0.020 SAM (5) 0.665 0.034SAM (6) 0.866 0.611 SAM (6) 0.894 0.169 SAM (6) 0.777 0.156SAM (7) 0.912 0.744 SAM (7) 0.909 0.410 SAM (7) 0.815 0.317
SID (0.01) 0.833 0.440 SID (0.01) 0.806 0.008 SID (0.01) 0.752 0.019SID (0.015) 0.892 0.624 SID (0.015) 0.884 0.052 SID (0.015) 0.804 0.129SID (0.02) 0.914 0.749 SID (0.02) 0.902 0.219 SID (0.02) 0.869 0.304
*Note that of the four different similarity measures we have tested, only the two best ones are presented, with the corresponding thresholds indicated between brackets. The results reportedin the table relate to three different pigments: cerulean blue (Cer), lead tin yellow (G Pn Sn), lapis lazuli (lapis). The tests have been conducted by taking into account the spectral bands in thevisible fluorescence only (VIS), in the visible reflectance and UV visible band fluorescence (VIS + UV), and in the visible reflectance, UV visible band fluorescence, and near IR reflectance (VIS +UV + IR) ranges. The best results are highlighted. They generally show a better performance with the VIS + UV set of images.
was used as a substitute, when allocated budget did notallow the real lapis lazuli to be used. In our test, however,we were able to distinguish it quite clearly from the otherpigments still using only the visible range. Mainly misde-tection was on pixels where this pigment was still presentbut mixed with another one. Using additionally the UVresponse, this ambiguity was solved. A similar challengingcase was represented by the lead tin yellow, one of the
classical materials. Even in this case, the contextual analy-sis of the visible and UV fluorescence response gave a veryreliable result. In this case, more than in others, given thevery high transparency to the IR radiation of this material,the IR bands were actually acting as noise added to thesignal, causing higher misdetection rate.
With the proposed methods, in many cases it was also possi-ble to identify the materials, comparing the achieved reflectance
and fluorescence spectra with the onesof the OPD samples, even if a perfectmatch is not to be expected since, asstated before, the multispectral analy-ses—and in general spectroscopicanalysis in such a broad wavelengthrange—are also related to the superfi-cial films, be these (altered) finishingvarnishes or retouches, and on theunderlying structures.
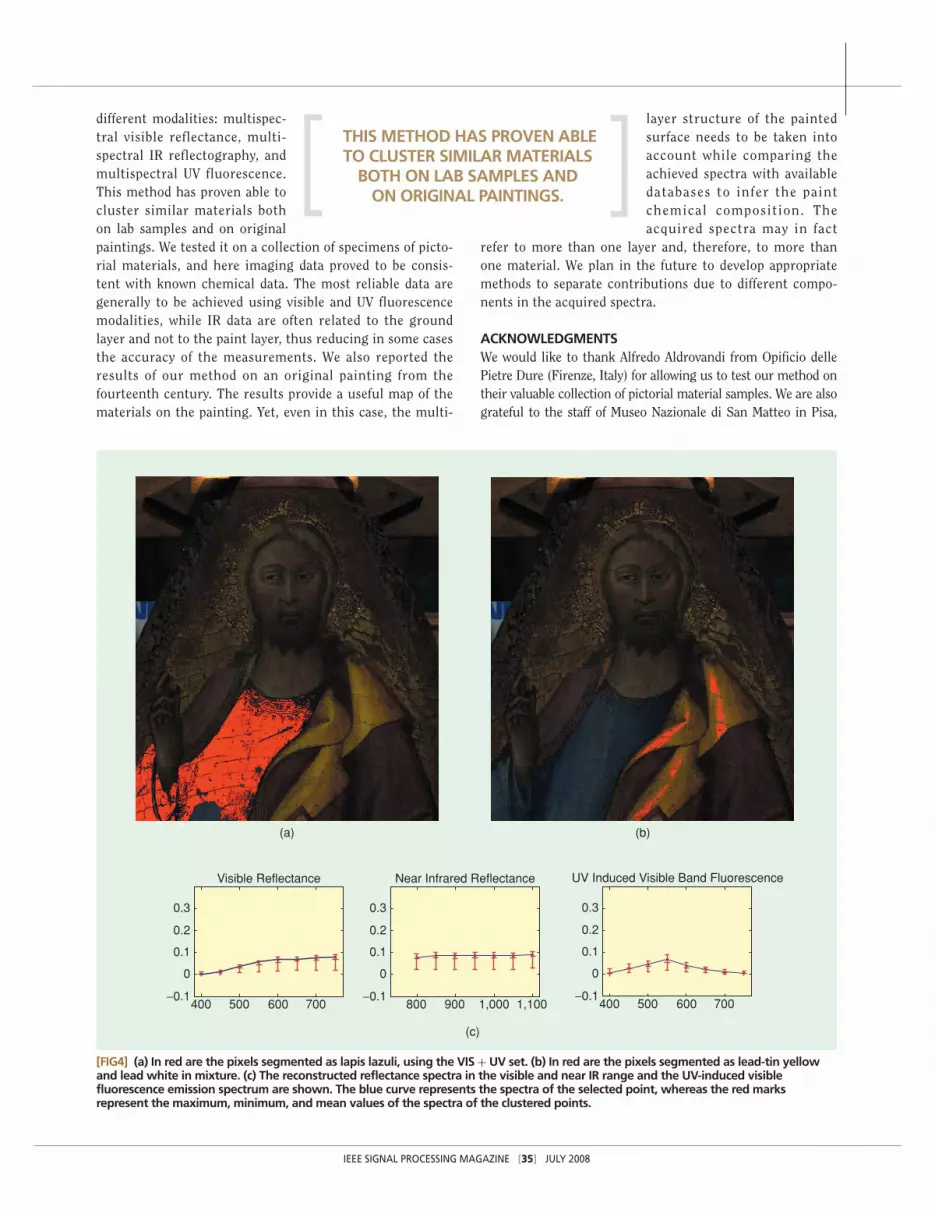
A powerful application of thismethod is the possibility of extendingthe validity of a single point measure tothe neighboring areas and, in this man-ner, assessing the sort of material to befound in that region. As an example,Figure 4(a) shows how knowing, thanksto a previous assessment, that thematerial indicated by the cross waslapis lazuli, by using this method tofind (on the whole surface of the paint-ing) pixels that showed a similar behav-ior, we could segment all areas whosecomposition was laspis lazuli. It is evi-dent by the fact that is not included inthe segmented area that the region atthe bottom of the image was restoredwith a different pigment.
CONCLUSIONSNowadays, noninvasive techniquesand evaluation methods have becomerather familiar. However, most ofthese techniques consist of pointmeasurements. Their advantage oversampling is obvious in the case ofunique art objects; nevertheless,chemical analyses are still needed insome cases. An affordable and reli-able way to extend the results ofpoint data, both for micro-invasiveand noninvasive cases, and to there-fore eventually reduce the number ofsamples, has been presented. Themethod employs a fairly simple imag-ing system, but concurrently ana-lyzes the data acquired in three
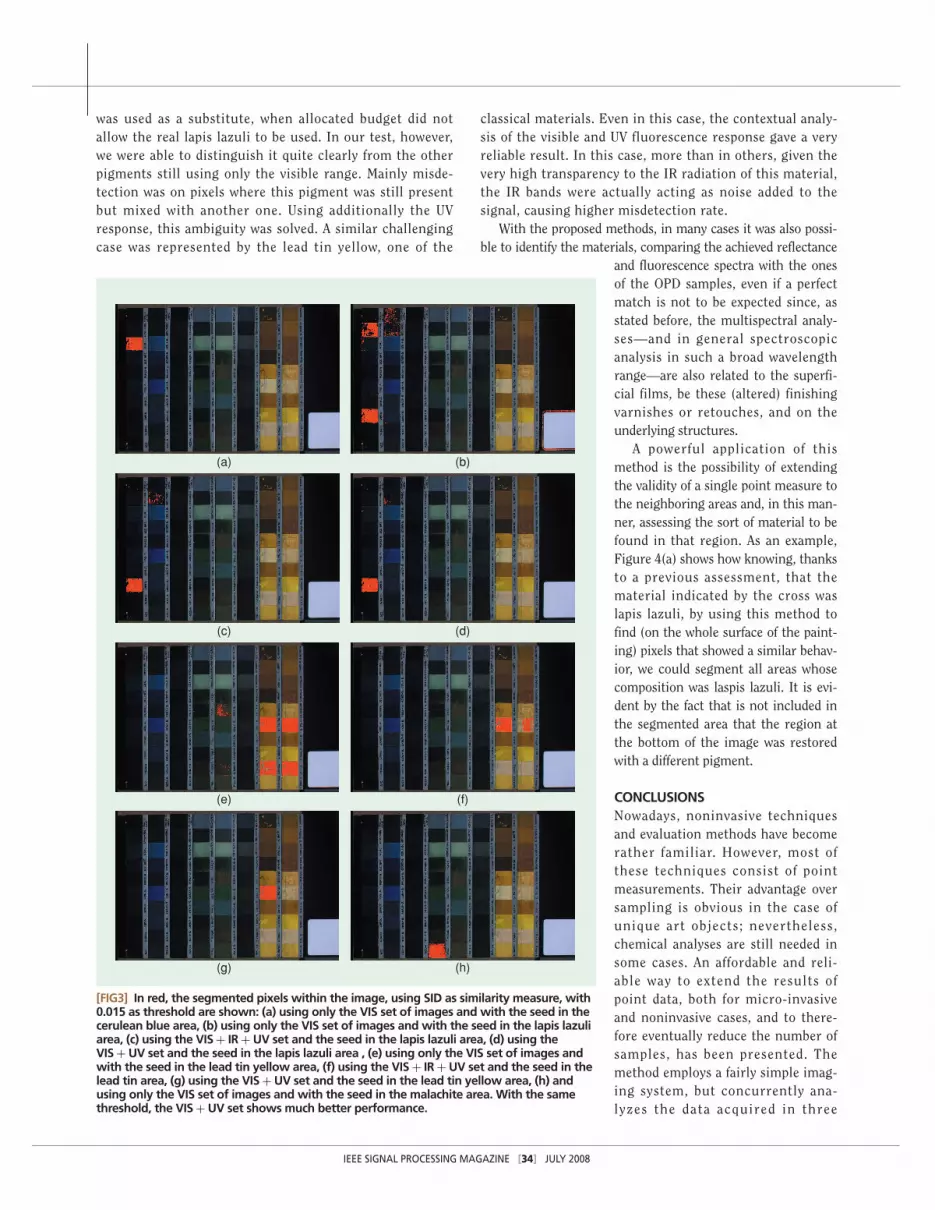
[FIG3] In red, the segmented pixels within the image, using SID as similarity measure, with0.015 as threshold are shown: (a) using only the VIS set of images and with the seed in thecerulean blue area, (b) using only the VIS set of images and with the seed in the lapis lazuliarea, (c) using the VIS + IR + UV set and the seed in the lapis lazuli area, (d) using theVIS + UV set and the seed in the lapis lazuli area , (e) using only the VIS set of images andwith the seed in the lead tin yellow area, (f) using the VIS + IR + UV set and the seed in thelead tin area, (g) using the VIS + UV set and the seed in the lead tin yellow area, (h) andusing only the VIS set of images and with the seed in the malachite area. With the samethreshold, the VIS + UV set shows much better performance.
(a) (b)
(c) (d)
(e) (f)
(g) (h)
IEEE SIGNAL PROCESSING MAGAZINE [34] JULY 2008
IEEE SIGNAL PROCESSING MAGAZINE [35] JULY 2008
different modalities: multispec-tral visible reflectance, multi-spectral IR reflectography, andmultispectral UV fluorescence.This method has proven able tocluster similar materials bothon lab samples and on originalpaintings. We tested it on a collection of specimens of picto-rial materials, and here imaging data proved to be consis-tent with known chemical data. The most reliable data aregenerally to be achieved using visible and UV fluorescencemodalities, while IR data are often related to the groundlayer and not to the paint layer, thus reducing in some casesthe accuracy of the measurements. We also reported theresults of our method on an original painting from thefourteenth century. The results provide a useful map of thematerials on the painting. Yet, even in this case, the multi-
layer structure of the paintedsurface needs to be taken intoaccount while comparing theachieved spectra with availabledatabases to infer the paintchemical composit ion. Theacquired spectra may in fact
refer to more than one layer and, therefore, to more thanone material. We plan in the future to develop appropriatemethods to separate contributions due to different compo-nents in the acquired spectra.
ACKNOWLEDGMENTSWe would like to thank Alfredo Aldrovandi from Opificio dellePietre Dure (Firenze, Italy) for allowing us to test our method ontheir valuable collection of pictorial material samples. We are alsograteful to the staff of Museo Nazionale di San Matteo in Pisa,
[FIG4] (a) In red are the pixels segmented as lapis lazuli, using the VIS + UV set. (b) In red are the pixels segmented as lead-tin yellowand lead white in mixture. (c) The reconstructed reflectance spectra in the visible and near IR range and the UV-induced visiblefluorescence emission spectrum are shown. The blue curve represents the spectra of the selected point, whereas the red marksrepresent the maximum, minimum, and mean values of the spectra of the clustered points.
0.3
0.2
0.1
0
400 500
UV Induced Visible Band Fluorescence
600 700 800 900 1,000 1,100−0.1
0.3
0.2
0.1
0
400 500 600 700−0.1
0.3
0.2
0.1
0
−0.1
Visible Reflectance Near Infrared Reflectance
(a)
(c)
(b)
THIS METHOD HAS PROVEN ABLE TO CLUSTER SIMILAR MATERIALS
BOTH ON LAB SAMPLES AND ON ORIGINAL PAINTINGS.
IEEE SIGNAL PROCESSING MAGAZINE [36] JULY 2008
[SP]
Italy, (National Museum of San Matteo, Pisa) for encouraging ourresearch activities and allowing us to work on images of a paint-ing belonging to the museum’s collection.
AUTHORSAnna Pelagotti ([email protected]) graduated in 1995 inelectronic engineering after obtaining a diploma as paintingconservator in 1990. From 1996 to 2002, she worked in theNetherlands for Philips Research on video and image process-ing. In 2003 she joined the National Institute of Applied Opticsin Italy. In 2006, she was cofounder of Art-Test, a private compa-ny whose mission is to provide optical art diagnostic servicesand continue research and development activities on innovativemethodologies in the cultural heritage field.
Andrea Del Mastio ([email protected]) graduated in2002 in electronic engineering. In 2006, he received the Ph.D.degree in telecommunication engineering, multimedia, andcomputer science from the University of Florence. Since 2006,he has worked at the University of Florence as assistantresearcher, focusing on image processing tools for cultural her-itage. He studied and developed algorithms for image registra-tion and processing of visible, multispectral UV fluorescence andIR reflectance images.
Alessia De Rosa ([email protected]) graduated in 1998in electronic engineering at the University of Florence, where inFebruary 2002 she received the Ph.D. degree in informatics andtelecommunications. Since 2002, she has been involved in theresearch activities of the Department of Electronics andTelecommunications of the University of Florence, where shehas worked since March 2007 as assistant professor. Her maininterests are in digital image processing and its application tomultimedia content security and cultural heritage applications.She holds an Italian patent in the field of digital watermarking.
Alessandro Piva ([email protected]) graduated cum laudein electronic engineering from the University of Florence in1995. He obtained the Ph.D. degree in computer science andtelecommunications engineering from the University ofFlorence in 1999. From 2002–2004, he was a research scientistat CNIT. He is currently an assistant professor at the Faculty ofEngineering of the University of Florence. His main researchinterests are in technologies for multimedia content securityand image processing techniques for the cultural heritage field.He is coauthor of more than 90 papers published in interna-tional journals and conference proceedings. He holds threeItalian patents and one international patent related to water-marking techniques.
REFERENCES[1] S. Bruni, F. Cariati, L. Consolandi, A. Galli, V. Guglielmi, N. Ludwig, and M.Milazzo, “In-situ and laboratory spectroscopic methods for the identification ofpigments in a northern-Italy XI century fresco cycle,” Appl. Spectrosc., vol. 56,no. 7, pp. 827–833, 2002.
[2] N.F. Barnes, “A spectrophotometric study of artists’ pigments,” Tech. Stud.Field Fine Arts, vol. 7, no. 3, pp. 120–138, 1938.
[3] L. Bullock, “Reflectance spectrophotometry for measurement of colourchange,” Nat. Gallery Tech. Bull., vol. 2, pp. 49–55, 1978.
[4] D. Saunders, “The measurement of colour change in paintings, “ Eur.Spectrosc. News, vol. 67, pp. 10–17, 1986.
[5] M. Bacci, F. Baldini, R. Carlà, and R. Linari, “A color analysis of the BrancacciChapel frescoes, “Appl. Spectrosc., vol. 45, no. 1, pp. 26–31, 1991.
[6] M. Bacci, S. Baronti, A. Casini, F. Lotti, M. Picollo, and O. Casazza, “Non-destructive spectroscopic investigations on paintings using optical fibers,” Mat.Res. Soc. Symp. Proc., vol. 267, pp. 265–283, 1992.
[7] A. Casini, F. Lotti, M. Picollo, L. Stefani, and E. Buzzegoli, “Image spectroscopymapping technique for non-invasive analysis of paintings,” Stud. Conserv., vol. 44,no. 1, pp. 39–48, 1999.
[8] H. Liang, D. Saunders, and J. Cupitt, “A new multispectral imaging system forexamining paintings,” J. Imag. Sci. Tech., vol. 49, no. 6, pp. 551–562, 2005.
[9] P. Colantoni, R. Pillayn, C. Lahanier, and D. Pitzalis, “Analysis of multispectralimages of paintings,” in Proc. 14th European Signal Processing Conf. EUSIPCO2006, Firenze, Italy, Sept. 4–8, 2006.
[10] P. Carcagnì, A.D. Patria, R. Fontana, M. Greco, M. Mastroianni, M.Materazzi, E. Pampaloni, and L. Pezzati, “Realization of a new spectrophotome-ter for multispectral imaging and colorimetric characterization of paintings,” inProc. OPDIMON’04 Int. Conf. Optical Diagnostics and Monitoring, Bacoli (NA),Italy, Mar. 2004.
[11] A. Pelagotti, L. Pezzati, A. Piva, and A. Del Mastio, “Multispectral UV fluores-cence analysis of painted surfaces,” in Proc.14th European Signal ProcessingConf. EUSIPCO 2006, Firenze, Italy, Sept. 4–8, 2006.
[12] M. Barni, A. Pelagotti, and A. Piva, “Image processing for the analysis and con-servation of paintings: Opportunities and challenges,” IEEE Signal ProcessingMag., vol. 22, no. 5, pp. 141–144, Sept. 2005.
[13] K. Martinez, J. Cupitt, D. Saunders, and R. Pillay, “Ten years of art imagingresearch,” Proc. IEEE, vol. 90, no. 1, Jan. 2002, pp. 28–41.
[14] G. Antonioli, F. Fermi, C. Oleari, and R. Reverberi, “Spectrophotometric scan-ner for imaging of paintings and other work of art,” in Proc CGIV 2004—SecondEuropean Conf. Color in Graphics, Imaging and Vision, Aachen, Germany, Apr.2004, pp. 219–224.
[15] A. Ribés, F. Schmitt, R. Pillay, and C. Lahanier, “Calibration and spectralreconstruction for CRISATEL: An art painting multispectral acquisition system,” J.Imag. Sci. Tech., vol. 49, no. 6, pp. 563–573, 2005.
[16] G. Novati, P. Pellegri, and R. Schettini, “An affordable multispectral imagingsystem for the digital museum,” Int. J. Dig. Libraries, vol. 5, no. 3, pp. 167–178,May 2005.
[17] F. Imai, M. Rosen, and R. Berns, “Multispectral imaging of Van Gogh’s self-portrait at the national gallery of art, Washington, D.C.,” in Proc. IS&T PICS Conf.,Montreal, Quebec, Canada, 2001, pp. 185–189.
[18] G. Sharma, “Digital color imaging,” IEEE Trans. Image Processing, vol. 6,no. 7, pp. 901–932, July 1997.
[19] V. Cappellini, A. Del Mastio, A. De Rosa, A. Piva, A. Pelagotti, and H.E. Yamani,“An automatic registration algorithm for cultural heritage images,” in Proc. IEEEInt. Conf. Image Processing 2005 (ICIP2005), Genoa, Italy, Sept. 11–14, 2005, vol.2, pp. 566–569.
[20] C.-I. Chang, “Spectral information divergence for hyperspectral image analy-sis,” in Proc. IEEE Int. Geoscience and Remote Sensing Symp. 1999 (IGARSS ’99),Hamburg, Germany, June 28–July 2, 1999, vol. 1, pp. 509–511.
[21] J.K. Delaney, E. Walmsley, B.H. Berrie, and C.F. Fletcher, “Multispectral imag-ing of paintings in the infrared to detect and map blue pigments,” in ScientificExamination of Art: Modern Techniques in Conservation and Analysis, Proc.National Academy of Science of the USA, 2005, pp. 120–136.
[22] M. Bacci, A. Casini, C. Cucci, M. Picollo, B. Radicati, and M. Vervat, “Non-inva-sive spectroscopic measurements on the ‘Portrait of the Stepdaughter’ by GiovanniFattori: Identification of pigments and colorimetric analysis,” J. Cult. Herit., vol. 4,no. 4, pp. 329–336, 2003.
[23] A. Casini, M. Bacci, C. Cucci, F. Lotti, S. Porcinai, M. Picollo, B. Radicati,M. Poggesi, and L. Stefani, “Fiber optic reflectance spectroscopy and hyper-spectral image spectroscopy: Two integrated techniques for the study of theMadonna dei Fusi,” in Proc. SPIE Optical Methods for Arts and Archaeology,Aug. 2005, vol. 5857, p. 177–184.
[24] S. Ridolfi, “From Giotto to De Chirico to Verrocchio: Analyses of paintings andhistorical bronze alloys availing of portable EDXRF equipment,” J. Neutron Res.,vol. 14, no. 1, pp. 17–27, Mar. 2006.
[25] L. Burgio, K. Melessanaki, M. Doulgeridis, R.J.H. Clark, and D. Anglos,“Pigments identification in paintings employing laser induced breakdown spec-troscopy and Raman microscopy,” Spectrochimica Acta Part B: AtomicSpectroscopy, vol. 56, no. 6, pp. 905–913, June 2001.
[26] R.J.H. Clark, “The scientific investigation of artwork and archaeological arte-facts: Raman microscopy as a structural, analytical and forensic tool,” Appl.Physics A: Mat. Sci. Processing, vol. 89, no. 4, pp. 833–840, Dec. 2007.
[27] N. Keshava, “Distance metrics and band selection in hyperspectral processingwith applications to material identification and spectral libraries,” IEEE Trans.Geosci. Remote Sens., vol. 42, no. 7, pp. 1552–1565, July 2004.
[28] A. Aldrovandi, M. Picollo, and B. Radicati, “I materiali pittorici: analisi di stesurecampione mediante spettroscopia in riflettanza nelle regioni dell’ultravioletto, delvisibile e del vicino infrarosso,” OPD Restauro, vol. 10, pp. 69–74, 1998.