ik 335 business english i autumn semester
TRANSCRIPT
IK 335 Business English IAutumn SemesterDr.Dilek Seymen
Course I
I. What is Economics?II.What is the differences between Economics and the Economy?III.Main economic terms to understand Economics: Scarcity, Resource &Commodities, Choice, Opportunity Cost.IV. Possitive & Normative EconomicsV. Microeconomics & Macroeconomics.
Economics and the Economy
Every group of people must solve three basic problems of dailyliving;- what goods and services to produce- how to produce these goods and services- for whom to produce these goods and services.Society must answer all three questions. By emphasizing the roleof society, economics is a social science that stuy and explainhuman behaviour. The subject matter of economics is humanbehavior in the production, exchange and use of goods andservices. The central economic problem for society is how toreconcile the conflict between people's virtualy limitlessdesires for goods and services and the scarcity of resources(labour, machinery and raw materials) with which these goods andservices can be produced. In aswering the questions, what, how,and whom to produce, economics explains how scarce resources areallocated between competing claims on their use. Economics is thestudy of the use of scarce resources to satisfy unlimited human wants. Economics isthe social science that deals with problems such as what, how, and for whom toproduce.
An Economy, is defined as a set of interrelated production andconsumption activities. It may refer to this activity in aregion of one country (for example the Economy of New England )in a country (the American economy) or in a group of countries(the economy of Western Europe). In any economies the allocationof resources is determined by the production, sales and purchasedecision made by firms, house holds and government.
1
ScarcityScarce good is a commodity for which the quantity demandedexceeds the quantity supplied at a price of zero; and thereforea good that commands a positive price in a market economy.Scarcity is inevitable and is central to economics problems. Inrelation to desires,(for more and better foods,clothing,housing, schooling, entertainment etc.) existing resources arewoefully inadequate; there are enough to produce only a smallfraction of the goods and services that are wanted.
Resources&CommoditiesA society’s resources consist of natural gifts such as land,forests and minerals; human resources, both mental and physical,and manufactured aids to production such as tool, machinery andbuildings. Economists call such resources factors of production,because they are used to produce those thing that people desire.The thing produced are called commodities. Commodities may bedivided in to goods and services. Goods are tangible andservices are intangible. What are goods? Goods are physical commodities such as steel,pencil and book etc. What are services? Services intangible commodities such as haircut or medical care. People use goods and services to satisfy many of their wants Theact of making goods and services is called production, and theact of using them to satisfy wants is called consumption.
ChoiceBecause resource are scarce, all societies face the problem ofdeciding what to produce, and how to divide the product amongtheir members. Societies differ in who makes the choices and howthey are made, but the need to choose is commen to all. Just asscarcity ipmlies the need for choice, so choice implies theexistence of cost.
Opportunity CostThe opportuniy cost is the cost of using resources for a certainpurpose, measured by the benefit given up by not using them inan alternative way; that is, measured in terms of othercommodities that could have been optained instead. Every timescarcity forces one to make a choice. These cost are measured interms of forgone alternatives.
Positive &Normative Economics
2
The success of modern science rest partly on the ability ofscientists to separate their views on what does happen fromtheir views on what they would like to happen.Positive statements concern what is, was or will be. Normativestatements concern what one bleives ought to be. Positivestatements or theories may be simple or complex, but they arebasically about matters of fact. Normative statements, becausethey concern what ought to be, are bound up with philosophical,cultural, and religious systems. A normative statement is onethat makes or is based on a value judgement -a judgement aboutwhat is good what is bad. In studying economics, its important to distinguish two branchesof the subject, "positive" and "normative" economics.Positive economics deals with objective or scientificexplanations of the economy. The aim of the positive economicsis to explain how society makes decisions about consumption,production and exchange of goods. Normative economics offers recomendations based on valuejudgements. Normative economics is based on subjective valuejudgements, not on the research for any objective truth. The following statements combines positive and normativeeconomics:"The elderly have very high medical expenses, and the governmentshould subsidize their health bills."The first part of the proposition- the claim that the aged haverelatively high medical bills- is a statement in positiveeconomics. It is a statement about how the world works, and wecan imagine a research programme that could determine whether ornot it is correct. Broadly speaking this assertion happens to becorrect. The second part of the proposition- the recommendationabout what the government should do- could never be proved to becorrect or false by any scientific research investigation. It issimply a subjective value judgement based on the feelings of theperson making the statement. Many people might share thissubjective judgement. But other people might reasonablydisagree. You might belive that it is more important to devotesociety’s scarce resource to improve the environment. There is no way that economics can be used to show that one ofthese normative judgements is correct and the other wrong. Itall depends on the preferences or priorities of the individualor the society that has to make this choice.
Microeconomics&MacroeconomicsWe can classify branches of economics according to the approachthat is used. Microeconomics analysis offers a detailed treatment ofindividual decisions about particular commodities.
3
Microeconomics is the study of the allocation of resources andthe distribution of income as they are affected by the workingof the price system and by government policies. Microeconomicsdeal with the determination of prices and quantities inindividual markets and with the relations among these market.Thus it looks at the details of the economy. In contrast, Macroeconomics focuses on much broaderaggregates.It looks at such thing as the total number of peopleemployed and unemployed., the average level of price and how itchanges over time, national output, and aggregate consumption.Macroeconomics emphasizes the interactions in the economy as awhole. Macroeconomics is the study of the determination ofeconomic aggregates and averages such as total output, totalemployment, the price level and rate of economic growth.Whereas microeconomics looks at demand and supply with regard toparticular commodities, macroeconomics looks at aggregate demandand aggregate supply.
Course II
I Graphical Explanation of Scarcity, Choice and Opportunity CostII. Alternative Economic Systems: Command Economy, Free MarketEconomy, Mixed Economy.IV. The Decision Makers; Households, Firms, Government.
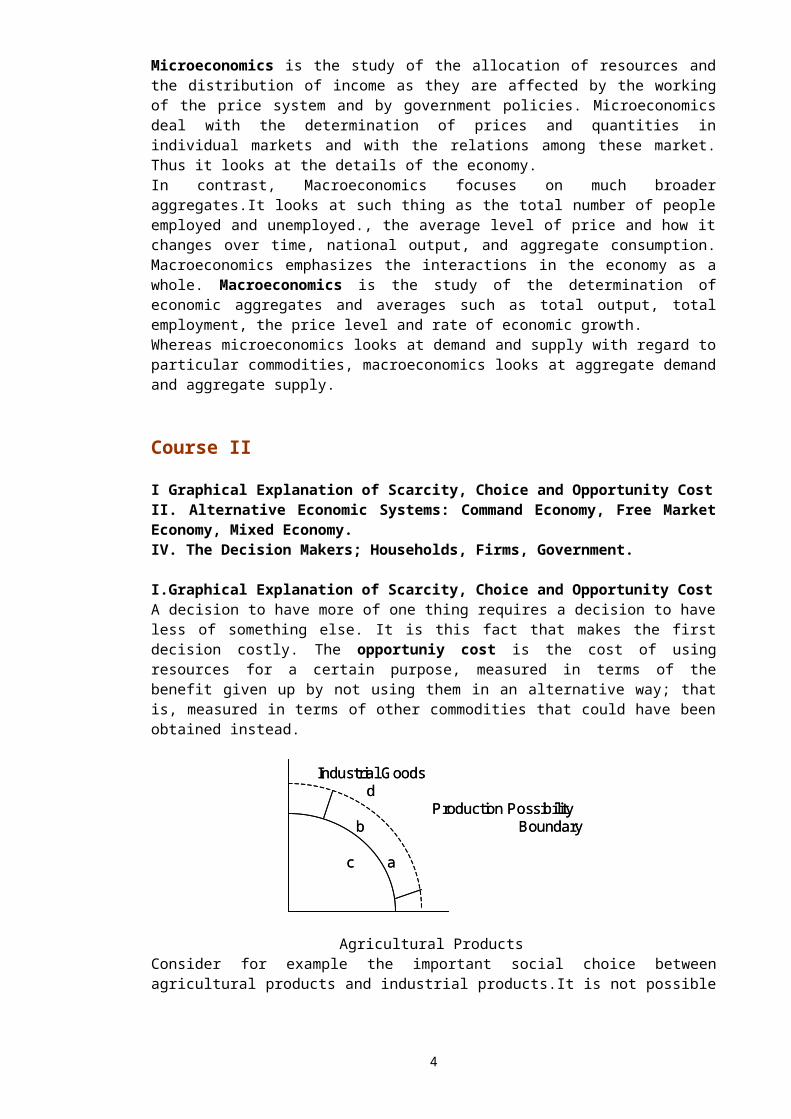
I.Graphical Explanation of Scarcity, Choice and Opportunity CostA decision to have more of one thing requires a decision to haveless of something else. It is this fact that makes the firstdecision costly. The opportuniy cost is the cost of usingresources for a certain purpose, measured in terms of thebenefit given up by not using them in an alternative way; thatis, measured in terms of other commodities that could have beenobtained instead.
IndustrialG oodsd
Production Possibilityb Boundary
c a
IndustrialG oodsd
Production Possibilityb Boundary
c a
Agricultural Products
Consider for example the important social choice betweenagricultural products and industrial products.It is not possible
4
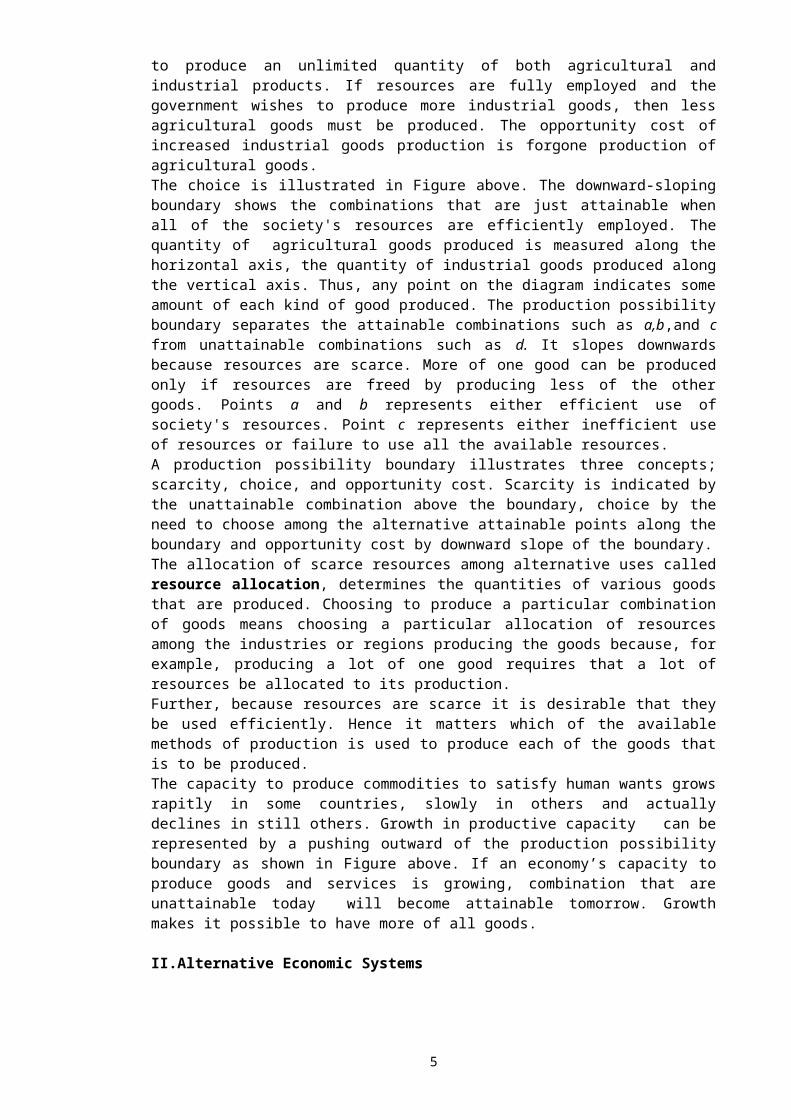
to produce an unlimited quantity of both agricultural andindustrial products. If resources are fully employed and thegovernment wishes to produce more industrial goods, then lessagricultural goods must be produced. The opportunity cost ofincreased industrial goods production is forgone production ofagricultural goods.The choice is illustrated in Figure above. The downward-slopingboundary shows the combinations that are just attainable whenall of the society's resources are efficiently employed. Thequantity of agricultural goods produced is measured along thehorizontal axis, the quantity of industrial goods produced alongthe vertical axis. Thus, any point on the diagram indicates someamount of each kind of good produced. The production possibilityboundary separates the attainable combinations such as a,b,and cfrom unattainable combinations such as d. It slopes downwardsbecause resources are scarce. More of one good can be producedonly if resources are freed by producing less of the othergoods. Points a and b represents either efficient use ofsociety's resources. Point c represents either inefficient useof resources or failure to use all the available resources. A production possibility boundary illustrates three concepts;scarcity, choice, and opportunity cost. Scarcity is indicated bythe unattainable combination above the boundary, choice by theneed to choose among the alternative attainable points along theboundary and opportunity cost by downward slope of the boundary.The allocation of scarce resources among alternative uses calledresource allocation, determines the quantities of various goodsthat are produced. Choosing to produce a particular combinationof goods means choosing a particular allocation of resourcesamong the industries or regions producing the goods because, forexample, producing a lot of one good requires that a lot ofresources be allocated to its production. Further, because resources are scarce it is desirable that theybe used efficiently. Hence it matters which of the availablemethods of production is used to produce each of the goods thatis to be produced.The capacity to produce commodities to satisfy human wants growsrapitly in some countries, slowly in others and actuallydeclines in still others. Growth in productive capacity can berepresented by a pushing outward of the production possibilityboundary as shown in Figure above. If an economy’s capacity toproduce goods and services is growing, combination that areunattainable today will become attainable tomorrow. Growthmakes it possible to have more of all goods.
II.Alternative Economic Systems
5
The role of the market in allocating resources differs vastlybetween countries. In the command economy resources areallocated by central government planning. In the free marketeconomy there is virtually no government regulation of theconsumption, production and exchange of goods, ın between liesthe mixed economy, where market forces play a large role but thegovernment intervenes extensively. All economies face scarcity, and all must decide how to allocatescarce resources and distribute goods and services; all may faceproblem of inflation, unemployment, and unsatisfactory rates ofgrowth.Because all economies faces many common problems, economicanalysis can contribute valuable insights even where familiarinstutitions are modified or absent. Economies can differ from one another in many ways and suchclassification as "capitalism" "socialism" or "mixed economy",represent simplification of complex matters.
The Command Economy (centrally planned economy-socialism)A command economy is a society where the government makes alldecisions about production and consumption. A governmentplanning office decides what will be produced, how it will beproduced, and for whom it will be produced. Detailedinstructions are then issued to household, firms, workers.Such planing is very complicated task, and there is no completecommand economy where all allocation decisions are undertaken inthis way. However in many countries, for example those in Chine,Cuba, and those formerly in the Soviet Bloc, there was largemeasure of central direction and planning. The state ownedfactories and land made the most important decisions about whatpeople should consume, how goods should be produced, and howmuch people should work.
Free Market Economy: The Invisible Hand (market oriented system-capitalism)Markets in which government do not intervene are called freemarkets. Individual in free markets pursue their own intereststrying to do as well for themselves as they can without anygovernment direction or interference. Smith argued thatindividuals pursuing their self-interest would be led 'as by aninvisible hand' to do things that are in the interest of societyas a whole. The idea that such a system could solve the what,how, and for whom to produce problem.
The Mixed EconomyThe free market allows individuals to pursue their self interestwithout any government restrictions. The command economy allows
6
little scope for individual economic freedom since mostdecisions are taken centrally by the government. Between thesetwo extremes lies the mixed economy.In a mixed economy the government and private sector interact insolving economic problems. The government controls a significantshare of output through taxation, transfer payments, and theprovision of goods and services such as defence and the policeforce. It also regulates the extend to which individuals maypursue their own self-interest.
III. The Decision MakersEconomics is about the behavior of people. There are millions ofindividual in most economies. To make a systematic study oftheir behaviour more manageable, we categorize them into threeimportant groups: households, firms, government.A household is defined as all the people who live under one roofand who make or are subject to others making for them, jointfinancial decisions. The members of household are oftenreferred to as concumers. A firm, is defined as the unit that employes factors ofproduction to produce commodities that it sells to other firms,to households, or to government. For obvious reasons a firm isoften called a producer. The term government is used in economics in a broad sense toinclude all public officials, agencies, government bodies andother organization belonging to or under the direct control ofstate.
Course III.
I. The MarketII. Demand&Supply III. The Market and Equilibrium Price
I. The MarketA market is a set of arrangements by which buyers and sellersare in contact to exchange goods or services. Some marketsphysically bring together the buyer and seller. Other markets(the stock exchange) operate through intermediaries (stockbrokers) who transact business on behalf of clients. To understand this process more fully, we require a model of atypical market. The essential features are demand , thebehhaviour of buyers, and supply, the behaviour of sellers. Wecan study the interaction of these forces to see how a marketworks in practice.
7
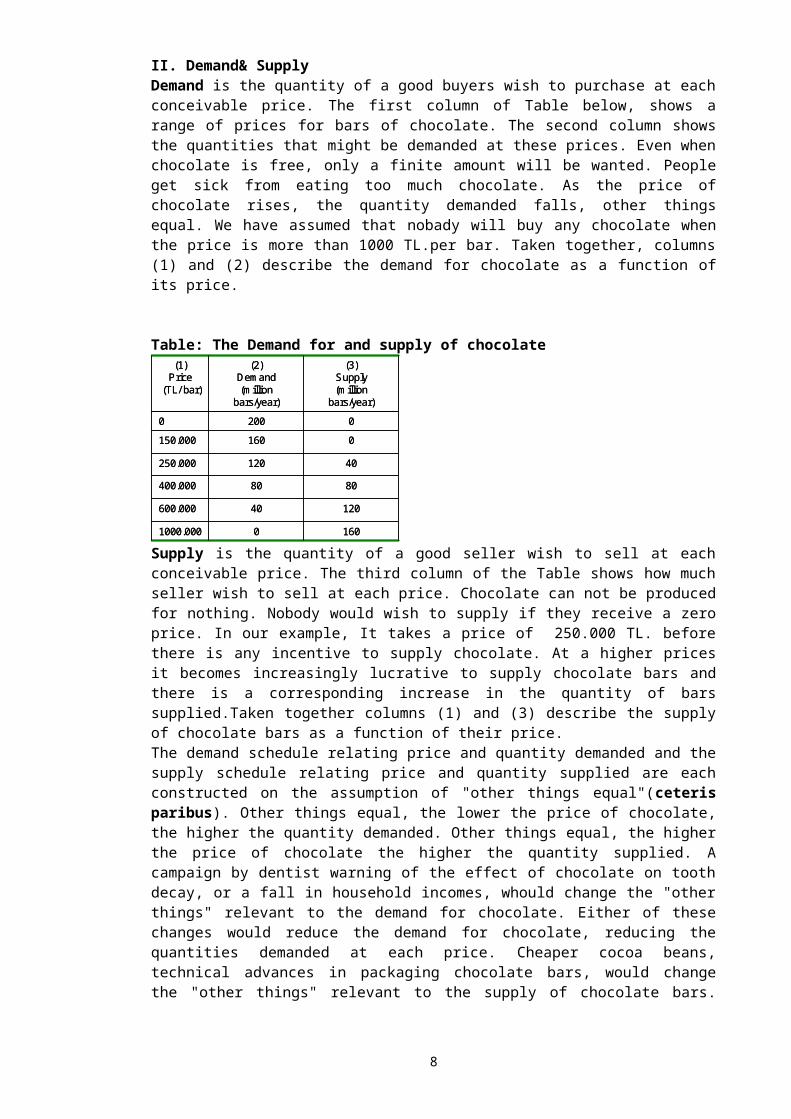
II. Demand& Supply Demand is the quantity of a good buyers wish to purchase at eachconceivable price. The first column of Table below, shows arange of prices for bars of chocolate. The second column showsthe quantities that might be demanded at these prices. Even whenchocolate is free, only a finite amount will be wanted. Peopleget sick from eating too much chocolate. As the price ofchocolate rises, the quantity demanded falls, other thingsequal. We have assumed that nobady will buy any chocolate whenthe price is more than 1000 TL.per bar. Taken together, columns(1) and (2) describe the demand for chocolate as a function ofits price.
Table: The Demand for and supply of chocolate
16001000.000
12040600.000
8080400.000
40120250.000
0160150.00002000
(3)Supply(m illion
bars/year)
(2)Dem and(m illion
bars/year)
(1)Price
(TL/ bar)
16001000.000
12040600.000
8080400.000
40120250.000
0160150.00002000
(3)Supply(m illion
bars/year)
(2)Dem and(m illion
bars/year)
(1)Price
(TL/ bar)
Supply is the quantity of a good seller wish to sell at eachconceivable price. The third column of the Table shows how muchseller wish to sell at each price. Chocolate can not be producedfor nothing. Nobody would wish to supply if they receive a zeroprice. In our example, It takes a price of 250.000 TL. beforethere is any incentive to supply chocolate. At a higher pricesit becomes increasingly lucrative to supply chocolate bars andthere is a corresponding increase in the quantity of barssupplied.Taken together columns (1) and (3) describe the supplyof chocolate bars as a function of their price.The demand schedule relating price and quantity demanded and thesupply schedule relating price and quantity supplied are eachconstructed on the assumption of "other things equal"(ceterisparibus). Other things equal, the lower the price of chocolate,the higher the quantity demanded. Other things equal, the higherthe price of chocolate the higher the quantity supplied. Acampaign by dentist warning of the effect of chocolate on toothdecay, or a fall in household incomes, whould change the "otherthings" relevant to the demand for chocolate. Either of thesechanges would reduce the demand for chocolate, reducing thequantities demanded at each price. Cheaper cocoa beans,technical advances in packaging chocolate bars, would changethe "other things" relevant to the supply of chocolate bars.
8
They would tend to increase the supply of chocolate bars,increasing the quantity supplied at each possible price.
III. The Market and Equilibrium PriceFor the moment, we assume that all these other things remainconstant. We combine the behavior of buyers and sellersdescribed in the Table to model how the market for chocolatebars would actually work. At low prices, the quantity demandedexceeds the quantity supplied but the reverse is true at highprice. At some intermadiate price, which we call the"equilibrium price" the quantity demanded just equal thequantity supplied. The equilibrium price clears the market for chocolate It is theprice at which the quantity supplied equals the quantity demanded. Table showsthat the equilibrium price is 400.000TL=80 million bars per yearis the quantity buyers wish to buy and sellers wish to sell atthis price. We call 80 million bars per year the equilibriumquantity. At prices below 400.000 TL. the quantity demandedexceeds the quantity supplied, and some buyers will befrustrated.There is a shortage: what we call excess demand. Youwill realize that when economists say there is excess demandthey are using a convenient shorthand for the more complicatedexpression: the quantity demanded exceeds the quantity suppliedat this price. Conversely, at any price above 400.000TL. thequantity supplied exceeds the quantity demanded. Sellers will beleft with unsold stock. To describe this surplus, economists usethe sorthand excess supply, it being understood that this meansexcess in the quantity supplied at this price. Is the market for chocolate bars automatically in equilibrium?If so, what bring this about ? Suppose the price of chocolate isinitially 1000.000TL, higher than the equilibrium price,Producers wish to sell 160 million bars per year but nobodywishes to buy at this price. To recoup the money spent inproducing chocolate, seller have to cut the price to clear theirstock. Cutting the price to 600.000 TL. has two effects: Itincreases the quantity demanded to 40 million bars per year andit reduces the quantity producers wish to supply to 120 millionbars per year. Both effects reduce the excess supply. Theprocess of price cutting will continue until the equilibriumprice of 400.000 TL. is reached and excess supply has beeneliminated. At this price the market clears.When the price liesbelow the equilibrium price the process works in reverse. Inthis sense, market are self correcting.
IV.Demand and Supply CurveTable shows demand and supply conditions in the chocolate marketand allows us to find the equilibrium price and quantity. It is
9
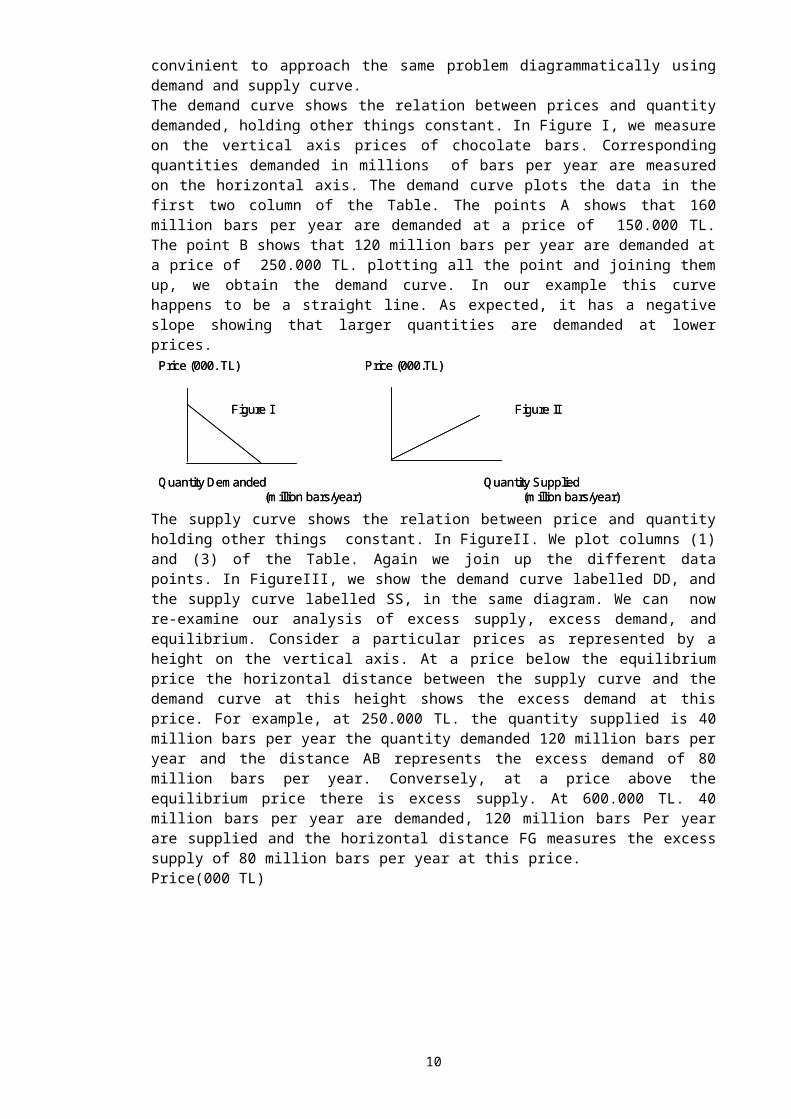
convinient to approach the same problem diagrammatically usingdemand and supply curve.The demand curve shows the relation between prices and quantitydemanded, holding other things constant. In Figure I, we measureon the vertical axis prices of chocolate bars. Correspondingquantities demanded in millions of bars per year are measuredon the horizontal axis. The demand curve plots the data in thefirst two column of the Table. The points A shows that 160million bars per year are demanded at a price of 150.000 TL.The point B shows that 120 million bars per year are demanded ata price of 250.000 TL. plotting all the point and joining themup, we obtain the demand curve. In our example this curvehappens to be a straight line. As expected, it has a negativeslope showing that larger quantities are demanded at lowerprices.Price (000. TL) Price (000.TL)
Figure I Figure II
QuantityDem anded QuantitySupplied(m illion bars/year) (m illion bars/year)
Price (000. TL) Price (000.TL)
Figure I Figure II
QuantityDem anded QuantitySupplied(m illion bars/year) (m illion bars/year)
The supply curve shows the relation between price and quantityholding other things constant. In FigureII. We plot columns (1)and (3) of the Table. Again we join up the different datapoints. In FigureIII, we show the demand curve labelled DD, andthe supply curve labelled SS, in the same diagram. We can nowre-examine our analysis of excess supply, excess demand, andequilibrium. Consider a particular prices as represented by aheight on the vertical axis. At a price below the equilibriumprice the horizontal distance between the supply curve and thedemand curve at this height shows the excess demand at thisprice. For example, at 250.000 TL. the quantity supplied is 40million bars per year the quantity demanded 120 million bars peryear and the distance AB represents the excess demand of 80million bars per year. Conversely, at a price above theequilibrium price there is excess supply. At 600.000 TL. 40million bars per year are demanded, 120 million bars Per yearare supplied and the horizontal distance FG measures the excesssupply of 80 million bars per year at this price.Price(000 TL)
10
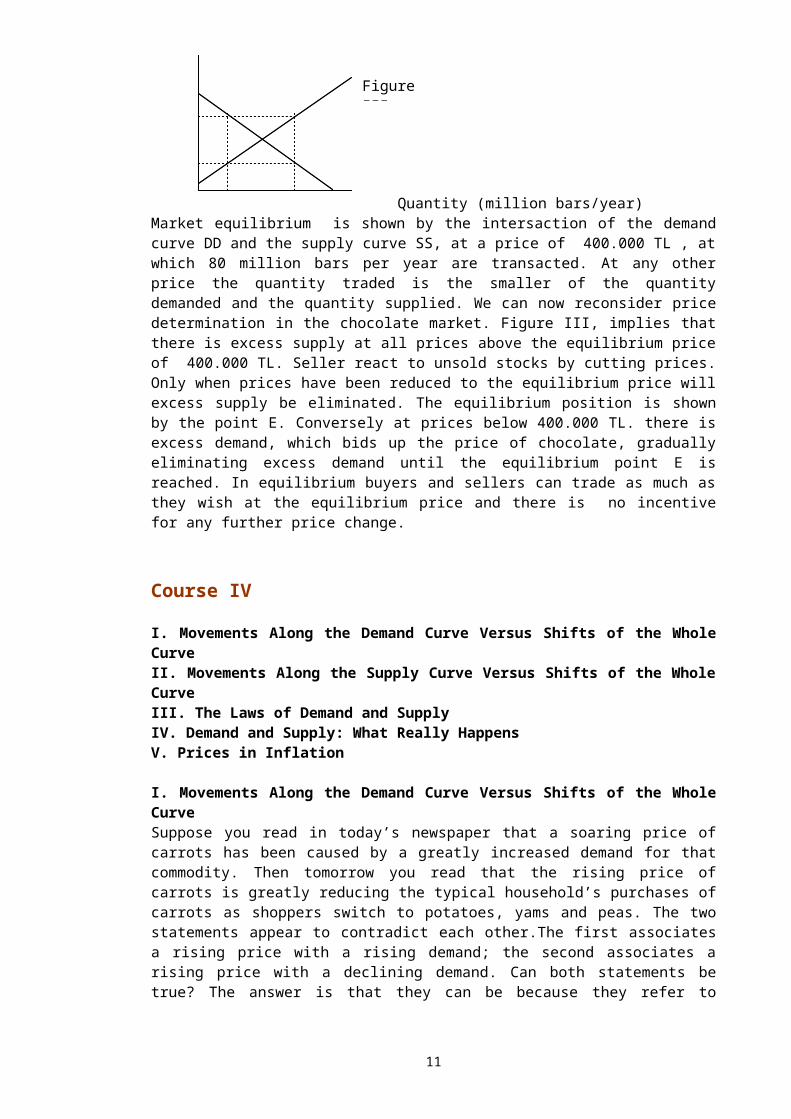
Quantity (million bars/year)Market equilibrium is shown by the intersaction of the demandcurve DD and the supply curve SS, at a price of 400.000 TL , atwhich 80 million bars per year are transacted. At any otherprice the quantity traded is the smaller of the quantitydemanded and the quantity supplied. We can now reconsider pricedetermination in the chocolate market. Figure III, implies thatthere is excess supply at all prices above the equilibrium priceof 400.000 TL. Seller react to unsold stocks by cutting prices.Only when prices have been reduced to the equilibrium price willexcess supply be eliminated. The equilibrium position is shownby the point E. Conversely at prices below 400.000 TL. there isexcess demand, which bids up the price of chocolate, graduallyeliminating excess demand until the equilibrium point E isreached. In equilibrium buyers and sellers can trade as much asthey wish at the equilibrium price and there is no incentivefor any further price change.
Course IV
I. Movements Along the Demand Curve Versus Shifts of the WholeCurveII. Movements Along the Supply Curve Versus Shifts of the WholeCurve III. The Laws of Demand and SupplyIV. Demand and Supply: What Really HappensV. Prices in Inflation
I. Movements Along the Demand Curve Versus Shifts of the WholeCurveSuppose you read in today’s newspaper that a soaring price ofcarrots has been caused by a greatly increased demand for thatcommodity. Then tomorrow you read that the rising price ofcarrots is greatly reducing the typical household’s purchases ofcarrots as shoppers switch to potatoes, yams and peas. The twostatements appear to contradict each other.The first associatesa rising price with a rising demand; the second associates arising price with a declining demand. Can both statements betrue? The answer is that they can be because they refer to
11
Figure III
different things. The fist describes a shift in the demandcurve; the second describes a movement along a demand curve inresponse to a change in price.Consider first the statement that the increase in the price ofcarrots has been caused by an increased demand for carrots. Thisstatement refers to a shift in the demand curve for carrots. Inthis case the demand curve must have shifted to the right,indicating more carrots demanded at each price. This shift willincrease the price of carrots.Now consider the statement that fewer carrots are being boughtbecause carrots have become more expensive. This refers to amovement along a given demand curve and reflects a changebetween two specific quantities being bought, one before theprice rose and one afterward. So what lay behind the two stories might have been somethinglike the following;1) A rise in the population is shifting the demand curve for
carrots to the right as more and more demanded at each price.This in turn is raising the price of carrot. This was thefist newspaper story.
2) The rising price of carrots is causing each individualhousehold to cut back on its purchase of carrots. This causesa movement upward to the left along any particular demandcurve for carrots. This was the second newspaper story.
To prevent the typ of confusion caused by our two news paperstories economist have developed a specialized vacabulary todistinguish shift of curves from movements along curve. Economist reserve the term change in demand to describe a shift inthe whole curve, that is a change in the amount that will bebought at every price. Any one point on a demand curve representa spesific amount being bought at a specified price. Itrepresents, therefore a particular quantity demanded. A movementalong a demand curve is refered to as a change in the quantitydemanded.
II. Movements Along the Supply Curve Versus Shifts of the WholeCurve As with demand, it is important to distinguish movements alongthe supply curves from shifts of the whole curve. The termchange in supply is reserved for a shift of the whole supply curve.This means a change in the quantity supplied at each price ofthe commodity. A movement along the supply curve indicates achange in the quantity supplied in response to a change in theprice of the commodity. Thus an increase in supply means thatthe whole supply curve has shifted to the right; an increase inthe quantity supplied means a movements upward to the rightalong a given supply curve.
12
III. The Law of Demand and SupplyChange in any of the variables other than price that influencequantity demanded or supplied will cause a shift in the supplycurve or the demand curve or both. There are four possibleshifts: 1) a rise in demand (a rightward shift in the demandcurve). 2) a fall in demand (a leftward shift in the demandcurve) 3) a rise in supply 4) a fall in supply.Each of these shifts causes changes that are described by one ofthe four "laws" of demand and supply. Each of the lawssummarizes what happens when an initial position of equilibriumis upset by some shift in either the demand or the supply curveand a new equilibrium position is then established. To discover the effects of each of the curve shifts that we wishto study, we use the method known comparative statics. We startfrom a position of equilibrium and then introduce the change tobe studied. The new equilibrium position is determined andcompared with the original one. The four laws of demand and supply are derived in the Figuresbelow, which generalizes our specific discussion (aboutcarrots.)
The laws of supply and demand are: 1) A rise in demand causes an increase in both the equilibriumprice and the equilibrium quantity exchanged.2) A fall in demand causes a decrease in both the equilibriumprice and the equilibrium quantity exchanged.3) A rise in supply causes a decrease in the equilibrium pricesand an increase in the equilibrium quantity exchanged.4)A fall in supply causes an increase in the equilibrium priceand a decrease in the equilibrium quantity exchanged.
We have studied many forces that can cause demand and supplycurves to shift. By combining this analysis with the four laws,we link many real world events that cause demand or supplycurves to shift with changes in market prices and quantities.The usefulness of this theory in interpreting what we see in theworld around us is further discussed.
IV.Demand and Supply: What Really HappensWhat Really Happens"The theory of supply and demand is neat enough", said theskeptic, "but tell me what really happens.""What really happens," said the economists "is that fist, demandcurves slope downward; second, supply curve slope upword; third,
13
prices rise in response to excess demand, and fourth, pricesfall in response to excess supply.""But that's theory", insisted the skeptic. "What about reality?""That is reality as well", said the economist."Show me" said the skeptic.The economist produced, the fallowing passages from articles inthe New York Times.
*** Increased demand for macademia nuts causes price to rise abovecompeting nuts. Major producer now plans to double the size ofits orchards during the next five years.
***OPEC countries once again fail to agree on output quotas. Outputsoars and price plummet.
***Last summer, Rhode Island officials reopened the northern sideof Narragansett Bay, a 9500-acre fishing ground that had beenclosed since 1978 because of pollution. Suddenly clam pricesdropped, thanks to an underwater population explosion that hadtransformed the Narragansett area in to a clam harvester'sdream.
***Increasing third world agricultural production threatens thestability of American agriculture, In the 1970's American farmprosperity was built on rising demand due to world prosperityand on falling output in Eastern Europe. Farm experts now, worrythat the prosperity will prove fragile in the face of majorincreases in world output.
***The effects of (the fist year of) deregulation of the nation'sairlines were spectacular: cuts in air fares of up to 70 percentin some cases, record passanger jam-ups at the airports, andspectacular increase in the average load factor (the proportionof occupied seats on average commercial flight.)
***The skeptic's response is not recorded, but you will have notrouble telling which of the economist's four statements about"what really happens."
V. Prices in InflationUp to now, we have developed the theory of the prices ofindividual commodities under the assumption that all otherprices remained constant. Does this mean that the theory is inapplicable to an inflationary world when almost all prices arerising? Fortunately the answer is no.The key lies in what are called relative prices. We havementioned several times that what metters for demand and supply
14
is the price of the commodity in question relative to the pricesof other commodities. This is called a relative price.In an inflationary world we are often interested in the price ofa given commodity as it relates to the average price of allother commodities. If during a period when the general pricelevel rose by 40 percent, the price of carrots rose by 60percent, then the price of carrots rose relative to the pricelevel as a whole. Carrots became relatively expensive. However,if carrots had risen in price by only 30 percent, when thegeneral price level rose by 40 percent then the relative priceof carrots would have fallen. Although the money price ofcarrots rose substantially, carrots became relatively cheap. In price theory, whenever we talk of a change in the price ofone commodity, we mean a change relative to other price. If the price level is constant, this change, requires only thatthe money price of the commodity in question should rise If theprice level is itself rising, this change requires that themoney price of the commodity in question should rise faster thanthe price level.We have been analyze a change in a particular price in thecontext of a constant price level. The analysis easily extendedto an iflationary peirod. By remembering that any force thatraises the price of one commodity when other price remainconstant will, given general inflation raise the price thatcommodity faster than the price level is rising. For example achange in tastes in favor of carrots that would raise theirprice by 20 percent when other price were constant, would raisetheir price by 32 percent if at the same time the general pricelevel goes up by 10 percent . In each case the price of carrotsrises 20 percent relative to the average of all price.
Course V
I. Price Elasticity of DemandII. Price Elasticity and Changes in Total ExpenditureIII. What Determines Elasticity of Demand?IV. Cross Elasticity of DemandV. Income Elasticity of DemandVI. What Determines Income Elasticity?VII.Elasticity of Supply
I. Price Elasticity of DemandElasticity of demand is the measure of responsiveness ofquantity demanded to price changes.
15
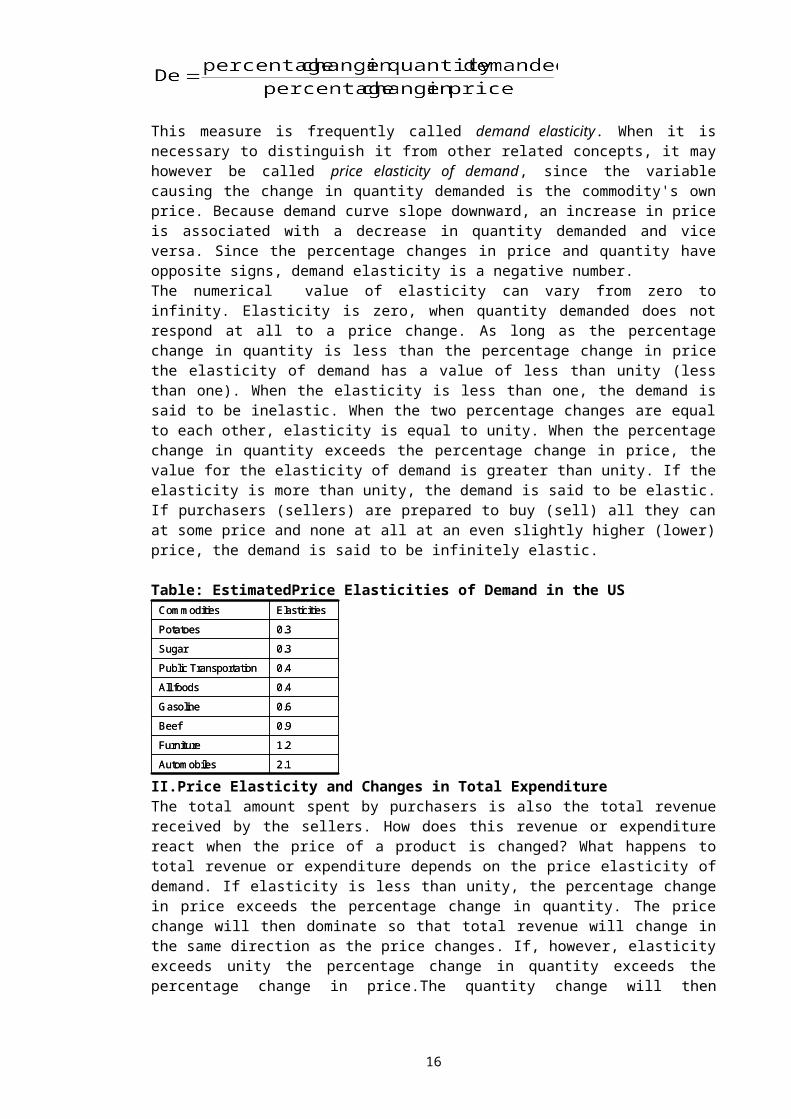
This measure is frequently called demand elasticity. When it isnecessary to distinguish it from other related concepts, it mayhowever be called price elasticity of demand, since the variablecausing the change in quantity demanded is the commodity's ownprice. Because demand curve slope downward, an increase in priceis associated with a decrease in quantity demanded and viceversa. Since the percentage changes in price and quantity haveopposite signs, demand elasticity is a negative number.The numerical value of elasticity can vary from zero toinfinity. Elasticity is zero, when quantity demanded does notrespond at all to a price change. As long as the percentagechange in quantity is less than the percentage change in pricethe elasticity of demand has a value of less than unity (lessthan one). When the elasticity is less than one, the demand issaid to be inelastic. When the two percentage changes are equalto each other, elasticity is equal to unity. When the percentagechange in quantity exceeds the percentage change in price, thevalue for the elasticity of demand is greater than unity. If theelasticity is more than unity, the demand is said to be elastic.If purchasers (sellers) are prepared to buy (sell) all they canat some price and none at all at an even slightly higher (lower)price, the demand is said to be infinitely elastic.
Table: EstimatedPrice Elasticities of Demand in the US
2.1Autom obiles1.2Furniture0.9Beef0.6Gasoline0.4Allfoods0.4PublicTransportation0.3Sugar0.3PotatoesElasticitiesCom m odities
2.1Autom obiles1.2Furniture0.9Beef0.6Gasoline0.4Allfoods0.4PublicTransportation0.3Sugar0.3PotatoesElasticitiesCom m odities
II.Price Elasticity and Changes in Total ExpenditureThe total amount spent by purchasers is also the total revenuereceived by the sellers. How does this revenue or expenditurereact when the price of a product is changed? What happens tototal revenue or expenditure depends on the price elasticity ofdemand. If elasticity is less than unity, the percentage changein price exceeds the percentage change in quantity. The pricechange will then dominate so that total revenue will change inthe same direction as the price changes. If, however, elasticityexceeds unity the percentage change in quantity exceeds thepercentage change in price.The quantity change will then
16
dominate so that total revenue will change in the same directionas quantity changes ( that is , in the opposite direction to thechange in price.)The general relations between elasticity and change in pricecan be summarized as follows:1.If demand is elastic, a fall in price increases total revenue and a rise in price reducesit.2.If deman is inelastic a fall in price reduces total revenue and a rise in price increasesit.3. If elasticity of demand is unity a rise or a fall in price leaves total revenue unaffacted.
III.What Determines Elasticity of Demand?The Table above, shows some measured elasticities of demand.Evidently, they can vary considerably. The main determanent ofelasticity is the availability of substitutes. Some commodities,such as margarine, cabbage, lamb have quite close substitutes-butter, other green vegetables, beef. A change in the price ofthese commodities, the price of substitutes remaining constant,can be expected to cause much substitution. A fall in priceleads consumers to buy more of the commodity and less of thesubstitutes, and a rise in price leads consumers to buy less ofthe commodities and more of the substitutes.A commodity withclose substitutes tend to have an elastic demand, one with noclose substitutes an inelastic demand.The degree of response to a price change, and thus the measuredprice elasticity of demand, will tend to be greater the longerthe time span considered, as well.
IV.Cross Elasticity of DemandThe responsiveness of demand to changes in the prices of othercommodities is called cross elasticity of demand. Complementary goodssuch as cars and gasoline have negative cross elasticities. Alarge rise in the price of gasoline will lead to a decline inthe demand for cars as some people decided to do without a carand others decided not to buy a second car. Substitutecommodities such as car and public transport, have positivecross elasticities. A large rise in the price of cars (relativeto public transport) would lead to a rise in the demand forpublic transport as some people shifted from cars to publictransport.
V.Income Elasticity of Demand One of the most determinants of the demand is the income of thepotantial customers. The responsiveness of demand to changes inincome is termed income elasticity of demand.
17
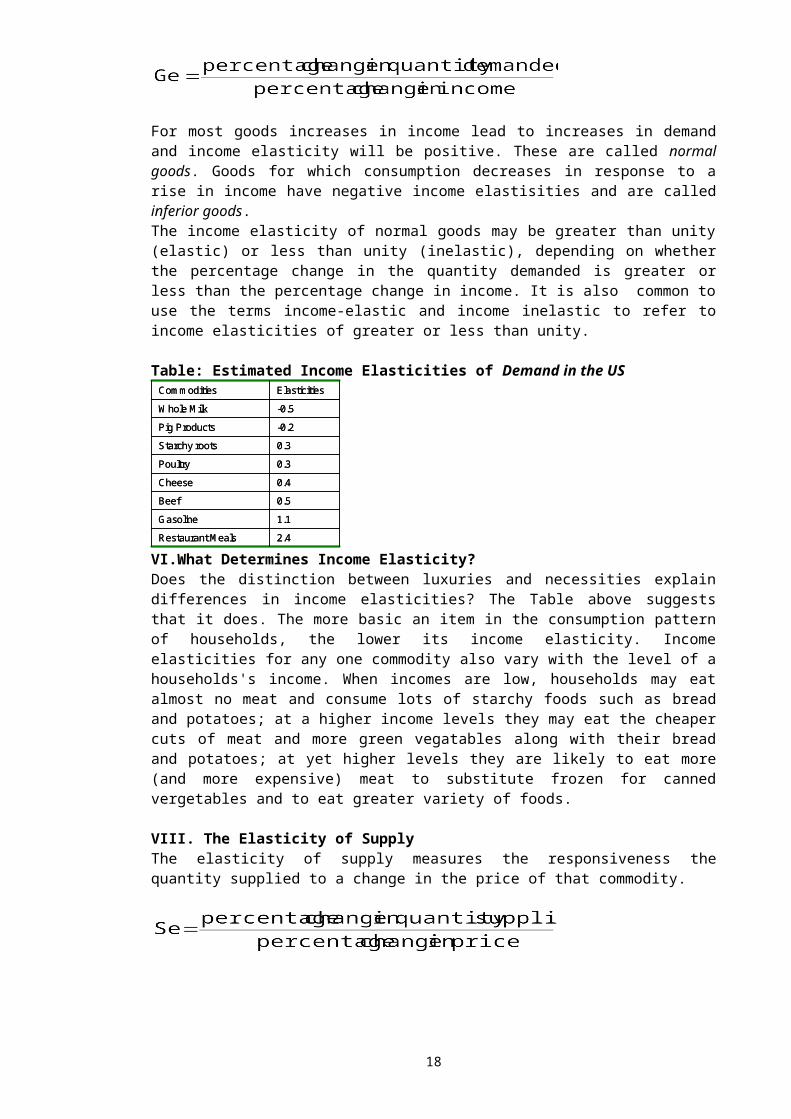
For most goods increases in income lead to increases in demandand income elasticity will be positive. These are called normalgoods. Goods for which consumption decreases in response to arise in income have negative income elastisities and are calledinferior goods.The income elasticity of normal goods may be greater than unity(elastic) or less than unity (inelastic), depending on whetherthe percentage change in the quantity demanded is greater orless than the percentage change in income. It is also common touse the terms income-elastic and income inelastic to refer toincome elasticities of greater or less than unity.
Table: Estimated Income Elasticities of Demand in the US
2.4RestaurantM eals1.1Gasoline0.5Beef0.4Cheese0.3Poultry0.3Starchyroots-0.2Pig Products-0.5W hole M ilkElasticitiesCom m odities
2.4RestaurantM eals1.1Gasoline0.5Beef0.4Cheese0.3Poultry0.3Starchyroots-0.2Pig Products-0.5W hole M ilkElasticitiesCom m odities
VI.What Determines Income Elasticity?Does the distinction between luxuries and necessities explaindifferences in income elasticities? The Table above suggeststhat it does. The more basic an item in the consumption patternof households, the lower its income elasticity. Incomeelasticities for any one commodity also vary with the level of ahouseholds's income. When incomes are low, households may eatalmost no meat and consume lots of starchy foods such as breadand potatoes; at a higher income levels they may eat the cheapercuts of meat and more green vegatables along with their breadand potatoes; at yet higher levels they are likely to eat more(and more expensive) meat to substitute frozen for cannedvergetables and to eat greater variety of foods.
VIII. The Elasticity of SupplyThe elasticity of supply measures the responsiveness thequantity supplied to a change in the price of that commodity.
18
Because supply curves slope upwards, the elasticity of supply ispositive. As we move along a supply curve, positive pricechanges are associated with positive output changes. An increasein price causes an increase in quantity sold. The more elasticis supply the larger the percentage increase in quantitysupplied in response to a given percentage change in price. Thuselastic supply curves are relatively flat and inelastic supplycurves relatively steep.There are important special cases. If the supply curve isvertical, -the quantity suplied does not change as priceschanges- elasticity of supply is zero. A horizontal supply curvehas an infinitely high elasticity of supply: A small drop inprice would reduce the quantity producers are willing to supplyfrom an indefinetely large amount to zero.
Course VI
I. The Theory of Consumer ChoiceII. Total Utility& Marginal UtilityIII Diminishing Marginal UtilityIV. Maximizing UtilityV.Consumers’ Surplus, Diminishing Marginal Utility and DemandCurve
I. The Theory of Consumer ChoiceEarly economists, struggling with the problem of what determinesthe relative prices of commodities, encountered what they cameto call the paradox of value: Necessary commodities, such as waterhave prices that are low compared with prices of luxurycommodities, such as diamonds. Water is necessary to ourexistence, while diamons used as ornaments are frivolous andcould disappear from the face of the earth tomorrow withoutcausing any great loss. Does it not seem odd then, theseeconomists argued, that water is so cheap and diamonds are soexpensive? It took along time to resolve this apperent paradox,so it is not suprising that even today the confusion persistand in different forms clouds many current policy discussions.The key to resolving the apparent paradox lies in the importantdistinction between marginal and total utulity.
II.Total Utility& Marginal UtilityThe satisfaction someone receives from consuming commodities iscalled utulity.Total utility refers to the total satisfactionfrom consuming some commodity. For example, the total utility ofconsuming 10 units of any commodity is the total satisfaction
19
those 10 units provide. Marginal utility refers to the change insatisfaction resulting from consuming a little more or a littleless of the commodity. The marginal utulity of the tenth unitconsumed is the additional satisfaction provided by theconsumption of that unit, or in other words, the difference intotal utility gained by consuming 9 units and by consuming 10units. The significance of this distinction can be seen by consideringtwo questions: (1) If you had to give up consuming one of thefollowing commodities completely, which would you choose: wateror the movies? (2) If you had to pick one of the following,which would you choose: increasing your water consumption by 35gallons a month (the amount required for an average bath) orattending one more movie a month?In (1) you are comparing the value you place on your totalconsumption of water with the value you place on all yourattendance at the movies. You are compering the total utility ofyour water consumption with the total utility of your movieattendance. There is little doubt that everyone would answer (1)in the same way revealing that the total utility derived fromconsuming water exceeds the total utility derived from attendingthe movies.In (2) you are compering the value you place on a small additionto your water consumption with the value you place on a smalladdition to your movie attendances. You are compering yourmarginal utility of water with your marginal utility of movies.In responding to (2), some might select the extra movie; othersmight select the extra water. Furthermore, their choice woulddepend on whether it was made at a time when water was plentifulso that they placed a low value on obtaining a little additionalwater. (low marginal utility of water) or when water wasscarce, so that they might put quite high value on obtaining alittle more water. (high marginal utility of water)Choices of type (1) are encountered much less commonly than arechoices of type (2). If our income rises a little, we have todecide to have some more of one thing or another. If we findthat we are overspending or if our income falls, we have todecide what to cut down on. Do we have a little less of this ora little less of that?Real choices are rarely conditioned by total utilities; it ismarginal utilities that are relevant to choices concerning alittle more or a little less.Now cosidering marginal utility approach, to understand the caseof water and diamonds, remember that water is cheap becausethere is enough of it that people consume it to the point atwhich its marginal utility is low, they are not prepared to paya high price to obtain a little more of it. Diamond are
20
expensive because they are scarce (the owners of diamond mineskeep diamonds scarce by limiting output) and those who buy themhave to stop at a point where marginal utility is still high;they are prepared to pay a high price for an additional diamond.
III. Diminishing Marginal UtilityThe basic hypothesis of utility theory, sometimes called the lawof of diminishing marginal utulity, is:The utility any household derives from successive units of aparticular commodity diminishes as total consumption of thecommodity increases while the consumption of all othercommodities remains constant.Consider water once again some minimum quantity is essential tosustain life, and a person would , if necessary, give up all hisor her income to obtain that quantity of water. Thus themarginal utility of that much water is extremely high. More thanthis bare minimum will be drunk, but the marginal utility ofsuccessive glasses of water drunk over a period will declinesteadily.How much money would induce you to cut your consumption of waterby one glass per week? The answer is very little. How much wouldinduce you to cut it by a second glass? By a third glass? Toonly one glass consumed per week? The aswer to the lastquaestion is quite bit. The fewer glasses you are consumingalready, the higher the marginal utility of one more or lessglass of water.
IV. Maximizing UtilityA basic assumption of the economic theory of household behaviouris that household try to make themselves as well off as theypossibly can in the circumtances in which they find themselves.In other words, the members of a household seek to maximizetheir total utility. How can household adjust its expenditure so as to maximize thetotal utility of its members? The household maximizing its utility will allocate itsexpenditure among commodities so that the utility of the lastlira spent on each is equal.
This says that the household will allocate its expenditure sothat the utility gained from the last lira spent on eachcommodity is equal.
21
IV.Consumers' Surplus, Diminishing Marginal Utility and DemandCurveAssume that you would be willing to pay as much as 100TL. amonth for the amount of a commodity for 60TL. instaed of 100TL.What a bargain! You have paid 40TL. less than the top figure youwere willing to pay. Yet this sort of bargain is not rare; itoccurs every day in any economy where prices do the rationing.Indeed it is so common that the 40TL.saved in this example hasbeen given a name: consumers' surplus. Consumers' surplus is a direct consequence of diminisingmarginal utility. We can explain it with an example: If you weregetting no milk at all, how much would you be willing to pay forone glass per week? With no hasitation you might answer 300TL.We than ask: If you had already consumed that one galss how muchwould you pay for a second glass per week? After a bit ofthought you might answer 150TL. Adding one glass per week witheach question, we discover that you would be willing to pay100TL to get a third glass per week and 80TL., 60TL, 50TL, 40TL,30TL, 25 TL, and 20TL. for successive glasses per week. Theprogressively lower valuation on each additional glass of milkillustrates the general concept of diminising marginal utility. But you dont have to pay a different price for each glass ofmilk you consume each week. You can buy all the milk you want atthe prevailing market price. Suppose the price is 30 TL. Youwill buy eight glass per week, because you value the eight glassjust at the market price, while valuing all earlier glasses athigher amounts. Because you value the fist glass at 300 TL, butget it for 30, you make a "profit" of 270TL. on that glassBetween your 150TL valuation of second glass and what you haveto pay for it you clear a "profit" of 120TL. You clear 70 TL onthe third glass, and so on. These profit amounts are called yourconsumers' surpluses on each glass. (The total suplus is 570TL.per week.) The data in columns 1 and 2 of the Table below give your demancurve for milk It is your demand curve because, you will go onbuying glasses of milk as long as you value each glass at leastas much as the market price you must pay for it. When the marketprice is 300 TL. per glass you will buy only one glass when itis 150 TL., you will buy two glasses and so on. The totalvaluation is the area below your demand curve and consumers'surplus is that part of the area that lies above the price
Table: Consumers' Surplus on Milk Consumption by One Consumer
22
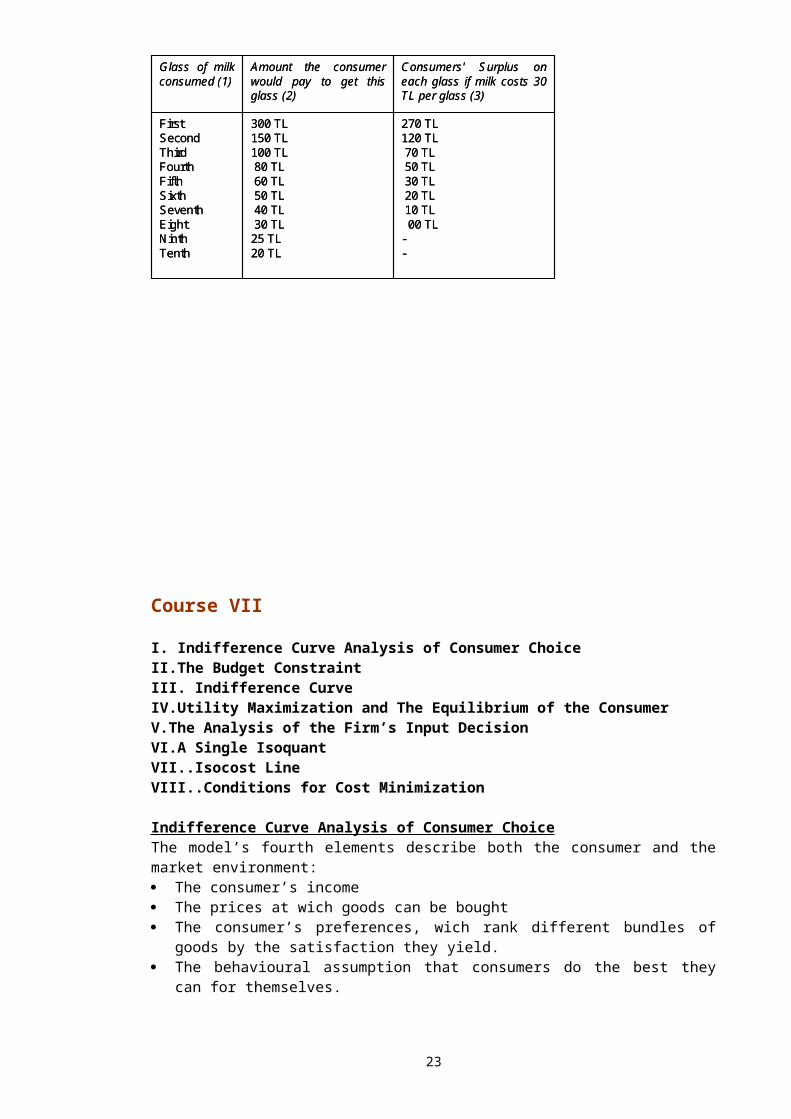
270 TL120 TL70 TL50 TL30 TL20 TL10 TL00 TL--
300 TL150 TL100 TL80 TL60 TL50 TL40 TL30 TL25 TL20 TL
FirstSecondThirdFourthFifthSixthSeventhEightNinthTenth
C onsumers' S urplus on each glass if milk costs 30 TL per glass (3)
Amount the consumerwould pay to get thisglass (2)
Glass of milkconsumed (1)
270 TL120 TL70 TL50 TL30 TL20 TL10 TL00 TL--
300 TL150 TL100 TL80 TL60 TL50 TL40 TL30 TL25 TL20 TL
FirstSecondThirdFourthFifthSixthSeventhEightNinthTenth
C onsumers' S urplus on each glass if milk costs 30 TL per glass (3)
Amount the consumerwould pay to get thisglass (2)
Glass of milkconsumed (1)
Course VII
I. Indifference Curve Analysis of Consumer ChoiceII.The Budget ConstraintIII. Indifference CurveIV.Utility Maximization and The Equilibrium of the ConsumerV.The Analysis of the Firm’s Input DecisionVI.A Single IsoquantVII..Isocost LineVIII..Conditions for Cost Minimization
Indifference Curve Analysis of Consumer ChoiceThe model’s fourth elements describe both the consumer and themarket environment: The consumer’s income The prices at wich goods can be bought The consumer’s preferences, wich rank different bundles of
goods by the satisfaction they yield. The behavioural assumption that consumers do the best they
can for themselves.
23
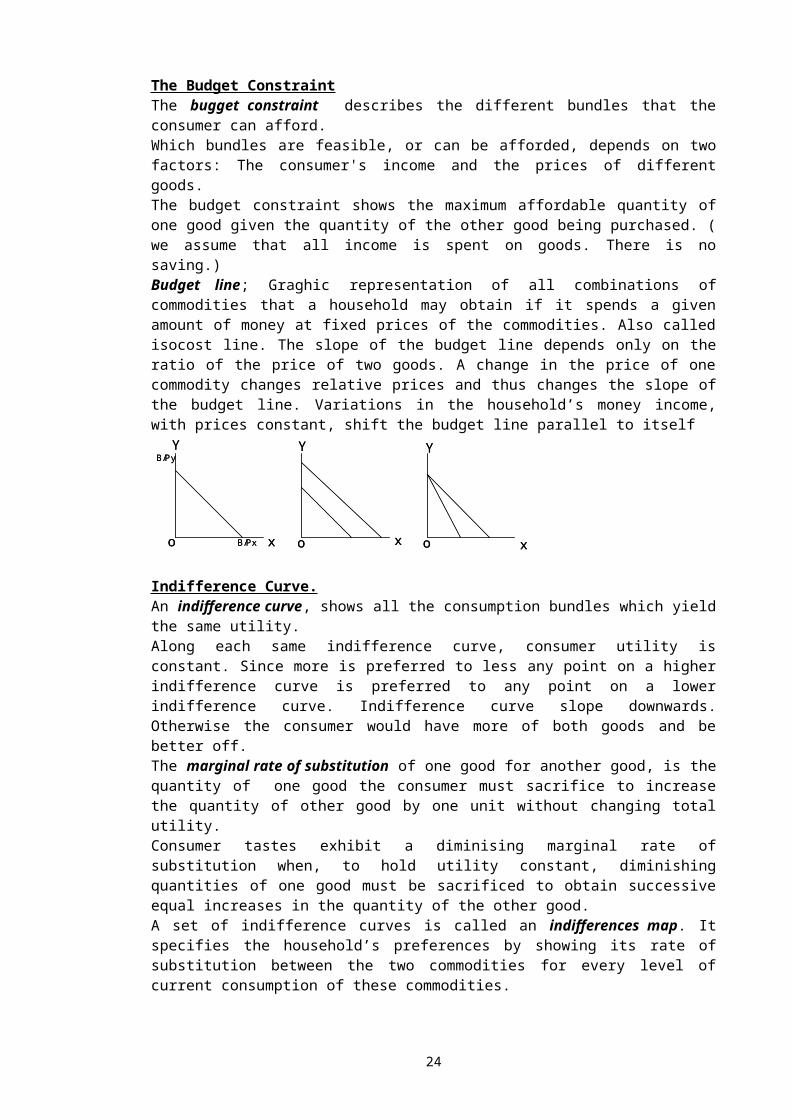
The Budget ConstraintThe bugget constraint describes the different bundles that theconsumer can afford.Which bundles are feasible, or can be afforded, depends on twofactors: The consumer's income and the prices of differentgoods.The budget constraint shows the maximum affordable quantity ofone good given the quantity of the other good being purchased. (we assume that all income is spent on goods. There is nosaving.)Budget line; Graghic representation of all combinations ofcommodities that a household may obtain if it spends a givenamount of money at fixed prices of the commodities. Also calledisocost line. The slope of the budget line depends only on theratio of the price of two goods. A change in the price of onecommodity changes relative prices and thus changes the slope ofthe budget line. Variations in the household’s money income,with prices constant, shift the budget line parallel to itself
Y Y Y
x x xo o o
B/Py
B/Px
Y Y Y
x x xo o o
B/Py
B/Px
Indifference Curve.An indifference curve, shows all the consumption bundles which yieldthe same utility.Along each same indifference curve, consumer utility isconstant. Since more is preferred to less any point on a higherindifference curve is preferred to any point on a lowerindifference curve. Indifference curve slope downwards.Otherwise the consumer would have more of both goods and bebetter off. The marginal rate of substitution of one good for another good, is thequantity of one good the consumer must sacrifice to increasethe quantity of other good by one unit without changing totalutility.Consumer tastes exhibit a diminising marginal rate ofsubstitution when, to hold utility constant, diminishingquantities of one good must be sacrificed to obtain successiveequal increases in the quantity of the other good.A set of indifference curves is called an indifferences map. Itspecifies the household’s preferences by showing its rate ofsubstitution between the two commodities for every level ofcurrent consumption of these commodities.
24
Y Y
x xo o
B/Py
X1 X2
Y1
Y2
A
B I3I2
I1
Y Y
x xo o
B/Py
X1 X2
Y1
Y2
A
B I3I2
I1
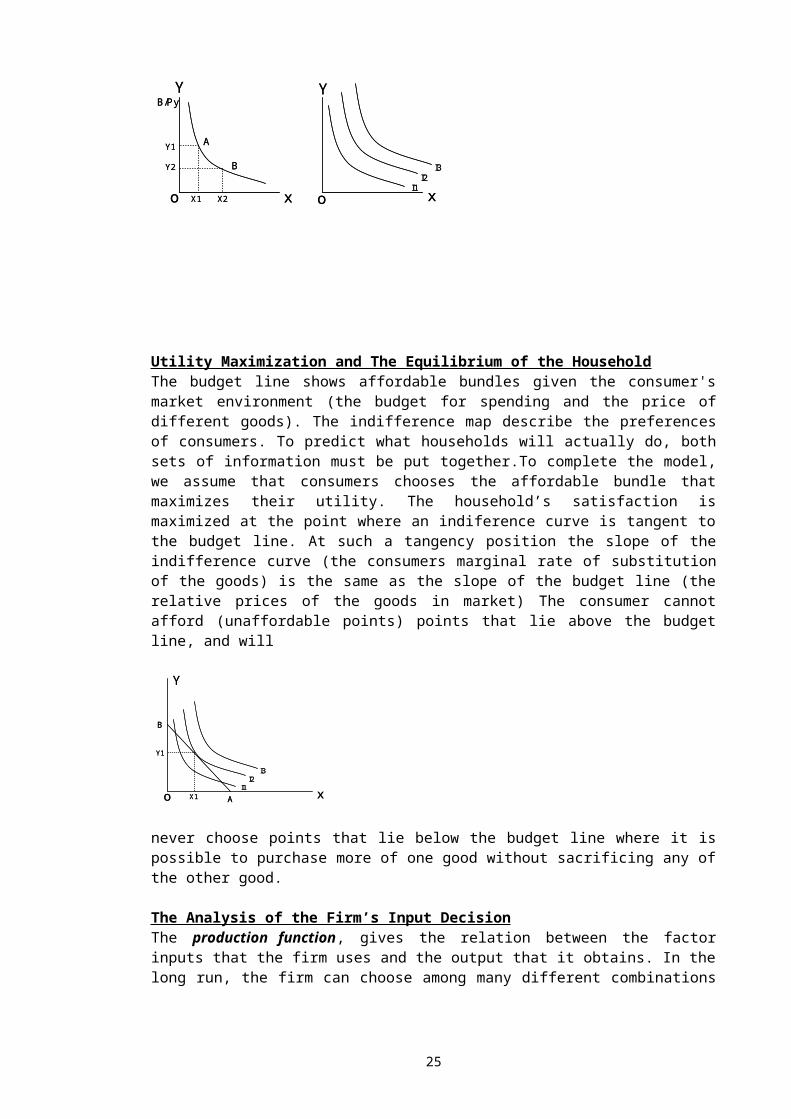
Utility Maximization and The Equilibrium of the HouseholdThe budget line shows affordable bundles given the consumer'smarket environment (the budget for spending and the price ofdifferent goods). The indifference map describe the preferencesof consumers. To predict what households will actually do, bothsets of information must be put together.To complete the model,we assume that consumers chooses the affordable bundle thatmaximizes their utility. The household’s satisfaction ismaximized at the point where an indiference curve is tangent tothe budget line. At such a tangency position the slope of theindifference curve (the consumers marginal rate of substitutionof the goods) is the same as the slope of the budget line (therelative prices of the goods in market) The consumer cannotafford (unaffordable points) points that lie above the budgetline, and will
Y
xo X1 A
I3I2
I1
Y1
B
Y
xo X1 A
I3I2
I1
Y1
B
never choose points that lie below the budget line where it ispossible to purchase more of one good without sacrificing any ofthe other good.
The Analysis of the Firm’s Input DecisionThe production function, gives the relation between the factorinputs that the firm uses and the output that it obtains. In thelong run, the firm can choose among many different combinations
25
of inputs that will yield the same output. The productionfunction and the choices open to the firm can be representedgraphically using the concept of an isoquant.
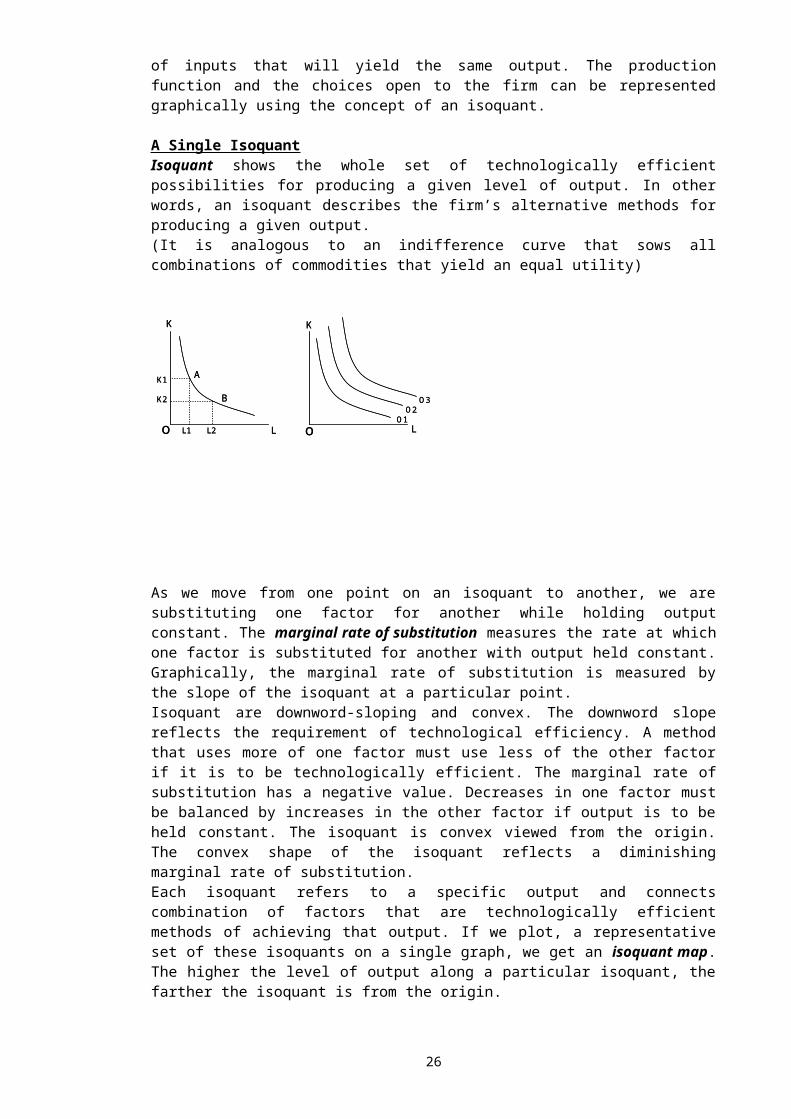
A Single IsoquantIsoquant shows the whole set of technologically efficientpossibilities for producing a given level of output. In otherwords, an isoquant describes the firm’s alternative methods forproducing a given output.(It is analogous to an indifference curve that sows allcombinations of commodities that yield an equal utility)
K K
L Lo oL1 L2
K1
K2
A
B O3O2
O1
K K
L Lo oL1 L2
K1
K2
A
B O3O2
O1
As we move from one point on an isoquant to another, we aresubstituting one factor for another while holding outputconstant. The marginal rate of substitution measures the rate at whichone factor is substituted for another with output held constant.Graphically, the marginal rate of substitution is measured bythe slope of the isoquant at a particular point.Isoquant are downword-sloping and convex. The downword slopereflects the requirement of technological efficiency. A methodthat uses more of one factor must use less of the other factorif it is to be technologically efficient. The marginal rate ofsubstitution has a negative value. Decreases in one factor mustbe balanced by increases in the other factor if output is to beheld constant. The isoquant is convex viewed from the origin.The convex shape of the isoquant reflects a diminishingmarginal rate of substitution.Each isoquant refers to a specific output and connectscombination of factors that are technologically efficientmethods of achieving that output. If we plot, a representativeset of these isoquants on a single graph, we get an isoquant map.The higher the level of output along a particular isoquant, thefarther the isoquant is from the origin.
26
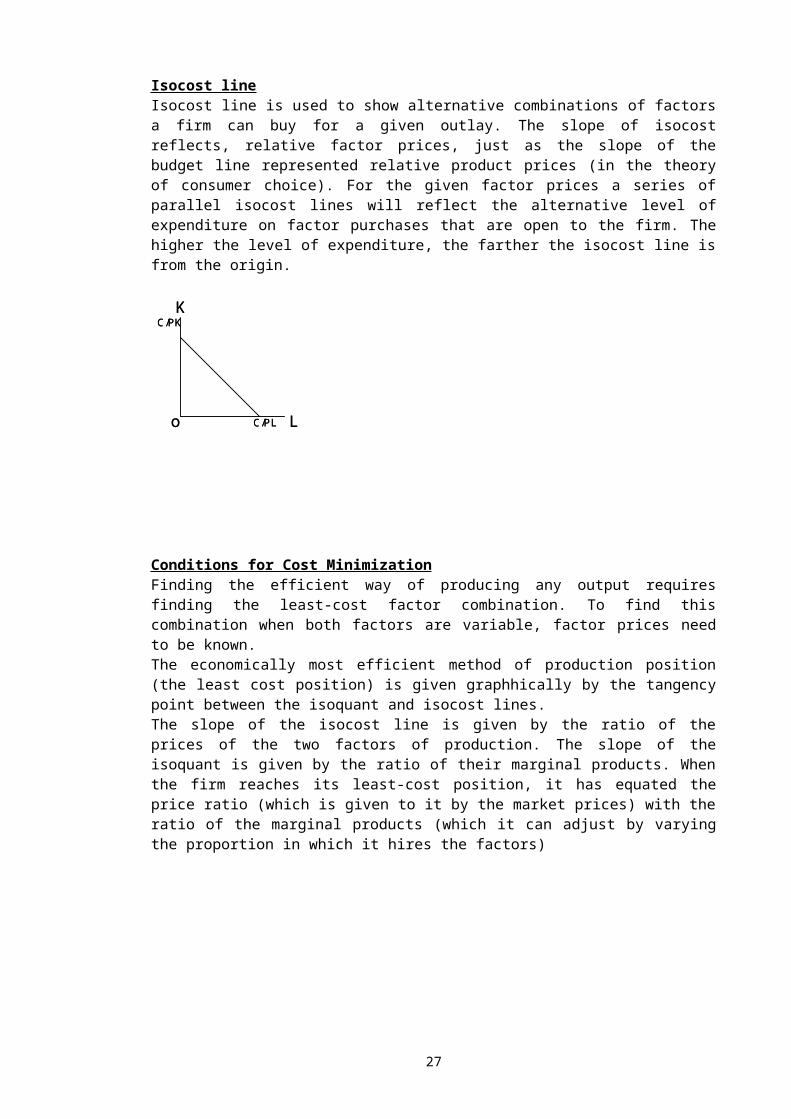
Isocost lineIsocost line is used to show alternative combinations of factorsa firm can buy for a given outlay. The slope of isocostreflects, relative factor prices, just as the slope of thebudget line represented relative product prices (in the theoryof consumer choice). For the given factor prices a series ofparallel isocost lines will reflect the alternative level ofexpenditure on factor purchases that are open to the firm. Thehigher the level of expenditure, the farther the isocost line isfrom the origin.
K
Lo
C/PK
C/PL
K
Lo
C/PK
C/PL
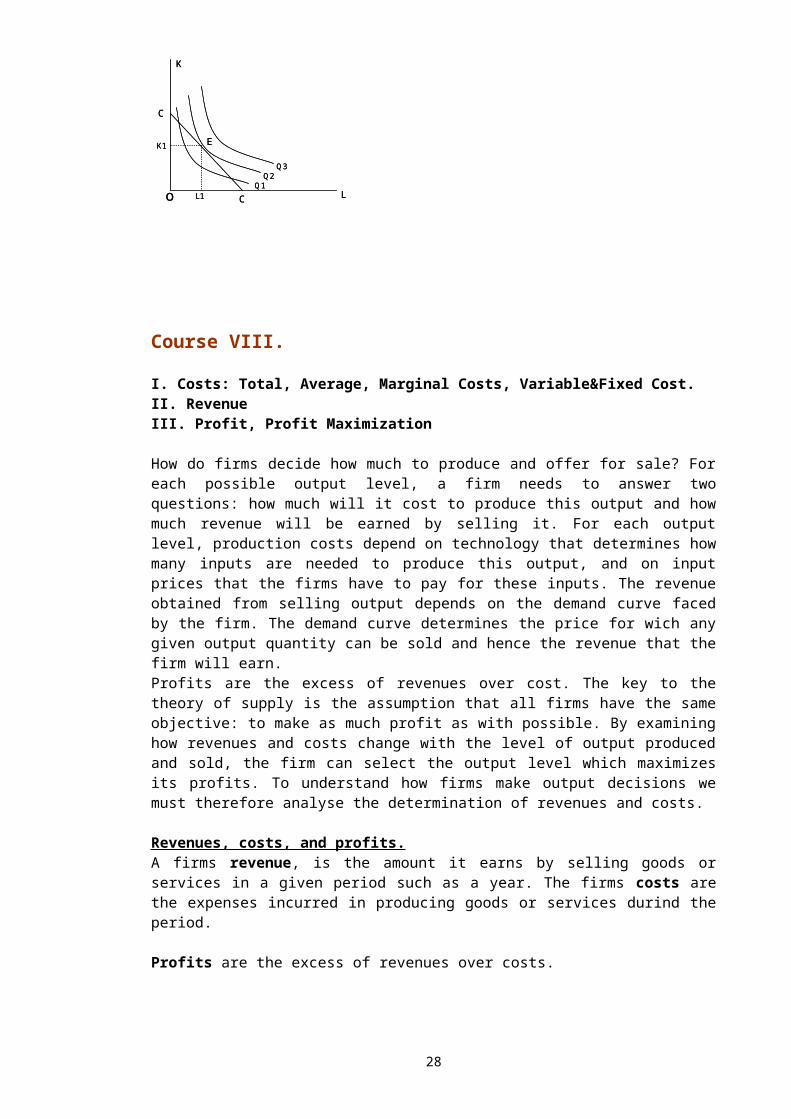
Conditions for Cost MinimizationFinding the efficient way of producing any output requiresfinding the least-cost factor combination. To find thiscombination when both factors are variable, factor prices needto be known. The economically most efficient method of production position(the least cost position) is given graphhically by the tangencypoint between the isoquant and isocost lines. The slope of the isocost line is given by the ratio of theprices of the two factors of production. The slope of theisoquant is given by the ratio of their marginal products. Whenthe firm reaches its least-cost position, it has equated theprice ratio (which is given to it by the market prices) with theratio of the marginal products (which it can adjust by varyingthe proportion in which it hires the factors)
27
K
Lo L1 C
Q 3Q 2
Q 1
K1
C
E
K
Lo L1 C
Q 3Q 2
Q 1
K1
C
E
Course VIII.
I. Costs: Total, Average, Marginal Costs, Variable&Fixed Cost.II. RevenueIII. Profit, Profit Maximization
How do firms decide how much to produce and offer for sale? Foreach possible output level, a firm needs to answer twoquestions: how much will it cost to produce this output and howmuch revenue will be earned by selling it. For each outputlevel, production costs depend on technology that determines howmany inputs are needed to produce this output, and on inputprices that the firms have to pay for these inputs. The revenueobtained from selling output depends on the demand curve facedby the firm. The demand curve determines the price for wich anygiven output quantity can be sold and hence the revenue that thefirm will earn. Profits are the excess of revenues over cost. The key to thetheory of supply is the assumption that all firms have the sameobjective: to make as much profit as with possible. By examininghow revenues and costs change with the level of output producedand sold, the firm can select the output level which maximizesits profits. To understand how firms make output decisions wemust therefore analyse the determination of revenues and costs.
Revenues, costs, and profits.A firms revenue, is the amount it earns by selling goods orservices in a given period such as a year. The firms costs arethe expenses incurred in producing goods or services durind theperiod.
Profits are the excess of revenues over costs.
28
Cost, to the producing firm, is the value of inputs used inproducing its outputs.Total cost (TC), is the total cost of producing any given levelof output. Total cost is diveded into two parts; total fixedcost (TFC), total variable cost (TVC). A fixed cost is one that does not vary with output; it will bethe same if output is 1 unit or one million units. Such a costis also refered as an overhead costs or unavoidable cost. A costthat varies directly with output, rising as more is produced andfalling as less is produced, is called a variable costs (also adirect or avoidable cost).
Avarega total cost (ATC), also called averega cost is the totalcost of producing any given output divided by that output.Average total cost may be divided into average fixed cost (AFC)and average variable cost (AVC) in the same way that total costswere.Although average variable costs may rise or fall as productionis increased (depending on whether output rises more rapidly ormore slowly than total variable costs), it is clear that averagefixed costs decline continuously as output increases. A doublingof output always leads to a halving of fixed costs per unit ofoutput. This is a process popularly known as spreading one'soverhead.
Marginal cost (MC), is the increase in total cost resulting fromraising the rate of production by one unit. Because fixed costdon't vary with otput marginal fixed costs are always zero.Therefore marginal cost are necessarily marginal variable costs,and a change in fixed costs will leave marginal costsunaffected. For example, the marginal cost of producing a fewmore potatoes by farming a given amount of land more intensivelyis the same, whatever the rent paid for the land.
Marginal cost is the increase in total cost when output isincreased by 1 unit. Marginal revenue is the increase in totalrevenue when output is increased by 1 unit (when an additionalunit of output is sold).
Firms have costs even when no output is produced. This costincludes the expenses of being in bussiness at all runing anoffice, renting a telephone and so on. Thereafter, cost risewith the level of production. Total cost of production is higherthe more is produced. At the begining costs rise quite slowly asoutput rises. At high levels of output, costs rise sharply asoutput increases.
29
Profit Maximization&Cost MinimizationEconomist assume that firms make supply and output decisions soas to make as much money as possible, in other words to maximizeprofits.Any firm maximizing profits certainly wants to produce itschosen output level at the minimum possible costs. Otherwise, byproducing the same output at lower cost it could increaseprofits. Thus a profit maximizing firm must produce its outputat minimum cost.
Economies and Diseconomies of ScaleThere are economies of scale (or increasing return to scale),when long run average costs decrease as output rises. There arediseconomies of scale (or decreasing return to scale) when longrun average costs increase as output rises. In thesedefinitions, scale refers to the size of the firm as measured byits output.There are some reasons for economies of scale. The first isindivisibilities in the production process, some minimumquantity of inputs required by the firm to be in business atallwhether or not output is produced. These are called fixedcosts, because they don’t vary with the output level. To be inbusiness a firm requires a manager, a telephone, an accountant,a market research survey. The firm can not have half a managerand half a telephone merely because it wishes to operate at lowoutput levels. Begining from small output levels, these costdon’t initially increase with output. The manager can organizethree workers as easly as two. As yet there is no need for asecond telephone. There economies of scale because these fixedcost can be spread over more units of output as output isincreased, reducing average cost per unit of output.
Sophisticated but expensive machinery also has an element ofindivisibilty. No matter how productive a robot assembly lineis, it is pointless to install one to make five cars a week.However at high output levels the machinery cost spread over alarge number of units of output and this production techniquemay produce so many cars that average costs are low.
The second reason for economies of scale is specialisation. Asole trader must be undertake all the different tasks ofbusiness. As the firm expands and takes on more workers, eachworker can concentrate on a single task and handle it moreefficiently.
30
The main reason for diseconomies of scale is that managementbecomes more difficult as the firm become larger: there aremanagerial diseconomies of scale. The company becomesbureaucratic, coordination problems arise, and average cost maybegin to rise.
Geography may also explain diseconomies of scale. If the firstfactory is located in the best side, to minimize the cost oftransporting goods to the market, the site of a second factorymust be less advantageus. To take a different example inextracting coal from a mine, a firm will extract the easiestcoal first. To increase output deeper coal seams have to beworked and these will be more expensive.
Course IX
I. Market StructureII. Perfect Competitive MarketIII. MonoplyIV. Monopolistic CompetitionV. Oligopoly
Market StructureThe term market structure refers to all aspects of a market, suchas the number of firms and the type of product sold, that mayaffect the behavior and performance of the firms in that market.The structure of a market is a description of the behavior ofbuyers and sellers in that market.First it is useful to establish two benchmark cases, theopposite extremes between which all other types of marketstructure must lie. These limiting cases are perfect competition onthe one hand, monopoly on the other hand.A perfectly competitive market is one which both buyers andsellers believe that their own buying or selling decision haveno effect on the market price. A monopolist is the only selleror potential seller of the good in that industry.
Perfect Competitive Market, The extreme of competitiveness occurswhen each firm has zero power.In such a case there are so manyfirms that each must accept the price set by the forces ofmarket demand and supply. This extreme is called the perfectlycompetitive market structure. In it there is no need forindividual firms to compete actively with one another since nonehas any power over the market. One firm's ability to sell itsproduct does not depend on the behavior of any other firm.
31
Assumptions of Perfect Competition, The theory of perfect competitionis built on two critical assumptions, one about the behavior ofindividual firm and one about the nature of the industry inwhich it operates. (An industry is the set of all firms making thesame product.)The firm is assumed to be a price taker; A firm operating in a perfectly competitive market has no power to influence that market trough its own individual actions. It must passively accept whatever price happens to be ruling.The industry is assumed to be characterized by freedom of entryand exit; that is, any new firm is free to set up production ifit so wishes, and any existing firm is free to cease productionand leave the industry. Existing firms can not bar the entry ofnew firms, and there are no legal prohibitions on entry or exit.In a perfectly competitive economy there are many firms and manyhouseholds. Each is a price taker. No single firm and no singleconsumer has any power over the market. Individual consumers andproducers are quantity adjusters who respond to market signals.The perfectly competitive model is almost too good to be true.Because the market mechanism works, it is not necessary for thegovernment to intervene. Market reaction, not public policies,will eliminate shortages or surpluses. There is no need forregulatory agencies or bureaucrats to make arbitrary decisionsabout who may produce what, how to produce it, or how much it ispermissible to charge for the product. If there are nogovernment officials to make such decisions, there will be noone to bribe to make one decision rather than another.In the impersonal decision-making world of perfect competition,neither private firms nor public officials wield economic power.The market mechanism, like an invisible hand determines theallocation of resources among competing uses.
Monoply, The word monopoly comes from the Greek words, monospolein, which mean "alone to sell". It is convenient for now tothink of monopoly, as the situation in which the output of anentire industry is controlled by a single seller. This sellerwill be called the monopolist. Because the monopoly firm is theonly producer of a particular product, its demand curve isidentical with the demand curve for that product. The marketdemand curve, which shows the aggregate quantity that themonopolist will purchase at every price, also shows the quantitythat the monopolist will be able to sell at any price it sets.The importance of this is that the monopoly, unlike the firm inperfect competition, faces a downward-sloping demand curve. Thefirm therefore faces a trade-off between price and quantity:Sales can be increased only if price is reduced, while price canbe increased only if sales are reduced. A monopolists is the
32
sole supplier and the potantial supplier of the industry'sproduct. The firm and the industry coincide. A monopoly will persist only if entry of new firms does notoccur. Impediments that prevent entry are called entry barriers;they may be either natural or created. Natural barriers mostcommonly arise as a result of economies of scale. If the longrun average cost declines over a large range of output big firmswill have significantly lower average total cost than smallfirms. The cost to the new firm of entering the market,developing its product, and establising such things as its brandimage and its dealer network may be such that entry is renderedunprofitable.Barriers to entry may be created by the conscious action ofparticipants in some markets. Some are created by the governmentand are therefore condoned by it. Patent laws, for instance, mayprevent entry by conferring on the patent holder the sole rightto produce a particular commodity.
Cartels As Monopolies, A second way in which a monopoly can arise isfor the firms in an industry to agree to cooperate with oneanother, to behave as if they were a single firm, and thus toeliminate competitive behavior among themselves. Such a group offirm is called a cartel. A cartel that includes all of the firmsin the industry can behave in just the same way as would asingle firm monopoly that owned all of these firms. The firmscan agree among themselves to restrict their total output to thelevel that maximize their joint profits.
Monopolistic Competition ; The theory of monopolistic competitionwas developed in two famous books of the early 1930's one by theBritish economist Joan Robinson, the other by the Americaneconomist Edward Chamberlin.The market envisaged in this theory is similar to perfectcompetition in that there are many firms with relatively easyentry and exit. But it defers in one important respects; Eachfirm has some power over price because each sells a product thatis differentiated significantly from those of its competitors.One firm's soap might be similar to another firms soap, but itdiffers in chemical composition, color, smell, softness,reputation, and a host of other characteristics that matter tocustomers. This is the phenomenon of product differentiation.Itimplies that each firm has a certain degree of local monopolypower ower its own product. It could raise its price, even itscompetitors did not, and not lose all of its sales. This is themonopolistic part of the theory. The monopoly power is severelyrestricted, however by the precense of similar products sold bymany competing firms and by easy entry and exit. As a result the
33
monopolistically competitive firm's demand curve is very muchflatter than the industry demand curve.The demand curve highlyelastic because, similar products sold by other firms providemany close substitutes. This the competition part of the theory.Firm in monopolistic competition, sell a differantiated products, which means a group of commodities similar enough to be called the same product, but dissimilar enough that the producer of each has some power over its own price. This dissimilarity leads to, and is enhanced by, establisment of brand names and advertasing.Monopolistic competition produces a wider range of products, but at somewhat higher cost per unit,than perfect competition.(because of advertising cost and product differentiation cost).
Oligopoly
Such industries have three major characteristics; (1) there aremore competing firms- thus the industry is not a monopoly. (2)Each firm faces a downward-sloping demand curve for its ownproduct –thus the industry is not perfectly competitive. (3)There is at least one large firm that is aware that itscompetitors will react to any move it makes- thus the industryis not monopolistically competitive.Collusion is an explicit or implicit aggreement between existingfirms to avoid competition with one another.Under perfect competition or monopolistic competition, there areso many firms in the industry that no single firm need worryabout the effect of its own actions on rival firms. However, thevery essence of an oligopolistic industry is the need for eachfirm to consider how its own actions will affect decision of itsrelatively few competitors.
OPEC: A Real World OligopolyThe Organization of Petroleum Exporting Countries (OPEC) is anexample of the attempted cartelization of a formerly competitiveindustry. It illustrates many of the problems of oligopolisticindustries.The oil industry in the years before 1973 was not perfectlycompetitive. However, there were many oil producing countries,so many, indeed that no one of them could significantlyinfluence the price of oil by witholding its own output from themarket. They were price takers in the market in which they soldtheir oil. OPEC did not become a cartel nor attract worldattention until 1973. In that year, however members of OPECplaced a temporary embargo on the export of Middle Eastern oil.(The embargo was in retaliation for support, particularly by theUS, for Israel in the Arab-Israeli was that broke out in thatyear.)After the embargo ended, the OPEC members voluntarily restrictedtheir outputs by negotiating quotas among themselves. At the
34
time OPEC countries accounted for about 70 percent of theworld’s supply of crude oil and 87 percent of world oil exports.So although it was not quite a complete monopoly, the cartel hadsubstantial monopoly power. The world oil market contained onelarge oligopolistic producers’ organization surrounded by acompetitive fringe of many smaller producing countries.
Course X
I.What do governments do?II.What should governments do?
Most resources in market economies are allocated through marketsin which individuals and private firms trade with otherindividuals or firms. However governments play a major role.They set the legal rules, they buy goods and services, theyproduce goods and services, and they make payments such aspensions. Through taxation and borrowing, governments exert amajor influence on prices, interest rates, and production.
This course, adresses some basic questions about thegovernment’s role in economic life. What do governments actuallydo? How can governments in principle improve the allocation ofresources in the economy ? How do governments decide what to do?
I.What do governments do?
Create Laws, Rules and RegulationsGoverments determine the legal frame work that sets the basicrules for ownership of property and the operation of markets.Even in the most capitalist economies, there are limits to therights of ownership. Not everyone can own a gun. It is usuallyillegal to build a factory in a residental area. In addition,governments at all levels regulate economic behaviour, settingdetailed rules for the operation of businesses. Regulationsinclude, planing permission (how land can be used and wherebusinesses can locate), health and safety regulations, andattempts to prevent some types of business, such as the sale ofheroin. Buy and sell goods and servicesGovernments buy and produce many goods and services, such asdefence, education, parks and roads which they provide to firmsand households. Most of these goods, such as defence andeducation are provided to users free of direct charge. Some,
35
such as local bus rides and government publications are paid fordirectly by the user.
Governments also produce and sell goods. In some countries, thephone company is government-owned; in most countries, thegovernment owns and operates urban transport such as buses andthe undergraund.
Make transfer paymentsGovernments also make transfer payments such as social security,and unemployment benefits to individuals.
Transfer payments are payments for which no current direct economic service isprovided in return.
A firemans’s salary is not a transfer payment; a social securitycheque is, as are unemployment benefits and interest payments ongovernment borrowing.
Impose taxesGovernments pay for the goods they buy and for the transferpayments they make by levying taxes or by borrowing. Taxesraised at national level such as income tax or VAT, are usuallysupplemented by local taxes assessed on property values orhousehold size.
Try to stabilize the economy Every market economy suffers from business cycles.The business cycle consists of fluctuations of total production, or GDP, accompanied byfluctuations in the level of unemployment and the rate of inflation.
Governments often attempt to modify fluctuations in the businesscycle. The government may reduce taxes in a recession in thehope that people will increase spending and thus raise the GDP.When inflation is high, the central bank may reduce the rate ofmoney growth with the aim of reducing inflation. These aremacroeconomic policies through which the government attemps tostabilize the economy. Keeping it close to full employment butwith low inflation.
Affect the allocation of resourcesBy spending and taxing, the government plays a major part inallocating resources in the economy. In terms of what, how, andfor whom, governments chooses much of what gets produced, fromdefence expenditures to education to its support for the arts.It affects how goods are produced through regulation and throughthe legal system. It affects for whom goods are produced through
36
its taxes and transfers, which take income away from some peopleand give it to others.
II. What should governments do?
Why should government intervene in a market economy? There aresome theoretical justifications for government intervention;
The general argument for government intervantion is marketfailure. Sometimes markets do not allocate resourcesefficiently, and government intervention may improve economicperformance. Government could, in theory, improve the allocationof resources. Economic theory, identifies the types of marketfailures;
The business cycleThe business cycle has many external causes, from wars or oilprice changes to bursts of new inventions. Government policiesalso affect it. Increases in taxes and reductions in governmentspending generally reduce GNP, increases in the money stockincrease GNP and prices. Government policy can make the businesscycle worse, lenthening recessions and creating inflations, orit can reduce economic fluctuations. Since the government doescontrol a large share of total spending and the quantity ofmoney, it must make its decisions with their effect on thebusiness cycle in mind. And it does: taxes may be cut when theeconomy is in a recession, and the growth rate of money may bereduced when the inflation rate is too high or be increased whenthe economy is in a recession.
Public goodsThere are goods we can all consume simultaneously. These arecalled public goods.A public good is a good that, even if it is consumed by one person, is stil available forconsumption by others. A private good, if consumed by one person, can not be consumed by another.
Clean air is a public good. So is national defence, or publicsafety. It is no coincidence that most public goods are notprovided in private markets. Because of the free rider problem,private market have trouble ensuring that the right amount of apublic good will be produced. A free-rider is some one who getsthe consume a good that is costly to produce without paying forit. The free-rider problem applies particularly to public goodsbecause if everyone were to buy the good, it would then beavailable for everyone else to consume.
37
ExternalitiesMarkets work well when the price of a good equals society’s costof producing that good and when the value of the good to thebuyer is equal to the benefit of the good to society, Howeverthe cost and benefits are sometimes not fully reflected inmarket prices. An externalities exist when the production or consumption of agood directly affects businesses or consumers not involved inbuying and selling it and when those spillover effects are notfully reflected in market prices.Externalities might be negative or positive; Such as pollutionor views of newly painted houses. When externelities arepresent, market prices do not reflect all the social costs andbenefits of the production of a good. Government interventionmay improve the functioning of the economy, for example byrequiring firms to treat their waste products in certain waysbefore dumping them.
Monopoly and market powersCompetitive markets generally work well, but markets whereeither buyers and sellers can manipulate prices generally donot. In particular to little will be produced and price will beto high in a market where a single seller controls supply.Some monopolies are almost unavoidable. Most public utilities(gas for exaple) are potantial monopolies. The government canregulate such companies by controlling the prices they areallowed to charge, or it may elect to supply the productsitself. Other monopolies may be artificial, brougth aboutthrough manupilation by firms. Here governments intervene withcompetition laws, seeking to make competition more vigorous andto prevent monopolies or other attemps to control supply.
Income redistribution and merit goodsIn practice modern governments engage in large scaleredistribution of income. Government spending on transferpayments represents government redistribution of income- towardsthe elderly (through social security), the unemployed (throughunemployment benefits), farmers (through price supports) andother beneficiaries.
There is difference between government intervention to effectthe distribution of income and intervention to ensure the rightlevel of production of public goods or to make market pricesreflect externalities. In the later cases the government istaking actions that at least in principle can make every one insociety beter off. But when the government intervenes to affect
38
the income distribution, it make some people better off bymaking others worse off. Governments are concerned not just with the distribution ofincome, but also with the consumption of particular goods andservices. Merit goods are goods that society thinks people should consume or receive, no matterwhat their incomes are.Merit goods typically include health, education shelter, andfood.
Course XI
I. Factors Market: Some terms on factors of production.II.The Functional Income Distribution
The demand for factors of production is derived demand becauseit is derived from the demand for the output that the factorsare used to produce.
Labour
Lobour, a factor of production consisting of all physical andmental contributions provided by people.
Labour supply, the number of workers (or more generally the numberof labour-hours) available to an aconomy. The principledeterminants of labour supply are population, real wages, andsocial traditions.
The labour force, is all individuals in work or seeking employment.
Minimum wages, legally specified minimum rate of pay for labourin covered occupations
Unemployment, the number of persons who are not employed and areactively searching for a job.
Trade Unions are worker organizations designed to affect pay andworking conditions.
Lobour boycott, an organized attempt to pursuade customers torefrain from purchasig the products of a firm or industry whoseemployees are on strike.
39
Strike, the concerted refusal of the members of a union to work.
Bread and butter unionism, is a union movement whose major objectivesare better wages and conditions of employment rather thanpolitical and social ends.
Capital
Capital, A factor of production consisting of all manufacturedaids to further production.
Physical capital is the stock of produced goods that contribute tothe production of other goods and services. Physical capitalconsists of durable produced goods that are in turn used inproduction. The major components of capital are equipment,structures, and inventory. When signifiying capital goodsreference is also made to real capital.
Portfolio capital or financial capital, means the total amount of moneysubscribed by the shareholder-owners of a corporation, in returnfor which they receive shares of the company’s stock.
Capital deepining; adding capital to the production process in sucha way as to increase the ratio of capital to labour and otherfactors of production. In economic growht theory, an increasein the capital labour ratio (contrast with capital widening)
Capital widening, A rate of growth in real capital stock just equalto the growth of the labour force, so that the ratio betweentotal capital and total labour remains unchanged. (contrast withcapital deepining)
Capital gains, the rise in value of a capital asset, such as landor common stocks, the gain being the difference between the saleprice and the purchase price of the asset.
Capital consumption allowance; depreciation of an asset: A decline inthe value of an asset in both business and national accounts,depreciation is the money estimate of the extend to wichcapital has been used up or worn out over the period inquestion.
Capital markets, markets in which financial resources (money bonds,stocks) are traded, These along with financial intermediaries,are institution through which savings in the economy aretransfered to investors.
40
Capitalist; one who owns capital goods.
Capitalist economy; an economy in which capital is predominantlyowned by privately rather than by the state.
Capital-labour ratio, a measure of the amount of capital per workerin an economy.
Capital-output ratio, The ratio of the value of capital to the annualvalue of output produced by it. In economic growth theory, theratio of the total capital stock to annual GDP.
Capital stock, The aggregate quantity of a society’s capital goodsor the total of a firm’s capital goods.
Human Capital, is the stock of expertise accumulated by a worker.It is valued for its income earning potential in the future.
Nature, Land
Land is the factor of production that nature supplies. Land is afactor of production consisting of all gifts of nature,including raw materials and “land” as conventionally defined.
Land is one of the three basic factors of production in clasicaland neoclasical economies; More generally land is taken toiclude land used for agricultural or industrial purposes as wellas natural resources taken from above or below the soil.
Rent is the price of using a piece of land for a period of time.
The functional income distribution, tells us how an economiestotal income is divided between factors of production. Forexample it tells the share going to labour through wages andsalaries, the share going to landowners through property rents,the share going to capital owners through the interest earning.
REFERENCES
Begg, D., S.Fischer, R.Dornbush, Economics, Mc Graw Hill, 1994.
Lipsey, R.G., P.O. Steiner, Economics, Harper InternationalEdition, 1987.
41
Samuelson, P.A., W. Nordhaus, Economics, Mc Graw Hill, 1995.
42