identifying structural complexity in aeromagnetic data: an image analysis approach to greenfields...
TRANSCRIPT
Ore Geology Reviews xxx (2012) xxx–xxx
OREGEO-00907; No of Pages 13
Contents lists available at SciVerse ScienceDirect
Ore Geology Reviews
j ourna l homepage: www.e lsev ie r .com/ locate /oregeorev
Identifying structural complexity in aeromagnetic data: An image analysis approachto greenfields gold exploration
Eun-Jung Holden ⁎, Jason C. Wong, Peter Kovesi, Daniel Wedge, Mike Dentith, Leon BagasCentre for Exploration Targeting, School of Earth and Environment, The University of Western Australia, 35 Stirling Hwy, Crawley, WA 6009, Australia
⁎ Corresponding author. Tel.: +61 8 6488 5806.E-mail address: [email protected] (E.-J.
0169-1368/$ – see front matter © 2011 Elsevier B.V. Alldoi:10.1016/j.oregeorev.2011.11.002
Please cite this article as: Holden, E.-J., et afields gold exploration, Ore Geol. Rev. (201
a b s t r a c t
a r t i c l e i n f oArticle history:Received 29 June 2011Received in revised form 30 September 2011Accepted 7 November 2011Available online xxxx
Keywords:AeromagneticsStructural complexity detectionGold explorationArchean greenstone beltsImage analysis
Aeromagnetic data is important for the exploration of gold and other hydrothermal deposits because geolog-ically favourable environments are associated with changes in rock magnetism. For example, Archean oro-genic gold mineralisation is known to be present in areas of structural complexity near major shear-zonesthat form conduits for mineralising fluids. Potential fluid pathways such as shear zones and faults are oftenassociated with magnetite destructive alteration resulting in linear negative anomalies in magnetic data.Here, we present a new image analysis method that identifies geological structural complexity using linea-ments automatically mapped within magnetic data. This quantitative analysis is efficient and self consistentin dealing with large volumes of data, and is suitable as a first-pass ground selection tool for orogenic goldexploration in greenfield terrains.Using regional aeromagnetic data, our method firstly identifies lineaments as a reliable indicator of geologicalstructures, exploiting a combination of texture analysis and contrast invariant ridge detection to find laterallycontinuous textural ridges. Using the detected lineaments, two scenarios of local structural complexity areexplored: feature intersection density based on the number of faults intersections and splays; and featureorientation diversity representing deviations of strike of lower order faults and ductile shear zones. Thelocal structural complexity is visualised using heat maps that highlight the regions of structural complexity.The method has been tested using aeromagnetic data from the Archean Eastern Goldfields Superterrane ofthe Yilgarn Craton in Western Australia and a region from the Archean Abitibi greenstone belt in the SuperiorCraton, Ontario, Canada. Both cratons are mature exploration areas where granite–greenstone terrains hostnumerous orogenic gold deposits. The regions selected by the proposed system as most structurally complex,and hence prospective, correlate with the known gold deposits in these areas.
© 2011 Elsevier B.V. All rights reserved.
1. Introduction
A crucial phase of any greenfields mineral exploration programmeis ‘ground selection’ where poorly explored areas are chosen for ex-ploration (e.g., Hronsky and Groves, 2008). In this process, explorerscollect and interpret various data to understand the geology of thearea in order to identify the areas that are geologically favourablefor mineralisation. To encourage greenfields exploration within theirjurisdictions, national, state or provincial governments throughoutthe world acquire aeromagnetic datasets across large areas andmake these data available at little or no cost to mineral explorers.Aeromagnetic data plays an important role in greenfields explorationfor many types of deposit because of its ability to map bedrock geol-ogy in a self consistent fashion and, most importantly, through cover.Such data are particularly useful for identifying, geological
Holden).
rights reserved.
l., Identifying structural com2), doi:10.1016/j.oregeorev.2
environments favourable for the formation of gold deposits as theseare often associated with changes in the amounts of magnetic min-erals, such as magnetite and pyrrhotite, in the rocks. For example,Archean orogenic-gold mineralisation is known to be present inareas of structural complexity near major shear zones, which is usedas conduits for mineralising fluids (Table 1). Crustal breaks that arepotential fluid pathways are often associated with magnetite destruc-tive alteration resulting in linear negative anomalies in magnetic data.Also, iron-rich, and hence potentially magnetic, units are often hostrocks for mineralisation due to their reactivity with gold-bearingfluids.
In the initial stages of greenfields exploration aeromagnetic datacan provide useful information about geological environmentsfavourable for the formation of mineral deposits, especially whenthere is little outcrop data. However, the magnetic datasets availablemay be extremely large and therefore time consuming to analyse.Here, we describe an image analysis method that identifies and visu-alises areas of geological structural complexity within aeromagneticdata, and which is then used to identify favourable areas for Archeanorogenic-gold mineralisation.
plexity in aeromagnetic data: An image analysis approach to green-011.11.002
Table 1Geological characteristics of areas suggestive of enhanced prospectivity for orogenic-gold deposits (after Bierlein et al., 2006; Groves et al., 2000; Hronsky and Groves,2008).
Key parameter Proxies for parameter
Thermal energy and ore-fluid source:Thinned lithosphere Short terrane historyMajor crust-forming event Geochronological dataOrogenic-gold mineralisation Known gold occurrences
Plumbing fluid systems:Deep fluid conduits Crustal-scale shear zonesFocused fluid flow High-strain shear zones in low-strain beltsHigh-damage zone in lower order faults Jogs, thrust duplexes, fault intersections
Trap:Structural trap Locked-up anticline, thrust tipRheological trap Contacts with high rheologically contrastChemical trap Reactive rocks with high Fe and/or C
Fluid seal:Stratigraphic cap Impermeable rocks over structurally
permeable rocksStructural cap Impermeable thrust stacks
Outflow zone:Fluid dispersion Metal dispersion halos
2 E.-J. Holden et al. / Ore Geology Reviews xxx (2012) xxx–xxx
1.1. Image analysis
Automated image analysis allowsquantitative, efficient and consistentanalysis of data. It is especially useful when dealing with large volumes ofdata. Image analysis algorithms are used to enhance and automaticallydetect features of interest within a wide range of applications such asmedical imaging (Gholipour et al., 2007), robotics (DeSouza and Kak,2002), and remote sensing (Tuia andCamps-Valls, 2009). Geology heavilyrelies on human presuppositions and expectations to understand themeaning of a geoscientific dataset (Frodeman, 1995). For ground selec-tion, given that there may be millions of square kilometres of data avail-able, interpretation is not only a complex task, but also a tedious onewhere image analysis can be effectively applied for first-pass screeningof data to highlight areas for further manual investigation.
The research presented in this manuscript applies a texture basedlineament detection algorithm to find the axis of texture ridges thatmay be associated with regions of discontinuities within magneticdata. These lineaments are then analysed to identify two scenariosof structural complexity. The first is local intersection density usinglineament crossings, junctions and bends representing faults inter-sections and splays. The other is local diversity of lineament orienta-tions representing deviations of strike of lower order faults andductile shear zones. These results are visualised using heat mapswhich graphically display the degree of structural complexity ateach neighbourhood within the map.
Previously, various algorithms were proposed to identify featuresof interest for mineral exploration within aeromagnetic data includ-ing lineaments (Blakely and Simpson, 1986; Cella et al., 2009) andother shape based geological features (e.g., Holden et al., 2011). Thisstudy goes one step further in analysing these structures automatical-ly based on two separate scenarios of structural complexity, and thenvisualising the results to highlight the regions that are perceived to begeologically favourable for gold mineralisation. This study focuses ongetting detailed information out of a single dataset where the out-come can be combined with other geological information either formanual or quantitative prospectivity mapping.
1.2. Structural complexity detection
Various approaches are documented on the quantitative analysisof structural complexity within geoscientific datasets. Pattern
Please cite this article as: Holden, E.-J., et al., Identifying structural comfields gold exploration, Ore Geol. Rev. (2012), doi:10.1016/j.oregeorev.2
analysis techniques were used to identify orientation changes intrends (Knox-Robinson and Groves, 1997), and fractal analysis wasused to define pattern complexity within geological maps (Ford andBlenkinsop, 2008; Hodkiewicz et al., 2005; Weinberg et al., 2004;Zhao et al., 2011). In another related work, an image analysis methodbased on geometric shape features was used to characterise prospec-tive regions using a digitised geological map (Gardoll et al., 2000).
The above mentioned studies used structural or geological mapsthat are inevitably derived from a subjective interpretation of incom-plete information. Furthermore, the level of detail in interpretationpotentially may vary for different regions within a derived datasetas more detailed studies may have been conducted for regions of in-terest in the studied area. This adds further uncertainty to the out-come of structural complexity analysis. The direct use of magneticdata using automated methods address this problem to some extentas it comprises a consistent quantitative analyses, albeit limited bythe sometimes complex relationship between magnetic anomaliesand their sources.
There have been very few previous studies on identifying areas ofstructural complexity within magnetic data. Core et al. (2009) appliedan automated edge detection method to seek belt-parallel trends andtheir cross-cutting structures to predict gold mineralisation, whilstlocal data variations and patterns in texture were used to identifystructural complexity by Holden et al. (2008).
This paper reports a sophisticated means of analysing lineamentsto examine the geometries of the structures comprising the zone ofcomplexity. In this research, two specific structural scenarios aretargeted:
1. The feature intersection density (crossings and bifurcations andchanges in the strike of the structures). In such an analysis, inter-section points will be expected to lead to concentrations of stres-ses, which encourage deformation and therefore have greaterpermeability than individual structures.
2. The diversity in feature orientations, where changes in strike areimportant because of the possibility of damaged zones. Slip vectorsthat are not parallel to the strike direction are loci where structuralopenings are present through which hydrothermal fluids mightflow commonly characterise such zones.
2. Methodology
The approach employed in this study firstly identifies linear fea-tures within the aeromagnetic data; then local structural complexityis analysed using the spatial associations between adjacent linear fea-tures. Firstly, we detect lineaments based on local texture (Holden etal., 2008, 2010a, 2010b). Then the spatial associations of the detectedlineaments are analysed to construct two heat maps corresponding toeach of the structural complexity scenarios, namely a feature inter-section density heat map and a feature orientation diversity heatmap. These maps show the occurrence of these structural scenarios,which can be used either to aid manual prospectivity analysis or asan additional layer of information for GIS-based quantitative prospec-tivity analysis that combines multiple geoscientific datasets. We dem-onstrate the production of the structural complexity heat maps fromtwo areas; one in the Yilgarn Craton of Western Australia and the sec-ond at Kirkland Lake in Ontario, Canada. Both are regions that containArchean orogenic-gold deposits in granite–greenstone terranes.
2.1. Lineament detection
Aeromagnetic data contain intensity values that range over sever-al orders of magnitude with significant variations in contrast forimage features, posing challenges to conventional image processingtechniques. For example, applying a conventional gradient basededge detection method to magnetic data will result in significant
plexity in aeromagnetic data: An image analysis approach to green-011.11.002
3E.-J. Holden et al. / Ore Geology Reviews xxx (2012) xxx–xxx
variations in edge strength amongst different anomalies. While thisoutput may be acceptable for a visualisation purpose for human inter-pretation, the feature strength variation in an edge map causes a
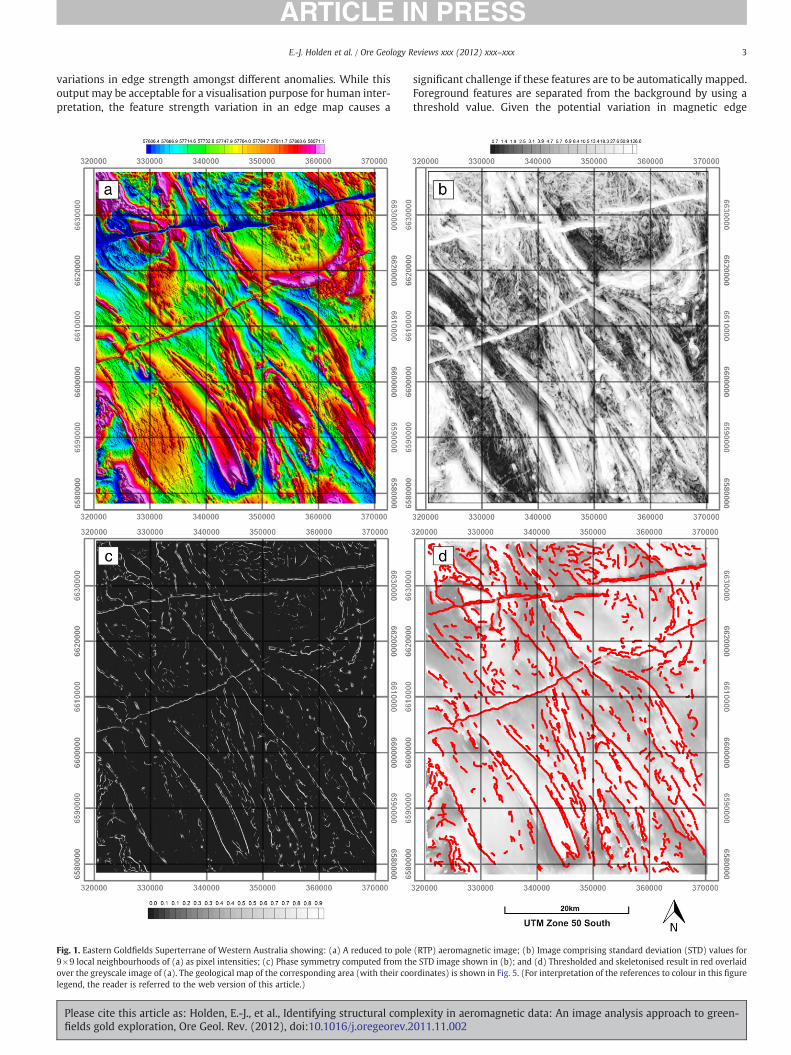
Fig. 1. Eastern Goldfields Superterrane of Western Australia showing: (a) A reduced to pole9×9 local neighbourhoods of (a) as pixel intensities; (c) Phase symmetry computed from thover the greyscale image of (a). The geological map of the corresponding area (with their coolegend, the reader is referred to the web version of this article.)
Please cite this article as: Holden, E.-J., et al., Identifying structural comfields gold exploration, Ore Geol. Rev. (2012), doi:10.1016/j.oregeorev.2
significant challenge if these features are to be automatically mapped.Foreground features are separated from the background by using athreshold value. Given the potential variation in magnetic edge
(RTP) aeromagnetic image; (b) Image comprising standard deviation (STD) values fore STD image shown in (b); and (d) Thresholded and skeletonised result in red overlaidrdinates) is shown in Fig. 5. (For interpretation of the references to colour in this figure
plexity in aeromagnetic data: An image analysis approach to green-011.11.002
4 E.-J. Holden et al. / Ore Geology Reviews xxx (2012) xxx–xxx
strength, determining a suitable threshold value is problematic. Toaddress this, a contrast invariant feature detection method can be ap-plied (Kovesi, 1997; Holden et al., 2008, 2010b). In this paper, we de-tect edges (i.e., magnetic discontinuities) by firstly enhancing localmagnetic variations using texture analysis and then finding ridgeswithin the texture analysis outputs using a contrast-invariant line de-tection technique. Finally, the texture ridges are identified andvectorised.
Thus, our approach consists of the following steps:
1. Texture analysis to enhance local magnetic variations.2. Texture ridge detection using a technique that finds bilaterally
symmetric, line-like features (Kovesi, 1997) within the textureanalysis output.
3. Thinning of texture ridges to vectorise their line segments.
These methods were detailed in Holden et al. (2008), and are onlybriefly explained here.
Texture analysis characterises the local neighbourhood of eachimage location. We used a standard deviation (STD) filter, which repre-sents the spread of greyscale pixel intensities within a local window.Thus, regions of discontinuitywill exhibit high standard deviation values.Alternatively, an entropy filter has also been found to be effective for en-hancing local magnetic anomalies (Holden et al., 2008). Note that thetexture analysis reduces high frequency noise to some extent and avoidsthe detection of edge boundaries on both sides of a narrow anomaly.
An example aeromagnetic dataset and the STD output are shownin Fig. 1a, b. The data is from a region in the Eastern Goldfields Super-terrane in Western Australia. The survey comprised east–west surveylines flown at a 200 m spacing and a nominal terrain clearance of60 m. The aeromagnetic image is a grid with a 50 m spacing. Thesize of the neighbourhood for texture analysis can be determined em-pirically, or based on the scale of the width of the edges being sought.In our experiments, a size of between 350 and 500 m in diameterseems to be a reasonable estimate.
Texture ridge detection is then applied to find the laterally continu-ous ridges within the texture analysis output. Ridge features aredetected using a contrast invariant line-like feature detection tech-nique based on local phase symmetry. This technique allows the de-tection of all ridges regardless of their image contrast to thesurroundings, and is further detailed below.
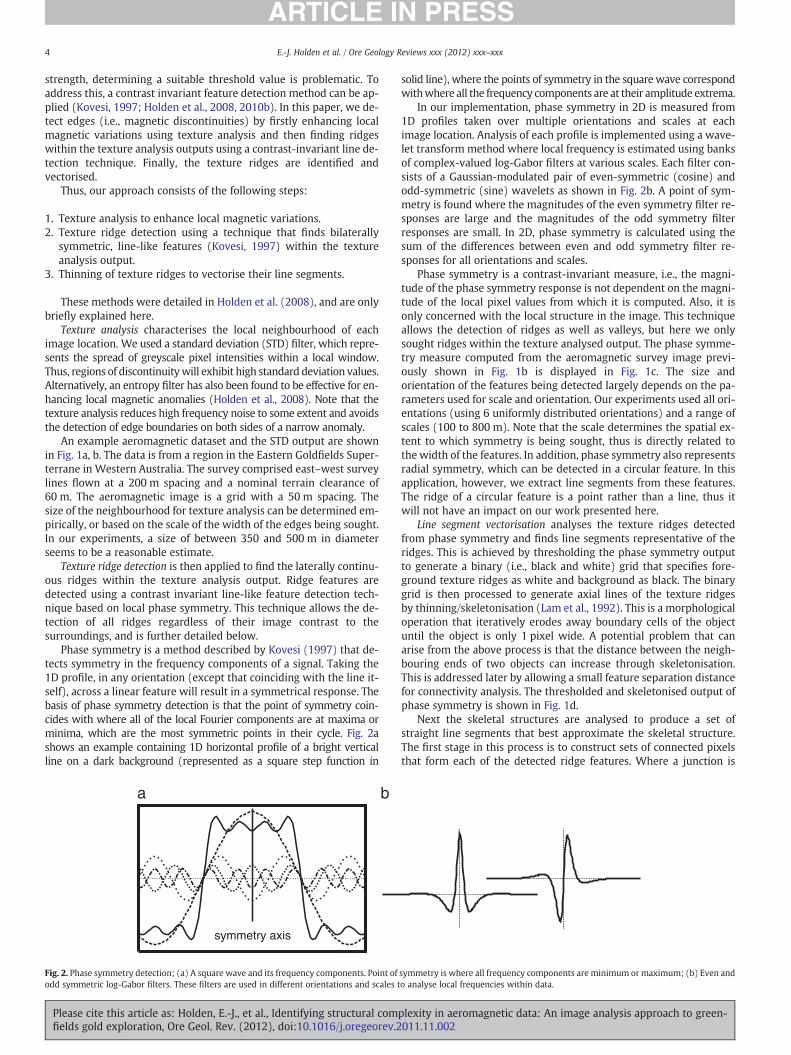
Phase symmetry is a method described by Kovesi (1997) that de-tects symmetry in the frequency components of a signal. Taking the1D profile, in any orientation (except that coinciding with the line it-self), across a linear feature will result in a symmetrical response. Thebasis of phase symmetry detection is that the point of symmetry coin-cides with where all of the local Fourier components are at maxima orminima, which are the most symmetric points in their cycle. Fig. 2ashows an example containing 1D horizontal profile of a bright verticalline on a dark background (represented as a square step function in
symmetry axis
a b
Fig. 2. Phase symmetry detection; (a) A square wave and its frequency components. Point ofodd symmetric log-Gabor filters. These filters are used in different orientations and scales t
Please cite this article as: Holden, E.-J., et al., Identifying structural comfields gold exploration, Ore Geol. Rev. (2012), doi:10.1016/j.oregeorev.2
solid line), where the points of symmetry in the square wave correspondwithwhere all the frequency components are at their amplitude extrema.
In our implementation, phase symmetry in 2D is measured from1D profiles taken over multiple orientations and scales at eachimage location. Analysis of each profile is implemented using a wave-let transform method where local frequency is estimated using banksof complex-valued log-Gabor filters at various scales. Each filter con-sists of a Gaussian-modulated pair of even-symmetric (cosine) andodd-symmetric (sine) wavelets as shown in Fig. 2b. A point of sym-metry is found where the magnitudes of the even symmetry filter re-sponses are large and the magnitudes of the odd symmetry filterresponses are small. In 2D, phase symmetry is calculated using thesum of the differences between even and odd symmetry filter re-sponses for all orientations and scales.
Phase symmetry is a contrast-invariant measure, i.e., the magni-tude of the phase symmetry response is not dependent on the magni-tude of the local pixel values from which it is computed. Also, it isonly concerned with the local structure in the image. This techniqueallows the detection of ridges as well as valleys, but here we onlysought ridges within the texture analysed output. The phase symme-try measure computed from the aeromagnetic survey image previ-ously shown in Fig. 1b is displayed in Fig. 1c. The size andorientation of the features being detected largely depends on the pa-rameters used for scale and orientation. Our experiments used all ori-entations (using 6 uniformly distributed orientations) and a range ofscales (100 to 800 m). Note that the scale determines the spatial ex-tent to which symmetry is being sought, thus is directly related tothe width of the features. In addition, phase symmetry also representsradial symmetry, which can be detected in a circular feature. In thisapplication, however, we extract line segments from these features.The ridge of a circular feature is a point rather than a line, thus itwill not have an impact on our work presented here.
Line segment vectorisation analyses the texture ridges detectedfrom phase symmetry and finds line segments representative of theridges. This is achieved by thresholding the phase symmetry outputto generate a binary (i.e., black and white) grid that specifies fore-ground texture ridges as white and background as black. The binarygrid is then processed to generate axial lines of the texture ridgesby thinning/skeletonisation (Lam et al., 1992). This is a morphologicaloperation that iteratively erodes away boundary cells of the objectuntil the object is only 1 pixel wide. A potential problem that canarise from the above process is that the distance between the neigh-bouring ends of two objects can increase through skeletonisation.This is addressed later by allowing a small feature separation distancefor connectivity analysis. The thresholded and skeletonised output ofphase symmetry is shown in Fig. 1d.
Next the skeletal structures are analysed to produce a set ofstraight line segments that best approximate the skeletal structure.The first stage in this process is to construct sets of connected pixelsthat form each of the detected ridge features. Where a junction is
symmetry is where all frequency components are minimum ormaximum; (b) Even ando analyse local frequencies within data.
plexity in aeromagnetic data: An image analysis approach to green-011.11.002
5E.-J. Holden et al. / Ore Geology Reviews xxx (2012) xxx–xxx
encountered, the continuity of the current ridge feature is determinedbased on the orientation and length of the branches. Next, for eachconnected ridge pixel, a set of straight-line segments is fitted. Astraight-line segment is fitted between the endpoints of a ridge fea-ture, and the maximum deviation of the ridge pixels from the fittedline segment is computed. If the maximum deviation exceeds athreshold, e.g., 2 pixels, the ridge feature is divided into two aboutthe point of maximum deviation. The test is then repeated until nofurther division is required. In this manner, each ridge feature is bro-ken into straight-line segments, whilst maintaining a significant sim-ilarity with the original ridge data. Note that processing theskeletonised image in this manner replaces the processing of curvedline-like features with a simpler set of linear approximations.
Our edge detection method based on texture ridges can bereplaced by other methods that were previously proposed for poten-tial field data. These include: other texture analysis methods that en-hance local discontinuities within magnetic data (Dentith, 2000; Dhuet al., 1999); automated detection of maximum in horizontal gradi-ents (Blakely and Simpson, 1986); multi-scale derivative analysis toenhance source boundaries (Cella et al., 2009; Fedi, 2002); a linearfeature detection method called the Radon transform (Sykes andDas, 2000); the combined use of wavelet transform and the Radontransform (Boukerbout and Gibert, 2006) to predict the sourcedepth of linear anomalies within magnetic data; and phase basededge detection (Cooper and Cowan, 2006). Lineaments detected byany of the above mentioned method, or even a manually interpretedstructural map can be used for the structural complexity detectiondescribed in this manuscript.
2.2. Structural complexity heat maps
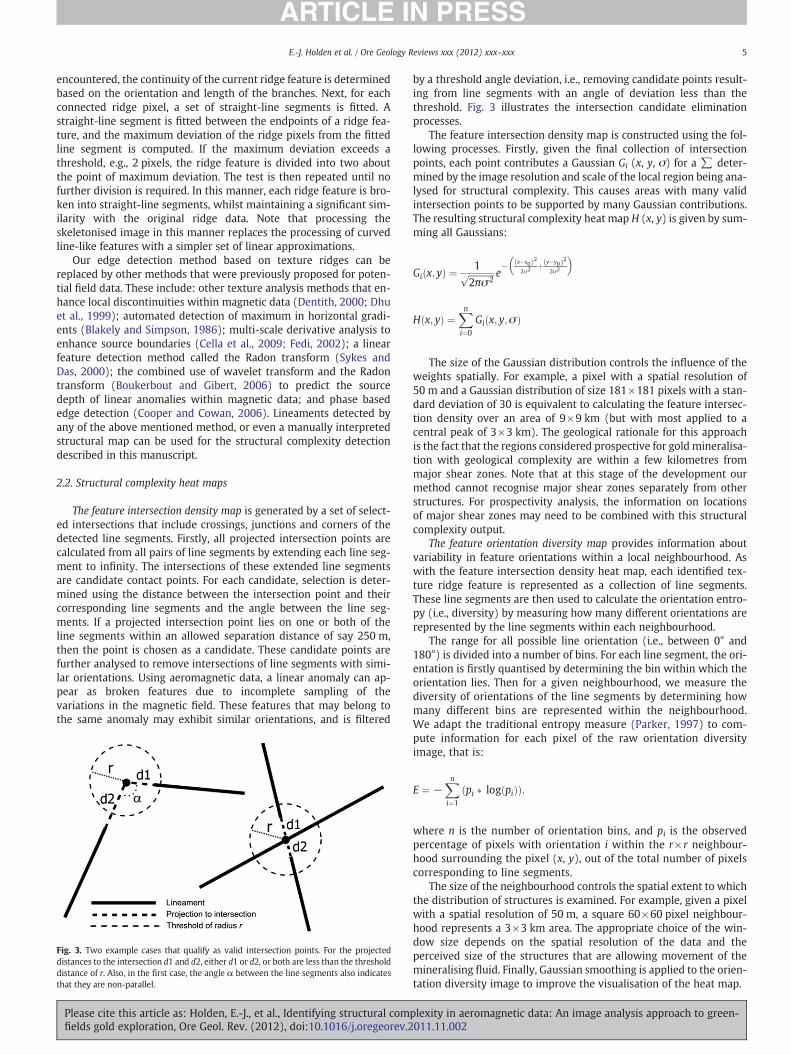
The feature intersection density map is generated by a set of select-ed intersections that include crossings, junctions and corners of thedetected line segments. Firstly, all projected intersection points arecalculated from all pairs of line segments by extending each line seg-ment to infinity. The intersections of these extended line segmentsare candidate contact points. For each candidate, selection is deter-mined using the distance between the intersection point and theircorresponding line segments and the angle between the line seg-ments. If a projected intersection point lies on one or both of theline segments within an allowed separation distance of say 250 m,then the point is chosen as a candidate. These candidate points arefurther analysed to remove intersections of line segments with simi-lar orientations. Using aeromagnetic data, a linear anomaly can ap-pear as broken features due to incomplete sampling of thevariations in the magnetic field. These features that may belong tothe same anomaly may exhibit similar orientations, and is filtered
Fig. 3. Two example cases that qualify as valid intersection points. For the projecteddistances to the intersection d1 and d2, either d1 or d2, or both are less than the thresholddistance of r. Also, in the first case, the angle α between the line segments also indicatesthat they are non-parallel.
Please cite this article as: Holden, E.-J., et al., Identifying structural comfields gold exploration, Ore Geol. Rev. (2012), doi:10.1016/j.oregeorev.2
by a threshold angle deviation, i.e., removing candidate points result-ing from line segments with an angle of deviation less than thethreshold. Fig. 3 illustrates the intersection candidate eliminationprocesses.
The feature intersection density map is constructed using the fol-lowing processes. Firstly, given the final collection of intersectionpoints, each point contributes a Gaussian Gi (x, y, σ) for a ∑ deter-mined by the image resolution and scale of the local region being ana-lysed for structural complexity. This causes areas with many validintersection points to be supported by many Gaussian contributions.The resulting structural complexity heat map H (x, y) is given by sum-ming all Gaussians:
Gi x; yð Þ ¼ 1ffiffiffiffiffiffiffiffiffiffiffiffi2πσ2
p e− x−x0ð Þ2
2σ2 þ y−y0ð Þ22σ2
� �
H x; yð Þ ¼Xn
i¼0
Gi x; y;σð Þ
The size of the Gaussian distribution controls the influence of theweights spatially. For example, a pixel with a spatial resolution of50 m and a Gaussian distribution of size 181×181 pixels with a stan-dard deviation of 30 is equivalent to calculating the feature intersec-tion density over an area of 9×9 km (but with most applied to acentral peak of 3×3 km). The geological rationale for this approachis the fact that the regions considered prospective for gold mineralisa-tion with geological complexity are within a few kilometres frommajor shear zones. Note that at this stage of the development ourmethod cannot recognise major shear zones separately from otherstructures. For prospectivity analysis, the information on locationsof major shear zones may need to be combined with this structuralcomplexity output.
The feature orientation diversity map provides information aboutvariability in feature orientations within a local neighbourhood. Aswith the feature intersection density heat map, each identified tex-ture ridge feature is represented as a collection of line segments.These line segments are then used to calculate the orientation entro-py (i.e., diversity) by measuring how many different orientations arerepresented by the line segments within each neighbourhood.
The range for all possible line orientation (i.e., between 0° and180°) is divided into a number of bins. For each line segment, the ori-entation is firstly quantised by determining the bin within which theorientation lies. Then for a given neighbourhood, we measure thediversity of orientations of the line segments by determining howmany different bins are represented within the neighbourhood.We adapt the traditional entropy measure (Parker, 1997) to com-pute information for each pixel of the raw orientation diversityimage, that is:
E ¼ −Xn
i¼1
pi � log pið Þð Þ;
where n is the number of orientation bins, and pi is the observedpercentage of pixels with orientation i within the r× r neighbour-hood surrounding the pixel (x, y), out of the total number of pixelscorresponding to line segments.
The size of the neighbourhood controls the spatial extent to whichthe distribution of structures is examined. For example, given a pixelwith a spatial resolution of 50 m, a square 60×60 pixel neighbour-hood represents a 3×3 km area. The appropriate choice of the win-dow size depends on the spatial resolution of the data and theperceived size of the structures that are allowing movement of themineralising fluid. Finally, Gaussian smoothing is applied to the orien-tation diversity image to improve the visualisation of the heat map.
plexity in aeromagnetic data: An image analysis approach to green-011.11.002
6 E.-J. Holden et al. / Ore Geology Reviews xxx (2012) xxx–xxx
3. Application to gold exploration
3.1. Prospectivity analysis applied to Archean orogenic-gold deposits
Archean orogenic gold deposits are one of the most importantclasses of gold mineralisation, representing about 1/5 of global pro-duction. Such deposits range in size from less than 1 t to more than1500 t with average economic grades varying from 2 to 50 g/t. Thiskind of gold deposit is one of the most intensively studied types ofmineral deposit, both from an academic and exploration perspective(e.g., McCuaig and Kerrich, 1994).
Relevant to this study are a series of empirically derived geologicalobservations that have been incorporated into geological models andexploration strategies for these gold deposits (Table 1). Geologicalmaps containing such information have been used as a basis forGIS-based quantitative prospectivity studies (see for examplePorwal and Kreuzer, 2010). The basic approach is to create a seriesof deposit-occurrence favourability maps based on spatial relation-ships with the geological features considered to be important to theformation of the deposits. These maps are combined in some fashionto create an overall prospectivity map where prospectivity is deter-mined by identifying regions containing, or those are closest to, thegreatest number of geological favourable features. Such methodshave been applied to exploration for Archean gold deposits (Bierleinet al., 2006; Gardoll et al., 2000; Knox-Robinson and Groves, 1997).
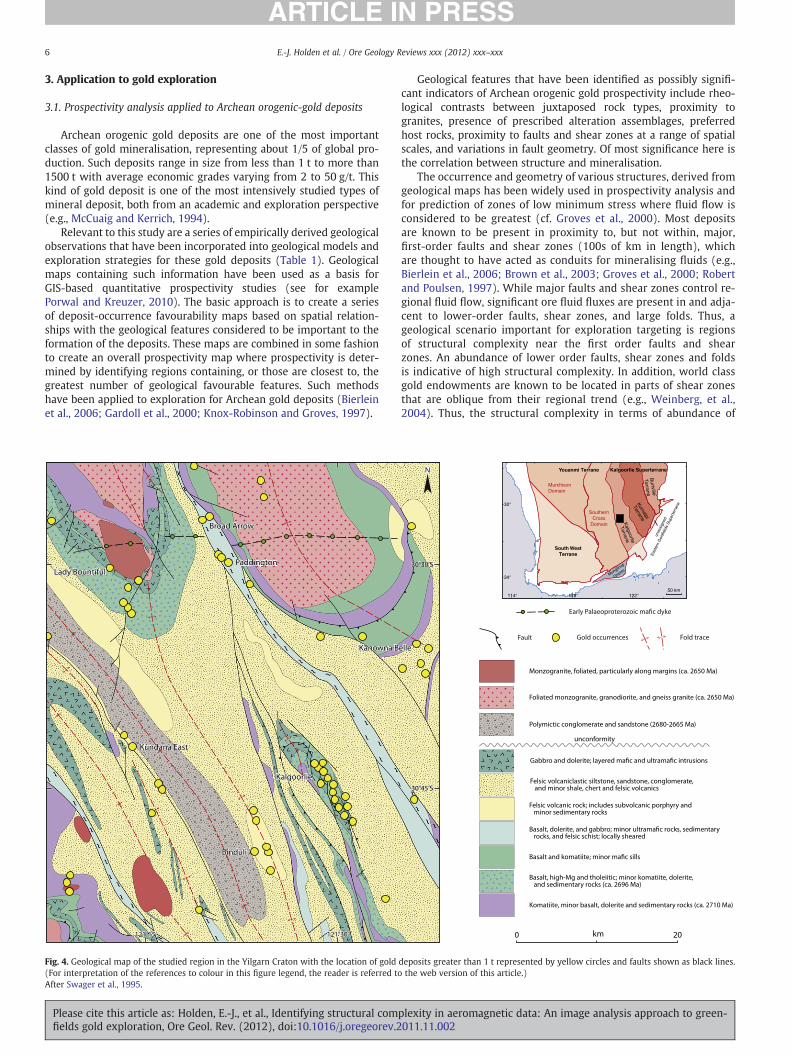
Fig. 4. Geological map of the studied region in the Yilgarn Craton with the location of gold(For interpretation of the references to colour in this figure legend, the reader is referred toAfter Swager et al., 1995.
Please cite this article as: Holden, E.-J., et al., Identifying structural comfields gold exploration, Ore Geol. Rev. (2012), doi:10.1016/j.oregeorev.2
Geological features that have been identified as possibly signifi-cant indicators of Archean orogenic gold prospectivity include rheo-logical contrasts between juxtaposed rock types, proximity togranites, presence of prescribed alteration assemblages, preferredhost rocks, proximity to faults and shear zones at a range of spatialscales, and variations in fault geometry. Of most significance here isthe correlation between structure and mineralisation.
The occurrence and geometry of various structures, derived fromgeological maps has been widely used in prospectivity analysis andfor prediction of zones of low minimum stress where fluid flow isconsidered to be greatest (cf. Groves et al., 2000). Most depositsare known to be present in proximity to, but not within, major,first-order faults and shear zones (100s of km in length), whichare thought to have acted as conduits for mineralising fluids (e.g.,Bierlein et al., 2006; Brown et al., 2003; Groves et al., 2000; Robertand Poulsen, 1997). While major faults and shear zones control re-gional fluid flow, significant ore fluid fluxes are present in and adja-cent to lower-order faults, shear zones, and large folds. Thus, ageological scenario important for exploration targeting is regionsof structural complexity near the first order faults and shearzones. An abundance of lower order faults, shear zones and foldsis indicative of high structural complexity. In addition, world classgold endowments are known to be located in parts of shear zonesthat are oblique from their regional trend (e.g., Weinberg, et al.,2004). Thus, the structural complexity in terms of abundance of
deposits greater than 1 t represented by yellow circles and faults shown as black lines.the web version of this article.)
plexity in aeromagnetic data: An image analysis approach to green-011.11.002
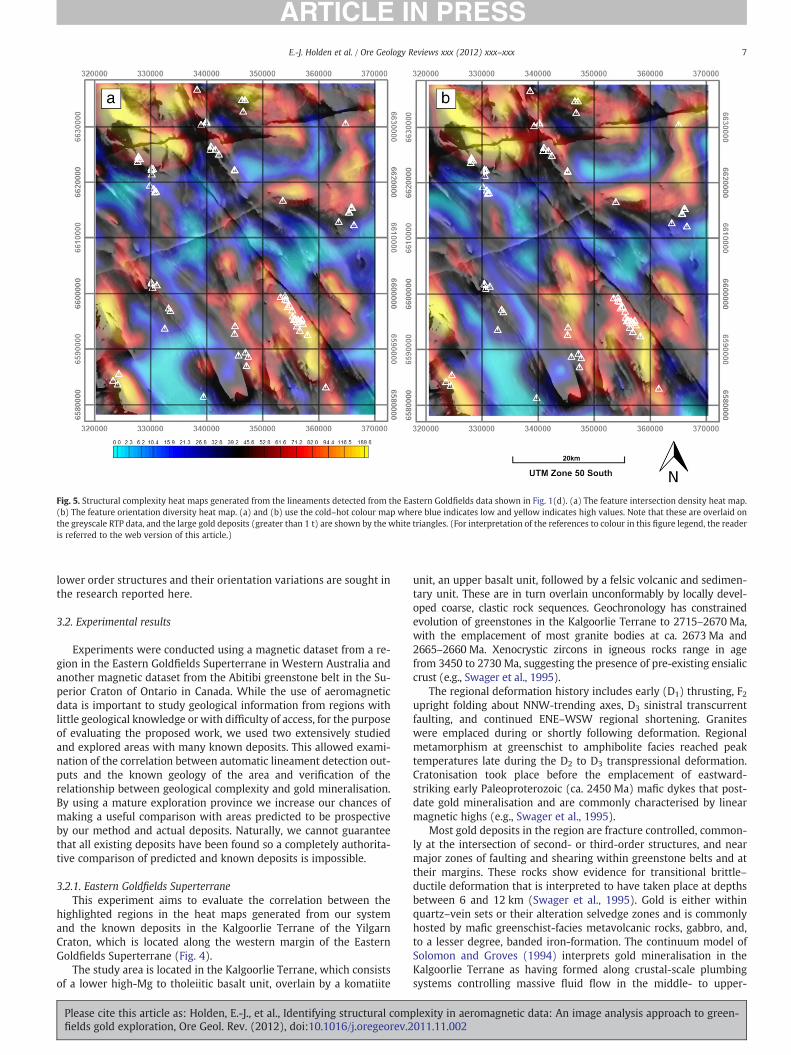
Fig. 5. Structural complexity heat maps generated from the lineaments detected from the Eastern Goldfields data shown in Fig. 1(d). (a) The feature intersection density heat map.(b) The feature orientation diversity heat map. (a) and (b) use the cold–hot colour map where blue indicates low and yellow indicates high values. Note that these are overlaid onthe greyscale RTP data, and the large gold deposits (greater than 1 t) are shown by the white triangles. (For interpretation of the references to colour in this figure legend, the readeris referred to the web version of this article.)
7E.-J. Holden et al. / Ore Geology Reviews xxx (2012) xxx–xxx
lower order structures and their orientation variations are sought inthe research reported here.
3.2. Experimental results
Experiments were conducted using a magnetic dataset from a re-gion in the Eastern Goldfields Superterrane in Western Australia andanother magnetic dataset from the Abitibi greenstone belt in the Su-perior Craton of Ontario in Canada. While the use of aeromagneticdata is important to study geological information from regions withlittle geological knowledge or with difficulty of access, for the purposeof evaluating the proposed work, we used two extensively studiedand explored areas with many known deposits. This allowed exami-nation of the correlation between automatic lineament detection out-puts and the known geology of the area and verification of therelationship between geological complexity and gold mineralisation.By using a mature exploration province we increase our chances ofmaking a useful comparison with areas predicted to be prospectiveby our method and actual deposits. Naturally, we cannot guaranteethat all existing deposits have been found so a completely authorita-tive comparison of predicted and known deposits is impossible.
3.2.1. Eastern Goldfields SuperterraneThis experiment aims to evaluate the correlation between the
highlighted regions in the heat maps generated from our systemand the known deposits in the Kalgoorlie Terrane of the YilgarnCraton, which is located along the western margin of the EasternGoldfields Superterrane (Fig. 4).
The study area is located in the Kalgoorlie Terrane, which consistsof a lower high-Mg to tholeiitic basalt unit, overlain by a komatiite
Please cite this article as: Holden, E.-J., et al., Identifying structural comfields gold exploration, Ore Geol. Rev. (2012), doi:10.1016/j.oregeorev.2
unit, an upper basalt unit, followed by a felsic volcanic and sedimen-tary unit. These are in turn overlain unconformably by locally devel-oped coarse, clastic rock sequences. Geochronology has constrainedevolution of greenstones in the Kalgoorlie Terrane to 2715–2670 Ma,with the emplacement of most granite bodies at ca. 2673 Ma and2665–2660 Ma. Xenocrystic zircons in igneous rocks range in agefrom 3450 to 2730 Ma, suggesting the presence of pre-existing ensialiccrust (e.g., Swager et al., 1995).
The regional deformation history includes early (D1) thrusting, F2upright folding about NNW-trending axes, D3 sinistral transcurrentfaulting, and continued ENE–WSW regional shortening. Graniteswere emplaced during or shortly following deformation. Regionalmetamorphism at greenschist to amphibolite facies reached peaktemperatures late during the D2 to D3 transpressional deformation.Cratonisation took place before the emplacement of eastward-striking early Paleoproterozoic (ca. 2450 Ma) mafic dykes that post-date gold mineralisation and are commonly characterised by linearmagnetic highs (e.g., Swager et al., 1995).
Most gold deposits in the region are fracture controlled, common-ly at the intersection of second- or third-order structures, and nearmajor zones of faulting and shearing within greenstone belts and attheir margins. These rocks show evidence for transitional brittle–ductile deformation that is interpreted to have taken place at depthsbetween 6 and 12 km (Swager et al., 1995). Gold is either withinquartz–vein sets or their alteration selvedge zones and is commonlyhosted by mafic greenschist-facies metavolcanic rocks, gabbro, and,to a lesser degree, banded iron-formation. The continuum model ofSolomon and Groves (1994) interprets gold mineralisation in theKalgoorlie Terrane as having formed along crustal-scale plumbingsystems controlling massive fluid flow in the middle- to upper-
plexity in aeromagnetic data: An image analysis approach to green-011.11.002
00’W
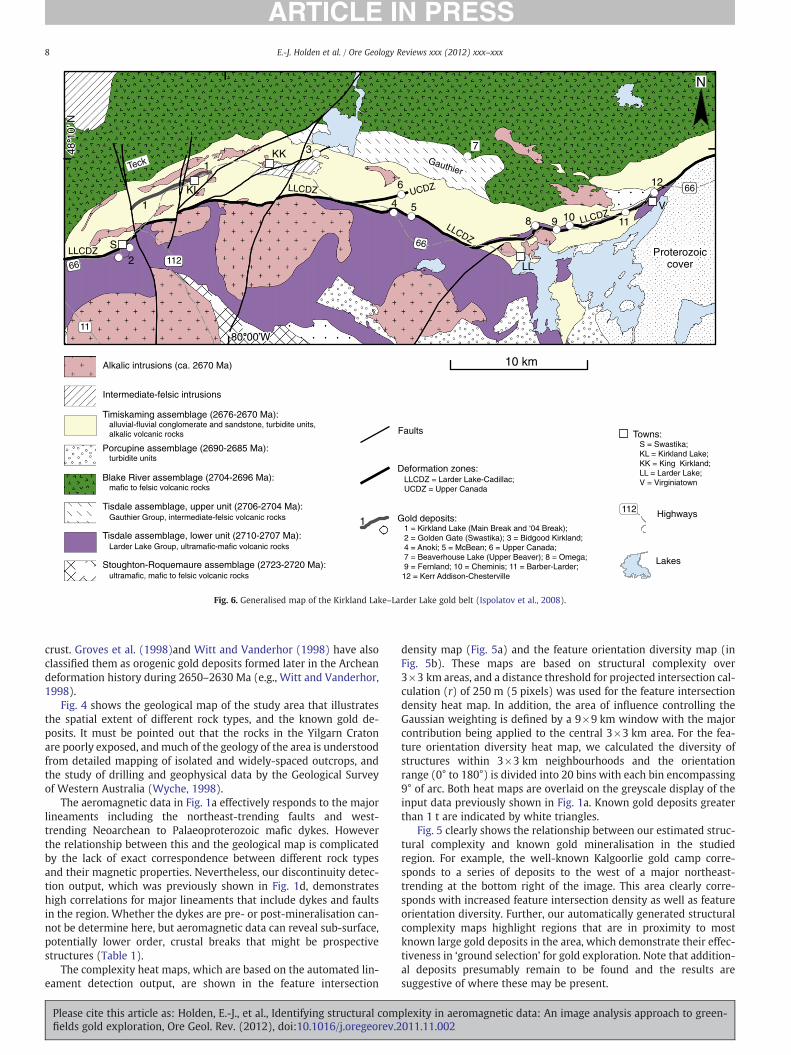
Fig. 6. Generalised map of the Kirkland Lake–Larder Lake gold belt (Ispolatov et al., 2008).
8 E.-J. Holden et al. / Ore Geology Reviews xxx (2012) xxx–xxx
crust. Groves et al. (1998)and Witt and Vanderhor (1998) have alsoclassified them as orogenic gold deposits formed later in the Archeandeformation history during 2650–2630 Ma (e.g., Witt and Vanderhor,1998).
Fig. 4 shows the geological map of the study area that illustratesthe spatial extent of different rock types, and the known gold de-posits. It must be pointed out that the rocks in the Yilgarn Cratonare poorly exposed, andmuch of the geology of the area is understoodfrom detailed mapping of isolated and widely-spaced outcrops, andthe study of drilling and geophysical data by the Geological Surveyof Western Australia (Wyche, 1998).
The aeromagnetic data in Fig. 1a effectively responds to the majorlineaments including the northeast-trending faults and west-trending Neoarchean to Palaeoproterozoic mafic dykes. Howeverthe relationship between this and the geological map is complicatedby the lack of exact correspondence between different rock typesand their magnetic properties. Nevertheless, our discontinuity detec-tion output, which was previously shown in Fig. 1d, demonstrateshigh correlations for major lineaments that include dykes and faultsin the region. Whether the dykes are pre- or post-mineralisation can-not be determine here, but aeromagnetic data can reveal sub-surface,potentially lower order, crustal breaks that might be prospectivestructures (Table 1).
The complexity heat maps, which are based on the automated lin-eament detection output, are shown in the feature intersection
Please cite this article as: Holden, E.-J., et al., Identifying structural comfields gold exploration, Ore Geol. Rev. (2012), doi:10.1016/j.oregeorev.2
density map (Fig. 5a) and the feature orientation diversity map (inFig. 5b). These maps are based on structural complexity over3×3 km areas, and a distance threshold for projected intersection cal-culation (r) of 250 m (5 pixels) was used for the feature intersectiondensity heat map. In addition, the area of influence controlling theGaussian weighting is defined by a 9×9 km window with the majorcontribution being applied to the central 3×3 km area. For the fea-ture orientation diversity heat map, we calculated the diversity ofstructures within 3×3 km neighbourhoods and the orientationrange (0° to 180°) is divided into 20 bins with each bin encompassing9° of arc. Both heat maps are overlaid on the greyscale display of theinput data previously shown in Fig. 1a. Known gold deposits greaterthan 1 t are indicated by white triangles.
Fig. 5 clearly shows the relationship between our estimated struc-tural complexity and known gold mineralisation in the studiedregion. For example, the well-known Kalgoorlie gold camp corre-sponds to a series of deposits to the west of a major northeast-trending at the bottom right of the image. This area clearly corre-sponds with increased feature intersection density as well as featureorientation diversity. Further, our automatically generated structuralcomplexity maps highlight regions that are in proximity to mostknown large gold deposits in the area, which demonstrate their effec-tiveness in ‘ground selection’ for gold exploration. Note that addition-al deposits presumably remain to be found and the results aresuggestive of where these may be present.
plexity in aeromagnetic data: An image analysis approach to green-011.11.002
9E.-J. Holden et al. / Ore Geology Reviews xxx (2012) xxx–xxx
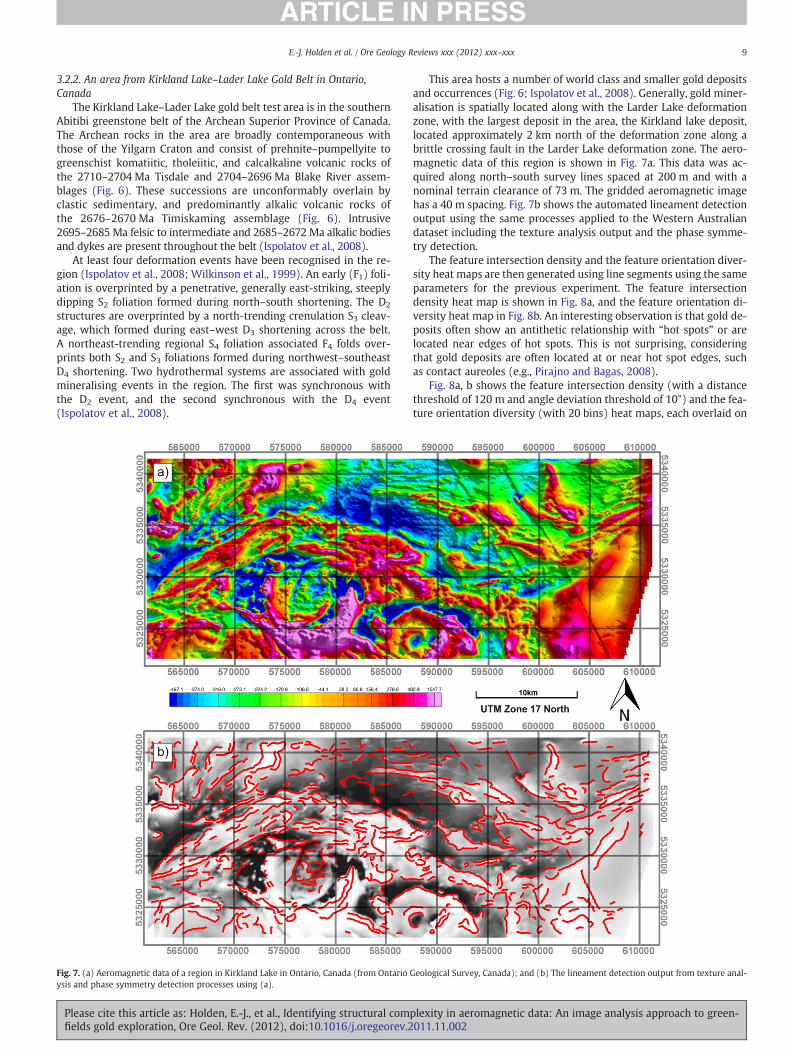
3.2.2. An area from Kirkland Lake–Lader Lake Gold Belt in Ontario,Canada
The Kirkland Lake–Lader Lake gold belt test area is in the southernAbitibi greenstone belt of the Archean Superior Province of Canada.The Archean rocks in the area are broadly contemporaneous withthose of the Yilgarn Craton and consist of prehnite–pumpellyite togreenschist komatiitic, tholeiitic, and calcalkaline volcanic rocks ofthe 2710–2704 Ma Tisdale and 2704–2696 Ma Blake River assem-blages (Fig. 6). These successions are unconformably overlain byclastic sedimentary, and predominantly alkalic volcanic rocks ofthe 2676–2670 Ma Timiskaming assemblage (Fig. 6). Intrusive2695–2685 Ma felsic to intermediate and 2685–2672 Ma alkalic bodiesand dykes are present throughout the belt (Ispolatov et al., 2008).
At least four deformation events have been recognised in the re-gion (Ispolatov et al., 2008; Wilkinson et al., 1999). An early (F1) foli-ation is overprinted by a penetrative, generally east-striking, steeplydipping S2 foliation formed during north–south shortening. The D2
structures are overprinted by a north-trending crenulation S3 cleav-age, which formed during east–west D3 shortening across the belt.A northeast-trending regional S4 foliation associated F4 folds over-prints both S2 and S3 foliations formed during northwest–southeastD4 shortening. Two hydrothermal systems are associated with goldmineralising events in the region. The first was synchronous withthe D2 event, and the second synchronous with the D4 event(Ispolatov et al., 2008).
Fig. 7. (a) Aeromagnetic data of a region in Kirkland Lake in Ontario, Canada (from Ontario Gysis and phase symmetry detection processes using (a).
Please cite this article as: Holden, E.-J., et al., Identifying structural comfields gold exploration, Ore Geol. Rev. (2012), doi:10.1016/j.oregeorev.2
This area hosts a number of world class and smaller gold depositsand occurrences (Fig. 6; Ispolatov et al., 2008). Generally, gold miner-alisation is spatially located along with the Larder Lake deformationzone, with the largest deposit in the area, the Kirkland lake deposit,located approximately 2 km north of the deformation zone along abrittle crossing fault in the Larder Lake deformation zone. The aero-magnetic data of this region is shown in Fig. 7a. This data was ac-quired along north–south survey lines spaced at 200 m and with anominal terrain clearance of 73 m. The gridded aeromagnetic imagehas a 40 m spacing. Fig. 7b shows the automated lineament detectionoutput using the same processes applied to the Western Australiandataset including the texture analysis output and the phase symme-try detection.
The feature intersection density and the feature orientation diver-sity heat maps are then generated using line segments using the sameparameters for the previous experiment. The feature intersectiondensity heat map is shown in Fig. 8a, and the feature orientation di-versity heat map in Fig. 8b. An interesting observation is that gold de-posits often show an antithetic relationship with “hot spots” or arelocated near edges of hot spots. This is not surprising, consideringthat gold deposits are often located at or near hot spot edges, suchas contact aureoles (e.g., Pirajno and Bagas, 2008).
Fig. 8a, b shows the feature intersection density (with a distancethreshold of 120 m and angle deviation threshold of 10°) and the fea-ture orientation diversity (with 20 bins) heat maps, each overlaid on
eological Survey, Canada); and (b) The lineament detection output from texture anal-
plexity in aeromagnetic data: An image analysis approach to green-011.11.002
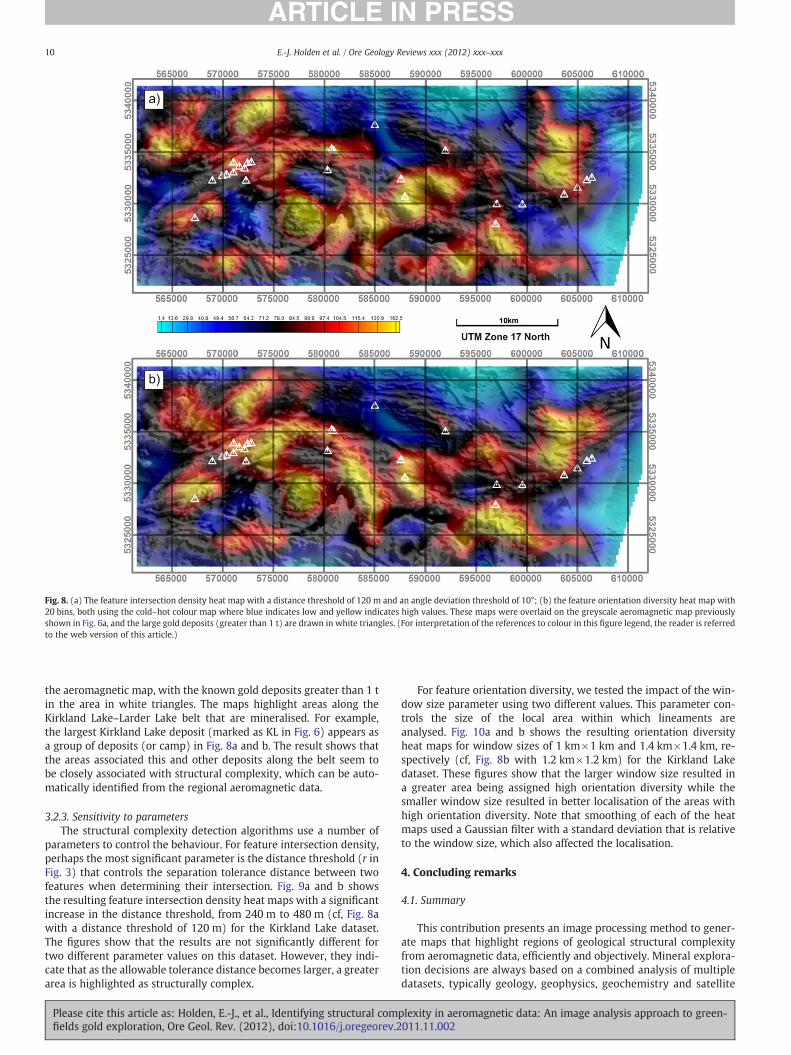
Fig. 8. (a) The feature intersection density heat map with a distance threshold of 120 m and an angle deviation threshold of 10°; (b) the feature orientation diversity heat map with20 bins, both using the cold–hot colour map where blue indicates low and yellow indicates high values. These maps were overlaid on the greyscale aeromagnetic map previouslyshown in Fig. 6a, and the large gold deposits (greater than 1 t) are drawn in white triangles. (For interpretation of the references to colour in this figure legend, the reader is referredto the web version of this article.)
10 E.-J. Holden et al. / Ore Geology Reviews xxx (2012) xxx–xxx
the aeromagnetic map, with the known gold deposits greater than 1 tin the area in white triangles. The maps highlight areas along theKirkland Lake–Larder Lake belt that are mineralised. For example,the largest Kirkland Lake deposit (marked as KL in Fig. 6) appears asa group of deposits (or camp) in Fig. 8a and b. The result shows thatthe areas associated this and other deposits along the belt seem tobe closely associated with structural complexity, which can be auto-matically identified from the regional aeromagnetic data.
3.2.3. Sensitivity to parametersThe structural complexity detection algorithms use a number of
parameters to control the behaviour. For feature intersection density,perhaps the most significant parameter is the distance threshold (r inFig. 3) that controls the separation tolerance distance between twofeatures when determining their intersection. Fig. 9a and b showsthe resulting feature intersection density heat maps with a significantincrease in the distance threshold, from 240 m to 480 m (cf, Fig. 8awith a distance threshold of 120 m) for the Kirkland Lake dataset.The figures show that the results are not significantly different fortwo different parameter values on this dataset. However, they indi-cate that as the allowable tolerance distance becomes larger, a greaterarea is highlighted as structurally complex.
Please cite this article as: Holden, E.-J., et al., Identifying structural comfields gold exploration, Ore Geol. Rev. (2012), doi:10.1016/j.oregeorev.2
For feature orientation diversity, we tested the impact of the win-dow size parameter using two different values. This parameter con-trols the size of the local area within which lineaments areanalysed. Fig. 10a and b shows the resulting orientation diversityheat maps for window sizes of 1 km×1 km and 1.4 km×1.4 km, re-spectively (cf, Fig. 8b with 1.2 km×1.2 km) for the Kirkland Lakedataset. These figures show that the larger window size resulted ina greater area being assigned high orientation diversity while thesmaller window size resulted in better localisation of the areas withhigh orientation diversity. Note that smoothing of each of the heatmaps used a Gaussian filter with a standard deviation that is relativeto the window size, which also affected the localisation.
4. Concluding remarks
4.1. Summary
This contribution presents an image processing method to gener-ate maps that highlight regions of geological structural complexityfrom aeromagnetic data, efficiently and objectively. Mineral explora-tion decisions are always based on a combined analysis of multipledatasets, typically geology, geophysics, geochemistry and satellite
plexity in aeromagnetic data: An image analysis approach to green-011.11.002
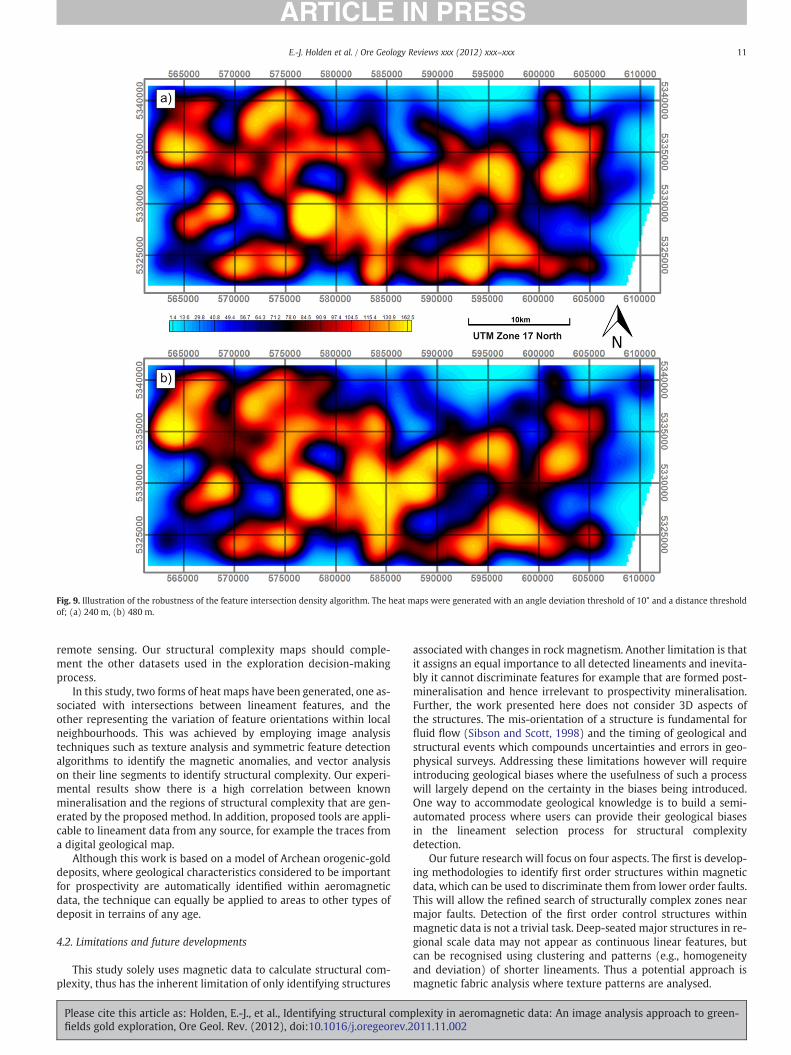
Fig. 9. Illustration of the robustness of the feature intersection density algorithm. The heat maps were generated with an angle deviation threshold of 10° and a distance thresholdof; (a) 240 m, (b) 480 m.
11E.-J. Holden et al. / Ore Geology Reviews xxx (2012) xxx–xxx
remote sensing. Our structural complexity maps should comple-ment the other datasets used in the exploration decision-makingprocess.
In this study, two forms of heat maps have been generated, one as-sociated with intersections between lineament features, and theother representing the variation of feature orientations within localneighbourhoods. This was achieved by employing image analysistechniques such as texture analysis and symmetric feature detectionalgorithms to identify the magnetic anomalies, and vector analysison their line segments to identify structural complexity. Our experi-mental results show there is a high correlation between knownmineralisation and the regions of structural complexity that are gen-erated by the proposed method. In addition, proposed tools are appli-cable to lineament data from any source, for example the traces froma digital geological map.
Although this work is based on a model of Archean orogenic-golddeposits, where geological characteristics considered to be importantfor prospectivity are automatically identified within aeromagneticdata, the technique can equally be applied to areas to other types ofdeposit in terrains of any age.
4.2. Limitations and future developments
This study solely uses magnetic data to calculate structural com-plexity, thus has the inherent limitation of only identifying structures
Please cite this article as: Holden, E.-J., et al., Identifying structural comfields gold exploration, Ore Geol. Rev. (2012), doi:10.1016/j.oregeorev.2
associated with changes in rock magnetism. Another limitation is thatit assigns an equal importance to all detected lineaments and inevita-bly it cannot discriminate features for example that are formed post-mineralisation and hence irrelevant to prospectivity mineralisation.Further, the work presented here does not consider 3D aspects ofthe structures. The mis-orientation of a structure is fundamental forfluid flow (Sibson and Scott, 1998) and the timing of geological andstructural events which compounds uncertainties and errors in geo-physical surveys. Addressing these limitations however will requireintroducing geological biases where the usefulness of such a processwill largely depend on the certainty in the biases being introduced.One way to accommodate geological knowledge is to build a semi-automated process where users can provide their geological biasesin the lineament selection process for structural complexitydetection.
Our future research will focus on four aspects. The first is develop-ing methodologies to identify first order structures within magneticdata, which can be used to discriminate them from lower order faults.This will allow the refined search of structurally complex zones nearmajor faults. Detection of the first order control structures withinmagnetic data is not a trivial task. Deep-seated major structures in re-gional scale data may not appear as continuous linear features, butcan be recognised using clustering and patterns (e.g., homogeneityand deviation) of shorter lineaments. Thus a potential approach ismagnetic fabric analysis where texture patterns are analysed.
plexity in aeromagnetic data: An image analysis approach to green-011.11.002
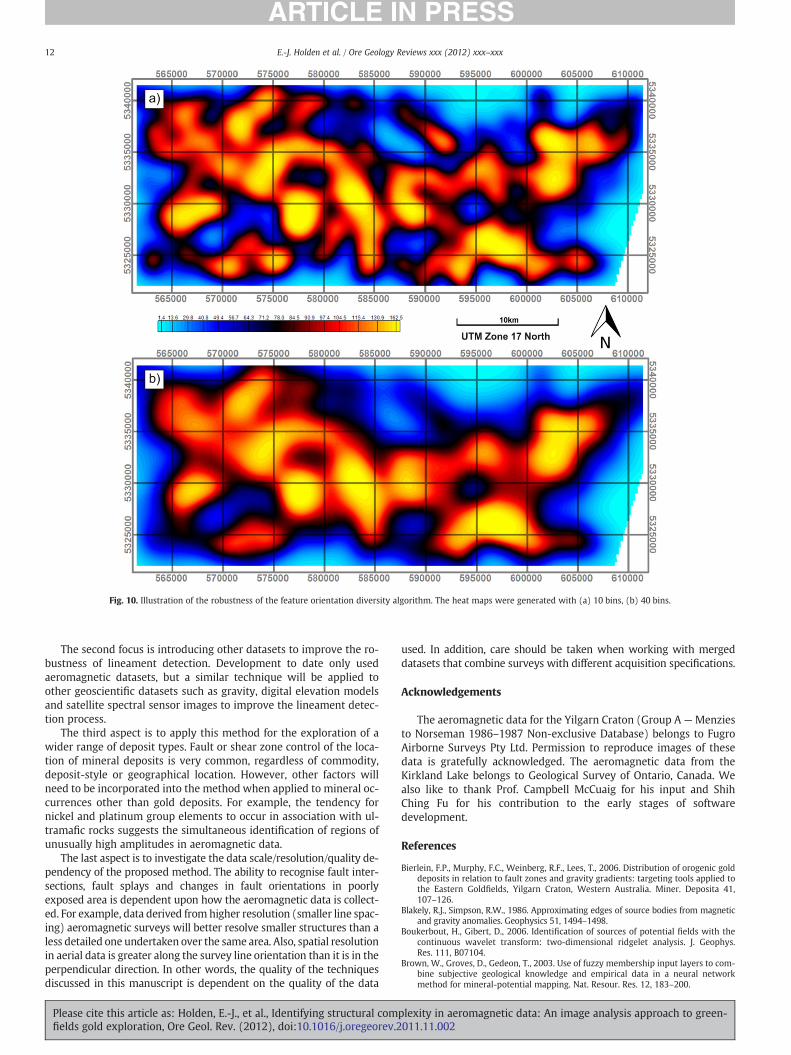
Fig. 10. Illustration of the robustness of the feature orientation diversity algorithm. The heat maps were generated with (a) 10 bins, (b) 40 bins.
12 E.-J. Holden et al. / Ore Geology Reviews xxx (2012) xxx–xxx
The second focus is introducing other datasets to improve the ro-bustness of lineament detection. Development to date only usedaeromagnetic datasets, but a similar technique will be applied toother geoscientific datasets such as gravity, digital elevation modelsand satellite spectral sensor images to improve the lineament detec-tion process.
The third aspect is to apply this method for the exploration of awider range of deposit types. Fault or shear zone control of the loca-tion of mineral deposits is very common, regardless of commodity,deposit-style or geographical location. However, other factors willneed to be incorporated into the method when applied to mineral oc-currences other than gold deposits. For example, the tendency fornickel and platinum group elements to occur in association with ul-tramafic rocks suggests the simultaneous identification of regions ofunusually high amplitudes in aeromagnetic data.
The last aspect is to investigate the data scale/resolution/quality de-pendency of the proposed method. The ability to recognise fault inter-sections, fault splays and changes in fault orientations in poorlyexposed area is dependent upon how the aeromagnetic data is collect-ed. For example, data derived from higher resolution (smaller line spac-ing) aeromagnetic surveys will better resolve smaller structures than aless detailed one undertaken over the same area. Also, spatial resolutionin aerial data is greater along the survey line orientation than it is in theperpendicular direction. In other words, the quality of the techniquesdiscussed in this manuscript is dependent on the quality of the data
Please cite this article as: Holden, E.-J., et al., Identifying structural comfields gold exploration, Ore Geol. Rev. (2012), doi:10.1016/j.oregeorev.2
used. In addition, care should be taken when working with mergeddatasets that combine surveys with different acquisition specifications.
Acknowledgements
The aeromagnetic data for the Yilgarn Craton (Group A — Menziesto Norseman 1986–1987 Non-exclusive Database) belongs to FugroAirborne Surveys Pty Ltd. Permission to reproduce images of thesedata is gratefully acknowledged. The aeromagnetic data from theKirkland Lake belongs to Geological Survey of Ontario, Canada. Wealso like to thank Prof. Campbell McCuaig for his input and ShihChing Fu for his contribution to the early stages of softwaredevelopment.
References
Bierlein, F.P., Murphy, F.C., Weinberg, R.F., Lees, T., 2006. Distribution of orogenic golddeposits in relation to fault zones and gravity gradients: targeting tools applied tothe Eastern Goldfields, Yilgarn Craton, Western Australia. Miner. Deposita 41,107–126.
Blakely, R.J., Simpson, R.W., 1986. Approximating edges of source bodies from magneticand gravity anomalies. Geophysics 51, 1494–1498.
Boukerbout, H., Gibert, D., 2006. Identification of sources of potential fields with thecontinuous wavelet transform: two-dimensional ridgelet analysis. J. Geophys.Res. 111, B07104.
Brown, W., Groves, D., Gedeon, T., 2003. Use of fuzzy membership input layers to com-bine subjective geological knowledge and empirical data in a neural networkmethod for mineral-potential mapping. Nat. Resour. Res. 12, 183–200.
plexity in aeromagnetic data: An image analysis approach to green-011.11.002

13E.-J. Holden et al. / Ore Geology Reviews xxx (2012) xxx–xxx
Cella, F., Fedi, M., Florio, G., 2009. Toward a full multiscale approach to interpret poten-tial fields. Geophys. Prospect. 57, 543–557.
Cooper, G.R.J., Cowan, D.R., 2006. Enhancing potential field data using filters based onthe local phase. Comput. Geosci. 32, 1585–1591.
Core, D., Buckingham, A., Belfield, S., 2009. Detailed structural analysis of magnetic data—done quickly and objectively. SGEG Newsletter. . (April).
Dentith, M., 2000. Texture analysis of aeromagnetic data. Proceedings AustralianSociety of Exploration Geophysicists (ASEG) 2000 Aeromagnetics — State of theArt Enhancement Workshop. Cowan Geodata Services, pp. 115–128.
DeSouza, G.N., Kak, A.C., 2002. Vision for mobile robot navigation: a survey. IEEE Trans-actions on Pattern Analysis and Machine Intelligence, Vol. 24, No. 2. (February).
Dhu, T., Dentith, M.C., Hillis, R.R., 1999. The use of fractal dimension estimators for en-hancing airborne aeromagnetic data. Explor. Geophys. 30, 33–37.
Fedi, M., 2002. Multiscale derivative analysis: a new tool to enhance detection of grav-ity source boundaries at various scales. Geophys. Res. Lett. 29, 1029 16.1–16.4.
Ford, A., Blenkinsop, T.G., 2008. Combining fractal analysis of mineral deposit cluster-ing with weights of evidence to evaluate patterns of mineralisation: applicationto copper deposits of the Mount Isa Inlier, NW Queensland, Australia. Ore Geol.Rev. 33, 435–450.
Frodeman, R., 1995. Geological reasoning: geology as an interpretive and historical sci-ence. Geol. Soc. Am. Bull. 107, 960–968.
Gardoll, S.J., Groves, D.I., Knox-Robinson, C.M., Yun, G.Y., Elliott, N., 2000. Develop-ing the tools for geological shape analysis, with regional- to local-scale exam-ples from the Kalgoorlie terrane of Western Australia. Aust. J. Earth Sci. 47,943–953.
Gholipour, A., Kehtarnavaz, N., Briggs, R., Devous, M., Gopinath, K., 2007. Brain func-tional localization: a survey of image registration techniques. IEEE Trans. Med. Im-aging 26, 427.
Groves, D.I., Goldfarb, R.J., Gebre-Mariam, M., Hagemann, S.G., Robert, F., 1998. Orogenicgold deposits: a proposed classification in the context of their crustal distributionand relationship to other gold deposit types. Ore Geol. Rev. 13, 1–27.
Groves, D.I., Goldfarb, R.J., Knox-Robinson, C.M., Ojala, J., Gardoll, S., Yun, G.Y., Holyland,P., 2000. Late-kinematic timing of orogenic gold deposits and significance ofcomputer-based exploration techniques with emphasis on the Yilgarn Block,Western Australia. Ore Geol. Rev. 17, 1–38.
Hodkiewicz, P.F., Wenberg, R.F., Cardoll, S.J., Groves, D.I., 2005. Complexity gradients inthe Yilgarn Craton: fundamental controls on crustal-scale fluid flow and the forma-tion of world-class orogenic-gold deposits. Aust. J. Earth Sci. 52, 831–841.
Holden, E.J., Dentith, M., Kovesi, P., 2008. Towards the automatic analysis of regionalaeromagnetic data to identify regions prospective for gold deposits. Comput.Geosci. 34, 1505–1513.
Holden, E.J., Kovesi, P., Dentith, M.C., Wedge, D., Wong, J., Fu, S.C., 2010a. Detection ofregions of structural complexity within aeromagnetic data using image analysis.Proceedings of Image Vision Computing New Zealand, Queenstown, New Zealand(November).
Holden, E.J., Dentith,M., Kovesi, P., 2010b. CETGridAnalysis Extension. Available fromGeo-soft http://www.geosoft.com/about-geosoft/partners/geosoft-partner-network/cet.
Holden, E.J., Fu, S.C., Kovesi, P., Dentith, M.C., Bourne, B., Hope, M., 2011. Automaticidentification of responses from porphyry intrusive systems within magneticdata using image analysis. J. Appl. Geophys. 74, 255–262.
Hronsky, J.M.A., Groves, D.I., 2008. Science of targeting: definition, strategies, targetingand performance measurement. Aust. J. Earth Sci. 55, 3–12.
Please cite this article as: Holden, E.-J., et al., Identifying structural comfields gold exploration, Ore Geol. Rev. (2012), doi:10.1016/j.oregeorev.2
Ispolatov, V., Lafrance, B., Dubé, B., Creaser, R., Hamilton, M., 2008. Geologic and struc-tural setting of gold mineralization in the Kirkland Lake–Larder Lake gold belt,Ontario. Econ. Geol. 103, 1309–1340.
Knox-Robinson, C.M., Groves, D.I., 1997. Gold prospectivity mapping using a geographicinformation system (GIS) with examples from the Yilgarn Block of WesternAustralia. Chronique de la Recherche Minière 529, 127–138.
Kovesi, P., 1997. Symmetry and asymmetry from local phase. In: Sattar, A. (Ed.), Proceed-ings The Tenth Australian Joint Conference on Artificial Intelligence. Springer-Verlag,London, UK, pp. 185–190.
Lam, L., Lee, S.-W., Suen, C.Y., 1992. Thinning methodologies — a comprehensivesurvey. IEEE Trans. Pattern Anal. Mach. Intell. 14, 869–885.
McCuaig, T.C., Kerrich, R.W., 1994. P–T–t–deformation-fluid characteristics of lode golddeposits: evidence from alteration systematic. In: Lentz, D.R. (Ed.), Alteration andAlteration Processes Associated with Ore-forming Systems: Geological Associationof Canada, Short Course Notes, Volume 11.
Parker, J.R., 1997. Algorithms for Image Processing and Computer Vision. John Wiley &Sons Inc., USA. 417 pp.
Pirajno, F., Bagas, L., 2008. Are view of Australia's Proterozoic mineral systems and ge-netic models. Precambrian Res. 166, 54–80.
Porwal, A.K., Kreuzer, O.P., 2010. Introduction to the Special Issue: mineralprospectivity analysis and quantitative resource estimation. Ore Geol. Rev. 38,121–127.
Robert, F., Poulsen, K.H., 1997. World-class Archaean gold deposits in Canada: an over-view. Aust. J. Earth Sci. 44, 329–351.
Sibson, R.H., Scott, J., 1998. Stress/fault controls on the containment and releaseof overpressured fluids: examples from gold–quartz vein systems in Juneau,Alaska; Victoria, Australia and Otago, New Zealand. Ore Geol. Rev. 13,293–306.
Solomon, M., Groves, D.I., 1994. The Geology and Origin of Australia's Mineral Deposits.Oxford Monographs on Geology and Geophysics. Oxford University Press, Oxford,UK, Oxford.
Swager, C.P., Griffin, T.J., Witt, W.K., Wyche, S., Ahmat, A.L., Hunter, W.M., McGoldrick,P.J., 1995. Geology of the Archaean Kalgoorlie Terrane — an explanatory note. Geo-logical Survey of Western Australia Report, 48. 26 pp.
Sykes, M.P., Das, U.C., 2000. Directional filtering for linear feature enhancement in geo-physical maps. Geophysics 65, 1758–1768.
Tuia, D., Camps-Valls, G., 2009. Recent advances in remote sensing image processing.Proceedings of the 16th IEEE International Conference on Image Processing(ICIP), pp. 3705–3708.
Weinberg, R.F., Hodkiewicz, P.F., Groves, D.I., 2004. What controls gold distribution inArchean terranes? Geology 32, 545–548.
Wilkinson, L., Cruden, A.R., Krogh, T.E., 1999. Timing and kinematics of post-Timiskaming deformation within the Larder Lake–Cadillac deformation zone,southwest Abitibi greenstone belt, Ontario, Canada. Can. J. Earth Sci. 36, 627–647.
Witt, W.K., Vanderhor, F., 1998. Diversity within a unified model for Archaean goldmineralisation in the Yilgarn Craton of Western Australia: an overview of thelate-orogenic, structurally controlled gold deposits. Ore Geol. Rev. 13, 29–64.
Wyche, S., Kalgoorlie, W.A., 1998. (2nd Edition). Geological survey of Western Australia1:250,000 geological series explanatory notes, 3lp.
Zhao, J., Chen, S., Zuo, R., Carranza, E.J.M., 2011. Mapping complexity of spatial distribu-tion of faults using fractal and multifractal models: vectoring towards explorationtargets. Comput. Geosci. doi:10.1016/j.cageo.2011.04.007
plexity in aeromagnetic data: An image analysis approach to green-011.11.002