identifying key factors affecting success in international food
TRANSCRIPT

Identifying Key Factors Affecting Success in
International Food Product Markets
The contribution of migration and tourism to international food product trade,
a model for modern international food consumption, and
results from a comparative survey of international food product marketers from Germany and Australia
Christian Fischer

Inauguraldissertation zu Erlangung des akademischen Grades
Doktor der Agrarwissenschaften - Dr. agr. -
des Fachbereichs Agrarwissenschaften, Oecotrophologie und Umweltmanagement (FB09)
der Justus-Liebig-Universität Giessen
Dekan: Prof. Dr. P. M. Schmitz
1. Gutachter: Prof. Dr. P. M. Schmitz
2. Gutachter: Prof. Dr. R. Herrmann
Tag der mündlichen Prüfung: 19.09.2002

ZUSAMMENFASSUNG
Schlüsselwörter:
Internationaler Handel, verarbeitete Agrarprodukte, Ernährungsindustrie, Immigration, Tourismus, Fehler-
Korrektur-Modelle, internationales Management, Deutschland, Australien, Clusteranalyse, Faktorenanalyse,
Diskriminanzanalyse.
Ziel dieser Studie ist eine Analyse der Globalisierung von Lebensmittelmärkten am Ende des 20. Jahr-
hunderts. Die Arbeit ist in zwei Hauptteile gegliedert: Der erste analysiert internationale Lebens-
mittelmärkte auf der aggregierten Ebene und der zweite Teil handelt vom internationalen Lebensmittel-
handelsmanagement auf der Firmenebene. Der internationale Handel mit verbrauchernahen, verarbeiteten
Agrarprodukten ist heutzutage das hauptsächliche Wachstumssegment im weltweiten Agrarhandel, aber es
existiert kaum ein geschlossenes theoretisches Rahmenwerk, um diese Art von Handel umfassend zu
erklären. Die Studie stellt vorhandene Theorien dar und ergänzt sie mit einem neuen Erklärungsansatz: Der
Beitrag von Immigration und internationalem Tourismus zum internationalen Lebensmittelhandel. Hierzu
wird die deutsche Importnachfrage von verschiedenen verarbeiteten Agrarprodukten aus verschiedenen
Herkunftsländern anhand eines ökonometrischen Fehlerkorrekturmodells geschätzt. Die Ergebnisse zeigen,
dass Immigration nach Deutschland und Tourismusaktivitäten von Deutschen in die Herkunftsländer der
importierten Waren im Zeitraum 1967 bis 1990 tatsächlich zur Erklärung der Importströme beigetragen
haben. In einem weiteren Abschnitt der Studie wird ein algebraisches Modell für den modernen,
internationalen Lebensmittelkonsum vorgestellt, welches als dynamisches Nutzenakkumulations-Modell
spezifiziert ist, in Gegensatz zum statischen Budgetallokations-Ansatz der herkömmlichen mikro-
ökonomischen Verbrauchstheorie. Mit diesem Modell lassen sich zum Beispiel die Konvergenz des
Lebensmittelverbrauchs in verschiedenen Ländern oder Erfolgsfaktoren in der internationalen
Lebensmittelvermarktung erklären. Der zweite große Teil der Studie präsentiert Ergebnisse einer
Unternehmensumfrage von internationalen Lebensmittelvermarktern aus Deutschland und Australien. Die
Umfragen wurden 1998 (Deutschland) und 1999 (Australien) durchgeführt. Die Ergebnisse der Umfragen,
welche auf einer Stichprobengröße von 166 beruhen, zeigen, dass die Aus- und Weiterbildung des Personals
und die Beherrschung der internationalen Handelslogistik bedeutend für den Erfolg in internationalen
Lebensmittelmärkten sind.


ACKNOWLEDGEMENTS
The following study was written over a period of four years in different places all over the world. It
commenced in Giessen/Germany where the idea for the study had already been born during the preparation
period for my diploma examination in Food Economics. The questionnaire design and conducting the survey
of German companies took place in Munich while I was working as an Assistant to the Director of a medium-
sized import and retail company of Italian food products. The survey of the Australian food companies was
carried out during my course in International Economics at the Centre for International Economic Studies of
The University of Adelaide. Unfortunately, the preparation of the survey took much of the already scarce
spare time away which I would have preferred to spend with my Chinese study colleagues who were
selected to prepare China's entry to the WTO. Adelaide was also the place of several weeks of intensive
literature search in the excellent Barr-Smith Library of the University. Back to Munich, the very first section
on the classifications of food products was written. During a following two-months stay in Helsinki/Finland I
was able to write the second part on the significance of international trade in food products and foreign
direct investments in the food industries. Then, against our original plans, my partner Anita and I left for
Atherton near Cairns/Australia where our son was to be born. Here, on a volcanic tableland in the tropics,
the most important parts of the study � the chapter on the contribution of tourism and immigration to the
international trade in food products, and the chapter on food consumption in the 21st century � were
completed, while I waited for five months for my residence visa and my working permit. At the same time I
prepared for the entrance test of a Specialised Master's course in Agribusiness Management (Mastère
Specialisé Management Agro-Industriel) at the Lyons' Graduate School of Management (EM Lyon) and the
École Nationale Supérieure Agronomique (ENSAM) in Montpellier. In order to pass the test, I had to fly to
Lyons. I was accepted to the course and most of the section on the management of international trade in
food products at the company level were written during the three months of general management training in
Lyons, and during the more specific agribusiness administration courses in Montpellier. I finished the rest of
this section after I took a position as a Senior Researcher with food, drink and agribusiness focus for the
consumer practice of The Boston Consulting Group in Munich. Finally, the section on the economic structure
of the international food industry and the remaining pages were also written during this period.
My deep thanks go first of all to Prof. P.M Schmitz and Prof. R. Herrmann for granting me the
freedom of the choice of the topic and of the structure of the study � the freedom that a young man
perhaps needs to explore the world. I would also like to thank Prof. Kym Anderson of The University of
Adelaide for supporting me, also financially, in conducting the survey of the Australian companies. Many
thanks go to Tobias Wronka, a university friend and assistant to Prof. Schmitz, who helped me greatly not to
loose contact with the academic world while I was involved in more practical tasks. I am also very grateful
to my parents, and in particular to my Dad who, although he was not always convinced of the things I was
doing, never stopped to help me out at the right moments. A big thank you deserve my partner's family
who welcomed us so warmly and prepared everything so wonderfully when we arrived in tropical
Queensland for the birth of our child. But above all, I am grateful to my partner and wife Anita, who had to
put up with many hours of our time of me not being mentally there but in my study. I devote this long
piece of work to Sándor, my lovely son.


CONTENTS vii
CONTENTS
CONTENTS ____________________________________________________________________________ vi
EXECUTIVE SUMMARY ___________________________________________________________________ ix
REFERENCES ________________________________________________________________________ 240
LIST OF TABLES AND FIGURES __________________________________________________________ 255
APPENDIX __________________________________________________________________________ 259
1 INTRODUCTION _____________________________________________________________________ 1
2 ANALYSING INTERNATIONAL FOOD PRODUCT MARKETS AT THE AGGREGATE LEVEL:
PRODUCT CONSIDERATIONS, TRADE AND INVESTMENT DIMENSIONS, AND
PRODUCTION AND CONSUMPTION DETERMINANTS _________________________________________ 3
2.1 Non-homogeneous good food______________________________________________________ 3
2.1.1 Technological classifications __________________________________________________ 4
2.1.1.1 Agricultural commodities or primary products_____________________________ 4
2.1.1.2 Perishable product distribution ________________________________________ 4
2.1.1.3 Primary and secondary food processing _________________________________ 5
2.1.1.4 Manufactured foods and industrial food products __________________________ 5
2.1.2 Economic classifications _____________________________________________________ 6
2.1.2.1 Defining a commodity _______________________________________________ 6
2.1.2.2 High-value foods (HVF or HVP) ________________________________________ 7
2.1.2.3 High value-added foods ______________________________________________ 7
2.1.3 Other classifications ________________________________________________________ 8
2.1.3.1 A simple three-stage classification _____________________________________ 8
2.1.3.2 Standard International Trade Classification (SITC) for food items _____________ 8
2.1.4 Summary _______________________________________________________________ 10

viii CONTENTS
2.2 The significance of international trade in food products and
foreign direct investments in the food industries ______________________________________ 11
2.2.1 International trade in food products ___________________________________________ 11
2.2.1.1 Worldwide overview and the most important countries _____________________ 11
2.2.1.2 The main products _________________________________________________ 21
2.2.1.3 Intra-industry trade ________________________________________________ 24
2.2.1.4 Prospects_________________________________________________________ 26
2.2.2 Foreign direct investment (FDI) in food industries ________________________________ 27
2.2.3 Summary ________________________________________________________________ 30
2.3 Justifying and explaining international activities of food product industries __________________ 32
2.3.1 International trade in food products � Why it is beneficial__________________________ 32
2.3.2 Explaining international trade in food products___________________________________ 36
2.3.2.1 Traditional trade theory and comparative advantage_______________________ 36
2.3.2.2 New trade theory and intra-industry trade_______________________________ 39
2.3.2.3 Industrial competitive advantages _____________________________________ 46
2.3.2.4 The role of demand and the contribution of international
migration and tourism to food product trade _____________________________ 50
2.3.2.4.1 Theoretical foundations _____________________________________ 51
2.3.2.4.2 Empirical evidence for the case of Germany _____________________ 61
2.3.3 Explaining foreign direct investments (FDI) in the food industries ____________________ 85
2.3.4 Summary and conclusions ___________________________________________________ 93
2.4 The economic structure of the international food industry and
food consumption in the 21st century ______________________________________________ 99
2.4.1 The economic structure of the international food industry __________________________ 99
2.4.1.1 Size and significance of food manufacturing in the economy________________ 100
2.4.1.2 Productivity and economies of size____________________________________ 105
2.4.1.3 Variable costs, sunk costs and transaction costs _________________________ 109
2.4.1.4 The world's main actors and export performance of German food industries ___ 116
2.4.1.5 Trade barriers ____________________________________________________ 120
2.4.1.6 Summary and conclusions __________________________________________ 122
2.4.2 Food consumption in the 21st century ________________________________________ 124
2.4.2.1 Current topics in international food consumption_________________________ 124
2.4.2.2 Explaining international food consumption______________________________ 129
2.4.2.2.1 Traditional microeconomic consumption modelling_______________ 129
2.4.2.2.2 A dynamic model for modern food consumption_________________ 135
2.4.2.3 Implications for consumers and international food product marketers ________ 144
2.4.2.4 Summary and conclusions __________________________________________ 149
2.5 Chapter conclusions____________________________________________________________ 151

CONTENTS ix
3 MANAGING INTERNATIONAL FOOD PRODUCT TRADE AT THE COMPANY LEVEL:
THEORY, AND RESULTS FROM A SURVEY OF INTERNATIONAL FOOD
PRODUCT MARKETERS FROM GERMANY AND AUSTRALIA ___________________________________ 155
3.1 The theory of international food product trade management____________________________ 155
3.1.1 Managing food product trade � theory and previous research findings ______________ 156
3.1.1.1 Theoretical foundations ____________________________________________ 156
3.1.1.2 Empirical findings from the literature _________________________________ 161
3.1.2 Specific management problems related to food product exports ____________________ 164
3.1.2.1 Education and training, foreign language skills, and knowledge of
foreign business partners' mentality __________________________________ 164
3.1.2.2 Trade fair activities _______________________________________________ 166
3.1.2.3 Special logistics and marketing problems ______________________________ 166
3.1.2.4 Trade terms, export documentation and billing, and foreign exchange risks ___ 168
3.1.2.5 Foreign market information _________________________________________ 172
3.1.2.6 Government assistance ____________________________________________ 173
3.1.3 Summary ______________________________________________________________ 173
3.2 Empirical results from a survey of international food product marketers
from Germany and Australia ____________________________________________________ 174
3.2.1 Questionnaire design and carrying out of survey ________________________________ 175
3.2.2 Methodological considerations ______________________________________________ 177
3.2.2.1 Testing for group differences________________________________________ 178
3.2.2.2 Factor analysis ___________________________________________________ 181
3.2.2.3 Cluster analysis __________________________________________________ 184
3.2.2.4 Multiple discriminant analysis _______________________________________ 187
3.2.3 Survey results___________________________________________________________ 191
3.2.3.1 General questions about the company ________________________________ 191
3.2.3.2 Foreign business performance _______________________________________ 196
3.2.3.3 Foreign business qualification _______________________________________ 200
3.2.3.4 Trade fair activities _______________________________________________ 205
3.2.3.5 Food product-related questions (logistics and marketing problems)__________ 209
3.2.3.6 Trade and payment terms __________________________________________ 216
3.2.3.7 The provision of information ________________________________________ 220
3.2.3.8 Government assistance ____________________________________________ 221
3.2.3.9 Overall comparative assessment _____________________________________ 223
3.2.3.10 The relationship between success factors and foreign business performance___ 229
3.2.4 Summary ______________________________________________________________ 234
3.3 Chapter conclusions ___________________________________________________________ 238

x EXECUTIVE SUMMARY
EXECUTIVE SUMMARY
Key words:
International trade, food products, food industry, immigration, tourism, error-correction models,
international management, Germany, Australia, cluster analysis, factor analysis, discriminant analysis.
This study explores globalisation of food and drink product markets at the end of the millennium. It is
divided into two main parts: the first analyses international food product markets at the aggregate level, and
the other deals with the management of international food product trade at the company level.
International trade in consumer-oriented food and drink items is today the main driver of worldwide
agricultural trade, however no complete theoretical framework exists to explain this kind of trade. This
study reviews existing theories and complements them with a new approach of explaining international trade
of food and drink products: the contribution of immigration and tourism in international food product trade.
Moreover, a model of modern international food consumption is presented, specified as a dynamic utility
accumulation model, as opposed to the static budget allocation approach of tradition microeconomic
consumption theory. Finally, results from a survey of German and Australian international food product
marketers are presented, which show that staff education/training and logistics are crucial for the success in
international food product markets.
The non-homogenous good food can be categorised into seven sub-groups, which may be quite
different with regard to the nature of the international trade and investment patterns that occur in these
product groups: (i) undifferentiated agricultural commodities which are generally price sensitive and bulky;
(ii) fresh perishable foods which are difficult to transport, but thanks to improved logistics, international
trade in these products has been growing rapidly, (iii) processed foods which through technological
manipulation are products either made edible through the separation of edible and non-edible parts, or
which are altered in texture, taste, shelf-life, etc., and where international trade of these products has often
only been made possible through a prolonged product life as a result of processing; (iv) manufactured foods,
as a preparation or mix of different ingredients, and where the way these foods are prepared or the
particular combination of ingredients may in many cases be "culturally-bound", thus putting potential
restrictions on the international marketability of these foods; (v) industrially produced food products (or
consumer-packaged foods) which in general cannot be produced in household kitchens, for which branding is
very important, and which very often may be designed from the very start by large international food and
drink corporations to be sold globally. Furthermore, there are also the concepts of (vi) high-value foods,
which are characterised by higher selling price levels and higher income elasticities of demand than the
average basic foods, and (vii) high value-added foods, where value-adding very often may go hand in hand
with higher degrees of processing, but sometimes branding alone can already increase the market value of a
food product considerably. This study deals with globalisation in consumer-oriented food and drink product
markets only, i.e. international trade in undifferentiated agricultural commodities is not treated.

EXECUTIVE SUMMARY xi
World trade in consumer-oriented food and drink products has grown significantly during the
last decades. In addition, trade in these products now represent the largest part of the value of global
agricultural shipments, thus making that trade in bulk agricultural commodities can no longer be taken as a
valid indicator for the world's total agricultural trade. The European Union is the most significant supplier of
these food products, with France, the Netherlands, Germany, the UK, and Italy all being among the eight
leading export nations of consumer-oriented food in 1996. If some basic agricultural commodities and
tobacco products are also included, the US was the largest food exporter in that year. However, in using a
more suitable aggregation, which includes processed foods, beverages and fats only, France and the
Netherlands end up far ahead of the US. In net exports and per capita terms, the Netherlands seems the
most competitive consumer-oriented food exporting nation, followed by France and Australia. The export
structure of leading food product trading nations reveals that diversity, i.e. non-specialisation in only one or
two food categories, seems important for gaining a leadership position. The most important consumer-
oriented food and drink products that were exported worldwide in 1994-95 were meat, followed by alcoholic
beverages, and fruit and vegetables. Fish and fish preparations were the products in which developing
countries hold the highest shares in world exports. The products with the highest annual growth rates,
apart from shell fish fresh, frozen, are all highly processed, such as food and cereal preparations, non-
alcoholic beverages, and chocolate and sugar products. Intra-industry trade, i.e. the simultaneous exchange
of similar goods between two countries, made up almost half of the trade of the European Union in food and
beverages in the early 1990s. Belgium, Germany, the Netherlands, and France traded even more than 50%
of their food and drink products in the intra-industry type of trade. Between the US and the EU, intra-
industry trade was especially important in food preparations, fresh meat, breakfast cereals, and canned fruit
and vegetables, whereas for wines, soft drinks, pasta, cheese, and snack foods trade was mainly of the
inter-industry type. However, these trade patterns depend on the countries or trade blocs between which
products are exchanged rather than on the products themselves. This can be explained with the existence
of high transport costs which may act as a significant barrier to very long-distance trade in many products
and thus resulting in the fact that most processed food trade is of an intra-regional nature (e.g. EU, NAFTA,
East Asia). Prospects for future trade in consumer-oriented, processed and high-value foods are positive.
World food demand is expected to rise with a further growing world population and the likely increase in real
incomes for most of the world population supports the shift to more processed and value-added foods.
Comprehensive quantitative studies support this view in predicting strong growth in trade in processed food.
Foreign direct investments in food industries have expanded strongly during the past and, as a
result, today's foreign affiliate sales worldwide exceed processed food exports by about a factor of 5.
However, not in all countries is FDI equally important: it is mainly found in a few, mainly Anglo-American,
nations. Nevertheless, in recent years, France and the Netherlands in particular have emerged as new and
increasingly important foreign food industry investors. Moreover, recent data suggest that FDI in the food
industry, although in absolute terms strongly growing, has relatively grown slower than the total FDI
average. Also, globally, only a few � western � countries are the main food industry investors, and these
countries were able to increase their significance even more during 1988 to 1997. And, most of the food
industry's investments go to developed countries, thus leaving developing countries � similar to the
international trade situation � more and more behind.

xii EXECUTIVE SUMMARY
Benefits from international trade in food products that arise are � apart from the general
gains from trade such as increases in consumption possibilities and in production efficiency due to
specialisation � also specific to this particular market. These special benefits, however, may be largest for
consumers who gain through a greater variety of available food products and, very often, through cheaper
prices. For producers, welfare gains from trade liberalisation are not guaranteed. On the one hand they can
gain access to foreign markets, but on the other hand, there is also the risk that producers may lose
domestic customers to foreign competitors. This is especially true in the food product markets of
industrialised economies where food consumption has become mostly income inelastic. Markets are
saturated because consumers are not hungry anymore and thus, with stagnating population growth, total
demand for calories has stopped to increase. As a consequence, for every foreign food product that comes
on a domestic market, a local product may not be sold. Thus, inefficient producers may be driven out of the
market as a result of increased competition due to international trade. Finally, society as a whole may gain
when peoples move closer together as a result of international trade in food products, which, very often, can
be seen as culturally-bound goods. With each foreign food product that domestic consumers start to
appreciate (e.g. Italian pasta or French wine), mutual understanding may grow and thus risk of conflict
might be reduced.
Traditional trade theory is mainly preoccupied with production side determinants of international
trade and examines how economies actually should trade in order to render the global economy efficient.
However, it is also the most developed theoretical framework which is in particular useful for analysing
issues of trade policy and welfare implications of international trade. Traditional trade theory is based on
the assumption that countries are different in production technology (Ricardo case), or in factor endowments
such as human, physical, and financial resources, and the opportunity cost of using these factors to produce
(and to market) several goods (Heckscher-Ohlin case). These differences then give rise to comparative
advantages in production which are seen as the cause of why goods are exported (or at least why they
should be exported). In particular, the Heckscher-Ohlin theorem states that a country will export the
commodity whose production uses the factor intensively with which a nation is relatively abundantly
endowed. One might argue that food processing or manufacturing, as opposed to agricultural production
which is dependent on arable land resources and on suitable climate, is a comparatively basic industrial
activity which does not in any case depend on a country's resources (take the production of chocolate as an
example) and therefore in which it is difficult to imagine that a single country could develop a strong
comparative production advantage. This is even the more so, since food manufacturing is (1) a necessary
human activity which in general has always been located near where people work and live, and (2) it is also
a culturally influenced activity, i.e. the way food products are produced and distributed can be important for
local people. That is, very often not only production efficiency counts but also local traditions and cultural
aspects of food manufacturing. Therefore, it should be clear that standard trade theory may not be able to
provide a complete understanding of what actually happens in international food product markets. However,
this theory may be helpful to understand trade in non-differentiated raw products such as agricultural
commodities. In addition, the theory may also be appropriate when applied to the existing inter-industry
kind of trade in high-value foods such as � typically unbranded � fresh fruit and vegetable, fresh meat and
fish or oils and fats. Furthermore, comparative cost advantage in production may be important for
intermediate products which are used as inputs for further processing/manufacturing in the food industries
and where price may be the most important purchasing factor. For the trade of highly differentiated

EXECUTIVE SUMMARY xiii
consumer food products, however, "world market prices" may not be the major determinant, since non-price
factors such as quality aspects, brand image, pre- and after sales customer service, etc. have become more
and more important. Here another approach is needed to explain existing trade pattern, in particular as
traditional trade theory cannot explain intra-industry trade, but which accounts nowadays for the largest
part in industrialised countries' food product trade.
New trade theory has been developed to explain the phenomena of intra-industry trade which
can theoretically and empirically be shown as occurring mostly between industrialised nations that are
similar in their income levels and their factor endowments. The driving forces behind this kind of trade are
seen in (1) economies of scale in production which allow to minimise per unit production cost by expanding
into foreign markets, and (2) product differentiation, as it is assumed that consumers in general gain utility
from higher levels of product variety. For aggregated global food industries it has been shown empirically
that in particular similar per capita income levels and short transport distances, together with the integration
into a free trade area or a common free market promote intra-industry trade, with the last factor confirming
that international food product trade is mostly of intra-regional character. At the level of individual food
industries, however, these few common factors are not enough to explain the causes for intra-industry
trade. Here it has been empirically demonstrated that industry-specific and related factors are necessary to
gain a better understanding of what determines intra-industry trade in food products. For example, the
extent of EU intra-industry trade in dairy products is influenced by producer and retailer concentration,
economies of scales in production and the availability of raw milk. In general, however, intra-industry trade
may also be very much a statistical phenomenon with the extent of this kind of trade increasing the more
aggregated the analysed trade flows are, and with seasonal effects (harvesting times) causing biases. Thus,
even though the concept of intra-industry trade is a very useful one that expands the understanding of
international trade considerably, it must also � especially in the food industries � be taken with some
caution. This is even the more so, since between similar countries the level and pattern of intra-food
industry trade can differ considerably and one would like to know what driving forces stand behind this.
National competitive advantages were stressed by PORTER (1990/98), who argued that factors
of production in today's internationally integrated economies are increasingly mobile, i.e. in case of a lack
they can be acquired from the world market. That is, he sees factor endowments not as "God-given" and
unchangeable but as manageable in the sense that they are only one input-variable among others, which
are important in order to gain international competitiveness, defined as profitability of industries operating in
international markets. Moreover, there are "factor creation mechanisms" especially for the development and
application of knowledge and intellectual skills which PORTER sees as the real crucial input factors in modern
manufacturing industries. Empirical findings underline the importance of human capital even in the in
general relatively "low-tech" food industries. The second argument which PORTER put forward is that in
international markets, individual companies compete rather than nations. Thus, although a country may
have a comparative advantage in the production of a certain commodity, we know that in reality within the
same industry there are in general competitive companies and non-competitive ones. That is, a
comparative advantage in production resulting from relative factor endowments does not necessarily lead to
competitive advantages for every company. There is a whole set of conditions that must be fulfilled in order
to gain success in international markets, such as factor and demand conditions, company strategy and
market structure, supporting industries, and government and chance. Thus, national export performance

xiv EXECUTIVE SUMMARY
must be seen as a multidimensional concept with all determinants being important, and not only factor
endowments or technical features of production such as economies of scale. Criticism of PORTER's theory
may be related to the whole concept of competitiveness. It is a term under which different people
understand different things, i.e. the term is not defined exactly or in a widely accepted way. In particular
PORTER's approach to define competitiveness in relationship with export performance seems not to be free
of problems. There may be industries that are perfectly competitive in terms of profits, market shares and
employment levels in their home markets but which simply do not engage in foreign business activity.
Furthermore, for some industries it may be easier to enter foreign markets than for others. Food products
may belong to the latter group, as these goods are often difficult to transport and also they may be
culturally-bound products made for local preferences and consumption habits. Finally, it seems that the
whole theory applies best to the Anglo-American way of doing business, i.e. within large companies that are
listed on stock markets and managed by highly trained professionals. We know however, that � apart from
a few well-known global players � food manufacturers are typically small or medium-sized. Very often they
may be family owned and typically run by the owner who as "hands on" in the production process and who's
company operates mostly in local markets. Therefore, PORTER's strategic management theory for globally
operating industries may only be partly applicable to the large numbers of locally orientated and small-scale
food businesses.
The role of foreign demand and the contribution of international migration and tourism to
international trade in food products, as two factors which potentially influence the (trans-) formation of
tastes in a country, was theoretically and empirically analysed. Although traditional trade theory has
generally focused more on supply side explanations for the causes of international trade, demand side
conditions may be more important for the strongly growing international trade in food and drink products. If
it is assumed that tastes of (at least some) immigrants are biased versus their source countries' food
products and that travellers to foreign countries may (at least in some cases) develop a taste for the food
products of their favourite holiday destinations, then there should be a positive connection between
international migration and tourism activities and international trade flows of (at least some) food products.
For immigration, there are, in theory, two effects on food product imports from the source countries of the
migrants: (1) with rising immigrant levels in a country (which are assumed to lead to an increase in total
population), the total demand for food will rise � and given the assumed bias in the tastes of the
immigrants versus their source countries' food products � the share of imported food products in totally
consumed food will rise, too. (2) More immigrants in an economy may also lead to an increase of e.g. ethnic
restaurants, speciality shops, stalls on local food produce markets, ethnic cuisine product lines in
supermarket shelves. The food products supplied via these new channels are likely to be also consumed (at
least to some extent) by the local (home) population. As the total amount of food consumed in today's
affluent societies may be seen as fixed, these new ethnic food products will therefore substitute locally
produced food. As a consequence, the share of imported food products in totally consumed food rises, too.
Thus, immigrant groups may be seen as catalysts for the change in tastes in the home population.
Increased international tourism activities may be seen as another factor that may alter the existing tastes of
the home population. Here, international travel may lead to more contact with new and exotic food
products. If it is assumed that at least some of the tourists wish to consume � back in their home countries
� (at least some of) the products that they have experienced in their favourite holiday destinations, then
similarly to the second effect of migration above, there may be a positive connection between rising levels of

EXECUTIVE SUMMARY xv
international tourism and rising shares of foreign food products (i.e. rising levels of imports) in the total
consumption of food products. These theoretical hypotheses have been tested empirically for the case of
Germany during the period from 1967-90. In order to control for trends that are commonly present in time
series data and thus to avoid the problem of spurious correlation, an error-correction model approach has
been used. The empirical results are, as so often in this kind of research, not indisputable. However, for
German aggregate food imports from India, Thailand, China, and Turkey, and for imports of wine, cheese,
and processed/preserved vegetables from France and Italy, it may be concluded that migration to Germany
and international travel activities of Germans to these destinations have indeed contributed to rising food
product imports from these countries. The tourism elasticities for individual food products have been found
to lie between one and two, and � consistent with a priori expectations � they are below unity for
aggregate food imports from the analysed Asian countries. As expected, the estimates of the immigration
elasticities were found to be higher than those for international tourism activities. In some cases, as for
imports of drink wine from France, and of cheese and processing wine from Italy, they have been estimated
as being well above two. These findings may thus complement the other theories of international trade in
food products presented before. Perhaps these demand side effects may describe better the driving forces
that stand behind the rising levels of international trade in food products, at least for those culturally-bound
ones, which are mostly produced by small and medium-sized food manufacturers.
The explanation of foreign direct investments is rooted in the process of allocating existing
global capital stocks efficiently among countries, i.e. in a way that the marginal returns on investments
equalise in each country. The location of food processing companies can generally been seen as resulting
from a decision between producing near input markets, i.e. in the countryside near agricultural production,
or near to output markets, i.e. near the cities and close to consumers. This trade-off problem is part of a
wider discussion about where production in general is most efficient, with the general rule being that
considering transport costs for inputs and for final products and economies of scale and scope, production
should take place where unit costs for the whole production and marketing process are minimised for a
individual company or a whole industry. FDI decisions generally may follow this economic reasoning, but for
an individual company other aspects such as communication costs, costs of stationing personnel abroad,
barriers due to language, customs, taxation, and protection of intellectual capital can also matter.
DUNNING's (1988) OLI framework argues that for an individual company there must be organisational,
locational and internalisational advantages the sum of which must outweigh the additional costs and risks of
setting up of a production or marketing facility in a foreign country. Empirical findings have shown that
these advantages are highest in companies with important "knowledge capital", i.e. intangible, company-
specific assets, such as high R&D inputs, special brand reputation, and important marketing budgets. In the
food industries it has been found that R&D seems to be less important as a determinant for FDI decisions,
but marketing expenses do matter, as does company size, i.e. large corporations are more likely to invest
directly. Most food businesses are however small or medium-sized. Concerning the question, whether FDI
is a substitute or a complement for exports, the findings do rather suggest the former. However, for an
individual company both strategies can be profitable options, depending on the circumstances. Finally, in
reality food manufacturers may not be as "footloose" as other industries. In Europe (above all in
Mediterranean countries), and for a number of traditional food products, legislation exists that regulates the
location where food manufacturing must take place. Special labels, such as "Protected Denomination of
Origin" and "Protected Geographical Indication" have been put into place for this purpose. In Anglo-

xvi EXECUTIVE SUMMARY
American countries, in the contrary, consumer nationalism � i.e. the patriotic willingness to purchase a
domestic product � are a big issue in food purchasing decisions, and which encourage food manufacturers
to produce in the own country. These restrictions need to be considered when FDI in the food industries is
discussed. It seems therefore, FDI may only be a real option for large food manufacturers of industrially
produced and culturally-unbound food products. For the majority of locally operating, small and medium-
sized food businesses, exports seems to be the first and maybe only choice for doing business in foreign
markets.
An international comparison of food and beverage industries of the EU-15, the US, Germany
and Australia reveals that in Europe this economic activity takes place in comparatively small production
plants and that its value-adding is considerably lower than in the US. The Australian food and beverage
industries lie in between these two extremes. When food and beverage manufacturing is compared to the
all manufacturing average � as measured by employee per company and turnover per company ratios � it
becomes clear that food and beverage plants in the EU-15 are usually smaller than average manufacturing
plants, but in the US they are larger than this benchmark. In all three continents turnover per employee is
usually higher than the all manufacturing average, implying higher labour productivity levels. On the other
hand, gross profits, i.e. the value-added, are in all three continents considerably lower as compared to the
all manufacturing figure. Total factor productivity in food processing has been growing only slowly and is
falling from year to year thus confirming that it is a comparatively mature economic activity. Food and drink
manufacturing also seems to be more capital-intensive than other manufacturing industries, but this may
depend on the actual sub-industry considered. Economies of size are in general small in food and drink
manufacturing, but they are more important in capital-intensive sub-sectors and for larger companies which
are able to spread their large marketing/advertising budgets over more units and thus achieve lower total
unit costs. The cost structure of food and drink manufacturing may indeed be particular as compared to
other (manufacturing) industries. Variable costs seem to be smaller in food and drink manufacturing, as
profits are generally higher and there is no reason to assume that fixed costs are significantly larger. Sunk
costs, too seem to be smaller, as R&D investments are lower, despite high marketing spending. However,
not all money spent on advertising or R&D is potentially lost: some of it increases a company's intangible
capital, thus raising its market value. On the other hand, it appears that marketing efforts become more
efficient with larger company sizes, as advertising costs can be spread over more output units, thus reducing
unit total cost. In addition, advertising seems also to become more effective from a certain level on.
Therefore, even if sunk costs may not be significantly higher than in other industries, the need to reach a
critical mass � i.e. a minimum company size � for marketing reasons may still create considerable barriers
to entry to food and drink markets, and may help to explain the existence of very large international
consumer food product companies. Transaction costs in food and drink manufacturing, finally, may be
structurally higher than in most other industries, given the perishable character of most food products, and
the 'natural' risk involved in their production. With respect to international trade it becomes clear that even
despite an above average profit potential, comparatively high barriers to entry and transaction costs can
lead to food and drink manufacturing in general being less attractive for internationalisation activities than
other industries.

EXECUTIVE SUMMARY xvii
Data on the world's 50 leading food and drink manufacturing corporations confirm the
industry level findings that Anglo-American companies in this sector are larger-scale and more profitable
than the ones from other countries. However, within the sample of 50 companies, no statistically significant
relationship between company size, the share of foreign sales in total turnover, the share of food/drink sales
in total turnover, and the operating profit level could be found. At the same time, the data reveal that
German food manufacturers are hardly present among the world's 50 top companies. An analysis of data on
the export performance of German food and beverage industries during 1967 to 1999 shows that companies
in these industries have displayed much higher export growth rates than the all manufacturing average,
albeit starting from a much lower basis. Thus, even if German food and beverage manufacturing companies
are hardly present among the world's leading companies, in particular consumer-oriented German food
industries' export performance has grown fast during the last 32 years. The data confirm once again that
the real growth in international agricultural trade is within manufactured consumer food products.
Two categories of barriers to the international trade of food and drink products exist: (1)
trade policy related barriers, such as tariffs or quotas, etc. may be seen of becoming less important, due to
international efforts of reducing such barriers. More market distorting than tariffs on the finished food/drink
product may actually be levies on agricultural inputs, which may affect the cost competitiveness and output
levels of food industries. Another problem with consumer food products is that they are often targeted in
trade related retaliation actions. (2) process and product standards, such as Technical Barriers to Trade or
Sanitary and Phytosanitary Standards seem to be the emerging issues in the discussion on barriers to the
international trade in food/drink products. Although these issues are regulated by international trade
agreements, the often nationalistic or regionalistic nature of these standards cause them to be effective
trade barriers. In the future, producers of food and drink items may be faced with more and more
complicated product and process standards, which may be seen as today's real obstacles to the successful
international marketing of these products.
Aggregate food consumption has been shown to converge in many industrialised countries,
implying that diets are becoming increasingly similar. Yet, at the same time, it has also been shown that
strong regional food consumption patterns persist. This apparent contradiction can be explained in two
ways: (1) a large part of consumers in a country eat increasingly internationally similar diets, whereas the
other parts of a national population continue to consume traditional food. This view is supported by the
empirical finding that similar types of food consumers across countries exist which � to very different
degrees � accept new foods and new food consumption habits. (2) Another possible explanation for
increasingly similar diets is that most consumers of a country adopt new foods and eating habits, but only
on certain occasions, whereas at other times they still prefer their regional foods. In order to gain deeper
insights in these developments, and to see how these trends affect international food product marketers, a
better understanding of consumption behaviour is needed.
Traditional microeconomic consumption theory describes how rational consumers should
allocate their expenditures between goods in order to reach a utility maximum. In assuming income as the
actual binding limiting factor in consumers' choice, the optimum condition then proposes to choose the
quantities of two goods in a way that, at the margin, their utility/price ratios equal each other.
LANCASTER's consumption theory argues that product characteristics spend utility, rather than market
xviii EXECUTIVE SUMMARY
goods. In order to maximise utility, a consumer selects a specific bundle of market goods in a way that
allows him to consume her/his preferred combination of characteristics. Given the conventional budget
constraint, consumption will then be efficient when a consumer chooses the cheapest of � otherwise
identical � such bundles. This model expands the traditional approach of modelling the consumer's decision
making process to the world of differentiated goods. Household production theory incorporates time in the
consumer's decision problem. It argues that (non-market) Z-goods are the real utility-spending entities.
These Z-goods need to be produced by the households, using market goods and time for the transformation
process. Thus, a budget and a time constraint need to be considered by a consumer when selecting goods
in order to maximise utility. Both constraints can however be transformed into a single one, using a
consumer's wage rate. This wage rate enables the calculation of a shadow price for the time requirements
in the production of a Z-good. The optimum condition then implies to equalise the ratio of the marginal
utility of two Z-goods to the ratio of their marginal costs, however, the latter supplemented by the shadow
prices of their production times.
A dynamic concept of utility derived from food consumption over a longer-run period can be
specified in assuming that utility from different characteristics is accumulated over time. There is a base
utility from calorie intake, which is equally important to all consumers as it assures human life. Other part
utility may come from other characteristics of food consumption, such as its taste, health, status or
environment contents. These attributes may not be equally important for all consumers, but if they matter
they increase the particular consumer's overall utility. There are, however, also utility-decreasing
characteristics that come along with food consumption. Modern food consumers may want to keep a certain
body weight, thus the calorie contents of food constrains their food choices. In addition, food consumption
takes time and money, and � by choice or out of necessity � many consumers may want to limit the total
amount of time and money spent on eating and accompanying activities. All of these constraints have
certain time frames. Food needs to be eaten regularly, thus calorie intake must take place within short
periods. Taste or health proprieties of food may also be desired by many people to be consumed on a
regular basis. Status aspects or environmental concerns may perhaps not be important at every meal, but
over a certain period there may exist � individually different � minimum consumption requirements.
Another important aspect in food consumption is that food is usually consumed as meals, i.e. as bundles of
many different foods and drinks. This implies that utility affecting characteristics offered by a meal come in
fixed proportions. Although the characteristics, and their amounts, offered by a meal should objectively be
the same for all consumers, personal preferences, which are affected by gender, age, culture, income, social
status, etc. lead to the objective vector of characteristics being transformed (by a weighting procedure) into
an individual one. Yet even then the different characteristics will come in fixed proportions which makes
utility maximisation difficult since it causes trade-off problems. Thus, in the long run, a consumer will
choose food products which allow him best to maximise his aggregate utility, in accumulating as much as
part utility as possible, until the first binding constraint (maximum calorie intake, monetary expenses or
time requirements) is reached. The different time frames of the constraints allow for some choice between
individual meals as not all restrictions need to be met at any meal. However, subsequent food choices may
then be affected by the food chosen before. The better the combination of foods chosen over a period, i.e. a
diet composed of meals that offer much of utility-increasing characteristics relative to the most restrictive
utility-decreasing one, the higher the overall utility will be at the end of the period. The more relevant the
characteristics which affect the decision process the more difficult the food selection process will be.

EXECUTIVE SUMMARY xix
Implications that arise from this theoretical framework are: (1) converging international food consumption
can be explained as a reaction to increasingly similar social and economic environments in many countries;
(2) individual preferences may be homogenous within geographical areas but different across them which
causes regional food consumption patterns to continue to exist despite international pressures for more
similar eating habits; (3) inter-regionally different preference matrices of consumers make it difficult to
market regional dishes successfully internationally; (4) internationally successful dishes and food products
are those that offer a high content of one or two distinctive utility-increasing characteristics relative to a
relevant, i.e. binding, utility-decreasing characteristic, which may be price, time requirements or calorie
contents; (5) foreign food products are more easily accepted by a local population when they help to
transform already existing and well-appreciated food products into a new meal which offers a better mix of
utility-increasing characteristics. For food product marketers it is important to understand these implications
if they want to operate successfully in international food product markets in the 21st century. The practical
relevance of the presented model is that it can be made operational. Using e.g. conjoint analysis � a
multivariate statistical technique � it is possible to determine the content of product (or meal) specific
relevant characteristics as the mean values of survey results from a large number of consumers. Consumer
individual deviations from these mean values would then reflect individual preferences. Regionally similar
patterns of deviations from the aggregate mean would indicate area-specific food consumption preferences.
Knowledge of these area-specific preferences and of the characteristics contents of a product or a dish
should then allow for accurate predictions of the marketability of a food product in a foreign market.
As general conclusions it becomes clear that international trade in food and drink products is
complex in nature and thus the application of one single theoretical framework which would be able to
explain this kind of trade is difficult. Rather, depending on the nature or kind of the food product, different
concepts need to be applied. Overall, however, since food and drink items are consumer products, it seems
clear that this kind of international trade is explained best from the consumers' point of view, rather than
from the production side on which standard international trade theory is usually based.
The management of international marketing activities of food and drink products is
characterised by particular complexities that are caused, in theory, by higher transaction costs and risks
involved as compared to home market deals. Transaction costs are higher due to the generally greater
physical distance to the foreign market and the thus resulting greater transport, communication,
negotiation, etc. efforts necessary for business success. Transaction risks are usually greater, since more
"uncontrollable factors" exist in foreign markets than in the home market, thus making the successful
completion of a foreign business deal less likely.
Concrete problem areas which food product exporters face have been identified by analysing
several empirical studies dealing with this topic. The six problem areas which seem to be most relevant are:
(i) education and training of export staff (including foreign language skills and knowledge of foreign business
partner's mentality); (ii) trade fair activities; (iii) special food product logistics and marketing problems; (iv)
trade terms, export documentation and billing, and foreign exchange risks; (v) provision of foreign market
information; and (vi) government assistance.

xx EXECUTIVE SUMMARY
A survey of international food product marketers from Germany and Australia was conducted
in order to find answers to the question of which factors affect success in international food product markets.
Out of 1 298 companies that were contacted in November 1998 (Germany) and July 1999 (Australia), 166
usable questionnaires were obtained. The responses were analysed separately for the overall sample,
German and Australian companies, all manufacturers and traders, and for manufacturers and traders alone
from each country. Given the small sample relative to the sector sizes, the representativeness and
generaliseability of the survey findings may be seen as low, however, from a statistical point of view, n=166
is large enough to achieve statistical significance, especially if the investigated effects can be assumed to be
structural for the food and drink product sector and independent of the country or of business class.
Multivariate analysis techniques have been used to analyse the survey data and to identify the
key factors that affect success in international food product markets of the sample companies. Apart from
tests for differences in group means (t- and F-tests, non-parametric tests, and chi-square tests), cluster
analysis, factor analysis, and multiple discriminant analysis have been employed. Factor analysis can be
used to condense the information contained in a large number of variables, which are bundled into a smaller
set of factors representing underlying dimensions. Cluster analysis' primary purpose is to group objects
based on the characteristics they possess in a way that the resulting clusters exhibit high internal (within-
cluster) homogeneity and high external (between-cluster) heterogeneity. Thus, factor analysis condenses
variables into a few factors and cluster analysis classifies objects into a few groups. Both techniques allow
for the identification and description of structures in complex data. Multiple discriminant analysis, on the
other hand, is a dependence technique which can be applied in situations where a relationship should be
predicted or explained which affect the category in which an object is located. It aims to identify variables
that are suitable for predicting the group membership of an object and provides measures to describe the
relative importance of independent variables in this procedure, and the discriminatory power of the
estimated function as a whole.
General company characteristics, in the survey results, show that German companies, in
general, are larger, older, more productive, they are more often publicly listed, they tend to be importers (in
particular traders), they operate mostly in European markets, and they are less consumer-oriented than
Australian businesses. Moreover, German responses reflect attitudes from functional (i.e. export or sales)
managers. The responses of Australian companies, on the other hand, express a more general management
background (i.e. managing directors, or CEOs). Australian companies have their main foreign markets in
Asia. The main structural differences between manufacturers and traders are, that manufacturers generally
seem to have higher corporate ages, they are larger in size, and they are more export-oriented than traders.
Foreign business performance or 'success' is complex to measure, since this concept is
multidimensional in nature. Nevertheless, the survey results suggest that trading companies start
significantly faster with foreign business activities than manufacturing companies, but that German
manufacturers are even significantly slower than Australian ones. German companies (and in particular
traders) are more import-oriented, whereas Australian businesses are more oriented towards exporting.
There is no statistically significant difference in the past growth rates between German and Australian
companies, but the latter rate their current and medium-term future business development tendencies
significantly more positively.

EXECUTIVE SUMMARY xxi
Foreign business qualification findings show that German companies have relatively fewer staff
dealing with foreign business activities. In both countries about 40% of these employees hold a university
degree, which is most likely a business/economics one. Furthermore, about 40% of the companies have
never used any sort of further specialised job training for their employees, but if they do, German
companies generally tend to choose private institutions, whereas Australian companies rely more on
government programs. Employees who deal with foreign customers/suppliers in Germany know significantly
more foreign languages and master these significantly better than employees in Australian companies. On
the other hand, Australian companies rank the critical importance of foreign language skills higher than
German ones, despite the fact that English may be the most important business language in the world. The
importance of the knowledge of foreign business partners' mentality is rated by Australian companies
significantly higher than by German companies, although there does not seem to be a great difference in the
knowledge level between the two countries. This may be caused by the fact that Australian companies do
most of their foreign business in Asian countries, i.e. in a, in general, culturally different environment.
Between the two business classes, there are no major structural differences, apart from the fact that traders
seem to rank the knowledge their employees have about their foreign business partners' mentality
significantly higher than manufacturers do. However, this finding may be due to the fact that sample
trading companies are more involved in foreign business than manufacturers and therefore they have more
contact to foreign customers or suppliers.
Trade fair activity findings reveal that the only significant difference between German and
Australian companies is the higher participation rates at trade fairs of the former. Moreover, German
companies exhibit strongly in the home country, whereas Australian ones hardly exhibit in Australia. The
most important purpose of trade fairs in both countries is the 'making, keeping or improving of contacts'.
There is no major difference concerning trade fair expenses and staff use, however significantly fewer
Australian companies prefer individual stands than German companies. The general difference between
manufacturers and traders is that the former mostly take part in trade fairs as exhibitors, whereas traders
are mostly visitors. Manufacturers spend more on trade fairs, employ less staff, and receive more financial
grants for participation from governments.
Food product-related questions reveal that the survey companies operate in several product
groups and processing/packaging categories which highlights the fact that the sample represents well the
diversities of the two countries' food manufacturing sectors. The degree of logistical problems is ranked by
all companies as relatively important, however it seems that Australian companies depend more on
appropriate transport logistics in their foreign partner countries than German companies, probably mostly
because they operate in the quite different Asian markets. This fact may also be a reason why Australian
companies have a higher percentage of product losses in their foreign business activities. Moreover,
Australian companies face a stronger seasonal influence in their foreign sales. Australian companies
highlight the origin of their food products more than German companies, which on the other hand adapt
their recipes more to their foreign markets. For German companies statistical reporting is more troublesome
than for their Australian counterparts. The main differences between manufacturers and traders is that the
former have fewer product losses in their foreign business transactions, but on the other hand
manufacturers are more affected than traders by the complexities resulting from different national food

xxii EXECUTIVE SUMMARY
laws. Overall, it becomes clear that logistical problems can be seen as a significant obstacle for foreign
business activities.
Trade and payment terms-related questions reveal that German companies appear to have more
bargaining power, since they seem to better transfer better the transport cost and risks to their customers.
On the other hand, German companies use more risky payment forms than their Australian counterparts.
Other standardised international contract standards are also used more often by German companies, but a
further standardisation does not seem to be a major preoccupation for the vast majority of the sample
companies. The most frequently used currency is the home currency in both countries, but in general,
exchange rate risks do not seem to have a great influence on international business decisions. Finally,
Australian companies may have a better understanding of, and therefore have higher usage rates of,
professional exchange rate risk management tools. There are no major differences between manufacturers
and traders, which might have been predicted beforehand, since the use of international trade, payment and
contract terms, and of exchange rate risk management techniques should be independent of the business
class.
Foreign market information seem to be better available in German companies which use mostly
(semi-)public marketing agencies as information sources, whereas Australian companies prefer government
agencies. Australian companies use modern electronic information media more intensively and they rate the
critical importance of a better supply of foreign market information higher than German companies. There is
no major difference between manufacturers and traders.
Government assistance, in form of financial grants, is received more often by Australian
companies than by German ones, and by manufacturers more often than by traders. The assistance
provided by (semi-)public marketing agencies or commodity marketing boards seems not to have a great
importance, nor is more assistance of this kind desired by the sample companies. The sort of government
assistance mostly asked for by the sample companies are more financial grants for trade fairs and travelling,
the creation of foreign customer contacts, and the reduction/abolishment of administrative formalities and
tariffs.
An overall comparative assessment of the different variables makes clear that the biggest
obstacle for food companies engaged in international food marketing activities lies in the actual knowledge
of how to enter and to serve a foreign market effectively (how to avoid customs troubles, how to adapt to
foreign food legislation, and how to obtain crucial foreign market intelligence), followed by staff qualification
(appropriate training and foreign language skills), and the mastering of logistics (the knowledge of the
particularities of the food product, and the availability of suitable facilities). The distance to a foreign market
either geographically or in terms of the existence of a similar consumption environment as in the home
market seem to matter least as success factors. The big difference between German and Australian
companies is that for the former staff qualification belongs to the most crucial points, whereas for the latter
logistics aspects are more important. Moreover, exchange rate risks are much more important for Australian
companies, indicating that they do not enjoy the advantage of doing most of their business in a fixed
exchange rate environment. For traders, staff qualification questions and logistics are most important and
significantly more crucial than for manufacturers. Manufacturers, on the other hand, care most about trade

EXECUTIVE SUMMARY xxiii
administrative problems and foreign business partners' mentality. Trade fair activities seem to be only of
some importance for German manufacturers and the assistance through either governments or (semi-)public
marketing agencies or commodity marketing boards is rated as not being crucial for companies operating in
international food product markets.
The relationship between foreign business performance and success factors was explored
in identifying three clusters of companies which are distinct in their foreign performance pattern measured
by four different variables. Cluster 1 may be called most foreign business oriented but mature and is
characterised by the highest level of expanding speed into foreign markets, high foreign business shares,
but low growth rates and development tendencies. Cluster 2 companies are late but successful movers,
characterised by low expanding speed levels, average foreign trade shares, but comparative high growth
rates and development tendencies. Cluster 3 may be given the name low involved but high potential, since
these companies have the lowest foreign trade shares but the highest development tendencies, with average
expanding speed and growth rates. Multiple discriminant analysis was used to identify those factors which
affect success in international food product markets and which are rated significantly differently among the
three clusters. The results consistently show that statistically significant differences exist only between
cluster 1 and the two other clusters but not between cluster 2 and cluster 3. Overall, the logistics factor and
the staff education/training factor discriminate between cluster 1 and the other two clusters, with cluster 1
companies rating the importance of these factors higher than the companies belonging to cluster 2 or 3.
German cluster 1 companies rate the importance of staff education/training statistically significantly higher
than cluster 2 or 3 companies. The importance of trade fair activities and public support is, on the other
hand, rated as less important by the more successful German companies than by the less successful ones.
Australian cluster 1 companies, too rate staff training/education, including the knowledge of foreign
language skills and of foreign business partner's mentality, as more important than the companies from the
other two clusters.
In summary, the survey results suggest that staff education/training and logistics are the most
important factors affecting success in international food product markets. Another main finding of the
survey is that problems which occur in the international food business do not depend much on business class
� i.e. there are no main differences between manufacturers and traders. Even the differences between
Australian and German companies are comparatively small. Thus, the findings may reflect the structural
problems that are involved in the international food product business. Also, even though the sample size of
the survey is small relative to the industry, the results often show statistical significance. Practical
significance can also be seen as high, too, since most findings are in line with previous expectations.
Implications for agribusiness managers which arise from this study are therefore that staff
qualification matters strongly when operating in foreign markets and every possible care should be
undertaken by companies to recruit well-trained staff and to offer export managers appropriate additional
training whenever possible. This finding thus confirms what should be obvious: at the very heart of
competitiveness stands the human being with his/her skills to create value, however new and unfamiliar the
environment encountered. Recruiting and maintaining well-trained staff is therefore crucial even for food
companies which are generally considered as low-tech and low-skill. A second important implication for food
businesses arises from the fact that the ability to manage logistics (i.e. to market perishable products over

xxiv EXECUTIVE SUMMARY
long distances) indeed discriminates between more and less successful enterprises. Knowing the product
and its technical characteristics, for example in terms of how product quality is affected by long distance
transport, thus allows export managers to plan better and to execute expansion into remote international
markets. Of course, this may be more relevant for some food businesses than for others but delivering
acceptable product quality in a continuous way matters to all of them.
Future research should focus on a more detailed analysis of which skills employees precisely
need to increase their food companies' competitiveness in foreign markets. Some aspects have already
been explored, such as language skills and the knowledge of foreign business partners' mentality. There are
other issues which could also be crucial, e.g. negotiation skills. Moreover, future studies should investigate
in more detail the logistics problems that are involved in the international food product business, given the
lack of literature dealing specifically with this topic, and acknowledging the findings of this survey that
logistics turned out to be a major success factor in international food product markets. In a time where
(national) manufacturers and retailers forge ever closer alliances in order to master the supply chain as
effectively as possible, it is clear that the next stage will be the international one. Thus, future studies must
investigate how transport, storage and information exchange � across climate and time zones, with
(multiple) border crossings and between (often) different national retailing standards � can be facilitated and
optimised.
* * *

Identifying Key Factors Affecting Success in
International Food Product Markets


1 INTRODUCTION 1
1 INTRODUCTION
Globalisation was one of the hot topics in the last decade of the millennium. Driven by new technologies,
cheaper transportation costs, and international liberalisation agreements, global trade, foreign investments,
and international travel have grown strongly. Nowadays, many consumers almost all over the world enjoy
the availability of useful products manufactured in foreign countries, of spending their holidays abroad, or of
having instant access to almost "real-time" information from anywhere around the globe. Undoubtedly,
there are many benefits resulting from an ever closer economic and political integration of the world's
nations. In fact, those who in general gain most from globalisation are consumers (The Economist,
September 29 2001), as they gain access to cheaper goods and services. This study deals with the
globalisation of one of the most important consumer goods industries: food and drink manufacturing.
The world food market makes no exception to the general trend of globalisation, and today most
of the value and growth of international food trade is within processed/manufactured or high-value food and
drink products. This means that international trade in agricultural commodities, once the largest part in
world food trade � and analysed intensively during the last decades � is becoming relatively less and less
important. However, despite the change in the nature of international food trade, little innovation has
occurred in the theories which were developed to explain international trade and which deal mainly with
undifferentiated, price-sensitive commodity-like goods. Although modern theories of trade in manufactured
goods do exist � namely the new trade theory of intra-industry trade � food and drink items seem to fit
uncomfortably into this framework, developed mainly for industrial products in industries where significant
economies of scale are present. And, although some useful elements in all the existing theories can be
found, few studies so far has tried to create a coherent theoretical framework of international trade of food
products, taking into account that there are different categories of food and drink products which may have
different driving forces underlying the global exchange of these goods.
The management of international trade in food products at the company level is a similar topic
which is not covered extensively in the literature. Although plenty of research work on general export
management has been done, hardly any of it deals with the particularities of the foreign trade of food and
drink products. So far, not very much is known on what impact product-specific factors, such as e.g. the
perishability of food products or the unstable supply of agricultural inputs, have on the international
marketability of food and drink products. That these aspects have not been researched more intensively is
even more surprising as it is known that food and drink industries in general have lower export shares than
other manufacturing industries. Other aspects in this respect seem also interesting, e.g. what effect on a
food company's foreign performance have the education and job training of employees responsible for
foreign trade, the role of logistics, or the use of internationally standardised trade and payment terms.
This study reviews existing theories of international trade and adapts them to the trade of food
products. Moreover, these theories are supplemented with an approach to incorporate the effects of
international migration and tourism on the trade flows of food and drink products "which are minefields of
cultural as well as economic sensitivities" (Financial Times, September 19 2001, p.I). For this, a theoretical
framework is provided and empirical estimates for the case of Germany are presented, using an econometric
error-correction estimation model. Also, foreign direct investments in the food industries will be discussed.
As it seems clear that the understanding of international consumer behaviour is crucial for the international

2 1 INTRODUCTION
marketability of food and drink items, a new approach to model modern international food consumption is
presented. In contrast to the traditional static microeconomic budget allocation model, a dynamic utility
accumulation model will be introduced. Although there is probably still much scope for improvement of this
new model, some valuable conclusions can already be drawn from it. Finally, the management of
international trade in food products at the company level will be discussed. A theoretical analysis is followed
by an empirical questionnaire survey of international food product marketers from Germany and Australia
(n=166). In using factor, cluster, and multiple discriminant analysis, key factors for the success in
international food product markets will be identified and discussed.
The structure of this study is as follows: the second part after the introduction analyses
international food product markets at the aggregate level. Within that chapter, different classification
systems for food products will firstly be discussed. Then the significance of international trade in these
products and of foreign direct investment in the food industries will be described by presenting some recent
data. The next section reviews existing theories of international trade and complements them with a
theoretical and empirical analysis of the effects of international migration and tourism on the international
trade in food and drink products. In order to better see that traditional trade theories cannot explain in a
completely satisfying way all international trade in differentiated consumer food and drink items, a
discussion on the economic structure of the international food industry, and on the determinants of modern
international food consumption is provided. The chapter finishes with some conclusions drawn from this
analysis at the aggregate level. The second part examines the management of international food and drink
product trade at the company level. First, the theory of this kind of trade management will be discussed.
Then empirical results from a survey of international food and drink product marketers from Germany and
Australia will be presented. As before, the second part finishes with some important conclusions. The
Appendix includes all raw data used, the algebraic foundations of econometric error-correction model, the
results from the regression analysis, and the English version of the questionnaire used in the survey of
German and Australian companies.

2 ANALYSING INTERNATIONAL FOOD PRODUCT MARKETS AT THE AGGREGATE LEVEL 3
2 ANALYSING INTERNATIONAL FOOD PRODUCT MARKETS AT THE AGGREGATE LEVEL:
PRODUCT CONSIDERATIONS, TRADE AND INVESTMENT DIMENSIONS, AND
PRODUCTION AND CONSUMPTION DETERMINANTS
This chapter of the study analyses the international food product markets at the aggregate level, i.e. data
and analysis will be provided for food and drink industries, international trade flows, and national food and
drink consumption. First, different classification systems for food and drink products will be discussed. Then
data on global trade in consumer food and drink products and on foreign direct investments in the food and
drink industries will be presented. The next sub-section reviews existing theories of international trade and
adapts them to trade in consumer food and drink products. As these theories cannot explain all trade in
these products in a completely satisfying way, a new approach to explain international trade in culturally-
bound food and drink products will be presented. A general theoretical framework and an empirical
investigation for the case of Germany, using econometric error-correction models will be provided. The next
sub-section discusses the economic structure of the international food and drink industry, and presents
recent structural data for food and drink industries in different western countries. As it will become clear,
food and drink manufacturing/processing is in many ways different to other manufacturing activities.
Following that comes a detailed discussion on international food consumption in the 21st century. In this
section a model of modern international food consumption will be presented, specified as a dynamic utility-
accumulation model in contrast to the conventional static budget-allocation/utility-maximisation approach of
microeconomic consumer theory. Finally, some important chapter conclusions will be given.
2.1 Non-homogeneous good food
The non-homogenous good food can be categorised into (i) agricultural raw commodities, (ii) fresh
perishable products, (iii) processed foods, (iv) manufactured foods, (v) industrial food products (or
consumer-packaged foods), (vi) high-value foods and (vii) high value-added foods. In the literature, the
groups (ii) through (vii) are often referred to as 'processed foods' only. This simplification may be handy,
however there seem to be some differences with regard to the causes and consequences of the international
trade within the individual food groups. Distinctions between the above categories have a technological or
an economic dimension. Technologically, different degrees of processing transform a raw commodity into a
new product which may have completely different characteristics, such as looks, taste, texture, smell, shelf-
life, etc. Economically, processing does not only alter the product itself, but in general it also raises its
market value. However, high degrees of processing do not always increase the market value of a food
product. In some cases high-value foods are not processed at all, such as e.g. fresh exotic fruit, or some
seafoods, etc. (OECD 1997, BIE 1996). Also, differences between the above categories can be fluent.
Sometimes one product can be a commodity and at the same time it can be marketed as a highly
differentiated consumer food product. For example, butter can be used as an industrial input for e.g. a
biscuit factory or it is sold as e.g. a high quality Irish brand product for final consumer use.

4 2 ANALYSING INTERNATIONAL FOOD PRODUCT MARKETS AT THE AGGREGATE LEVEL
The analysis of trade patterns and the understanding of the different driving forces that
underlie those patterns is facilitated by a classification of food into different categories. Although trade
economists in general do not recognise the importance of product characteristics when analysing
international flow of goods, agribusiness professionals and agricultural marketing specialists do so. The later
have focused their attention on individual commodity systems which may involve the production, processing,
and marketing of either only a single commodity or a set of very closely related foods (such as dairy
products, poultry, citrus fruits, etc.) (JAFFE & GORDON 1993, p.7). Therefore, different categorisations for
food will be presented in the following, which will then be used � after a general discussion of relevant trade
and investment theories � for the creation of a more specific explanation framework of international trade in
food products.
2.1.1 Technological classifications
Technological classifications are based on common features that are derived mainly from product
characteristics such as processing stage, shelf-life, purity, quality, taste, etc. Even if these features are
usually not considered in economic trade analysis, they are often most important for the international
marketability of food products.
2.1.1.1 Agricultural commodities or primary products
Agricultural commodities or primary products are basic foods such as grains and rice, live animals,
oilseeds, raw coffee, tea or cocoa. These products need at least one further stage of processing in order to
be transformed into an edible product. They are in general bulky, perishable, and expensive to transport.
Therefore the nature of the foreign trade of those primary products is quite different from the international
marketing of processed, manufactured or industrially produced foods (PADBERG 1997; SHELDON & ABBOTT
1996).
2.1.1.2 Perishable product distribution
Perishable or fresh food products such as fruit, vegetables, fish, meat cuts, etc. are sold for direct
consumption and in general they do not undergo any kind of processing in the sense of product
transformation. However, these products may need chilling and/or packaging (SCHAFFNER et al. 1998).
Improved storage and transport techniques and technologies, such as e.g. low temperature and controlled
atmosphere storage1, and the increased use of refrigerated ships (which today run 20% to 30% faster in
comparison to the 1970s), have contributed substantially to an increase in the world wide trade of fresh fruit
and vegetables (OECD 1996). Moreover, although in general the transport of perishable foods over long
distances carries potential food safety risks, as food spoilage is positively correlated with prolonged delivery
times (PAWSEY 1995), the rapid expansion of air freight capacities has made fast delivery possible almost all
1 The controlled atmosphere method is a much recent storage technique which only was introduced into maritime
transport at around 1980. It consists of placing fruit in an atmosphere in which the oxygen, nitrogen and carbon dioxide content, temperature and humidity are maintained at a level which slows the metabolism of the fruit and the ethylene given off by them is absorbed if necessary (OECD 1996).

2 ANALYSING INTERNATIONAL FOOD PRODUCT MARKETS AT THE AGGREGATE LEVEL 5
over the world (RIRDC 1994). Also, unit costs of air freight have fallen by 3%-4% per year during the last
10-15 years (WTO 1998, p.35). As a consequence, the international trade in perishable food products has
grown strongly all over the world (HENDERSON et al. 1996a).
2.1.1.3 Primary and secondary food processing
Historically, the development of techniques and technologies of making food durable and transportable was
a precondition for expanding international trade in food products. Food preservation techniques have
transformed perishable animal and vegetable products into edible, stable, and portable products, thus
making it possible for them to be put in long-term storage and to be transported (THOMPSON & COWAN
1995). Furthermore, THOMPSON & COWAN (1995, p.23) give also a good overview on the historical
development of food preservation techniques:
Preservation of foods inhibits spoilage caused by bacterial growth, oxidation, insects, or desiccation. Fermentation, oil packing, pickling, salting, and smoking are all ancient preservation technologies. Milling and baking, brewing, and cheese and yoghurt making are ancient methods of food preservation and also extend the durability of foods. Refrigeration in caves or under cool water were also well-known ancient techniques of food preservation. Most other methods of preservation are innovations of the past 200 years. Mechanical refrigeration, various dehydration techniques, and quick freezing were late nineteenth- and early twentieth-century discoveries.
Today, commercial food processing is defined as "the branch of manufacturing that starts with
raw animal, vegetable, or marine materials, and which transforms them into intermediate foodstuffs or
edible products through the application of labour, machinery, energy, and scientific knowledge" (CONNOR &
SCHICK 1997, p.XXII). Thus, food processors fulfil the economic task of converting various food materials
into finished, consumer-ready products and add value by technological transformation, packaging, physical
storage, delivery, and information (ibid.).
Technologically, depending on the degree of transformation from a primary good into a product
ready for final consumption, one can differentiate between primary and secondary processing (SCHAFFNER
et al. 1998). Primary processing is the first step of transforming a bulk raw commodity into an edible
product and/or the process of separating edible parts from non-edible ones (skins, bones, straw, stones,
etc.). This may result in fresh or frozen fish fillets, in meat cuts, cleaned grains (polished rice), raw sugar,
roasted coffee or fermented tea leaves, etc. Secondary processing involves a further step, where the
character (texture, smell, taste, etc.) of a food is altered. Cream, butter or cheese are quite distinctive from
milk in texture or taste, as mince is from meat, and flour or flakes are from grains. Canned or frozen fruits
and vegetables, fruit juice or wine are further examples.
2.1.1.4 Manufactured foods and industrial food products
Manufactured foods and drinks are goods such as bakery products (bread, cakes, biscuits, buns, etc.),
sausages, pies and pastries, tinned soups and frozen meals, beer, etc. That is, they are all products which
are or could be produced at home, but which nowadays in general are bought in food shops and
supermarkets. These products typically consists of a blend of different food ingredients (SCHAFFNER et al.
1998, p.9).

6 2 ANALYSING INTERNATIONAL FOOD PRODUCT MARKETS AT THE AGGREGATE LEVEL
Industrial food and drink products (or consumer-packaged food and drink items) are modern
goods that can only be produced in industrial food plants. Chocolate2, candy and confectionery products,
chewing gum, soft drinks, soup powder and stock cubes, ready-to-eat breakfast cereals, instant coffee
powder, but also flavourings and colours, extracts, artificial sweeteners and fat substitutes belong to this
group. These products are sometimes called "formulated products" by food technologists. Besides, the
creation of completely new "food structures", and thus the development of product innovations, has only
been possible through the use of a wide variety of modern chemicals, such as emulsifiers, stabilisers, and
other texture-modifying substances (SCHAFFNER et al. 1998).
The difference between manufactured and industrial foods is that the former have often been a
result of history and tradition and they are thus "culturally-bound products" (CARTER 1997, pp.8-9). For
example, there may be recipes for soups all over the world, but the ingredients and the way the dishes are
prepared can differ completely. The same may be true for breads, cheeses, sausages, biscuits, etc. which
has strong implications for the international marketing of these products. Industrial food products, on the
other hand, very often have not this traditional feature in their product characteristics. On the contrary,
often these products might even have been designed to be globally marketable, for which traditional roots or
cultural preferences may be an obstacle.
2.1.2 Economic classifications
Economic concepts are based on the (relative) market prices or mark-ups of different food categories.
Time series analysis of own prices can be used to determine whether a product is an easily substitutable
commodity or is sufficiently differentiated, i.e. whether it holds a unique market position. High-value foods
are characterised by higher and more stable world market prices and higher income and price elasticities,
whereas high value-added products are those where the difference between selling price and input material
costs are large, i.e. those products with high gross margins.
2.1.2.1 Defining a commodity
A commodity test based on time series econometrics was proposed by GORDON et al. (1999). The
authors claim that commodities are "simply goods produced under conditions described by the perfect
competition model of economists" (p.4). In order to test for this they check whether similar products have
co-integrated3 price series or not. A commodity is defined as a good which has one or more close
substitutes whose prices develop in the long run not independently from its own price. Economic forces
from either the supply side (e.g. an increase in production of the good) or the demand side (e.g. a buyer's
shift away to the substitute) as reaction to e.g. an increase in the price of a good will force its price back to
its long-run trend path. Therefore, if a good's price is co-integrated into the long-run development of the
2 For a description of the crucial role of steam engines and the mechanisation process in the chocolate producing industry
see SCHOLLIERS (1995)
3 One or more time series are called co-integrated if they have the same degree of stationarity, i.e. the mean, variance, and autocovariance (at various lags) are the same at any point of time measured. An integrated time series of order d, I(d) would be if the equation ∆Yt = (Yt - Yt-d) = ut holds where d denotes the time lag (GUJARATI 1995, p.709-733). For a more detailed discussion see ENGLE & GRANGER (1987) and Section 2.3.2.4.2 plus Appendix I.

2 ANALYSING INTERNATIONAL FOOD PRODUCT MARKETS AT THE AGGREGATE LEVEL 7
prices of one or more similar goods (substitutes), it cannot be considered as a differentiated good. Such a
product is perceived by consumers as having distinctive characteristics and thus holds a defined single
position in the market. Compared to measuring substitutability by means of demand elasticities, the time
series approach has the advantage that it does not necessitate the estimation of an entire demand system
which is dependent on the availability of extensive data. Tests for co-integration of price developments
need only information on price time series, thus making this method a more parsimonious one.
2.1.2.2 High-value foods (HVF or HVP)
High-value foods are products with considerably higher unit values and much higher income elasticities of
demand, such as fresh fruit and vegetables, protein-rich foods such as meats, fish and dairy products,
vegetable oils, and prepared 'convenience' foods with high value-added. Compared to representative world
prices of traditional staple foods (such as e.g. wheat, maize, sorghum, etc.), ranging from US$75 to US$175
per metric ton, these horticultural, livestock, fisheries, oilseed, and prepared foods quote international prices
of US$500 or more per metric ton (JAFFE & GORDON 1993, p.1). Furthermore, in industrialised market
economies [developing countries] the estimated income elasticities of demand for cereals, a low-value food,
is -0.22 [+0.16], compared with between +0.25 and +0.38 [+0.61 and +1.00] for high-value meat, eggs,
and fruit and vegetables (ibid.).
2.1.2.3 High value-added foods
High value-added foods (i.e. a product where the difference between the market value and the costs for
inputs is comparatively high) are often also highly processed (i.e. a product with a high degree of
transformation or preparation), but this does not need to be necessarily the case. For example, (minimally)
processed poultry in general has a higher degree of value-added than highly processed oils and fats (BIE
1996, p.251). In fact, adding value can also be achieved by branding and providing appropriate marketing
efforts (advertising). For instance, by putting brand stickers on bananas and thus differentiating the fruits
from those of the competitors, the bananas' market value can be increased considerably without any
processing needing to occur.4
Adding value to primary food products is considered to be crucial with respect to the
competitiveness of a food producing sector, as value-added is used as a measure for economic performance
(Council for Agricultural Science and Technology 1995). Adding value to agricultural raw commodities in
terms of processing, packaging, branding, etc. creates national income and wealth. Therefore, most nations
are keen on exporting high-value added products, and, on the other hand, tend to restrict the import of
them.
4 However, advertising itself is not cost-free.

8 2 ANALYSING INTERNATIONAL FOOD PRODUCT MARKETS AT THE AGGREGATE LEVEL
2.1.3 Other classifications
The classifications presented above seem to be reasonable with respect to an exact analysis of what
explains competitiveness in international food markets, but they are quite detailed. A simpler classification
attempt uses only three categories. Also, it is important to know how international trade statistics
categorise food items in their classification systems.
2.1.3.1 A simple three-stage classification
A classification by processing stage divides food into bulk, intermediate and consumer-oriented goods
(SCHAFFNER et al. 1998, p.232):
Bulk commodities include wheat, rice, feed grains, soybeans, peanuts, cottonseed, flaxseed,
safflowerseed, other bulk oilseeds, pulses, and raw sugar. Tropical products, such as green coffee,
cocoa, and live animals, are also included in this category.
Intermediate products are principally semi-processed products in the intermediate stage of the
food system, such as wheat flour, feeds and fodders, hops, oilseed meals, vegetable oils, and
refined sugar.
Consumer-oriented or consumer-ready products are fundamentally end-use products that require
little or no additional processing for consumption. Included in this group are such items as fresh
and processed horticultural products, fresh and processed meats, snack foods, beer and wine, and
other processed food products.
This classification, however, is less exact than the technological one given above and makes analysis of
trade determining factors more difficult. In particular, the inclusion of horticultural products and meats into
the same group as processed and strongly branded, industrially produced, foods may be problematic, as
international competitiveness in these product groups may have different causes.
2.1.3.2 Standard International Trade Classification (SITC) for food items
International trade statistics often use highly aggregated commodity or product classes which makes
analysis of trade flows of particular products difficult. Most official international trade statistics is published
on the 3-digit level of the Standard International Trade Classification (SITC) which categorises food products
as follows (see UNCTAD 1999):

2 ANALYSING INTERNATIONAL FOOD PRODUCT MARKETS AT THE AGGREGATE LEVEL 9
Table 1: 3-Digit Standard International Trade Classification (SITC), Revision 2 for foods
SITC Commodity / Product SITC Commodity / Product
0 Food and live animals 057 Fruit and nuts (not included oil nuts), fresh or dried
001 Live animals chiefly for food 058 Fruit, preserved and fruit preparations
011 Meat and edible meat offals, fresh, chilled or frozen 061 Sugar and honey
012 Meat and edible meat offals (except poultry liver), salted, in brine, dried or smoked
062 Sugar confectionery and other sugar preparations
014 Meat and edible meat offals, prepared or preserved, nes; fish extracts
071 Coffee and coffee substitutes
022 Milk and cream 072 Cocoa
023 Butter 073 Chocolate and other food preparations containing cocoa
024 Cheese and curd 074 Tea and maté
025 Egg and yolks, fresh, dried or otherwise preserved, sweetened or not
075 Spices
034 Fish, fresh (live or dead), chilled or frozen 081 Feeding stuffs for animals (not including unmilled cereals)
035 Fish, dried, salted or in brine, smoked fish 091 Margarine and shortening
036 Crustaceans and molluscs, fresh, chilled, frozen, salted, in brine or dried
098 Edible products and preparations, nes
037 Fish, crustaceans and molluscs, prepared or preserved, nes
1 Beverages
041 Wheat (including spelt) and meslin, unmilled 111 Non-alcoholic beverages, nes
042 Rice 112 Alcoholic beverages
043 Barley 2 Crude materials
044 Maize (corn), unmilled 222 Oil seeds and oleaginous fruit, whole or broken (excluding flours and meals)
045 Cereals, unmilled (other than wheat, rice, barley and maize)
223 Oil seeds and oleaginous fruit, whole or broken (non-defatted flours and meals)
046 Meal and flour of wheat and flour of meslin 4 Animal and vegetable oils and fats
047 Other cereal meals and flours 411 Animal oils and fats
048 Cereal preparations and preparations of flour or starch of fruits or vegetables
423 Fixed vegetable oils, fluid or solid, crude, refined or purified
054 Vegetables, fresh, chilled, frozen or simply preserved, roots, tubers
424 Other fixed vegetable oils, fluid or solid, crude, refined or purified
056 Vegetables, roots and tubers prepared or preserved, nes
431 Animal and vegetable oils and fats, processed and waxes
Note: nes = not elsewhere specified
Source: UNCTAD (1999), Handbook of International Trade and Development Statistics 1996/1997, pp.203-209.
Country-specific trade classification systems exist in addition to the SITC which often provide
more detailed information on trade of individual products. For example, the USA publish Standard Industrial
Classification (SIC) codes on a 4-digit level with 49 subgroups including categories such as sauces and salad
dressings, breakfast cereals or chewing gum (HENDERSON et al. 1996, pp.2-4). The Australian ANZSIC
(former ASIC) uses only 27 subgroups on the 4-digit level (BIE 1996, pp.252-254). The European Union
uses apart from the Standard Classification System a further denomination system for products that
originally were not included into the Annex II of the European Economic Union Treaty of 1966. Theses items
are called Not-Annex-II Products and include highly processed foods and chemical-technological products
which originate from agricultural raw materials (AID 1997, pp.229-234). Not-Annex-II products include
products such as yoghurt, ice-cream, yeast, citron acid, fructose, etc. (ibid.).

10 2 ANALYSING INTERNATIONAL FOOD PRODUCT MARKETS AT THE AGGREGATE LEVEL
2.1.4 Summary
The non-homogenous good food can be categorised into seven subgroups, which may be quite different
with regard to the nature of the international trade and investment patterns that occur in these product
groups: (i) undifferentiated agricultural commodities which are generally price sensitive and bulky; (ii) fresh
perishable foods which are difficult to transport but thanks to improved logistics, international trade in these
products has been growing rapidly, (iii) processed foods which through technological manipulation are
products either made edible through the separation of edible and non-edible parts, or which are altered in
texture, taste, shelf-life, etc., and where international trade of these products has often only been made
possible through a prolonged product life as a result of processing; (iv) manufactured foods, as a
preparation or mix of different ingredients, and where the way these foods are prepared or the particular
combination of ingredients may in many cases be "culturally-bound", thus putting potential restrictions on
the international marketability of these foods; (v) industrially produced food products (or consumer-
packaged foods) which in general cannot be produced in household kitchens, for which branding is very
important, and which very often may be designed by large international food and drink corporations from
the very start to be sold globally. Furthermore, there are also the concepts of (vi) high-value foods, which
are characterised by higher selling price levels and higher income elasticities of demand than the average
basic foods, and (vii) high value-added foods, where value-adding very often may go hand in hand with
higher degrees of processing, but sometimes branding alone can already increase the market value of a food
product considerably. Finally, the aggregation of similar foods into categories for trade-statistical reasons is
regulated in the Standard International Trade Classification (SITC) for food items of the United Nations, but
most countries have developed their own, nationally unique, classification systems. These aggregation rules
need to be understood, when analysing international trade in aggregate food categories.

2 ANALYSING INTERNATIONAL FOOD PRODUCT MARKETS AT THE AGGREGATE LEVEL 11
2.2 The significance of international trade in food products and foreign direct investments in
the food industries
Systematic data collection and research on trade in consumer-oriented food products and on other
international activities of food industries, such as foreign direct investments (FDI), has only recently started.
One of the pioneering works was conducted by DAYTON & HENDERSON (1992) who used United Nations
trade data for a 25-year period to compile detailed trends in international processed food trade. Also, hardly
any official statistics until now have provided systematic aggregate figures on trade in consumer-oriented
food products. Thus, most of the published information on trade in these products is based on some
categorisation and aggregation introduced by individual authors which makes comparison of the different
figures sometimes difficult.
The following section reviews existing information on trade in food products and complements it
by providing new tables which summarise recently published trade data. In addition, although exact
quantitative information on foreign direct investments in the food industries is even more scarce, some
insights ino the extent of these activities will be presented as well.
2.2.1 International trade in food products
Describing the structure of trade is a multidimensional task, as trade occurs between different countries
in different products and changes over time. Moreover, any presented picture of trade pattern may depend
crucially on the underlying aggregation of countries or products.
2.2.1.1 Worldwide overview and the most important countries
According to UN data, in 1990 64% of world food trade consisted of processed food (SHELDON & ABBOTT
1996, p.1). Trade growth in these products during the 1970s and 80s was about 1.3 times the level of bulk
commodity trade (442% versus 337%) (ibid.). High-value food exports in 1990 reached approximately
US$144bn, which was equal to crude petroleum exports and represented 5% of world commodity trade
(CARTER 1997). At this time, world trade in edible horticultural products alone (US$40.3bn) exceeded that
for cereals (US$38.4bn) (JAFFE & GORDON 1993).
The development of world agricultural trade during 1980 to 1997 is presented in Figure 1. It
shows the composition of world agricultural trade broken down into the four categories: (i) bulk
commodities, (ii) processed intermediate products, (iii) fresh horticultural goods, and (iv) processed
consumer products. As it becomes clear, the significance of bulk agricultural commodities in total trade
value has decreased strongly, representing about 30% of world agricultural trade in 1997, down from just
over 40% in 1980. At the same time, the share of consumer-processed products has risen: from about 20%
in 1980 to over 30% in 1997. The shares of the other two product groups, fresh horticultural goods and
intermediate processed products, have stayed fairly constant, at about 30% and 10% respectively. All this
shows that the real growth in world agricultural trade is within consumer-processed products, and that "bulk
commodities are no longer a valid indicator for measuring world agricultural trade growth" (GELHAR &
COYLE 2001, p.5).

12 2 ANALYSING INTERNATIONAL FOOD PRODUCT MARKETS AT THE AGGREGATE LEVEL
Figure 1: Composition of world agricultural trade (value), 1980-97
Notes: Bulk commodities consist of raw grains, oilseeds, tobacco, and cotton. Intermediate processed products consist of semi-processed goods such as flours, meals, and oils. Fresh horticultural goods consist of unprocessed fruits and vegetables such as bananas or tomatoes, and nursery products including cut flowers. Consumer-processed products include processed products at or near where a substantial degree of processing has taken place. Items in this category include beverages, bakery products, ready to eat cereals and snack food, fresh and frozen meat, and preserved fruit and vegetables.
Source: UN COMTRADE; Economic Research Service, US Department of Agriculture. Reproduced in GEHLHAR M. & COYLE W. (2001), 'Global Food Consumption and Impact on Trade Patterns', in REGMI A. (ed.), Changing Structure of Global Food Consumption and Trade, Economic Research Service (ERS), US Department of Agriculture, p.5.
World export shares of several countries and for different food categories are given in Table 2.
For the total food category, the share of US food exports in world exports in 1990-92 was slightly less than
20 years ago (19% versus 20%). By contrast, the European Union was able to raise its export share from
11% to 18% over the same time period. With regard to consumer-oriented foods, the EU was the most
important exporter in 1990-92 with 27% export share of these products. The US followed with 14% export
share of consumer-oriented foods, 6% more as compared to 1970-74. For bulk products, the US is by far
the most important exporter, holding about 30% of world exports in 1970-74 as in 1990-92. In
intermediate products, finally, in 1990-92 the US lost its leading role which it had in 1970-74 (19% export
share) to the EU (18% versus 17% for the US). To sum up, it becomes clear that the world's largest
exporters of food products are the US and the EU, with the importance of the latter growing and of the
former declining. In consumer-oriented food products the EU is the world leading exporter, whereas the US
holds this position for bulk commodities. In intermediate products both countries are about equally
important.
0%
20%
40%
60%
80%
100%
1980 81 82 83 84 85 86 87 88 89 90 91 92 93 94 95 96 97
Sh
are
of
tota
l
Bulk Intermediate processed Fresh horticultural Processed consumer

2 ANALYSING INTERNATIONAL FOOD PRODUCT MARKETS AT THE AGGREGATE LEVEL 13
Table 2: Major food suppliers by processing stage (% share of exports)
Average 1970-74 Average 1980-84 Average 1990-92
Total United States 20% 23% 19%
European Union 11 14 18 Australia 6 4 5 Canada 4 4 4
China 2 3 4
Bulk* United States 28 32 30
Canada 6 7 7 European Union 2 4 6
Australia 3 4 5 Brazil 7 5 5
Intermediate� European Union 11 19 18
United States 19 18 17 Australia 11 7 8 Malaysia 2 5 6
Argentina 3 4 5
Consumer-oriented� European Union 19 25 27
United States 8 10 14 Australia 6 4 4 Thailand 2 3 4
New Zealand 5 4 4
Notes: *Bulk commodities include wheat, rice, feed grains, soybeans, peanuts, cottonseed, flaxseed, safflowerseed, other bulk oilseeds, pulses, and raw sugar. Tropical products, such as green coffee, cocoa, and live animals, are also included in this category.
�Intermediate products are principally semiprocessed products in the intermediate stage of the food system, such as wheat flour, feeds and fodders, hops, oilseed meals, vegetable oils, and refined sugar.
�Consumer-oriented or consumer-ready products are fundamentally end-use products that require little or no additional processing for consumption. Included in this group are such items as fresh and processed horticultural products, fresh and processed meats, snack foods, beer and wine, and other processed food products.
Source: USDA FAS, Desk Reference Guide to Agricultural Trade, Agric. Handbook No. 683, April 1994, p.47. Reproduced in SCHAFFNER D.J., SCHRODER W.R. & EARLE M.D. (1998), Food Marketing � An International Perspective, p.232.
In OECD countries5 (excluding intra-EU trade, and imports by Turkey, Mexico and Iceland)
processed food imports accounted for 29.4% of total food imports in 1990-92 as compared to 23.4% in
1980-82 (OECD 1997, p.15). The annual growth rate within this period was 5.4% for processed food
imports and 2.2% for basic products (ibid.). The share of processed food exports in total food exports of
OECD countries in 1990-92 was 36.7% (29.4% in 1980-82), with annual average growth rates of 0.1% for
basic and 4.5% for processed food items (ibid.). Figure 2 demonstrates the strong growth in processed food
items as compared to basic agricultural commodities in OECD member states. It also shows that these
countries were net food importers in both food categories in 1980-82 as well as in 1990-92 (ibid.).
5 Members of the Organisation for Economic Co-operation and Development (OECD) include Austria, Belgium, Canada,
Denmark, France, Germany, Greece, Iceland, Ireland, Italy, Luxembourg, the Netherlands, Norway, Portugal, Spain, Sweden, Switzerland, Turkey, the UK, the USA, Japan, Finland, Australia, New Zealand, Mexico, the Czech Republic, Hungary, Poland, and the Republic of Korea.

14 2 ANALYSING INTERNATIONAL FOOD PRODUCT MARKETS AT THE AGGREGATE LEVEL
Figure 2: Food imports and exports of the OECD countries, US$ million, 1980-82 and 90-92
Imports (US$m)
-
40 000
80 000
120 000
1980/82 1990/92
Basic Processed
Exports (US$m)
-
40 000
80 000
120 000
1980/82 1990/92Basic Processed
Note: Intra-EU trade, and imports and exports by Turkey, Mexico and Iceland are not included.
Source: Author's compilation of data from OECD (1997), The Uruguay Round Agreement on Agricultural and Processed Agricultural Products, p.15.
The leading export nations in 1996 are given in Table 3. The US food, beverages and tobacco
(excluding agricultural raw materials) exports totalled US$31.2bn, followed by France (US$29.6bn), the
Netherlands (US$29.5bn), Germany (US$22.4bn), the UK (US$15.2bn), Italy (US$12.5bn), Australia
(US$8.5bn), and China (US$8.0bn). At the same time, the US imported foods and beverages worth of
US$37.8bn, followed by France (US$25.1bn), the Netherlands (US$20.4bn), Germany (US$40.1bn), the UK
(US$25.5bn), Italy (US$20.9bn), Australia (US$2.8bn), and China (US$6.2bn). Looking at net export6
values, however, results in a different ranking of competitive food export nations. The Netherlands lead the
field with US$9.1bn, followed by Australia (US$5.7bn), France (US$4.5bn) and China (US$1.7bn). Germany
was the largest net importer of food products with a US$17.6bn food trade deficit, followed by the UK
(-US$10.3bn), the US (-US$6.5bn) and Italy (-US$8.3bn). However, even these values may not reflect real
competitiveness in international food markets, as they are absolute rather than relative figures.
Per capita trade figures7 reveal that the Netherlands was the leading food product export nation,
in nominal terms (US$1 906 per capita exports) as on a net export basis (US$591 per capita net exports).
The second largest food product exporter in 1996 was France on the export basis (US$508 per capita
exports) ahead of Australia (US$470 per capita exports). In per capita net export terms, however, Australia
was far ahead of France with US$312 as compared to US$77. The leading per capita net food product
importer in 1996 was Japan with US$353 per capita net imports, followed by Germany (-US$216), the UK (-
US$176), Italy (-US$145), and the US (-US$24). These rankings should however be viewed cautiously,
since the UN statistics include tobacco in the export values and primary products in the import values.
Therefore a closer look at the trade structure of the individual countries seems necessary.
6 Net exports = exports - imports.
7 In theory it would also be possible to relate trade values to e.g. arable land per country instead of to the population number. However, as food industries today seem more and more able to source their inputs globally, a country's own land resources may not be any longer a limiting determinant for export performance in processed, manufactured or industrially produced food products.

Table 3: World's leading food exporters and food trade balance in some selected countries, 1996
Rank Country Food Bev Tob exports in US$
million
Food Bev Tob export share in total exports
(%)
Food Bev imports in US$ million
Food Bev import share
(%)
Proc. Food Bev import share
(% total)
Proc. Food Bev import share (% household
use)
Net exports in
US$ million
Population in million
Per capita exports in
US$
Per capita imports in
US$
Per capita net exports
in US$
(1) (2) (3) (4) (5) (6) (7) (8)
1 USA 31 253.65 5.0 37 813.15 4.6 2.2 1.8 -6 559.50 266.6 117.2 141.9 -24.6
2 France 29 668.93 10.3 25 144.37 9.0 4.6 4.0 4 524.55 58.4 508.2 430.7 77.5
3 Netherlands 29 586.80 15.0 20 412.56 11.3 5.1 4.1 9 174.23 15.5 1 906.7 1 315.5 591.2
4 Germany 22 408.89 4.3 40 102.11 8.8 4.0 3.5 -17 693.22 81.9 273.6 489.6 -216.0
5 UK 15 201.72 5.8 25 587.76 8.9 5.5 4.6 -10 386.04 58.8 258.6 435.3 -176.7
6 Italy 12 545.21 5.0 20 903.89 10.1 3.8 3.4 -8 358.68 57.4 218.6 364.2 -145.6
7 Australia 8 595.89 14.2 2 878.83 4.4 3.2 2.7 5 717.06 18.3 470.0 157.4 312.6
8 China 8 013.44 5.3 6 252.48 4.5 1.8 0.4 1 760.97 1 232.1 6.5 5.1 1.4
9 Spain 7 955.97 7.8 13 031.53 10.7 4.1 3.8 -5 075.56 39.3 202.6 331.8 -129.2
10 Thailand* 7 107.42 12.8 2 011.58 2.8 1.2 1.0 5 095.84 60.0 118.5 33.5 84.9
11 India* 3 173.48 9.6 1 495.09 4.0 2.5 0.6 1 678.38 936.0 3.4 1.6 1.8
12 Turkey 2 239.05 9.7 2 038.32 4.8 2.1 1.4 200.73 62.7 35.7 32.5 3.2
13 Greece* 1 993.77 18.2 3 603.83 13.9 6.9 6.5 -1 610.06 10.5 190.3 344.0 -153.7
14 Hungary 1 934.93 15.3 539.04 3.4 1.8 1.4 1 395.89 10.2 189.8 52.9 136.9
15 Japan 1 643.70 0.4 46 092.35 13.2 3.6 3.1 -44 448.65 125.8 13.1 366.5 -353.4
16 Finland 922.62 2.4 1 756.25 6.0 3.2 2.7 -833.63 5.1 180.0 342.7 -162.7
Notes: *Data for 1995 (1) Food, beverages and tobacco exports (excluding agricultural products) as given by the statistics (2) Food and beverages (including primary products) import value calculated by multiplying given share with value of total imports (3) Share of processed food and beverages imports in total imports (4) Share of processed food and beverages imports for household use in total imports (5) Net exports calculated by subtracting (2) from (1) although both aggregates are not completely identical (6) Per capita food, beverages and tobacco exports calculated by dividing (1) through population (7) Per capita processed food and beverages imports calculated by dividing (2) through population (8) Per capita net processed food exports calculated by subtracting (7) from (6).
Source: United Nations (1997), 1996 International Trade Statistics Yearbook � Volume I: Trade by Country; United Nations (1998), Demographic Yearbook 1996; Author's calculations (in italics).
2 A
NALY
SIN
G IN
TERN
ATIO
NAL FO
OD
PRO
DU
CT M
ARKETS A
T T
HE A
GG
REG
ATE LE
VEL
15

16 2 ANALYSING INTERNATIONAL FOOD PRODUCT MARKETS AT THE AGGREGATE LEVEL
Table 4 and Table 5 present a more accurate aggregation, since the figures given in Table 3 also
contain products that cannot be considered as processed, manufactured, industrially produced food products
or high-value food items. The aggregation in Table 4 and Table 5 includes the food categories meat and
preparations (SITC 01), dairy products (SITC 02), fish and preparations (SITC 03), prepared cereals (SITC
048), vegetable and fruit (SITC 05), refined sugar and preparations (SITC 0612), coffee, tea, cocoa, spices
(SITC 07), miscellaneous edible products (SITC 09), beverages (SITC 11) and oils and fats (SITC 4). Not
included are live animals for food (SITC 001), grains and unmilled cereals (SITC 041-047), raw sugar (SITC
06), feeding stuffs for animals (SITC 081), and tobacco (SITC 12). The tables give insights into the trade
structure of the world leading food trade nations and they also provide the share of individual food
categories in the total processed food, beverages and fats trade.
The United States was a main producer of grains and unmilled cereals, of animal feed and of
tobacco in 1996. This explains why the export value for aggregated processed food, beverages and fats is
only half of that for total food and live animals (SITC 0). Within the processed and high-value food
category, fruit and vegetables (33.2% share in total processed food, beverages and fats exports), meat and
preparations (29.9%), and fish and preparations (13.0%) are the largest groups. The US was also a main
exporter of miscellaneous edible products (10.7%). With regard to imports, it is striking that the US was
also a main importer of fruit and vegetables (30.0% share in total processed food, beverages and fats
imports), and of fish and preparations (24.5%). This can already be seen as a hint for the significance of
intra-industry trade in the processed and high-value food trade. Finally, alcoholic beverages accounted for
18.0% of US imports.
France exported mainly alcoholic beverages (25.7%), dairy products (15.2% with cheese and curd
accounting for 7.8% share of total processed food, beverages and fats exports) and meat and preparations
(15.1%). Miscellaneous edible products accounted for 7.5% of total processed and high-value food exports.
The main imports in 1996 were fruit and vegetables (26.5%), meat and preparations (15.9%), and fish and
preparations (14.0%). In general, the trade structure seems to be more divers than the US one.
The Netherlands' processed and high-value food exports in 1996 included as main groups
horticultural products (26.0% share, with 14.8% for fresh or simply preserved vegetables), meat and
preparations (20.3% for the total group and 6.8% for pig meat fresh, chilled or frozen), and dairy products
(18.5%). Cheese and curd exports accounted for 8.7% of total exports and at US$2.28bn exceeded even
those of France (US$2.23bn). The main imports in 1996 were: fruit and vegetables (30.9% with fruit, nuts
fresh, dried accounting for 11.3%), dairy products (15.7% with milk and cream accounting for 11.1%), and
coffee, tea, cocoa, spices (14.1% with cocoa alone 7.0%).
Germany exported as main food items in 1996 dairy products (32.1%, with milk and cream
accounting for 19.0%), coffee, tea, cocoa, spices (16.8%), and fruit and vegetables (14.0%). Alcoholic
beverages exports contributed 10.6% to total processed and high-value food exports. 34.9% of the imports
of these products were in fruit and vegetables (15.1% fruit, nuts fresh, dried), 15.3% in meat and
preparations (5.9% pig meat fresh, chilled, frozen), and 10.6% in dairy products (6.5% for cheese and
curd).

Table 4: Food trade structure of selected countries in 1996
Trade values in US$ million
United States France Netherlands Germany
SITC Product Exports % Imports % Exports % Imports % Exports % Imports % Exports % Imports %
Proc food, bev and fats* 23 464.0 100.0 28 642.4 100.0 28 537.8 100.0 22 920.0 100.0 26 163.3 100.0 14 539.4 100.0 15 425.8 100.0 35 562.8 100.0
0 Food and live animals 45 773.7 31 114.0 29 974.7 23 611.1 27 057.6 16 618.9 20 907.7 35 801.1
001 Live animals for food 1 706.7 1 039.5 450.2
01 Meat and preparations 7 007.3 29.9 2 469.0 8.6 4 321.5 15.1 3 652.5 15.9 5 303.5 20.3 1 313.6 9.0 2 010.8 13.0 5 442.6 15.3
011 Meat fresh, chilled, frozen 6 426.6 27.4 1 940.4 6.8 3 664.6 12.8 3 134.0 13.7 4 387.6 16.8 1 002.8 6.9 1 537.1 10.0 4 659.7 13.1 0111 Bovine meat fresh, frozen 2 381.7 10.2 1 230.3 4.3 1 117.0 3.9 982.3 4.3 1 324.9 5.1 959.4 6.2 883.7 2.5 0113 Pig meat fresh, chilled, frozen 1 786.7 6.8 2 100.5 5.9 0114 Poultry fresh, chilled, frozen 2 311.2 9.8 1 564.9 5.5 1 042.8 4.0 014 Meat prepd, prsvd, nes etc 474.0 1.8
02 Dairy products, birds' eggs 4 345.9 15.2 2 013.1 8.8 4 839.5 18.5 2 283.1 15.7 4 956.8 32.1 3 775.5 10.6 022 Milk and cream 1 726.0 6.0 743.7 3.2 1 460.4 5.6 1 611.0 11.1 2 931.6 19.0 0224 Milk, cream preserved etc 1 087.2 3.8 1 180.9 4.5 1 203.8 8.3 1 560.9 10.1 023 Butter 565.5 2.2 228.8 1.6 024 Cheese and curd 2 238.1 7.8 2 288.4 8.7 360.4 2.5 1 738.8 11.3 2 315.7 6.5 025 Eggs, birds, fresh, prsrvd 525.2 2.0
03 Fish and preparations 3 058.6 13.0 7 026.9 24.5 980.6 3.4 3 206.1 14.0 1 395.8 5.3 943.4 6.5 2 365.8 6.7 034 Fish fresh, chilled, frozen 1 902.4 8.1 2 510.6 8.8 1 415.5 6.2 769.9 2.9 496.9 3.4 1 365.5 3.8 036 Shell fish fresh, frozen 3 309.4 11.6 890.7 3.9
04 Cereals and preparations 18 437.3 7 600.2 2 196.1 1 670.2 2 135.8 3 828.7 2 623.9 7.4 048 Cereals etc preparations 1 733.3 6.1 1 609.5 7.0 1 271.2 4.9 579.6 4.0 1 814.1 11.8 1 557.9 4.4 0484 Bakery products 590.2 2.3
05 Vegetable and fruit 7 781.7 33.2 8 600.0 30.0 3 701.5 13.0 6 062.9 26.5 6 800.7 26.0 4 494.5 30.9 2 166.7 14.0 12 428.2 34.9 054 Veg etc frsh, smply prsvd 1 941.6 8.3 2 488.0 8.7 1 304.9 4.6 1 849.8 8.1 3 883.3 14.8 1 545.8 10.6 4 065.4 11.4 0544 Tomatoes fresh 833.8 3.2 057 Fruit, nuts, fresh, dried 4 047.8 17.3 3 570.1 12.5 1 487.0 5.2 2 512.1 11.0 1 275.6 4.9 1 642.7 11.3 5 386.9 15.1 0579 Fruit fresh or dried nes 847.7 3.0 468.2 3.2 1 432.2 4.0 058 Fruit preserved, prepared 1 189.9 4.2 883.2 3.4 1 032.1 7.1 2 035.7 5.7
06 Sugar and preps, honey 2 077.0 691.5 577.6 451.8 0612 Refined sugar etc. 1 491.7 5.2
07 Coffee, tea, cacoa, spices 4 899.4 17.1 1 731.7 6.1 2 728.8 11.9 1 909.6 7.3 2 053.7 14.1 2 595.4 16.8 4 018.9 11.3 071 Coffee and substitutes 2 884.0 10.1 1 110.1 4.8 599.4 4.1 2 129.0 6.0 072 Cocoa 985.5 3.8 1 015.7 7.0 073 Chocolate and products 1 028.1 3.6 961.5 4.2 655.1 2.5
081 Feeding stuff for animals 4 387.1 1 365.0 1 701.7 2 233.4 1 960.4 1 449.2 1 802.3
09 Misc edible products 2 512.3 10.7 2 144.6 7.5 918.7 4.0 1 287.9 4.9 532.4 3.7 1 737.0 4.9 098 Edible products, preps nes 2 361.9 10.1 2 092.5 7.3 1 015.8 3.9 461.4 3.2 1 669.6 4.7 09809 Misc food preparations nes 1 830.6 7.8 1 864.8 6.5 554.7 2.1 1 355.5 3.8
1 Beverages and tobacco 8 024.8 7 031.4 8 378.7 3 388.0 4 909.4 2 083.5 3 519.2 4 245.2 11 Beverages 1 361.1 5.8 5 647.1 19.7 8 086.9 28.3 1 651.5 7.2 1 862.9 7.1 1 111.6 7.6 1 882.0 12.2 2 947.6 8.3 111 Non-alcoholic beverages nes 758.5 2.7 112 Alcoholic beverages 5 164.7 18.0 7 328.4 25.7 1 372.8 6.0 1 489.1 5.7 850.4 5.8 1 631.6 10.6 2 711.8 7.6 11212 Wine of fresh grapes 4 785.3 16.8 557.4 3.8 1 821.6 5.1 1123 Beer, ale, stout, porter 1 160.9 4.4 1124 Distilled alcoholic beverages 2 316.6 8.1 11242 Distilled wine, grape marc 1 829.8 6.4 12 Tobacoo and manufactures 6 663.7 1 736.5 3 046.5 971.9 1 637.3 1 297.6
4 Animal, vegetable oil, fat 1 743.1 7.4 1 076.7 4.7 1 492.2 5.7 1 227.4 8.4 1 289.2 3.6 42 Fixed vegetable oil, fat 971.6 3.7 822.5 5.7
Note: *Calculated by adding SITC 01, 02, 03, 048, 05, 0612, 07, 09, 11 and 4.
Source: United Nations (1997), 1996 International Trade Statistics Yearbook � Volume I: Trade by Country; Author's calculations (in italics).
2 A
NALY
SIN
G IN
TERN
ATIO
NAL FO
OD
PRO
DU
CT M
ARKETS A
T T
HE A
GG
REG
ATE LE
VEL
17

Table 5: Food trade structure of selected countries in 1996
Trade values in US$ million
United Kingdom Italy Australia China
SITC Product Exports % Imports % Exports % Imports % Exports % Imports % Exports % Imports %
Proc food, bev and fats* 11 268.0 100.0 22 976.7 100.0 13 762.9 100.0 15 765.3 100.0 6 495.7 100.0 2 191.5 100.0 8 999.7 100.0 2 332.8 100.0
0 Food and live animals 10 652.3 22 321.2 11 995.1 19 571.3 12 365.7 2 276.7 10 206.7 5 648.9
001 Live animals for food 1 424.7 503.3 462.2
01 Meat and preparations 1 620.2 14.4 3 939.0 17.1 1 090.3 7.9 3 607.3 22.9 2 264.5 34.9 1 437.8 16.0 011 Meat fresh, chilled, frozen 1 444.6 12.8 2 110.8 9.2 3 451.8 21.9 2 219.0 34.2 1 083.6 12.0 0111 Bovine meat fresh, frozen 219.2 1.9 1 340.7 8.5 1 621.1 25.0 0112 Mutton etc fresh, chilld, frozen 413.1 6.4 0113 Pig meat fresh, chilled, frozen 1 764.4 11.2 0114 Poultry fresh, chilled, frozen 690.9 7.7 0121 Pig meat dried, salted, smoked 1 060.2 4.6 014 Meat prepd, prsvd, nes etc 766.1 3.3 344.8 3.8
02 Dairy products, birds' eggs 1 055.4 9.4 1 710.3 7.4 945.4 6.9 2 984.4 18.9 1 344.3 20.7 022 Milk and cream 1 425.5 9.0 810.1 12.5 0224 Milk, cream preserved etc 709.2 10.9 024 Cheese and curd 983.4 4.3 845.6 6.1 1 334.9 8.5 368.3 5.7
03 Fish and preparations 1 110.8 9.9 1 901.0 8.3 2 515.6 16.0 821.8 12.7 473.6 21.6 2 855.3 31.7 600.4 25.7 034 Fish fresh, chilled, frozen 808.2 3.5 1 024.6 6.5 866.7 9.6 380.8 16.3 036 Shell fish fresh, frozen 801.8 5.1 622.3 9.6 781.8 8.7 037 Fish etc prepd, prsvd nes 851.2 3.7 174.8 8.0 1 131.2 12.6
04 Cereals and preparations 2 638.0 2 025.1 2 834.6 2 381.6 4 547.2 165.0 604.3 6.7 2 601.3 048 Cereals etc preparations 1 515.5 13.4 1 125.4 4.9 1 998.5 14.5 292.3 4.5 0483 Macaroni, spaghetti etc 1 204.4 8.8 0484 Bakery products 705.3 6.3 755.0 5.5
05 Vegetable and fruit 6 489.5 28.2 4 828.2 35.1 2 795.9 17.7 856.2 13.2 459.6 21.0 3 178.6 35.3 054 Veg etc frsh, smply prsvd 2 218.8 9.7 1 692.8 12.3 901.9 5.7 361.3 5.6 1 357.8 15.1 0542 Leguminous vegetables dry 181.7 2.8 248.2 2.8 05461 Vegetables frozen 791.4 5.8 056 Vegetables etc prsvd, prepd 944.9 10.5 057 Fruit, nuts, fresh, dried 2 812.6 12.2 2 081.6 15.1 1 265.2 8.0 340.7 5.2 417.6 4.6 0579 Fruit fresh or dried nes 978.6 7.1 058 Fruit preserved, prepared 1 017.6 4.4 829.9 6.0 458.4 5.1
06 Sugar and preps, honey 1 355.0 1 284.4 415.3 427.7 0612 Refined sugar etc. 238.6 2.7
07 Coffee, tea, cacoa, spices 1 052.6 9.3 1 976.8 8.6 829.6 6.0 1 319.6 8.4 379.4 17.3 547.3 6.1 071 Coffee and substitutes 876.7 5.6 0741 Tea 282.5 3.1 072 Cocoa
081 Feeding stuff for animals 1 335.1 5.8 1 403.3 390.5 365.5 1 299.5
09 Misc edible products 1 280.2 5.6 202.1 3.1 398.5 18.2 098 Edible products, preps nes 1 179.1 5.1 394.2 18.0 09809 Misc food preparations nes 927.2 4.0 295.9 13.5
1 Beverages and tobacco 6 810.6 4 455.2 3 135.0 2 117.7 577.4 399.8 1 341.9 497.3 11 Beverages 4 913.5 43.6 3 482.4 15.2 2 875.1 20.9 792.5 5.0 528.1 8.1 266.9 12.2 366.2 4.1 40.4 1.7 112 Alcoholic beverages 4 652.1 41.3 3 264.2 14.2 2 733.9 19.9 734.9 4.7 496.5 7.6 258.4 11.8 11212 Wine of fresh grapes 2 201.3 9.6 2 128.7 15.5 430.5 6.6 1124 Distilled alcoholic beverages 4 083.9 36.2 188.6 8.6 11241 Whisky 3 609.1 32.0 12 Tobacoo and manufactures 1 897.1 972.7 1 325.2 975.7 457.0
4 Animal, vegetable oil, fat 1 072.1 4.7 1 195.8 8.7 1 750.1 11.1 186.4 2.9 213.5 9.7 375.9 4.2 1 692.0 72.5 411 Animal oils and fat 151.3 2.3 42 Fixed vegetable oil, fat 1 603.0 10.2 185.5 8.5 351.1 3.9 1 571.2 67.4 4235 Olive oil 921.0 6.7 1 176.7 7.5
Note: *Calculated by adding SITC 01, 02, 03, 048, 05, 0612, 07, 09, 11 and 4. Source: United Nations (1997), 1996 International Trade Statistics Yearbook � Volume I: Trade by Country; Author's calculations (in italics).
18
2 A
NALY
SIN
G IN
TERN
ATIO
NAL FO
OD
PRO
DU
CT M
ARKETS A
T T
HE A
GG
REG
ATE LE
VEL

2 ANALYSING INTERNATIONAL FOOD PRODUCT MARKETS AT THE AGGREGATE LEVEL 19
The United Kingdom's processed food, beverages and fats exports were dominated by beverages
which accounted for 43.6% (32.0% for whiskey alone) in 1996. Other important export food categories
were meat and preparations (14.4%), and cereal preparations (13.4%). Main imports were fruit and
vegetables (28.2%, with fruit, nuts fresh, dried accounting for 12.2%), meat and preparations (17.1%), and
beverages (15.2%, with wine of fresh grapes alone 9.6%). 5.6% of the food imports were miscellaneous
edible products.
Italy was a main exporter of wine of fresh grapes (15.5%), of fruits (15.1%), vegetables (12.3%),
macaroni, spaghetti etc. (8.8%), olive oil (6.7%), and cheese and curd (6.1%) in 1996. In more
aggregated terms, fruit and vegetables accounted for 35.1%, beverages for 20.9%, oils and fats for 8.7%,
and meat and preparations for 7.9% of total processed and high-value food exports. Main imports were
meat and preparations (22.9%), dairy products (18.9%, with 9.0% accounting for milk and cream alone),
fruit and vegetables (17.7%), fish and preparations (16.0%), and oils and fats (11.1%, with olive oil
accounting for 7.5%).
Australia as a large agricultural producer had processed food, beverages and fats exports
contributing to about half the value of food and live animals shipments in 1996. Within this group exports of
meat and preparations totalled 34.9% (34.2% for meat fresh, chilled, frozen alone), of dairy products
20.7% (12.5% for milk and cream), fruit and vegetables 13.2%, and beverages 8.1% (with wine of fresh
grapes accounting for 6.6%). Main imports were fish and preparations (21.6%), fruit and vegetables
(21.0%), miscellaneous edible products (18.2%), and coffee, tea, cocoa, spices (17.3%).
China exported mainly fruit and vegetables (35.3%, with 10.5% for vegetables etc. preserved,
prepared), fish and preparations (31.7%, fish etc prepared, preserved nes accounting for 12.6%), and meat
and preparations (16.0%). 83.7% of China's food imports in 1996 were made up of only two categories:
fixed vegetable oil, fat (67.4%) and fish fresh, chilled frozen (16.3%).
The general picture arising from the data provided in Table 4 and Table 5 is that in all of the
leading food exporting nations the food export scheme is quite diverse. With the exception of the UK where
beverages accounted for 43.6% of total food, beverages and fats exports in 1996, in all other countries the
most significant export food category never exceeded 36%. In fact, the two leading food, beverages and
fats export nations (France with US$28.5bn and the Netherlands with US$26.1bn worth of exports) had the
most diversified export pattern, with none of the individual food categories exceeding 29% (France) and
26% (Netherlands). Figure 3 illustrates this conclusion in a more systematic way by displaying a possible
connection between per capita exports of a country and the diversity of its export structure.

20 2 ANALYSING INTERNATIONAL FOOD PRODUCT MARKETS AT THE AGGREGATE LEVEL
Figure 3: Export diversity structure of world leading exporters of food products, 1996
Notes: Figure shows the shares of the most important export product categories in total processed food, beverages and fats export of individual countries. 1st = food category with highest share in total exports, 2nd = food category with the second highest share in total exports, ..., 4th++ share of the sum of all remaining food categories . Countries are ranked in an ascending order according to per capita exports as calculated by total processed food, beverages and fats exports (as given in Tables 4 and 5) divided by countries' population (as provided in Table 3). The Netherlands have the highest per capita exports, China the lowest. Trend lines are manually fitted.
Source: Author's compilation based on data given in Tables 4 and 5.
Figure 3 suggests a possible relationship between a country's per capita consumer-oriented food
exports and the diversity of its export structure, as measured by the share of the most important food
categories in its total processed food, beverages and fats exports. It seems that the higher per capita
exports are, the lower the share of the most important food category and the larger the combined share of
the fourth and higher categories. This means that a successful food product exporting nation is one that is
not specialised in only one or two food categories, but exports a whole variety of different food items, each
of them with considerable share in total exports.
Developing countries' share in worldwide exports of processed and high-value food products for
the period between 1980-81 and 1994-95 is provided in Table 7. As it becomes clear, this share has
evolved for individual food categories differently, but it has increased in more food product groups than in
those where it has decreased. With respect to the EU market, MATTHEWS (1994) showed that the share of
primary processed foods and of manufactured food products imported from developing countries increased
slightly between 1984-86 and 1990 (from 35.3% to 36.0% for the former and from 4.1% to 4.6% for the
later category respectively). However, as Table 7 shows, the share of the least developed countries in the
worldwide exports of food products has slightly declined in 1994-95 as compared to 1980-81 (from 31.3% to
31.0%), thus emphasising the weak standing of these countries in the global exports of food products.
0%
10%
20%
30%
40%
50%
60%
70%
80%
90%
100%
Netherlands France Australia Italy UK Germany US China
4th++3rd2nd1st

2 ANALYSING INTERNATIONAL FOOD PRODUCT MARKETS AT THE AGGREGATE LEVEL 21
2.2.1.2 The main products
The largest product category which accounted for 30% of the global export value in 1987 was
miscellaneous food and kindred products with US$23.3bn (HENDERSON et al. 1996a, p.26). This category
includes fish and seafoods fresh, canned or frozen, coffee and other food preparations nes. The second
most important category was meat products (18%), followed by sugar and confectionery products (11%),
and the smallest categories were bakery products and grain mill products (6.7% altogether) (ibid.).
In 1995, total world food exports accounted for US$427bn which was 9.5% of total world
commodity exports (UNCTAD 1999, see also Table 7). The most important processed or high-value food
products were meat fresh, chilled, frozen (with 8.7% share in world food exports), alcoholic beverages
(6.0%), fruit, nuts fresh, dried (5.8%), vegetables etc. fresh, simply preserved (5.2%), and fish fresh,
chilled, frozen (4.5%).
Fresh fish (including shell fish) and fish preparations were the most important high-value
and processed food items for developing countries' exports in 1994-95 (Table 7). For example, 66.9% of
shell fish fresh, frozen and 55.4% of fish etc. prepared, preserved nes world exports came from least
developed countries in 1994-95. In 1997, global fishery exports were worth some US$51bn which
represented 10% of the value of global agricultural exports and about 1% of total merchandise trade (FAO
1999). Despite the fact that most seafood exports occur in some kind of processed form because fish is
highly perishable (ibid.), there was an increase by a factor of 11 between 1976 and 1996 in the (nominal)
value of world wide fresh fish exports, according to the FAO Fishery Database. Table 6 illustrates the high
growth rate in international fresh seafood trade.
Table 6: World fresh fish exports 1976 and 1996, in US$ million
1976 1996 Increase factor
Cephalopods 7.1 292.7 41.0
Crustaceans 139.9 1 376.8 9.8
Demersl marine fish 226.4 1 827.9 8.1
Freshwater diadrom 172.3 2 940.7 17.1
Marine fish nes 52.6 684.8 13.0
Molluscs excl cephalopods 82.5 791.8 9.6
Pelagic marine fish 144.6 1 076.1 7.4
Total 825.4 8 990.8 10.9
Note: nes = not elsewhere specified
Source: FAO, Fishery Online-Database: www.fao.org/databases/fisheries, Oct. 1999; Author's calculations (in italics).
The product categories with the highest growth rates (Table 7) between 1980 and 1995
were all highly processed items such as food preparations nes (11.6%), cereal preparations (11.2%), non-
alcoholic beverages (11.4%), and sugar preparations non-chocolate (10.3%).

Table 7: Value of world trade in food products, 1980-95
LDC* share of world exports
SITC Product category World exports 1994-95
US$ million Share (%) in world
food exports Share (%) in total
world exports Growth rate (%)
1980-95 1980-81 1994-95 Change
011 Meat fresh, chilled, frozen 37 067.2 8.67 0.83 6.2 12.7 14.9 2.2
112 Alcoholic beverages 25 592.2 5.99 0.57 7.4 6.3 8.9 2.6
057 Fruit, nuts fresh, dried 24 935.1 5.84 0.55 6.0 43.6 40.2 -3.4
054 Veg etc fresh, simply prsvd 22 298.5 5.22 0.50 8.0 33.5 29.2 -4.3
034 Fish fresh, chilled, frozen 19 405.2 4.54 0.43 9.6 34.0 33.5 -0.5
036 Shell fish fresh, frozen 16 958.6 3.97 0.38 10.7 60.7 66.9 6.2
048 Cereal etc preparations 14 788.3 3.46 0.33 11.2 9.2 13.2 4.0
098 Edible products, preps nes 14 147.1 3.31 0.32 11.6 10.2 13.2 3.0
022 Milk and cream 12 395.2 2.90 0.28 7.2 2.1 5.0 2.9
058 Fruit preserved, prepared 11 372.4 2.66 0.25 7.9 37.0 36.0 -1.0
024 Cheese and curd 10 384.1 2.43 0.23 6.9 - - -
423 Fixed veg oils, soft 10 127.9 2.37 0.23 6.9 27.9 38.2 10.3
037 Fish etc prepd, prsvd nes 8 355.3 1.96 0.19 8.2 33.9 55.4 21.5
424 Fixed veg oil nonsoft 7 298.6 1.71 0.16 5.2 84.4 85.7 1.3
073 Chocolate and products 7 221.0 1.69 0.16 10.5 - - -
014 Meat prepd, prsvd, nes etc 5 486.8 1.28 0.12 6.3 30.4 23.6 -6.8
111 Non-alcohol beverages nes 4 185.0 0.98 0.09 11.4 19 20.6 1.6
062 Sugar preps non-chocolate 3 668.5 0.86 0.08 10.3 15.5 23.6 8.1
Total food 427 336.3 59.83� 9.53 8.4� 31.3 31.0 -0.3
Notes: *LDC = Least developed countries. � sum of column. � mean of column. nes = not elsewhere specified.
Source: UNCTAD (1999), Handbook of International Trade and Development Statistics 1996/1997; Author's calculations (in italics).
22
2 A
NALY
SIN
G IN
TERN
ATIO
NAL FO
OD
PRO
DU
CT M
ARKETS A
T T
HE A
GG
REG
ATE LE
VEL

2 ANALYSING INTERNATIONAL FOOD PRODUCT MARKETS AT THE AGGREGATE LEVEL 23
OECD countries (excluding intra-EU trade) in the early 1990s imported as main processed food
items fruit and vegetable products (35.9% share in total processed food imports), followed by oils and fats
(13.0%) (OECD 1997, p.15). The main processed export goods were dairy products (24.4% share in total
processed food exports) and prepared cereal products (14.4%) (ibid., p.16). The highest annual growth
rates in processed food imports in the period from 1980-82 to 1990-92 were achieved by edible products
and preparations nes (12.4% average annual growth rate) and prepared cereal products (11.8%). With
regard to exports, prepared cereal products achieved 10.7% and coffee, cocoa and chocolate products (not
displayed in the charts) 8.5% annual growth (ibid.). Figure 4 and Figure 5 show the situation.
Figure 4: Imports of foods (basic and processed) of OECD countries, 1980-82 and 1990-92
1980-82 (US$m)
-
5 000
10 000
15 000
20 000
25 000
30 000
35 000
Meat Dairyproducts
Cereals Fruit &vegetables
Sugar &honey
Oil & fats Edibleprod. nes
1990-92 (US$m)
-
5 000
10 000
15 000
20 000
25 000
30 000
35 000
Meat Dairyproducts
Cereals Fruit &vegetables
Sugar &honey
Oil & fats Edibleprod. nes
Figure 5: Exports of foods (basic and processed) of OECD countries, 1980-82 and 1990-92
1980-82 (US$m)
-
5 000
10 000
15 000
20 000
25 000
30 000
35 000
Meat Dairyproducts
Cereals Fruit &vegetables
Sugar &honey
Oil & fats Edibleprod. nes
1990-92 (US$m)
-
5 000
10 000
15 000
20 000
25 000
30 000
35 000
Meat Dairyproducts
Cereals Fruit &vegetables
Sugar &honey
Oil & fats Edibleprod. nes
Notes: ! processed. nes = not elsewhere specified. Intra-EU trade, and imports and exports by Turkey, Mexico and Iceland are not included. Edible products and preparations nes include food items such as soups, sauces and seasonings, ice-cream, yeast, sweet corn and vinegar.
Source: Author's compilation of data from OECD (1997), The Uruguay Round Agreement on Agricultural and Processed Agricultural Products, pp.15-16.

24 2 ANALYSING INTERNATIONAL FOOD PRODUCT MARKETS AT THE AGGREGATE LEVEL
2.2.1.3 Intra-industry trade
The simultaneous exchange of similar goods is called intra-industry trade. The finding that countries
export and import the same types of processed and high-value foods at the same time resulted already from
the figures of Table 4 and Table 5. The extent of intra-industry trade can be measured by the Grubel-Lloyd
Index8.
Within the European Union in 1992 almost half of the trade in food and beverages was of the
intra-industry kind, as Table 8 shows. Belgium lead the field with 62% of its food and beverages trade being
intra-industry, followed by Germany (58%), the Netherlands (56%), France (54%), and the UK (49%)
(TRAILL 1997, p.396). In Greece, Portugal, Italy and Denmark intra-industry trade was less than EU
average.
Table 8: EU intra-industry trade in food and beverages, 1980/92 (Grubel-Lloyd Index)
Country 1980 1992
Belgium .57 .62 Germany .53 .58 Netherlands .54 .56 France .49 .54 United Kingdom .45 .49 Spain .27 .47 Ireland .36 .45 Denmark .37 .39 Italy .32 .38 Portugal .19 .28 Greece .13 .24
EU-12 .38 .45
Source: TRAILL B. (1997), 'Globalization in the food industries', in European Review of Agricultural Economics, Vol. 24, pp.390-410.
More specific for the European Dairy industries, PIERI et al. (1997) calculated Grubel-Lloyd
Index figures for the intra-industry trade between various EU member countries (see Table 9). The figures
show that, at least for dairy products, European trade integration is not so homogenous as the figures in
Table 8 might suggest. In fact, two distinctive groups of countries with strong two-way exchange of dairy
products can be identified (with coefficients being larger than 0.5 in each group). The first country group
includes France, Belgium (incl. Luxembourg), The Netherlands, Germany and Denmark. The second group
may be seen as the three Mediterranean countries, Greece, Spain and Portugal (ibid., p.415). Furthermore,
it can be seen that, in general, intra-industry between these two groups is rather weak, perhaps already
indicating that geographical and cultural distance may play an important role for these trade patterns.
8 The Grubel-Lloyd Index is defined as ( ) ( )[ ]
( )MXMXMX
+
−−+ where X = exports and M = imports of similar products. The
index has the characteristic 1 ≥ GL Index ≥ 0; with 0 = all trade is inter-industry; 1 = all trade is intra-industry (HENDERSON 1998, p.113).

2 ANALYSING INTERNATIONAL FOOD PRODUCT MARKETS AT THE AGGREGATE LEVEL 25
Table 9: EU intra- industry trade in dairy products, 1992 (Grubel-Lloyd Index)
F B-L NL D I UK IRL DK GR P SP
F .82 .87 .97 .14 .75 .30 .94 .16 .41 .23 B-L .67 .96 .12 .54 .04 .56 .03 .12 .45 NL .61 .67 .74 .08 .86 .01 .79 .25 D .07 .29 .07 .54 .18 .16 .21 I .26 0 .09 .25 .27 .46 UK .91 .14 .62 0 .53 IRL .93 0 0 .09 DK 0 .50 .09 GR .77 .96 P .96
Source: Adapted from: PIERI R., RAMA D. & VENTURINI L. (1997), 'Intra-industry trade in the European dairy industry', in European Review of Agricultural Economics, Vol. 24, p.415.
The United States had even higher intra-industry index values within the North American Free
Trade Area (NAFTA) for food products in 1994 than the European Union (see Table 10). Other food
preparations was the food product category with the highest Grubel-Lloyd Index value (0.83) in the trade
between the US and the EU, followed by fresh meat (0.77), breakfast cereals (0.71), and canned fruits and
vegetables (0.71). Products that were mainly or exclusively traded one-way in 1994 were wines (0.11), soft
drinks (0.05), pasta (0.02), cheese (0.01), and snack foods (0.0) (HENDERSON et al. 1996a, pp.50-51).
Table 10: US intra-industry trade with others, 1994 (Grubel-Lloyd Index)
Industry NAFTA European Union Asian Tigers South America
Other food preparations .63 .83 .40 .58
Fresh meat .89 .77 0 .12 Breakfast cereals .89 .75 .15 .15 Canned fruits and vegetables .56 .71 .43 .16 Frozen specialities .04 .67 .78 0 Prepared fish and seafood .38 .60 .35 .01 Frozen bakery products .96 .59 .85 .04 Confectionery products .91 .51 .85 .30 Canned fish and seafood .76 .44 .98 .05 Peanut, olive, other oils .49 .31 .57 .71 Distilled liquors .12 .31 .05 .09 Canned specialities .69 .28 .30 .26 Beer .25 .19 .20 .14 Ice-cream 0 .18 .01 0 Bread and bakery products .91 .16 .64 .33 Roasted coffee .83 .15 .05 .02 Cookies and crackers .96 .14 .50 .95 Chocolate products .99 .13 1 .16 Frozen fruits and vegetables .56 .13 .02 .03 Wines .36 .11 .34 .12 Soft drinks .98 .05 .22 .52 Pasta .86 .02 .10 .19 Cheese .38 .01 0 .56 Snack foods .61 0 .07 0
Mean .63 .34 .37 .23
Source: Adapted from: HENDERSON D.R., HANDY C.R. & NEFF S.A. (eds.) (1996), Globalization of the Processed Foods Market, US Department of Agriculture, ERS, Agricultural Economic Report #742, pp.50-51.

26 2 ANALYSING INTERNATIONAL FOOD PRODUCT MARKETS AT THE AGGREGATE LEVEL
In conclusion, it becomes clear that trade in the same products at the same time can be both
intra-industry and inter-industry, depending on the countries or trade blocs between which the products are
exchanged. For example, pasta is traded almost exclusively one-way between the US and the EU, whereas
almost completely in a two-way direction within the NAFTA. The same is true for frozen specialities, which
were traded intra-industrially between the US and the EU and the US and the Asian Tiger states, however
mostly inter-industry within the NAFTA and between the US and South America. Therefore, one should not
conclude that processed food markets are globally connected, as high transport costs act as a significant
barrier to very long-distance trade in many products, "which is the reason why most processed food trade is
of an intra-regional nature (EU, NAFTA, East Asia)" (TRAILL 1997, p.396).
2.2.1.4 Prospects
Forecasts for the future significance of trade in processed and high-value foods are difficult. However, as
long as the world population continues to grow, the aggregated global demand for food will also rise. A
simultaneous increase in real incomes of the world population will support the shift to an increased demand
for higher processed and value-added foods (OECD 1999, p.12).
A global perspective on food markets and trade in 2005 by ANDERSON et al. (1997) includes
also processed food. The projections of the researchers are based on a modified version of the Global Trade
Analysis Project (GTAP) database9. Table 11 provides the main results, which show that world prices for
processed foods are expected to decline by -0.4% and trade volume to rise by 53% from 1992 to 2005 as
compared to a situation without the Uruguay Round agreements in 1995.
Table 11: World prices and trade volume by 2005 (% change)*
World Trade
Price Volume
Rice 2.1 147 Wheat 5.2 8 Coarse grains 2.3 32 Other Crops 2.5 13 Livestock products 4.1 25 Processed food -0.4 53
Note: * As compared to a base case 1992 to 2005 without Uruguay Round agreements
Source: ANDERSON K., DIMARANAN B., HERTEL T. & MARTIN W. (1997), 'Asia-Pacific food markets and trade in 2005: a global, economy-wide perspective', in The Australian Journal of Agricultural and Resource Economics, 41:1, pp.19-44.
Even if these figures are only relative to the scenario without the Uruguay Round agreements, they do
support expectations that the strong growth in processed food trade during the recent past is very likely to
continue into the near and medium-term future.
99 The GTAP model is an applied general equilibrium (CGE), multi-region model. For a detailed description of the GTAP
framework see HERTEL (1996).

2 ANALYSING INTERNATIONAL FOOD PRODUCT MARKETS AT THE AGGREGATE LEVEL 27
2.2.2 Foreign direct investment (FDI) in food industries
Total annual worldwide FDI expanded from US$165bn to almost US$350bn between 1973 and 1996, an
increase by almost a factor of 17 (UNCTAD 1997). This equals an annual growth rate of more than 12%,
starting from FDI stocks of US$165bn at the end of 1973 to US$3 205bn in 1996 (ibid.).
In the food industries, there is some evidence that foreign affiliate sales worldwide exceed
processed food exports by the factor of 5 to 1 (VIATTE 1997). However, the investment and trade pattern
can differ strongly from country to country, as VIATTE (1997) states:
Japan invests in food industries abroad but there has been virtually no penetration of Japan's market by foreign food companies. The US and the UK are active investors in other countries as well as hosting a significant amount of foreign investment. Canada and Germany are hosts to a significant number of foreign food companies but have not themselves invested much abroad. France is active as an investor abroad but the presence of foreign food companies in France is not so significant.
For selected European countries data on trade and FDI in processed foods is provided in Table
12 which support the fact that the extent of FDI differs greatly between countries. In addition, the table
allows a comparison of the value of foreign affiliates sales and trade in food products in these countries.
From 1988-91 the UK was the leading country with respect to foreign affiliate activity (US$43.8bn as
compared to US$9.4bn of processed food exports), followed by the US (US$40.4bn versus US$19.1bn), and
France (US$30.6bn versus US$19.8bn) (TRAILL & DA SILVA 1994). In Germany, food companies preferred
exports (US$15.9bn) to foreign direct investments (US$2.9bn) and the same was true for Italy (ibid.). Also,
in these two countries imports were higher than sales by foreign affiliates.
Table 12: Trade and foreign production of processed foods, US$ billion, annual average 1988-91
Out-bound sales In-bound sales
Foreign affiliates Exports Foreign affiliates Imports
United Kingdom 43.8 9.4 22.4 11.6
United States 40.4 19.1 60.7 12.7
France 30.6 19.8 11.7 9.0
Netherlands 21.8 19.0 14.3 6.2
Italy 3.2 7.0 6.1 6.9
Germany 2.9 15.9 8.7 13.0
Source: TRAILL B. & DA SILVA (1994), 'Trade, Foreign Direct Investment and Competitiveness in the European Food Industries', in Structural Change in the European Food Industries, EU Agriculture and Agro-industrial Research Programme, Discussion Paper #1, September.
The total food industry FDI outward stock of the most important western economies more
than tripled between 1988 and 1997 (from US$38.8bn to US$134.2bn) (see Table 13). This increase was
even over-proportional, as the share of food industry's FDI outward stock in total FDI outward stock gained
from 3.8% in 1988 to 4.2% in 1997. The countries which expanded their outward FDI stock most were
France (from an 7.5% share in total food industry FDI outward stock in 1988 to 10.8% in 1997) and the
Netherlands (from zero in 1988 to 12.7% in 1997). The countries with the biggest relative losses were the
US (from 43.7% in 1988 to 31.8% in 1997) and the UK (from 39.4% to 32.7%). For Germany, Italy and
Japan their relative positions did not change much.

28 2 ANALYSING INTERNATIONAL FOOD PRODUCT MARKETS AT THE AGGREGATE LEVEL
Table 13: Food industry* FDI outward stock, and shares in total FDI stock, 1988 and 1997 (values in US$ million and shares in %)
Year UK US Nether-lands
Francea Japan Italy Germany Total Share in total FDI
1988 15 292 16 973 - 2 915 1 971 1 051 627 38 829 3.8
% of total 39.4 43.7 - 7.5 5.1 2.7 1.6 100.0
1997 43 837 42 660 17 104 14 450 10 213 3 685 2 249 134 198 4.2
% of total 32.7 31.8 12.7 10.8 7.6 2.7 1.7 100.0
Notes: * Including beverages and tobacco. a France's manufacture of food also includes some agriculture.
Source: Adapted from UNCTAD (1999), World Investment Report 1999 � Foreign Direct Investment and the Challenge of Development, United Nations, pp.426-429.
The world's food industry inward stock and inflows both grew strongly in absolute terms
between 1988 and 1997 (see Table 14). Relative to the total FDI inward stock and inflows, however, the
food industry's significance decreased, as global food industry's inward FDI grew slower than the total
aggregate. In particular, in developing countries the food industry's FDI inward stock grew only under-
proportionally, thus, in 1997, representing only 1.7% of developing economies' total FDI stock, as compared
to 4.7% in 1988. In developed countries, however, the food industry's share even increased, from 3.4% of
total developed countries' FDI in 1988 to 3.6% in 1997. In 1997 the food industry's FDI inflows were
relatively weak, as they represented in all areas a smaller percentage of the areas' total FDI inflows than in
1988. Overall, it becomes clear that most of the food industry's FDI comes from developed countries and
also goes into these countries. And, whereas the seven most important food industry investor countries
were able to strengthen their position between 1988 and 1997, the global growth of food industry FDI has
been slower than the total aggregate's one. This means � although worldwide FDI in the food industry has
absolutely been growing � it has at the same time been a below average growth, with an increasing
concentration on a handful of investing nations.
Table 14: Food industry* FDI inward stock and inflows, and shares in total FDI, for selected regions 1988 and 1997 (values in US$ million and shares in %)
Developed countriesa Developing economies Worldb Year
Stock Inflows Stock Inflows Stock Inflows
1988 24 654 3.4 5 502 5.9 5 255 4.7 974 3.7 29 909 3.6 6 476 5.4
1997 65 747 3.6 4 495 2.3 16 455 1.7 5 420 3.3 82 202 2.9 9 915 2.8
Notes: * Including beverages and tobacco. a Based on FDI inflows to France, Germany, Iceland, Netherlands, Sweden, UK, and the US that accounted for 71% of total inflows to developed countries in 1988, and on inward stock in Australia, Austria, Canada, Germany, Iceland, Italy, Norway, Switzerland, UK and US that accounted for 76% of total inward stock. For 1997 including also FDI inflows from Belgium/Luxembourg, Canada, Denmark, Italy, Norway and Switzer- land that accounted for 83% of total inflows to developed countries, and inward stock also from Finland and Denmark that accounted for 81% of total inward stock. b Not including Central and Eastern Europe.
Source: Adapted from UNCTAD (1999), World Investment Report 1999 � Foreign Direct Investment and the Challenge of Development, United Nations, pp.418-425.

2 ANALYSING INTERNATIONAL FOOD PRODUCT MARKETS AT THE AGGREGATE LEVEL 29
The world's top transnational food corporations in 1998 are listed in Table 15. As it becomes
clear, the world's largest food companies are also the most internationalised, and their headquarters are all
located in western economies. The message resulting from the table may also support the argument that
most of the global food brands are owned by a handful of very large corporations, which operate truly
internationally.
Table 15: The world’s top transnational food and drink corporations, ranked by foreign assets, 1998 (US$ billion and number of employees)
Assets Sales Employment Corporation Country Industry
Foreign Total Foreign Total Foreign Total
Index (%)*
Nestlé SA Switzer-land
Food / beverages 35.6 41.1 51.2 52.0 225 665 231 881 94.2
Unilever Nether-lands/UK
Food / beverages 32.9 35.8 39.4 44.9 240 845 265 103 90.1
Diageo Plc UK Beverages 27.9 46.3 10.5 12.4 65 393 77 029 76.7
Seagram Company
Canada Beverages / media 18.8 22.2 9.1 8.7 - 24 200 94.8
Coca-Cola Company
US Beverages 14.9 19.2 11.9 18.8 - 29 000 70.6
McDonald's US Eating places 12.0 19.8 7.5 12.4 - 284 000 60.7
RJR Nabisco Holdings
US Food / tobacco - 28.9 5.6 17.0 - 74 000 36.9
British American Tobacco Plc
UK Food / tobacco 10.5 12.4 13.8 15.3 99 204 101 081 91.0
Danone Groupe SA
France Food / beverages 10.3 17.6 8.8 14.4 58 602 78 945 64.6
Compart Spa Italy Food 10.2 21.6 10.5 15.0 24 097 33 076 63.4
Note: *The index of transnationality is calculated as the average of three ratios: foreign assets to total assets; foreign sales to total sales and foreign employment to total employment.
Source: Adapted from UNCTAD (2000), World Investment Report 2000 � Cross-border Mergers and Acquisitions and Development, United Nations, pp.72-74.
In summary, it becomes clear that overall FDI by food producing companies is much more
significant than global trade in food products, but this is not equally true for all countries. The importance of
foreign direct investments is therefore limited to only a few, mainly Anglo-American, countries. However, in
recent years, their position has suffered, and in particular France and the Netherlands have emerged as new
and increasingly important foreign food industry investors. Moreover, recent data suggest that FDI in the
food industry, although in absolute terms strongly growing, has relatively grown slower than the total FDI
average. Also, only a few western countries are the main food industry investors, and these countries were
able to increase their significance even more during 1988 to 1997. And, most of the food industry's
investments go to developed countries, thus causing developing countries � similar to the international
trade situation � to lag more and more behind.

30 2 ANALYSING INTERNATIONAL FOOD PRODUCT MARKETS AT THE AGGREGATE LEVEL
2.2.3 Summary
World trade in consumer-oriented foods (processed and high-value products) has grown significantly
during the last decades. In addition, trade in these products now represent the largest part of the value of
global agricultural shipments, thus making that trade in bulk agricultural commodities can no longer be
taken as a valid indicator for the world's total agricultural trade.
The European Union is the most significant supplier of these food products, with France, the
Netherlands, Germany, the UK, and Italy all being within the eight leading exporters of consumer-oriented
food in 1996. If some basic agricultural commodities and tobacco products are also included, the US was
the largest food exporter in that year. However, in using a more suitable aggregation, which includes
processed foods, beverages and fats only, France and the Netherlands end up far ahead of the US. In net
exports and per capita terms, the Netherlands seems the most competitive consumer-oriented food
exporting nation, followed by France and Australia.
The export structure of leading food product trading nations reveals that diversity, i.e. non-
specialisation in only one or two food categories, seems important for gaining a leadership position. A
ranking of leading countries by per capita exports of processed food, beverages and fats suggests a positive
relationship between per capita exports and the extent of diversity in the exported food categories. In fact,
for the most successful export countries none of the shares of individual food categories exceeded 29%
(France) and 26% (Netherlands) in total food and beverages exports in 1996. Thus, the world's leading food
product export nations do not specialise in a few food categories but they offer a wide array of different
product categories.
The most important consumer-oriented food products that were exported worldwide in 1994-
95 were meat, followed by alcoholic beverages and fruit and vegetables. Fish and fish preparations were the
products in which developing countries hold the highest shares in world exports. The products with the
highest annual growth rates, apart from shell fish fresh, frozen, are all highly processed, such as food and
cereal preparations, non-alcoholic beverages and chocolate and sugar products.
In OECD countries, which represent the developed world and therefore the largest part of the
world economy, growth in processed food trade has been much higher than exports and imports of basic
agricultural commodities during the period from 1980-82 to 1990-92. Processed fruit and vegetable
products and oils and fats were the main imported processed food items; dairy products and prepared cereal
products the main processed export goods. The highest annual growth rates in processed foods imports
were achieved by food preparations and cereal preparations, and at the export side in cereal preparations
and coffee, cocoa and chocolate products.
Intra-industry trade, i.e. the simultaneous exchange of similar goods between two countries,
made up almost half of the trade of the European Union in food and beverages in the early 1990s. Belgium,
Germany, the Netherlands, and France traded even more than 50% of their foods in the intra-industry type
of trade. Between the US and the EU, intra-industry trade was especially important in food preparations,
fresh meat, breakfast cereals and canned fruit and vegetables, whereas for wines, soft drinks, pasta, cheese

2 ANALYSING INTERNATIONAL FOOD PRODUCT MARKETS AT THE AGGREGATE LEVEL 31
and snack foods trade was mainly of the inter-industry type. However, these trade patterns depend on the
countries or trade blocs between which products are exchanged rather than on the products themselves.
This can be explained with reference to the existence of high transport costs which may act as a significant
barrier to very long-distance trade in many products and thus resulting in the fact that most processed food
trade is of an intra-regional nature (EU, NAFTA, East Asia).
Prospects for future trade in consumer-oriented, processed and high-value foods are positive.
World food demand is expected to rise with a further growing world population and the likely increase in real
incomes for most of the world population supports the shift to more processed and value-added foods.
Comprehensive quantitative studies support this view in predicting strong growth in trade in processed
foods.
Foreign direct investments in food industries have expanded strongly during the past and, as a
result, today's foreign affiliate sales worldwide exceed processed food exports by about a factor of 5.
However, not in all countries is FDI equally important: it is mainly found in a few, mainly Anglo-American,
countries. Nevertheless, in recent years, France and the Netherlands in particular have emerged as new and
increasingly important foreign food industry investors. Moreover, recent data suggest that FDI in the food
industry, although in absolute terms strongly growing, has relatively grown slower than the total FDI
average. Also, globally, only a few � western � countries are the main food industry investors, and these
countries were able to increase their significance even more during 1988 to 1997. And, most of the food
industry's investments go to developed countries, thus leaving developing countries � similar to the
international trade situation � more and more behind.
32 2 ANALYSING INTERNATIONAL FOOD PRODUCT MARKETS AT THE AGGREGATE LEVEL
2.3 Justifying and explaining international activities of food product industries
The explanation and justification of international trade is a major topic in economics, and this has
been the case from the early beginnings of this academic discipline. However, theories to explain
international trade have also been developed outside the traditional school of international economists. The
most prominent and successful attempt has probably been PORTER's (1990/98) concept of National
Competitive Advantage. A fundamental problem with traditional trade theory is that, until recently, no focus
has been given to product specific considerations which can crucially influence causes for international trade.
Only KRUGMAN (1994, p.1) stressed this shortcoming in claiming that "conventional trade theory views
world trade as taking place entirely in goods like wheat; new trade theory sees it as being largely in goods
like aircraft". One may put forward that modern food products do not belong to either of these two
categories. They are somehow in between. This may explain why sector specific agricultural economists
and agribusiness specialists have argued that one single theory could not capture the whole complexity of
international food trade anyway (ABBOTT & BREDAHL 1994; SHELDON & ABBOTT 1996; KENNEDY et al.
1997; PADBERG 1997). In fact, a coherent and vertical theoretical framework that would be able to
incorporate the various aspects and product specific considerations of food product trade, starting from a
food trade policy point of view, via the analysis of food industry competitiveness, down to the international
marketing mechanics of modern consumer food products, has not been constructed so far. Therefore,
existing theories can only be reviewed and relevant parts from them be adapted to the special conditions of
the international trade in food products.
The following section therefore presents these existing theories, but also describes a new
approach in exploring theoretically, and empirically for the case of Germany, the role of foreign demand and
the contribution of international migration and tourism to international trade in food products. Furthermore,
economic theories to explain foreign direct investment (FDI) in the food industries will also be discussed.
Finally, all findings and conclusions will be represented in a concentrated form in the chapter summary.
2.3.1 International trade in food products - Why it is beneficial
The exchange of goods has always been a natural part of human activities and many people acknowledge
the mutual advantages resulting from it, but international trade has usually been treated differently and with
more caution. Today many people seem to take the gained utility resulting from the international
availability of appreciated products such as tropical beverages (coffee, tea) and fruit (bananas) for granted
while, at the same time, wondering whether we really need for example beef or cheeses imported from
various origins, apples from the other end of the globe, chocolates from all over the world, or the whole
huge and confusing international variety of wines and beers. It seems therefore worthwhile to review the
main benefits deriving from international trade in general, and to specify them for the trade in food products
in particular.
Political reasons that justify international trade can be seen in its potential to promote political
stability and in particular to maintain and to generate peace among nations (WTO 1998, p.37). For
example, US president Truman argued in 1947 that "trade and peace are inextricably linked" (ibid.). There
is also a saying that claims that "two nations trading bushels are less likely to trade bullets" (KOHLS & UHL
1998, p.115). At least three reasons exist as to why trade and peace are closely inter-related, and why

2 ANALYSING INTERNATIONAL FOOD PRODUCT MARKETS AT THE AGGREGATE LEVEL 33
integration through trade promotes world peace (WTO 1998, p.37): (1) Trade reduces the likelihood of
conflict by establishing vested interests in the welfare and prosperity that were generated through trade.
(2) Trade brings information about other countries and cultures and builds relationships among people
across countries. (3) Trade helps to build peace-oriented structures, including international rules. In short,
mutual beneficial contact promotes co-operation, not conflict (ibid.). These reasons seem especially true for
food products, most of which can be considered as "culturally-bound goods" (CARTER 1997). To the extent
of which people learn about and start to appreciate foods from other countries, closer relationships between
cultures can be created.
Traditional economic welfare gains can be divided into two sources: (1) those deriving from
pure exchange and (2) those resulting from mutual specialisation (WTO 1998; MARKUSEN et al. 1995,
pp.61-75). Through the exchange of goods peoples gain because trade enables them to expand their
consumption possibilities, i.e. a country can choose a consumption pattern that is closer to the preferred one
and that may be different from the one determined by domestic production possibilities based on given
resources. In an autarky, only that can be consumed what the country is able to produce. Gains from
mutual specialisation arise because it allows to use available resources more efficiently. Specialisation in
production makes sense when differences in either production technology (Ricardo case) or factor
endowments (Heckscher-Ohlin case) exist. From these differences result comparative advantages in pro-
duction, i.e. the ability to produce cheaper (more efficiently) than others. Mutual specialisation in the manu-
facturing of goods that offer comparative production advantages thus increases total production efficiency.
For example, one might imagine the case of Germany producing beer and of Costa Rica growing
bananas.10 German consumers may not be happy with beer alone and Costa Rica's inhabitants may have
many more bananas than they can consume. When both countries start to exchange beer for bananas, total
utility is likely to increase because now both countries' consumers can consume food products that have not
been available before, and producers are able to expand their markets. Furthermore, it seems reasonable
from a cost and experience point of view that the two countries do not engage both in the production of beer
and bananas. This because it would be cheaper for both countries to specialise in the product that they are
able to produce more efficiently. In fact, even if transport costs for beer and bananas over such a long
distance were high, trading the food products will likely turn out being cheaper for each country than if
Germany tried to grow its own bananas and Costa Rica started to experiment with brewing technology.
However, this is only a very simple example.
In reality, the situation may be much more complex, e.g. local producers come to be
threatened by cheap imports and will end up as losers from international trade. The use of trade policy
instruments, such as tariffs, quotas, etc. complicates the situation even more and the total welfare effect is
then much more difficult to determine. However, empirical studies have confirmed that free trade leads to
an overall welfare optimum and that any diversion from it reduces total economic welfare11 (WTO 1998,
p.39). In fact, this should be obvious, as presumably countries would not trade which each other anyway if
10 This example is derived from the standard two-goods two-countries case of basic trade theory, based on the Heckscher-
Ohlin model which can be found in every international economics textbook (see e.g. MARKUSEN et al. 1995, p.61-75).
11 For example, HUFBAUER & ELLIOT (1994) have estimated the potential consumer gain if the US eliminated all tariffs and quantitative restrictions at about 1.3% of US GDP in 1990. For Japan, the potential consumer gain from liberalisation was estimated between 2 and 4% of GDP (SAZANAMI et al. 1995).

34 2 ANALYSING INTERNATIONAL FOOD PRODUCT MARKETS AT THE AGGREGATE LEVEL
there weren't any gains from it for both sides (MARKUSEN et al. 1995, p.218). Thus, alone the fact that
trade occurs may be seen as a proof for the mutual benefits resulting from it. This should actually be clear,
since aggregate trade flows are the sum of voluntary individual transactions, each of which is subject to
rational decisions from both parties of the deal. Every individual international business transaction will only
take place, if it offers mutual benefits for both bargaining parties. If any individual voluntary international
trade deal brings along benefits for the involved business partners, why then should the sum of all these
transactions not be positive?
Further economic welfare gains result in markets (countries) where imperfect competition is
present or where production technology allows the exploitation of economies of scale (WTO 1998):
(1) opening up monopolistic markets to trade will most likely provoke competition and lead to lower prices.
(2) economies of scale in production can be exploited when international trade leads to higher outputs as
additional foreign markets are served. As a result, more products become available for consumers and unit
production costs (and prices) fall as fixed costs are spread over a higher output (KRUGMAN & OBSTFELD
1997, pp.133-136). This is true under the condition that consumers in total actually consume more as
compared to the situation without trade. More likely, however, it may be the case that consumers have
fixed incomes and they do not increase their total consumption significantly. Then, the opening up of
markets will lead to an international concentration process among producers leading to a fewer total number
of producers as compared to the autarky situation however, the remaining are able to realise higher outputs
and, due to economies of scale, they produce with lower per unit costs and they will consequently sell
cheaper products. Thus, international trade can increase welfare by lowering overall production costs. (3) A
greater variety of goods available for consumers can lead to an increase in (consumer) welfare. On the one
hand, variety per se may increase utility as consumers gain by having a greater choice of products12 [love
for variety concept of DIXIT & STIGLITZ (1977) and KRUGMAN & HELPMAN (1985)]. On the other hand, a
greater variety of goods can increase the likelihood for an individual consumer to find her "ideal" product
specification which maximises her utility [ideal variety concept of LANCASTER (1979)]. For LANCASTER
(1991, p.9) optimal product variety in an economy is "determined as a balance between gains from greater
variety and losses from smaller scale production". However, some have argued that, in general, rising
variety itself is subject to diminishing utility returns (BRESNAHAN & GORDON 1997, p.12), and that more
variety may also lead to increased social costs13 (KOHLS & UHLS 1998, p.169). LANCASTER (1991) himself
abstracts in his assumptions on gains from product differentiation from "search and information costs, and
disutilities of uncertainty or consumer confusion in the face of variety" (p.155). Empirical research has
12 A simple model to demonstrate that a greater variety in available goods will result in higher consumer utility is provided
by MARKUSEN et al. (1995, p.191-192):
αXnU ⋅= , 0 < α < 1
where U stands for Utility, n is the number of varieties and X the amount consumed of each variety (while assuming that each variety is consumed to the same amount X, therefore a subscript i can be omitted). The range of the exponent α secures decreasing marginal utility. If the number of varieties in a country is doubled, without changing overall output (i.e. the amount of output of each variety is now only half), the new utility level will rise:
( ) UnXnXXnUnew =>⋅=
⋅= − ααα
α12
22
Thus, consumers gain from higher diversity.
13 KOHL & UHLS (1998, p.169) specify economic cost as a result of higher variety by arguing: "However, product differentiation can also complicate consumer choices by substituting non-price for price competition. Differentiation may also increase prices and company profits, provide the illusion of product differences where none exists, and generally insulates sellers from the discipline of price competition".

2 ANALYSING INTERNATIONAL FOOD PRODUCT MARKETS AT THE AGGREGATE LEVEL 35
shown that with rising incomes the demand for variety in general increases (THEIL & FINKE 1983). This has
also found to be true for food consumption (at least in the US), i.e. the more available income consumers
have the more diversified their diet will be (SHONKWILER et al. 1987). However, FAO (1996, Table 3 in
Appendix 2, and pp.29-30) data shows that this is not necessarily true for all developing countries. For
example, measured by the share of the major food groups in total dietary energy supply � which the FAO
uses as a measure of the extent of diversification in national diets � Uganda, Rwanda or the Central African
Republic show similar patterns as e.g. the much richer countries of Italy or Portugal. Variety in food
consumption is therefore not only a function of income, but it is also determined by the degree of
diversification of locally available foods. In absence of this variety, trade can compensate, and with
increasing incomes, transportation and other trading costs will become less prohibitive. In summary,
however, the discussion on welfare gains resulting from a greater variety of goods as a result of
international trade can be seen as an extension of the traditional economic welfare gains of greater
consumer choice resulting from the pure exchange of goods (see above).
As an example of further economic welfare gains from trade, one might imagine a closed German
market with only one producer of rolled oats, the traditional breakfast cereal. Then international trade is
allowed and British-made corn flakes enter the market at half the price of the rolled oats. As a result, and
given the substitutability of both products, the price for the rolled oats is likely to fall (assuming that it
contained a considerable monopoly rent component before). British consumers may also gain, as corn
flakes producers now can achieve higher output which under the assumption of economies of scale will lead
to a decrease in unit production costs and price (assuming that producers are actually willing to reduce
prices). But even if British corn flakes manufacturers decided to differentiate the price for their products
internationally and enter the German market with about the same high price level than that paid for rolled
oats, German consumers would gain, as they typically prefer to have corn flakes and rolled oats to not
having any choice at all.
In summary, three points need to be stressed: (1) In general consumers will benefit most from
international trade in food products. They gain through a greater variety of available food products and very
often through cheaper prices as compared to the autarky situation.14 (2) For producers welfare gains from
trade liberalisation are not certain. On the one hand foreign manufacturers can gain access to foreign
markets, but on the other hand there is also the risk that home producers may lose domestic customers to
foreign competitors. This may be especially true for food products markets in industrialised economies,
where income cannot be considered as a limiting factor for food demand anymore. Markets are saturated
because consumers are not hungry anymore and thus, with stagnating population growth, total demand for
calories does not increase further. This fact actually is just what Engel's law predicts and it can be seen as a
consequence of man's physiological disposition that calorie intake has, apart from a critical lower boundary,
also an upper one (TANGERMANN 1986, pp.65-66).15 As a consequence, for every foreign food product that
enters a domestic market, a local one may not be sold. Thus, inefficient producers are driven out of the
market as a result of increased competition due to international trade. However, this may be seen as
beneficial from a market hygiene point of view. (3) Society, finally, may gain when peoples move closer
14 It is abstracted here from the in a developed country rather unlikely case that food is exported to an extent that it
becomes scarce and as a result prices rise.
15 In fact, it has been empirically shown that with rising income (per capita GDP), income elasticities of food demand approach zero or become even negative (see TANGERMANN 1986, p.73).

36 2 ANALYSING INTERNATIONAL FOOD PRODUCT MARKETS AT THE AGGREGATE LEVEL
together as a result of international trade. With each foreign food product that domestic consumers start to
appreciate (take Italian pasta or French wine as an example), mutual understanding may grow and thus the
risk of conflict be reduced.
2.3.2 Explaining international trade in food products
This sub-section reviews the main existing theories which have been developed to explain international
trade. Traditionally, no focus has been given to product (i.e. industry-) specific determinants that may
influence the level and pattern of international trade. However, in the following, the existing theories will be
discussed in a food industry specific context, i.e. they will be supplemented with relevant and recent
empirical findings on international trade in food products. In particular, traditional trade theory, new trade
theory, and PORTER's (1990/98) theory of national competitive advantage will be discussed. As all these
existing theories seem not to be able to fully explain international trade in food products, the role of foreign
demand and the contribution of international migration and tourism to this kind of trade will be explored
theoretically. For the case of Germany, the theoretical findings will be tested empirically. In order to
understand the empirical results � based on time series econometrics and using error-correction models �
one sub-section will also deal with econometric theory. Aspects of trade protection such as tariffs, quotas,
non-tariff barriers and other political influences on trade (e.g. the behaviour of lobby groups), which can
distort international trade substantially in the real world, will no be treated in a general way in this study.
However, some of these aspects � relevant for the food industries � will be referred to in Chapter 2.4.
2.3.2.1 Traditional trade theory and comparative advantage
Traditional trade theory is mainly preoccupied with the production side determinants of international
trade (MARKUSEN et al. 1995, p.196). Moreover, traditional trade theory tries to explain how economies
actually should trade in order to render the global economy efficient,16 i.e. it has normative character
(ETHIER 1996, p.51). Thus, not surprisingly, economists have failed until now to confirm empirically the
traditional theoretical expectations (ibid., p.66). The most prominent case is the so-called "Leontrief
Paradox"17. This may underline the fact that real-world trade is far more complex than traditional trade
theory suggests. However, since it is the most developed theoretical framework which is in particular useful
for analysing the issues of trade policy and the welfare implications of international trade (see e.g.
VOUSDEN 1990), its fundamental ideas must be described here.
16 It examines under which production conditions trade reproduces the "integrated economy", i.e. a theoretical world in
which all factors of production are perfectly mobile (HELPMAN & KRUGMAN 1985, p.5), and where production and exchange are organised on a global scale and in a way that world production becomes most efficient.
17 The Leontrief Paradox resulted from surprising empirical findings on the factor contents composition of US exports and imports in 1947, in a study conducted by Wassily Leontrief. Contrary to theoretical expectations the capital-labour ratio of US imports exceeded that in US exports by some 23%, although the US in that time was unquestionably the most capital-abundant nation in the world and it was certainly labour-scarce relative to the rest of it (see MARKUSEN et al. 1995, p.220-225).

2 ANALYSING INTERNATIONAL FOOD PRODUCT MARKETS AT THE AGGREGATE LEVEL 37
Comparative advantages in production are seen as the cause of why goods are exported (or at
least why they should be exported). Traditional trade theory builds mostly on the Heckscher-Ohlin
framework18 which argues that comparative advantages of production arise because nations are differently
endowed with production factors such as human, physical and financial resources19, and the opportunity cost
of using these factors to produce (and to market) different goods (MARKUSEN et al. 1995, pp.98-126). The
Heckscher-Ohlin theorem then states that a country will export the commodity the production of which uses
the factor intensively with which the nation is relatively abundantly endowed (ibid., p.106).
Figure 6: Heckscher-Ohlin approach to explain the Netherlands' strength in exporting pork
Source: Author's draft. Terminology adapted from MARKUSEN J., MELVIN J., KAEMPFER W. & MASKUS K., International trade: theory and evidence, 1995.
For example, a small country such as the Netherlands, which in 1996 was an exporter of pork and
a net importer of animal feed (see Table 4), may be seen as comparatively poorly endowed with land.
However it is rich in population and thus available labour. Pork production may be seen as more labour
intensive20 than the production of feeds. In Figure 6 this situation is illustrated by the shape of the
production frontier (transformation curve) which is biased towards pork production, i.e. the more labour-
intensive good. World market prices are in favour of pork (indicated through the slope of the national
budget line p* = ppork / pfeeds), i.e. the price of pork is high relative to the price of feeds. The world price
ration p* determines the production levels of pork (PP) and feeds (PF) at point Q where the budget line is
tangent to the production frontier21. The countries' aggregate consumption preferences are given by the
18 Apart from the Heckscher-Ohlin approach, the Ricardo Model is based on differences in production technology as the
source of comparative advantages of nations. A third approach, the Specific-Factors Model, deals with the � in contrast to the Heckscher-Ohlin Model � more realistic assumption of partly immobile and industry specific factors (MARKUSEN et al. 1995). However, these two other models have by far not reached the same theoretical and empirical relevance than the Heckscher-Ohlin approach and thus they will not be discussed further in the following.
19 Special production factors for food processing or manufacturing are, dependent on the product which is to be produced, agricultural, horticultural, aquacultural or industrially produced inputs, as well as capital (specific machinery) and human labour to an higher or lesser extent.
20 Consider here pork production as pig breeding plus slaughtering and boning.
21 This point is the producer optimum where the world price ration p* equals MRT, the marginal rate of transformation, i.e. the ratio of the change in output of feeds to the change in output of pork.
CP CP' PP' PP pork
feeds
p*
U
CF
PF
p*'
U'
Q
C
Q'
C' CF'
PF'

38 2 ANALYSING INTERNATIONAL FOOD PRODUCT MARKETS AT THE AGGREGATE LEVEL
community indifference curve (U). Point C determines the chosen consumption level where U becomes a
tangent in p*.22 The Netherlands, due to their comparative advantage in production, and given the current
world price ratio, produce more pork (PP) than they consume (CP) with the excess being exported. On the
other hand, short of labour to produce the necessary amount of feeding stuffs, the difference between
consumption (FC) and production (FP) must be imported. Thus, production possibilities resulting from fixed
factor endowments should determine which goods are exported and imported, and world market prices
determine the amounts traded. When world market prices change, e.g. a decline in the price of pork
(indicated in Figure 6 by a shift of p* to p*'), the export pattern of a nation will change. With pork
becoming cheaper, the price of feeds rises relative to the pork price. As a consequence, pork production
becomes less and feed production more lucrative. Thus, the production pattern should change (Q->Q') with
new amounts of pork (PP') and feed (PF') being produced. The new price ratio will also affect consumption
levels, with the new amounts CP' and CF' being consumed. As a result, less pork should be exported by the
Netherlands (as given by the differences PP' - CP' and FP' - CF'), and less feeding stuffs imported.
In summary, for the international trade in food products traditional trade theory may be helpful
only to understand trade in non-differentiated raw products such as agricultural commodities. For this
purpose it has been used intensively during the past (SHELDON & ABBOTT 1996, p.2). In addition, the
theory may also be appropriate when applied to the existing inter-industry kind of trade in high-value foods
such as, typically unbranded, fresh fruit and vegetables, fresh meat and fish, or oils and fats.23
Furthermore, comparative cost advantage in production may be important for intermediate products which
are used as inputs for further processing/manufacturing in the food industries and where their price may be
the most important purchasing factor. For the trade of highly differentiated consumer food products,
however, "world market prices" may not be the major determinant, as non-price factors have become more
and more important (REED 1994; PIERSON & ALLAN 1994; KENNEDY et al. 1997). Here another approach
is needed to explain existing trade pattern. Furthermore, a fundamental problem with traditional trade
theory is that it cannot explain why trade among industrialised economies has grown so enormously during
the last decades, although these countries have become increasingly similar in their factor endowments24.
In addition, the trade pattern have changed and trade among industrialised nations is now increasingly of
the intra-industry kind of trade (BALASSA 1986). This is also true for the international trade in food
products, since in industrialised countries about 50% of these goods are now exchanged mutually between
the same industries (see Section 2.2.1.3). Therefore, there was need for a new trade theory, able to explain
these empirical facts.
22 Equal to Q, C represents the consumer optimum where p* equals MRS, the marginal rate of substitution, i.e. the ratio
of the marginal utilities of the two commodities.
23 In fact, the increasing trade in fresh fruits between developing & second world countries and industrialised economies (OECD 1996) may be explained in that the former countries have the production advantage of being able to harvest their crops and to market them into the northern hemisphere when countries there are just in the off-season of fruit production. That is, they may have a "comparative advantage in harvesting time".
24 See DOLLAR & WOLFF (1993) for an empirical illustration of this fact.

2 ANALYSING INTERNATIONAL FOOD PRODUCT MARKETS AT THE AGGREGATE LEVEL 39
2.3.2.2 New trade theory and intra-industry trade
New trade theory is able to explain intra-industrial trade, i.e. the simultaneous exchange of goods, which
are similar in terms of factor inputs and consumption, among countries or industries. Moreover, this
"strategic" trade theory deals also with situations of imperfect competition as determinants of international
trade, such a monopolistic competition25 market structure or several oligopoly situations, such as Cournot or
Bertrand equilibria26. In order to be able to deal with such situations the assumption of a constant returns-
to-scale production technology is relaxed.
A model of intra-industry trade within a monopolistic competition framework has been
developed by KRUGMAN (1994)27. He argues that production technologies with increasing returns-to-scale
� by which many modern industrial activities such as car or aircraft production or computer industries are
characterised � stimulates foreign trade, as entrance into foreign markets may lead to higher output levels
with existing fixed costs spread over more units. Furthermore, KRUGMAN showed that in modern economies
consumers gain utility through product variety which drives companies to engage in product differentiation.
Within a closed economy the number of available varieties is constrained by the available labour supply, i.e.
the size of the country. Concentrating the production on one or a few varieties would, under the assumption
of economies of scale, lower overall production costs, but this would also go hand in hand with increased
monopoly power for the producers of these few varieties. KRUGMAN showed that in such a situation an
equilibrium exists where product prices must equal average production costs of the products. If the price
were higher than average cost, then the resulting profits would attract new companies. Respectively, if the
price were lower than average production cost, then the occurring losses would drive companies out of the
market. In a larger economy the same number of manufacturers could produce larger outputs of the
individual varieties, thus making to consumers available the same number of varieties at cheaper prices, or
a higher number of varieties to an equal price level in comparison to a small economy. Intra-industry trade
then would make the global economy more efficient, as it allows large-scale production of industrial goods
which can be marketed internationally. Thus, by the means of intra-industry trade, and on a global scale,
the same number of product varieties could be produced more cheaply. Therefore, a complete model for
world trade must be able to explain both intra-industry and inter-industry trade since we know that in reality
both types of trade occur.
25 Monopolistic competition is a type of market structure which combines some elements of perfect competition (no
strategic interactions between companies, free market entry) with some elements of monopoly (a company's control of its product prices), hence the model's name. With the production and marketing of differentiated products, a company is able to set prices for its products above marginal unit production cost, however, only within a limited margin, because other producers of similar products exist in the market (see KRUGMAN & OBSTFELD 1997, p.127-130; and PINDYCK & RUBINFELD 1995, p.413-417).
26 Cournot and Bertrand models are special cases of a duopoly market structure with the difference being, that the former assumes that companies make output decisions taking into account an assumed output reaction by their competitors, whereas the later assumes that companies make price decisions based on an assumed price reaction by competitors (PINDYCK & RUBINFELD 1995, p.419ff.). Both models are able to explain intra-industry trade in homogenous goods.
27 KRUGMAN (1994) is a collection of the author's earlier papers. In fact, much of his intra-industry theory was already developed in the 1980s and in co-operation with other economists. A simpler specification of his model can also be found in KRUGMAN & OBSTFELD (1997, p.121-158).

40 2 ANALYSING INTERNATIONAL FOOD PRODUCT MARKETS AT THE AGGREGATE LEVEL
O
L
L* O*
B
B
K K*
Q
Q*
E
C PD
CD
CH PH
•E'
L
Figure 7: An integrated model of international trade
Source: Adapted from HELPMAN E. & KRUGMAN P., Market Structure and Foreign Trade: Increasing Returns, Imperfect Competition, and the International Economy, 1985, p.16.
An integrated model of world trade has been developed by HELPMAN & KRUGMAN (1985).
Imagine a 2x2x2 situation, i.e. a world with two countries, two goods, and two factors of production. Such
a situation is described in Figure 7. It is an Edgeworth-Bowley box diagram, i.e. a graphical representation
of resource allocation for two countries. There are two resources, capital K and labour L. E describes the
distribution of the two resources for the two countries, home and foreign, i.e. home uses OL (OK) of the
total labour (capital) supply and foreign O*L* (O*K*). The diagonal OO* represents aggregate
employment, and with appropriate units of measurement, it can be interpreted as world gross domestic
product (GDP) (HIRSCHBERG et al. 1994, p.160). Furthermore, OO* can be seen as a reference point for
the countries' resource allocation. Since E is above OO*, the home country is relatively capital rich.
Drawing through E a negatively sloped line BB whose slope is wL/wK, where wl is the reward to factor l,
l = L, K (or factor prices), and C is the intersection point of this line with the diagonal. Point C divides the
diagonal into two segments that are proportional to the countries' GDP levels. Thus, following HELPMAN &
KRUGMAN (1985, p.17), by constructing parallelograms between O and E, and O and C, it is possible to
obtain a representation of the home country's production and consumption levels.
There are two industries, one producing a homogenous good under constant returns to scale, and the other
producing n differentiated goods under an increasing returns technology, e.g. the food processing industry.
OQ (=O*Q*) gives the vector of resources, i.e. the proportions of available labour and capital used in the
differentiated goods sector. As the sector uses relatively more capital, it is assumed to be capital intensive.
OQ* is the vector of resources that are used in the homogenous good sector, which is labour intensive in
production. PD and CD give the production and consumption levels of the differentiated product in the home
country. Similarly, PH and CH give the production and consumption levels of the homogenous good. The
home country imports the homogenous good and is a net exporter (PD - CD) of the differentiated product,
while the foreign country is an exporter of the homogenous good and a net importer of the differentiated
product. The concept of net trade flows in the differentiated good's sector follows from the fact that the
home country produces and exports n varieties, and imports n* varieties from the foreign country, where
n > n* (see HELPMAN & KRUGMAN 1985, pp.18-19 for the precise specification of determining n). Thus, the
share of intra-industry trade in total trade can be systematically related to differences in relative factor
endowments.

2 ANALYSING INTERNATIONAL FOOD PRODUCT MARKETS AT THE AGGREGATE LEVEL 41
Three testable hypotheses can be derived from the above model (see HELPMAN & KRUGMAN
1985, pp.169-78 and HIRSCHBERG et al. 1994, p.161). (1) The level of intra-industry trade will be higher
(lower) the greater the equality (inequality) of relative factor endowments between countries. In Figure 7
the degree of equality is given by the distance of the endowment point E from the line of equal endowments,
the diagonal OO*. The more distant E is from this locus the more different are both countries in their factor
endowments. With E moving towards OQ* (i.e. the more capital intensive good, thus the capital-labour ratio
increasing), the home country specialises more and more in the production of the differentiated good and
produces less of the homogenous good. At the limit, with E lying on OQ, it will not produce the latter at all.
Thus, with increasing inequality in the factor endowments of the two countries, both countries will specialise
in the production of that good, which uses the factor of production more intensively, the country is
comparatively better endowed with. This is another way of saying that the resulting trade will be inter-
industry in nature. The opposite is true for the case where E moves closer to C on the OO* line. At the
limit, with E equals C, both countries will produce and exchange differentiated goods, i.e. all trade is intra-
industry. As a country's income is a function of its capital-labour ratio in this model, the hypothesis can be
restated as: the levels of intra-industry trade will be higher (lower) the greater the equality (inequality) of
the countries' per capita GDP.28 (2) The degree of intra-industry trade will be higher (lower), the smaller
(higher) the relative size of the capital-rich country is, size being measured by GDP. To see this, imagine
that the home country's size, which is determined by the endowment point E, reduces to E' where the
country's GDP is smaller but the same capital-labour ratio is maintained. Now with a smaller home country,
the level of intra-industry trade increases, i.e. the gap between PD and CD decreases. If instead the
endowment point is on OO*, where each country has the same capital-labour ratio, relative size does not
matter and there is only intra-industry trade. (3) HELPMAN & KRUGMAN (1985) argue that, a priori, in more
capital-intensive industries, relatively more differentiated goods will be produced. Consequently, it is
expected that the degree of intra-industry trade for a specific country will be positively associated with
endowments of capital available per worker, again measured by a country's per capita income (GDP).
For the global food processing sector these hypotheses were tested empirically by
HIRSCHBERG et al. (1994). For the period of 1964-85 and a sample of 30 countries which imported 85-90%
of the world's processed food exports during this period, the researchers estimated the strength of the
effects of the inequality of two countries', j and k, per capita GDP [INEQGDCjk], the relative size of country
j's GDP as compared to country k [GDPSIZEjk], and the value of the importing country j's per capita GDP
[GDCj] on the bilateral intra-food industry trade, as measured by a weighted Grubel-Lloyd Index value
[IITjk]. Furthermore, HIRSCHBERG et al. included also variables for exchange rate volatility between the
trading partners j and k [DEXjk], the transport cost between the two countries as a function of distance
[DISTjk] at various powers, and dummy variables for the membership in a customs union [ECjk] or in a free
trade bloc [EFTAjk], for a common land border between country j and k [BORDERjk], for country-specific,
unobserved factors such as tariff and non-tariff barriers for importing country j [DRCj] and exporting country
k [DPCk] respectively, and for year-specific effects [DYR] which account for influences not measured by the
other variables. These variables were tested in a linear model using a weighted cross-section/time-series
fixed-effects Tobit procedure, since more than 20% of country pairs with zero IITjk were present in the data
(see ibid., p.163 for details) The model was specified as
28 HELPMAN & KRUGMAN (1985, p.171-2) showed that for any country j, GDPj = π (p, Lj, Kj), where π, p, Lj and Kj are
profits, prices, labour and capital, respectively. Rearranging yields, GDPj /Lj = π (p, Kj / Lj).

42 2 ANALYSING INTERNATIONAL FOOD PRODUCT MARKETS AT THE AGGREGATE LEVEL
.1985
1965
29
1
29
11098
37
26543210
jktt
ttk
kkj
jjjktjktjkt
jktjktjktjktjktjktjktjkt
DYRDPCDRCEFTAECBORDER
DISTDISTDISTDEXGDCGDFSIZEINEQGDCIIT
επλγβββ
βββββββα
++++++
+++++++=
∑∑∑===
+
In contrast to a regression model, the usual R2-statistics is not applicable for a Tobit procedure, but the
squared correlation between the predicted and the actual values (including zeros) was estimated as 0.64.
Furthermore, Tobit parameters do not have the interpretation as derivatives of the independent variable
with respect to the regressor. However, the sign of the derivative is the same as the sign of the estimated
coefficients, and the t-tests on the coefficients are equivalent to the comparable tests on the derivatives
(ibid., p.164). Table 16 lists the estimated parameters.
Table 16: Estimated Tobit parameters for determinants of global* intra-food industry trade
Variables Coefficient t-statistics
INTERCEPT -0.083 -8.793 INEQGDC -0.151 -17.041 GDPSIZE 0.010 0.083 GDC 0.301 3.198 DEX -0.012 -4.400 DIST -0.048 -6.926 DIST2 0.045 7.721 DIST3 -0.011 -8.143 BORDER 0.146 78.743 EC 0.073 34.456 EFTA 0.039 17.349
Note: *30 countries, importing 85-90% of global exports in processed foods during the period 1964-85.
Source: HIRSCHBERG J.G., SHELDON I.M. & DAYTON J.R., 'An analysis of bilateral intra-industry trade in the food processing industry', in Applied Economics, 26, 1994, pp.159-167.
The empirical results suggest that, in general, the theoretical hypotheses of HELPMAN &
KRUGMAN (1985) discussed above are proved to be true for global intra-industry trade occurring in the food
industries. All three estimated coefficients of the tested GDP variables which are supposed to have a strong
influence on bilateral intra-industry trade, display the correct sign but GDPSIZE not being statistically
significant. The significant negative coefficient for the INEQGDC variable indicates that the larger the
difference in per capita GDP of two countries, the lower the level of intra-industry trade. In addition, the
positive coefficient on GDC suggests that the importing country's per capita GDP has a positive influence on
the level of bilateral intra-industry trade. However, the relative size of GDP of the importing country in
relationship to that of the exporting one does not influence the level of bilateral intra-food industry trade
significantly. The estimated coefficients of all other included variables are statistically significant and display
the expected sign. The parameter on DEX indicates that exchange rate uncertainty negatively influences
intra-industry trade. A common border between two trading partners or their membership in the EC or the
EFTA effects the level of bilateral intra-industry trade positively, with the effect of a membership in the EC
appearing about twice as large as a membership in the EFTA. The combined effect of the distance variables
suggests that transport costs effect the level of intra-food industry trade negatively, but this effect (partly
imposed though the cubic estimation form) depends itself on the distance between the trading partners (see
ibid., pp.164-5 for details). The fixed effects for country-specific influences have been estimated as
particularly large and positive for the United Kingdom, the United States, Germany and the Netherlands,

2 ANALYSING INTERNATIONAL FOOD PRODUCT MARKETS AT THE AGGREGATE LEVEL 43
both, as importers and exporters. The authors of the study argue that for these countries their result
indicates the influence of other factors not included in the specification, but which are correlated with the
INEQGDC and GDC variables. Finally, the estimated year-specific fixed effects indicate that global intra-food
industry trade was indeed influenced by time-related international events such as the oil price shocks during
1973-78, for example. During this period a definite drop in the overall level of bilateral intra-industry trade
could be identified (see ibid., p.166 for details).
Detailed patterns of intra-industry trade in processed food for 49 individual food industries
based on the same data set as above were published by HIRSCHBERG & DAYTON (1996). In using an
equivalent model and the same variables, but instead of aggregating over all processed food industries, the
researchers this time estimated regression coefficients for individual industries. Their results reveal that
there are surprisingly great differences among these industries and that no clear pattern emerges which
would allow for meaningful conclusions concerning the similarity of various food categories. Although the
estimated parameters for EC, EFTA and BORDER are mostly significant and display the expected sign, there
are great discrepancies in the INEQGDC, GDPSIZE, GDC and DEX variables. In only 27 of the 49 food
industries are the estimated parameters for INEQGDC significantly negative and thus confirm a priori
theoretical expectations. For a number of industries the parameters have been estimated with a positive
sign, among them miscellaneous food products, macaroni, dehydrated vegetables and canned fish. The
authors claim that for these industries trade may be better described by the traditional trade model for
which countries have differing resource endowments (ibid., p.148). Similarly, for the GDC variable which
could be expected as positive, only 20 have been estimated as significantly different from zero and among
them nine were negative, such as e.g. bottled soft drinks, cheese, sugar and candy, and miscellaneous food
preparations. Exchange rate effects seem to be more consistent among the different industries, with only a
few parameters displaying a positive instead of the expected negative sign. However, only 19 out of the 49
parameters have been found to be significantly different from zero. In order to classify the individual
industries into groups with similar regression results, the researchers used a special cluster algorithm which
divided the 49 industries into 10 groups with homogenous industries. However, the resulting clusters are,
apart from their similarities in statistical qualities, rather incomprehensible from a product specific point of
view. For example, the industries which yield the best results in explaining intra-industry trade according to
the given model specification are canned vegetables, pickles, sauces and salad dressing, cake and pastry,
cocoa products, salted, roasted nuts and seeds, cottonseed oil mills, vegetable oil mills, malt beverages and
spices. Here the authors conclude that except for spices and salted, roasted nuts and seeds these industries
"do not exhibit any environmentally based advantages" (ibid., p.156), i.e. the processing of these foods are
purely industrial activities that could be done anywhere regardless of location. To sum up, HIRSCHBERG &
DAYTON claim that certain industries are more liable to engage in intra-industry trade and that in particular
ten industries among the 49 have different characteristics of their intra-industry trade which may not be
explained by the model specification used in their study. In general, the results illustrate that explaining
international trade is crucially dependent on an industry-specific model, i.e. the more disaggregated the
trade flows that are to be analysed the more industry-specific factors may need to be taken into
consideration.

44 2 ANALYSING INTERNATIONAL FOOD PRODUCT MARKETS AT THE AGGREGATE LEVEL
For the EU dairy industries another empirical study (PIERI et al. 1997) seems to confirm the
argument of the importance of industry-specific factors that are needed to explain intra-industry trade in
food products. PIERI et al. used country-specific and industry-specific factors to explain intra-industry trade
flows of dairy products between 11 European Union member countries in the period 1988-92. The
researchers argue that "country characteristics reflect demand conditions, whereas industry characteristics
mostly focus on the supply side" (p.416). As country-specific variables PIERI et al. included, (i) an
inequality index of two countries' per capita GDP as an indicator for "taste overlap" (p.416), (ii) the average
(mean) of two trading partner's per capita GDP values as a proxy for their average development stage,
(iii) the average (mean) GDP of two trading partners as a measure of their combined average market size,
(iv) the existence of a common border as a dummy variable for market proximity, and (v) a trade imbalance
indicator that controls for the bias in the Grubel-Lloyd Index which generally becomes smaller as the size of
the trade imbalance increases. As industry-specific factors the researchers considered variables for product
differentiation, market concentration, raw material availability, and economies of scales. Furthermore, two
variables for the countries' retailing concentration and the degree of inequality between two trading
partner's retailing structure were included, as PIERI et al. expected that intra-industry trade in dairy
products would be higher between countries with high and similar levels of retailing concentration (p.420).
As results the study finds that similar to HIRSCHBERG et al. (1994) the variable for the average combined
market size turned out to be insignificant (PIERI et al., p.421), whereas the inequality measure of two
countries' per capita GDP was always estimated as significantly different from zero and with the expected
negative sign. Second, the inclusion of the industry-specific factors improved the significance of the
estimated models considerably with all of the included variables being statistically significant and very often
showing the expected sign. Third, the incorporation of the retailing-specific variables also improved the
model significantly, with the variables being themselves highly significant, however with the concentration
parameter resulting almost always with an unexpected negative sign. To sum up, PIERI et al.'s study
confirms that intra-industry trade in the food industries is higher the more equal two trading partners are.
Furthermore it confirms that factors that cause intra-industry food product trade may be very different
depending on the industry. Thus, product specific conditions should always be considered in the analysis of
these trade flows.
One general problem with intra-industry trade exists, however. This problem is related to its
definition as a two-way trade of similar products and to its measurement. Depending on the definition of a
product category, intra-industry trade will be greater the more aggregated the analysed commodity group.
Taking food as an example, it is obvious that almost all countries produce food and most of them may also
export and imports foods, i.e. there will always be some degree of intra-industry trade. However, one
country may export only cereals and the other only meat. Thus, if trade in cereals is to be analysed, no
intra-industry trade will be found, although at the more aggregate food level it exists. Now let's assume
both countries export meat products, but one country is specialised in the production of sausages whereas
the other one may only produce corned beef. On the meat level there is intra-industry trade but on the
sausage level there is none. The same may be true for dairy products, with one country being specialised in
cheese making whereas another country may produce butter or milk powder. PIERI et al. (1997, p.412)

2 ANALYSING INTERNATIONAL FOOD PRODUCT MARKETS AT THE AGGREGATE LEVEL 45
thus argued that intra-industry trade very much seems to be a statistical phenomenon, i.e. the measured
level of intra-industry trade often tends to reduce as the level of data disaggregation increases. Moreover,
and especially in the food sector, one needs to be aware of inter-temporal intra-industry trade, since some
of the food production and trade is seasonal. For example, we know that many countries export fruit and
vegetables when they are in season and shortly after the harvest season, but the same countries may
equally import these commodities when they are off-season (OECD 1996; KANTOR & MALANOSKI 1997,
pp.14-15). Thus, when analysing yearly trade figures, time-lagged exports and imports of the product
category may appear as strong intra-industry trade, but in fact it is of a totally different nature as it can also
occur between countries which are completely different in their income levels and factor endowments. A
final problem is related to the Grubel-Lloyd Index itself. This measure is affected by the size of the overall
trade imbalance between two countries and there is some discussion about whether to use the unadjusted
or an adjusted version and about the way of how to adjust the index (see PIERI et al. 1997, p.416 and
p.421). Thus, although it is obvious that a great deal of today's trade between industrialised nations is a
two-way kind of trade in similar goods, it is much less easy to exactly determine the "real" extent of intra-
industry trade, or to explain its causes.
In summary, intra-industry trade, or the simultaneous exchange of similar goods between
countries, can theoretically and empirically be shown as occurring mostly between industrialised nations
which are similar in their income levels and their factor endowments. For aggregated global food industries
it was shown empirically that, in particular, similar per capita income levels and short transport distances
together with the integration into a free-trade area or a common free market promote intra-industry trade,
with the last factor confirming that international food product trade is mostly of intra-regional character, as
already stressed before. At the level of individual food industries, however, these factors are not enough to
explain the causes for intra-industry trade. Here it has been empirically demonstrated that industry-specific
and related factors are necessary to gain a better understanding of what determines intra-industry trade in
food products. For example, the level for EU intra-industry trade in dairy products is influenced by producer
and retailer concentration, economies of scales in production and the availability of raw milk. In general,
however, intra-industry trade may also be very much a statistical phenomena with the extent of this kind of
trade increasing the more aggregated the analysed trade flows are, and seasonal effects (harvesting times)
causing biases. Thus, even though the concept of intra-industry trade is a very useful one that expands the
understanding of international trade considerably, it must, especially in the food industries, also be viewed
with some caution.

46 2 ANALYSING INTERNATIONAL FOOD PRODUCT MARKETS AT THE AGGREGATE LEVEL
2.3.2.3 Industrial competitive advantages
The theory of competitive advantages was developed by PORTER (1990/98)29. Although, strictly
speaking his theory is not an economic one but rather belongs to the international business and strategic
management field, PORTER discusses the topic of national comparative advantage and sees his work as a
complement to international trade theory. Given this different approach, economists have criticised his
research on methodological grounds for the results not being based on testable hypotheses (VAN DUREN et
al. 1994, pp.46-47)30. However, PORTER's work has found much attention in the academic as in the
business world and has undoubtedly widened considerably the understanding of how the international
economy actually works. In particular in the agricultural sector, PORTER's ideas have found widespread
acceptance (see e.g. HARTMANN 1993, BREDAHL et al. 1994, KENNEDY et al. 1997, HENDERSON 1998,
DRESCHER & MAURER 1999). Therefore, PORTER's theory needs to be included in this study in order to
explain in a comprehensive way international trade in food products.
PORTER's main arguments are (1) that factors of production (such as labour, capital, natural
resources or know-how), which in the traditional trade theory are seen as the sources for comparative
advantage, are in today's internationally integrated economies increasingly mobile, i.e. in case of a lack of
(one of) them, they may be acquired from the world market. That is, he sees factor endowments not as
"God-given" and unchangeable but as manageable in the sense that factor endowments are only one input
variable among others, which are important in order to gain international competitiveness.31
(2) PORTER put forward that in international markets, individual companies compete rather than nations.
Thus, although a country may have a comparative advantage in the production of a certain commodity, we
know that � in reality � within the same industry of a country there are generally competitive companies
and non-competitive ones. That is, comparative advantage in production resulting from relative factor
endowments does not necessarily lead to competitive advantages for every company. There is a whole set
of conditions that must be fulfilled in order to gain success in international markets. PORTER specifies these
determinants, and their graphical visualisation is know as his "national diamond model" (see Figure 8).
29 PORTER's The Competitive Advantage of Nations (1998) is a new edition of the same book which was originally
published in 1990. The 1998 edition is, however, complemented with a new introduction and therefore in the following only the new edition will be referred to.
30 PORTER conducted an in-depth case study of relatively sophisticated, internationally operating industries and industry segments in 10 countries that accounted for over 50% of world trade in 1985. In classifying these industries into clusters according to their shares in their countries' exports and their shares in world cluster exports, PORTER aimed to identify "successful" and "unsuccessful" industries.
31 Competitiveness (or competitive advantages) according to PORTER results from the difference between the value a company is able to create for its buyers and the cost of creating that value. National competitiveness then occurs when a sufficient number of companies create the means for sustainable positional advantage, and generate enough profit to finance the private and public sector's role in achieving their responsibilities. There are, however, many different definitions of competitiveness depending on the level in which the economic agent(s), to whom the definition is applied to, operate(s) (company, industry or country level), the particular market in which the economic agent operates (commodity or differentiated products), and the purpose of the definition (i.e. for policy, sector productivity, or export performance analysis, etc.) (ABBOTT & BRENDAHL 1994, p.11).

2 ANALYSING INTERNATIONAL FOOD PRODUCT MARKETS AT THE AGGREGATE LEVEL 47
Figure 8: Determinants of national competitive advantages
Source: PORTER M., The Competitive Advantage of Nations - With a New Introduction, 1998, p.127.
Factor conditions are important, given the fact that without any inputs there cannot be much
output. However, as opposed to traditional trade theory, PORTER claims that "Factor Creation Mechanisms"
are even more important. Raw materials, labour and technical know-how can be acquired from world
markets, especially for modern industrial activities, as the economic catch-up process of e.g. the Asian
"Tiger States" has shown. Thus, more crucial than classical factor endowments are human capital, i.e.
education and training, managerial expertise, and character qualities. In fact, PORTER argues that "...
incentives, effort, perseverance, innovation, and especially competition are the source of economic progress
in any nation..." (p.736). Therefore, the development and application of knowledge and intellectual skills
are the real crucial input factors that matter in modern manufacturing industries. For the leading US food
producers, for example, HENDERSON (1998) showed that in 1995/96 expenditures on research and
development (R&D) and for advertising were positively correlated with a "competitiveness index" based on a
combination of earnings and international market share, and profitability. This finding underlines the
importance of human capital even in relatively "low-tech" (TRAILL 1997, p.401) industries such as food
processing/manufacturing.
Demand conditions, especially the existence of a strong and sophisticated home demand, are
important in particular in industries where economies of scale and learning curve effects exist. A strong
home demand promotes innovation and product differentiation, just as rapid growth rates and early market
saturation "pull" industry competitiveness. Strong preferences of Germans for different types of local beers,
of French people for cheese variety, or of Italians for a larger choice in pasta products may be seen as an
example, and today all three countries are important net exporters of these products.
Firm strategy, structure, and
rivalry
Demand conditions
Factor conditions
Related and supporting industries
Chance
Govern-ment

48 2 ANALYSING INTERNATIONAL FOOD PRODUCT MARKETS AT THE AGGREGATE LEVEL
Related and supporting industries may supply important inputs. Geographic concentration in a
cluster of supporting industries may lead to economies of scope, as short transport ways and the sharing of
R&D or communication facilities can reduce unit production costs at the cluster level. 'Silicon Valley' may be
an example for the high-tech industry. For the food industry one might think that a locally strong
agricultural sector is crucial, but there is some evidence that raw materials are increasingly sourced
internationally (e.g. Italian Parma ham is made partly from Dutch pigs or Parmesan cheese from Bavarian
milk.) However, especially for modern food products, the availability of specialised packaging companies
and transport logistics may be crucial, especially when delivering perishable goods to far-distant export
markets. Moreover, given the importance of advertising (food products are among the most intensively
advertised consumer products) the availability of specialised marketing agencies may also be important.
Finally, getting access to shelf space is probably the largest problem that at least small and medium-sized
food manufacturers face, indicating the importance of supporting retailing companies, especially in the
industrialised economies' highly concentrated food retailing markets.
Firm strategy, structure, and rivalry is reflected in the willingness and capability of actively
entering foreign markets, which may differ considerably between countries due to culture or inertia of
existing economic structures. Furthermore, PORTER (p.117) claims that "... firms in nations with leading
world positions often have a number of strong local rivals... . This is true not only in fragmented industries
but also in industries with substantial economies of scale". For the food processing industries several
econometric studies have consistently shown the statistically significant relationship between the intensity of
domestic competition and external market competitiveness, thus supporting the argument that the lower the
level of seller concentration in a food producer's home market, the greater the company's success in foreign
markets (see HENDERSON 1998, p.122 and the studies cited there). In sum, company strategy and market
structure together with the role of supporting and related industries illustrate the importance of industrial
organisation for gaining success in international markets.
Government and chance, although being equally important, differ from the other four
determinants. Theses two forces effect competitiveness indirectly in so far as they have an influence on the
other four factors. The government's role is to amplify the efficiency of the four main determinants with
appropriate policies, programs, and other social instruments in order to maintain or to improve in a
sustainable way the national competitive advantages. However, these instruments have to be chosen and
applied carefully. Especially in the agricultural sector in many parts of the world (e.g. the EU, USA, Japan,
etc.), the respective governments have tried with enormous financial efforts to influence the competitive-
ness of local food production. In particular farmers have received large amounts of subsidies, but as we
know today this has produced a more inefficient agricultural sector than a more competitive one (TYERS &
ANDERSON 1992). Therefore, government intervention also has the potential to influence national
competitiveness negatively (PORTER 1998, p.127). Chance, too can affect the performance of individual
companies, industrial sectors and whole national economies in both ways. Apart from natural disasters or
wars, regional or worldwide supply or demand shocks (e.g. the "oil crisis"), or political events beyond the
home governments control, can have devastating effects on the bottom line of economic activity. On the
other hand, for example the accidental discovery of a new recipe or a new food product can result in very
positive effects on the competitiveness of individual companies or whole industrial sectors. Take the inven-
tion of the champagne method and France's leading world position in this particular market as an example.

2 ANALYSING INTERNATIONAL FOOD PRODUCT MARKETS AT THE AGGREGATE LEVEL 49
Empirical studies based on PORTER's concept for the food processing sector have been
conducted e.g. by HARTMANN (1993) for German food manufacturers and DRESCHER & MAURER (1999) for
the European dairy industries. Both studies investigate the competitiveness on the industry level using an
index measure, the Revealed Comparative Advantage Export Indicator (XRCA) and the Revealed
Comparative Advantage Net Export Indicator (NXRCA), which are both based on (net) export shares of the
analysed country industry in total industry exports.32 Although it may be problematic to evaluate the
multidimensional concept of competitiveness only by export shares, both studies were able to rank different
countries' food or dairy industries and thus reveal relative differences in the countries' competitive positions.
For example, HARTMANN (1993, p.245) found that in 1990, using the NXRCA index, German aggregate food
manufacturing sector took only position 10 within the 13 countries analysed, with Denmark, Ireland and the
USA leading the field. Similarly, DRESCHER & MAURER (1999, p.174) found that for the period of 1983-93,
by using the same measure, Denmark had comparative competition advantages in dry milk, butter and
cheese production, whereas Ireland had even advantages in almost all the analysed dairy products (fresh
milk, whey, dry milk, evaporated milk, butter and cheese). On the other hand, Italy turned out to have only
a weak competitive position in all of these products, and so had Spain. Germany was found to possess a
strong competitive position in evaporated milk only and to be comparatively weak in the whey, butter and
cheese industries. However, these positions do not seem to be very stable as they change considerably
under different conditions and when different measures are applied. Therefore, the results of both studies
must been taken cautiously.
Criticism of PORTER's theory may be related to the whole concept of competitiveness. It is a
term under which different people understand different things, i.e. the term is not defined exactly or in a
widely accepted way. Especially, PORTER's approach to define competitiveness in relationship to export
performance seems not free of problems. There may be industries that are perfectly competitive in terms of
profits, market shares and employment levels in their home markets but simply do not engage in foreign
business activity. Furthermore, for some industries it may be easier to enter foreign markets than for
others. Food products may belong to the latter group, as these goods are often difficult to transport and as
they often may be culturally-bound products made for local preferences and consumption habits. Finally, it
seems that the whole theory applies best to the Anglo-American kind of doing business, i.e. within large
companies that are listed on stock markets and managed by highly trained professionals. We know
however, that at least in Europe (see TRAILL & GILPIN 1998 and Section 2.4.1), food manufacturers are
typically small or medium-sized. Very often they may be family owned and typically run by the owner
"hands on" in the production process and operating mostly in local markets. Therefore, PORTER's strategic
32 The Revealed Comparative Advantage Export Indicator (XRCA) is an index measure calculated on the basis of export
flows, with values in excess of 1 indicating a comparative advantage in the competitive position of a country's industry, and values below 1 indicating a comparative disadvantage. The XRCA puts the export share of an analysed country's industry in world exports in this product category in relation to the share of the country's total exports in world total
exports. Thus,
= ∑ ∑∑∑
jiij
iij
jijijij XXXXXRCA , with X being exports, and i and j referring to the individual
industry and country, respectively. The Revealed Comparative Advantage Net Export Indicator (NXRCA) expresses the net foreign trade position of a country, i.e. (X - M) with M being imports, corrected by the net foreign trade position of all industries together. ( )[ ] 100••+= Tjijijij NXNXNXNXRCA ,
with ( ) ( )ijijijijij MXMXNX +−= and ( ) ( )∑∑ +−=j
ijijj
ijijTj MXMXNX . This index, apart from very special cases,
takes values between -100 and 100 with the more positive the value the better the relative competitive position of the country for the analysed industry (BALASSA 1989, p.81-85).

50 2 ANALYSING INTERNATIONAL FOOD PRODUCT MARKETS AT THE AGGREGATE LEVEL
management theory for globally operating industries may only be partly applicable to the large numbers of
locally orientated and small-scale food businesses.
In summary, PORTER 's approach has clearly opened international trade theory in so far as he
sees the thoroughly human activity of trade as determined by human performance rather than by sheer
factor endowments or technical features of production, such as economies of scales. Moreover, in
suggesting that trade performance is a multidimensional concept with all determinants being important,
such as factor and demand conditions, company strategy and market structure, supporting industries, and
government and chance, it becomes clear that a comparative advantage in production will not necessarily
lead to a competitive industry. Also, PORTER's theory is also mainly focused on the production side.
However, in the international trade of food products the role of foreign demand may be more important.
2.3.2.4 The role of demand and the contribution of international migration & tourism to food product trade
Different approaches to explain trade in a general way exist, as seen before. Standard economic trade
theory focuses strongly on the production side of the general equilibrium structure of economies and argues
mainly that differences in technology or factor endowments are the causes for trade. On the other hand,
PORTER's (1990/98) argument that a national comparative advantage in production does not lead
necessarily to competitive advantages for all industries and companies involved, stresses the importance of
trade "infrastructure" such as industry and market structure, management know-how, politics, etc.
However, even "a free way" to foreign markets may not be a sufficient cause for the development of trade
flows. Countries may differ in their production possibilities, industries may be highly competitive and politics
may not limit trade deals, and yet there may be no substantial flows of goods unless there is specific
demand for home products in foreign countries. In the international trade of food products this aspect may
be especially true, given the fact that preferences play a significant role in food choice and that tastes are
often influenced by local culture and traditions. That is, it may be very difficult to market a food product to
a foreign country, where it is not known and where people may prefer their own local foods.
For example, highly competitive Dutch or Danish pork producers may face problems in selling
large amounts of their meat in Islamic countries. Milk may be produced in absolute low-cost conditions but
it still may not be able to be marketed to countries with high lactose-deficiency rates in the local population.
Foreign beer producers may find it very hard to export beer tins onto the German market where people care
for ingredients and production processes as regulated by the German purity law for beer ("Reinheitsgebot")
(GORDON 1998, p.93). Vegemite, the classic Australian household spread, may have huge selling success
in its own country, and its production and marketing may be highly efficient, but it is still not exportable to
overseas markets where people just not grow up with it.
The following section will try to expand existing knowledge in order to understand better how
demand conditions determine international trade flows, especially for foreign food products. In particular,
the role of migration and tourism as two important channels of learning about new food products and their
potential to alter existing preferences will be examined. Not very much "hard" research has been done on
this special topic so far, therefore both a theoretical and an empirical analysis for the case of Germany will
be provided.

2 ANALYSING INTERNATIONAL FOOD PRODUCT MARKETS AT THE AGGREGATE LEVEL 51
2.3.2.4.1 Theoretical foundations
The Linder Hypothesis by LINDER (1961) has probably been the most convincing argument put forward so
far that challenged standard trade theory with its strong focus on the production side of economies. Based
on the observation that a large volume of trade in manufactured goods exists between similar countries,
Linder highlighted the role of demand for this kind of trade. He concluded that countries with the most
similar demand pattern for manufactured goods will tend to be those with similar per capita incomes. In
poor countries people may tend to buy relatively simple products, whereas with rising income levels, people
may want more sophisticated devices, i.e. the same best products. Thus, trade between industrial countries
has increased significantly due to similarities in demand, rather than because of comparative advantages in
production resulting from differences in (relative) factor endowments.
More analytically, MARKUSEN et al. (1995, pp.196-202) have described two special cases where
trade can be explained by differences in tastes even within the traditional Heckscher-Ohlin framework. The
first case assumes different tastes in two otherwise identical economies. Preferences for different goods in
the two economies result in price differences for identical goods. After opening up to trade, product prices
are equalised to the world price level. The second case deals with non-homogenous preferences and can
help to explain how budget shares for food and other consumption goods vary widely across countries, given
different levels of per capita income. Both cases are reviewed in the following.
Different tastes (see ibid., pp.198-200) imply that the utility functions of two countries H and F
are different but both homogenous33. Otherwise the two countries are assumed to be identical, i.e. they
have the same production functions (TT'). Furthermore, it is assumed that endowments are identical and
that production takes place with constant return to scale and under perfect competition.
Figure 9: Trade based on differences in tastes within the Heckscher-Ohlin framework
Source: MARKUSEN J., MELVIN J., KAEMPFER W. & MASKUS K., International trade: theory and evidence, 1995, pp.198-99.
33 A function Y = f(X1,X2,...,Xn) is homogenous of degree r if and only if trY ≡ trf(X1,X2,...,Xn) ≡ f(tX1,tX2,...,tXn)
(TOUMANOFF & NOURZAD 1994, p.468) for any value of t > 0. That is, a homogenous function of degree r is one whose value increases by a positive constant t raised to the power r ≥ 0 when all independent variables are increased by this constant. For the given case this means that with rising income levels, but constant prices, the two countries will hold constant the ratio of goods consumed, i.e. r = 1.
T
Y
X T'
Uh
Uf
ph
pf
Ah
Af
O
Y
X T'
U'h
U'f
Cf
Ch
Bh
Bf
O
pw
Q
T

52 2 ANALYSING INTERNATIONAL FOOD PRODUCT MARKETS AT THE AGGREGATE LEVEL
The autarky equilibrium (left-hand model in Figure 9) is given where the highest indifference
curve for each country is tangent to the production possibility curve (in Ah and Af). Assuming that
preferences (tastes) in Country H are biased towards good Y relative to tastes in Country F, Uh and Uf then
represent community indifference curves for the utility functions of H and F respectively. Given the autarky
price lines ph and pf, good Y is thus relatively expensive in Country H, whereas commodity X is relatively
expensive in Country F. This simply because a stronger preference for good Y in Country H drives up its
price as compared to good X. The opposite is true in Country F.
When it comes to trade (right-hand model in Figure 9), residents in both countries will realise
that their preferred good is cheaper in the other country and consequently will buy the other country's
product. This then will be followed by a shift in production with Country H producing less of good Y and
Country F producing more of it. As a consequence, adjustments will continue until the new equilibrium point
Q is found. Changes in the production levels are accompanied by adjustments in the relative prices of the
two commodities and will continue until the common world price level pw is reached. Under the assumption
that the resulting trade is balanced (i.e. the triangles ChBhQ and QBfCf are identical), the new equilibrium
involves that each country imports the good towards which its taste is biased. Thus, Country H will end up
importing commodity Y and exporting good X, whereas the opposite would be true for Country F. As a
result, it can be stated that when differences in tastes are the predominant cause of trade, nations will tend
to import the goods which are most preferred in consumption.
This model stands in contrast to the Linder Hypothesis, however, which predicts as mentioned
before, the exact opposite, i.e. trade is generated not because tastes are different, but because they have
became increasingly similar. In fact, for food markets there is some evidence that international food
consumption has converged over time (HERMANN & RÖDER 1995; GIL et al. 1995), reflecting increasingly
similar tastes, while during the same period trade in food products has increased considerably. Given this
contradiction, the presented model does not seem to yield valuable insights for international food product
markets. Therefore, another standard case, where tastes are considered to be non-homogeneous but
nevertheless identical will be examined next.
The assumption of non-homogeneous but nevertheless identical tastes as a source for
international trade seems to be more valuable, especially for food markets, as such a taste structure implies
a minimum consumption requirement for one good even at a zero income level. However, non-homogenous
tastes (see MARKUSEN et al. 1995, pp.46-47) can only be aggregated into community indifference curves,
and thus be used for country-level economic analysis, when underlying income-consumption curves are
linear and do not go through the origin.34 In using these special assumptions, non-homogenous tastes can
actually be treated as "quasi-homogenous" what then allows one to illustrate how differences in per capita
income across countries can lead to different national budget shares for food and other goods. International
34 Aggregation of individual consumer's preferences into community indifference curves is only possible in cases where, at
constant prices, the overall ratio Y/X of the goods consumed is independent of changes in aggregated income. It can be shown (see MARKUSEN et al. 1995, p.46-47) that with a linear income-consumption curve (i.e. the relationship between the overall ratio Y/X of the goods consumed and aggregate consumer income) which does not go through the origin (i.e. one good is even consumed with zero income), a redistribution of income among consumers does not change the overall ratio Y/X. However, as in this special case the ratios Ya/Xa of the goods consumed by individual consumers do change after the redistribution of income, this type of preference is called "quasi-homogeneous".

2 ANALYSING INTERNATIONAL FOOD PRODUCT MARKETS AT THE AGGREGATE LEVEL 53
trade in such a situation is once again generated due to differences in the autarky prices of the same good in
two economies.
Figure 10: Trade based on non-homogeneous tastes within the Heckscher-Ohlin framework
Source: MARKUSEN J., MELVIN J., KAEMPFER W. & MASKUS K., International trade: theory and evidence, 1995, p.200.
Two countries H and F (see MARKUSEN et al. 1995, pp.200-201) are assumed to have identical
populations, but Country F has superior technologies for producing both goods X and Y. This situation is
illustrated in Figure 10 in that its production frontier (TfT'f) is a "radical blow-up" of the production possibility
curve (ThT'h) of Country H, which means that along any ray from the origin, the slopes of the two curves are
equal. Furthermore, it is assumed that all consumers in both countries have the same (non-homogeneous)
preferences and in particular that there is a minimum consumption requirement of Y in both countries. The
origin for a system of indifference curves is then point Cy. Country F has a higher per capita income than
Country H as a result of a larger national product due to the higher production frontier at the same
population level. The lower per capita income in Country H implies a relatively higher demand for good Y as
compared to Country F. The autarky equilibria will be at points Ah and Af. At these points there will be,
because of the similar production structures, a relatively high autarky price of Y (X) in Country H (F).
After opening up to trade the two different autarky prices will equalise to the free trade price
ratio p. Due to the assumptions, the production points Qh and Qf lie on the same ray from the origin and the
consumption points Ch and Cf lie on the same ray originating from Cy. As a result, low per capita income
Country H imports Y and the richer Country F imports X. Another important implication is that with quasi-
homogenous preferences, the proportion of income spent on Y (the good with the minimum consumption
requirement) falls and the proportion spent on X rises as per capita income increases. That is, good Y is
income-inelastic (elasticity less than unity) and demand for X is income-elastic (elasticity is greater than
unity). Thus, the poorer country tends to import the good with the low income elasticity which suggests that
(poor) developing countries in general can be expected to be food importing nations.
Disadvantages of these standard cases are that, although being interesting and providing
valuable insights in some special situations, they are not suitable for explaining why trade especially in dif-
ferentiated consumer food products has risen so strongly during the last decades, especially in industrialised
countries. In particular, trade in both models is inter-industry in nature, thus they are not appropriate for
the analysis of industrialised countries' food product trade. Furthermore, it is not clear how preferences are
Y
X T'f
Tf
Cf
Qf
Ch Af
O
p
p
T'h
Qh
Ah
Th
Cy

54 2 ANALYSING INTERNATIONAL FOOD PRODUCT MARKETS AT THE AGGREGATE LEVEL
actually formed. Just assuming that tastes are either totally different or totally similar, without giving any
condition on what this depends, shows a lack of knowledge of how tastes are actually created.
A different approach is therefore needed which is able to explain how preferences are influenced
apart from income and prices, as we know that food in industrialised nations has become widely income and
price inelastic. In the following, the relationship between factors that may influence preferences for foreign
food products and aggregated demand for these products will be examined. That is, the nature of the
correlation between preference building for foreign food products and increased rates of imports of these
products will be investigated.
Developing a preference for a product typically means using existing information about the
attributes of a product in order to compare these proprieties with an existing value structure. If these
attributes are, or at least if they are believed to be, similar with our ideas of how a product should be, we
will develop a positive attitude � i.e. a preference � for it (SCHAFFNER et al. 1998, p.66f.). Obtaining
information about a product is a crucial first step for the development of a taste. For foreign food products
information is typically transferred through migration, international travel and media (CARTER 1997, p.9;
GORDON 1998, p.93). The influence of media is the most difficult to measure and therefore will not be
further investigated in the following.
A first examination of trends in international migration and tourism shows strong growth in
both activities during the last decade(s). In almost all OECD countries the immigrant levels have risen
significantly during the period from 1986 to 99 (see left-hand side of Figure 11). In Germany, Austria,
Belgium, the United States, Canada, Switzerland, Australia, and Luxembourg the percentage of foreign
citizens in 1999 reached or surpassed 9% of total population, with Australia and Luxembourg each having
more than 20%. Growth in world tourism has even been more impressive (see right-hand side of Figure
11), with almost 700 million worldwide tourist trips in 2000 as compared to about 25 million in 1950.
Measured per head of world population, tourism activity has increased more than ten-fold during this period.
Figure 11: Immigrant shares in OECD countries 1986/99, and growth in world tourism activity from 1950 to 2000
Foreign citizens as % of total population*
0
10
20
30
40
Japa
n
Finl
and
Portu
gal
Spai
nIt
aly
Irel
and
UK
Norw
ay
Nethe
rland
s
Denm
ark
Swed
en
Fran
ce
Belgi
um
Germ
any
Austria
Unite
d St
ates
Cana
da
Switz
erla
nd
Austral
ia
Luxe
mbo
urg
1986 1999
World tourism growth†Trips per thousand of world population, 1950-2000
0
20
40
60
80
100
120
140
1950 1960 1970 1980 1990 2000
25 282
69 296
159 690
287 906
455 594
698 800
International tourist arrivals (000)
Sources: *OECD, Trends in International Migration, several editions, Paris. �World Travel Organisation, World Travel Statistics, various issues, Geneva; own calculations.

2 ANALYSING INTERNATIONAL FOOD PRODUCT MARKETS AT THE AGGREGATE LEVEL 55
The influence of migration on international trade flows in general and in particular for the
international trade in services has been shown as significant (RUSSELL & TEITELBAUM 1992). More
specifically, the connection between international migration and trade can be twofold: (1) labour migration
generates host-country demand for source country products, and (2) the specialised knowledge (business
connections, language and cultural skills) of immigrants can contribute to lower transaction costs for the
trade between the host and the source countries of the migrants and thus facilitate trade development
between these economies (ETHIER 1996, p.50).35
The role of immigrant links in facilitating trade between the United States and the home
countries of its immigrant population was investigated by GOULD (1994) empirically. In using a panel data
set of 47 U.S. trading partners for 1970 through 1986, the results reveal that (ibid., p.303)
Immigrant links to the home country have a strong positive impact on exports and imports, with the greatest effects on consumer manufactured exports. These effects tend to increase at a decreasing rate as the size of the immigrant community grows, and they also depend crucially on the type of goods traded.
For Australia, AISLABIE et al. (1994) explored the relationship between the growth in the country's
multicultural population and the direction, volume and composition of its trade in goods and services. The
study found that, at the aggregate level, there is no association between recent growth in major immigrant
population sources and the growth and direction of Australian exports, but there is significant rank
correlation for the sub-period 1986-87 to 1990-91. AISLABIE et al. conclude, although acknowledging the
use of inadequate data, that the argument that immigration stimulates exports with the immigrant source
countries may be true in specific cases, but not in general. More specific for the Australian food industry,
the contribution of East Asian immigrants on export success within East Asia has been tested by ROD &
WEBSTER (1995). The results of their intensive survey study of over 1700 Australian food manufacturers
and wholesalers show that language skills and cultural knowledge of the immigrant employees are
considered as "useful but not necessary" for successful exporting to East Asian countries (ibid., p.xiv).
The more direct connection between immigration and trade in that immigrants may prefer
consuming their source country products in their host country and thus stimulate imports of certain goods
has been much less researched so far. Empirical results confirming this argument are scarce, although
statements that illustrate the connection can be found frequently in the literature. For example, PINARD
(1995, p.122) states that "Parmesan (cheese) which accompanied the Italian immigration to several
industrial regions also spread to the South of France". For the case of Australia it was argued (see RIRDC
1994, pp.2-3):
All migrants bring with them their habits, customs and tastes, each of these have strong persistence. So it was with the Chinese diggers, who in this respect were no different than the British convicts and their gaolers. ... After 1850 the Chinese inhabitants of New South Wales and Queensland began to import processed food that was distinctively Asian. ... From very early times, the Chinese also imported their own alcoholic drinks, fiery liquors made from rice, sorghum and other grains.
35 This topic is in fact part of a much broader and general discussion among international economists on the
substitutability or complementarity of international trade in commodities and international movements of labour. The discussion however is mainly concerned with supply side effects, i.e. to what extent labour offered by immigrants in the host country replaces or promotes trade flows in general and in particular from the source countries. This topic will not be discussed further in the following, however for a recent and applied overview see LLOYD & WILLIAMS (eds., 1996).

56 2 ANALYSING INTERNATIONAL FOOD PRODUCT MARKETS AT THE AGGREGATE LEVEL
The reason for the lack of hard empirical evidence may be that the relationship between immigrants
preferences and imports from their home country cannot be expected to be a general one. On the contrary,
the proposed connection may probably only be relevant for certain goods and selected ethnic groups.
The following assumptions have to be made, therefore: (1) Consumer goods and in particular
culturally-bound goods such as certain food products may be expected to much more likely follow migrant
flows, as e.g. raw commodities such as steel, wheat or beef, or as intermediate goods such as machinery,
tools or electronic products. (2) Goods may only be expected to follow migrant flows if these people value
the goods highly enough to compensate for the efforts that are needed to establish trade connections. That
is, there must not be close substitutes for source country goods available in the host country. (3) An ethnic
group must be prone to engage in trading, i.e. the activity of trade in general must not be seen as
dishonourable within the ethnic group. Some nationalities seem to engage more in small-scale trade
businesses than other, for example, Arabic, Chinese or Italian may be more active in this kind of business
than Anglo-Saxons, French or Germans. (4) The imported source country goods must be allowed to be
imported into the host country, i.e. they must follow local safety rules and morality standards. Especially for
food products, this condition may not always be fulfilled and trade may be blocked despite sufficient
potential demand. Take raw milk cheese as an example, a product which is not allowed to be imported into
countries such as the US or Australia. But even given these assumptions the actual "mechanics" which
underlies the relationship between rising immigrant levels and increased imports of certain products is not
yet clear. Therefore an economic model is needed which allows for more precise analysis.
Demand (q) for a food product can generally be seen as a function of income (I), own price (p),
prices of close substitutes (pkS, with k=1 to n), and preferences (z) (YOUNG & BURTON 1997). That is,
q = f(I; p; pkS; z). [2.3.2.4-1]
In traditional consumer theory and demand analysis, preferences are usually not directly included in
theoretical and empirical investigations due to difficulties in the identification and specification of appropriate
indicator variable(s) (VON ALVENSLEBEN 1997, p.209). However, for the analysis of aggregate foreign food
product demand, immigration and tourism may be regarded as suitable indicators for prevailing preferences.
This will be made clear shortly.
Total demand for food products in a country can be disaggregated into demand for food
products of the home population (qHOME) and demand for food products of the immigrant population (qIMM).
Furthermore, demand of both population groups can be divided into demand for home produced food
products (qprod) and imported food products (qimp). That is, total demand for food products (qtotal) is equal to
IMMimp
IMMprod
HOMEimp
HOMEprodtotal qqqqq +++= . [2.3.2.4-2]
In the following, however, we are mostly interested in the imports of foreign food products, thus the
equation [2.3.2.4-2] can be reduced to
);;;();;;( IMMimpprod
IMMIMMimp
HOMEimpprod
HOMEHOMEimpimp zppIqzppIqq += [2.3.2.4-3]
which states that demand for imported food products depends on the income of the home and the immigrant
population, the price indices for locally produced food and imported food products (seen here as close
substitutes) and the (presumably different) tastes of the local and the immigrant population.

2 ANALYSING INTERNATIONAL FOOD PRODUCT MARKETS AT THE AGGREGATE LEVEL 57
The influence of income and prices on demand for food products in industrialised societies,
however, may have diminished over the last decades, or as VON ALVENSLEBEN (1997, p.209) put it:
With rising consumer income, the relative influence of prices and income on food demand is decreasing while the influence of preferences is increasing. For example, in their study of the causes of changing patterns of food product consumption in the UK, RITSON & HUTCHINS (1991) show that, during the 1960s and 1970s, most of the changes in patterns of food product consumption were caused by changes in prices and incomes but, since 1980, changes in tastes and preferences have dominated. Similar developments have been observed in other industrialised countries (VON ALVENSLEBEN 1989). In affluent societies, future changes in food demand will be more and more caused by preference changes rather than by price and income changes.
Therefore it may be justified to abstract from possible differences in incomes between the home and the
immigrant population and price differences between local and foreign manufactured food products. It is
then relatively straightforward to show that qimp = f(IMM), with f ' = ∂qimp/∂IMM > 0, i.e. that imports for
foreign food products are an increasing function of the share of immigrants (IMM) in an economy.
The overall share s of foreign food products in total food consumption can be defined as
total
imp
q
qs = . Let's assume that home people have a lower share
HOMEtotal
HOMEimpHOME
q
qs = of foreign food products
consumed than the foreign population IMMtotal
IMMimpIMM
q
qs = , that is sHOME < sIMM. Now s can be calculated as
IMMsHOMEss IMMHOME ⋅+⋅= , or as the share of home population (HOME) in total population equals
(1-IMM):
IMMssss HOMEIMMHOME ⋅−+= )( . [2.3.2.4-4]
Given sIMM > sHOME and assuming both shares are (positive) constants, it becomes clear that s rises with
higher immigrant shares in the home economy and so does qimp. However, it may also be possible that the
shares sIMM and sHOME are not constant, but depend themselves on other factors.
A positive relationship between the consumption habits of the home population and the level of
immigration, such as sHOME = f(IMM), with f ' = ∂sHOME/∂IMM > 0, may be possible. It can be assumed that
when an immigrant group brings with it its ethnic restaurants, retail outlets, stalls on local produce markets,
etc., it will not only supply to its own ethnic group but the home population may also start to consume some
of the new foods offered (KÖHLER 1994, p.335). Therefore, the consumption habits of the home population
may alter in the long run, provided that the "new" foods offer some advantages (in terms of taste, health
value perception, price, etc.) over the traditional, locally produced food products.
That is, this effect will enforce the positive relationship qimp = f(IMM), with f ' = ∂qimp/∂IMM > 0 between
immigrant levels and food product imports.36 On the other hand, it may also be possible that sIMM changes
over time (t), as it can be assumed that the immigrant population adopts at least some of the local
consumption habits, i.e. sIMM = f(t), with f ' = ∂sIMM/∂t < 0.
36 In fact, it may be quite possible, that also on the demand side the stimulating influence of immigration on trade flows
diminishes with rising immigration levels, i.e. f '' = ∂2qimp/∂IMM2 < 0, similar to the immigrant effect on export promotion as suggested by GOULD (op. cit.). This, because it seems likely that the change in the consumption habits of the home population will only be partial, and once the interested home population has sufficient access to the newly imported products, more immigrants will not bring further changes. However, more immigrants always result in increased aggregated food demand and given the assumption that they have a preference for their home country products,

58 2 ANALYSING INTERNATIONAL FOOD PRODUCT MARKETS AT THE AGGREGATE LEVEL
Figure 12: The two effects of immigration on food product imports
Source: Author's draft.
Figure 12 provides an approach to illustrate the effects of rising immigrant levels on food product
imports from the source country. Although resembling a Heckscher-Ohlin model, the above figure is
considerably different. C1C1' is not a production frontier but describes the consumption choice that a country
may face. Country H can choose between either producing all food products by itself (in which case it would
be in the autarky position at C1), to import all foods (in which case it would be at C1'), or it can choose any
position in between these extremes. Every point CH on the "consumption frontier" can be associated with a
different price ratio p of the price for food products produced at home pH and the price for imported foods
pF.37 For further analysis, however, it will be abstracted from price effects, because, as already mentioned
before, food products in today's affluent industrialised societies are likely to be price inelastic.
In a typical (industrialised) economy immigrant groups are in a minority situation (although their sizes are
rising) and preferences of the home population (although changing) may be biased against locally
manufactured food products. Thus, an initial equilibrium could be at Point 1 which is determined by the
"consumption possibility curve" C1C1' and the community indifference curve U1. Point 1 determines also the
initial overall share of imported food products in total food consumption, as given by the ratio
11
11
OFOH
OFs
+= .
imports will rise proportionally to immigrant numbers, i.e. f '' = ∂2qimp/∂IMM2 = 0. Thus, it will depend on the size of the two individual effects whether their combined (added) effect is actually decreasing or constant.
37 The shape of the "consumption frontier" suggests that prices for home food products as compared to imported food products become increasingly expensive as a country moves versus an autarky position (i.e. high rates of self-sufficiency). By the same token, total reliance on imports is assumed to result in high relative prices for imported foods, as there may always be at least some food products that a country could produce more cheaply at home.
Home food
products
Foreign food products
U1
C1'
C1
U3
H2
H3
F1 F3
C2
C2'
H1
F2
1
2
3
U2
O
CH
p = pH / pF

2 ANALYSING INTERNATIONAL FOOD PRODUCT MARKETS AT THE AGGREGATE LEVEL 59
With an increase of the immigrant population in Country H, total population in general grows
too and the share of the immigrant group rises. A growing total population implies that more food is needed
in the country which leads to a "radical blow-up" of C1C1', resulting in C2C2'. As the population growth is
mainly generated by the immigrant population, aggregated preferences may change as well which would
result in the new equilibrium point 2. As shown in the figure, the increased total demand for food is mainly
supplied through imports and only by little through locally produced products. Of course, this ratio depends
on the preferences of the newly arrived population. In total, the new share s2 of imported food products in
all consumed food products is given by 22
22
OFOH
OFs
+= which is larger than s1.
38
The second effect of rising immigrant levels may be the change in consumption habits of the
home population. As argued above, immigrant food products may be perceived by the home population (or
at least a part of it) as beneficial since these products may offer, apart from more variety in the daily diet, a
more tasty, healthy or cheaper alternative to locally produced foods. Given the assumptions outlined
before, the preferences in Country H may then change in favour for the foreign food products, which is
illustrated in Figure 12 by the new community indifference curve U3 and the shift from Point 2 to Point 3.
This new equilibrium is characterised by a much higher share s3 (as compared to s1) of imported food
imports in overall consumed food products due to the substitution of locally manufactured food by imported
products in the home population.
Rising international tourism activity may have a similar potential to alter existing preferences
in the home population. Tourists (TOU) who learn about exotic foods during their travel may develop a taste
for these products and later on � back in their home countries � may continue to consume the "new" foods
in ethnic restaurants or buy them in supermarkets or speciality shops (KÖHLER 1994, p.335). That is,
imports of foreign food products may also be a rising function of tourism, or qimp = f(TOU), with
f ' = ∂qimp/∂TOU > 0. Of course, this may only be true for a part of the tourists and only for some countries
and food products, however the effect might be strong enough in order to be measured at the aggregate
market level. The "mechanics" is in fact similar to the second effect of immigration in Figure 12. With rising
international tourism to certain countries, the community indifference curve may be altered in favour of
foreign food products, which results in a rise of imports of these goods.
38 To show this more formally, assume 12 OFaOF ⋅= and 12 OHbOH ⋅= , with a > b. Now 11
12
OFaOHb
OFas
⋅+⋅
⋅= or
11
1
1
1
11
2
+⋅=⋅
⋅+⋅=
OF
OHab
OFa
OFaOHbs
. Reparameterisation then yields 11
1
1
2
+⋅=OF
OHc
s, with c < 1 as a > b.
Similarly, 11
1
1
1
11
1
+=+
=OF
OH
OF
OFOHs
. From this it can easily been seen that 1
1s
is larger than 2
1s
, or 12 ss > .

60 2 ANALYSING INTERNATIONAL FOOD PRODUCT MARKETS AT THE AGGREGATE LEVEL
Recent empirical research has found conflicting evidence for the influence of tourism on
international trade flows. EASTON (1998) investigated the general relationship between the levels of
tourists travelling to Canada and aggregated exports to the source countries of the tourists. The study is
primarily interested in the question whether trade and tourism are substitutes or complements, i.e. whether
rising costs of Canadian exports affect tourism to Canada positively or negatively. In using a pooled time
series and cross-section sample of 18 countries during a period of 21 years (1972-92) the study finds some
(weak) evidence that a rise in the costs of Canadian goods promotes travel to Canada. Although
acknowledging the use of inappropriate data (aggregated total exports rather than exports of consumer
goods only) (p.529), EASTON thus sees his hypothesis confirmed that "... by purchasing and drinking French
wine in your own country, that consumption acts as substitute for visiting France" (p.523). However, it is
also acknowledged that a priori theoretical considerations allow for both, substitutability and
complementarity of tourism and trade. In contrast, REED (1994) uses the number of US tourists travelling
to foreign countries as a proxy for cultural similarity of a country to the USA. He argues that "American
tourists naturally flock to countries that are similar to the United States" (p.91). The study attempts to
determine the influence of economic (income and prices) and non-economic factors (cultural, political and
legal forces) on US agricultural exports by processing stage. In using a country cross-section data set from
1987-89 the author finds that the tourism variable (i.e. cultural similarity) was positive and significant for
highly processed food products but not for agricultural raw commodities and intermediate products. The
results suggest that highly processed food product exports are positively linked to tourism flows, i.e. there is
complementarity between them. Therefore, given the theoretical considerations and the empirical results, it
is assumed in the following that for the special case of international food product trade, rising levels of
tourists to foreign countries in fact do stimulate imports of these products.
In summary, the following theoretical hypotheses are postulated:
1) Immigrant levels are positively connected to imports of food products from the source countries of the
immigrants, i.e. qimp = f(IMM), with f ' = ∂qimp/∂IMM > 0. However, this relationship is likely to be true
only for some countries and certain food products. Immigrants must have a strong preference for their
source country food products and no close substitutes of their favourite products must exist in the host
countries. Furthermore, the establishment of trade relationships between the immigrant source and
host country in form of import/export business must be feasible (i.e. political or other restrictions on
trade must not be prohibitive), and an ethnic group should be prone to engage in international trade
activities.
2) Tourism activity to foreign countries is positively connected to the imports of food products from these
countries, i.e. qimp = f(TOU), with f ' = ∂qimp/∂TOU > 0. Again, this relationship is likely to be true only
for some countries and certain food products. The tourist host country must offer food products that are
perceived by the tourists as so advantageous (in terms of taste, potential health benefits, or price, etc.),
as compared to their home country's products, that (some of) the travellers will continue to consume
(some of) these products when they are back in their home countries.
These hypotheses need to be verified by empirical research. Furthermore, only statistical analysis might be
able to show for which countries and food products the proposed relationship proofs to be true. In the
following, econometric regression results are presented and discussed for the case of Germany.

2 ANALYSING INTERNATIONAL FOOD PRODUCT MARKETS AT THE AGGREGATE LEVEL 61
2.3.2.4.2 Empirical evidence for the case of Germany
This sub-section will begin with some econometric considerations which are necessary for the
understanding of the nature of statistical error-correction models. Then the origin and the quality of the
employed data will be discussed. Finally, regression results for the effects of immigration into Germany and
international travel of Germans on German food product imports for the period 1967-90 will be presented
and the findings will be discussed.
A) Econometric considerations
Measuring the effects of international migration and tourism at the aggregate level may in effect
be difficult. In theory, there are three approaches: (1) the use of country or product cross-section data at a
fixed point of time, (2) the use of time series data, and (3) the use of a pooled cross-section and time
series data set. As argued before, the promoting effects of migrants and tourists on international food
product trade may only be existent for certain countries and products and a priori it is not clear which they
are. Therefore, the use of cross-section data seems problematic, as the effects of international migration
and tourism may not be constant among countries or products. The same is true for a pooled data set, and
unless a statistical model is used that allows for differences in the effects on constants and parameters of
individual countries or products, the pooling procedure may not result in more efficient estimates than
separate equation regressions (DIELMAN 1989).39 For this reason, and because a first examination of
existing data with more simple statistical techniques may also yield valuable insights, separate time series
regressions will be used in the following.
Time series econometrics has its shortcomings, too. One of the most disturbing is that of
spurious correlation. This problem arises when time series used in regression analysis exhibit strong trends,
i.e. sustained upward or downward movements (GUJARATI 1995, p.709). The obtained goodness-of-fit
measure (R2), i.e. the percentage of the variance explained by the model, is in the presence of spurious
correlation very high, however not because of the true statistical relationship between the explanatory
variables and the dependent variable, but due to the underlying shared trends. Originally, 'classical'
statistical interference was specially designed for variables that are stationary in the sense that their mean,
variance and covariances remain constant over time. Clearly, if a variable is trending, then its mean, and
very possible its variance, will change over time (THOMAS 1993, p.151). Now, if variables are non-
stationary, the OLS (ordinary least square) estimators have sampling distributions with properties very
different from those needed for valid statistical interference, and regression coefficients tend to appear
spuriously significant. A popular past method of attempting to overcome the problem of spurious correlation
has been to estimate relationships between the rates of change of variables, i.e. ∆yt = yt - yt-1 and ∆xit = xit -
xit-1, rather than between their absolute levels (ibid., p.152). The effect of looking at the rate of change in a
variable is typically to remove any trend element. That is, many non-stationary economic time series
become stationary when they are first-differenced. Unfortunately, when attention is put on relationships
39 In general, a pooled estimation technique is useful only if some contemporaneous correlation can be expected, i.e.
disturbances that are measured at the same point of time are correlated between different cross-sections, (DIELMAN 1989, p.29). For the purpose of this study some contemporaneous correlation could be existent e.g. between different products imported from the same country. If there are shared factors that are not captured by the included explanatory variables (such as e.g. "cultural preposition" to engage in activities to make home products available in the host country), then pooled data regressions may indeed result in more efficient estimations than separate equation regressions.

62 2 ANALYSING INTERNATIONAL FOOD PRODUCT MARKETS AT THE AGGREGATE LEVEL
between rates of change, there is a real danger that valuable information in the long-run relationship
between the levels of the variables will be lost. First differencing then is an unsatisfactory method of dealing
with a spurious correlation problem. A major advantage of error-correction models is that they result in
equations with first-differenced and thus stationary dependent variables but do not fail to make use of any
long-run information in the data (ibid.).
Error-correction models (ECMs) allow for a separate measurement of short-run and long-run
effects of the explanatory time series variables xit on the dependent time series variable yt. A typical ECM
usually takes the following form (for the way this specification is derived algebraically see Appendix I):
t
m
itiit
m
itiit uxyxy +
−−−−∆=∆ ∑∑
=−−
= 1101
1)1( γγαβ [2.3.2.4.2-1]
with ∆yt = yt - yt-1 and ∆xit = xit - xit-1 for m explanatory variables and where γ0 = β0 / (1-α) with β0 being the
usual regression constant (THOMAS 1993, p.153). Equation [2.3.2.4.2-1] can be regarded as stating that
changes in y depend on changes in xit and on the term in square brackets which is the disequilibrium error
from the previous period.40 This makes sense since it implies that the lower (higher) is y compared with its
equilibrium value relative to xi, the greater (smaller) will be the immediate rise in y. The value of y is being
corrected for the previous disequilibrium error. Hence the term error-correction model (ibid.). α and thus
(1-α) determine the extent to which the disequilibrium in period t-1 is 'made up for' in period t. Since
0 < α < 1, only part of this disequilibrium is made up for in period t, causing a different ∆yt than would
otherwise occur (ibid.).
Advantages of ECM formulation (see THOMAS 1993, pp.154-157) are: (1) If model [2.3.2.4.2-
1] is specified in logarithmic form, then 11 loglog −− −=−=∆ ttttt YYyyy 1
1
1
log−
−
−
−≈=
t
tt
t
t
YYY
YY
. This approxi-
mation will hold provided growth rates are small so that Yt ≈ Yt-1. Hence ∆yt is the proportionate change in Y
and, similarly ∆xit is the proportionate change in Xi. That is, the parameters can be interpreted as
elasticities. (2) As argued before, standard regression techniques are invalid when applied to non-stationary
variables. Since many economic variables exhibit long-run trend movements, and only become stationary
after first-differencing, this suggests that regression techniques are applied not to the absolute levels of
variables but to their first differences. The ECM clearly involves the first-differenced variables ∆yt and ∆xit ,
and moreover, provided the model has been correctly specified, the disequilibrium error in square brackets
will also be stationary. Therefore, an ECM may be estimated by standard classical regression techniques,
provided the sample is large. Thus, since the dependent variable is ∆yt and not the typically trending yt, it
can safely be referred to measures as R2 without being concerned about the spurious correlation problem.
(3) Since the disequilibrium error term involves xit-1 and yt-1, an ECM formulation makes use of any long-run
information about the levels of variables that is contained in the data. Furthermore, the specification clearly
distinguishes between long-run and short-run effects. The parameters γ0 and γi (i = 1, ... , m), which appear
in the disequilibrium error term, are the long-run parameters. The coefficients of ∆xit, the βis, however, are
40 Given is the underlying long-run relationship yt = γ0 + γ1 x1t + γ2 x2t + ... + γm xmt. If y and the xi were at all times
in equilibrium then clearly 01
0 =−− ∑=
m
iitit xy γγ . However, there are many times when y will not be at its equilibrium
value relative to the xi and at such times the equation will be non-zero and will measure the 'extent of disequilibrium' between the xi and y (THOMAS 1993, p.153).

2 ANALYSING INTERNATIONAL FOOD PRODUCT MARKETS AT THE AGGREGATE LEVEL 63
short-run parameters measuring the immediate impact effect on y of a change in x. Similarly, α is a short-
run parameter. Most economic theories involve hypotheses or predictions about the long-run relationship
between values, but have little to say about the short-run dynamics. This clear separation of short-run and
long-run effects, thus make ECMs a very powerful analysis tool. (4) With typical time-series data and a
traditional (non-ECM) specification, the variables are likely to be highly correlated, regardless of whether yt
or xit are stationary or not. In estimating such a model the usual consequence of multicollinearity � large
standard errors � will be faced. However, the variables in an ECM representation will normally be far less
highly correlated. In fact, they tend to be almost orthogonal, that is correlations between them are often
close to zero. (5) It can be shown (see Appendix I) that in a typical ECM formulation there is no reason to
expect that the disturbance term ut is auto-correlated.
Stationarity of the variables is one of the requirements for meaningful statistical interference.
Intuitively, a time series is said to be stationary if its behaviour does not change over time which implies not
only the behaviour of individual points, but the collective behaviour of sets of points as well (MASTERS 1995,
p.253). Another way of expressing this is that the time path of a series must show stability (THOMAS 1993,
p.158). More formally, a stochastic process is said to be stationary if, (1) E(Yt) = constant for all t,
(2) var(Yt) = constant for all t, and (3) covar(Yt, Yt+s) = constant for all t ≠ s, that is the mean, variance and
(auto)covariances of a time series remain constant over time.41 There are different types of stationarity and
strictly speaking, this is a definition for what is known as weak stationarity (GUJARTI 1995, p.713), but
these differences are beyond the scope of this study. Furthermore, a stationary time series as just defined
is not necessarily a "non-trending" time series. An underlying trend just implies that the mean of the series
is non-constant, but a trend does not usually affect conditions (2) and (3) (THOMAS 1993, p.158). Many
time series encountered in daily life are non-stationary but homogenous, i.e. apart from occasional changes
in level (or perhaps slope and level), these series exhibit generally uniform behaviour over time (MASTERS
1995, p.253).42 However, no answer to the question has found so far why some economic time series are
stationary and others are non-stationary (GUJARATI 1995, p.730).
41 The (auto)covariance at lag s measures the correlation between the original series and itself lagged by s periods (see
GUJARATI 1995, p.713). Thus, the condition of a constant (auto)covariance implies that the correlation between any two values of Y taken from different time periods depend only on the "difference apart in time" between the two values (THOMAS 1993, p.158).
42 A classic example of homogenous non-stationary time series are stock prices (MASTERS 1995, p.253). A share price may fluctuate around e.g. 40 for some months, then drop to e.g. 30 where it remains for a few more months. Its day-to-day behaviour in the latter period is nearly identical to its behaviour in the former time period. Only its central tendency is different. This behaviour is also known as a "random walk", i.e. today's stock prices are equal to yesterday's stock price plus a random shock (GUJARATI 1995, p.718). Differencing then, can make a homogenous non-stationary series stationary.

64 2 ANALYSING INTERNATIONAL FOOD PRODUCT MARKETS AT THE AGGREGATE LEVEL
Testing for stationarity of a time series can be done by using statistical tests such as the Unit
Root Test for Stationarity, the Dickey-Fuller Test (DF), the Augmented Dickey-Fuller Test (ADF), and the F-
test for a Stochastic Trend. For a unit root can be tested in running a regression such as Yt = ρ Yt-1 + ut
and checking H0: ρ = 1 against ρ < 1. If it is found that p is statistically not different from 1 it can be
concluded that the series is non-stationary (GUJARATI 1995, p.718). The Dickey-Fuller Test is similar, but
here a regression such as ∆Yt = ϕ Yt-1 + ut is run, where ϕ = ρ - 1 and the null hypothesis ϕ = 0 is tested
against ϕ < 0. Now, a statistically significant value of zero for ϕ implies non-stationarity (THOMAS 1993,
p.159). Unfortunately, there is one problem. In case ϕ = 1 or ρ = 0, i.e. the process is non-stationary, then
standard distribution theory does not apply and the OLS estimator of ϕ or ρ can be shown to be biased
downwards, however large the sample (ibid.). Therefore the usual t-test cannot be applied. FULLER (1976),
however, has tabulated adjusted critical values for the t-statistic (so called τ [tau] values), which are
considerably larger than standard critical t-values (see Appendix I). In using these values it is possible to
test the null hypothesis of non-stationarity despite the bias in the OLS estimator. The Augmented Dickey-
Fuller Test (ADF) includes also lagged values of ∆Yt in the above Dickey-Fuller regression, i.e.
t
l
iititt YYY εφϕ +∆+=∆ ∑
=−−
11 where ∆Yt-1 = (Yt-1 - Yt-2), ∆Yt-2 = (Yt-2 - Yt-3), etc. This test is advised if the error
term ut turns out to be autocorrelated. The number of lagged difference terms l to include is often
determined empirically with the idea being to add enough terms so that the error term εt is serially
independent (GUJARATI 1995, p.720). A more advanced test for stationarity includes also the testing for
the type of trend that possibly underlies a chosen time series.43 Here, a regression such as
ttt YTY εϕβα +++=∆ −1 is estimated, or in case the error term shows to be autocorrelated, a regression
such as t
l
iititt YYTY εφϕβα +∆+++=∆ ∑
=−−
11 , where T is a time variable. The null hypothesis is still
H0: ϕ = 0 against ϕ < 0, however under these circumstances (i.e. due to the inclusion of a constant and a
time trend) critical t-statistic values are even larger in absolute terms and now have to be compared to what
is known in the literature as critical ττ values (THOMAS 1993, p.162). In order to check specifically for the
type of trend that a time series is subject to there is also the possibility to test the joint null hypothesis
β = ϕ = 0 in these two models, using the F-test. Failure to reject this joint hypothesis (the empirical F-value
is smaller than the tabulated critical one) implies that stationarity can be achieved by first-differencing
(ibid.). However, the critical F-values cannot be taken from standard F-tables. DICKEY & FULLER (1981)
have shown that the F statistic in this case must be compared with special critical F-values which are
considerably larger than the standard critical F-values. These values and a more formal treatment of these
tests are provided in Appendix I. In summary, however, it has been found that all these tests for
stationarity lack power and should not be regarded as precise (THOMAS 1993, p.163). This is especially
true for the ADF test as the number l of lagged terms included can seriously affect the values of the test
statistics. Therefore these tests need to be applied with care (ibid.).
43 In theory there are two different types of trends (see THOMAS 1993, p.162): (1) A stochastic trend which takes the
form ∆Yt = α + ut where α is a constant and ut the disturbance term. This type of trend can be removed by first differencing and the Dickey-Fuller procedure tests for such a trend. (2) A deterministic trend, which takes the form Yt = α + βT + ρYt-1 + ut where T is a time or trend variable. Here Y depends also on T and such a trend cannot simply be removed by differencing. A deterministic trend has to be removed by regressing Y on time and the obtained residuals will then not display any deterministic trend. The practical significance is that a time series with a deterministic trend (a so-called trend-stationary process [TSP]) has a more stable time path and thus can be much more reliably forecasted. On the other hand, a time series with an underlying stochastic trend (a difference-stationary process [DSP]) is much more unstable and disturbances or shocks to such a time series will not only result in fluctuations of the transitory or cyclical component but will directly affect its levels (GUJARATI 1995, p.724).

2 ANALYSING INTERNATIONAL FOOD PRODUCT MARKETS AT THE AGGREGATE LEVEL 65
Co-integration of several time series may be described intuitively as the existence of a long-run
equilibrium relationship between them. That is, they move synchronously. In fact, exhibiting trends does
not exclude series from being co-integrated. The point is they must be "trending together" (GUJARATI
1995, p.725). In the context of an error-correction model, as pointed out by ENGLE & GRANGER (1987),
this means that the disequilibrium errors ∑=
−−m
iitit xy
10 γγ observed over time (which measure the extent
of 'departure' from equilibrium) should tend to fluctuate around zero, should rarely drift very far from zero,
and should fairly frequently 'cross the zero line'. Defining such behaviour more precisely provides the
statistical concept of co-integration, which can be found in THOMAS (1993, p.164):
A process or series is said to be integrated of order d, denoted as I(d), if it has to be differenced d times before it becomes stationary. Two or more series are said to be co-integrated of order d, b, denoted CI(d, b), if (1) they are integrated of order d, and (2) there exists some linear combination of them that is integrated of order b < d.
The most common case for economic time series is a situation such as CI(1,0) which means that a series is
non-stationary but by first-differencing can be transformed into a stationary process, i.e. it is I(1).
For example, assume a long-run relationship
∑=
+=m
iitit xy
10 γγ [2.3.2.4.2-2]
and disequilibrium errors such as ∑=
−−=m
iititt xy
10 γγε , i.e. a linear combination of the chosen series.
As just mentioned, in an equilibrium relationship the disequilibrium errors should fluctuate about zero which
is another way of saying that they are stationary or I(0). If they were non-stationary and e.g. trending
upwards, then yt and the xit would be moving further and further away from each other, a behaviour that is
hardly consistent with a long-run relationship (THOMAS 1993, p.164). But if the εt are stationary, i.e. I(0),
then, as in fact the error terms result from a linear combination of I(1) time series, and the other condition
for co-integration is met, the underlying statistical processes are indeed co-integrated. That is, a stable
long-run relationship exists between them.
Testing for co-integration therefore implies, after having checked if yt and the xit are integrated
of the same order, to test the residuals of the co-integrating regression (i.e. equation 2.3.2.4.2-2) for
stationarity. More specifically, the residuals et of this regression are retained which can be seen as
estimates of the disequilibrium errors εt, and the Dickey-Fuller tests just described are applied to them.
However, since the errors εt are expected to have a zero mean but they are not expected to have a
deterministic trend (see Footnote 43), no intercept and trend variable is included into the Dickey-Fuller
regression. Therefore, ttt uee +=∆ −1ϕ is estimated by OLS, or ∑=
−− +∆+=∆l
itititt eee
11 νφϕ in case the error
term ut turns out to be autocorrelated, and the null hypothesis ϕ = 0 against ϕ < 0 is tested (ibid., p.165).
However, as now the critical values for the Co-integration (Augmented) Dickey-Fuller Test depend on the
number m of explanatory variables included in the co-integrating regression, the estimated t-value for ϕ has
to be compared to a yet again another critical test statistics (as provided in Appendix I). If ϕ = 0 is
rejected, then the ets can be considered as stationary. There are several other tests for co-integration.
Another common approach to test the ets for stationarity is the Co-integrating Regression Durbin-Watson
Test (CRDW) (see GUJARATI 1995, pp.727-728). Here, a regression such as et = φ et-1 + νt is run and

66 2 ANALYSING INTERNATIONAL FOOD PRODUCT MARKETS AT THE AGGREGATE LEVEL
H0: φ = 1 is tested against φ < 1. It can be shown that when φ = 1, the Durbin-Watson DW coefficient is
likely to take a value very close to zero, but if φ < 1 a value in excess of zero can be expected. For n = 100
and at the 0.01, 0.05 and 0.10 level of significance the null hypothesis φ = 1 (i.e. the ets are non-stationary)
should be rejected if the Durbin-Watson statistic exceeds a value of 0.511, 0.386 and 0.322 respectively.
Similarly to the stationarity tests, the co-integration tests have some problems too. In particular, the critical
values for the Co-integration ADF Test depend on the number of the included lags l. Equally, the CRDW Test
only works well when the disturbances in the co-integrating regression really follow a first-order scheme. It
has, however, very different critical values for alternative specifications (THOMAS 1993, p.166). Therefore,
these tests cannot be considered as precise and again need to be applied with care.
The estimation of ECMs implies an underlying equilibrium relationship and it can be proved (see
ENGLE & GRANGER 1987) that, provided the employed variables are co-integrated (i.e. an equilibrium
relationship exists), then the short-run 'disequilibrium' relationship between the variables can always be
represented by an ECM. This result is known as the Granger Representation Theorem. The actual
estimation process of an ECM can be done in two distinct ways (see THOMAS 1993, pp.167-168).
(1) A two-step procedure as suggested by ENGLE & GRANGER (1987) where in a model such as
t
m
itiit
n
itiit uxyxy +
−−−−∆=∆ ∑∑
=−−
= 1101
1)1( γγαβ the long-run parameters γ0 and γi are obtained by the
application of OLS to ∑=
+=m
iitit xy
10 γγ , i.e. the co-integrating regression. The residuals from this regression,
the ets, are then substituted into the ECM in place of the disequilibrium errors. Thus, the second step
involves the application of OLS to tt
m
itiit uexy +−−∆=∆ −
=∑ 1
1)1( αβ by which the short-run parameters βi and
α are obtained. However, there is one problem with this procedure. In a small sample the disequilibrium
errors ets can be substantially biased (i.e. they are a bad approximation of the true εts), and this bias carries
over into the second stage where it can lead to a serious small sample bias in the estimation of the short-
run parameters. A second problem with the two-stage estimation process of an ECM can result when more
than one explanatory variables are included in the estimation process. In this case it is possible that more
than one linear relationship exists with variables being integrated to the same order, i.e. more than one co-
integrating vector exists (THOMAS 1993, p.170). It is then not clear which of these linear combinations
should be treated as the long-run equilibrium relationship and used to generate the residuals for the second
step of the Engle-Granger procedure. Therefore, an alternative to the two-step procedure has been
proposed by WICKENS & BREUSCH (1988).
(2) The ECM is estimated directly, i.e. OLS is applied to a specification such as
t
m
itiit
m
itiit uxyxy +−+−−∆+=∆ ∑∑
=−−
= 111
10 )1()1( γααββ where β0 = γ0 (1-α). The estimates of the long-run
parameters γi can then be obtained from the ratio of the estimated coefficients of xit-1 and yt-1. Similarly, an
estimate of γ0 is obtained from the ratio of the β0 to the coefficient of yt-1. A comparison between both
methods revealed that the estimators of the short-run parameters are identical whereas this is not true for
the estimators of the long-run parameters. However, there is some evidence that the small-sample bias is
smaller in the direct estimation procedure than it is in the two-step procedure (THOMAS 1993, p.168).
Therefore the direct estimation procedure may be seen as a more feasible approach for the practical
estimation process of an ECM.

2 ANALYSING INTERNATIONAL FOOD PRODUCT MARKETS AT THE AGGREGATE LEVEL 67
B) Data discussion
Unreliable or inappropriate raw data will not provide valuable results, even if the most sophisticated
econometric models are used in the estimation procedure. Therefore, in the following, some room is given
to a brief discussion of the data used in the regression analysis. (The raw data are provided in Appendix I.)
The estimation period 1967 to 1990 was imposed by the availability of appropriate data.
Unfortunately, continuous time series for foreign citizens living in Germany are only available from 1967 on.
This is a problem, as it prevents the analysis for the late 1950s and early 1960s, a period with a relatively
high intake of foreign workers. It is especially a problem for the case of Italy, one of the largest supplier of
food products to Germany, as in 1967 Italian immigrant levels were already near their peak values of 1973-
75, i.e. the whole period with strongly rising immigrant intakes from Italy could not be analysed. Thus,
1967 was the lower limit for all time series entering the estimation process. An upper limit was imposed by
the German reunification event in 1989 and the switch in the published statistical times series of West
Germany to reunified Germany from 1991 onwards. This resulted in a structural shift in most of the
employed time series (as many of them have been specified in per capita terms), but is especially true for
the per capita GDP series. Moreover, for the food import data series (i.e. the dependent variables) a change
in the measurement methodology by the German Bureau of Statistics in 1993 made comparability of the
data from this year on to the previous years difficult and thus led to another structural shift. Although it was
tried to account for these shifts by the use of dummy variables that were introduced into the regressions,
the resulting estimations did in fact not improve but rather deteriorate. The reunification process may in
fact have had a too big impact and the few observations available (1991-96) for the years after this shift
may not have been enough to allow the statistical model to adapt to the new situation. Therefore, the
estimation period for all regressions was limited to the period of 1967-90.
Data for immigration and tourism came from the German Bureau of Statistics (for immigration)
and the World Travel Organisation in Geneva (for international tourism activity). For the latter there are in
fact two suitable indicators that could be used: (1) tourists arrivals at the frontiers of the countries, or (2)
the numbers of nights spent by tourists in formal accommodation. However, in both series, unfortunately,
comparatively many missing values are present. It was found that arrivals at borders were a more suitable
and reliable measurement for international travel activity mostly because they include also travellers with
caravans, backpackers and people staying privately with the home population and because the completeness
of the data seemed to be better. Nevertheless the data cannot be considered to be a very reliable measure.
Although missing values were replaced by linear interpolation procedures, the tourist data for France in
particular displayed some inexplicable 'breaks'. In general, these series may only be suitable for reflecting
changes in overall levels over time but they may not be reliable for accurately reflecting possible short-run
effects.44 Figure 13 shows the development of immigration into Germany and the foreign travel activity of
Germans to selected countries for the period 1967-90. All data are displayed in relative terms, i.e. per head
of population in order to control for population growth. Apart from Italian and French immigrants, all series
show substantial upward trends. Especially strong growth rates can be found in both immigration from and
44 In fact, the statistics itself, the measurement methods and the presentation of the data changed considerably during
the years. Even the name of the publication changed frequently starting as International Travel Statistics (until 1974), and was then called World Travel Statistics, World Tourism Statistics, and World Tourism and Travel Statistics.

68 2 ANALYSING INTERNATIONAL FOOD PRODUCT MARKETS AT THE AGGREGATE LEVEL
foreign travel to Asian countries, although the levels of these flows are still considerably lower when
compared to the displayed European countries.
Figure 13: Immigration to Germany and foreign travel of Germans by selected countries, 1967-90
Selected immigrants from European origin in Germany, 1967-90 (in % of total population)
0.0
0.5
1.0
1.5
2.0
2.5
3.0
1967 69 71 73 75 77 79 81 83 85 87 89
French Italians Turks
Selected immigrants from Asian origin in Germany, 1967-90 (in % of total population)
0.00
0.01
0.02
0.03
0.04
0.05
0.06
1967 69 71 73 75 77 79 81 83 85 87 89
Chinese Indians Japanese Thai
Foreign travel of Germans to selected European countries, 1967-90 (as percentage of total population)*
0
2
4
6
8
10
12
14
16
18
20
1967 69 71 73 75 77 79 81 83 85 87 89
Italy France Turkey
Foreign travel of Germans to selected Asian countries, 1967-90 (as percentage of total population)*
0.00
0.05
0.10
0.15
0.20
0.25
0.30
0.35
0.40
0.45
1967 69 71 73 75 77 79 81 83 85 87 89
China India Japan Thailand
Note: *Number of travellers divided by total population for each year to control for population growth. Missing values replaced by linear interpolation.
Sources: Raw data from the Statistisches Bundesamt (German Bureau of Statistics), Fachserie 1, Reihe 2, 1997; World Travel Organisation, World Travel Statistics, various yearbooks.
Data for German food imports came from the German Bureau of Statistics published in the
Statistical Yearbook of Germany for Food, Agriculture and Forestry (Statistisches Jahrbuch über Ernährung,
Landwirtschaft und Forsten der Bundesrepublik Deutschland). From all available food import data two
specifications of published time series in particular have been found as possibly suitable for the regression
analysis. (1) In order to check for any connection between aggregate food imports at the country level and
tourism activity and immigration, total food imports (including coffee and tobacco) have been used.
Although it seems unlikely to find significant connections between these activities and the highly aggregate
food imports, there may be some chance of detecting it in the case of certain Asian countries. Food items
from these countries have only recently emerged on a large scale in supermarkets and Asian specialty shops
in Germany. Furthermore, most of these countries are geographically located in the tropical or sub-tropical
zone, thus their agricultural commodities and foods products are considerably distinct from those of
Germany, i.e. substitutability between the products of the Asian countries and Germany can be assumed as
low. That is, it is not likely that e.g. Thailand has emerged as a new potato, wheat or pork supplier, etc. for

2 ANALYSING INTERNATIONAL FOOD PRODUCT MARKETS AT THE AGGREGATE LEVEL 69
Germany.45 Moreover, as it can be seen in Figure 14, there is a high (simple) correlation between the
increase in food imports from these countries and the growth of German tourism activity to and immigration
into Germany from there. In fact, as long as these imports mostly represent final consumer products and
not agricultural raw commodities (e.g. cereals, feeding stuffs for animals, etc.), or intermediate products for
further processing (e.g. rice flour), there may be a good chance of finding some significant influence of
tourism activity and immigration on the import flows. In fact, a look at the export structure of these
countries (see Table 17) reveals that in 1995 the spectrum of exported foods was quite broad, including
agricultural commodities such as meat, fresh (shell) fish, rice, sugar or fresh vegetables, as well as more
consumer oriented food products such as cereal preparations, confectionery, spices, beverages, or food
preparations. Of course, the figures given in the table do not show how the situation was in 1967, nor how
it eventually changed through to 1990. Furthermore, it cannot be seen what proportion of the individual
food groups actually ended up as being imported into Germany. However, these figures can provide a first
examination of the commodities and food products that these countries supply onto the world markets.
Table 17: Food export structure of selected Asian countries (incl. Turkey) in 1995
India Thailand China* Turkey Japan
Total food and tobacco exports in US$ million
5 484.3 10 747.5 10 923.0 3 796.3 1 558.1
Shares (in %) of individual food product groups in total food and tobacco exports
Meat and preparations 12.6 Shell fish fresh, frozen 14.5 22.4 9.4 Fish etc prepd, prsvd, nes 14.8 7.2 Rice milled, unbroken 24.7 16.6 0.1 Wheat meal or flour 3.8 Cereal etc preparations 6.1 Veg etc fresh, smply prsvd 12.6 12.4 Veg etc prsvd, prpd 2.2 10.5 5.1 Fruit, nuts fresh, dried 8.1 4.1 31.9 Fruit preprd, prsvd, nes 3.4 4.0 7.9 Raw sugar 7.7 Sugar candy non chocolate 4.9 Chocolate and products 2.1 Edible products, preps nes 2.5 1.5 Spices 3.3 Coffee green, roasted 6.7 1.7 Tea 6.3 2.5 Beverages 2.3 Tobacco 2.4 0.5 10.0 Feeding stuff for animals 12.9 2.2 3.2
Notes: Selected commodities and products. Missing values either not provided in source statistics or very small. *For China see also Table 6. nes = not elsewhere specified.
Source: Author's calculations from United Nations, 1996 International Trade Statistics Yearbook � Volume I: Trade by Country, 1997.
45 Furthermore, rising imports of the agricultural raw commodity rice may quite possibly be related to increasing tourism
activity or rising Asian immigration into Germany (indicated e.g. by an increase in Chinese restaurants), since Asian rice varieties (such as Basmati, Jasmin, Japanese sticky rice etc.) are quite distinctive in their use as compared to European or American varieties. That is, these Asian rice varieties are likely to be used only in Asian dishes and thus only by people who have an interest in Asian food. Moreover, other typical Asian food products such as tropical spices & vegetables (e.g. bamboo or bean sprouts), soy-, fish- or mushroom sauces, coconut products, rice noodles, etc. can hardly be replaced in the food preparation process by locally produced German ingredients, thus an increasing interest of the German population in Asian foods is almost inevitably linked to rising food product imports from these countries.

70 2 ANALYSING INTERNATIONAL FOOD PRODUCT MARKETS AT THE AGGREGATE LEVEL
Another problem with these series is that they are listed in millions of DM, i.e. in nominal monetary terms.
Therefore they needed to be deflated (see next paragraph) and transformed to a per capita basis.
(2) As already argued in the previous theoretical part, a higher likelihood of finding some evidence for the
effects of tourism and immigration on food imports may be expected at the individual commodity level.
Import data with country of origin listings are available for eggs and dairy products (butter, cheese and soft
cheese), oils and fats, meats, bottled or tinned fruit and vegetable preparations, fresh citrus fruits and
vegetables, and wine (for drink or processing use). From these goods, imports of agricultural raw
commodities such as eggs, butter, meats and fresh fruit and vegetable are not likely to display a significant
connection with immigrant or tourist flows and thus were not included in the regression analysis.
Furthermore, for most of the others, more highly processed products such as cheese, oils and fats, and fruit
and vegetable preparations, it is not clear what amount of the imports are actually final consumer food
products, and what percentage of the imports are used as intermediate products for further processing.
Although there may be a strong a priori expectation that e.g. imports of Italian tinned tomatoes, or
conserved artichokes or olives, or bottled olive oil may be highly related to international migration and
tourism activities, this connection can be far less expected when these products are used to a large extent in
further industrial food processing (e.g. deep frozen pizza production), and if substitute procurement origins
exist (e.g. North Africa for olives and olive oil). The same may be true for cheese: the German imports of
French cheese marketed as final consumer products may be strongly related with German tourism activity to
France, or French immigration into Germany. However, total imports may also contain a considerable
fraction of industrially produced cheese for grating or other processing which could, for example equally be
supplied by Switzerland, Austria or Bavaria (and buying behaviour of industrial processors can be expected
to be much more price sensitive, i.e. volatile). Therefore, the connection between total cheese imports from
France and tourists to France, or French immigrants in Germany, may turn out to be much less significant
than expected. In fact, there are import data for only one product, namely wine, which are differentiated by
final use (drink or processing), and where a clear a priori hypothesis can be formulated: the connection
between tourism and immigration and imports should be much more significant for the drink wine imports
than for the processing wine. Unfortunately, for the chosen time period complete import, tourism and
immigration, or financial data was only available for two countries: Italy and France. However, these
countries are the most important world wine producers which together provide, depending on the year,
between 50% and 80% of total wine imports to Germany. Another advantage with the individual commodity
series is that they are specified in physical terms (tons or hectoliters etc.). That is, there is no risk of them
displaying biasing monetary inflation movements during the estimation period. Figure 14 shows real per
capita total food imports from selected countries and imports of selected food products for different
countries from 1967-90. Apart from aggregate food imports from Japan (downwards trend) and imports of
processing wine (no distinct trends), all time series display substantial upwards trends during the chosen
period.

2 ANALYSING INTERNATIONAL FOOD PRODUCT MARKETS AT THE AGGREGATE LEVEL 71
Figure 14: Real German per capita imports from selected countries and of selected food products, 1967-90
Real* German per capita food imports (in DM) from selected Asian countries, 1967-90
0
2
4
6
8
10
12
14
1967 69 71 73 75 77 79 81 83 85 87 89
Turkey China India Japan Thailand
Annual** German per capita wine imports (in litres) by final use from France and Italy, 1967-90
0
1
2
3
4
5
6
7
1967 69 71 73 75 77 79 81 83 85 87 89
French drink wine French processing wine Italian drink wine Italian processing wine
Annual** German per capita cheese imports (in grams) from France and Italy, 1967-90
0
200
400
600
800
1000
1200
1400
1967 69 71 73 75 77 79 81 83 85 87 89
France Italy
Annual** German per capita prcsd/prsvd vegetables imports (in grams) from France and Italy, 1967-90
0
500
1000
1500
2000
2500
3000
3500
4000
1967 69 71 73 75 77 79 81 83 85 87 89
Italy France
Notes: *Deflated with the German index of food import prices; Imports include coffee and tobacco. **Agricultural years.
Source: Raw data from the German Bureau of Statistics published in Statistisches Jahrbuch über Ernährung, Landwirtschaft und Forsten der Bundesrepublik Deutschland, various issues.
Financial data such as GDP, exchange rates, and price indices came from the International
Monetary Fond (IMF), the German Federal Reserve Bank (Deutsche Bundesbank) and the German Bureau of
Statistics. The GDP series is based on 1991 prices. That is, inflationary effects have been removed.
Unfortunately, no price indices for food imports from individual countries were available. There is only a
general price index for all food imports published by the German Bureau of Statistics which is the average
price tendency for all countries. This index was used in all regressions as a price indicator, as all country's
specific food import prices, or the import prices of individual commodities, should be correlated with this
aggregate. However, in order to account for individual country price effects, country specific exchange rates
have been introduced into the regressions. Long-term time series of exchange rates on a DM basis for the
countries of interest for this analysis were only available from the German Federal Reserve Bank for the
Italian Lira, the French Franc, and the Japanese Yen. For India, Thailand, China, and Turkey exchange rates
on a US-$ basis published by the IMF have been used. These rates have been transformed into DM values
by using the IMF DM per US-$ exchange rate series. No measure has been found to reflect prices for home
produced foods as a substitute for food imports. All available price indices include food in general, i.e. they
do not differentiate between food produced in Germany and imported foods. However, as argued in the
theoretical part above, the price differences between both prices can be expected as small and are not
assumed to influence the food choice significantly. Thus, the influence of substitute prices may be neglected.

72 2 ANALYSING INTERNATIONAL FOOD PRODUCT MARKETS AT THE AGGREGATE LEVEL
In order to deflate the nominal food imports from Asian countries, two possibilities were considered. (1) The
use of the general price index for food imports. This is quite a rough measure, however it reflects the fact
that world production of food over the examined period has become more efficient, and thus food in real
terms has become more inexpensive. (2) The use of country specific GDP-deflator series, as the price
development of food exports should at least weakly be correlated with a country's general price
development. However, this measure has not been available during the whole period for most of the
countries of interest such as India, China, or Turkey. For Thailand, where this measure was available, the
general price index, the GDP deflator and the mean of both series have been used to deflate the imports
from this country. The resulting regression coefficients have not been found to differ significantly, therefore
� and in order to have a more systematic approach � the general price index has been used to deflate food
imports from all countries used in the analysis. Figure 15 displays the financial data used, i.e. income and
price variables. Apart from the price index and the exchange rate for Japanese Yen, all time series show
distinctive upward (real per capita GDP) or downward trends (exchange rates).
Figure 15: Financial data (per capita GDP, food imports price index and exchange rates) for Germany, 1967-90
Real per capita GDP of German population (in DM), 1967-90
15.000
20.000
25.000
30.000
35.000
40.000
45.000
1967 69 71 73 75 77 79 81 83 85 87 89
Price index for food imports into Germany (1991 = 100), 1967-90
40
50
60
70
80
90
100
110
120
130
1967 69 71 73 75 77 79 81 83 85 87 89
Exchange rates* (price in DM for foreign currency) for selected countries, 1967-90
0
1
2
3
4
5
6
7
8
9
1967 69 71 73 75 77 79 81 83 85 87 89
10 French Francs 100 Italian Lira 100 Japanese Yen
Exchange rates** (price in DM for foreign currency) for selected countries, 1967-90
0
10
20
30
40
50
60
1967 69 71 73 75 77 79 81 83 85 87 89
100 Thai Baht 10 Chinese Yuan 100 Indian Rupees 100 Turkish Lira
Notes: * Data originally published in DM; ** Data transformed from US$ into DM using the IMF DM-US$ exchange rate.
Sources: International Monetary Fund (IMF), International Financial Statistics Yearbook, various issues, for the raw data of GDP and right-hand graph exchange rates. Statistisches Bundesamt (German Bureau of Statistics), Fachserie 17, Reihe 8, 1996, for the price index. Deutsche Bundesbank (German Federal Reserve Bank), Devisenkursstatistik � Statistisches Beiheft zum Monatsbericht 5, November 1995, for the left hand graph exchange rates data.

2 ANALYSING INTERNATIONAL FOOD PRODUCT MARKETS AT THE AGGREGATE LEVEL 73
In summary, the available data may not be optimal for explaining aggregate food imports, or
imports of selected food products into Germany. The only feasible deflation methods may be too crude,
mostly because of the use of only one general price index and not of country specific deflators.
Furthermore, price effects cannot be taken into account appropriately due to the non-availability of suitable
import price series for individual countries or food products. Finally, the available tourism data does not
seem to be very accurate and reliable, especially for reflecting possible short-run effects. Nevertheless, all
indicators should at least be roughly correlated with the "true" changes over time, and thus regression
analysis still seems to be justified.
C) Regression results
The following research strategy has been employed to explore potential positive effects of international
tourism activity of Germans and foreign immigration into Germany on food imports from selected countries
and for selected food products. Tests for normality and stationarity of the employed variables have been
conducted before the estimations. In all estimated models only (natural) logarithms of the variables have
been used. All variables have been found to be sufficiently normally distributed and most of them to be
integrated of order 1, i.e. I(1) (see Appendix I for details). All models have been controlled for
multicollinearity (VIF coefficients are provided in Appendix I)46 and regression residuals have been checked
for normality, linearity, and heteroscedasticity (null plots are provided in Appendix I). All long-run
coefficients have been directly estimated (i.e. the two-stage procedure has not been used), as discussed in
Section A. Tests for co-integration have been conducted for all specified underlying long-run relationships of
the estimated error-correction models using the Co-integration Dickey-Fuller Test (see Section A). Not all
tested long-run relationships have been found to be co-integrated. All regressions were run using SPSS 9.0.
First, aggregate food imports from selected Asian countries (including Turkey) have been
analysed. For these countries the imposed estimation period seemed to be well-suited, as in it falls strong
growth of foreign tourism activity to these countries and immigration from them. Furthermore, given the
assumed relative weak substitutability of these countries' agricultural production with the German one, the
aggregate food imports from these countries are assumed to be composed to a higher extent of consumer
oriented food products. First, a purely economic error-correction model has been estimated using only real
per capita GDP, the price index for food imports, and country specific exchange rates. The purely economic
model has then been tried to be improved by eliminating variables, however only and strictly according to
the following criteria: (1) as all the entered variables are coherent with economic theory, or at least their
long-run effects are, the first differenced terms have been removed first. These variables simply reflect
short-run dynamics, about which theory typically has nothing to say, thus their elimination does not involve
46 The variance inflation factor (VIF) is a measure for assessing both pairwise and multiple variable collinearity. It is the
inverse of the tolerance value (i.e. VIF = 1/TOL) and both values show to which extent each independent variable is explained by the other independent variables. Tolerance is the amount of variability of the selected independent variable not explained by the other independent variables. Thus, very small tolerance values (i.e. high VIF values) denote high collinearity. A VIF values above 5.3 indicates a multiple correlation with this variable of more than .90. However, a commonly accepted cut-off threshold is a VIF of 10 (corresponds to a multiple correlation of .95) (HAIR et al. 1998, p.192-193). Both measures, however, do not indicate which variables are intercorrelated. For this problem, SPSS provides a special multicollinearity diagnosis statistics which is based on a coefficient variance decomposition analysis (for more information see ibid., p.220-221). This statistics has been checked in all regressions, and it was found that hardly any regression suffered from multicollinearity problems severe enough to exceed the statistics' cut-off thresholds. Therefore, these (paper filling) tables are not included in the appendix.

74 2 ANALYSING INTERNATIONAL FOOD PRODUCT MARKETS AT THE AGGREGATE LEVEL
violations (THOMAS 1993, p.156). Only in cases in which the lagged variable displayed the wrong sign, was
highly insignificant, had a low partial and part correlation with the dependent variable (see point 4), and the
model could significantly be improved by eliminating this variable, also the long-run specifications (i.e. the
lagged variables) were removed. (2) The differenced term displayed a sign incoherent with economic
theory. (3) The differenced variable was highly insignificant (as measured by the t-value). (4) The
differenced variable was only weakly correlated with the dependent variable, as measured by the partial and
part correlation coefficients.47 The next step involved the inclusion of the tourism and immigration variables
into the purely economic model, and then it was tried to improve this model by eliminating implausible and
insignificant effects according to the criteria just listed. The estimated tourism and immigration models were
then compared to their purely economic specifications, and the quality of the estimated models was judged
by using the adjusted R2, the F-test value, and the plausibility and significance of the estimated variable
coefficients, using the common t-test. If a tourism and immigration model proved superior to its purely
economic specification according to these criteria, then this was seen as proof of the explanatory power of
the tourism and immigration variables (or at least of one of them).
Second, imports of individual food products from France and Italy have been analysed. In
particular, wine for drink and processing use, cheese and processed and preserved vegetables were chosen,
as these products could be considered as consumer food products (with the exception of processing wine).
A further selection criteria was the availability of complete import data time series for these products during
the estimation period. The same research strategy as above has been employed to test for the significance
of the influence of immigration into Germany and international tourism activity of Germans on import flows
of the selected food products into Germany. The first step involved the estimation of a purely economic
import demand specification, using income, prices and exchange rates only. Then, the tourism and
immigration variables were included and the new model was checked for significant statistical improvement
over the purely economic specification. To do this, the same criteria as just listed above were used. Table
18 to Table 23 list the regression results for German aggregate food imports from selected Asian countries
and for the German imports of selected food products from France and Italy.
47 As explanatory variables are usually intercorrelated, they "share" some of their predictive power. The partial and the
part correlation coefficients allow for the measurement of the "net" effect of an independent variable on the dependent variable in the presence of other independent variables. The partial correlation coefficient measures the strength of the relationship between an independent variable and the dependent variable in the presence of other independent variables, but the effects of these held constant. By contrast, the part correlation coefficient is used to apportionate variance among the independent variables. Its squared value gives the unique variance of the dependent variable explained by an independent variable (HAIR et al. 1998, p.190-91). Thus, a low part correlation means that an independent variable is relatively unimportant because it explains only a small part of the total variance of the dependent variable. A low partial correlation means the independent variable only explains a small part of the remaining variance, not already explained by the other independent variables present in the model. However, both coefficients are usually highly correlated, so that a low part correlation coefficient involves a low partial correlation coefficient.

2 ANALYSING INTERNATIONAL FOOD PRODUCT MARKETS AT THE AGGREGATE LEVEL 75
The overall model significance for all estimated regressions (with the exception of aggregate
imports from Japan) is high, i.e. it is at least significant at the 95% level of significance. In all models (with
the exception of Japan again) the inclusion of the tourism and immigration variables could improve the
explanatory power of the models, as measured by the adjusted R2 coefficient.48 However, as expected, the
best improvements have been found in the most consumer-oriented food product analysed here, namely
wine for drink use. For this food product, a purely economic demand specification could only explain 25.4%
of the total variance in the imports of drinking wine from Italy, and 27.7% of the total variance in the
imports of drinking wine from France. However, after the inclusion of the immigrant and tourism variables
the estimated models were able to explain 72.2% of the total variance of these imports from Italy, and
67.1% of those from France. This stands in contrast with the comparatively low improvements in
explanatory power that could be achieved in the imports of wine for processing use from these countries.
Here the proportion of the total variance explained by the specified models rose only comparatively little
from 40.8% to 51.0% for the case of Italy, and from 35.8% to 55.1% for the case of France. However, it is
interesting to find that even for apparently not directly consumer-oriented food products, the immigration
and tourism specification indeed improved the explanatory power of the specified models.49
The overall model significance for aggregate food imports from selected Asian countries after the inclusion of
the tourism and immigration variables has also been found to increase from 63.7% to 87.1% (India), 48.6%
to 55.0% (Thailand), 49.9% to 54.6% (Turkey), and 31.2% to 34.8% (China). However, it fell from 31.2%
to 23.9% for the case of Japan. As already argued above, these comparatively small improvements could
have been expected a priori, given the fact that these aggregate food imports are composed of agricultural
raw commodities as well as of consumer-oriented food products, with the former not being likely to display a
connection with migrant and tourist flows. For the imports of cheese and processed/preserved vegetables
from France and Italy, the improvements in the explanatory power of the specified models lie somehow in
between those of the drinking wine models and those of the aggregate food imports. As already argued,
imports of cheese and the processed/preserved vegetables are likely to represent both, final consumer
products and products for further industrial processing, which may explain the differences in the explained
total variance in the import flows of the different products. Thus, for German cheese imports from France a
purely economic specification has been found to explain 40.0% of the total variance, whereas after the
inclusion of the tourism and immigration variables it was 69.8%. However, for cheese imports from Italy
the improvement was considerably smaller, up from 42.7% to 48.0%. On the other hand, imports of
processed/preserved vegetables from Italy have been found to be much stronger related to tourism and
immigration flows than those from France, with total variance explained increasing from 36.3% (Italy) and
39.2% (France) to 61.4% and 41.9% respectively.
48 The adjusted R2 or 2R is a more appropriate 'goodness of fit' measure than R2 for the comparison of models with a
different number of explanatory variables m (or for models that differ in the number of observations n). The reason is that 2R does not necessary rise when more variables are included in a model as R2 does. In fact, 2R will fall when variables with no explanatory power are introduced into a model, and it can even take negative values. (For a formal definition of both measures see GUJARATI 1995, p.207-211, or THOMAS 1993, p.36.) Note further that the comparison of R2 or 2R between different models is only justified when the dependent variable Y is the same in the compared models (ibid.). This, however, is true for all compared regression pairs in this study.
49 This might be explained by the fact that at least a small proportion of the processed products still ends up as being marketed as consumer food product with country of origin declaration. For example, some large German food product manufacturers sell vinegar made from red or white wine from Italy or France within their ethnic cuisine product lines.

Table 18: Regression estimates of an error-correction model for aggregate German food imports from selected Asian countries, 1967-90, purely economic specification
∆yt: ∆IMPt Short-run parameters Long-run parameters Model statistics
∆GDPt ∆IPXt ∆EXRt (1-α) IMPt-1 γ0 GDPt-1 IPXt-1 EXRt-1 n adj. R2 F�
Co-inte-gration*
India 2.217
(1.262) .023
(4.032) -1.203 [
(-5.560) -18.232 (-4.572)
1.274 (3.662)
.010 (2.492)
] 23 .637 9.058 [.000]
CI(1, 0)
Thailand 1.352 (.896)
.718 (2.343)
-.495 [ (-4.908)
-4.564 (-3.324)
-.640] (-2.408)
23 .486 5.350 [.003]
no
Turkey .582
(.643) -.005
(-1.791) -.182
(-1.685) -.747 [
(-3.565) -2.464
(-3.490) -.127]
(-3.317) 23 .499 3.561
[.020] CI(1, 0)
China -.006
(-1.510) -.515 [
(-3.009) -23.691 (-3.010)
2.001 (2.983)
] 23 .312 4.472 [.015]
no
Japan�
-4.461 (-1.517)
.011 (1.319)
-1.017 [ (-3.778)
56.276 (3.372)
-5.039 (-3.270)
.011 (1.582)
.725] (1.626)
20 .312 2.514 [.073]
CI(1, 0)
Table 19: Regression estimates of an error-correction model for aggregate German food imports from selected Asian countries, 1967-90, tourism and immigration specification
∆yt: ∆IMPt Short-run parameters Long-run parameters Model statistics
∆GDPt ∆IPXt ∆EXRt ∆TOUt ∆IMMt (1-α) IMPt-1 γ0 GDPt-1 IPXt-1 EXRt-1 TOUt-1 IMMt-1 n adj. R2 F�
Co-inte-gration*
India 4.904
(3.138) .013
(2.796) .439
(1.500) -1.232 [
(-6.953) 21.845 (2.201)
-1.792 (-2.295)
.004 (1.294)
.701 (3.699)
.332] (2.659)
22 .871 11.836 [.000]
CI(1, 0)
Thailand 2.155
(1.262) .495
(1.642) -.689
(-2.342) -.787
(-1.429) -.487 [
(-4.722) 3.294
(2.343) -.027
(-3.140) .772
(2.505) ] 22 .550 4.839
[.005] no
Turkey 1.211
(1.093) -.004
(-1.434) -.433
(-1.553) -.995 [
(-5.003) -50.222 (-4.427)
4.346 (4.369)
-.003 (-1.061)
-.202 (-2.631)
-.464] (-3.531)
22 .546 4.306 [.008]
no
China .131
(1.277) -.816 [
(-3.874) -20.124 (-1.850)
1.707 (1.832)
-.268 (-1.587)
.265] (2.904)
22 .348 3.343 [.028]
no
Japan�
-2.696 (-.932)
.010 (1.072)
-.750 (-1.342)
-.842 [ (-3.117)
30.819 (.933)
-3.099 (-1.269)
.014 (1.221)
-.588] (-.624)
20 .239 1.896 [.152]
CI(1, 0)
Source: Author's calculations.
Notes: Error-correction model specification: t
m
itiit
m
itiit uxyxy +
−−−−∆=∆ ∑∑
=−−
= 1101
1)1( γγαβ . All variables used in natural logarithm form only.
IMPt = Aggregate German real per capita food imports from listed country GDPt = German real per capita gross domestic product TOUt = Tourists from Germany into foreign country per 100 of German population IPXt = Index of food import prices IMMt = Immigrants from foreign country per 100 of German population EXRt = Exchange rate in DM per foreign currency ∆ = first difference, i.e. ∆yt = yt - yt-1 t-1 = lagged by one period.
(t-values) in parentheses. Coefficients significant at the 5% level of significance (or higher) in bold print. �Model significance in square brackets.
*Co-integration Dickey-Fuller Test for the specified long-run relationship. For details refer to Appendix I. �For Japan: 1969-90.
76
2 A
NALY
SIN
G IN
TERN
ATIO
NAL FO
OD
PRO
DU
CT M
ARKETS A
T T
HE A
GG
REG
ATE LE
VEL

Table 20: Regression estimates of an error-correction model for German imports of drink and processing wine
from Italy and France, 1967-90‡, purely economic specification
∆yt: ∆IMPt Short-run parameters Long-run parameters Model statistics
∆GDPt ∆IPXt ∆EXRt (1-α) IMPt-1 γ0 GDPt-1 IPXt-1 EXRt-1 n adj. R2 F�
Co-inte-gration*
Italy drink
-.338 [ (-2.580)
-68.319 (-2.116)
6.611 (2.138)
1.603] (2.111)
23 .254 3.606 [.031]
no
Italy process.
1.956 (1.036)
-.662 [ (-4.083)
-58.441 (-3.070)
5.572 (3.083)
1.434] (2.988)
23 .408 4.958 [.007]
no
France drink
.632 (1.585)
.464 (.829)
-.567 [ (-3.411)
-29.415 (-3.217)
2.941 (3.238)
] 23 .277 3.201 [.036]
CI(1, 0)
France process.
3.442 (1.155)
-1.203 [-.987]
-.735 [ (-3.262)
.198 (.958)
] 23 .358 5.272 [.008]
no
Table 21: Regression estimates of an error-correction model for German imports of drink and processing wine from Italy and France, 1967-90‡,
tourism and immigration specification
∆yt: ∆IMPt Short-run parameters Long-run parameters Model statistics
∆GDPt ∆IPXt ∆EXRt ∆TOUt ∆IMMt (1-α) IMPt-1 γ0 GDPt-1 IPXt-1 EXRt-1 TOUt-1 IMMt-1 n adj. R2 F�
Co-inte-gration*
Italy drink
1.100 (3.309)
-1.601 (-2.301)
-.690
[ (-5.543)
21.194 (5.831)
-1.763 (-3.857)
1.858 (4.791)
1.712] (3.278)
22 .722 10.502 [.000]
no
Italy process.
5.425 (2.002)
2.080 (2.054)
-1.113 [ (-4.517)
-16.556 (-2.343)
2.722 (3.541)
-1.443 (-3.127)
2.979] (3.485)
22 .510 4.810 [.006]
no
France drink
1.428 (1.347)
.514 (1.776)
.902 (2.358)
-.685 [ (-5.803)
21.815 (5.323)
-.480 (-1.349)
-.268 (-2.041)
2.841] (6.071)
22 .671 7.416 [.001]
no
France process.
4.254 (1.663)
-.686 (-1.957)
-.912 [ (-4.207)
-12.708 (-2.371)
.912 (2.059)
-1.055 (-3.187)
] 22 .551 6.650 [.001]
CI(1, 0)
Source: Author's calculations.
Notes: Error-correction model specification: t
m
itiit
m
itiit uxyxy +
−−−−∆=∆ ∑∑
=−−
= 1101
1)1( γγαβ . All variables used in natural logarithm form only.
IMPt = German per capita wine imports by final use from listed country (in litres) GDPt = German real per capita gross domestic product TOUt = Tourists from Germany into foreign country per 100 of German population IPXt = Index of food import prices IMMt = Immigrants from foreign country per 100 of German population EXRt = Exchange rate in DM per foreign currency ∆ = first difference, i.e. ∆yt = yt - yt-1 t-1 = lagged by one period.
(t-values) in parentheses. Coefficients significant at the 5% level of significance (or higher) in bold print. �Model significance in square brackets.
*Co-integration Dickey-Fuller Test for the specified long-run relationship. For details refer to Appendix I. �Agricultural years.
2
AN
ALY
SIN
G IN
TERN
ATIO
NAL FO
OD
PRO
DU
CT M
ARKETS A
T T
HE A
GG
REG
ATE LE
VEL
77

Table 22: Regression estimates of an error-correction model for German imports of cheese and processed
vegetables from France and Italy, 1967-90‡, purely economic specification
∆yt: ∆IMPt Short-run parameters Long-run parameters Model statistics
∆GDPt ∆IPXt ∆EXRt (1-α) IMPt-1 γ0 GDPt-1 IPXt-1 EXRt-1 n adj. R2 F�
Co-inte-gration*
France cheese
-1.205 (-1.952)
.343 (1.621)
-.589 [ (-3.892)
-11.447 (-1.464)
1.276 (1.895)
-.467] (-1.320)
23 .400 4.060 [.012]
no
Italy vegetab.
1.299 (1.028)
1.004 (2.677)
-.758 [ (-3.017)
-37.864 (-3.105)
3.345 (3.280)
.826 (1.484)
] 23 .363 3.503 [.023]
CI(1, 0)
Italy cheese
1.208 (2.086)
-.318 (-1.979)
-.111 [ (-2.068)
7.718 (3.185)
-1.655 (-3.137)
-.890] (-2.995)
23 .427 4.432 [.008]
no
France vegetab.
.990 (1.871)
.934 (1.253)
-.258 [ (-3.847)
1.114 (4.180)
] 23 .392 5.733 [.006]
no
Table 23: Regression estimates of an error-correction model for German imports of cheese and processed vegetables from France and Italy,
1967-90‡, tourism and immigration specification
∆yt: ∆IMPt Short-run parameters Long-run parameters Model statistics
∆GDPt ∆IPXt ∆EXRt ∆TOUt ∆IMMt (1-α) IMPt-1 γ0 GDPt-1 IPXt-1 EXRt-1 TOUt-1 IMMt-1 n adj. R2 F�
Co-inte-gration*
France cheese
.519 (3.386)
.355 (1.921)
-1.008 [ (-6.789)
-.142 (-.031)
.710 (2.159)
-.254 (-1.553)
-.080 (-1.764)
.957] (4.878)
22 .698 8.253 [.000]
CI(1, 0)
Italy vegetab.
2.431 (2.347)
.773 (3.193)
-1.625 (-3.831)
-.568 [ (-4.961)
-37.933 (-4.476)
3.715 (4.490)
] 22 .614 7.987 [.000]
CI(1, 0)
Italy cheese
-.169 (-1.177)
-.793 (-2.172)
-.264 [ (-2.183)
-66.177 (-2.592)
5.239 (2.287)
-1.407 (-2.220)
-3.451] (-4.403)
22 .480 4.384 [.008]
no
France vegetab.
4.914 (1.918)
1.952 (2.289)
1.602 (1.574)
-.410 [ (-2.320)
-43.254 (-.802)
5.692 (1.372)
4.918 (2.353)
-1.211 (-2.204)
5.462] (1.762)
22 .419 2.980 [.036]
no
Source: Author's calculations.
Notes: Error-correction model specification: t
m
itiit
m
itiit uxyxy +
−−−−∆=∆ ∑∑
=−−
= 1101
1)1( γγαβ . All variables used in natural logarithm form only.
IMPt = German per capita imports of listed product from listed country (in kilograms) GDPt = German real per capita gross domestic product TOUt = Tourists from Germany into foreign country per 100 of German population IPXt = Index of food import prices IMMt = Immigrants from foreign country per 100 of German population EXRt = Exchange rate in DM per foreign currency ∆ = first difference, i.e. ∆yt = yt - yt-1 t-1 = lagged by one period.
(t-values) in parentheses. Coefficients significant at the 5% level of significance (or higher) in bold print. �Model significance in square brackets.
*Co-integration Dickey-Fuller Test for the specified long-run relationship. For details refer to Appendix I. �Agricultural years.
78
2 A
NALY
SIN
G IN
TERN
ATIO
NAL FO
OD
PRO
DU
CT M
ARKETS A
T T
HE A
GG
REG
ATE LE
VEL

2 ANALYSING INTERNATIONAL FOOD PRODUCT MARKETS AT THE AGGREGATE LEVEL 79
The overall variance explained by many of the models can be seen as relatively high, given the
following considerations: (i) The chosen model specification is a pure demand side approach. However, this
is not a typical, "main-stream" methodology for the analysis of international trade flows. International trade
models are very often based on supply side considerations such as wage differences, capital endowments, or
measures for the availability of modern production technology. None of these factors have been considered
in the investigations of this study. (ii) It has not been controlled for trade distorting influences such as
tariffs, quotas, export subsidies, etc. Although it seems unlikely that there have been big differences
between these factors on the imports from France and Italy, as both countries belong to the European
Union, it may be quite possible that these trade distorting factors may have considerably influenced the
trade flows from the investigated Asian countries. Thus, the partly high unexplained variance in the
estimated models for the German aggregate food imports from these Asian countries (76.1% for Japan to
12.9% for India) is probably due to differences in either supply side effects or in trade distorting factors.
However, the influence of these factors are not of interest for the purpose of this study. (iii) Some
international trade models also account for transport costs and differences in physical distance between
trading partners. These influences too have not explicitly been considered. (iv) As already argued above, it
is much more difficult to explain rates of change rather than changes in levels of economic time series.
Many "traditional" trade models have not explicitly controlled for underlying time trends, which account for
much of very high 'goodness of fit' (R2) values. Thus, in order to eliminate influences which are due to
trends (i.e. population growth in physical series or inflationary influences in monetary series), and to isolate
and analyse the remaining "real" changes, error-correction models and co-integration analysis are needed.
Co-integration of the specified long-run relationship time series has not been found to occur in all
estimated models. There are two main reasons for this. First, not all of the long-run time series are
integrated of the same order. Whereas most of the time series have been found to be I(1), four out of the
seven exchange rate series were found to be neither I(0) nor I(1). Furthermore, two of the immigration
series (Turkey and Italy) and one of the tourism series (Thailand) turned out to be I(0) rather than I(1), as
were all the other tourism and immigration series. Since one of the conditions for co-integration is that all
the series entering the specified long-run relationship must be of the same order, these findings made the
existence of co-integration already difficult from the very start. The second condition then demands that the
regression residuals from the specified long-run relationship are stationary. Here it was found � using the
Dickey-Fuller Co-integration Test � that in three cases, the calculated t-value did not surpass the critical t-
value, so the null hypothesis of non-stationarity of the co-integration regression residuals could not be
rejected. The problem with these tests for stationarity and co-integration is, however, that they are
considered not to be very exact (see theoretical part above) and that some of the tested models failed to
exceed the critical values only by a little. Thus, one cannot be completely sure whether the series are really
co-integrated or not. Therefore, all models have been included in the result tables regardless if the
underlying long-run relationships were found to be co-integrated or not.
Overall, the significance and the correctness of specification of the presented models can be
seen as good enough to conclude that there is a significant influence of immigration and tourism activity on
selected German food imports, and to justify a closer look at the estimated price and income elasticities of
import demand and the quantitative effects of migration and international tourism.

80 2 ANALYSING INTERNATIONAL FOOD PRODUCT MARKETS AT THE AGGREGATE LEVEL
Income elasticities have been found in most of the estimated models to be positive and
significantly different from zero. In fact, very often the estimates are very large, even up to 5.239 (long-run
elasticity for cheese imports from Italy).50 This finding may surprise, however as the estimation period
starts back in the sixties and does not include the nineties, it may just underline VON ALVENSLEBEN's (op.
cit.) argument that income was important for food choice during the sixties and seventies and it has started
to lose its significance for food choice decisions during the eighties. On the other hand, income elasticities
for food import demand may always be expected to be larger than income elasticities for locally produced
food, since many governments actively promote the local production of important stable foods and allow
only the import of not so necessarily needed luxury food products from other countries. In general, it
appears that long-run income elasticities are higher and more significant than the short-run effects. This
makes sense according to economic theory, as it reflects the idea of "permanent income", i.e. with changing
income it might take a while until consumers actually adapt their consumption behaviour due to the inertia
in their habits.
Price elasticities show a more diversified picture. Economic theory suggests that they have a
negative sign (at least import quantity elasticities). Furthermore, they can be expected to be in the inelastic
range, i.e. lower than unity. The estimated price elasticities however display negative as well as positive
signs and some of them are considerably larger than one. However, for most of German aggregate food
imports from Asian countries, these elasticities have been found to not differ significantly from zero. For
imports of Italian drink wine and cheese, the long-run estimates take significant values of -1.763 and -1.407
respectively, whereas for imports of French cheese and of Italian processed/preserved vegetables the short-
run estimates take significant values of 0.519 and 0.773 respectively. In general, however, price effects are
probably not very well represented by the available and thus used data anyway. First, no price-indicator for
potential substitute products has been included in the models. Furthermore, the only available price index
may not reflect well own-price changes for different countries or different food product. In addition, it is an
absolute price measure. That is, it does not reflect real price changes, e.g. relative to income. For example,
the price of an imported product may rise over time, but income over the same period may rise by more.
Then, in absolute terms, the product has become more expensive, but not relative to available income, and
thus demand for this product may increase despite its (absolute) price rise. This fact may help to explain
why quite a few of the estimated import price elasticities turned out to have a positive sign. To sum up,
given the non-availability of suitable data, the estimated price elasticities may not be seen as very reliable.
Exchange rate elasticities that have been estimated show an even more difficult pattern to
explain. Exchange rates were included in the models to account for country specific price effects and thus to
complement the included price index variable. Therefore, exchange rate elasticities are expected to be
negative and small. However, very often the exchange rate series were not found to improve the models
significantly. Where exchange rate series entered the models, the long-run effects turned out to be larger
than the short-run effects (see estimates for aggregate imports from Thailand and for processed/preserved
vegetables imports from France). This finding may reflect the fact that international food markets take quite
a while to adapt to price changes. However, most of the estimated elasticities show a positive sign. In
50 This implies that a one percent increase in German per capita GDP in the long-run resulted on average in a 5.24%
increase in the imports of this food over the estimation period.

2 ANALYSING INTERNATIONAL FOOD PRODUCT MARKETS AT THE AGGREGATE LEVEL 81
short, the exchange rate variables do not contribute much to the explanation of the variation in international
food product trade.
Tourism elasticities may be expected to be positive and long-run effects to be more important
than short-run effects. This is because, as argued in the theoretical part above, international tourism
activity may be seen as a main driver for changes in tastes in local populations. Changes in preferences
may not take place within a single year but there should be a significant (positive) connection between the
levels of international tourism to certain countries and imports of certain food products from these
destinations. The estimated elasticities confirm that, in general, the long-run effects are stronger and that
the biggest influences can be found for imports of wine from Italy and France, and for processed/preserved
vegetables imports from France (elasticities in absolute terms above unity up to 1.858). In contrast, for
aggregate food imports from Asian countries, the estimates take smaller values (in absolute terms between
0.202 and 0.701). This finding makes good sense, since aggregate import flows are not expected to display
a strong association with international tourist flows. This is because the aggregates are composed of both,
agricultural raw commodities and consumer food products. However, there is one problem with the
estimated tourism elasticities. Many of the parameters are negative. One possible explanation for this is
the high collinearity that can be observed between the per capita GDP and the tourism series. It is known
from econometric theory that high degrees of multicollinearity result in very sensitive OLS estimators
(GUJARATI 1995, pp.331-332), which can result in "regression coefficients being incorrectly estimated and
even having wrong signs" (HAIR et al. 1998, p.189). In fact, it can be seen in the result tables that
whenever the lagged GDP and the lagged tourism series both enter a model, one of the two estimated
parameters for these series displays the wrong sign. There is probably not very much that can be done
against this problem. Naturally, increases in German per capita GDP will cause increased international travel
activities of Germans, thus both series must be highly collinear. At the same time higher imports of exotic
foods as a result of increased income can be expected. However, the causal connection is likely to be that
more disposable income leads to increased foreign travel, causing more contact with exotic foods in foreign
countries which may then lead to increased imports of these products in the following period(s). The second
problem with the tourism data has already been discussed above: unfortunately, the available series cannot
be considered as a very reliable measure of the real situation. Overall, given all these limitations, it may
cautiously be concluded that for some consumer-oriented food products, notably for wine from Italy and
processed/preserved vegetables from France, the elasticities of German tourism activity to these countries
with respect to the imports of these products between 1967 and 1990 were between one and two. That is, a
1% increase of German tourists to Italy and France resulted in a 1% to 2% increase of German imports of
these food products from these countries. For aggregate food imports from Asia, probably depending on the
actual composition of the aggregates, the impact of tourism on the import flows has been found to be
smaller, i.e. below unity.
Immigration elasticities can also be expected to take positive values. Furthermore, as
immigration is supposed to have even two different effects on food import flows, as argued in the theoretical
part above, it may be assumed that the estimated elasticities are in absolute terms larger than those of
tourism activity. Finally, as for the tourism activities, the long-run effects are likely to be more important
than the short-run effects. All these hypotheses are confirmed by the estimated parameters. Furthermore,
the data series can be considered as reliable, and collinearity with the GDP series, although present, is much
82 2 ANALYSING INTERNATIONAL FOOD PRODUCT MARKETS AT THE AGGREGATE LEVEL
smaller than for the tourism series. Therefore, the estimated elasticities may be seen as meaningful
measures for the promoting effects of immigration activities on the investigated German food import flows.
For individual food products the estimated long-run elasticities take absolute values from 0.957 (for cheese
imports from France) up to 3.451 (for cheese imports from Italy). The short-run parameters are smaller
with most of them lying between one and two in absolute terms. For aggregate food imports from Asian
countries the estimated long-run as the short-run elasticities are all smaller than unity in absolute terms.
Six of the eight estimated long-run parameters, which have been found to be significant at least at the 95%
level of significance, display the expected positive sign. However, only three estimated short-run
parameters have turned out to be significant at least at the 95% level of significance, with all three showing
negative signs. In sum, it may be concluded that immigration elasticities are in general higher than those
for tourism. However, immigration effects were estimated as being smaller than income effects.
Immigration elasticities for some of the investigated food products (notably for imports of drink wine from
France, and of cheese and processing wine from Italy) have been found to be well above two. However, at
the aggregate food import level they take values below unity.
Estimates for alpha (1-α) and the regression constant show mostly the expected pattern. All
coefficients of (1-α) have been estimated with the expected negative sign, and most of them are below
unity. If they are large, i.e. above unity, than this can be seen as a sign for "overcompensation", which
means the error corrections are actually destabilising (THOMAS 1993, p.341). This concern may be true for
the estimated regression of aggregate food imports from India, where (1-α) takes an implausible high value
of -1.232. Although the series that enter the long-run relationship for this model have found to be co-
integrated, the relatively high DW-coefficient and the residual null-plot (see Appendix I) generate some
doubts concerning a correct model specification. Therefore, this regression, although found to be highly
significant, should perhaps be interpreted carefully. For the other two regressions where (1-α) has been
estimated in excess of unity (notably for imports of processing wine from Italy (-1.113) and for cheese
imports from France (-1.008)), however, there are no other major signs of an incorrect model specification.
Except for aggregate food imports from Japan, all (1-α) coefficients have been estimated as highly
significant. This result suggests that long-run effects, i.e. information that is in the levels of the employed
series, indeed play a significant role in the explanation of the variation in German food product imports.
Thus, in almost all estimated models the rates of change measures had to be complemented by trend
information, with per capita GDP and tourism and immigration variables having been found to have the
largest long-run influence. On the contrary, price and exchange rate effects seem to be more important in
the short-run. With regard to the estimated regression constant (γ0), it can be said that in the context of
this study this parameter does not have a special interpretation. However, many estimated γ0s have turned
out to be significant at least at the 95% level of significance, and many of these estimates are comparatively
large.
Directions for further research are manifold. This study has only been a first (and a relatively
straightforward) attempt to quantify the effects that international migration and tourism activities may have
on international food product trade. There is scope for much more work. Here only selected products or
countries have been investigated where there was a strong a priori expectation of a positive influence of
migration and international tourism activities on German food product imports. In almost all cases (except
for aggregate food imports from Japan) these expectations have been confirmed by the empirical results.

2 ANALYSING INTERNATIONAL FOOD PRODUCT MARKETS AT THE AGGREGATE LEVEL 83
However, a more systematic approach would ideally analyse a complete database of individual food product
imports for a very long period, and then would cluster the products according to the strength of association
with migration and international tourism activity. Ideally, this research then would be conducted for many
countries in order to find significant patterns over products or ethnic groups. That is, one would investigate
if some ethnic groups really are more prone to engage in this sort of food product trade, and if yes, who are
they, and to what extent do their promoting effects depend on food imports from their source countries on
the host country they currently live in? Or, are there products such as wine, or bakery, or dairy products
whose trade flows are more likely to follow international migration or tourism activities? The results may
have valuable marketing implications since they could show export managers of food manufacturing
companies whom to target in their export markets. That is, given the assumption that travellers to foreign
countries or immigrant groups may take a leading role for the (trans-)formation of tastes of the rest of the
population, these groups may be seen as first targets of international marketing activities. This may even
be more important in the future, as we know that both international tourism activity and international
migration have been growing strongly during the last decades. For policy makers the results of this kind of
research could be equally valuable, in so far as if the link between tourism and food product trade flows are
found to be significant for a wide range of consumer food products, then export promoting policies for local
food industries should take this relationship explicitly into consideration. Thus, promoting tourism to an area
would then also mean creating export opportunities for food processors from that region.
In summary, this chapter has tried to shed some light on the demand side contributions to
international trade. Although traditional mainstream economic theory has generally focused more on supply
side explanations for the causes of international trade, demand side conditions may be more important for
the strongly growing international trade in food products � at least for the culturally-bound ones.
Theoretically, two standard cases which are based on a traditional Heckscher-Ohlin trade framework, notably
the case where trade is based on differences in tastes in otherwise identical economies and the case of non-
homogenous tastes, have been presented. However, both cases are built on two different assumptions on
the nature of tastes, and it not clear what actually causes the taste structure in a country. Therefore, the
role of international migration and tourism activities, as two factors which potentially influence the (trans-)
formation of tastes in a country, has been analysed theoretically and empirically. If it is assumed that tastes
of (at least some) immigrants are biased versus their source countries' food products, and that tourists to
foreign countries may (at least in some cases) develop a taste for the food products of their favourite travel
destinations, then there should be a positive connection between international migration and tourism
activities and the international trade flows of (at least some) food products. For immigration, there are in
theory two effects on food product imports from the source countries of the migrants. First, with rising
immigrant levels in a country (which is assumed to lead to an increase in total population), the total demand
for food will rise, and given the assumed bias in the tastes of the immigrants versus their source countries'
food products, the share of imported food products in totally consumed food will grow as well. Second,
more immigrants in an economy may also lead to an increase of e.g. ethnic restaurants, speciality shops,
stalls on local food produce markets, ethnic cuisine product lines in supermarkets, etc. The food products
supplied via these new channels are likely also to be consumed (at least to some extent) by the local (home)
population. Since the total quantity of food consumed in today's affluent, and population-wise non-growing,
societies may be seen as fixed, these new ethnic food products will therefore substitute locally produced
food. As a consequence, the share of imported food products in totally consumed food rises, too. Thus,

84 2 ANALYSING INTERNATIONAL FOOD PRODUCT MARKETS AT THE AGGREGATE LEVEL
immigrant groups may be seen as catalysts for the change in tastes in the home population. Increased
international tourism activities can be seen as another factor that may alter existing tastes of the home
population. Here, international travel may lead to more contact with new and exotic food products. If it is
assumed that at least some of the tourists wish to consume, back in their home countries, (at least some of)
the products that they have experienced in their favourite holiday destinations, then similarly to the second
effect of immigration above, there may be a positive connection between rising levels of international
tourism and rising shares of foreign food products (i.e. rising levels of imports) in the total consumption of
food products. These theoretical hypotheses have been tested empirically for the case of Germany and the
period from 1967 to 90. In order to control for trends that are commonly present in time series data � and
thus to avoid the problem of spurious correlation � an error-correction model approach has been used. The
empirical results are, as so often in this kind of research, not unambiguous. However, for German
aggregate food imports from India, Thailand, China and Turkey, and for imports of wine, cheese and
processed/preserved vegetables from France and Italy, it may be concluded that migration to Germany and
international travel activities of Germans to these destinations have indeed contributed to rising food
product imports from these countries. In nearly all cases a model including the immigration and tourism
variables improved a purely economic specification � based on income, prices and exchange rates only �
by several measures. The tourism elasticities for individual food products have been found to lie between
one and two in absolute terms. Also, consistent with a priori expectations, they are below unity for
aggregate food imports from the analysed Asian countries. As expected, the estimates of the immigration
elasticities are higher than those for international tourism activities. In some cases, as for imports of drink
wine from France, and of cheese and processing wine from Italy, the immigration elasticities have been
estimated as being well above two in absolute terms. Although these empirical results seem to confirm
theoretical expectations, there is scope for more research. A more systematic empirical effort would start
with a complete database of food product imports and then would try to cluster these products according to
their association with international tourism and migration flows. Then this analysis would look for similar
patterns in different countries in order to arrive at conclusions of whether some ethnic groups are more
likely to engage in activities that make their source countries' food products available in their new home
countries, or whether tourists from some countries are more likely to adopt food products from their
favourite holiday destinations. These research results could be valuable for both international marketing
professionals as for policy makers. Export managers of food processing companies would have effective
information about possible crucial target groups for their market entry strategies. Policy makers may learn
that, for example, promoting tourism into an area could prove to be an effective means for promoting food
industry export success.

2 ANALYSING INTERNATIONAL FOOD PRODUCT MARKETS AT THE AGGREGATE LEVEL 85
2.3.3 Explaining foreign direct investments (FDI) in the food industries
Theoretical analysis of the causes and consequences of FDI51 is in general more scarce than for
international trade. This may be related to the fact that the multinational enterprise (MNE) is a relatively
recent observation in the international economy. However, its appearance is strongly connected with the
process of globalisation and thus FDI has been increasingly researched during the last decades (BURNHAM &
EPPERSON 1998, p.380). Unfortunately, there are still contradictions in the empirical findings and the
picture that emerges is not completely conclusive. However, for some recent work on this subject in the
food industries see e.g. GOPINATH et al. (1999), HENDERSON (1998), BURNHAM & EPPERSON (1998),
ANASTASSOPOULOS & TRAILL (1998), TRAILL (1997), HENDERSON et al. (1996b), REED (1996), REED &
NING (1996), and NING & REED (1995). In the following, the existing theories and empirical findings will be
reviewed and some conclusions will be drawn.
Classification of foreign direct investments can be done twofold. First, (see MARKUSEN 1995,
p.170f.) into horizontal and vertical investments. Horizontal FDI means that the foreign production of
products and services is roughly similar to the those the company produces for its home market and most of
the output of foreign production is sold in the foreign country. In contrast, vertical investment means the
"fragmentation" of the production process geographically, by stages of production. In general, horizontal
direct investment is more important quantitatively (ibid., p.171) and there is no reason to assume that it is
much different for the food industry. Second, depending on the purpose of FDI, this kind of foreign business
activity may be aimed at replacing actively existing exports. Typically this may take place when a foreign
market grows and demand becomes more stable and predictable. Then, a new plant may be set up in the
foreign country and exports will be (partly) replaced by foreign production. On the other hand, there is also
the group of mergers and acquisitions which may take place as related or unrelated investments (GOPINATH
et al. 1999, p.444). 'Related' here means that take-overs are within the core business of the buying
company. For example, a take-over could aim to buy an existing plant and to modify it according to the new
production process instead of building a completely new production facility. In this case the investment
decision may be a substitute for existing exports, too. However, a take-over can also take place in an
unrelated business field, e.g. a packaging or a transport company. These kinds of take-overs may take
place for a variety of reasons, e.g. financial, strategic, etc., and it not clear what effect (substitutive or
complementary) they have on existing exports, if there are such exports at all. Thus, a second classification
seems possible according to the effect that FDI has on existing or potential trade-flows, i.e. whether it is
either substitutive or complementary to them.
A general approach to explain FDI is related to the fact that FDI is part of a process to
efficiently allocate worldwide resources of capital. Global capital stocks should be distributed in a way that
the marginal returns on investment are equal in all countries (LINDERT & PUGEL 1996, p.566f.; KEMP 1990,
p.119). With such an allocation, world welfare would be maximised. However, this original FDI theory may
have more appeal in portfolio investments than in direct investments (NING & REED 1995, p.79).
Nevertheless, for an individual company that intends to engage in FDI the marginal return must be higher
51 In the literature the term direct foreign investment (DFI) is also used instead of foreign direct investment (FDI).

86 2 ANALYSING INTERNATIONAL FOOD PRODUCT MARKETS AT THE AGGREGATE LEVEL
than the one resulting from serving the foreign market with exports, or there must be some other advantage
that outweighs the additional costs of doing business in another country (MARKUSEN 1995, p.173). Thus,
FDI decisions generally follow the economic rationale of an efficient use of existing capital.
The location of food processing companies is, in general, the result of a decision on a principal
trade-off problem between producing close to input markets, i.e. in the countryside near sources of raw farm
products, or near to output markets, i.e. close to the cities and near to consumers. This problem is
sometimes expressed in the law of market area (LOMA), which states that a production plant should be
located where total per unit costs for the whole production and marketing process (including transport costs
for inputs and final products, and economies of scale) are minimised (KOHL & UHLS 1998, p.87f.).52, 53
Thus, one would expect a concentrated production with one single plant in industries where the gains from
economies of scale outweigh the increased transport costs to reach more distant consumer markets. On the
other hand, in industries where transport costs are high, and economies of scale are comparatively small,
one would expect a multiple production plant structure, with subsidiaries producing near consumer markets.
For a decision on FDI versus exports, the problem is similar, however, given the fact that there are "added
costs of doing business in another country, including communications and transport costs, higher costs of
stationing personnel abroad, barriers due to language, customs, and being outside the local business and
government networks" (MARKUSEN 1995, p.173), and other aspects that need to be considered, such as
taxation, protection of intellectual capital in form of patents, or management expertise, etc., the complexity
of the decision may be much greater. Thus, another theoretical framework is needed.
DUNNING's (1988) OLI framework provides such an organising system which names three
conditions that need to be present for a company to have a strong incentive to undertake direct investment:
ownership, location, and internationalisation (see also MARKUSEN 1995, p.173f.). An ownership advantage
for a company could be a special product or a production process, such as a patent, blueprint, or trade
secret. It could also be something intangible, such as a trademark or reputation for quality. Whatever its
form, the ownership advantage confers some valuable market power or cost advantage on the company
52 For a very readable introduction to this topic which sometimes is also called "Spatial Competition", with an application
to restaurants, see FRANK (1997, p. 453-470 and 713-720).
53 In fact, this topic is part of a much larger discussion among industrial organisation economists about the geographical location of not only individual companies but whole industries. That is, as above, should production take place near income-rich consumer markets, which, at a country level would mean within industrialised countries, or should manufacturing be located close to cheap factor markets, which could mean in developing countries. According to HENDERSON (1998, p.125-129) the origin of this theory may be seen in the following problem. As the number of companies in the same industry increases at one location, the profitability of all declines. This, because it can be expected that increased competition in that region's product market drives output prices down and in the factor market it drives input costs up. This traditional convention thus leads to predictions of geographical dispersion. However, new ideas have been incorporated into industrial location theory which suggest that concentration of industries into geographical clusters is often a more likely outcome. One approach is to consider the role of labour mobility. KRUGMAN (1991) showed that companies that locate close to high-income markets may pay higher real wages than those that are located in more distant locations and which have on top additional costs to reach consumers. Consequently, the companies located close to their output markets attract labour inflows, which further enlarge the market. The final result may be that companies concentrate around that market rather than disperse geographically. HENDERSON (1998, p.128) argues that "for the food processing sector, size of the home market appears rather consistently to be one of the chief draws, particularly for the large, multinational companies that dominate this sector. That is, food processing is drawn to nations with relatively large, high-income populations." This finding is, not surprisingly, consistent with what we observe in reality. We know, for example that chocolate production or coffee roasting takes place to a large extent in industrialised countries and not where the crops grow. For margarine or pasta it may be similar. However, for primary food processors, such as vegetable oil mills or producers of fruit & vegetable tins (pineapples, tomatoes, etc.) this may be less true. Thus, product characteristics must be considered, too.

2 ANALYSING INTERNATIONAL FOOD PRODUCT MARKETS AT THE AGGREGATE LEVEL 87
sufficient to outweigh the disadvantages of doing business abroad. Moreover, there must be a location
advantage to be in the foreign market that makes it profitable to produce there rather than to serve the
market via exports. Factors, such as tariffs, quotas, transport costs, and cheap factor prices may be
important, as is better access to customers. Finally, there must be some sort of an internationalisation
advantage. If a company has a superior product or production process and if, due to e.g. tariffs or transport
costs, it is advantageous to produce the product in the foreign market rather than to export it, it is still not
obvious why a company should set up a foreign subsidiary. Alternatively, it could give a license to a foreign
company or just sell the blueprints to it, rather than to go through the costly and risky process of setting up
a foreign production facility. Therefore there must be some special motivations that outweigh these costs
and risks and that is what is referred to as internationalisation advantage. These motivations could for
example be (see MARKUSEN 1995, p.181f.) that monopoly rents, due to the superiority of a special product,
service or production process, are best exploited if the knowledge is kept within the own company.
Moreover, transferring this knowledge to another company, and above all securing its appropriate use by
legal contracts, can be very costly, too.54 Finally, if product or company reputation (e.g. for special quality)
is at stake, a company may prefer to produce by itself rather than run the risk of giving a license to
somebody else. Therefore, a subsidiary may be costly but "secure" (ibid., p.184). TRAILL (1997, p.397)
suggests that internalisation advantages "simply mean that the transaction costs for the firm are lower with
international production than with other market serving forms". He attributes this to a lowered risk and
gives for the food industry the example of the growing importance to control "unmeasurable" aspects of food
quality, such as food safety, production methods, or origin, but which gain increasing weight by consumers.
This view is also supported by HENDERSON (1998, p.130) who argues that especially brand-building in the
food industries forces manufacturers to keep production within the company, which allows the firm to gain
direct control over its supply and thus enables it to more fully protect its brand reputation. In all, the OLI
framework gives some valuable insights in the decision making process of multinational companies but it is
limited in so far as it only considers the conditions necessary for direct investment. Also, it does not offer
very much on the choice of alternatives, such as licensing versus joint venture versus exporting (MARKUSEN
1995, p.174).
Motives of FDI that can be found in the literature are according to TRAILL (1997, p.397):
Resource seeking, i.e. to gain access to raw materials, or to stop competitors having access to them.
Tropical products, such as coffee, tea, cocoa, or oil plants (coconuts, palms, etc.) may be seen as an
example. Market seeking is aimed to find new selling opportunities for a company's products. Efficiency
seeking aims to expand production in order to be able to benefit from economies of scale and scope. Risk
diversification and tax avoidance, i.e. the ability to move the headquarter of the company to a country
where taxation schemes are most favourable, may also fall under this category.55 Strategic asset seeking
can be motivated by gaining access to specialised labour or R&D facilities which may improve the
54 HENDERSON (1998, p.132-134) provides a discussion of the significance of contracts in the US food industries. He
argues that the number of contracts has been increased during the last decades and concludes that contracts are "in many cases efficient means of responding to conditions that give rise to internalisation. Increasingly, these are incomplete contracts, generally taking the form of strategic alliances. This appears to be a harbinger of future organisational form in the [food] sector" (p.134).
55 However, MARKUSEN (1995, p.171) argues that there is little empirical support for the idea that tax avoidance is an important motive for FDI: "Apparently, most companies choose foreign production locations, and then instruct their tax departments to minimise taxes".

88 2 ANALYSING INTERNATIONAL FOOD PRODUCT MARKETS AT THE AGGREGATE LEVEL
competitiveness of all MNEs activities, and not just those in the foreign country. Very often, however, the
motives for an actual FDI decision may overlap, as they are not completely independent of each other. That
is, operating in a new market will also bring some access to new resources and at the same time may
increase the total efficiency of a MNE.
General empirical findings on FDI suggest (see MARKUSEN 1995, pp.170-172, and the studies
cited there), that, among others, (1) FDI has been growing strongly over the last decades and that most of
it is horizontal direct investment among countries with similar per capita incomes, similar relative factor
endowments, and relatively low trade barriers. (2) There are large differences across individual industries in
the degree to which production and sales are accounted by MNEs. (3) FDI seems to be most important in
companies with (i) high level of R&D relative to sales, (ii) a large share of professional and technical worker
in their workforces, (iii) products are new and/or technologically complex, and (iv) high levels of product
differentiation and advertising. (4) Multinationals tend to be companies in which the value of the company's
intangible assets, i.e. market value minus the value of tangible assets such as plant and equipment, are
large. (5) there is some evidence that plant-level scale economies negatively affect FDI. (6) MNE are
usually large corporations and corporate age is important, i.e. the older the company the more likely that
FDI exists. (7) Trade barriers and transport costs can cause a substitution effect toward FDI, although they
may also reduce the level of both investment and trade. To sum up, the strongly growing FDI is mostly
found in companies with important "knowledge capital", i.e. intangible, company-specific assets, and the
share of FDI in total sales, as compared to exports, may rise as tariffs and transport costs increase.
Recent empirical findings specific to the food industries seem to confirm the general results
and offer further interesting details concerning the determinates of FDI in the food manufacturing sector.
GOPINATH et al. (1999) analysed data on foreign activities (exports and foreign sales) of the US processed
food industry in 10 developed countries for the period of 1982-94, using regression analysis, and found that
exports and FDI were indeed substitutes during the examined period. Their study confirmed also, that a
level of per capita GDP equal to the US � as a measure of development level � was a significant factor of
FDI and exports. Furthermore, the results showed that FDI was "protection-jumping" (p.450), as it was
positively connected to the producer subsidy equivalent (PDS), used as a measure for protection in the food
sector of the host country (exports were found to be negatively related to this variable). However, the net
effect of protection was found to be small. HENDERSON et al. (1996b) examined the effects of market
structure on 628 companies with food and/or beverage manufacturing operations, representing 41 countries,
for the years 1987-90. In particular, the researchers were interested in how home market dominance
(measured as a company's home market share, its size, or its price-cost margin), the specialisation into the
food sector (measured by the share of food/beverage sales in total sales), and product diversity (specified as
the number of 3-digit SICs within which a company produces a food or beverage product) affected exports
or FDI. Their regression estimates revealed that (i) a company's dominance in its home market (as
measured by its home market share) was negatively related to exports but positively to FDI. (ii) When
company size was used as a measure for home market dominance, it turned out that smaller companies
engaged more in exports and larger companies more in FDI. (iii) Specialisation of a multi-sector company
into food/beverage products directly enhanced exports but showed no significant impact on FDI. (iv)
Product diversity or differentiation discouraged exports but encouraged FDI. By examining also how the
choice between exports and FDI affected the profitability of the companies, the study found some weak

2 ANALYSING INTERNATIONAL FOOD PRODUCT MARKETS AT THE AGGREGATE LEVEL 89
evidence that FDI increased profits, while exports decreased them. This finding led the researchers to the
conclusion that FDI "is a strategic behaviour in the sense that it is profit-enhancing, and ... the dominance of
FDI relative to exports as an international market strategy for these companies corresponds with relative
profit opportunities" (p.212). NING & REED (1995) investigated locational determinants at the aggregate
market level of US food processors' FDI in six industrialised countries from 1983-89. Their regression
results show that cultural links (i.e. being an English-speaking country) and the membership in a trade bloc
(the EU) were major incentives for US FDI, followed by a strong foreign country currency, fast foreign
market growth, and low taxes. The same researchers (REED & NING 1996) also investigated at the
individual company level, how a company's technological position and its marketing skills affect FDI. In
using a sample of 34 US food processing companies with data from the early 1990s the regression results
reveal that high marketing expenditures, a capital intensive production, and high degrees of product
diversity increased FDI, while high levels of R&D seemed to reduce FDI. This last result stands in contrast to
the general findings for direct investment (see above), however the researchers acknowledge that the
sample is small and biased against larger companies. REED (1996) also investigated the impact of the FDI
advantage of gaining better information about consumers when being close to them with a foreign
subsidiary, the significance of superior management skills, and the effect of economies of scale in
production. By using a bootstrapping resampling mechanism of 100 quarterly observations (1978-92) in
four US food manufacturing industries, the empirical results show that locating companies closer to target
markets indeed provided better consumer data and influenced FDI decisions positively. Economies of scale
were important, too, but superior management skills turned out to be less significant. ANASTASSOPOULOS
& TRAILL (1998), finally, investigated determinants of foreign entry strategies in Greek food industries. In a
Tobit model for eight subsectors over six years (1987-92) the following independent variables were used:
marketing and R&D intensity as measures for ownership advantages, distribution intensity (distribution
expenses as a proportion of sales) as a measure for a location advantage, and "legal intensity" (calculated
as a percentage of legal expenses in sector sales) as an internalisation factor. As dependent variable two
measures were used: first, the subsidiary sales share (i.e. the proportion of Greek domestic sales accounted
for by foreign-owned companies), and the licensed sales share (i.e. the share of licensed sales in total
domestic sales). The regression results show that marketing and legal expenses contributed positively and
were statistically significant (at the 5% level) to subsidiary sales, but R&D expenditures were found,
although with a positive sign, to be an insignificant factor. The distribution intensity variable was estimated
with a negative sign and was statistically significant, indicating that higher distribution costs acted as an
entry barrier to MNEs in Greece.
Conclusions that can be drawn from the empirical findings are the following: (1) FDI clearly
seems to be an option mostly for large companies, i.e. size matters. As we know that in the food industries,
apart from a few "global players" with world-known brands, most companies are rather small or medium-
sized (see Section 2.4.1), it still needs to be shown convincingly that FDI is a real alternative to exports for
most food businesses. (2) The result that R&D levels seem to be unimportant as a determinant for FDI in
the food industries may be explained by the fact that food processing in general is "low-tech" (TRAILL 1997,
p.401), as compared to other industries. There might be some exceptions, such as artificial sweeteners or
other "high-tech foods", but for the vast majority of products this finding is true. Consequently, R&D
expenditures cannot be a significant factor influencing FDI decisions. (3) Marketing efforts seem to be
important, on the other hand. As food products are among the most highly advertised consumer goods, it

90 2 ANALYSING INTERNATIONAL FOOD PRODUCT MARKETS AT THE AGGREGATE LEVEL
seems only logical that companies try to spread their existing marketing costs for brand building and brand
communication over as many countries as possible. There might be an economies of scale effect as well, as
the process of building a brand may be seen as a high fixed cost, and where the result then can, with some
few regional adaptations, be easily transferred to other countries. Together with the need to deliver product
quality as advertised, and with a minimum and stable foreign market size, FDI may then be the more
profitable option. This may help to explain the fact, as to why there are a few very profitable multinational
food companies that have grown enormously during the last decades and which mostly engage in FDI.
However, in order to be able to do so, the food product must be one that is globally acceptable by
consumers, too. As already argued in Section 2.1, these products are very often especially designed,
industrially produced and highly branded products, such as confectionery, soft or alcoholic drinks, instant
coffee, breakfast cereals, etc. (4) The substitution relationship between FDI and exports which was found in
the cited studies may not be as predetermined as the results might suggest. Although at the market level
the majority of transactions may indeed have been of substitutive character, the result only reflects an
overall average. For an individual company one might expect a priori that all options are possible, or as
TRAILL (1997, pp.397-98) put it:
Suppose a firm decides that a market which had previously been supplied by exports, had reached sufficient size that it could be supplied more cheaply by foreign production. Perhaps non-tariff barriers and transport costs were high, economies of scale unimportant � a typical food example. In this case, exports and foreign production are substitutes. Suppose and MNE buys a company in another country simply because it thinks it can make a good profit, based on its ownership advantages. Exports from its home country are unaffected � trade and FDI are independent. This is a typical multi-domestic pattern for foreign participation that has historically typified the food industry. Suppose a firm with market-seeking motives buys a company in a foreign country to gain access to distribution channels for its products. This can lead to an increase in exports from the home country � exports and FDI are positively related. Finally, consider a firm with efficiency-seeking motives that rationalises production by moving to a centre which supplies a region that includes the home country. Then, foreign production not only lowers exports (to zero), it results in imports.
Therefore, although the question of substitution or complementarity of FDI and exports has clearly policy
implications, as labour markets and government tax incomes may be affected, it is less important from a
company or market competitiveness point of view. Depending on the individual company, the industry and
the situation in both, the home and the target country, both strategies can result in profitable outcomes. A
competitive firm will always take the most profitable option and will adapt to changing market conditions.
Restrictions on the mobility of food manufacturing companies, however, may be seen in
government legislation which, in Europe at least, regulate the geographical area in which certain food
products must be produced. In order to control the location of production, special labels, so-called
'Protected Denomination of Origin' (PDO) and 'Protected Geographical Indication' (PGI) are issued (CANALI
1996, p.321). There are labels for cheese, wine, meat products, bakery goods, olive oil, and some other
foods. Traditionally used in Mediterranean countries, such as France, Italy and Spain their significance has
grown over the years. Thus, for example, it has been estimated that in 1992 approximately half (54%) of
the Italian national cheese production was labelled with a denomination of origin sign (ibid., p.319). For the
wine sector the significance is even higher.56 The idea that stands behind these labels is that, in contrast to
56 Originally, in France, the denomination of origin label was issued as a simple sign of reconnaissance and for the
identification of a singularity and not as a quality label. Today, however, it is mostly seen as the latter: a certified and publicly controlled certificate of a certain quality standard (RUFFIEUX & VALCESCHINI 1996, p.142; CANALI 1996, p.321). In Italy, national legislation to regulate denominations of origin was already passed in 1954 (CANALI 1996, p.320), and in France the origin of this idea may be seen in the first legal classification of Bordeaux wine, which took place as early as 1855 (RUFFIEUX & VALCESCHINI 1996, p.134). In Italy, the labels have traditionally been issued, and

2 ANALYSING INTERNATIONAL FOOD PRODUCT MARKETS AT THE AGGREGATE LEVEL 91
conventional Anglo-American economic thinking, it is not believed in the countries which use these labels
that a free market and strong competition will guarantee the existence of manufacturers of food products
which are considered to belong to and to represent local traditions and culture. Therefore, these
governments feel the need to grant special protection to those primarily small and traditional producers, in
order to maintain what is felt to be part of national identity. Thus, a PDO or PGI label can be seen as a
publicly transferred and controlled brand name which allows these producers to compete with the private
brands of large and heavily advertising food companies (YON & BERNAUD 1993, p.120; RUFFIEUX &
VALCESCHINI 1996, p.137, 140; CANALI 1996, p.322). Problems that are seen with this label system are,
that the rigid legislation which regulates in detail the production process may stop producers from innovating
(CANALI 1996, p.323), and that such labels in fact transfer a competitiveness advantage to selected
producers (RUFFIEUX & VALCESCHINI 1996, p.140) which � from an economic point of view � does not
necessarily seem to be justified, especially when these manufacturers do not produce efficiently and thus
may waste valuable resources. However, even if these concepts may seem like being a typical European
affair, in the USA similar strategies have been used in food marketing. CENTNER et al. (1989), e.g. report
that many US commodity commissions and state departments of agriculture have tried to promote the use
of labelling and certification marks to increase the sale of locally grown and processed food products. Some
examples are "Tennessee Certified", "Grown in NY State", and "A Taste of Iowa". Moreover, in the USA, but
also in Australian and New Zealand, food products are, among other goods, subject to what is known as
consumer nationalism, i.e. the patriotic willingness to purchase a domestic product (SKAGGS et al. 1996).
"Australian made and owned" can be found on many Australian food products, and "Buy American" has been
a favourite slogan in numerous consumer campaigns in the US.57 Thus, the location of food processing
does matter, at least for marketing purposes. This leads to the conclusion that food manufacturing
companies, at least the smaller ones, are not as "footloose" in their production location decisions as one
might think. Producers of local foods therefore may wish or are even encouraged by law to produce in the
region. Only the producers of culturally-unbound and non-traditional products, such as the already
mentioned industrially produced food items may really be globally mobile, and thus can engage in FDI. In
short, Coca-Cola or Kraft cheese slices can be produced all over the world, but Bordeaux wine and (real
Italian) Parmesan cheese can only be manufactured in a limited area at France's Atlantic coast and in
their proper use controlled, by specific producer associations ("Consorzi di tutela") (CANALI 1996, p.320), whereas in France these labels are administrated by a government institution (INAO � "Institut National des Applications d'Orgine") (RUFFIEUX & VALCESCHINI 1996, p.142). In 1992, the concept was taken over into EU legislation (No. 2081/92) under the title "Protection of Geographical Indications and Destinations of Origin for Agricultural Products and Foodstuffs" (CANALI 1996, p.320; RUFFIEUX & VALCESCHINI 1996, p.144).
57 In general, having information about the region or the country of origin has been shown to be important for food consumers (see SKAGGS et al. 1996 and the 12 empirical studies cited there). The most important reason that stands behind this fact is that consumers see in the origin information a means of simplifying the processing of the growing information that is connected with the increasing supplies of food items from all over the world (ibid., p.595). With certain country stereotypes (positive as well as negative ones) in their minds, the origin information of a food allows consumers to quickly find out if they may like a food product or not. In fact, there are two theories, that try to explain this consumer behaviour (see ibid., p.594): (1) In the halo model country images affect beliefs about product quality when consumers are unfamiliar with products from a particular country, much like price or brand image can be used to infer something about an unknown product. The structural relationship is from country image to beliefs about product attributes to brand attributes. For example, if a consumer had never tried food products imported from China but had an image of China as a country that uses prison labour to produce exports, it may cause the consumer to question the business ethics and ingredients used to produce food products there. (2) The summary construct model operates such that consumers infer product information directly from country image instead of indirectly through product attributes ratings. Thus, the structural relationship is from beliefs to country image to brand attitudes. For example, consumers may infer from their knowledge of a particular Swiss cheese that all Swiss food products are high quality, thereby supplying all Swiss food exporters a positive externality of the image achieved by cheese manufacturers. To sum up, having origin information may for many consumers be as important as having information on price or brand image.

92 2 ANALYSING INTERNATIONAL FOOD PRODUCT MARKETS AT THE AGGREGATE LEVEL
northern Italy respectively. Therefore, these restrictions on the decisions about where to locate food
processing plants need to be considered too when FDI in the food industries is discussed. This point then
may also be a reason why, in the food industries, large companies are rather multi-domestic than
multinational companies, i.e. instead of producing the same product in different countries, large food
manufacturing companies typically own an international portfolio of nationally produced (and only locally
important) food brands, as TRAILL (1997) and RAMA (1998) claim.
In summary, FDI has been shown to have grown strongly over the last decades, and mostly in its
horizontal form, i.e. complete products are produced and sold in the foreign country. FDI can be seen as
being part of the process to allocate existing global capital stocks efficiently among countries, i.e. in a way
that the marginal returns on investments equalise in each country. The location of food processing
companies can generally been seen as resulting from a decision on the choice between producing near input
markets, i.e. in the countryside near agricultural production, or rather near to output markets, i.e. near the
cities and close to consumers. This trade-off problem is part of a wider discussion about where production in
general is most efficient, with the general rule being, that considering transport costs for inputs as for final
products and economies of scale and scope, production should take place where unit costs for the whole
production and marketing process are minimised for an individual company or an entire industry. FDI
decisions may follow this economic reasoning, but for an individual company other criteria, such as
communication costs, costs of stationing personnel abroad, barriers due to language, customs, taxation, and
protection of intellectual capital may also matter. DUNNING's (1988) OLI framework argues that for an
individual company there must be organisational, locational and internalisational advantages, the sum of
which must outweigh the additional costs and risks of setting up a production or marketing facility in a
foreign country. Empirical findings have shown that these advantages are highest in companies with
important "knowledge capital", i.e. intangible, company-specific assets, such as high R&D inputs, special
brand reputation and important marketing budgets. In the food industries it has been found that R&D
seems to be unimportant as a determinant for FDI decisions, but marketing expenses do matter, as does
company size, i.e. large corporations are more likely to invest directly. Most of food business are, however,
small or medium-sized. With regard to the question of whether FDI is a substitute or a complement for
exports, the findings do rather suggest the former. However, for an individual company both strategies can
be profitable options, depending on the circumstances. Finally, in reality, food manufacturers may not be as
"footloose" as other industries. In Europe (and above all in Mediterranean countries) � and for a number of
traditional food products � legislation exists that regulates the location where food manufacturing must take
place. Special labels, such as Protected Denomination of Origin or Protected Geographical Indication have
been put into place for this purpose. In Anglo-American countries, on the contrary, consumer nationalism,
i.e. the patriotic willingness to purchase a domestic product, is an important issue in food purchasing
decisions, which encourages food manufacturers to produce in their own country. These restrictions need to
be considered when FDI in the food industries is discussed. These restrictions may also be a reason as to
why, in the food industries, large manufacturers are often multi-domestic rather than multinational, i.e. they
own an international portfolio of mostly nationally important brands. It seems therefore, that FDI may only
be a real option for large food manufacturers of industrially produced and culturally-unbound food products.
For the majority of locally operating, small and medium-sized food businesses, exports seem to be the first
and maybe only choice of doing business in foreign markets.

2 ANALYSING INTERNATIONAL FOOD PRODUCT MARKETS AT THE AGGREGATE LEVEL 93
2.3.4 Summary and conclusions
This chapter reviewed existing theories of international trade and foreign direct investment, and discussed
recent empirical findings on international activities in the food industries. Focus has been put on why
international trade of food products is beneficial, and why trade and FDI occur. Traditional trade theory, the
new (strategic) trade theory of intra-industry trade, and economic approaches explaining FDI have been
presented, complemented with PORTER's (1990/98) framework of national competitive advantage.
Furthermore, since all these theories seem only partially applicable to food products, an attempt has been
made to investigate theoretically and empirically the role of foreign demand and the contribution of
international migration and tourism to trade in food products. The following points may summarise the
findings and conclusions of this sub-section.
Benefits from international trade in food products that arise are � apart from the general
gains from trade such as increases in consumption possibilities and in production efficiency due to
specialisation � also specific to this particular market. These special benefits, however, may be largest for
consumers who gain through a greater variety of available food products and, very often, through cheaper
prices. For producers, welfare gains from trade liberalisation are not guaranteed. On the one hand they can
gain access to foreign markets, but on the other hand, there is also the risk that producers may lose
domestic customers to foreign competitors. This is especially true in the food product markets of
industrialised economies where food consumption has become mostly income inelastic. Markets are
saturated because consumers are not hungry anymore and thus, with stagnating population growth, total
demand for calories has stopped to increase. As a consequence, for every foreign food product that comes
on a domestic market, a local product may not be sold. Thus, inefficient producers may be driven out of the
market as a result of increased competition due to international trade. Finally, society as a whole may gain
when peoples move closer together as a result of international trade in food products, which, very often,
may be seen as culturally-bound goods. With each foreign food product that domestic consumers start to
appreciate (e.g. Italian pasta or French wine), mutual understanding may grow and thus risk of conflict
might be reduced.
Traditional trade theory is mainly preoccupied with production side determinants of international
trade and examines how economies actually should trade in order to render the global economy efficient.
However, it is also the most developed theoretical framework which is in particular useful for analysing
issues of trade policy and welfare implications of international trade. Traditional trade theory is based on
the assumption that countries are different in production technology (Ricardo case), or in factor endowments
such as human, physical and financial resources, and the opportunity cost of using these factors to produce
(and to market) several goods (Heckscher-Ohlin case). These differences then give rise to comparative
advantages in production which are seen as the cause of why goods are exported (or at least why they
should be exported). In particular, the Heckscher-Ohlin theorem states that a country will export the
commodity the production of which uses the factor intensively with which a nation is relatively abundantly
endowed. One might argue that food processing or manufacturing, as opposed to agricultural production
which is dependent on arable land resources and on suitable climate, is a comparatively basic industrial
activity which does not in any case depend on a country's resources (take the production of chocolate as an
example) and therefore in which it is difficult to imagine that a single country could develop a strong

94 2 ANALYSING INTERNATIONAL FOOD PRODUCT MARKETS AT THE AGGREGATE LEVEL
comparative production advantage. This is even more so, since food manufacturing is (1) a necessary
human activity which in general has always been located near where people work and live, and (2) it is also
a culturally influenced activity, i.e. the way food products are produced and distributed can be important for
local people. That is, very often not only production efficiency counts but also local traditions and cultural
aspects of food manufacturing. Therefore, it should be clear that standard trade theory may not be able to
provide a complete understanding of what actually happens in international food product markets. However,
this theory may be helpful to understand trade in non-differentiated raw products such as agricultural
commodities. In addition, the theory may also be appropriate when applied to the existing inter-industry
kind of trade in high-value foods such as � typically unbranded � fresh fruit and vegetable, fresh meat and
fish or oils and fats. Furthermore, comparative cost advantage in production may be important for
intermediate products which are used as inputs for further processing/manufacturing in the food industries
and where price may be the most important purchasing factor. For the trade of highly differentiated
consumer food products, however, "world market prices" may not be the major determinant, as non-price
factors such as quality aspects, brand image, pre- and after sales customer service, etc., have become more
and more important. Here another approach is needed to explain existing trade pattern, in particular since
traditional trade theory cannot explain intra-industry trade, but which accounts nowadays for the largest
part in industrialised countries' food product trade.
New trade theory has been developed to explain the phenomena of intra-industry trade, or the
simultaneous exchange of similar goods between countries, which can theoretically and empirically be shown
as occurring mostly between industrialised nations that are similar in their income levels and their factor
endowments. The driving forces behind this kind of trade are seen in (1) economies of scale in production
which allow to minimise per unit production cost by expanding into foreign markets, and (2) product
differentiation, as it is assumed that consumers in general gain utility from higher levels of product variety.
For aggregated global food industries it has been shown empirically that in particular similar per capita
income levels and short transport ways, together with the integration into a free trade area or a common
free market promote intra-industry trade, with the last factor confirming that international food product
trade is mostly of intra-regional character. At the level of individual food industries, however, these few
common factors are not enough to explain the causes for intra-industry trade. Here it has been empirically
demonstrated that industry-specific and related factors are necessary to gain a better understanding of what
determines intra-industry trade in food products. For example, the extent of EU intra-industry trade in dairy
products is influenced by producer and retailer concentration, economies of scales in production and the
availability of raw milk. In general, however, intra-industry trade may also be very much a statistical
phenomenon with the extent of this kind of trade increasing the more aggregated the analysed trade flows
are, and with seasonal effects (harvesting times) causing biases. Thus, even though the concept of intra-
industry trade is a very useful one that expands the understanding of international trade considerably, it
must also � especially in the food industries � be taken with some caution. This is even the more so, as
between similar countries the level and pattern of intra-food industry trade can differ considerably and one
would like to know what driving forces stand behind this.

2 ANALYSING INTERNATIONAL FOOD PRODUCT MARKETS AT THE AGGREGATE LEVEL 95
National competitive advantages were stressed by PORTER (1990/98), who argued that factors
of production in today's internationally integrated economies are increasingly mobile, i.e. in case of a lack
they can be acquired from the world market. That is, he sees factor endowments not as "God-given" and
unchangeable but as manageable in the sense that they are only one input-variable among others, which
are important in order to gain international competitiveness, defined as profitability of industries operating in
international markets. Moreover, there are "factor creation mechanisms" especially for the development and
application of knowledge and intellectual skills which PORTER sees as the real crucial input factors in modern
manufacturing industries. Empirical findings underline the importance of human capital even in the in
general relatively "low-tech" food industries. The second argument which PORTER put forward is that in
international markets, individual companies compete rather than nations. Thus, although a country may
have a comparative advantage in the production of a certain commodity, we know that in reality within the
same industry there are in general competitive companies and non-competitive ones. That is, comparative
advantage in production resulting from relative factor endowments does not necessarily lead to competitive
advantages for every company. There is a whole set of conditions that must be fulfilled in order to gain
success in international markets, such as factor and demand conditions, company strategy and market
structure, supporting industries, and government and chance. Thus, national export performance must be
seen as a multidimensional concept with all determinants being important, and not only factor endowments
or technical features of production such as economies of scale. Criticism of PORTER's theory may be related
to the whole concept of competitiveness. It is a term under which different people understand different
things, i.e. the term is not defined exactly or in a widely accepted way. In particular PORTER's approach to
define competitiveness in relationship with export performance seems not to be free of problems. There
may be industries that are perfectly competitive in terms of profits, market shares and employment levels in
their home markets but which simply do not engage in foreign business activity. Furthermore, for some
industries it may be easier to enter foreign markets than for others. Food products may belong to the latter
group, as these goods are often difficult to transport and as very often they may be culturally-bound
products made for local preferences and consumption habits. Finally, it seems that the whole theory applies
best to the Anglo-American way of doing business, i.e. within large companies that are listed on stock
markets and managed by highly trained professionals. We know however, that, apart form a few well-
known global players, food manufacturers are typically small or medium-sized. Very often they may be
family owned and typically run by the owner who has "hands on" in the production process and who's
company operates mostly in local markets. Therefore, PORTER's strategic management theory for globally
operating industries may only be partly applicable to the large numbers of locally orientated and small-scale
food businesses.
The role of foreign demand and the contribution of international migration and tourism to
international trade in food products, as two factors which potentially influence the (trans-) formation of
tastes in a country, was theoretically and empirically analysed. Although traditional trade theory has
generally focused more on supply side explanations for the causes of international trade, demand side
conditions may be more important for the strongly growing international trade in � often culturally-bound �
food products. If it is assumed that tastes of (at least some) immigrants are biased versus their source
countries' food products and that travellers to foreign countries may (at least in some cases) develop a taste
for the food products of their favourite holiday destinations, then there should be a positive connection
between international migration and tourism activities and international trade flows of (at least some) food

96 2 ANALYSING INTERNATIONAL FOOD PRODUCT MARKETS AT THE AGGREGATE LEVEL
products. For immigration, there are, in theory, two effects on food product imports from the source
countries of the migrants: (1) With rising immigrant levels in a country (which are assumed to lead to an
increase in total population), the total demand for food will rise � and given the assumed bias in the tastes
of the immigrants versus their source countries' food products � the share of imported food products in
totally consumed food will rise, too. (2) More immigrants in an economy may also lead to an increase of
e.g. ethnic restaurants, speciality shops, stalls on local food produce markets, ethnic cuisine product lines in
supermarket shelves. The food products supplied via these new channels are likely to be also consumed (at
least to some extent) by the local (home) population. As the total amount of food consumed in today's
affluent societies may be seen as fixed, these new ethnic food products will therefore substitute locally
produced food. As a consequence, the share of imported food products in totally consumed food rises, too.
Thus, immigrant groups may be seen as catalysts for the change in tastes in the home population.
Increased international tourism activities may be seen as another factor that may alter the existing tastes of
the home population. Here, international travel may lead to more contact with new and exotic food
products. If it is assumed that at least some of the tourists wish to consume � back in their home countries
� (at least some of) the products that they have experienced in their favourite holiday destinations, then
similarly to the second effect of migration above, there may be a positive connection between rising levels of
international tourism and rising shares of foreign food products (i.e. rising levels of imports) in the total
consumption of food products. These theoretical hypotheses have been tested empirically for the case of
Germany during the period from 1967-90. In order to control for trends that are commonly present in time
series data and thus to avoid the problem of spurious correlation, an error-correction model approach has
been used. The empirical results are, as so often in this kind of research, not indisputable. However, for
German aggregate food imports from India, Thailand, China, and Turkey, and for imports of wine, cheese,
and processed/preserved vegetables from France and Italy, it may be concluded that migration to Germany
and international travel activities of Germans to these destinations have indeed contributed to rising food
product imports from these countries. The tourism elasticities for individual food products have been found
to lie between one and two, and � consistent with a priori expectations � they are below unity for
aggregate food imports from the analysed Asian countries. As expected, the estimates of the immigration
elasticities were found to be higher than those for international tourism activities. In some cases, as for
imports of drink wine from France, and of cheese and processing wine from Italy, they have been estimated
as being well above two. These findings may thus complement the other theories of international trade in
food products presented here. Perhaps these demand side effects may describe better the driving forces
that stand behind the rising levels of international trade in food products, at least for those culturally-bound
ones, which are mostly produced by small and medium-sized food manufacturers.
Foreign direct investment (FDI) has been shown to have grown strongly during the last
decades, and mostly in its horizontal form, i.e. complete products are produced and sold in foreign
countries. FDI can be seen as being part of the process to allocate existing global capital stocks efficiently
among countries, i.e. in a way that the marginal returns on investments equalise in each country. The
location of food processing companies can generally been seen as resulting from a decision between
producing near input markets, i.e. in the countryside near agricultural production, or near to output
markets, i.e. near the cities and close to consumers. This trade-off problem is part of a wider discussion
about where production in general is most efficient, with the general rule being that considering transport
costs for inputs and for final products and economies of scale and scope, production should take place where

2 ANALYSING INTERNATIONAL FOOD PRODUCT MARKETS AT THE AGGREGATE LEVEL 97
unit costs for the whole production and marketing process are minimised for a individual company or a
whole industry. FDI decisions consider this economic reasoning, but for an individual company other aspects
such as communication costs, costs of stationing personnel abroad, barriers due to language, customs,
taxation and protection of intellectual capital may also matter. DUNNING's (1988) OLI framework argues
that for an individual company there must be organisational, locational and internalisational advantages the
sum of which must outweigh the additional costs and risks of setting up of a production or marketing facility
in a foreign country. Empirical findings have shown that these advantages are highest in companies with
important "knowledge capital", i.e. intangible, company-specific assets, such as high R&D inputs, special
brand reputation, and important marketing budgets. In the food industries it has been found that R&D
seems to be less important as a determinant for FDI decisions, but marketing expenses do matter, as does
company size, i.e. large corporations are more likely to invest directly. Most food businesses are however
small or medium-sized. Concerning the question, whether FDI is a substitute or a complement for exports,
the findings do rather suggest the former. However, for an individual company both strategies can be
profitable options, depending on the circumstances. Finally, in reality food manufacturers may not be as
"footloose" as other industries. In Europe (above all in the large Mediterranean countries), and for a
number of traditional food products, legislation exists that regulates the location where food manufacturing
must take place. Special labels, such as "Protected Denomination of Origin" and "Protected Geographical
Indication" have been put into place for this purpose. In Anglo-American countries, in the contrary,
consumer nationalism � i.e. the patriotic willingness to purchase a domestic product � are a big issue in
food purchasing decisions, and which encourage food manufacturers to produce in the own country. These
restrictions need to be considered when FDI in the food industries is discussed. It seems therefore that FDI
may only be a real option for large food manufacturers of industrially produced and culturally-unbound food
products. For the majority of locally operating, small and medium-sized food businesses, exports seems to
be the first and maybe only choice for doing business in foreign markets.
In conclusion, it needs to be stressed that: (1) it is important to understand the general idea of
international trade, which is that global production should be organised in a way in which it is most efficient,
and where trade is a necessary component for the distribution of the so-produced goods. That is, wheat
growing should take place where it is most cost effective, and so should timber cutting, or steel production.
Nations would then specialise and exchange goods among each other, rather than each country starting to
produce all goods by itself. However, many modern industrial activities, such as car making or TV set
production can in fact be done in many countries, as material inputs can be required from world markets
and labour is available everywhere, even though wage rates may differ. However, in today's affluent
societies, where available income generally does not restrict the existence of tastes and preferences, prices
(i.e. production costs) may not be the decisive factor anymore. There are enough people who can afford a
Mercedes, and many may prefer a stylish home stereo colour TV with remote control to a black and white
set, even if the former may be triple the price or more. Consumers have gained more choice through
international trade, and � as more variety seems to be welfare-enhancing by itself � trade can thus be
composed of a whole spectrum from low cost to high quality suppliers. Therefore, international trade has
changed from its one-way form to the two-way exchange of similar goods. However, the fact that in today's
international markets many determinants matter, does not mean that today's production is necessary
inefficient. On the contrary, companies try to gain comparative production advantage for example through
exploiting economies of scale and scope. Where transport costs exceed these gains, a foreign subsidiary

98 2 ANALYSING INTERNATIONAL FOOD PRODUCT MARKETS AT THE AGGREGATE LEVEL
may be set up. In contrast to immobile nations, individual companies have many options to serve foreign
markets, and thus to become or to stay competitive. The economic (and export) performance of a nation is,
after all, only the sum of its companies' achievements. Similar companies may be aggregated into individual
industries, but it should have become clear that international trade needs to be discussed at the company
and industry level and not at a country level, as company and industry specific factors almost always
influence the extent and pattern of trade. Therefore, the next section, in comparing the food industries
intersectorally and internationally, will discuss the economic structure, i.e. production and marketing
determinants, together with other factors that may influence international trade in food products.
(2) Trade in modern consumer food products seems to fit uncomfortably in the context of production-based,
traditional trade theory. As most consumers may not eat wheat but Italian pasta, Chinese noodles, French
bread, Danish pastry, or German wheat beer, the price of wheat may even be unimportant. Clearly, food
producers will always look for cheap inputs, in order to maximise their profits, thus favouring low-cost
suppliers. Therefore, traditional thinking is important in industrial input markets, and food processing/
manufacturing is dependent on material inputs. However, consumers may want a particular brand, or a
special quality, they may be concerned about how a food product is produced, or where it comes from, and
many consumers may be willing to pay a premium for these features and thus accept a product price that is
higher than a low-cost alternative. That is, international trade in final consumer products can be seen as
much more complex than the comparative production advantage approach which may determine input
markets. Thus, due to the importance of non-price factors, foreign markets may be seen now as
increasingly open for producers who can deliver a special quality (e.g. Black Angus beef), a better service
(e.g. customer information phone line) or a fancy brand image (e.g. Mexican beer). Therefore, the focus on
trade-determining factors, at least for food products, may have shifted from production factors to
consumption determinants. Perhaps a point that international economists may still have to learn from
export marketing specialists. In order to explore these consumption-based forces more deeply, the next
section will also explore the mechanics of modern international food consumption and its contribution to
international trade in consumer food products.

2 ANALYSING INTERNATIONAL FOOD PRODUCT MARKETS AT THE AGGREGATE LEVEL 99
2.4 The economic structure of the international food industry and food consumption in the
21st century
This section explores the determinants of international trade in food and drink products on the production
and the consumption side. First, the production structure of food industries in different western countries at
the turn of the millennium will be discussed and it will be argued that food and drink processing/
manufacturing is particular in many ways in comparison to other industrial manufacturing activities. As a
consequence, food and drink industries may be structurally much less suited to international marketing
activities than other non-food industries. Second, modern international food consumption will be explored,
and a dynamic food consumption model, specified as a utility accumulation approach, will be presented. As
it becomes clear, the desire of modern consumers for a multi-dimensionally optimised diet drives
international food consumption convergence tendencies. But as in fact different products may be suitable
for optimising ever more internationally similar objective functions, regionally different food consumption
patterns will still exist in the future.
2.4.1 The economic structure of the international food industry
A worldwide comparison of the economic structure of food and drink processing/manufacturing is
important for the analysis of underlying forces that determine success in international food markets. As
many of the theories trying to explain international trade make specific assumptions on sector and industry
characteristics (as e.g. input dependence, cost structure, economies of scale, size of companies, specific
trade and investment barriers, etc.) a review of relevant facts is presented in the following.
The food processing industry is part of the traditional � secondary � manufacturing sector. A
good description of industrialised countries' food and beverage processing/manufacturing activities is
provided by KOHLS & UHL (1998, p.85):
The food processing industry today can be divided into two sectors: (1) a dominant core that consists of a few very large companies producing well-known brands and accounting for a significant share of industry sales, and (2) a competitive fringe that consists of a large number of smaller companies producing less well-known brands accounting for a small share of industry sales.
The following pages will illustrate and expand this characterisation. Data will be provided for the EU and US
food and drink sector, and more detailed information will be given for German and Australian food and drink
processing/manufacturing industries. Also, financial data on the world's 50 largest food and drink
corporations will be presented, and the significance of trade barriers in international food and drink markets
will be discussed.

100 2 ANALYSING INTERNATIONAL FOOD PRODUCT MARKETS AT THE AGGREGATE LEVEL
2.4.1.1 Size and significance of food manufacturing in the economy
The European food, drink and tobacco sector employed slightly more than 3.7 million people in 1996,
i.e. a little more than 3% of the total EU-15 workforce (EUROSTAT 2001, p.33). Turnover of this sector
accounted for more than 4% of the total business turnover in the European Union (ibid.). Food
manufacturing activities dominate this sector, with the tobacco industry accounting for between 7% and 8%
of total production and the beverage industry accounting for about 15% of total production (EUROSTAT
2000, p.103). As food sub-sectors, other food products accounted for 22% of the total food, drink and
tobacco production value, production, processing and preserving of meat and meat products 18%, and the
manufacture of dairy products 15% (ibid.). The share of the food, drink and tobacco sector in total EU
manufacturing activities was 16.2% in 1996, as measured in production value, but only 11.4% in terms of
value-added (ibid.). Table 24 gives an overview of EU-15 food, drink and tobacco manufacturing and of its
member countries. These figures include all food, drink and tobacco manufacturing enterprises, i.e. also
small food trades, such as bakeries, butchers, fishmongers etc. As it becomes clear, almost 60% of all EU
food enterprises employ less than 250 staff and can thus be considered as small and medium sized
enterprises. For the EU-15, the average number of employees per company is therefore just below 13, with
only the Northern European countries United Kingdom, the Netherlands, Denmark, and Norway showing
significantly higher average staff per company levels. The mean EU-15 turnover per company is about
US$2m, with the United Kingdom, Denmark and Norway having significant above average turnover per
company levels. However, when turnover is calculated on a per employee basis, Belgium and Germany lead
the field, surpassing the EU-15 average of US$158 000 significantly. In all, it becomes clear that food, drink
and tobacco processing/manufacturing in most of the EU countries is still a very low-scale activity,
performed mainly by small and medium sized companies.
Table 24: Economic structure of EU food, drink and tobacco sector*, 1996
Total employment and size classes� (in %) Country
No. of firms
Turnover (US$m) Total no. 0 1-9 10-49 50-249 250+
Average no. of employ. per firm
Turnover per firm (US$m)
Turnover per employee (US$'000)
EU-15 293 662 584 991 3 707 282 2.2 19.4 19.8 18.3 40.3 12.6 2.0 158
D 54 840 168 388 875 041 0.4 18.8 24.3 16.7 39.7 16.0 3.0 192
F 67 067 - 649 015 3.9 26.8 18.9 18.4 32.1 9.7 - -
UK 16 081 58 895 504 188 1.9 3.5 8.5 - - 31.4 3.7 117
I 70 005 72 255 440 220 3.3 35.3 22.6 17.4 21.4 6.3 1.0 164
E 58 298 51 376 398 195 4.0 20.7 - 21.8 - 6.8 0.9 129
NL 5 625 - 213 659 0.7 11.9 11.7 - - 38.0 - -
B 10 507 21 190 106 804 6.2 23.5 20.1 17.4 32.9 10.2 2.0 198
DK 2 173 16 126 92 365 0.6 - 13.1 16.4 - 42.5 7.4 175
NO 1 951 9 627 53 555 0.0 6.6 20.3 22.3 50.8 27.5 4.9 180
IS 655 - 9 037 0.9 10.5 32.9 17.4 37.2 13.8 - -
P 11 280 - - 0.4 19.2 28.6 - - - - -
FIN 1 925 - - 1.2 6.4 12.8 - - - - -
S 1 864 - - 1.1 7.4 12.7 - - - - -
A 4 678 - - 0.6 18.5 28.2 - - - - -
Notes: *As measured by production, the tobacco industry accounted for between 7% and 8% of total production in this year, and the beverage industry accounted for almost 15% of the total. �Average no. of employees per company in %. Data includes all food/beverage enterprises in Europe, i.e. also small food trades such as bakeries, butchers, fishmongers, etc. ECU have been converted into US$ using as exchange rate: ECU1=US$0.7987.
Sources: EUROSTAT, Enterprises in Europe 6th Report, 2001, p.33; EUROSTAT, Panorama of European Business, 2000, p.103; Author's calculations.
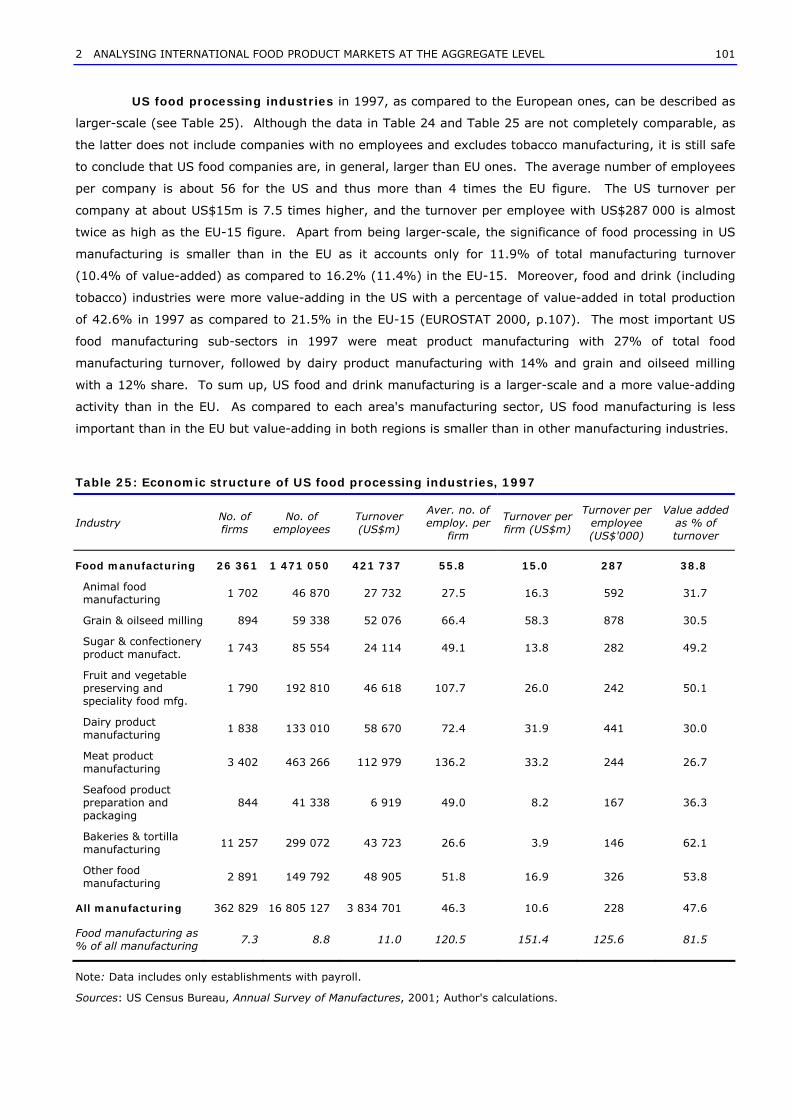
2 ANALYSING INTERNATIONAL FOOD PRODUCT MARKETS AT THE AGGREGATE LEVEL 101
US food processing industries in 1997, as compared to the European ones, can be described as
larger-scale (see Table 25). Although the data in Table 24 and Table 25 are not completely comparable, as
the latter does not include companies with no employees and excludes tobacco manufacturing, it is still safe
to conclude that US food companies are, in general, larger than EU ones. The average number of employees
per company is about 56 for the US and thus more than 4 times the EU figure. The US turnover per
company at about US$15m is 7.5 times higher, and the turnover per employee with US$287 000 is almost
twice as high as the EU-15 figure. Apart from being larger-scale, the significance of food processing in US
manufacturing is smaller than in the EU as it accounts only for 11.9% of total manufacturing turnover
(10.4% of value-added) as compared to 16.2% (11.4%) in the EU-15. Moreover, food and drink (including
tobacco) industries were more value-adding in the US with a percentage of value-added in total production
of 42.6% in 1997 as compared to 21.5% in the EU-15 (EUROSTAT 2000, p.107). The most important US
food manufacturing sub-sectors in 1997 were meat product manufacturing with 27% of total food
manufacturing turnover, followed by dairy product manufacturing with 14% and grain and oilseed milling
with a 12% share. To sum up, US food and drink manufacturing is a larger-scale and a more value-adding
activity than in the EU. As compared to each area's manufacturing sector, US food manufacturing is less
important than in the EU but value-adding in both regions is smaller than in other manufacturing industries.
Table 25: Economic structure of US food processing industries, 1997
Industry No. of firms
No. of employees
Turnover (US$m)
Aver. no. of employ. per
firm
Turnover per firm (US$m)
Turnover per employee (US$'000)
Value added as % of turnover
Food manufacturing 26 361 1 471 050 421 737 55.8 15.0 287 38.8
Animal food manufacturing
1 702 46 870 27 732 27.5 16.3 592 31.7
Grain & oilseed milling 894 59 338 52 076 66.4 58.3 878 30.5
Sugar & confectionery product manufact.
1 743 85 554 24 114 49.1 13.8 282 49.2
Fruit and vegetable preserving and speciality food mfg.
1 790 192 810 46 618 107.7 26.0 242 50.1
Dairy product manufacturing
1 838 133 010 58 670 72.4 31.9 441 30.0
Meat product manufacturing
3 402 463 266 112 979 136.2 33.2 244 26.7
Seafood product preparation and packaging
844 41 338 6 919 49.0 8.2 167 36.3
Bakeries & tortilla manufacturing
11 257 299 072 43 723 26.6 3.9 146 62.1
Other food manufacturing
2 891 149 792 48 905 51.8 16.9 326 53.8
All manufacturing 362 829 16 805 127 3 834 701 46.3 10.6 228 47.6
Food manufacturing as % of all manufacturing
7.3 8.8 11.0 120.5 151.4 125.6 81.5
Note: Data includes only establishments with payroll.
Sources: US Census Bureau, Annual Survey of Manufactures, 2001; Author's calculations.

102 2 ANALYSING INTERNATIONAL FOOD PRODUCT MARKETS AT THE AGGREGATE LEVEL
German food processing industries' structural economic data in 1998 is provided in Table 26.
The figures exclude small food trades, i.e. they reflect only industrial manufacturing activities of companies
with more than 20 employees. Thus, the data is not directly comparable to the one of Table 24. This fact
explains the relatively high employee per company ratio of 118 for total food and beverage manufacturing,
ranging from 87 for fresh bakery products to 969 for ice cream production. However, even with this focus,
the German food and beverage industry is still organised on a smaller-scale than the overall German
manufacturing sector, employing an average number of 170 people per company. Turnover per company
for the average food/drink plant of almost US$27m was only about 77% of the total manufacturing figure.
Turnover per employee was about 10% higher than the figure for total manufacturing, but value-added as
percent of turnover was only about 70% of the total manufacturing value. Thus, German food and beverage
manufacturing generally takes place in relatively smaller companies with smaller gross profits but higher
labour productivity levels relative to the manufacturing sector. As compared to the US situation, it is
striking how much lower German food and drink industry gross profits were (18% versus 39%), despite
almost the same level of labour productivity. The most important German sub-sectors in 1998 were
beverages with 19% of total food and beverages turnover (beer alone accounting for 8%), milk processing
16%, meat processing 10%, and confectionery 8%. Between 1995 and 1998 beverage industries generally
experienced negative growth, as did coffee roasting and tea packaging, sugar, starch products and cereal
foods, ice cream manufacturing and seafood processing. The industries, which grew most during that period
were fresh bakery products, meat processing, and fruit and vegetables.
The Australian food processing industry's economic structure in 1998/99 (financial year) is
presented in Table 27. Judging by the average employee per company ratio the Australian food and
beverage industry appears similar to its US equivalent (49 people as compared to 56). However, all other
structural measures are much lower and are in fact in between EU and US levels: the Australian turnover per
company of about US$9m is only 60% of the US figure (EU-15: US$2m), the turnover per employee of
US$186 000 is 65% of the US figure (EU-15: US$158 000), and the value-added as percent of turnover at
28.0% is just 72% of the equivalent US value. In comparing Australian food and beverage manufacturing to
its national manufacturing industries' average the same structural pattern as in the USA appears: in general
food processing companies are larger than the average manufacturing plant as measured by the employee
per company (2.6 times larger) and the turnover per company (3.2 times larger) ratio. Also, the turnover
per employee figure is accordingly higher as compared to the total manufacturing average, but the value-
added is considerably lower. Once again it becomes clear that food and beverage manufacturing is an
economic activity with a comparatively high level of labour productivity and a relatively low gross margin.
The most important sub-sectors in the Australian food and beverage industry in 1998/99 were meat
processing with a 14% share of total industry turnover, followed by other dairy products with 9%, and fruit
and vegetables with 7%. That is, the Australian food and beverage industry is structurally positioned in
between the small-scale, low value-adding European food and drink industry and the large-scale and high
value-adding US one.

Table 26: Economic structure of the German food processing industry, 1998
No. of firms
∆ 95-98 (%)*
Employ-ees
∆ 95-98 (%)*
Turnover (US$m)
∆ 95-98 (%)*
Industry valueadded (US$m)
∆ 95-98 (%)*
Employees per firm
Turnover per firm (US$m)
Turnover per employee (US$ '000)
Val. add. as % of turnover
Meat and seafood Meat processing 914 8.0 83 053 3.3 12 469 3.1 2 936 19.4 91 13.6 150 23.5 Seafood processing 62 -21.5 8 648 -27.8 1 768 -17.8 323 -19.1 139 28.5 205 18.3
Dairy Milk processing 187 -10.1 36 228 -9.6 20 594 3.6 1 794 -3.2 194 110.1 569 8.7 Ice cream 7 -12.5 6 780 -36.5 1 481 -29.6 295 -39.5 969 211.6 218 19.9
Fruit and vegetables 213 1.9 26 692 5.2 6 691 13.8 1 115 5.7 125 31.4 251 16.7
Oil and fat 26 -10.3 7 843 -27.8 5 832 10.7 472 -19.8 302 224.3 744 8.1
Starch products and cereal food Starch and starch products 9 -30.8 2 692 -4.6 1 006 -3.8 173 -8.0 299 111.7 374 17.2 Pasta 29 -9.4 2 878 -36.0 594 -21.6 95 -43.9 99 20.5 206 16.0
Bakery products Fresh bakery products 2 003 62.7 173 620 47.4 9 686 34.9 4 495 47.8 87 4.8 56 46.4 Long shelf-life bakery products 84 -13.4 19 930 -4.6 2 841 6.7 671 -3.0 237 33.8 143 23.6
Other food Sugar 12 -14.3 7 470 -20.2 3 790 -0.3 539 -14.7 623 315.8 507 14.2 Confectionery 133 -5.0 33 612 -7.3 10 000 24.4 1 977 25.1 253 75.2 298 19.8 Coffee roasting, tea packaging 31 -18.4 4 603 -23.8 2 886 -39.1 419 -0.1 148 93.1 627 14.5 Spices and sauces 54 8.0 23 834 2.6 5 828 11.2 1 143 -0.1 441 107.9 245 19.6 Dietetic food 11 57.1 2 811 -5.2 813 17.9 147 -4.2 256 73.9 289 18.0 Food nec 86 2.4 15 342 1.2 3 570 18.8 879 12.4 178 41.5 233 24.6
Beverages Spirits 58 -31.0 5 122 -29.6 3 949 -16.5 242 -56.1 88 68.1 771 6.1 Wine 28 -17.6 2 635 -14.2 1 598 18.5 203 34.5 94 57.1 607 34.0 Beer 360 -9.8 41 062 -13.2 10 698 -4.1 2 597 -5.9 114 29.7 261 24.3 Mineral water, soft drinks 153 -11.0 27 027 2.8 7 163 -3.9 1 537 4.3 177 46.8 265 21.5 Total beverages 628 -12.8 77 308 -9.5 24 032 -5.0 4 659 -6.6 123 38.3 311 19.4
Total food and beverages 4 854 16.3 574 560 5.0 129 827 3.9 23 817 5.9 118 26.7 226 18.3
Total manufacturing industry 37 586 0.5 6 379 319 -4.4 1 313 302 11.0 344 018 7.3 170 34.9 206 26.2
Share of food/beverage industry in total manufacturing industry (%)
12.9 15.8 9.0 9.8 9.9 -6.4 6.9 -1.3 69.7 76.5 109.8 70.0
Notes: *Total change between 1995 and 98 in %. Data covers only firms with 20 and more employees. Monetary values converted, using as exchange rate DM1=US$0.5683
Sources: Statistisches Bundesamt (German Bureau of Statistics), Fachserie 4.3, various issues; Author's calculations
2 A
NALY
SIN
G IN
TERN
ATIO
NAL FO
OD
PRO
DU
CT M
ARKETS A
T T
HE A
GG
REG
ATE LE
VEL
103

Table 27: Economic structure of the Australian food processing industry, 1998/99*
No. of firms
Employees ('000)
Turnover (US$m)
Wages/salaries (US$m)
Value added (US$m)
Employees per firm
Wage/salary per employee
Turnover per firm (US$m)
Turnover per employee
Val. add. as % of turnover
Meat 551 51 6 700 1 038 1 665 93 20 351 12.2 131 381 24.9 Meat processing 279 30 4 310 636 975 108 21 189 15.4 143 656 22.6 Poultry processing 136 13 1 509 260 427 96 20 032 11.1 116 088 28.3 Bacon, ham and small goods 136 8 881 142 263 59 17 727 6.5 110 126 29.8
Dairy 211 17 4 925 473 1 040 81 27 831 23.3 289 720 21.1 Milk and cream processing 39 6 1 756 173 374 154 28 760 45.0 292 624 21.3 Ice cream 72 3 433 70 128 42 23 218 6.0 144 325 29.6 Other dairy products 100 8 2 737 231 538 80 28 865 27.4 342 144 19.6
Fruit and vegetables 264 11 2 216 280 580 42 25 442 8.4 201 485 26.2
Oil and fat 52 2 658 53 141 38 26 669 12.6 328 810 21.5
Flour mill and cereal food 225 8 2 109 194 594 36 24 237 9.4 263 628 28.1 Flour mill products 42 2 799 65 174 48 32 316 19.0 399 404 21.8 Cereal food and baking mixes 183 6 1 311 129 420 33 21 544 7.2 218 475 32.0
Bakery products 675 23 2 140 490 865 34 21 308 3.2 93 061 40.4 Bread 58 9 821 233 298 155 25 867 14.2 91 266 36.3 Cakes and pastry products 606 9 672 161 243 15 17 849 1.1 74 673 36.2 Biscuits 11 5 647 97 323 455 19 327 58.8 129 391 50.0
Other food 941 36 6 748 856 1 842 38 23 775 7.2 187 431 27.3 Sugar 22 7 1 556 163 373 318 23 307 70.7 222 225 24.0 Confectionery 123 6 922 166 387 49 27 610 7.5 153 633 41.9 Seafood 126 4 697 63 122 32 15 688 5.5 174 288 17.6 Prepared animal and bird feed 169 4 1 599 117 326 24 29 179 9.5 399 874 20.4 Food nec 501 15 1 973 348 634 30 23 218 3.9 131 566 32.1
Beverage and malt 471 18 5 412 444 1 929 38 24 647 11.5 300 642 35.6 Soft drink, cordial and syrup 101 6 1 625 165 506 59 27 505 16.1 270 766 31.2 Beer and malt 40 3 1 580 104 560 75 34 513 39.5 526 682 35.4 Wine 312 9 2 085 168 832 29 18 686 6.7 231 687 39.9 Spirits 18 0 121 6 31 0 - 6.7 - 25.9
Total food and beverages 3 390 166 30 908 3 827 8 656 49 23 055 9.1 186 194 28.0
Total manufacturing industry 48 951 937 139 653 22 025 42 856 19 23 495 2.9 148 979 30.7
Share of food/beverage industry in total manufacturing (%) 6.9 17.7 22.1 17.4 20.2 255.7 98.1 319.6 125.0 91.3
Notes: *Financial year ending June 30. Monetary values converted, using as exchange rate A$1=US$0.6275. nec = not elsewhere classfied.
Sources: ABARE (2001), Australian Food Statistics 2001; ABS (2001), Manufacturing Industry, Australia; Author's calculations.
104
2 A
NALY
SIN
G IN
TERN
ATIO
NAL FO
OD
PRO
DU
CT M
ARKETS A
T T
HE A
GG
REG
ATE LE
VEL

2 ANALYSING INTERNATIONAL FOOD PRODUCT MARKETS AT THE AGGREGATE LEVEL 105
In summary, the comparison of food and beverage industries of the EU-15, the US, Germany, and
Australia reveals that in Europe this economic activity takes place in comparatively small production plants
and that its value-adding is considerably lower than in the US. The Australian food and beverage industries
lie in between these two extremes. When food and beverage manufacturing is compared to the overall
manufacturing industries' average � as measured by the employee per company and the turnover per
company ratios � it becomes clear that food and beverage plants in the EU-15 are usually smaller than
average manufacturing plants, but in the US they are larger than this benchmark. In all three continents
turnover per employee are usually higher than the all manufacturing average, implying higher labour
productivity levels. On the other hand, gross profits, i.e. the value-added, are in all three continents
considerably lower in comparison to the all manufacturing figure. Although it seems that economies of scale
and productivity in food and beverage processing should be investigated in more detail, it already becomes
clear that this industry seems structurally to be a high-volume, low-margin one.
2.4.1.2 Productivity and economies of size
This sub-section explores the significance of total factor productivity and of economies of scale, scope and
experience in the food industries. Empirical evidence from recent studies is provided in order to illustrate
these aspects.
The contribution of total factor productivity (TFP), real price effects, and inputs to the real
value of output of the US food processing sector were calculated by GOPINATH et al. (1996). The
researchers used the envelope properties of a sectoral gross domestic product (GDP) function and the
Quadratic Approximation Lemma of Diewert. The application of this lemma to the US food processing GDP
function, using data for the period 1959-91, permitted the researchers to quantify the effects of real prices,
material inputs, and TFP effects on US food processing sector's GDP growth.58 Their results show that the
major factor contributing to growth in food processing GDP (1.04% annually during the period 1959-91)
were input effects, with material inputs (including among others, primary agricultural products) accounting
for almost all this growth. However, a 0.83% decline in real price of sectoral output offset the contribution
from other inputs to that growth. Increases in TFP were relatively low, at 0.41% per annum compared to
0.47% for the economy as a whole and 2.31% for primary agriculture (ibid., p.1055). By using a Hodrick-
Prescott filter for separating the calculated TFP time series from the noise of unanticipated effects (such as
e.g. weather influences), the researches found a declining trend for the contribution of total factor
productivity to the growth of food processing industry's output. Figure 16 illustrates the declining
contribution of TFP during the period 1959-1991 and Table 28 summarises the main findings.
58 In fact, a constant-returns-to-scale or vintage production function was maximised subject to input restrictions. The
derived Langrangian multipliers represented shadow prices for sector-specific and economy wide inputs (GOPINATH et al. 1996, p.1045).

106 2 ANALYSING INTERNATIONAL FOOD PRODUCT MARKETS AT THE AGGREGATE LEVEL
Figure 16: Filtered TFP growth rates in US food processing, 1959-1991
0.3
0.4
0.5
0.6
0.7
0.8
0.9
1959 1963 1967 1971 1975 1979 1983 1987 1991
Year
Filter
ed T
FP G
row
th R
ates
(%
)
Source: GOPINATH M., ROE T.L. & SHANE M.D. (1996), 'Competitiveness of US Food Processing: Benefits from Primary Agriculture', in American Journal of Agricultural Economics, 78, pp.1044-1055.
Table 28: Components of US food processing growth (%), 1959-1991
GDP Growth Real Price Effect* Input Contribution** TFP Growth
1959-91
Average 1.04 -0.83 1.46 0.41 Std. Devn. 3.14 3.27 1.78 1.05
1959-63 1.05 -1.79 1.84 1.00
1964-68 1.61 -1.03 2.34 0.34
1969-73 3.52 1.54 1.46 0.52
1974-78 1.84 -0.51 2.64 -0.29
1979-83 -1.46 -2.27 -0.09 0.90
1984-88 0.78 -1.15 1.14 0.79
1989-91 -0.64 -0.94 0.59 -0.29
Notes: * The real price effect is the sum of the price effects from crops (-0.21%), grains (-0.14%), dairy (-0.13 %), and meat prices (-0.36%), the latest contributing most on average during the whole period.
** The input effect is aggregated from the individual effects of labour (-0.06%), capital (0.49%), energy (0.02%), and material effects (1.01%), the latest contributing most on average during the whole period to the combined input effect. For more details see source.
Source: GOPINATH M., ROE T.L. & SHANE M.D. (1996), 'Competitiveness of US Food Processing: Benefits from Primary Agriculture', in American Journal of Agricultural Economics, 78, pp.1044-1055.
In conclusion, it becomes clear that food and drink processing/manufacturing may be a
comparatively mature economic activity, which is performed in today's industrialised countries in already
almost optimal production conditions. Technical progress can therefore be seen as slow which is reflected in
low TFP growth rates. However, the above findings apply only to the US economy, and as seen before,
Australian and in particular EU food and drink industries are much smaller-scale and probably less
industrialised than US food processing plants. Therefore there may still be more scope for technical

2 ANALYSING INTERNATIONAL FOOD PRODUCT MARKETS AT THE AGGREGATE LEVEL 107
improvements and production productivity growth in these continents. 59 Besides, from the data presented
it is still not clear whether, as compared to other sectors, food and drink processing/manufacturing is a
labour intensive or rather a capital intensive industry. CONNOR & SCHICK (1997) claim that food processing
is "a relatively labour-extensive manufacturing activity" (p.3) and rank the industry among the leading
manufacturing industries in the amount of physical assets available per employee. This may be underlined
by the above finding of greater than average turnover per employee ratios reflecting high machinery, i.e.
capital use in the food and drink processing/manufacturing industry. But as before, this finding may apply
mainly to the highly industrialised, large-scale US food and drink processing/manufacturing industry.
Moreover, as the "food industry is far from homogenous" (TRAILL 1997, p.401), there may be large
differences with respect of capital utilisation in the different sub-sectors.
Economies of scale, scope and experience (or, in short, economies of size) are concepts that
need to be discussed first before the significance of these effects in the food processing/manufacturing
industries can be explored. Economies of scale are defined as reductions in average unit costs due to
increases in the scale of output (PRATTEN 1991, p.13). Another way of saying this is that economies of
scale exist if total costs rise less proportionately than output (BALASUBRAMANYAM & SALISU 1994, p.63).
Economies of scope arise when the production of two or more products reduces unit costs compared to the
situation where each product is produced separately, i.e. the cost of producing a number of products jointly
is less than the total cost of separate production of each of the products (PRATTEN 1991, p.15). Economies
of experience (or learning curve effects) arise from long-term production cycles through learning, i.e. unit
costs fall with cumulative output over time (ibid., p.18). Whereas economies of scale occur because a
company increases its output, economies of experience can be realised when a company produces at a
constant output level for a long period of time. Then unit costs may fall due to increases in production
efficiency through the creation of know-how. Sources for economies of size are indivisibilities of production
factors, increased dimensions, specialisation, massed resources, more efficient organisation, learning
effects, and/or vertical integration (ibid.).60 Minimum efficient size (MES), finally, is defined as the scale of
59 On the other hand, it is not sure whether in particular European consumers would accept the highly-industrialised US
food manufacturing style, as the conflicts between the US and the EU on e.g. the use of growth hormones in meat production or the adverse positions of both continents on genetically modified foods show. Also, the worldwide emergence and growing significance of organic food as an alternative to industrially produced groceries (see LOHR 2001 for and a good overview) make it unlikely that large-scale mass produced consumer food products will be the only or main form of food supply of the future (see Section 2.4.2 for a more detailed discussion of this topic).
60 Indivisibilities of input factors, such as e.g. machines which can only produce within a certain output level range, demand an optimal output level at which input factors can be used most efficiently. Investments in Research and development or certain overhead administration costs belong also into this category. As fixed costs, they rise only stepwise with output. While staying on the same level, higher output levels will result in lower unit costs, i.e. in economies of scale. Increased dimensions of production result usually in lower unit initial and operating costs due to inherent technical properties. For example, the material needed per volume unit of a water tank decreases as the tank's cubic capacity rises. In addition, proportionally fewer parts may be needed for its construction. In cooking, the preparation of a meal for six people takes longer than for two people, but usually it does not take 3 times as long. Specialisation of the labour force or of capital equipment as result of higher output levels will usually result in higher productivity and thus in economies of scale. Massed resources result e.g. in proportionally lower stock keeping costs or reduced production risks. For example, a food manufacturer who runs several identical processing machines needs to stock proportionally fewer spare parts than a manufacturer who uses only one machine since it is unlikely that all machines develop the same faults at the same time. Also, a company with a large customer base is less vulnerable against a sudden loss of a few customers. A more efficient organisation may in some cases be achieved at higher output levels. For example, in industrial baking continuous baking ovens can only be used from certain output levels on, leaving small bakers using traditional ovens with significant cost disadvantages. Learning effects are the main reason for economies of experience (see text above). Vertical integration possibilities arising from larger company sizes may involve e.g. the starting of in-company processing of inputs which may technical efficiencies to be gained. Thus, in certain cases these integration activities may result in overall lower unit costs as compared to a more specialised, small-

108 2 ANALYSING INTERNATIONAL FOOD PRODUCT MARKETS AT THE AGGREGATE LEVEL
production at which unit costs cease to fall, which means in practice the output level at which costs cease to
fall rapidly rather than the level at which they cease to fall at all (ibid., p.13).
In the food and drink processing/manufacturing industries the importance of economies of
size has been shown by empirical research as not being overly high (HENDERSON 1998, p.117; TRAILL
1996, p.63; KOHLS & UHL 1998, p.215). The following generalisation can be made (see KOHLS & UHL
1998, pp.24-25): (i) economies of size are greater for highly capitalised food industries (such as dairy
processing, flour milling) than for lower-capital industries (egg or fruit and vegetable packaging); (ii) many
food processing plants are much larger than is justified by economies of size (see Table 29 on the next
page): in virtually all listed sub-markets in the table the four largest companies are much bigger than the
minimum efficient size. Moreover, what appears from this table is that food processing companies do not
have to be very large to achieve maximum scale efficiencies (see also HENDERSON 1998, p.117). (iii) Some
research suggest also that economies of scale are more important in larger food processing companies than
in smaller ones (see CARAVELI & TRAILL 1998). This finding might then explain why very often food
industry companies are much larger than MES: if cost savings become more important at larger company
sizes, it would provide a strong incentive for companies to grow and for industries to become more highly
concentrated (ibid., p.311). This fact is also supported by statements of the US National Commission on
Food Marketing which argues that the smallest companies in the food industry suffer handicaps because of
inefficient size; medium-sized plants are operationally as efficient as larger plants; but the larger companies
experience in addition economies of size in advertising and sales promotion (see KOHLS & UHL 1998,
p.215). Therefore, in order to understand this situation better, it is important to have a closer look at the
cost structure of food and drink processing/manufacturing.
In summary, it becomes clear that food and drink processing/manufacturing is a comparatively
mature economic activity in which total factor productivity has been growing only slowly and is falling from
year to year. Food and drink processing/manufacturing also seems to be more capital-intensive than other
manufacturing industries, but this may depend on the actual sub-industry considered. Economies of size are
in general small in food and drink processing/manufacturing, but they are more important in capital-
intensive sub-sectors and for larger companies which are able to spread their large marketing/advertising
budgets over more units and thus achieve lower total unit costs.
scale company size. Of course, all these causes for economies of scale, scope & experience describe theoretical effects only. In practice, all these points can also give rise to diseconomies. The size and direction of the effect will always depend on the actual situation.

2 ANALYSING INTERNATIONAL FOOD PRODUCT MARKETS AT THE AGGREGATE LEVEL 109
Table 29: Potential no. of companies and four-company sales concentration ratios by country and product group, in food processing industries, mid 1980s
France Germany Italy UK USA Industry
S/MES C4(%) S/MES C4(%) S/MES C4(%) S/MES C4(%) S/MES C4(%)
Salt 39 98 62 93 24 80 39 99 194 82
Sugar 46 81 40 60 31 72 41 94 128 46
Flour 392 29 580 38 652 7 346 78 1 590 55
Bread 2 845 5 3 824 7 3 015 4 2 114 58 4 350 25
Processed meat 745 23 1 465 22 1 245 11 - - 5 000 19
Canned vegetables 1 569 40 - - 93 80 480 81 3 230 50
Soup 14 91 25 84 - - 36 75 213 75
Margarine 79 - 181 - 34 - 154 - 455 -
Soft drinks 16 70 89 - 20 84 47 48 910 89
RTE cereals - - - - - - 7 79 55 86
Mineral water 400 77 350 27 337 55 9 73 - -
Sugar confectionery 143 51 353 39 116 29 279 38 1 000 27
Biscuits 88 62 43 49 69 46 130 62 286 68
Baby foods 50 88 40 83 41 88 27 80 250 90
Beer 18 82 68 25 10 55 46 59 181 81
Notes: S = market size; MES = minimum efficient size, defined as output of median plant as percentage of industry output. S/MES gives the number companies with MES which fit into a market. C4 = market share of the four largest companies in the sector.
Source: SUTTON J. (1991), Sunk Cost and Market Structure, MIT Press.
2.4.1.3 Variable costs, sunk costs and transaction costs
Variable costs, sunk costs and transaction costs have been claimed to affect the cost competitiveness
of agribusiness companies (KENNEDY at al. 1997, p.389). Apart from these effects on individual companies
it seems also interesting to investigate how these measures can be used to assess the structural
particularities of food and drink processing/manufacturing industries as compared to other manufacturing
industries. In the following, theoretical considerations and empirical facts will be presented which show that
food and drink processing/manufacturing in many ways may indeed be a particular industry.
Variable costs in food and drink processing/manufacturing include all inventory, production, and
distribution costs that tend to vary with output level (KENNEDY at al. 1997, p.389). Average variable costs
are in general the most used measure to assess company competitiveness; not only because they are
directly measurable, but also because they represent the minimum price that a company can charge during
a limited period of time without risking its economic existence (ibid.). It is not always easy to define exactly
what variable costs are, as opposed to fixed costs. The problem lies mainly in the time horizon which is
used in the analysis: in the short-term almost all costs are fix as in general staff cannot be immediately be
made redundant, stocks of inventory exist, it is not possible to cancel contracts with suppliers and marketing
agencies from one day to the other, etc. In the long-run, however, no costs are really fix, as contracts can

110 2 ANALYSING INTERNATIONAL FOOD PRODUCT MARKETS AT THE AGGREGATE LEVEL
be cancelled after a certain time, assets can be sold, staff can be laid off, etc. Unfortunately, common cost
categories, such as e.g. employment costs in a company's accounting system can represent both variable
and fixed costs, but their nature may differ from company to company. This makes sector analysis difficult
as aggregate statistical data in general does not make any distinction between different categories of e.g.
payroll costs. Nevertheless, in using the measure of value-added � which also defines the gross profit level
of an industry � it may be possible to approximate variable costs at the industry level. In fact, material
inputs are always directly related to manufactured output and every change in production level will directly
affect the expenditure for material inputs, at least after stocks are cleared. Thus, even if material inputs
may not include all variable costs of an industry, they may still be a good proxy for them. Then, as Table
25, Table 26, and Table 27 show, food manufacturing industries have a higher percentage of variable input
costs than the all manufacturing industries' average, as the percentage of value-added is smaller. However,
this need not be a real structural disadvantage, as it is profits that finally matter. Under the assumption of
smaller payroll costs than in other manufacturing industries � and of all other costs are not being much
different � food manufacturing can still be a profitable business. Table 30 shows payroll costs of food and
drink processing/manufacturing industries as percentage of turnover as compared to the all manufacturing
average in three countries. As it appears, payroll costs in Germany and the US in food and drink
processing/manufacturing industries are structurally only about 60% of the all manufacturing average levels
and about 80% in Australia. The reason for this can be seen in the generally low-skilled labour force
employed in food and beverages industries. For example, Table 31 shows that in the EU-15 in 1997 just
11.0% of those employed in food, drink and tobacco industries had completed a higher education degree.
But, as many as 44.7% of these staff had a primary or lower secondary education (EUROSTAT 2000, p.106).
Also, the percentage of part-time workers and the female participation rate in this industry is generally
higher as compared to the all manufacturing averages (ibid.).
Table 30: Payroll costs (wages and salaries) of food and drink manufacturing companies as % of industry turnover as compared to all manufacturing averages
Germany (1996) Australia (1998/99) US (1997)
Food/drink manufacturing 14.6 12.4 9.1
All manufacturing 24.7* 15.8 14.9
Food manufacturing as % of all manufacturing
59.1 78.5 61.5
Note: *including mining industry
Sources: Statistisches Bundesamt (German Bureau of Statistics) (1999), Fachserie 4.3; ABARE (2001), Australian Food Statistics 2001; ABS (2001), Manufacturing Industry, Australia; US Census Bureau (2001), Annual Survey of Manufactures; Author's calculations.

2 ANALYSING INTERNATIONAL FOOD PRODUCT MARKETS AT THE AGGREGATE LEVEL 111
Table 31: Composition of labour force in EU food, beverages and tobacco industries, 1999 (%)
Country Women1 Part-time2 Highly educated3
EU-15 37.7 12.0 11.0 B 25.5 8.0 17.3 DK 37.6 20.1 9.6 D 49.1 19.7 14.6 EL 33.7 2.9 10.7 E 31.6 3.3 14.0 F 39.7 11.0 10.5 IRL 27.5 7.2 19.6 I 31.8 4.9 2.9 L 36.8 - - NL 35.5 25.5 14.6 A 31.0 11.4 3.5 P 46.0 5.8 4.5 FIN 58.2 9.1 16.2 S 29.6 13.3 - UK 33.0 12.2 12.1
Notes: 1) EU-15 and EL, 1998; 2) EU-15, B and EL, 1998; 3) EL, 1998; EU-15, IRL, P and UK, 1997.
Source: EUROSTAT (2000), Panorama of European Business, p.106.
Thus, although material costs are proportionally higher in food and drink industries, labour costs are
generally lower. In order to assess the effect of these findings on the bottom line of food and beverages
companies, it is useful to have a closer look at the profits that these companies make, as compared to other
industries. Table 32 lists profits and different profit ratios separately for the beverages and food industries
and the average for all industries. The data are based on the world's 500 largest companies. Moreover,
these figures are ten years' averages (1989-99), since profits can vary substantially from one year to
another. As it becomes clear from this table, food manufacturing � and in particular the beverages industry
� is considerably more profitable in comparison to the all industries' average. In addition, in both
industries, profits are also less volatile than the average of all industries, as measured by the calculated
coefficients of variation of the ten years' mean values.
Table 32: Profits in food and beverages industries as compared to all industries' total, 10 years' averages (1989-99) from Fortune Global 500 companies
Industry No. of firms
included
Turnover US$bn
Profits US$bn
Assets US$bn
Equity US$bn
Employ- ees ('000)
Profits as % of turnover
Profits as % of assets
Profits as % of equity
Assets per employee
US$
Beverages 10.5 89.9 7.2 114.4 39.2 489 8.4 6.7 19.8 291 192 Coef. o. variat. (%) 58.9 27.2 23.2 30.8 31.7 60.4 26.1 28.8 31.9 39.0
Food manufacturing 27.7 313.8 11.9 239.8 73.4 1 552 3.9 5.0 16.3 160 066
Coef. o. variat. (%) 68.2 27.9 25.5 26.8 25.3 36.8 14.8 14.5 12.8 11.4 All industries' total 500 8 580.7 285.7 21 925.4 2 863.2 32 114 3.2 1.8 9.6 613 519
Coef. o. variat. (%) - 39.0 56.9 73.3 43.3 21.2 34.3 64.3 31.9 62.0
Source: Author's calculations from Fortune Global 500, various issues.

112 2 ANALYSING INTERNATIONAL FOOD PRODUCT MARKETS AT THE AGGREGATE LEVEL
Thus, it become clear that variable costs in food and drink manufacturing industries may actually be lower
than in other manufacturing industries � despite proportionally higher material input costs � due to
substantially lower payroll costs. In assuming that other costs do not differ significantly from the ones in
other industries, this should then result in higher profits, which is the situation found in the real world.
Sunk costs can be defined as expenditure on assets for which there is no (second-hand) market,
i.e. once these expenditures are made they are "sunk" or lost (PRATTEN 1991, p.25). Expenditure on
research and development and marketing are typical examples of this kind of costs (ibid.). Sunk costs can
act as barriers to entry to a market for new companies, since they signify large initial investments combined
with a high risk of never getting any return on them. Food and drink manufacturing/processing has often
been characterised as a "low-tech" industry (see e.g. TRAILL 1997, p.401; RAMA 1996, p.124; GALIZZI &
VENTURINI 1996, p.133), meaning that R&D expenditures in this industries are low as compared to other
industries. Table 33 presents data which support this argument: based on a survey of 300 international
corporations, food and beverages manufacturers in 2000 had R&D expenditure ratios of only 1.9% and 2.0%
of turnover respectively, compared to the average ratio for all industries of 4.7%. Also, R&D spending per
employee at US$3 900 and US$5 700 respectively were significantly lower than the all companies' composite
figure of US$13 900. Thus food and beverage manufacturing can indeed be considered as a low-tech
industry. R&D levels are even smaller when measured at the aggregate sector level, as shown in Table 34.
As these data include also the smaller � and presumably even lower-tech companies � the average R&D
spending as percentage of turnover lies only at around 0.2% for German food and drink processing/
manufacturing industries from 1995-99. On the other hand, marketing spending is comparatively high in
these industries. Table 34 lists marketing expenditures of the German food processing industry for the
years 1995-99. As it stands, annual marketing expenditures at 2.3% of turnover are more than ten times
as high as R&D investments for each listed year. This shows clearly the importance of advertising in food
manufacturing industries. Of course, not all of the marketing expenditures may be sunk costs, as � apart
from animating people to buy the products � the money spent serves also to build brands, which can be
sold later and thus investments may at least partly be regained (see for a quantitative analysis of the
creation of intangible capital through advertising in US food industries e.g. WU & BJORNSON 1996). This is
actually also true for R&D expenses: once patents are registered and eventually sold, initial investments
may be amortised (ibid.). Nevertheless, high marketing spending can still serve as barriers to entry to new
companies, as only heavy advertising may lead to the necessary profit levels, which allow a new company to
stay in the market. For example, based on a sample of leading US food manufacturers Table 35 shows that
companies with higher advertising levels are more competitive and more profitable than those with low
marketing efforts. A similar relationship is true for R&D spending: higher levels seem to assure higher
competitiveness and profit ratios.

2 ANALYSING INTERNATIONAL FOOD PRODUCT MARKETS AT THE AGGREGATE LEVEL 113
Table 33: R&D spending of top companies in different industries, 2000
Previous R&D investment Rank-ing
Industry No. of firms incl.
Sales 2000 $m
R&D spend 2000 $m
% chg.
As % of
sales
R&D peremp $�000
1999 $m
1998 $m
1997 $m
1 Software & IT services 20 71 259 10 500 21 14.7 39.5 8 685 7 480 5 621
2 Pharmaceuticals 38 336 978 43 145 16 12.8 38.2 37 264 33 472 31 072
3 Internet retailers 1 2 762 285 79 10.3 31.7 160 47 12
4 Health 11 54 155 5 123 18 9.5 20.8 4 336 4 024 4 167
5 IT hardware 62 930 067 76 093 17 8.2 23.8 64 990 62 101 54 932
6 Electronic & electrical 26 450 520 26 626 0 5.9 11.1 26 602 25 260 23 743
7 Chemicals 22 255 695 12 111 7 4.7 14.4 11 317 10 779 10 190
8 Aerospace & defence 14 237 516 10 903 13 4.6 8.9 9 006 8 821 7 546
9 Media & photography 6 59 265 2 594 4 4.4 11.2 2 291 3 344 3 548
10 Automobiles & parts 30 1 253 071 50 110 3 4.0 11.8 45 885 41 835 36 292
11 Leisure & hotels 2 13 167 499 2 3.8 7.2 491 850 320
12 Engineer. & machinery 18 162 329 5 969 4 3.7 8.9 5 549 6 106 5 330
13 Household goods 4 24 684 878 -3 3.6 6.5 903 816 696
14 Personal care 7 103 896 3 525 8 3.4 9.4 3 251 3 235 2 905
15 Telecommunications 7 274 872 5 708 -6 2.1 5.7 6 072 5 289 5 860
16 Beverages 1 9 396 188 3 2.0 5.7 182 174 176
17 Food processors 3 102 176 1 966 16 1.9 3.9 1 689 1 535 1 350
18 Construction & building 3 46 116 770 -13 1.7 3.6 887 828 1 382
19 Electricity 3 79 260 1 202 - 1.5 10.8 - - -
20 Steel & metals 5 72 057 992 31 1.4 3.4 627 662 706
21 Diversified industrials 7 318 691 4 075 11 1.3 3.6 3 679 2 691 2 462
22 Tobacco 2 101 551 955 13 0.9 4.4 847 837 851
23 Oil & gas 8 727 908 3 193 10 0.4 4.7 2 905 3 255 2 601
All companies composite 300 5 687 391 267 410 10 4.7 13.9 237 618 223 441 201 762
Note: Based on top 300 international companies' data
Source: Adapted from Financial Times (September 27 2001), p.24. See also http://surveys.ft.com/scoreboard2001
Table 34: R&D and marketing spending of the German food processing industry, 1995-1999
1995 1996 1997 1998 1999
Nominal turnover (DMbn) 221.0 222.5 231.0 228.6 228.1
Investments (DMbn) 7.8 8.2 7.7 7.5 9.6
as % of turnover 3.5 3.7 3.3 3.3 4.2
Marketing (DMbn) - 5.0 5.1 5.3 5.2
as % of turnover - 2.3 2.2 2.3 2.3
R&D (DMbn) 0.475 0.483 0.417 0.422 0.410
as % of turnover 0.22 0.22 0.18 0.19 0.18
Source: Bundesvereinigung der Deutschen Ernährungsindustrie (BVE) (German Food Industry Association), www.ang-online.de/bvedaten.htm Stifterverband Wissenschaftsstatistik (2000), Forschung und Entwicklung in der Wirtschaft 1998.
Although the data presented in Table 35 may be misleading since the actual sample size is unknown, and
apparently it is not controlled for other effects, such as e.g. company size or sub-industry membership etc.,
a positive effect of advertisement intensity on company profitability has also be shown in other empirical
studies. For example, VLACHVEI & OUSTAPASSIDIS (1998) and GIANNAKAS & TZOUVELEKAS (1998)

114 2 ANALYSING INTERNATIONAL FOOD PRODUCT MARKETS AT THE AGGREGATE LEVEL
showed both independently from each other the positive and statistically significant effect of advertising on
the profit levels of Greek food manufacturing industries.
Table 35: Input intensity and competitive performance, leading US food manufacturers, 1995/96
Competitive Index1 Profitablity2 Indicator
0.5-1.0 0.0-0.5 Above 9% Below 9%
R&D expenditures/total sales 1.26% 0.56% 1.36% 0.59%
Advertising expenditures/total sales 11.22% 4.46% 11.55% 6.22%
Intangible assets/total sales 27.60% 30.30% 28.00% 28.70%
Competitiveness index, mean 0.74 0.38 0.63 0.63
Profit rate, mean 10.10% 7.70% 13.60% 5.10%
Notes: Compiled from annual reports of a sample of leading US food manufacturing companies. 1) Combined rate of earnings on assets and international sales as a share of total sales, indexed to 1 for the highest company. 2) Net earnings as a percentage of total assets.
Source: HENDERSON D.R., 'Between the Farm Gate and the Dinner Plate: Motivations for Industrial Change in the Processed Food Sector', in OECD (ed.), The Future of Food, 1999, p.117.
In summing up, it becomes clear that sunk costs in food and drink manufacturing/processing may not be
significantly higher than in other (manufacturing) industries. Although marketing efforts are comparatively
high, R&D investments are rather low, thus making it difficult to come to a final and secure conclusion about
the relative level of sunk cost in this particular industry. However, it appears that both high advertising and
R&D investment levels positively affect competitiveness and profitability in food and drink manufacturing.
This finding completes the results from the economies of size discussion above, which already suggested
that larger companies can lower unit (marketing) costs in stretching total costs over larger output. Thus,
large companies with high marketing budgets can realise lower unit costs and at the same time their
advertising efficiency seems also to rise. These double gains arising from large company sizes may
therefore contribute to explain the existence of very large global food manufacturing corporations.
Transaction costs include a variety of expenditures incurred by companies which attempt to
remedy incomplete information and imperfect commitment in their exchanges in goods and services
(KENNEDY et al. 1997, p.389). They are a measure of how difficult and costly it is to secure exchanges of
goods and services between parties which are willing to do so. These costs thus include everything from
identifying the right trading partner to maintaining the relationship after the first deal has been completed.
However, the difficulty with these costs is that in many cases they do not appear on a company's balance
sheet, as they are implicit rather than payable costs (ibid.). Moreover, often such costs are external to a
company, i.e. caused by industry structure, geographical location, product characteristics, the nature of a
very particular business, etc., but they still have an impact on company competitiveness. The effect of
transaction costs on the management of international food marketing activities will be discussed in more
detail in Section 3.1.1.1. At the industry level, however, it is hard to find data which quantify the size of
transaction costs and which would allow an assessment of their impact on food and drink manufacturing/
processing as compared to other industries. Food and beverages industries, however, can be characterised

2 ANALYSING INTERNATIONAL FOOD PRODUCT MARKETS AT THE AGGREGATE LEVEL 115
in general by the following structural aspects: (i) the perishability of most products asks for a need to
market them rapidly, which may involve in many cases a seller's acceptance of first-best offers rather than
leaving him time to identify the best buyer; (ii) a seasonality pattern in the availability of most inputs,
combined with sometimes considerable production risks caused e.g. by weather conditions affecting the
security of the supply chain, and thus preventing the creation of long-term contracts, at least in some cases;
(iii) most food manufacturers in western industrialised countries face an often very concentrated customer
structure in form of retailers with considerable bargaining power, forcing manufacturers to slush prices, thus
resulting in transaction costs in the form of not attainable profits. All these factors suggest that transaction
costs in food and drink manufacturing industries may be above the level of other industries, but as already
mentioned, it very hard to show this empirically.
In summary, the cost structure of food and drink manufacturing may indeed be particular as
compared to other (manufacturing) industries. Variable costs seem to be smaller in food and drink
manufacturing, as profits are generally higher and there is no reason to assume that fixed costs are
significantly larger. Sunk costs, too seem to be smaller, as R&D investments are lower, despite high
marketing spending. However, not all money spent for advertising or R&D is potentially lost: some of it
increases a company's intangible capital, thus raising its market value. On the other hand, it appears that
marketing efforts become more efficient with larger company sizes, as advertising costs can be spread over
more output units, thus reducing total unit cost. In addition, advertising seems also to become more
effective from a certain level on. Therefore, even if sunk costs may not be significantly higher than in other
industries, the need to reach a critical mass � i.e. a minimum company size � for marketing reasons may
still create considerable barriers to entry into food and drink markets, and may help to explain the existence
of very large international consumer food product companies. Transaction costs in food and drink
manufacturing, finally, may be structurally higher than in most other industries, given the generally
perishable character of most food products, and the 'natural' risk involved in their production. In any case,
with respect to international trade it becomes clear that even despite an above average profit potential,
comparatively high barriers to entry and transaction costs can cause food and drink manufacturing in
general to be less attractive for internationalisation activities than other industries.

116 2 ANALYSING INTERNATIONAL FOOD PRODUCT MARKETS AT THE AGGREGATE LEVEL
2.4.1.4 The world's main actors and export performance of German food industries
The world's 50 largest food and drink manufacturing/processing companies at the turn of the
millennium are presented in Table 37. The data provides an overview of their turnovers, their degree of
internationalisation, their involvement in food/drink manufacturing, and their (operating) profits. There is a
wide variation in the values for the individual companies, thus making it difficult to find some regularities in
the data. In fact, although it seems possible on theoretical grounds that there could be a causal relationship
between operating profits (dependent variable) and company size (as measured by turnover), degree of
internationalisation (as measured by the percentage of foreign sales in total sales), and the percentage of
food sales in total sales (all independent variables), no statistically significant relationship could be found
using regression analysis.61 Thus, none of these variables seems to have a systematic impact on the
operating profit level of these 50 companies.
More aggregated data based on this sample of 50 companies is presented in Table 36 providing
averages for different country groups. As it becomes clear, Anglo-American countries are the home of the
world's largest food and drink manufacturing corporations: 31 out of the 50 companies have their
headquarters in these countries and these companies account for almost 70% of the combined turnover of
all 50 companies. Moreover, companies coming from Anglo-American countries are also the most profitable
ones, with an average operating margin of 11.2% far above the 9.3% average for all companies. However,
the companies situated in these countries are among the least internationalised ones, with only 42.2% of
sales outside their home country. The second most important geographic area for large food and drink cor-
porations are Romanic countries (France, Switzerland and Italy), followed by the Benelux countries (The
Netherlands and Belgium) and Denmark. Germany has only one single company among the world's 50
largest, which is characterised by a comparatively low profitability. The data of the world's leading food and
drink manufacturing companies confirms what already has become clear from the industry data discussed
above: Anglo-American food and beverages manufacturing/processing is the largest-scale and most
profitable one in the world.
Table 36: Average values for country groups based on the sample of 50 world leading food and drink manufacturing companies, 1999
Country group No. of
companies Sum of food sales (US$m)
Average of food/drink as percentage of
total sales
Average of foreign as
percentage of total sales
Average of operating profit
margin (%)
Anglo-American (incl. ZA) 31 423 781 84.9 42.2 11.2
Romanic (CH/F/I) 4 76 258 94.1 79.5 8.4
Japan 9 63 873 89.0 10.8 3.8
NL/BEL/DK 5 41 217 83.9 73.3 8.8
Germany 1 4 814 100.0 53.3 7.3
All firms 50 609 943 87.7 38.2 9.3
Note: Averages are unweighted means.
Source: Author's calculations from Table 37.
61 The calculated regression is as follows: PROFIT = 112.1 + 0.00*TURNOVER - 0.34*FOOD_SHARE + 0.12*FOR_SALES
N=46; Adj. R²=-0.11; F=0.832; DW=2.52; t= (2.59) (1.15) (-0.74) (0.36).

2 ANALYSING INTERNATIONAL FOOD PRODUCT MARKETS AT THE AGGREGATE LEVEL 117
Table 37: World leading food and drink processing/manufacturing companies, 19991
Company Head-
quarters
Food/drink sales
(net US$ mil)
Food/drink as a percentage of total sales
Foreign as a percentage of
total food sales
Operating profit margin (in %) of
food business
1. Nestlé S.A. CH 46 663 84.1 98.4* 10.6#2 2. Philip Morris Companies US 30 652 39.0 31.1 15.7 3. Unilever N.V. NL/UK 21 825 50.0 58.0** 10.1 4. Coca-Cola Co. US 19 805 100.0 62.0*** 20.1 5. Con-Agra Inc. US 19 269 78.3 14.6* 4.9 6. PepsiCo Inc. US 18 244 89.6 27.1*** 15.2 7. Diaego UK 17 909 92.6 64.1** 15.7 8. MM/Mars US 15 0003 90e n/a n/a 9. Archer Daniels Midland Co. US 14 283 85e 35.0 5.0
10. IBP US 14 075 100.0 15.3* 3.8 11. Groupe Danone F 13 634 96.2 62.7* 10.5 12. Asahi Breweries Ltd. J 13 126 96.2 <10.0* 6.9 13. Anheuser-Busch Inc. US 9 710 83.0 6.5 23.2 14. Eridania Beghin-Say F 9 603 100.0 79.4 4.2 15. The H.J. Heinz Company US 9 300 100.0 45.4 11.9 16. Snow Brand Milk Products J 9 015 86e n/a 1.4 17. Bestfoods US 8 637 100.0 58.3*** 15.4 18. RJR/Nabisco Inc. US 8 268 100.0 28.8 13.2 19. Farmland Industries UK 7 922 74.0 29.8* 1.6 20. Kirin Brewery Co. Ltd. J 7 895 82.6 n/a 8.9 21. Nippon Meat Packers Inc. J 7 894 100.0 7.5 4.8 22. Sara Lee Corp. US 7 876 45.6 45.5* 12.3 23. Heineken N.V. NL 7 618 100.0 85.1 11.2 24. Kellogg Co. US 6 984 100.0 42.5 11.9 25. Cadbury Schweppes PLC UK 6 959 100.0 77.0 14.7 26. Associated British Foods PLC UK 6 956 100.0 31.1** 5.5 27. Tyson Foods Inc. US 6 550 89.0 3.0* 6.6# 28. Campbell Soup Co. US 6 424 100.0 25.2 19.8 29. Parmalat Finanzaria I 6 358 100.0 69.0** 7.3 30. Tate & Lyle PLC UK 6 094 82.3 84.6* 4.9# 31. Yamazaki Baking Co. J 5 999 93.0 <10.0* 1.1# 32. General Mills Inc. US 5 848 93.6 4.6* 16.3# 33. Ajinomoto Co. Inc. J 5 649 72.2 17.0* 4.0 34. Meiji Milk Products J 5 331 86.2 <10.0* 2.0 35. South African Breweries ZA 5 280 85.4 48.6* 13.0 36. Dole Food Company US 4 823 95.3 58.5* 4.3 37. Südzucker AG GER 4 814 100.0 53.3 7.3 38. Quaker Oats Co. US 4 725 100.0 18.3*** 15.0 39. Nichirei J 4 532 84.5 n/a 2.4 40. Itoham Foods Inc. J 4 432 100.0 <10.0* 2.7 41. Procter & Gamble US 4 381 11.5 49.8*** 16.4# 42. Friesland Coberco Dairy Foods NL 4 291 100.0 58.0 2.4 43. Flowers Industries US 4 236 100.0 <5.0 4.3 44. Carlsberg DK 4 015 89.6 80.4* 5.3# 45. Suiza Food Corp. US 3 992 89.1 10.7* 6.5 46. Hershey Foods US 3 971 100.0 <5.0 20.2 47. Smithfield Foods US 3 775 100.0 8.1 4.9 48. Interbrew BEL 3 468 95.8 83.4 12.9# 49. Interstate Bakeries US 3 460 100.0 <5.0 6.5 50. Bass PLC UK 3 370 44.5 23.9* 9.8
Notes: 1) calendar or financial year * of total turnover 2) trading profit ** outside Europe, of total turnover 3) total business turnover, estimated *** outside North America, of total turnover e estimated # of total business
Source: Author's calculations from companies' annual reports.

118 2 ANALYSING INTERNATIONAL FOOD PRODUCT MARKETS AT THE AGGREGATE LEVEL
German food industries' export performance for the years 1967-99, as measured by export
ratios, i.e. the share of foreign earnings in total turnover, are presented in Table 38. These figures are given
for several selected sub-industries and provide information on the development of their internationalisation
processes. As it stands, the export ratio of the total food and drink manufacturing industry grew from 2.4%
in 1967 to 11.4% in 1999, representing a mean annual growth rate of 5.2%. This was a much faster growth
than for the manufacturing sector as a whole with an annual average of 1.8%, even if this sector started
from an already much higher basis of 23.6% foreign earnings in 1977 increasing to 34.2% in 1999. With
regard to the separate food and drink sub-industries, it becomes clear that consumer-oriented industries'
exports grew more than twice as fast as intermediate food industries (4.2% annually on average as
compared to 2.0%). In fact, the fastest growing consumer-oriented sub-industry was dairy processing, with
a mean annual growth rate of 18.9%, starting with an export ratio of 0.3% in 1967 which increased to
18.7% in 1999. The next most important sub-industry is soft drinks with an annual export growth rate of
11.6%, followed by coffee and tea products with 8.3%. By contrast, among the intermediate food industries
there is only one with an average annual export growth rate of above 10%: margarine with an average of
14.2% per year. But consumer-oriented food industries' exports did not only grow faster, they also showed
a more stable growing pattern, as measured by the coefficients of variation (c.o.v.) of the growth rates. The
lower this figure the less volatile the growth is, and consumer-oriented food industries' average annual
export growth rates fluctuated by only 1.5% around their mean value in the period 1967-99, whereas for
intermediate food industries the c.o.v. is 3.3%. For all food industries combined the c.o.v. is 1.4% which
compares to 2.1% for the all manufacturing average. Thus, in sum it becomes clear that food-industries'
exports grew more than three times faster than the all manufacturing average from 1967-99, albeit the
export ratio of the combined food industries is still only about a third of the all manufacturing figure (11.4%
versus 34.2% in 1999). Within the food industry, consumer-oriented food companies' exports grew almost
twice as fast as intermediate food product companies, even though � here also � the former's level at
8.4% in 1999 is only about a third of the latter's (21.7%).
In summary, the data on the 50 world leading food and drink manufacturing corporations confirm
the industry level findings discussed before that Anglo-American companies in this sector are much larger-
scale and more profitable than the ones from other countries. However, within the sample of 50 companies,
no statistically significant relationship between company size, the share of foreign sales in total turnover, the
share of food/drink sales in total turnover, and the operating profit level could be found. At the same time,
the data shows that German food manufacturers are hardly present among the 50 top world companies. An
analysis of data on the export performance of German food and beverage industries from 1967 to 1999
reveals that companies in these industries displayed much higher export growth rates than the all
manufacturing average, albeit starting from a much lower basis. Thus, even if German food and beverages
manufacturing companies are hardly present among the world's leading companies, in particular consumer-
oriented German food industries' export performance has grown fast during the last 32 years. The data
confirm once again that the real growth in international agricultural trade is within manufactured consumer
food products.

Table 38: Export ratios (foreign earnings as % of total turnover) of different food processing industries in Germany, 1967 to 1999
Consumer-oriented food industries Intermediate food industries Total food process.
Total manufact.
Food process./ total manufact.
Notes (1) (2) (3) (4) (5) (6) (7) (8) (9) (10) (11) (12) (13) (14) (15) (16) (17) (18) (13) (19) (20) (21)
Year M
eat
Fish
Fruit &
Veg
.
Dai
ry
Bak
ery
Pas
ta
Condim
ents
Confe
ctio
ner
y
Soft
drinks
Bee
r
Win
e
Coff
ee
& T
ea
Mean
Mill
ing
Sta
rch
Cas
ein,
Dai
ry
Mar
gar
- in
e
Anim
al
Fats
Mean
1967 1.1 9.5 1.6 0.3 0.5 - 5.6 2.7 0.3 1.8 1.4 1.2 2.4 7.3 8.4 7.3 0.4 38.6 12.4 2.4 - - 1968 1.0 7.0 2.2 0.7 0.8 - 5.3 3.3 0.4 2.0 1.6 1.6 2.4 7.2 8.3 9.0 0.7 34.6 12.0 2.6 - - 1969 1.2 6.9 2.7 0.7 1.2 - 5.1 3.6 0.6 2.1 1.5 1.8 2.5 9.6 7.1 9.0 0.9 36.6 12.6 3.0 - -
1970 1.0 7.3 3.1 0.8 1.2 - 5.3 3.6 0.5 2.0 1.5 2.2 2.6 10.3 6.2 8.3 0.9 30.1 11.2 3.1 - - 1971 1.1 7.2 3.1 0.9 1.1 - 5.7 3.7 0.5 2.0 1.4 2.6 2.7 10.6 7.7 10.3 0.9 33.7 12.6 3.2 - - 1972 1.1 7.3 3.4 0.9 1.3 - 5.8 4.4 0.4 1.9 1.5 1.9 2.7 11.6 8.2 8.8 1.1 31.2 12.2 3.4 - - 1973 1.2 7.5 3.6 1.0 1.9 - 5.6 4.4 0.3 2.0 1.5 2.8 2.9 13.2 8.5 9.5 1.3 25.6 11.6 4.0 - - 1974 1.4 7.3 4.1 1.9 1.8 - 6.3 4.9 0.5 2.1 1.4 3.0 3.2 12.2 9.4 11.7 1.1 31.2 13.1 5.2 - - 1975 1.7 12.9 4.1 2.0 1.8 - 5.4 4.7 0.4 2.8 1.5 2.9 3.7 14.0 9.2 11.2 0.9 38.5 14.8 5.1 - - 1976 2.0 14.3 5.3 2.0 2.3 - 5.0 5.1 0.3 3.4 1.5 4.9 4.2 13.1 10.5 13.0 1.9 39.0 15.5 5.4 - - 1977 1.5 14.6 5.5 6.4 1.7 2.5 4.6 6.3 0.7 3.5 3.7 5.0 4.7 14.2 13.4 13.6 1.0 42.0 16.8 6.3 23.6 26.7 1978 1.4 13.0 6.2 6.4 2.3 2.3 4.5 7.0 0.7 2.6 3.7 5.3 4.6 15.1 13.8 14.8 1.0 42.4 17.4 6.5 24.0 27.1 1979 1.5 12.3 6.4 7.6 2.5 3.6 4.9 6.6 0.8 2.7 3.9 4.8 4.8 16.1 17.4 16.9 1.7 44.2 19.3 6.8 24.0 28.3
1980 1.7 12.8 6.6 8.8 2.7 3.9 5.9 6.3 1.2 2.8 4.8 4.5 5.2 19.2 18.9 18.9 1.9 43.7 20.5 7.5 24.3 30.9 1981 1.8 13.5 7.8 9.9 3.0 3.5 7.1 6.6 1.7 3.4 5.7 4.4 5.7 17.7 22.6 21.6 2.6 40.5 21.0 8.3 26.0 31.9 1982 1.6 14.0 9.0 10.1 3.3 3.4 8.6 7.3 0.8 3.8 6.5 5.8 6.2 16.2 24.2 21.4 1.9 38.3 20.4 8.5 27.1 31.4 1983 1.8 14.0 10.1 9.3 3.2 3.8 10.0 7.4 0.9 4.3 6.5 7.8 6.6 12.6 27.7 20.1 1.5 39.7 20.3 8.5 27.1 31.4 1984 1.9 12.1 11.0 10.9 3.0 4.8 8.4 9.1 0.8 4.9 6.7 9.1 6.9 13.1 29.8 18.7 2.1 38.0 20.3 9.4 28.8 32.6 1985 2.1 12.1 11.6 12.1 2.7 4.7 9.7 11.1 1.1 5.5 7.6 7.2 7.3 14.0 30.3 20.6 2.2 36.5 20.7 9.9 29.6 33.4 1986 2.3 11.7 10.9 11.5 2.9 4.6 8.4 10.6 0.9 5.6 6.4 7.8 7.0 11.9 31.0 18.0 2.4 39.0 20.5 9.3 29.7 31.3 1987 3.1 12.5 11.0 12.5 2.9 4.4 8.3 9.3 1.2 5.3 5.0 6.7 6.9 11.0 32.5 20.3 2.6 34.3 20.1 9.1 29.7 30.6 1988 2.5 12.4 11.1 13.6 3.1 4.4 7.5 9.9 1.2 5.2 5.6 8.7 7.1 12.2 32.8 18.5 2.6 35.7 20.4 9.4 30.4 30.9 1989 2.7 12.7 12.8 13.5 3.2 3.7 11.7 10.6 1.5 5.2 5.7 9.4 7.7 12.4 34.5 19.2 2.8 40.3 21.8 9.9 30.8 32.1
1990 2.4 11.3 11.1 12.1 3.0 3.7 9.3 10.2 1.6 5.2 4.4 8.7 6.9 13.7 33.4 16.4 3.0 40.4 21.4 9.0 29.2 30.8 1991 3.1 10.6 10.2 12.6 3.2 3.3 10.2 9.6 1.3 5.1 3.9 7.7 6.7 13.1 35.6 14.7 2.9 38.0 20.9 8.4 26.8 31.3 1992 2.3 11.9 10.3 13.2 2.9 2.5 9.1 10.4 1.5 5.1 3 7.2 6.6 13.4 33.8 15.7 3.2 38.4 20.9 8.7 26.8 32.5 1993* 2.4 13.2 10.9 12.4 2.5 2.9 11.5 11.4 1.0 4.8 3.6 7.7 7.0 13.2 35.1 16.8 3.4 41.2 21.9 8.9 26.1 34.1 1994 2.3 13.5 12.3 12.5 2.6 4.9 11.6 12.8 1.0 5.3 4.3 10.7 7.8 13.2 42.5 16.5 2.7 41.3 23.2 9.4 27.4 34.3 1995 2.1 13.7 11.3 14.5 2.4 3.8 11.3 15.6 1.8 5.8 - 12.0 8.6 13.7 36.1 - 4.0 37.7 22.9 9.8 28.4 34.5 1996 2.5 14.3 11.9 15.8 2.4 4.2 11.7 17.2 2.6 5.9 - 11.7 9.1 13.2 39.4 - 4.7 41.0 24.6 10.4 29.7 35.0 1997 2.6 15.5 12.6 17.3 2.8 4.0 12.1 18.2 1.8 6.0 - 12.8 9.6 14.0 39.9 - 11.2 39.4 26.1 11.1 31.9 34.8 1998 2.8 16.8 13.1 17.7 2.1 3.0 8.5 17.3 1.4 6.0 3.9 9.5 8.5 15.2 42.8 - 10.1 - 22.7 11.4 33.2 34.3 1999 3.0 16.0 13.8 18.7 1.8 2.6 9.1 15.6 1.7 6.4 3.6 8.3 8.4 16.1 44.3 - 4.6 - 21.7 11.4 34.2 33.3
Mean annual growth rate (%) 4.2 2.6 7.5 18.9 5.8 2.4 2.7 6.1 11.6 4.5 6.6 8.3 4.2 3.0 5.8 3.7 14.2 0.5 2.0 5.2 1.8 1.1
Coefficient of variation (%)
3.5 6.1 1.4 2.4 3.5 9.9 6.0 1.7 3.3 2.3 4.6 2.6 1.5 3.5 1.8 3.2 2.9 18.5 3.3 1.4 2.1 3.2
Notes: Data from companies with 20 or more employees only. *From 1993 on data for reunified Germany. (1) Processing & manufacturing of meat products (2) Processing & manufacturing of fish products (3) Processing & manufacturing of fruit & vegetable products (4) Processing & manufacturing of dairy products & cheeses (5) Production of bakery goods (without long-life products) (6) Production of pasta and noodles (7) Manufacturing of vinegar, mustard, essences and spices (8) Manufacturing of chocolate and sugary confectionery (9) Production and bottling of soda water and soft drinks (10) Beer brewing industry (11) Manufacturing of wine, fruit wine and sparkling wine (12) Processing and manufacturing of tea and coffee products (13) Unweighted mean representing year's average (14) Manufacturing of grain mill products (15) Manufacturing of starch & starch products (16) Production of sterilised milk, casein & processed cheese (17) Manufacturing of margarine and similar products (18) Production of animal fats and lard
(19) Export ratios of all food industries including also those not given in the table (20) Export ratios of total manufacturing and mining industries (21) Food industry export ratios as a share of total manufacturing's export ratio (multiplied by 100)
Source: Bundesministerium für Landwirtschaft, Ernährung und Forsten (BML) (German Ministry of Agriculture, Food and Forestry) (ed.), Statistisches Jahrbuch über Ernährung, Landwirtschaft und Forsten der Bundesrepublik Deutschland, various issues; Author's calculations (italic and bold figures).
2 A
NALY
SIN
G IN
TERN
ATIO
NAL FO
OD
PRO
DU
CT M
ARKETS A
T T
HE A
GG
REG
ATE LE
VEL
119

120 2 ANALYSING INTERNATIONAL FOOD PRODUCT MARKETS AT THE AGGREGATE LEVEL
2.4.1.5 Trade barriers
This last sub-section addresses economic aspects related to barriers to the international trade in
manufactured/processed food products. First, the role of trade policy and world trade agreements for
manufactured goods in general and for food products in particular is explored. Then, aspects which are
especially relevant for food products, such as process and product standards are discussed.
Trade policies have been shown in empirical research to be nowadays only "a minor cause of
variation in the manufactured/primary export ratio", i.e the share of manufactured goods in a country's
exports (WOOD & BERGE 1997). The main reason for this is that trade policies have been harmonised
during the last decades, together with a common international effort to reduce trade policy related barriers
such as tariffs, quotas etc. In fact, an OECD (1997) study on the impact of the Uruguay Round Agreement
on agriculture and processed agricultural products finds that (p.21)
For the majority of processed product items, the base tariffs reflect the applied tariffs in 1986 or existing bound rates. These base tariffs are usually not high, although the level varies between countries and products. Generally, it is non-competing products � either those not produced locally or where domestic production is competitive � which have not been tariffied and imports are either duty-free or face low tariffs. Product categories for which tariffication was not used extensively include: plants and flowers, coffee, tea and spices, seeds, straw and fodder, vegetable extracts and plaiting materials, fats and oils, alcoholic beverages and tobacco, wool, hides, skins, silk and other agricultural raw material. Tariff reduction commitments are likely to be of greater significance where tariffication has not been applied but where base tariffs are nevertheless relatively high. Examples of this are found for some categories in some countries (e.g. some fruit and vegetables in Japan and the US, alcoholic beverages in Australia and EU, vegetable oils in Japan).... The products for which tariffication has been used most frequently tend to be "sensitive" basic products and processed products containing significant amounts of those same basic agricultural products. Where processed products were subject to tariffication (i.e. previously subject to non-tariff barriers) the resulting tariffs are in most cases reduced by less than average over the implementation period. The majority of those products incorporate dairy products, such as skim milk powder and milk fat (e.g. US, EU, Japan, Canada, Norway), sugar (e.g. US, EU) and cereals to a lesser extent. New Zealand and Australia have hardly used tariffication at all, because they had few non-tariff barriers applying.
One big problem for processed food products is therefore that they can suffer from tariffs on intermediate
inputs. Empirical research by LANCLOS & HERTEL (1995) and LANCLOS, HERTEL & DEVADOSS (1996)
showed that e.g. for US food processing industries input tariffs are more important and more market-
distorting than tariffs on the finished consumer products (output tariffs). Thus, reducing tariffs on inputs
would lead to higher output levels per company and more food processing companies in the US, independent
of the actual market structure (imperfect competition, monopolistic competition, etc.). Another problem for
processed food products with regard to international trade policy is that manufactured foodstuff & drink
items are often targeted in agricultural disputes for 'retaliation', as it is much easier to get a group of
products together which meet the required value of the trade total specified for such retaliation measures,
and because it is much easier to target exports from specific countries (HARRIS 1994, p.199). In summing
up, it appears that trade policy related barriers to the international trade of manufactured/processed food
and drink products in today's globalised world economy are only small, although some exceptions do exist.

2 ANALYSING INTERNATIONAL FOOD PRODUCT MARKETS AT THE AGGREGATE LEVEL 121
Non-trade policy based barriers to trade, such as Technical Barriers to Trade (TBT) or Sanitary
and Phytosanitary Standards (SPS), are the emerging issues in the current debate on obstacles in the
international marketing of food and drink products (HOOKER & CASWELL 1996; NEFF & MALONOSKI 1996;
WORLEY et al. 1995). Whereas TBT describe barriers which are related to the process of how a food/drink
item is produced, i.e. its production technology, SPS refer to product quality attributes resulting from its
natural or artificial composition. In fact, sanitary and phytosanitary measures aim to minimise risks for
human, animal, and plant health and safety arising from diseases, pests, additives, contaminants, and
toxins (NEFF & MALONOSKI 1996, p.20). Some examples are foodborne pathogens, heavy metals, and
pesticide and veterinary residues (HOOKER & CASWELL 1996, p.412). The main purposes for governments
to set process or product standards which need to be met by imported foods are to protect consumers and
to foster competition among producers (WORLEY et al. 1995), and in some cases also to protect agricultural
producers from imported animal or plant diseases (MACLAREN 1998). Although these motives are generally
internationally accepted, the main problem with standards is that they are often developed individually by
each country. As a result of their individuality or uniqueness, process or product standards may create
barriers to the international trade in food and drink products (ibid., p.101). Regulations become trade
barriers when the marginal costs associated with meeting the process or product standards in the import
market raises the overall cost of delivering the product to the foreign customers to the point that the
product becomes uncompetitive in that market (ibid., p.102). In addition to the cost of meeting quality and
labelling standards, companies are faced with the risk associated with regulatory compliance (ibid.).
Although TBT and SPS are regulated in international WTO agreements (NEFF & MALONOSKI 1996), trade
conflicts still arise when governments prevent food products from entering the country because they are not
seen as following the nationally required product or process standards. Typical recent examples are the EU's
ban on US beef produced with growth hormones, the EU's ban of genetically modified foods, or raw milk
products which are not allowed to be imported into the US or Australia. To sum up, national or regional
product and process standards may have become the real obstacles for food and drink manufacturers
seeking to market their products internationally, thus exposing companies to new and hard to calculate �
and still political � risks.
In summary, there are two main categories of barriers to the international trade of food and drink
products: (1) trade policy related barriers, such as tariffs or quotas, etc. may be seen to have become less
important, due to international efforts of reducing such barriers. More market distorting than tariffs on the
finished food/drink product may actually be levies on agricultural inputs, which may affect the cost
competitiveness and output levels of food industries. Another problem with consumer food products is that
they are often targeted in trade related retaliation actions. (2) process and product standards, such as
Technical Barriers to Trade or Sanitary and Phytosanitary Standards seem to be the emerging issues in the
discussion on barriers to the international trade in food/drink products. Although these issues are regulated
by international trade agreements, the often nationalistic or regionalistic nature of these standards make
them to effective trade barriers. In the future, producers of food and drink items may be faced with ever
more complicated product and process standards, which may be seen as today's real obstacles to the
successful international marketing of their products.

122 2 ANALYSING INTERNATIONAL FOOD PRODUCT MARKETS AT THE AGGREGATE LEVEL
2.4.1.6 Summary and conclusions
This sub-section has explored the economic structure of the international food and drink industries and
analysed in more detail its size and significance in several western countries compared to their aggregate
manufacturing sector. Then, the role of total factor productivity and of economies of size in food and drink
industries have been discussed. After an assessment of the cost structure of food and drink manufacturing,
i.e. the extent of variable, sunk and transaction costs, the world's 50 largest food and drink companies and
data on the export performance of the German food and drink industries was presented. Finally, issues
related to international trade barriers have been examined. In conclusion it becomes clear that food and
drink processing/manufacturing is structurally a basic economic activity, neither particularly labour nor
overly capital intensive, thus being an industry in which it seems hard to achieve clear comparative
production advantages. It is therefore difficult to explain international trade in food and drink products
within the framework of traditional trade theory.
The international comparison of food and beverage industries of the EU-15, the US,
Germany and Australia reveals that in Europe this economic activity takes place in comparatively small
production plants and that its value-adding is considerably lower than in the US. The Australian food and
beverage industries lie in between these two extremes. When food and beverage manufacturing is
compared to the all manufacturing average � as measured by the employee per company and the turnover
per company ratios � it becomes clear that food and beverage plants in the EU-15 are usually smaller than
average manufacturing plants, but in the US they are larger than this benchmark. In all three continents
turnover per employee is usually higher than the all manufacturing average, implying higher labour
productivity levels. On the other hand, gross profits, i.e. the value-added, are in all three continents
considerably lower as compared to the all manufacturing figure. Although it seems that economies of scale
and productivity in food and beverage processing should be investigated in more detail, it becomes already
clear that this industry seems structurally to be a high volume, low margin one.
Total factor productivity in food processing has been growing only slowly and is falling from year
to year thus confirming that it is a comparatively mature economic activity. Food and drink processing/
manufacturing also seems to be more capital-intensive than other manufacturing industries, but this may
depend on the actual sub-industry considered. Economies of size are in general small in food and drink
processing/manufacturing, but they are more important in capital-intensive sub-sectors and for larger
companies which are able to spread their large marketing/advertising budgets over more units and thus
achieve lower total unit costs.
The cost structure of food and drink manufacturing may indeed be particular as compared to
other (manufacturing) industries. Variable costs seem to be smaller in food and drink manufacturing, as
profits are generally higher and there is no reason to assume that fixed costs are significantly larger. Sunk
costs, too, seem to be smaller, as R&D investments are lower, despite high marketing spending. However,
not all money spent on advertising or R&D is potentially lost: some of it increases a company's intangible
capital, thus raising its market value. On the other hand, it appears that marketing efforts become more
efficient with larger company sizes, as advertising costs can be spread over more output units, thus reducing
unit total cost. In addition, advertising seems also to become more effective from a certain level on.
Therefore, even if sunk costs may not be significantly higher than in other industries, the need to reach a

2 ANALYSING INTERNATIONAL FOOD PRODUCT MARKETS AT THE AGGREGATE LEVEL 123
critical mass � i.e. a minimum company size � for marketing reasons may still create considerable barriers
to entry to food and drink markets, and may help to explain the existence of very large international
consumer food product companies. Transaction costs in food and drink manufacturing, finally, may be
structurally higher than in most other industries, given the generally perishable character of most food
products, and the 'natural' risk involved in their production. In any case, with respect to international trade
it becomes clear that even despite an above average profit potential, comparatively high barriers to entry
and transaction costs can lead to food and drink manufacturing in general being less attractive for
internationalisation activities than other industries.
Data on the world's 50 leading food and drink manufacturing corporations confirm the
industry level findings that Anglo-American companies in this sector are larger-scale and more profitable
than the ones from other countries. However, within the sample of 50 companies, no statistically significant
relationship between company size, the share of foreign sales in total turnover, the share of food/drink sales
in total turnover, and the operating profit level could be found. At the same time, the data reveal that
German food manufacturers are hardly present among the world's 50 top companies. An analysis of data on
the export performance of German food and beverage industries during 1967 to 1999 reveals that
companies in these industries have displayed much higher export growth rates than the all manufacturing
average, albeit starting from a much lower basis. Thus, even if German food and beverages manufacturing
companies are hardly present among the world's leading companies, in particular consumer-oriented
German food industries' export performance has grown fast during the last 32 years. The data confirm once
again that the real growth in international agricultural trade is within manufactured consumer food products.
Two categories of barriers to the international trade of food and drink products exist: (1)
trade policy related barriers, such as tariffs or quotas, etc. may be seen of becoming less important, due to
international efforts of reducing such barriers. More market distorting than tariffs on the finished food/drink
product may actually be levies on agricultural inputs, which may affect the cost competitiveness and output
levels of food industries. Another problem with consumer food products is that they are often targeted in
trade related retaliation actions. (2) process and product standards, such as Technical Barriers to Trade or
Sanitary and Phytosanitary Standards seem to be the emerging issues in the discussion on barriers to the
international trade in food/drink products. Although these issues are regulated by international trade
agreements, the often nationalistic or regionalistic nature of these standards cause them to be effective
trade barriers. In the future, producers of food and drink items may be faced with more and more
complicated product and process standards, which may be seen as today's real obstacles to the successful
international marketing of these products.
In conclusion it becomes clear that food and drink manufacturing is structurally a basic economic
activity which seems to be neither particularly labour nor overly capital intensive. Moreover, R&D spending
and economies of size are low. It may therefore prove hard to achieve clear comparative production
advantages in food and drink manufacturing for nations, and thus to apply the traditional, production-based,
theoretical framework to explain international trade in these products. Rather it needs to be explained, why
in particular trade in consumer-oriented food and drink products � the real driver in international food trade
� is growing much more rapidly, in order to understand the dynamics of international food product markets.
The next section will do this in more detail.

124 2 ANALYSING INTERNATIONAL FOOD PRODUCT MARKETS AT THE AGGREGATE LEVEL
2.4.2 Food consumption in the 21st century
The success of a food product in international markets depends on many factors. Getting access to
distribution channels and having the product placed on supermarket shelves is certainly crucial. Even more
important may be, however, to know what actually determines a consumer's decision making process when
� in front of the shelves � he/she repeatedly chooses a particular product from many similar ones.
Understanding therefore the 'mechanics' of consumer choice and the determinants of modern food
consumption is important for product developers as well as for international marketers.
Traditional microeconomic consumption theory has provided one approach to model a
consumer's product selection process. While having shed much light on how a rational, utility-maximising
consumer should actually allocate his budget in an optimal way, it is also a rather limited attempt, because
in general the decision is assumed to be based on product prices and consumer income only. Not
surprisingly therefore, this theory has been commonly found to be rejected by most of available
consumption data (THOMAS 1993, p.231). Moreover, many factors which influence product choice such as
e.g. status, health, or environmental aspects of food products cannot be explained in a satisfying way with
the traditional model. Thus, there is need for a new approach to consumption modelling, and a more
specific one to the food selection process.
This section presents a new model of modern food consumption which is able to incorporate all
the current issues that can affect modern consumers' food selection decisions. The proposed model is a
dynamic utility accumulation model, rather than the traditional static budget allocation approach. The new
model is specified for the food consumption problem only, thus implying necessarily less generality, but, on
the other hand, it may provide a better 'fit' to the 'real' world. The organisation of this section is as follows:
after a discussion of some current topics in international food consumption, traditional approaches to
consumption modelling are reviewed. Then a new modelling approach will be presented, followed by
implications for consumers and international food marketers which are derived from this new approach.
Given the novelty, there is probably much scope for improvement. Nevertheless, this approach should be
able to stimulate new discussion on the complexities of food consumption modelling in the very beginning of
the 21st century.
2.4.2.1 Current topics in international food consumption
Demographic developments in most industrialised countries indicate declining rather than increasing
demand for food products in the future. Population growth is generally low (e.g. less than 1% per annum in
most EU countries) with the average population age rising, indicating lower total and per capita calorie
needs in most industrialised countries in the 21st century (POOLE 1997, p.3).62 That is, the food product
market, measured in terms of quantity (i.e. calories), cannot be expected to grow strongly in most of these
62 This scenario abstracts from a possible change in immigration policies which until now have limited large intakes of
young foreigners from not industrialised but still largely growing countries. With bigger migrant intakes, declining population growth in industrialised countries could be compensated, and total (and per capita) food demand would increase. For a recent outlook on trends in world and regional population growth see e.g. The Economist (September 25 1999, p.17 & 60).

2 ANALYSING INTERNATIONAL FOOD PRODUCT MARKETS AT THE AGGREGATE LEVEL 125
economies. However, there is scope for a change in the types of food products demanded, and thus for
growth in terms of total market value.
Current food consumption pattern, partly a result of reduced house-hold sizes and increased
female participation rates in the workforce, seem to be shaped by (see POOLE 1997, p.3; PIERSON & ALLAN
1994): (i) more out-of-home food consumption, (ii) higher value-added products with greater convenience
attributes, (iii) a greater presence and diversity of ethnic foods, (iv) heightened consumer concerns for
nutrition, safety, and health, and (v) growing sensitivity to environmental and social externalities such as
production technologies, distribution systems, ecological sustainability, and animal welfare. These common
movements seem to be present in many of the industrialised economies, and thus it appears that these
countries are becoming increasingly similar in their food consumption pattern.
Convergence in food consumption has therefore been investigated empirically (see e.g. TRAILL
1997; HERRMANN & RÖDER 1995; GIL et al. 1995; HERRMANN 1994; CONNOR 1994). For example,
CONNOR (1994) argued that Europe would follow the US way of food consumption (with a lag of 5 to 10
years), as a result of a catch-up process in incomes, prices and demographic factors. TRAILL (1997), in
using broad product categories of FAO food balance sheet data, showed that the coefficients of variation in
consumption across 29 European countries in 1990 were all smaller than in 1961, thus providing evidence
that within European nations convergence in food consumption has been occurring, too, due to the
increasingly similar economic conditions within the area. HERRMANN & RÖDER (1995) and GIL et al.
(1995), in using OECD and EU consumption data respectively � and in applying more sophisticated
methodologies of measurement � were able to confirm this finding. However, their results show that the
degree of convergence was different across the analysed food nutrients (and also depended on the used
measurement criteria) (HERRMANN & RÖDER), or the tendency developed differently across individual
countries (GIL et al.). In addition, GIL et al. demonstrated that the speed of convergence diminished, i.e.
convergence, to a large extent, took place in the 1970s and was less intensive during the 1980s (p.396).
Finally, HERRMANN (1994), in analysing consumption of 15 food products in OECD countries between 1968
and 1988, found that convergence tendencies were considerably different for individual food products. For
example, consumption in foods such as poultry meat was found to actually have diverged over time, and for
others such as fruit and vegetable oil no significant trend could be revealed. To sum up, some convergence
in food consumption across industrialised nations was found and it seems that once people are freed from
income and product availability constrains, their food consumption pattern move towards an internationally
similar diet. This can even occur when a national diet is believed to be more beneficial than the
"international" one, as LAAJIMI et al. (1997) show for the case of Spain by the shift of Spanish consumers
away from the traditional Mediterranean diet. However, it has also been shown that there are still
considerable regional or national differences in food consumption.
Regional or national consumption differences are remaining present despite the tendencies of
an increasingly similar diet in industrialised countries. Morris Tabaksblat, Chairman of Unilever, the food and
other consumer goods manufacturing company which operates in 160 countries claimed that "all
consumption is local" and adds that he doesn't believe that tastes will ever be the same in all countries of
the world (Wirtschaftswoche #10, 1997, p.131). Alan Gordon, Chairman of GIRAG S.A., a Swiss food
market research company put it this way (GORDON 1998):

126 2 ANALYSING INTERNATIONAL FOOD PRODUCT MARKETS AT THE AGGREGATE LEVEL
The United Kingdom has traditionally had a "fuel" approach to food, currently being changed however by the remarkable culinary innovation and sales system of major retailers such as Mark & Spencer. The other "fuel" country in Europe is The Netherlands; the attitude is somewhat alleviated by the Indonesian ethnic influence. France, Spain, Italy and Belgium are firmly on the "pleasure" camp, with strong regional influences and culinary traditions passed from generation to generation. Eating well in these countries was not a function of class as it was in the United Kingdom. Germany is part "fuel" (attachment via discount stores to best food bargains), part "pleasure" - but in that country there is a massive attachment to Reinheit (purity, cleanliness in food) which can be traced back to the Middle Ages. ... The United States can be characterised by: (i) The "land of plenty": enormous helpings and the most serious obesity problem in the world. ... (ii) The homogenisation of eating habits, with the universal hamburger (the biggest source of saturated fat in the US diet) as a typical example. (iii) ... This is the land of the nutrition fads. (iv) A food industry responding via new product innovations to every possible consumer fad in the search for "added value" per kg of food product sold. ... In Japan it is the traditional "seafood and rice" diet with low saturated fat consumption. There is some Westernisation of Japanese eating habits, influenced particularly by strong tourism outside Japan.
Empirical research seem to confirm these views. For example, KRAUSE et al. (1995) performed a global
market segmentation for value-added agricultural products. 119 countries were analysed, using factor and
cluster analysis for 26 variables that possibly effect total and value-added food consumption, age
distribution, media availability, female labour force participation, etc. The study identified 10 country
clusters with distinctively different consumption characteristics. For industrialised countries three clusters
were found: one with most of the EU member states, Australia, New Zealand, and Uruguay. A second
cluster includes the Nordic countries, Iceland, the US, Canada, Japan, and Switzerland. The third cluster
was formed by Singapore only. For Europe, GIL et al. (op. cit.) analysed the diet structure of 15 EU member
countries using three main factors: (i) the share of average calorie intake deriving from animal products, (ii)
the share of fish and meat consumption, and (iii) the share of calorie intake coming from fruits. Using the
factor values for each country, a cluster analysis was performed which resulted in seven country groupings:
Portugal and Spain; Greece and Italy; Benelux, France, Ireland and the UK; Austria, Germany and The
Netherlands; Norway and Sweden; Finland; and Denmark. This result satisfies a priori expectations, apart
from France, which in similar studies (see e.g. HENSON & LOADER 1991) was found to belong to the
Mediterranean countries. Regional patterns of food consumption within the individual European countries
were analysed by ASKEGAARD & MADSEN (1995). The researchers used survey data of 20 000 respondents
provided by the Paris-based marketing research agency CCA (Centre de Communication Avancé). The
survey was organised in a joint venture by the Europanel network of European opinion-research institutes.
Instead of countries, 79 European regions were defined and the average values of each region for 138 food-
related questions were used to identify areas with similar food-consumption pattern. A factor analysis
reduced the 138 variables to 41 factors with eigenvalues greater than one, i.e. each factor explaining more
than 80% of the variance found in the original variables.63 A cluster analysis using these factor values
grouped the 79 regions into 12 clusters of areas with similar food consumption pattern which to a very high
extent rebuilt the EU countries, thus confirming the importance of national borders for consumers' food
habits. Moreover, the cluster results also revealed that language barriers are an even more powerful
separation criteria, as Germany, Austria and the German speaking parts of Switzerland were put into one
single cluster. Respectively, the French speaking part of Switzerland ended up as being part in the cluster
belonging to France.64 For the US, regionality of food consumption was shown by LARSON (1998). His
63 For a complete description of the research project and the methodology used see CATHELAT (1990) and ASKEGAARD &
MADSEN (1995). For a short description of the results see also GRUNERT et al. (1996, p.38-46).
64 The cluster analysis revealed also that some countries or cross-national areas are more homogenous with regard to food consumption pattern than others. For example, the most homogenous countries were found to be Denmark, Sweden, Germany (apart from Bavaria), and Switzerland (the German speaking part). In contrast, Norway, Austria, Greece, Portugal and Belgium were found to be less homogenous, as measured by the iteration steps needed in the cluster analysis to rebuild a whole country out of its regions (see ASKEGAARD & MADSEN 1995, p.22-25 or GRUNERT et

2 ANALYSING INTERNATIONAL FOOD PRODUCT MARKETS AT THE AGGREGATE LEVEL 127
study, in using a cluster analysis of food purchases in 126 categories across 54 US areas, found 11 market
groupings which distinctive differences in food consumption patterns. This finding may confirm SENAUER et
al.'s (1991, p.70) conclusion that "... markets as well as people, will grow increasingly diverse. A growing
mass market for homogenous food commodities may be a thing of the past". In order to understand the
apparent contradictions between the findings of increasing similarities in food consumption on the one hand,
and persistent local consumption pattern on the other hand, a deeper understanding of food consumption at
the level of individual consumers is needed.
Similar types of food consumers across countries have been identified by GRUNERT et al.
(1996, pp.46-73). Their survey study was based on representative national samples of 1 000 respondents
each from Germany, France, and Great Britain. In an exploratory study 21 cross-culturally stable factors
were identified which cover five broad food-related topics such as (i) ways of shopping (importance of
product information, attitudes to advertising, enjoyment from shopping, speciality shops, price criteria,
shopping list), (ii) food quality aspects (health, price-quality relation, novelty, ecological products), (iii)
cooking methods (interest in cooking, looking for new ways, convenience, whole family, spontaneity,
women's task), (iv) consumption situations (snacks versus meals, social event), and (v) purchasing motives
(self-fulfilment in food, security, social relationships). First, aggregated national differences in German,
French, and British food consumption habits were analysed which yielded similar results as already described
above (see ibid., pp.53-69 for a detailed description). Second, national consumer types were identified by
means of a cluster analysis. In all three countries five cluster solutions proved to be the most readily
interpretable and to be those results which discriminated best among consumers with regard to the
underlying dimensions. Table 39 which follows summarises the findings on comparable consumer segments
across the three countries.
al. 1996, p.42-43). Moreover, the three most important clusters, the German-speaking, the French-speaking, and the British one, were found to be different in the following characteristics (see ibid., p.44-45): in the Germanic areas (Germany, Austria, Switzerland) food consumers were found to be very health conscious. They like food to be raw and natural, compact, dense, fried, spongy, marinated, sour, which melts in the mouth, can be put on biscuits, and has a complex taste. Furthermore, more than the average European food consumer they like fluid, crispy, sweet and sour, acid lemony, soft, crunchy food that can be torn apart and eaten with the fingers. People in this area prefer filter coffee, but they are only average users of wine, beer, coke, and other soft drinks. "Fast food" is not very popular. In the French-speaking area, food consumers were found to attach importance to the sensory enjoyment of food, to red wine, and mineral water. White wine, beer, coke, and tea are less preferred. There is a growing willingness to eat "fast food" and takeaway meals. The British Isles were found to have no strong food culture. Consumers there like sweets and pastries, but they are also found of a sour taste. British consumers drink above average instant coffee and tea. However, they consume little mineral water and red wine. These empirical results thus seem to strongly confirm GORDON's (op. cit.) statements on national differences in food consumption, cited earlier.

128 2 ANALYSING INTERNATIONAL FOOD PRODUCT MARKETS AT THE AGGREGATE LEVEL
Table 39: Food consumer segments in three European countries
% within a representative survey sample of 1 000 consumers per country Type of food consumer *
Germany France Great Britain
Uninvolved 21 18 9 Careless 11 n/a 27 Moderate n/a 16 n/a Conservative 18 13 19
Rather uninterested 50 47 55
Rational 26 35 33 Hedonistic n/a 18 n/a Adventurous 24 n/a 12
Rather interested 50 53 45
Notes: n/a = not applicable. Segments are cluster analysis results from 21 underlying cross-culturally valid factors.
* Uninvolved food consumers are the least interested in food and related activities (shopping, cooking, etc.); Careless food consumers are similar to the uninvolved but they are much less price conscious as them; Moderate food consumers show average interests in almost all aspects. They represent the French average con- sumer if the whole population would not be divided into segments; Conservative food consumers are not keen on new products and food should "taste as it always has"; Rational food consumers are interested in food and price conscious. Meals and shopping are planned. Health and environmental aspects matter. New products are accepted when offering a particular advantage; Hedonistic food consumers like shopping, cooking and new products. Eating in restaurants is frequently done; Adventurous food consumers are most keen on cooking and new products. Meals are not planned and eating out is frequently done. However, shopping is not very much appreciated in this group.
The characteristics of the individual segments differ slightly across countries. See source for a more detailed description of the country-specific segments.
Source: Adapted from GRUNERT K.G., LARSEN H.H., MADSEN T.K. & BAADSGAARD A. (1996), Market Orientation in Food and Agriculture, p.71.
It can be seen that there are quite similar food consumer types across the analysed countries. Even if the
individual segments show country-specific particularities,65 it can still be concluded that in each country
about half of the population shows no great interest in food � and related activities such as grocery
shopping and cooking � whereas the other half does. In Germany the division between the two groups
appears to be exactly 50/50, whereas in Great Britain the former and in France the latter group has a small
majority. Even if the study only investigated these three countries, it seems likely that in most
industrialised countries � and probably in poorer countries as well � about half of the population � to a
lower or higher extent � cares about what they eat, whereas the other half doesn't. This may then help to
understand why and to what extent international food consumption will converge, and why at the same time
regional or national diets can still continue to exist. If in each country a large proportion of consumers is
willing to accept new products and consumption habits, whereas a similar large proportion of consumers
prefer their traditional foods, then both trends can co-exist at the aggregate country level. Conservative
food consumers may belong to the latter group, whereas adventurous ones will be part of the former.
However, it is also possible that most consumers adopt � to a lower or higher extent � new foods and
consumption habits, and also � at other occasions � still prefer traditional food, i.e. that both trends co-
exist at the level of the individual consumer. Under this scenario then, both trends can also co-exist at the
aggregate level. In order to better understand actual consumption behaviour, deeper insights into the
'mechanics' of consumer decision-making is required.
65 A multidimensional scaling (MDS) diagram which visualises the cluster results for German and French consumers only
can also be found in GRUNERT et al. (1998). The MDS configuration shows that although the country specific segments are similar with regard to their attitude towards new products and consumption habits, there is still a "clear cultural grouping of the segments" (p.13), indicating existing national differences across them.

2 ANALYSING INTERNATIONAL FOOD PRODUCT MARKETS AT THE AGGREGATE LEVEL 129
2.4.2.2 Explaining international food consumption
Microeconomic theory provides the standard approach to consumption modelling. Some important
extensions to it have been made within what is called Neo-classical Consumer Theory or Household
Production Theory. All these concepts will be reviewed in the following, before a new modelling approach
specific to food consumption is presented.
2.4.2.2.1 Traditional microeconomic consumption modelling
Traditional microeconomic consumption theory and demand analysis investigates the relationship
between the demand for goods and their prices and the incomes (or expenditures) of consumers, under the
assumption of utility maximisation and rational behaviour. That is, in mathematical terms, max U(q), where
U stands for utility and q is a vector of the quantities of n goods, subject to the income restriction
∑=
=n
iiiqpI
1 where I is income (or expenditure) and pi and qi are the price and quantity of each good i,
respectively. The analysis is often restricted to the case of two goods only (i.e. n = 2), but even then the
theoretical implications of this simple model are far-reaching and go into great detail. These theoretical
results will not be reproduced here, however see TANGERMANN (1986) for a good introduction into the topic
applied to the food consumer, SELEVANTHAN & CLEMENTS (1995) for an advanced treatment of demand
analysis with interesting results for alcohol consumption in OECD countries, TOUMANOFF & NOURZAD (1994,
Chapter 9) for algebraic consumer behaviour modelling using comparative statics techniques, and THOMAS
(1993, Chapter 9) for a practical treatment of applied econometric demand estimation. The most useful
result of this very reduced economic approach to model complex consumer behaviour � based on good
prices and consumer incomes only � is the derivation of the concept of price and income (expenditure)
elasticities. Applying these concepts to aggregate food consumption, own-price elasticities have consistently
been found to be negative and inelastic (i.e. lying between zero and one in absolute terms). Income
(expenditure) elasticities have consistently been estimated as positive but being also widely inelastic. Table
40 lists some recent estimates for OECD countries using advanced econometric techniques.
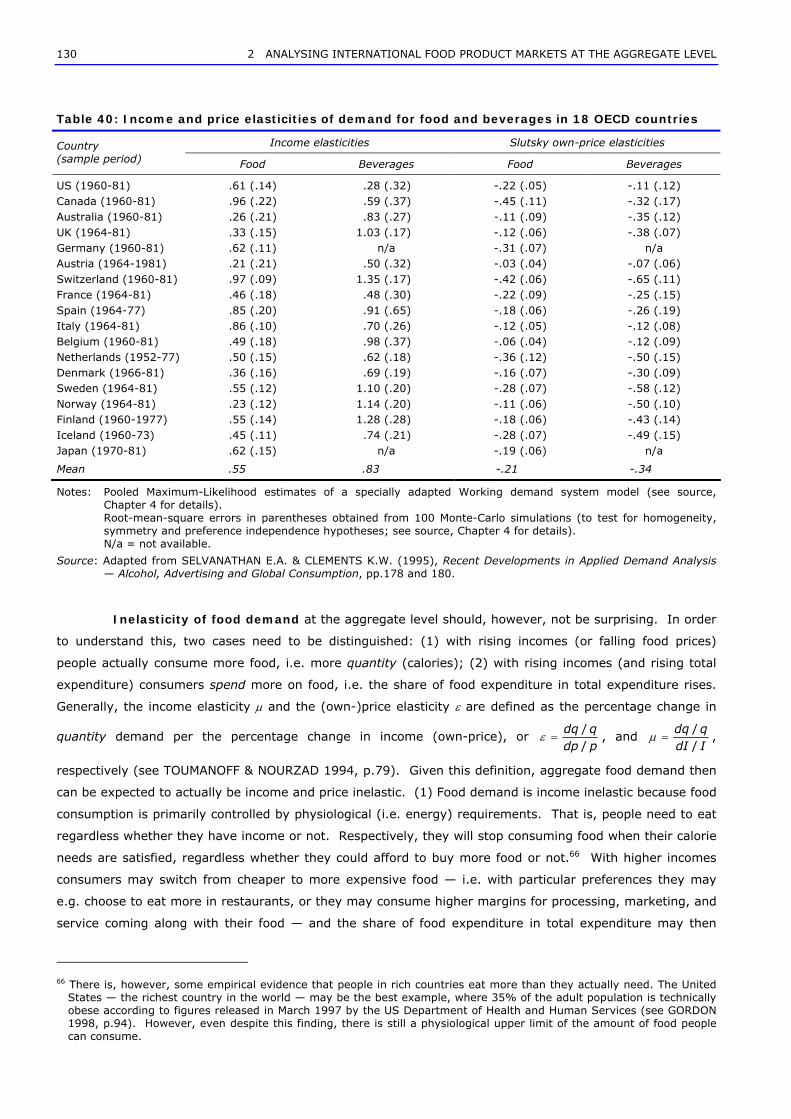
130 2 ANALYSING INTERNATIONAL FOOD PRODUCT MARKETS AT THE AGGREGATE LEVEL
Table 40: Income and price elasticities of demand for food and beverages in 18 OECD countries
Income elasticities Slutsky own-price elasticities Country (sample period) Food Beverages Food Beverages
US (1960-81) .61 (.14) .28 (.32) -.22 (.05) -.11 (.12) Canada (1960-81) .96 (.22) .59 (.37) -.45 (.11) -.32 (.17) Australia (1960-81) .26 (.21) .83 (.27) -.11 (.09) -.35 (.12) UK (1964-81) .33 (.15) 1.03 (.17) -.12 (.06) -.38 (.07) Germany (1960-81) .62 (.11) n/a -.31 (.07) n/a Austria (1964-1981) .21 (.21) .50 (.32) -.03 (.04) -.07 (.06) Switzerland (1960-81) .97 (.09) 1.35 (.17) -.42 (.06) -.65 (.11) France (1964-81) .46 (.18) .48 (.30) -.22 (.09) -.25 (.15) Spain (1964-77) .85 (.20) .91 (.65) -.18 (.06) -.26 (.19) Italy (1964-81) .86 (.10) .70 (.26) -.12 (.05) -.12 (.08) Belgium (1960-81) .49 (.18) .98 (.37) -.06 (.04) -.12 (.09) Netherlands (1952-77) .50 (.15) .62 (.18) -.36 (.12) -.50 (.15) Denmark (1966-81) .36 (.16) .69 (.19) -.16 (.07) -.30 (.09) Sweden (1964-81) .55 (.12) 1.10 (.20) -.28 (.07) -.58 (.12) Norway (1964-81) .23 (.12) 1.14 (.20) -.11 (.06) -.50 (.10) Finland (1960-1977) .55 (.14) 1.28 (.28) -.18 (.06) -.43 (.14) Iceland (1960-73) .45 (.11) .74 (.21) -.28 (.07) -.49 (.15) Japan (1970-81) .62 (.15) n/a -.19 (.06) n/a
Mean .55 .83 -.21 -.34
Notes: Pooled Maximum-Likelihood estimates of a specially adapted Working demand system model (see source, Chapter 4 for details). Root-mean-square errors in parentheses obtained from 100 Monte-Carlo simulations (to test for homogeneity, symmetry and preference independence hypotheses; see source, Chapter 4 for details). N/a = not available.
Source: Adapted from SELVANATHAN E.A. & CLEMENTS K.W. (1995), Recent Developments in Applied Demand Analysis � Alcohol, Advertising and Global Consumption, pp.178 and 180.
Inelasticity of food demand at the aggregate level should, however, not be surprising. In order
to understand this, two cases need to be distinguished: (1) with rising incomes (or falling food prices)
people actually consume more food, i.e. more quantity (calories); (2) with rising incomes (and rising total
expenditure) consumers spend more on food, i.e. the share of food expenditure in total expenditure rises.
Generally, the income elasticity µ and the (own-)price elasticity ε are defined as the percentage change in
quantity demand per the percentage change in income (own-price), or pdpqdq
//
=ε , and IdIqdq
//
=µ ,
respectively (see TOUMANOFF & NOURZAD 1994, p.79). Given this definition, aggregate food demand then
can be expected to actually be income and price inelastic. (1) Food demand is income inelastic because food
consumption is primarily controlled by physiological (i.e. energy) requirements. That is, people need to eat
regardless whether they have income or not. Respectively, they will stop consuming food when their calorie
needs are satisfied, regardless whether they could afford to buy more food or not.66 With higher incomes
consumers may switch from cheaper to more expensive food � i.e. with particular preferences they may
e.g. choose to eat more in restaurants, or they may consume higher margins for processing, marketing, and
service coming along with their food � and the share of food expenditure in total expenditure may then
66 There is, however, some empirical evidence that people in rich countries eat more than they actually need. The United
States � the richest country in the world � may be the best example, where 35% of the adult population is technically obese according to figures released in March 1997 by the US Department of Health and Human Services (see GORDON 1998, p.94). However, even despite this finding, there is still a physiological upper limit of the amount of food people can consume.

2 ANALYSING INTERNATIONAL FOOD PRODUCT MARKETS AT THE AGGREGATE LEVEL 131
even rise, but in general consumers will rarely buy more than they can eat.67 Therefore, food consumption
can be expected to be income inelastic in affluent societies. (2) Food demand at the aggregate level is also
very likely to be price inelastic, as there is no substitute for food. That is, if food as a whole � and
compared to other aggregates such as housing, textile, transportation, etc. � becomes more expensive,
consumers still need to buy it. That is, there is no choice (again apart from the switch from more expensive
to less expensive foods, which, however, will not influence strongly total food quantity demanded).
However, within the food group � and at the disaggregated product level � there are many choices
between similar foods, and thus many available substitutes. For example, imagine someone who feels like
eating something sweet and wants to buy a chocolate bar. As many consumers, this person may have a
favourite brand as long as price differences between similar products are small. However, if price
differences become too large for products that are perceived as close substitutes, she/he will switch to
cheaper brands. Therefore, if the favourite chocolate brand is sufficiently more expensive as e.g. a
competitor's product, which happens to be on special, a consumer is likely to buy the cheaper product. That
is, demand for individual brands is highly price elastic. However, now imagine cocoa becomes more
expensive on the world market, and as a consequence, all chocolate bars become relatively more expensive
than let's say (non-chocolate) biscuits or ice-cream. Then choices are more limited. Those consumers who
feel they can do without chocolate may choose other sweets. Others who feel that they still need chocolate
in order to feel happy will still buy it, even if prices have become more expensive. Thus, the aggregate
'chocolate products' is very likely to be less price elastic than are individual chocolate brands. Now assume
sugar becomes more expensive on world markets and, as a consequence, all confectionery becomes more
expensive relative to cereal products, vegetables, meats, dairy products, etc. Now choices are even more
limited: there is no real alternative to the sweet taste, and thus it seems unlikely that consumers will
substitute sweets for other foods. Those consumers who really need to watch their budgets may substitute
their carbohydrate needs for cereal products or potatoes, etc. However, many consumers will not accept
this as a real alternative and despite higher prices they will still purchase sweets. It is therefore clear that,
within the food group at least, price elasticities are a function of the number of available substitute products.
That is, the higher the aggregation level, the less real choice exists, and the less price elastic goods will be.
There is some empirical support for this hypothesis, see e.g. JONES (1997) who, in analysing US
supermarket scanner data for several carbohydrates, finds that there is only weak substitutability between
e.g. rice, potatoes, and pasta products. However, the estimated cross-price-elasticities show that there is
strong substitutability within a product group, i.e. between e.g. (cheaper) home brand pasta products and
(more expensive) national brand pasta products. Thus, JONES concludes that "... consumers look more
within the product categories than across product categories when making purchase decisions about lower
priced products" (p.610). Moreover, JONES' study reveals generally elastic and statistically significant own-
price elasticities at the level of individual products, which stands in contrast to findings of inelastic US
demand for selected aggregate carbohydrates groups (such as pasta, rice, and potatoes) which are based on
Nationwide Food Consumption Survey (NFCS) data (see e.g. RICHARDS et al. 1998).68 In summing up, it
should have become clear that inelastic food demand, at the aggregate level at least, is not a surprising
finding.
67 Wine or spirits may be the only exceptions, since they can be stored well and can even be used as an investment.
68 For a general discussion (in German) of different findings for food demand elasticities depending on data aggregation levels, and implications arising thereof see also HERRMANN (1997). For a description of the principal differences in the
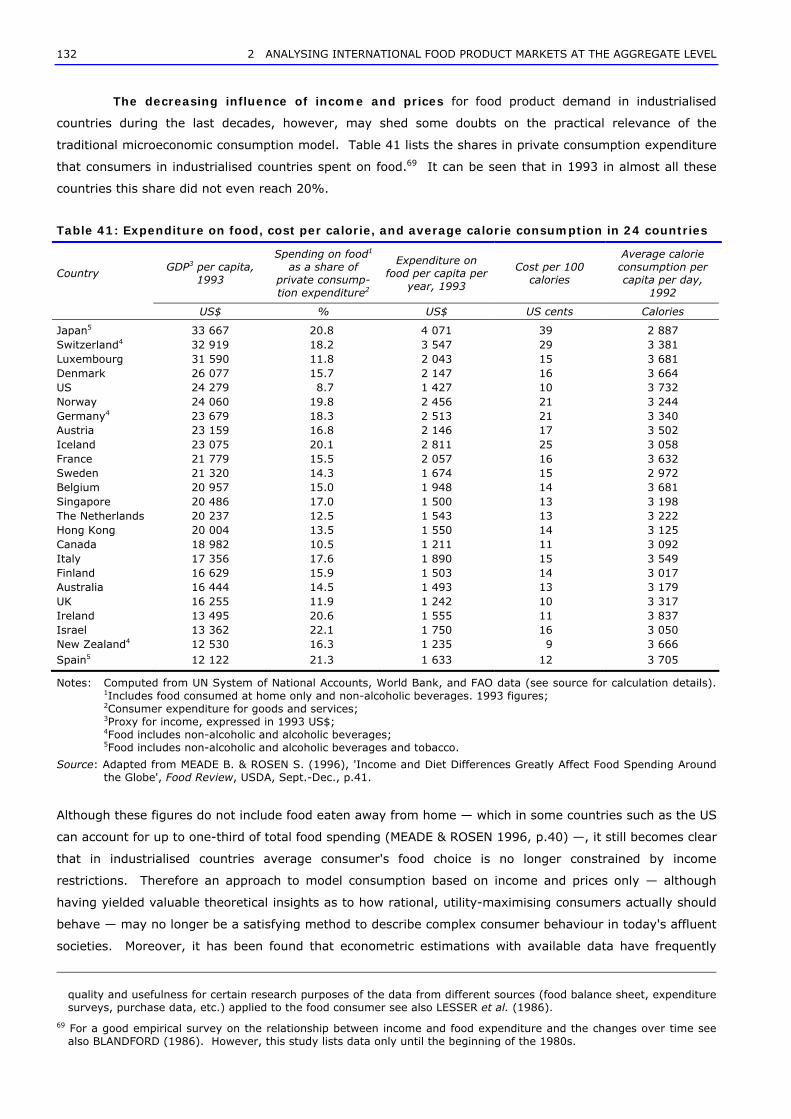
132 2 ANALYSING INTERNATIONAL FOOD PRODUCT MARKETS AT THE AGGREGATE LEVEL
The decreasing influence of income and prices for food product demand in industrialised
countries during the last decades, however, may shed some doubts on the practical relevance of the
traditional microeconomic consumption model. Table 41 lists the shares in private consumption expenditure
that consumers in industrialised countries spent on food.69 It can be seen that in 1993 in almost all these
countries this share did not even reach 20%.
Table 41: Expenditure on food, cost per calorie, and average calorie consumption in 24 countries
Country GDP3 per capita,
1993
Spending on food1 as a share of
private consump-tion expenditure2
Expenditure on food per capita per
year, 1993
Cost per 100 calories
Average calorie consumption per capita per day,
1992
US$ % US$ US cents Calories
Japan5 33 667 20.8 4 071 39 2 887 Switzerland4 32 919 18.2 3 547 29 3 381 Luxembourg 31 590 11.8 2 043 15 3 681 Denmark 26 077 15.7 2 147 16 3 664 US 24 279 8.7 1 427 10 3 732 Norway 24 060 19.8 2 456 21 3 244 Germany4 23 679 18.3 2 513 21 3 340 Austria 23 159 16.8 2 146 17 3 502 Iceland 23 075 20.1 2 811 25 3 058 France 21 779 15.5 2 057 16 3 632 Sweden 21 320 14.3 1 674 15 2 972 Belgium 20 957 15.0 1 948 14 3 681 Singapore 20 486 17.0 1 500 13 3 198 The Netherlands 20 237 12.5 1 543 13 3 222 Hong Kong 20 004 13.5 1 550 14 3 125 Canada 18 982 10.5 1 211 11 3 092 Italy 17 356 17.6 1 890 15 3 549 Finland 16 629 15.9 1 503 14 3 017 Australia 16 444 14.5 1 493 13 3 179 UK 16 255 11.9 1 242 10 3 317 Ireland 13 495 20.6 1 555 11 3 837 Israel 13 362 22.1 1 750 16 3 050 New Zealand4 12 530 16.3 1 235 9 3 666 Spain5 12 122 21.3 1 633 12 3 705
Notes: Computed from UN System of National Accounts, World Bank, and FAO data (see source for calculation details). 1Includes food consumed at home only and non-alcoholic beverages. 1993 figures; 2Consumer expenditure for goods and services; 3Proxy for income, expressed in 1993 US$; 4Food includes non-alcoholic and alcoholic beverages; 5Food includes non-alcoholic and alcoholic beverages and tobacco.
Source: Adapted from MEADE B. & ROSEN S. (1996), 'Income and Diet Differences Greatly Affect Food Spending Around the Globe', Food Review, USDA, Sept.-Dec., p.41.
Although these figures do not include food eaten away from home � which in some countries such as the US
can account for up to one-third of total food spending (MEADE & ROSEN 1996, p.40) �, it still becomes clear
that in industrialised countries average consumer's food choice is no longer constrained by income
restrictions. Therefore an approach to model consumption based on income and prices only � although
having yielded valuable theoretical insights as to how rational, utility-maximising consumers actually should
behave � may no longer be a satisfying method to describe complex consumer behaviour in today's affluent
societies. Moreover, it has been found that econometric estimations with available data have frequently
quality and usefulness for certain research purposes of the data from different sources (food balance sheet, expenditure surveys, purchase data, etc.) applied to the food consumer see also LESSER et al. (1986).
69 For a good empirical survey on the relationship between income and food expenditure and the changes over time see also BLANDFORD (1986). However, this study lists data only until the beginning of the 1980s.

2 ANALYSING INTERNATIONAL FOOD PRODUCT MARKETS AT THE AGGREGATE LEVEL 133
rejected important theoretical assumptions of consumer theory such as Symmetry and Homogeneity
(THOMAS 1993, p.231).70 Although it has been argued that existing estimation techniques may not yet be
powerful enough to capture all expected effects (and in particular dynamic effects) (ibid., p.232), it may
simply be that there is a principle incompatibility between the postulates of how consumer theory expects
consumers to behave, and the data, which reflect how consumers act in reality. THOMAS (1993, p.232)
therefore concludes that "a household's spending pattern depends not only on prices and total expenditure
but on vital demographic and social factors".
LANCASTER's product characteristics theory can be seen as a new approach to consumer
modelling. Whereas traditional consumption theory can be considered as a "coarse-structure" theory,
designed to analyse broadly conceived goods such as food, clothing, etc., LANCASTER's approach is the
"fine-structure" equivalent, designed to deal with the choice between differentiated products within a group.
LANCASTER (1991) 71 defines utility over product characteristics rather than over market goods. That is,
each unit of a market good (or commodity) qi contains different units of different characteristics zi (i = 1,...,
m), and utility is defined as a function of the vector z, i.e. U(z), with z = Bq. The matrix B is called
consumption technology which describes the relationship between the market goods (inputs) and the utility
generating product characteristics. This relationship is assumed to be linear, objective, and universal, i.e.
the characteristics possessed by a good � or a combination of goods � should be the same for all
consumers. The personal element in consumer choice arises from the individual selection of relevant
characteristics only, not from the allocation of characteristics to the goods. Consumers differ because
individual preferences determine the relative weights given to the various characteristics in making choices,
and choosing different subsets of market goods are then optimal ways to achieve different preferred bundles
of characteristics. As in the traditional model, there is a budget constraint pq ≤ I where p is the vector of
the market prices of the consumed commodities and I is the consumer's total income. The budget
constraint is defined on the "goods-space" (G-space), whereas U is defined on the "characteristics-space"
(C-space). To relate the budget constraint and the utility function, there are two possibilities: (1) to
transform the utility function into G-space, i.e. U(z) = U(Bq) = u(q) which is a new utility function that
depends crucially on the structure of the matrix B. (2) To transform the budget constraint into C-space,
which will result in the need to determine the monetary value of each individual characteristic zi, its so-called
"shadow price". These price components can be quantified econometrically, a procedure with is known as
hedonic price estimation. Either way, given a price vector consumers will maximise utility in that for every
characteristics vector, they will choose the most efficient combination of goods to achieve that collection of
characteristics, and the efficiency criterion will be minimum cost (ibid., p.19). In short, LANCASTER's
approach, as traditional consumer theory, is concerned with the optimal allocation of income (or total
expenditure) between various goods, with the only difference being that marginal rates of substitution, now
70 Homogeneity (of degree zero) means that an equiproportionate change in all prices and total expenditure should leave
total demand unchanged, which in a n equation demand system implies that the sum of all price elasticities plus the total expenditure elasticity equals zero. Symmetry of the substitution effects (i.e. with constant income, the effect of an increase in the price of good j on the demand for good i is equal to the effect of a price increase of i on the demand of j) is another important theoretical restriction, as is Negativity of the own-price effects (SELVANATHAN & CLEMENTS 1995, p.7-8 & 161).
71 LANCASTER (1991) is a collection of earlier papers of the author, most of which were already published in the 1960s and 70s. In the 1991 book these papers are, however, adjusted to each other in order to create a coherent monograph, and they are supplemented with a summarising introduction. Therefore, in the following, only this book will be referred to instead of the original papers.

134 2 ANALYSING INTERNATIONAL FOOD PRODUCT MARKETS AT THE AGGREGATE LEVEL
specified between characteristics, must equal the implicit characteristics price ratios, and not the market
price ratios. Thus, the underlying economic rationale is in fact not new, just more difficult to apply.
Household production theory may be seen as an even more innovative approach to
consumption modelling. BECKER (1965) argued that, similar to the LANCASTER model, households do not
derive utility directly from market goods (or services). Rather households use these goods and services �
together with their available time t � as inputs for the "production" of so-called Z-goods such as e.g. health,
social standing and reputation, pleasures of the senses, etc. These non-market Z-goods are seen as the real
sources of utility. Thus, the production of amount zi of the i's Z-good is a function of a vector of necessary
market goods qi and the time ti needed to transform qi into zi, or zi = f(qi, ti). The really new idea is,
however, that there are actually two resource constraints that restrict the maximisation of the utility
function U(z). (1) There is the usual budget constraint where the sum of all expenditures on the purchased
market goods must not exceed available income, i.e. (as defined above) pq ≤ I. (2) The sum of the ti,
necessary to produce the Z-goods, must not exceed total available spare time, where this time is the
difference between total available time for an individual, T, minus the amount of it spent working to
generate monetary income, tw, i.e. ∑=
+=m
iiw ttT
1. However, both restrictions can be combined in a single
one, using the wage rate w to calculate "full income" S, i.e. S = wtw + V, where V is other non-wage income.
S can then be transformed into ∑=
+=m
iiii xpwtS
1)( , and this equation can be used in a Lagrange
maximisation of the utility function instead of the usual income restriction. The maximum condition then
yields jijjjjj
iiiiiji MCMC
dzdtwdzdqpdzdtwdzdqp
MUMU /)/()/(
)/()/(/ =
++
= , where MUx and MCx (x = i, j) denote the
marginal utility and the marginal cost of two Z-goods i and j, respectively. As it can be seen, the general
maximum condition is, in principle, the same as for ordinary market goods. However, in this case, the
marginal costs are shadow prices of the Z-goods, determined by the prices of the market goods and the
opportunity cost of time ti used for the production of Zi. In short, the inclusion of production in the theory of
consumption induces the household to minimise production costs and thus to maximise utility in response to
changes in prices, productivity, relative shadow prices, and changes in full income. As a consequence, a
decrease in the price of one of the production factors will force the household to prefer the production
process which uses this factor more intensively, and to increase the consumption of the resulting good.
None of the presented approaches to describe consumption behaviour is, however, particularly
useful in gaining understanding of why e.g. consumers may choose foreign food products over nationally
produced ones, why international food consumption is becoming internationally more similar, or how
"externalities" such as health and environmental concerns can significantly influence food product choice. In
fact, all presented models are not so much models of product choice but rather models of optimal budget
allocation. There is, therefore, need for a new approach to consumption modelling and in particular for one
that is able to incorporate "new" determinants which influence product choice, and which is not based on
income and prices only. Given the fact that these non-monetary determinants are less easy to quantify,
this new approach will perhaps be less elegant and less mathematical. However, this does not necessarily
mean that it has less analytical rigour. Moreover, it would be useful to specify a model specific for food
consumption, which however will necessarily mean that it would be less general. But, on the other hand,
this model may provide a more detailed and perhaps a more realistic picture of reality. Finally, a new

2 ANALYSING INTERNATIONAL FOOD PRODUCT MARKETS AT THE AGGREGATE LEVEL 135
approach should still be an economic one, in the sense that it deals with limited resources, trade-off
situations, and optimisation problems. After all, economics is concerned with any kind of resource allocation
and it is not restricted to monetary variables only. Maybe one of the best summaries of the determinants of
modern food consumption has been given by GOLDBERG R. (1999, p.228):
The choices of [food] consumers will be guided more and more by their search for the following: good value for money; better food safety; greater attention to the nutritional values and composition of products in order to follow a balanced diet; particular attention to the production process with a preference for products that have a low environmental impact and a "natural" value. It should be emphasised that food and diet have important entertainment and social values, especially in industrialised countries. These influence the buying decisions for certain goods by giving relevance to some emotional aspects such as: the image of luxury, the exclusivity of the product, the desire for self-gratification and adventure (for new foods or those originating from traditions different from one's own), the image of and values associated with the product's country of origin.
Another attempt to identity and to evaluate all factors that influence food choice (from a point of view of the
social sciences) may be seen in the book The Food Consumer, edited by RITSON et al. (1986). Although
this work offers many valuable insights in the complexities of the modern food consumption problem, it does
not provide a formal model which would be able to incorporate at least some of the findings. In the
following, it will therefore be attempted to lay at least the first foundations for a formal model of food
consumption, and to draw some conclusions from it.
2.4.2.2.2 A dynamic model for modern food consumption
A broader perspective on food choice was provided by ROZIN et al. (1986, p.86) who argue that
economic factors such as price, product availability, and income influence only the actual consumption (the
'use') of food, i.e. what and how much is chosen. However, this choice will not always reflect our real
preference. One might 'prefer' steak to bread but still eat ('use') more bread because of its price or
availability. Furthermore, people will not always prefer what they have a liking for (i.e. an affective
response to a good as opposed to a rational one). A dieter might 'prefer' lettuce to cake but still like cake
better. Of course, these concepts are clearly related. All other things being equal, people eat (use) what
they prefer, and prefer what they like. Economic factors, thus, can influence the use but do not determine
preferences or likings. Moreover, in times of economic affluence where higher real incomes mean less
constraints on consumption choice for large parts of the population, it is obvious that personal preferences
have become more important for purchasing decisions. Although individual preferences may be hard to
determine and to quantify, they must still be considered in a modern model of food consumption. In fact,
such a preference structure is similar to what LANCASTER (1991) calls consumption technology (matrix B,
see above). It describes the mechanism of how from the objective characteristics of goods � equal to all
consumers � the individual relevant characteristics, which actually spend utility, are selected and weighted.
In the following food choice model individual preferences will be introduced as a matrix Pi. This matrix gives
the 'code of selection' which describes how objective food is transformed into subjective utility.
Utility from food consumption may, in general, result primarily from the consumption of a
bundle of different foods. Meals are such food bundles composed of a variety of different foods and which
are often accompanied by drinks. Furthermore, in some countries there is also a certain meal structure,

136 2 ANALYSING INTERNATIONAL FOOD PRODUCT MARKETS AT THE AGGREGATE LEVEL
consisting typically of more than one dish, accompanied and finished by appropriate drinks.72 Similarly,
even a 'fast food' meal consists normally of more than one item, a typical example may be the hamburger
with chips (french fries) and a soft drink. Sometimes, of course, a meal can consist of a single food item
only, then it is called a snack. Yet, in general, a meal can be described as a vector of different ingredients
and accompanying products (drinks). In fact, some ingredients may only spend utility within such a
combination of different foods. For example, spices or vegetable oils are mostly consumed as part of a
(cooked) dish, and not very many people would eat pepper corns or olive oil on its own. Thus, it seems that
the utility derived from a meal is more than the sum of the utility of the individual ingredients used for the
meal. Moreover, a meal can offer even more than just nutritional value. Or, as LANCASTER (1991, p.13)
put it:
A meal (treated as a single good) possesses nutritional characteristics but it also possesses aesthetic characteristics, and different meals will possess these characteristics in different relative proportions. Furthermore, a dinner party, a combination of two goods, a meal and a social setting, may possess nutritional, aesthetic, and perhaps intellectual characteristics different from the combination obtainable from a meal and a social gathering consumed separately.
Thus there are positive externalities (i.e. additional utility) that can come with a meal, and therefore a meal
can be also be summarised as a vector of potentially utility spending characteristics.
Utility spending characteristics of meals can be classified into the following categories (see
e.g. VON ALVENSLEBENS 1997; SCHAFFNER et al. 1998, Chapter 3; PIERSON & ALLEN 1994). The
significance of each characteristic will be discussed in more detail later in this chapter.
Energy (calorie) needs may be seen as the main driver for food consumption. Every person needs
calories in a limited range, i.e. there is a minimum and a maximum level. Moreover, food energy is needed
regularly, i.e. generally it is not possible to eat only e.g. once a week and then do without food in between
these "fill-ups". The calorie contents of a meal can be measured easily and in the following model it will be
referred to it as c.
Taste and the desire to enjoy foods. This characteristic may not be important for all people, and it
even will not be equally important for the same person at any meal. However, in general, most consumers
will choose foods according to their individual taste requirements, other things being equal. This variable
may be difficult to quantify and therefore in the following model it will be referred to it as θ.
Health proprieties of food may be scientifically justified or not, but for many people they seem to
be important, and thus they do affect food choice. The "true" health value of a meal or a food may also be
difficult to determine, therefore it will referred to this variable in the following as ξ.
Status or prestige is another feature of a meal that can be very important for some people and
unimportant to others. In almost every country, expensive restaurants can be found, and luxury food
products such as caviar, champagne, etc. are available. But even for less expensive products such as e.g.
beer or soft drinks the brand image can be a very important purchasing criteria. The "true" status contents
of a meal (or a single food item) is again difficult to quantify, and in the following it will referred to it as ψ.
72 For example, YON & BERNARD (1993, p.122) show for the case of France that there is "... a majority of consumers
following the traditional way of eating: Three meals (breakfast, lunch and dinner) with a very structured composition of the main meals (starter, main dishes, cheese, and dessert)". However, ASKEGAARD & MADSEN (1995, p.2-3) show that in Europe a border exists which runs between Germany and France, through the southern part of Belgium, northern France and western Switzerland. North of this line there is an overwhelming preference for the 'single dish' meal, whereas south of the line there is a general majority in favour of the several courses comprising a 'composite meal'.

2 ANALYSING INTERNATIONAL FOOD PRODUCT MARKETS AT THE AGGREGATE LEVEL 137
Environmental, political and ethical motives have become increasingly important for some food
consumers. The growing significance of organically produced foods in many industrialised countries may be
seen as evidence for this. Religious aspects of food choice may also be summarised within this factor. Once
again, these characteristics are difficult to quantify and therefore it will be referred to in the following model
as φ.
Time for food consumption is needed not only for the eating process itself; with it comes also time
consuming activities such as shopping, cooking, washing up, etc. These activities, however, can be
"outsourced" in our economically highly differentiated societies. Thus, people who value the opportunity
costs of the time spent for preparation and accompanying activities as high can choose between industrially
pre-cooked ready-to-eat dishes, take-away meals, or going to a fast-food chain outlet or a restaurant. The
rapidly increasing significance of these services show that for many people the time needed to spend on food
consumption is rather utility-decreasing than increasing. That is, many people may minimise these time re-
quirements.73 Time needed for food consumption can be measured; in the following it will referred to as t.
The price or cost for a meal may also be seen as a utility-influencing characteristics of food
consumption. Very often this aspect of a meal will be utility decreasing as it reduces the amount of the
available budget needed or wished to be spent on other (non-food) items which may increase overall
consumer utility by more. As food spending is a necessity, many people thus will try to minimise the total
cost needed for their diet requirements. However, in modern affluent societies it has been found that
sometimes products (included food items) sell, not because they are cheap, but because they are actually
highly priced. Moreover, occasionally we get meals for free and then utility from such a meal will be higher
than from the same one where we have to pay for it. In the following, the price of a meal will be referred to
as p.
Algebraically, it can then be stated that an individual derives utility from food in the form of the
characteristics offered by a meal, or:
U = f(ms*) [2.4.2.2.2-1]
where ms* is the vector of the � individually different � utility spending characteristics, and which is the
result of the consumer individual weighting process of the � objective � characteristics contained in a single
meal ms. That is,
ms* = Pi ms [2.4.2.2.2-2]
where the individual preference matrix Pi, and the utility spending characteristics vectors ms and ms* of a
single meal are defined as follows:
73There might be some exceptions where the time spent on a meal may actually increase a meal's total utility, e.g. when
someone has to wait for a train or a flight and prefers to spend this time in a restaurant or coffee shop (i.e. in situations where not eating, i.e. not making use of a convenient opportunity, would actually lead to opportunity costs for later activities).

138 2 ANALYSING INTERNATIONAL FOOD PRODUCT MARKETS AT THE AGGREGATE LEVEL
ms*
=
*
*
*
*
*
*
*
s
s
s
s
s
s
s
tp
c
φψξθ
, Pi =
it
it
it
it
it
it
it
ip
ip
ip
ip
ip
ip
ip
iiiiiii
iiiiiii
iiiiiii
iiiiiii
ic
ic
ic
ic
ic
ic
ic
pc
tc
tpc
tpc
tpc
tpc
tp
ωωωωωωωωωωωωωωωωωωωωωωωωωωωωωωωωωωωωωωωωωωωωωωωωω
φψξθ
φψξθ
ψξθ
φξθ
φψθ
φψξ
φψξθ
φφφφφφφ
ψψψψψψψ
ξξξξξξξ
θθθθθθθ
, ms
=
s
s
s
s
s
s
s
tp
c
φψξθ
, with:
c = calories, θ = taste, ξ = health, ψ = status, φ = environment, p = price, t = time, and the
ixω , x ∈[c, θ, ξ, ψ, φ, p, t], are the individual "own" weights with respect to each characteristics, and the
ixy
ω , x, y ∈[c, θ, ξ, ψ, φ, p, t] and x ≠ y, are the individual "cross" weights, which indicate complement (when
positive) or substitute (when negative) relationships between the individual characteristics.
The characteristics, chosen here, may look like an adhoc selection, but they are coherent with
the relevant literature. Moreover, for this model the number of the characteristics included does not really
matter, and others could be added without problem. The only consequence would be that the more
characteristics that are incorporated in the model, the more difficult it may become to determine the utility
maximum. The chosen characteristics can be seen as factors representing a whole set of variables. For
example, the health factor may summarise many contributing effects from the different nutrients; and the
environment vector may contain food production features such as animal health as well as the (non-) use of
pesticides, etc. Important is, however, that in the following it will be assumed that these characteristics
factors are independent of each other, i.e. their cross weights ixy
ω are assumed to be all zero. That is, there
are no substitution or complement effects between these characteristics, and thus Pi simplifies to
Pi =
it
ip
i
i
i
i
ic
ωω
ωω
ωω
ω
φ
ψ
ξ
θ
000000
000000
000000
000000
000000000000000000
. [2.4.2.2.2-3]
The remaining own-weights ixω , x∈[c, θ, ξ, ψ, φ, p, t], can take any positive or negative value, including
zero, depending on the individual preference structure. Thus, people who do not care much about
environmental concerns in food, will have iφω equal to zero. An average food consumer will have positive (or
partly zero) weights, apart from the price and time characteristics. These two may, as argued above,
represent overall utility decreasing rather than increasing aspects of a meal, thus in general ipω and i
tω will
be negative.
The simplification of the preference matrix has important consequences for the underlying
utility function. In traditional microeconomic consumption theory utility is defined over market goods, which

2 ANALYSING INTERNATIONAL FOOD PRODUCT MARKETS AT THE AGGREGATE LEVEL 139
are assumed to be substitutes for each other. That is, consumers are, in principle, indifferent between
individual goods and choose the optimal consumption level of a pair of goods according to their marginal
utility / price ratios.74 However, in this new model, utility is defined over independent characteristics, which
cannot be substituted for each other. Thus, there is no indifference relationship between them. That is, one
cannot trade calories against e.g. environmental concerns, although the latter for some people may be
unimportant. The point is however that utility resulting from environmental aspects may "top up" the utility
derived from the calorie contents of a meal. In the traditional theory, utility cannot be increased further,
once the efficient goods combination has been realised, unless income rises or prices fall. In the new model,
even with income remaining the same, and two � otherwise identical � goods having the same price, utility
will be higher when one good offers a non-monetary characteristics (an "externality") such as a superior
taste, a higher status value, or the advantage of being produced in an environmentally-friendly way. The
advantage of such an 'adding-up' concept of the 'part utilities' derived from individual characteristics is that
total utility can be defined as a linear function. This makes the maximisation process easier. Furthermore,
it must be considered that, in general, people consume more than one meal a day in order to meet their
energy (and other nutrient) needs. That is, the full utility of food consumption � which in very basic terms
means to assure life, as without food anybody would die within 40 days or so � is only reached with d food
(included drinks) intakes a day. Thus, daily total utility derived from food consumption can be defined
algebraically as the sum of the part utilities derived from each characteristics contained in each meal (or
other food/drink intakes) consumed during the day, or
U( ∑=
d
ss
1
*m ) = )(1
*
1
*
1
*
1
*
1
*
1
*
1
* ∑∑∑∑∑∑∑=======
++++++d
ss
d
ss
d
ss
d
ss
d
ss
d
ss
d
ss tpcf φψξθ . [2.4.2.2.2-4]
The time horizon for this utility function, however, is not limited to the period of one day. This
is for two reasons. First, even calorie intakes, as the most time-critical variable, can be stretched over a few
days, although most people, in general, will have regular meals every day. That is, one will not lose much
utility deriving from calorie intake, if there is a day without food, as long as this energy loss will be
recaptured during the following days. Second, all the other variables are clearly less time-critical. Even if
most people have their own taste requirements, i.e. a preference for certain foods, they will eat other (not
so favourite) dishes in situations where choices are limited, without losing much (taste) utility, as they can
re-compensate later on. Thus, during a longer period � maybe a month or so � there may be a minimum
amount of their favourite tastes they want to consume. From this follows in return that when do people not
have the opportunity to re-compensate within this period, they may loose utility and eventually deviate from
their optimum long-run utility levels. A similar reasoning can be applied to the variables ξ, ψ, and φ.
Consumers may have � within a certain longer-run period � minimum consumption requirements of the
� abstract � characteristics of health, status, and environment proprieties of food, but they will not need to
consume them with every meal or even every day. For the variables p and t the time restrictions are more
conventional and easier to identify. The sum of the expenditure on the individual meals must stay within a
certain (let's say monthly) budget determined by income (or savings) of a consumer. The total time needed
74 That is, the marginal rate of substitution U1/U2 between good 2 and good 1 (i.e. the negative of the slope of the
indifference curve) must equal P1/P2 (i.e. the negative of the slope of the budget constraint). Algebraically,
2
1
2
1
2
1
//
PP
XUXU
UU
=∂∂∂∂
= (see TOUMANOFF & NOURZAD 1994, Chapt. 9).

140 2 ANALYSING INTERNATIONAL FOOD PRODUCT MARKETS AT THE AGGREGATE LEVEL
for food consumption (maybe within a week) is likely to take an upper limit too for many consumers,
although there may be differences depending on the day. For example, a weekday's breakfast may have a
different time frame than a weekend's one. In more detail, the following restrictions on the utility function
can be specified.
Energy constraints depend on gender, age, and the level of physical activity during the day. In
general, the United Nations recommend 2100 calories a day as a minimum to sustain life without allowing
for work or play. This is less than the 2300 calories that the US Agency for International Development uses
as a threshold level to determine food aid needs (MEADE & ROSEN 1996). Moreover, there is some
discussion as to whether people can adapt their energy requirements to their environment, where
"adaptation includes shorter-run adjustment to variations over time in energy intakes and expenditures
around unchanging means (homeostatis) and longer-run adjustments to changes in the means through
changes in body weight" (BEHRMAN & DEOLALIKAR 1988, p.655). Thus, it is not completely clear if there is
a single 'universal' minimum calorie level equal to all humans, or whether this level is � more realistically �
determined individually. The existence of such a lower minimum level for every human is the main reason
why all people derive utility from food consumption: food energy assures life. Thus, there is a minimum
base level that needs to be reached, and the individual weight icω in the preference matrix Pi can never be
zero. On the other hand, in modern societies there is also a maximum calorie level that many weight-
watching consumers may not want to exceed, unless perhaps on special occasions. But even then, one day
of excess calories will be probably followed by a diet day, and therefore average daily calorie intake should
be fairly stable. In order to incorporate these restrictions into the model, two critical values will be
specified:
iCmin refers to the daily individual minimum calorie level needed to assure life, and iCmax to the daily
maximum calorie level, determined by personal choice.
Taste considerations for food choice have been found to be important for most consumers. For
example, PIERSON & ALLAN (1994, p.70) argue that "food marketers frequently rank taste as the most
important consumer attribute. ... In this indulgent society, when foods taste good enough, they may be
eaten regardless of their nutritional shortcomings. For most people, taste and flavor is paramount." This
view is supported by VON ALVENSLEBEN (1997, p.213) who argues that "In every society we find a basic
desire to enjoy food." However, at the level of the individual consumer, there may be large differences with
respect to the value individuals put on this characteristics.75 Thus, the individual weight iθω can take large
positive values as well as zero. Even negative values are imaginable, in situations where people are forced
to eat food, despite not liking their tastes. An example for this would be, when people under the threat of
starving to death start to eat insects or reptiles. Clearly, although these "foods" may provide the same
amount of life saving calories, people would be better off if they had better tasting alternatives available.
On the other hand, there can be large differences in how different people judge the taste of the same foods
and therefore these differences must be explained by differences in the preference matrix Pi instead of being
rooted in the 'objective' attributes of a single food or a meal, i.e. in the vector ms. Thus, the taste
75 STIGLER & BECKER (1977) suggested that tastes are stable over time and similar among people, and showed that
differences in the choices that people make can be related to different amounts of "human capital" that they accumulate over time. This may be possible, but the consequences of assuming different capital stocks or different tastes are in fact the same: people do make different choices even when having the same incomes and facing similar product prices.

2 ANALYSING INTERNATIONAL FOOD PRODUCT MARKETS AT THE AGGREGATE LEVEL 141
characteristics of available foods (meals) can also decrease the overall utility derivable from food
consumption. For consumers, whose taste weight iθω is non-zero, there will thus be a minimum amount of
taste utility that they may want to reach within a given period. The length of this period may differ between
consumers, as may the total amount of their "taste needs". In the following, this total amount will be
referred to as Θ i.
Health aspects (including food safety) of food consumption have an objective and a subjective
component. On the one hand, there is clear scientific evidence that food is more than just energy intake.76
The human organism needs different nutrients, substances which are necessary for growth, development,
and performance. Different foods contain different amounts of essential nutrients such as carbohydrates,
fats, proteins, vitamins, and minerals. Different people have different needs of these nutrients, depending
on gender, age, and the level of physical activity. Thus, it is obvious that different diets fulfil these different
nutrient requirements only to different degrees. That is, some diets are more "healthy" in this respect than
are others. However, on the other hand, there is considerable discussion on the "real" health consequences
of malnutrition. Nutrition is only one factor among many that influence human health and the interactions
between the different determinants are complex and numerous (see BEHRMAN & DEOLALIKAR 1988).
Moreover, nutritional health effects are mostly long-run which makes the assessment of the impact of the
health value of foods on the actual (mainly short-run orientated) food selection and buying process difficult.
Nevertheless, for many consumers in today's affluent societies health considerations do increasingly matter.
The time frame for the urge to consume "healthy" foods is difficult to determine and probably depends on
the individual consumer, as does the total amount of this consumption. It is likely that the demand for
healthy foods will vary over time, and e.g. it will be higher during periods of sickness. Moreover, as VON
ALVENSLEBEN (1997, p.213) argues, health consciousness rises with age. In the following, the minimum
level of 'health delivered through food' will be defined as Ξ i, and the period in which people may want to
consume this amount will be assumed as one year.
Status and prestige motives which influence food selection may clearly not be important for
everyone. There is probably a strong positive correlation of this factor with income, but the variance at any
point of this trend line may also be high, i.e. at any income level the weight iψω in the individual preference
matrix Pi may take quite different values. Many other aspects � apart from income � may influence this
factor, too. Culture, traditions, profession, psychological factors, etc. can affect the decision process which
determines e.g. how often people choose a restaurant meal over a sandwich, invite guests for dinner
parties, or buy champagne and caviar for New Years' Eve, instead of beer and potato chips. For example,
VON ALVENSLEBEN (1997, p.215) argues that "people with low self-confidence tend more often to prestige
consumption than people with high self-confidence, who depend less on the opinion of other people."
Business people may regularly lunch in expensive restaurants with their business partners, and people in
public life are sometimes characterised in books, magazines, etc. by the way and by what they eat.
However, even "ordinary" people may put value on the status content of a meal. For example, MURCOTT
(1986, p.124) argues that traditionally � in Anglo-Saxon societies � a proper dinner must be cooked and it
must be "... taken at home, earned by the husband (father) and cooked by the wife (mother)", indicating
76 See BENDER (1986), GORDON (1998, p.94-95), and SCHAFFNER et al. (1998, p.77-83), for some excellent overviews
on this topic and a discussion of the "hard" research findings within the inexact science of nutrition.

142 2 ANALYSING INTERNATIONAL FOOD PRODUCT MARKETS AT THE AGGREGATE LEVEL
that a different kind of dinner � maybe from a take-away, but equal in nutritional and taste proprieties �
would not give the same amount of satisfaction, i.e. utility. Furthermore, image aspects are at the heart of
any brand, and the food and drink industries are one of the most heavily-branded industries in the world
(see JONES & MORGAN 1994). Thus, although hard to quantify, a total amount of "status quantity", which
consumers may strive for to consume over, let's say a year, is introduced in the following model, and it will
be referred to it as Ψ i.
Environmental, political and ethical concerns may be seen as relatively new issues which affect
todays' consumers in their choice of food products. However, the importance of these aspects has been
growing rapidly. For example, in the US in 1995 organically-grown produce represented US$3bn or about
9% of the US$32bn produce retail market, and overall organic food sales doubled between 1990 and 1995
to reach about US$8bn (GORDON 1998, p.97). Apart from this aspect, there are also increasing consumer
concerns which are related to e.g. waste disposal, packaging, pollution, animal welfare and rights, worker
safety and welfare, roles of advertising, forms of competition, prices and profits, and the wise use of energy
(PIERSON & ALLAN 1994, p.74). In the following, all these different variables will be summarised into one
single factor, as it seems likely that consumers who care about specific production methods will also be
aware of related political issues, and thus the weight iφω in their individual preference matrix Pi will be non-
zero. As before, these concerns may be difficult to quantify exactly, but for the sake of the model, a certain
� consumer individual � minimum level of environmental. political, ethical etc. 'quantity' will be assumed
here which may be felt by some consumers to be consumed via food within a certain period of time. This
minimum level will be referred to as Φ i, and as a time frame one year will be assumed.
Price and time constraints, finally, are more conventional. The sum of the expenditure spent on all
purchased food items must stay within a certain budget, which is determined by either income or savings or
both. Food can, however, also be given as a gift, in which case its consumption does not affect an existing
budget; or it can be grown for personal use in individual gardens or on subsistence farms which even in
some developed countries (e.g. the Mediterranean area) is not uncommon. In this case, food can be
consumed at a much lower price, but the home production may involve higher time requirements. Time, in
fact, can be seen as another major constraint for food consumption in modern societies, perhaps mostly
because the opportunity costs of the time spent on it may have become higher. In highly differentiated and
free societies the opportunities to use available time in the private as in the professional field for nearly
anyone are manifold, and many consumers may want to make use of these options rather than to spend
their time on long-lasting activities such as meal-planning, food shopping, in-home handling and storage,
food preparation and serving, eating, and mealtime clean-up. On the other hand, some people may derive
much utility from shopping, cooking and eating, as they may consider these activities as a better use of
(non-working) time than e.g. watching TV, or playing cards or computer games, etc. In any case, available
time for food consumption and accompanying activities will be limited for most consumers, and therefore a
certain maximum level can be specified. As time frames for the budget and food consumption time
constraints a month and a week will be assumed, respectively. The individual maximum values will be
referred to as Bi and Ti.

2 ANALYSING INTERNATIONAL FOOD PRODUCT MARKETS AT THE AGGREGATE LEVEL 143
The following optimisation problem can thus be specified which describes the food
consumption problem that a consumer faces over a long-run period, here assumed as a year:
Maximise ∑∑∑∑∑∑∑=======
++++++y
ss
y
ss
y
ss
y
ss
y
ss
y
ss
y
ss tpc
1
*
1
*
1
*
1
*
1
*
1
*
1
* φψξθ over a period y (e.g. a year)
Subject to:
energy constraints id
ss Cc min
1
* ≥∑=
and
id
ss Cc max
1
* ≤∑=
over a period d (e.g. a day)
taste constraint iw
ss Θ≥∑
=1
*θ over a period w (e.g. a week)
health constraint iy
ss Ξξ ≥∑
=1
* over a period y (e.g. a year)
status constraint iy
ss Ψψ ≥∑
=1
* over a period y (e.g. a year)
environment constraint iy
ss Φφ ≥∑
=1
* over a period y (e.g. a year)
budget constraint im
ss Bp ≤∑
=1
* over a period m (e.g. a month)
time constraint iw
ss Tt ≤∑
=1
* over a period w (e.g. a week).
This maximisation process is different to a linear programming problem as two new aspects
need to be considered. First, the inputs that enter into this model are not single units of the individual
characteristics, but bundles (meals) of several combined characteristics coming in different quantities. That
is, if someone wants to consume e.g. taste, this consumption will, in general, only come with a cost: the
simultaneous decrease of the limited "stocks" of money, time, and calories. Thus, consumers almost always
faces trade-off problems when deciding on a meal. Second, the different time frames of the individual
constraints extend the choices for consumers (and for the maximisation algorithm). Food consumption is a
continuos process (when seen over a longer period) and thus there is no single big allocation decision to
make but many little ones. This implies that one decision often is influenced by a previous one or can affect
a following one. For example, after a long dinner party people may not feel like having a big breakfast, and
after a week of fast food, people may have a desire for something home-cooked. Therefore, the longer-run
time limits imposed in the model mean that within a series of food intakes only some need to contribute to
fulfil the restrictions and some do not, which increases choice. The actual technical optimisation algorithm
will not be investigated in the following, as it would it be beyond the scope of this introduction into the
model. However, the next sub-section will discuss some important implications which can be derived from
this model.

144 2 ANALYSING INTERNATIONAL FOOD PRODUCT MARKETS AT THE AGGREGATE LEVEL
2.4.2.3 Implications for consumers and international food product marketers
The food selection process depends on (i) the individual preference matrix Pi, and (ii) the individual
needs (C imin, Θ i, Ξ i, Ψ i, Φ i) and resources (C i
max, B i, T i), and their time frames as expressed in the
constraints. Both determinants are, however, connected, and a non-existent need implies a zero
corresponding weight in the preference matrix. For example, for consumers who are not concerned about
e.g. environmental externalities of food, Φ i and the corresponding weight in the preference matrix, iφω , will
be zero. Yet people with no interest in the environmental aspects of food production may occasionally still
consume e.g. organically grown food, i.e. products which are high in φs, but φs will not affect these
consumers' optimisation processes, as their Φ i and iφω are both zero. This implies that people with simple
preferences and needs, and not too restricted resources, face a much simpler optimisation problem. For
example, imagine someone who derives utility from food consumption from calorie intake only. This utility
must reach a certain minimum level (in order to assure life, as stated earlier). That is, there is a constant
minimum utility iCmin . All other utility spending characteristics of food consumption are unimportant for this
person, i.e. the weights iiiiφψξθ ωωωω ,,, and the needs Θ i, Ξ i, Ψ i, Φ i take all zero values. Furthermore, this
person allocates only minimum (i.e. small) money and time budgets B i and T i to food consumption, and
he/she values each unit of time and money spent on it as strongly utility-decreasing, i.e. ipω and i
tω take
comparatively large and negative values. It is then clear that this person maximises utility derived from
food consumption in minimising the sum of utility-decreasing characteristics, i.e. in choosing food products
(or meals) that have low ps and ts contents. That is,
( ) ( )
−−=
⋅−+⋅−+= ∑∑∑∑∑
=====
y
ss
y
ss
iy
ss
it
y
ss
ip
y
ss tpCftpcfU
1
*
1
*min
111
* ωω , and max U(⋅) = min
+ ∑∑
==
y
ss
y
ss tp
1
*
1
* .
However, consumers for whom food is more than just "fuel" and who feel the need for additional utility from
other characteristics offered by food � i.e. either one or some or even all of [Θ i, Ξ i, Ψ i, Φ i] and their
corresponding weights in the preference matrix Pi take non-zero values � the meal (or product) selection
process will be more difficult. Then, the more aspects to be considered, the more complicated the decision
(i.e. the optimisation process) will be. This may perhaps explain why in todays' affluent societies, despite
the enormous variety of different food products (and partly because of this), the basic human activity of
eating seems to have become more complicated, as the emergence of social phenomena such as e.g.
overweight problems, anorexia, vegetarianism, organic foods, food snobbism, etc. shows.
Different types of food consumers, as identified by GRUNERT et al. (1996) (see above) can be
explained with the presented model as people who differ in their needs/resource structure and in their
preference matrices. For example, "conservative" food consumers may be described as having
comparatively strong taste requirements,77 but the health contents of a meal may only be of little
77 It should be noted here, that the presented model is still a rather aggregated one. 'Tastes' describe here only how
important this determinant is relative to the other specified factors. However, it is still possible that two consumers who have the same preference for taste (as compared to the other determinants) will have completely different tastes and choose different meals. Both consumers, however, would choose these meals due to their specific tastes and not because e.g. these meals are the cheapest available or because they have special health or environmental properties. In order to allow for differences in taste in the model, the taste factor must be further disaggregated and special 'needs' for e.g. sour, sweet, spicy, salty tastes, soft and crunchy textures, desires for meat, vegetables, pastas, rice, etc. be introduced. Such a specification, however, would result in a much more complex model.

2 ANALYSING INTERNATIONAL FOOD PRODUCT MARKETS AT THE AGGREGATE LEVEL 145
importance, and environmental aspects be rather unimportant. Furthermore, prices may be important
within a certain range but time constraints may not be too restrictive (as GRUNERT et al. show that
convenience products are rarely used by these consumers). "Hedonistic" food consumers, on the other
hand, may be described as having strong preferences for taste and status, i.e. Θ i, Ψ i, iθω and i
ψω take all
comparatively large values, but prices and time are less important, implying comparatively high Bi and Tis
and low (and negative) ipω and i
tω s. Furthermore, the model can also explain very special food choice
behaviour, e.g. that of children. Children behave differently from adults because they have different needs
and because in their food selection decisions they usually don't have to take into account resource
considerations such as prices or time, as they live with their parents. Moreover, at this age, status, health,
and environmental concerns may be unimportant. The only aspects that may matter to children are to meet
their energy requirements and taste (and in particular sweet tastes, see MURCOTT 1986, pp.119-122).
Thus, their utility maximisation problem reduces to
+ ∑∑
==
y
ss
y
sscmax
1
*
1
* θ subject to id
ss Cc min
1
* ≥∑=
, id
ss Cc max
1
* ≤∑=
, and id
ss Θθ ≥∑
+1
* over a day.
Therefore, considering this particular consumption situation, a child's typical choice to "not eat their beans
and yet still be hungry for ice cream" cannot necessarily be seen a "violation of rational consumption
behaviour" as e.g. RICHARDS et al. (1998, p.365) claim.
Increasingly similar food consumption pattern across countries can also be explained within
the presented theoretical framework. As the selection of food (either in form of meals or food products)
depends on the resource/needs vector, it should be clear that the more similar these vectors become the
more similar the chosen foods will be. In societies where working patterns, ways to spend leisure time,
shopping behaviour, etc. converge, and thus individual resources (in particular time constraints), and needs
(body weight ideals and environmental concerns are cross-national anyway) become more similar, optimal
food consumption patterns must become similar, too. Thus, converging food product markets can be
explained as a result of increasingly cross-national similar, T i and iCmax , the simultaneous increase of health
concerns, Ξ i, and the emergence of new environmental aspects in food production, Φ i, in many consumers'
food choice optimisation problem. Therefore, ever more similar food consumption patterns can be well
understood as similar reactions to changes in the economic and social environment of consumers, more or
less external to them.
Persisting national or regional food consumption patterns may be attributed to nationally or
regionally different preference matrices Pi. Even if the 'economic and social environments' have become
more and more similar for many consumers in most industrialised countries, individual, regional or national
preferences may not necessarily converge. For example, it may be rational for all consumers to switch from
meats to vegetables in their eating habits, because vegetables may be more healthy, cheap, and low-calorie.
But Germans may still prefer potatoes, Britons pumpkin, and Italians tomatoes, etc. Equally, a rise in the
demand of dairy products in all countries does not necessarily mean that all consumers prefer exactly the
same cheese or yoghurt brand, etc. After all, existing research results has only confirmed food consumption
convergence within nutrients or broad commodity groups. For individual products the trend is far less clear
(see above), which supports the argument well. Thus, given the large variety of foods, with many of them
containing similar characteristics, there is still scope for a very individual meal (or food product) selection.

146 2 ANALYSING INTERNATIONAL FOOD PRODUCT MARKETS AT THE AGGREGATE LEVEL
That is, even if two consumers are identical in their needs/resource vector and their preference matrices
� which is not unlikely given the simple, i.e. aggregated specification of this model, and the high numbers
of existing consumers � they may still end up with different diets (see however Footnote 77).
Food consumption in the 21st century, therefore, will still be a problem for many consumers,
and maybe a bigger one than ever before. With income restrictions having become less binding, new
aspects have emerged in the food consumer's decision process. The resulting trade-off problems are now
more complicated as more aspects need to be considered in the food selection problem: typically an affluent
society's food consumer wants to enjoy as much food as possible, yet to stay in a good shape and in good
health, she/he still doesn't want to spend unnecessary time or money on eating and related activities,
she/he may want to take part regularly in food-related social events, and even might want his consumption
decisions to be in harmony with accompanying environmental, ethical or political concerns. Finding the
"optimal" diet is therefore not only more complicated, the result is also likely to be more uniform. There are
already research results that show that for example, given its outstanding convenience properties,
consumers prefer pasta over potatoes or rice (RICHARDS et al. 1998), indicating that in the future only a
limited range of food products (or particular meals) may be capable of fulfilling all of the modern food
consumers' requirements. However, this scenario will become true only to the extent to which consumers
understand the trade-off problems that come along with food consumption. However, the growing
significance of diet related health problems (overweight, high blood pressure, heart and liver problems,
anorexia, etc.) in many affluent countries seems to confirm, that "optimal" food consumption for large parts
of the population is by far not yet reached. Thus, there should be scope for many supporting services in the
food industries. In fact, there are predictions that the strongest growing segments of the food industries in
the 21st century will be (i) ethnic foods, (ii) healthy and natural foods, and (iii) 'functional' foods (The
Economist, April 15 2000, p.68). All these foods provide special proprieties with respect to taste and status
(ethnic foods), health and environment (natural foods), or body weight and health (functional foods).
Functional foods, in particular, as a high-tech combination of a food and a drug, are designed to minimise
the nutritional trade-off problems that come along with "normal" food, and promise health benefits beyond
what nutrients would normally provide, or special, calorie-free, taste sensations (e.g. fat-free ice-cream).
The commercial success of functional foods, however, has been limited so far (The Economist, September 11
1999, pp.75-76), mostly because the promised effects are not always scientifically proven, and because
these products suffer from image problems (poor branding), and are often very highly priced (ibid.). Thus,
it seems likely that the solution for a modern consumer's diet problem may instead come from finding better
combinations of already existing, 'traditional' foods.
Opportunities for international food marketers seem therefore manifold. Ethnic foods will be
a growth segment in the otherwise stagnant food product market. However, it should be clear that a foreign
dish or food product will only be accepted internationally if it offers proprieties which are perceived as
superior over those offered by local food. This might be a better taste, a special health value, maybe a
cheaper price, or simply status and image-related characteristics. In the context of the presented model, a
food product (or a meal) is superior to another one if the sum of the part utilities of its characteristics is
higher relative to the (at this particular choice situation) binding utility-decreasing characteristics, i.e. the
sum of the **** ,,, ssss φψξθ values of a meal (or a single food product) per *, sts tc or *
sp is higher than the
ratio offered by locally produced food alternatives. For example, it may be argued that "Asian" food, in

2 ANALYSING INTERNATIONAL FOOD PRODUCT MARKETS AT THE AGGREGATE LEVEL 147
general, is as quick to prepare as other non-Asian fast foods, but it is not significantly more expensive, it
offers a more intensive taste (perhaps due to its spice contents) and maybe in health quality (as it is in
general low in fat and meat, and rich in vegetable and complex carbohydrates (rice)). More specific, the
worldwide growing popularity of Japanese sushi may be explained by its high content of health properties
(low fat, low calorie) combined with its high status value (it is very chic at the moment), thus making it a
perfect food for all who have to eat often in restaurants and who can afford its high price (e.g. business
people or affluent individuals). German bratwurst, on the contrary, may be seen as another fast-food which
is cheap and quick to prepare, but it is also low in health and status properties, thus, not surprisingly, it has
not become a worldwide accepted food. Therefore, one aspect that determines the success of a particular
dish in international markets is its relative content of actually utility-spending characteristics it offers to
consumers. However, this may only be a necessary condition for the acceptance of a new food in a foreign
country, yet it may not be sufficient to make it also a household success such as e.g. pasta, pizza, curry
dishes or hamburgers. In order to get people to prepare foreign dishes also at home, and thus to buy
foreign food products rather than restaurant or take-away meals, other factors must be fulfilled, too. To
understand what makes the difference, it is useful to regard a (foreign) meal (cooked at home) as a vector
of many different ingredients, but which can be simplified into a vector with just two input components, i.e.
=
h
fs i
im , where if and ih stand for ingredients produced in a foreign country and for those produced at
home, respectively. It could be argued now that a foreign food will be successful if it complements foods
that are already eaten in a country, which means that by combining if and ih to a new meal, the sum of its
part utilities resulting from its now changed characteristics can be higher. For example, SCHAFFNER et al.
(1998, p.67) argue for the US food market that "Thai food's ultimate success at the grocery store will
depend on how well it complements cuisine Americans already eat. ... Mexican food would not have taken
off if it had not been a new way to cook ground beef." In fact, the overwhelming success of pasta dishes or
pizza in many countries of the world may be explained by the fact that it is possible to use many local
ingredients for the preparation of these dishes and the result will still have an Italian flair.78 Therefore, if
ethnic cuisines offer a new way of cooking already available foods, and this new combination of ingredients
offers a better mix of utility-spending characteristics � which allow the food consumer to better maximise
his food utility function � a new dish is likely to become a cross-country success.
Food product marketers need to understand this modern 'food consumption mechanics' and find
ways to help the consumer to solve her/his food utility maximisation problem. They can do so in e.g.
providing foods that are high in one single utility-increasing characteristic and, ideally, low in utility-
decreasing ones. Such foods, in minimising trade-off problems, would allow the consumer to better "fine-
tune" his/her selection process, and to reach a higher overall utility level. Ingredients such as e.g. widely-
traded spices or olive oil, which is now very popular all over the world, may be a good example, because
they allow to add 'taste' or 'health' to a dish according to individual preferences. Drinks (e.g. soft-drinks,
fruit juices, wines or beers, coffee, teas, etc.), are internationally successful products, too, which allow food
78 In fact, a research project launched by the US Army Natick RD&E Center in the early 1990s on the determinants of the
acceptance of ethnic food showed that new unknown food is more likely to be accepted if it is similar to one that people already know and which are well-liked. That is, familiar products serve as a kind of bridge to the new product. Moreover, the acceptance has been shown to be significantly higher if the novel food product is introduced with sufficient accompanying information on e.g. ingredients, proper use, origin or cultural background (ITKONEN 1999, p.16). Thus, real new foods, i.e. those that are not just new combinations of already familiar foods, are indeed much more difficult to sell successfully in a foreign market.

148 2 ANALYSING INTERNATIONAL FOOD PRODUCT MARKETS AT THE AGGREGATE LEVEL
consumers all over the world to increase the utility derived from a meal, as meal-accompanying drinks add
further characteristics (e.g. taste, nutrients, stimulation, status, etc.) that can be consumed according to
personal preferences. French champagne is a particularly successful example. Although not offering very
much different properties such as taste or health than e.g. comparable � but much less exported � German
sparkling wine, the champagne's high contents in status value has made it an internationally highly
demanded product, despite its higher price. (This is also because it offers more overall utility per calorie �
due to its higher status properties and other things being equal � in particular for people who care more
about body weight than price.) On the other hand, it is obvious now, why e.g. pre-cooked ready-to-eat
meals, in general, must be adapted specifically to local tastes. Within a limited geographical area, individual
food preference matrices Pi may be quite homogenous. Thus, a particular dish, which is appreciated by
many in this area, can be optimised according to these homogenous preferences in order to deliver the
optimal mix of utility-spending characteristics. However, as soon as preferences change, a standardised
dish may no longer be optimal for the individual utility maximisation process, and therefore successful
international marketing of regional dishes becomes difficult. On the other hand, modern, industrially-
produced, internationally-successful, and usually highly-branded food products such as e.g. confectionery
products, soft-drinks, beers, instant coffee, breakfast cereals, etc. may be seen as products which are very
useful for consumers to supplement existing needs and which offer dominant characteristics such as specific
tastes (confectionery), special status/prestige proprieties (drinks) or particular convenience advantages
(instant coffee or breakfast cereals). Therefore, in the future, food products must be tailored even more
specifically to support a consumer's food utility maximisation process. As in particular health and
environmental (ethical, political, social, etc.) concerns are predicted to become more important for modern
consumers' food selection decisions, international food product marketers must be prepared to review their
existing product ranges.
The practical relevance of the presented model needs to be stressed, too. Relevant food
product (or meal) characteristics can be identified empirically and preferences can be measured. Conjoint
analysis, a modern multivariate data analysis technique,79 can be used for the identification of the relevant
characteristics offered by a food product (or a meal), i.e. ms, and the individual preference matrix Pi. To
identify relevant characteristics of a meal or a food product, a large sample of consumers need to be
surveyed on the characteristics of a particular food and the mean of all responses will give the "true"
contents of relevant characteristics. Consumer-individual deviations from this mean should then reflect
adequately individual preferences. Systematic differences across geographical areas in the aggregate values
of perceived characteristics of a single meal or a food product may represent cultural influences within the
preference matrices. Knowledge of area-specific differences in preferences should make possible predictions
of how successful a particular product could be marketed within a foreign country.
79 see HAIR et al.(1998, Chapter 7) for an introduction to conjoint analysis.

2 ANALYSING INTERNATIONAL FOOD PRODUCT MARKETS AT THE AGGREGATE LEVEL 149
2.4.2.4 Summary and conclusions
This section discusses some current topics in international food consumption, which are important for
international food product marketers: international convergence in food consumption, persistent regional
consumption pattern, and the existence of cross-national similar types of food consumers. Then, after
revising traditional economic approaches to explain consumption behaviour, a new modelling approach is
proposed. Based on this model, some important implications for consumers and international food
marketers are derived which affect food consumption in the 21st century.
Aggregate food consumption has been shown to converge in many industrialised countries,
implying that diets are becoming increasingly similar. Yet, at the same time, it has also been shown that
strong regional food consumption patterns persist. This apparent contradiction can be explained in two
ways: (1) a large part of consumers in a country eat increasingly internationally similar diets, whereas
another large part of a national population continues to consume traditional food. This view is supported by
the empirical finding that similar types of food consumers across countries exist which � to very different
degrees � accept new foods and new food consumption habits. (2) Another possible explanation for
increasingly similar diets is that most consumers of a country adopt new foods and eating habits, but only
on certain occasions, whereas at other times they still prefer their regional foods. In order to gain deeper
insights in these developments, and to see how these trends affect international food product marketers, a
better understanding of consumption behaviour is needed.
Traditional microeconomic consumption theory describes how rational consumers should
allocate their expenditures between goods in order to reach a utility maximum. In assuming income as the
actual binding limiting factor in consumers' choice, the optimum condition then proposes to choose the
quantities of two goods in a way that, at the margin, their utility/price ratios equal each other.
LANCASTER's consumption theory argues that product characteristics spend utility, rather than market
goods. In order to maximise utility, a consumer selects a specific bundle of market goods in a way that
allows him to consume her/his preferred combination of characteristics. Given the conventional budget
constraint, consumption will then be efficient when a consumer chooses the cheapest of otherwise identical
such bundles. This model expands the traditional approach of modelling the consumer's decision making
process to the world of differentiated goods. Household production theory incorporates time in the
consumer's decision problem. It argues that (non-market) Z-goods are the real utility-spending entities.
These Z-goods need to be produced by the households, using market goods and time for the transformation
process. Thus, a budget and a time constraint need to be considered by a consumer when selecting goods
in order to maximise utility. Both constraints can however be transformed into a single one, using a
consumer's wage rate. This wage rate enables the calculation of a shadow price for the time requirements
in the production of a Z-good. The optimum condition then implies to equalise the ratio of the marginal
utility of two Z-goods to the ratio of their marginal costs, however, the latter supplemented by the shadow
prices of their production times.

150 2 ANALYSING INTERNATIONAL FOOD PRODUCT MARKETS AT THE AGGREGATE LEVEL
A dynamic concept of utility derived from food consumption over a longer-run period can be
specified in assuming that utility from different characteristics is accumulated over time. There is a base
utility from calorie intake, which is equally important to all consumers as it assures human life. Other part
utility may come from other characteristics of food consumption, such as its taste, health, status or
environment contents. These attributes may not be equally important for all consumers, but if they matter
they increase overall utility. There are, however, also utility-decreasing characteristics that come along with
food consumption. Modern food consumers may want to keep a certain body weight, thus the calorie
contents of food constrains their food choices. In addition, food consumption takes time and money, and,
by choice or out of necessity, many consumers may want to limit the total amount of time and money spent
on eating and accompanying activities. All of these constraints have certain time frames. Food needs to be
eaten regularly, thus calorie intake must take place within short periods. Taste or health proprieties of food
may also be desired by many people to be consumed on a regular basis. Status aspects or environmental
concerns may perhaps not be important at every meal, but over a certain period there may exist �
individually different � minimum consumption requirements. Another important aspect in food consumption
is that food is usually consumed as meals, i.e. as bundles of many different foods and drinks. This implies
that utility affecting characteristics offered by a meal come in fixed proportions. Although the
characteristics, and their amounts, offered by a meal should objectively be the same for all consumers,
personal preferences, which are affected by gender, age, culture, income, social status, etc., lead to the
objective vector of characteristics being transformed (by a weighting procedure) into an individual one. Yet
even then the different characteristics will come in fixed proportions which makes utility maximisation
difficult since it causes trade-off problems. Thus, in the long run, a consumer will choose food products
which allow him best to maximise his aggregate utility, in accumulating as much as part utility as possible,
until the first binding constraint (maximum calorie intake, monetary expenses or time requirements) is
reached. The different time frames of the constraints allow for some choice between individual meals as not
all restrictions need to be met at any meal. However, subsequent food choices may then be affected by the
food chosen before. The better the combination of foods chosen over a period, i.e. a diet composed of
meals that offer much of utility-increasing characteristics relative to the most restrictive utility-decreasing
one, the higher the overall utility will be at the end of the period. The more relevant the characteristics
which affect the decision process the more difficult the food selection process will be.
Implications that arise from this theoretical framework are: (1) converging international food
consumption can be explained as a reaction to increasingly similar social and economic environments in
many countries; (2) individual preferences may be homogenous within geographical areas but different
across them which causes regional food consumption patterns to continue to exist despite international
pressures for more similar eating habits; (3) regionally different preference matrices of consumers make it
difficult to market regional dishes successfully internationally; (4) internationally successful dishes and food
products are those that offer a high content of one or two distinctive utility-increasing characteristics relative
to a relevant, i.e. binding, utility-decreasing characteristics, which may be price, time requirements or
calorie contents; (5) foreign food products are more easily accepted by a local population when they help to
transform already existing and well-appreciated food products into a new meal which offers a better mix of
utility-increasing characteristics. For food product marketers it is important to understand these implications
if they want to operate successfully in international food product markets in the 21st century.

2 ANALYSING INTERNATIONAL FOOD PRODUCT MARKETS AT THE AGGREGATE LEVEL 151
The practical relevance of the presented model is that it can be made operational. Using e.g.
conjoint analysis � a multivariate statistical technique � it is possible to determine the content of product
(or meal) specific relevant characteristics as the mean values of survey results from a large number of
consumers. Consumer individual deviations from these mean values then reflect individual preferences.
Regionally similar patterns of deviations from the aggregate mean would indicate area-specific food
consumption preferences. Knowledge of these area-specific preferences and of the characteristics contents
of a product or a dish should then allow for accurate predictions of the marketability of a food product in a
foreign market.
2.5 Chapter conclusions
International trade in food and drink products is complex in nature and thus the application of one
single theoretical framework which would be able to explain this kind of trade is difficult. Rather, depending
on the nature or kind of the food product, different concepts need to be applied. Overall, however, as food
and drink items are consumer products it seems clear that this kind of international trade is explained best
from the consumers' point of view, rather than from the production side on which standard international
trade theory is usually based. Table 42, which follows at the end of this section, summarises the chapter
findings. It focuses on differences between the individual food groups. In addition, the expected trade
patterns are given. Corresponding explanations and justifications for this expectations have been presented
in the previous sections. The main conclusions for the individual food and drink product categories are as
follows.
World trade in agricultural commodities has been extensively analysed in the past. This
analysis has generally rested on the traditional theory of comparative advantage resulting from differences
in either factor productivity or factor endowments (that may also include climatic and geological conditions),
and which assumes perfectly competitive markets where the goods sold are homogenous and produced
under a technology of constant returns to scale. This study, however, has not focused on international
commodity trade.
World trade in perishable foods, in general, may also be explained within the framework of
comparative advantages, although branding can be important for some goods (e.g. bananas or special meat
varieties, such as Angus, Aberdeen or Charolais beef). In fact, it would be possible to classify perishable
foods into the group of agricultural raw commodities but they are distinct in at least two ways: (1) they are
ready for final preparation/consumption, and (2) until recently � due to their perishable character � these
products were difficult to store and transport. Thus logistics clearly plays a role in this kind of trade and
comparative advantages may therefore not only include production but also marketing skills, i.e. the
creation of appropriate transport and storage capacities.
The international trade of high-value foods may be as difficult to explain with a single theory
as it is for food as a single group on the whole. The reason for this is that undifferentiated agricultural/
aquacultural commodities such as crayfish, asparagus or strawberries belong to the high-value group as well
as highly-branded and industrially produced products such as expensive chocolates or beer. Whereas a

152 2 ANALYSING INTERNATIONAL FOOD PRODUCT MARKETS AT THE AGGREGATE LEVEL
nation that has comparative advantage in shrimp farming or in growing strawberries will probably end up as
an exporter of these products, it is less clear why a trendy Mexican beer brand has more international
success than traditional German breweries with sometimes century-long production experience. However,
as prices in international food trade are only one factor affecting success, focusing on market value for
analysing international market success is not enough. Non-price factors clearly influence the international
success of these food and drink products, in particular as they are mostly bought by affluent consumers who
are clearly sensitive to other product aspects as well.
International trade in processed foods is also complex since these products can be either
undifferentiated final consumer goods or ingredients for food preparation in the food and drink industry.
Examples may be items such as raw sugar, cream or flour which are commonly used as ingredients but
which can also be marketed internationally as highly differentiated and branded products, such as Demerara
tea sugar, (Australian) King Island Cream or French Crème Frâiche de Normandie, or Italian durum wheat
flour for making pasta at home. For ingredients, prices and production cost and therefore comparative
advantages in production may be crucial for success in international markets. However, non-price factors,
such as attributes related to the product itself (quality, packaging, taste, etc.) or services offered with the
product ("send it back if not satisfied"), and marketing skills of the distributor may be more relevant for the
international marketability of final consumer products.
World trade in culturally-bound manufactured food and drink products may be especially
particular in nature. This study has suggested that at least part of this kind of trade may follow international
migration and tourism flows, since immigrants and tourists may create a demand for these products in their
host countries and their home countries respectively. Moreover, immigrants and tourists may serve as
catalysts for the creation of additional demand of foreign food and drink products in the native populations.
Empirical evidence for the case of Germany could largely confirm these effects. However, a more detailed
analysis, including different countries and more products, would be necessary in order to identify which
ethnic groups do actually engage strongly in this kind of trade and which products are most likely to belong
in the category of those internationally unique products which apparently cannot be substituted by local
products and are thus traded globally.
Industrial food and drink products seem to be produced and distributed mainly by large
multinational companies, contrary to the very often small local enterprises which manufacture traditional
food products for local markets. As a consequence, foreign direct investments (FDI) seem to occur mostly in
the industrial food group. Since the large international food and drink companies hardly produce traditional,
culturally-bound foods, they are able to access foreign markets more easily and to create demand for their
'cultural unproblematic' products with their highly developed marketing skills. This may explain why the
majority of small and medium-sized food producers are not equally successful internationally than most of
the large multinationals are.

Table 42: How product determinants affect international food and drink product trade
Food category
Food products
Agricultural raw commodities
Perishable goods Processed foods Manufactured foods Industrial food products
Examples Grains, oilseeds, raw coffee
& sugar, live animals Fruit & vegetables, fresh meat & fish
Dairy products, flour, oat flakes, pasta, jam, juice & wine, bottled
tomatoes
Bread & bakery goods, tinned soup, prepared
pasta sauces, deep-frozen pizza, fish preparations
Soft drinks, beer, chocolate, confectionery, breakfast cereals, instant
coffee, stock cubes
Main features
Undifferentiated bulky goods;
price most important criteria
Fresh & unprocessed; difficult to transport
and store
Separation of edible from not edible parts,
therefore plants are often located near agricultural
production
Blend of different ingredients. Product
composition may depend on local taste and tradition.
Therefore difficult to market elsewhere
Products cannot be produced by households. Products can be designed
for international tastes and uses
Share of agricultural input value in final product price
high high medium medium to low very low
High-value no yes dependent on raw material
and processing method yes yes
High value-added no partly through branding dependent on processing
methods yes yes
Product differentiation and branding
rarely partly often very often nearly always
Significance of non-price factors
unimportant partly important partly important important
"culturally-bound" important
International trade mainly driven by
Comparative advantages in production
Comparative advantages in production and
marketing
Comparative advantages in production & demand
conditions
Demand conditions; Some products may follow international migration &
tourism
Trade mostly substituted by
foreign production
Expected trade pattern Inter-industry Inter-industry Intra-industry Intra-industry; trade
follows people movements Foreign direct investment
Source: Author's compilation.
2 A
NALY
SIN
G IN
TERN
ATIO
NAL FO
OD
PRO
DU
CT M
ARKETS A
T T
HE A
GG
REG
ATE LE
VEL
153


3 MANAGING INTERNATIONAL FOOD PRODUCT TRADE AT THE COMPANY LEVEL 155
3 MANAGING INTERNATIONAL FOOD PRODUCT TRADE AT THE COMPANY LEVEL:
THEORY, AND RESULTS FROM A SURVEY OF INTERNATIONAL FOOD PRODUCT
MARKETERS FROM GERMANY AND AUSTRALIA
The following part of this study investigates the problems involved in the management of international
marketing activities of food products from a single company's perspective. For this, first, the theoretical
foundations of the management of international marketing transactions of food products will be presented.
Then relevant empirical studies will be discussed which have already been conducted, and which investigate
the problems involved in these activities in a variety of countries. After this, the results of a survey of
German and Australian companies engaging in international food product marketing activities will be
presented. The survey aims to explore the problems encountered in international food product marketing,
and which have not been much investigated before in this manner. Finally, some conclusions will be drawn
from the research findings.
3.1 The theory of international food product trade management
A definition of international management is provided by O'CONNELL (1999, p.177): "the process of
planning, staffing, organising, and controlling international business activities", where international business
refers to activities that are carried out across national borders including "import and export activities, trade
in services, consulting activities, and any other business related endeavours which cross a nation's boarders"
(ibid., p.169).80 In the following, however, the focus will mainly be on export and import management,
although the other activities will also be described briefly.
The international food product business adds further, mostly product-specific, challenges to
the management process, such as e.g. a complex logistics due to the perishable character of most food
products. Moreover, food products are, as argued before, "culture-bound" goods which makes international
marketing activities of these products difficult, due to the existence of regional or national tastes and
preferences (see Section 2.4.2).
80 Management in general can be defined as the activity of achieving change in one's material and/or human environment
in order to create financial or non-material value. This definition thus includes conventional business management, but also non-commercial forms, such as e.g. the management of expeditions etc. The successful completion of a change process usually requires the following skills: (i) the identification and formulation of goals and the figuring-out of a way to achieve them (demanding vision & strategy formulation), (ii) a detailed planning phase, (iii) the make-it-all-happen (i.e. the realisation process which demands technical skills such as a deep understanding of the mechanics, i.e. the economics of a process, together with skills in handling humans, such as a understanding of psychology, that is organisational behaviour), and (iv) the controlling of the change process. In addition, (v) effective communication skills may be necessary during the whole process, as convincing all involved persons of the importance and necessity and quality of the achieved results of the process may be equally important for its overall success than the actual realisation of its goals.

156 3 MANAGING INTERNATIONAL FOOD PRODUCT TRADE AT THE COMPANY LEVEL
3.1.1 Managing food product trade � theory and previous research findings
3.1.1.1 Theoretical foundations
International commercial exchanges of good and services are in general more complex to manage than
domestic business deals. This is a consequence of the usually greater physical distance between two
business partners and the different business environment in which they may operate. Figure 17 can be seen
as a simple model that illustrates the principal differences between domestic and foreign business
operations.
Figure 17: A model of export complexity (home market transactions versus exports)
Source: Author's draft
The foreign business complexity is a result of (i) higher transaction costs, and (ii) increased commercial risks
that are involved in foreign market operations. The perishable nature of food products increases both
transaction costs and involved risks (JAFFEE & GORDON 1993). Furthermore, both factors determine the
entry strategies that a company may typically choose for serving a foreign market.
Transaction costs � i.e. the whole array of costs associated with buying, selling, and transferring
ownership of goods and services81 (JAFFEE & GORDON 1993, pp.8-9) � are higher in international business
due to (i) the physical distance to the foreign market, and (ii) the generally different business environment,
i.e. the economic, legal and/or cultural aspects that characterise foreign markets. Large geographic
distances between trading partners increase the logistical problems of transport and storage. This is in
81 Transaction costs include in particular: (a) the information costs incurred in identifying and screening different trading
opportunities, outlets, and partners, (b) the costs of negotiating exchange agreements, (c) the costs of actually transferring goods, services, money, and ownership rights, (d) the costs of monitoring trade conditions to determine whether the agreed terms are complied with, and (e) the costs of enforcing stipulated terms through legal, social or other means (JAFFEE & GORDON 1993, p.9). Transaction costs take numerous tangible forms, including: travel costs, personnel time, communications costs, insurance costs, advertising and promotional costs, transport and storage costs, market research and consulting cost, arbitration, legal, and auditing costs, financial and other costs from delayed payments or delayed procurement, the cost of credit rating checks and product inspection services, costs incurred in safeguarding property, and actual losses from stolen goods, etc. (ibid.).
HOME
HOME FOREIGN

3 MANAGING INTERNATIONAL FOOD PRODUCT TRADE AT THE COMPANY LEVEL 157
particular true for bulky and perishable food products. Perishability limits the marketable life as a fresh
product and thus the period during which it can be used as a raw material for processing (ibid., p.13). As a
result, food products must be handled within a set time period and investments in special transport and
storage facilities (e.g. refrigerated trucks) must be undertaken. Finally, rapid perishability increases
transaction costs since it requires that the raw products are repeatedly screened or rated for quality at each
stage in the food chain (ibid.).
Transaction risks82 result from the fact that operations in foreign markets add more
"uncontrollable" factors to a business deal, thus increasing its complexity (CARTER 1997, pp.13-14). Doing
business in an international environment means therefore copeing with an additional "layer" of
uncontrollable factors as illustrated in Figure 18. The resulting risks can be classified in economic and
political risks (ULLMER & BÖTTGER 1995, p.310).83 Economic risks include delivery risks, i.e. uncertainties
concerning the expected completion of the contract, or macro-financial risks such as a possible change in
exchange rates or foreign interest rates. There is also an increased transport and storage risk. Political
risks arise from government actions which deny or restrict the right of a foreign owner/investor to use or
benefit from his/her assets, or which reduce the value of a transaction or of an investment84 (O'CONNELL
1996, pp.230-232). Particular risks related to international transactions of food products result from the
perishable nature of these products, as long transport times and inappropriate storage enhances the
likelihood of product loss or value decline (JAFFEE & GORDON 1993, p.13; PAWSEY 1995).85
82 The concept of risk can be related to a decision situation where (i) more possible outcomes exist as actually will occur,
(ii) where not all outcomes are being seen as favourable to the decision maker, and (iii) the consequences of a decision are not completely clear, i.e. the causal link between decision and outcome is not known (BERNSTEIN 1998). Such a constellation involves risk, i.e. a probability greater than zero of being confronted with an unwanted result as a consequence of a decision. International business transactions are more risky than domestic ones because the foreign business environment and the transport of the goods over possibly long distances and maybe other foreign � possibly unknown � territory increases the number of possible outcomes for the completion of a business transaction and therefore the likelihood of being confronted with a business failure.
83 A different, but recommendable treatment (in German) of risks occurring in international market transactions can be found in PEPELS (1997, p.19-23).
84 The best known political risks for foreign businessmen include (a) confiscation of private property, (b) contract repudiation, i.e. a foreign government terminates a contract without showing cause, refuses to pay for delivered goods, cancels the contractor's licence to operate, etc., (c) currency inconvertibility, (d) discriminatory taxation, (e) embargoes, (f) expropriation of property, (g) nationalisation, (h) war risks, or (i) wrongful calling of guarantees (O'CONNELL 1996, p.230-232).
85 Typical risk management tools used by companies are (a) insurance, (b) hedging (of financial risks), (c) transferring risk to third parties (e.g. through outsourcing) which are more knowledgeable or better equipped to deal with a particular risk, or (d) legal mechanisms such as e.g. adopting a limited liability status in a commercial operation (DICKINSON 2000).

158 3 MANAGING INTERNATIONAL FOOD PRODUCT TRADE AT THE COMPANY LEVEL
Figure 18: Foreign uncontrollable factors in the international business environment
Source: CARTER S. (1997), Global Agricultural Marketing Management, FAO, p.14.
The internationalisation process of a company depends on both the costs and risks involved in
establishing a foreign market. Typically small- and medium-sized enterprises (SME) which decide to
internationalise choose a step-wise strategy in their internationalisation efforts and as an initial foreign
market entry form will prefer one which involves minimal costs and risks (DALLI 1994; MAURER 1996).86
Several foreign market entry and serving strategies exist (see e.g. CARTER 1997, Chapter 7;
MACHARZINA & OSTERLE 1997). The individual methods can be categorised in different ways. In the
following the distinction will be made between three categories of serving foreign markets: (i) export, (ii) co-
operation, and (iii) foreign direct investment (KUMAR & EPPLE 1997).
Exporting can be defined as "the marketing of goods produced in one country into another"
(CARTER 1997, p.122). Exporting may be seen as one of the simpler, less costly and less risky market entry
strategies. Exporting methods include indirect or direct export. Indirect exporting includes the use of
86 The costs of building a foreign market will include both (a) the initial investments necessary to establish a commercial
connection with the foreign market, and (b) the transaction costs which come along with each deal in this market. The initial investments may include expenses for identifying general market demand, for learning about the foreign legal and economic environment, for a general risk analysis, for finding transport and storage facilities, etc. These costs may be seen as fixed "sunk costs", as these expenditures cannot be re-gained in the case of a withdrawal from the foreign market. However, these initial investments may only be necessary for companies which actively seek to expand into foreign markets. For the case of passive exporting � that is for example a company is approached by a foreign importer who buys ex works and takes over all marketing activities � the indirect export transaction may not be more difficult nor more costly than a home market deal (CARTER 1997, p.122).
Domestic environment International environment
Uncontrollables
Economics
Politics
Competition Technology
Tastes
Government
Uncontrollables
Economics
Competition
Markets
Politics
Technology
Geography State of
development
Taxation
Ethical
Distribution
Culture
Social
Government
Controllables
Product Price
Promotion

3 MANAGING INTERNATIONAL FOOD PRODUCT TRADE AT THE COMPANY LEVEL 159
trading companies, export management companies, piggybacking87 or countertrade88. Here the
manufacturing company is only indirectly involved in the management of the export problems which are
handled by a third party. Direct exporting involves the use of an agent, distributor or even an overseas
subsidiary. The manufacturing company thus organises and controls the exporting process and needs to
have special know-how. Exporting activities can take different degrees of intensity. On the one hand, there
is the difference between passive and active exporting (see Footnote 86). On the other hand, the literature
dealing with international marketing management makes the distinction between export selling and export
marketing (KEEGAN 1995, p.581). Export selling means to simply deliver existing products to foreign
customers without any modifications. Export marketing, however, involves the tailoring of the product, its
price, or the promotional strategy to the international market (ibid.).
Co-operation agreements involve the transfer of the production of goods to a local partner in a
foreign country. Such agreements are typically more costly and risky strategies for serving foreign markets
than exporting because reliable partners need to be found, contracts may need to be negotiated for longer
periods and more knowledge about the commercial conditions in the foreign market is demanded.
Moreover, depending on the type of the co-operation agreement, assets (intellectual or physical) need to be
transferred to the foreign country which makes these agreements more costly in case of a business failure
and thus also more risky. Finally, the handing over of the production responsibility to someone else may it
make difficult to ensure that product quality standards are internationally equal. Co-operation strategies
include contract manufacturing, licensing (including leasing and franchising) and joint ventures (CARTER
1997, p.122). Contract manufacturing involves finding a partner enterprise which is able to reliably produce
a good according to set standards. However, for this agreement all assets of an internationally expanding
organisation stay in the home country. Licensing can be defined as "the method of foreign operation
whereby a company in one country agrees to permit a company in another country to use the
manufacturing, processing, trademark, know-how or some other skill provided by the licensor" (IBID.,
p.127). In this case, intellectual assets need to be transferred to the foreign country. Joint ventures can be
defined as "an enterprise in which two or more investors share ownership and control over property rights
and operation" (ibid., p.128). Here capital investments need to be undertaken, making the whole
agreement more risky. In addition, these co-operation strategies differ in the degree of autonomy and
responsibility the foreign partner takes over. Of course, the higher the involvement of a foreign partner the
better the relationship with him/her needs to be established beforehand.
Foreign direct investments can be divided into setting up (i) a foreign production facility, or (ii)
a foreign subsidiary including also administration and marketing services. Both forms involve capital
investments which increase the cost and the risk of a foreign market engagement. However, in the long run
and after the creation of a sufficient 'critical mass' of local demand, this market serving form may be the
87 Piggybacking is a method of indirect export where an organisation with little exporting skills may use the services of one
that has. Another form is the consolidation of orders by a number of companies in order to take advantage of bulk buying (CARTER 1997, p.125).
88 Countertrade is defined by the UN as "commercial transactions in which provisions are made, in one of a series of related contracts, for payment by deliveries of goods and/or services in addition to, or in place of, financial settlement" (CARTER 1997, p.125). Countertrade is the modern form of barter, except contracts are not legal and it is not covered by GATT (ibid.). It is estimated that countertrade accounts for 20-30% of world trade (ibid.).

160 3 MANAGING INTERNATIONAL FOOD PRODUCT TRADE AT THE COMPANY LEVEL
most cost efficient one as argued in Section 2.3.3. For SMEs a foreign direct investment may however not
be the typically preferred market entry strategy to start an internationalisation process, given the high
capital needs and foreign market know-how involved in it.
Figure 19 shows different market entry/serving forms and the risks and costs that are involved in
the individual strategies. Transaction costs involve here the total cost of serving the foreign market
including the first initial investments to establish a foreign market connection. As argued in Footnote 86
these investments may be seen as "sunk costs" and can be very capital intensive, especially for foreign
direct investments. Therefore it should be clear that Figure 19 is also a picture of a typical
internationalisation process of a company. In general, a company will start to serve foreign markets by
export activities before it may opt for a more advanced and more risky market serving strategy.
Figure 19: Foreign market entry/serving strategies
Source: Adapted from MUELLER-STEWENS G. & LECHNER C., 'Unternehmesindividuelle und gastlandbezogene Einflussfaktoren der Markteintrittsformen', in MACHARZINA K. & OESTERLE M.-J. (eds.), Handbuch Internationales Management : Grundlagen - Instrumente - Perspektiven, 1997, p.237.
In summary, it should have become clear that foreign market operations are more complex and
thus more difficult to manage than home market operations. The fundamental reason for this is the higher
transaction costs and higher transaction risks which are involved in foreign market operations. For food
producing companies these costs and risks may be especially high, given the usually perishable nature of
food products. However, different market entry/serving strategies expose a company to higher or lower
degrees of costs and risks and thus companies which plan to internationalise their commercial activities will
typically start to gain first foreign market experience via exports. In the following, only the export strategy
will be further discussed.
Foreign direct investment
high
low
low high Transaction risks
Tra
nsa
ctio
n c
ost
s
Indirect export
Direct export Export
Co-operation Licensing
Joint venture
Foreign production facility
Foreign subsidiary
Contract manu- facturing

3 MANAGING INTERNATIONAL FOOD PRODUCT TRADE AT THE COMPANY LEVEL 161
3.1.1.2 Empirical findings from the literature
Empirical investigations are needed to determine the actual factors � and their individual weights �
which may hinder companies from expanding their commercial activities into foreign markets. The existence
of high transaction costs does not necessarily mean that financial resources determine export success. Non-
financial aspects such as specialised know-how, negotiations skills, management capacities, and time and
effort allocation may also play crucial roles in successful exporting.89 Equally, even if risks are high in
foreign market transactions, it is well-known that some companies are more successful in dealing with these
risks than others. Therefore there must be organisational aspects in the export business which allow it to
better deal with occurring risks. In theory, general obstacles that agribusiness companies may encounter
when trying to expand in foreign markets can be manifold, as e.g. SINGH (1996, p.100) argues:
In fact, barriers to entry could be many and they differ from the ones firms face in the domestic market. Some of these barriers in international markets are: culture, language, nature and accessibility of distribution channels, government policy, expected global and local competition, political and economic environment, exchange rate changes and customer switching costs.
In order to determine therefore relevant factors that influence export performance, in particular for food
product exporters several empirical studies that have been conducted during the last decade are reviewed in
the following.
Extensive cross-country but not sector-specific studies that were conducted with exporting
companies show that in fact a number of factors significantly influence export performance. This indicates
that there is no simple answer to the problem. For example, STYLES & AMBLER (1997) find in a
questionnaire survey of 434 exporting companies from Great Britain and Australia that high performers are
more likely to (i) visit their export markets more often in order to better understand them, (ii) build close,
trusting, long-term partnerships with their foreign distributors, and (iii) commit fully to export projects. The
authors stress thus the importance of relational aspects with foreign business partners. Product quality,
country-specific adaptations of marketing strategies or export market infrastructure such as roads or
telecommunications facilities, however, were not found to have a significant influence of the export
performance of the surveyed companies. In another survey of 296 exporters from the US, the UK and
Germany, DIAMANTOPOULOS & SCHLEGELMILCH (1994) examine the linking of export manpower to export
performance. In particular the researchers examine variables such as the proportion of export managers (as
% of all managers) and export employees (as % of all employees), the education and specialised training of
the export managers, the number of overseas visits of export managers, their attendance at international
trade fairs, and their attitudes towards exporting. The study results show that factors such as (i) export
managers convinced of the importance of exporting, (ii) specialised training in exporting, (iii) trade fair
attendance, and (iv) overseas visits, are positively related to a company's export performance. Yet, the
empirical results reveal also that higher staffing ratios with export managers or export employees do not
significantly affect export performance, indicating that the quality of the export personnel is more important
than its quantity.
89 A company which has large financial resources available may of course be able to buy expert knowledge, management
and negotiation skills, foreign market contacts, etc. from external sources when preparing to internationalise its commercial activities. In reality, however cost-free financial capital is the limiting factor for almost all companies, thus restricting the possibility of buying expensive external services.

162 3 MANAGING INTERNATIONAL FOOD PRODUCT TRADE AT THE COMPANY LEVEL
Findings from US food processing and agribusiness companies which operate in
international markets indicate that apart from general export management problems, the perishable nature
of the food product adds to the complexity of successfully completing international transactions. For
example, BYFORD & HENNEBERRY (1996) in surveying 267 food processing companies from Kansas,
Missouri and Oklahoma find that the main obstacle in exporting for these companies is the nature of the
product itself. The researchers argue that (p.254):
Most food products, particularly processed foods, are perishable. This presents certain problems not associated with the majority of manufactured goods. Special handling, transportation, and storage are often required, at a substantially higher cost.
Other major obstacles to international trade which are named by the surveyed companies are (i) developing
a market for the product, (ii) exchange rate and financing problems, and (iii) receiving the payments for the
exported goods. As marketing techniques to overcome these obstacles the companies (i) participate in
government export promotion programs, (ii) use export brokers or consultants, (iii) customise packaging for
foreign markets, (iv) adapt the product itself to foreign markets, (v) produce promotional materials in
foreign languages, (vi) employ bilingual marketing staff, (vii) publish ads in foreign trade journals, and (viii)
use forward contracts (or other hedging tools) for currency exchanges. Additionally, in analysing non-
exporting companies' responses, managerial apathy (i.e. a non-interest in exporting) was found as a major
reason for not expanding into foreign markets. In another survey study of 113 Louisiana agribusinesses
HUGHES et al. (1999) find as main obstacles encountered by the companies when exporting:
(i) communication (insufficient foreign language skills), (ii) transportation costs, (iii) trade barriers (e.g.
tariffs, quotas), (iv) locating potential markets, (v) complicated documentation, (vi) unfamiliar foreign trade
procedures, (vii) determining preferences or altering products for foreign markets (e.g. package type and
size), (viii) company size and capital, and (ix) insufficient financial return. The study also finds that
companies do not seem to fully utilise the resources made available to them through the state and federal
governments (p.58).
European food product exporting companies, in general, face the same problems, as several
studies have revealed. For example, OLLILA (1995) investigated the problems encountered by Finnish food
industry companies face when trying to enter the German and Dutch Markets. His survey results, which
derived from 29 questionnaire respondents, indicate that (i) the knowledge of the foreign markets
(identifying local competitors, finding the right import agent, knowing local consumer preferences), and
(ii) good communication (foreign language) skills are perceived as the main success factors. In the case of
Turkey, ATES & SEN (1998) surveyed 72 small- and medium-sized agro-industry companies. Their study
finds as major success factors (i) managerial skills (education and training and foreign language skills), (ii)
financial resources and access to export credits, (iii) product characteristics (quality) and price, (iv) the
intensity of foreign marketing activities (foreign market visits, trade fair attendance, contacts to commercial
attachés in foreign markets or to foreign attachés in Turkey), and (v) the size and corporate age of the firms
(larger and older companies show better export performance). CHRYSSOCHOIDIS (1996) interviewed the
four largest Greek food product exporters and finds that export success, as measured by foreign market
share, is influenced by (i) market-related elements, such as the size and demand structure of the foreign
markets, (ii) product-related elements, such as product quality, the adaptation of the product to a foreign
market, and branding issues, and (iii) distribution related elements, such as the quality of the contacts with
importers.

3 MANAGING INTERNATIONAL FOOD PRODUCT TRADE AT THE COMPANY LEVEL 163
As conclusion from all these research findings it becomes clear that a whole bundle of factors
affects the export performance of companies exporting food products. Although the discussed studies do
not all investigate the same aspects of the complexity of foreign trade transactions, it is still possible to
extract the main obstacles that seem to play a role in the export business. The most common problem
areas may thus be seen as: (i) education and training of export staff (including foreign language skills and
knowledge of foreign business partner's mentality); (ii) trade fair activities; (iii) special food product logistics
and marketing problems; (iv) trade terms, export documentation and billing, and foreign exchange risks; (v)
provision of foreign market information; and (vi) government assistance.
A categorising of these management problems may help to better understand their nature.
Management problems can be specific to domestic or to international business (or they occur equally in both
fields). For example, human resource administration is a general management problem, but the
administration of expatriate staff is specific only to businesses which operate internationally. Thus, one
source of management problems can result from the market focus of a business. A second source of
management problems are specific to the industry a business belongs to. For example, the problems faced
in the marketing of cars are usually quite different to those occurring in the music industry. Figure 20 shows
a categorisation of the above identified problems which food product exporters face according to the
dimensions market focus and industry specificity.
Figure 20: Categories of business management problems
Source: Author's draft.
In the following, these special problem areas will be explored in more detail in order to gain a
better understanding of the issues that may hinder food manufacturing companies from expanding their
commercial activities into foreign markets.
Industry specificity
All industries Food industry only
Mark
et
focu
s
Dom
estic
Fore
ign
• Education & training of export staff
• Trade fair activities
• Trade fair activities
• Logistics & foreign marketing
• Trade terms, export documentation & billing, and
foreign exchange risks
• Government assistance
• Foreign market information

164 3 MANAGING INTERNATIONAL FOOD PRODUCT TRADE AT THE COMPANY LEVEL
3.1.2 Specific management problems related to food product exports
This section examines more closely the special problem areas which food product exporters face in their
internationalisation activities. It is important to understand these aspects well in order to be able to assess
accurately their possible impacts on the export performance of food manufacturing companies.
3.1.2.1 Education & training, foreign language skills, and knowledge of foreign business partners' mentality
The positive impact of a good job training of export managers on export performance has been shown
by empirical research (see above). Furthermore, this aspect is also stressed in the theoretical international
management literature (FORZELY 1994; RAUPP 1997). Export-management relevant knowledge and
business skills can be required through special university courses (at undergraduate or graduate levels) or
MBA programs, etc. Sometimes government agencies offer relevant courses, too. There is also the
possibility of obtaining appropriate skills in a foreign country. Finally relevant skills can be acquired through
on-the-job training and practical experience. It is a priori not completely clear, which courses are best for
gaining the necessary management skills for successful exporting. A business (commerce) or economics
course may be useful, but an agriculture or food related course may be equally helpful when complemented
with additional commercial knowledge. Law studies may also be useful, especially when operating in the
food sector, where extensive and country-specific food legislation frequently exists. In general, it should be
clear that the better and the more specific the knowledge and skill level of the export staff � managers and
employees � is, the more likely complex export deals will be accomplished successfully. Therefore a
hypothesis can be formulated that higher relevant knowledge and skill levels of export staff will affect the
export performance of a company positively.
Foreign language skills of export staff may also have a positive impact on the export success
of a company. This effect was found in the empirical studies discussed above and the importance of foreign
language skills is also stressed in the theoretical literature (e.g. FORZLEY 1994). On the other hand, it is
clear that English is today's most important business language (the lingua franca) and most international
business deals can and will be negotiated in this language (MCCUE 1998, p.18). Why therefore learn other
languages than English? The answer to this question may have been provided by the results of an extensive
study of STANLEY et al. (1990). In learning a foreign language, people learn about the country, its
economic, political and legal system, its culture and consumption habits, its people, etc. A good knowledge
of these aspects is important when doing business in a foreign markets as it may reduce insecurity. Thus,
learning a foreign language does not only improve the communication and thus negotiation skills, it also
provides positive 'external' effect in that the language learner acquires important and valuable knowledge of
a foreign business environment. A detailed knowledge about the particularities of a foreign market may not
be important for "global", i.e. highly internationally standardised goods. However, for the international
marketing of "culture-bound" goods such as food products, detailed knowledge of a foreign culture and its
consumption habits may be crucial. Therefore the hypothesis can be formulated that higher levels of
relevant foreign language skills of the export staff should have a positive effect on the export performance of
a company, in particular in the food business.

3 MANAGING INTERNATIONAL FOOD PRODUCT TRADE AT THE COMPANY LEVEL 165
Good knowledge of foreign business partners' mentality may also be important for the
export success of a company. Business mentality is part of a culture of a country.90 Cultural differences do
exist between countries. For example HOFSTEDE (1991) examines cultural differences connected to work-
related issues and finds as most important dimensions: (i) power distance, (ii) individualism versus
collectivism, (iii) masculinity versus femininity, and (iv) uncertainty avoidance. These dimensions allow him
to identify country cluster with similar cultures.91 A different � more operational � way of classifying
countries according to cultural differences is provided by SCHUSTER & COPELAND (1996). According to their
classification system, businessmen from different cultural background differ in their (i) approach to the task
to be accomplished, (ii) the role of relationships in making business decisions, and (iii) their assumptions
regarding the use of time. For example, North American and North-western / Central European cultures are
typically characterised by their primary focus on (p.19)
getting the task at hand and accomplishing it as efficiently and quickly as possible. Typically, the relationship between the buyer and the seller on both sides in the negotiation situation is less important than task completion. Time is an important component in these cultures, and using it efficiently is a critical goal and an admired measure of skill.
On the other hand, in Mediterranean countries there is a more polychronic attitude towards time, i.e.
deadlines are more flexible and several issues are handled in a parallel way. Contrarily, in the Nordic (and
Anglo-Saxon) countries the use of time is typically monochronic: deadlines are seen as fixed and issues are
handled serially, i.e. one thing after another. In Mediterranean countries the relationship has, in general,
more importance and some effort has to be undertaken to develop it in order to accomplish a business deal.
In the Latin American culture the importance of the relationship is even greater. However, relations can be
developed during a business transaction. In many Asian countries, in the contrary, where the relationship
between two business parties is equally or even more important, it needs to be established before a deal
(SCHUSTER & COPELAND 1996). This makes business negotiations in these cultures a lengthy affair. Thus
there is a distinct difference between the 'short-run deal making' business approach of Anglo-Saxon/Nordic
countries and the 'long-run relationship building' approach of Mediterranean/Latin American and Asian
countries (SEBENIUS & LAX 2000). The existence of these country specific differences makes therefore
"training in cross-cultural competency" (KEEGAN 1996, p.146) of export managers necessary. Of course,
when talking about cultural differences there is always the danger of falling into stereotypes. In fact,
cultural differences are more a statistical phenomena. That is, for one particular characteristic the mean of
two populations can differ which makes it more likely that one single person from the population shows this
characteristics. However, it is possible that this person is accidentally an exception and behaves not as
expected. As business deals are negotiated between individuals, relying on generalities therefore may be
too insecure. Thus, although cultural differences at the aggregate level clearly exist, it would be unwise to
blindly rely on them in an individual case. In general, however, the hypothesis can be postulated that good
knowledge of export managers about foreign business partners' mentality should have a positive effect on
the export performance of a company.
90 Here, the term 'culture' will not be defined nor discussed as very many different concepts of this term exist and the
differences between them are at last philosophical. However, a good discussion of this term from an international marketing point of view can be found in KEEGAN (1996, Chapter 4) and CARTER (1997, Chapter 3).
91 For example, clustering countries according the two dimensions uncertainty avoidance and power distance shows, that Nordic and Anglo-Saxon countries are characterised by small power distance and weak uncertainty avoidance, whereas Mediterranean and South American countries display large power distance and strong uncertainty avoidance. The Germanic group is characterised by small power distance and strong uncertainty avoidance (HOFSTEDE 1991).

166 3 MANAGING INTERNATIONAL FOOD PRODUCT TRADE AT THE COMPANY LEVEL
3.1.2.2 Trade fair activities
In theory, trade fairs are one of the most efficient places for doing business. They are in general cost
effective and they bring together large numbers of sellers and buyers at on place and at one time (MILLER
1990). Trade fairs are thus real market places where supply and demand are concentrated, and given this
concentration, business contacts can be easily established. Trade fairs are in this respect highly effective
because they reduce transaction costs as compared to the normal business situation where sellers and
buyers are usually geographically dispersed. It can therefore be hypothesised that a more intensive
participation in trade fairs (especially foreign ones) of exporting companies will affect the export
performance of companies positively.
Purposes of trade fair participation are manifold (MCCUE 1998). They range from
(i) obtaining general information, (ii) market analysis and observation of competitors, (iii) making, keeping,
or improving contacts, to (iv) the acquisition of deals. For exhibitors, the presentation of a company or its
products can be an additional major reason for participation in a trade fair. Of course, the importance of
these purposes of trade fairs may be different for each company.
The participation in trade fairs needs thorough preparation (MILLER 1990; MCCUE 1998).
Trade fair stalls need to be designed according to the company's general public appearance, and the
products it presents. Employees need to be trained, customers contacted and invited before the start of the
fair, a selling strategy needs to be worked out, accommodation to be organised, etc. MILLER (1990)
suggests also organising a follow-up meeting of all staff who prepared or worked at a fair in order to
evaluate the performances and to identify and eliminate problems for subsequent trade fairs.
Assistance for the participation in international trade fairs (and sometimes also for domestic ones)
is offered in many countries by governments and private institutions. This assistance exists in different
forms, such as e.g. financial support (for participation fees, travel and accommodation expenses, etc.),
advice, the organisation of shared national or regional stalls, etc. In particular SME may need some kind of
assistance, given the complexity of successful trade fair participation (in particular of those in a foreign
country) and the usually important volume of business that may be at stake.
Important trade fairs for food product producers and distributors are in Europe the SIAL
food and beverage fair of Paris, held in alternate years with the ANUGA fair in Cologne. In Asia the biggest
food sector trade fair is the FOODEX in Japan. In the US the biggest food industry trade fairs take place
each year in Chicago.
3.1.2.3 Special logistics and marketing problems
The perishable character of food products (JAFFEE & GORDON 1993; PAWSEY 1995) and their status as
"culture-bound" goods (CARTER 1997) makes food products in general difficult to transport over long
physical distances and to market them to foreign countries. In particular four problem areas are
encountered in the international food product business: (i) special logistics problems (i.e. storage and
transport), (ii) the positive or negative effects resulting from the image of the country or region of origin,

3 MANAGING INTERNATIONAL FOOD PRODUCT TRADE AT THE COMPANY LEVEL 167
(iii) the adaptation of the recipe or packaging to foreign markets, and (iv) problems related to different
national food legislation or trade impediments such as tariff formalities or quota regulations which are
common for agricultural goods.
Logistics in international food product trade is particularly important as food product life is
usually short and environmental factors such as temperature, moisture, oxygen levels and vibrations have to
be controlled strictly in order to prevent premature product losses (PAWSEY 1995; KANTOR et al. 1997).
Product life and transportability depend on the kind of processing and preservation applied to the food
product. For example, dried fruit is less likely to deteriorate during long distance transport than fresh fruit.
Similarly, deep freezing slows biodegradation and increases transportability, under the condition of a
guaranteed cold chain (PAWSELY 1995). Other preservation techniques include chilling, bottling/canning, or
smoking (ibid.). The choice of an appropriate transport vehicle is also important for preventing product
losses. Typically, highly perishable food products such as fresh fruit and vegetables or fresh sea foods need
to be transported over long distances by air plane. However, this form of transport can be costly and air
freight capacities can be limited (CARTER 1997, Chapter 10; RIRDC 1994). Other types of transport include
ships, trains or (refrigerated) trucks. Appropriate storage and handling is another factor that can crucially
affect product life. For example, KANTOR et al. (1997, p.4) estimate that a typical food product is handled
about 30 times before it is touched by a consumer. As the international marketing process of a food product
is much more complex, this figure can be expected to be even higher in cross-border transactions, thus
increasing the risk of quality losses (PAWSELY 1995). Appropriate packing and storage techniques (e.g. in
specially-designed containers or controlled atmosphere and air-conditioned storage) reduces this risk (ibid.).
Given these particular characteristics of food products it becomes clear that logistics is a crucial factor in
successful exporting. This may even be more true, due to the fact that food production and marketing is
very often a seasonal affair, which increases storage and transport problems, as considerable storage and
transport capacities need to be made available but only for limited periods during the year.
The origin of a food product is commonly used in marketing campaigns (SKAGGS et al. 1996).
Consumers make use of the origin information to evaluate quality of a food product (ibid.). 92 This can
happen in a positive or in a negative manner. For example, for French cheese, German beer, Italian pasta,
Florida citrus fruit, etc. the origin is seen as a positive quality attribute by many consumers. On the other
hand, South African food products (fresh fruit or wine) were boycotted by many international consumers
during the apartheid regime. However, in general the origin of a food product will only be highlighted in
international marketing campaigns if the origin label is believed to have a positive effect on the product
quality perception of consumers. Positive images of origin are often derived from famous agricultural areas
or holiday destinations which offer a broad range of regional food specialities (such as the Tuscany area in
Italy). In all, it can generally be assumed that highlighting the origin of a food product in international
marketing campaigns may have a positive effect on the export performance of a food manufacturing
company.
92 See also Footnote 57 for a more detailed descriptions how consumers use origin information for quality evaluation.

168 3 MANAGING INTERNATIONAL FOOD PRODUCT TRADE AT THE COMPANY LEVEL
The adaptation of a food product to a foreign market in recipe and/or packaging (or price)
may also play a crucial factor for export success. Food products are often bought because of their taste, and
tastes differ through geographic areas. For example, even in such "global products" such as e.g. Coca-Cola
sugar contains and acidity levels are adapted to local preferences. Moreover, religious reasons (e.g. the
objection of pork in Muslim countries) or cultural reasons (e.g. the choice of drink that accompanies meals)
can be significant trade barriers for food products. The same may be true for the packaging of food
products. Different countries have different preferences for product size and packaging. For example, in
Mediterranean countries drinking water is sold in plastic bottles, whereas in Germany returnable glass
bottles are used. Australia innovated the marketing of wine casks (3, 5 or 10 litres) which sell well in
Australia and the US but badly in Europe where households usually have smaller refrigerators and thus the
cooling of the wine becomes a problem. In France and Italy, food product promotion are often of the type
"buy three, get one for free", whereas German consumers are more sensitive to price reduction promotions.
Knowing about these differences and adapting the food products to local tastes or habits and customs can
have an important effect on the export performance of a food producing company.
Different national food legislation and other administrative rules (e.g. tariffs, quotas,
reporting obligations to statistical agencies, etc.) can be significant trade impediments (CARTER 1997). For
example, the USA and Australia do not allow the import of unpasteurised milk products such as raw milk
cheese. German food law prohibits the production of beer in Germany that is not brewed according to its
purity law standards. Different countries have different legislation concerning additives such as
preservatives or colourings. Even if the Codex Alimentarius Committee of the FAO/WHO has created a
catalogue of broadly accepted standards, there are still considerably national differences. For example, in
the USA and Australia the use of sulphur in the wine making process must be declared as preservative on
the label. In Europe, this additive is seen as an unimportant and "natural" ingredient which does not need
to be declared on the wine label. Detailed knowledge of a foreign market�s food legislation may thus be
necessary for successful exporting into this market. The same may be true for tariff formalities, quota
regulations, reporting to statistical organisations, etc. Agricultural products belong in general to the most
protected goods, and tariffs schemes are complex (ibid.).93 To know about these trade impediments may
thus be important when foreign markets are to be entered via exports. In sum, it can be hypothesised that
good knowledge of export managers concerning foreign food legislation and trade administrative rules are
important for successful food product exporting.
3.1.2.4 Trade terms, export documentation and billing, and foreign exchange risks
International commerce terms (INCOTERMS) are standardised trading terms which are approved by
the International Chamber of Commerce (ICC in Paris), and which exist in order to reduce
misunderstandings, disputes and litigation between international parties in trade transactions (O'CONNELL
1999). INCOTERMS are a terminology which describe the responsibilities of parties (usually buyers and
sellers) in international trade transactions. The terms specify which party is responsible for paying for
93 Here all existing forms of tariffs and quota regulations will not be discussed, but see e.g. CARTER (1997, Chapter 4) for
an overview.

3 MANAGING INTERNATIONAL FOOD PRODUCT TRADE AT THE COMPANY LEVEL 169
insurance, and other transportation requirements (ibid.). The most recent revision of INCOTERMS took place
in 1990. The following table lists the 1990 INCOTERMS:94
Table 43: International commerce terms 1990
EXW Ex works (named place)
FAS Free alongside ship (named port of shipment)
FCA Free carrier (named place)
FOB Free on board (named port of shipment)
CFR Cost and freight (named port of destination
CIF Cost, insurance and freight (named port of destination)
CPT Carriage paid to (named place of destination)
CIP Carriage and insurance paid to (named place of destination)
DAF Delivered at frontier (named place)
DES Delivered ex ship (named port of destination)
DEQ Delivered ex quay duty paid (named port of destination)
DDU Delivered duty unpaid (named place of destination)
DDP Delivered duty paid (named place of destination)
Source: Adapted from O'CONNELL J.J. (ed.) (1999), The Blackwell encyclopaedic dictionary of international management, Blackwell Publishers Ltd., p.161.
These 13 INCOTERMS are listed in an order of increasing seller responsibilities. That is, the lower the
placing of the INCOTERM in the above table, the more duties (transport, insurance, etc.) the seller has to
take over. Therefore the choice of an INCOTERM of two parties reflects also their power relationship: a
strong seller will typically prefer E- or F-terms, whereas powerful buyers would prefer D-terms (ALTMANN
1997).95 INCOTERMS facilitate international trade transactions because they provide an internationally
approved contract framework with standardised norms that describe exactly the responsibilities of sellers
and buyers. The INCOTERMS are thus an efficient means of reducing transaction risks (because the reduce
insecurity through regulation) and transaction costs (because they are standardised contracts). Making use
of these terms in an appropriate and frequent way should therefore have a positive effect on the export
performance of a company as a result of lower transaction costs and risks.
Export documentation is a complex matter, too. In international trade transactions a number of
documents are asked for by private and/or government bodies in both the exporting and importing country.
The documents are either required by the importer to satisfy the country's trade control authorities or the
importer may also want to ensure that the exporter fulfils the requirements for documentary letter of credit
operations in order for payment to be effected (CARTER 1997, p.207). Table 44 lists some of the most
94 For a more detailed discussion of each term see e.g. CARTER (1997, Chapter 12); O'CONNELL (1999) or ALTMANN
(1997).
95 Some INCOTERMS are for use with seafreight only, e.g. FAS, FOB, CFR or CIF and are not recommended when goods are to be consigned by air (as it is frequently the case for fresh food products). For airfreight use the terms FCA, CPT and CIP should be used (ALTMANN 1997).
Seller's responsibilities

170 3 MANAGING INTERNATIONAL FOOD PRODUCT TRADE AT THE COMPANY LEVEL
common export documents which, however, are not all used in every international trade transaction, and
which can differ through countries.96
Table 44: A list of basic documents used in export trade
a) Invitation to quote o) Health, sanitary, phytosanitary, veterinary certificates
b) Quote p) Quality inspection certificate/certificate of value
c) Pro forma invoice q) Independent third party inspection certificate
d) Order confirmation/acknowledgment r) Dispatch advice note
e) Bill of lading/short form bill of lading s) Dangerous goods declaration
f) Airway bill t) Shipping or export consignment notes
g) Marine (other) insurance policy u) Documentary credit of payment drafts
h) Commercial invoice v) Export licences
i) Consular invoice w) Import licences
j) Certified invoice x) Exporter's commission advice to agent
k) Certificate of origin y) Customs and Excise export entry forms
l) Packing list/weight note z) EU Movement documents EUR1 Form
m) Specification sheet α) Other specifically requested documents
n) Manufacturer's analysis certificate
Source: CARTER S. (1997), Global Agricultural Marketing Management, FAO, p.207.
International payment terms have been created for the same reasons as INCOTERMS: to
standardise international payment transfers and thus to reduce the involved financial risks and costs
(ALTMANN 1997). There are five basic methods of payment which can be divided into two main groups: (1)
non-documentary payments and (2) documentary payments. Non-documentary payments include the
payment methods (i) cash before delivery (c.b.d), (ii) cash on delivery (c.o.d), and (iii) simple invoice with
due date (ibid.). These payment methods are simple and inexpensive to arrange as they do not make use
of an intermediary third party. However, they leave the exporter or the importer with considerable risks of
either non-payment or non-reception of the goods. In cases where more security is needed, the use of
more secure payment arrangements is recommended. Documentary payments offer more transaction
security but resulting transaction fees can be considerable, since these payment modes demand third-party
involvement (usually a bank in the exporter's country or a bank in both countries). There are two main
documentary payment groups: (i) documentary collections (drafts) with the two basic forms of 'documents
against payments' (d/p) and 'documents against acceptance' (d/a), and (ii) letters of credit (L/C). The
document collection methods make use of certain documents (usually the 'bill of exchange', also called 'bill
of lading' or 'draft') which need to be transferred in order to release the goods to an importer which are kept
under a third party's control. Thus, when an exporter transfers goods to an importer in another country, the
importer must provide certain documents (the bill of exchange, or an export declaration, etc.) to the import
country's customs authority in order to take possession of the goods. Usually a bank representing the
exporter in the importer's country has possession of the documents needed to release goods. Upon
presentation of payment from the importer, the bank transfers the documents and the importer gains title
96 These documents will not be discussed in detail here, but see CARTER (1997, Chapter 12) or O'CONNELL (1999) for
more information about the individual documents.

3 MANAGING INTERNATIONAL FOOD PRODUCT TRADE AT THE COMPANY LEVEL 171
and possession of the imported goods (O'CONNELL 1999, p.79). Under the d/p method the bank must hold
the title documents until the bill of lading is cashed. Under the d/a method the bank releases the bill of
lading to the importer as soon as he/she accepts its payment within a defined period of time. In the d/p
method the importer runs a risk as he/she pays the goods without having seen them. In the d/a method
the exporter runs a risk since the goods are released to the importer without the bill is actually cashed. In
order to eliminate this imbalance of risk, an even more secure payment method, the letter of credit was
created. Under a L/C arrangement an importer instructs a bank in his own country (the issuing bank) to
open a credit with a bank in the exporter's country (the advising bank) in favour of the exporter, specifying
the documents which the exporter has to deliver to the bank for him/her to receive payment (CARTER 1997,
p.216). These documents serve as proof (through third party inspection and confirmation) that the goods
are exactly of the kind, quality and quantity as negotiated beforehand between exporter and importer.
Thus, by using the L/C payment mode, the risk of not obtaining the exact kind of merchandise agreed
before, or of not being paid is minimised. There are a number of different kinds of letters of credit. The
exact nature of the letter of credit used in a particular situation is based upon specific needs of a particular
transaction, as well as the degree of trust between buyer and seller (O'CONNELL 1999, pp.192-93).97 In
general, it should be clear that the mastering of the complex export financing methods can reduce
transaction risks and costs, and an effective use of these tools by the export managers should have a
positive effect on the export performance of a company.
Other international contract standards exist too which aim to facilitate the complexity of
international contracts. For example in the EU, a standardised contract for fresh fruit and vegetables trade
was approved in 1967 (WOELFLIN 1997). These "COFEUROP" terms provide industry specific contract
standards which allow a simplification of transactions and can thus reduce involved costs and risks.
Foreign exchange rate risks can also be a major factor that may prevent companies from
engaging in international marketing operations. Exchange exposures are due to the fact that payables,
receivables, or investments in other currencies may change value over time (O'CONNELL 1999, p.99). In
international trade the "transaction exposure" is the most relevant form of exchange rate risk, in cases
where payments are arranged in a foreign currency. In a situation of a sudden rise of the exchange rate,
i.e. the price of the foreign money, the exporter may receive only a lower value (in terms of his own
currency) than originally calculated. These sudden � and often unforeseeable � currency changes make
foreign business transactions a risky matter. However, several strategies to manage the foreign exchange
risks exist (ibid., p.132; KEEGAN 1995, pp.191-98): (i) to arrange contracts on the basis of a fixed
exchange rate, (ii) the use of hedging methods on FOREX markets, such as forward contracts, futures,
options or swaps, (iii) the opening of long-run foreign exchange accounts with the provision of large
amounts of a currency when it is comparatively cheap and the use of this account in times when the
currency is comparatively expensive, (iv) the use of other methods, such as the arrangement of payments in
a third country currency (e.g. the US$ or Japanese Yen) which is assumed to be relatively stable during the
transaction time. Like with the other contract standards, a good management of foreign exchange risk by
the export managers can be expected to have a positive impact on the export performance of a company.
97 For a detailed discussion of the different kinds of letters of credit see O'CONNELL (1999, p.193-94). For a detailed

172 3 MANAGING INTERNATIONAL FOOD PRODUCT TRADE AT THE COMPANY LEVEL
3.1.2.5 Foreign market information
Foreign market information, in particular information about foreign market trends, competitor activities,
consumer demand, potential governmental assistance, and other areas can be assumed as crucial for
companies engaging in foreign commercial activities. A quick provision of information is even more
important in foreign markets, given the fact of the usually non-physical presence of export managers in that
market and the likely large geographic distance to it, all making external observation difficult. It is therefore
comprehensible that a large body of organisations exist in many countries which try to assist exporters with
foreign market information.
Sources of foreign market information are public and government institutions and private
information agencies. In many countries government organisations have been especially created for this
purpose, or existing networks such as overseas trade chambers engage in these activities. For example, in
Germany there is the Bundesstelle für Außenhandelsinformation (BfAI), in France the Moniteur du
Commerce international (MOFI), and in Australia AUSTRADE. All these institutions have as their main task
the provision of information about foreign markets to national exporters. Apart from government bodies,
private market research institutes, such as the internationally operating Nielsen Inc. can provide very
specific foreign market information.
Food product promotion agencies and commodity marketing boards also observe foreign
markets and provide information on them. These kind of institutions exist in several countries, e.g. the
German CMA, the French Sopexa, the Italian ICE, the British Food from Britain, the Australian Wheat
Marketing Board or the New Zealand Dairy Marketing Board. The primary focus of these organisations is to
promote national agricultural commodities and food products in foreign markets, and therefore they need to
accurately monitor these markets. Many of these promotion bodies co-operate closely with national
producers on foreign trade fairs or in especially organised promotion campaigns.
Modern information technology, such as online databases, the Internet or CD-ROMs facilitate
foreign market research as they give quick and low-price access to foreign information resources. In
particular the internet removes many barriers to foreign markets by eliminating the obstacles due to
geography, time zones, and location, thus creating a "frictionless" business environment (QUELCH & KLEIN
1998, p.229).
In summary, it can therefore be assumed that an intensive provision of relevant foreign market
information and an effective use of modern information technologies should affect the export performance of
food companies positively.
discussion of the procedures which a letter of credit payment involves see ALTMANN (1997).
3 MANAGING INTERNATIONAL FOOD PRODUCT TRADE AT THE COMPANY LEVEL 173
3.1.2.6 Government assistance
Government assistance to support export activities of national companies can take several forms.
KEEGAN (1995, pp.583-84) names (i) tax incentives on earnings from export sales, (ii) subsidies used to
reward export performance, and (iii) assistance in form of providing information, advice, the establishment
of trade fairs or trade missions, etc. These forms of services are general and not sector-specific. However,
it has been shown (see ADAMS et al. 1997) for the case of US agribusiness exporters that many export
assistance services provided by the federal government are either not known or not used by the companies
targeted, i.e. the usually small and inexperienced ones. That is, larger and more experienced companies are
more likely to know about and to use existing assistance schemes, mostly because these companies employ
specialised staff devoted solely to export activities (ibid., p.293). This fact may lead to the conclusion that
government assistance services do affect export performance of a company positively, and larger and more
experienced companies devote more resources to the identification and use of these services in order to
maximise their impacts.
Additional export assistance is frequently provided in many countries by food product
promotion agencies or commodity marketing boards (see the previous section). These bodies can help food
exporters in their foreign market activities through the provision of market information, communication
(publicity) campaigns, potential customer identification, etc. In line with the reasoning above, it can be
hypothesised that the more intensive the assistance of food product exporters with such assistance services
is, the better will be a company's export performance.
3.1.3 Summary
The causes of the complexities involved in the management of international marketing activities of food
products are, in theory, the higher transaction costs and risks involved as compared to home market deals.
Transaction costs are higher due to the generally greater physical distance to the foreign market and the
thus resulting greater transport, communication and/or negotiation efforts necessary for business success.
Transaction risks are usually higher, since more "uncontrollable factors" exist in foreign markets than in the
home market, thus making the successful completion of a foreign business deal less likely.
Concrete problem areas which food product exporters face have been identified by analysing
several empirical studies dealing with this topic. The six problem areas which seem to be most important
are: (i) education and training of export staff (including foreign language skills and knowledge of foreign
business partners' mentality); (ii) trade fair activities; (iii) special food product logistics and marketing
problems; (iv) trade terms, export documentation and billing, and foreign exchange risks; (v) provision of
foreign market information; and (vi) government assistance. These topics will be investigated in the
following survey of Australian and German companies, which engage in the international marketing of food
products.

174 3 MANAGING INTERNATIONAL FOOD PRODUCT TRADE AT THE COMPANY LEVEL
3.2 Empirical results from a survey of international food product marketers from Germany
and Australia
The management of international food product marketing activities is a complex and
multidimensional problem as discussed in the previous theoretical section. Although some empirical
research has been conducted on various aspects of the problem in several countries � as presented above
� it has not yet clearly revealed the actual importance, i.e. the 'weights' of the individual problem areas,
when they are compared to each other. In particular, only little is known about the significance of logistical
aspects in the international food marketing problem structure, especially in the relevant German literature.
Moreover, it seems interesting to investigate whether national differences exist in the perception of the
individual aspects of problems occurring in the international marketing of food products.
The main objective of the following empirical section is therefore to investigate how in
particular (1) staff education/training and special skills such as the mastering of foreign languages, (2) trade
fair activities, (3) particular logistics aspects related to the food product, (4) the use of international
standardised business tools such as trade and payment terms and the handling of exchange rate risks, (5)
the provision of foreign market information, and (6) the extent of government assistance affect success in
international food product markets. The second aim is to find out whether, and to what extent, the
perception of the importance of these problem areas differs across countries.
In order to answer these questions, a survey of international food product marketers from
Germany and Australia was conducted. Australian companies may be seen as a valuable benchmark for
German businesses, as they operate in a comparatively liberalised business environment which is seen by
many economists as a future standard also for German companies (see e.g. SCHMITZ 1996) and which will
also be a consequence of the future implementation of the WTO rules for the European market. Moreover,
German companies could learn which particular problems the marketing of food products into the important
and strongly growing Asian market brings, in which many Australian business have already been operating
for some time. Australian managers, on the other hand, could learn from the German situation which
particular challenges the European market has, especially with respect to the existing stringent nationally
different food legislations and its tendency to consumer protectionism.
The structure of this section is as follows: in the following paragraph, the questionnaire design
and the conduction of the survey is described. Then, the methodology of analysis, which was used to
evaluate the survey data, will be discussed. The fourth section will present in detail the research findings of
the survey. Finally, some conclusions will be drawn and directions for future research will be given.

3 MANAGING INTERNATIONAL FOOD PRODUCT TRADE AT THE COMPANY LEVEL 175
3.2.1 Questionnaire design and carrying out of survey
The questionnaire design resulted from the theoretical analysis discussed in the previous section. The
questionnaire structure reflects thus the principal problem areas which were found to occur in the
international marketing of food products. A total of 59 questions (58 in the Australian questionnaire)
arranged in 8 main categories were asked using a paper questionnaire comprising 12 A5-formatted pages
(see Appendix for a copy). The individual questions will be discussed in detail in the following sections. In
most questions the choices needed either to be ticked with a cross or a figure had to be filled into a
corresponding field. Only one question was formulated in an open way where the respondents could write
down their opinions concerning the asked topic. 5-grade rating scales were used, where 1 always signified
the lowest, 3 the mean and 5 the highest value. The 5-grade rating scale was preferred to a 7-grade rating
scale because the former offers the advantage of attributing a realistic word meaning to every grade on the
scale, thus facilitating the interpretation of the meaning of each grade for the respondent. Since the survey
was held in Germany and Australia, two versions, one in German and one in English were produced.
The testing and optimisation of the questionnaire was done in the following way: the German
version was presented to and discussed with 13 Ph.D.-students and two professors of the Justus-Liebig
University of Giessen. The questionnaire was then pre-tested on three practitioners, but their remarks
necessitated no major changes. After the survey was conducted in Germany the questionnaire was
translated into English and adapted to the particularities of the Australian business environment. In general,
it was tried to keep the English translation as close as possible to the German version in order to assure the
comparability of the results. The translated version was given to several researchers of The University of
Adelaide for proof-reading and testing of comprehensiveness before it was sent out to Australian companies.
The German survey took place in December 1998. For this survey the following method was
used in order to meet the given survey budget. First, contact details from 828 German food manufacturing
and trading companies were randomly selected from several CD-ROM databases (ANUGA trade fair
participants 1997, D-INFO 1998 address register, etc.). Only companies with fax numbers in the address
data set were chosen. These companies were contacted via fax in November 1998 and asked whether they
would be interested in participating in the survey. A total number of 728 faxes could be transmitted to the
companies within 3 trials during one week. Out of these 728 companies 123 returned the fax specifying a
respondent with contact details and thus agreed to receive a paper questionnaire via ordinary mail. One
week before the closing date the respondents who had not yet returned the questionnaire where contacted
again via fax to remind them of the approaching deadline. A total number of 91 usable questionnaires were
finally returned. Out of these, 9 questionnaires had to be excluded from the evaluation because it was not
possible to classify the companies clearly as either manufacturers or traders since the companies indicated
to do both at the same time. As a result, this survey method yielded 82 usable questionnaires from German
companies, giving a response rate of 11.3% out of the 728 contacted companies.
The Australian survey took place in June 1999. 570 contact details of companies engaging in
the international marketing of food products were selected from the AUSTRADE website
(www.austrade.gov.au), the Australian trade promotion agency. However, as no fax numbers were
available, the questionnaires were sent directly by ordinary mail to all of these companies. A reminder

176 3 MANAGING INTERNATIONAL FOOD PRODUCT TRADE AT THE COMPANY LEVEL
postcard was sent to the companies which had not yet returned the questionnaire one week before the
closing date. A total number of 93 questionnaires were returned from which only 84 could be included in the
final evaluation for the same reason as for the German survey. This yielded a response rate of 14.7%.
Given the very similar sample sizes, the efforts made to assure a close questionnaire translation, and the
fact that both surveys were conducted within a delay of only a few months, the survey data may be
considered as sufficiently comparable from a methodological point of view.
Table 45: Industry sizes, companies contacted and questionnaires returned in both surveys
Germany Australia Total
Total no. of companies in the industry* 5 911� 3 390� 9 301
Companies contacted 728 570 1 298
Questionnaires returned 91 93 184
Questionnaires used in the final evaluation 82 84 166
Response rate (%) 11.3 14.7 12.8
Notes: * Manufacturing companies only; � 1998; � 1998/99.
Sources: Bundesvereinigung der Deutschen Ernährungsindustrie (German food industry association), www.ang-online.de/bvedaten.htm; Department of Agriculture, Fisheries and Forestry Australia (AFFA), Australian Food Statistics 2001, p.41; Author's compilation from questionnaire responses.
The representativeness and generaliseability of the survey results must be viewed
cautiously, however. The food manufacturing sector is in most countries still a very large one which,
because of the small company sizes, in general consists of a great number of businesses. As Table 45
shows, the number of food manufacturing companies in the mid-nineties was almost 6 000 in Germany and
more than 3 000 in Australia. Given this fact, it becomes clear that the number of companies included in
this survey represents only a small percentage of the sector.98 From a statistical point of view, a sample
size of just over 80 for each country is also rather at the lower end of the minimum sample sizes required
for meaningful statistical interference. Although these critical minimum sample sizes depend on the
specified power level, the expected effect sizes and the chosen alpha values, meaningful statistical
interference is in general only possible with sample sizes at least greater than 100 observations (HAIR at al.
1998, pp.11-13).99 In the context of this survey, statistical interference of the results can therefore only be
98 This is even more true considering the fact that the survey included also food trading companies which are not included
in the above figures of the sector sizes.
99 The power of a statistical interference test is the probability of 1-β where β is the type II error or beta. Power is the probability of correctly rejecting the null hypothesis when it should be rejected. Thus, power is the probability that statistical interference will be indicated if it is present (HAIR at al. 1998, p.11). Power is determined by three factors: (1) α or alpha, i.e. the type I error, which gives the probability of rejecting the null hypothesis when it is actually true, or the chance of the test showing statistical interference when it actually is not present (ibid., p.10). α and β are inversely related, with the consequence that reducing the type I error reduces automatically the power of the statistical test. (2) effect size (ES), i.e. the estimate of the degree to which the phenomenon being studied (e.g. the correlation or the difference in means) exists in the population (ibid. p.2). Effect sizes are defined in standardised terms, i.e. mean differences are stated in terms of standard deviations (e.g. an effect size of 0.5 indicates that the mean difference is one-half of the standard deviation). Typically, small ES are defined at around 0.2, moderate ES at around 0.5 and large ES at around 0.8 (ibid., p.12). As one would expect, a larger effect is more likely to be found than a smaller effect, and thus to impact the power of a statistical test (ibid., p.11). The researcher must be aware of the fact that in order to

3 MANAGING INTERNATIONAL FOOD PRODUCT TRADE AT THE COMPANY LEVEL 177
expected if the investigated research issues can be assumed to be consistent in both countries, i.e. the
country bias in the results between the two samples is small. This, however, should a priori be the case, as
the purpose of this study is to identify structural success factors specific to the food industries, i.e. specific
to the sector and not to the country. Thus, the combined sample size of over 160 cases should be
sufficiently large for significant statistical interference. Finally, a sample size of 166 observations is � in
absolute terms � still a lot, which, in any case, should be enough to produce interesting results in their own
right, even if the number of analysed companies seems small relative to the sector.
3.2.2 Methodological considerations
The general research methodology of this survey is that of an expert interrogation. That is, the
intention was to ask professionals working in the international marketing of food products to give their
opinions on selected relevant issues which emerged from previous theoretical and empirical analysis. This
led to a sample of answers from highly qualified people who expressed their work experience in completed
questionnaires. The evaluation of the sample then looked for similarities or significant differences between
the ratings on the individual questions in order to identify coherent opinion patterns.
The subdivision of the sample data into different groups can be seen as a logical consequence
of the structure of the data set. Thus, apart from an overall evaluation using the whole sample, the data
were analysed separately for Australian and German responses. Moreover, the sample was also analysed
separately for manufacturing and trading companies. Finally, the data set was split even further into
German manufacturers and traders, and Australian manufacturers and traders. This gives as a whole nine
sub-samples for which individual analysis was performed. Such a fine subdivision of the data should
therefore allow to check for country homogeneity and to identify differences resulting from the business
class (manufacturer or trader) to which a company belongs.
Multivariate analysis techniques were used for the evaluation of the results. Apart from tests
of differences in group means (t- and F-tests, non-parametric tests, and cross-tabulation and chi-square
( 2χ ) tests), factor analysis, cluster analysis, and multiple discriminant analysis techniques were applied to
the data where it seemed to yield useful results. The analysis was performed using SPSS 10.0. In the
following, the employed multivariate statistical analysis techniques are described in more detail.
establish statistical interference of small effects, a much bigger sample size is needed than for large effects. (3) Sample size itself determines the power of the statistical test. At any given α level increased sample sizes always produce greater power with the consequence that with very large sample sizes almost every effect (i.e. even very small ones at about 0.01) will become significant (ibid., p.11-12). This implies that with very large sample sizes (i.e. 1 000 or more cases) (ibid., p.164-65), almost every variation in the data becomes significant, making the test overly sensitive and thus not producing useful results anymore. On the other hand, with larger sample sizes the sample will become more representative of the population, and the variation of the estimated coefficients will become smaller. This is true until the analysis is estimated using the population. Then there is no need for significance testing because the "sample" is equal to � and thus perfectly representative of � the population (ibid., p.182). In summary, however, it should be clear that statistical power and significance testing are not enough to assess the validity, meaningfulness and usefulness of quantitative research results. Their practical significance, i.e. whether the results are "substantial enough to warrant action" (ibid., p.3) must also always taken into consideration.

178 3 MANAGING INTERNATIONAL FOOD PRODUCT TRADE AT THE COMPANY LEVEL
3.2.2.1 Testing for group differences
The identification of significant group differences in the ratings on important aspects is one of the
main purposes of this empirical investigation. A significant difference in the means of the responses of sub-
samples indicates underlying structural dissimilarities which could be a cause for e.g. a possible lower export
performance of German as compared to Australian companies. Significant in this context means that the
identified difference is generaliseable, i.e. that it is very likely (i.e. with only 1%, 5% or 10% error
probability, depending on the adopted confidence level) that the identified difference does exist in the
population, and that it is not only found accidentally in the sample. That is, an identified significant
difference is very likely to be present in reality and it is not only due to sampling variation. Significance
testing is particularly useful when apparently important differences are identified but these are based on
fairly small samples. In these cases the chances that the result simply reflects sampling variation is
relatively high.
The mechanics of significant tests is to calculate a test value from the sample data which is
compared to a theoretical 'critical' value derived from an assumed underlying distribution of the population.
Very often the sample data needs to meet some assumptions, such as normality and/or homogeneity of the
group variances ('homoscedasticity'). The null hypothesis (H0) is in general that there is no differences
between two (or more) values. If the calculated test value is higher than the critical value, then H0 is
rejected, i.e. there is a significant difference between the two (or more) values being tested. In so-called
'non-parametric tests' no particular distribution of the data has to be assumed and the sample data does not
need to fulfil important restrictions, which makes these tests more universally applicable. On the other
hand, many non-parametric tests are highly sophisticated statistical procedures which often demand
advanced statistical software and powerful computers. In the following, the most commonly used tests for
assessing group differences and their underlying assumptions are discussed.
The t-test is probably the most commonly used test for assessing group differences, however it is
also the most restrictive one in its assumptions concerning the underlying data. In general, the data needs
to be of metric scale, normally distributed and the group variances need to be homoscedastic (see HAIR et
al. 1998, pp.331-2).100 Moreover, there are different t-tests, depending on the exact purpose of the analysis
and the sample structure: (i) the one-sample t-test which tests whether the mean of a single variable differs
from a specified constant; (ii) the independent-sample t-test which compares means for two groups of
cases; and (iii) the paired-samples t-test which compares the means of two variables (e.g. two products or
two measurements at different points of time) for a single group. For the purpose of this study, however,
the independent-sample t-test will be mostly used, in cases where the data was tested positively to fulfil the
necessary assumptions.
100 SPSS provides the Kolmogorov-Smirnov test to check for the hypothesis that a sample comes from a normal
distribution. The value of the Kolmogorov-Smirnov Z is based on the largest absolute difference between the observed and the theoretical cumulative distributions (SPSS 1999, p.826f.). In order to test for the equality of group variances, SPSS provides the Levene test, a homogeneity-of-variance test that is less dependent on the assumption of normality than most other tests. For each observation, the program computes the absolute difference between the value of that observation and its cell mean and performs a one-way analysis of variance on those differences. A second test that is available in SPSS is the Box's M test for the equality of the group covariance matrices. For sufficiently large samples, a non-significant p value means there is insufficient evidence that the matrices differ. However, the test is sensitive to departures from multivariate normality (see HAIR et al. 1998, p.240f.).

3 MANAGING INTERNATIONAL FOOD PRODUCT TRADE AT THE COMPANY LEVEL 179
F-test or analysis of variance (ANOVA) are statistical procedures to test for differences in
group means in the case of more than two groups. Thus, this technique is an extension of the two-sample
t-test. Although one could imagine calculating separate t-tests for the differences between each pair of
groups, it has been shown that these multiple t-tests inflate the overall type I error rate (see Footnote 99)
(HAIR et al. 1998, p.332). ANOVA avoids this type I error inflation by determining in a single test whether
the entire set of sample means are all equal at the same time, e.g. H0: µ1 = µ2 = µ3 = ... = µk. For this a
test value � the so-called F-value � is calculated from the sample data which is the quotient of the
estimates for the between-groups variance and the within-groups variance (see ibid., p.333). The null
hypothesis is rejected as soon as the test value is greater than the theoretical critical F-value. However,
although the F-test assesses the null hypothesis of overall equal means, it does not address the question of
which means are different. In order to assess these differences, so-called post hoc tests have been
designed. These tests provide abundant diagnostic information, but they also inflate the overall type I error
rate by performing multiple statistical tests and thus must use very strict confidence levels (ibid., pp.356-7).
ANOVA can only be used for quantitative (metric) data, however the test is robust against deviations from
normality of the data (ibid.).
Non-parametric tests offer the advantage of not requiring particular assumptions concerning the
distribution and the quality of the variable to be compared between groups. As before, there are different
tests for the 2-groups and the k-groups case. The Mann-Whitney U test is the most popular of the 2-
independent-samples tests. It is equivalent to the Wilcoxon rank sum test and the Kruskal-Wallis test for
two groups. Mann-Whitney tests that two sampled populations are equivalent in location. The observations
from both groups are combined and ranked, with the average rank assigned in the case of ties. The number
of ties should be small relative to the total number of observations. If the populations are identical in
location, the ranks should be randomly mixed between the two samples. The number of times a score from
group 1 precedes a score from group 2 and the number of times a score from group 2 precedes a score from
group 1 are calculated. The Mann-Whitney U statistic is the smaller of these two numbers.101 The Mann-
Whitney U tests requires data which is at least of ordinal scale. The Kolmogorov-Smirnov Z test for 2-
independent-samples is a more general test than the Mann-Whitney U test and detects differences in both
the locations and the shapes of the distributions. The Kolmogorov-Smirnov test is based on the maximum
absolute difference between the observed cumulative distribution functions for both samples. When this
difference is significantly large, the two distributions are considered different. Thus, the test is sensitive to
any type of difference in the two distributions: shape, location, etc. In cases of more than two groups, the
Kruskal-Wallis H test, the non-parametric equivalent to ANOVA, can be used. Kruskal-Wallis tests whether
several independent samples are from the same population. It requires data of at least ordinal scale and
assumes that the underlying variable has a continuous distribution and that the samples to be tested are
101 In order to determine the level of significance for non-parametric tests, SPSS (in its module 'exact tests') offers three
possibilities: (i) asymptotic only, (ii) Monte Carlo simulations, or (iii) exact significance. Asymptotic significance, i.e. the standard method which compares calculated test values to an assumed theoretical pre-tabulated distribution, requires large samples and densely filled data tables. The calculation of the exact significance, on the other hand, is very computing-intensive and time-consuming so that even today's powerful computers may fail to produce results in large samples. The Monte Carlo simulation method can be seen as a good compromise between the two techniques, as it can be applied to large data sets but does not require particular assumptions concerning the underlying data. However, the determined significance level is less accurate than the 'exact' one.

180 3 MANAGING INTERNATIONAL FOOD PRODUCT TRADE AT THE COMPANY LEVEL
similar in shape. To sum up, non-parametric tests are powerful and widely applicable statistical procedures
which makes them a useful analysis tool despite their underlying sophisticated computing methods.
Chi-square ( 2χ ) testing and cross-tabulation are appropriate analysis techniques of group
differences when the variable to be analysed is of nominal scale. The chi-square test tabulates a variable
into categories and computes a chi-square statistic. This goodness-of-fit test compares the observed and
expected frequencies in each category to test either that all categories contain the same proportion of values
or that each category contains a user-specified proportion of values. Cross-tables can be formed as two-
way and multi-way tables. The structure of the table and the scale of the data determine the test or
measure to be used. For tables with two rows and two columns, there are Pearson chi-square, the
likelihood-ratio chi-square, Fisher's exact test, and Yates' corrected chi-square. For 2x2 tables, Fisher's
exact test can be computed when a table, that does not result from missing rows or columns in a larger
table, has only one cell with an expected frequency of less than 5. Yates' corrected chi-square can be
computed for all other 2x2 tables. For tables with any number of rows and columns, the Pearson chi-square
and the likelihood-ratio chi-square can be used. For nominal data, test measures based on the chi-square
statistics are: the phi (ϕ) coefficient, Cramer's V, the contingency coefficient (cc), or lambda (λ).102 These
measures indicate the strength of the relationship between the two or more cross-tabulated variables.
The different test procedures which exist to assess group differences are summarised in
Table 46. The selection of a certain test depends on the number of groups to be analysed (2 or more) and
on the quality of the data of the variable used for comparison between the groups.
Table 46: Tests for group differences in 2- or k-independent samples depending on data quality
No. of groups
Quality of data 2 3 or more
Metric � normally distributed / variance homogeneity
t-test F-test (ANOVA)
Metric � non-normally distributed / variance heterogeneity
Mann-Whitney-U-test Kruskal-Wallis-H-test
Non-metric � ordinal Mann-Whitney-U-test Kruskal-Wallis-H-test
Non-metric � nominal Chi-square ( 2χ ) Chi-square ( 2χ )
Source: Author's draft.
102 Phi is a chi-square based measure of association that involves dividing the chi-square statistic by the sample size and
taking the square root of the result. Cramer's V is a very similar measure of association which only differs from phi in the case of multi-way tables. The contingency coefficient is always between 0 and 1, but it is not generally possible for it to attain the value of 1. The maximum value possible depends on the number of rows and columns in a table. Lambda reflects the reduction in error when values of the independent variable are used to predict values of the dependent variable. A value of 1 means that the independent variable perfectly predicts the dependent variable. A value of 0 means that the independent variable is no help in predicting the dependent variable (see BACKHAUS et al. 1996, p.178-80).

3 MANAGING INTERNATIONAL FOOD PRODUCT TRADE AT THE COMPANY LEVEL 181
3.2.2.2 Factor analysis
Factor analysis is a multivariate statistical analysis technique used to condense or to summarise the
information contained in a large number of variables (HAIR et al. 1998, p.88). Variables are bundled into a
smaller set of factors each representing an underlying dimension. Also, factor analysis determines the
extent to which each variable is explained by each dimension. Thus, the two primary uses of factor analysis
� summarisation and data reduction � are achieved (ibid., pp.90-91). Factor analysis can be used for
exploratory or confirmatory research purposes. Unknown data structures can be explored and described by
using factoring techniques. On the other hand, factor analysis can also be used in order to confirm
hypothesised data patterns.
The underlying concept of factor analysis is that variables which are sufficiently correlated with
each other express the same information and can thus be summarised into a single factor. Reducing the
number of variables into a few factors has not only the advantage of limiting the amount of variables to deal
with, but the resulting factors are also independent of each other, thus representing real dimensions, and
reducing multicollinearity problems. Variables that are used in factor analysis should be of metric
measurement, and there must be sets of variables which have at least some degree of correlation among
each other (>0.3) (HAIR et al. 1998, p.99). As a general rule, a minimum of at least five observations for
each variable to be analysed should be available, with any more improving the results considerably (ibid.).
Factor analysis is not a dependency technique, it merely explores existing data pattern and bundles the
information. Thus, factor analysis will always produce results, even if there is no rational explanation for
them. This requires that factor analysis is applied with great care and with clear a priori expectations about
the underlying data structure. Moreover, whenever differing groups are expected in the sample, separate
factor analysis should be performed, and the results should be compared to identify differences not reflected
in the results of the overall sample (ibid., p.100).
The two main models used to obtain factor solutions are (i) common factor analysis, or (ii)
component (or principle components) analysis (HAIR et al. 1998, pp.100-103). The two models differ in the
type of variance used in the calculation process. Component analysis considers the total variance which
exists in the variables, whereas common factor analysis considers only the shared, or common, variance
among the variables (ibid.).103 Both models are widely used, however, the component analysis has �
although it is considered as more theoretically based � some problems (ibid.). First, common factor
analysis suffers from factor indeterminancy, meaning the model gives no single unique solution but several
similar ones. Second, the calculation of this model can take substantial computing power and time. Third,
the calculated communalities, i.e. the total amount of variance that the variables share with all other
variables in the analysis, are not always estimable or may be invalid, which may lead to the deletion of
variables from the analysis. These drawbacks of common factor analysis have made the principle
components model the preferred one. However, in any case, empirical research has demonstrated similar
results for both models in many instances (ibid. p.103).
103 Common variance is defined as that variance in a variable which is shared with all other variables in the analysis.
Specific variance is associated with only a specific variable. Error variance is the variance due to unreliability in the data-collection process, measurement error, or a random component in the measured phenomenon (HAIR et al. 1998, p.100-101).

182 3 MANAGING INTERNATIONAL FOOD PRODUCT TRADE AT THE COMPANY LEVEL
The number of factors to extract is one of the most important decisions in factor analysis, and
since a quantitative method for determining exactly this numbers has not yet been developed, this problem
is subject to a great deal of arbitrary judgement. The decision must be taken carefully, as there are
negative consequences for selecting either too many or too few factors to represent the data. Despite the
lack of precise tests, there are some 'stopping rules' for the number of factors to be extracted. The latent
root criterion is the most commonly chosen technique which can be used for either component or common
factor analysis. Here it is assumed that any individual factor should account for the variance of at least a
single variable if it is to be retained for interpretation. Thus, only factors having latent roots or
eigenvalues104 greater than 1 are considered significant, the other variables are disregarded. Using the
eigenvalues for establishing a cut-off is most reliable when the number of variables is between 20 and 50. If
the number of variables is less than 20, there is a tendency of this method to extract too few factors,
whereas if more than 50 variables are included too many factors might be extracted (ibid., p.104). The
percentage of variance criterion is based on achieving a specified cumulative percentage of total variance
extracted by successive factors. There is no absolute threshold. However in the social sciences � where
information is often less precise � it is not uncommon to stop the factoring procedure when the extracted
factors account for not more than 60% of the total variance (ibid.). The a priori criterion can be applied
when there is already exact knowledge of how many factors there should be. The researcher than simply
instructs the computer to stop the analysis when the desired number of factors has been extracted. The
scree test criterion is based on the eigenvalues as well. Here these values are plotted against the number of
factors in their order of extraction, and the shape of the resulting curve is used to evaluate the cut-off point.
The point at which the curve first begins to straighten out is considered to indicate the maximum numbers of
factors to extract. In general, the scree test results lead to at least one more factor to be considered for
inclusion than the latent root criterion. In practice, several criteria should used to decide on the number of
factors to be included in the final solution, and the practical significance of the factor solution needs also to
be assessed.
The interpretation of the factor solution usually involves several steps. First, the initial
unrotated factor matrix is computed which gives a preliminary indication of the number of factors to extract
(HAIR et al. 1998, p.106). The matrix contains factor loadings for each variable in each factor. In
computing the unrotated factor matrix, a combination of factors is extracted, where the first factor is a linear
combination of the original variables which account for most of the variance in the data. The second factor
is then a linear combination of variables that account for most of the residual variance after the effect of the
first factor has been removed from the data. Subsequent factors are calculated similarly until all the
variance in the data is exhausted (ibid.). Thus, unrotated factor solutions achieve the objective of data
reduction, but they do not provide information that offers the most adequate interpretation of the variables
under examination. Generally, rotation simplifies the factor structure and thus facilitates interpretation of
the factors. The second step will then be to rotate the extracted factors, i.e. to redistribute the variance
104 The eigenvalue (or latent root) is the column sum of squared loadings for a factor, where a factor loading is the
correlation between the original variables and the factor. Squared factor loadings indicate what percentage of the variance in an original variable is explained by a factor. Thus, the eigenvalue represents the amount of variance accounted for by a factor (HAIR et al. 1998, p.89). In practice, factor loadings should at least be greater than ±0.30 in order to be considered practically significant (though the significance level depends also on the sample size: the larger the sample the more significant the loading will be). A ±0.30 loading translates to approximately 10% of the variance explained, and a ±0.50 loading denotes that 25% of the variance is accounted for by the factor.

3 MANAGING INTERNATIONAL FOOD PRODUCT TRADE AT THE COMPANY LEVEL 183
from the first extracted factors to the later ones in order to achieve a simpler, and theoretically more
meaningful factor pattern (ibid., p.107). There are about half a dozen different rotation methods, but one of
the most frequently used is the VARIMAX rotation105. A VARIMAX rotation will yield a factor structure where
the individual factors are clearly separated from each other, thus making the interpretation of the underlying
dimensions easier. The third step involves assessing whether the obtained factor results are sufficiently
accurate and practically meaningful, or whether the factor analysis should be repeated with different
variables included or with a different rotation method. Statistical significance can be assessed in examining
factor loadings for each variable (which in samples of less than 100 observations should at least be greater
than ±0.30, see also Footnote 104). A second measure to assess statistical significance are the
communalities of each variable (ibid., p.113). For example, one can specify that at least one-half of the
variance of each variable must be taken into account by the factor solution what causes variables with
communalities of less than 0.50 to be excluded from the analysis. A final step in the interpretation of a
factor solution is to find factor labels, i.e. to assign some meaning to the pattern of factor loadings. This
step can only be done intuitively by the researcher and the process will mostly be based on his/her
perception of how the factor solution represents the underlying dimensions of a given research context.
Factor scores are composite measures created for each observation on each factor extracted in
the factor analysis (HAIR at al. 1998, p.89). The factor weights are used in conjunction with the original
variable values to calculate each observation's score. The factor scores can then be used to represent the
factor(s) in subsequent analyses. Factor scores are standardised to have a mean of 0 and a standard
deviation of 1. Conceptually the factor score represents the degree to which each individual variable scores
high on the group of variables that have high loadings on a factor. Thus, variables with high loadings will be
given higher factor scores. In practice, factor scores are generally calculated by using regressions. To sum
up, factor scores are calculated if the factor results need to be used in subsequent analysis, such as cluster
of discriminant analysis.
In summary, factor analysis is a multivariate statistical analysis technique used to condense the
information contained in a large number of variables which are bundled into a smaller set of factors
representing underlying dimensions. Thus the two primary uses of factor analysis � summarisation and
data reduction � are achieved. Variables used in factor analysis should be of metric measurement, and
there must be sets of variables which have at least some degree of correlation among each other (>0.3) so
that these sets can be transformed into factors. There are two main models used to obtain factor solutions
(i) common factor analysis, or (ii) component (or principle components) analysis which differ in the type of
variance that they use in the calculation process. In practice, principle component analysis is usually the
preferred method. Several criteria exist to extract the 'correct' number of factors, but all of them can only
give an indication, and practical significance should always be assessed too when decisions on the number of
factor to be extracted are made. The interpretation of the factor solution involves several steps, from
105 VARIMAX is an orthogonal rotation method which treats all factors as independent of each other so that their axes are
maintained at 90 degrees. In effect, the correlation between the factors is determined to be zero. The result is a very clear image of the factor structure. The other group of rotation methods are oblique rotations, where the extracted factors are correlated with each other. These solutions are more realistic, as in practice very few factors are uncorrelated, but they are also more difficult to interpret (see HAIR et al. 1998, p.110-111 for details).

184 3 MANAGING INTERNATIONAL FOOD PRODUCT TRADE AT THE COMPANY LEVEL
extracting an unrotated factor solution, via rotation, to the labelling of the finally accepted factors. Factor
scores can be calculated in order to use the factors, instead of the original variables, in subsequent analysis.
3.2.2.3 Cluster analysis
Cluster analysis is the name given to a group of multivariate interdependence techniques whose primary
purpose is to group objects based on the characteristics they possess (HAIR et al. 1998, p.473). Objects are
classified in a way that the resulting clusters exhibit high internal (within-cluster) homogeneity and high
external (between-cluster) heterogeneity. Thus, when plotted geometrically, the objects within clusters will
be close together, and different clusters will be far apart (ibid.). The focus of cluster analysis is on the
comparison of objects based on the cluster variate, i.e. the set of variables representing the characteristics
used to compare the objects, not on the estimation of the variate itself. This makes an accurate definition of
the variate a critical step in cluster analysis. Cluster analysis is comparable to factor analysis in its objective
of assessing structure. But the two techniques differ in that cluster analysis groups objects, whereas factor
analysis is primarily concerned with grouping variables (ibid.).
The problems involved in cluster analysis result from the fact that it is primarily an exploratory
technique. It can be characterised as descriptive, atheoretical, and noninferential (HAIR et al. 1998, p.474).
It has no statistical basis upon which to draw statistical inferences. The solutions are not unique, as the
cluster membership for any number of solutions is dependent on many elements of the procedure (such as
clustering algorithm, standardisation of the data, and/or the existence of outliners), and many different
solutions can be obtained by varying one or more elements. Moreover, cluster analysis will always create
clusters, regardless of the 'true' existence of any structure in the data. Finally, the cluster solution is totally
dependent on the variables selected as a basis for the similarity measure. The addition or deletion of
relevant variables can have a substantial impact on the resulting solution. Thus cluster analysis, along with
factor analysis, is much more an art than a science (ibid., p.482).
The procedure of cluster analysis demands that at least three steps are performed in order to
obtain a solution: (i) a measure for assessing 'interobject similarity' needs to be defined, (ii) a method for
forming the actual clusters, i.e. the clustering algorithm, needs to be selected, and (iii) the number of the
clusters in the final solution must be determined. An initial step may also involve the standardisation of the
data and the detection and deletion of outliners, as cluster results are very sensitive to the scales the
variables are measured and to the influence of outliners (HAIR et al. 1998, p.482). In the following, these
steps are described in more detail.
Interobject similarity can be measured in different ways, with the three methods most
frequently employed being (1) correlational measures, (2) distance measures, (3) and association measures.
The first two measures require metric data, whereas the third one can also be used for non-metric data
(HAIR et al. 1998, p.484). There are half a dozen different measures, however one of the most

3 MANAGING INTERNATIONAL FOOD PRODUCT TRADE AT THE COMPANY LEVEL 185
recommended ones is Mahalanobis distance (D²) � a distance measure � or the squared Euclidean distance
in case D² is not available in the computer software package used for the calculations (ibid., p.488).106
Clustering algorithms can be divided into two main categories: (1) hierarchical and (2) non-
hierarchical ones. The hierarchical procedures involve the construction of a hierarchy, i.e. a treelike
structure (also called dendrogram) which depicts the formation of the clusters. In this method, each object
starts out as its own cluster. In subsequent steps, the two closest clusters are combined into a new
aggregate cluster, thus reducing the number of clusters by one in each step. In some cases, a third object
joins the first two in a cluster. In other cases, two groups of objects formed at an earlier stage may join
together in a new cluster. Eventually, all objects will be grouped into one final large cluster. The main
disadvantage with this method is that once an object is assigned into a cluster it will stay there even if later
occurring cluster solutions would rather necessitate it to change its membership. That is, this method is
rather inflexible. There are five popular hierarchical clustering algorithms: (1) single linkage, (2) complete
linkage, (3) average linkage, (4) Ward's method, and (5) centroid method. These algorithms differ in how
the distance between clusters is computed (ibid., pp.494-95).107 The Ward's method may be generally the
most frequently used algorithm. Non-hierarchical - or K-means - clustering procedures do not involve the
tree-like construction process. Instead, they assign objects into clusters once the number of clusters to be
formed is specified (ibid., p.496). Thus, for example, a six-cluster solution is not just a combination of two
clusters from the seven-cluster solution, but is based only on finding the best six-cluster solution. A first
step in this procedure demands the selection of a cluster seed as initial cluster centre, and all objects within
a pre-specified threshold distance are included in the resulting cluster. Then another cluster seed is chosen,
and the assignment continues until all objects are assigned. Objects will be reassigned if they are closer to
another cluster than the one originally assigned. As for the hierarchical procedures, there are several
different methods for selecting cluster seeds and assigning objects. However, some statistical software
packages (such as SPSS) do not give the user the choice between these different methods, thus making a
detailed discussion about the pros and cons of each method useless (but see for a description HAIR et al.
1998, p.497). The major problem with non-hierarchical clustering procedures is how to select the cluster
seeds since unfortunately the cluster solutions depend strongly on the initially specified cluster seeds.
Probably the best � and least arbitrary � way is to determine cluster seeds by hierarchical cluster analysis,
thus making a combination of both methods the most reliable way of clustering. That is, first, a hierarchical
technique establishes the number of clusters and profile the cluster centres. Then, a non-hierarchical
method will use these as initial cluster seeds and will 'fine-tune' the results by allowing the switching of
cluster membership (ibid., p.498).
106 The Euclidean distance is a measure of the length of a straight line drawn between two objects (the length of the
hypotenuse of a right triangle). The squared Euclidean distance has the advantage of not having to take the square root which speeds computation considerably. The Mahalanobis distance (D²) is the standardised form of the Euclidean distance. Its calculation not only performs a standardisation process on the data by scaling in terms of standard deviations, but it also sums the pooled within-group variance-covariance, which adjusts for intercorrelations among the variables (HAIR et al. 1998, p.486-88).
107 The single-linkage method is defined as the minimum distance between the closest objects in two clusters. In contrast, the complete linkage method uses the maximum distance between the most farthest objects of any cluster. The average linkage method uses the mean distance from all objects in one cluster to all objects in another cluster. Ward's method uses the sum of squares between two clusters summed over all variables. The centroid method, finally, measures the distance between cluster centroids, i.e. the mean value of all objects in one cluster. (See HAIR et al. 1998, p.493-96 for more information on the advantages and disadvantages of each method.)

186 3 MANAGING INTERNATIONAL FOOD PRODUCT TRADE AT THE COMPANY LEVEL
The number of clusters to be formed is one of the most difficult questions in cluster analysis
since, as in factor analysis, no standard, objective method or stopping rule exists (HAIR et al. 1998, p.499).
Instead several criteria and guidelines have been developed for approaching the problem. The principal
drawback is that these are ad hoc procedures and must be computed by the researcher, and very often this
involves quite complex calculations (ibid.). One class of stopping rules that is relatively simple examines
some measure of similarity or distance between clusters at each successive step, with the cluster solution
defined when the similarity measure exceeds a specified value or when the successive values between steps
make a sudden jump. Thus, one looks for large increases in the average within-cluster distance. When a
large increase occurs, the prior cluster solution will be selected on the logic that its combination caused a
substantial decrease in similarity. The agglomeration coefficient is particularly useful for such a stopping
rule which evaluates the changes in the coefficient at each stage of the (hierarchical) clustering process.
Small coefficients indicate that fairly homogenous clusters are being merged. Joining two very different
clusters results in a large coefficient or a large percentage change in it. Thus, one looks for large increases
in the value, similar to the scree test in factor analysis. This test has been shown to be a quite accurate
algorithm, although it has the tendency to indicate too few clusters (ibid., p.503). A second general class of
stopping rules attempts to apply some form of statistical rule or to perform a statistical test, such as the
point-biserial / tau correlations or the likelihood ratio (ibid., p.499). Although some of these measures are
included in statistical software packages, the measures seem overly complex for the improvement they pro-
vide over simpler measures (ibid.). In any case, in practice a priori criteria, practical judgement and com-
mon sense need to be considered too when a particular cluster solution is selected among a range of others.
The interpretation of clusters involves examining each cluster in terms of the cluster variate in
order to name or to assign a label to it which accurately describes the nature of the cluster (HAIR et al.
1998, p.500). When starting the interpretation process, one measure frequently used is the profile of
cluster centroids. Examining the average scores for each group on the variables underlying the cluster
solution will usually yield a rich description for each cluster (ibid.). The profiling and interpretation of the
clusters, however, achieve more than just description. First, they provide a means for assessing the
correspondence of the derived clusters to those proposed by prior theory or practical experience. Second,
the cluster profiles provide a route for making assessments of practical significance. Thus, in assessing
either correspondence or practical significance, the derived cluster solution can be compared to a pre-
conceived typology (ibid.).
In summary, cluster analysis is a multivariate interdependence technique whose primary purpose
is to group objects based on the characteristics they possess in a way that the resulting clusters exhibit high
internal (within-cluster) homogeneity and high external (between-cluster) heterogeneity. The procedure
demands that at least three steps are performed: (i) the definition of a measure for assessing 'interobject
similarity', (ii) the selection of a method for forming the actual clusters, i.e. the clustering algorithm, and
(iii) a decision on the number of the clusters contained in the final solution. As measure of interobject
similarity the most recommended one is Mahalanobis distance (or squared Euclidean distance). The Ward's
method is one of the most frequently used hierarchical clustering algorithm, however best clustering results
can be achieved if the cluster seeds � which this method yields � are used to fine-tune the cluster solution
by a subsequent non-hierarchical (K-means) clustering procedure. As stopping rule, the agglomeration
coefficient is particularly useful which indicates the changes in cluster heterogeneity at each stage of the

3 MANAGING INTERNATIONAL FOOD PRODUCT TRADE AT THE COMPANY LEVEL 187
(hierarchical) clustering process. The cluster solution before the largest increase in its value should be used.
Finally, the interpretation of a cluster solution involves the profiling of cluster centroids on the underlying
variables. Thus, correspondence with a priori expectations and practical significance can be assessed.
3.2.2.4 Multiple discriminant analysis
Multiple discriminant analysis is a multivariate dependence technique that is used when the dependent
variable is non-metric. In case the variable is dichotomous, i.e. it takes only two values, this technique is
called discriminant analysis, when it multichotomous, i.e. it takes three or more (categorical) values, the
technique is referred to as multiple discriminant analysis. Thus, discriminant analysis can be applied in
situations where a relationship should be predicted or explained which impact the category in which an
object is located (HAIR et al. 1998, p.240). In general, the relationship takes the general form:
nXXXXY ++++= ...3211 . [3.2.2.4-1]
(nonmetric) (metric)
More specifically, this technique estimates a so-called discriminant function, i.e. a variate of the independent
variables selected for their discriminatory power used in the prediction of the group membership. The
predicted value of the discriminant function is the discriminant Z score, which is calculated for each object in
the analysis. The discriminant function takes the form of the linear equation (ibid., p.241)
nknkkjk XwXwXwaZ ++++= ...2211 [3.2.2.4-2]
where
Zjk = discriminant Z score of discriminant function j for object k
a = intercept
wi = discriminant weight for independent variable i
Xik = independent variable i for object k.
Discriminant analysis is the appropriate statistical technique for testing the hypothesis that the
group means, i.e. the centroids, of a set of independent variables for two or more groups are equal (HAIR et
al. 1998, p.245). The test for statistical significance of the discriminant function is a generalised measure of
the distance between group centroids. It is computed by comparing the distributions of the discriminant
scores for the groups. If the overlap in the distribution is small, the discriminant function separates the
groups well. If the overlap is large, the function is a poor discriminator between the groups (ibid.). If there
are more than two groups in the dependent variable, discriminant analysis will calculate NG - 1 discriminant
functions, where NG is the number of groups. Each discriminant function will calculate a discriminant Z
score. Thus, in case of a three-group dependent variable, each object will have a score for each
discriminant function, allowing the objects to be plotted in two dimensions, with each dimension
representing a discriminant function (ibid., p.246). The estimation procedure of discriminant analysis
involves several steps (ibid., pp.256-275). First, the available data need to be checked to assure that they
meet the assumptions of discriminant analysis. Then, the computational method � simultaneous or
stepwise estimation � has to be selected, the discriminant function(s) has/have to be estimated, and the
overall fit and the statistical significance have to be assessed. Finally, the results need to be interpreted. In
the following, these steps are described in more detail.

188 3 MANAGING INTERNATIONAL FOOD PRODUCT TRADE AT THE COMPANY LEVEL
The assumptions of discriminant analysis refer to the scale of the variables, the sample size,
and general model specifications. First, a decision must be made on how many groups should be used for
the estimation procedure. In principle, there are two possibilities: the polar extreme approach involves only
comparing the extreme two groups and excluding the middle group(s) from the discriminant analysis, or the
use of all available groups in the estimation procedure (HAIR et al. 1998, p.257). The former approach may
be useful when group differences are poor, which would result only in the estimation of insignificant separate
discriminant functions. Decisions need also to be made on the independent variables included, as only those
with sufficient discriminatory power should be used in the analysis. Discriminant analysis is quite sensitive
to the ratio of sample size to the number of predictor variables (ibid., p.258). The ratio should at least be
20 observations for each variable, otherwise the results may become unstable (ibid.). The recommended
minimum size is five observations per independent variable (ibid.). In addition to the overall sample size,
the sample size of each group needs to be considered too. At a minimum, the smallest group size must
exceed the number of independent variables, but in practice, each group should at least have 20
observations (ibid.). Moreover, the groups should ideally be quite similar in size, otherwise the results may
be biased (ibid.). Another important assumption is that the data (i.e. the independent variables) must meet
multivariate normality. If this assumption is violated by most variables, the use of other estimation
techniques, such as logistic regression, is advised (ibid., p.259). Finally, multicollinearity between the
independent variables should not be excessive and the relationship between the dependent and independent
variables must be linear (ibid.).
The estimation of the discriminant functions demands as a first step that a decision on the
method of estimation is made. Two computational methods can be utilised in deriving a discriminant
function: the simultaneous (direct) method and the stepwise method (HAIR et al. 1998, p.260).
Simultaneous estimation involves computing the discriminant function so that all of the independent
variables are considered concurrently, i.e. it is computed based upon the entire set of independent variables,
regardless of their discriminatory power (ibid.). This method is appropriate when � for theoretical reasons
� there is a strong reason to include all variables in the analysis and not only the most discriminatory ones.
Stepwise estimation involves entering the variables into the discriminant function one at a time on the basis
of their discriminatory power. The estimation procedure begins by choosing the single best discriminating
variable. This variable is then paired with each of the other independent variables one at a time, and the
variable that is best able to improve the discriminating power of the function in combination with the first
variable is chosen. The subsequent variables are selected in a similar manner. As additional variables are
included, some previously selected ones may be removed if the information they contain about group
differences is available in some combination of the other variables included in later stages (ibid.). The
stepwise method is useful when a relatively large number of independent variables are to be considered for
inclusion in the discriminant function. By sequentially selecting the next best discriminating variable at each
step a reduced set of variables is identified which is typically as good � and sometimes even better than �
the complete set of variables (ibid., p.261). However, it should be noted that stepwise estimation becomes
less stable and generalisable as the ratio of sample size to independent variable, falls below the
recommended level of 20 observations per independent variable (ibid.).
Assessing statistical significance is the next step in the estimation procedure of discriminant
analysis. After the discriminant function(s) has/have been computed, the level of significance must be

3 MANAGING INTERNATIONAL FOOD PRODUCT TRADE AT THE COMPANY LEVEL 189
assessed, for which a number of statistical criteria is available (HAIR et al. 1998, p.262). One of the most
commonly used measures is Wilks' Lamba, also called the maximum likelihood criterion or U statistics. It is
a measure that examines whether group differences are somehow different without being concerned with
whether they differ on at least one linear combination of the dependent variables (ibid., p.351).108 Another
measure frequently used is the chi-square statistic (see Section 3.2.2.1). If the number of groups is three
or more, what must be tested is not only if the discrimination between groups is overall statistically
significant but also if each of the estimated discriminant functions is statistically significant (ibid.). All
statistical software packages provide standard significance tests for accessing the significance of the
estimated discriminant function(s).
The assessment of the overall fit of the discriminant function(s) usually involves three
steps: the calculation of discriminant Z scores for each observation, the evaluation of group differences on
the discriminant Z scores, and the assessment of the prediction accuracy of group membership (HAIR et al.
1998, p.263). Z scores are calculated using Equation [3.2.2.4-2]. This score � a metric variable �
provides a direct means of comparing observations on each function. Observations with similar Z scores are
assumed to be more alike on the variables constituting the discriminant function than those with disparate
scores (ibid.). The evaluation of group differences can be done in comparing the group centroids, i.e. the
average discriminant Z score for all group members (ibid.). A measure of success of discriminant analysis is
its ability to identify discriminant function(s) that result in significantly different group centroids. There are
standard tests available for assessing this difference. The assessment of group membership prediction
accuracy is not possible by using conventional measures, such as R² (ibid., p.264). Rather, each
observation must be assessed as to whether it was correctly classified. This is because the statistical tests
for assessing the significance of the discriminant function do not tell how well the function predicts.109 To
determine the predictive ability of a discriminant function, classification matrices must be constructed (ibid.).
These matrices are created by cross-tabulating actual group membership with predicted group membership,
where the numbers on the diagonal represent correct classifications, and off-diagonal numbers represent
incorrect classifications (ibid., p.241). Several criteria exist in order to assess whether the classification
achieved by the estimated discriminant model is significantly better than a pure chance classification. The
most commonly used are the proportional chance criterion and Press's Q statistic. The proportional chance
criterion is used when group sizes are unequal and it is calculated as the sum of the squared proportions of
all groups, i.e. 2
1∑=
=
K
i
iPRO N
nC , with K = number of groups, ni the number of observations in group i, and
N = total sample size. This percentage value is compared to the value of correct classification that would be
expected by chance. No precise decision rules have been developed, but in general, the classification
accuracy should be at least 25% higher than that achieved by chance (ibid., p.269). Press's Q statistic is a
statistical test for the discriminatory power of the classification matrix when compared with the chance
108 Wilks' Lambda is calculated using the formulation |W|/|W+A|, where |W| is the discriminant (a single number) of the
sum of W and A, A being the between-groups multivariate dispersion matrix. The larger the between-groups dispersion, the smaller the value of Wilks' Lambda and the greater the implied significance. Although the distribution of Wilks' Lambda is complex, good approximations for significance testing are available by transforming it into an F statistic (HAIR et al. 1998, p. 351).
109 With sufficiently large sample sizes, the group means (centroids) could be virtually identical, and there would still be statistical significance. Thus, the level of significance is a poor indication of the function's ability to discriminate between groups (HAIR et al. 1998, p.264).

190 3 MANAGING INTERNATIONAL FOOD PRODUCT TRADE AT THE COMPANY LEVEL
classification (ibid., p.270). This measure compares the number of correct classifications with the total
sample size and the number of groups. The calculated value is then compared with a critical value (the chi-
square value for one degree of freedom at the chosen confidence level). If it exceeds this critical value,
then the classification matrix can be seen as statistically better than chance. The Q statistic is calculated by
using the formula: ( )[ ]
( )1
2
−−
=KN
nKNQPress's , where N = total sample size, n = number of observations
correctly classified, and K = number of groups.
The interpretation of the results involves the determination of the relative importance of each
independent variable in the analysis. There are three commonly used measures to assess this importance:
(i) standardised discriminant weights, (ii) discriminant loadings (structure correlations), and (iii) partial
F values (HAIR et al. 1998, p.272). Discriminant weights, the wi in Equation 3.2.2.4-2 (sometimes also
referred to as discriminant coefficients), express the relative contribution of its assigned variable to that
function. Independent variables with relatively larger weights contribute more to the discriminatory power
of the function than do variables with smaller weights. The sign of the weight denotes only that the variable
makes either a positive or negative contribution (ibid.). Thus, small absolute weights indicate that its
corresponding variables are irrelevant in the analysis. However, discriminant weights are subject to
considerable instability (ibid.). Discriminant loadings (or structure correlations) measure the simple linear
correlation between each dependent variable and the discriminant function (ibid.). Thus the loadings reflect
the variance that the independent variables share with the discriminant function and they can be interpreted
like factor loadings in assessing the relative contribution of each independent variable to the discriminant
function (ibid.). Discriminant loadings are less unstable than discriminant weights and they are considered
as more valid than weights as a means of interpreting the discriminant power of independent variables
because of their correlational nature (ibid.). Partial F values are another measure of assessing the relative
discriminating power of independent variables which is, however, only available in the stepwise calculation
method. The F values are calculated for each variable entering the estimation procedure. Large values
indicate greater discriminatory power. In practice, rankings of independent variables using the F values
approach are the same as the ranking derived from using discriminant weights, but the F values indicate
associated levels of significance for each variable (ibid., p.273).
In summary, (multiple) discriminant analysis is a multivariate dependence technique used when
the dependent variable is non-metric. It can be applied in situations where a relationship should be
predicted or explained which impact on the category in which an object is located. A so-called discriminant
function will be estimated, i.e. a variate of the independent variables selected for their discriminatory power
used in the prediction of the group membership. In case there are more than two groups in the dependent
variable, NG - 1 discriminant functions will be calculated, where NG is the number of groups. Also,
discriminant analysis is the appropriate statistical technique for testing the hypothesis that the group means,
i.e. the centroids, of a set of independent variables for two or more groups are equal. The estimation
procedure of discriminant analysis involves several steps: First, the available data need to be checked to
assure that they meet the assumptions of discriminant analysis. Then, a computational method �
simultaneous or stepwise estimation � must be chosen, the discriminant function(s) has/have to be
estimated, and the overall fit and the statistical significance has to be assessed. Finally, the results must be
interpreted.

3 MANAGING INTERNATIONAL FOOD PRODUCT TRADE AT THE COMPANY LEVEL 191
3.2.3 Survey results
This section describes the results obtained from the two surveys in detail. The structure of the discussion
follows the order of the questionnaire. At the end of each section the key findings are summarised in a few
sentences.
3.2.3.1 General questions about the company
The sizes of the sub-samples turned out to be almost symmetric which offers the advantage of facilitating
the comparison of the results. The total number of responses (166) is fairly evenly split into a German (82)
and Australian (84) sub-sample. 64.6% of the German respondents are manufacturers as compared to
75.0% for the Australian responses. Overall, the sample thus consists of 69.9% manufacturers and 30.1%
traders.
The job positions of the respondents � which reflects their professional competence and thus
the quality of the survey results � can be categorised as follows. Overall, 48% of the respondents are
managing directors or CEOs, 38% are export, marketing or sales managers. 6% company proprietors filled
in the questionnaires and the remaining 7% of respondents hold other positions such as finance officers,
accountants, assistants, etc. There are some differences between the German and the Australian sub-
sample, as in the former the majority (47%) of the respondents hold more functional positions such as
export managers, whereas in the latter more than half (58%) of all respondents hold a more general
management position such as managing director or CEO. The same is true for the manufacturer and trader
sub-samples: whereas the majority (51%) of the respondents of food manufacturing companies hold
functional positions, 73% of those of the trading companies were managing directors or CEOs. This finding
applies broadly also to the individual German or Australian manufacturer or trader sub-samples. In general,
it becomes clear that the quality of the responses can be considered high, but the German responses may
reflect a more technical/operational attitude, whereas the Australian responses may express a more general
management point of view.
The sizes of the surveyed companies, as measured by the number of staff they employ, are in
the majority of the cases rather small. Overall, 36% of the companies employ less than 10 people, and
24% between 10 and 49. Only 11% of them have staff in excess of 500 people. There are statistically
significant differences (99% confidence level) in the means of the staff number between the German (411.0)
and Australian (92.6), and the manufacturer (355.2) and trader (10.5) sub-samples. As a result, it becomes
clear that German companies are generally larger than Australian ones and that in both countries
manufacturers employ more staff than traders do.
The turnover (without taxes) classes of the surveyed companies can be described as follows:
overall, 47% of the companies earned between DM10m and DM99m in the last financial year before the
survey. 32% of all companies earned less than DM10m in that year, and only 5% DM500m or more. It is
clear that companies that employ more staff should also have higher turnovers. However, it is interesting to
calculate the turnover-per-employee ratio, since it may reflect overall productivity of the surveyed
companies. Table 48 lists these ratios for all sub-samples. Even if these values

Table 47: Survey results — general questions about the company
GERMAN AUSTRALIAN
Question
All companies Manufacturers Traders Manufacturers Traders
All Manufacturers
All Traders
All GERMAN
All AUSTRALIAN
No. of companies
166 53 29 63 21 116 50 82 84
7
38
48
6 6
69
24
18
7
64
11
5
37
49
10
510
86
5
51
38
6
128
73
6 10
47
38
5 5
30
58
7
Position of responders % of total (proprietor; managing dir. / CEO; export manager, etc.; others) Prop MD Exp Oth Prop MD Exp Oth Prop MD Exp Oth Prop MD Exp Oth MD Exp Oth Prop MD Exp Oth Prop MD Exp Oth Prop MD Exp Oth Prop MD Exp Oth
11
29
24
36
27
50
19
4 4
32
64
5
33
28
33
15
85
15
41
2420
25
73
18
34
2425
4
2525
46
No. of employees % of total
1-9 10-49
50-499
≥ 500
1-9 10-49
50-499
≥ 500
1-9 10-49 50-499
1-9 10-49
50-499
≥ 500
1-9 10-49 1-9 10-49
50-499
≥ 500
1-9 10-49 50-499
1-9 10-49
50-499
≥ 500
1-9 10-49
50-499
≥ 500
5
15
47
32
15
31
44
10
11
70
19
9
36
54
56
44
8
19
3934
7
64
29
9
24
53
13
7
41
51
Total turnover (without taxes) of last financial year % of total (DM million; DM1 = A$0.83) <
10 10-99
100499
≥ 500
< 10
10-99
100499
≥ 500
< 10 10-99 100-499
< 10
10-99
99-499
≥ 500
< 10 10-99 < 10
10-99
100499
≥ 500
< 10 10-99 100-499
< 10
10-99
100499
≥ 500
< 10
10-99
100499
≥ 500
7
89
4
86
10
100% privately owned
12
87
11
89
8
86
6
96
91
6 11
87
Legal status of companies % of total (publicly listed, privately owned, others) Public Private Others Public Private Others Public Private Others Private Others Public Private Others Private Others Public Private Others Public Private Others
% of proprietors engaged in management
79.8 64.2 82.1 85.2 100 75.4 89.8 70.4 89.0
Corporate age in years mean (min/max)
41.0 (1/310)
77.3 (3/310)
30.0 (1/118)
26.8 (1/148)
8.3 (1/22)
49.6 (1/310)
21.1 (1/118)
60.2 (1/310)
22.3 (1/148)
_________________ c o n t i n u e d _______________________
192
3 M
AN
AG
ING
INTERN
ATIO
NAL FO
OD
PRO
DU
CT T
RAD
E A
T T
HE C
OM
PAN
Y LE
VEL

GERMAN AUSTRALIAN
Question
All companies Manufacturers Traders Manufacturers Traders
All Manufacturers
All Traders
All GERMAN
All AUSTRALIAN
25
43
28
4
35
44
19
21
28
41
10
15
49
30
33
33
43
24
24
47
25
3
26
3434
6
30
38
27
5
20
48
28
22
Degree of competition % of total (1=never,..., 5= totally aggressive)
1 2 3 4 5 2 3 4 5 2 3 4 5 1 2 3 4 5 3 4 5 1 2 3 4 5 2 3 4 5 2 3 4 5 1 2 3 4 5
1.21.31.2
3.0
2.2
1.41.5
1.3
2.7
2.3
1.51.31.1
2.0
4.1
1.11.11.2
3.1
1.4
1.21.11.3
4.5
1.4
1.11.31.2
2.9
1.8
1.31.21.2
3.12.9
1.41.4
1.2
2.5
3.0
1.11.11.2
3.4
1.4
Foreign business transactions mean out of 5 (importing, export., licensing/franchising, FDI, others) Imp Ex L/F FDI Oth Imp Ex L/F FDI Oth Imp Ex L/F FDI Oth Imp Ex L/F FDI Oth Imp Ex L/F FDI Oth Imp Ex L/F FDI Oth Imp Ex L/F FDI Oth Imp Ex L/F FDI Oth Imp Ex L/F FDI Oth
Europe
America
Africa
Asia
AUS/NZ
Form USSR
Main foreign markets mean %
Others 3
432
39
47
6
85
10
9
11
69
9
59
12
15
12
4
60
7
10
5
32
9
48
5
31
8
8
45
6
8
79
6
7
59
10
14
25
43
31
25
47
27
3431
34
20
48
32
29
3833
22
48
30
323434
29
41
30
22
45
32
Degree of geographical diversification mean % of total (non-diversified, lowly diversified, highly diversified) Non Lowly Highly Non Lowly Highly Non Lowly Highly Non Lowly Highly Non Lowly Highly Non Lowly Highly Non Lowly Highly Non Lowly Highly Non Lowly Highly
3
22
60
15
30
62
8
23
51
25
7
16
61
16
3
15
62
20
4
23
62
12
20
56
23
28
58
14
6
16
61
17
Main foreign business partners mean % of total (processors, whole-salers, retailers, consumers) Proc Who Ret Con Proc Who Ret Con Proc Who Ret Con Proc Who Ret Con Proc Who Ret Con Proc Who Ret Con Proc Who Ret Con Proc Who Ret Con Proc Who Ret Con
Source: Author's compilation from questionnaire responses.
3 M
AN
AG
ING
INTERN
ATIO
NAL FO
OD
PRO
DU
CT T
RAD
E A
T T
HE C
OM
PAN
Y LE
VEL
193

194 3 MANAGING INTERNATIONAL FOOD PRODUCT TRADE AT THE COMPANY LEVEL
seem high (which may be caused of biased responses), it becomes clear that German companies seem to
have higher productivity levels than Australian ones. However, the differences are (at the 99% confidence
level) only statistically significant for the sample as a whole and for the manufacturer sub-sample. For the
trader sub-sample, the existing difference is not large enough to achieve generaliseability, given the small
sample size of just 50 observations. In summary, the survey results suggest that German companies
generally are not only larger, they are also more productive, as measured by turnover per employee.
Table 48: Mean turnover (without taxes, in DM'000)* per employee
Manufacturers� Traders Total�
German 614.7 4 226.7 1 915.0
Australian 466.5 3 029.0 1 063.2
Total 534.9 3 763.9 1 494.9
Notes: * Australian turnover values have been converted using as exchange rate: DM1 = A$0.83 (annual average rate of 1998). � Differences between countries statistically significant (99% confidence level), using the exact Mann-Whitney U test for 2-independent samples.
Source: Author's compilation from questionnaire responses.
The legal status of the surveyed companies does not differ greatly between the sub-samples. In
the great majority, companies are owned privately. Only 10% of German manufacturers are listed publicly,
in all other samples, this figure is even lower. This finding corresponds well with the fact that most sample
companies are small- and medium-sized businesses, which in general are listed rarely on stock markets.
The percentage of proprietors engaged in management turns out to be high in the surveyed
companies. Overall, almost 80% of the owners hold either the position of a managing director or of a CEO.
There is a statistically significant difference (99% confidence level) between the Australian (89.0% of
proprietors engage in management) and the German (70.4%) sub-sample, but not between the
manufacturer (75.4%) and trader (89.8%) sub-samples. This finding supports the results from the question
on the job titles of the respondents in that the answers of the Australian companies may be biased versus
general management, whereas German responses may reflect a more functional management background.
The corporate age of the surveyed companies varies widely. The mean age is 39.3 years, the
maximum is 180 years and the minimum 1 year. As probably could have been expected, Australian
companies have been existing for much less time (22.3 years), as compared to the German ones (56.7
years). Also, manufacturing companies are on average older (47.1 years) than trading businesses (21.1
years) (both findings are statistically significant at the 99% confidence level).
The degree of competition that the surveyed companies face does not differ greatly between
countries, nor between business classes (no statistically significant differences at the 99% confidence level).
Overall, 43% of survey respondents see their company operating in an 'aggressive' competitive
environment, 28% in a 'middle aggressive', 25% in a 'totally aggressive', 4% in a 'less aggressive' and only
1% in a 'never aggressive' business environment.

3 MANAGING INTERNATIONAL FOOD PRODUCT TRADE AT THE COMPANY LEVEL 195
The pattern of foreign business transactions, in the categories: importing, exporting,
licensing/franchising, foreign direct investment (FDI), and others (such as consulting) is considerably
different through the sub-samples. Overall, exporting is the category of foreign business transactions which
is mostly practised (with a mean rating of 3.0 out of 5), followed by importing (2.2) and FDI (1.3).
However, German companies import more (3.0) than they export (2.5), which is strongly opposed to the
Australian pattern with exports leading (3.4) far ahead of imports (1.4). This structural dissimilarity is most
apparent for the business class of the traders, which are strongly import-oriented in Germany (4.1) and
strongly export-directed in Australia (4.5). For manufacturers the pattern of foreign business transactions is
more uniform, with exports leading in both countries (2.7 for German companies versus 3.1 for Australian
ones), ahead of imports (2.3 versus 1.4). In summing up, it becomes clear that in particular the German
responses (and above all those from trading companies) reflect more an importer attitude, whereas the
Australian ones are thoroughly export-oriented. All other categories of foreign business transactions don't
seem to be very important in the surveyed companies.
The main foreign markets which are served differ widely between the surveyed companies from
Australia and Germany, but not between manufacturers and traders. The very clear finding is that German
companies do foreign business mostly in Europe (79% of the total foreign market) and America (8%),
whereas for 59% of Australian companies Asia is the largest market, followed by Europe (14%) and America
(10%). In calculating a measure for geographical diversification, which classifies companies into the three
categories (i) non-diversified (i.e. they operate only in one continent), (ii) lowly diversified (two continents),
and (iii) highly diversified (more than two continents), it appears that German companies are slightly more
diversified than Australian ones, however this finding is not statistically significant.
As main foreign business partners, overall, wholesalers come first (60% of total foreign
transactions), followed by retailers (22%), processors/manufacturers (15%), and consumers (3%). There
are some differences between German and Australian companies: German businesses do not tend to deal
directly with consumers (1%) and seem to prefer contacts with retailers (28%), whereas Australian
companies interact more with consumers (6%) and less with retailers (16%). This finding is in particular
true for Australian manufacturers, which is the most consumer-oriented sub-sample. Finally, as it could be
expected, traders deal more with processors/manufacturers and manufacturers interact more often with
wholesalers (i.e. traders).
In summary, the survey findings suggest that, in general, German companies are larger, older,
more productive, they are more often publicly listed, they tend to be importers (in particular traders), they
operate mostly in European markets, and they are less consumer-oriented than Australian businesses.
Moreover, German responses reflect attitudes from functional (i.e. export, sales, etc.) managers, which
seems logical since larger companies normally have higher degrees of specialisation and thus offer more
functional job positions. The responses of Australian companies, on the other hand, express a more general
management background (i.e. managing directors, or CEOs). Australian companies have their main foreign
markets in Asia. The main structural differences between manufacturers and traders are, that
manufacturers generally seem to have higher corporate ages, they are larger in size, and they are more
export-oriented than traders.

196 3 MANAGING INTERNATIONAL FOOD PRODUCT TRADE AT THE COMPANY LEVEL
3.2.3.2 Foreign business performance
The assessment of foreign business performance, or 'success', is difficult, given the multidimensional
nature of this concept (DALLI 1994, p.96). That is, there are many, different, variables that can be used to
measure foreign business performance. For example, Table 49 lists numerous measures that have been
used for assessing export performance. However, as seen before, companies which operate internationally
use in general more than just one international marketing strategy, i.e. they export and import or invest
directly at the same time. In such a case, assessing foreign business performance as a whole may therefore
even be more complex.
Table 49: Various measures of export performance
Performance dimension Variables
> Percentage of sales a company obtains from exporting > Company's export sales/domestic sales compared with industrial average > Annual export volume (categorised by cut-offs) > Export stages > Export sales compared with domestic sales on a "-3 to+3" bipolar scale > Proportion of products exported
Export involvement / intensity
> Management's perception of export involvement
> Perceptions about profitability of exporting relative to home marketing > Export profitability/growth: total net income/sales growth compared to domestic income/sales growth > Satisfaction with export performance > Export productivity: export sales per employee or per manager
Profitability, productivity and growth
> International commitment: formalisation of internal arrangements for exporting activity; number of different channels used by the company; number of actual foreign customers; number of actual foreign markets
> Exporting vs. non-exporting > Export initiation: active vs. reactive; aggressive vs. passive; innate vs. adoptive; systematic vs. non-systematic > Export intention: interested, plan, excess resource allocation > Export experience > Export markets OECD vs. developing countries
Others (categorical measures)
> Export market extension vs. concentration vs. diversification
Source: Adapted from BODUR M. (1994), 'Foreign market indicators, structural resources and marketing strategies as determinants of export performance', in CAVUSGIL S.T. & AXINN C.N. (eds.), Advances in International Marketing � Export Marketing: International Perspectives, Vol. 6, pp.186-7.
The variables used to evaluate international business success in this study were selected
carefully in order to capture the various dimensions of the international business performance concept.
However, only export and import activities were taken into consideration from the very start, as these
activities were assumed to be the most important for small- and medium-sized food businesses. The
following aspects were investigated: (i) the length of foreign business experience (in years), (ii) the share of
exports or imports in total turnover (in %), the (iii) growth rate of foreign business during the last three
years (in %), (iv) the current business development tendency (separate ratings on a 5-point scale for
foreign, domestic and total business activities), and (v) the future (next three years) business development
tendency (measured on the same 5-point scale). Finally, another variable was introduced in order to control
for different growth tendencies in different countries or for different products. In order not to run the risk of
wasting valuable questionnaire space for questions with a small likelihood of being answered, no question

3 MANAGING INTERNATIONAL FOOD PRODUCT TRADE AT THE COMPANY LEVEL 197
asked about foreign business profitability. This is, because in general companies are reluctant to give
somehow confidential information. Already the question for the growth rate was critical, and indeed it
turned out to be the question with the lowest overall response rate, which caused 12% of the questionnaires
to be excluded from the final evaluation seeking to identify the key success factors. In the following, the
responses to these questions will be presented. How these variables were used to differentiate successful
companies from less successful ones is described in Section 3.2.3.10.
The length of foreign business experience differs statistically significantly (99% confidence
level) between German (mean 28.1 years) and Australian (10.4 years) companies. However, there is no
significant difference between manufacturers (19.4 years) and traders (18.5 years), although there is one in
corporate age (see above). This implies that traders from the very beginning of their business activity either
already start as export/import business or very soon begin to operate internationally. This conclusion is
supported by the calculation of the ratio of years of foreign business experience/corporate age, which gives
an index measure ranging from 1 (business is from the very start involved in international deals) to 0
(business has not yet started to operate internationally). Table 50 lists these ratios. It becomes clear that
there is a general statistically significant difference between manufacturers and traders with the latter going
much earlier into foreign markets. Moreover, between countries there is a statistically significant difference
for manufacturers, i.e. German companies start foreign business activities considerably later than Australian
ones.
Table 50: Mean ratios* indicating the speed of foreign market entering for German and Australian business classes
Manufacturers� Traders Total
German� .44 .96 .62
Australian� .59 .95 .68
Total� .52 .96 .65
Notes: * Ratio calculated as years of foreign business experience/corporate age, which gives an index measure moving between 1 (business is from the very start involved in international deals) and 0 (business has not yet started to operate internationally). � Differences between countries statistically significant (95% confidence level), using the Monte Carlo Mann-Whitney U test for 2-independent-samples. � Differences between business classes statistically significant (99% confidence level), using the exact Mann-Whitney U test for 2-independent-samples.
Source: Author's compilation from questionnaire responses.
The questions about export and imports shares (in total turnover) confirm generally what has
already been found in the question about the foreign business transactions (see above). Australian
companies are generally more export-oriented (52% of all respondents have export shares of more than
50%, as compared to only 9% of German businesses). On the other hand, 33% of German companies have
import shares in excess of 50%, but only 2% of Australian respondents are in this category. The main
difference is between the trading companies, as they are strong exporters in Australia (90% have export
shares larger than 50%), but strong importers in Germany (76% have import shares larger than 50%).
Both measures will be used later to calculate a combined 'trade share' in order to measure the strength of
foreign business involvement.

Table 51: Survey results — foreign business performance of sample companies
GERMAN AUSTRALIAN
Question
All companies Manufacturers Traders Manufacturers Traders
All Manufacturers
All Traders
All GERMAN
All AUSTRALIAN
Years of foreign business experience mean (min/max)
19.1 (1/200)
28.6 (1/200)
27.3 (1/118)
11.5 (1/60)
7.1 (1/22)
19.4 (1/200)
18.5 (1/118)
28.1 (1/200)
10.4 (1/60)
30
3732
8
55
38
10
34
55
3934
26
90
55
25
44
32
44
22
34
9
4844
52
2721
Export shares in total turnover % of total (little <10%, medium 10-50%, high >50%)
<10% 10-50% >50% <10% 10-50% >50% <10% 10-50% >50% <10% 10-50% >50% <10% 10-50% >50% <10% 10-50% >50% <10% 10-50% >50% <10% 10-50% >50% <10% 10-50% >50%
1813
69
9
19
72
76
17
7 5
92
19
81
611
82
44
18
38
33
18
49
9
89
Import shares in total turnover % of total (little <10%, medium 10-50%, high >50%)
<10% 10-50% >50% <10% 10-50% >50% <10% 10-50% >50% <10% 10-50% >50% <10% 10-50% <10% 10-50% >50% <10% 10-50% >50% <10% 10-50% >50% <10% 10-50% >50%
13
70
116
14
74
84
92
8 15
62
158
21
58
21
15
68
126 9
77
95 9
80
55 17
61
17
6
Growth rates % of total (declining <0%, stagnant 0%, growing 1-99% strongly growing ≥100%) <0% 0% 1-
99% ≥100% <0% 0% 1-
99% ≥100% <0% 1-99% <0% 0% 1-
99% ≥100% 0% 1-99% ≥100% <0% 0% 1-
99% ≥100% <0% 0% 1-
99% ≥100% <0% 0% 1-
99% ≥100% <0% 0% 1-
99% ≥100%
3.7
3.5
3.7
3.5
3.4
3.6
3.6
3.3
3.4
4.0
3.6
3.8
4.0
3.3
4.3
3.7
3.5
3.7
3.8
3.3
3.8
3.5
3.4
3.5
4.0
3.6
3.9
Current business development mean out of 5 (1=strongly de-creasing,..., 5=strongly growing) Foreign Domestic Total Foreign Domestic Total Foreign Domestic Total Foreign Domestic Total Foreign Domestic Total Foreign Domestic Total Foreign Domestic Total Foreign Domestic Total Foreign Domestic Total
3.9
3.6
4.0
3.7
3.4
4.0
3.7
3.3
3.6
4.0
3.9
4.0
4.3
3.7
4.3
3.9
3.7
4.0
3.9
3.4
3.9
3.7
3.4
3.8
4.1
3.8
4.1
Future (next 3 years) business development mean out of 5 (1=strongly de-creasing,..., 5=strongly growing) Foreign Domestic Total Foreign Domestic Total Foreign Domestic Total Foreign Domestic Total Foreign Domestic Total Foreign Domestic Total Foreign Domestic Total Foreign Domestic Total Foreign Domestic Total
34
11
37
18
4440
16
43
5
2924
23
16
45
16
38
24
14
24
31
10
43
16
40
14
2124
44
36
19
27
18
37
18
Foreign busin. development pattern % of total (homogenous deve-lopment, differences in countries or products, or both) Homo Count Prod Both Homo Count Both Homo Count Prod Both Homo Count Prod Both Homo Count Prod Both Homo Count Prod Both Homo Count Prod Both Homo Count Prod Both Homo Count Prod Both
Source: Author's compilation from questionnaire responses.
198
3 M
AN
AG
ING
INTERN
ATIO
NAL FO
OD
PRO
DU
CT T
RAD
E A
T T
HE C
OM
PAN
Y LE
VEL

3 MANAGING INTERNATIONAL FOOD PRODUCT TRADE AT THE COMPANY LEVEL 199
The growth rates of total foreign business (as measured by the percentage change in foreign
business turnover / total turnover during the last three years) show a fairly homogenous distribution
through all sub-samples. Overall, 70% of the respondent companies have had mean growth rates between
1% and 99%, 13% of the companies in excess of 100%, 11% of the companies have not shown any growth,
and 6% have had negative growth. There are no statistically significant differences between the mean
growth rates of the sub-samples, suggesting that the industry structure is quite mature in both countries.
The growth rates will be used later to classify sample companies into more and less successful companies.
The current and the future business development tendencies are highly correlated. This
finding indicates that managers may interpolate from the current situation into the medium-term future.
However, the results show also that the assessment given in questionnaires is not always reliable.
Theoretically, the total business development tendency should always be a weighted mean of the foreign
and the domestic development tendency. However, Australian companies in particular (and above all
Australian manufacturers) have rated the total business tendencies more positively than its two
components. This is also true for German traders. In general, however, all companies assess the foreign
business development tendencies more positively than the domestic ones. Australian companies rate the
current foreign business development tendency significantly higher (99% confidence level) than German
companies (3.9 versus 3.5, on a 5-point rating scale), but there is no statistically significant difference
between manufacturers (3.7) and traders (3.8). This pattern is also true for the future (next three years)
foreign business development tendency (at the 95% confidence level). Thus, to sum up, Australian
companies in general seem to be more optimistic about the future of their foreign business activities.
The future foreign business pattern, i.e. whether the sample companies expect homogenous
growth, or rather differences in countries or products, is assumed to change by most respondents. Overall,
only 18% of the respondents expect homogenous growth, 37% see changes in the composition of foreign
countries they operate in, 11 % see changes in the products they exchange currently with foreign countries,
and 34% of the companies see changes in both countries and products. Australian companies expect a
stronger change in the products they exchange (18%) than German ones (1%). 43 % of the manufacturers
expect changes in the foreign countries they deal with, versus only 21 % of the traders. Although these
findings are interesting, this variable will not be used further for a classification of more or less successful
companies.
In summary, it becomes clear that measuring foreign business performance or 'success' is
complex, since this concept is multidimensional in nature. Nevertheless, the survey results suggest that
trading companies start significantly faster with foreign business activities than manufacturing companies,
but that German manufacturers are even significantly slower than Australian ones. German companies (and
in particular German trading companies) are more import-oriented, whereas Australian food product
businesses are more export-oriented. There is no statistically significant difference in the past growth rates
between German and Australian companies, but the latter rate their current and medium-term future
business development tendencies significantly more positively. These findings will be used in Section
3.2.3.10 for a classification of the sample companies into groups which operate of more or less
internationally successfully.

200 3 MANAGING INTERNATIONAL FOOD PRODUCT TRADE AT THE COMPANY LEVEL
3.2.3.3 Foreign business qualification
This section investigates a number of independent variables with respect to the foreign business
qualification of a company, and which may influence its foreign business performance. In particular, the
relative number of staff employed directly for foreign business activities, the education and job training of
these employees, their foreign language skills, and their knowledge of foreign business partners' mentality
are addressed. The respondents were also asked how they would assess the critical importance of some of
these variables.
The number of staff engaged directly in foreign business activities differs considerably
between the companies. It can be expected that the number of foreign business staff rises proportionally
with the size of a companies and the share of its foreign business in total business activities. However, in
calculating a ratio between these variables, it should be possible to compare the relative use of staff for
foreign business activities net of the effects of overall company size and foreign business involvement.
Table 52 lists these ratios and it becomes clear that there is a statistically significant difference (99%
confidence level) between German and Australian companies, indicating that the latter employ structurally
more staff for the same degree of foreign business involvement. On the other hand, there is also a
statistically significant difference between manufacturing and trading companies, with the former employing
slightly more staff. These figures confirm the findings concerning the 'mean turnover per employee' and
may simple reflect the fact that larger companies (and in the sample German companies are larger than
Australian ones) have in general higher productivity levels than smaller ones.
Table 52: Mean ratios* indicating the relative number of staff employed for the same degrees of foreign business activities in German and Australian business classes
Manufacturers� Traders� Total�
German� 1.20 1.28 1.23
Australian� 1.79 1.74 1.78
Total� 1.51 1.48 1.50
Notes: * Ratio calculated as (no. of staff employed directly for foreign business activities / total staff of firm) / [0.5* (export share + import share)], which gives an index measure indicating the relative use of staff per the same degree of foreign business involvement. The higher this value, the higher the companies are staffed relatively. � Differences between countries statistically significant (99% confidence level), using the exact Mann-Whitney U test for 2-independent-samples. � Differences between business classes statistically significant (99% confidence level), using the exact Mann- Whitney U test for 2-independent samples.
Source: Author's compilation from questionnaire responses.
The education and job training of the foreign business staff can be classified into three
categories: university degrees/diplomas, apprenticeships, and others (such as e.g. non-academic degrees
from private or public institutions, or no particular job training at all). In both countries, about 40% of the
foreign business staff hold university degrees/diplomas. In Germany, the share of the apprenticeship kind of
job training is quite important (51%), given the overall importance of this sort of job training in the country.
In Australia, 'other' forms of job training (55%) are most important, indicating that the German and the
Australian educational systems may not be directly comparable. There are no major differences between
manufacturing and trading companies.

Table 53: Survey results — foreign business qualification of sample companies
GERMAN AUSTRALIAN
Question
All companies Manufacturers Traders Manufacturers Traders
All Manufacturers
All Traders
All GERMAN
All AUSTRALIAN
# of employees for foreign busi-ness activities mean (min/max) mean share in total employees
22.4 (0/2000) 29.0%
60.1 (0/2000) 7.9%
4.2 (1/11) 49.0%
4.7 (0/40) 20.4%
3.4 (1/12) 82.5%
30.3 (0/2000) 14.6%
3.9 (1/12) 63.3%
40.8 (0/2000) 21.9%
4.4 (0/40) 35.9%
32
29
39
6
51
43
16
51
33
56
9
35
52
3
45
33
28
39
3130
38
9
51
40
55
8
38
Education/train-ing of foreign business staff mean % of total (university degree, apprenticeship, others) Uni Apprent. Others Uni Apprent. Others Uni Apprent. Others Uni Apprent. Others Uni Apprent. Others Uni Apprent. Others Uni Apprent. Others Uni Apprent. Others Uni Apprent. Others
2417
55
2116
3
60
26
10
64
3025
41
2114
58
2520
52
24
12
61
2214
61
2721
47
Kind of univer-sity courses mean % of total (business/economics, law, agriculture/food related studies, others) Busi/
EconLaw Agri/
FoodOthers Busi/
EconLaw Agri/
FoodOthers Busi/
EconLaw Agri/
FoodOthers Busi/
EconLaw Agri/
FoodOthers Busi/
EconLaw Agri/
FoodOthers Busi/
EconLaw Agri/
FoodOthers Busi/
EconLaw Agri/
FoodOthers Busi/
EconLaw Agri/
FoodOthers Busi/
EconLaw Agri/
FoodOthers
3
2722
7
41
2
37
24
4
33
6
30
4
58
3
1825
8
46
5
2628
16
25
2
2724
7
40
6
28
15
8
43
3
35
18
3
41
3
2025
10
41
Further educa-tion/training mean % of total (none, postgraduate uni courses, courses of governmental or private institutions, overseas training) Non Uni Gov Priv Over Non Uni Gov Priv Over Non Uni Gov Priv Over Non Uni Gov Priv Over Non Uni Gov Priv Over Non Uni Gov Priv Over Non Uni Gov Priv Over Non Uni Gov Priv Over Non Uni Gov Priv Over
2
12
3031
25
19
48
33
7
14
54
25
35
13
33
46
15
5
25
55
2
11
2933
25
4
15
33
2523
3
18
50
30
27
11
31
48
No. of foreign languages spoken mean % of total (0 to 4+)
0 1 2 3 4+ 1 2 3 1 2 3 4+ 0 1 2 3 4+ 0 1 2 3 0 1 2 3 4+ 0 1 2 3 4+ 1 2 3 4+ 0 1 2 3 4+
22
37
16
9
17
17
55
19
8
29
61
74
23
9
1616
35
20
7
20
7
47
20
34
18
11
17
26
42
12
2
19
21
57
15
52
22
9
1714
38
Degree of com-mand of foreign languages spok-en mean % of total (1=insufficient know-ledge,..., 5=very good knowledge) 1 2 3 4 5 1 2 3 4 5 1 3 4 5 1 2 3 4 5 1 2 3 4 5 1 2 3 4 5 1 2 3 4 5 1 2 3 4 5 1 2 3 4 5
_________________ c o n t i n u e d _______________________
3 M
AN
AG
ING
INTERN
ATIO
NAL FO
OD
PRO
DU
CT T
RAD
E A
T T
HE C
OM
PAN
Y LE
VEL
201

GERMAN AUSTRALIAN
Question
All companies Manufacturers Traders Manufacturers Traders
All Manufacturers
All Traders
All GERMAN
All AUSTRALIAN
N/a 2.72.72.8
2.6
4.5
3.1
3.9
3.0
2.7
4.6
1.8
2.8
1.31.2
2.1
1.9
2.8
1.6
1.4
2.2
N/a N/a 2.8
3.12.9
2.6
4.5
1.9
2.8
1.41.2
2.1
Importance of individual for-eign languages* mean out of 5 (English, Chinese, Spanish, French, respective trading partners' l., other international langu.)
Eng Sp Fr Res Oth Eng Sp Fr Res Oth Chin Sp Fr Res Oth Chin Sp Fr Res Oth Eng Sp Fr Res Oth Chin Sp Fr Res Oth
Critical import-ance of foreign languages skills (% of firms saying YES)
51.8 51.9 42.9 50.8 66.7 51.3 53.1 48.8 54.8
22
40
30
44 12
4040
6
29
46
25
23
37
29
3
8
3843
14
5
18
3934
45
33
45
20
2
18
43
35
4
27
39
25
46
Knowledge of foreign business partners' ment-ality mean out of 5 (1=insufficient know-ledge,..., 5=very good knowledge) 1 2 3 4 5 1 2 3 4 5 3 4 5 1 2 3 4 5 2 3 4 5 1 2 3 4 5 2 3 4 5 1 2 3 4 5 1 2 3 4 5
Critical import-ance of know-ledge of foreign busin. mentality (% of firms saying YES)
71.0 66.7 53.6 75.8 90.5 71.7 69.4 62.0 79.5
Note: * 1=non important,..., 5=very important. N/a = non applicable, as questions for German and Australian companies were different.
Source: Author's compilation from questionnaire responses.
202
3 M
AN
AG
ING
INTERN
ATIO
NAL FO
OD
PRO
DU
CT T
RAD
E A
T T
HE C
OM
PAN
Y LE
VEL

3 MANAGING INTERNATIONAL FOOD PRODUCT TRADE AT THE COMPANY LEVEL 203
The kind of university courses that the foreign business staff attended show a consistent
pattern through the sub-samples. Overall, 55% of the staff attended business or economics courses, 17%
agriculture or food related studies, 1% law, and 24% of the staff attended other courses. The main
difference between German and Australian companies is that for the latter the share of agriculture/food
related studies is higher (21%) at the expense of business/economics courses (47%), as compared to
German companies (14% vs. 61%). The same is basically true for food manufacturing companies, where
20% of their staff hold agriculture/food related degrees, as compared to only 12% in trading companies.
German traders employ staff with the highest degrees of business/economics degrees (64%), whereas
Australian manufacturers are the most important employers of staff with agriculture/food related degrees
(25%).
Further job training and education of staff which works directly in foreign business activities
can be provided by different institutions. Apart from universities, there are government or private
institutions, such as customs agencies, foreign consulates, language schools, or experienced private trainers
which offer courses of specialised further job training. Another possibility are specialised courses obtained in
a foreign country. However, overall, 41% of all samples companies have never used any kind of further job
training for their staff. 27% have used courses offered by private institutions, 22% courses offered by
government agencies, 7% programs from universities, and 3% have used offerings in foreign countries. In
Australia, government programs are mostly favoured (25%), ahead of private courses (20%), and
universities (10%). German companies prefer job training from private institutions (35%), followed by
those from government agencies (18%), and universities (3%). Manufacturers seem to use slightly more
further job training programs than trading companies (only 40% have never used any offering versus 43%
of the traders). Moreover, manufacturers use job training from governments (24%) more often than trading
companies (15%). The most reluctant sub-sample to use any kind of further training are German traders
(58% have never used any program), followed by Australian manufacturers (46%).
The number and the degree of command of foreign languages spoken differs significantly
between the German and the Australian sub-samples. On average, employees dealing with foreign
customers/suppliers in German companies speak 1.9 foreign languages, as compared to 0.8 for the
employees in Australian companies (the difference is statistically significant at the 99% confidence level).
48% of the staff of Australian companies speak no foreign language at all, whereas 50% of the employees in
German companies speak two foreign languages. On average, employees dealing with foreign
customers/suppliers in trading companies speak 1.5 foreign languages (2.0 in German companies vs. 0.8 in
Australian ones), as compared to 1.3 to those employed in manufacturing companies (1.9 vs. 0.9). The
difference is, however, not statistically significant. German employees do not only speak more foreign
languages, they also seem to have higher degrees of command of the foreign languages they speak, as
compared to the Australian staff. On average the skill level of employees of German companies are rated
3.9 on a 5-point rating scale versus 2.6 for Australian staff (the difference is statistically significant at the
99% confidence level). Employees dealing with foreign customers/suppliers in trading companies have a
command level of 3.5 versus 3.3 of those working in manufacturing companies. However, this difference is,
as for the number of foreign languages spoken, not statistically significant. In all, it becomes clear that
German companies are better qualified with respect to foreign languages than Australian ones.

204 3 MANAGING INTERNATIONAL FOOD PRODUCT TRADE AT THE COMPANY LEVEL
The importance of individual foreign languages can be expected to be different for German
and Australian companies. For German companies, English is by far the most important foreign language (a
rating of 4.5 on a 5-point scale), followed by the respective language of the foreign trading partner country
(3.1), French (2.9), other international languages (2.8), and Spanish (2.6). For Australian companies, the
respective languages of the trading partner countries are most important (2.8), followed by Chinese (2.1),
other international languages (1.9), French (1.4), and Spanish (1.2). There are no major differences
between manufacturing and trading companies in the two countries.
The critical importance of foreign languages skills is assessed differently by German and
Australian businesses. The majority of Australian companies (55%) think that better foreign language skills
of their employees dealing with foreign customers/supplies would significantly improve their foreign business
success. On the other hand, only 49% of German companies confirm this view. (The difference between
Australian and German companies is, however, not statistically significant, using the exact chi-square test in
a 2x2 cross-tabulation) Between manufacturers (51%) and traders (53%) there seems to be no major
difference, but there is a great dissimilarity between Australian traders (67% of agreement) and German
ones (43%). These findings suggest that the more foreign languages are mastered and the better their
command levels, the less important these skills are seen by their users.
The knowledge of foreign business partner's mentality is overall assessed as being good.
Measured as a rating on a 5-point scale, 40% of the respondents think that their employees who deal with
foreign customers/suppliers have good knowledge, 30% judge it as average, 22% give the highest ranking
of 5 (very good knowledge), 4% of the respondents see it as sufficiently, and only the remaining 4% think
that this knowledge is insufficiently. There is no statistically significant difference between the German
(mean rating: 3.7) and the Australian (3.8) sub-sample, however, there is one between manufacturers (3.6)
and trading companies (4.1) (99% confidence level). For the different business classes between the two
countries, the results are relatively homogenous.
The critical importance of the knowledge of foreign business partners' mentality is
acknowledged by the majority of all companies (71%). There is, however, a statistically significant
difference between the German (62%) and the Australian (80%) sub-sample (95% confidence level, using
the exact chi-square test in a 2x2 cross-tabulation). The difference between manufacturers (72%) and
traders (69%) is not statistically significant. Australian traders rate this knowledge as particularly important
(91%), whereas only 54% of German traders agree. The large difference between the Australian and the
German opinions may be caused by the fact that Australians do most of their foreign business in Asian
markets where the mentality difference as compared to the "western" way of thinking and acting may be
quite distinctive. For German businesses, which operate mostly in relatively similar European neighbouring
country cultures, this aspect is then understandably less a problem.
In summary, the survey results suggest that German companies have relatively fewer staff
dealing with foreign business activities. In both countries about 40% of the employees hold a university
degree, which is most likely a business/economics one. Furthermore, about 40% of the companies have
never used any sort of further specialised job training for their employees, but if the do, German companies
generally tend to choose private institutions, whereas Australian companies rely more on government

3 MANAGING INTERNATIONAL FOOD PRODUCT TRADE AT THE COMPANY LEVEL 205
programs. Employees who deal with foreign customers/suppliers in Germany know significantly more
foreign languages and master these significantly better than employees in Australian companies. On the
other hand, Australian companies rank the importance of foreign language skills higher than German ones,
despite the fact that English may be the most important business language in the world. The importance of
the knowledge of foreign business partners' mentality is assessed by Australian companies as significantly
higher than by German companies, although there does not seem to be a great difference in the knowledge
level between the two countries. This may be caused by the fact that Australian companies do most of their
foreign business in Asian countries, i.e. in a, in general, culturally different environment. Overall it becomes
clear that there are structural differences between the Australian and the German sub-sample, in particular
with respect to the number of staff employed for foreign business activities and the foreign language skills.
Between the two business classes, there are no major structural differences, apart from the fact that traders
seem to rank the knowledge their employees have about the mentality of their foreign business partners
significantly higher than manufacturers do. However, this finding may be due to the fact that sample
trading companies are more involved in foreign business than manufacturers and therefore they have more
contact with foreign customers or suppliers.
3.2.3.4 Trade fair activities
The percentage of companies which participate in trade fairs at all (as visitors or exhibitors) is on
average about 78% for all companies together, with 89% being the average for German companies and
67% for Australian companies. The figures for manufacturers are 78% and for traders 76%. The sub-
sample with the lowest percentage of companies taking part in trade fairs is the Australian trader one
(68%), the one with the highest value are German manufacturers (91%). However, these figures do not
take into consideration how often companies take part in trade fairs during a year.
The trade fair participation level of companies can be measured more accurately by calculating
the (unweighted) mean of their annual number of participations as visitor or exhibitors in home country or
foreign country trade fairs. Table 54 lists index values based on this measuring concept for German and
Australian manufacturing and trading companies. It becomes clear that German companies statistically
significantly have higher participation rates (99% confidence level) than Australian companies, which is in
particular true for food product manufacturers. In Germany there is also a statistically significant difference
in trade fair participation between manufacturing and trading companies, with the former being the sub-
sample with the highest participation rate at all. The main difference between German and Australian
companies is that the former exhibit strongly in the home country, whereas the latter hardly exhibit in
Australia. This finding may be due to the existence of the ANUGA trade fair held in Germany, one of the
largest food trade fairs in the world, and the lack of a major internationally important Australian food trade
fair. The general difference between manufacturers and traders is that the former mostly take part in trade
fairs as exhibitors, whereas traders are mostly trade fair visitors. However, Australian traders also exhibit
strongly at foreign fairs, despite the fact that they are the sub-sample with lowest participation rate of all.

206 3 MANAGING INTERNATIONAL FOOD PRODUCT TRADE AT THE COMPANY LEVEL
Table 54: Mean index values* indicating the degree of trade fair participation of German and Australian food product manufacturers and traders
Manufacturers� Traders Total�
German� 1.15 .86 1.05
Australian .73 .64 .71
Total .92 .77 .87
Notes: * Index value calculated as the mean of the variables: visitor in home country trade fairs, exhibitor in home country trade fairs, visitor in foreign country trade fairs, exhibitor in foreign country trade fairs, where each variable can take integer values between [0, 3], with 0 = no participation, 1 = less than 3 times a year, 2 = 3 to 6 times a year, and 3 = more than 6 times a year. The index measure can take values between 0 (no trade fair participation at all) and 3 (very intensive trade fair participation). � Differences between countries statistically significant (99% confidence level), using the exact Mann-Whitney U test for 2-independent-samples. � Differences between business classes statistically significant (99% confidence level), using the exact Mann- Whitney U test for 2-independent samples.
Source: Author's compilation from questionnaire responses.
The main purposes of trade fairs for visitors are the making, keeping or improving of contacts
(with an overall mean rating of 4.2 on a 5-point scale), market analysis/observation of competitors (3.8),
obtaining general information (3.8), acquisition of deals (3.1), and other purposes (2.3). There are no
major differences between the German and the Australian sub-sample, nor between the manufacturer and
trader one. The biggest difference can be found between German and Australian traders, with the former
rating the 'obtaining of general information' aspect considerably higher than the later (4.2 versus 3.5).
The main purposes of trade fairs for exhibitors are similar to the ones for visitors. However,
for exhibitors, the making, keeping or improving of contacts aspect is even more important (with an overall
mean rating of 4.6 on a 5-point scale), as it is the acquisition of deals purpose (3.9). Also very important is
the presentation of the company or its products (4.4). The importance of market analysis/observation of
competitors (3.7), and other purposes (2.3) are almost equally important as for visitors. As seen before,
there are no major differences between the German and the Australian sub-sample, nor between the
manufacturer and trader one.
Trade fair expenses and staff use of the sample firms could be analysed quite exactly from the
obtained data (see Table 55). The average annual trade fair expenses vary widely between the sub-
samples, as they depend on the company size and the number of a company's trade fair participations per
year. The overall mean value is about DM81 000, varying between DM30 000 for Australian firms and
DM121 000 for German firms, and between DM98 000 for manufacturers and DM42 000 for traders. More
interesting is the percentage of trade fair expenses in total turnover of a company. Here the figures display
no statistically significant variation between the sub-samples. The overall value is about 0.7%, which is the
same for German and Australian firms. Manufacturers spend on average 0.8% (0.9% in Germany vs. 0.7%
in Australia) of total turnover for trade fair activities as compared to 0.4% (0.3% vs. 0.6%) for traders. The
annual number of staff deployed on trade fairs is on average 10 for all sample firms, with the same strong
variation between the sub-samples as for the total annual trade fair expenses. However, relating this figure
to the total staff employed yields more meaningful information. Overall, the annual number of staff
deployed on trade fairs as a percentage of total staff employed equals about 49%, with the figures for the
individual sub-samples: 54% (German firms), 43% (Australian firms), 34% (manufacturers), 87% (traders).

Table 55: Survey results — trade fair activities of sample companies
GERMAN AUSTRALIAN
Question
All companies Manufacturers Traders Manufacturers Traders
All Manufacturers
All Traders
All GERMAN
All AUSTRALIAN
.8
.9.9
.9
1.2
1.0
1.3
1.1
.2
1.01.0
1.2
.7.8
.6
.8
.8.7
.4
.7
1.0
.9
.9
.9
.5
.9
.7
1.0
.9
1.0
1.2
1.1
.8.8
.6
.8
Trade fair participation index values (as visitors or exhibi-tors in home and foreign countries) Vis
HomExh
Hom Vis For
Exh For
VisHom
Exh Hom
Vis For
Exh For
VisHom
Exh Hom
Vis For
Exh For
VisHom
Exh Hom
Vis For
Exh For
VisHom
Exh Hom
Vis For
Exh For
VisHom
Exh Hom
Vis For
Exh For
VisHom
Exh Hom
Vis For
Exh For
VisHom
Exh Hom
Vis For
Exh For
VisHom
Exh Hom
Vis For
Exh For
2.3
3.1
4.2
3.83.8
2.6
3.4
3.93.9
3.6
2.0
3.4
4.6
3.94.2
2.3
2.7
4.1
3.73.8
2.3
3.2
4.6
3.9
3.5
2.4
3.1
4.03.8
3.7
2.1
3.3
4.6
3.93.9
2.4
3.4
4.23.9
3.8
2.3
2.8
4.2
3.83.7
Main purposes of trade fairs as a visitor mean out of 5 (*)
Infos
Market
Contacts
Deals
Oth Infos
Market
Contacts
Deals
Oth Infos
Market
Contacts
Deals
Oth Infos
Market
Contacts
Deals
Oth Infos
Market
Contacts
Deals
Oth Infos
Market
Contacts
Deals
Oth Infos
Market
Contacts
Deals
Oth Infos
Market
Contacts
Deals
Oth Infos
Market
Contacts
Deals
Oth
2.3
3.9
4.6
3.7
4.4
2.4
4.24.5
3.7
4.3
2.2
3.8
4.8
3.7
4.7
2.3
3.6
4.6
3.6
4.2
2.3
3.8
4.4
3.7
4.3
2.3
3.9
4.6
3.7
4.3
2.3
3.8
4.7
3.7
4.5
2.3
4.1
4.6
3.7
4.4
2.3
3.7
4.5
3.6
4.2
Main purposes of trade fairs as an exhibitor mean out of 5 (**)
Presen
Market
Contacts
Deals
Oth Presen
Market
Contacts
Deals
Oth Presen
Market
Contacts
Deals
Oth Presen
Market
Contacts
Deals
Oth Presen
Market
Contacts
Deals
Oth Presen
Market
Contacts
Deals
Oth Presen
Market
Contacts
Deals
Oth Presen
Market
Contacts
Deals
Oth Presen
Market
Contacts
Deals
Oth
% of sample firms engaging in fairs 77.7% 90.6% 86.2% 68.3% 61.9% 78.4% 76.0% 89.0% 66.7%
Average annual expenses DM81 300 DM158 200 DM49 000 DM30 100 DM28 400 DM97 700 DM42 000 DM120 800 DM29 700
% of expenses in total turnover 0.68% 0.88% 0.27% 0.72% 0.60% 0.80% 0.38% 0.66% 0.69%
Average annual # of staff deployed 10.0 19.1 6.5 4.2 2.5 12.0 5.0 14.9 3.8
% of trade fair staff in total staff 49.1% 43.9% 73.7% 23.4% 110.6% 34.3% 86.4% 53.7% 43.1%
Expenses per staff deployed DM11 500 DM13 350 DM10 100 DM9 900 DM13 300 DM11 700 DM11 300 DM12 300 DM10 700
% of companies receiving financial
support 18.1% 26.4% 0% 22.2% 9.5% 24.1% 4.0% 17.1% 19.0%
Trade fair ex-penses and staff use of firms (mean values; DM1 = A$0.83)
Average amount of financial support DM2 950 DM4 960 DM0 DM2 300 DM3 200 DM3 700 DM1 100 DM3 300 DM2 500
% of companies preferring an individual trade fair stand (mean)
67.9 83.3 80.0 45.5 64.3 65.2 74.4 82.2 50.0
Critical import-ance of trade fair efforts (% of firms saying YES)
48.4 44.2 38.5 56.7 47.6 50.9 42.6 42.3 54.3
Notes: * (obtaining general information; market analysis/observation of competitors; making, keeping or improving contracts; acquisition of deals; others) ** (presentation of firm or products; market analysis/observation of competitors; making, keeping or improving contracts; acquisition of deals; others)
Source: Author's compilation from questionnaire responses.
3 M
AN
AG
ING
INTERN
ATIO
NAL FO
OD
PRO
DU
CT T
RAD
E A
T T
HE C
OM
PAN
Y LE
VEL
207

208 3 MANAGING INTERNATIONAL FOOD PRODUCT TRADE AT THE COMPANY LEVEL
The difference is statistically significantly different (99% confidence level) between the two business classes,
but not between the two countries. Another measure is the average trade fair expenses per staff deployed,
which can be simply calculated as ratio between the two variables just discussed. This ratio yields
interesting and reliable figures which are quite stable between the sub-samples (i.e. with no statistically
significant differences between them). Overall, companies spent about DM11 500 (= A$9 500) per
employee at trade fairs in 1998/99, DM12 300 by German companies, DM10 700 by Australian companies,
DM11 700 by manufacturers, and DM11 300 by traders. Australian traders and German manufacturers
spent about DM13 000, whereas Australian manufacturers and German traders spent about DM 10 000.
Financial government grants for trade fairs receive about 18% of all companies (17% in Germany, 19% in
Australia; 24% of manufacturers and 4% of traders). German sample trading companies receive no
financial support at all. The overall average amount of financial support is about DM3 000 (= A$2 500), with
DM3 300 for German companies and DM2 500 for Australian companies (the difference is not statistically
significant). However, manufacturers receive significantly (99% confidence level) more than traders do
(DM3 700 versus DM1 100). In summing up, it becomes clear that there is no structural difference
concerning trade fair investments between German and Australian companies. However, there is one
between manufacturers and traders, with the former spending � in relative terms � significantly more,
employing significantly less staff, and receiving significantly more financial grants from governments.
The percentage of companies preferring an individual trade fair stand differs statistically
significantly between the two countries (99% confidence level, using the exact chi-square test in a 2x2
cross-tabulation), but not between the two business classes (82% of German companies versus 50% of
Australian ones, and 65% of manufacturers vs. 75% of traders). However, no statistically significant
relationship has been found (using cross-tabulation and chi-square testing) between the company size or the
degree of trade fair involvement, and the preference for an individual stand � as opposed to a shared,
community stand. Thus, there are perhaps cultural factors which explain the differences in the preferences
between the German and Australian companies.
The critical importance of trade fair efforts is not rated in a statistically significantly different
way between the sub-samples. 54% of Australian companies think that additional trade fair efforts (i.e.
higher levels of participation or bigger presentations at trade fairs) would significantly improve their foreign
business success, as opposed to 42% of German companies. For manufacturers and traders the
corresponding figures are 51% and 43% respectively. German traders rate the importance of trade fairs
lowest (39%), whereas Australian manufacturers seem to be most convinced of their importance (57%).
Overall, not even half of the sample companies (48%) acknowledge the importance of trade fairs.
In summary, it becomes clear that the only significant difference between German and Australian
companies are the higher participation rates at trade fairs. Moreover, German companies exhibit strongly in
the home country, whereas Australian ones hardly exhibit in Australia. The most important purpose of trade
fairs in both countries is the 'making, keeping or improving of contacts'. There is no major difference
concerning trade fair expenses and staff use, however significantly fewer Australian companies prefer
individual stands than German companies. The general difference between manufacturers and traders is
that the former mostly take part in trade fairs as exhibitors, whereas traders are mostly visitors.
Manufacturers spend more, employ less staff, and receive more financial grants from governments.

3 MANAGING INTERNATIONAL FOOD PRODUCT TRADE AT THE COMPANY LEVEL 209
3.2.3.5 Food product-related questions (logistics and marketing problems)
This sub-section investigates problems which are related to the nature of food products. In particular,
selected aspects of logistics are investigated, such as transport and storage. Moreover, marketing problems
specific to the export of food products, and trade-related administration problems are addressed. Many of
these issues have not yet been researched intensively for food product companies, which implies that
information about these problem areas is hard to find in the relevant literature.
The main product/commodity groups the sample companies work in are: fruit and vegetables
(17%), drinks (beer, wine, and soft) (15%), seafood and products (13%), mixed (13%), meat and products
(11%), confectionery (9%), milk and dairy products (9%), ready-to-eat meals (7%), and cereals/bakery
products (7%). The German sample companies are more concentrated in the product groups: fruit and
vegetables (16%), mixed (15%) and confectionery (12%), whereas Australian companies are mostly in fish
and seafood (23%), drinks (18%), and fruit and vegetables (16%). The sample trading companies operate
mostly in the product categories fruit and vegetables (40%), mixed (32%), and meat and products (10%),
whereas manufacturers are mostly in drinks (20%), seafood and products (18%), and meat and products
(11%). There are no major differences between the German and Australian trader sub-samples, however
Australian manufacturers are mostly in seafood and products (29%) and drinks (23%), whereas German
manufacturers produce mostly confectionery (19%) and drinks (17%). Overall, it may be claimed that the
survey samples reflect well the diverse structure of the German and Australian food manufacturing/
processing sector.
The degree of processing and packaging applied to the products provides information on the
degree of industrialisation of the sample companies. For traders, it reflects the degree of logistical
complexity, since fresh produce or deep frozen products in general require specialised transport and storage
facilities. Overall, 48% of the products the sample companies deal with are fresh or slightly processed and
packed. 30% are deep frozen, 23% are bottled/tinned, 18% are unpacked bulk products, 14% are smoked
or dried, and 21% of the products have undergone other forms of processing and packaging, such as those
required for the production of drinks.110 Australian sample company responses indicate a higher use of deep
frozen and bulk products, and of other forms of processing/packaging as compared to German companies.
Traders handle more deep frozen, bottled/tinned, and bulk products than manufacturers. Australian traders
are mostly in bulk products whereas German ones deal mostly with deep frozen ones. German
manufacturers are mainly in the 'fresh or slightly processed and packed' category, whereas Australian ones
also use strongly deep freezing and other forms of processing/packaging.
The degree of logistics problems that the sample companies face is on average ranked as
'middle difficult' (3.0 on a 5-point scale). There is no statistically significant difference between the
individual sub-samples which display all values of around 3.0. Only German traders with a mean value of
2.7 rank the degree of logistics problems a little bit lower than the other sub-samples.
110 In this question, multiple responses were possible.

Table 56: Survey results — food product related questions (logistics and marketing problems)
GERMAN AUSTRALIAN
Question
All companies Manufacturers Traders Manufacturers Traders
All Manufacturers
All Traders
All GERMAN
All AUSTRALIAN
Cereals / bakery products
Fruit /vegetables
Milk, eggs & prod.
Meat & products
Seafood & products
Ready-to-eat meals
Confectionery*
Drinks
Pro
duct
gro
ups
mea
n %
Mixed 1315
97
1311
917
7
41719
134
1015
413
34
3
3
7
3
45
3
523
65
2913
510
5
29
5
5
5
14
10
33
420
129
1811
1079
32
410
640
151112
104
911
1910
1118
64
2313
616
4
*and savouries
No bars for confectionery and drinks
No bars for cereals and ready-to-eat meals
Bulk products /unpacked
Fresh / slight. proc. /packed
Dried / smoked
Bottled / tinned
Deep frozen
Pro-cessing / pack-aging degree mean % (multiple respon.) Others
(Drinks) 21
30
23
14
48
18
17
17
21
21
53
15
14
48
41
17
34
14
29
37
18
10
40
18
15
20
20
5
75
35
23
28
19
15
46
17
14
37
33
12
51
22
16
28
28
20
46
15
26
33
18
9
49
22
Degree of logistics problems (mean out of (1=never difficult,..., 5=very difficult)
3.0 3.0 2.7 3.0 3.1 3.0 2.9 2.9 3.0
N/a 36
100
62
10
83
35
85
43
90
N/a N/a 45
5
94
37
87
Means of transport % of total (truck, train, ship, plane; multiple resp-onses possible)
Truck Train Ship Plane Truck Train Ship Plane Ship Plane Ship Plane Truck Train Ship Plane Ship Plane
Importance of appropriate trans-port logistics (mean out of 1=non important,..., 5=very important)
3.6 3.2 3.6 3.8 4.3 3.5 3.9 3.4 3.9
_________________ c o n t i n u e d _______________________
210
3 M
AN
AG
ING
INTERN
ATIO
NAL FO
OD
PRO
DU
CT T
RAD
E A
T T
HE C
OM
PAN
Y LE
VEL

GERMAN AUSTRALIAN
Question
All companies Manufacturers Traders Manufacturers Traders
All Manufacturers
All Traders
All GERMAN
All AUSTRALIAN
% of product losses in foreign business trans-actions mean (min/max)
3.2 (0.0/20.0)
2.2 (0.0/10.0)
2.8 (0.0/10.0)
3.1 (0.0/20.0)
6.6 (0.0/20.0)
2.7 (0.0/20.0)
4.5 (0.0/20.0)
2.4 (0.0/10.0)
4.1 (0.0/20.0)
27
19
34
20
35
20
41
4
1818
45
18
2022
3127
41
612
41
27
21
36
16
28
13
3128
30
20
42
8
25
18
2631
Annual stock turnover in previous year % of total (<6, 6-12, 13-24, >24 times) <6 6-12 13-24 >24 <6 6-12 13-24 >24 <6 6-12 13-24 >24 <6 6-12 13-24 >24 <6 6-12 13-24 >24 <6 6-12 13-24 >24 <6 6-12 13-24 >24 <6 6-12 13-24 >24 <6 6-12 13-24 >24
20
28
34
18
14
32
40
14
1212
42
35
2527
32
17
29
43
1414
20
29
35
15
19
2630
26
13
25
41
21
26
3127
16
Seasonal influ-ence in main product cate-gory % of total (100%, 100%-150%, 151-200%, >200%) 100 -150 -200 >200 100 -150 -200 >200 100 -150 -200 >200 100 -150 -200 >200 100 -150 -200 >200 100 -150 -200 >200 100 -150 -200 >200 100 -150 -200 >200 100 -150 -200 >200
Influence of im-age of origin on market success (mean out of 1=in no ,..., 5=in any case)
3.5 3.4 3.6 3.7 3.2 3.6 3.4 3.5 3.6
Use of product origin in marketing (mean out of 1= never,..., 5=always)
4.0 3.4 4.0 4.4 4.6 3.9 4.3 3.6 4.4
1.4
3.43.3
2.6
1.4
3.43.4
2.9
1.3
3.3
2.9
2.5
1.5
3.43.3
2.4
1.2
3.53.3
2.2
1.5
3.43.3
2.6
1.3
3.43.1
2.4
1.4
3.43.2
2.7
1.4
3.43.3
2.4
Adaptation of products to local preferences mean out of 5 (recipe, packaging, price, others)
Recip Pack Price Other Recip Pack Price Other Recip Pack Price Other Recip Pack Price Other Recip Pack Price Other Recip Pack Price Other Recip Pack Price Other Recip Pack Price Other Recip Pack Price Other
1.4
2.22.0
2.5
3.1
1.4
2.22.42.4
3.2
1.6
2.2
2.52.7
2.9
1.3
2.2
1.6
2.3
3.2
1.2
2.2
1.6
2.7
3.1
1.4
2.21.9
2.4
3.2
1.4
2.22.1
2.73.0
1.5
2.22.42.5
3.1
1.3
2.2
1.6
2.4
3.2
Problems due to administrative regulations mean out of 5 (tariff formalities, quota regulations, statistical reports, tax matters, others)
Tariffs
Quotas
Statistics
Taxes
Oth Tariffs
Quotas
Statistics
Taxes
Oth Tariffs
Quotas
Statistics
Taxes
Oth Tariffs
Quotas
Statistics
Taxes
Oth Tariffs
Quotas
Statistics
Taxes
Oth Tariffs
Quotas
Statistics
Taxes
Oth Tariffs
Quotas
Statistics
Taxes
Oth Tariffs
Quotas
Statistics
Taxes
Oth Tariffs
Quotas
Statistics
Taxes
Oth
Problems due to differ. national food legislations (mean out of 1=none ,..., 5=v. strong)
3.1 3.1 2.6 3.3 3.0 3.2 2.7 2.9 3.3
Source: Author's compilation from questionnaire responses.
3 M
AN
AG
ING
INTERN
ATIO
NAL FO
OD
PRO
DU
CT T
RAD
E A
T T
HE C
OM
PAN
Y LE
VEL
211

212 3 MANAGING INTERNATIONAL FOOD PRODUCT TRADE AT THE COMPANY LEVEL
The means of transport used by the sample companies differ, naturally, between the two
countries. For German companies the use of trucks is most important (94% of the respondents use them
regularly), followed by ships (45%), trains (5%), and planes (2%). Australian companies can send their
merchandises to foreign countries only by ship (87%) or aircraft (37%).111 Between Australian
manufacturers and traders, there are no major differences, however German traders use ships and trains
more intensively than German manufacturers, which rely mostly on trucks.
The perceived importance of the availability of appropriate transport logistics in the
foreign business partner countries � which e.g. assures the necessary temperature, moisture levels, or air
composition � is on total average ranked as 'important' (3.6 on a 5-point scale). There is a statistically
significant difference between the Australian (3.9) and the German sub-sample (3.4), perhaps indicating
that Asian markets, in which Australian companies do most of their foreign business, are not yet as
advanced in this respect as European countries, in which most of the German companies operate. Between
manufacturers (3.5) and traders (3.9) there is no statistically significant difference, nor between the other
sub-samples. Australian traders rank the importance of the availability of appropriate transport logistics
highest (4.3), and German manufacturers lowest (3.2).
The extent of product losses which occur in the foreign business transactions is on average
about 3.2% of the merchandise handled. Although this value differs considerably between the German
(2.4%) and the Australian (4.1%) sub-samples, the difference is not statistically significant, using the exact
Mann-Whitney U test for two independent samples. However, the difference between the manufacturer
(2.7%) and the trader (4.5%) sub-sample is statistically significant (99% confidence level). Thus, it
appears that manufacturers manage the logistics complexity involved in international business transactions
better than traders do. However, this is only true for the Australian sub-sample, where traders lose on
average 6.6% and manufacturers 3.1% of their products during international business transactions. In
Germany the difference is much smaller: 2.2% for manufacturers and 2.8% for traders, and it is not
statistically significant. On the other hand, it is clear that product losses depend on the perishability of a
specific product. Table 57 lists the average percentage losses for different product categories. The
differences between the individual product groups are overall statistically significant (99% confidence level,
using the Monte-Carlo Krustal-Wallis test for k independent samples). The companies which handle mixed,
i.e. several different product categories at the same time have the highest loss levels (5.4%), ahead of
companies dealing with fruit and vegetables (4.8%), drinks (3.9%), and fish and seafood (3.5%). The
lowest loss rates have companies dealing with confectionery and savouries (0.6%), and milk and dairy
products (1.0%).
111 In this question, multiple responses were possible.

3 MANAGING INTERNATIONAL FOOD PRODUCT TRADE AT THE COMPANY LEVEL 213
Table 57: Product losses (in %) occurring in international business transactions for different product categories
Product category Mean (%)� Std. dev. n
Mixed� 5.4 5.4 18
Fruits & vegetables 4.8 5.2 27
Softdrinks, beer & wine 3.9 4.0 22
Fish & seafood 3.5 5.6 20
Meat & meat products 2.9 3.4 16
Cereals, bakery goods 2.3 1.8 11
Ready-to-eat meals 1.8 2.4 10
Milk & dairy products 1.0 1.4 14
Confectionery & savouries 0.6 0.6 14
Total 3.2 4.3 152
Notes: � Companies dealing with several of the listed product categories at the same time. � Differences between product categories statistically significant (99% confidence level), using the Monte-Carlo Kruskal-Wallis test for k-independent samples.
Source: Author's compilation from questionnaire responses.
The annual stock turnover during the year prior to the survey does not show statistically
significant differences between the sub-samples. Overall, about a third of all sample companies have
average stock turnover rates between 6 and 12 times a year. 27% of them clear their warehouses more
than 24 times a year, 20% less than 6 times, and 19% between 13 and 24 times. Although here differences
among the product categories could have been expected, too, no statistically significant inequalities were
found. This may be because the stock turnover depends on perishability of the product which itself is
determined by the kind of processing and packaging applied to the product. On the other hand, stock
turnover rates are also determined by the intensity of the business activity itself which was not measured in
the survey.
The seasonal influence in the main product category in which the surveyed companies operate
(as measured by the ratio of the highest to the lowest monthly turnover) is, overall, medium strong. 34%
of all companies have a ratio between 1 and 1.5, 28% between 1.5 and 2, 20% greater than 2, and 18%
say they have no seasonal influence in their monthly sales at all. Australian companies underlie a
statistically significantly larger seasonal influence (99% confidence level, using the exact Mann-Whitney U
test for two independent samples) than German ones. However, there are no significant differences
between traders and manufacturers. The product categories with the strongest seasonal influences are fish
and seafood and confectionery and savouries for the German companies, and fruit and vegetables and fish
and seafood for the Australian ones. The product categories with the lowest seasonal influence are meat
and meat products for German companies, and ready-to-eat meals for Australian ones. Statistically
significant differences (99% confidence level) can be found for drinks (which have a stronger seasonal
influence in Germany than in Australia), and fruit and vegetables (for which in Australia the seasonal
influence is greater than in Germany) (see Table 58). In summary, it becomes clear that the extent of the
seasonal influence differs considerably between product categories and the two countries.

214 3 MANAGING INTERNATIONAL FOOD PRODUCT TRADE AT THE COMPANY LEVEL
Table 58: Seasonal influence (index values)* in the main product category of German and Australian sample companies
Product category German Australian
Fish & seafood 3.00 3.17
Confectionery & savouries 3.00 3.00
Softdrinks, beer & wine� 2.89 2.00
Milk & dairy products 2.43 2.80
Ready-to-eat meals 2.25 1.50
Cereals, bakery goods 2.00 2.00
Fruits & vegetables� 2.00 3.33
Mixed 2.00 2.33
Meat & meat products 1.71 2.36
Total� 2.30 2.66
Notes: * Ratings on a 4-grade rating scale with 1 (no seasonal influence) and 4 (strong seasonal influence). � Differences between countries statistically significant (99% confidence level), using the exact Mann-Whitney U test for 2-independent samples.
Source: Author's compilation from questionnaire responses.
The importance of the influence of the positive image of the origin of a food product (e.g. a
famous holiday area) on its market success was rated homogeneously by all sub-samples with a mean of 3.5
on a 5-grade rating scale. This means that all companies see this aspect as a rather important issue in their
foreign marketing activities. Thus, there are no statistically significant differences between the sub-samples.
The use of the origin of a food product in foreign marketing shows more differences between
the individual sub-samples. Australian companies highlight the origin of a food product statistically
significantly (99% confidence level) more often than German companies (4.4 on a 5-grade rating scale
versus 3.6). However, there is no statistically significant difference between manufacturers (3.9) and
traders (4.3). Australian traders (4.6) are most keen on highlighting the origin of their food products,
whereas German manufacturers are the most reluctant (3.4). Thus, although almost all companies are
equally convinced of the positive influence of the declaration of the origin of a food product in foreign
marketing, German companies are actually less consistent than their Australian counterparts in putting this
concept into practice.
The adaptation of products to local preferences happens overall mostly by adapting the price
to the foreign market, followed by adaptations in packaging, and in the recipe. This pattern is homogenous
across the individual sub-samples. However, German companies � and above all German manufacturers �
adapt their recipes statistically significantly more often (95% confidence level) to the foreign market than
their Australian counterparts do. Between manufacturers and traders there are no significant differences.
Overall, it becomes clear that price policy is the most intensively used instrument to tailor offers to foreign
markets.
Differences in the national food laws cause problems for the foreign business activities of the
surveyed companies. The overall mean rating is 3.1 on a 5-grade rating scale. There is no statistically
significant difference between German (2.9) and Australian companies (3.3). However, the difference

3 MANAGING INTERNATIONAL FOOD PRODUCT TRADE AT THE COMPANY LEVEL 215
between manufacturers (3.2) and traders (2.7) is statistically significant at the 95% confidence level, which
could have been expected beforehand, since producers are the ones who have to follow foreign standards
when manufacturing their products.
Other administrative regulations, such as tariffs, quotas, statistical reporting or tax matters
pose also problems in the foreign market activities of the sample companies. Overall, tariff formalities are
seen by the surveyed companies as most troublesome (3.1 on a 5-grade rating scale), followed by quota
regulations (2.5), tax matters (2.2), statistical reporting (2.0), and other formalities (1.4). The main
difference between German and Australian companies is that statistical reporting is significantly (99%
confidence level) more a problem for German companies than for the Australian ones (2.4 versus 1.6).
Between manufacturers and traders there are no major differences. To sum up, tariffs formalities are the
heaviest burden among the administrative regulations in international food product trade for German as well
as for Australian companies, but statistical reporting seems to be much more a hassle in Germany than in
Australia.
In summary, the survey companies operate in several product groups and processing/packaging
categories which highlights the fact that the given sample represents well the diversities of the two
countries' food manufacturing sector. The degree of logistical problems is ranked by all companies as
relatively important, however it seems that Australian companies depend more on appropriate transport
logistics in their foreign partner countries than German companies, probably because they mostly operate in
the quite different Asian markets. This fact may also be a reason as to why Australian companies have a
higher percentage of product losses in their foreign business activities. Moreover, Australian companies face
a stronger seasonal influence in their foreign sales. Australian companies highlight the origin of their food
products stronger than German companies do, but the latter on the other hand adapt their recipes more to
their foreign markets. For German companies statistical reporting is more troublesome than for their
Australian counterparts. The main differences between manufacturers and traders is that the former have
fewer product losses in their foreign business transactions, but on the other hand manufacturers are more
affected than traders by the complexities resulting from different national food legislations. Overall, it
becomes clear that logistical problems can be seen as a significant obstacle for foreign business activities.

216 3 MANAGING INTERNATIONAL FOOD PRODUCT TRADE AT THE COMPANY LEVEL
3.2.3.6 Trade and payment terms
This sub-section investigates the relevance of internationally standardised trade and payment terms, and
the management of exchange rate risks in the surveyed companies. All these problem areas are specific to
international business activities and do not occur in companies operating solely in the national market.
The use of INCOTERMS in international business transactions is commonplace in almost all
sample companies. Overall, only 10% of the respondents say that they never use these international
commercial terms. The INCOTERM the most frequently used is FOB (66% of all respondents use it),
followed by CIF (58%), EXW (48%), and CFR (39%).112 This shows clearly that most companies use more
than one INCOTERM, the choice of which probably depending on the individual transaction. There are some
differences between German and Australian companies: the latter use mostly FOB (73%), CIF (63%), and
CFR (58%), whereas German companies use mainly EXW (72%), FOB (59%), and CIF (43%). This may
indicate that German companies have a stronger bargaining position than Australian companies, as German
companies can make their customers to take on transport costs and risks (in using the FOB term). On the
other hand, it seems that German companies � and in particular German traders � use the whole range of
the INCOTERMS, whereas Australian companies concentrate almost exclusively on E-, F- and C-terms.
Between manufacturers and traders there are no major differences.
The use of international standardised payment terms in international business transactions
are less common. Overall, the simple invoice is still the most frequently used payment mode (74% of all
sample companies use it). The second most important payment term is the documentary letter of credit
(L/C) which use 57% of all sample companies. Then comes cash before delivery (c.b.d.) with 37% and
documents against payment or acceptance (D/P, D/A) with 31%. Cash on delivery (c.o.d.) is used by 11%
of the companies.113 There is a significant difference between German and Australian companies, with the
latter using mostly (70%) the L/C, whereas German companies use in majority (87%) the simple invoice.
This suggests that Australian companies are more cautious in the billing of their international deals. Traders
differ from manufacturers in so far as they use more D/P, D/A payment terms.
Other international contract standards, such as e.g. the COFEUROP, are used overall by about
5% of all surveyed companies, with no statistically significant difference between German companies (7.5%)
and Australian ones (2.4%). There is, however, a statistically significant difference between manufacturers
(1.8%) and traders (12.2%), using the exact chi-square test in a 2x2 cross-tabulation. This finding is only
true for the German sub-sample where manufacturers hardly use these contract standards (2%), but traders
do relatively often (17.2%). In all, it could be that in Europe more standardised contract standards exist,
making it easier for German companies to make use of them.
112 In this question, multiple responses were possible.
113 In this question, multiple responses were possible, too.

Table 59: Survey results — questions related to trade and payment terms
GERMAN AUSTRALIAN
Question
All companies Manufacturers Traders Manufacturers Traders
All Manufacturers
All Traders
All GERMAN
All AUSTRALIAN
None
EXW
FCA
FAS
FOB
CFR
CIF
CPT
CIP
DAF
DES
DEQ
DDU
INCO
TERM
S u
sed m
ean %
(m
ultip
le a
nsw
ers
poss
ible
)
DDP 78
116
5339
661013
4810
13
919
4221
579
1981
13
2121
7
1417
4534
62
1755
21
5647
7688
26
10
10
8171
6729
1019
7
10
5035
67913
519
16
12
1210
6050
641214
4012
11
16
717
1043
2659
618
7216
6353
7313
824
57
31
74
11
37
42
11
87
6
53
4548
86
1424
70
30
62
10
30
71
5762
24
33
57
22
73
8
41
5652
76
18
28
43
24
87
9
43
70
37
62
13
31
Payment terms used % of total (non documentary: c.b.d., c.o.d., invoice; documentary: D/P or D/A, L/C. Multiple responses possible)
C.b.d. C.o.d. Invoice
D/PD/A
L/C C.b.d. C.o.d. Invoice
D/PD/A
L/C C.b.d. C.o.d. Invoice
D/PD/A
L/C C.b.d. C.o.d. Invoice
D/PD/A
L/C C.b.d. C.o.d. Invoice
D/PD/A
L/C C.b.d. C.o.d. Invoice
D/PD/A
L/C C.b.d. C.o.d. Invoice
D/PD/A
L/C C.b.d. C.o.d. Invoice
D/PD/A
L/C C.b.d. C.o.d. Invoice
D/PD/A
L/C
Use of other in-ternational con-tract standards (% of firms saying YES)
4.9 2.0 17.2 1.6 5.0 1.8 12.2 7.5 2.4
Critical import-ance of further standardisation of busin. terms (% of firms saying YES)
38.4 34.6 31.0 41.9 47.6 38.6 38.0 33.3 43.4
1.4
2.7
2.0
3.7
1.2
2.02.0
4.2
2.1
2.82.5
3.6
1.1
2.8
1.8
3.4
1.8
3.2
2.0
3.5
1.1
2.5
1.9
3.8
2.0
3.0
2.2
3.6
1.8
2.42.2
4.0
1.3
2.9
1.9
3.4
Currency used in foreign busi-ness activities mean out of 5 * (home country's, of corresponding part-ner country, US$, others)
Home Correspond.
US$ Other Home Correspond.
US$ Other Home Correspond.
US$ Other Home Correspond.
US$ Other Home Correspond.
US$ Other Home Correspond.
US$ Other Home Correspond.
US$ Other Home Correspond.
US$ Other Home Correspond.
US$ Other
Have foreign exchange risks ever prevented a deal? (% of firms saying YES)
48.4 61.5 38.5 38.7 57.1 49.1 46.8 53.8 43.4
_________________ c o n t i n u e d _______________________
3 M
AN
AG
ING
INTERN
ATIO
NAL FO
OD
PRO
DU
CT T
RAD
E A
T T
HE C
OM
PAN
Y LE
VEL
217

GERMAN AUSTRALIAN
Question
All companies Manufacturers Traders Manufacturers Traders
All Manufacturers
All Traders
All GERMAN
All AUSTRALIAN
1.3
1.8
2.0
2.3
1.3
1.61.7
2.1
1.4
3.0
1.6
2.2
1.0
1.5
2.22.3
2.3
1.8
2.72.7
1.1
1.6
2.0
2.2
1.9
2.6
2.1
2.4
1.3
2.1
1.7
2.1
1.3
1.6
2.32.4
Coverage of for-eign exchange risk mean out of 5* (arrangement of fixed rates, forward con-tracts, long run keep-ing of foreign ex-change, others)
Arrangement
Forw. contr.
Long run
Others Arrangement
Forw. contr.
Long run
Others Arrangement
Forw. contr.
Long run
Others Arrangement
Forw. contr.
Long run
Others Arrangement
Forw. contr.
Long run
Others Arrangement
Forw. contr.
Long run
Others Arrangement
Forw. contr.
Long run
Others Arrangement
Forw. contr.
Long run
Others Arrangement
Forw. contr.
Long run
Others
Note: *1=never, ..., 5=always.
Source: Author's compilation from questionnaire responses.
Table 60: Survey results — provision of information in sample companies
GERMAN AUSTRALIAN
Question
All companies Manufacturers Traders Manufacturers Traders
All Manufacturers
All Traders
All GERMAN
All AUSTRALIAN
7
32
44
14
3 11
32
42
15
7
52
38
3 5
21
49
19
6
3843
14
5 8
26
46
17
3 4
4640
82
10
3940
11
4
25
48
18
6
Degree of avail-ability of relev-ant information mean % of total (1=never available ,..., 5=always available) 1 2 3 4 5 2 3 4 5 2 3 4 5 1 2 3 4 5 1 2 3 4 1 2 3 4 5 1 2 3 4 5 2 3 4 5 1 2 3 4 5
3.1
2.72.7
3.1
3.7
3.0
2.3
3.0
3.4
2.0
2.6
1.8
2.6
2.8
2.1
3.1
2.6
3.6
2.3
3.3
2.1
2.9
2.9
2.8
3.5
2.1
2.4
3.23.2
2.9
2.2
2.9
3.1
2.1
3.2
2.5
Sources for for-eign business information mean out of 5* (private agencies, govern. agencies, foreign trade cham-bers, Austrade, mark-eting boards, others)
Private agencies
Market-ing
boards
Others Private
Gov-ern-
men.
Chamb-ers
Mar-ket-ing
Oth Private
Gov-ern-
men.
Chamb-ers
Mar-ket-ing
Oth Priv-ate
Aus-trade
Mark-eting
Oth Priv-ate
Aus-trade
Mark-eting
Oth Private agencies
Market-ing
boards
Others Private agencies
Market-ing
boards
Others Private
Gov-ern-
men.
Chamb-ers
Mar-ket-ing
Oth Priv-ate
Aus-trade
Mark-eting
Oth
8
18
3025
19
17
262828
11
4
36
29
21
10
2224
27
17
1924
48
10
5
20
2528
22
1412
41
20
12
4
12
302826
12
23
30
23
13
Use of new electronic in-formation media mean % of total (1=never,..., 5=intensively) 1 2 3 4 5 1 2 3 4 1 2 3 4 5 1 2 3 4 5 2 3 4 5 1 2 3 4 5 1 2 3 4 5 1 2 3 4 5 1 2 3 4 5
Critical import-ance of a better supply of foreign market information (% of firms saying YES)
77.0 68.6 60.7 86.9 90.5 78.6 73.5 65.8 87.8
Note: *1=never, ..., 5=intensively.
Source: Author's compilation from questionnaire responses.
218
3 M
AN
AG
ING
INTERN
ATIO
NAL FO
OD
PRO
DU
CT T
RAD
E A
T T
HE C
OM
PAN
Y LE
VEL

3 MANAGING INTERNATIONAL FOOD PRODUCT TRADE AT THE COMPANY LEVEL 219
The critical importance of a further standardisation of international business terms is
acknowledged overall only 38.4% of the surveyed companies. There are no statistically significant
differences between the sub-samples. German traders see the least importance in it (31.0%), whereas
47.6% of Australian traders � the sub-samples with the highest approval rate � see this point as crucial.
The currency most frequently used in international business transactions is the home currency
in both cases, i.e. the DM in Germany and the A$ in Australia. The second most important currency is the
US$ for both countries, but it is more important for Australian companies (a 2.9 rating versus a 2.4 for
German companies on a 5-grade rating scale). At the same time, German companies seem to accept more
often than Australian companies invoices written in the currency of the corresponding trading partner
country (2.2 versus 1.9). Traders seem to accept more often invoices in foreign currencies than
manufacturers which may indicate that traders are less risk averse than them.
That foreign exchange rate risks have already prevented a foreign business deal is committed
by 48.4% of all sample companies. There are no statistically significant differences between the sub-
samples, however, only 43.3% of Australian companies agree versus 53.8% for German companies, and
49.1% of manufacturers versus 46.8% for traders. German traders are less concerned about foreign
exchange risks (only 38.5% agree) and German manufacturers are most (61.5%). Overall, it becomes clear
that foreign exchange rate risks are not crucial for the business decisions of German and Australian
international food product marketers.
The coverage of foreign exchange rate risks happens in most cases by an arrangement on a
fixed exchange rate on the completion of the contract, followed by the use of risk hedging tools such as
forward contracts, futures, options, swaps, etc. The overall third most preferred method is the long run
acquisition and keeping of foreign exchange accounts. Australian companies have a stronger preference for
the use of hedging tools, whereas German companies prefer the keeping of foreign exchange accounts, as
the second most used method. This is also the preferred option for traders � in particular German ones �
whereas manufacturers arrange mostly fixed rates on the completion of the contract.
In summary, it appears that German companies have more bargaining power, since they seem to
be able to transfer the transport cost and risks to their customers. On the other hand, German companies
use more risky payment forms than their Australian counterparts. Other standardised international contract
standards are also used more often by German companies, but a further standardisation does not seem to
be a major preoccupation for the vast majority of the sample companies. The most frequently used
currency is the home currency in both countries, but in general, exchange rate risks do not seem to have a
great influence on international business decisions. Finally, Australian companies may have a better
understanding of, and therefore higher usage rates of, professional exchange rate risk management tools.
There are no major differences between manufacturers and traders, which might have been expected
beforehand, since the use of international trade, payment and contract terms, and of exchange rate risk
management techniques should be independent of the business class.

220 3 MANAGING INTERNATIONAL FOOD PRODUCT TRADE AT THE COMPANY LEVEL
3.2.3.7 The provision of information
The degree of availability of relevant foreign business information for the sample companies has
overall been rated 3.25 on a 5-point rating scale. This indicates that relevant information is available only in
a little bit more than half of the cases. There is a statistically significant difference between German
companies (3.48) and Australian ones (3.02), i.e. German companies seem generally better informed than
their Australian counterparts. The difference between manufacturers (3.17) and traders (3.42) is not
statistically significant at the 95% confidence level. Australian manufacturers rate their provision with
information lowest (2.98), while German traders rate it highest (3.62).
As main sources for foreign business information are overall used others (such as own
market research, exchange with partner companies, etc.) with a 3.1 rating on a 5-point rating scale. Then
follow marketing boards (2.7) and private information agencies (2.7). For German companies, (semi-)public
marketing agencies such as the CMA are equally important than others (both 3.2), followed by trade
chambers and private information agencies (both 2.9). The CMA is in particular important for German
manufacturers (with a 3.7 versus a 2.0 rating for German traders). For Australian companies the
government agency AUSTRADE is the most important source of foreign business information (3.2), ahead of
others (3.1). This agency is equally important for Australian manufacturers (3.1) as for traders (3.2). The
Australia commodity marketing boards seem not to be used as an important source of information by the
Australian sample companies (only a 2.1 rating).
The use of modern electronic information media, such as the internet, CD-ROMs, online
databases, etc. have overall not yet been used intensively at the time of the survey. Overall, the sample
companies attribute only a 2.7 rating on a 5-point rating scale, which indicates a use of not even half of the
cases. Here, however, Australian companies seem to be more advanced, with a rating of 2.98 versus 2.4 for
German companies. This difference is statistically significant at the 99% confidence level. The difference
between manufacturers (2.58) and traders (2.96) is not statistically significant. Australian traders are the
most intensive users of modern information tools (2.96), whereas German manufacturers use them least
(2.32).
The critical importance of a better supply of foreign market information is acknowledged
by 77.0% of all sample companies. Australian companies rate this importance statistically significantly
(99% confidence level) higher (87.8% approval rate) than German companies (65.8%). The difference
between manufacturers (78.5%) and traders (73.5%) is not statistically significant. German traders see the
lowest importance in a better supply of foreign market information (60.7%), Australian traders the highest
(90.5%). Here again, the survey findings indicate that the less a certain attribute is available, the more it is
seen as important by the people in short supply of it.
In summary, it becomes clear that German firms seem to be better informed about foreign
markets than Australian firms, and that they use mostly (semi-)public marketing agencies as information
sources, whereas Australian firms prefer a government agency. Australian firms use more intensively
electronic information media and they rate the critical importance of a better supply of foreign market
information higher than German firms. There is no major difference between manufacturers and traders.

3 MANAGING INTERNATIONAL FOOD PRODUCT TRADE AT THE COMPANY LEVEL 221
3.2.3.8 Government assistance
Financial government assistance is granted to a third (33.3%) of all sample companies. Australian
companies (44.0%) receive statistically significantly (99% confidence level, using the exact chi-square test)
more often financial grants than German companies (22.2%). Moreover, manufacturers (41.4%) receive
more often support than traders (14.3%), with the difference being also statistically significant at the 99%
confidence level. Thus, Australian manufacturers are the sub-sample with the highest assistance levels
(47.6%), whereas none of the German sample traders have received financial grants.
The support of (semi-)public marketing agencies (for German companies) or commodity
marketing boards (for Australian companies) is not rated as very important in both countries. Overall, the
results show only a 1.76 rating on the 5-point rating scale. German companies more often make use of the
CMA (2.05) than Australian companies do of AUSTRADE (1.48). This difference is statistically significant at
the 99% confidence level. The difference between manufacturers (1.87) and traders (1.51) is not
statistically significant. German manufacturers (2.30) use the CMA more often than German traders (1.57),
as Australian manufacturers (1.50) use AUSTRADE more often than Australian traders (1.43).
The critical importance of a better support through marketing agencies or commodity
marketing boards is acknowledged overall by only 44.3% of the sample companies. There is no statistically
significant difference between German companies (41.8%) and Australian ones (46.8%), nor between
manufacturers (46.8%) and traders (38.8%). German traders see the least importance in it (32.1%),
whereas 47.6% of Australian traders � the sub-sample with the highest approval rate � acknowledge the
importance of this kind of assistance.
The sort of government assistance desired by the sample companies can be categorised into
three main groups. 79 respondents filled in this question, and there are some differences between the
individual sub-samples. German manufacturers would most like better financial trade fair support (7 out of
26 responses), ahead of the reduction of administrative obstacles (tariffs, paperwork, etc.) (5 responses),
and more financial subsidies (4 responses). The remaining answers are quite mixed, and deal e.g. with the
strengthening of the country-of-origin effect, more advice or the provision of contacts. German traders ask
mostly for financial grants (3 out of 7 responses), lower taxes (1) or less 'red tape' (1). Australian
manufacturers prefer financial grants (mostly for travelling and accommodation) (14 out of 31 responses),
followed by the creation of contacts (6 responses), and the abolishment of trade barriers and paperwork (3
responses). The remaining answers are also quite mixed, such as lower AUSTRADE fees, more market
access information, and faster payments. Australian traders, finally, ask mostly for financial grants (5 out of
15 responses) and the creation of customer contacts (4 responses). In addition, lower AUSTRADE fees (1),
less paperwork (1), more foreign market information (1) are desired. In all, the sample companies would
mainly like more financial grants (for trade fairs by German companies, and for travel and accommodation
by Australian companies), the creation of foreign customer contacts, and the facilitation of the
administrative procedures involved in international business activities.

Table 61: Survey results — questions related to government assistance for sample companies
GERMAN AUSTRALIAN
Question
All companies Manufacturers Traders Manufacturers Traders
All Manufacturers
All Traders
All GERMAN
All AUSTRALIAN
Receipt of financial grants (subsidies, refunds, etc.) (% of firms saying YES)
33.3 34.0 0.0 47.6 33.3 41.4 14.3 22.2 44.0
3712
21
58
6
11
19
36
28
444
25
64
688
76
1414
71
39
13
21
54
8
20
67
5
914
32
41
51010
75
Support by govern. market-ing boards/ agencies mean % of total (1=never,..., 5=intensively) 1 2 3 4 5 1 2 3 4 5 1 2 3 4 5 1 2 3 4 5 1 2 3 1 2 3 4 5 1 2 3 4 5 1 2 3 4 5 1 2 3 4 5
Critical import-ance of a better support through marketing boards / agencies (% of firms saying YES)
44.3 47.1 32.1 46.6 47.6 46.8 38.8 41.8 46.8
Source: Author's compilation from questionnaire responses.
222
3 M
AN
AG
ING
INTERN
ATIO
NAL FO
OD
PRO
DU
CT T
RAD
E A
T T
HE C
OM
PAN
Y LE
VEL

3 MANAGING INTERNATIONAL FOOD PRODUCT TRADE AT THE COMPANY LEVEL 223
In summary, it becomes clear that Australian companies more often receive financial grants than
German ones, and manufacturers more often than traders. The assistance provided by (semi-)public
marketing agencies or commodity boards seems not to have a great importance, nor is more assistance of
this kind desired by the sample companies. The sort of government assistance mostly asked for by the
sample companies are more financial grants for trade fairs and travelling, the creation of foreign customer
contacts, and the reduction/abolishment of administrative formalities and tariffs.
3.2.3.9 Overall comparative assessment
The purpose of this question was to obtain an overall assessment of the importance of the most crucial
points already investigated in the earlier questions, but relative to each other. Thus it was possible to
determine the key variables which the sample companies say would mostly affect the success in
international food product markets. Apart from a graphical analysis (see Table 62), which visualises clearly
the differences between the individual sub-samples, a factor analysis was performed in order to find out
whether underlying common factors exist in the sub-samples.
Overall, the most important variables affecting success in international food product markets
are trouble-free customs clearance (with a 4.19 rating on a 5-point rating scale), followed by the knowledge
of trade administrative procedures (4.16), the knowledge of foreign food legislation (4.14), and the
knowledge of foreign business partners' mentality (4.09). The variables which least affect success in
international food product markets are, according to the sample companies: a small geographical distance to
foreign markets (2.51), support through marketing agencies/commodity marketing boards (2.76), and the
availability of public financial grants (3.00).
Differences between German and Australian firms exist in several ways. The most important
points for German firms are: foreign language skills (4.18), ahead of staff education/training (4.16) and
trouble-free customs clearance (4.16). The least important points for German firms are: a small distance to
foreign markets (2.46), the availability of public financial assistance (2.62), and the support through (semi-)
public marketing agencies (2.84). The most crucial points for Australian firms are: the knowledge of foreign
food legislation (4.27), the knowledge of foreign business partners' mentality (4.25), and the knowledge of
trade administrative procedures (4.24). Least important for Australian companies are: a small distance to
foreign markets (2.56), the support through commodity marketing boards, and trade fair activities (2.77).
Statistically significant (95% confidence level, using the exact Mann-Whitney U test) higher ratings of the
German companies can be found for the importance of foreign language skills of employees (4.18 versus
2.86 for Australian firms), staff education/qualification (4.16 versus 3.45), and trade fair activities (3.26
versus 2.77). These findings are consistent with the results found in Sections 3.2.3.3 and 3.2.3.4.
Australian firms rank the importance of the knowledge of foreign business partners' mentality (4.25 versus
3.93), the access to foreign market information (4.14 versus 3.46), the importance of the country of origin
affect (4.04 versus 3.56), the availability of sufficient stock capacities (3.86 versus 3.46), the appropriate
protection against exchange rate risks (3.69 versus 3.25), the use of INCOTERMS (3.45 versus 3.09), and
the availability of public financial grants (3.37 versus 2.62) statistically significantly higher than German
firms. These results, too are largely consistent with the results gained in the previous sections.

Table 62: Survey results — overall comparative assessment given by sample companies
GERMAN AUSTRALIAN Variable
Manufact. (n=53)
Traders (n=29)
Manufact. (n=63)
Traders (n=21)
All manufact. (n=116)
All traders (n=50)
All GERMAN (n=82)
All AUSTRALIAN
(n=84)
Staff education / qualification ――――
Foreign language skills of employees ―
Knowledge of foreign business_______ partners' mentality
Trade fair activities ――――――――――
Similar consumption patterns―――――
Positive image of geograph. origin ――
Adaptation of product in recipe,______ packaging, price
Small distance to foreign markets―――
Knowledge of the special logistics_____ characteristics of food products
Availability of special transport logistics
Sufficient stock capacities―――――――
Trouble-free customs clearance――――
Knowledge of foreign food legislation ―
Knowledge of trade administrative____ procedures
Use of INCOTERMS ――――――――――
Use of international standardised_____ payment terms Appropriate protection against_______ exchange rate risks Access to relevant foreign market ____ information Availability of public financial ________ assistance Support through commodity_________ marketing boards
2 3 4 5
2 3 4 5
2 3 4 5
2 3 4 5
Notes: )" indicate statistically significant differences of the group means at the 95% confidence level (exact Mann-Whitney U test results). 1=unimportant, ... , 5=very important.
Source: Author's compilation from questionnaire responses.
224
3 M
AN
AG
ING
INTERN
ATIO
NAL FO
OD
PRO
DU
CT T
RAD
E A
T T
HE C
OM
PAN
Y LE
VEL

3 MANAGING INTERNATIONAL FOOD PRODUCT TRADE AT THE COMPANY LEVEL 225
Differences between manufacturers and traders exist, too. The most important points for
manufacturers are knowledge of foreign food legislation (4.16), followed by knowledge of trade
administrative procedures (4.11), and knowledge of foreign business partners' mentality (4.00). The least
important variables for manufacturers are a small distance to foreign markets (2.57), the support through
marketing agencies/commodity marketing boards (2.79), and trade fair activities (3.08). For traders the
most crucial points are trouble-free customs clearance (4.48), followed by knowledge of foreign business
partners' mentality (4.30), and knowledge of foreign food legislation together with staff training/education
(both 4.22). The least important points for traders are a small distance to foreign markets (2.38), trade fair
activities (2.86), and the existence of similar consumption patterns in foreign markets (2.92). Traders rate
statistically significantly higher (95% confidence level) than manufacturers the importance of staff
education/training (4.22 versus 3.62), foreign language skills (3.86 versus 3.36), the knowledge of foreign
business partners' mentality (4.30 versus 4.00), an appropriate protection against exchange rate risks (3.84
versus 3.32), and all the points concerning logistics: knowledge of the special logistics characteristics of food
products (4.06 versus 3.45), availability of special transport logistics (3.96 versus 3.35), sufficient stock
capabilities (3.90 versus 3.47), and trouble-free customs clearance (4.48 versus 4.07). Manufacturers rank
only the existence of similar consumption patterns in foreign markets statistically significantly higher than
traders (3.38 versus 2.92). In all, the result is that for traders logistics and staff qualification questions are
most important and significantly more crucial than for manufacturers. Manufacturers, on the other hand,
care most about trade administrative problems and foreign business partners' mentality. However, only the
existence of similar consumption patterns in foreign markets is for them significantly more important than
for traders.
The differences between German manufacturers and traders are largely the same as those
found in the overall sample just described. There is, however, one large dissimilarity in so far as German
traders rate the significance of public support, either through subsidies (2.07) or by marketing agencies
(2.38) as statistically significantly lower than German manufacturers (2.92 and 3.09). The same is true for
trade fair activities which German traders rank also statistically significantly as less important (2.90) than
German manufacturers (3.45). These differences cannot be found in the Australian sample nor in the overall
sample. Between Australian manufacturers and traders the differences are less distinct than those present
in the German sub-sample. Major dissimilarities between the two groups can only be found for the variables
staff education/training, knowledge of foreign business partners' mentality, knowledge of the special logistics
characteristics of food products, availability of special transport logistics, and appropriate protection against
exchange rate risks. Australian traders rate the importance of all these points statistically significantly
higher than Australian manufacturers.
Factor analysis was performed in order to find out whether these numerous results just discussed
could be condensed into a few main statements. The principle component method with VARIMAX-rotation
was used. Only factors were extracted with eigenvalues greater than one. Factor analysis was applied to
the overall sample, and separately to the country and business class sub-samples. For the manufacturer or
trader sub-sample within a single country the number of observations n was not large enough to allow for
separate analysis. This problem is actually also true for the overall trader sub-sample with n being only 50
which is generally seen as being too small for a factor analysis including 20 variables. Nevertheless, this
result is also included in the following Table 63, but it needs to be interpreted with caution. The upper part

226 3 MANAGING INTERNATIONAL FOOD PRODUCT TRADE AT THE COMPANY LEVEL
of the table shows which variables belong to which factor for each sub-sample. Seven factors were
extracted from the overall, the all-German, and the all-traders sample and six factors from the all-Australian
and the all-manufacturers sample. The middle part of the table lists the mean rankings for each extracted
factor and sub-sample, indicating the importance of each factor. The lower part presents the rotated
squared factor loadings in form of the cumulated per cent of variance explained by the factors for each sub-
sample. Thus, it can be assessed how much of the sample variation is represented by the extracted factors.
Table 63: Factor analysis* results for all sample companies and subgroups
Factor membership
Variables All
(n=166) All German
(n=82) All Australian
(n=84) All Manu (n=116)
(All Trad) (n=50)
Staff education / training 4 1 3 3 4
Foreign language skills of employees 4 1 3 3 4
Knowledge of foreign business partners' mentality 2 6 3 1 2
Trade fair activities 5 2 4 5 7
Similar consumption patterns 6 5 4 5 5
Positive image of geographical origin 6 5 4 3 5
Adaptation of product in recipe, packaging, price 6 5 6 6 7
Small distance to foreign markets 7 7 4 4 2
Knowledge of special logistics characteristics of food 3 4 5 4 1
Availability of special transport logistics 3 4 1 4 1
Availability of sufficient stock capacities 3 4 5 3 1
Trouble-free customs clearance 1 1 1 1 4
Knowledge of foreign food legislation 1 1 1 1 2
Knowledge of trade administrative procedures 1 3 1 1 3
Use of standardised terms of trade (INCOTERMS) 2 3 2 2 3
Use of international standardised payment terms 2 3 2 2 3
Appropriate protection against exchange rate risks 2 7 2 2 2
Access to relevant foreign market information 1 6 1 1 2
Availability of public financial assistance 5 2 6 5 6
Support through market. agencies/commod. boards 5 2 6 5 6
Factor Mean rankings (out of 1, ..., 5)
1 4.08 4.13 4.08 4.03 3.97
2 3.57 2.90 3.56 3.32 3.70
3 3.59 3.51 3.52 3.57 3.70
4 3.66 3.51 3.11 3.12 4.19
5 2.92 3.48 3.75 3.10 3.34
6 3.52 3.70 3.21 3.59 2.69
7 2.51 2.85 - - 3.12
Factor Rotated squared factor loadings (cumulated % of variance explained)
1 11.88 12.50 13.65 13.53 12.97
2 22.32 24.50 26.11 24.40 25.15
3 32.42 36.73 36.90 34.70 36.07
4 42.48 46.15 45.83 44.86 46.42
5 51.63 54.67 53.68 54.02 56.46
6 58.80 62.38 61.49 60.83 66.48
7 64.97 68.78 - - 73.21
Note: *VARIMAX rotation with Kaiser normalisation; principle component method.
Source: Author's compilation from questionnaire responses.

3 MANAGING INTERNATIONAL FOOD PRODUCT TRADE AT THE COMPANY LEVEL 227
The factor results for the overall sample show that the most important factor which affects
success in international food product markets consists of four variables: trouble-free customs clearance,
knowledge of foreign food legislation, knowledge of trade administrative procedures, and access to relevant
foreign market information. All these variables can be summarised to a factor called know-how of
entering and serving foreign markets. It has a mean rating of 4.08 on the 5-grade rating scale. The
second most important factor (3.66) consists of staff education/training and foreign language skills of
employees. This factor may be called staff qualification. The third most important factor (3.59) is formed
out of three variables: knowledge of special logistics characteristics of food products, availability of special
transport logistics, and availability of sufficient stock capacities. This factor may be called logistics factor.
The fourth factor (3.57) is made up of the knowledge of foreign business partners' mentality, the use of
INCOTERMS, the use of international standardised payment terms, and the appropriate protection against
exchange rate risks. This factor is similar to the first one but whereas the first factor describes more
fundamental foreign marketing knowledge, the focus of this factor lies more on the technical details of
handling foreign deals. It may thus be called technical know-how factor. The fifth factor (3.52) consists
of similar consumption pattern in the foreign market, the positive image of the geographical origin of a food
product, and the adaptation of the food product in recipe, packaging, and/or price to the foreign market.
This factor may be summarised as the consumption similarity factor. The sixth factor (2.92) is formed of
trade fair activities, the availability of public financial assistance, and support through marketing
agencies/commodity marketing boards. It may be given the name assistance factor. The least important
factor (2.51) consists of only one variable: a small geographical distance to foreign markets, and it can
therefore be called the geographical distance factor.
The factor results for the sub-samples differ considerably. For German companies the most
important factor (with a mean 4.13 ranking) which affects success in international food product markets is
made up of staff education/training, employee's foreign language skills, trouble-free customs clearance, and
the knowledge of foreign food legislation. The second most important factor (3.70) consists of the
knowledge of foreign business partners' mentality and the access to relevant foreign market information.
On the contrary, for Australian companies the most important factor (4.08) is composed of five variables:
availability of special transport logistics, trouble-free customs clearance, knowledge of foreign food
legislation, knowledge of trade administrative procedures, and access to relevant foreign market
information. The second most important factor (3.75) for Australian companies consists of the knowledge of
the special transport logistics characteristics of food products and the availability of sufficient stock
capacities. These results confirm that the big difference between German and Australian companies is that
for the former staff qualification is one of the most crucial points, whereas for the latter logistical aspects are
more important. There is another big difference concerning the appropriate protection against foreign
exchange rate risks, which for German companies belongs to the least important factor (together with a
small geographical distance to foreign markets), whereas for Australian companies it is part of the third
most important factor (together with the use of INCOTERMS and the use of international standardised
payment terms). With regard to manufacturers, it becomes clear that apart from the most important (4.03)
foreign market entering and serving know-how factor which consists of knowledge of foreign business
partner's mentality, trouble-free customs clearance, knowledge of foreign food legislation, knowledge of
trade administrative procedures, and access to relevant foreign market information, the second most
important point (3.59) is the adaptation of the product in recipe, packaging, and/or price to the foreign

228 3 MANAGING INTERNATIONAL FOOD PRODUCT TRADE AT THE COMPANY LEVEL
market. The least important factor (3.10) consists, as before, of trade fair activities, similar consumption
patterns in the foreign market, and the support through either public subsidies or through marketing
agencies/commodity marketing boards. The results for the trader sub-sample are very much similar to the
ones of the German sub-sample, but as mentioned before, they need to be treated cautiously due to the
small sample size.
In summary, it becomes clear that, overall, the biggest obstacle for food companies engaged in
international food marketing activities lies in the actual knowledge of how to enter and to serve a foreign
market effectively (how to avoid customs troubles, how to adapt to foreign food legislation, and how to
obtain crucial foreign market intelligence), followed by staff qualification (appropriate training and foreign
language skills), and the mastering of logistics (the knowledge of the particularities of the food product, and
the availability of suitable facilities). The distance to a foreign market either geographically or in terms of
the existence of a similar consumption environment as in the home market seem to matter least as success
factors. The big difference between German and Australian companies is that for the former staff
qualification is one of the most crucial points, whereas for the latter logistics aspects are more important.
Moreover, exchange rate risks are much more important for Australian companies, indicating that they do
not enjoy the advantage of doing most of their business in a fixed exchange rate market environment. For
traders, staff qualification questions and logistics are most important and significantly more crucial than for
manufacturers. Manufacturers, on the other hand, care most about trade administrative problems and
foreign business partners' mentality. Trade fair activities seem to be only of some importance for German
manufacturers and the assistance through either governments or (semi-)public marketing agencies or
commodity marketing boards is rated as not being crucial for companies operating in international food
product markets.

3 MANAGING INTERNATIONAL FOOD PRODUCT TRADE AT THE COMPANY LEVEL 229
3.2.3.10 The relationship between success factors and foreign business performance
This section attempts, as a last analysis, to investigate whether there is any relationship between the
foreign business performance of the sample firms, as measured according to the criteria outlined in Section
3.2.3.2, and the factors the firms claim are important for foreign market success. That is, do more
successful companies rate the importance of some factors significantly differently from firms which are less
successful? In order to investigate this relationship, first a cluster analysis was performed to identify groups
('clusters') of companies which are similar in their foreign performance patterns. Then, multiple discriminant
analysis was used to check for the existence of factors (from the one just discussed in the section before)
which discriminate against the foreign performance clusters, for all companies and for each sub-sample.
Clusters of foreign business performance were identified by using four variables which
represent the different dimensions of the success concept (as discussed in Section 3.2.3.2): the (relative)
speed of foreign market entering (i.e. the ratio of the length of foreign business activities to corporate age),
the foreign trade share (the mean of import and export share in total business turnover), the foreign
business growth rate (during the last three years), and the development tendency of the foreign business
activities (as measured as the mean of the current and the expected future development tendency). All
variables were measured on a 3-point rating scale, i.e. the original variables were transformed into three
simple categories: 'late expander' (0 to 0.33 ratio values), 'medium fast expander' (0.34 to 0.66), and 'fast
expander' (0.67 to 1.0) for the speed of entry into foreign market variable; 'little'(<10% in total turnover),
'medium' (10%-49.9%), and 'high' (≥50%) for the trade share variable; 'declining' (<0%), 'stagnant'
(=0%), and 'growing' (>0%) for the growth rate variable; and 'declining' (mean ratings of <3 on the 5-point
rating scale), 'constant' (a mean rating of 3), and 'growing' (mean ratings of >3) for the development
tendency variable. The transformation of the variables onto a 3-point scale had the advantage of measuring
all success dimensions on the same scale, which made a standardisation of the variables unnecessary, and it
eliminated outliners which can seriously affect cluster results. First, hierarchical cluster analysis (Ward's
method) was used to determine the optimal cluster number, using the agglomeration coefficient as a
stopping rule. The largest percentage change in this coefficient occurred from the 4 cluster to the 3 cluster
solution, suggesting 3 as the optimum number of clusters. Then non-hierarchical K-means clustering was
performed, using the results from the hierarchical cluster analysis as initial cluster seeds, to determine the
optimal cluster structure. Figure 21 shows the identified cluster solution.
Three patterns of foreign business success resulted from the cluster analysis. The first cluster
of companies (n=64) is characterised by a high trade share and a high speed of entry into foreign markets.
Moreover, the ratings on these two variables are statistically significantly (95% confidence level using
ANOVA with post hoc tests) higher than the ones for the other two clusters. On the other hand, cluster 1
displays the lowest growth rate (but the difference to the other clusters is not statistically significant) and
also one of the lowest ratings on development tendency. This cluster may thus be characterised as most
foreign business-oriented but mature. The second cluster of companies (n=26) is characterised by entering
foreign markets comparatively late, but having the second highest foreign trade share. In addition,
companies belonging to this cluster have enjoyed the highest growth rates during the last three years
(though this difference is not statistically significant), but their development tendencies are the lowest
among all companies. Cluster 2 companies may thus be characterised as a late but successful movers. The
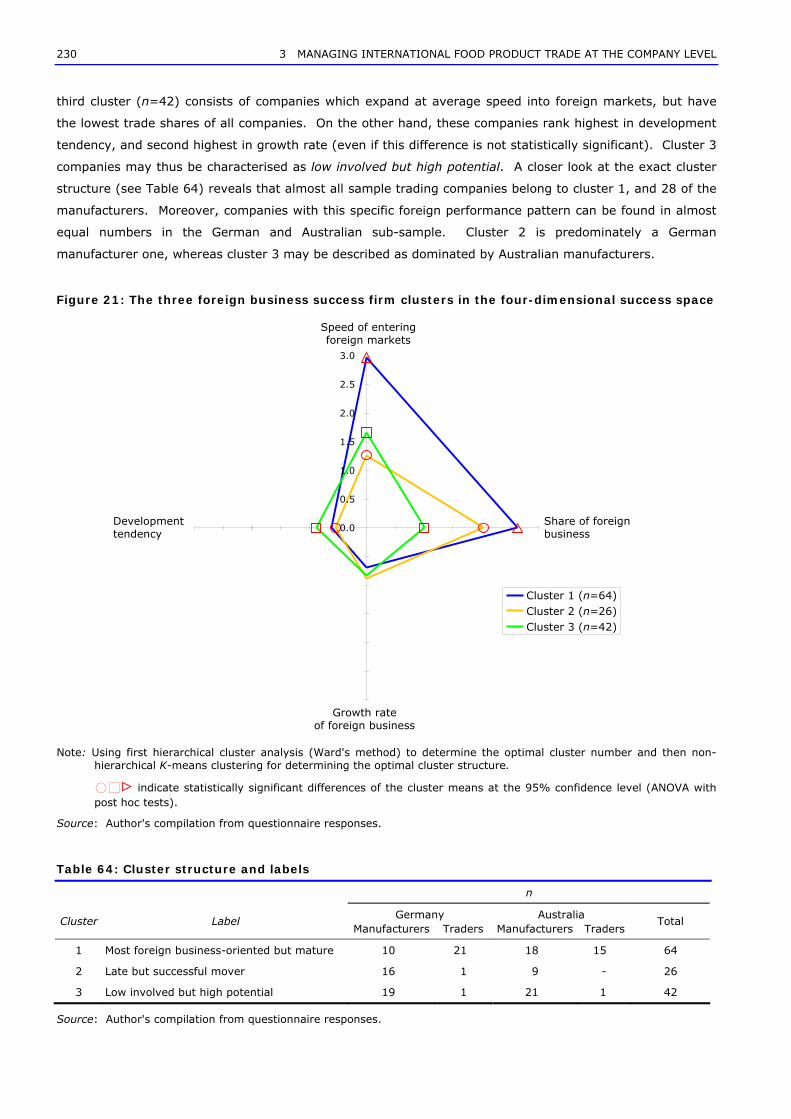
230 3 MANAGING INTERNATIONAL FOOD PRODUCT TRADE AT THE COMPANY LEVEL
third cluster (n=42) consists of companies which expand at average speed into foreign markets, but have
the lowest trade shares of all companies. On the other hand, these companies rank highest in development
tendency, and second highest in growth rate (even if this difference is not statistically significant). Cluster 3
companies may thus be characterised as low involved but high potential. A closer look at the exact cluster
structure (see Table 64) reveals that almost all sample trading companies belong to cluster 1, and 28 of the
manufacturers. Moreover, companies with this specific foreign performance pattern can be found in almost
equal numbers in the German and Australian sub-sample. Cluster 2 is predominately a German
manufacturer one, whereas cluster 3 may be described as dominated by Australian manufacturers.
Figure 21: The three foreign business success firm clusters in the four-dimensional success space
Note: Using first hierarchical cluster analysis (Ward's method) to determine the optimal cluster number and then non-hierarchical K-means clustering for determining the optimal cluster structure.
)"> indicate statistically significant differences of the cluster means at the 95% confidence level (ANOVA with post hoc tests).
Source: Author's compilation from questionnaire responses.
Table 64: Cluster structure and labels
n
Germany Australia Cluster Label
Manufacturers Traders Manufacturers Traders Total
1 Most foreign business-oriented but mature 10 21 18 15 64
2 Late but successful mover 16 1 9 - 26
3 Low involved but high potential 19 1 21 1 42
Source: Author's compilation from questionnaire responses.
0.0
0.5
1.0
1.5
2.0
2.5
3.0
Speed of entering foreign markets
Share of foreign business
Growth rate of foreign business
Development tendency
Cluster 1 (n=64) Cluster 2 (n=26) Cluster 3 (n=42)

3 MANAGING INTERNATIONAL FOOD PRODUCT TRADE AT THE COMPANY LEVEL 231
Attributing different success labels to the individual clusters seems difficult. Yet, in terms of a
'business life cycle model', cluster 1 appears to be the most advanced in foreign marketing, cluster 3 the
least advanced, and cluster 2 lies somewhere in between. Companies which have expanded quickly into
foreign markets and which now do a significant share of their business in foreign countries may be called
successful, even if their foreign business growth may have slowed. Cluster 1 may thus be seen as a
benchmark for the other two clusters each of which is characterised by a different foreign expansion pattern.
Multiple discriminant analysis was used to explore whether any factors exist, the importance of
which are rated significantly differently among the identified foreign business performance clusters. First, all
factors were tested for normality, using the Kolmogrov-Smirnov Test. As it turned out, all factors proved to
be sufficiently normally-distributed, allowing for their use in discriminant analysis. Separate discriminant
models were estimated for the overall sample, the German and the Australian sample, using these factors.
For the trader sub-sample the sample size n was too small, thus not allowing for the estimation of a
separate discriminant model. Therefore, with no direct comparison possible, a separate model for the
manufacturer sample is not presented in the following either.
Table 65: Discriminant analysis results for all sample companies (n=132)
Standardised canonical coefficients
Factors Steps n Function 1 Function 2
3 (Logistics) (1) .782 -.625
4 (Staff education / training) (2) .591 .808
Eigenvalue .137 .008 Percent of variance 94.8 5.20
Canonical correlation .348 .087
Wilks' Lambda .873 .992
Chi-square 17.51 .968
Significance .002 .325
Group centroids:
(1) 64 .336* -.004
(2) 26 -.002 .174
(3) 42 -.499* -.005
Percent of correct classification 55.3% Proportional chance classification 37.5% Press's Q statistic 46.15**
Notes: *Differences statistically significant between the marked centroids (95% confidence level using ANOVA with post hoc tests). **Statistically significant at the 99% confidence level.
Source: Author's compilation from questionnaire responses.
Results for the overall sample (see Table 65) suggest that there are two main factors which
discriminate between the three clusters. First, the logistics factor and the staff education/training factor
separate cluster 1 from the two other clusters, and in a statistically significant way in particular from
cluster 3 (95% confidence level using ANOVA with post hoc tests). The discriminant function 1 is statistically
significant (99% confidence level) and explains 94.8% of the total sample variance. In this function the
logistics factor takes the highest discriminant weight, indicating that logistics, ahead of staff education/
training, is considered by cluster 1 companies as the most crucial factor affecting success in foreign markets,

232 3 MANAGING INTERNATIONAL FOOD PRODUCT TRADE AT THE COMPANY LEVEL
i.e. by the companies characterised by the highest levels of expanding speed into foreign markets and
foreign trade shares. Discriminant function 2, which should separate cluster 2 from cluster 3, is not
statistically significant, thus underlining the assumption that these two clusters are not very different with
respect to their foreign business performance. Overall, the estimated discriminant model can be considered
as valid and useful as its classification proprieties are statistically significantly better (99% confidence level,
using Press's Q statistic) than pure chance classification. On the other hand, a mere rate of 55.3% of
correctly classified companies is from a practical significance point of view not satisfactory, thus the model
may not be seen as a strong proof of the findings. However, in general, it does confirm the results from the
previous sections in that logistics and staff qualification are the most important levers in the international
food product business.
Table 66: Discriminant analysis results for all German companies (n=68)
Standardised canonical coefficients
Factors Steps n Function 1 Function 2
1 (Staff education / training) (1) .801 .607
2 (Trade fair activities, public assistance) (2) -.681 .739
Eigenvalue .259 .024 Percent of variance 91.6 8.4
Canonical correlation .453 .152
Wilks' Lambda .776 .977
Chi-square 16.33 1.502
Significance .003 .220
Group centroids:
(1) 31 .513* .005
(2) 17 -.191 -.254
(3) 20 -.633* .132
Percent of correct classification 55.9% Proportional chance classification 35.7% Press's Q statistic 15.56**
Notes: *Differences statistically significant between the marked centroids (95% confidence level using ANOVA with post hoc tests). **Statistically significant at the 99% confidence level.
Source: Author's compilation from questionnaire responses.
Results for the German sub-sample (see Table 66) suggest that staff education/training is the
most crucial factor which separates cluster 1 from the other two clusters. The estimated discriminant
function is statistically significant (99% confidence level) and explains 91.6% of the sample variation.
Factor 2, i.e. trade fair activities and public assistance, is the one that takes the main weight in discriminant
function 2, which separates cluster 2 from cluster 3 companies. This function is, however, not statistically
significant, confirming as above that cluster 2 and cluster 3 companies are too similar in their foreign
business success pattern. Overall, the estimated discriminant model classifies 55.9% of the companies
correctly, which is statistically significantly more than proportional chance classification, albeit the rate is not
satisfactory either. In all, it becomes clear that successful German companies rate the importance of staff
training/education statistically significantly higher than less successful companies.

3 MANAGING INTERNATIONAL FOOD PRODUCT TRADE AT THE COMPANY LEVEL 233
Table 67: Discriminant analysis results for all Australian companies (n=64)
Standardised canonical coefficients
Factors Steps n Function 1 Function 2
3 (Staff training, knowledge of foreign languages and mentality)
(1) 1.000 -
Eigenvalue .193 - Percent of variance 100.0 -
Canonical correlation .403 -
Wilks' Lambda .838 -
Chi-square 10.787 -
Significance .005 -
Group centroids:
(1) 33 .403* -
(2) 9 -.188 -
(3) 22 -.527* -
Percent of correct classification 57.8% Proportional chance classification 40.4% Press's Q statistic 24.50**
Notes: *Differences statistically significant between the marked centroids (95% confidence level using ANOVA with post hoc tests). **Statistically significant at the 99% confidence level.
Source: Author's compilation from questionnaire responses.
Results for the Australian sub-sample (see Table 67) show once again that staff training, here
combined with the knowledge of foreign languages and of foreign business partner's mentality, separates
cluster 1 companies � i.e. the more successful companies � from cluster 2 and cluster 3 companies. The
estimated discriminant function is statistically significant (99% confidence level), but the Australian sample
data reject the estimation of a second discriminant function. Here again the classification power of the
estimated discriminant model is statistically significantly higher than proportional chance classification, but
with only 57.8% of all companies correctly classified the practical significance of the model may not be seen
as satisfactory. Nevertheless, the findings underline the importance of the staff training/education factor
which consistently discriminated between companies which expand rapidly into foreign markets and which
have high foreign trade shares from companies with more passive expansion patterns.
In summary, cluster analysis yields three distinct groups of companies which are different in their
foreign business performance measured in four dimensions: the (relative) speed of entering foreign markets,
the trade share, the past foreign business growth rate, and the (current and future) development tendency.
Cluster 1 may be called most foreign business oriented but mature and is characterised by the highest level
of expanding speed into foreign markets, high foreign business shares, but low growth rates and
development tendencies. Cluster 2 companies are late but successful movers, characterised by low
expanding speed levels, average foreign trade shares, but comparatively high growth rates and development
tendencies. Cluster 3 may be given the name low involved but high potential, since these companies have
the lowest foreign trade shares but the highest development tendencies, with average expanding speed and
growth rates. Multiple discriminant analysis was used to identify those factors which affect success in
international food product markets and which are rated significantly differently between the three clusters.
The results consistently show that statistically significant differences exist only between cluster 1 and the
two other clusters but not between cluster 2 and cluster 3. Overall, the logistics factor and the staff

234 3 MANAGING INTERNATIONAL FOOD PRODUCT TRADE AT THE COMPANY LEVEL
education/training factor discriminate between cluster 1 and the other two clusters' companies, with cluster
1 companies rating the importance of these factors higher than the companies belonging to cluster 2 or 3.
German cluster 1 companies rate the importance of staff education / training statistically significantly higher
than cluster 2 and 3 companies. The importance of trade fair activities and public support is, on the other
hand, rated as less important by the more successful German companies than by the less successful ones.
Australian cluster 1 companies, too rate staff training/education combined with the knowledge of foreign
language skills and of foreign business partner's mentality as more important than the companies from the
other two clusters. In all, it becomes clear that staff education/training (which in Australia includes foreign
language skills and knowledge of foreign business partner's mentality) and logistics are the most important
factors affecting success in international food product markets.
3.2.4 Summary
A survey of international food product marketers from Germany and Australia was conducted in order
to find answers to the question of which factors affect success in international food product markets. Out of
1 298 companies that were contacted in November 1998 (Germany) and July 1999 (Australia), 166 usable
questionnaires were obtained. The responses were analysed separately for the overall sample, German and
Australian companies, all manufacturers and traders, and for manufacturers and traders alone from each
country. Given the small sample relative to the sector sizes, the representativeness and generaliseability of
the survey findings may be seen as low, however, from a statistical point of view, n=166 is large enough to
achieve statistical significance, especially if the investigated effects can be assumed to be structural for the
food product sector and independent of the country or of business class.
Multivariate analysis techniques have been used to analyse the survey data and to identify the
key factors that affect success in international food product markets of the sample companies. Apart from
tests for differences in group means (t- and F-tests, non-parametric tests, and chi-square tests), cluster
analysis, factor analysis, and multiple discriminant analysis have been employed. Factor analysis can be
used to condense the information contained in a large number of variables, which are bundled into a smaller
set of factors representing underlying dimensions. Cluster analysis' primary purpose is to group objects
based on the characteristics they possess in a way that the resulting clusters exhibit high internal (within-
cluster) homogeneity and high external (between-cluster) heterogeneity. Thus, factor analysis condenses
variables into a few factors and cluster analysis classifies objects into a few groups. Both techniques allow
for the identification and description of structures in complex data. Multiple discriminant analysis, on the
other hand, is a dependence technique which can be applied in situations where a relationship should be
predicted or explained which affect the category in which an object is located. It aims to identify variables
that are suitable for predicting the group membership of an object and provides measures to describe the
relative importance of independent variables in this procedure, and the discriminatory power of the
estimated function as a whole.

3 MANAGING INTERNATIONAL FOOD PRODUCT TRADE AT THE COMPANY LEVEL 235
General company characteristics, in the survey results, show that German companies, in
general, are larger, older, more productive, they are more often publicly listed, they tend to be importers (in
particular traders), they operate mostly in European markets, and they are less consumer-oriented than
Australian businesses. Moreover, German responses reflect attitudes from functional (i.e. export or sales)
managers. The responses of Australian companies, on the other hand, express a more general management
background (i.e. managing directors, or CEOs). Australian companies have their main foreign markets in
Asia. The main structural differences between manufacturers and traders are, that manufacturers generally
seem to have higher corporate ages, they are larger in size, and they are more export-oriented than traders.
Foreign business performance or 'success' is complex to measure, since this concept is
multidimensional in nature. Nevertheless, the survey results suggest that trading companies start
significantly faster with foreign business activities than manufacturing companies, but that German
manufacturers are even significantly slower than Australian ones. German companies (and in particular
traders) are more import-oriented, whereas Australian businesses are more oriented towards exporting.
There is no statistically significant difference in the past growth rates between German and Australian
companies, but the latter rate their current and medium-term future business development tendencies
significantly more positively.
Foreign business qualification findings show that German companies have relatively fewer staff
dealing with foreign business activities. In both countries about 40% of the employees hold a university
degree, which is most likely a business/economics one. Furthermore, about 40% of the companies have
never used any sort of further specialised job training for their employees, but if they do, German
companies generally tend to choose private institutions, whereas Australian companies rely more on
government programs. Employees who deal with foreign customers/suppliers in Germany know significantly
more foreign languages and master these significantly better than employees in Australian companies. On
the other hand, Australian companies rank the critical importance of foreign language skills higher than
German ones, despite the fact that English may be the most important business language in the world. The
importance of the knowledge of foreign business partners' mentality is rated by Australian companies
significantly higher than by German companies, although there does not seem to be a great difference in the
knowledge level between the two countries. This may be caused by the fact that Australian companies do
most of their foreign business in Asian countries, i.e. in a, in general, culturally different environment.
Between the two business classes, there are no major structural differences, apart from the fact that traders
seem to rank the knowledge their employees have about their foreign business partners' mentality
significantly higher than manufacturers do. However, this finding may be due to the fact that sample
trading companies are more involved in foreign business than manufacturers and therefore they have more
contact to foreign customers or suppliers.
Trade fair activity findings reveal that the only significant difference between German and
Australian companies is the higher participation rates at trade fairs of the former. Moreover, German
companies exhibit strongly in the home country, whereas Australian ones hardly exhibit in Australia. The
most important purpose of trade fairs in both countries is the 'making, keeping or improving of contacts'.
There is no major difference concerning trade fair expenses and staff use, however significantly fewer
Australian companies prefer individual stands than German companies. The general difference between

236 3 MANAGING INTERNATIONAL FOOD PRODUCT TRADE AT THE COMPANY LEVEL
manufacturers and traders is that the former mostly take part in trade fairs as exhibitors, whereas traders
are mostly visitors. Manufacturers spend more on trade fairs, employ less staff, and receive more financial
grants for participation from governments.
Food product related questions reveal that the survey companies operate in several product
groups and processing/packaging categories which highlights the fact that the sample represents well the
diversities of the two countries' food manufacturing sectors. The degree of logistical problems is ranked by
all companies as relatively important, however it seems that Australian companies depend more on
appropriate transport logistics in their foreign partner countries than German companies, probably mostly
because they operate in the quite different Asian markets. This fact may also be a reason why Australian
companies have a higher percentage of product losses in their foreign business activities. Moreover,
Australian companies face a stronger seasonal influence in their foreign sales. Australian companies
highlight the origin of their food products more than German companies, which on the other hand adapt
their recipes more to their foreign markets. For German companies statistical reporting is more troublesome
than for their Australian counterparts. The main differences between manufacturers and traders is that the
former have fewer product losses in their foreign business transactions, but on the other hand
manufacturers are more affected than traders by the complexities resulting from different national food
laws. Overall, it becomes clear that logistical problems can be seen as a significant obstacle for foreign
business activities.
Trade and payment terms related questions reveal that German companies appear to have more
bargaining power, since they seem to better transfer the transport cost and risks to their customers. On the
other hand, German companies use more risky payment forms than their Australian counterparts. Other
standardised international contract standards are also used more often by German companies, but a further
standardisation does not seem to be a major preoccupation for the vast majority of the sample companies.
The most frequently used currency is the home currency in both countries, but in general, exchange rate
risks do not seem to have a great influence on international business decisions. Finally, Australian
companies may have a better understanding of, and therefore have higher usage rates of, professional
exchange rate risk management tools. There are no major differences between manufacturers and traders,
which might have been predicted beforehand, since the use of international trade, payment and contract
terms, and of exchange rate risk management techniques should be independent of the business class.
Foreign market information seems to be better available in German companies which use
mostly (semi-)public marketing agencies as information sources, whereas Australian companies prefer
government agencies. Australian companies use modern electronic information media more intensively and
they rate the critical importance of a better supply of foreign market information higher than German
companies. There is no major difference between manufacturers and traders.
Government assistance, in form of financial grants, is received more often by Australian
companies than by German ones, and by manufacturers more often than by traders. The assistance
provided by (semi-)public marketing agencies or commodity marketing boards seems not to have a great
importance, nor is more assistance of this kind desired by the sample companies. The sort of government
assistance mostly asked for by the sample companies are more financial grants for trade fairs and travelling,

3 MANAGING INTERNATIONAL FOOD PRODUCT TRADE AT THE COMPANY LEVEL 237
the creation of foreign customer contacts, and the reduction/abolishment of administrative formalities and
tariffs.
An overall comparative assessment of the different variables makes clear that the biggest
obstacle for food companies engaged in international food marketing activities lies in the actual knowledge
of how to enter and to serve a foreign market effectively (how to avoid customs troubles, how to adapt to
foreign food legislation, and how to obtain crucial foreign market intelligence), followed by staff qualification
(appropriate training and foreign language skills), and the mastering of logistics (the knowledge of the
particularities of the food product, and the availability of suitable facilities). The distance to a foreign market
either geographically or in terms of the existence of a similar consumption environment as in the home
market seem to matter least as success factors. The big difference between German and Australian
companies is that for the former staff qualification belongs to the most crucial points, whereas for the latter
logistics aspects are more important. Moreover, exchange rate risks are much more important for Australian
companies, indicating that they do not enjoy the advantage of doing most of their business in a fixed
exchange rate environment. For traders, staff qualification questions and logistics are most important and
significantly more crucial than for manufacturers. Manufacturers, on the other hand, care most about trade
administrative problems and about foreign business partners' mentality. Trade fair activities seem to be
only of some importance for German manufacturers and the assistance through either governments or
(semi-)public marketing agencies or commodity marketing boards is rated as not being crucial for companies
operating in international food product markets.
The relationship between foreign business performance and success factors was explored
in identifying three clusters of companies which are distinct in their foreign performance pattern measured
by four different variables. Cluster 1 may be called most foreign business oriented but mature and is
characterised by the highest level of expanding speed into foreign markets, high foreign business shares,
but low growth rates and development tendencies. Cluster 2 companies are late but successful movers,
characterised by low expanding speed levels, average foreign trade shares, but comparative high growth
rates and development tendencies. Cluster 3 may be given the name low involved but high potential, since
these companies have the lowest foreign trade shares but the highest development tendencies, with average
expanding speed and growth rates. Multiple discriminant analysis was used to identify those factors which
affect success in international food product markets and which are rated significantly differently between the
three clusters. The results consistently show that statistically significant differences exist only between
cluster 1 and the two other clusters but not between cluster 2 and cluster 3. Overall, the logistics factor and
the staff education/training factor discriminate between cluster 1 and the other two clusters, with cluster 1
companies rating the importance of these factors higher than the companies belonging to cluster 2 or 3.
German cluster 1 companies rate the importance of staff education/training statistically significantly higher
than cluster 2 or 3 companies. The importance of trade fair activities and public support is, on the other
hand, rated as less important by the more successful German companies than by the less successful ones.
Australian cluster 1 companies, too rate staff training/education, including the knowledge of foreign
language skills and of foreign business partner's mentality, as more important than the companies from the
other two clusters.

238 3 MANAGING INTERNATIONAL FOOD PRODUCT TRADE AT THE COMPANY LEVEL
3.3 Chapter conclusions
The theoretical analysis of the problems involved in the management of exporting or importing of food
products shows that higher transaction costs and risks relative to home market business activities may be
the main obstacles to companies for not engaging in international marketing activities. From the literature
arise several problem areas but it is not clear which ones are actually most important. In order to find an
answer to this problem, a questionnaire-based survey of Australian and German businesses involved in the
international marketing of food products has been conducted.
The survey results suggest that staff education/training and logistics are the most important
factors affecting success in international food product markets. Another main finding of the survey is that
problems which occur in the international food business do not depend much on business class � i.e. there
are no main differences between manufacturers and traders. Even the differences between Australian and
German companies are comparatively small. Thus, the findings may reflect the structural problems that are
involved in the international food product business. Also, even though the sample size of the survey is small
relative to the industry, the results often show statistical significance. Practical significance can also be seen
as high, too, since most findings are in line with previous expectations.
Implications for agribusiness managers which arise from this study are therefore that staff
qualification matters strongly when operating in foreign markets and every possible care should be
undertaken by companies to recruit well-trained staff and to offer export managers appropriate additional
training whenever possible. This finding thus confirms what should be obvious: at the very heart of
competitiveness stands the human being with his/her skills to create value, however new and unfamiliar the
environment encountered. Recruiting and maintaining well-trained staff is therefore crucial even for food
companies which are generally considered as low-tech and low-skill. A second important implication for food
businesses arises from the fact that the ability to manage logistics (i.e. to market perishable products over
long distances) indeed discriminates between more and less successful enterprises. Knowing the product
and its technical characteristics, for example in terms of how product quality is affected by long distance
transport, thus allows export managers to plan better and to execute expansion into remote international
markets. Of course, this may be more relevant for some food businesses than for others but delivering
acceptable product quality in a continuous way matters to all of them.
Future research should focus on a more detailed analysis of which skills employees precisely
need to increase their food companies' competitiveness in foreign markets. Some aspects have already
been explored, such as language skills and the knowledge of foreign business partners' mentality. There are
other issues which could also be crucial, e.g. negotiation skills. Moreover, future studies should investigate
in more detail the logistics problems that are involved in the international food product business, given the
lack of literature dealing specifically with this topic, and acknowledging the findings of this survey that
logistics turned out to be a major success factor in international food product markets. In a time where
(national) manufacturers and retailers forge ever closer alliances in order to master the supply chain as
effectively as possible, it is clear that the next stage will be the international one. Thus, future studies must
investigate how transport, storage and information exchange � across climate and time zones, with
(multiple) border crossings and between (often) different national retailing standards � can be facilitated and
optimised.


240 REFERENCES
REFERENCES
ABARE (Australian Bureau of Agricultural and Resource Economics) (2001), Australian Food Statistics 2001,
Australian Government Publishing Service, Canberra, Australia.
ABBOTT P.C. & BREDAHL M.E. (1994), Competitiveness: Definitions, Useful Concepts, and Issues, in
Competitiveness in International Food Markets, BREDAHL M.E., ABBOTT P.C. & REED M.R. (eds.),
Westview Press, Boulder, US.
ABS (Australian Bureau of Statistics) (2001), Manufacturing Industry, Australia, Government Publishing
Service, Canberra, Australia.
ADAMS B. JENSEN K. & DAVIS G. (1997), 'Knowledge and Use of Export Assistance Services by
Agribusiness', Agribusiness, Vol. 13, No. 3, pp.285-94.
AID (Auswertungs- und Informationsdienst für Ernährung, Landwirtschaft und Forsten e.V.) (1997),
Agrarmarktordnungen in der Europäischen Union und Agrarmärkte in Deutschland, AID, Bonn, Germany.
AISLABIE C., LEE J. & STANTON J. (1994), Australian Cultural Diversity and Export Growth, Australian Office
of Multicultural Affairs, Canberra.
ALTMANN J. (1997), Lieferungs- und Zahlungsbedingungen im internationalen Handel, in Handbuch
Internationales Management: Grundlagen � Instrumente � Perspektiven, MACHARZINA K. & OESTERLE
M.-J. (eds.), Gabler Verlag, Wiesbaden, Germany.
ANASTASSOPOULOS G. & TRAILL W.B. (1998), 'Determinants of Foreign Entry Strategies in Greek Food
Industry', Agribusiness, Vol. 14, No. 4, pp.267-279.
ANDERSON K., DIMARANAN B., HERTEL T. & MARTIN W. (1997), 'Asia-Pacific Food Markets and Trade in
2005: a Global, Economy-wide Perspective', The Australian Journal of Agricultural and Resource
Economics, Vol. 41, No. 1, pp.19-44.
ASKEGAARD S. & MADSEN T.K. (1995), European food cultures: An exploratory analysis of food related
preferences and behaviour in European regions, MAPP working paper #26 (www.mapp.hha.dk/wp),
Aarhus: The Aarhus School of Business, Denmark.
ATES H. & SEN A. (1998), 'Export Performance of Agroindustry Companies: The Case of Turkey', Journal of
International Food & Agribusiness Marketing, Vol. 10, No. 1, pp.71-87.
BACKHAUS K., ERICHSON B., PLINKE W. & WEIBER R. (1996), Multivariate Analysemethoden � Eine
anwendungsorientierte Einführung. 8., verbesserte Auflage, Springer Verlag, Berlin, Germany.
BALASSA B. (1989), Comparative Advantage, Trade Policy and Economic Development, New York & London.
BALASSA B. (1986), 'Intra-Industry Specialization: A Cross-Country Analysis', European Economic Review,
Vol. 30, pp.27-42.
REFERENCES 241
BALASUBRAMANYAM V.N & SALISU M.A. (1994), Brands and the alcoholic drinks industry, in Adding Value:
Brands and Marketing in Food and Drink, JONES G. & MORGAN N.J. (eds.), Routledge, London & New
York, pp.59-75.
BECKER G.S. (1965), 'A Theory of the Allocation of Time', Economic Journal, Vol. 75, pp.493-516.
BEHRMAN J.R. & DEOLALIKAR A.B. (1988), Health and Nutrition, in Handbook of Development Economics,
Volume I, CHENERY H. & SRINIVASAN T.N. (eds.), Elsevier Science Publishers B.V., Holland, Chapt. 14,
pp.631-711.
BENDER A. (1986), Food and Nutrition � Principles of Nutrition and some current controversies in the
Western countries, in The Food Consumer, RITSON C., GOFTEN L. & MCKENZIE J. (eds.), John Wiley &
Sohn Ltd, Chichester, UK, Chapt. 3, pp.37-58.
BERNSTEIN P.L. (1998), Against the Gods: The Remarkable Story of Risk, John Wiley & Sons Ltd,
Chichester, UK.
BIE (Bureau of Industry Economics) (1996), Evaluation of the agri-food strategy � An assessment of recent
government assistance to the agri-food industry, Australian Government Publishing Service, Canberra,
Australia.
BLANDFORD D. (1986), The Food People Eat, in The Food Consumer, RITSON C., GOFTEN L. & MCKENZIE J.
(eds.), John Wiley & Sohn Ltd, Chichester, UK, Chapt. 2, pp.21-36
BML (Bundesministerium für Landwirtschaft, Ernährung und Forsten � German Ministry for Agriculture, Food
and Forestry) (various issues), Statistisches Jahrbuch über Ernährung, Landwirtschaft und Forsten für die
Bundersrepublik Deutschland, Landwirtschaftsverlag GmbH, Münster-Hiltrup, Germany.
BODUR M. (1994), Foreign market indicators, structural resources and marketing strategies as determinants
of export performance, in Advances in International Marketing � Export Marketing: International
Perspectives, Vol. 6, CAVUSGIL S.T. & AXINN C.N. (eds.), JAI Press Inc., Greenwich, Connecticut &
London, pp.183-205.
BREDAHL M.E., ABBOTT P.C. & REED M.R. (eds.) (1994), Competiveness in International Food Markets,
Westview Press, Boulder, US.
BRESNAHAN T.F & GORDON R.J. (eds.) (1997), The Economics of New Goods, The University of Chicago
Press, Chicago, US.
BURNHAM J.C. & EPPERSON J.E. (1998), 'A Profile of Foreign Direct Investment by the US Fruit and
Vegetable Industry', Agribusiness, Vol. 14, No. 5, pp.379-388.
BVE (Bundesvereinigung der Deutschen Ernährungsindustrie � German Food Industry Association), online,
accessed 01/07/01, URL: http://www.ang-online.de/bvedaten.htm
BYFORD L. & HENNEBERRY D. (1996), 'Export Decisions of Food Processing Companies in Kansas, Missouri,
and Oklahoma', Agribusiness, Vol. 12, No. 3, pp.247-264.

242 REFERENCES
CANALI G. (1996), Evolution of Consumers' Preferences and Innovation: The Case of Italian Foods with
Denominations of Origin, in The Economics of Innovation: The Case of the Food Industry, GALIZZI G. &
VENTURINI L. (eds.), Physica-Verlag, Heidelberg, Germany.
CARAVELI H. & TRAILL W.B. (1998), 'Technological Developments and Economics of Scale in Dairy Industry',
Agribusiness, Vol. 14, No. 4, pp.311-319.
CARTER S. (1997), Global Agricultural Marketing Management, FAO, Rome, Italy.
CATHELAT B. (1990), Socio-Styles-Système, Éditions d'organisation, Paris, France.
CENTNER T.J., TURNER S.C. & BRYAN J.T. (1989), 'Product Differentiation Protection: Developing a Strategy
for Multiple Producers of Regional Speciality Crops', Journal of Food Distribution Research, Vol. 20, No. 2,
pp.10-19.
CHRYSSOCHOIDIS G. (1996), 'Greek Food Manufacturing Exporters: An Exploratory Investigation into Major
Aspects of their Export Strategy', Journal of International Food & Agribusiness Marketing, Vol. 8, No. 2,
pp.23-47.
CONNOR J.M. (1999), 'Breakfast Cereals: The Extreme Food Industry', Agribusiness, Vol. 15, No. 2, pp.247-
259.
CONNOR J.M. & SCHICK W.A. (1997), Food Processing � An Industrial Powerhouse in Transition, second
edition, Wiley-Interscience.
CONNOR J.M. (1994), 'North America as a precursor of changes in Western European food purchasing
patterns', European Review of Agricultural Economics, Vol. 21, No. 2, pp.155-173.
Council for Agricultural Science and Technology (1995), Competitiveness of the U.S. Agriculture and the
Balance of Payments, Task Force Report #125, Washington DC, US.
DALLI D. (1994), The "exporting process": the evolution of small and medium sized companies towards
internationalization, in Advances in International Marketing � Export Marketing: International
Perspectives, Vol. 6, CAVUSGIL S.T. & AXINN C.N. (eds.), JAI Press Inc., Greenwich, Connecticut &
London, pp.85-110.
Deutsche Bundesbank (German Federal Bank) (1995), Devisenkursstatistik � Statistisches Beiheft zum
Monatsbericht 5, Deutsche Bundesbank, Frankfurt, Germany.
DIAMANTOPOULOS A. & SCHLEGELMILCH B.B. (1994), Linking export manpower to export performance: a
canonical regression analysis of European and U.S. data, in Advances in International Marketing � Export
Marketing: International Perspectives, Vol. 6, CAVUSGIL S.T. & AXINN C.N. (eds.), JAI Press Inc.,
Greenwich, Connecticut & London, pp.161-181.
DICKEY D.A & FULLER W.A. (1981), 'The likelihood ratio statistics for autoregressive time series with a unit
root', Econometrica, Vol. 49, pp.1057-72.

REFERENCES 243
DICKINSON G. (2000), 'Risk role grows to enterprise scale', Mastering Management, Supplement of the
Financial Times, Part Seven (November 13), pp.14-15.
DIELMAN T.E. (1989), Pooled Cross-Sectional and Time Series Data Analysis, Marcel Dekker, Inc., New York
and Basel.
DING J.Y. & CASWELL J.A. (1995), 'Changes in Diversification among Very Large Food Manufacturing
Companies in the 1980s', Agribusiness, Vol. 11, No. 6, pp.553-563.
DIXIT A. & STIGLITZ J.E. (1977), 'Monopolistic Competition and Optimum Product Diversity', American
Economic Review, Vol. 67, pp.297-308.
DOLLAR D. & WOLFF E.N. (1993), Competitiveness, Convergence, and International Specialization, MIT
Press, Massachusetts.
DRESCHER K. & MAURER O. (1999), 'Competitiveness in the European Dairy Industries', Agribusiness, Vol.
15, No. 2, pp.163-77.
DUNNING J.H. (1988), 'The Eclectic Paradigm of International Production: A Restatement and Some Possible
Extensions', Journal of International Business Studies, Vol. 19, pp.1-31.
EASTON S.T. (1998), 'Is Tourism Just Another Commodity? Links between Commodity Trade and Tourism',
Journal of Economic Integration, Vol. 13, No. 3, pp.522-543.
ENGLE R.F. & GRANGER C.W. (1987), 'Co-integration and error correction: representation, estimation and
testing', Econometrica, Vol. 55, No. 2, pp.251-276.
ENGLE R.F. & YOO B.S. (1987), 'Forecasting in co-integrated systems', Journal of Econometrics, Vol. 35,
pp.143-59.
ETHIER W.J. (1996), Theories About Trade Liberalisation and Migration: Substitutes or Complements?, in
International Trade and Migration in the APEC Region, LLOYD P.J. & WILLIAMS, L.S. (eds.), Oxford
University Press, Melbourne, Australia.
EUROSTAT (2001), Enterprises in Europe, sixth report, EUROSTAT, Luxembourg.
EUROSTAT (2000), Panorama of European Business, EUROSTAT, Luxembourg.
FAO (Food and Agricultural Organization of the United Nations), Fisheries and food security, online accessed
01/10/99, URL: http://www.fao.org/focus/e/fisheries
FAO (Food and Agricultural Organization of the United Nations), FAOSTAT database, online accessed
01/10/99, URL: http://www.fao.org/databases/fisheries
FAO (Food and Agriculture Organisation of the United Nations) (1996), The Sixth World Food Survey 1996,
FAO, Rome, Italy.
FELLOWS P.(1996), Food Processing Technology � Principles and Practice, Woodhead Publishing Limited,
Cambridge, UK.

244 REFERENCES
FIELD M.K. & PAGOULATOS E. (1996), International Trade, Market Structure, and Cyclical Fluctuations in US
Food Manufacturing, in Industrial Organization and Trade in the Food Industries, SHELDON I. & ABBOTT
P. (eds.), Westview Press, Boulder, US.
Financial Times (September 27 2001), Scoreboard 2001, p.24, see also:
http://surveys.ft.com/scoreboard2001
Financial Times (September 19 2001), Food & Drink Industry, Survey, see also:
http://surveys.ft.com/foodindustry2001
Fortune (various issues), Fortune Global 500.
FORZELY, M. (1994), Winning in Foreign Markets, Crisp Publications, Inc., Menlo Park, US.
FRANK R.H. (1997), Microeconomics and Behavior, McGraw-Hill, Inc., Boston, US.
FULLER W.A. (1976), Introduction to Statistical Time Series, Wiley, New York, US.
GALIZZI G. & VENTURINI L. (1996), Product Innovation in the Food Industry: Nature, Characteristics and
Determinants, in Economics of Innovation: The Case of the Food Industry, GALIZZI G. & VENTURINI L.
(eds.), Physica-Verlag, Heidelberg, Germany.
GEHLHAR M. & COYLE W. (2001), Global Food Consumption and Impact on Trade Patterns, in Changing
Structure of Global Food Consumption and Trade, REGMI A. (ed.), Economic Research Service (ERS), US
Department of Agriculture, Washington DC, pp.4-13.
GIANNAKAS K. & TZOUVELEKAS V. (1998), 'Strategic Behaviour and Competition in Dynamic Industry:
Greek Processed Meat', Agribusiness, Vol. 14, No. 2, pp.157-169.
GIL J.M., GRACIA A. & PÉREZ Y PÉREZ L. (1995), 'Food consumption and economic development in the
European Union', European Review of Agricultural Economics, Vol. 22, No. 2, pp.385-399.
GOLDBERG R.A. (1999), 'Conclusions', in The European Agro-Food System and the Challenge of Global
Competition, IAMA (International Food and Agribusiness Management Association), ismea, Rome,
pp.225-230.
GOPINATH M., PICK D. & VASAVADA (1999), 'The Economics of Foreign Direct Investment and Trade with
an Application to the US Food Processing Industry', American Journal of Agricultural Economics, Vol. 81,
May, pp.442-452.
GOPINATH M., ROE T.L. & SHANE M.D. (1996), 'Competitiveness of US Food Processing: Benefits from
Primary Agriculture', American Journal of Agricultural Economics, Vol. 78, Nov., pp.1044-1055.
GORDON A.D. (1998), Changes in Food and Drink Consumption, and the Implication for Food Marketing, in
The Future of Food � Long-Term Prospects for the Agro-Food Sector, OECD, Paris, France.
GORDON D.V., HANNESSON R. & KERR W.A. (1999), 'What Is a Commodity? An Empirical Definition Using
Time Series Econometrics', Journal of International Food & Agribusiness Marketing, Vol. 10, No. 2, pp.1-
29.

REFERENCES 245
GOULD D.M. (1994), 'Immigrant Links to the Home Country: Empirical Implications for U.S. Bilateral Trade
Flows', Review of Economics and Statistics, Vol. 76, pp.302-16.
GRUNERT K.G., BRUNSØ K. & BREDAHL L. (1998), Food-Related Lifestyles in France and Germany, in New
Developments and Approaches in Consumer Behaviour Research, BALDERJAHN I., MENNICKEN C. &
VERNETTE E. (eds.), Schäffer-Poeschel & Macmillan Press Ltd, Stuttgart & London.
GRUNERT K.G., LARSEN H.H., MADSEN T.K. & BAADSGAARD A. (1996), Market Orientation in Food and
Agriculture, Kluwer Academic Publishers, Boston, US.
GUJARATI D.N. (1995), Basic Econometrics, McGraw-Hill, Inc., New York, US.
HAIR J.F., ANDERSON R.E., TATHAM R.L. & BLACK W.C. (1998), Multivariate Data Analysis � Fifth Edition,
Prentice-Hall International, Inc., London, UK.
HARRIS S. (1994), The Food Industry Perspective, in Agriculture in the Uruguay Round, INGERSENT K.A.,
RAYNER A.J. & HINE R.C. (eds.), St. Martin's Press, Inc., New York, US.
HARTMANN M. (1993), 'Überlegungen zur Wettbewerbsfähigkeit des deutschen Ernährungsgewerbes',
Agrarwirtschaft, Vol. 6, pp.237-247.
HELPMAN E. & KRUGMAN P.R. (1985), Market Structure and Foreign Trade � Increasing Returns, Imperfect
Competition, and the International Economy, MIT Press, Cambrige, Massachusetts, US.
HENDERSON D.R. & HANDY C.R. (1994), International Dimensions of Food Marketing System, in Food and
Agricultural Markets: The Quiet Revolution, SCHERTZ L. & DAFT L. (eds.), National Planning Association,
Washington DC, US.
HENDERSON D.R. (1998), Between the Farm Gate and the Dinner Plate: Motivations for Industrial Change in
the Processed Food Sector, in The Future of Food � Long-Term Prospects for the Agro-Food Sector,
OECD, Paris, France.
HENDERSON D.R., HANDY C.R. & NEFF S.A. (1996a), Globalization of the Processed Food Market,
Agricultural Economic Report #742, US Department of Agriculture, Washington DC, US.
HENDERSON D.R., VÖRÖS P.R. & HIRSCHBERG J.G. (1996b), Industrial Determinants of International Trade
and Foreign Investment by Food and Beverage Manufacturing Companies, in Industrial Organization and
Trade in the Food Industries, SHELDON I. & ABBOTT P. (eds.), Westview Press, Boulder, US.
HENSON S.J. & LOADER R.J. (1991), The implication of the single market for European food consumption
and diets, in Food Marketing and Food Industries in the Single European Market, BUCHHOLZ H.E. &
WENDT H. (eds.), Proceedings of the 25th EAAE Seminar, Braunschweig, Germany, pp.267-282.
HERRMANN R. & RÖDER C. (1995), 'Does food consumption converge internationally? Measurement,
empirical tests and determinants', European Review of Agricultural Economics, Vol. 22, pp.400-414.
HERRMANN R. (1997), 'Reagieren die Nachfrager von Nahrungsmitteln in Industrieländern wirklich
preisunelastisch?', Agrarwirtschaft, Vol. 46, No. 11 (November), pp.369-371.

246 REFERENCES
HERRMANN R. (1994), 'Gleicht sich der Nahrungsmittelverbrauch international an? Ein Meßkonzept und
empirische Ergebnisse für ausgewählte OECD-Länder', Jahrbuch der Absatz- und Verbrauchsforschung,
Vol. 40, No. 4, pp.371-390.
HERTEL T.W. (ed.) (1996), Global Trade Analysis: Modeling and Applications, Cambridge University Press,
New York.
HIRSCHBERG J.G. & DAYTON J.R. (1996), Detailed Pattern of Intra-Industry Trade in Processed Food, in
Industrial Organization and Trade in the Food Industries, SHELDON I.M & ABBOTT P.C. (eds.), Westview
Press, Boulder, US.
HIRSCHBERG J.G., SHELDON I.M. & DAYTON J.R. (1994), 'An Analysis of Bilateral Intra-Industry Trade in
the Food Processing Sector', Applied Economics, Vol. 26, pp.159-167.
HOFSTEDE G. (1991), Cultures and Organizations: Software of the Mind, McGraw Hill, Inc., London, UK.
HOOKER N.H., & CASWELL J.A. (1996), 'Trends in Food Quality Regulation: Implication for Processed Food
Trade and Foreign Direct Investment', Agribusiness, Vol. 12, No. 5, pp.411-419.
HUFBAUER G.C. & ELLIOT K.A. (1994), Measuring the Costs of Protection in the United States, Institute for
International Economics, Washington DC, US.
HUGHES K., KENNEDY P.& ORTEGO A. (1999), 'Developing Agribusiness Competitiveness in Global Markets:
A Survey of Louisiana Agribusiness Companies', Journal of International Food & Agribusiness Marketing,
Vol. 10, No. 2, pp.49-63.
IMF (International Monetary Fund) (various issues), International Financial Statistics Yearbook, IMF,
Washington DC, US.
ITKONEN L. (1999), 'Do Finnish specialties appeal to the American palate?', UH � Magazine of the University
of Helsinki, Vol. 2, pp.16-17.
JAFFEE S. & GORDON P.(1993), Exporting High-Value Food Commodities � Success Stories from Developing
Countries, World Bank Discussion Paper #198, The World Bank, Washington DC, US.
JONES E. (1997), 'Consumer Demand for Carbohydrates: A Look Across Products and Income Classes',
Agribusiness, Vol. 13, No. 6, pp.599-612.
JONES G. & MORGAN N.J. (ed.) (1994), Adding Value: Brands and Marketing in Food and Drink, Routledge,
London & New York.
KANTOR L.S. & MALANOSKI M. (1997), 'Imports Play a Growing Role in the America Diet', Food Review,
September-December, USDA (US Department of Agriculture), Washington DC, pp.13-17.
KANTOR L.S., LIPTON K., MANCHESTER A. & OLIVEIRA V. (1997), 'Estimating and Addressing America's
Food Losses', Food Review, January-April, USDA (US Department of Agriculture), Washington DC, pp.2-
12.

REFERENCES 247
KEEGAN, W.J. (1995), Global Marketing Management, Prentice-Hall International, Inc., Englewood Cliffs,
New Jersey, US.
KEMP M.C. (1990), The Benefits and Costs of Private Investment from Abroad: Comment, in International
Investment, BUCKLEY P.J. (ed.), Edward Elgar Publishing Limited, Brookfield, UK.
KENNEDY P.L., HARRISON R.W., KALAITZANDONAKES N.G. & RINDFUSS R.P.(1997), 'Perspectives on
Evaluating Competitiveness in Agribusiness Industries', Agribusiness, Vol. 13, No. 4, pp.385-392.
KIM D. & MARION B.W. (1995), Domestic Market Structure and Performance in Global Markets: Theory and
Empirical Evidence from US Food Manufacturing Industries, in Food System Organization, Performance
and Public Policies, Report WP109, October, Department of Agricultural Economics, University of
Wisconsin-Madison, US.
KÖHLER S. (1994), 'Kulturelle Vielfalt in der Ernährung � Die zunehmende Bedeutung ausländischer Kost in
der BR Deutschland', Agrarwirtschaft, Vol. 42, No. 8/9, pp.328-336.
KOHLS R.L. & Uhl J. N. (1998), Marketing of Agricultural Products, eighth edition, Prentice-Hall, Inc., Upper
Saddle River, New Jersey, US.
KRAUSE J.H., WILSON W.W. & DOOLEY F.J. (1995), 'Global Market Segmentation for Value-Added
Agricultural Products', Agribusiness, Vol. 11, No. 3, pp.195-206.
KRUGMAN P.R. & OBSTFELD M. (1997), International Economics � Theory and Policy, Addison-Wesley
Longman, Inc., Reading, Massachusetts, US.
KRUGMAN P.R. (1994), Rethinking International Trade, MIT Press, Cambridge, Massachusetts, US.
KRUGMAN P.R. (1991), Geography and Trade, MIT Press, Cambridge, Massachusetts, US.
KUMAR B.N. & EPPLE P.(1997), Exporte, Kooperationen und Auslandsgesellschaften als Stationen des
Lernens im Internationalisierungsprozeß, in Handbuch Internationales Management: Grundlagen �
Instrumente � Perspektiven, MACHARZINA K. & OESTERLE M.-J. (eds.), Gabler Verlag, Wiesbaden,
Germany.
LAAJIMI A., GRACIA A. & ALBISU L.M. (1997), 'The Demand for Food in Spain: Economic and Demographic
Effects', Journal of International Food & Agribusiness Marketing, Vol. 9, No. 2, pp.1-17.
LANCASTER K. (1991), Modern Consumer Theory, Edward Elgar Publishing Ltd, Hants, UK & Vermont, US.
LANCASTER K. (1979), Variety, Equity, and Efficiency, Colombia University Press, New York, US.
LANCLOS D.K., HERTEL T.W. & DEVADOSS S. (1996), 'Assessing the Effects of Tariff Reform on US Food
Manufacturing Industries: The Role of Imperfect Competition and Intermediate Inputs', Agricultural
Economics, Vol. 14, pp.201-212.
LANCLOS K. & HERTEL T.W. (1995), 'Endogenous Product Differentiation and Trade Policy: Implications for
the US Food Industry', American Journal of Agricultural Economics, Vol. 77, pp.591-601.

248 REFERENCES
LARSEN R.B. (1998), 'Regionality of Food Consumption', Agribusiness, Vol. 14, No. 3, pp.213-226.
LESSER D., HUGHES D. & MARSHALL D. (1986), Researching The Food Consumer � Techniques and
Practice in the UK and North America, in The Food Consumer, RITSON C., GOFTON L. & MCKENZIE J.
(eds.), John Wiley & Sons Ltd, Chichester, UK, Chapt. 9, pp.171-195.
LINDER S.B. (1961), An Essay on Trade and Transformation, Almqvist & Wiksell, Stockholm, Sweden.
LINDERT P.H. & PUGEL T.A. (1996), International Economics � Tenth Edition, Erwin, Chicago, US.
LLOYD P.J. & WILLIAMS L.S. (eds.) (1996), International trade and migration in the APEC region, Oxford
University Press, Melbourne, Australia.
LOHR L. (2001), Factors Affecting International Demand And Trade in Organic Food Product, in Changing
Structure of Global Food Consumption and Trade, REGMI A. (ed.), Economic Research Service (ERS), US
Department of Agriculture, Washington DC, pp.67-79.
MACHARZINA K. & OESTERLE M.-J. (eds.) (1997), Handbuch Internationales Management: Grundlagen �
Instrumente � Perspektiven, Gabler Verlag, Wiesbaden, Germany.
MACLAREN D. (1998), Some Issues in the Economic Analysis of Technical Barriers to International Trade in
Agri-Food Products, Research Paper #663, Department of Economics, The University of Melbourne,
Australia.
MARKUSEN J., MELVIN J., KAEMPFER W. & MASKUS K. (1995), International trade: theory and evidence,
McGraw Hills, Inc., Singapore.
MARKUSEN J.R. (1995), 'The Boundaries of Multinational Enterprises and the Theory of International Trade',
Journal of Economic Perspectives, Vol. 9, No. 2 (Spring), pp.169-89.
MASTERS T. (1995), Neural, novel & hybrid algorithmus for time series prediction, John Wiley & Son, Inc.,
US.
MATTHEWS A. (1994), 'Trade Reform and the Prospects for Processed Food Exports from Developing
Countries', Journal of Agricultural Economics, Vol. 45, No. 2, pp.177-188.
MAURER O. (1996), 'European Integration and Internationalisation Strategies of Food Companies � A
Survey of Entry Strategies into the German Food Industry', Journal of International Food & Agribusiness
Marketing, Vol. 8, No. 2, pp.83-99.
MCCUE, S. (1998), Trade secrets: the export answer book for small- and medium-sized exporters, Michigan
Small Business Development Center, Wayne State University, Detroit, US.
MEADE B. & ROSEN S. (1996), 'Income and Diet Differences Greatly Affect Food Spending Around the
Globe', Food Review, Sept.-Dec., USDA (US Department of Agriculture), Washington DC, pp.39-44.
MILLER S. (1990), How to get the most out of trade shows, NTC Business Books, Lincolnwood, Illinois, US.

REFERENCES 249
MUELLER-STEWENS G. & LECHNER C. (1997), Unternehmesindividuelle und gastlandbezogene
Einflussfaktoren der Markteintrittsform, in Handbuch Internationales Management: Grundlagen �
Instrumente � Perspektiven, MACHARZINA K. & OESTERLE M.-J. (eds.), Gabler Verlag, Wiesbaden,
Germany.
MURCOTT A. (1986), You Are What You Eat: Anthropological Factors Influencing Food Choice, in The Food
Consumer, RITSON C., GOFTEN L. & MCKENZIE J. (eds.), John Wiley & Sohn Ltd, Chichester, UK, Chapt.
6, pp.107-125.
NEFF S.A. & MALANOSKI M.A. (1996), 'Trade Reforms Increase Likelihood of Challenges to Food Standards',
Food Review, May-August, pp.18-22, USDA (US Department of Agriculture), Washington DC.
NING Y. & REED M.R. (1995), 'Locational Determinants of the US Direct Foreign Investment in Food and
Kindred Products', Agribusiness, Vol. 11, No. 1, pp.77-85.
O'CONNELL J (ed.) (1999), The Blackwell encyclopaedic dictionnary of international management, Blackwell
Publishers Ltd, Oxford, UK.
OECD (Organisation for Economic Co-operation and Development), Trends in International Migration, several
editions, OECD, Paris, France.
OECD (Organisation for Economic Co-operation and Development) (1999), OECD Agricultural Outlook 1999-
2004, OECD, Paris, France.
OECD (Organisation for Economic Co-operation and Development) (1997), The Uruguay Round Agreement
on Agriculture and Processed Agricultural Products, OECD, Paris, France.
OECD (Organisation for Economic Co-operation and Development) (1996), Export Fruit Boom from the
South: A Threat for the North?, OECD, Paris, France.
OLLILA P.(1995), 'Aspects of Market Entry of the Finnish Food Industry into the German and Dutch Markets',
Journal of International Food & Agribusiness Marketing, Vol. 7, No. 7, pp.25-52.
PADBERG D.I. (1997), The Global Context of Agro-food Marketing, in Agro-Food Marketing, PADBERG, D.I.,
RITSON, C. & ALBISU, L.M. (eds.), CAB International, New York, pp.1-9.
PAWSEY R.K. (1995), 'Preventing losses and preserving quality in food cargoes', Food, Nutrition and
Agriculture, #15 � Food safety and trade, FAO, Rome, pp.7-14.
PEPELS, W. (1997), Aussenhandel, Cornelsen, Berlin, Germany.
PIERI R., RAMA D. & VENTURINI L. (1997), 'Intra-Industry trade in the European Dairy Industy', European
Review of Agricultural Economics, Vol. 24, pp.411-425.
PIERSON T.R. & ALLEN J.W. (1994), Innovation, Entrepreneurship, and Non-Price Factors: Implications for
Competitiveness in International Trade, in Competitiveness in International Food Markets, BREDAHL M.E.,
ABBOTT P.C. & REED M.R. (eds.), Westview Press, Boulder, US.

250 REFERENCES
PINARD J. (1995), The Development of Cheese Consumption in France in the past 150 Years, in Food
Technology, Science and Marketing � European Diet in the Twentieth Century, DEN HARTOG A.P. (ed.),
Tuckwell Press, East Linton, Scotland, UK.
PINDYCK R.S. & RUBINFELD D.L. (1995), Microeconomics, Prentice-Hall International, Inc., London, UK.
POOLE N.D. (1997), 'Change in the European Food Industry: A Research Agenda for Marketing Economists',
Journal of International Food & Agribusiness Marketing, Vol. 9, No. 1, pp.1-17.
PORTER M.E. (1998), The Competitive Advantage of Nations � With a New Introduction, Macmillan Press
LTD, London, UK.
PRATTEN C. (1991), The competitiveness of small firms, Cambridge University Press, Cambridge, UK.
QUELCH J. & KLEIN L. (1998), The Internet and International Marketing, in International and Global
Marketing � Concepts and Cases, MELOAN T.W. & GRAHAM J. (eds.), Irwin / McGraw-Hill, Boston,
pp.229-248.
RAMA R. (1998), 'Growth in Food and Drink Multinationals, 1977-94: An Empirical Investigation', Journal of
International Food & Agribusiness Marketing, Vol. 10, No. 1, pp.31-51.
RAMA R. (1996), 'Empirical Study on Sources of Innovation in International Food and Beverage Industry',
Agribusiness, Vol. 12, No. 2, pp.123-134.
RAUPP (1997), Managementbezogene und organisatorische Anforderungen der Exportstrategie, in Handbuch
Internationales Management: Grundlagen � Instrumente � Perspektiven, MACHARZINA K. & OESTERLE
M.-J. (eds.), Gabler Verlag, Wiesbaden, Germany.
REED M.R. & NING Y. (1996), Foreign Investment Strategies of US Multinational Food Companies, in
Industrial Organization and Trade in the Food Industries, SHELDON I.M. & ABBOTT P.C. (eds.), Westview
Press, Boulder, US.
REED M.R. (1994), Importance of Non-price Factors to Competitiveness in International Food Trade, in
Competitiveness in International Food Markets, BREDAHL M.E., ABBOTT P.C. & REED M.R. (eds.),
Westview Press, Boulder, US.
RICHARDS T.J., GAO X.M. & PATTERSON P.M. (1998), 'The Demand for Value-Added and Convenience: A
Household Production Approach', Agribusiness, Vol. 14, No. 5, pp.363-378.
RIRDC (Rural Industries Research and Development Corporation) (1994), Air Freight Economics of
Perishable Goods � An Analysis of Opportunities for Value Improvement, Research Paper #94/2, National
Capital Printing, Canberra, Australia.
RITSON C. & HUTCHINS R. (1991), The consumption revolution, in Fifty Years of National Food Survey
1940-1990, SLATER J.M. (ed.), Ministry of Agriculture, Fisheries and Food, HMSO, London, UK.
RITSON C., GOFTON L. & MCKENZIE J. (eds.) (1986), The Food Consumer, John Wiley & Sons Ltd,
Chichester, UK.

REFERENCES 251
ROD T. & WEBSTER E. (1995), Immigration and Trade with East Asia in the Food Industry � The
Contribution of Immigrants, Bureau of Immigration, Multicultural and Population Research, Canberra,
Australia.
ROZIN P., PELCHAT M.L. & FALLON A.E. (1986), Psychological Factors Influencing Food Choice, in The Food
Consumer, RITSON C., GOFTON L. & MCKENZIE J. (eds.), John Wiley & Sons Ltd, Chichester, UK, Chapt.
5, pp.85-106.
RUFFIEUX B. & VALCESCHINI E. (1994), 'Biens d'orgine et compétence des consommateurs: les enjeux de la
normalisation dans l'agro-alimentaire', Revue d'économie industrielle, Vol. 75, 1er trimestre, pp.133-146.
RUSSELL S.S. & TEITELBAUM M.S. (1992), International Migration and International Trade, World Bank
Discussion Paper #160, The World Bank, Washington DC, US.
SAZANAMI Y., URATA S. & KAWAI H. (1995), Measuring the Costs of Protection in Japan, Institute for
International Economics, Washington DC, US.
SCHAFFNER D.J., SCHRODER W.R. & EARLE M.D. (1998), Food Marketing � An International Perspective,
McGraw-Hill, Inc., Boston, US.
SCHMITZ P.M. (1996), Agrarstandort Europa im internationalen Vergleich, in Schriften der Gesellschaft für
Wirtschafts- und Sozialwissenschaften des Landbaues e.V., Bd. 32, pp.11-23, GeWiSoLa, Frankfurt,
Germany.
SCHOLLIERS P.(1995), From Elite Consumption to Mass Consumption. The Case of Chocolate in Belgium, in
Food Technology, Science and Marketing � European Diet in the Twentieth Century, DEN HARTOG A.P.
(ed.), Tuckwell Press, East Lothian, Scotland, UK, pp.127-138.
SCHUSTER C. & COPELAND M (1996), Global Business � Planning for Sales and Negotiations, The Dyden
Press, Orlando, Florida, US.
SEBENIUS J. & LAX D. (2000), 'Interests, value and the art of the best deal', Mastering Management,
Supplement of the Financial Times, Part 1 (October 2), pp.6-7.
SELEVANATHAN E.A. & CLEMENTS K.W. (1995), Recent Developments in Applied Demand Analysis �
Alcohol, Advertising and Global Consumption, Springer Verlag, Berlin, Germany.
SENAUER B., ASP E. & KINSEY J. (1991), Food Trends and the Changing Consumer, Eagan Press, St. Paul,
MN, US.
SHELDON I.M. & ABBOTT P.C. (1996), Introduction, in Industrial Organization and Trade in the Food
Industries, SHELDON I.M. & ABBOTT P.C. (eds.), Westview Press, Boulder, US.
SHONKWILER J.S., LEE J. & TAYLOR T.G. (1987), 'An empirical model of the demand for a varied diet',
Applied Economics, Vol. 19, pp.1403-1410.
SINGH S. (1996), 'International Marketing of Agro-Food Products by Developing Country Companies: Some
Conceptual Issues', Agribusiness, Vol. 12, No. 1, pp.99-103.

252 REFERENCES
SKAGGS R., FALK C., ALMONTE J. & CÁRDENAS M. (1996), 'Product-Country Images and International Food
Marketing: Relationships and Research Needs', Agribusiness, Vol. 12, No. 6, pp.593-600.
SPSS (1999), SPSS Syntax Reference Guide for SPSS Base, SPSS Regression Models, SPSS Advanced
Models, SPSS Inc., US.
STANLEY J., INGRAM D. & CHITTICK G. (1990), The Relationship between International Trade and Linguistic
Competence, Australian Government Publishing Service, Canberra, Australia.
Statistisches Bundesamt (German Bureau of Statistics) (1997), Fachserie 1, Reihe 2, Wiesbaden, Germany.
Statistisches Bundesamt (German Bureau of Statistics) (1996), Fachserie 17, Reihe 8, Wiesbaden, Germany.
Statistisches Bundesamt (German Bureau of Statistics) (various issues), Fachserie 4.3, Kostenstrukturen im
Bergbau und verarbeitenden Gewerbe, Wiesbaden, Germany.
Stifterverband Wissenschaftsstatistik (2000), Forschung und Entwicklung in der Wirtschaft, Essen, Germany.
STIGLER G.J. & BECKER G.S. (1997, 1969), 'De Gustibus Non Est Disputandum', American Economic
Review, Vol. 67, No. 2, pp.76-90, republished in Accounting for Tastes, Becker G.S. (ed.), Harvard
University Press, Cambridge & London.
STYLES C. & AMBLER T. (1997), First steps to export success � What makes some exporters more
successful than others?, Australian Trade Commission & British Overseas Trade Board Secretariat,
Sydney & London.
SUTTON J. (1991), Sunk Cost and Market Structure, MIT Press, Cambrige, Massachusetts, US.
TANGERMANN S. (1986), Economic Factors Influencing Food Choice, in The Food Consumer, RITSON C.,
GOFTON L. & MCKENZIE J. (eds.), John Wiley & Sons, Chichester, UK, Chapt. 4, pp.61-83.
The Economist (September 29 2001), 'Globalisation and its critics � A survey of globalisation', Survey.
The Economist (April 15 2000), 'Unilever � Fat and thin', pp.67-68.
The Economist (September 11 1999), 'Functional foods � Dysfunctional', pp.75-76.
The Economist (September 25 1999), 'Too many or too few' & 'Unshapely world, too old or too young',
pp.17 & 60.
THEIL H. & FINKE R. (1983), 'The Consumer's Demand for Diversity', European Economic Review, Vol. 23,
pp.395-400.
THOMAS R.L. (1993), Introductory Econometrics: Theory and Applications � Second Edition, Longman,
London and New York.
THOMPSON S.J. & COWAN J.F. (1995), Durable Food Production and Consumption in the World-Economy, in
Food and Agrarian Orders in the World-Economy, MCMICHAEL P. (ed.), Praeger, Westport & London,
pp.35-52.

REFERENCES 253
TOUMANOFF P.& FARROKH N. (1994), A mathematical approach to economic analysis, West Publishing
Company, St. Paul, MN, US.
TRAILL B. & GILPIN J. (1998), 'Changes in Size Distribution of EU Food and Drink Manufacturer: 1980 to
1992', Agribusiness, Vol. 14, No. 4, pp.321-329.
TRAILL B. (1996), Price and Non-Price Competition and Market Structure in the Single European Market, in
Economics of Innovation: The Case of the Food Industry, GALIZZI G. & VENTURINI L. (eds.), Physica-
Verlag, Heidelberg, Germany.
TRAILL B. (1997), 'Globalisation in the food industries?', European Review of Agricultural Economics, Vol. 24,
pp.390-410.
TRAILL B. & DA SILVA J.G. (1994), Trade, Foreign Investment and Competitiveness in the European Food
Industries, in Structural Change in the European Food Industries, European Union Agriculture and Agro-
industrial Research Programme, Discussion Paper #1, September.
TYERS R. & ANDERSON K. (1992), Disarray in world food markets: a quantitative assessment, Cambridge
University Press, Hong Kong.
ULLMER E. & BÖTTGER C. (1995), Verkehrslehre des Aussenhandels, Feldhaus, Hamburg, Germany.
UNCTAD (United Nations Conference on Trade and Development) (2000), World Investment Report 2000 �
Cross-border Mergers and Acquisitions and Development, United Nations, New York and Geneva.
UNCTAD (United Nations Conference on Trade and Development) (1999), World Investment Report 1999 �
Foreign Direct Investment and the Challenge of Development, United Nations, New York and Geneva.
UNCTAD (United Nations Conference on Trade and Development) (1997), World Investment Report,
UNCTAD, Geneva, Switzerland.
United Nations (1998), Demographic Yearbook 1996, United Nations, New York, US.
United Nations (1997), 1996 International Trade Statistics Yearbook, Volume I � Trade by Country, United
Nations, New York, US.
United Nations (1990), Statistical Papers, Commodity Trade Statistics, According to Standard International
Trade Classification, Series D, Statistical Office, Department of Economic and Social Affairs, New York,
US.
US Census Bureau (2001), Annual Survey of Manufactures, US Census Bureau, Washington DC, US.
VAN DUREN E., MARTIN L. & WESTGREN R. (1994), A Framework for Assessing National Competitiveness
and the Role of Private Strategy and Public Policy, in Competitiveness in International Food Markets,
BREDAHL M.E., ABBOTT P.C. & REED M.R. (eds.), Westview Press, Boulder, US.
VIATTE G. (Director for Food, Agriculture & Fisheries, OECD, Paris) (1997), 'The Changing Role of the Food
Industry: Greater Prosperity through Global Markets', online accessed 01/07/99, URL:
http://www.oecd.org//agr/News

254 REFERENCES
VLACHVEI A. & OUSTAPASSIDIS K. (1998), 'Advertising, concentration and profitability in Greek food
manufacturing industries', Agricultural Economics, Vol. 18, pp.191-198.
VON ALVENSLEBEN R. (1997), Consumer Behaviour, in Agro-Food Marketing, PADBERG D.I., RITSON C. &
ALBISU L.M. (eds.), CAB International, New York, US.
VON ALVENSLEBEN R. (1989), Sozialwissenschaftliche Methoden der Agrarmarktforschung, in Neuere
Forschungskonzepte und -methoden in den Wirtschafts- und Sozialwissenschaften des Landbaus,
Schriften der Gesellschaft für Wirtschafts- und Sozialwissenschaften des Landbaus e.V., Band 25,
Landwirtschaftsverlag, Münster-Hiltrup, Germany.
VOUSDEN N. (1990), The Economics of Trade Protection, Cambridge University Press, Cambridge, US.
WICKENS M.R. & BREUSCH T.S. (1988), 'Dynamic specification, the long run and the estimation of
transformed regression models', Economic Journal, Vol. 98, supplement, pp.189-205.
Wirtschaftswoche (1997), '"Konsum is lokal" � Interview with Morris TABAKSBLAT, Chairman of Unilever',
Wirtschaftswoche, Vol. 10, February 27, pp.130-132.
WOELFLIN R. (1997), 'Fruchthandel: Kein Vertrag ohne AGB', Dynamik im Handel, Vol. 5, pp.66-67,
Germany.
WOOD A. & BERGE K. (1997), 'Exporting Manufactures: Human Resources, Natural Resources and Trade
Policy', The Journal of Development Studies, Vol. 34, No. 1, pp.35-59.
World Travel Organisation (various issues), World Travel Statistics, Geneva, Switzerland.
WORLEY C.T., FOLWELL R.J., MCCRACKEN V.A. & BAGNARA G.L. (1995), 'Food Label Regulations in the
United States and European Community: International Trade Facilitators or Non Tariff Barriers', Journal of
International Food & Agribusiness Marketing, Vol. 7, No. 2, pp.91-103.
WTO (World Trade Organisation) (1998), Globalization and Trade, in Annual Report 1998, WTO, Geneva,
Switzerland.
WU Q. & BJORNSON B (1996), 'Value of Advertising by Food Manufacturers as Investment in Intangible
Capital', Agribusiness, Vol. 12, No. 2, pp.147-156.
YON B. & BERNAUD S. (1993), Agricultural Marketing in France, in Food and Agribusiness Marketing in
Europe, MEULENBERG M. (ed.), International Business Press, New York, US.
YOUNG T. & BURTON M. (1997), Supply and Demand of Agricultural Products, in Agro-Food Marketing,
PADBERG D.I., RITSON C. & ALBISU L.M. (eds.), CAB International, New York, US.

LIST OF TABLES AND FIGURES 255
LIST OF TABLES AND FIGURES
Tables
(1) 3-Digit Standard International Trade Classification (SITC), Revision 2 for foods _________________ 9
(2) Major food suppliers by processing stage (% share of exports) _____________________________ 13
(3) World's leading food exporters and food trade balance in some selected countries, 1996_________ 15
(4) Food trade structure of selected countries in 1996 _______________________________________ 17
(5) Food trade structure of selected countries in 1996 _______________________________________ 18
(6) World fresh fish exports 1976 and 1996, in US$ million ___________________________________ 21
(7) Value of world trade in food products, 1980-95 _________________________________________ 22
(8) EU intra-industry trade in food and beverages, 1980/92 (Grubel-Lloyd Index) _________________ 24
(9) EU intra- industry trade in dairy products, 1992 (Grubel-Lloyd Index) _______________________ 25
(10) US intra-industry trade with others, 1994 (Grubel-Lloyd Index) ____________________________ 25
(11) World prices and trade volume by 2005 (% change) _____________________________________ 26
(12) Trade & foreign production of processed foods, US$ billion, annual average 1988-91____________ 27
(13) Food industry FDI outward stock, and shares in total FDI stock, 1988 and 1997 (values in US$ million and shares in %) _______________________________________________ 28
(14) Food industry FDI inward stock and inflows, and shares in total FDI, for selected regions 1988 and 1997 (values in US$ million and shares in %) __________________________________________ 28
(15) The world�s top transnational food and drink corporations, ranked by foreign assets, 1998 (US$ billion and number of employees) _______________________________________________ 29
(16) Estimated tobit parameters for determinants of global intra-food industry trade________________ 42
(17) Food export structure of selected Asian countries (incl. Turkey) in 1995______________________ 69
(18) Regression estimates of an error-correction model for aggregate German food imports from selected Asian countries, 1967-90, purely economic specification ___________________________ 76
(19) Regression estimates of an error-correction model for aggregate German food imports from selected Asian countries, 1967-90, tourism & immigration specification ______________________ 76
(20) Regression estimates of an error-correction model for German imports of drink & processing wine from Italy and France, 1967-90, purely economic specification _____________________________ 77
(21) Regression estimates of an error-correction model for German imports of drink & processing wine from Italy and France, 1967-90, tourism & immigration specification________________________ 77
(22) Regression estimates of an error-correction model for German imports of cheese and processed vegetables from France and Italy, 1967-90, purely economic specification ___________ 78
(23) Regression estimates of an error-correction model for German imports of cheese and processed vegetables from France and Italy, 1967-90, tourism & immigration specification_______ 78
(24) Economic structure of EU food, drink and tobacco sector, 1996____________________________ 100
(25) Economic structure of US food processing industries, 1997 _______________________________ 101
(26) Economic structure of the German food processing industry, 1998 _________________________ 103
(27) Economic structure of the Australian food processing industry, 1998/99_____________________ 104
(28) Components of US food processing growth (%), 1959-91 ________________________________ 106

256 LIST OF TABLES AND FIGURES
(29) Potential no. of companies and four-company sales concentration ratios by country and product group, in food processing industries, mid 1980s ______________________________ 109
(30) Payroll costs (wages & salaries) of food/drink manufacturing companies as % of industry turnover as compared to all manufacturing averages____________________________________________ 110
(31) Composition of labour force in EU food, beverages and tobacco industries, 1999 (%) ___________ 111
(32) Profits in food and beverages industries as compared to all industries' total, 10 years' averages (1989-99) from Fortune Global 500 companies _________________________________________ 111
(33) R&D spending of top companies in different industries, 2000 ______________________________ 113
(34) R&D and marketing spending of the German food processing industry, 1995-1999 _____________ 113
(35) Input intensity and competitive performance, leading US food manufacturers, 1995/96 _________ 114
(36) Average values for country groups based on the sample of 50 world leading food manufacturing companies, 1999 ________________________________________________ 116
(37) World leading food and drink processing/manufacturing companies, 1999____________________ 117
(38) Export ratios (foreign earnings as % of total turnover) of different food processing industries in Germany, 1967 to 1999 _________________________________________________________ 119
(39) Food consumer segments in three European countries ___________________________________ 128
(40) Income and price elasticities of demand for food and beverages in 18 OECD countries __________ 130
(41) Expenditure on food, cost per calorie, and average calorie consumption in 24 countries _________ 132
(42) How product determinants affect international food and drink product trade __________________ 159
(43) International commerce terms 1990 _________________________________________________ 169
(44) A list of basic documents used in export trade__________________________________________ 170
(45) Industry sizes, companies contacted and questionnaires returned in both surveys _____________ 176
(46) Tests for group differences in 2- or k-independent samples depending on data quality __________ 180
(47) Survey results � general questions about the company __________________________________ 192
(48) Mean turnover (without taxes, in DM'000) per employee _________________________________ 194
(49) Various measures of export performance______________________________________________ 196
(50) Mean ratios indicating the speed of foreign market entering for German and Australian business classes ______________________________________________ 197
(51) Survey results � foreign business performance of sample companies _______________________ 198
(52) Mean ratios indicating the relative number of staff employed for the same degrees of foreign business activities in German and Australian business classes _______________________ 200
(53) Survey results � foreign business qualification of sample companies________________________ 201
(54) Mean index values indicating the degree of trade fair participation of German and Australian food product manufacturers and traders______________________________________ 206
(55) Survey results � trade fair activities of sample companies________________________________ 207
(56) Survey results � food product related questions (logistics and marketing problems) ___________ 210
(57) Product losses (in %) occurring in international business transactions for different product categories _____________________________________________________ 213
(58) Seasonal influence (index values) in the main product category of German and Australian sample companies_____________________________________________ 214

LIST OF TABLES AND FIGURES 257
(59) Survey results � questions related to trade and payment terms___________________________ 217
(60) Survey results � provision of information in sample companies ___________________________ 218
(61) Survey results � questions related to government assistance for sample companies ___________ 222
(62) Survey results � overall comparative assessment given by sample companies _______________ 224
(63) Factor analysis results for all sample companies and subgroups ___________________________ 226
(64) Cluster structure and labels________________________________________________________ 230
(65) Discriminant analysis results for all sample companies (n=132) ___________________________ 231
(66) Discriminant analysis results for all German companies (n=68)____________________________ 232
(67) Discriminant analysis results for all Australian companies (n=64) __________________________ 233
Figures
(1) Composition of world agricultural trade (value), 1980-97 _________________________________ 12
(2) Food imports and exports of the OECD countries, US$ million, 1980-82 & 90-92 _______________ 14
(3) Export diversity structure of world leading exporters of food products, 1996 __________________ 20
(4) Imports of foods (basic and processed) of OECD countries, 1980-82 and 1990-92______________ 23
(5) Exports of foods (basic and processed) of OECD countries, 1980-82 and 1990-92 ______________ 23
(6) Heckscher-Ohlin approach to explain the Netherlands' strength in exporting pork ______________ 37
(7) An integrated model of international trade _____________________________________________ 40
(8) Determinants of national competitive advantages _______________________________________ 47
(9) Trade based on differences in tastes within the Heckscher-Ohlin framework___________________ 51
(10) Trade based on non-homogeneous tastes within the Heckscher-Ohlin framework_______________ 53
(11) Immigrant shares in OECD countries 1986/99, and growth in world tourism activity from 1950 to 2000______________________________________ 54
(12) The two effects of immigration on food product imports___________________________________ 58
(13) Immigration to Germany and foreign travel of Germans by selected countries, 1967-90 _________ 68
(14) Real German per capita imports from selected countries and of selected food products, 1967-90 __ 71
(15) Financial data (per capita GDP, food imports price index and exchange rates) for Germany, 1967-90_____________________________________________________________ 72
(16) Filtered TFP growth rates in US food processing, 1959-1991 ______________________________ 106
(17) A model of export complexity (home market transactions versus exports) ___________________ 156
(18) Foreign uncontrollable factors in the international business environment ____________________ 158
(19) Foreign market entry/serving strategies ______________________________________________ 160
(20) Categories of business management problems _________________________________________ 163
(21) The three foreign business success company clusters in the four-dimensional success space_____ 230
