identifying cost-effective hotspots for restoring natural capital and enhancing landscape...
TRANSCRIPT

Ecological Economics 69 (2010) 1031–1042
Contents lists available at ScienceDirect
Ecological Economics
j ourna l homepage: www.e lsev ie r.com/ locate /eco lecon
Analysis
Reconfiguring an irrigation landscape to improve provision of ecosystem services
Neville D. Crossman a,⁎, Jeffrey D. Connor a, Brett A. Bryan a, David M. Summers a, John Ginnivan b
a Policy and Economic Research Unit, CSIRO Sustainable Ecosystems, Urrbrae, SA, Australiab Goulburn Murray Water, Tatura, Victoria, Australia
⁎ Corresponding author.E-mail address: [email protected] (N.D. Cro
0921-8009/$ – see front matter. Crown Copyright © 20doi:10.1016/j.ecolecon.2009.11.020
a b s t r a c t
a r t i c l e i n f oArticle history:Received 23 March 2009Received in revised form 14 September 2009Accepted 18 November 2009Available online 16 December 2009
Keywords:Landscape planningGeographic information systemsCost–benefit analysisIrrigationClimate changeWater managementSpatial targetingEnvironmental valuation
Over-allocation of fresh water resources to consumptive uses, coupled with recurring drought and theprospect of climate change, is compromising the stocks of natural capital in the world's basins and reducingtheir ability to provide water-dependent ecosystem services. To combat this, governments worldwide aremaking significant investment in efforts to improve the sharing of water between consumptive uses and theenvironment. Many investments are centred on the modernisation of inefficient irrigation delivery systemsand the purchase of consumptive water for environmental flows. In this study, we applied spatial targetingwithin a cost–benefit framework to reconfigure agricultural land use in an irrigation district to achieve a 20%reduction in agricultural water use to increase environmental flows, and improve the provision of otherecosystem services. We demonstrate a targeted land use reconfiguration policy approach using spatialplanning and optimisation models. Our model estimates a potential increase in the net present value ofecosystem services of up to $A 347 million. The increase in ecosystem services include recovering 62 GL ofwater for environmental flows, the sequestration of 10.6 million tonnes of CO2e/year, a 12 EC (μS/cm)reduction in river salinity, and an overall 9% increase in the value of agriculture. Without a spatially targetedapproach to planning, a 20% reduction in water for irrigation could result in the loss of $A 68.7 million ineconomic returns to agriculture which may be only marginally offset by the increased value of ecosystemservices resulting from the return of 62 GL of water to the environment.
Crown Copyright © 2009 Published by Elsevier B.V. All rights reserved.
1. Introduction
Irrigation of agricultural crops in low-rainfall regions of the world isan important element of world food production. Yet water security andwater-dependent ecosystems inmany irrigated areas are threatened bythe increase in demand for water tomeet food requirements of growingpopulations, coupled with intermittent droughts and the prospect ofcontinued reduced runoff andwater supply as a consequence of human-induced climate change. The focus of this paper is the evaluation oftargeted policy to mitigate ongoing water shortages and erosion ofnatural capital in irrigation regions. This is an issue inAustralia (Quiggin,2001; Qureshi et al., 2007), California (Doremus and Tarlock, 2003;Burke et al., 2004), the Mediterranean region (Isendahl and Schmidt,2006;Hein, 2007) andparts of Asia (Datta et al., 2004; Shah, 2005). All ofthese regions are grappling with the impacts of unsustainable use andover-allocation of water (Postel, 2003; Hillel and Vlek, 2005; Wichelnsand Oster, 2006). In Australia, significant public finances are beinginvested in irrigation water management (Wong, 2008a), whichincludes the reorganisation and reconfiguration of irrigation landscapes.This study presents a reconfiguration planning approach that helpsresolve the over-allocation of water without compromising the
ssman).
09 Published by Elsevier B.V. All rig
economic value of irrigated agricultural production, while at the sametime returningwater to the environment. The approachaims to increasethe value of ecosystem services provided by landscapes that haveirrigation as a major land and water use.
The concept of ecosystem services centres on the idea that naturalecosystemsprovide awide rangeof benefits tohumans, and thebenefitshave economic value. The services that ecosystems provide includeprovisioning, regulating, and cultural services that directly affect people,and the supporting services needed to maintain functionality of thesystem. The valuing of ecosystem services dates back to the 1970s(Westman, 1977), rising to prominence with Costanza et al. (1997) andDaily (1997). There exist a number of practical applications thatevaluate investments accounting for a wide range of ecosystem servicevalues within water and non-water environmental domains. ExamplesincludeWilson and Carpenter (1999), Heal (2000), Loomis et al. (2000),Daily and Ellison (2002), National Research Council of the NationalAcademies (2005), Bateman et al. (2006), and Yang et al. (2008). Theeconomic value of watersheds (Pattanayak, 2004; Zheng et al., 2008)and wetlands (Loomis et al., 2000; Zedler, 2003; Tong et al., 2007; Yanget al., 2008) has been found to be substantial because of the wide rangeof ecosystem services that they provide.
In this paper we combine ecosystem service valuation and spatialtargeting methodologies. Spatial targeting and landscape planning tounderpin agricultural policy intervention have been recently shownto provide significant environmental gains for potentially small
hts reserved.
1032 N.D. Crossman et al. / Ecological Economics 69 (2010) 1031–1042
economic costs (Yang et al., 2003; Ferraro, 2004; Lee and Thompson,2005; Bailey et al., 2006; Messer, 2006; Saroinsong et al., 2007; vander Horst, 2007; Wünscher et al., 2008; Crossman and Bryan, 2009).Messer (2006) show that conservation benefits of an existing landacquisition could be obtained for up to $US 3.5 million less usingspatial optimisation and targeting. Saroinsong et al. (2007) demon-strated that applying smart landscape planning to a fast erodingcatchment in Indonesia could reduce soil loss by 75% for only a 3.1%reduction in total agricultural profitability. Crossman and Bryan(2009) show that locating 53,000 ha of ecological restoration (or 1%of the landscape area) in a targetedwaywithin themost cost-effectivelocations, could improve the annual income of degraded drylandfarms and provide carbon and biodiversity benefits. In contrastCrossman and Bryan (2009) find that less targeted restoration wouldlead to much lower ecosystem benefits. These studies demonstratethe efficacy of spatially targeted investment and its advantages as ananalytical framework. We contend that extension of spatial targetingand ecosystem service valuation methods into irrigated agriculturallandscapes could provide a framework for identifying ways to reduceover-allocation of water resources whilst increasing rather thandecreasing ecosystem service returns to land and water.
We used a case study approach to develop and apply spatiallytargeted planning and ecosystem service valuation tools for reconfi-guring an irrigation landscape in southern Australia to operate withless water. Our objective was to plan for the reconfiguration of landuse and to jointly increase the net ecosystem service values of waterand land use, including agricultural production, amenity, salinity andcarbon sequestration. We constructed hierarchical, rule-based andoptimisation planning models to identify zones of potential land usechange based on a set of spatially explicit constraints for enhancingthe provision of ecosystem services. We then quantified the economicvalue of ecosystem services, including agricultural production. Wecompared the value under our plannedmodel to a random unplannedscenario achieving the same water savings. Our results demonstratethe advantage of strategic spatial targeting of land use change inirrigation landscapes under less water availability and of accountingfor a wide range of ecosystem service values. Our results also identifypotential ways to improve the returns to public investment in waterresource management.
2. Study Area and Policy Setting
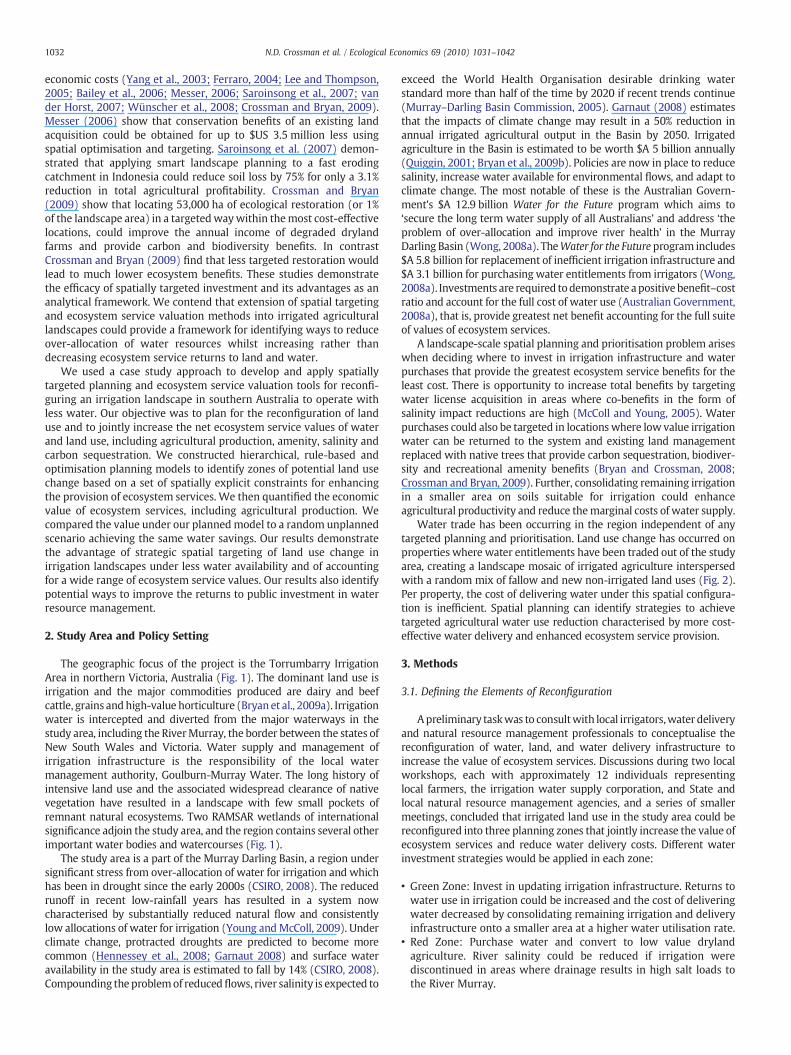
The geographic focus of the project is the Torrumbarry IrrigationArea in northern Victoria, Australia (Fig. 1). The dominant land use isirrigation and the major commodities produced are dairy and beefcattle, grains andhigh-value horticulture (Bryan et al., 2009a). Irrigationwater is intercepted and diverted from the major waterways in thestudy area, including the RiverMurray, the border between the states ofNew South Wales and Victoria. Water supply and management ofirrigation infrastructure is the responsibility of the local watermanagement authority, Goulburn-Murray Water. The long history ofintensive land use and the associated widespread clearance of nativevegetation have resulted in a landscape with few small pockets ofremnant natural ecosystems. Two RAMSAR wetlands of internationalsignificance adjoin the study area, and the region contains several otherimportant water bodies and watercourses (Fig. 1).
The study area is a part of the Murray Darling Basin, a region undersignificant stress from over-allocation of water for irrigation and whichhas been in drought since the early 2000s (CSIRO, 2008). The reducedrunoff in recent low-rainfall years has resulted in a system nowcharacterised by substantially reduced natural flow and consistentlylow allocations of water for irrigation (Young andMcColl, 2009). Underclimate change, protracted droughts are predicted to become morecommon (Hennessey et al., 2008; Garnaut 2008) and surface wateravailability in the study area is estimated to fall by 14% (CSIRO, 2008).Compounding the problemof reducedflows, river salinity is expected to
exceed the World Health Organisation desirable drinking waterstandard more than half of the time by 2020 if recent trends continue(Murray–Darling Basin Commission, 2005). Garnaut (2008) estimatesthat the impacts of climate change may result in a 50% reduction inannual irrigated agricultural output in the Basin by 2050. Irrigatedagriculture in the Basin is estimated to be worth $A 5 billion annually(Quiggin, 2001; Bryan et al., 2009b). Policies are now in place to reducesalinity, increase water available for environmental flows, and adapt toclimate change. The most notable of these is the Australian Govern-ment's $A 12.9 billion Water for the Future program which aims to‘secure the long term water supply of all Australians’ and address ‘theproblem of over-allocation and improve river health’ in the MurrayDarling Basin (Wong, 2008a). TheWater for the Future program includes$A 5.8 billion for replacement of inefficient irrigation infrastructure and$A 3.1 billion for purchasing water entitlements from irrigators (Wong,2008a). Investments are required todemonstrate apositive benefit–costratio and account for the full cost of water use (Australian Government,2008a), that is, provide greatest net benefit accounting for the full suiteof values of ecosystem services.
A landscape-scale spatial planning and prioritisation problem ariseswhen deciding where to invest in irrigation infrastructure and waterpurchases that provide the greatest ecosystem service benefits for theleast cost. There is opportunity to increase total benefits by targetingwater license acquisition in areas where co-benefits in the form ofsalinity impact reductions are high (McColl and Young, 2005). Waterpurchases could also be targeted in locations where low value irrigationwater can be returned to the system and existing land managementreplaced with native trees that provide carbon sequestration, biodiver-sity and recreational amenity benefits (Bryan and Crossman, 2008;Crossman and Bryan, 2009). Further, consolidating remaining irrigationin a smaller area on soils suitable for irrigation could enhanceagricultural productivity and reduce themarginal costs of water supply.
Water trade has been occurring in the region independent of anytargeted planning and prioritisation. Land use change has occurred onproperties where water entitlements have been traded out of the studyarea, creating a landscape mosaic of irrigated agriculture interspersedwith a random mix of fallow and new non-irrigated land uses (Fig. 2).Per property, the cost of delivering water under this spatial configura-tion is inefficient. Spatial planning can identify strategies to achievetargeted agricultural water use reduction characterised by more cost-effective water delivery and enhanced ecosystem service provision.
3. Methods
3.1. Defining the Elements of Reconfiguration
Apreliminary taskwas to consultwith local irrigators,water deliveryand natural resource management professionals to conceptualise thereconfiguration of water, land, and water delivery infrastructure toincrease the value of ecosystem services. Discussions during two localworkshops, each with approximately 12 individuals representinglocal farmers, the irrigation water supply corporation, and State andlocal natural resource management agencies, and a series of smallermeetings, concluded that irrigated land use in the study area could bereconfigured into three planning zones that jointly increase the value ofecosystem services and reduce water delivery costs. Different waterinvestment strategies would be applied in each zone:
• Green Zone: Invest in updating irrigation infrastructure. Returns towater use in irrigation could be increased and the cost of deliveringwater decreased by consolidating remaining irrigation and deliveryinfrastructure onto a smaller area at a higher water utilisation rate.
• Red Zone: Purchase water and convert to low value drylandagriculture. River salinity could be reduced if irrigation werediscontinued in areas where drainage results in high salt loads tothe River Murray.
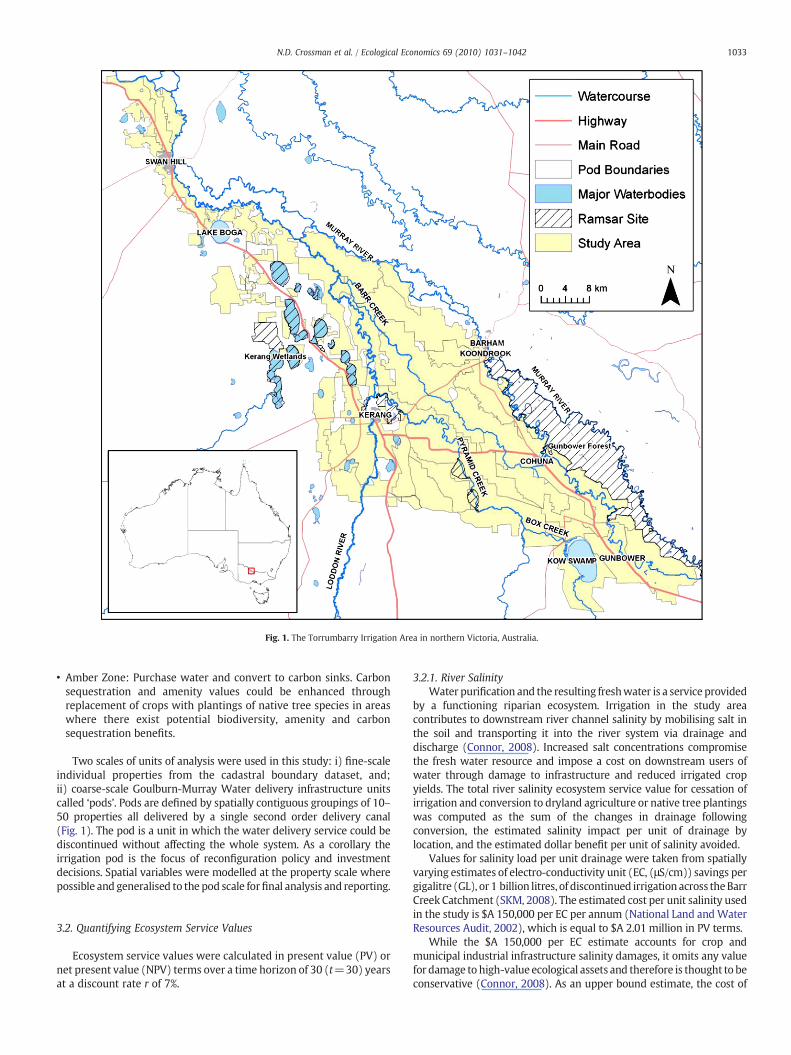
Fig. 1. The Torrumbarry Irrigation Area in northern Victoria, Australia.
1033N.D. Crossman et al. / Ecological Economics 69 (2010) 1031–1042
• Amber Zone: Purchase water and convert to carbon sinks. Carbonsequestration and amenity values could be enhanced throughreplacement of crops with plantings of native tree species in areaswhere there exist potential biodiversity, amenity and carbonsequestration benefits.
Two scales of units of analysis were used in this study: i) fine-scaleindividual properties from the cadastral boundary dataset, and;ii) coarse-scale Goulburn-Murray Water delivery infrastructure unitscalled ‘pods’. Pods are defined by spatially contiguous groupings of 10–50 properties all delivered by a single second order delivery canal(Fig. 1). The pod is a unit in which the water delivery service could bediscontinued without affecting the whole system. As a corollary theirrigation pod is the focus of reconfiguration policy and investmentdecisions. Spatial variables were modelled at the property scale wherepossible and generalised to the pod scale forfinal analysis and reporting.
3.2. Quantifying Ecosystem Service Values
Ecosystem service values were calculated in present value (PV) ornet present value (NPV) terms over a time horizon of 30 (t=30) yearsat a discount rate r of 7%.
3.2.1. River SalinityWater purification and the resulting freshwater is a service provided
by a functioning riparian ecosystem. Irrigation in the study areacontributes to downstream river channel salinity by mobilising salt inthe soil and transporting it into the river system via drainage anddischarge (Connor, 2008). Increased salt concentrations compromisethe fresh water resource and impose a cost on downstream users ofwater through damage to infrastructure and reduced irrigated cropyields. The total river salinity ecosystem service value for cessation ofirrigation and conversion to dryland agriculture or native tree plantingswas computed as the sum of the changes in drainage followingconversion, the estimated salinity impact per unit of drainage bylocation, and the estimated dollar benefit per unit of salinity avoided.
Values for salinity load per unit drainage were taken from spatiallyvarying estimates of electro-conductivity unit (EC, (μS/cm)) savings pergigalitre (GL), or 1 billion litres, of discontinued irrigation across theBarrCreek Catchment (SKM, 2008). The estimated cost per unit salinity usedin the study is $A 150,000 per EC per annum (National Land andWaterResources Audit, 2002), which is equal to $A 2.01 million in PV terms.
While the $A 150,000 per EC estimate accounts for crop andmunicipal industrial infrastructure salinity damages, it omits any valuefor damage to high-value ecological assets and therefore is thought to beconservative (Connor, 2008). As an upper bound estimate, the cost of

Fig. 2. Property scale change in water use in the Torrumbarry Irrigation Area, 1998 to 2005 (unpublished data).
1034 N.D. Crossman et al. / Ecological Economics 69 (2010) 1031–1042
removing salt from the river using salt interception schemes isapproaching $A 3–4 million per EC (Connor, 2008). Therefore theecosystem service value of less salt in the river is assumed to be in therange of $A 2.01 million–$A 4 million per EC in PV terms.
3.2.2. Carbon SequestrationClimate regulation and the resulting stable atmosphere is another
service provided by correctly functioning ecosystems. Biosequestra-tion of atmospheric carbon dioxide through reforestation reduces theconcentration of carbon. The total carbon sequestration value forconversion from irrigation to native tree plantings was computed asthe sum of the area converted to tree plantings multiplied by thecarbon dioxide equivalents (CO2e) per ha and the dollar benefit pertonne of CO2e reduction.
The spatially explicit version of 3-PG tree productivity simulations(Sands and Landsberg, 2002) was used to estimate the carbon capturedin the tree biomass. The well established 3-PG process model simulatestree growth based on a series of spatial soil and climate input layers andstand management variables. The parameter set for Eucalyptus kochii, alow-rainfall mallee species, was used to estimate total carbon. Themodel was run for a 30-year period at a planting density of 1200 stemsper hectare. The soil texture (sand, sandy loam, loam and clay) andavailable soil water holding capacity (mm) inputs required by 3-PGwere created from detailed regional soil maps and associated surveymanuals available from the Department of Primary Industries Victoria(2007). Available soil water holding capacity was calculated as afunction of the rooting depth of each soil texture class and an availablesoil watermultiplier that varies according to soil texture.Meanmonthlyclimate surfaces (maximum temperature, minimum temperature,precipitation, and daily solar radiation) were derived for the studyarea using the ESOCLIM module of ANUCLIM 5.0 (Houlder et al., 1999)
based on a digital elevation model (DEM). Total dry biomass producedper hectare bt for each year t from 3-PG was converted to carbonsequestration potential Qt in carbon dioxide equivalent terms (CO2e):
Qt = 3:667bt−bt−1
2
� �ð1Þ
The market price of $A 20/t CO2e under a carbon cap-and-tradesystem is used to calculate the ecosystem service value of carbonsequestration. It is expected that landowners who reforest their landwill be able to sell the annual carbon sequestered in the AustralianCarbon Pollution Reduction Scheme due to commence in 2011(Australian Government, 2008b). The $A 20/t CO2e market pricewas chosen because it is a price repeatedly modelled for analyses onthe impact of the Australian Carbon Pollution Reduction Scheme (e.g.Garnaut, 2008; Lawson et al., 2008). Net Present Value (NPV) perhectare from carbon trading was calculated as:
NPV = ∑T
t=0
P × Q t−ðECt + MCÞð1 + rÞt ð2Þ
where P is the price of carbon (P=$20/t CO2e), Qt is the quantity ofCO2e sequestered in year t, ECt is the establishment cost (ECt=$1000/ha at t=0, 0 otherwise), MC is the annual maintenance cost(MC=$10/ha), and r is the discount rate (r=7%).
3.2.3. Productive AgricultureAn ecosystem service of substantial value is the production of
agricultural commodities for human consumption. The value of thisservice can bequantified spatially bymodelling agricultural profitabilityaccording to land andwater use. Methods used to calculate profit at full
1035N.D. Crossman et al. / Ecological Economics 69 (2010) 1031–1042
equity PFE for each agricultural land use category are based on Bryanet al. (2009b) and involved calculating the gross revenue less thevariable and fixed costs to determine net returns to the farmer. Thegeneral form of the profit function is:
PFE = ðPrice ⁎ YieldÞ–ðVariable Costs + FixedCostsÞ ð3Þ
Production statistics and prices for each commodity typically grownunder each land use type in the study area were derived from theAustralian Bureau of Statistics (2007) Agricultural Commodities data.Four gross margin handbooks (Wimalasuriya, 1998; Montecillo andReeves, 2006; Montecillo et al., 2006; English, 2007) were used in caseswhere Agricultural Commodities datawas not used because of potentialerror. Fixed and variable costs, including water, were derived fromprevious studies (Bryan et al., 2009b) and gross margin handbooks(Wimalasuriya, 1998; Montecillo and Reeves, 2006; Montecillo et al.,2006; English, 2007). Profit at full equity was spatially allocated usingthe agricultural land use dataset derived from cadastral and land usedata. The annual profit values were converted to NPV.
3.2.4. Environmental FlowsFresh water flow acts as a provisioning and supporting ecosystem
service bymaintaining the biological diversity and integrity of the freshwater systems. The value of environmental flows to industries can bemeasured using market values. For example, the economic value ofamenities on the Murray River to industry has been estimated at $A2.7 billion/year (Howard, 2008).However, it ismore difficult to quantifyecosystem service values of improved river health from environmentalflows not extracted for irrigation or other consumptive uses. Robustestimates of these values require an understanding of ecologicalresponses to increased flows coupled with estimated non-marketvalues of improvements in environmental quality, such as increasedecological function and improved human use value.We have relied on arecent studywhichestimated theNPVof increased environmentalflowsfor improving the health of the predominant ecological community(river red gum, Eucalyptus camaldulensis) along the River Murray givenvarious volumetric and temporal scenarios (Bennett et al., 2008). Thestudy valued increased flows at $A 500 per megalitre (ML) to $A 2200per ML over a 20-year period with a 6% discount rate.
3.2.5. Recreation and AmenityCultural and aesthetic value is a core ecosystem service provided
by natural landscapes and it is thought to have a significant value inthe study area (Howard, 2008). However, measuring them is achallenge because many of these values are not traded in markets. Weused results from a stated preference study of Australian land andwater resources (van Bueren and Bennett, 2004) which applied achoice modelling questionnaire to 3200 randomly selected Australianhouseholds. Choice sets centred on species protection, landscapeaesthetics, riparian health and social impact. The aim was to quantifyhousehold willingness to pay for improvements in the environment.Relevant to the present study is the finding relating to landscapeaesthetics that households were willing to pay to have farmlandsrepaired and bush area protected. The average willingness to pay was$A 0.07 (range 0.02–0.14) per 10,000 ha of landscape restored perhousehold per year over 20 years (van Bueren and Bennett, 2004).
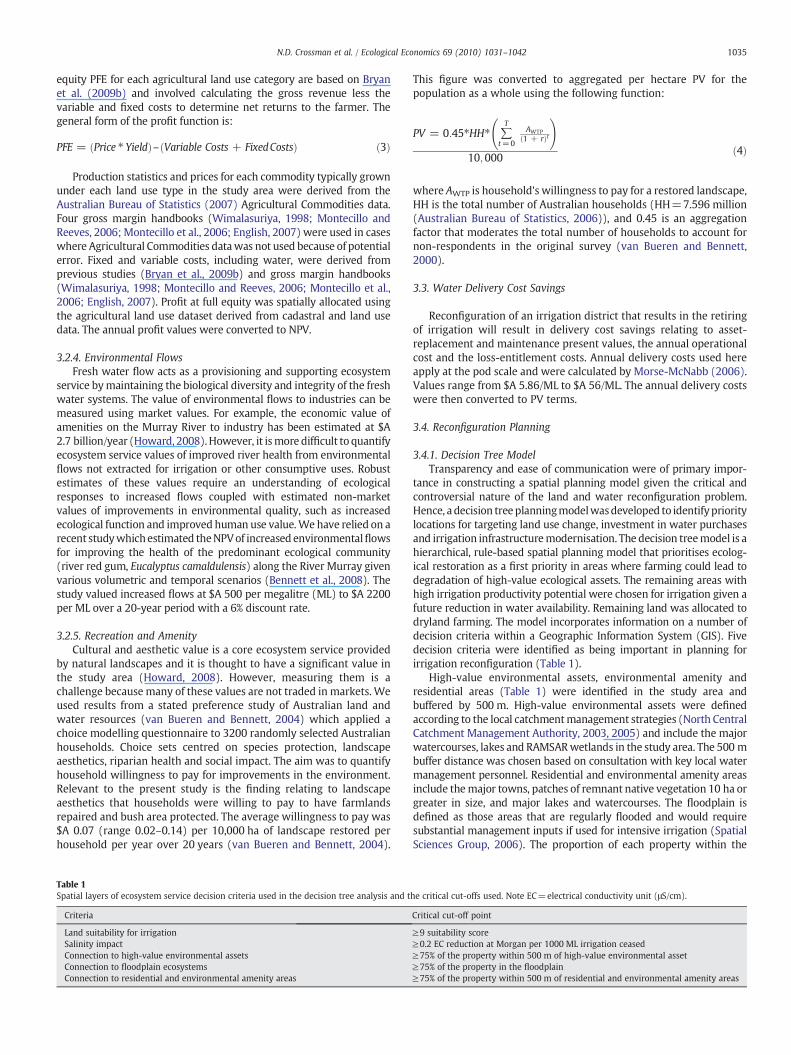
Table 1Spatial layers of ecosystem service decision criteria used in the decision tree analysis and t
Criteria
Land suitability for irrigationSalinity impactConnection to high-value environmental assetsConnection to floodplain ecosystemsConnection to residential and environmental amenity areas
This figure was converted to aggregated per hectare PV for thepopulation as a whole using the following function:
PV = 0:45⁎HH⁎ ∑T
t=0
AWTPð1 + rÞt
!
10;000ð4Þ
where AWTP is household's willingness to pay for a restored landscape,HH is the total number of Australian households (HH=7.596 million(Australian Bureau of Statistics, 2006)), and 0.45 is an aggregationfactor that moderates the total number of households to account fornon-respondents in the original survey (van Bueren and Bennett,2000).
3.3. Water Delivery Cost Savings
Reconfiguration of an irrigation district that results in the retiringof irrigation will result in delivery cost savings relating to asset-replacement and maintenance present values, the annual operationalcost and the loss-entitlement costs. Annual delivery costs used hereapply at the pod scale and were calculated by Morse-McNabb (2006).Values range from $A 5.86/ML to $A 56/ML. The annual delivery costswere then converted to PV terms.
3.4. Reconfiguration Planning
3.4.1. Decision Tree ModelTransparency and ease of communication were of primary impor-
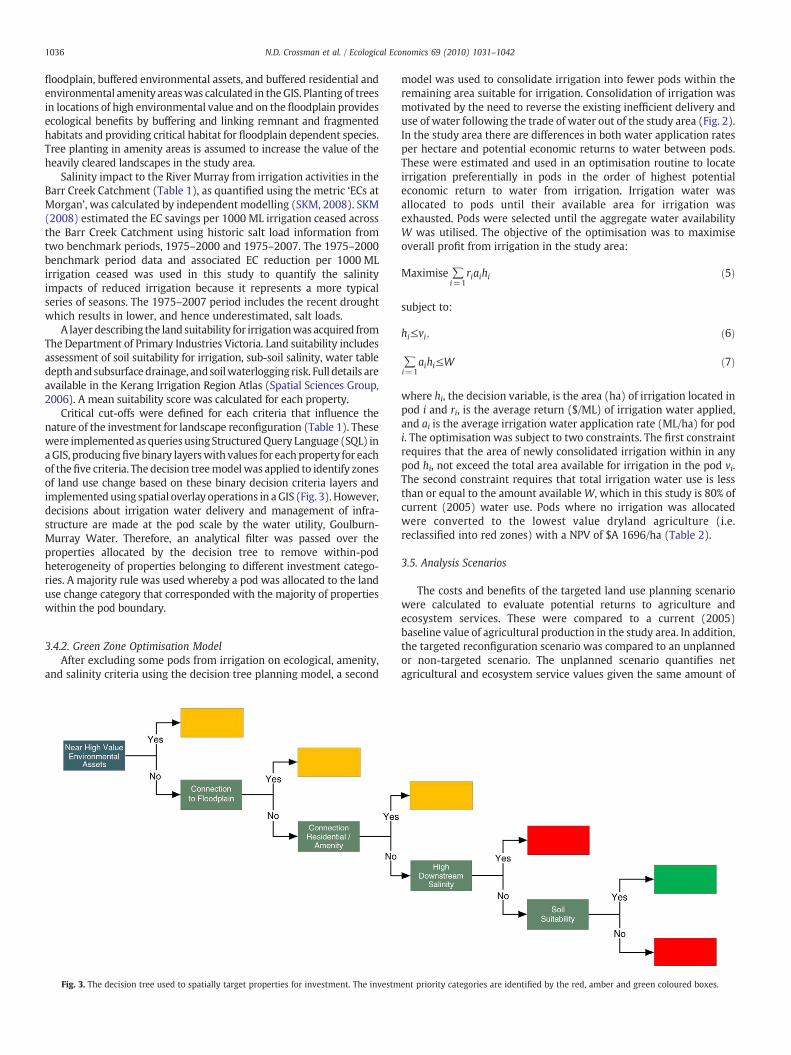
tance in constructing a spatial planning model given the critical andcontroversial nature of the land and water reconfiguration problem.Hence, a decision treeplanningmodelwasdeveloped to identifyprioritylocations for targeting land use change, investment in water purchasesand irrigation infrastructuremodernisation. The decision treemodel is ahierarchical, rule-based spatial planning model that prioritises ecolog-ical restoration as a first priority in areas where farming could lead todegradation of high-value ecological assets. The remaining areas withhigh irrigation productivity potential were chosen for irrigation given afuture reduction in water availability. Remaining land was allocated todryland farming. The model incorporates information on a number ofdecision criteria within a Geographic Information System (GIS). Fivedecision criteria were identified as being important in planning forirrigation reconfiguration (Table 1).
High-value environmental assets, environmental amenity andresidential areas (Table 1) were identified in the study area andbuffered by 500 m. High-value environmental assets were definedaccording to the local catchmentmanagement strategies (North CentralCatchment Management Authority, 2003, 2005) and include the majorwatercourses, lakes and RAMSARwetlands in the study area. The 500 mbuffer distance was chosen based on consultation with key local watermanagement personnel. Residential and environmental amenity areasinclude themajor towns, patches of remnant native vegetation 10 ha orgreater in size, and major lakes and watercourses. The floodplain isdefined as those areas that are regularly flooded and would requiresubstantial management inputs if used for intensive irrigation (SpatialSciences Group, 2006). The proportion of each property within the
he critical cut-offs used. Note EC=electrical conductivity unit (μS/cm).
Critical cut-off point
≥9 suitability score≥0.2 EC reduction at Morgan per 1000 ML irrigation ceased≥75% of the property within 500 m of high-value environmental asset≥75% of the property in the floodplain≥75% of the property within 500 m of residential and environmental amenity areas
1036 N.D. Crossman et al. / Ecological Economics 69 (2010) 1031–1042
floodplain, buffered environmental assets, and buffered residential andenvironmental amenity areaswas calculated in theGIS. Planting of treesin locations of high environmental value and on the floodplain providesecological benefits by buffering and linking remnant and fragmentedhabitats and providing critical habitat for floodplain dependent species.Tree planting in amenity areas is assumed to increase the value of theheavily cleared landscapes in the study area.
Salinity impact to the River Murray from irrigation activities in theBarr Creek Catchment (Table 1), as quantified using the metric ‘ECs atMorgan’, was calculated by independent modelling (SKM, 2008). SKM(2008) estimated the EC savings per 1000 ML irrigation ceased acrossthe Barr Creek Catchment using historic salt load information fromtwo benchmark periods, 1975–2000 and 1975–2007. The 1975–2000benchmark period data and associated EC reduction per 1000 MLirrigation ceased was used in this study to quantify the salinityimpacts of reduced irrigation because it represents a more typicalseries of seasons. The 1975–2007 period includes the recent droughtwhich results in lower, and hence underestimated, salt loads.
A layer describing the land suitability for irrigationwasacquired fromThe Department of Primary Industries Victoria. Land suitability includesassessment of soil suitability for irrigation, sub-soil salinity, water tabledepth andsubsurfacedrainage, andsoilwaterlogging risk. Full details areavailable in the Kerang Irrigation Region Atlas (Spatial Sciences Group,2006). A mean suitability score was calculated for each property.
Critical cut-offs were defined for each criteria that influence thenature of the investment for landscape reconfiguration (Table 1). Thesewere implementedasqueries using StructuredQuery Language (SQL) inaGIS, producingfive binary layerswith values for each property for eachof thefive criteria. The decision treemodelwas applied to identify zonesof land use change based on these binary decision criteria layers andimplemented using spatial overlay operations in aGIS (Fig. 3). However,decisions about irrigation water delivery and management of infra-structure are made at the pod scale by the water utility, Goulburn-Murray Water. Therefore, an analytical filter was passed over theproperties allocated by the decision tree to remove within-podheterogeneity of properties belonging to different investment catego-ries. A majority rule was used whereby a pod was allocated to the landuse change category that corresponded with the majority of propertieswithin the pod boundary.
3.4.2. Green Zone Optimisation ModelAfter excluding some pods from irrigation on ecological, amenity,
and salinity criteria using the decision tree planning model, a second
Fig. 3. The decision tree used to spatially target properties for investment. The investm
model was used to consolidate irrigation into fewer pods within theremaining area suitable for irrigation. Consolidation of irrigation wasmotivated by the need to reverse the existing inefficient delivery anduse of water following the trade of water out of the study area (Fig. 2).In the study area there are differences in both water application ratesper hectare and potential economic returns to water between pods.These were estimated and used in an optimisation routine to locateirrigation preferentially in pods in the order of highest potentialeconomic return to water from irrigation. Irrigation water wasallocated to pods until their available area for irrigation wasexhausted. Pods were selected until the aggregate water availabilityW was utilised. The objective of the optimisation was to maximiseoverall profit from irrigation in the study area:
Maximise ∑i=1
riaihi ð5Þ
subject to:
hi≤vi; ð6Þ
∑i=1
aihi≤W ð7Þ
where hi, the decision variable, is the area (ha) of irrigation located inpod i and ri, is the average return ($/ML) of irrigation water applied,and ai is the average irrigation water application rate (ML/ha) for podi. The optimisation was subject to two constraints. The first constraintrequires that the area of newly consolidated irrigation within in anypod hi, not exceed the total area available for irrigation in the pod vi.The second constraint requires that total irrigation water use is lessthan or equal to the amount availableW, which in this study is 80% ofcurrent (2005) water use. Pods where no irrigation was allocatedwere converted to the lowest value dryland agriculture (i.e.reclassified into red zones) with a NPV of $A 1696/ha (Table 2).
3.5. Analysis Scenarios
The costs and benefits of the targeted land use planning scenariowere calculated to evaluate potential returns to agriculture andecosystem services. These were compared to a current (2005)baseline value of agricultural production in the study area. In addition,the targeted reconfiguration scenario was compared to an unplannedor non-targeted scenario. The unplanned scenario quantifies netagricultural and ecosystem service values given the same amount of
ent priority categories are identified by the red, amber and green coloured boxes.

Table 2Summary of ecosystem service values used in this study.
Variable Description Units Values ($A)
River salinity Avoided costs of removing salt from the River Murray through cessation of irrigation PV $/ML 0–4823Stable climate Value of carbon sequestered by reforestation of irrigation areas, assuming $A 20/t CO2e NPV $/ha 4377–5404Productive agriculture Value of additional agriculture (dryland and irrigated) possible under reconfigured landscape NPV $/ha 1696–98,490Environmental flows Value of water returned to the environment for increased flows NPV $/ML 500–2200Recreation and amenity Value of reforested and restored landscapes for visual amenity and recreational enjoyment PV $/ha 96–642
1037N.D. Crossman et al. / Ecological Economics 69 (2010) 1031–1042
water savings as in the targeted scenario. This scenario quantifies thenet values of less water without any attempt to target how and whereland, water and water delivery infrastructure are used. Irrigatedproperties were randomly selected to cease irrigation until the totalvolume of water of selected properties reached a threshold equivalentto the volume of water returned to environment under the plannedtargeted scenario, which in this case is 20% of the water used underthe 2005 baseline.While the spatial pattern of reductions in water useunder the non-targeted scenario were randomly identified, they arearguably similar to the observed trends between 1998 and 2005(Fig. 2) and thus represent what might be expected with acontinuation of past trends.
3.6. Sensitivity Analysis
The sensitivity of each decision criteria (Fig. 3) to the critical cut-offs(Table 1) was explored by iteratively adjusting the cut-off value of eachcriteria while keeping the other criteria constant. The effect of adjustingcut-offs was reported through the impact on the total value ofagricultural production and water returned for environmental flows.
4. Results
Table 2 summarises the ecosystem service values quantified in thisstudy. Ecosystem service value of salinity reduction is up to $A 4823/ML in PV terms. The ecosystem service value of carbon sequestration,assuming a market price of $A 20/t CO2e, ranges from $A 4377/ha to$A 5404/ha in NPV terms. The ecosystem service value of agriculturalproduction estimates range from $A 1696/ha for dryland pasture onthe most limited soils in the region to $A 98,490/ha for irrigatedhorticulture on the best soils in the region. The value of restoredlandscapes is in the range $A 96/ha to $A 642/ha in PV terms. Thedelivery cost is in the range $A 79/ML to $A 751/ML in PV terms.
Input variables summarised and mapped at the property scale arepresented in Fig. 4. The ecosystemservice value of converting a propertyto non-irrigated land uses (dryland farming and reforestation) displaysconsiderable heterogeneity across the landscape (Fig. 4a to e). The largerproperties in the central part of the study area, around the Barr Creekand LoddonRiver, are of greater value to ecosystem service provision. Insome cases, individual properties could provide in the order of $A 20–30 million in ecosystem service value through cessation of irrigation.The soils less suitable for irrigation are located predominantly in thecentral parts of the study area, around the Barr Creek and Loddon River(Fig. 4g). The central locations are also where there are properties inclose proximity to high-value environmental assets, residential andamenity living areas and the floodplain (Fig. 4h to j).
Application of the decision tree planningmodel identifies propertiesand pods for allocation to the green (irrigation), red (drylandagriculture) and amber (ecological restoration) zones (Fig. 5a and b).The application of the optimisation model for targeted location ofirrigation reduces the number of pods under irrigation (categorised asbelonging to the green zone) as shown in Fig. 5c. This results in anincrease in the value of irrigated agriculture as a result of consolidatingirrigation in more productive areas with greater economic returns, andimproving delivery infrastructure utilisation (Table 3). The red andamber pods are targeted for water purchases and alternative dryland
agriculture and ecological restoration land uses, respectively. Ecologicalrestoration in the amber pods improves the provision of ecosystemservices to a greater extent than in the red or green pods.
Table 3 summarises the results of the scenario analysis. The low tohigh range of ecosystem service values for river salinity, environ-mental flows and recreation and amenity ecosystem services areestimated based on the ranges per unit listed in Table 1. In the currentscenario estimated total net economic returns to agriculture in thestudy area was $A 777.7 million in NPV terms. Annually, agriculture inthe study area is worth $A 58 million assuming a 2004/05water use of305 GL. No ecosystem service values are reported for the currentscenario in Table 3 because it is a baseline and changes from thisbaseline are reported in the other analysis scenarios.
In the non-targeted and targeted scenarios a total of 62 GL of water(20% less than in 2004/05) was assumed to be no longer available forirrigation. In the non-targeted scenario 20% less water was estimatedto result in a $A 68.7 million or a 9% decline in the value of agricultureto $A 709 million from the current baseline of $A 777.7 million over a30-year period. No water delivery cost savings are estimated in thisscenario because it was assumed that all infrastructure must bemaintained to service the spatially disparate spread of customers thatcould be expected with a random pattern of reduced water use byirrigators. The random pattern is arguably similar to the 1998–2005trend in land use change (Fig. 2). The non-targeted scenario wouldlead to a rising per unit delivery cost for the expected smaller numberof irrigators. A decline in salinity impact on downstream water userswas estimated in this scenario of 5 EC atMorganwhich could beworthup to $A 23 million over the next 30 years.
The results of the targeted scenario suggest that the value oftargeted reconfiguration of land, water and infrastructure use canenhance net economic returns to the region. In the targeted scenario,despite 20% less irrigation water, a $A 72.5 million or 9% increase inthe value of agriculture over a 30-year period could be expectedthrough smart spatial targeting and planning. In addition there arepotential water delivery cost savings of approximately $A 26.3 millionthat are attainable with a spatially targeted strategy.
The expected increase in ecosystem service values is up to $A90.8 million and $A 347 million under the non-targeted unplanned andtargeted planned scenarios, respectively. The environmental flow valuefrom the 62 GL returned to the environment is the same for bothscenarios, but values are higher for the other ecosystem services underthe targeted scenario. In biophysical terms, estimated benefit of thetargeted scenario is a 12EC reductionof salinity atMorgan. Thepotentialvalue of the additional salinity reduction in the targeted scenarios is $A30million greater than the value of salinity reduction estimated toresult in the non-targeted scenario. Revegetation and ecologicalrestoration has the estimated potential to provide climate changebenefits in the order of 10.6 million tonnes of CO2e sequestered over a30-year periodwith an estimated economic value of up to $A 75 millionover 30 years. The restored treed landscapes along lengths of theLoddon River, River Murray and Kerang Lakes in this scenario also offerpotential for significant recreational and amenity benefits with anestimated value of up to $A 10.1 million.
Fig. 6 demonstrates the sensitivity of the decision criteria toadjustments of the critical cut-offs. A tightening of the cut-offs byadjusting thresholds to the left of their current values (Fig. 6) will

Fig. 4. Input variables summarised at the property scale: a) upper bound NPV of avoided costs of removing salt from the River Murray through cessation of irrigation; b) NPV ofcarbon sequestered by reforestation of irrigation areas; c) NPV of agriculture; d) upper bound of total value of water returned to the environment for increased flows; e) upper boundof NPV of reforested and restored landscapes for visual amenity and enjoyment; f) NPV of infrastructure maintenance, operation, replacement and loss-entitlement costs; g) averageland suitability for irrigation score; h) proportion of the property within 500 m of key environmental assets; i) proportion of the property within 500 m of residential and amenityliving areas, and; j) proportion of the property within the floodplain.
1038 N.D. Crossman et al. / Ecological Economics 69 (2010) 1031–1042
increase the volume of water available for the environment but thetrade-off will be lower agricultural production values because therewill be less irrigated agriculture. The EC reduction decision criteria isthe most sensitive to a tightening of cut-offs. For example, shifting theEC reduction from 0.2 ECs to 0.15 EC will result in 130 GL of waterpotentially available for restoring natural flows, i.e. 43% less water forirrigation. The NPV of agricultural productionwould be approximately$A 740 million, a $A 37 million reduction in the current baseline overa 30-year period. The other decision criteria are not as sensitive but ashift in cut-off will nonetheless result in a trade-off betweenenvironmental water and agricultural production value. The critical
cut-offs selected for our model therefore provides a balance betweenecosystem service benefits, in this case environmental water, and thevalue of agricultural production (Fig. 6).
5. Discussion
Through smart targeting of investment in irrigation infrastructureand water entitlement purchases, 20% of the region's water could bereturned to the River Murray with positive impacts on ecosystemservice and agricultural production. Significant water delivery costssavings could also be realised. Twelve ECs can be avoided at Morgan,
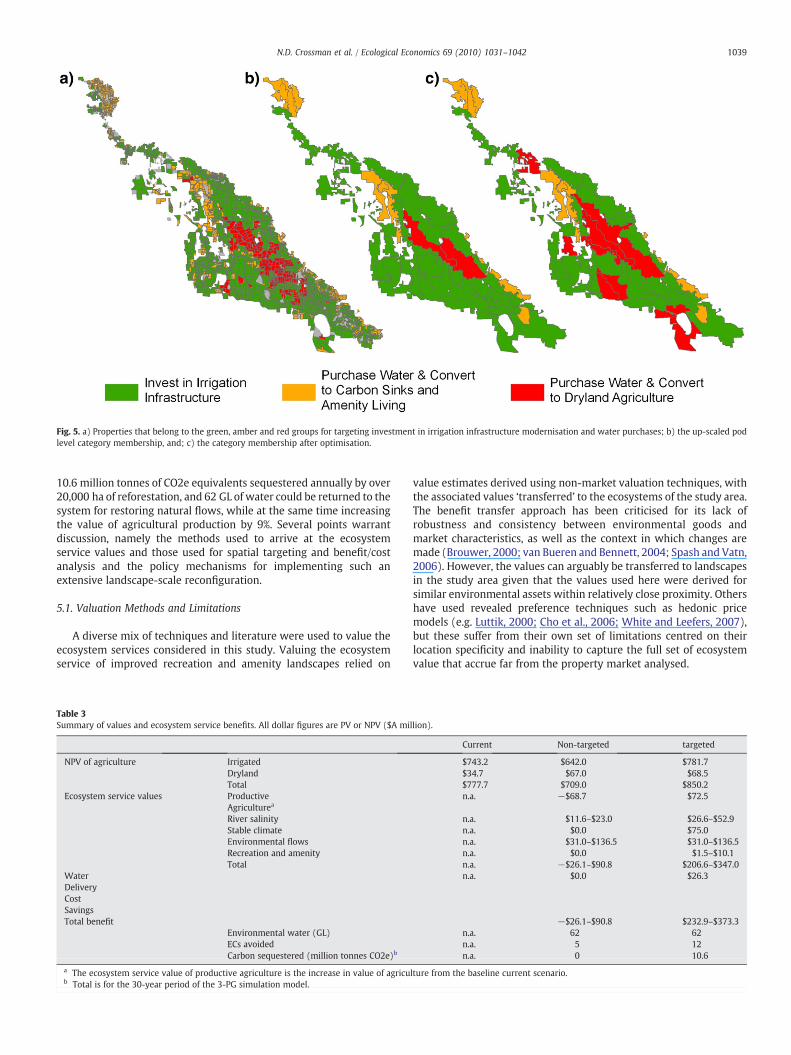
Fig. 5. a) Properties that belong to the green, amber and red groups for targeting investment in irrigation infrastructure modernisation and water purchases; b) the up-scaled podlevel category membership, and; c) the category membership after optimisation.
1039N.D. Crossman et al. / Ecological Economics 69 (2010) 1031–1042
10.6 million tonnes of CO2e equivalents sequestered annually by over20,000 ha of reforestation, and 62 GL of water could be returned to thesystem for restoring natural flows, while at the same time increasingthe value of agricultural production by 9%. Several points warrantdiscussion, namely the methods used to arrive at the ecosystemservice values and those used for spatial targeting and benefit/costanalysis and the policy mechanisms for implementing such anextensive landscape-scale reconfiguration.
5.1. Valuation Methods and Limitations
A diverse mix of techniques and literature were used to value theecosystem services considered in this study. Valuing the ecosystemservice of improved recreation and amenity landscapes relied on
Table 3Summary of values and ecosystem service benefits. All dollar figures are PV or NPV ($A mi
NPV of agriculture IrrigatedDrylandTotal
Ecosystem service values ProductiveAgriculturea
River salinityStable climateEnvironmental flowsRecreation and amenityTotal
WaterDeliveryCostSavingsTotal benefit
Environmental water (GL)ECs avoidedCarbon sequestered (million tonnes CO2e)b
a The ecosystem service value of productive agriculture is the increase in value of agricub Total is for the 30-year period of the 3-PG simulation model.
value estimates derived using non-market valuation techniques, withthe associated values ‘transferred’ to the ecosystems of the study area.The benefit transfer approach has been criticised for its lack ofrobustness and consistency between environmental goods andmarket characteristics, as well as the context in which changes aremade (Brouwer, 2000; van Bueren and Bennett, 2004; Spash and Vatn,2006). However, the values can arguably be transferred to landscapesin the study area given that the values used here were derived forsimilar environmental assets within relatively close proximity. Othershave used revealed preference techniques such as hedonic pricemodels (e.g. Luttik, 2000; Cho et al., 2006; White and Leefers, 2007),but these suffer from their own set of limitations centred on theirlocation specificity and inability to capture the full set of ecosystemvalue that accrue far from the property market analysed.
llion).
Current Non-targeted targeted
$743.2 $642.0 $781.7$34.7 $67.0 $68.5$777.7 $709.0 $850.2n.a. −$68.7 $72.5
n.a. $11.6–$23.0 $26.6–$52.9n.a. $0.0 $75.0n.a. $31.0–$136.5 $31.0–$136.5n.a. $0.0 $1.5–$10.1n.a. −$26.1–$90.8 $206.6–$347.0n.a. $0.0 $26.3
−$26.1–$90.8 $232.9–$373.3n.a. 62 62n.a. 5 12n.a. 0 10.6
lture from the baseline current scenario.
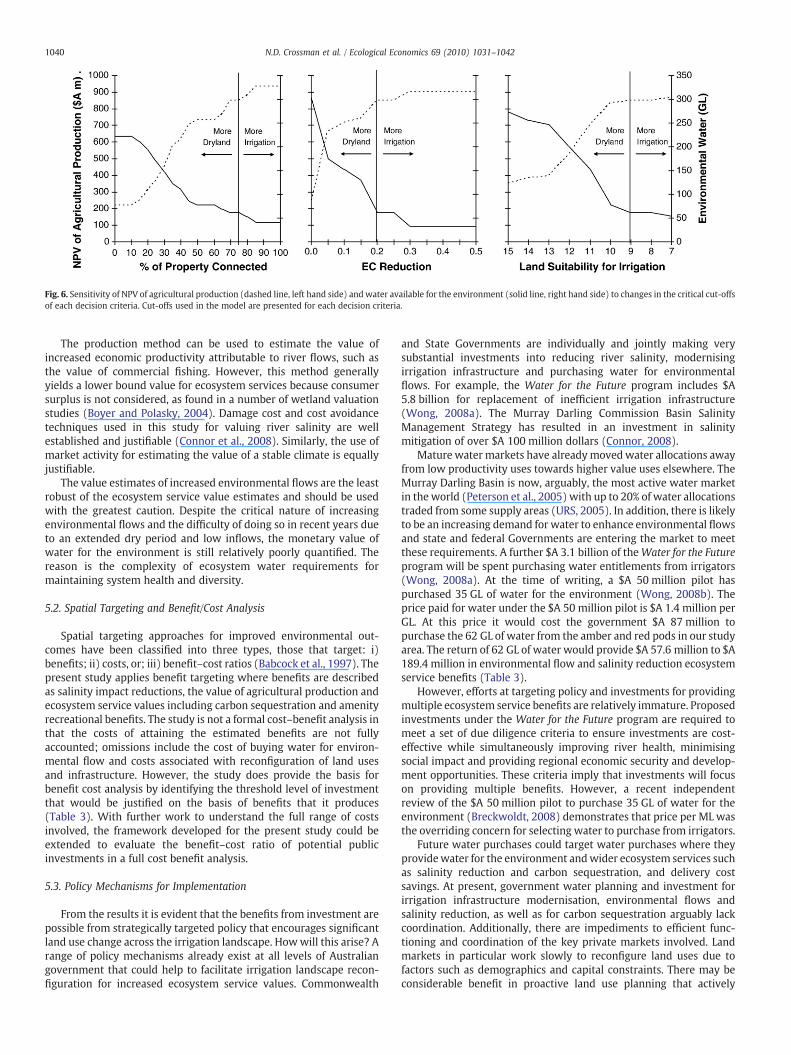
Fig. 6. Sensitivity of NPV of agricultural production (dashed line, left hand side) andwater available for the environment (solid line, right hand side) to changes in the critical cut-offsof each decision criteria. Cut-offs used in the model are presented for each decision criteria.
1040 N.D. Crossman et al. / Ecological Economics 69 (2010) 1031–1042
The production method can be used to estimate the value ofincreased economic productivity attributable to river flows, such asthe value of commercial fishing. However, this method generallyyields a lower bound value for ecosystem services because consumersurplus is not considered, as found in a number of wetland valuationstudies (Boyer and Polasky, 2004). Damage cost and cost avoidancetechniques used in this study for valuing river salinity are wellestablished and justifiable (Connor et al., 2008). Similarly, the use ofmarket activity for estimating the value of a stable climate is equallyjustifiable.
The value estimates of increased environmental flows are the leastrobust of the ecosystem service value estimates and should be usedwith the greatest caution. Despite the critical nature of increasingenvironmental flows and the difficulty of doing so in recent years dueto an extended dry period and low inflows, the monetary value ofwater for the environment is still relatively poorly quantified. Thereason is the complexity of ecosystem water requirements formaintaining system health and diversity.
5.2. Spatial Targeting and Benefit/Cost Analysis
Spatial targeting approaches for improved environmental out-comes have been classified into three types, those that target: i)benefits; ii) costs, or; iii) benefit–cost ratios (Babcock et al., 1997). Thepresent study applies benefit targeting where benefits are describedas salinity impact reductions, the value of agricultural production andecosystem service values including carbon sequestration and amenityrecreational benefits. The study is not a formal cost–benefit analysis inthat the costs of attaining the estimated benefits are not fullyaccounted; omissions include the cost of buying water for environ-mental flow and costs associated with reconfiguration of land usesand infrastructure. However, the study does provide the basis forbenefit cost analysis by identifying the threshold level of investmentthat would be justified on the basis of benefits that it produces(Table 3). With further work to understand the full range of costsinvolved, the framework developed for the present study could beextended to evaluate the benefit–cost ratio of potential publicinvestments in a full cost benefit analysis.
5.3. Policy Mechanisms for Implementation
From the results it is evident that the benefits from investment arepossible from strategically targeted policy that encourages significantland use change across the irrigation landscape. Howwill this arise? Arange of policy mechanisms already exist at all levels of Australiangovernment that could help to facilitate irrigation landscape recon-figuration for increased ecosystem service values. Commonwealth
and State Governments are individually and jointly making verysubstantial investments into reducing river salinity, modernisingirrigation infrastructure and purchasing water for environmentalflows. For example, the Water for the Future program includes $A5.8 billion for replacement of inefficient irrigation infrastructure(Wong, 2008a). The Murray Darling Commission Basin SalinityManagement Strategy has resulted in an investment in salinitymitigation of over $A 100 million dollars (Connor, 2008).
Mature water markets have alreadymovedwater allocations awayfrom low productivity uses towards higher value uses elsewhere. TheMurray Darling Basin is now, arguably, the most active water marketin the world (Peterson et al., 2005) with up to 20% of water allocationstraded from some supply areas (URS, 2005). In addition, there is likelyto be an increasing demand for water to enhance environmental flowsand state and federal Governments are entering the market to meetthese requirements. A further $A 3.1 billion of theWater for the Futureprogram will be spent purchasing water entitlements from irrigators(Wong, 2008a). At the time of writing, a $A 50 million pilot haspurchased 35 GL of water for the environment (Wong, 2008b). Theprice paid for water under the $A 50 million pilot is $A 1.4 million perGL. At this price it would cost the government $A 87 million topurchase the 62 GL of water from the amber and red pods in our studyarea. The return of 62 GL of water would provide $A 57.6 million to $A189.4 million in environmental flow and salinity reduction ecosystemservice benefits (Table 3).
However, efforts at targeting policy and investments for providingmultiple ecosystem service benefits are relatively immature. Proposedinvestments under the Water for the Future program are required tomeet a set of due diligence criteria to ensure investments are cost-effective while simultaneously improving river health, minimisingsocial impact and providing regional economic security and develop-ment opportunities. These criteria imply that investments will focuson providing multiple benefits. However, a recent independentreview of the $A 50 million pilot to purchase 35 GL of water for theenvironment (Breckwoldt, 2008) demonstrates that price per ML wasthe overriding concern for selecting water to purchase from irrigators.
Future water purchases could target water purchases where theyprovidewater for the environment andwider ecosystem services suchas salinity reduction and carbon sequestration, and delivery costsavings. At present, government water planning and investment forirrigation infrastructure modernisation, environmental flows andsalinity reduction, as well as for carbon sequestration arguably lackcoordination. Additionally, there are impediments to efficient func-tioning and coordination of the key private markets involved. Landmarkets in particular work slowly to reconfigure land uses due tofactors such as demographics and capital constraints. There may beconsiderable benefit in proactive land use planning that actively
1041N.D. Crossman et al. / Ecological Economics 69 (2010) 1031–1042
encourages higher value and regional employment generating uses ofland resources. Additionally, land banking or brokerage arrangementsand financial planning assistance for landholders considering changesin land use may be ways to encourage higher value uses.
6. Conclusion
The problem of water scarcity and the unsustainable use and over-allocation of water is not unique to Australia (Postel, 2003; Hillel andVlek, 2005; Wichelns and Oster, 2006). Water shortages and thesubsequent impacts on agriculture, society and natural ecosystemsare felt in California (Doremus and Tarlock, 2003; Burke et al., 2004),the Mediterranean region (Isendahl and Schmidt, 2006; Hein, 2007)and parts of Asia (Datta et al., 2004; Shah, 2005), to name a few. Ourresults are specific to the Australian context, especially the ecosystemservice values used to quantify the benefits of spatial targeting ofinvestment in water and irrigation infrastructure. However, there isarguably a case for significant public investment in irrigationlandscape reconfiguration that provides multiple ecosystem servicebenefits in any location affected by water scarcity. The form ofinvestment, whether it is smart targeting of water purchases or newirrigation technologies that increase water use efficiencies, or both,will be specific to a region and country. The monetary values used tovalue ecosystem services will also be location and context specific.
Measuring the size of potential benefits from a targeted approachto land, water and water infrastructure reconfiguration and identify-ing priority locations based on potential benefit to a case study regionhas been the focus of our study. Applying our model to anotherirrigation-dependent regionwill require research into local ecosystemservices and values. There will also need to be relevant policyinstruments and institutions for targeting water investments thatprovide multiple benefits. The next step is to design policy thatrealises the potential improvements in multiple objective outcomesidentified in this study.
Acknowledgements
This study was supported by the Better Basin Futures Themewithin the CSIRO Water for a Healthy Country Flagship. Funding waspartly sourced from the Commonwealth Department of Agriculture,Fisheries and Forestry under the Market Based Instruments PilotProgram. Many staff within the North Central Catchment Manage-ment Authority, Department of Primary Industries Victoria andGoulburn-Murray Water are thanked for their many contributionsranging from data supply to intellectual and professional input.Significant thanks are given to Jim McColl, John Ward, SoradaTapsuwan, Parvin Mahmoudi and two anonymous reviewers forvaluable comments on an earlier version of this paper.
References
Australian Bureau of Statistics, 2006. Australian Census of Population and Housing2006. Australia Bureau of Statistics, Canberra.
Australian Bureau of Statistics, 2007. Agricultural Commodities: Small Area Data,Australia, 2006–07. Australia Bureau of Statistics, Canberra.
Australian Government, 2008a. Agreement on Murray_Darling Basin Reform, 3 July2008. At URL http://coag.gov.au/coag_meeting_outcomes/2008-07-03/docs/Murray_Darling_IGA.pdf, accessed on 27/11/2008.
Australian Government, 2008b. Carbon Pollution Reduction Scheme: Australia's LowPollution Future. Australian Government, December 2008, Canberra. At URL http://www.climatechange.gov.au/whitepaper/report/index.html, accessed on 20/02/2009.
Babcock, B.A., Lakshminarayan, P.G., Wu, J.J., Zilberman, D., 1997. Targeting tools for thepurchase of environmental amenities. Land Economics 73, 325–339.
Bailey, N., Lee, J.T., Thompson, S., 2006. Maximising the natural capital benefits ofhabitat creation: spatially targeting native woodland using GIS. Landscape andUrban Planning 75, 227–243.
Bateman, I.J., Brouwer, R., Davies, H., Day, B.H., Deflandre, A., Di Falco, S., Georgiou, S.,Hadley, D., Hutchins, M., Jones, A.P., Kay, D., Leeks, G., Lewis, M., Lovett, A.A., Neal, C.,Posen, P., Rigby,D., Turner, R.K., 2006. Analysing the agricultural costs andnon-market
benefits of implementing the water framework directive. Journal of AgriculturalEconomics 57, 221–237.
Bennett, J., Dumbsday, R., Gillespie, R., 2008. Analysing options for the Red Gum Forestsalong the Murray River. Proceedings of the 52nd Australian Agricultural ResourceEconomics Conference, 5–8 February 2008, Canberra.
Boyer, T., Polasky, S., 2004. Valuing urban wetlands: a review of non-market valuationstudies. Wetlands 24, 744–755.
Breckwoldt, R., 2008. Review of the 2007–08 Water Entitlement Purchases: FinalReport. Hyder Consulting, Melbourne.
Brouwer, R., 2000. Environmental value transfer: state of the art and future prospects.Ecological Economics 32, 137–152.
Bryan, B.A., Crossman, N.D., 2008. Systematic landscape planning for multiple objectivenatural resourcemanagement. Journal of EnvironmentalManagement 88, 1175–1189.
Bryan, B.A., Barry, S., Marvanek, S., 2009a. Quantifying and mapping commodity-levelagricultural land use change in the Murray–Darling Basin, Australia 1996/97–2000/01. Journal of Land Use Science 4, 131–155.
Bryan, B.A., Hajkowicz, S., Marvanek, S., Young, M.D., 2009b. Mapping economic returnsto agriculture for informing environmental policy in the Murray-Darling Basin,Australia. Environmental Modelling and Assessment 14, 375–390.
Burke, S.M., Adams, R.M., Wallender, W.W., 2004. Water banks and environmental waterdemands: case of the Klamath project. Water Resources Research 40, W09S02.
Cho, S.H., Bowker, J.M., Park, W.M., 2006. Measuring the contribution of water and greenspace amenities to housing values: an application and comparison of spatiallyweighted hedonic models. Journal of Agricultural and Resource Economics 31,485–507.
Connor, J., 2008. The economics of time delayed salinity impact management in theRiver Murray. Water Resources Research 44, W03401.
Connor, J., Doble, R., Walker, G., Stenson, M., Elmahdi, A., Ferris, M.M., Jolly, I.D., Kirby,M., Kaczan, D., Morrison, J.B., King, D., Pickett, T., Overton, I., Pettit, C., 2008. LowerMurray Landscape Futures: Analysis of Regional Plans and Landscape Futures forthe River Corridor. At URL http://www.landscapefutures.com.au/publications.html,accessed on 21/11/2008.
Costanza, R., d'Arges, R., de Groot, R.S., Farber, S., Grasso, M., Hannon, B., Limburg, K.,Naeem, S., O'Neill, R.V., Paruelo, J., Raskin, R.G., Sutton, P., van den Belt, M., 1997. Thevalue of the world's ecosystem services and natural capital. Nature 387, 253–260.
Crossman, N.D., Bryan, B.A., 2009. Identifying cost-effective hotspots for restoringnatural capital and enhancing landscape multi-functionality. Ecological Economics68, 654–668.
CSIRO, 2008. Water availability in the Murray. A Report to the Australian Governmentfrom the CSIRO Murray–Darling Basin Sustainable Yields Project. CSIRO, Australia.
Daily, G.C. (Ed.), 1997. Nature's Services: Societal Dependence on Natural Ecosystems.Island Press, Washington DC.
Daily, G.C., Ellison, K., 2002. The New Economy of Nature: The Quest to MakeConservation Profitable. Island Press, Washington DC.
Datta, K.K., Tewari, L., Toshi, P.K., 2004. Impact of subsurface drainage on improvementof crop production and farm income in northwest India. Irrigation and DrainageSystems 18, 43–56.
Department of Primary Industries Victoria, 2007. Detailed Soils Surveys. . At URL http://www.dpi.vic.gov.au/dpi/vro/nthcenregn.nsf/pages/nthcen_soil_dssurveys, accessedon 23/11/2007.
Doremus, H., Tarlock, A.D., 2003. Fish, farms and the clash of cultures in the Klamathbasin. Ecology Law Quarterly 30, 279–350.
English, W., 2007. Dairy Industry FarmMonitor Project Summary of Results 2006–2007.Department of Primary Industries, Victoria.
Ferraro, P.J., 2004. Targeting conservation investments in heterogeneous landscapes —a distance function approach and application to watershed management. AmericanJournal of Agricultural Economics 86, 905–918.
Garnaut, R., 2008. The Garnaut Climate Change Review: Final Report. CambridgeUniversity Press, Melbourne.
Heal, G., 2000. Nature and the Marketplace: Capturing the Value of Ecosystem Services.Island Press, Washington DC.
Hein, L., 2007. Assessing the costs of land degradation: a case study for the PuentesCatchment, southeast Spain. Land Degradation and Development 18, 631–642.
Hennessey, K., Fawcett, R., Kirono, D., Mpelasoka, F., Jones, D., Bathols, J., Whetton, P.,Stafford Smith, M., Howden, M., Mitchell, C., Dlummer, N., 2008. An Assessment ofthe Impact of Climate Change on the Nature and Frequency of Exceptional ClimaticEvents. CSIRO and Bureau of Meteorology, Canberra.
Hillel, D., Vlek, P., 2005. The sustainability of irrigation. Advances in Agronomy 87,55–84.
Houlder, D., Hutchinson, M., Nix, H., McMahon, J., 1999. ANUCLIM Users' Guide.Australian National University, Canberra, Australia.
Howard, J.L., 2008. The future of the Murray River: amenity re-considered?Geographical Research 46, 291–302.
Isendahl, N., Schmidt, G., 2006. Drought in the Mediterranean: WWF Policy Proposals. .At URL http://assets.panda.org/downloads/wwf_drought_med_report_2006.pdf,accessed on 31/10/2008.
Lawson, K., Burns, K., Low, K., Heyhoe, E., Ahammad, H., 2008. Analysing the economicpotential of forestry for carbon sequestration under alternative carbon price paths.Australian Bureau of Agricultural and Resource Economics, Canberra, November2008. At URL http://www.treasury.gov.au/lowpollutionfuture/consultants_report/downloads/Economic_Potential_of_Forestry.pdf, accessed on 10/02/2009.
Lee, J.T., Thompson, S., 2005. Targeting sites for habitat creation: an investigation intoalternative scenarios. Landscape and Urban Planning 71, 17–28.
Loomis, J., Kent, P., Strange, L., Fausch, K., Covich, A., 2000. Measuring the total economicvalue of restoring ecosystem services in an impaired river basin: results from acontingent valuation survey. Ecological Economics 33, 103–117.
1042 N.D. Crossman et al. / Ecological Economics 69 (2010) 1031–1042
Luttik, J., 2000. The value of trees, water and open space as reflected by house prices inThe Netherlands. Landscape and Urban Planning 48, 161–167.
McColl, J.C., Young, M.D., 2005. Managing change: Australian structural adjustmentlessons for water. CSIRO Land and Water Technical Report 16/05, September 2005.
Messer, K.D., 2006. The conservation benefits of cost-effective land acquisition: a casestudy in Maryland. Journal of Environmental Management 79, 305–315.
Montecillo, O.P., Reeves, C., 2006. Loddon Murray Region Horticulture Gross Margins2005–2006. Department of Primary Industries, Victoria.
Montecillo, O.P., Jones, D., Grey, D., 2006. Northern Victoria Irrigated Cropping GrossMargins 2005–2006. Department of Primary Industries, Victoria.
Morse-McNabb, E., 2006. Strategic View of Service Needs: Torrumbarry Irrigation AreaAtlas. Primary Industries Research Victoria. 1 876356 84 7.
Murray Darling Basin Commission, 2005. Living Murray Business Plan. Murray DarlingBasin Commission, Canberra. At URL http://thelivingmurray.mdbc.gov.au/__data/page/1480/2005_TLM_Business_Plan.pdf, accessed on 21/10/2008.
National Land and Water Resources Audit, 2002. Australians and Natural ResourceManagement 2002. National Land and Water Resources Audit, Canberra.
National Research Council of the National Academies, 2005. Valuing EcosystemServices: Toward Better Environmental Decision-Making. National Academy ofSciences, Washington DC.
North Central Catchment Management Authority, 2003. North Central RegionalCatchment Strategy 2003–2007. North Central Catchment Management Authority,Victoria.
North Central Catchment Management Authority, 2005. North Central River HealthStrategy. North Central Catchment Management Authority, Victoria.
Pattanayak, S.K., 2004. Valuing watershed services: concepts and empirics fromSoutheast Asia. Agriculture, Ecosystems, and Environment 104, 171–184.
Peterson, D., Dwyer, G., Appels, D.C., Fry, J., 2005. Water trade in the southern Murray–Darling Basin. The Economic Record 81, S115–S127.
Postel, S.L., 2003. Securing water for people, crops, and ecosystems: new mindset andnew priorities. Natural Resources Forum 27, 89–98.
Quiggin, J., 2001. Environmental economics and the Murray–Darling river system.Australian Journal of Agricultural and Resource Economics 45, 67–94.
Qureshi, E., Connor, J., Kirby,M.,Mainudin,M., 2007. Economic assessmentof environmentalflows in the Murray Basin. Australian Journal of Agricultural and Resource Economics51, 283–305.
Sands, P.J., Landsberg, J.J., 2002. Parameterisation of 3-PG for plantation grown Eucalyptusglobulus. Forest Ecology and Management 163, 273–292.
Saroinsong, F., Harashina, K., Arifin, H., Gandasasmita, K., Sakamoto, K., 2007. Practicalapplication of a land resources information system for agricultural landscapeplanning. Landscape and Urban Planning 79, 38–52.
Shah, T., 2005. Groundwater and human development: challenges and opportunities inlivelihoods and environment. Water Science and Technology 51, 27–37.
SKM, 2008. Market based instruments for the Torrumbarry System: salt exportmechanisms from the Barr Creek catchment. Final Report.
Spash, C., Vatn, A., 2006. Transferring environmental value estimates: issues andalternatives. Ecological Economics 60, 379–388.
Spatial Sciences Group, 2006. Kerang irrigation region atlas. Primary Industries ResearchVictoria. 1 876356 48 0.
Tong, C., Feagin, R.A., Lu, J., Zhang, X., Zhu, X., Wang,W., He, W., 2007. Ecosystem servicevalues and restoration in the urban Sanyang Wetland of Wenzhou, China.Ecological Engineering 29, 249–258.
URS, 2005. Salinity Impact ofWater Trade, Review ofWater Trade in the Riverine Plains.Prepared for Murray–Darling Basin Commission, Canberra.
van Bueren, M., Bennett, J., 2000. Estimating community values for land and waterdegradation impacts. Final Report, Project 6.1.4. National Land and Water ResourcesAudit, Canberra.
van Bueren, M., Bennett, J., 2004. Towards the development of a transferable set ofvalue estimates for environmental attributes. The Australian Journal of Agriculturaland Resource Economics 48, 1–32.
Van der Horst, D., 2007. Assessing the efficiency gains of improved spatial targeting ofpolicy interventions; the example of an agri-environmental scheme. Journal ofEnvironmental Management 85, 1076–1087.
Westman, W.E., 1977. How much are nature's services worth? Science 197, 960–964.White, E.M., Leefers, L.A., 2007. Influence of natural amenities on residential property
values in a rural setting. Society and Natural Resources 20, 659–667.Wichelns, D., Oster, J.D., 2006. Sustainable irrigation is necessary and achievable, but
direct costs and environmental impacts can be substantial. Agricultural WaterManagement 86, 114–127.
Wilson, M.A., Carpenter, S.R., 1999. Economic valuation of freshwater ecosystemservices in the United States: 1971–1997. Ecological Applications 9, 772–783.
Wimalasuriya, R., 1998. North-Central Gross Margins 1998–1999. Department ofNatural Resources and Environment.
Wong, P., 2008a. Rudd Government to Invest $12.9 Billion inWater. . At URL http://www.environment.gov.au/minister/wong/2008/pubs/mr20080429.pdf, accessed on 21/10/2008.
Wong, P., 2008b. Government Water Purchase Secures Rights to 35 billion litres for theMurray Darling. . At URL http://www.environment.gov.au/minister/wong/2008/pubs/mr20080523.pdf, accessed on 31/10/2008.
Wünscher, T., Engel, S., Wunder, S., 2008. Spatial targeting of payments forenvironmental services: a tool for boosting conservation benefits. EcologicalEconomics 65, 822–833.
Yang, W., Khanna, M., Farnsworth, R., Onal, H., 2003. Integrating economic,environmental and GIS modelling to target cost effective land retirement inmultiple watersheds. Ecological Economics 46, 249–267.
Yang, W., Chang, J., Xu, B., Peng, C., Ge, Y., 2008. Ecosystem service value assessment forconstructed wetlands: a case study in Hangzhou, China. Ecological Economics 68,116–125.
Young, M.D., McColl, J.C., 2009. Double trouble: the importance of accounting for anddefining water entitlements consistent with hydrological realities. The AustralianJournal of Agricultural and Resource Economics 53, 19–35.
Zedler, J.B., 2003. Wetlands at your service: reducing impacts of agriculture at thewatershed scale. Frontiers in Ecology and the Environment 1, 65–72.
Zheng, B.F., Duan, J., Jia, J.S., Liu, F., Yan, Y., 2008. Assessment of ecosystem services ofLugu Lake watershed. International Journal of Sustainable Development andWorldEcology 15, 62–70.