identification of proteomic signatures associated with depression and psychotic depression in...
TRANSCRIPT
Identification of proteomic signatures associated withdepression and psychotic depression in post-mortembrains from major depression patients
D Martins-de-Souza1,2, PC Guest1, LW Harris1, N Vanattou-Saifoudine1, MJ Webster3, H Rahmoune1 and S Bahn1,4
Major depressive disorder (MDD) is a leading cause of disability worldwide and results tragically in the loss of almost one millionlives in Western societies every year. This is due to poor understanding of the disease pathophysiology and lack of empiricalmedical tests for accurate diagnosis or for guiding antidepressant treatment strategies. Here, we have used shotgun proteomicsin the analysis of post-mortem dorsolateral prefrontal cortex brain tissue from 24 MDD patients and 12 matched controls. Brainproteomes were pre-fractionated by gel electrophoresis and further analyzed by shotgun data-independent label-free liquidchromatography-mass spectrometry. This led to identification of distinct proteome fingerprints between MDD and controlsubjects. Some of these differences were validated by Western blot or selected reaction monitoring mass spectrometry. Thisincluded proteins associated with energy metabolism and synaptic function and we also found changes in the histidine triadnucleotide-binding protein 1 (HINT1), which has been implicated recently in regulation of mood and behavior. We also founddifferential proteome profiles in MDD with (n¼ 11) and without (n¼ 12) psychosis. Interestingly, the psychosis fingerprintshowed a marked overlap to changes seen in the brain proteome of schizophrenia patients. These findings suggest that it may bepossible to contribute to the disease understanding by distinguishing different subtypes of MDD based on distinct brainproteomic profiles.Translational Psychiatry (2012) 2, e87; doi:10.1038/tp.2012.13; published online 13 March 2012
Introduction
Major depressive disorder (MDD) is a serious psychiatriccondition affecting approximately 10% of the world populationwith a lifetime prevalence of 17%.1 The effects of MDD arewide-ranging, including a negative impact on families, workand relationships, and has been associated with debilitatingco-morbidities such as general ill health, substance abuse andanxiety disorders. Together, these factors contribute to anenormous significant financial burden on the healthcareservices.2 In addition, MDD subjects account for 60% ofsuicides in the United States.3 Although some molecularaspects of MDD have been identified, such as hypothalamic–pituitary–adrenal axis dysfunction,4 effects on memory5 andvolume reduction of certain brain regions such as hippocam-pus6 and prefrontal cortex,7 the underlying pathophysiology ofthis disorder has only been partially elucidated. The associa-tion between inflammation and MDD has been supported bythe fact that treatment of hepatitis C and certain cancerpatients with interferon-alpha,8,9 frequently induces depres-sive symptoms as side-effects. In addition, MDD is alsoassociated with auto-immune diseases10 and metabolicdisorders,11 and several studies have shown that the efficacyof antidepressants may be partly attributable to their anti-
inflammatory properties.12 As a consequence, currentlyavailable antidepressant medications often show only med-ium efficacy and can have serious side-effects.13 Therefore, itis important to increase our understanding of the physiologicalfactors underlying this condition before more effectivemedications can be developed.
Studies of MDD are complicated by the fact that it is asystemic, multifactorial disorder. Current hypotheses suggestthat MDD most likely arises from complex interactionsbetween genetic predisposition,14 disturbance of key mole-cular pathways including neurotransmitter systems andsynaptic plasticity,4 along with the impact of environmentalfactors such as stressful life events.15,16 Therefore, anincreased understanding of this disorder is likely to be gainedby application of molecular profiling analyses of relevant brainregions using approaches such as transcriptomics,17,18
lipidomics19 and proteomics.20 Of these platforms, proteo-mics may be the most appropriate for studies of psychiatricconditions considering that it is better suited for capturing thedynamic nature of perturbed biological systems.20,21
MDD patients can present with a great variety of symptomsincluding low mood, low self-esteem, loss of interest orpleasure in normally enjoyable activities and melancholia.MDD patients may also present with severe psychotic
Received 9 Septemeber 2011; revised 11 January 2012; accepted 15 January 2012
1Department of Chemical Engineering and Biotechnology, University of Cambridge, Cambridge, UK; 2Max Planck Institute for Psychiatry, Munich, Germany; 3StanleyBrain Research Laboratory, Stanley Medical Research Institute, Rockville, MD, USA and 4Department of Neuroscience, Erasmus Medical Centre, Rotterdam,The NetherlandsCorrespondence: Dr D Martins-de-Souza and Professor Sabine Bahn, Department of Chemical Engineering and Biotechnology, University of Cambridge, Tennis CourtRoad, Cambridge, Cambridgeshire CB2 1QT, UK.E-mails: [email protected] or [email protected]: depression; HINT1; major depressive disorder; mass spectrometry; proteomics; SRM
Citation: Transl Psychiatry (2012) 2, e87, doi:10.1038/tp.2012.13& 2012 Macmillan Publishers Limited All rights reserved 2158-3188/12
www.nature.com/tp
symptoms, including delusions and hallucinations. Similarsymptoms are often observed, for example, in schizophreniaalbeit with subtle differences. Therefore, the identification ofsymptom-related potential biomarker candidates22 could beuseful in combination with the existing clinical assessment formore accurate classification of MDD patients and also toprovide a biochemical comprehension of the molecularprocesses involved. These could be useful not only forpotential diagnostic purposes but also to provide a molecularmeans of distinguishing patients to facilitate much-neededpersonalized medicine strategies.
With this in mind, we have carried out shotgun proteomeanalyses as represented in Supplementary Material 1 onpost-mortem dorsolateral prefrontal cortex (DLPFC) tissuefrom MDD patients. Features such as volume reduction7 andreduced activation23 have previously suggested that effectson this brain region are associated with MDD.24 Weused label-free liquid chromatography mass spectrometryin data-independent mode (LC-MSE) to analyze DLPFCtissue from 24 MDD patients and 12 control subjects. TheDLPFC is known to be involved in executive and intellectualfunctions, integration of sensory and mnemonic informationand in working memory.25 Additionally, we have re-eval-uated the data considering those MDD patients whopresented with (n¼ 11) or without (n¼ 12) psychoticsymptoms, in an attempt to identify a MDD psychosis-specific signature.
Materials and methods
Clinical samples. DLPFC tissues (Brodmann area 9) werecollected post-mortem and frozen from MDD patients(n¼ 24), either with psychosis (n¼ 11) or without psychosis(n¼ 12) plus matched control subjects (n¼ 12) by theStanley Medical Research Institute (Bethesda, MD, USA).One of the MDD patients could not be defined as psychotic ornot. The diagnosis of MDD had been given ante-mortem.Consent was obtained by questionnaire-based telephoneinterview and signed by the interviewer and a witness. TheInstitutional Review Board at the Uniformed ServicesUniversity of Health Sciences determined that theprocedure was exempt from federal and state regulations
governing human research, as specimens were obtainedfrom cadavers and anonymized with respect to personalinformation. General patient information is given in Table 1and detailed information in Supplementary Material 2.
Sample and proteome preparation. Tissue samples(20 mg) were homogenized individually in 100ml of 7 M urea,2 M thiourea, 4% CHAPS, 2% ASB-14 and 70 mM DTT, asdescribed previously,26 using the Sample Grinding Kit (GEHealthcare, Little Chalfont, Bucks, UK). Samples were cen-trifuged for 10 min at 16 000� g, the supernatants werecollected and protein concentrations were determined usingthe Bradford dye-binding assay (Sigma, Poole, Dorset, UK).For enhancing proteome coverage, SDS–polyacrylamide gelelectrophoresis (SDS-PAGE) pre-fractionation was used forseparation of proteins according to apparent molecular size.Extracted protein samples (15 mg) were diluted in SDS-PAGEsample loading buffer (2% w/v SDS, 100 mM Tris (pH 6.8),10% glycerol, 100 mM DTT and 0.001% w/v bromophenolblue). Samples were heated for 5 min at 95 1C before elec-trophoresis on NuPAGE 4–12% bis-tris polyacrylamide gels(Invitrogen, Paisley, UK). Protein bands were visualized usingCoomassie blue staining. Each lane containing stained proteinbands was sliced in the horizontal direction to produce foursections corresponding to different apparent molecular weightranges. Each gel section was then subjected to trypsindigestion in situ as described previously,27 and resultingpeptide mixtures were lyophilized.
Nano-high-performance liquid chromatography—massspectrometry analyses. Lyophilized peptides were dissolvedin 0.1% formic acid and 0.5mg injected in duplicate into ananoUltra-Performance Liquid Chromatography instrumentcontaining a BEH-130 C18 column (75mm� 200 mm) at aflow rate of 0.3ml min–1 connected online to a Q-TOF PremierMass Spectrometer (Waters Corporation, Manchester, UK).The following gradient was applied over 140 min comprised ofsolvent A (0.1% aqueous formic acid) and solvent B(acetonitrile with 0.1% formic acid): 97/3% (A/B) to 70/30%in 90 min; 70/30 to 10/90% in 25 min; 10/90 to 3/97% in 5 min;10 min at 3/97%; returning to the initial condition in 1 min.Eluted peptides were measured in MSE mode (data-independent
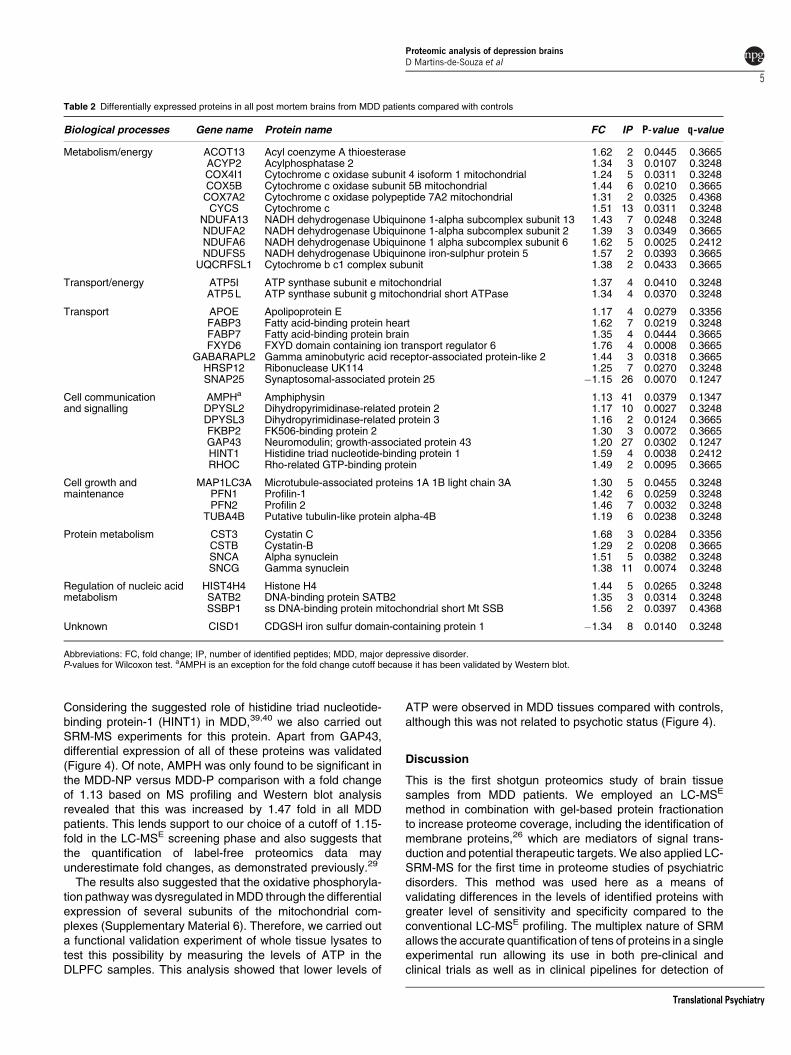
Table 1 Demographic information for the brain tissue samples used in the study
Control All MDD MDD-P MDD-NP Significance Significancet-test for MDD xCTRL ( P-value)
ANOVA for MDD-P xCTRL x MDD-NP ( P-value)
Sample size 12 24 12 12Age 47±12 42±11 40±11 43±10 0.38 0.30Postmortem interval 25.3±10.6 29.7±12.4 33.1±11 23.6±6.7 0.44 0.12Refrigerator interval 7.4±5.4 7.9±6.3 7.2±3.9 8±8.2 0.80 0.94Brain pH 6.6±0.2 6.7±0.2 6.6±0.2 6.7±0.1 0.44 0.12
Fisher’s exact testGender (male/female) 8/4 13/11 5/6 7/5 0.57 0.41 (MDD-P x CTRL)
0.99 (MDD-NP x CTRL)0.68 (MDD-P x MDD-NP)
Abbreviations: ANOVA, analysis of variance; CTRL, control; MDD, major depressive disorder.Values are mean ±s.d. MDD patients have been considered as one group (All MDD) or separately according to the presence of psychosis (MDD-P and MDD-NP).
Proteomic analysis of depression brainsD Martins-de-Souza et al
2
Translational Psychiatry

analysis) using the ion accounting algorithm28 for dataprocessing. Analysis of the resulting chromatograms/massspectra and database searching were performed using theProteinLynx Global Server (PLGS) v.2.4 (Waters Corp.).Firstly, raw data were processed and chromatograms alignedin time. Aligned peaks were extracted and abundancemeasurements obtained by integration of time, mass/charge(m/z) and intensity volumes, with normalization to the total ioncurrent. Data were searched against the SwissProt humandatabase (version 57.4; http://www.uniprot.org/) and alsoagainst a randomized database to exclude false-positives.The maximum false identification rate was set to 4% andpeptides had to be detected in 470% of samples to ensurebiological reproducibility. The criteria for protein identificationswere set at a minimum of three ion fragments per peptide,seven ion fragments per protein and one peptide per protein.However, we only considered for differential expressionanalyses proteins identified by at least two peptides. Modi-fications considered were carbamidomethylation of cysteinesand oxidation of methionine.
Quantitative protein expression and statistical analyseswere performed using the Rosetta Elucidator systemv.3.3.0.1.SP3.19 (Rosetta Inpharmatics, Seattle, WA, USA)and processed data from PLGS analysis. We established afold change cutoff of ±1.15 based on the following facts: (1)coefficient of variation calculated for all identified proteins was0.18±0.3 (mean±s.d.); (2) label-free proteomics has beenshown to underestimate fold changes,29 which is supportedby the fact that a protein with a fold change of 1.13 wasvalidated by Western blot analysis revealing a 1.47-foldchange.
Statistical analyses. Differences in protein expressionbetween MDD patients and controls were accessed usingWilcoxon signed-rank test, as the data were not assumed tobe normally distributed. Only differences with a Po0.05 wereconsidered significant. False discovery rate (FDR) wascalculated according to Benjamini and Hochberg.30 Noadjustments were made for multiple comparisons in orderto not exclude possible true positives.31 This approach willlead to fewer errors of interpretation as proteomic data arenot necessarily random but can be physiologically inter-dependent observations. Nevertheless, a FDR threshold ofapproximately 0.4 and a fold change cutoff of 15% for theshotgun proteome analyses was established.
Although groups are matched for demographic variables(Table 1), the influence of gender, age, alcohol abuse,smoking, post-mortem interval and refrigeration interval onthe data were accessed by using principal componentanalysis (PCA) as previously described.32 The PCA resultsare presented in Supplementary Material 3. Differentiallyexpressed proteins were not found to be correlated todemographics variables.
Selected reaction monitoring. Quantitative differences inthe levels of histidine triad nucleotide-binding protein 1(HINT1) and synaptosomal-associated protein 25(SNAP25) were validated using whole tissue lysates byselected reaction monitoring (SRM) mass spectrometry.Three SRM transitions of the HINT1 peptides ‘IIFEDDR’,
‘HISQISVAEDDDESLLGHLMIVGK’ and ‘MVVNEGSDGGQSVYHVHLHVLGGR’ were analyzed, as well as threeSRM transitions of the SNAP25 peptides ‘NELEEMQR’,‘AWGNNQDGVVASQPAR’ and ‘IEEGMDQINK’. Peptideswere selected based on identification in the LC-MSE datasetwith a high spectral quality, and if those peptides were pro-teotypic, which means an experimentally observable peptidethat uniquely identifies a specific protein or protein isoforms.33
Samples (0.2 mg) were prepared exactly like for LC-MSE
analyses. Whole digested lysates were injected in duplicateinto an identical LC system, as above, coupled to a Xevotriple-quadrupole mass spectrometer (Waters). For separa-tion of peptides, the following 48 min gradient was applied: 97/3% (A/B) to 60/40% B in 30 min; 60/40 to 15/85% in 2 min;5 min at 15/85%; returning to the initial condition in 1 min.Eluted peptides were measured in SRM mode using anelectrospray voltage of 22 kV and a cone voltage of 35 V. AllSRM functions had a 2 min window of the predicted retentiontime and the scan time was 20 milliseconds. The collisionenergy for each transition was optimized using Skylinesoftware34 based on the equation: CE¼ 0.034*m/zþ 3.314.Acquired data were processed using TargetLynx (Waters).Differences in protein levels between MDD and controls weredetermined using Student’s t-tests considering Po0.05 assignificant.
Western blot. Quantitative differences in the levels ofamphiphysin (AMPH) and growth-associated protein 43(GAP43) were assessed for validation of LC-MSE findingsby Western blot analyses due to their involvement insynapses. Total tissue lysates from MDD and controls werearranged in randomized order such that each of the groupswere represented on both gels. For each sample, 20 mg totalprotein was electrophoresed using pre-cast Novex 10–20%Tricine polyacrylamide gels (Invitrogen) at 125 V for 60 min,followed by semi-dry transfer to Immobilon-FL poly-vinyldiphenyl fluoride membranes (Millipore, Watford, UK).The membranes were incubated in a 1:1 mixture of Odysseyblocking buffer (Li-COR Biosciences, Cambridge, UK) andphosphate-buffered saline containing 0.1% Tween-20 for 1 hat room temperature. Membranes were then incubatedovernight at 4 1C with the following primary antibodies (bothfrom Abcam, Cambridge, UK): anti-amphiphysin (1:2000)and anti-GAP-43 (1/5000). Membranes were washed in Tris-buffered saline containing EDTA for 30 min, in phosphate-buffered saline for 2� 5 min and then for 1 h at roomtemperature with the appropriate IR dye-conjugatedsecondary antibodies (1:7500 for secondary rabbit antibodyand 1:15000 for secondary mouse antibody Li-CORBiosciences) in blocking buffer. Immunoreactive proteinbands were visualized using the Odyssey Infra-red imagingsystem (Li-COR Biosciences) and the integrated intensitiesof the bands measured. Values outlying by more than twostandard deviations from the mean were excluded from theanalysis. Differences in protein levels between MDD andcontrols were determined using Student’s t-tests consideringPo0.05 as significant.
ATP assay. In order to validate the differential expression ofseveral oxidative phosphorylation protein subunits, ATP
Proteomic analysis of depression brainsD Martins-de-Souza et al
3
Translational Psychiatry
levels were measured using the ATP Assay Quantification Kitaccording the manufacturers’ instructions (BioVision, SanFrancisco, CA, USA). Differences in ATP levels per 5mg ofbrain tissue between MDD and controls were determinedusing Student’s t-tests considering Po0.05 as significant.
Classification of differentially expressed proteins.Differentially expressed proteins in MDD DLPFC wereclassified according to their biological pathways and sub-cellular localization using the Human Protein ReferenceDatabase (http://www.hprd.org) and KEGG database(www.genome.jp/kegg). For interpretation of the functionalsignificance of differentially expressed proteins, the asso-ciated SwissProt accession numbers were uploaded into theIngenuity Pathways Knowledgebase (IPKB) (www.ingenuity.com) and these were analyzed to identify potential interactionsbetween these proteins and other proteins in the IPKB.
Results
Shotgun proteomics results. The shotgun LC-MSE
strategy for protein profiling of post-mortem DLPFCsamples from MDD (n¼ 24) and control subjects (n¼ 12) isoutlined in Supplementary Material 1. This resulted inidentification of 18 422 unique peptides in the 36 analyzedsamples, which led to identification of 1422 non-redundantproteins. From these, 526 proteins were identified with aminimum of two distinct peptides and detected at least in475% of samples. Overall, 35 of these were discarded,as they were keratin and trypsin contaminations. Therefore,491 proteins were considered for differential analyses. Theseproteins, their peptides and mass spectra data aredeposited at the PRIDE database35 (http://www.ebi.ac.uk/pride; accession number: 15310). There were no significantdifferences between MDD patients and controls with regardsto gender, age, post-mortem and refrigeration interval andbrain pH (Table 1). In addition, PCA of the data showed noovert effects of any of these parameters (SupplementaryMaterial 3).
Proteome differences between MDD and controlsubjects. Comparing all MDD patient samples to controls,significant differences (Po0.05; Wilcoxon test) in proteinlevels were observed for 39 proteins with a fold change cutoffof ±1.15 and a FDR of approximately 0.4 although mostwere approximately 0.350 (Table 2). No adjustment forFDR was used31 as described in material and methodssection. AMPH is the only exception for the fold changecutoff as it has been validated by Western Blot. Two of theseproteins were decreased and 37 increased in MDD patientscompared with controls. These proteins were classifiedaccording to their biological processes and cellularlocalization. The major pathways that are associated withMDD were metabolic/energy pathways (32%) and transportof molecules (22%) (Supplementary Material 4A). Themajority of the differentially expressed proteins (72%) wereidentified as cytoplasmic, and 13% were membrane-associated proteins (Supplementary Material 4B). We alsoidentified several proteins such as profilin 1 and 2 (PFN1 and
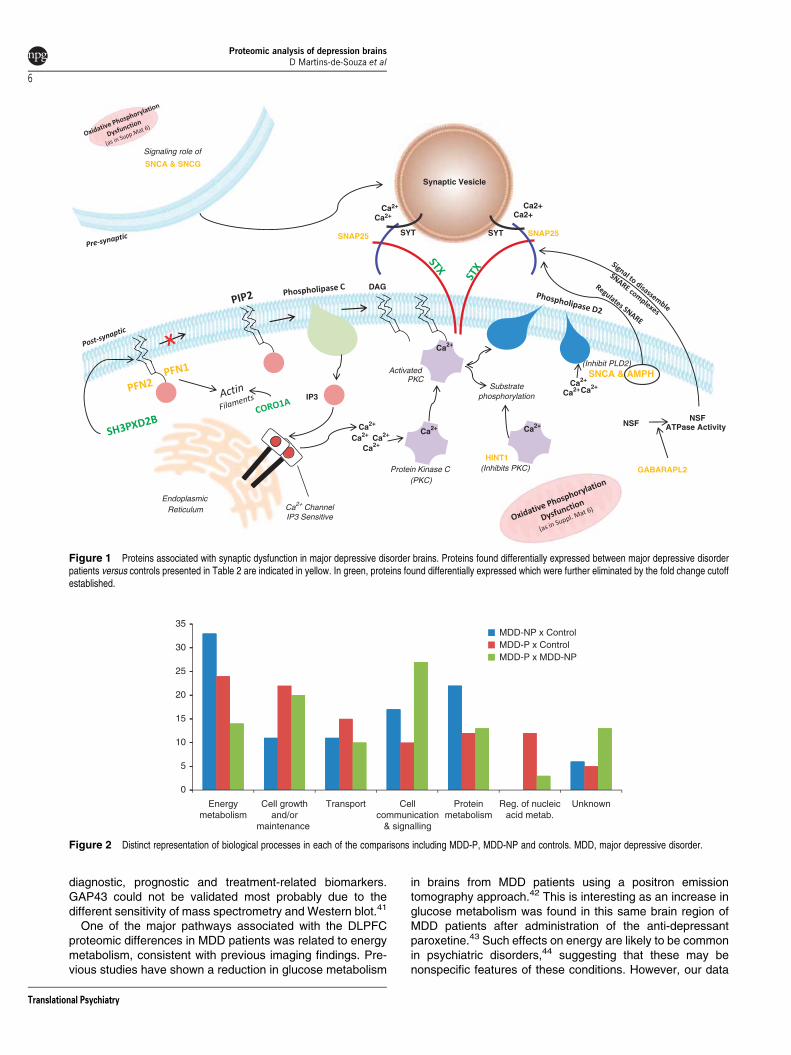
PFN2), SNAP25 and gamma aminobutyric acid receptor-associated protein like 2 (GABARAPL2) that are involved insynaptic transmission (Figure 1). Also, some of theseproteins have been previously associated with otherneurological or psychiatric conditions such as Huntington’sdisease (27%), schizophrenia (18%) and Alzheimer’sdisease (3%) (Supplementary Material 5).
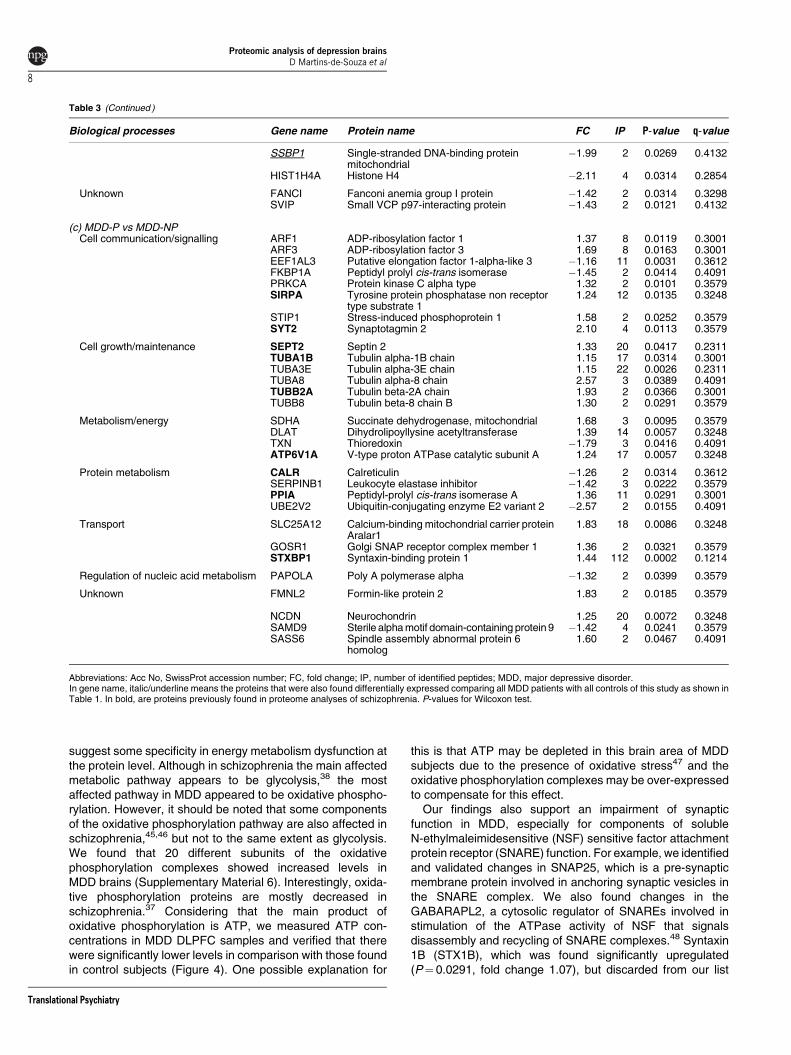
Proteome differences in MDD patients with and withoutpsychosis. Shotgun LC-MSE analysis of MDD patients withpsychosis (MDD-P) and without psychosis (MDD-NP)showed significant differences (Po0.05; Wilcoxon test) inproteomic profiles with an FDR of approximately 0.4.Proteomic comparison of MDD-NP patients (n¼ 12) withcontrol subjects (n¼ 12) led to identification of 18 alteredproteins. However, comparison of MDD-P patients (n¼ 11)with controls resulted in identification of 36 altered proteinsand direct comparison of the MDD-P and MDD-NPproteomes resulted in identification of 30 significantlydifferent proteins. All of the differentially expressed proteinsassociated with the categories above are listed in Table 3and classified according to their biological processes andcellular localization (Figure 2).
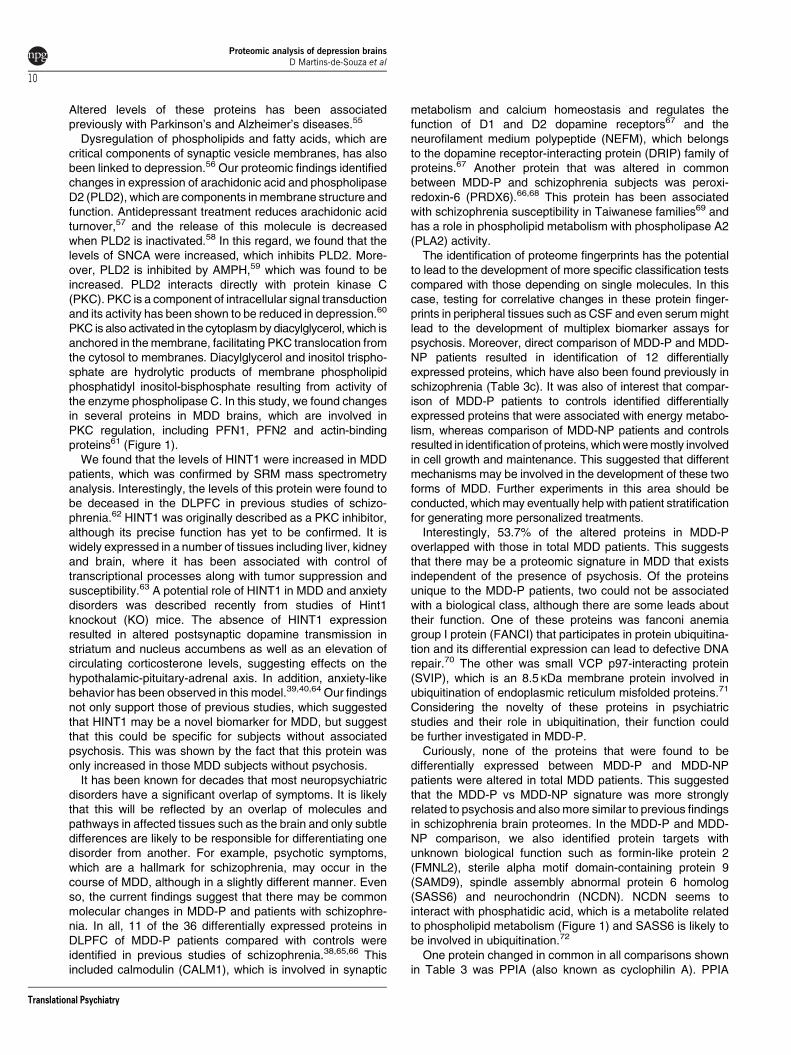
The overlapping proteins across these different compar-isons are shown in Figure 3. Five proteins (cystatin C (CST3),fatty acid-binding protein (FABP3), rho-related GTP-bindingprotein (RHOC), gamma synuclein (SNCG) and peptidylprolylisomerase A (PPIA)) were changed in common between theMDD-P and MDD-NP patients relative to controls (Figure 3a).A total of 13 proteins were altered specifically in the MDD-NPsubjects, including the HINT1 and the mitochondrial ATPsynthase subunits b and e (ATP5F1 and ATP5I). Overall, 31proteins were altered specifically in the MDD-P patientsincluding the synaptic vesicle-related proteins AMPH andSNAP25. Direct comparison of the MDD-P and MDD-NPproteomes resulted in identification of 25 altered proteins,which were not found in either of the MDD-P vs control orMDD-NP vs control comparisons (Figure 3b). These proteinsincluded ADP-ribosylation factor 1 and 3 (ARF1 and ARF3),synaptotagmin 2 (SYT2) and stress-induced phosphoprotein 1(STIP1). Moreover, there was no overlap of this signature withthat found in the total MDD vs control comparison.
Comparison of these datasets with those obtained fromprevious proteomic studies of post-mortem brain tissue fromschizophrenia patients36–38 showed a marked overlap be-tween the MDD-P and schizophrenia proteomes (Figure 3a).Also, the psychosis-specific fingerprint obtained by directcomparison of MDD-P and MDD-NP subjects showed a sig-nificant overlap with the schizophrenia fingerprint (Figure 3b).This included proteins such as SYT2, septin 2 (SEPT2),syntaxin-binding protein 1 (STXBP1) and calreticulin (CALR).
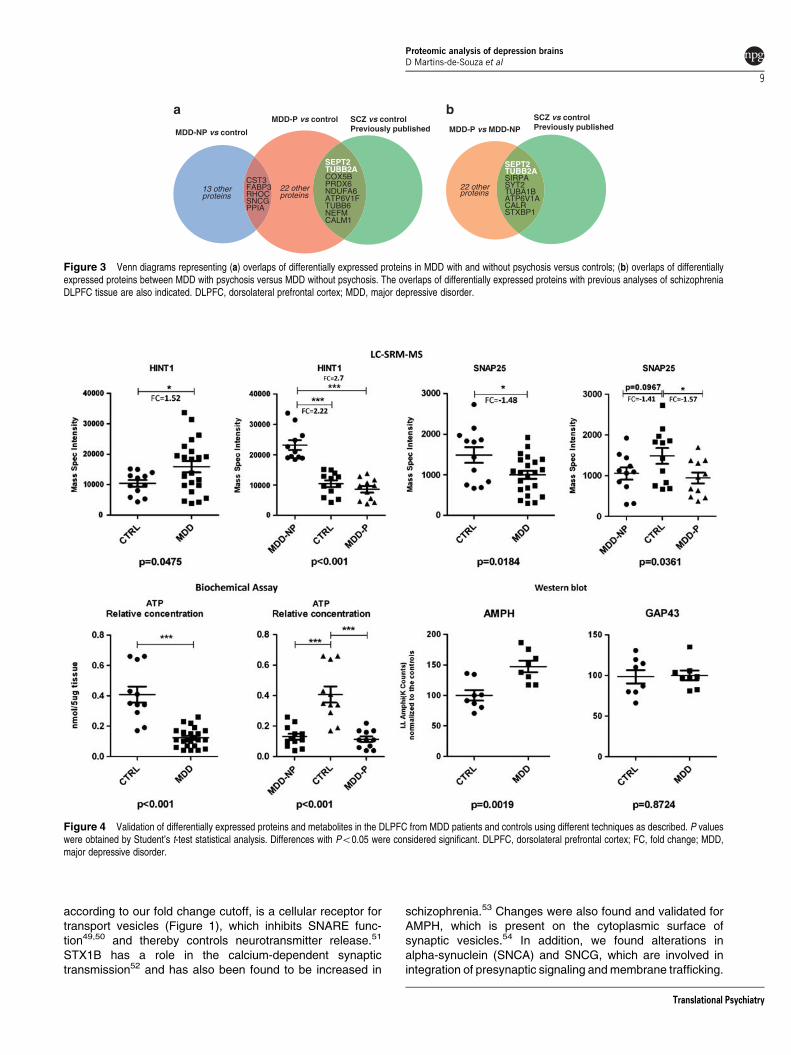
Validation experiments. Considering the impairment ofsynaptic transmission associated with MDD, as observedhere and previously,1,4 we carried out technical validation ofthree such differentially expressed candidate proteinsidentified by the shotgun LC-MSE molecular profilingmethod. Using Western blot, we analyzed the proteinsAMPH and GAP43 in whole tissue lysates as well as withSRM-MS to validate the differential expression of SNAP25.
Proteomic analysis of depression brainsD Martins-de-Souza et al
4
Translational Psychiatry
Considering the suggested role of histidine triad nucleotide-binding protein-1 (HINT1) in MDD,39,40 we also carried outSRM-MS experiments for this protein. Apart from GAP43,differential expression of all of these proteins was validated(Figure 4). Of note, AMPH was only found to be significant inthe MDD-NP versus MDD-P comparison with a fold changeof 1.13 based on MS profiling and Western blot analysisrevealed that this was increased by 1.47 fold in all MDDpatients. This lends support to our choice of a cutoff of 1.15-fold in the LC-MSE screening phase and also suggests thatthe quantification of label-free proteomics data mayunderestimate fold changes, as demonstrated previously.29
The results also suggested that the oxidative phosphoryla-tion pathway was dysregulated in MDD through the differentialexpression of several subunits of the mitochondrial com-plexes (Supplementary Material 6). Therefore, we carried outa functional validation experiment of whole tissue lysates totest this possibility by measuring the levels of ATP in theDLPFC samples. This analysis showed that lower levels of
ATP were observed in MDD tissues compared with controls,although this was not related to psychotic status (Figure 4).
Discussion
This is the first shotgun proteomics study of brain tissuesamples from MDD patients. We employed an LC-MSE
method in combination with gel-based protein fractionationto increase proteome coverage, including the identification ofmembrane proteins,26 which are mediators of signal trans-duction and potential therapeutic targets. We also applied LC-SRM-MS for the first time in proteome studies of psychiatricdisorders. This method was used here as a means ofvalidating differences in the levels of identified proteins withgreater level of sensitivity and specificity compared to theconventional LC-MSE profiling. The multiplex nature of SRMallows the accurate quantification of tens of proteins in a singleexperimental run allowing its use in both pre-clinical andclinical trials as well as in clinical pipelines for detection of
Table 2 Differentially expressed proteins in all post mortem brains from MDD patients compared with controls
Biological processes Gene name Protein name FC IP P-value q-value
Metabolism/energy ACOT13 Acyl coenzyme A thioesterase 1.62 2 0.0445 0.3665ACYP2 Acylphosphatase 2 1.34 3 0.0107 0.3248COX4I1 Cytochrome c oxidase subunit 4 isoform 1 mitochondrial 1.24 5 0.0311 0.3248COX5B Cytochrome c oxidase subunit 5B mitochondrial 1.44 6 0.0210 0.3665COX7A2 Cytochrome c oxidase polypeptide 7A2 mitochondrial 1.31 2 0.0325 0.4368
CYCS Cytochrome c 1.51 13 0.0311 0.3248NDUFA13 NADH dehydrogenase Ubiquinone 1-alpha subcomplex subunit 13 1.43 7 0.0248 0.3248NDUFA2 NADH dehydrogenase Ubiquinone 1-alpha subcomplex subunit 2 1.39 3 0.0349 0.3665NDUFA6 NADH dehydrogenase Ubiquinone 1 alpha subcomplex subunit 6 1.62 5 0.0025 0.2412NDUFS5 NADH dehydrogenase Ubiquinone iron-sulphur protein 5 1.57 2 0.0393 0.3665
UQCRFSL1 Cytochrome b c1 complex subunit 1.38 2 0.0433 0.3665
Transport/energy ATP5I ATP synthase subunit e mitochondrial 1.37 4 0.0410 0.3248ATP5 L ATP synthase subunit g mitochondrial short ATPase 1.34 4 0.0370 0.3248
Transport APOE Apolipoprotein E 1.17 4 0.0279 0.3356FABP3 Fatty acid-binding protein heart 1.62 7 0.0219 0.3248FABP7 Fatty acid-binding protein brain 1.35 4 0.0444 0.3665FXYD6 FXYD domain containing ion transport regulator 6 1.76 4 0.0008 0.3665
GABARAPL2 Gamma aminobutyric acid receptor-associated protein-like 2 1.44 3 0.0318 0.3665HRSP12 Ribonuclease UK114 1.25 7 0.0270 0.3248SNAP25 Synaptosomal-associated protein 25 �1.15 26 0.0070 0.1247
Cell communicationand signalling
AMPHa Amphiphysin 1.13 41 0.0379 0.1347DPYSL2 Dihydropyrimidinase-related protein 2 1.17 10 0.0027 0.3248DPYSL3 Dihydropyrimidinase-related protein 3 1.16 2 0.0124 0.3665FKBP2 FK506-binding protein 2 1.30 3 0.0072 0.3665GAP43 Neuromodulin; growth-associated protein 43 1.20 27 0.0302 0.1247HINT1 Histidine triad nucleotide-binding protein 1 1.59 4 0.0038 0.2412RHOC Rho-related GTP-binding protein 1.49 2 0.0095 0.3665
Cell growth andmaintenance
MAP1LC3A Microtubule-associated proteins 1A 1B light chain 3A 1.30 5 0.0455 0.3248PFN1 Profilin-1 1.42 6 0.0259 0.3248PFN2 Profilin 2 1.46 7 0.0032 0.3248
TUBA4B Putative tubulin-like protein alpha-4B 1.19 6 0.0238 0.3248
Protein metabolism CST3 Cystatin C 1.68 3 0.0284 0.3356CSTB Cystatin-B 1.29 2 0.0208 0.3665SNCA Alpha synuclein 1.51 5 0.0382 0.3248SNCG Gamma synuclein 1.38 11 0.0074 0.3248
Regulation of nucleic acidmetabolism
HIST4H4 Histone H4 1.44 5 0.0265 0.3248SATB2 DNA-binding protein SATB2 1.35 3 0.0314 0.3248SSBP1 ss DNA-binding protein mitochondrial short Mt SSB 1.56 2 0.0397 0.4368
Unknown CISD1 CDGSH iron sulfur domain-containing protein 1 �1.34 8 0.0140 0.3248
Abbreviations: FC, fold change; IP, number of identified peptides; MDD, major depressive disorder.P-values for Wilcoxon test. aAMPH is an exception for the fold change cutoff because it has been validated by Western blot.
Proteomic analysis of depression brainsD Martins-de-Souza et al
5
Translational Psychiatry
diagnostic, prognostic and treatment-related biomarkers.GAP43 could not be validated most probably due to thedifferent sensitivity of mass spectrometry and Western blot.41
One of the major pathways associated with the DLPFCproteomic differences in MDD patients was related to energymetabolism, consistent with previous imaging findings. Pre-vious studies have shown a reduction in glucose metabolism
in brains from MDD patients using a positron emissiontomography approach.42 This is interesting as an increase inglucose metabolism was found in this same brain region ofMDD patients after administration of the anti-depressantparoxetine.43 Such effects on energy are likely to be commonin psychiatric disorders,44 suggesting that these may benonspecific features of these conditions. However, our data
Ca2+
DAG
Endoplasmic Reticulum
IP3
Ca2+ ChannelIP3 Sensitive
Ca2+Ca2+ Ca2+
Ca2+Ca2+
Ca2+
Protein Kinase C(PKC)
Activated PKC
Substrate phosphorylation
(Inhibit PLD2)
HINT1(Inhibits PKC)
Ca2+
Ca2+Ca2+
SNAP25
GABARAPL2
SYT SYT
Ca2+Ca2+
Ca2+Ca2+
Synaptic Vesicle
NSFNSF
ATPase Activity
SNCA & SNCG
Signaling role of
SNAP25
SNCA & AMPH
Figure 1 Proteins associated with synaptic dysfunction in major depressive disorder brains. Proteins found differentially expressed between major depressive disorderpatients versus controls presented in Table 2 are indicated in yellow. In green, proteins found differentially expressed which were further eliminated by the fold change cutoffestablished.
30
35MDD-NP x ControlMDD-P x ControlMDD-P x MDD-NP
10
15
20
25
0
5
Energymetabolism
Cell growthand/or
maintenance
Transport Cellcommunication
& signalling
Proteinmetabolism
Reg. of nucleicacid metab.
Unknown
Figure 2 Distinct representation of biological processes in each of the comparisons including MDD-P, MDD-NP and controls. MDD, major depressive disorder.
Proteomic analysis of depression brainsD Martins-de-Souza et al
6
Translational Psychiatry

Table 3 Differentially expressed proteins comparing healthy controls to MDD patients divided in psychotic or non-psychotic patients
Biological processes Gene name Protein name FC IP P-value q-value
(a) MDD-NP vs controlsCell growth/maintenance TUBA4A Tubulin alpha-4A chain 2.03 2 0.0321 0.3725
TUBA4B Putative tubulin-like protein alpha-4B 1.33 6 0.0196 0.3725
Cell communication/signalling HINT1 Histidine triad nucleotide-binding protein 1 1.45 4 0.0063 0.3725RHOC Rho-related GTP-binding protein RhoC 1.36 2 0.0396 0.3725SIRPA Tyrosine protein phosphatase non receptor
type substrate 11.19 12 0.0293 0.3154
Metabolism/energy ATP5F1 ATP synthase subunit b mitochondrial 1.24 3 0.0245 0.3154ATP5I ATP synthase subunit e mitochondrial 1.58 3 0.0237 0.3725COX7A2 Cytochrome c oxidase polypeptide 7A2
mitochondrial1.55 2 0.0007 0.3725
CYCS Cytochrome c 1.59 13 0.0001 0.3725NDUFA2 NADH dehydrogenase ubiquinone 1 alpha
subcomplex subunit21.60 3 0.0401 0.3725
NDUFS5 NADH dehydrogenase ubiquinone iron sulfurprotein 5
1.67 2 0.0257 0.3725
Protein metabolism CST3 Cystatin C 1.58 3 0.0333 0.3725HSP90AA1 Heat-shock protein HSP 90-alpha 1.22 5 0.0327 0.3725PPIA Peptidyl-prolyl cis-trans isomerase A 1.37 3 0.0265 0.3725SNCG Gamma synuclein 1.38 11 0.0215 0.3725
Transport FABP3 Fatty acid-binding protein heart 1.45 6 0.0028 0.3725FXYD6 FXYD domain-containing ion transport
regulator 61.77 4 0.0039 0.3725
Unknown CISD1 CDGSH iron sulfur domain-containingprotein 1
1.64 8 0.0134 0.3725
(b) MDD-P vs controlsMetabolism/energy TXN Thioredoxin �1.33 3 0.0005 0.2854
MTHFD1 C-1-tetrahydrofolate synthase, cytoplasmic �1.45 2 0.0448 0.3654ACYP2 Acylphosphatase 2 �1.47 3 0.0344 0.2854COX5B Cytochrome c oxidase subunit 5B
mitochondrial�1.56 7 0.0453 0.2854
PRDX6 Peroxiredoxin-6, mitochondrial �1.60 5 0.0169 0.2854NDUFA13 NADH dehydrogenase ubiquinone 1 alpha
subcomplex subunit 13�1.61 7 0.0477 0.2854
NDUFA6 NADH dehydrogenase ubiquinone 1 alphasubcomplex subunit 6
�1.71 5 0.0022 0.2854
ACOT13 Acyl coenzyme A thioesterase 13 Short AcylCoA thioesterase 13
�1.88 2 0.0207 0.2854
ATP6V1F V type proton ATPase subunit F Short VATPase subunit F
�2.26 2 0.0492 0.2854
Cell growth/maintenance TUBB2A Tubulin beta-2A chain 1.58 2 0.0428 0.2854TUBB6 Tubulin beta-6 chain �1.24 5 0.0179 0.3654NEFM Neurofilament medium polypeptide �1.31 143 0.0079 0.1236PFN2 Profilin 2 �1.58 7 0.0209 0.2854SEPT2 Septin 2 1.25 20 0.0016 0.3298PFN1 Profilin-1 �1.59 6 0.0239 0.2655
Transport ATP6V1H V type proton ATPase subunit H Short VATPase subunit H
�1.15 24 0.0052 0.3654
SNAP25 Synaptosomal-associated protein 25 1.17 27 0.0048 0.2655FABP7 Fatty acid-binding protein brain �1.47 4 0.0393 0.2854GABARAPL2 Gamma aminobutyric acid receptor-
associated protein-like 2�1.72 3 0.0275 0.2854
FABP3 Fatty acid-binding protein heart �1.85 6 0.0371 0.2854
Cell communication/signalling AMPH Amphiphysin �1.16 40 0.0068 0.3024FKBP1A Peptidyl prolyl cis-trans isomerise �1.51 2 0.0230 0.4132RHOC Rho-related GTP-binding protein RhoC �1.63 2 0.0413 0.2854CALM1 Calmodulin �1.66 2 0.0275 0.2854
Protein metabolism PPIA Peptidyl-prolyl cis-trans isomerase A 1.29 11 0.0123 0.3298SNCG Gamma synuclein �1.37 11 0.0107 0.2655SNCA Alpha synuclein �1.58 5 0.0235 0.2854CSTB Cystatin-B �1.70 2 0.0474 0.4132CST3 Cystatin C �1.81 3 0.0357 0.2655
Regulation of nucleic acid metabolism PBXIP1 Pre B-cell leukemia transcription factor-interacting protein 1
�1.31 2 0.0123 0.3298
SATB2 DNA-binding protein SATB2 �1.64 3 0.0018 0.2854HIST1H2BL Histone H2B type 1-L �1.85 2 0.0412 0.4132
Proteomic analysis of depression brainsD Martins-de-Souza et al
7
Translational Psychiatry
suggest some specificity in energy metabolism dysfunction atthe protein level. Although in schizophrenia the main affectedmetabolic pathway appears to be glycolysis,38 the mostaffected pathway in MDD appeared to be oxidative phospho-rylation. However, it should be noted that some componentsof the oxidative phosphorylation pathway are also affected inschizophrenia,45,46 but not to the same extent as glycolysis.We found that 20 different subunits of the oxidativephosphorylation complexes showed increased levels inMDD brains (Supplementary Material 6). Interestingly, oxida-tive phosphorylation proteins are mostly decreased inschizophrenia.37 Considering that the main product ofoxidative phosphorylation is ATP, we measured ATP con-centrations in MDD DLPFC samples and verified that therewere significantly lower levels in comparison with those foundin control subjects (Figure 4). One possible explanation for
this is that ATP may be depleted in this brain area of MDDsubjects due to the presence of oxidative stress47 and theoxidative phosphorylation complexes may be over-expressedto compensate for this effect.
Our findings also support an impairment of synapticfunction in MDD, especially for components of solubleN-ethylmaleimidesensitive (NSF) sensitive factor attachmentprotein receptor (SNARE) function. For example, we identifiedand validated changes in SNAP25, which is a pre-synapticmembrane protein involved in anchoring synaptic vesicles inthe SNARE complex. We also found changes in theGABARAPL2, a cytosolic regulator of SNAREs involved instimulation of the ATPase activity of NSF that signalsdisassembly and recycling of SNARE complexes.48 Syntaxin1B (STX1B), which was found significantly upregulated(P¼ 0.0291, fold change 1.07), but discarded from our list
Table 3 (Continued )
Biological processes Gene name Protein name FC IP P-value q-value
SSBP1 Single-stranded DNA-binding proteinmitochondrial
�1.99 2 0.0269 0.4132
HIST1H4A Histone H4 �2.11 4 0.0314 0.2854
Unknown FANCI Fanconi anemia group I protein �1.42 2 0.0314 0.3298SVIP Small VCP p97-interacting protein �1.43 2 0.0121 0.4132
(c) MDD-P vs MDD-NPCell communication/signalling ARF1 ADP-ribosylation factor 1 1.37 8 0.0119 0.3001
ARF3 ADP-ribosylation factor 3 1.69 8 0.0163 0.3001EEF1AL3 Putative elongation factor 1-alpha-like 3 �1.16 11 0.0031 0.3612FKBP1A Peptidyl prolyl cis-trans isomerase �1.45 2 0.0414 0.4091PRKCA Protein kinase C alpha type 1.32 2 0.0101 0.3579SIRPA Tyrosine protein phosphatase non receptor
type substrate 11.24 12 0.0135 0.3248
STIP1 Stress-induced phosphoprotein 1 1.58 2 0.0252 0.3579SYT2 Synaptotagmin 2 2.10 4 0.0113 0.3579
Cell growth/maintenance SEPT2 Septin 2 1.33 20 0.0417 0.2311TUBA1B Tubulin alpha-1B chain 1.15 17 0.0314 0.3001TUBA3E Tubulin alpha-3E chain 1.15 22 0.0026 0.2311TUBA8 Tubulin alpha-8 chain 2.57 3 0.0389 0.4091TUBB2A Tubulin beta-2A chain 1.93 2 0.0366 0.3001TUBB8 Tubulin beta-8 chain B 1.30 2 0.0291 0.3579
Metabolism/energy SDHA Succinate dehydrogenase, mitochondrial 1.68 3 0.0095 0.3579DLAT Dihydrolipoyllysine acetyltransferase 1.39 14 0.0057 0.3248TXN Thioredoxin �1.79 3 0.0416 0.4091ATP6V1A V-type proton ATPase catalytic subunit A 1.24 17 0.0057 0.3248
Protein metabolism CALR Calreticulin �1.26 2 0.0314 0.3612SERPINB1 Leukocyte elastase inhibitor �1.42 3 0.0222 0.3579PPIA Peptidyl-prolyl cis-trans isomerase A 1.36 11 0.0291 0.3001UBE2V2 Ubiquitin-conjugating enzyme E2 variant 2 �2.57 2 0.0155 0.4091
Transport SLC25A12 Calcium-binding mitochondrial carrier proteinAralar1
1.83 18 0.0086 0.3248
GOSR1 Golgi SNAP receptor complex member 1 1.36 2 0.0321 0.3579STXBP1 Syntaxin-binding protein 1 1.44 112 0.0002 0.1214
Regulation of nucleic acid metabolism PAPOLA Poly A polymerase alpha �1.32 2 0.0399 0.3579
Unknown FMNL2 Formin-like protein 2 1.83 2 0.0185 0.3579
NCDN Neurochondrin 1.25 20 0.0072 0.3248SAMD9 Sterile alpha motif domain-containing protein 9 �1.42 4 0.0241 0.3579SASS6 Spindle assembly abnormal protein 6
homolog1.60 2 0.0467 0.4091
Abbreviations: Acc No, SwissProt accession number; FC, fold change; IP, number of identified peptides; MDD, major depressive disorder.In gene name, italic/underline means the proteins that were also found differentially expressed comparing all MDD patients with all controls of this study as shown inTable 1. In bold, are proteins previously found in proteome analyses of schizophrenia. P-values for Wilcoxon test.
Proteomic analysis of depression brainsD Martins-de-Souza et al
8
Translational Psychiatry
according to our fold change cutoff, is a cellular receptor fortransport vesicles (Figure 1), which inhibits SNARE func-tion49,50 and thereby controls neurotransmitter release.51
STX1B has a role in the calcium-dependent synaptictransmission52 and has also been found to be increased in
schizophrenia.53 Changes were also found and validated forAMPH, which is present on the cytoplasmic surface ofsynaptic vesicles.54 In addition, we found alterations inalpha-synuclein (SNCA) and SNCG, which are involved inintegration of presynaptic signaling and membrane trafficking.
SEPT2TUBB2ASIRPASYT2TUBA1BATP6V1ACALRSTXBP1
MDD-P vs MDD-NP
SCZ vs controlPreviously published
22 other proteins
SEPT2TUBB2ACOX5BPRDX6NDUFA6ATP6V1FTUBB6NEFMCALM1
CST3FABP3RHOCSNCGPPIA
MDD-NP vs control
MDD-P vs control SCZ vs controlPreviously published
13 other proteins
22 other proteins
Figure 3 Venn diagrams representing (a) overlaps of differentially expressed proteins in MDD with and without psychosis versus controls; (b) overlaps of differentiallyexpressed proteins between MDD with psychosis versus MDD without psychosis. The overlaps of differentially expressed proteins with previous analyses of schizophreniaDLPFC tissue are also indicated. DLPFC, dorsolateral prefrontal cortex; MDD, major depressive disorder.
Figure 4 Validation of differentially expressed proteins and metabolites in the DLPFC from MDD patients and controls using different techniques as described. P valueswere obtained by Student’s t-test statistical analysis. Differences with Po0.05 were considered significant. DLPFC, dorsolateral prefrontal cortex; FC, fold change; MDD,major depressive disorder.
Proteomic analysis of depression brainsD Martins-de-Souza et al
9
Translational Psychiatry
Altered levels of these proteins has been associatedpreviously with Parkinson’s and Alzheimer’s diseases.55
Dysregulation of phospholipids and fatty acids, which arecritical components of synaptic vesicle membranes, has alsobeen linked to depression.56 Our proteomic findings identifiedchanges in expression of arachidonic acid and phospholipaseD2 (PLD2), which are components in membrane structure andfunction. Antidepressant treatment reduces arachidonic acidturnover,57 and the release of this molecule is decreasedwhen PLD2 is inactivated.58 In this regard, we found that thelevels of SNCA were increased, which inhibits PLD2. More-over, PLD2 is inhibited by AMPH,59 which was found to beincreased. PLD2 interacts directly with protein kinase C(PKC). PKC is a component of intracellular signal transductionand its activity has been shown to be reduced in depression.60
PKC is also activated in the cytoplasm by diacylglycerol, which isanchored in the membrane, facilitating PKC translocation fromthe cytosol to membranes. Diacylglycerol and inositol trispho-sphate are hydrolytic products of membrane phospholipidphosphatidyl inositol-bisphosphate resulting from activity ofthe enzyme phospholipase C. In this study, we found changesin several proteins in MDD brains, which are involved inPKC regulation, including PFN1, PFN2 and actin-bindingproteins61 (Figure 1).
We found that the levels of HINT1 were increased in MDDpatients, which was confirmed by SRM mass spectrometryanalysis. Interestingly, the levels of this protein were found tobe deceased in the DLPFC in previous studies of schizo-phrenia.62 HINT1 was originally described as a PKC inhibitor,although its precise function has yet to be confirmed. It iswidely expressed in a number of tissues including liver, kidneyand brain, where it has been associated with control oftranscriptional processes along with tumor suppression andsusceptibility.63 A potential role of HINT1 in MDD and anxietydisorders was described recently from studies of Hint1knockout (KO) mice. The absence of HINT1 expressionresulted in altered postsynaptic dopamine transmission instriatum and nucleus accumbens as well as an elevation ofcirculating corticosterone levels, suggesting effects on thehypothalamic-pituitary-adrenal axis. In addition, anxiety-likebehavior has been observed in this model.39,40,64 Our findingsnot only support those of previous studies, which suggestedthat HINT1 may be a novel biomarker for MDD, but suggestthat this could be specific for subjects without associatedpsychosis. This was shown by the fact that this protein wasonly increased in those MDD subjects without psychosis.
It has been known for decades that most neuropsychiatricdisorders have a significant overlap of symptoms. It is likelythat this will be reflected by an overlap of molecules andpathways in affected tissues such as the brain and only subtledifferences are likely to be responsible for differentiating onedisorder from another. For example, psychotic symptoms,which are a hallmark for schizophrenia, may occur in thecourse of MDD, although in a slightly different manner. Evenso, the current findings suggest that there may be commonmolecular changes in MDD-P and patients with schizophre-nia. In all, 11 of the 36 differentially expressed proteins inDLPFC of MDD-P patients compared with controls wereidentified in previous studies of schizophrenia.38,65,66 Thisincluded calmodulin (CALM1), which is involved in synaptic
metabolism and calcium homeostasis and regulates thefunction of D1 and D2 dopamine receptors67 and theneurofilament medium polypeptide (NEFM), which belongsto the dopamine receptor-interacting protein (DRIP) family ofproteins.67 Another protein that was altered in commonbetween MDD-P and schizophrenia subjects was peroxi-redoxin-6 (PRDX6).66,68 This protein has been associatedwith schizophrenia susceptibility in Taiwanese families69 andhas a role in phospholipid metabolism with phospholipase A2(PLA2) activity.
The identification of proteome fingerprints has the potentialto lead to the development of more specific classification testscompared with those depending on single molecules. In thiscase, testing for correlative changes in these protein finger-prints in peripheral tissues such as CSF and even serum mightlead to the development of multiplex biomarker assays forpsychosis. Moreover, direct comparison of MDD-P and MDD-NP patients resulted in identification of 12 differentiallyexpressed proteins, which have also been found previously inschizophrenia (Table 3c). It was also of interest that compar-ison of MDD-P patients to controls identified differentiallyexpressed proteins that were associated with energy metabo-lism, whereas comparison of MDD-NP patients and controlsresulted in identification of proteins, which were mostly involvedin cell growth and maintenance. This suggested that differentmechanisms may be involved in the development of these twoforms of MDD. Further experiments in this area should beconducted, which may eventually help with patient stratificationfor generating more personalized treatments.
Interestingly, 53.7% of the altered proteins in MDD-Poverlapped with those in total MDD patients. This suggeststhat there may be a proteomic signature in MDD that existsindependent of the presence of psychosis. Of the proteinsunique to the MDD-P patients, two could not be associatedwith a biological class, although there are some leads abouttheir function. One of these proteins was fanconi anemiagroup I protein (FANCI) that participates in protein ubiquitina-tion and its differential expression can lead to defective DNArepair.70 The other was small VCP p97-interacting protein(SVIP), which is an 8.5 KDa membrane protein involved inubiquitination of endoplasmic reticulum misfolded proteins.71
Considering the novelty of these proteins in psychiatricstudies and their role in ubiquitination, their function couldbe further investigated in MDD-P.
Curiously, none of the proteins that were found to bedifferentially expressed between MDD-P and MDD-NPpatients were altered in total MDD patients. This suggestedthat the MDD-P vs MDD-NP signature was more stronglyrelated to psychosis and also more similar to previous findingsin schizophrenia brain proteomes. In the MDD-P and MDD-NP comparison, we also identified protein targets withunknown biological function such as formin-like protein 2(FMNL2), sterile alpha motif domain-containing protein 9(SAMD9), spindle assembly abnormal protein 6 homolog(SASS6) and neurochondrin (NCDN). NCDN seems tointeract with phosphatidic acid, which is a metabolite relatedto phospholipid metabolism (Figure 1) and SASS6 is likely tobe involved in ubiquitination.72
One protein changed in common in all comparisons shownin Table 3 was PPIA (also known as cyclophilin A). PPIA
Proteomic analysis of depression brainsD Martins-de-Souza et al
10
Translational Psychiatry
accelerates the folding of proteins that are involved incyclosporin A-mediated immunosuppression.73 Interestingly,this protein has also been found to be increased inschizophrenia thalamus,38 which suggests some relationshipwith the psychosis status. However, considering the fact thatthis protein is also differentially expressed in MDD-NPcompared with controls, it does not seem to be a specificbiomarker candidate to psychosis, but most likely associatedto psychiatric conditions. On the other hand, the proteinpeptidylprolyl cis-trans isomerase (FKBP1A), which is fromthe same family of PPIA, was specifically altered in MDD-Psamples. FKBP1A acts on immunoregulation and cellularprocesses involved in protein folding and trafficking and it alsointeracts with several intracellular signal transduction pro-teins.74 Moreover, FKBP1A binds to the immunosuppres-sants FK506 and rapamycin. Interestingly, the mammaliantarget of rapamycin (mTOR) signaling pathway in theprefrontal cortex is compromised in MDD,75 and mTORinteracts with FKBP1A bound to rapamycin.76 FKBP1A alsointeracts with the transforming growth factor (TGF)-betareceptor, which is critical for modulation of GABA synaptictransmission and dendritic homeostasis.77 Moreover, FMNL2,which we also found increased in MDD-P, is also part of TGF-beta pathway.78 These findings warrant further studies on theinvolvement of these proteins in psychiatric disorders.
Figure 2 represents a broader perspective of the uniquefindings of each of the compared groups. Changes in energymetabolism are notable in both MDD-P and MDD-NP.Although protein metabolism processes are more related toMDD-NP, changes in cell growth/maintenance, transport andregulation of nucleic acids are more related to MDD-P. Whenthe two groups of MDD patients are compared, defects in cellsignaling are pronounced so as are proteins with unknownbiological processes. This last group of proteins should befurther studied for providing more leads about the stratificationof different MDD subtypes.
It is widely known that factors such as age, gender,postmortem interval, drug treatment and others may haveconfounding effects on global proteomic studies involvingpost-mortem samples.79 None of the factors considered hereseem to have had a significant effect on the analyses.Compared groups are matched for demographic variablesand these have not shown significant differences (Table 1). Inaddition, no unusual segregation of subjects using principlecomponent analyses has been observed (Supplementarymaterial 3). However, it should be noted that information wasnot available regarding the number of patients who wererelapsed or who were on or off medication at the time of death.Although some effects on proteomic changes were observedwhen comparing MDD patients that committed suicide(n¼ 17) with non-suicide MDD patients (n¼ 6), we could notexplore this any further due to the low numbers of subjectswho did not die from suicide. Moreover, in the non-suicidegroup, some of these subjects actually attempted suicidealthough they were not successful.
The static nature of post-mortem brain tissue and limitedsample sizes can be a drawback in studies such as the onepresented here. Therefore, a replication of this study in anindependent sample would be essential. However, we concurwith a recent report that the analysis of post-mortem tissue
from patients in brain disorders is indispensable, especiallyconsidering that it has generated important and uniqueinsights for psychiatric studies.80
Our systems biology analyses of the MDD brain proteomeshowed that some of the differentially expressed proteinsfound in subjects with MDD have been associated previouslywith other diseases such as Huntington’s and Alzheimer’sdisease and schizophrenia. This supports the notion thatneurological and psychiatric disorders may share commonpathways at the molecular level. Therefore, identification ofmultiple components of these conditions may be required inorder to identify unique biomarker fingerprints. This mayrequire identification of differences in the expression ofseveral genes and proteins, together with consideration ofpotential environmental factors. Nevertheless, we and othershave identified peculiarities for different diseases, as seen bydifferential expression of specific proteins. In fact, we showedthat the changes in HINT1 expression were specific for MDD-NP in the DLPFC. Moreover, there appears to be distinctenergy metabolism signatures for MDD and schizophrenia,with MDD affected more by changes in oxidative phosphor-ylation and schizophrenia through glycolysis-related path-ways.
The current findings support the known impairment onsynaptic transmission and especially on SNARE-relatedproteins in MDD. We also attempted to identify biomarker-specific signatures for subgroups of MDD through studies ondepression associated with psychosis and even with suicide.Interestingly, we found a significant overlap of differentiallyexpressed proteins in post-mortem brain tissue from MDDsubjects with psychosis, with that of schizophrenia subjects.
These findings suggest that it may be possible to distinguishdifferent subtypes of MDD patients based on differences inbrain proteomic profiles. Translating such findings to theperiphery might lead to novel personalized medicine strate-gies based on patient stratification according to molecularprofiles. Also, the identification of new models for MDD basedon brain and serum molecular profiles could lead to thedevelopment of such models for use in drug discovery. Thiscould lead to more targeted treatment approaches and reducethe rate of drug attrition within the field of neuropsychiatricdisorders.
Conflict of interest
PCG, HR and SB are consultants for Psynova Neurotech Ltd.
Acknowledgements. We would like to sincerely thank all tissue donorsand their families for comprehending how important their consent is to our researchand to the lives of patients. We also thank Professor Fuller Torrey and the StanleyMedical Research Institute for material donation and awarded grants.
1. Fava M, Kendler KS. Major depressive disorder. Neuron 2000; 28: 335–341.2. Kendler KS. Major depression and generalised anxiety disorder. Same genes,
(partly)different environments–revisited. Br J Psychiatry Suppl 1996; 30: 68–75.3. Henriksson MM, Aro HM, Marttunen MJ, Heikkinen ME, Isometsa ET, Kuoppasalmi KI
et al. Mental disorders and comorbidity in suicide. Am J Psychiatry 1993; 150: 935–940.4. Harrison PJ. The neuropathology of primary mood disorder. Brain 2002; 125(Part 7):
1428–1449.5. Berke JD, Hyman SE. Addiction, dopamine, and the molecular mechanisms of memory.
Neuron 2000; 25: 515–532.
Proteomic analysis of depression brainsD Martins-de-Souza et al
11
Translational Psychiatry
6. McKinnon MC, Yucel K, Nazarov A, MacQueen GM. A meta-analysis examining clinicalpredictors of hippocampal volume in patients with major depressive disorder. J PsychiatryNeurosci 2009; 34: 41–54.
7. Drevets WC, Ongur D, Price JL. Neuroimaging abnormalities in the subgenual prefrontalcortex: implications for the pathophysiology of familial mood disorders. Mol Psychiatry1998; 3: 220–226, 190-221.
8. Lotrich FE. Major depression during interferon-alpha treatment: vulnerability andprevention. Dialogues Clin Neurosci 2009; 11: 417–425.
9. Capuron L, Ravaud A, Dantzer R. Early depressive symptoms in cancer patients receivinginterleukin 2 and/or interferon alfa-2b therapy. J Clin Oncol 2000; 18:2143–2151.
10. Marques-Deak A, Cizza G, Sternberg E. Brain-immune interactions and diseasesusceptibility. Mol Psychiatry 2005; 10: 239–250.
11. Gans RO. The metabolic syndrome, depression, and cardiovascular disease: interrelatedconditions that share pathophysiologic mechanisms. Med Clin North Am 2006;90: 573–591.
12. Roumestan C, Michel A, Bichon F, Portet K, Detoc M, Henriquet C et al. Anti-inflammatoryproperties of desipramine and fluoxetine. Respir Res 2007; 8: 35.
13. Fava GA. Subclinical symptoms in mood disorders: pathophysiological and therapeuticimplications. Psychol Med 1999; 29: 47–61.
14. McGuffin P, Katz R. The genetics of depression and manic-depressive disorder. Br JPsychiatry 1989; 155: 294–304.
15. Agid O, Kohn Y, Lerer B. Environmental stress and psychiatric illness. BiomedPharmacother 2000; 54: 135–141.
16. Lundberg P, Cantor-Graae E, Rukundo G, Ashaba S, Ostergren PO. Urbanicity of place ofbirth and symptoms of psychosis, depression and anxiety in Uganda. Br J Psychiatry 2009;195: 156–162.
17. Choudary PV, Molnar M, Evans SJ, Tomita H, Li JZ, Vawter MP et al. Altered corticalglutamatergic and GABAergic signal transmission with glial involvement in depression.Proc Natl Acad Sci USA 2005; 102: 15653–15658.
18. Sequeira A, Mamdani F, Ernst C, Vawter MP, Bunney WE, Lebel V et al. Global brain geneexpression analysis links glutamatergic and GABAergic alterations to suicide and majordepression. PLoS One 2009; 4: e6585.
19. Lalovic A, Levy E, Canetti L, Sequeira A, Montoudis A, Turecki G. Fatty acid composition inpostmortem brains of people who completed suicide. J Psychiatry Neurosci 2007; 32:363–370.
20. Martins-de-Souza D, Harris LW, Guest PC, Turck CW, Bahn S. The role of proteomics indepression research. Eur Arch Psychiatry Clin Neurosci 2010; 260: 499–506.
21. Filiou MD, Turck CW, Martins-de-Souza D. Quantitative proteomics for investigatingpsychiatric disorders. Proteomics Clin Appl 2011; 5: 38–49.
22. Martins-de-Souza D. Is the word ‘biomarker’ being properly used by proteomics research inneuroscience? Eur Arch Psychiatry Clin Neurosci 2010; 260: 561–562.
23. Halari R, Simic M, Pariante CM, Papadopoulos A, Cleare A, Brammer M et al. Reducedactivation in lateral prefrontal cortex and anterior cingulate during attention and cognitivecontrol functions in medication-naive adolescents with depression compared to controls. JChild Psychol Psychiatry 2009; 50: 307–316.
24. Chang CC, Yu SC, McQuoid DR, Messer DF, Taylor WD, Singh K et al. Reduction ofdorsolateral prefrontal cortex gray matter in late-life depression. Psychiatry Res 2011;193: 1–6.
25. Miller EK, Cohen JD. An integrative theory of prefrontal cortex function. Annu Rev Neurosci2001; 24: 167–202.
26. Martins-de-Souza D, Menezes de Oliveira B, dos Santos Farias A, Horiuchi RS, CrepaldiDomingues C, de Paula E et al. The use of ASB-14 in combination with CHAPS is the bestfor solubilization of human brain proteins for two-dimensional gel electrophoresis. BriefFunct Genomic Proteomic 2007; 6: 70–75.
27. Martins-de-Souza D, Guest PC, Steeb H, Pietsch S, Rahmoune H, Harris LW et al.Characterizing the proteome of the human dorsolateral prefrontal cortex by shotgun massspectrometry. Proteomics 2011; 11: 2347–2353.
28. Li GZ, Vissers JP, Silva JC, Golick D, Gorenstein MV, Geromanos SJ. Database searchingand accounting of multiplexed precursor and product ion spectra from the dataindependent analysis of simple and complex peptide mixtures. Proteomics 2009; 9:1696–1719.
29. Levin Y, Hradetzky E, Bahn S. Quantification of proteins using data-independent analysis(MSE) in simple andcomplex samples: a systematic evaluation. Proteomics 2011; 11:3273–3287.
30. Benjamini Y, Hochberg Y. Controlling the false discovery rate: a practical and powerfulapproach to multiple testing. J R Statist Soc 1995; 57: 289–300.
31. Rothman KJ. No adjustments are needed for multiple comparisons. Epidemiology 1990; 1:43–46.
32. Levin Y, Wang L, Schwarz E, Koethe D, Leweke FM, Bahn S. Global proteomic profilingreveals altered proteomic signature in schizophrenia serum. Mol Psychiatry 2010; 15:1088–1100.
33. Kuster B, Schirle M, Mallick P, Aebersold R. Scoring proteomes with proteotypic peptideprobes. Nat Rev Mol Cell Biol 2005; 6: 577–583.
34. MacLean B, Tomazela DM, Shulman N, Chambers M, Finney GL, Frewen B et al. Skyline:an open source document editor for creating and analyzing targeted proteomicsexperiments. Bioinformatics 2010; 26: 966–968.
35. Vizcaino JA, Cote R, Reisinger F, Foster JM, Mueller M, Rameseder J et al. A guide to theProteomics Identifications Database proteomics data repository. Proteomics 2009; 9:4276–4283.
36. Martins-De-Souza D, Dias-Neto E, Schmitt A, Falkai P, Gormanns P, Maccarrone Get al. Proteome analysis of schizophrenia brain tissue. World J Biol Psychiatry 2010; 11:110–120.
37. Martins-de-Souza D, Harris LW, Guest PC, Bahn S. The role of energy metabolismdysfunction and oxidative stress in schizophrenia revealed by proteomics. Antioxid RedoxSignal 2011; 15: 2067–2079.
38. Martins-de-Souza D, Maccarrone G, Wobrock T, Zerr I, Gormanns P, Reckow S et al.Proteome analysis of the thalamus and cerebrospinal fluid reveals glycolysis dysfunctionand potential biomarkers candidates for schizophrenia. J Psychiatr Res 2010; 44:1176–1189.
39. Barbier E, Wang JB. Anti-depressant and anxiolytic like behaviors in PKCI/HINT1 knockoutmice associated with elevated plasma corticosterone level. BMC Neurosci 2009; 10: 132.
40. Barbier E, Zapata A, Oh E, Liu Q, Zhu F, Undie A et al. Supersensitivity to amphetamine inprotein kinase-C interacting protein/HINT1 knockout mice. Neuropsychopharmacology2007; 32: 1774–1782.
41. Martins-de-Souza D, Guest PC, Vanattou-Saifoudine N, Harris LW, Bahn S. ProteomicTechnologies for Biomarker Studies in Psychiatry: Advances and Needs. Int Rev Neurobiol2011; 101: 33.
42. Baxter Jr LR, Schwartz JM, Phelps ME, Mazziotta JC, Guze BH, Selin CE et al. Reductionof prefrontal cortex glucose metabolism common to three types of depression. Arch GenPsychiatry 1989; 46: 243–250.
43. Kennedy SH, Evans KR, Kruger S, Mayberg HS, Meyer JH, McCann S et al. Changes inregional brain glucose metabolism measured with positron emission tomography afterparoxetine treatment of major depression. Am J Psychiatry 2001; 158: 899–905.
44. Rezin GT, Amboni G, Zugno AI, Quevedo J, Streck EL. Mitochondrial dysfunction andpsychiatric disorders. Neurochem Res 2009; 34: 1021–1029.
45. Karry R, Klein E, Ben Shachar D. Mitochondrial complex I subunits expression is altered inschizophrenia: a postmortem study. Biol Psychiatry 2004; 55: 676–684.
46. Martins-de-Souza D, Gattaz WF, Schmitt A, Maccarrone G, Hunyadi-Gulyas E, Eberlin MNet al. Proteomic analysis of dorsolateral prefrontal cortex indicates the involvement ofcytoskeleton, oligodendrocyte, energy metabolism and new potential markers inschizophrenia. J Psychiatr Res 2009; 43: 978–986.
47. Cumurcu BE, Ozyurt H, Etikan I, Demir S, Karlidag R. Total antioxidant capacity and totaloxidant status in patients with major depression: impact of antidepressant treatment.Psychiatry Clin Neurosci 2009; 63: 639–645.
48. Sagiv Y, Legesse-Miller A, Porat A, Elazar Z. GATE-16, a membrane transportmodulator, interacts with NSF and the Golgi v-SNARE GOS-28. EMBO J 2000; 19:1494–1504.
49. Sorensen JB. SNARE complexes prepare for membrane fusion. Trends Neurosci 2005; 28:453–455.
50. Yang B, Steegmaier M, Gonzalez Jr LC, Scheller RH. nSec1 binds a closed conformationof syntaxin1A. J Cell Biol 2000; 148: 247–252.
51. Mitchell SJ, Ryan TA. Munc18-dependent regulation of synaptic vesicle exocytosis bysyntaxin-1A in hippocampal neurons. Neuropharmacology 2005; 48: 372–380.
52. Smirnova T, Stinnakre J, Mallet J. Characterization of a presynaptic glutamate receptor.Science 1993; 262: 430–433.
53. Behan AT, Byrne C, Dunn MJ, Cagney G, Cotter DR. Proteomic analysis of membranemicrodomain-associated proteins in the dorsolateral prefrontal cortex in schizophrenia andbipolar disorder reveals alterations in LAMP, STXBP1 and BASP1 protein expression. MolPsychiatry 2009; 14: 601–613.
54. Mathew D, Popescu A, Budnik V. Drosophila amphiphysin functions during synapticFasciclin II membrane cycling. J Neurosci 2003; 23: 10710–10716.
55. Lavedan C. The synuclein family. Genome Res 1998; 8: 871–880.56. Bennett CN, Horrobin DF. Gene targets related to phospholipid and fatty acid metabolism
in schizophrenia and other psychiatric disorders: an update. Prostaglandins Leukot EssentFatty Acids 2000; 63: 47–59.
57. Tassoni D, Kaur G, Weisinger RS, Sinclair AJ. The role of eicosanoids in the brain. AsiaPac J Clin Nutr 2008; 17(Suppl 1): 220–228.
58. Kim JH, Lee BD, Kim Y, Lee SD, Suh PG, Ryu SH. Cytosolic phospholipase A2-mediatedregulation of phospholipase D2 in leukocyte cell lines. J Immunol 1999; 163: 5462–5470.
59. Lee C, Kim SR, Chung JK, Frohman MA, Kilimann MW, Rhee SG. Inhibition ofphospholipase D by amphiphysins. J Biol Chem 2000; 275: 18751–18758.
60. Shelton RC, Hal Manier D, Lewis DA. Protein kinases A and C in post-mortem prefrontalcortex from persons with major depression and normal controls. Int JNeuropsychopharmacol 2009; 12: 1223–1232.
61. Goldschmidt-Clermont PJ, Machesky LM, Baldassare JJ, Pollard TD. The actin-bindingprotein profilin binds to PIP2 and inhibits its hydrolysis by phospholipase C. Science 1990;247: 1575–1578.
62. Varadarajulu J, Schmitt A, Falkai P, Alsaif M, Turck CW, Martins-de-Souza D.Differential expression of HINT1 in schizophrenia brain tissue. Eur Arch Psychiatry ClinNeurosci 2011; doi: 10.1007/s00406-011-0216-4; PMID: 21553311 [e-pub ahead of print].
63. Su T, Suzui M, Wang L, Lin CS, Xing WQ, Weinstein IB. Deletion of histidine triadnucleotide-binding protein 1/PKC-interacting protein in mice enhances cell growth andcarcinogenesis. Proc Natl Acad Sci USA 2003; 100: 7824–7829.
Proteomic analysis of depression brainsD Martins-de-Souza et al
12
Translational Psychiatry
64. Varadarajulu J, Lebar M, Krishnamoorthy G, Habelt S, Lu J, Bernard Weinstein I et al.Increased anxiety-related behaviour in Hint1 knockout mice. Behav Brain Res 2011; 220:305–311.
65. Martins-de-Souza D, Gattaz WF, Schmitt A, Rewerts C, Maccarrone G, Dias-Neto E et al.Prefrontal cortex shotgun proteome analysis reveals altered calcium homeostasis andimmune system imbalance in schizophrenia. Eur Arch Psychiatry Clin Neurosci 2009; 259:151–163.
66. Martins-de-Souza D, Gattaz WF, Schmitt A, Novello JC, Marangoni S, Turck CW et al.Proteome analysis of schizophrenia patients Wernicke’s area reveals an energymetabolism dysregulation. BMC Psychiatry 2009; 9: 17.
67. Bergson C, Levenson R, Goldman-Rakic PS, Lidow MS. Dopamine receptor-interactingproteins: the Ca(2+) connection in dopamine signaling. Trends Pharmacol Sci 2003; 24:486–492.
68. Martins-de-Souza D, Schmitt A, Roder R, Lebar M, Schneider-Axmann T, Falkai P et al.Sex-specific proteome differences in the anterior cingulate cortex of schizophrenia. JPsychiatr Res 2010; 44: 989–991.
69. Hwu HG, Liu CM, Fann CS, Ou-Yang WC, Lee SF. Linkage of schizophrenia withchromosome 1q loci in Taiwanese families. Mol Psychiatry 2003; 8: 445–452.
70. Dorsman JC, Levitus M, Rockx D, Rooimans MA, Oostra AB, Haitjema A et al.Identification of the Fanconi anemia complementation group I gene, FANCI. Cell Oncol2007; 29: 211–218.
71. Ballar P, Zhong Y, Nagahama M, Tagaya M, Shen Y, Fang S. Identification of SVIP as anendogenous inhibitor of endoplasmic reticulum-associated degradation. J Biol Chem 2007;282: 33908–33914.
72. Sowa ME, Bennett EJ, Gygi SP, Harper JW. Defining the human deubiquitinating enzymeinteraction landscape. Cell 2009; 138: 389–403.
73. Colgan J, Asmal M, Yu B, Luban J. Cyclophilin A-deficient mice are resistant toimmunosuppression by cyclosporine. J Immunol 2005; 174: 6030–6038.
74. Matsuda A, Suzuki Y, Honda G, Muramatsu S, Matsuzaki O, Nagano Y et al. Large-scaleidentification and characterization of human genes that activate NF-kappaB and MAPKsignaling pathways. Oncogene 2003; 22: 3307–3318.
75. Jernigan CS, Goswami DB, Austin MC, Iyo AH, Chandran A, Stockmeier CA et al. ThemTOR signaling pathway in the prefrontal cortex is compromised in major depressivedisorder. Prog Neuropsychopharmacol Biol Psychiatry 2011; 35: 1774–1779.
76. Jacinto E, Loewith R, Schmidt A, Lin S, Ruegg MA, Hall A et al. Mammalian TORcomplex 2 controls the actin cytoskeleton and is rapamycin insensitive. Nat Cell Biol 2004; 6:1122–1128.
77. Sun M, Gewirtz JC, Bofenkamp L, Wickham RJ, Ge H, O’Connor MB. Canonical TGF-betasignaling is required for the balance of excitatory/inhibitory transmission within thehippocampus and prepulse inhibition of acoustic startle. J Neurosci 2010; 30: 6025–6035.
78. Li Y, Zhu X, Zeng Y, Wang J, Zhang X, Ding YQ et al. FMNL2 enhances invasion ofcolorectal carcinoma by inducing epithelial-mesenchymal transition. Mol Cancer Res 2010;8: 1579–1590.
79. Kleinman JE, Law AJ, Lipska BK, Hyde TM, Ellis JK, Harrison PJ et al. Geneticneuropathology of schizophrenia: new approaches to an old question and new uses forpostmortem human brains. Biol Psychiatry 2011; 69: 140–145.
80. Harrison PJ. Using our brains: the findings, flaws, and future of postmortem studies ofpsychiatric disorders. Biol Psychiatry 2011; 69: 102–103.
Translational Psychiatry is an open-access journalpublished by Nature Publishing Group. This work is
licensed under the Creative Commons Attribution-Noncommercial-NoDerivative Works 3.0 Unported License. To view a copy of this license,visit http://creativecommons.org/licenses/by-nc-nd/3.0/
Supplementary Information accompanies the paper on the Translational Psychiatry website (http://www.nature.com/tp)
Proteomic analysis of depression brainsD Martins-de-Souza et al
13
Translational Psychiatry