identification of anchor genes during kidney development defines ontological relationships,...
TRANSCRIPT
Identification of Anchor Genes during KidneyDevelopment Defines Ontological Relationships,Molecular Subcompartments and Regulatory PathwaysRathi D. Thiagarajan., Kylie M. Georgas., Bree A. Rumballe., Emmanuelle Lesieur, Han Sheng Chiu,
Darrin Taylor, Dave T. P. Tang¤, Sean M. Grimmond*, Melissa H. Little*
Institute for Molecular Bioscience, The University of Queensland, St. Lucia, Australia
Abstract
The development of the mammalian kidney is well conserved from mouse to man. Despite considerable temporal andspatial data on gene expression in mammalian kidney development, primarily in rodent species, there is a paucity of geneswhose expression is absolutely specific to a given anatomical compartment and/or developmental stage, defined here as‘anchor’ genes. We previously generated an atlas of gene expression in the developing mouse kidney using microarrayanalysis of anatomical compartments collected via laser capture microdissection. Here, this data is further analysed toidentify anchor genes via stringent bioinformatic filtering followed by high resolution section in situ hybridisationperformed on 200 transcripts selected as specific to one of 11 anatomical compartments within the midgestation mousekidney. A total of 37 anchor genes were identified across 6 compartments with the early proximal tubule being thecompartment richest in anchor genes. Analysis of minimal and evolutionarily conserved promoter regions of this set of 25anchor genes identified enrichment of transcription factor binding sites for Hnf4a and Hnf1b, RbpJ (Notch signalling),PPARc:RxRA and COUP-TF family transcription factors. This was reinforced by GO analyses which also identified theseanchor genes as targets in processes including epithelial proliferation and proximal tubular function. As well as defininganchor genes, this large scale validation of gene expression identified a further 92 compartment-enriched genes able tosubcompartmentalise key processes during murine renal organogenesis spatially or ontologically. This included a cohort of13 ureteric epithelial genes revealing previously unappreciated compartmentalisation of the collecting duct system and aseries of early tubule genes suggesting that segmentation into proximal tubule, loop of Henle and distal tubule does notoccur until the onset of glomerular vascularisation. Overall, this study serves to illuminate previously ill-defined stages ofpatterning and will enable further refinement of the lineage relationships within mammalian kidney development.
Citation: Thiagarajan RD, Georgas KM, Rumballe BA, Lesieur E, Chiu HS, et al. (2011) Identification of Anchor Genes during Kidney Development DefinesOntological Relationships, Molecular Subcompartments and Regulatory Pathways. PLoS ONE 6(2): e17286. doi:10.1371/journal.pone.0017286
Editor: Martin Pera, University of Southern California, United States of America
Received November 24, 2010; Accepted January 26, 2011; Published February 28, 2011
Copyright: � 2011 Thiagarajan et al. This is an open-access article distributed under the terms of the Creative Commons Attribution License, which permitsunrestricted use, distribution, and reproduction in any medium, provided the original author and source are credited.
Funding: This work was funded by the National Institutes of Health, USA (NIDDK DK070136). The funders had no role in study design, data collection andanalysis, decision to publish, or preparation of the manuscript.
Competing Interests: The authors have declared that no competing interests exist.
* E-mail: [email protected] (MHL); [email protected] (SMG)
¤ Current address: Omics Science Center, RIKEN Yokohama Institute, Tsurumi-ku, Yokohama, Kanagawa, Japan
. These authors contributed equally to this work.
Introduction
Many diseases of the kidney stem from disruptions to the
transcriptional programs involved in normal kidney development
[1]. Such disruptions, resulting from both genetic and environ-
mental factors, can affect overall renal function in postnatal life.
Indeed, predisposition to renal disease in humans is inversely
related to the number of functional epithelial nephrons per kidney
[2], a parameter completely determined during kidney develop-
ment. Understanding this molecular pathogenesis has been a
major aim of kidney organogenesis research [1]. To do this, it is
critical to understand the extent and origins of cellular complexity
within the developing kidney.
Kidney organogenesis in mammalian species is highly conserved
anatomically and molecularly. Hence, the field has made
considerable use of model organisms, predominantly mouse and
rat, to study the process. The mammalian kidney is a complex
organ containing more than 25 distinct functional cell types [3,4].
These arise from one of two intermediate mesoderm-derived cell
populations, the metanephric mesenchyme (MM) and the ureteric
bud [5]. The UB forms a dichotomously branching epithelial tree,
giving rise to the cell types that make up the collecting ducts of the
kidney and the ureter that connects the kidney with the bladder.
This involves considerable regional specification to ensure the vast
variation in water permeability between the water-reclaiming
collecting ducts and the water impermeable conduit that is the
ureter. Regionalisation within this compartment is also critical for
nephron formation as key proteins expressed by the tips of this
epithelium signal to the surrounding mesenchyme to initiate
nephrogenesis. Equally, there is now evidence that the segmen-
tation and patterning of the nephrons themselves is dictated via the
secretion of distinct Wnt proteins from the collecting duct tree [6].
The MM gives rise to the cap mesenchyme (CM), which in turn
forms all of the tubular elements of the nephron other than the
PLoS ONE | www.plosone.org 1 February 2011 | Volume 6 | Issue 2 | e17286
collecting ducts via a process of mesenchyme to epithelial
transition (MET) immediately adjacent to the tip of the advancing
UB branches [7,8,9]. As a result, the human kidney forms up to 2
million nephrons per kidney. An individual mature nephron is
comprised of at least 14 distinct functional segments [10,11], each
of which contains cell types that play specific roles in water and
solute retention and loss. While patterning and segmentation must
occur to reach this level of specialization, only the earliest events
have been well studied. Hence the role of Wnt9b in the initiation of
MET and the subsequent requirement for Wnt4 expression to
proceed through this event is well documented [12,13], as is the
requirement for Notch2 for proximal tubule specification [14]. The
regulation of subsequent events remains to be dissected. The
remainder of the MM does not undergo MET, instead giving rise
to elements of the interstitium of the kidney. The interstitium as a
whole is highly heterogeneous, containing fibroblasts, resident
macrophages, vascular, perivascular/smooth muscle, lymphatic
and neural tissue of the kidney [15,16]. While some interstitial cell
types are likely to migrate into the interstitium during develop-
ment, including the resident macrophages/dendritic cells [17], the
origin and lineage relationships of these components is still
unresolved, as are their roles during normal kidney homeostasis
and in response to renal injury [18].
The development of conditional transgenic strains in the mouse
has particularly assisted in defining our existing understanding of
ontological relationships during kidney development. For example,
the Six2 gene is regionally-enriched in the CM during kidney
development [19]. Using a Six2GFPCre transgenic line, Kobaya-
shi et al (2008) demonstrated that all epithelial portions of the
nephron apart from the collecting duct were derived from CM [7].
Using the same transgenic line, it was shown that during renal
injury no interstitial stem cells could contribute to tubular repair as
there is no apparent dilution of the nephron epithelium with cells
that did not originally express Six2 [20]. Finally, Georgas et al
(2009) showed that the connecting segment cells at the point of
fusion between the collecting duct tips and the nephron tubules are
derived from the CM and not the UB [9]. The power of these
analyses rests with the compartment-specific expression of the Six2
gene. The identification of additional compartment-specific genes
is needed to advance our understanding of kidney development,
notably during the later stages of patterning, segmentation and
differentiation. The obvious solution to this would appear to be
gene expression analysis of kidney development.
While global analysis of gene expression in the entire developing
kidney has been of limited value given the cellular complexity of
this organ [21,22,23,24], we have previously contributed to the
most comprehensive compartmental analysis of any developing
organ, in which Affymetrix microarray expression profiling was
performed on 15 distinct temporospatial anatomical compart-
ments of the developing mouse kidney collected via laser capture
micro-dissection or FACS [25]. This allowed for the identification
of genes and gene networks enriched during different processes of
kidney development, but also highlighted the paucity of genes
absolutely restricted in expression to a single compartment in time
and space.
Microarray compartments in Brunskill et al (2008) [25] were
based primarily upon identifiable anatomical and/or regional
subdivisions rather than established molecular or ontological
entities. Other gene expression studies during organogenesis
[26,27,28] have demonstrated the need for complimentary high
resolution validation to more finely dissect the relationship
between gene expression and anatomical organization. It was
anticipated that this would reveal additional ‘molecularly-defined’
compartments more representative of key developmental
processes, including segmentation and patterning, and possibly
also identify specific cell types within complex and heterogeneous
compartments. In the study presented here, we have extended the
analysis of the kidney development gene atlas using high
resolution section in situ hybridisation (SISH). A bioinformatic
method was devised for the stringent prediction of ‘anchor’ genes,
defined as a gene whose expression was restricted to one
temporospatial anatomical compartment. A total of 200 genes
across 11 anatomical compartments were analysed with 46% of
genes (92 genes) being compartment-enriched and an additional
18.5% (37 genes) representing anchor genes for a defined
temporospatial structure (overall validation of bioinformatic
selection of 64.5%). As such, these anchor genes will fuel the
generation of further mouse resources for lineage tracing, thereby
extending our understanding of kidney organogenesis and
ultimately molecular pathogenesis within the kidney. Equally,
compartment-enriched genes redefined the developing kidney
atlas into molecular events rather than regional or anatomical
structures, identifying markers able to subdivide the processes of
nephron segmentation, collecting duct functionalisation and
interstitial differentiation.
Results and Discussion
Selecting potential anchor genes via reanalysis of theatlas of kidney development
Brunskill et al (2008) [25] reported Affymetrix expression
profiling for 15 compartments, 11 of which were isolated from
embryonic day (E) 15.5 developing murine kidney. Microarray
data from these 11 anatomical compartments represented
interstitial/mesenchymal elements (cap mesenchyme, CM; med-
ullary interstitium, MI; cortical interstitium, CI), anatomical
subdivisions of the ureteric epithelium (ureteric tip, UT; cortical
collecting duct, CCD; medullary collecting duct, MCD) and CM-
derived elements of the nephron (renal vesicle/Stage I nephron,
RV; S-shaped body/Stage II nephron, SSB; early proximal
tubule, EPT; Loop of Henle, LH and renal corpuscle, RC). A list
of putative anchor genes were selected as those displaying; a) the
most significant differential expression ratio (.2 x median
expression fold change), b) high raw signal intensity (.100
RFU) above background and c) low median signal intensity in all
other subcompartments examined (Figure 1). As can be seen in
Figure 1, there was considerable variation in the median
expression fold change and number of putative anchor genes
identified between compartments. Early proximal tubule showed
the largest number of highly differentially expressed genes
whereas compartments representing transient developmental
stages (RV, SSB) or probable cellular heterogeneity (MI, CI)
showed very few selected genes. As a lack of anchor genes may
also have arisen due to a lack of association between the physical
compartment selected and any molecular association or due to
contamination of samples during isolation, a parallel comparison
of a subset of 7 compartments (UT, RC, MCD, RV, EPT, MI,
and SSB) was also performed. A complete list of the 251 genes
prioritised for validation from both comparisons is listed in
Table S1.
Investigating apparent false negatives at the level ofmicroarray
Validation via in situ hybridisation only proceeded for those
genes selected according to the criteria determined for selection
of potential anchor genes. The approach taken here is distinct
from our previous analysis [25] and hence not all genes identified
as enriched were included for validation. For example, Prnp, a
Anchor Genes in Kidney Development
PLoS ONE | www.plosone.org 2 February 2011 | Volume 6 | Issue 2 | e17286
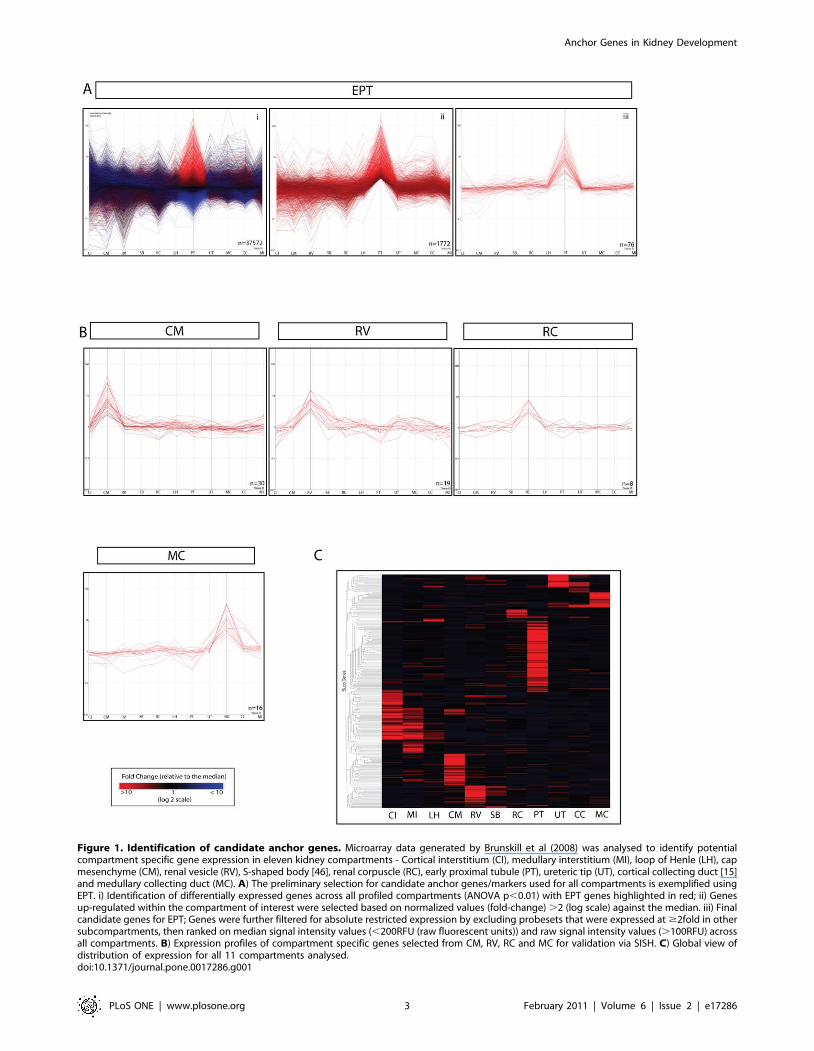
Figure 1. Identification of candidate anchor genes. Microarray data generated by Brunskill et al (2008) was analysed to identify potentialcompartment specific gene expression in eleven kidney compartments - Cortical interstitium (CI), medullary interstitium (MI), loop of Henle (LH), capmesenchyme (CM), renal vesicle (RV), S-shaped body [46], renal corpuscle (RC), early proximal tubule (PT), ureteric tip (UT), cortical collecting duct [15]and medullary collecting duct (MC). A) The preliminary selection for candidate anchor genes/markers used for all compartments is exemplified usingEPT. i) Identification of differentially expressed genes across all profiled compartments (ANOVA p,0.01) with EPT genes highlighted in red; ii) Genesup-regulated within the compartment of interest were selected based on normalized values (fold-change) .2 (log scale) against the median. iii) Finalcandidate genes for EPT; Genes were further filtered for absolute restricted expression by excluding probesets that were expressed at $2fold in othersubcompartments, then ranked on median signal intensity values (,200RFU (raw fluorescent units)) and raw signal intensity values (.100RFU) acrossall compartments. B) Expression profiles of compartment specific genes selected from CM, RV, RC and MC for validation via SISH. C) Global view ofdistribution of expression for all 11 compartments analysed.doi:10.1371/journal.pone.0017286.g001
Anchor Genes in Kidney Development
PLoS ONE | www.plosone.org 3 February 2011 | Volume 6 | Issue 2 | e17286
gene we have shown to mark a distinct subcompartment of the
SSB, was not selected as it is also expressed at a significant level in
RV. As this approach did not identify a number of genes
commonly regarded as marking specific renal compartments, a
retrospective analysis was performed to determine why such
genes were excluded. Four major issues arose. 1) Insufficient
differential in expression, e.g. Wnt11 and Wnt7b, regarded as
specific to the ureteric tip and collecting duct respectively, were
not selected due to insufficient differential expression between this
and all other compartments. 2) Absence from microarray
probeset, e.g. Crlf (syn: CLF-1), previously reported as specific
to the UT [29], was not represented on the Affymetrix
microarrays. 3) Evidence from microarray for an expression
pattern contrary to that previously reported, e.g. Pf4 (Cxcl4),
previously reported as a UT marker [29,30], was clearly present
in the EPT compartment. 4) Genes thought to mark a specific
compartment were also expressed in other regions, e.g. Cadherin
16 (Cdh16), although previously described as a marker of
collecting duct [31], was also expressed by microarray in the
EPT. On occasion this may reflect the accuracy of the selection of
material for microarray, resulting in false negatives. For example,
Six2, a well known marker of the CM was also detected in the MI
compartment. While this may reflect contamination of the MI
compartment with CM, there was no such contamination
detected in the more closely located CI.
Validation of anchor genes using high-resolution mRNAin situ hybridisation.
Of the 251 putative anchor genes selected, 200 were analysed
using high resolution section in situ hybridisation (SISH) of
paraffin-embedded E15.5 murine kidney. A subset of genes was
also examined in adult kidney. In all cases, expression patterns
were annotated in accordance with the anatomical ontology
previously generated for the mouse urogenital system [4]. Each
gene was then classified as specific (expression only present in a
single compartment; validated anchor gene), enriched (expression
present in the correct compartment and at least one other
compartment; marker gene), ubiquitous (ubiquitous expression in all
compartments), not-detected (no detectable expression) or non-specific
(expression detected in an unexpected compartment). As micro-
array data was not available for all kidney compartments, some
genes validated with respect to the other ten compartments but
were not regarded as anchor genes as they were found to also be
expressed in a compartment not included in the analysis (e.g. distal
tubule). The fully annotated expression patterns, riboprobe details
and all ISH images for the complete set of validated genes are
available on the GUDMAP website (http://www.gudmap.org).
The percentage validation (combining specific and enriched) for
all compartments was 64.5%, however this did vary considerably
between compartments (Table S1) and anchor genes were not
detected for all compartments. No true anchor genes were
detected for the CM due to the very low signal for many of the
selected genes (e.g. Rspo3, Disp1, Cacnb4, Adcy8). Other genes (Eya1;
Figure 2) could be detected in surrounding interstitium either
between early nephrons and/or in pretubular aggregate as well as
the CM, in contrast to the previous literature [32]. The lack of an
SSB anchor gene is likely to reflect the fact that this structure is a
continuum of nephron development with no unique gene
expression or that it was difficult to definitively identify this stage
from others at isolation based upon PNA staining. Very few LH
anchor genes were identified and this gene set may have included
surrounding interstitium based upon the overlap between array
signals between these compartments.
Investigating false positives at the level of microarray andriboprobe design: gene-centric vs. transcript-centricriboprobes
The success of the validations depended on the ability to
replicate the gene expression detected in the microarray study.
While the majority of the genes that were validated produced an
expected signal pattern (129/200), 71 other gene probes yielded
false positive signal (non-specific, not detected, or ubiquitous).
Sources of these variations are mostly likely due to the technical
challenges from comparing microarrays and ISH. These variations
include contamination of LCM samples from spatially adjacent
compartments during sampling [25] as discussed above. A key
issue was selecting an ideal dynamic range of signal detection and
specificity during the microarray analysis. While the range of raw
microarray signals successfully validated extended from 100 to
10,000 RFU, less than 50% of probes displaying microarray
expression levels of ,500 RFU could be validated by SISH of
paraffin embedded material, highlighting the limits of SISH signal
detection [25]. Also, different cell-densities are likely to influence
the mean signal intensities of each subcompartment and therefore,
a generalized threshold of detection across all samples does not
reflect the individual dynamic range.
Another source of variation comes from discrepancies of
microarray and SISH probes representing a gene. One of the
issues lies in the sequence length of the microarray probeset and
SISH riboprobe. The riboprobes used in this study were typically
designed within the 500–800 bp range, while the Affymetrix
probes are 25 mers. The shorter probes are more likely to target
specific transcripts whereas the longer probes can span across
several transcripts and are therefore more likely to pick up
different signal combinations picked up by each transcript [33].
This suggests that riboprobes that directly overlap Affymetrix
probes along the target transcript, ‘transcript-centric’ probes, were
more likely produce replicable signal during SISH validation than
gene-centric designs. We reviewed the riboprobe localization
along the locus relative to the Affymetrix probeset for riboprobes
showing non-specific expression, as these probes are capable of
providing signal (i.e. no ubiquitous background signal). Non-specific
riboprobes showed less than 80% overlap with the Affymetrix
probeset which may be a contributing factor towards the
inaccuracy of the riboprobe and could be avoided during
riboprobe design.
Since microarray and SISH based comparisons are common for
the validation of gene targets, a riboprobe design pipeline that
minimizes discrepancies in expression validation arising from
transcriptional complexity was created by consolidating the
Affymetrix probeset locations into the design of SISH riboprobes.
Each of the eleven 25 mer oligo-probes in a given Affymetrix
probeset were mapped against a non-redundant set of mouse
cDNA transcripts (FANTOM3 cDNA clones) to obtain overlap-
ping regions to serve as sequence templates for riboprobe primer
design via the Primer3 program [34]. The overall popularity of the
Affymetrix Mouse Genome 430.2 platform across many murine
studies (over 1400 experimental series in GEO, (GPL: 1261)) and
within the GUDMAP consortium [35], lead to the creation of a
riboprobe primer design tool (http://uqgudmap.imb.uq.edu.au/
riboprobe_design/). Here, each probeset entered, results in the
generation by Primer3 of the corresponding riboprobe primer
sequences. This then links to the complete set of primer statistics in
the Sequence Manipulation Suite (http://www.bioinformatics.
org/sms2/) and the In-Silico PCR program from the UCSC
Genome Browser [36] which predicts the specificity of the
amplified riboprobe region.
Anchor Genes in Kidney Development
PLoS ONE | www.plosone.org 4 February 2011 | Volume 6 | Issue 2 | e17286
Definition of molecular compartments of kidney deve-lopment across time, developmental process and space
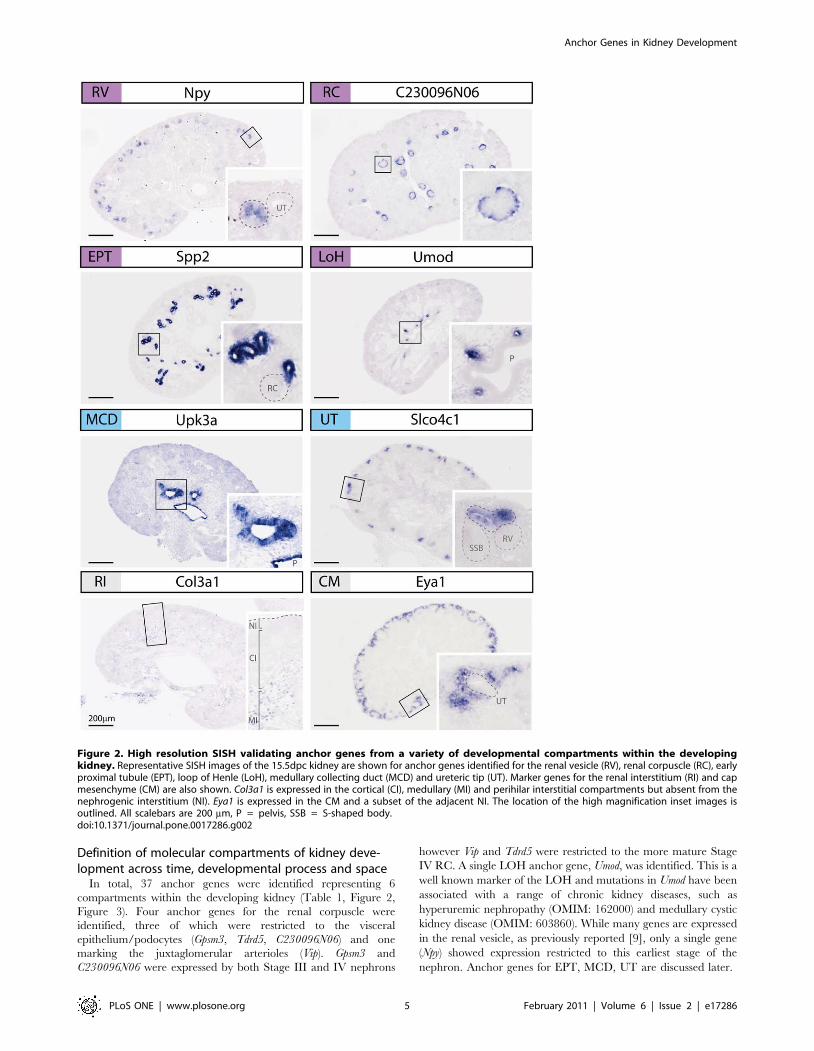
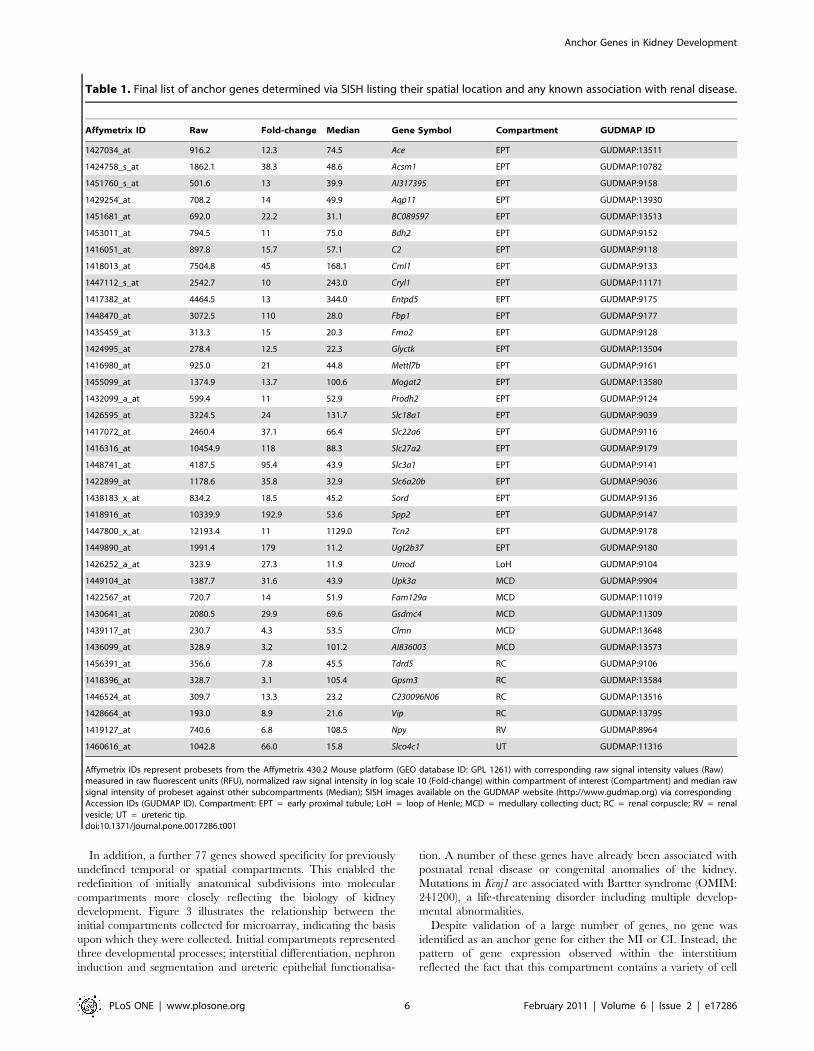
In total, 37 anchor genes were identified representing 6
compartments within the developing kidney (Table 1, Figure 2,
Figure 3). Four anchor genes for the renal corpuscle were
identified, three of which were restricted to the visceral
epithelium/podocytes (Gpsm3, Tdrd5, C230096N06) and one
marking the juxtaglomerular arterioles (Vip). Gpsm3 and
C230096N06 were expressed by both Stage III and IV nephrons
however Vip and Tdrd5 were restricted to the more mature Stage
IV RC. A single LOH anchor gene, Umod, was identified. This is a
well known marker of the LOH and mutations in Umod have been
associated with a range of chronic kidney diseases, such as
hyperuremic nephropathy (OMIM: 162000) and medullary cystic
kidney disease (OMIM: 603860). While many genes are expressed
in the renal vesicle, as previously reported [9], only a single gene
(Npy) showed expression restricted to this earliest stage of the
nephron. Anchor genes for EPT, MCD, UT are discussed later.
Figure 2. High resolution SISH validating anchor genes from a variety of developmental compartments within the developingkidney. Representative SISH images of the 15.5dpc kidney are shown for anchor genes identified for the renal vesicle (RV), renal corpuscle (RC), earlyproximal tubule (EPT), loop of Henle (LoH), medullary collecting duct (MCD) and ureteric tip (UT). Marker genes for the renal interstitium (RI) and capmesenchyme (CM) are also shown. Col3a1 is expressed in the cortical (CI), medullary (MI) and perihilar interstitial compartments but absent from thenephrogenic interstitium (NI). Eya1 is expressed in the CM and a subset of the adjacent NI. The location of the high magnification inset images isoutlined. All scalebars are 200 mm, P = pelvis, SSB = S-shaped body.doi:10.1371/journal.pone.0017286.g002
Anchor Genes in Kidney Development
PLoS ONE | www.plosone.org 5 February 2011 | Volume 6 | Issue 2 | e17286
In addition, a further 77 genes showed specificity for previously
undefined temporal or spatial compartments. This enabled the
redefinition of initially anatomical subdivisions into molecular
compartments more closely reflecting the biology of kidney
development. Figure 3 illustrates the relationship between the
initial compartments collected for microarray, indicating the basis
upon which they were collected. Initial compartments represented
three developmental processes; interstitial differentiation, nephron
induction and segmentation and ureteric epithelial functionalisa-
tion. A number of these genes have already been associated with
postnatal renal disease or congenital anomalies of the kidney.
Mutations in Kcnj1 are associated with Bartter syndrome (OMIM:
241200), a life-threatening disorder including multiple develop-
mental abnormalities.
Despite validation of a large number of genes, no gene was
identified as an anchor gene for either the MI or CI. Instead, the
pattern of gene expression observed within the interstitium
reflected the fact that this compartment contains a variety of cell
Table 1. Final list of anchor genes determined via SISH listing their spatial location and any known association with renal disease.
Affymetrix ID Raw Fold-change Median Gene Symbol Compartment GUDMAP ID
1427034_at 916.2 12.3 74.5 Ace EPT GUDMAP:13511
1424758_s_at 1862.1 38.3 48.6 Acsm1 EPT GUDMAP:10782
1451760_s_at 501.6 13 39.9 AI317395 EPT GUDMAP:9158
1429254_at 708.2 14 49.9 Aqp11 EPT GUDMAP:13930
1451681_at 692.0 22.2 31.1 BC089597 EPT GUDMAP:13513
1453011_at 794.5 11 75.0 Bdh2 EPT GUDMAP:9152
1416051_at 897.8 15.7 57.1 C2 EPT GUDMAP:9118
1418013_at 7504.8 45 168.1 Cml1 EPT GUDMAP:9133
1447112_s_at 2542.7 10 243.0 Cryl1 EPT GUDMAP:11171
1417382_at 4464.5 13 344.0 Entpd5 EPT GUDMAP:9175
1448470_at 3072.5 110 28.0 Fbp1 EPT GUDMAP:9177
1435459_at 313.3 15 20.3 Fmo2 EPT GUDMAP:9128
1424995_at 278.4 12.5 22.3 Glyctk EPT GUDMAP:13504
1416980_at 925.0 21 44.8 Mettl7b EPT GUDMAP:9161
1455099_at 1374.9 13.7 100.6 Mogat2 EPT GUDMAP:13580
1432099_a_at 599.4 11 52.9 Prodh2 EPT GUDMAP:9124
1426595_at 3224.5 24 131.7 Slc18a1 EPT GUDMAP:9039
1417072_at 2460.4 37.1 66.4 Slc22a6 EPT GUDMAP:9116
1416316_at 10454.9 118 88.3 Slc27a2 EPT GUDMAP:9179
1448741_at 4187.5 95.4 43.9 Slc3a1 EPT GUDMAP:9141
1422899_at 1178.6 35.8 32.9 Slc6a20b EPT GUDMAP:9036
1438183_x_at 834.2 18.5 45.2 Sord EPT GUDMAP:9136
1418916_at 10339.9 192.9 53.6 Spp2 EPT GUDMAP:9147
1447800_x_at 12193.4 11 1129.0 Tcn2 EPT GUDMAP:9178
1449890_at 1991.4 179 11.2 Ugt2b37 EPT GUDMAP:9180
1426252_a_at 323.9 27.3 11.9 Umod LoH GUDMAP:9104
1449104_at 1387.7 31.6 43.9 Upk3a MCD GUDMAP:9904
1422567_at 720.7 14 51.9 Fam129a MCD GUDMAP:11019
1430641_at 2080.5 29.9 69.6 Gsdmc4 MCD GUDMAP:11309
1439117_at 230.7 4.3 53.5 Clmn MCD GUDMAP:13648
1436099_at 328.9 3.2 101.2 AI836003 MCD GUDMAP:13573
1456391_at 356.6 7.8 45.5 Tdrd5 RC GUDMAP:9106
1418396_at 328.7 3.1 105.4 Gpsm3 RC GUDMAP:13584
1446524_at 309.7 13.3 23.2 C230096N06 RC GUDMAP:13516
1428664_at 193.0 8.9 21.6 Vip RC GUDMAP:13795
1419127_at 740.6 6.8 108.5 Npy RV GUDMAP:8964
1460616_at 1042.8 66.0 15.8 Slco4c1 UT GUDMAP:11316
Affymetrix IDs represent probesets from the Affymetrix 430.2 Mouse platform (GEO database ID: GPL 1261) with corresponding raw signal intensity values (Raw)measured in raw fluorescent units (RFU), normalized raw signal intensity in log scale 10 (Fold-change) within compartment of interest (Compartment) and median rawsignal intensity of probeset against other subcompartments (Median); SISH images available on the GUDMAP website (http://www.gudmap.org) via correspondingAccession IDs (GUDMAP ID). Compartment: EPT = early proximal tubule; LoH = loop of Henle; MCD = medullary collecting duct; RC = renal corpuscle; RV = renalvesicle; UT = ureteric tip.doi:10.1371/journal.pone.0017286.t001
Anchor Genes in Kidney Development
PLoS ONE | www.plosone.org 6 February 2011 | Volume 6 | Issue 2 | e17286
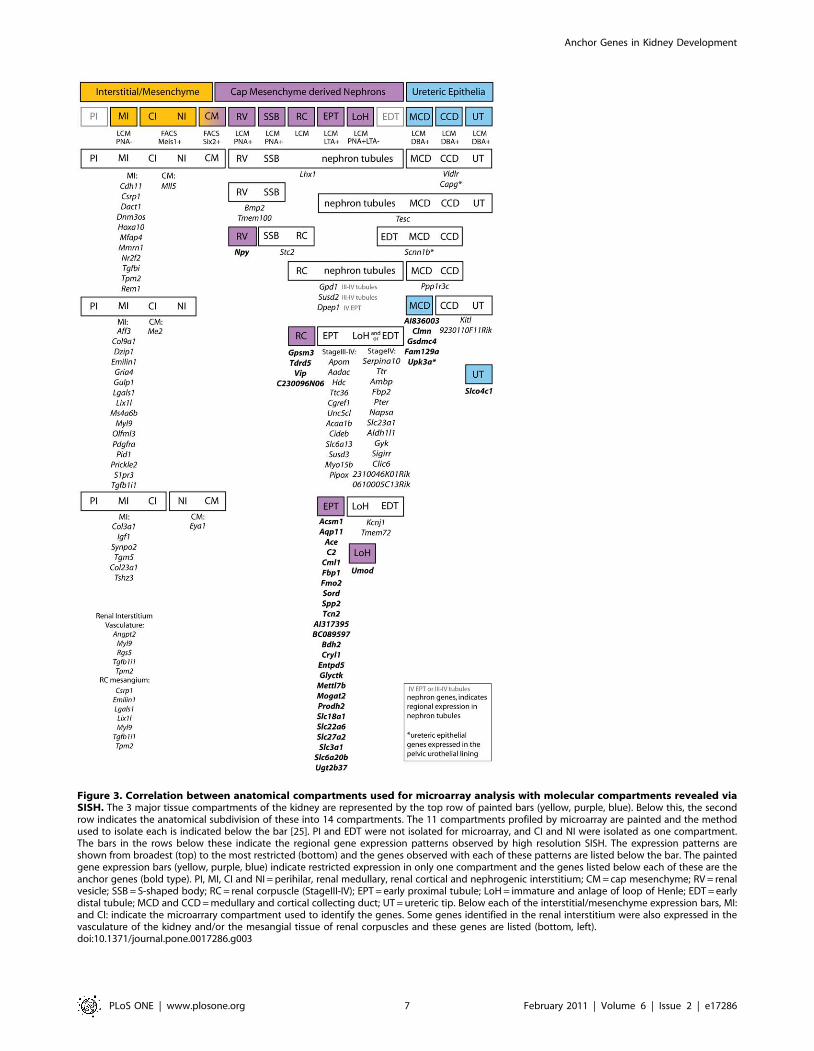
Figure 3. Correlation between anatomical compartments used for microarray analysis with molecular compartments revealed viaSISH. The 3 major tissue compartments of the kidney are represented by the top row of painted bars (yellow, purple, blue). Below this, the secondrow indicates the anatomical subdivision of these into 14 compartments. The 11 compartments profiled by microarray are painted and the methodused to isolate each is indicated below the bar [25]. PI and EDT were not isolated for microarray, and CI and NI were isolated as one compartment.The bars in the rows below these indicate the regional gene expression patterns observed by high resolution SISH. The expression patterns areshown from broadest (top) to the most restricted (bottom) and the genes observed with each of these patterns are listed below the bar. The paintedgene expression bars (yellow, purple, blue) indicate restricted expression in only one compartment and the genes listed below each of these are theanchor genes (bold type). PI, MI, CI and NI = perihilar, renal medullary, renal cortical and nephrogenic interstitium; CM = cap mesenchyme; RV = renalvesicle; SSB = S-shaped body; RC = renal corpuscle (StageIII-IV); EPT = early proximal tubule; LoH = immature and anlage of loop of Henle; EDT = earlydistal tubule; MCD and CCD = medullary and cortical collecting duct; UT = ureteric tip. Below each of the interstitial/mesenchyme expression bars, MI:and CI: indicate the microarrary compartment used to identify the genes. Some genes identified in the renal interstitium were also expressed in thevasculature of the kidney and/or the mesangial tissue of renal corpuscles and these genes are listed (bottom, left).doi:10.1371/journal.pone.0017286.g003
Anchor Genes in Kidney Development
PLoS ONE | www.plosone.org 7 February 2011 | Volume 6 | Issue 2 | e17286
types that are present throughout all regions of the interstititum.
Eleven interstitial genes were present in all mesenchymal
interstitium including the CM, 16 genes were present in all
interstitial regions other than the CM and 6 genes were present in
MI and CI but not nephrogenic insterstitium, perihilar interstitium
or CM. It should be noted that the CI compartment was isolated
using FACS sorting of Meis1+ GFP mice, a gene whose expression
does extend into the CM (see GUDMAP data Accession ID
GUDMAP:12521). However, overall the absence of markers that
distinguish individual interstitial compartments also supports the
notion of commonality in cellular composition within much of the
interstitial space. It also highlights the need for ultimate
compartmentalization of this organ down to the cellular level.
Segmentation of the ureteric compartmentWhile it is known that specific factors secreted from the tips of
the ureteric tree are critical for the induction of nephron
formation, the specification, segmentation and differentiation of
non-tip regions of the ureteric epithelium is not well understood.
Many well known ureteric tree markers are ubiquitously
expressed throughout the ureteric epithelia during development,
including Calb1 and Hoxb7 [37,38]. While previous studies have
sought differential markers of ureteric trunk versus tip [21,29,30],
few have been well defined other than Wnt11 in the tip [39]. Even
the widely reported tip marker, Ret, while enriched in the ureteric
tip, is also expressed weakly in the ureteric trunk [39]. Three
spatially defined compartments were isolated from the ureteric
epithelium in the initial microarray analysis; UT, CCD and
MCD. Validation of predicted anchor genes within these
subcompartments identified Slco4c1 as a novel UT anchor gene,
five MCD anchor genes (Gsdmc4, Clmn, AI83600, Fam129a, and
Upk3a) but no CCD anchor genes. However, a cohort of seven
additional genes revealed a complex set of overlapping gene
expression patterns indicating a much greater level of segmen-
tation of this epithelial compartment (Figure 4). Two genes, Tesc
and Scnn1b were expressed in the ureteric epithelia as well as the
adjacent distal nephron tubules. Genes specific to or enriched in
MCD included genes involved in epithelial differentiation and
specialisation. Gsdmc4, part of the Gsdmc gene cluster, also shows
epithelial-specific expression in the skin and gut [40]. Mutations
in Upk3a, which encodes a protein critical to urothelial plaque
formation, can result in renal adysplasia including vesicoureteral
reflux and echogenic cystic kidneys [41]. This set of markers can
be used to further understand functional differentiation along the
ureteric tree.
Distinct temporospatial expression domains within thedeveloping proximal tubule
The strength of the anchor gene analysis was especially
demonstrated within the EPT compartment in which 25 anchor
genes were identified (see Table 1, Figure 3). The EPT genes
demonstrated different regional expression patterns across the
tubular segments of the nephron, with regional patterns observed
within the Stage IV EPT itself, which could be further subdivided
into presumptive S1, S2 and S3 segments (see Figure S1). Figure 5
shows representations of the pattern of expression of each of these
EPT anchor genes in the Stage IV nephron. The majority of EPT
anchor genes maintained this specific pattern of expression in the
proximal tubule of the adult kidney, suggesting very early
specification of this tubular segment (see Figure 5 B, Figure S2).
As well as identifying many EPT anchor genes, a further 34 genes
(identified within the RV, SSB, RC, EPT and LOH compart-
ments) allowed the subdivision of cap mesenchyme derived
nephron development into distinct temporospatial gene expression
patterns including early (Lhx1) and later markers of pan-nephron
development (Gpd1, Susd2, Dpep1), early nephron (Bmp2,
Tmem100), presumptive podocyte (Stc2) and LOH/distal tubule
(Kcnj1, Tmem72) (Figure 3). One group of 12 genes displayed
expression in the tubules of Stage III nephrons. All genes in this
group were also expressed in Stage IV nephrons (Figure 3,
Figure 5A) but were not restricted to the proximal tubule. Other
genes do not commence expression until the differentiation of the
nephron into Stage IV (maturing nephron). This included the 25
anchor genes whose expression was restricted to the proximal
tubules (Figure 3, Figure 5B) together with a further 13 genes
whose expression extended beyond the proximal tubule into other
tubular segments (immature loop of Henle and/or early distal
tubule) (Figure 3, Figure 5C). As with EPT anchor genes, many of
these marker genes maintained the same regional domains of
expression in the adult proximal tubule (Figure 5, Figure S2). This
suggests that segmentation of the early nephron into proximal,
distal and LOH elements does not occur until the formation of a
Stage IV nephron.
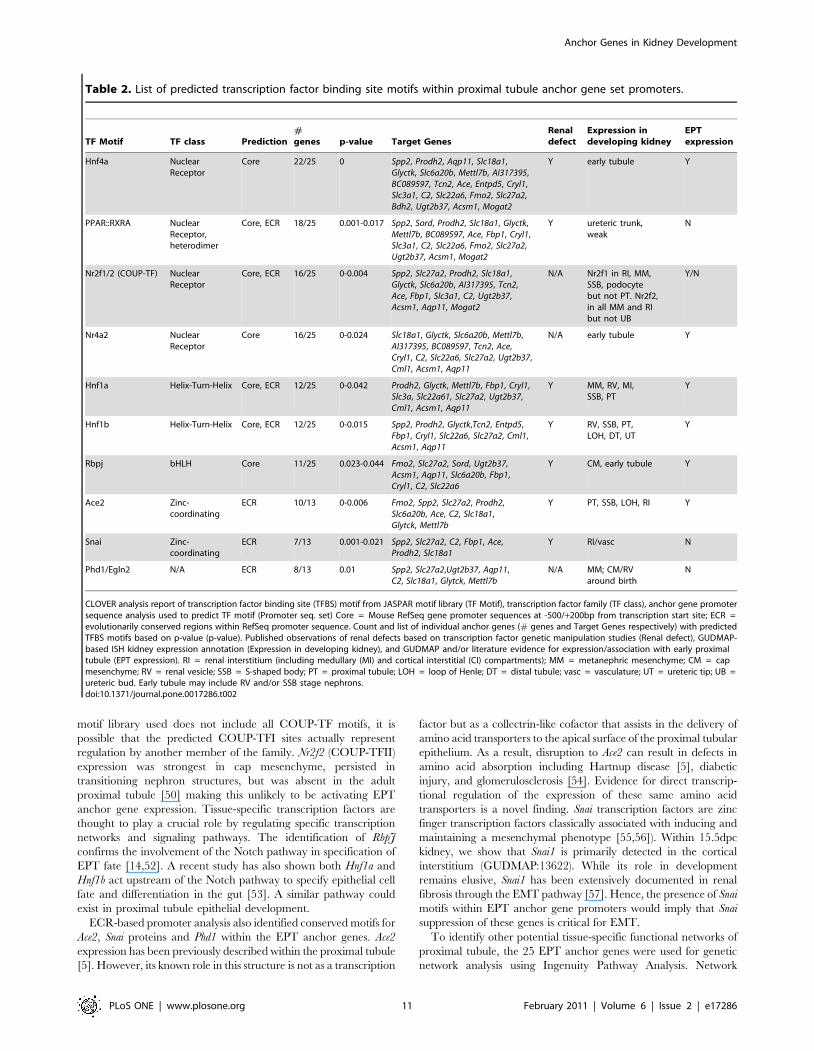
Transcriptional regulation and gene ontologicalrelationships of proximal tubule anchor genes
The large number of anchor genes identified in the proximal
tubule provided the basis to perform downstream analyses to
understand transcriptional control of tissue-specific expression. The
proximal promoters of EPT anchor genes were used to identify over-
represented transcription factor binding motifs defined at 2500/
+200 of RefSeq annotated transcription start sites (referred to as
‘‘Core’’) using the CLOVER algorithm [42] against the JASPAR
motif library [43](see Methods). A second set of sequences containing
only evolutionarily conserved regions within the promoter was also
used in a separate analysis (referred to as ‘‘ECR’’). The collective
results are summarized in Table 2. In total, 10 TF motifs were
statistically enriched in EPT anchor gene promoters using both Core
and ECR analyses. Two of these transcription factors RbpJ and
Hnf1a have been previously shown to directly affect proximal tubule
development and function [14,44]. Hnf1b and Hnf4a transcription
factors are associated with kidney development [45,46,47,48,49]
however no direct involvement during proximal tubule development
has been reported to date. Almost all EPT anchor gene promoters
(22/25) showed binding site for Hnf4a. SISH analysis of Hnf1b and
Hnf4a shows expression within the proximal tubule and other
nephron segments with Hnf1b showing collecting duct expres-
sion and Hnf1a showing S-shaped body expression (see GUDMAP
data Accession IDs GUDMAP:12560 and GUDMAP:12531
respectively).
In addition to Hnf4a, this analysis also detected other nuclear
receptor superfamily TF motifs including sites for binding of the
PPARc:RxRA heterodimer activation complex, COUP-TFI, and
Nr4a2. Activation of perioxisome proliferator-activated receptor
gamma (PPARc) requires heterodimerization of RxRA and is
therefore represented as PPARc:RxRA. The presence of TF motifs
may reflect a role for such proteins in proximal tubular gene
expression or in the regulation of these genes in another context.
Both PPARc and RxRA expression have been detected in the
proximal tubule [50] and are involved in modulating sodium
transport [51]. Although previously only associated with nervous
system development, our own data shows that Nr4a2 is expressed
in early nephron tubules (GUDMAP:5209), suggesting a role in
the regulation of later proximal tubule specification. Nr2f1
(COUP-TFI) expression has only been detected in the interstitial
mesenchyme (GUDMAP:5232), however it is possible that this
transcription factor plays a role in the repression of expression of
these key proximal tubular markers. Alternatively, as the JASPAR
Anchor Genes in Kidney Development
PLoS ONE | www.plosone.org 8 February 2011 | Volume 6 | Issue 2 | e17286
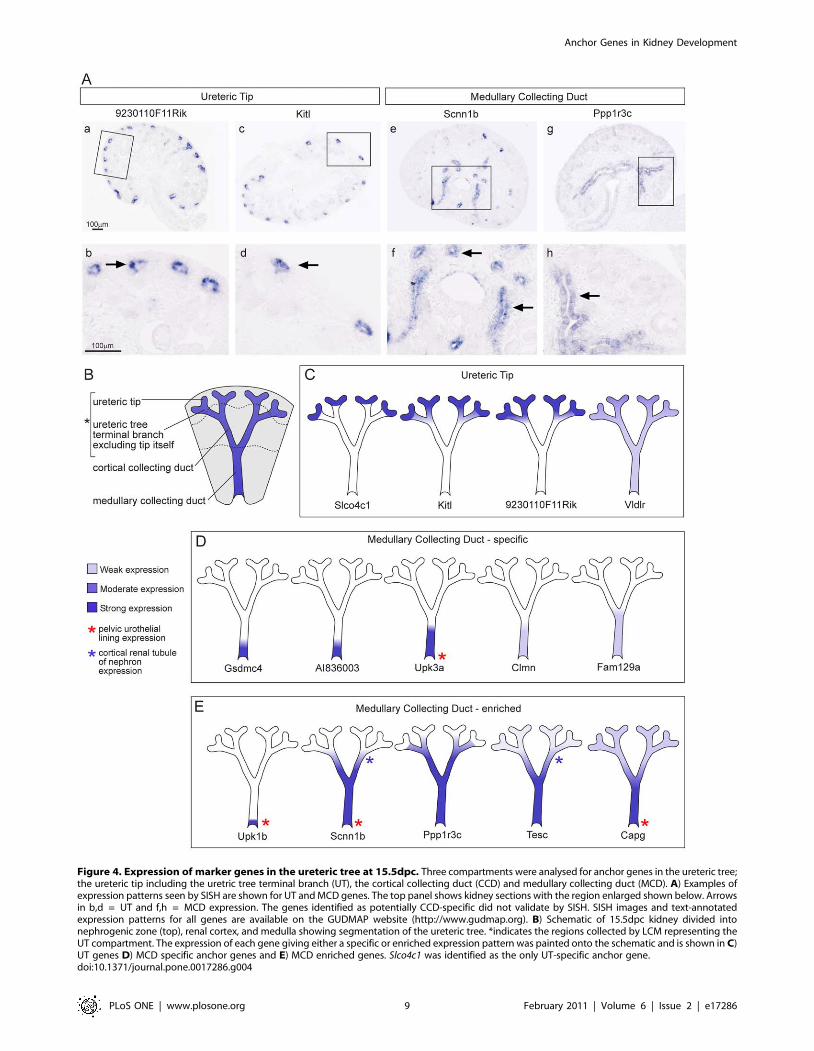
Figure 4. Expression of marker genes in the ureteric tree at 15.5dpc. Three compartments were analysed for anchor genes in the ureteric tree;the ureteric tip including the uretric tree terminal branch (UT), the cortical collecting duct (CCD) and medullary collecting duct (MCD). A) Examples ofexpression patterns seen by SISH are shown for UT and MCD genes. The top panel shows kidney sections with the region enlarged shown below. Arrowsin b,d = UT and f,h = MCD expression. The genes identified as potentially CCD-specific did not validate by SISH. SISH images and text-annotatedexpression patterns for all genes are available on the GUDMAP website (http://www.gudmap.org). B) Schematic of 15.5dpc kidney divided intonephrogenic zone (top), renal cortex, and medulla showing segmentation of the ureteric tree. *indicates the regions collected by LCM representing theUT compartment. The expression of each gene giving either a specific or enriched expression pattern was painted onto the schematic and is shown in C)UT genes D) MCD specific anchor genes and E) MCD enriched genes. Slco4c1 was identified as the only UT-specific anchor gene.doi:10.1371/journal.pone.0017286.g004
Anchor Genes in Kidney Development
PLoS ONE | www.plosone.org 9 February 2011 | Volume 6 | Issue 2 | e17286
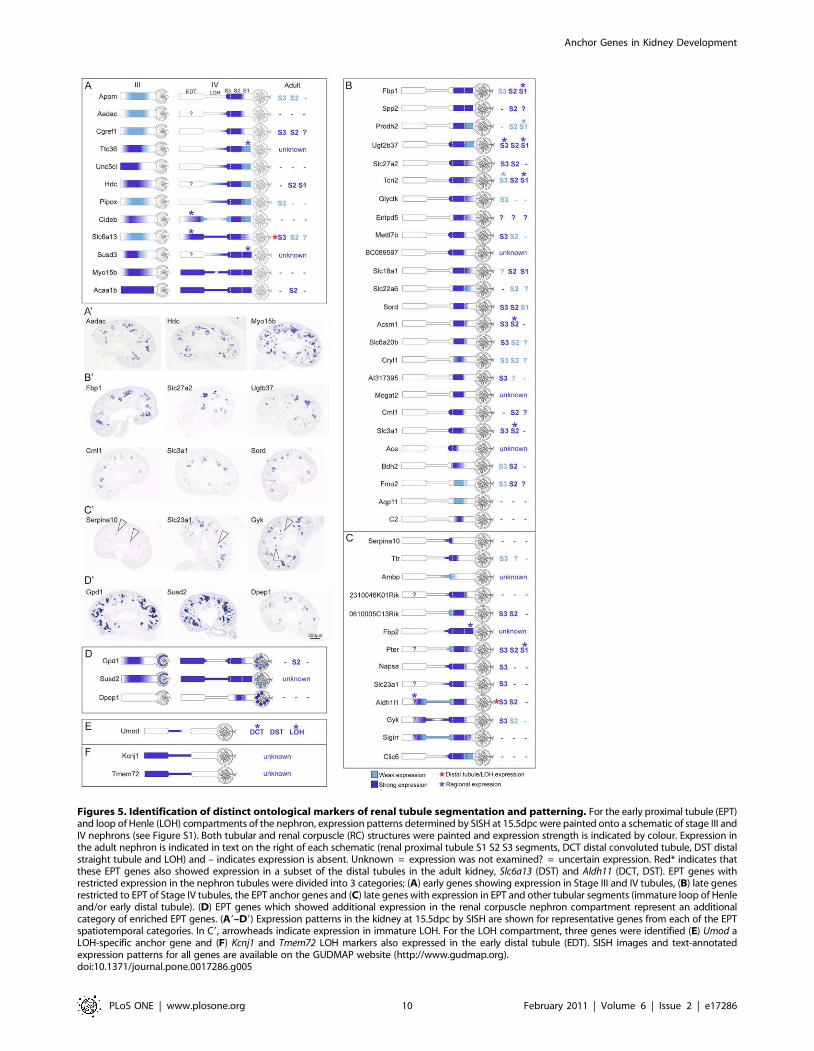
Figures 5. Identification of distinct ontological markers of renal tubule segmentation and patterning. For the early proximal tubule (EPT)and loop of Henle (LOH) compartments of the nephron, expression patterns determined by SISH at 15.5dpc were painted onto a schematic of stage III andIV nephrons (see Figure S1). Both tubular and renal corpuscle (RC) structures were painted and expression strength is indicated by colour. Expression inthe adult nephron is indicated in text on the right of each schematic (renal proximal tubule S1 S2 S3 segments, DCT distal convoluted tubule, DST distalstraight tubule and LOH) and – indicates expression is absent. Unknown = expression was not examined? = uncertain expression. Red* indicates thatthese EPT genes also showed expression in a subset of the distal tubules in the adult kidney, Slc6a13 (DST) and Aldh11 (DCT, DST). EPT genes withrestricted expression in the nephron tubules were divided into 3 categories; (A) early genes showing expression in Stage III and IV tubules, (B) late genesrestricted to EPT of Stage IV tubules, the EPT anchor genes and (C) late genes with expression in EPT and other tubular segments (immature loop of Henleand/or early distal tubule). (D) EPT genes which showed additional expression in the renal corpuscle nephron compartment represent an additionalcategory of enriched EPT genes. (A9–D9) Expression patterns in the kidney at 15.5dpc by SISH are shown for representative genes from each of the EPTspatiotemporal categories. In C9, arrowheads indicate expression in immature LOH. For the LOH compartment, three genes were identified (E) Umod aLOH-specific anchor gene and (F) Kcnj1 and Tmem72 LOH markers also expressed in the early distal tubule (EDT). SISH images and text-annotatedexpression patterns for all genes are available on the GUDMAP website (http://www.gudmap.org).doi:10.1371/journal.pone.0017286.g005
Anchor Genes in Kidney Development
PLoS ONE | www.plosone.org 10 February 2011 | Volume 6 | Issue 2 | e17286
motif library used does not include all COUP-TF motifs, it is
possible that the predicted COUP-TFI sites actually represent
regulation by another member of the family. Nr2f2 (COUP-TFII)
expression was strongest in cap mesenchyme, persisted in
transitioning nephron structures, but was absent in the adult
proximal tubule [50] making this unlikely to be activating EPT
anchor gene expression. Tissue-specific transcription factors are
thought to play a crucial role by regulating specific transcription
networks and signaling pathways. The identification of RbpJ
confirms the involvement of the Notch pathway in specification of
EPT fate [14,52]. A recent study has also shown both Hnf1a and
Hnf1b act upstream of the Notch pathway to specify epithelial cell
fate and differentiation in the gut [53]. A similar pathway could
exist in proximal tubule epithelial development.
ECR-based promoter analysis also identified conserved motifs for
Ace2, Snai proteins and Phd1 within the EPT anchor genes. Ace2
expression has been previously described within the proximal tubule
[5]. However, its known role in this structure is not as a transcription
factor but as a collectrin-like cofactor that assists in the delivery of
amino acid transporters to the apical surface of the proximal tubular
epithelium. As a result, disruption to Ace2 can result in defects in
amino acid absorption including Hartnup disease [5], diabetic
injury, and glomerulosclerosis [54]. Evidence for direct transcrip-
tional regulation of the expression of these same amino acid
transporters is a novel finding. Snai transcription factors are zinc
finger transcription factors classically associated with inducing and
maintaining a mesenchymal phenotype [55,56]). Within 15.5dpc
kidney, we show that Snai1 is primarily detected in the cortical
interstitium (GUDMAP:13622). While its role in development
remains elusive, Snai1 has been extensively documented in renal
fibrosis through the EMT pathway [57]. Hence, the presence of Snai
motifs within EPT anchor gene promoters would imply that Snai
suppression of these genes is critical for EMT.
To identify other potential tissue-specific functional networks of
proximal tubule, the 25 EPT anchor genes were used for genetic
network analysis using Ingenuity Pathway Analysis. Network
Table 2. List of predicted transcription factor binding site motifs within proximal tubule anchor gene set promoters.
TF Motif TF class Prediction#genes p-value Target Genes
Renaldefect
Expression indeveloping kidney
EPTexpression
Hnf4a NuclearReceptor
Core 22/25 0 Spp2, Prodh2, Aqp11, Slc18a1,Glyctk, Slc6a20b, Mettl7b, AI317395,BC089597, Tcn2, Ace, Entpd5, Cryl1,Slc3a1, C2, Slc22a6, Fmo2, Slc27a2,Bdh2, Ugt2b37, Acsm1, Mogat2
Y early tubule Y
PPAR::RXRA NuclearReceptor,heterodimer
Core, ECR 18/25 0.001-0.017 Spp2, Sord, Prodh2, Slc18a1, Glyctk,Mettl7b, BC089597, Ace, Fbp1, Cryl1,Slc3a1, C2, Slc22a6, Fmo2, Slc27a2,Ugt2b37, Acsm1, Mogat2
Y ureteric trunk,weak
N
Nr2f1/2 (COUP-TF) NuclearReceptor
Core, ECR 16/25 0-0.004 Spp2, Slc27a2, Prodh2, Slc18a1,Glyctk, Slc6a20b, AI317395, Tcn2,Ace, Fbp1, Slc3a1, C2, Ugt2b37,Acsm1, Aqp11, Mogat2
N/A Nr2f1 in RI, MM,SSB, podocytebut not PT. Nr2f2,in all MM and RIbut not UB
Y/N
Nr4a2 NuclearReceptor
Core 16/25 0-0.024 Slc18a1, Glyctk, Slc6a20b, Mettl7b,AI317395, BC089597, Tcn2, Ace,Cryl1, C2, Slc22a6, Slc27a2, Ugt2b37,Cml1, Acsm1, Aqp11
N/A early tubule Y
Hnf1a Helix-Turn-Helix Core, ECR 12/25 0-0.042 Prodh2, Glyctk, Mettl7b, Fbp1, Cryl1,Slc3a, Slc22a61, Slc27a2, Ugt2b37,Cml1, Acsm1, Aqp11
Y MM, RV, MI,SSB, PT
Y
Hnf1b Helix-Turn-Helix Core, ECR 12/25 0-0.015 Spp2, Prodh2, Glyctk,Tcn2, Entpd5,Fbp1, Cryl1, Slc22a6, Slc27a2, Cml1,Acsm1, Aqp11
Y RV, SSB, PT,LOH, DT, UT
Y
Rbpj bHLH Core 11/25 0.023-0.044 Fmo2, Slc27a2, Sord, Ugt2b37,Acsm1, Aqp11, Slc6a20b, Fbp1,Cryl1, C2, Slc22a6
Y CM, early tubule Y
Ace2 Zinc-coordinating
ECR 10/13 0-0.006 Fmo2, Spp2, Slc27a2, Prodh2,Slc6a20b, Ace, C2, Slc18a1,Glytck, Mettl7b
Y PT, SSB, LOH, RI Y
Snai Zinc-coordinating
ECR 7/13 0.001-0.021 Spp2, Slc27a2, C2, Fbp1, Ace,Prodh2, Slc18a1
Y RI/vasc N
Phd1/Egln2 N/A ECR 8/13 0.01 Spp2, Slc27a2,Ugt2b37, Aqp11,C2, Slc18a1, Glytck, Mettl7b
N/A MM; CM/RVaround birth
N
CLOVER analysis report of transcription factor binding site (TFBS) motif from JASPAR motif library (TF Motif), transcription factor family (TF class), anchor gene promotersequence analysis used to predict TF motif (Promoter seq. set) Core = Mouse RefSeq gene promoter sequences at -500/+200bp from transcription start site; ECR =evolutionarily conserved regions within RefSeq promoter sequence. Count and list of individual anchor genes (# genes and Target Genes respectively) with predictedTFBS motifs based on p-value (p-value). Published observations of renal defects based on transcription factor genetic manipulation studies (Renal defect), GUDMAP-based ISH kidney expression annotation (Expression in developing kidney), and GUDMAP and/or literature evidence for expression/association with early proximaltubule (EPT expression). RI = renal interstitium (including medullary (MI) and cortical interstitial (CI) compartments); MM = metanephric mesenchyme; CM = capmesenchyme; RV = renal vesicle; SSB = S-shaped body; PT = proximal tubule; LOH = loop of Henle; DT = distal tubule; vasc = vasculature; UT = ureteric tip; UB =ureteric bud. Early tubule may include RV and/or SSB stage nephrons.doi:10.1371/journal.pone.0017286.t002
Anchor Genes in Kidney Development
PLoS ONE | www.plosone.org 11 February 2011 | Volume 6 | Issue 2 | e17286
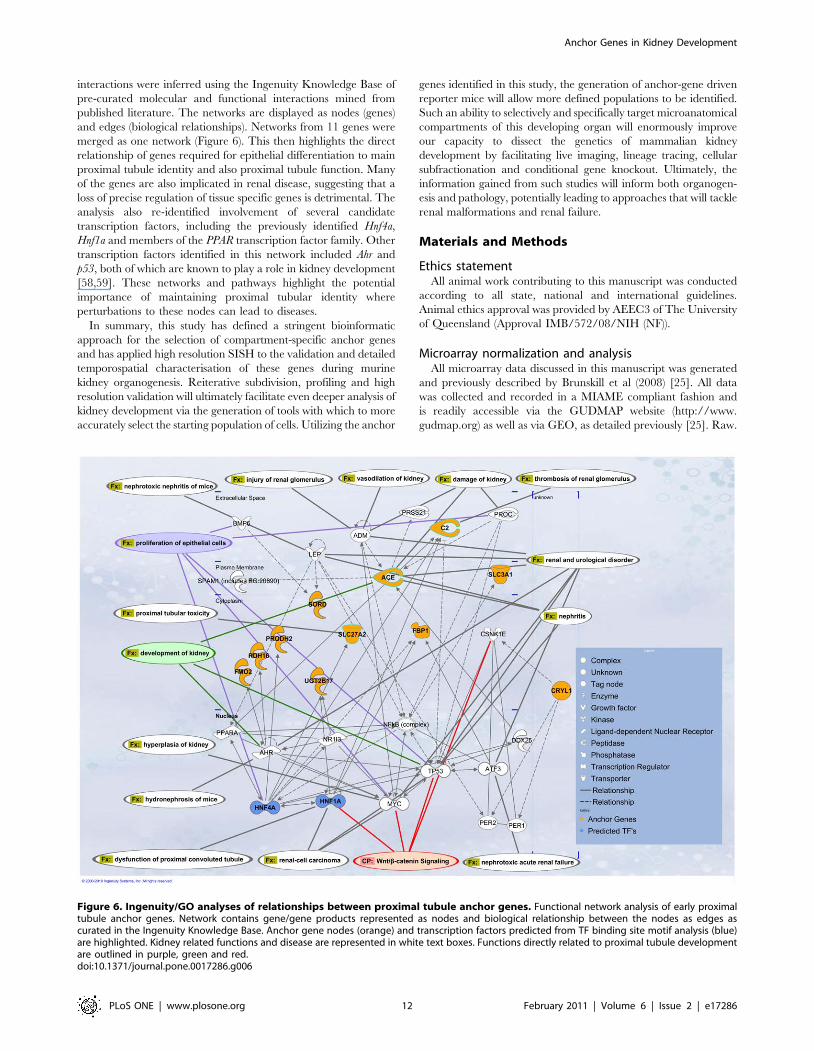
interactions were inferred using the Ingenuity Knowledge Base of
pre-curated molecular and functional interactions mined from
published literature. The networks are displayed as nodes (genes)
and edges (biological relationships). Networks from 11 genes were
merged as one network (Figure 6). This then highlights the direct
relationship of genes required for epithelial differentiation to main
proximal tubule identity and also proximal tubule function. Many
of the genes are also implicated in renal disease, suggesting that a
loss of precise regulation of tissue specific genes is detrimental. The
analysis also re-identified involvement of several candidate
transcription factors, including the previously identified Hnf4a,
Hnf1a and members of the PPAR transcription factor family. Other
transcription factors identified in this network included Ahr and
p53, both of which are known to play a role in kidney development
[58,59]. These networks and pathways highlight the potential
importance of maintaining proximal tubular identity where
perturbations to these nodes can lead to diseases.
In summary, this study has defined a stringent bioinformatic
approach for the selection of compartment-specific anchor genes
and has applied high resolution SISH to the validation and detailed
temporospatial characterisation of these genes during murine
kidney organogenesis. Reiterative subdivision, profiling and high
resolution validation will ultimately facilitate even deeper analysis of
kidney development via the generation of tools with which to more
accurately select the starting population of cells. Utilizing the anchor
genes identified in this study, the generation of anchor-gene driven
reporter mice will allow more defined populations to be identified.
Such an ability to selectively and specifically target microanatomical
compartments of this developing organ will enormously improve
our capacity to dissect the genetics of mammalian kidney
development by facilitating live imaging, lineage tracing, cellular
subfractionation and conditional gene knockout. Ultimately, the
information gained from such studies will inform both organogen-
esis and pathology, potentially leading to approaches that will tackle
renal malformations and renal failure.
Materials and Methods
Ethics statementAll animal work contributing to this manuscript was conducted
according to all state, national and international guidelines.
Animal ethics approval was provided by AEEC3 of The University
of Queensland (Approval IMB/572/08/NIH (NF)).
Microarray normalization and analysisAll microarray data discussed in this manuscript was generated
and previously described by Brunskill et al (2008) [25]. All data
was collected and recorded in a MIAME compliant fashion and
is readily accessible via the GUDMAP website (http://www.
gudmap.org) as well as via GEO, as detailed previously [25]. Raw.
Figure 6. Ingenuity/GO analyses of relationships between proximal tubule anchor genes. Functional network analysis of early proximaltubule anchor genes. Network contains gene/gene products represented as nodes and biological relationship between the nodes as edges ascurated in the Ingenuity Knowledge Base. Anchor gene nodes (orange) and transcription factors predicted from TF binding site motif analysis (blue)are highlighted. Kidney related functions and disease are represented in white text boxes. Functions directly related to proximal tubule developmentare outlined in purple, green and red.doi:10.1371/journal.pone.0017286.g006
Anchor Genes in Kidney Development
PLoS ONE | www.plosone.org 12 February 2011 | Volume 6 | Issue 2 | e17286
CEL (Affymetrix M430v2) files were obtained for all compart-
ments except early tissues (ureteric bud and metanephric
mesenchyme (E11.5)) and pelvic regions (urothelium and uretral
smooth muscle from (GEO ID: GSE6290, 6589, 8232, 8360,
12588)) and 11 compartments were chosen for analysis: ureteric
tip, cortical collecting duct, medullary collecting duct,, renal
vesicle, S-shaped body, renal corpuscle/glomerulus, loop of Henle,
proximal tubule, cortical interstitium, medullary interstitium and
cap mesenchyme. Normalization of the. CEL files was performed
using RMA in Genespring (GX 7.3.1 (Agilent)). Differential
expression was defined using a Welch ANOVA test (P ,0.01) plus
Benjamini and Hochberg correction to define a cohort with
dynamic expression across all sub-compartments. All genes were
required to have a minimum of 2 fold expression and 100RFU for
raw signal. Proximal tubule candidate anchor genes/probesets
were further filtered to those with a minimum of 10 fold-change
difference to reduce the number of targets for validation.
Design of in situ hybridisation probes/Riboprobegeneration tool
Primers were designed to amplify 500–800 bp product pri-
marily towards the 39UTR region of each transcript using the
Primer3 program (http://frodo.wi.mit.edu/). In each case the
reverse primer included a T7 polymerase promoter tag for the
generation of an antisense riboprobe using T7RNA polymerase.
Custom-made tracks of the riboprobe amplicons and primers were
generated for visualization on the UCSC genome browser [60]
against genomic regions, transcripts, and corresponding Affyme-
trix probesets. Instructions for track visualization and riboprobe
selection are available (http://uqgudmap.imb.uq.edu.au/tools).
For the riboprobe generation tool, all Affymetrix probes were
mapped to a non-redundant set of full length mouse cDNA
transcripts [61] and RefSeq genes for the mouse and riboprobe
amplicons designed so as to generate riboprobes of 500–800 bp.
Given the transcriptional complexity of some loci and the dynamic
nature of transcript and locus annotations over time, it was
important to capture the exact region spanning at least 80% of the
11 Affymetrix probes to minimize the variable expression patterns
between the array and ISH. Probe sequences from probesets are
matched to the corresponding DNA template from the cDNA and
RefSeq set and primers are designed for this region of amplification.
Where multiple probe sets existed for a locus, the physical overlap of
probe sets with exonic sequences used to generate the riboprobe and
a focus towards the 39 end of transcripts was also prioritized. This
pipeline, including all results from the mappings of the non-
redundant full length cDNA transcripts and Affymetrix probesets is
accessible through our Affymetrix probe design tool (http://
uqgudmap.imb.uq.edu.au/riboprobe_design/).
Tissue collection and processingOutbred CD1 mouse embryos of unknown sex (both male and
female) were collected at 10.5, 13.5 and 15.5 days post coitum (dpc)
(Theiler Stages 17, 21, 23) from pregnant adult female mice which
were sacrificed by cervical dislocation. The embryonic kidneys and
adult kidneys (from either pregnant or non-pregnant females or
males) were dissected in ice-cold Phosphate Buffered Saline (PBS)
and fixed overnight in fresh 4% paraformaldehyde in PBS at 4uC.
Section mRNA in situ hybridisationExpression patterns were analysed by RNA section in situ hy-
bridisation using digoxigenin (DIG)-labelled antisense riboprobes
as described previously [4,38,62]. The protocol is also available on
the GUDMAP (Genitourinary Development Molecular Anatomy
Project) gene expression database (http://www.gudmap.org).
Briefly, kidneys were processed and embedded in paraffin and
sectioned at 7 mm. Following dewaxing and rehydration, sections
were fixed with 4% paraformaldehyde in PBS, washed with PBS,
assembled into slide chambers and inserted into the Tecan Freedom
Evo 150 robot. Sections were permeabilised with Proteinase K
(10 mg/ml) for 20–30minutes and acetylated (0.1 M triethanol-
amine, 0.65%HCl, 0.25% (v/v) acetic anhydride). Sections were
immersed in pre-hybridisation solution whilst the chamber racks
were heated from 25uC to 68uC. Hybridisation occurred at 68uC for
10 hours with 0.5 mg/ml of probe in hybridisation buffer (50%
formamide, 10% dextran sulphate, 1x Denhardt’s, 0.2 mg/ml yeast
tRNA, 0.5 mg/ml salmon sperm). After a series of SSC stringency
washes, some sections were treated with 2 mg/ml RNase A and all
sections were blocked (20% sheep serum, 2% Blocking Reagent in
1x MBST (100 mM Maleic acid, 150 mM NaCl, 0.1% Tween-20,
pH7.5) and incubated with 1:4000 of anti-DIG-alkaline phospha-
tase Fab fragments for 6 hours at 4uC. Sections were washed with
NTMT (0.1 M NaCl, 0.1 M Tris.HCl pH9.6, 50 mM MgCl2,
0.1% Tween20). Chromogenic substrate BM Purple was used to
detect the in situ alkaline phosphatase activity. Once the signal had
reached optimal intensity (4–100 hr), the slides were rinsed and
fixed in 4% paraformaldehyde/PBS at 25uC for 10 min followed by
PBS washes in order to preserve the mRNA in situ hybridisation
signal. In order to keep the level of false negatives to a minimum,
control riboprobes for monitoring high and low gene expression
(Wnt4 and Shh respectively) were included in every hybridisation
run. Resulting sections were scanned using a semi-automated. slide
System from Olympus and Soft Imaging Systems (BX51 micro-
scope, digital CCD camera, motorized scanning stage and
workstation, automated slide loader and. slide software) and images
captured using Olyvia software (Soft Imaging Systems, Olympus)
and Adobe Photoshop CS2. All analyses presented (both microarray
and SISH) are for genes from 3 compartments of the 15.5dpc mouse
kidney, including; early proximal tubule (EPT), renal vesicle (RV)
and renal medullary interstitium (MI). It should be noted that RV
genes originated from microarrays hybridised with renal vesicles
obtained from 12.5dpc kidneys by LCM.
Enrichment for transcription factor binding sites andfunctional network analysis
Transcription factor binding site (TFBS) motifs was scanned
within two sets of core promoter regions from proximal tubule
anchor genes; a) the entire core promoter sequence (+500 bp/
2200 bp from the transcription start site retrieved from UCSC
Genome Browser, and b) only evolutionary conserved sequences
within the core promoter set with at least 70% identity conserved
across a minimum of three species from the ECR Browser using
the CLOVER algorithm [42]. Background sequence sets from
mouse Chromosome 19 and mouse CpG islands were used as
recommended. Transcription factor matrix library of all species
was used to infer a broader set of potential TFBS to compensate
for some missing TFBS motifs within the vertebrate collection
obtained from JASPAR [43].
Proximal tubule anchor genes network and GO analysis was
generated by Ingenuity Pathway Analysis (http://www.ingenuity.com),
using default settings and gene interactions curated in the Knowledge
Base database. Predicted gene nodes without direct interactions to
anchor genes were excluded from the network diagram.
Supporting Information
Figure S1 Domains of gene expression in the earlyproximal tubule at 15.5dpc. Expression analysis of early
Anchor Genes in Kidney Development
PLoS ONE | www.plosone.org 13 February 2011 | Volume 6 | Issue 2 | e17286
proximal tubule (EPT)-specific genes was performed using SISH
of 15.5dpc kidneys to validate the genes identified through
microarray profiling. A) Schematic of capillary loop (Stage III)
and maturing nephron (Stage IV) subdivided into renal tubular
and renal corpuscle structures. The EPT of maturing nephrons
was subdivided into presumptive S1, S2 & S3 segments based on
histology and anatomical location within the kidney. B)Example SISH images of expression domains seen in EPT of
Stage III (a) and Stage IV (b-d) nephrons at 15.5dpc. (a) Gpd1 in
Stage III nephron (EPT and anlage of loop of Henle). The
entire nephron can be seen from ureteric tip to renal corpuscle
(RC). The outside edge of the kidney and nephron are outlined.
Expression in visceral epithelium of RC is indicated (arrowhead).
(b) Gpd1 in EPT (arrows), the proximal portion of immature loop
of Henle (ILH, arrowheads) and the adjacent S3 EPT (open
arrowhead). Gpd1 was absent from the distal portion of the ILH
within the medulla. (c) Spp2 was specific to the EPT (S1 & S2).
Enlarged region (c9) shows Spp2 in S1 adjacent to RC. (d) Gyk in
EPT and ILH. Enlarged region (d9) shows Gyk in S3 EPT and
ILH.
(TIF)
Figure S2 Spatial expression analysis of early proximaltubule-specific genes in the adult kidney. SISH of adult
kidney revealed domains of expression in the renal proximal
tubule of the mature Stage IV nephron. Transverse sections
through the whole kidney (top) with high magnifications of two
enlarged regions shown below; S3 in the outer stripe of outer
medulla (a-d) and S1, S2 and a small subset of S3 in the renal
cortex (e-h). Examples are shown from each of the adult expression
types; broad expression in all renal proximal tubules S1, S2 and S3
(Fbp1 – note expression was absent from the first portion of S1
adjacent to the renal corpuscle but present in other S1, S2 and S3)
and regional expression in either proximal convoluted tubule
(Acaa1b and Spp2 - S2 and a subset of S1); or proximal straight
tubule (Slc3a1 - S3).
(TIF)
Table S1 Complete list of all genes selected for SISHvalidation. All candidate anchor genes identified in microarray
analysis from both 11 and 7 kidney-subcompartments. ‘‘Array
Information’’ contains Affy 430.2 probeset IDs (Affy ID), probese
raw signal intensity in raw florescent units (Raw), fold-change
values based on microarray normalization performed in Gene-
Spring software, median raw signal intensity across other
subcompartments (raw signal/normalized). ‘‘SISH expression
pattern across the entire TS23 kidney’’ contains gene expression
pattern annotations scored against all known 15.5 kidney
subcompartments. Candidate genes without probes were due to
unavailable Fantom 2 amplicon/clones (Riken), or failed PCR.
(XLS)
Acknowledgments
SMG and MHL are Research Fellows of the National Health and
Medical Research Council of Australia. We thank the GUDMAP
editorial office, Edinburgh University, Scotland, led by Professor Jamie
Davies and including Jane Armstrong, Jane Brennan, Sue Lloyd-
MacGilp and Chris Armit, and the GUDMAP database development
team, MRC Human Genetics Unit, Western General Hospital, Scotland,
led by Professor Duncan Davidson and including Derek Houghton, Ying
Cheng, Xingjun Pi, Mehran Sharghi and Simon Harding, for their
support and assistance in editing and uploading data. We also
acknowledge other members of the GUDMAP consortium as a whole,
notably Professor S. Steven Potter and Dr. Eric W. Brunskill, Division
of Biomedical Informatics, Children’s Hospital Medical Center, Cincin-
nati, USA.
Author Contributions
Conceived and designed the experiments: RDT KMG SMG MHL.
Performed the experiments: RDT BAR EL HSC. Analyzed the data: RDT
KMG MHL. Contributed reagents/materials/analysis tools: DT DTPT.
Wrote the paper: RDT KMG MHL. Edited the manuscript: RDT KMG
SMG MHL. Designed the program for primer design: RDT DTPT.
Designed the riboprobes: RDT DT DTPT.
References
1. Drummond IA (2005) Kidney Development and Disease in the Zebrafish. J Am
Soc Nephrol 16: 299–304.
2. Luyckx VA, Brenner BM (2005) Low birth weight, nephron number, and kidney
disease. Kidney Int 68: S68–S77.
3. Al-Awqati Q, Oliver JA (2002) Stem cells in the kidney. Kidney Int 61: 387–395.
4. Little MH, Brennan J, Georgas K, Davies JA, Davidson DR, et al. (2007) Ahigh-resolution anatomical ontology of the developing murine genitourinary
tract. Gene Expr Patterns 7: 680–699.
5. Simone MRC, Dustin S, Victoria M, Katja H, Klaas MP, et al. (2009) Tissue-Specific Amino Acid Transporter Partners ACE2 and Collectrin Differentially
Interact With Hartnup Mutations. Gastroenterology 136: 872–882.e873.
6. Karner CM, Chirumamilla R, Aoki S, Igarashi P, Wallingford JB, et al. (2009)Wnt9b signaling regulates planar cell polarity and kidney tubule morphogenesis.
Nat Genet 41: 793–799.
7. Kobayashi A, Valerius MT, Mugford JW, Carroll TJ, Self M, et al. (2008) Six2
defines and regulates a multipotent self-renewing nephron progenitor population
throughout mammalian kidney development. Cell Stem Cell 3: 169–181.
8. Boyle S, Misfeldt A, Chandler KJ, Deal KK, Southard-Smith EM, et al. (2008)
Fate mapping using Cited1-CreERT2 mice demonstrates that the cap
mesenchyme contains self-renewing progenitor cells and gives rise exclusivelyto nephronic epithelia. Dev Biology 313: 234–245.
9. Georgas K, Rumballe B, Valerius MT, Chiu HS, Thiagarajan RD, et al. (2009)
Analysis of early nephron patterning reveals a role for distal RV proliferation infusion to the ureteric tip via a cap mesenchyme-derived connecting segment.
Dev Biol 332: 273–286.
10. Jacobson HR (1981) Functional segmentation of the mammalian nephron.Am J Physiol Renal Physiol 241: F203–218.
11. Little MH (2006) Regrow or Repair: Potential Regenerative Therapies for the
Kidney. J Am Soc Nephrol 17: 2390–2401.
12. Stark K, Vainio S, Vassileva G, McMahon AP (1994) Epithelial transformation
of metanephric mesenchyme in the developing kidney regulated by Wnt-4.
Nature 372: 679–683.
13. Carroll TJ, Park J-S, Hayashi S, Majumdar A, McMahon AP (2005) Wnt9b
Plays a Central Role in the Regulation of Mesenchymal to Epithelial TransitionsUnderlying Organogenesis of the Mammalian Urogenital System. Dev Cell 9:
283–292.
14. Cheng HT, Kim M, Valerius MT, Surendran K, Schuster-Gossler K, et al.(2007) Notch2, but not Notch1, is required for proximal fate acquisition in the
mammalian nephron. Development 134: 801–811.
15. Alcorn D, Maric C, McCausland J (1999) Development of the renal interstitium.Pediatr Nephrol 13: 347–354.
16. Little M, Georgas K, Pennisi D, Wilkinson L, Peter K (2010) Kidney
Development: Two Tales of Tubulogenesis. Current Topics in DevelopmentalBiology Academic Press. pp 193–229.
17. Rae F, Woods K, Sasmono T, Campanale N, Taylor D, et al. (2007) Characterisation
and trophic functions of murine embryonic macrophages based upon the use of a
Csf1r-EGFP transgene reporter. Dev Biol 308: 232–246.
18. Kisseleva T, Brenner DA (2008) Fibrogenesis of Parenchymal Organs. Proc AmThorac Soc 5: 338–342.
19. Self M, Lagutin OV, Bowling B, Hendrix J, Cai Y, et al. (2006) Six2 is required
for suppression of nephrogenesis and progenitor renewal in the developingkidney. Embo J 25: 5214–5228.
20. Humphreys BD, Valerius MT, Kobayashi A, Mugford JW, Soeung S, et al.
(2008) Intrinsic epithelial cells repair the kidney after injury. Cell Stem Cell 2:284–291.
21. Challen G, Gardiner B, Caruana G, Kostoulias X, Martinez G, et al. (2005)
Temporal and spatial transcriptional programs in murine kidney development.Physiol Genomics 23: 159–171.
22. Schwab K, Hartman HA, Liang HC, Aronow BJ, Patterson LT, et al. (2006)
Comprehensive microarray analysis of Hoxa11/Hoxd11 mutant kidneydevelopment. Dev Biol 293: 540–554.
23. Potter SS, Hartman HA, Kwan KM, Behringer RR, Patterson LT (2007) Laser
capture-microarray analysis of Lim1 mutant kidney development. Genesis 45:
432–439.
Anchor Genes in Kidney Development
PLoS ONE | www.plosone.org 14 February 2011 | Volume 6 | Issue 2 | e17286
24. Rumballe B, Georgas K, Wilkinson L, Little M (2010) Molecular anatomy of the
kidney: what have we learned from gene expression and functional genomics?Pediatr Nephrol 25: 1005–1016.
25. Brunskill EW, Aronow BJ, Georgas K, Rumballe B, Valerius MT, et al. (2008)
Atlas of gene expression in the developing kidney at microanatomic resolution.Dev Cell 15: 781–791.
26. Ghate A, Befort K, Becker JA, Filliol D, Bole-Feysot C, et al. (2007)Identification of novel striatal genes by expression profiling in adult mouse
brain. Neuroscience 146: 1182–1192.
27. Lein ES, Hawrylycz MJ, Ao N, Ayres M, Bensinger A, et al. (2007) Genome-wide atlas of gene expression in the adult mouse brain. Nature 445: 168–176.
28. Zirlinger M, Kreiman G, Anderson DJ (2001) Amygdala-enriched genesidentified by microarray technology are restricted to specific amygdaloid
subnuclei. Proc Natl Acad Sci U S A 98: 5270–5275.29. Schmidt-Ott KM, Yang J, Chen X, Wang H, Paragas N, et al. (2005) Novel
regulators of kidney development from the tips of the ureteric bud. J Am Soc
Nephrol 16: 1993–2002.30. Caruana G, Cullen-McEwen L, Nelson AL, Kostoulias X, Woods K, et al.
(2006) Spatial gene expression in the T-stage mouse metanephros. Gene ExprPatterns 6: 807–825.
31. Wertz K, Herrmann BG (1999) Kidney-specific cadherin (cdh16) is expressed in
embryonic kidney, lung, and sex ducts. Mech Dev 84: 185–188.32. Mugford JW, Yu J, Kobayashi A, McMahon AP (2009) High-resolution gene
expression analysis of the developing mouse kidney defines novel cellularcompartments within the nephron progenitor population. Dev Biol 333:
312–323.33. Lee C-K, Sunkin S, Kuan C, Thompson C, Pathak S, et al. (2008) Quantitative
methods for genome-scale analysis of in situ hybridization and correlation with
microarray data. Genome Biology 9: R23.34. Rozen S, Skaletsky H (2000) Primer3 on the WWW for general users and for
biologist programmers. Methods Mol Biol 132: 365–386.35. McMahon AP, Aronow BJ, Davidson DR, Davies JA, Gaido KW, et al. (2008)
GUDMAP: the genitourinary developmental molecular anatomy project. J Am
Soc Nephrol 19: 667–671.36. Kuhn RM, Karolchik D, Zweig AS, Wang T, Smith KE, et al. (2009) The
UCSC Genome Browser Database: update 2009. Nucleic Acids Res. ppD755–761.
37. Srinivas S, Goldberg MR, Watanabe T, D’Agati V, Al-Awqati Q, et al. (1999)Expression of green fluorescent protein in the ureteric bud of transgenic mice: A
new tool for the analysis of ureteric bud morphogenesis. Dev Genet 24: 241–251.
38. Georgas K, Rumballe B, Wilkinson L, Chiu H, Lesieur E, et al. (2008) Use ofdual section mRNA in situ hybridisation/immunohistochemistry to clarify gene
expression patterns during the early stages of nephron development in theembryo and in the mature nephron of the adult mouse kidney. Histochem Cell
Biol 130: 927–942.
39. Majumdar A, Vainio S, Kispert A, McMahon J, McMahon AP (2003) Wnt11and Ret/Gdnf pathways cooperate in regulating ureteric branching during
metanephric kidney development. Development 130: 3175–3185.40. Tamura M, Tanaka S, Fujii T, Aoki A, Komiyama H, et al. (2007) Members of
a novel gene family, Gsdm, are expressed exclusively in the epithelium of theskin and gastrointestinal tract in a highly tissue-specific manner. Genomics 89:
618–629.
41. Jenkins D, Bitner-Glindzicz M, Malcolm S, Hu C-CA, Allison J, et al. (2005) DeNovo Uroplakin IIIa Heterozygous Mutations Cause Human Renal Adysplasia
Leading to Severe Kidney Failure. J Am Soc Nephrol 16: 2141–2149.42. Frith MC, Fu Y, Yu L, Chen JF, Hansen U, et al. (2004) Detection of functional
DNA motifs via statistical over-representation. Nucleic Acids Res 32:
1372–1381.
43. Sandelin A, Alkema W, Engstrom P, Wasserman WW, Lenhard B (2004)
JASPAR: an open-access database for eukaryotic transcription factor binding
profiles. Nucleic Acids Res 32: D91–D94.
44. Pontoglio M, Barra J, Hadchouel M, Doyen A, Kress C, et al. (1996) Hepatocyte
Nuclear Factor 1 Inactivation Results in Hepatic Dysfunction, Phenylketonuria,
and Renal Fanconi Syndrome. Cell 84: 575–585.
45. Kanazawa T, Konno A, Hashimoto Y, Kon Y (2010) Hepatocyte nuclear factor
4 alpha is related to survival of the condensed mesenchyme in the developing
mouse kidney. Devl Dyn 239: 1145–1154.
46. Gresh L, Fischer E, Reimann A, Tanguy M, Garbay S, et al. (2004) A
transcriptional network in polycystic kidney disease. EMBO J 23: 1657–1668.
47. Coffinier C, Barra J, Babinet C, Yaniv M (1999) Expression of the vHNF1/
HNF1[beta] homeoprotein gene during mouse organogenesis. Mech Dev 89:
211–213.
48. Kanazawa T, Konno A, Hashimoto Y, Kon Y (2009) Expression of hepatocyte
nuclear factor 4alpha in developing mice. Anat Histol Embryol 38: 34–41.
49. Lucas B, Grigo K, Erdmann S, Lausen J, Klein-Hitpass L, et al. (2005)
HNF4[alpha] reduces proliferation of kidney cells and affects genes deregulated
in renal cell carcinoma. Oncogene 24: 6418–6431.
50. Suh JM, Yu CT, Tang K, Tanaka T, Kodama T, et al. (2006) The expression
profiles of nuclear receptors in the developing and adult kidney. Mol Endocrinol
20: 3412–3420.
51. Ambrozewicz M, DeBose SC, Duran-Simsek F, Ali KA, Dobrian AD (2007)
PPARgamma Modulates the Sodium Transporters in the Renal Proximal
Tubule Epithelium in Vivo and in Vitro. FASEB J 21: A901.
52. Leimeister C, Schumacher N, Gessler M (2003) Expression of Notch pathway
genes in the embryonic mouse metanephros suggests a role in proximal tubule
development. Gene Expr Patterns 3: 595–598.
53. D’Angelo A, Bluteau O, Garcia-Gonzalez MA, Gresh L, Doyen A, et al. (2010)
Hepatocyte nuclear factor 1[alpha] and [beta] control terminal differentiation
and cell fate commitment in the gut epithelium. Development 137: 1573–1582.
54. Reich HN, Oudit GY, Penninger JM, Scholey JW, Herzenberg AM (2008)
Decreased glomerular and tubular expression of ACE2 in patients with type 2
diabetes and kidney disease. Kidney Int 74: 1610–1616.
55. Nieto MA (2002) The snail superfamily of zinc-finger transcription factors. Nat
Rev Mol Cell Biol 3: 155–166.
56. Thiery JP, Sleeman JP (2006) Complex networks orchestrate epithelial-
mesenchymal transitions. Nat Rev Mol Cell Biol 7: 131–142.
57. Boutet A, De Frutos CA, Maxwell PH, Mayol MJ, Romero J, et al. (2006) Snail
activation disrupts tissue homeostasis and induces fibrosis in the adult kidney.
EMBO J 25: 5603–5613.
58. Hadi Falahatpisheh M, Ramos KS (2003) Ligand-activated Ahr signaling leads
to disruption of nephrogenesis and altered Wilms’ tumor suppressor mRNA
splicing. Oncogene 22: 2160–2171.
59. Menke AL, Clarke AR, Leitch A, Ijpenberg A, Williamson KA, et al. (2002)
Genetic Interactions between the Wilms’ Tumor 1 Gene and the p53 Gene.
Cancer Res 62: 6615–6620.
60. Rhead B, Karolchik D, Kuhn RM, Hinrichs AS, Zweig AS, et al. (2010) The
UCSC Genome Browser database: update 2010. Nucleic Acids Res. pp
D613–619.
61. Maeda N, Kasukawa T, Oyama R, Gough J, Frith M, et al. (2006) Transcript
Annotation in FANTOM3: Mouse Gene Catalog Based on Physical cDNAs.
PLoS Genet 2: e62.
62. Rumballe B, Georgas K, Little MH (2008) High-Throughput Paraffin Section In
Situ Hybridization and Dual Immunohistochemistry on Mouse Tissues. CSH
Protoc 2008: 5030.
Anchor Genes in Kidney Development
PLoS ONE | www.plosone.org 15 February 2011 | Volume 6 | Issue 2 | e17286