icici prudential fmcg etf nfo: secular growth stocks & a
TRANSCRIPT
ICICI Prudential FMCG ETF NFO: Secular Growth Stocks & a Defensive
Sector in One Fund
Krishna Karwa, Senior Research Analyst
The ICICI Prudential FMCG ETF NFO offers investors exposure to some of the biggest consumption brands
in India with strong balance sheets, high cash flow generation, top-notch return ratios and high barriers
to scale. However, with characteristics of high sectoral concentration and structural risks to demand due
to COVID, investing in this sector requires a long-term outlook, and the willingness to track the benchmark
performance closely.
We recommend this ETF as a tactical allocation to investors who believe in growth investing and are
looking for sectoral bets to complement their core equity allocations.
NFO Details
- Underlying benchmark: Nifty FMCG Total Return Index (Nifty FMCG TRI)
- Closing date: August 2, 2021
- Approximate total expense ratio post listing on the exchange: 0.20
- Exit load: Nil
- Minimum subscription amount during the NFO period: Rs 1,000
- Taxation: Equity
- Fund managers: Kayzad Eghlim, Nishit Patel
Understanding FMCG v/s Consumption
Consumption is a major theme in a large retail market like India, captured by the Nifty Consumption Index,
and several thematic funds and ETFs based on it already in the market.
The ICICI Prudential FMCG ETF, via its underlying benchmark, the Nifty FMCG TRI, takes a more targeted
view of the consumption theme, focusing only on the fast moving consumer goods segment. Compared
to the Nifty Consumption Index, it includes no exposure to discretionary consumer goods and services
stocks, which have the potential re-rate more than FMCG stocks, but carry higher downside risk as well.
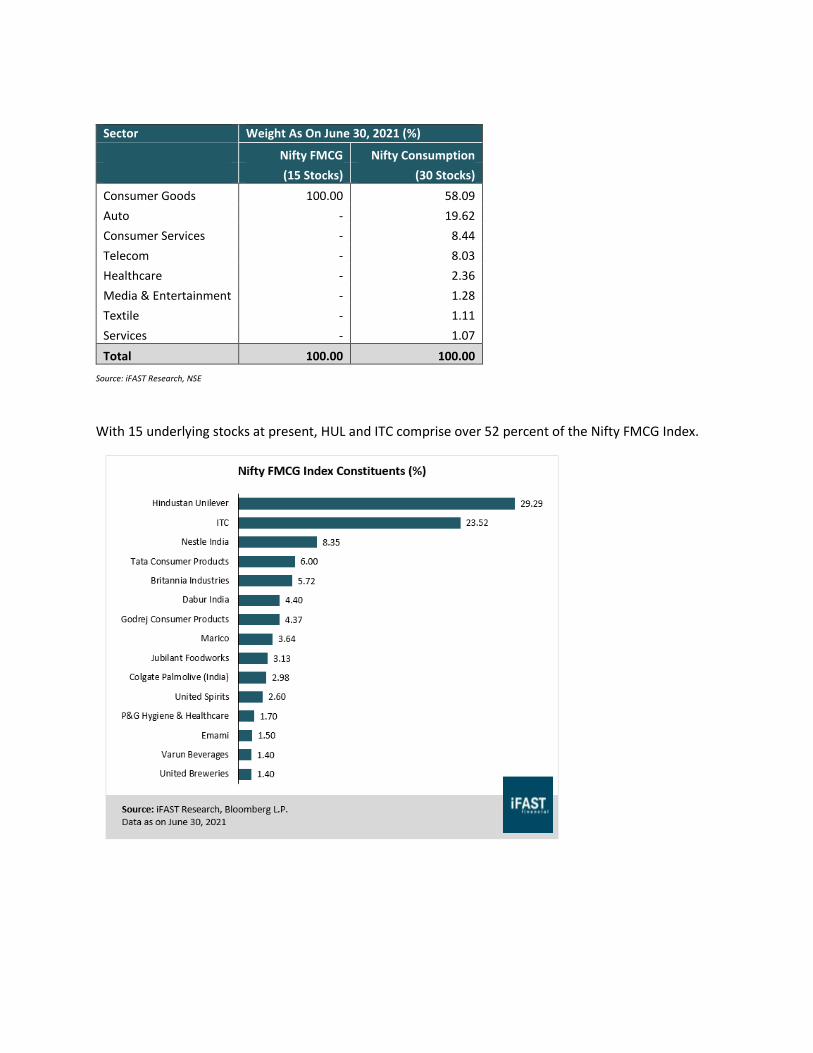
Sector Weight As On June 30, 2021 (%)
Nifty FMCG Nifty Consumption
(15 Stocks) (30 Stocks)
Consumer Goods 100.00 58.09
Auto - 19.62
Consumer Services - 8.44
Telecom - 8.03
Healthcare - 2.36
Media & Entertainment - 1.28
Textile - 1.11
Services - 1.07
Total 100.00 100.00
Source: iFAST Research, NSE
With 15 underlying stocks at present, HUL and ITC comprise over 52 percent of the Nifty FMCG Index.
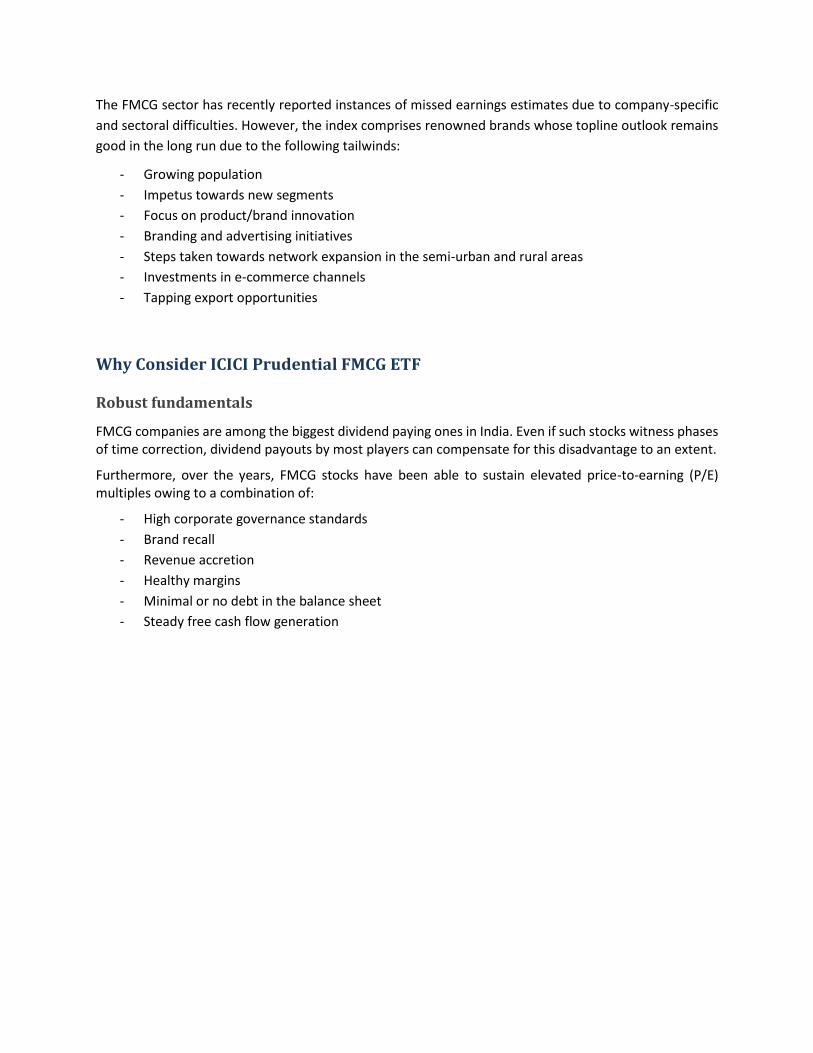
The FMCG sector has recently reported instances of missed earnings estimates due to company-specific
and sectoral difficulties. However, the index comprises renowned brands whose topline outlook remains
good in the long run due to the following tailwinds:
- Growing population
- Impetus towards new segments
- Focus on product/brand innovation
- Branding and advertising initiatives
- Steps taken towards network expansion in the semi-urban and rural areas
- Investments in e-commerce channels
- Tapping export opportunities
Why Consider ICICI Prudential FMCG ETF
Robust fundamentals
FMCG companies are among the biggest dividend paying ones in India. Even if such stocks witness phases of time correction, dividend payouts by most players can compensate for this disadvantage to an extent.
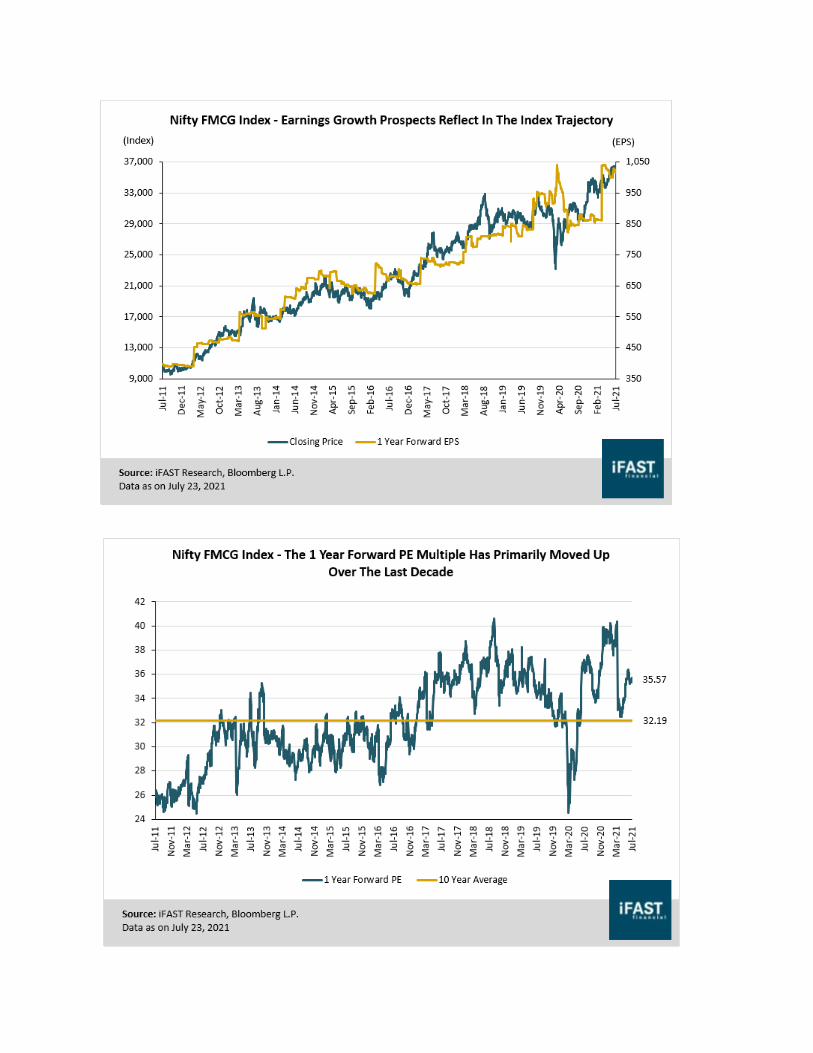
Furthermore, over the years, FMCG stocks have been able to sustain elevated price-to-earning (P/E) multiples owing to a combination of:
- High corporate governance standards
- Brand recall
- Revenue accretion
- Healthy margins
- Minimal or no debt in the balance sheet
- Steady free cash flow generation
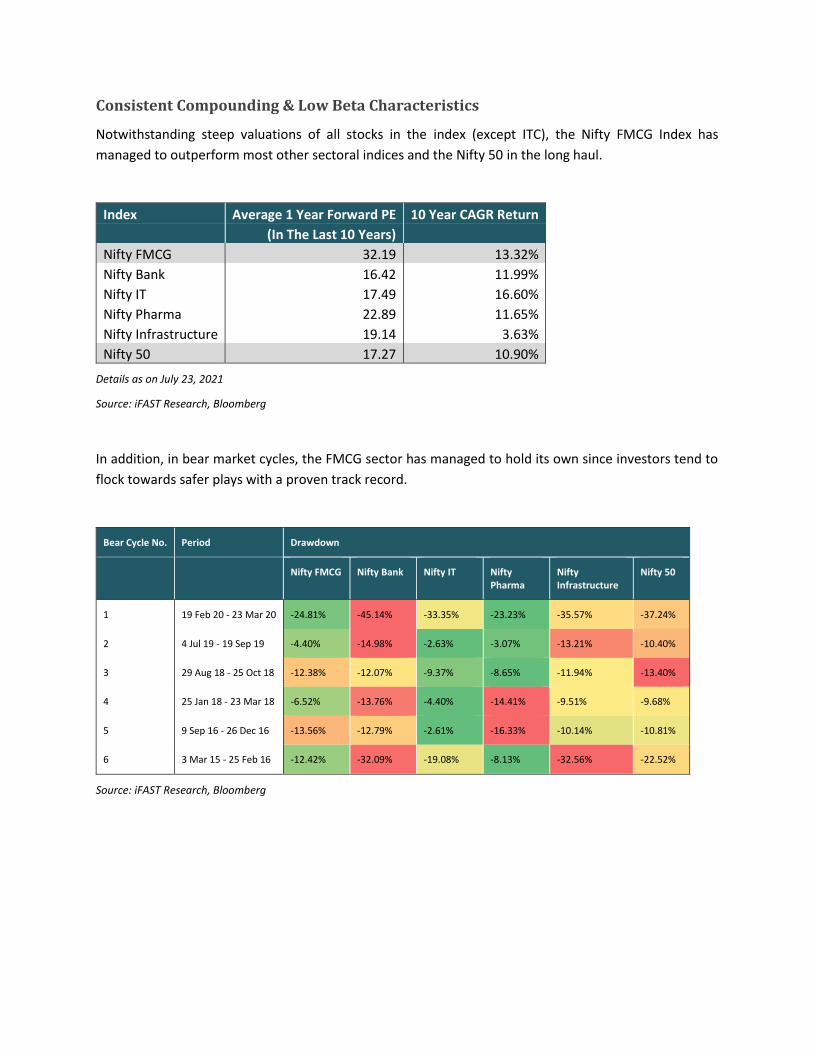
Consistent Compounding & Low Beta Characteristics
Notwithstanding steep valuations of all stocks in the index (except ITC), the Nifty FMCG Index has
managed to outperform most other sectoral indices and the Nifty 50 in the long haul.
Index Average 1 Year Forward PE 10 Year CAGR Return
(In The Last 10 Years)
Nifty FMCG 32.19 13.32%
Nifty Bank 16.42 11.99%
Nifty IT 17.49 16.60%
Nifty Pharma 22.89 11.65%
Nifty Infrastructure 19.14 3.63%
Nifty 50 17.27 10.90%
Details as on July 23, 2021
Source: iFAST Research, Bloomberg
In addition, in bear market cycles, the FMCG sector has managed to hold its own since investors tend to
flock towards safer plays with a proven track record.
Bear Cycle No. Period Drawdown
Nifty FMCG Nifty Bank Nifty IT Nifty
Pharma Nifty Infrastructure
Nifty 50
1 19 Feb 20 - 23 Mar 20 -24.81% -45.14% -33.35% -23.23% -35.57% -37.24%
2 4 Jul 19 - 19 Sep 19 -4.40% -14.98% -2.63% -3.07% -13.21% -10.40%
3 29 Aug 18 - 25 Oct 18 -12.38% -12.07% -9.37% -8.65% -11.94% -13.40%
4 25 Jan 18 - 23 Mar 18 -6.52% -13.76% -4.40% -14.41% -9.51% -9.68%
5 9 Sep 16 - 26 Dec 16 -13.56% -12.79% -2.61% -16.33% -10.14% -10.81%
6 3 Mar 15 - 25 Feb 16 -12.42% -32.09% -19.08% -8.13% -32.56% -22.52%
Source: iFAST Research, Bloomberg
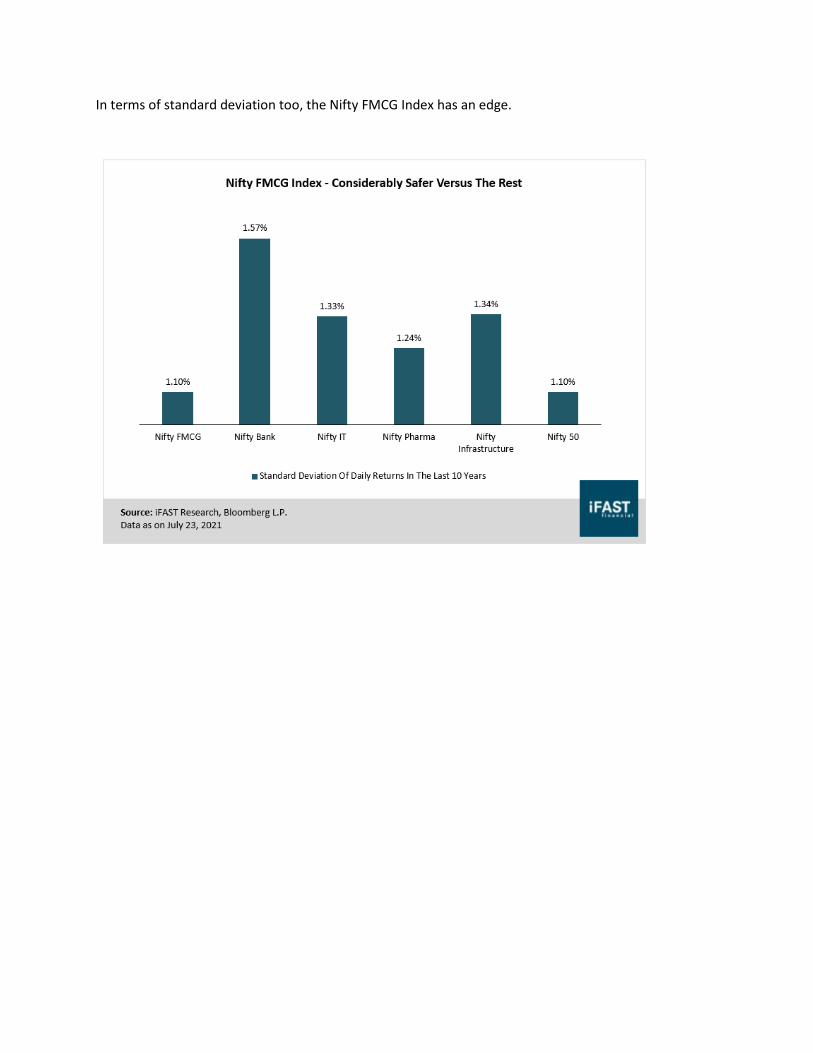
In terms of standard deviation too, the Nifty FMCG Index has an edge.
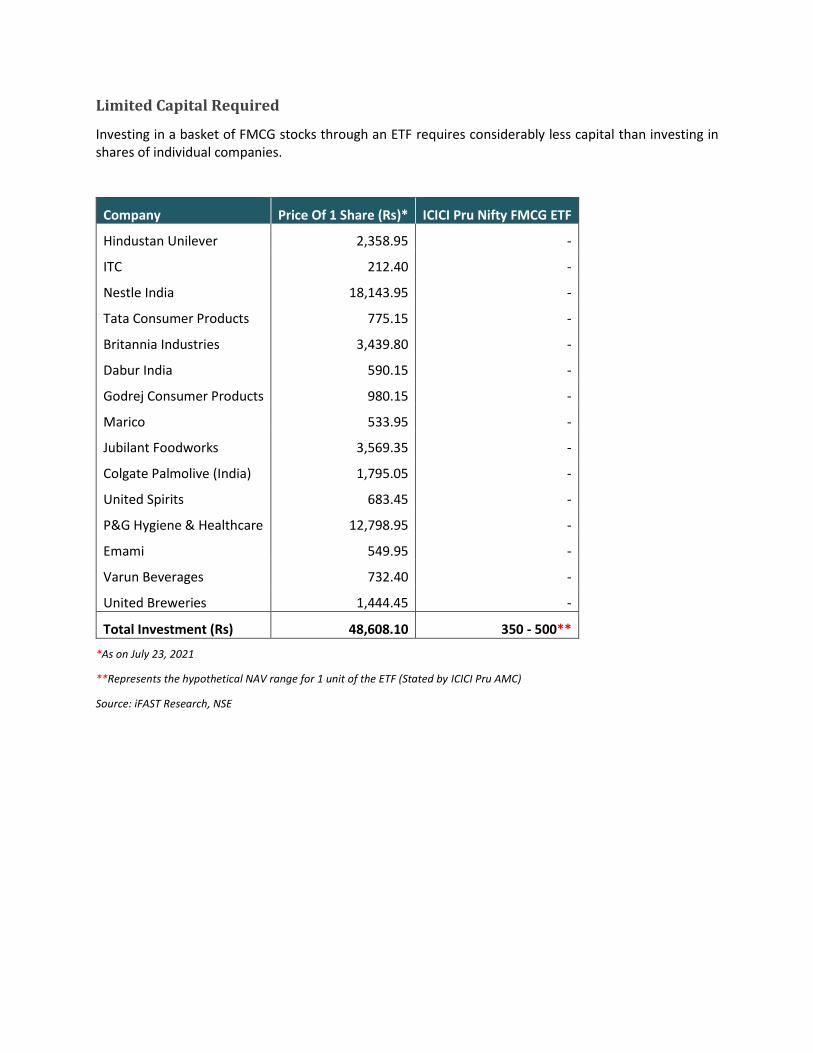
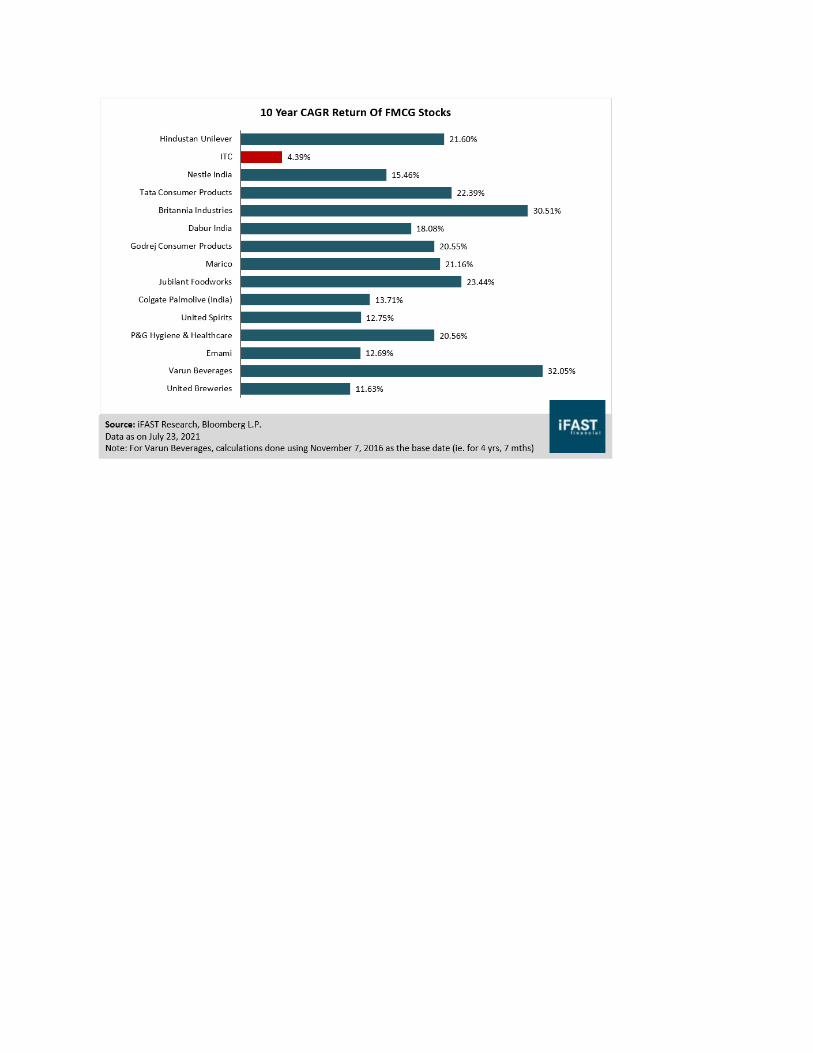
Limited Capital Required
Investing in a basket of FMCG stocks through an ETF requires considerably less capital than investing in shares of individual companies.
Company Price Of 1 Share (Rs)* ICICI Pru Nifty FMCG ETF
Hindustan Unilever 2,358.95 -
ITC 212.40 -
Nestle India 18,143.95 -
Tata Consumer Products 775.15 -
Britannia Industries 3,439.80 -
Dabur India 590.15 -
Godrej Consumer Products 980.15 -
Marico 533.95 -
Jubilant Foodworks 3,569.35 -
Colgate Palmolive (India) 1,795.05 -
United Spirits 683.45 -
P&G Hygiene & Healthcare 12,798.95 -
Emami 549.95 -
Varun Beverages 732.40 -
United Breweries 1,444.45 -
Total Investment (Rs) 48,608.10 350 - 500**
*As on July 23, 2021
**Represents the hypothetical NAV range for 1 unit of the ETF (Stated by ICICI Pru AMC)
Source: iFAST Research, NSE
Key Risks
Apart from the higher sectoral concentration of the Nifty FMCG index, when compared to the Nifty
Consumption Index, investors should bear the following risk factors in mind.
Disruptions Due To Covid-19
The FMCG space is likely to encounter near-term challenges linked to:
- Higher raw material prices
- Logistical inconvenience
- Regional and store lockdowns
- A slowdown in certain segments (such as beauty)
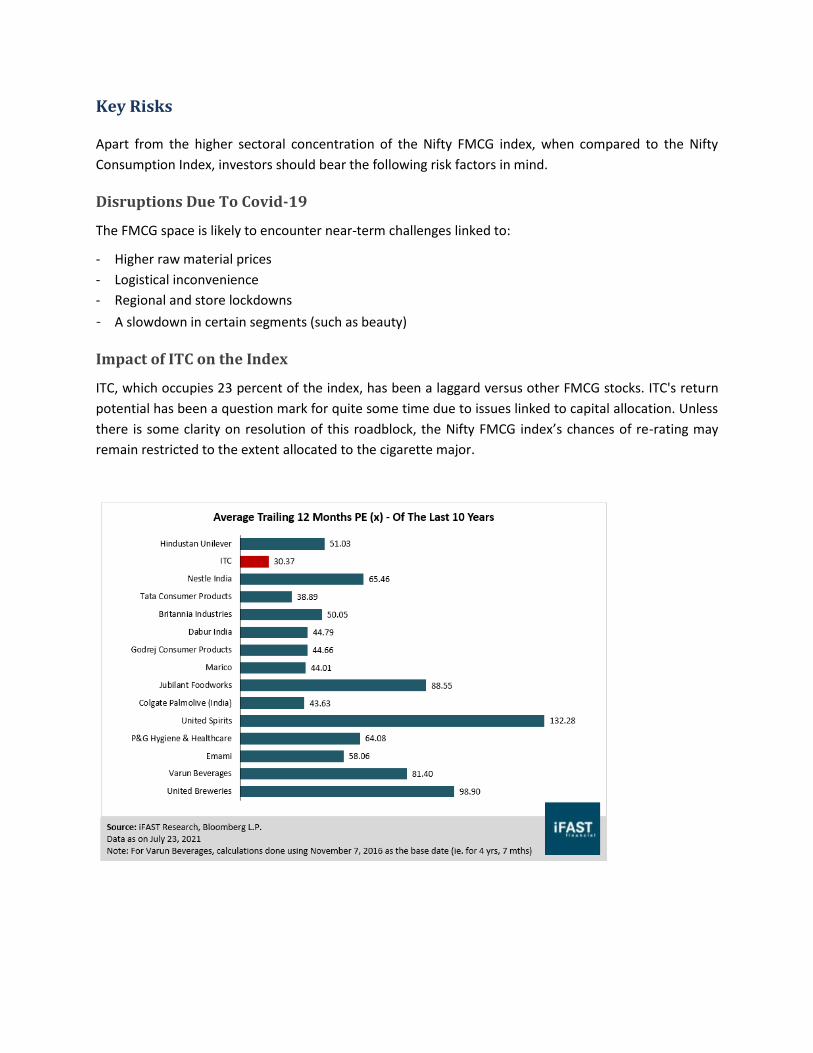
Impact of ITC on the Index
ITC, which occupies 23 percent of the index, has been a laggard versus other FMCG stocks. ITC's return
potential has been a question mark for quite some time due to issues linked to capital allocation. Unless
there is some clarity on resolution of this roadblock, the Nifty FMCG index’s chances of re-rating may
remain restricted to the extent allocated to the cigarette major.
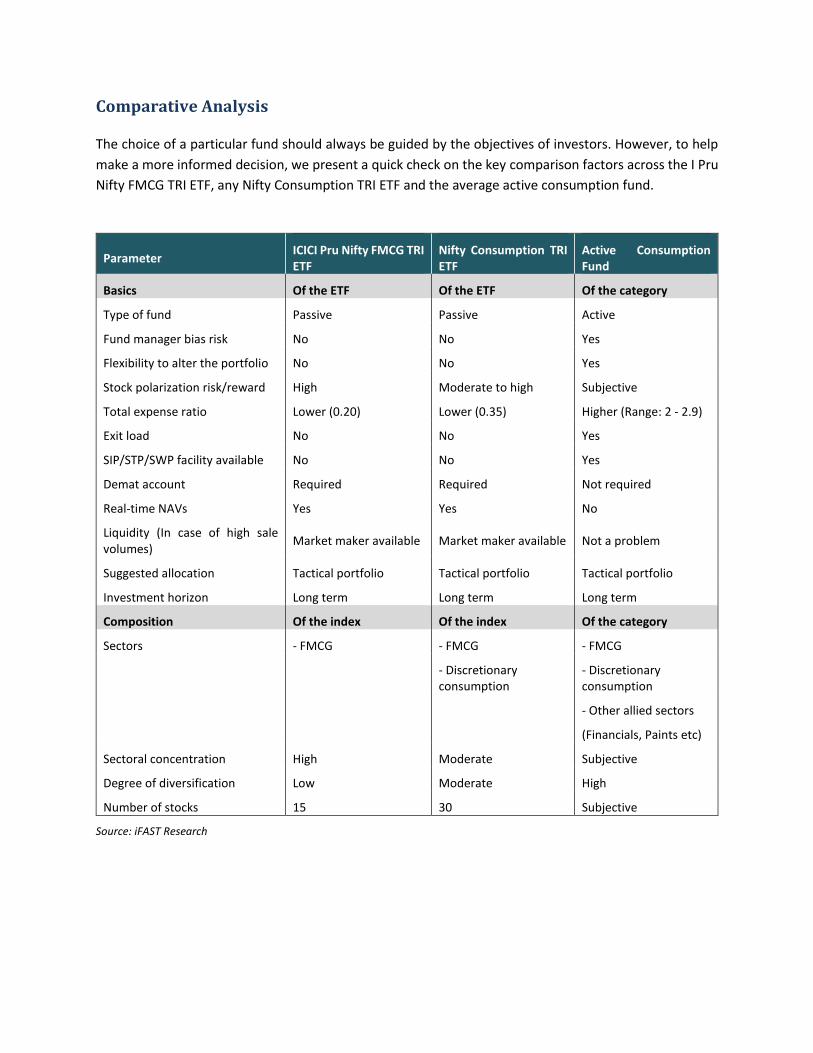
Comparative Analysis
The choice of a particular fund should always be guided by the objectives of investors. However, to help
make a more informed decision, we present a quick check on the key comparison factors across the I Pru
Nifty FMCG TRI ETF, any Nifty Consumption TRI ETF and the average active consumption fund.
Parameter ICICI Pru Nifty FMCG TRI ETF
Nifty Consumption TRI ETF
Active Consumption Fund
Basics Of the ETF Of the ETF Of the category
Type of fund Passive Passive Active
Fund manager bias risk No No Yes
Flexibility to alter the portfolio No No Yes
Stock polarization risk/reward High Moderate to high Subjective
Total expense ratio Lower (0.20) Lower (0.35) Higher (Range: 2 - 2.9)
Exit load No No Yes
SIP/STP/SWP facility available No No Yes
Demat account Required Required Not required
Real-time NAVs Yes Yes No
Liquidity (In case of high sale volumes)
Market maker available Market maker available Not a problem
Suggested allocation Tactical portfolio Tactical portfolio Tactical portfolio
Investment horizon Long term Long term Long term
Composition Of the index Of the index Of the category
Sectors - FMCG - FMCG - FMCG
- Discretionary consumption
- Discretionary consumption
- Other allied sectors
(Financials, Paints etc)
Sectoral concentration High Moderate Subjective
Degree of diversification Low Moderate High
Number of stocks 15 30 Subjective
Source: iFAST Research
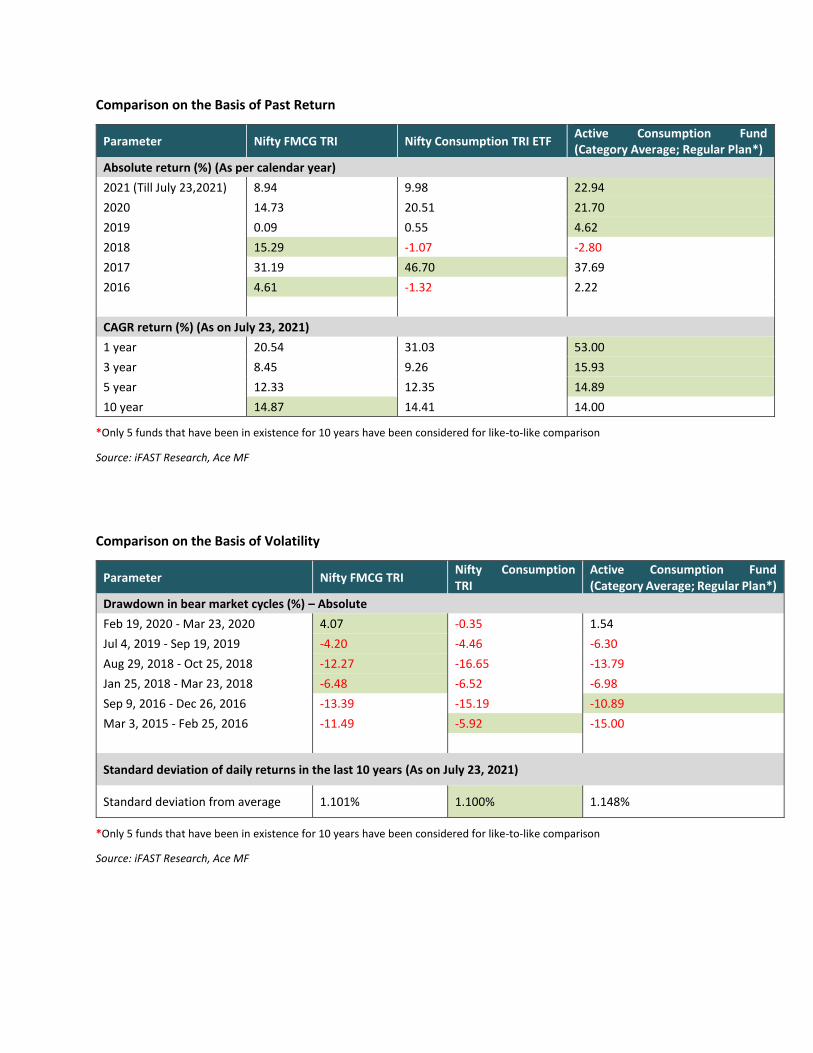
Comparison on the Basis of Past Return
Parameter Nifty FMCG TRI Nifty Consumption TRI ETF Active Consumption Fund (Category Average; Regular Plan*)
Absolute return (%) (As per calendar year)
2021 (Till July 23,2021) 8.94 9.98 22.94
2020 14.73 20.51 21.70
2019 0.09 0.55 4.62
2018 15.29 -1.07 -2.80
2017 31.19 46.70 37.69
2016 4.61 -1.32 2.22
CAGR return (%) (As on July 23, 2021)
1 year 20.54 31.03 53.00
3 year 8.45 9.26 15.93
5 year 12.33 12.35 14.89
10 year 14.87 14.41 14.00
*Only 5 funds that have been in existence for 10 years have been considered for like-to-like comparison
Source: iFAST Research, Ace MF
Comparison on the Basis of Volatility
Parameter Nifty FMCG TRI Nifty Consumption TRI
Active Consumption Fund (Category Average; Regular Plan*)
Drawdown in bear market cycles (%) – Absolute
Feb 19, 2020 - Mar 23, 2020 4.07 -0.35 1.54
Jul 4, 2019 - Sep 19, 2019 -4.20 -4.46 -6.30
Aug 29, 2018 - Oct 25, 2018 -12.27 -16.65 -13.79
Jan 25, 2018 - Mar 23, 2018 -6.48 -6.52 -6.98
Sep 9, 2016 - Dec 26, 2016 -13.39 -15.19 -10.89
Mar 3, 2015 - Feb 25, 2016 -11.49 -5.92 -15.00
Standard deviation of daily returns in the last 10 years (As on July 23, 2021)
Standard deviation from average 1.101% 1.100% 1.148%
*Only 5 funds that have been in existence for 10 years have been considered for like-to-like comparison
Source: iFAST Research, Ace MF
Suitability & Recommendation
We recommend the ICICI Prudential FMCG ETF to investors who meet all the following criteria:
- Want to complement their existing equity exposure (in large, mid, small, multi and flexi cap funds) with low-risk sectoral equity exposure.
- Will stay invested patiently for the long term.
- Are predominantly inclined towards the growth theme, while simultaneously leaving some room for alpha from value unlocking (read ITC).
- Prefer keeping close tabs on markets to time purchase, accumulation and partial/complete exit of units from this fund.
Disclaimer
iFAST and/or its content and research team's licensed representatives may own or have positions in the mutual funds of any of the Asset Management Companies mentioned or referred to in the article, and may, from time to time add or dispose of, or be materially interested in any such. No investment decision should be taken without first viewing a mutual fund's scheme information document including statement of additional information. Any advice herein is made on a general basis and does not take into account the specific investment objectives of the specific person. Investors should seek for professional investment, tax, and legal advice before making an investment or any other decision. Past performance and any forecast is not necessarily indicative of the future or likely performance of the mutual fund. Opinions expressed herein are subject to change.