hypoxic pulmonary vasoconstriction and gas exchange during exercise in chronic obstructive pulmonary...
TRANSCRIPT
DOI 10.1378/chest.97.2.268 1990;97;268-275Chest
A G Agustí, J A Barberá, J Roca, P D Wagner, R Guitart and R Rodriguez-Roisín pulmonary disease.exchange during exercise in chronic obstructive Hypoxic pulmonary vasoconstriction and gas
http://chestjournal.chestpubs.org/content/97/2/268
can be found online on the World Wide Web at: The online version of this article, along with updated information and services
) ISSN:0012-3692http://chestjournal.chestpubs.org/site/misc/reprints.xhtml(without the prior written permission of the copyright holder.reserved. No part of this article or PDF may be reproduced or distributedChest Physicians, 3300 Dundee Road, Northbrook, IL 60062. All rights
ofbeen published monthly since 1935. Copyright1990by the American College is the official journal of the American College of Chest Physicians. It hasChest
© 1990 American College of Chest Physicians by guest on July 22, 2011chestjournal.chestpubs.orgDownloaded from
HPV = hypoxic pulmonary vasoconstriction; i7A/Q relation-shipventilation-perfusion relatipnslsips; shunt (inert gascs)�percent ofQr.to lung units with VA�Q ratios <0.005; low VA/Q
percent ofQr.to lung units iyith VA/Q ratios <0.1,(excludingshunt); high V1t/Qpercent OfVE tojung units with VA/Q r$ios10 to 100; deadsp�cepercent ofVE to lung units with VA/Qratios >100�QVu/Q ratio at the mean of the blood flowdistribution; V ratio at the mean of the ventilation distribu-tion; LOgSD Qdispersion (SD) of the blood flow distributionon a log scale; LOg5D Vdispersion (SD) of the ventilation4istdbution on a log scale; DISP R-E overall degree of‘h/Qjnismatching direcdy Obtained from the raw inert gasdata; Ppa = pulmonary artery pressure; PFT pulmqnary func-
tion test; Dco carbon monoxide diffusing capacity; Q�, cardiac
output; Pwpulmonary capillary wedge pressure;TPVR = total pulmonary vascular resistance; RVSWI rightventricular strQke . work index; f respiratory rate;R = respiratory; Qs/QT venous admixture; VDIVT deadspace tidal volume ratio; BE base excess
268 Vasoconstriction and Gas Exchange during Exercise (Agust! at a!)
Hypoxic Pulmonary Vasoconstriction andGas Exchange During Exercise in ChronicObstructive Pulmonary Disease*Alvar G. N. AgustI, M.D.; Joan A. Barberd,4 M.D.;t Josep Roca, M.D.;
Peter D. Wagner� M.D.; Raim#{243}n Guitart, Ph.D.;� and
Robert Rodriguez-RaisIn, M.D.
In patients with chronic obstructive pulmonary disease
(COPD) studied at rest, nifedipine releases hypoxic pul-monary vasoconstriction (HPV) and worsens gas exchange.During exercise, this drug lowers pulmonary hypertension,
but the effects of this lower pulmonary vascular tone onventilation-perfusion (V��/Q) relationships are still poorlyunderstood. To analyze them, we determined the VA/Q
&sfributions in eight patients with stable COPD (FEy1, 36
percent ofpredicted) at rest and during exercise (60 percent
Vo�max), before and after nifedipine (20 mg sublingually).Nifedipine shifted to the right the pulmonary pressure-flow
relationship (p<O.Ol) and increased the dispersion of theblood flow distribution at rest and during exercise(p<O.005). These observations strongly suggest that nifedi-pine released HPV under both conditions. However, evenafter releasing HPV by nifidipine, exercise distributed
blood flow more homogeneously than at rest (p<O.05).
Besides, exercise greatly decreased the overall degree ofi’A/Q mismatching (p<O.OOl) not only before but also afternifedipine. Thus, we postulate that most of the VA/Q
improvement that exercise may induce in patients withCOPD, as it is shown here, is due to improvement in theventilation distribution. Interestingly, this VA/Q improve-
I n patients with chronic obstructive pulmonary dis-
ease (COPD) studied at rest, nifedipine releases
hypoxic pulmonary vasoconstriction (HPV), diverts
blood flow to poorly ventilated lung units, and worsens
gas exchange.’ During exercise, release of HPV in
COPD by nifedipine blunts the increase in pulmonary
artery pressure (Ppa) and lowers the severity of
pulmonary hypertension.2”� However, the effects of
*Fmm the Departments of Medicine, Servei de Pneumologia,
Hospital Clinic, Universitat de Barcelona, Barcelona, Spain, andthe Section of Physiology, University ofCalifornia, San Diego, LaJolla, Calif.Supported in part by Grant CCA 8309185 from the Joint US-SpainCommittee, and CICYT PA 82-1787 and PA 86-0345.Presented in part at the American Thoracic Society Meeting, LasVegas, MayS-11, 1988.
tRecipient of a Postdoctoral Research Fellowship Award of theFondo de Investigaciones de Ia Segundad Social (FISss IIE/88),Spain.
tFormer Research Fellow, Universitat de Barcelona (FP1185).Manuscript received March 20; revision accepted July 13.Reprint requests: Dr. Rodriquez-RoLrin, Servel de Pneunwlogia,
Hospital Clinic, V’mllarroel 170, 08036 Barcelona, Spain
ment was not paralleled by a significant decrease ofP(A-a)02. This apparent paradox could be explained by 20
percent of the actual P(A-a)02 during exercise due to
diffusion limitation, as assessed through the inert gas
approach. Taken all together, these results help to better
understand the mechanisms that govern pulmonary gas cx-
change during exercise in COPD. (Chest 19%: 97:268-75)
this lower pulmonary vascular tone on ventilation-
perfusion (‘��A/Q) relationships under exercise condi-
tions are still poorly understood. This investigation
was aimed at analyzing the role of hypoxic vasocon-
striction in modulating pulmonary gas exchange dur-
ing exercise in COPD. We used the multiple inert gas
elimination technique5’6 to determine the VA/Q distri-
butions ofeight patients with COPD at rest and duringexercise, before and after releasing HPV by nifedi-
pine. We elected to include subjects with advanced
COPD but without overt clinical cor pulmonale on
the assumption that HPV might predominate in these
patients more than in those with end-stage vascular
disease, who presumably have more irreversible struc-
tural damage.7’8
Patients
M
Eight male patients (�± SEM, 62 ± 1 year) with the standard
clinical criteria ofCOPD and with previous functional confirmationof nonreversible chronic airflow limitation (FEy,, 1.15±0.12 L
© 1990 American College of Chest Physicians by guest on July 22, 2011chestjournal.chestpubs.orgDownloaded from
CHEST I 97 I 2 I FEBRUARY, 1990 269
[36±3 percent predicted]) were selected from the outpatient clinic
ofour institution. None ofthem had clinical evidence ofovert right
heart failure. Type B COPD was present in five patients whereas
the three remaining patients had predominantly type A COPD.
Consent was Obtained after the purposes and risks ofthe investiga-
tion were explained and understood by each patient. All were
clinically stable (none had required hospitalization during the
previous two months) and none had evidence of renal, liver, or
intrinsic heart disease. None ofthem was receiving oxygen therapy
at home. Pulmonary function test (PFT) evaluation included meas-
urement ofstatic and dynamiclung volumes(HP.47804A PulmonarySystem Desk; Hewlett-P�kard, Palo Alto, Calif), plethysmographic
functional residual capacity and airway resistance (Body test, E.
Jaeger, Wurzburg, FRG), and single-breath carbon monoxide dif.fusing capacity (Deo) (Resparameter model A, PK Morgan Ltd.
Chatham, UK). The Dco values were corrected for hemoglobin.�
Predicted values for PET were from our own labory.b0h1
&ocedures
A transvenous balloon-tipped catheter (Swan-Ganz 7F, Edwards
Laboratories, Santa Ann, Calif) was placed into the pulmonary
artery under pressure wave monitoring (HP.78303 A), and a
polyethylene catheter (Seldicath, Plastimed, France) was inserted
in the radial artery. Cardiac output (Qr) was determined by the
thermodilution technique (9520A, Edwards Laboratories, Santa
Ana, Calif) Intravascular pressures were continuously monitored
(HP-7754 B) using HP1290 A transducers and were read at endexpiration over three respiratory cycles (the external zero reference
level was positioned at midchest). During exercise, the pronounced
pleural pressure swings made the measurement of pulmonary
capillary wedge pressure (Pw) difficult. Therefore, we elected to
report Pw only at rest andto calculate total pulmonary vascular
resistance (TPVR) as mean Ppa divided by Qr.� Right ventricular
stroke work index (RVSWI) was derived as ([Ppa-Pra].CI.0.0136)/
heart rate) (in g.m/rn2), where cardiac index (CI) was Qr (L.min’�
body surface area (rn’).1
Minute ventilation (VE) and respiratory rate (1) were recorded
minute by minute using a calibrated Wright spirometer. Low dead
space, low resistance, and nonrebreathing valves were used to
collect the expired gas through a heated-mixing box, either at rest
(No. 1500, Hans Rudolph, Kansas City Mo) or during exercise (E.
Jaeger, Wurzburg, FRG). Oxygen uptake (Vo,) and carbon dioxide
output (Vco,) were calculated from mixed expired fractions of 0,
and CO, (Multi-gas MS2, Medishield, Ohrneda..BOC UK), respec-
lively, and the respiratory quotient (R) as Vco,/Vo,. Po,, Pco,, and
pH were analyzed in duplicate (IL 1302 pH blood gas analyzer;
Instrumentation Laboratories, Milan, Italy). Hemoglobin concentra-lion was measured (OSM-2 Hemo-oximeter, Radiometer, Copen-
hag en, Denmark) and oxygen saturation was computed through
Kelman’s subroutines.’ Alveolar-arterial 0, pressure difference (PEA-
alO,) venous admixture (Qs/Qr), dead space-tidal volume ratio (VD/
VT, and systemic 0, delivery were calculated using standard
formulas.”
The �‘A/Q distributions were estimated by the multiple inert gas
elimination technique.” Particular features of its set-up in our
laboratory have been reported elsewhere.” Briefly, after infusing a
5 percent dextrose solution of six inert gases (SF,, ethane, cyclo-
propane, enflurane, ether, and acetone) through a peripheral vein
for about 30 minutes at a constant rate, duplicate samples of
heparinized arterial and mixed venous blood and mixed expired gas
were simultaneously withdrawn. Inert gas concentrations in mixed
expired samples and the gas phase of equilibrated arterial and
mixed venous samples were measured by gas chromatography
(Hewlett-Packard 5880A). Solubilities ofinert gases were measured
for each patient and the VA/Q distributions were estimated from
the inert gas data using a least-square fit to the data by a
multicompartmental model with enforced smoothing in the usual
manner.’3 %%�s defined shunt as � the percentage of Qr perfusing
essentially unventilated alyeoli (VAJQ <0.005), low and high VAJQ
regions as those with VAJQ ratios between 0.005 and 0.1, and 10
and 100, respectively, and dead space as the percentage of VE to
lung units with VA/Q ratios higher than 100. The latter includes the
anatomic dead space, unperfused alveoli, and instrument dead
space. The position ofthe pulmonary blood flow (Q) and ventilation
cy) distributions is described by the VA/Q ratio at their mean (Q,V, respectively), and their dispersion by their standard deviation
on a log scale (log,0 Q, I�#{176}�s�V). The inert gas results are also
reported as the dispersion directly obtained from retention (R)
minus excretion (E) (corrected for the acetone excretion, E*) of
each inert gas (DISP R-E�), which is an index ofthe overall amount
ofV��JQ mismatching.”
Protocol
The protocol was approved by the Hospital Clinic-Facultat de
Medicina Research Committee on Human Investigations. Patients
were allowed to continue taking their usual steroid regimen (if any),
but treatment with alloral or inhaled bronchodilators was withdrawn
24 hours before the study. Specifically, patients were not receiving
additional medication that could have either vasoactive or bron-
choactive effects. After the patient had fasted overnight and without
premedication, pulmonary and systemic arterial catheterization
were performed. Forty-five minutes after starting the inert gas
infusion, measurements of pulmonary and systemic hemodynamic
variables and respiratory and inert gas exchange parameters were
taken at rest. Then, exercise was begun on a cycle ergometer
(E. Jaeger) at a power output (33 ± 8 W) equivalent to 50 to 60
percent of their maximal tolerated work load (which had been
quantified on a previous day), and a second set of hemodynamic
and gas exchange measurements was obtained approximately ten
minutes later. The patients were allowed to rest for 15 to 30 minutes
until pulmonary and systemic hemodynamic variables and respira-
tory gas exchange parameters had returned to resting conditions.
Nifedipine (20 mg) was then given sublingually, and resting and
exercise measurements were repeated as before (at 45 minutes and
1 h after nifedipine, respectively). All measurements were taken in
a semirecumbent position. A steady state condition (as defined by
variations of less than ± 5 percent in heart rate and minute
ventilation and ofless than ±0. 1 percent in FEO2 and FECO,) was
monitored in each of the steps of the present protocol (rest andexercise with and without nifedipine) by continuously monitoring
electrocardiogram, minute ventilation, respiratory rate, and mixed
expired 02 and CO,. The hemodynamic measurements were
obtained before and after blood sampling for respiratory and inert
gas analysis. Given that there were no significant differences
between these two hemodynamic measurements, only values oh-
tamed after blood sampling are reported.
Safety Measures
Our primary concern at all times during the study was the safety
of the patient. Consequently, improvement in monitoring proce-
dures included a continuous graphic recording of systemic and
pulmonary arterial pressures as well as continuous electrocardio-
graphic (HP.7830A) and ear oximetry (Biox II; Ohmeda-BOC, UK)
monitoring. Patients were instructed to stop exercise should unusual
symptoms (other than discomfort) develop, but none of them did.
Three physicians were present at all times, with one directing his
attention exclusively to the patient.
Statistical Analysis
An analysis ofvariance for repeated measures (MANOVA, SPSS)
was used to compare measurements at rest and during exercise,
before and after nifedipine. Interaction between exercise and
nifedipine was specifically checked. Linear regression was usedwhen appropriate. Comparison of the regression lines was done by
© 1990 American College of Chest Physicians by guest on July 22, 2011chestjournal.chestpubs.orgDownloaded from
Patient Age, Height, V�ight, ‘
FEY
. FEY Ratio, ‘- UC� �‘ -�
BY
- - RV!I’LC,
Dco
-
No. y Cal kg L percent pred percent FYC L percent pred L percent pred percent mL/mia/mm Hg percent pred
1 67 161 72 0.98 35 34 7.13 106 4.14 139 58 24.46 105
2 64 175 94 1,54 43 39 7.11 88 3.12 94 44 17.42 61
3 57 171 82 119 34 35 7.78 103 4.35 147 56 19.46 69
4 58 172 87 1,33 38 48 8.87 117 5.99 �l 68 23.05 81
5 65 164 73 0,53 18 24 9.38 135 7.17 239 76 14.30 58
6 61 170 80 1.17 35 39 7.37 98 4.19 137 57 18.46 67
7 64 158 55 0.89 33 34 6.39 100 3.77 134 59 19.94 87
8 59 162 70 1.57 52 56 7.45 112 4.51 165 61 24.55 97
i±SEM 62±1 167±2 77±4 1.15±012 36±3 39±3 7.69±0.35 108±5 4.66±0.46 157±16 60±3 20.21±1.28 78±6
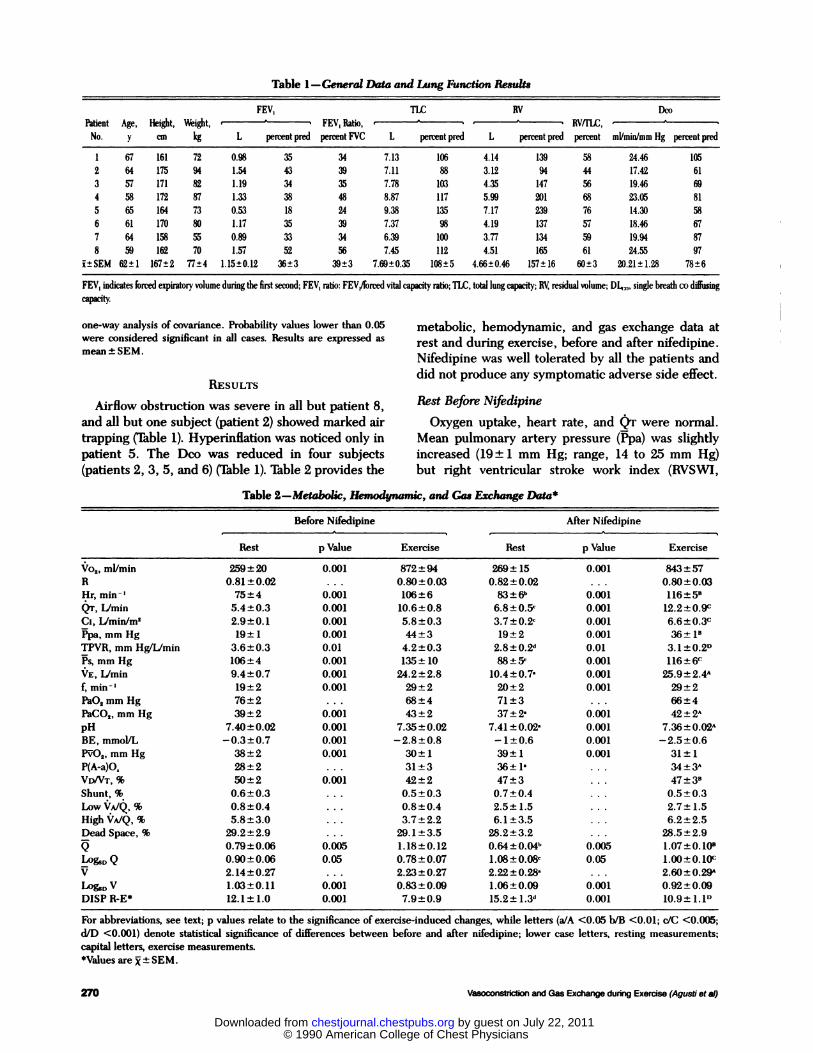
FEY indicates forced expiratory volumeduringthe first seurnd; FEY, ratio: FEY,/forced vital capacity �6o;TLC,totallungcapuity; BY, residual volume; � single breath codiffusing
Table 1-General Data and Lwsg FUnCtIOn Results
270 Vasoconstriction and Gas Exchange during Exercise (Agust! et at)
one-way analysis of covariance. Probability values lower than 0.05
were considered significant in all cases. . Results are expressed as
mean±SEM.
RESULTS
Airflow obstruction was severe in all but patient 8,
and all but one subject (patient 2) showed marked air
trapping (Table 1). Hyperinflation was noticed only in
patient 5. The Deo was reduced in four subjects
(patients 2, 3, 5, and 6) (Table 1). Table 2 provides the
metabolic, hemodynamic, and gas exchange data at
rest and during exercise, before and after nifedipine.
Nifedipine was well tolerated by all the patients and
did not produce any symptomatic adverse side effect.
Rest Before N(fedipine
Oxygen uptake, heart rate, and (�r were normal.
Mean pulmonary artery pressure (Ppa) was slightly
increased (19 ± 1 mm Hg; range, 14 to 25 mm Hg)
but right ventricular stroke work index (RVSWI,
Table 2-Metabolic, HemOdywimiC, and Gas Exchange Data�
Before Nifedipine After Nifedipine
Rest p Value ExerciseRest p Value Exercise
Vo,,ml/min 259±20 0.001 872±94 269±15 0.001 843±57
R 0.81±0.02 . . . 0.80±0.03 0.82±0.02 . . . 0.80±0.03
Hr. min’ 75±4 0.001 106±6 83±6” 0.001 116±5’
QT, lJmin 5.4±0.3 0.001 10.6±0.8 6.8±0.5’ 0.001 12.2±0.9c
C,, Iimin/m2 2.9±0.1 0.001 5.8±0.3 3.7±0.2’ 0.001 6.6±0.3c
Ppa,mmHg 19±1 0.001 44±3 19±2 0.001 36±P
TPVR, mm HgfLJmin 3.6±0.3 0.01 4.2±0.3 2.8±0.2d 0.01 3.1±0.2’�
Ps,mmHg 106±4 0.001 135±10 88±5’ 0.001 116±6c
VE, Lfmin 9.4±0.7 0.001 24.2±2.8 10.4±0.7’ 0.001 25.9±2.4”
f,min’ 19±2 0.001 29±2 20±2 0.001 29±2
PaO,mmllg 76±2 . . . 68±4 71±3 . . . 66±4
PaCO,,mmHg 39±2 0.001 43±2 37±2’ 0.001 42±2”
pH 7.46±0.02 0.001 7.36±0.02 7.41±0.02� 0.001 7.36±0.02A
BE, mmolJL -0.3±0.7 0.001 -2.8±0.8 -1±0.6 0.001 -2.5±0.6
P�O,,mmHg 38±2 0.001 30±1 39±1 0.001 31±1
P(A-a)O. 28± 2 . . . 31 ±3 36± 1’ . , . 34 �3A
VD/VT,% 50±2 0.001 42±2 47±3 . . . 47±3’Shunt, % 0.6±0.3 . . . 0.5±0.3 0.7±0.4 ‘ ‘ ‘ 0.5±0.3
LowV��JQ,%
HighVA/Q, %
0.8±0.4
5.8±3.0
. . .
. . .
0.8±0.4
3.7±2.2
2.5±1.5
6.1±3.5
. ‘ ‘
. . .
2.7±1.5
6.2±2.5
Dead Space, % 29.2±2.9 . . . 29.1±3.5 28.2±3.2 . . . 28.5±2.9
0.79±0.06 0.005 1.18±0.12 0.64±004” 0.005 1.07±0.10’
Log,0 Q 0.90±0.06 0.05 0.78±0.07 1.08±0.08W 0.05 1.00±0.10’�
V 2.14±0.27 . . . 2.23±0.27 2.22±0.28’ ‘ ‘ . 2.60±0.29”
b�0V 1.03±0.11 0.001 0.83±0.09 1.06±0.09 0.001 0.92±0.09
DISP R.E* 12.1 ± 1.0 0.001 7.9±0.9 15.2± 1.3d 0.001 10.9± 1.1’�
For abbreviations, see text; p values relate to the significance of exercise-induced changes, while letters (a/A <0.05 b/B <0.01; c/C <0.005;
d/D <0.001) denote statistical significance of differences between before and after nifedipine; lower case letters, resting measurements;
capital letters, exercise measurements.*Values are �±SEM.
© 1990 American College of Chest Physicians by guest on July 22, 2011chestjournal.chestpubs.orgDownloaded from
BEFORE N.
EXERCISE
0z4
0
z
0
-J
zU>
0 01 1 10100 0 0.1 1 XHOO
a’IEEa
IQ.
50
40
30
20
10
0
I- �,2E -�
�
ib
OT, L/min
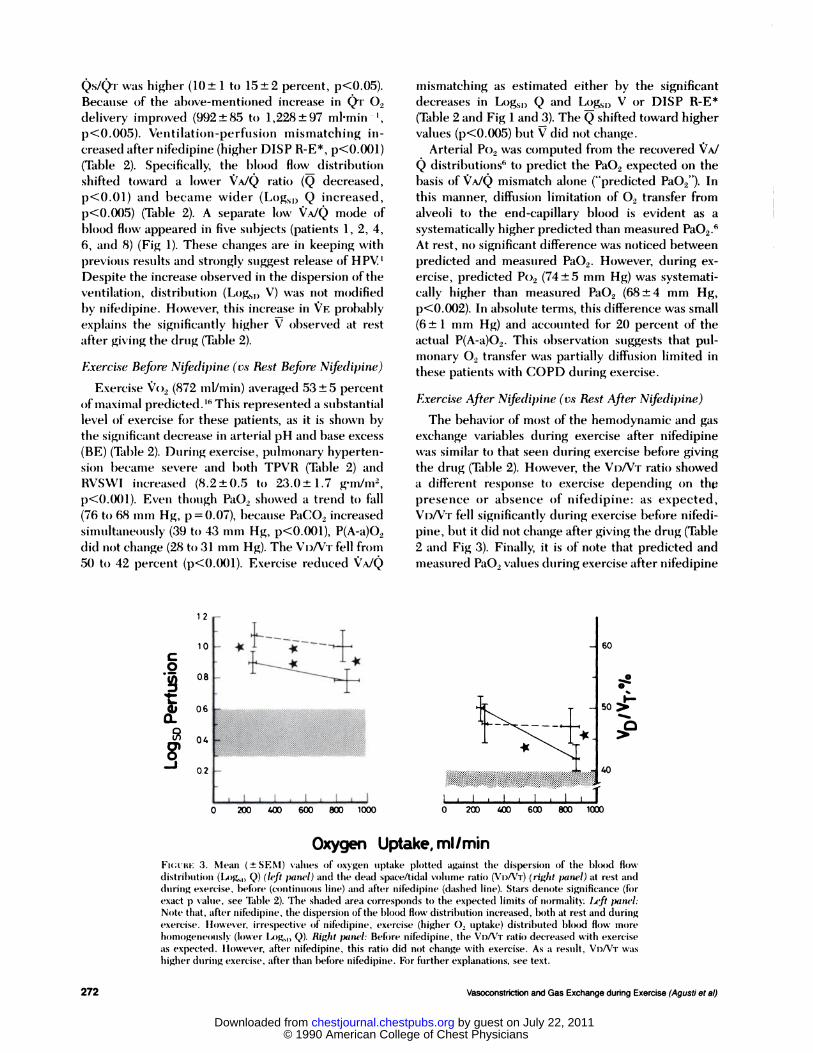
FIGURE 2. Mean values (� ±SEM) of cardiac output (Qr) and mean
pulmonary artery pressure (Ppa) at rest (bottom) and during exercise(top), before (continuous line) and after nifedipine (dashed line).
The pressure-flow relationship shifted to the right after nifedipine(p<O.Ol), indicating an active vasodilatory effect of the drug.
CHEST I 97 I 2 I FEBRUARY, 1990 271
AFTER N.
C
E
0-J
000-j
REST
VENTILATION- PERFUSION RATIO
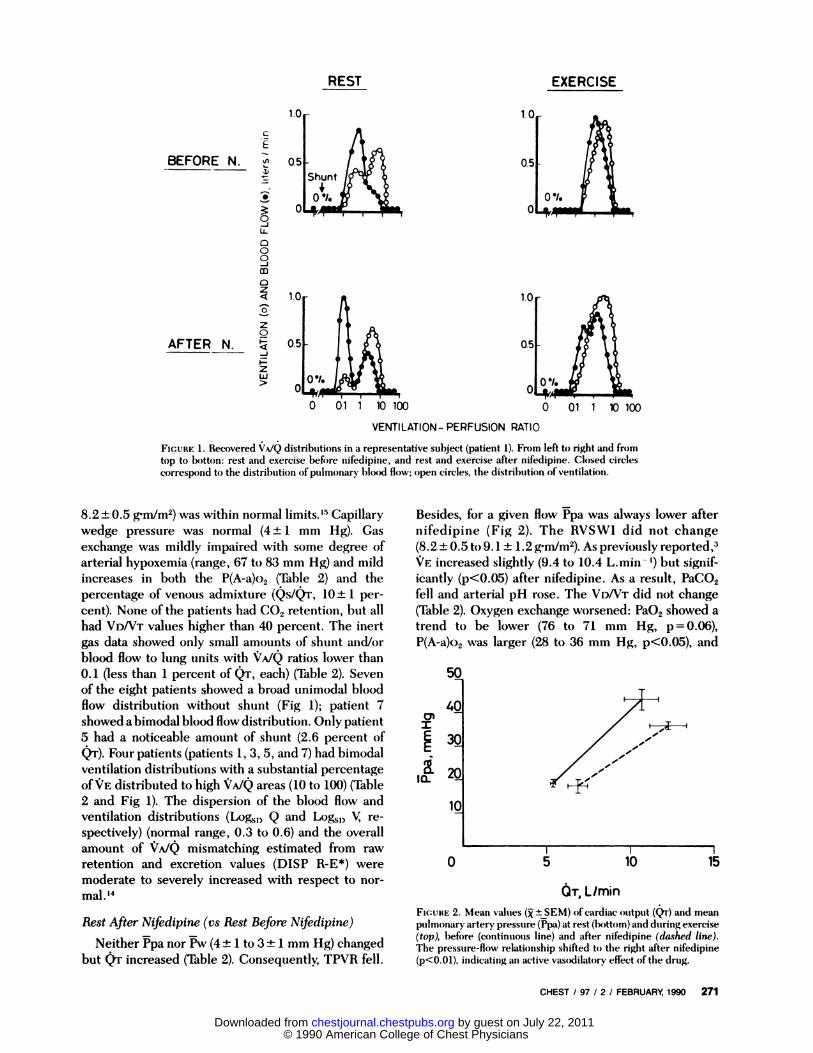
FIGURE 1 . Recovered �A/Q distributions in a representative subject (patient 1), From left to right and from
top to b()ttofl: rest and exercise before nifedipine, and rest and exercise after nifedipine. Closed circles
correspond to the distribution of pulmonary blood flow; open circles, the distribution of ventilation,
8.2 ± 0.5 gm/m2) was within normal �5 Capillary
wedge pressure was normal (4 ± 1 mm Hg). Gas
exchange was mildly impaired with some degree of
arterial hypoxemia (range, 67 to 83 mm Hg) and mild
increases in both the P(A-a)o2 (Table 2) and the
percentage of venous admixture (Qs/Qr, 10 ± 1 per-
cent). None of the patients had CO2 retention, but all
had VDNT values higher than 40 percent. The inert
gas data showed only small amounts of shunt and/or
blood flow to lung units with �TA/Q ratios lower than
0. 1 (less than 1 percent of Qr, each) (Table 2). Seven
of the eight patients showed a broad unimodal blood
flow distribution without shunt (Fig 1); patient 7
showed a bimodal blood flow distribution. Only patient
5 had a noticeable amount of shunt (2.6 percent of
Q’r). Four patients (patients 1, 3, 5, and 7) had bimodal
ventilation distributions with a substantial percentage
of�E distributed to high VA/Q areas (10 to 100) (Table
2 and Fig 1). The dispersion of the blood flow and
ventilation distributions (Log,�0 Q and Logs,) V, re-
spectively) (normal range, 0.3 to 0.6) and the overall
amount of �TA/Q mismatching estimated from raw
retention and excretion values (DISP R�E*) were
moderate to severely increased with respect to nor-
mal. ‘�
Rest After Nifedipine (vs Rest Before Nifedipine)
Neither i�pa nor i�w (4 ± 1 to 3 ± 1 mm Hg) changed
but Qr increased (Table 2). Consequently, TPVR fell.
Besides, for a given flow Ppa was always lower after
nifedipine (Fig 2). The RVSWI did not change
(8.2 ± 0.5 to 9. 1 ± 1 .2 g’m/m2). As previously reported,3
VE increased slightly (9.4 to 10.4 L.min ‘) but signif-
icantly (p’(O.05) after nifedipine. As a result, PaCO2
fell and arterial pH rose. The VD/VT did not change
(Table 2). Oxygen exchange worsened: Pa02 showed a
trend to be lower (76 to 71 mm Hg, p = 0.06),
P(A-a)o2 was larger (28 to 36 mm Hg, p<O.O5), and
© 1990 American College of Chest Physicians by guest on July 22, 2011chestjournal.chestpubs.orgDownloaded from
12 -10
08 -
C
0
-I
06
04
60
0.2 -
I-50 >
‘ I � I � � � � �
0 200 400 600 800 1000
40
272 Vasoconstriction and Gas Exchange during Exercise (Agusti et a!)
QS/QT was higher (10 ± 1 to 15 ± 2 percent, p<O.O5).
Because of the above-mentioned increase in Qr O�
delivery improved (992 ± 85 to 1 ,228 ± 97 ml’min � I,
P<O.005). Ventilation-perfusion mismatching in-creased after nifedipine (higher DISP R�E*, p<0.O0l)
(Table 2). Specifically, the blood flow distribution
shifted toward a lower VA/Q ratio (Q decreased,p�zzO.0l) and l)ecaflle wider (Logs,) Q increased,
p<O.005) (Table 2). A separate low ‘�AJQ mode of
blood flow appeared in five subjects (patients 1, 2, 4,
6, and 8) (Fig 1). These changes are in keeping with
�)reviot�s results and strongly suggest release of HPV.’Despite the increase observed in the dispersion of the
ventilation, distribution (Logs,) V) was not modified
l)y nifedipine. However, this increase in �TE probably
exI)laiflS the significantly higher V observed at rest
after giving the drug (Table 2).
Exercise Befiwe Nifedipine (vs Rest Before Nifedipine)
Exercise Vo: (872 mI/mm) averaged 53 ± 5 percent
of maximal predicted . “ This represented a substantial
level of exercise for these patients, as it is shown bythe significant decrease in arterial pH and base excess
(BE) (Table 2). During exercise, pulmonary hyperten-
slim became severe and both TPVR (Table 2) and
RVSWI increased (8.2 ± 0.5 to 23.0 ± 1 .7 gm/m,
P<O.O�)l). Even though PaO� showed a trend to fall(76 to 68 ,i�ni Hg, p = 0.07), because PaCO2 increased
simultaneously (39 to 43 nim Hg, p<O.OOl), P(A-a)02
did flot change (28 to 31 mm Hg). The VDNT fell from
50 to 42 iercent (p<O.OOl). Exercise reduced ‘�A/Q
mismatching as estimated either by the significant
decreases in Logs,) Q and Logs,) V or DISP R�E*
(Table 2 and Fig 1 and3). The � shifted toward higher
values (p<O.005) but V did not change.
Arterial Po2 was computed from the recovered �/
Q distributions6 to predict the PaO2 expected on the
l)asis of ‘$;�A/Q mismatch alone (“predicted Pa02”). In
this manner, diffusion limitation of O� transfer from
alveoli to the end-capillary blood is evident as a
systematically higher predicted than measured PaO2.6
At rest, fl() significant difference was noticed between
predicted and measured Pa02. However, during ex-
ercise, predicted Po2 (74 ± 5 mm Hg) was systemati-
cally higher than measured Pa02 (68 ± 4 mm Hg,
p<O.002). In absolute terms, this difference was small
(6 ± 1 mm Hg) and accounted for 20 percent of the
actual P(A-a)02. This observation suggests that pul-
monary 02 transfer was partially diffusion limited in
these patients with COPD during exercise.
Exercise After Nifedipine (vs Rest After Nifedipine)
The behavior of most of the hemodynamic and gas
exchange variables during exercise after nifedipinewas similar to that seen during exercise before giving
the drug (Table 2). However, the VDNT ratio showed
a different response to exercise depending on th�
presence or absence of nifedipine: as expected,
VIIVT fell significantly during exercise before nifedi-
pine, but it did not change after giving the drug (Table
2 and Fig 3). Finally, it is of note that predicted and
measured PaO� values during exercise after nifedipine
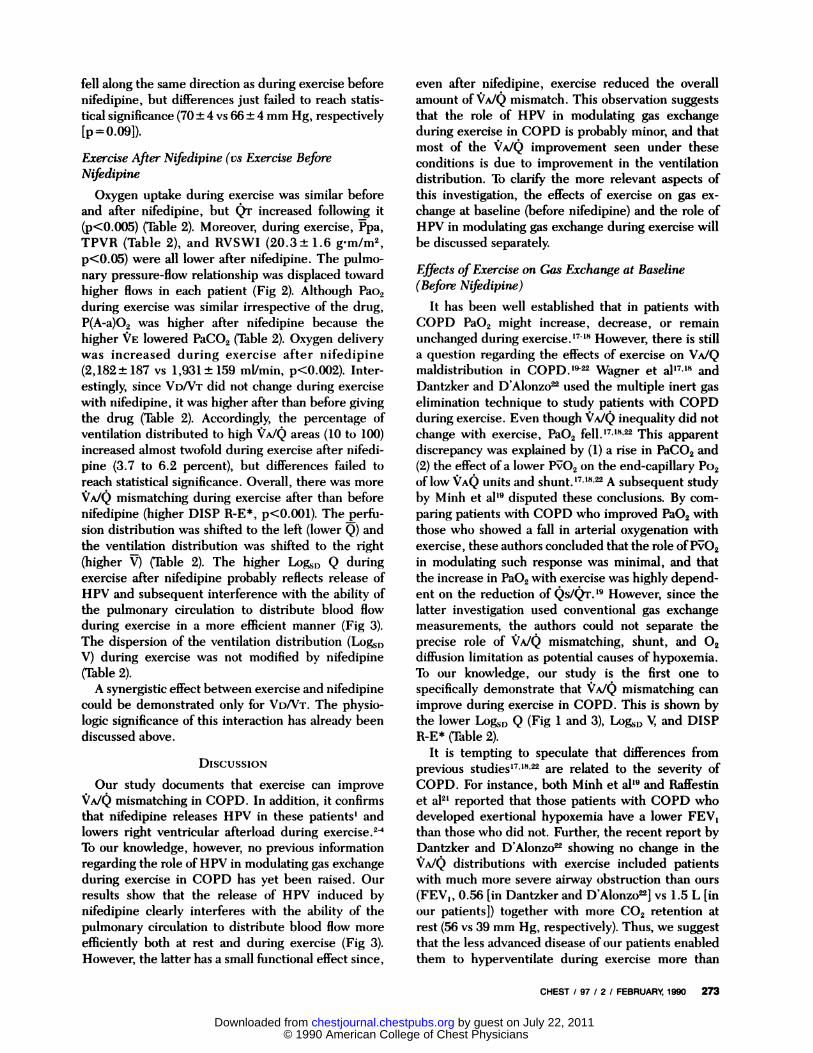
Oxygen Uptake,mI/minFIctIIF: 3. Mean ( ± SEM) values of oxygen uptake plotted against the (lispersioll of the blood flow
(listriln,tion (L()g�,) Q) (left panel) and the dead space/tidal volume ratio (V1/VT) (rig/it ;xinel) at rest and
(l1,nng exercise, before (c�ontinnou,s line) and after nifedipine (dashed line). Stars denote significance (for
exact p val,,,’, see Table 2). The shaded area corresponds to the expected limits of r�ormalit)� Left panel:
Note that, after nifedipine, the dispersion ofthe blood flow distribution increased, both at rest and duringexercise. lh)wever, irrespective of nifedipine, exercise (higher � uptake) distributed blood flow ITh)�C
homogeneously (lower L4)g�,, Q). Rig/it paru’l: Befre nifedipine, the VoATT ratio decreased with exercise
as expected. however, after nifedipine, this ratio did not change with exercise. As a result, Vo/VT was
higher (luring exercise, after than before nifedipine. For further explanatiotis, see text.
© 1990 American College of Chest Physicians by guest on July 22, 2011chestjournal.chestpubs.orgDownloaded from
CHEST I 97 I 2 I FEBRUARY, 1990 273
fell along the same direction as during exercise before
nifedipine, but differences just failed to reach statis-
tical significance (70 ± 4 vs 66 ± 4 mm Hg, respectively
{p=O.09]).
Exercise After Nzfedipine (vs Exercise Before
Nifedipine
Oxygen uptake during exercise was similar before
and after nifedipine, but Qr increased following it
(p<0.005) (Table 2). Moreover, during exercise, Ppa,
TPVR (Table 2), and RVSWI (20.3± 1.6 gm/m2,
p<O.05) were all lower after nifedipine. The pulmo-
nary pressure-flow relationship was displaced toward
higher flows in each patient (Fig 2). Although Pao2
during exercise was similar irrespective of the drug,
P(A-a)02 was higher after nifedipine because the
higher VE lowered PaCO2 (Table 2). Oxygen delivery
was increased during exercise after nifedipine
(2, 182 ± 187 vs 1 ,931 ± 159 mI/mm, p<O.002). Inter-
estingly, since VD/VT did not change during exercise
with nifedipine, it was higher after than before giving
the drug (Table 2). Accordingly, the percentage of
ventilation distributed to high ‘1A/Q areas (10 to 100)
increased almost twofold during exercise after nifedi-
pine (3.7 to 6.2 percent), but differences failed to
reach statistical significance. Overall, there was more
�;‘A/Q mismatching during exercise after than before
nifedipine (higher DISP R�E*, p<O.00l). The perfu-
sion distribution was shifted to the left (lower Q) and
the ventilation distribution was shifted to the right
(higher V) (Table 2). The higher Log�� Q during
exercise after nifedipine probably reflects release of
HPV and subsequent interference with the ability of
the pulmonary circulation to distribute blood flow
during exercise in a more efficient manner (Fig 3).
The dispersion of the ventilation distribution (Log�1)
V) during exercise was not modified by nifedipine
(Table 2).
A synergistic effect between exercise and nifedipine
could be demonstrated only for VD/VT. The physio-
logic significance of this interaction has already been
discussed above.
DIScUSSIoN
Our study documents that exercise can improve
‘s;�AJQ mismatching in COPD. In addition, it confirms
that nifedipine releases HPV in these patients’ and
lowers right ventricular afterload during exercise.24
To our knowledge, however, no previous information
regarding the role of HPV in modulating gas exchange
during exercise in COPD has yet been raised. Our
results show that the release of HPV induced by
nifedipine clearly interferes with the ability of the
pulmonary circulation to distribute blood flow more
efficiently both at rest and during exercise (Fig 3).
However, the latter has a small functional effect since,
even after nifedipine, exercise reduced the overall
amount of ‘:I�A/Q mismatch. This observation suggests
that the role of HPV in modulating gas exchange
during exercise in COPD is probably minor, and that
most of the ‘/A/Q improvement seen under these
conditions is due to improvement in the ventilation
distribution. To clarify the more relevant aspects of
this investigation, the effects of exercise on gas ex-
change at baseline (before nifedipine) and the role of
HPV in modulating gas exchange during exercise will
be discussed separately.
Effects ofExercise on Gas Exchange at Baseline
(Before Nifedipine)
It has been well established that in patients with
COPD PaO2 might increase, decrease, or remain
unchanged during �7�18 However, there is still
a question regarding the effects of exercise on VA/Q
maldistribution in COPD.’� Wagner et alh7,18 and
Dantzker and D’Alonzo� used the multiple inert gas
elimination technique to study patients with COPD
during exercise. Even though ‘$�A/Q inequality did not
change with exercise, PaO2 � This apparent
discrepancy was explained by (1) a rise in PaCO2 and(2) the effect of a lower NO2 on the end-capillary Po2
oflow VAQ units and shunt.’7”8’� A subsequent study
by Minh et al’s disputed these conclusions. By com-
paring patients with COPD who improved Pa02 with
those who showed a fall in arterial oxygenation with
exercise, these authors concluded that the role of P�O2
in modulating such response was minimal, and that
the increase in Pa02 with exercise was highly depend-
ent on the reduction of Qi’’9 However, since the
latter investigation used conventional gas exchange
measurements, the authors could not separate the
precise role of VA/Q mismatching, shunt, and 02
diffusion limitation as potential causes of hypoxemia.
To our knowledge, our study is the first one to
specifically demonstrate that �‘A/Q mismatching can
improve during exercise in COPD. This is shown by
the lower Log�� Q (Fig 1 and 3), Log8,) V, and DISP
R�E* (Table 2).
It is tempting to speculate that differences from
previous studies’7”8’� are related to the severity of
COPD. For instance, both Minh et al’s and Raffestin
et al2’ reported that those patients with COPD who
developed exertional hypoxemia have a lower FEy,
than those who did not. Further, the recent report by
Dantzker and D’Alonzo� showing no change in the
‘;;�A/Q distributions with exercise included patients
with much more severe airway obstruction than ours
(FEy,, 0.56 [in Dantzker and D’Alonzo�9 vs 1.5 L [in
our patients]) together with more CO2 retention at
rest (56 vs 39 mm Hg, respectively). Thus, we suggest
that the less advanced disease of our patients enabled
them to hyperventilate during exercise more than
© 1990 American College of Chest Physicians by guest on July 22, 2011chestjournal.chestpubs.orgDownloaded from
274 Vasoconstriction and Gas Exchange during Exercise (Agusti et a!)
those whose cases were reported by Dantzker and
D’Alonzo,� reducing but not preventing the increase
in PaCO2 and shifting Q toward higher values. This
higher Q would then minimize the impact ofa lowered
P�O2 on the end-capillary blood of those units with
very low ‘�‘A/�:! ratio’7”8’� which, on the other hand,
would have been reduced by exercise itself (Table 2).
In summary, we postulate that the less severe lung
structural derangement of our patients may have
facilitated a more homogeneous distribution during
exercise of both the alveolar ventilation (lower Log�0
V) and the pulmonary blood flow (lower LOgSD Q).During exercise, P(A-a)O2 did not change (Table 2).
At first glance, this suggests that exercise did not
modify the efficiency of the lung as a gas exchanger.
However, as it has been already pointed out, the inert
gas elimination technique showed that the �A/Q
distributions definitely improved during exercise. The
apparent paradox of a better “A/Q matching without
any noticeable change in P(A-a)02 is explained by 20
percent of the P(A-a)O2 due to diffusion limitation, assuggested by the higher predicted than measured
PaO2 during exercise (p<O.002).6 This would then limit
the expected increase in PaO2 due to the improvement
in �A/Q mismatching. This unexpected finding is at
variance with previous po7’8’� In our laboratory,
the accuracy of Po2 and Pco2 electrodes is checked
daily with tonometered blood, and reported Po2
values are systematically corrected for body
temperature6 which, in the present study, was obtained
through the thermistor of the Swan-Ganz catheter.
Using the same methodology, this difference was not
seen at rest. Moreover, during exercise after nifedipine
(1 h after the first exercise measurements were taken),
we observed a similar trend (p 0.09). Thus, under
these circumstances, a technical error seems most
unlikely. We lack a precise explanation for this finding,
but we would suggest that the higher exercise �#{176}2 of
our patients, compared with former reports,’7”8’� may
well clarify it. Clearly, further studies are needed to
confirm and explain this observation.
Role ofHPV During Exercise
At rest, nifedipine diverted blood flow to poorly
ventilated lung units (Fig 1 and 3). This observation
strongly suggests release of HPV and is in keeping
with previous reports in COPD.’ After releasing HPV,
the increase in Ppa seen during exercise was blunted
and the severity of pulmonary hypertension was
lowered (Fig 2), again in accordance with former
investigations.2� To our knowledge, however, the ef-
fects of this lowered vascular tone on the adaptation
of ‘/A/Q mismatching to exercise in COPD have not
been previously investigated. Our results show that
the dispersion of the blood flow distribution (Log��
Q) was always higher after than before nifedipine,
either at rest or during exercise (Table 2 and Fig 3).
Moreover, in contrast to before nifedipine conditions,
the VDNT ratio did not fall with exercise after nifedi-
pine (Table 2). As a result, VD/VT during exercise was
higher after than before nifedipine (Fig 3). The reason
for this latter finding is not evident but a possible
explanation is as follows. Nifedipine theoretically ex-
erts its maximal vascular effect on those lung units
with more alveolar hypoxia.� Therefore, it could be
expected that during exercise after nifedipine, hypoxic
areas would receive more blood flow than those units
with normal and high �iA/Q ratios, making the latter
less well perfused and, as a result, increasing their
‘;/A/Q ratio. Taken together, these two observations
(higher ‘-‘#{176}�SD Q� no change in VD/VT with exercise
after nifedipine) indicate that the release of HPV
induced by nifedipine certainly interferes with the
ability of the pulmonary circulation to efficiently
control the distribution ofblood flow during exercise.
However, it also appears from our results that this has
a small effect in modulating the gas exchange response
to exercise in COPD. Note that the overall amount of
�;�AJQ mismatching (DISP R�E*) improved with exer-
cise even after the release of HPV induced by nifedi-
pine (Table 2). Graphically, this is shown by the virtual
disappearance ofthe low ‘�A/Q mode in the blood flow
distribution in all of the patients in whom it had
appeared at reast after nifedipine (Fig 1). Moreover,
since exercise lowered the dispersion ofthe blood flow
distribution (Lo�D Q) irrespective of nifedipine (ie,
with or without modifying the pulmonary vascular
tone) (Fig 3), we suggest that most of the ‘IAJQ
improvement seen during exercise is due to improve-
ment of the ventilation distribution.
For example, the increase in the end-inspiratory
volume that follows exercise may have facilitated a
better ventilation of airways that were partially closed
at rest. We cannot exclude that nifedipine has some
effect on the bronchomotor tone. However, given that
nifedipine has no bronchodilator effect at rest in
asthmatic patients,� we consider unlikely that it may
have had any effect in our patients who have irreversi-
ble airflow limitation. Alternatively, nifedipine might
have theoretically prevented the development of some
bronchoconstnction induced by exercise. However we
found that, before nifedipine, exercise improved
�;�A/Q inequality an observation that is at variance with
the hypothesis of exercise-induced bronchoconstric-
tion. Further, during exercise after nifedipine we
showed more �TA/Q mismatch than before nifedipine.
If we speculate that nifedipine really has either a
bronchodilator or a protective effect on the bronchial
tone, then it would be conceivable to observe a better
VA/Q matching after its administration, which was not
shown. In summary, it seems highly unlikely that
nifedipine had any effect on the bronchomotor tone
© 1990 American College of Chest Physicians by guest on July 22, 2011chestjournal.chestpubs.orgDownloaded from

CHEST I 97 I 2 I FEBRUARY, 1990 275
in our patients. On the other hand, the potential
effects of the slight changes in CO2 during exercise on
bronchomotor or vascular tone, although presumably
negligible, cannot be quantified be design.
To summarize, our study shows that exercise can
improve ‘c�A/Q mismatching in COPD, although the
type ofresponse (ie, improvement or no change in the
VA/Q maldistribution) is probably related to the sever-
ity of COPD. Further, it suggests that most of this
improvement depends on a more homogeneous distri-
bution of the inspired ventilation and that hypoxic
pulmonary vasoconstriction probably plays a minor
role in the modulation ofsuch response. Nevertheless,
our results also demonstrate that the release of hypoxic
pulmonary vasoconstriction by nifedipine interferes
with the ability of the pulmonary circulation to dis-
tribute blood flow more efficiently and worsens pul-monary gas exchange, not only at rest but also during
exercise. Finally, this investigation highlights a limi-
tation in the diffusion of 02 from the alveoli to the
end-capillary blood during exercise of COPD. Un-
doubtedly, this observation requires further investi-
gation. Taken all together, these results help to better
understand the mechanisms that govern pulmonary
gas exchange during exercise in COPD.
ACKNOWLEDGMENTS: The authors thank C. Gistau for herchromatographic work; F.A. Lopez, F. Burgos, T Lecha, M. Simo,and C. Arga#{241}a for their skillful technical assistance; A. Cobos(Department ofStatistics, University ofBarcelona) for his statisticaladvice; and the Medical Staff of our Service for their cooperationand care of the patients.
REFERENCES
1 M#{233}lotC, Hallemans R, Naeije R, Mols P, Lejeune P Deleterious
effect of nifedipine on pulmonary gas exchange in chronic
obstructive pulmonary disease. Am Rev Bespir Dis 1984;
130:612-6.
2 Kennedy T1� Michael JR. Huang CK, Kailman CH, Zahka K,
Schlott W, et al. Nifedipine inhibits hypoxic pulmonary vas-
constriction during rest and exercise in patients with chronic
obstructive pulmonary disease. Am Rev Bespir Dis 1984;
129:544-51
3 Muramoto A, Caldwell J, Albert RK, Lakshminarayan AS, Butler
J. Nifedipine dilates the pulmonary vasculature without produc-
ing symptomatic systemic hypotension in upright resting and
exercising patients with pulmonary hypertension secondary to
chronic obstructive pulmonary disease. Am Rev Respir Dis
1985; 132:963-6
4 Singh H, Ebejer MJ, Higgins DA, Henderson AH, Campbell
IA. Acute hemodynamic effects of nifedipine at rest and during
maximal exercise in patients with chronic cor pulmonale. Thorax
1985; 40:910-4
5 Wagner PD, Naumann PF, Laravuso RB. Simultaneous meas-
urement ofeight foreign gases in blood by gas chromatography.
J Appl Physiol 1974; 36:600-5
6 West JB, Wagner PD. Pulmonary gas exchange. In: West JB,
ed. Bioengineering aspects of the lung. New York: Marcel
Dekker; 1977:361-4
7 Rubin U. Vasodilators and pulmonary hypertension: where do
we go from here?. Am Rev Respir Dis 1987; 135:2878 Magee F, Wright JL, Wiggs BR, Pare PD, HoggJC. Pulmonary
vascular structure and function in chronic obstructive pulmonary
disease. Thorax 1988; 43:183-9
9 Cotes JE, Dabbs JM, Elwood PC, Hall AM, McDonald A,
Saunders JM . Iron-deficiency anaemia: its effect on transfer
factor for the lung, diffusing capacity and ventilation and cardiac
frequency during submaximal exercise. Clin Sd 1972; 42:325-
3510 Roca J, Sanchis J, Agusti-Vidal A, Segarra F, Navajas D,
Rodriguez-Roisin R, et al. Spirometric reference values for a
Mediterranean population. Bull Europ Physiopathol Respir
1986; 22:217-24
11 Roca J, Segarra F, Rodriguez-Roisin R, Cobo E, Martinez J,Agusti-Vidal A. Static lung volumes and single-breath diffusion
capacity reference values from a Latin population. Am Rev
Respir Dis 1985; 131:352A
12 Rodriguez-Boisin R, Boca J, AgustI AGN, Mastai R, Wagner
PD, Bosch J. Gas exchange and pulmonary vascular reactivity
in patients with liver cirrhosis. Am Rev Respir Dis 1987;
135:1085-92
13 Evans JV, Wagner PD. Limits on �‘AJQ distributions from
analysis of experimental inert gas elimination. J AppI Physiol
1977; 42:889-98
14 Gale GE, Torre-Bueno JA, Moon RE, Saltzman HA, Wagner
PD. Ventilation-perfusion inequality in normal humans during
exercise at sea level and simulated altitude. J AppI Physiol 1985;
58:978-88
15 Sprung CL, Backow EC, Civetta JM. Direct measurement and
derived calculations using the pulmonary artery catheter. In:
CL Sprung, ed. The pulmonary artery catheter. Baltimore:
University Park Press; 1983:105-40
16 Jones NL, Makrides L, Hitchcock C, Chypchar T McCartney
N. Normal standards for an incremental progressive cycle
ergometer test. Am Rev Respir Dis 1985; 131:700-8
17 Wagner PD, Dantzker DR. Dueck R, Clausen JL, West JB.
Ventilation-perfusion inequality in chronic obstructive pulmo-
nary disease. J Clin Invest 1977; 59:203-16
18 Wagner PD. Ventilation-perfusion inequality and gas exchange
during exercise in lung disease. In: Dempsey JA, Reed CE, eds.
Muscular exercise and the lung. Madison, Wis: University of
Wisconsin Press; 1977:345-56
19 Minh VD, Lee HM, Dolan GF, Light R� Bell J, Vasquez PHypoxemia during exercise in patients with chronic obstructive
pulmonary disease. Am Rev Respir Dis 1979; 120:787-94
20 Minh VD, Chun D, Dolan GR, Lee HM, Vasquez P Mixed
venous oxygenation, exercise, body posture and V/Q ratio in
chronic obstructive pulmonary disease. Am Rev Respir Dis
1981; 124:226-31
21 Raffestin B, Escourrou P. Legrand A, Duroux F, Lockhart A.
Circulatory transport of oxygen in patients with chronic airflow
obstruction exercising maximally. Am Rev Respir Dis 1982;
125:426-31
22 Dantzker D, D’Alonzo GE. The effect ofexercise on pulmonary
gas exchange in patients with severe chronic obstructive pul-
monary disease. Am Rev Respir Dis 1986; 134:1135-9
23 Simmoneau G, Escourrou P, Duroux P. Lockhart A. Inhibitionof hypoxic pulmonary vasonconstriction by nifedipine. N Engl
J Med 1981; 304:1582-5
© 1990 American College of Chest Physicians by guest on July 22, 2011chestjournal.chestpubs.orgDownloaded from
DOI 10.1378/chest.97.2.268 1990;97; 268-275Chest
A G Agustí, J A Barberá, J Roca, P D Wagner, R Guitart and R Rodriguez-Roisínchronic obstructive pulmonary disease.
Hypoxic pulmonary vasoconstriction and gas exchange during exercise in
July 22, 2011This information is current as of
http://chestjournal.chestpubs.org/content/97/2/268Updated Information and services can be found at:
Updated Information & Services
http://chestjournal.chestpubs.org/content/97/2/268#related-urlsThis article has been cited by 27 HighWire-hosted articles:
Cited Bys
http://www.chestpubs.org/site/misc/reprints.xhtmlonline at: Information about reproducing this article in parts (figures, tables) or in its entirety can be foundPermissions & Licensing
http://www.chestpubs.org/site/misc/reprints.xhtmlInformation about ordering reprints can be found online:
Reprints
the right of the online article.Receive free e-mail alerts when new articles cite this article. To sign up, select the "Services" link to
Citation Alerts
slide format. See any online figure for directions. articles can be downloaded for teaching purposes in PowerPointCHESTFigures that appear in Images in PowerPoint format
© 1990 American College of Chest Physicians by guest on July 22, 2011chestjournal.chestpubs.orgDownloaded from