hypothesis and theory article a general framework of persistence strategies for biological systems...
TRANSCRIPT
HYPOTHESIS ANDTHEORY ARTICLEpublished: 25 February 2013
doi: 10.3389/fgene.2013.00016
A general framework of persistence strategies forbiological systems helps explain domains of lifeLiudmila S.Yafremava1, Monica Wielgos2, SuraviThomas2, Arshan Nasir 1, Minglei Wang1,Jay E. Mittenthal 3 and Gustavo Caetano-Anollés1*1 Evolutionary Bioinformatics Laboratory, Department of Crop Sciences, University of Illinois, Urbana, IL, USA2 School of Molecular and Cell Biology, University of Illinois, Urbana, IL, USA3 Department of Cell and Developmental Biology, University of Illinois, Urbana, IL, USA
Edited by:Firas H. Kobeissy, University ofFlorida, USA
Reviewed by:Firas H. Kobeissy, University ofFlorida, USABilal Fadlallah, University of Florida,USA
*Correspondence:Gustavo Caetano-Anollés,Evolutionary BioinformaticsLaboratory, Department of CropSciences, University of Illinois atUrbana-Champaign, 1101West,Peabody Drive, Urbana, IL 61801,USA.e-mail: [email protected]
The nature and cause of the division of organisms in superkingdoms is not fully under-stood. Assuming that environment shapes physiology, here we construct a novel theoreticalframework that helps identify general patterns of organism persistence. This frameworkis based on Jacob von Uexküll’s organism-centric view of the environment and James G.Miller’s view of organisms as matter-energy-information processing molecular machines.Three concepts describe an organism’s environmental niche: scope, umwelt, and gap.Scope denotes the entirety of environmental events and conditions to which the organ-ism is exposed during its lifetime. Umwelt encompasses an organism’s perception ofthese events. The gap is the organism’s blind spot, the scope that is not covered byumwelt. These concepts bring organisms of different complexity to a common ecologi-cal denominator. Ecological and physiological data suggest organisms persist using threestrategies: flexibility, robustness, and economy. All organisms use umwelt information toflexibly adapt to environmental change. They implement robustness against environmen-tal perturbations within the gap generally through redundancy and reliability of internalconstituents. Both flexibility and robustness improve survival. However, they also incurmetabolic matter-energy processing costs, which otherwise could have been used forgrowth and reproduction. Lineages evolve unique tradeoff solutions among strategies inthe space of what we call “a persistence triangle.” Protein domain architecture and otherevidence support the preferential use of flexibility and robustness properties. Archaeaand Bacteria gravitate toward the triangle’s economy vertex, with Archaea biased towardrobustness. Eukarya trade economy for survivability. Protista occupy a saddle manifold sep-arating akaryotes from multicellular organisms. Plants and the more flexible Fungi sharean economic stratum, and Metazoa are locked in a positive feedback loop toward flexibility.
Keywords: economy, flexibility, gap, proteome evolution, redundancy, robustness, scope, umwelt
INTRODUCTIONThe division of cellular organisms into six kingdoms (Whittaker,1969) and three superkingdoms has been confirmed by a widevariety of means (e.g., Gogarten and Taiz, 1992; Pace, 1997; Cic-carelli et al., 2006; Wang and Caetano-Anollés, 2006; Ding et al.,2008; Kim and Caetano-Anollés, 2012). Still, we do not completelyunderstand the nature of the fundamental differences betweenthem (e.g., Woese, 1987, 2002; Koch, 1998; Cavalier-Smith, 2002a;Horiike et al., 2002; Kurland et al., 2006; Valentine, 2007; amongmany others). Genetic sequences, molecular organization, mor-phology, nutrition, ecological preferences, and adaptations havebeen used either separately or in combinations to resolve groupsof organisms and explain their differences. While our compar-ative knowledge becomes more detailed over time, it would beuseful to synthesize the essence of what makes an organism orlineage unique. The theory of evolution by natural selection hasprovided one framework for such synthesis: organisms persist inan environment by evolving internal organization that works in
that environment. By definition, lineages of the six kingdoms havedemonstrated persistence, and a large catalog of their idiosyn-cratic environmental adaptations exists in the literature. Can wenow design a framework that will help us describe their method ofpersistence, and express what makes one organism different fromanother, in those terms?
To accomplish this goal, we need a language for comparativeinquiry. Miller’s theory of living systems (Miller, 1995) is a well-established theoretical framework that provides such language. Itidentifies the entire set of 20 subsystems required for operation ofany living system, and all the relationships between those subsys-tems. It is therefore complete, as the 20 subsystems are necessaryand sufficient to describe any living system at any level of com-plexity. It scales perfectly across the levels of complexity becauseit describes all life, from cells to societies, in exactly the same way.It works well, as the internal subsystems and their relationshipshave been substantiated in great detail. Thus, Miller’s frameworkis a good choice for our problem. The framework describes the
www.frontiersin.org February 2013 | Volume 4 | Article 16 | 1
Yafremava et al. A framework of economy, flexibility, and robustness
interaction of organisms with their environment as ingestion, pro-cessing, and extrusion of matter, energy, and information. Wecould start by comparing organisms in terms of the magnitudeand strategies of that processing.
Processing of matter and energy has been considered in a num-ber of life history theories (e.g., Pianka, 1972; Taylor et al., 1990;Mueller and Diamond, 2001; Brown et al., 2004; Seibel and Drazen,2007). To compare information processing between organisms,environments must be described in a comparable way. We findthat the organism-centric model of the environment, pioneeredby von Uexküll (1909) for Metazoa, is suitable. The model con-sists of describing an organism’s environment via the so-called“umwelt,” literally “the world around us.” Umwelt refers to theentirety of an organism’s perception, and therefore accounts forall environmental signals (information) that are processed by theorganism. By representing the environment as the organism per-ceives it, at its own spatio-temporal scale, umwelt makes it possibleto compare environments for very different organisms. However,organisms also evolve methods to withstand signals they do notprocess. For example, the outer layer of tree bark is essentially deadtissue, which serves to protect it against some external influenceswithout processing and responding to them. Thus, the concept ofumwelt is not sufficient to describe an organism’s environment,which leads us to introduce two new concepts – scope and gap.
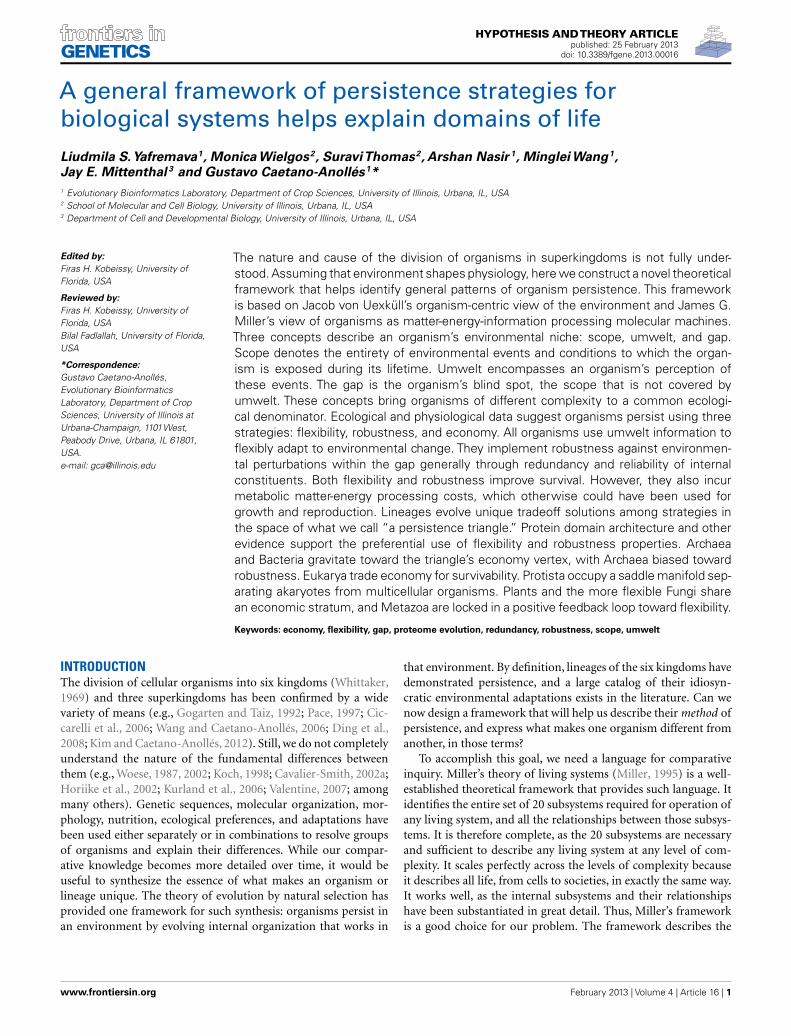
We use the term “scope” to denote the entirety of signals towhich the organism is exposed during its lifetime. Because pro-cessing signals is costly, organisms perceive and respond only toa fraction of their scope, called umwelt. Responses of an organ-ism to the signals of the umwelt help modulate the environmentaleffects on the organism’s function, making the organism moreflexible. The signals that are not perceived and processed by theorganism fall into the “gap” between scope and umwelt. Organ-isms evolve properties of robustness, which allow them to continuefunctioning despite possible effects of the gap signals. The costsassociated with flexibility and robustness are offset by the organ-ism’s matter-energy budget. Flexible responses and robustnessproperties compete for this budget and are thus in a tradeoff rela-tionship, resulting in evolution of a particular economy – a methodof meeting the organism’s budget. Lineages evolve unique tradeoffsolutions among economy,flexibility and robustness, and the spaceof all those solutions forms what we call the persistence triangle(Figure 1). The coevolving economy/flexibility/robustness trio isthus a dynamic attribute of every lineage, describing its particularstrategy of persistence.
We studied the patterns of division of scope into umwelt andgap for lineages that are extant, attempting to understand whatflexibility/robustness tradeoffs they adopt. We find that the sixkingdoms break up into four economic strata, in order of increas-ing budget: Archaea-Bacteria, Protista, Fungi-Plants, and Metazoa.Kingdoms that share a stratum are resolved based on their per-sistence tradeoff: Bacteria are more flexible and less robust thanArchaea. Fungi are more flexible and less robust than Plants. Meta-zoa invest primarily into flexibility. We demonstrate that the trioof economy/flexibility/robustness is a complete set of persistencestrategies. It is sufficient to adequately describe an organism’smethod of persistence, and compare it to that of another organ-ism, regardless of the level of complexity. We also find that some
FIGURE 1 |The persistence triangle depicts the set of solutions to thetradeoff problem among economy, flexibility and robustness. Theelements of Scope/Umwelt/Gap trio and Economy/Flexibility/Robustnesstrio are intimately related, reflecting the effect environment has onevolution of an organism’s persistence strategies. Scope size is correlatedwith the organism’s budget, giving rise to the strategy of economy. Umweltis composed of scope signals, which are processed by the organism,making it more flexible in response to the environment. Organisms evolveproperties of robustness against the gap signals, which are not processed.Mechanisms of flexibility and robustness both cost matter-energy andcompete with each other for the budget quota. Thus, the three persistencestrategies are in a tradeoff relationship. Each location within the persistencetriangle denotes a solution to this tradeoff problem.
features of the organism’s internal organization, such as diversity,redundancy, modularity, combinatorial use, and reuse of internalparts are correlated with the tradeoff biases. We hypothesize thatthese features constrain the evolution of lineages toward particularpersistence strategies.
In the following sections, we first define key terminology ofour framework. We then use ecological and physiological data toidentify tendencies of organisms in scope/umwelt/gap and econ-omy/flexibility/robustness. These data permit us to identify econ-omy, flexibility, and robustness as the strategies of persistence andformulate hypotheses about the tradeoffs between them. Lastly, wedescribe coevolution of persistence strategies and coevolutionaryconstraints.
DESCRIPTION OF THE FRAMEWORKLife is manifested as persistent lineages of mortal self-replicatingindividuals that compete with each other for resources, striving tosurvive, grow, and reproduce. The distinctive features of each lin-eage evolved through the experience of all generations to-date. Toavoid confusion, we use the terms “organism” or “organism kind”for sets of lineages with similar characteristics, but also discussindividuals, where appropriate.
We adopt Miller’s theory of living systems, which models organ-isms as a class of emergent dissipative systems, i.e., as engines thatorganize their own structure by using energy from gradients ofelectro-chemical potential and of radiant energy (Morowitz andSmith, 2007). The theory captures this by representing an individ-ual organism as a network of molecular machines, which take in,
Frontiers in Genetics | Systems Biology February 2013 | Volume 4 | Article 16 | 2
Yafremava et al. A framework of economy, flexibility, and robustness
process and extrude matter, energy, and information. Because mat-ter and energy are inter-convertible, we follow Miller in referringto them both jointly as matter-energy (Table 1). Information arisesfrom spatio-temporal inhomogeneity (Umpleby, 2007) in an indi-vidual’s external and internal environment. Information is used byindividual organisms for homeostasis, to function and replicate,to avoid the risk of adverse events, to locate resources, and tocommunicate. Matter-energy is used to manufacture the requiredcomponents and to process information. We conjecture that thefundamental differences between organisms could be captured inthe ways they process matter-energy and information. This mayexhibit itself as processing different amounts of matter-energyand/or information, using different mechanisms for processing, orperforming processing at different rates. Our objective is to findan adequate abstract representation of those differences throughsynthesis of ecological and physiological knowledge at all levels ofcomplexity.
Scope defines the spatio-temporal parcel of the environmentthat the individual is exposed to, and therefore the amount ofinformation and matter-energy available to it. The term “scope”literally means “outlook,” or “extent of view.” Every individuallives within its own spatio-temporal scale, from which it scans,“scopes out,” the environment, as if through a window. The tem-poral dimension of scope is circumscribed by the individual’s lifespan. For example, in a lichen colony covering a rock, a singlecyanobacterium that comes into being on a summer day may neverexperience the cold of winter, because its lifetime is much shorterthan the time-scale of temporal variation of the seasons. Withinits narrow temporal scope it experiences environmental tempera-ture as being fairly constant. In contrast, the snake living under thesame rock is exposed to a more variable environment, as its tempo-ral scale encompasses that of the seasons. The spatial dimension ofscope is circumscribed by the individual’s body size, surface area,and motility range, as these parameters determine the amount ofthe exposure of the individual to the environment. The amountof matter-energy that is processed increases with body size andmotility. Thus, scope size is positively related to the amount ofmatter-energy that is processed by the individual (Figure 1), whilethe signal content of the scope (Table 1) constrains its informationflux. Two organisms with the same scope size may be exposed todifferent amount of information depending on how quickly theirenvironmental signals change. For example, plant individuals maybe exposed to a similar range of temperatures in a dry desert andin a temperate climate, with the total amplitude of variation beingtens of degrees centigrade. However, the former experience thisvariation diurnally, whereas the latter experience it seasonally. Wecall an organism’s scope “dense” when individuals are exposed toexternal environmental signals that change rapidly at the indi-vidual’s temporal scale, with amplitude that encompasses signalvalues that have different effects on the organism. This may be dueto the environment being highly in homogeneous in space-time,or due to the individuals exploring the environment at high speed.
The scope changes as the individual goes through different lifestages, such as egg, larval instar, pupa, and adult stages of a butterflydevelopment. The scope of an individual does not have to includeall environmental signals to which its lineage may be exposed. Inour example above, a single cyanobacterium is exposed to different
temperatures during the day or at night, but the lineage at large isexposed to the entire diurnal temperature range.
Individuals process some of the information to which theyare exposed, by perceiving and responding to signals with innerchanges or outward behaviors. Those signals comprise a part ofthe scope, traditionally termed umwelt, which describes the worldof an organism’s perception (von Uexküll, 1909). An individual’sresponses to umwelt signals enable it to flexibly adapt to its envi-ronment, maintaining the physical, developmental, physiological,and social parameters within ranges conducive to persistence ofits lineage. For example, cyanobacteria in the ocean surface switchfrom phototrophy to chemorganotrophy as mixing moves theminto darker waters (external signal causing inner changes), and thepit viper attacks a prey in response to the infrared radiation emit-ted by it (external signal causing outward behaviors). Umwelt doesnot describe the meaning of information carried by the signals –that is the subject of semiotics (Barbieri, 2008), and we leave it outof this paper.
Processing signals is costly: the respective molecular machineryis made of matter and requires energy to function. The signals thatthe organism fails to process fall into “the gap” between the experi-enced world and the perceived world: between scope and umwelt.By definition, the signals and events that happen in the gap do notelicit any responses from the individual exposed to them, regard-less of the effect they may have on its fitness, including its survivaland reproduction. Organisms evolve properties that allow indi-viduals to continue functioning despite the effects of gap signals,and therefore make individuals more robust to those signals, at thecost of missed opportunities when information contained in thesignal is ignored. These robustness properties include reliabilityand redundancy of an individual’s internal machinery, or protec-tive shielding. For example, an enzyme that maintains its catalyticactivity (is reliable) over a broad range of temperatures is robustagainst deviations from its optimum temperature of operation.An organism that ventures into a variety of thermal environmentscan keep using this enzyme (robustness) and continue functioningwithout switching to a different one (flexibility).
The distinction between flexibility and robustness is tricky.Robustness is frequently used in the literature to refer to anymechanism that allows maintenance of function despite externalinfluence. For example, robust operation of an airport involvesmaintaining a schedule of flights despite malfunctions of equip-ment. Detecting the malfunctions and effecting timely repairs, orreplacing the equipment with functional copies may accomplishthis. Detection, repair, and replacement are actions that reflectchanges within the system and require processing of information.We call them mechanisms of flexibility. On the other hand, robust-ness of a bridge against physical strain imposed by the load is apassive property, which allows the bridge to function without pro-cessing information about that load. We use the term robustnessin this passive sense. More examples of flexibility mechanisms androbustness properties are given in Table 1.
In the next section, we attempt to compare organisms indifferent kingdoms and superkingdoms in terms of their flexibil-ity and robustness. What does it mean when an organism is moreflexible, or more robust? Flexibility and robustness are definedin terms of the division of scope signals into umwelt and gap.
www.frontiersin.org February 2013 | Volume 4 | Article 16 | 3
Yafremava et al. A framework of economy, flexibility, and robustness
Table 1 | Elaboration on the fundamental concepts.
Concept Definition
Matter-energy In his theory of living systems, Miller (1995) refers to matter and energy jointly in order to follow the principle of
mass-energy equivalence established in physics. This principle may seem remote from the problems of biology.
Nonetheless, the joint term of matter-energy is valid for living systems, because for biological organisms matter and
energy are biochemically inseparable. Interconversions of energy during chemical reactions alter the underlying
chemicals (particles of matter), and are fundamental to the process of life. The term is therefore useful for capturing the
total flux of enthalpy through an organism
Information Matter-energy and information are related. Information is always borne on a material marker. Distribution of matter-energy
in the environment is inhomogeneous, and thus embeds information. An organism’s material components interact with
each other, communicating and changing their states, which is a form of information flow. Thus, in organisms the fluxes
of matter-energy and information are like two sides of a coin: somewhat different, but not entirely separable.
Information arises from the environmental inhomogeneity. Thus, the spatial and temporal variability in ecological niches
are literally measured by the amount on information to which the organism is exposed. Because these concepts are very
abstract, we choose to express the organism’s environment in terms of signals
Signal This term is used to describe what is happening in the external environment as well as within an individual organism.
Depending on the context, signals may describe physical events and quantities, values of physical quantities, as well as
patterns formed by values of physical quantities. Examples of signals include chemical: nutrients, pH, salinity, moisture,
etc.; physical: temperature, pressure, illumination, etc.; social: proximity to and signals issued by other organisms, etc.
Flexibility mechanisms These mechanisms are expressed either through inner changes or through outward behaviors. Examples include: inner
changes: gene expression patterns, intracellular signaling cascades, heart rate modulation, stomach juice secretion,
melatonin production, subcutaneous fat accumulation and loss, learning, etc.; outward behaviors: movement of any kind,
taxis, ingestion, egestion, pheromone secretion, leaf/tail shedding, etc.
An organism is considered more flexible if it is able to respond with a greater number of inner changes or outward
behaviors to a greater number of informative patterns in its environment. The latter can be represented by a greater
number of different physical quantities, or by a broader range of values of the same physical quantity, or by greater
complexity of spatio-temporal patterns formed by the values of a physical quantity. In the text, all of these
representations are referred to as “signals”
Robustness properties Features and properties that make an organism less vulnerable with respect to signals it cannot process. Examples
include: cell wall, bark and thorns, skin, fur, horns, teeth, shells, claws and skeleton, constitutively produced poison or
other chemical repellant, thermophilic proteins, etc.
An organism is considered more robust if it is able to withstand without change a greater number of informative patterns
(signals) in its environment
Thus, the greater is the range of signal values that the organismcan withstand without having to change itself, the more robust theorganism is against that signal. For example, all else being equal, ananimal with thicker bones is more robust against forces of phys-ical stress and deformation than an animal with thinner bones.Similarly, the greater is the number of responses generated by anorganism to different values of the same signal, the more flexibleis the organism with respect to that signal. For example, mammalshave a wide array of behaviors in response to the different patternsof intensity and color of the experienced illumination, whereasbacteria at best can tell light from dark. At this point, it is obviousthat the division of scope into umwelt and gap is exclusive: eithera signal is processed by the organism, or it is not. However, it isnot clear whether flexibility and robustness are exclusive. If oneorganism is more flexible than another, is it also less robust? Wewill return to this point later in the paper.
EVIDENTIAL SUPPORT OF THE FRAMEWORKOrganisms in the six kingdoms exhibit easily recognizablepatterns of scope, budget, flexibility, and robustness. We
demonstrate these patterns based on the data collected from theliterature.
SCOPE SIZES AND MATTER-ENERGY BUDGETS OF ORGANISMSScope size measures how much of the external environment theindividual can scan, or how many external signals it can potentiallybe exposed to. This exposure grows with the individual’s size, spa-tial range due to motility, and life span. The plots in Figure 2recapitulate the known positive relationship between these vari-ables (Harestad and Bunnell, 1979; Jenkins, 1981; Garland, 1983;McMahon and Bonner, 1983; Reich, 2001; Hedenstrom, 2003;Speakman, 2005). Based on these data and the factors contribut-ing to budget, we arranged the six kingdoms in order of increasingscope size and budget (Figure 3, left panel). Motility and nutritionappear to be the defining factors in this distribution.
The microbes of kingdoms Bacteria and Archaea, which we heredenote collectively as “Akarya,” are the smallest and slowest organ-isms among the six kingdoms. Motility is costly, inefficient, andsimply not very useful at their spatial scale (Berg and Purcell, 1977;Purcell, 1977), due to the substantial viscous drag (Berg, 1993)
Frontiers in Genetics | Systems Biology February 2013 | Volume 4 | Article 16 | 4
Yafremava et al. A framework of economy, flexibility, and robustness
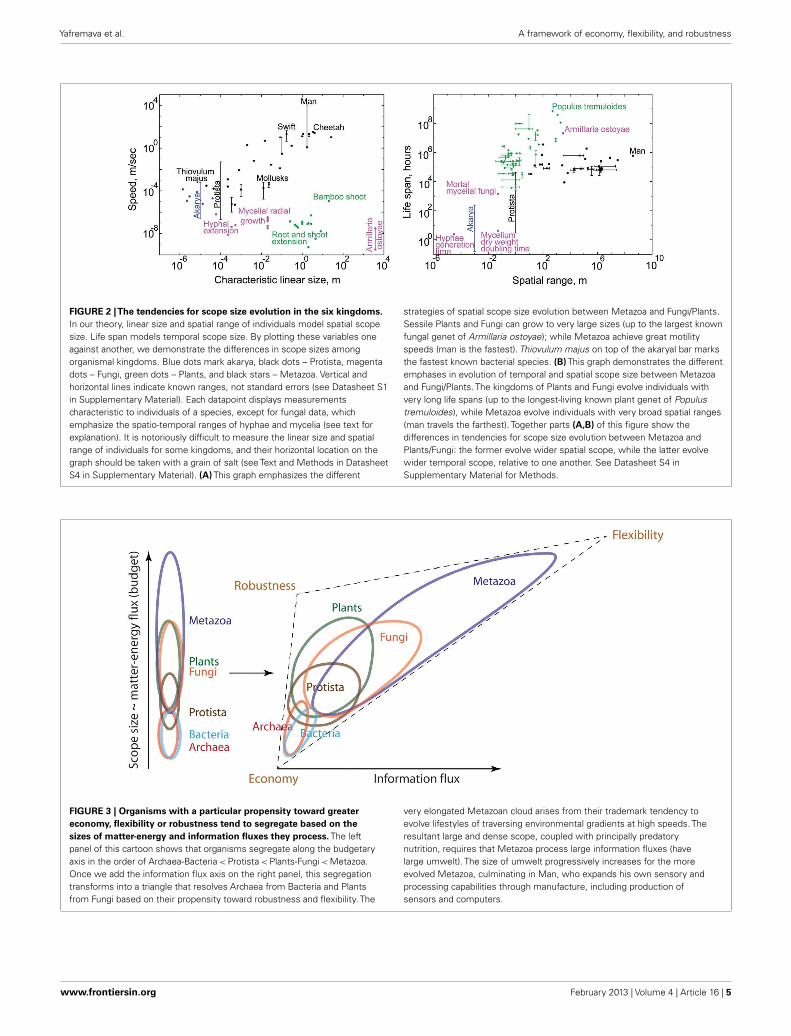
FIGURE 2 |The tendencies for scope size evolution in the six kingdoms.In our theory, linear size and spatial range of individuals model spatial scopesize. Life span models temporal scope size. By plotting these variables oneagainst another, we demonstrate the differences in scope sizes amongorganismal kingdoms. Blue dots mark akarya, black dots – Protista, magentadots – Fungi, green dots – Plants, and black stars – Metazoa. Vertical andhorizontal lines indicate known ranges, not standard errors (see Datasheet S1in Supplementary Material). Each datapoint displays measurementscharacteristic to individuals of a species, except for fungal data, whichemphasize the spatio-temporal ranges of hyphae and mycelia (see text forexplanation). It is notoriously difficult to measure the linear size and spatialrange of individuals for some kingdoms, and their horizontal location on thegraph should be taken with a grain of salt (see Text and Methods in DatasheetS4 in Supplementary Material). (A) This graph emphasizes the different
strategies of spatial scope size evolution between Metazoa and Fungi/Plants.Sessile Plants and Fungi can grow to very large sizes (up to the largest knownfungal genet of Armillaria ostoyae); while Metazoa achieve great motilityspeeds (man is the fastest). Thiovulum majus on top of the akaryal bar marksthe fastest known bacterial species. (B) This graph demonstrates the differentemphases in evolution of temporal and spatial scope size between Metazoaand Fungi/Plants. The kingdoms of Plants and Fungi evolve individuals withvery long life spans (up to the longest-living known plant genet of Populustremuloides), while Metazoa evolve individuals with very broad spatial ranges(man travels the farthest). Together parts (A,B) of this figure show thedifferences in tendencies for scope size evolution between Metazoa andPlants/Fungi: the former evolve wider spatial scope, while the latter evolvewider temporal scope, relative to one another. See Datasheet S4 inSupplementary Material for Methods.
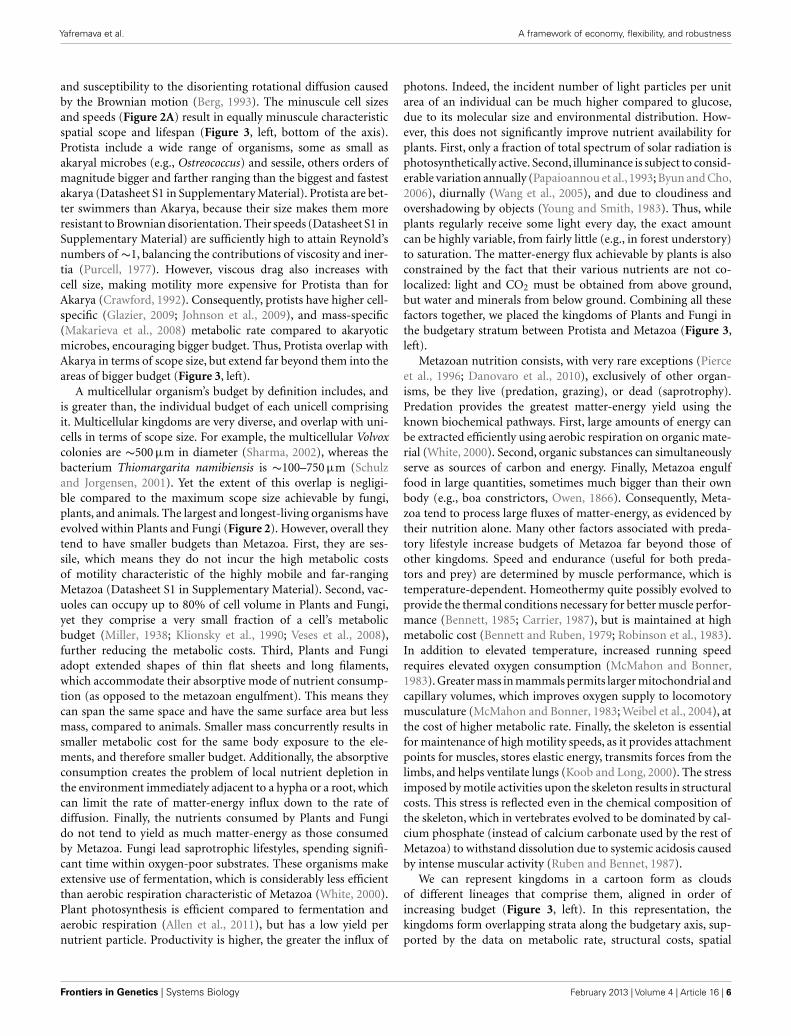
FIGURE 3 | Organisms with a particular propensity toward greatereconomy, flexibility or robustness tend to segregate based on thesizes of matter-energy and information fluxes they process. The leftpanel of this cartoon shows that organisms segregate along the budgetaryaxis in the order of Archaea-Bacteria < Protista < Plants-Fungi < Metazoa.Once we add the information flux axis on the right panel, this segregationtransforms into a triangle that resolves Archaea from Bacteria and Plantsfrom Fungi based on their propensity toward robustness and flexibility. The
very elongated Metazoan cloud arises from their trademark tendency toevolve lifestyles of traversing environmental gradients at high speeds. Theresultant large and dense scope, coupled with principally predatorynutrition, requires that Metazoa process large information fluxes (havelarge umwelt). The size of umwelt progressively increases for the moreevolved Metazoa, culminating in Man, who expands his own sensory andprocessing capabilities through manufacture, including production ofsensors and computers.
www.frontiersin.org February 2013 | Volume 4 | Article 16 | 5
Yafremava et al. A framework of economy, flexibility, and robustness
and susceptibility to the disorienting rotational diffusion causedby the Brownian motion (Berg, 1993). The minuscule cell sizesand speeds (Figure 2A) result in equally minuscule characteristicspatial scope and lifespan (Figure 3, left, bottom of the axis).Protista include a wide range of organisms, some as small asakaryal microbes (e.g., Ostreococcus) and sessile, others orders ofmagnitude bigger and farther ranging than the biggest and fastestakarya (Datasheet S1 in Supplementary Material). Protista are bet-ter swimmers than Akarya, because their size makes them moreresistant to Brownian disorientation. Their speeds (Datasheet S1 inSupplementary Material) are sufficiently high to attain Reynold’snumbers of ∼1, balancing the contributions of viscosity and iner-tia (Purcell, 1977). However, viscous drag also increases withcell size, making motility more expensive for Protista than forAkarya (Crawford, 1992). Consequently, protists have higher cell-specific (Glazier, 2009; Johnson et al., 2009), and mass-specific(Makarieva et al., 2008) metabolic rate compared to akaryoticmicrobes, encouraging bigger budget. Thus, Protista overlap withAkarya in terms of scope size, but extend far beyond them into theareas of bigger budget (Figure 3, left).
A multicellular organism’s budget by definition includes, andis greater than, the individual budget of each unicell comprisingit. Multicellular kingdoms are very diverse, and overlap with uni-cells in terms of scope size. For example, the multicellular Volvoxcolonies are ∼500 µm in diameter (Sharma, 2002), whereas thebacterium Thiomargarita namibiensis is ∼100–750 µm (Schulzand Jorgensen, 2001). Yet the extent of this overlap is negligi-ble compared to the maximum scope size achievable by fungi,plants, and animals. The largest and longest-living organisms haveevolved within Plants and Fungi (Figure 2). However, overall theytend to have smaller budgets than Metazoa. First, they are ses-sile, which means they do not incur the high metabolic costsof motility characteristic of the highly mobile and far-rangingMetazoa (Datasheet S1 in Supplementary Material). Second, vac-uoles can occupy up to 80% of cell volume in Plants and Fungi,yet they comprise a very small fraction of a cell’s metabolicbudget (Miller, 1938; Klionsky et al., 1990; Veses et al., 2008),further reducing the metabolic costs. Third, Plants and Fungiadopt extended shapes of thin flat sheets and long filaments,which accommodate their absorptive mode of nutrient consump-tion (as opposed to the metazoan engulfment). This means theycan span the same space and have the same surface area but lessmass, compared to animals. Smaller mass concurrently results insmaller metabolic cost for the same body exposure to the ele-ments, and therefore smaller budget. Additionally, the absorptiveconsumption creates the problem of local nutrient depletion inthe environment immediately adjacent to a hypha or a root, whichcan limit the rate of matter-energy influx down to the rate ofdiffusion. Finally, the nutrients consumed by Plants and Fungido not tend to yield as much matter-energy as those consumedby Metazoa. Fungi lead saprotrophic lifestyles, spending signifi-cant time within oxygen-poor substrates. These organisms makeextensive use of fermentation, which is considerably less efficientthan aerobic respiration characteristic of Metazoa (White, 2000).Plant photosynthesis is efficient compared to fermentation andaerobic respiration (Allen et al., 2011), but has a low yield pernutrient particle. Productivity is higher, the greater the influx of
photons. Indeed, the incident number of light particles per unitarea of an individual can be much higher compared to glucose,due to its molecular size and environmental distribution. How-ever, this does not significantly improve nutrient availability forplants. First, only a fraction of total spectrum of solar radiation isphotosynthetically active. Second, illuminance is subject to consid-erable variation annually (Papaioannou et al., 1993; Byun and Cho,2006), diurnally (Wang et al., 2005), and due to cloudiness andovershadowing by objects (Young and Smith, 1983). Thus, whileplants regularly receive some light every day, the exact amountcan be highly variable, from fairly little (e.g., in forest understory)to saturation. The matter-energy flux achievable by plants is alsoconstrained by the fact that their various nutrients are not co-localized: light and CO2 must be obtained from above ground,but water and minerals from below ground. Combining all thesefactors together, we placed the kingdoms of Plants and Fungi inthe budgetary stratum between Protista and Metazoa (Figure 3,left).
Metazoan nutrition consists, with very rare exceptions (Pierceet al., 1996; Danovaro et al., 2010), exclusively of other organ-isms, be they live (predation, grazing), or dead (saprotrophy).Predation provides the greatest matter-energy yield using theknown biochemical pathways. First, large amounts of energy canbe extracted efficiently using aerobic respiration on organic mate-rial (White, 2000). Second, organic substances can simultaneouslyserve as sources of carbon and energy. Finally, Metazoa engulffood in large quantities, sometimes much bigger than their ownbody (e.g., boa constrictors, Owen, 1866). Consequently, Meta-zoa tend to process large fluxes of matter-energy, as evidenced bytheir nutrition alone. Many other factors associated with preda-tory lifestyle increase budgets of Metazoa far beyond those ofother kingdoms. Speed and endurance (useful for both preda-tors and prey) are determined by muscle performance, which istemperature-dependent. Homeothermy quite possibly evolved toprovide the thermal conditions necessary for better muscle perfor-mance (Bennett, 1985; Carrier, 1987), but is maintained at highmetabolic cost (Bennett and Ruben, 1979; Robinson et al., 1983).In addition to elevated temperature, increased running speedrequires elevated oxygen consumption (McMahon and Bonner,1983). Greater mass in mammals permits larger mitochondrial andcapillary volumes, which improves oxygen supply to locomotorymusculature (McMahon and Bonner, 1983; Weibel et al., 2004), atthe cost of higher metabolic rate. Finally, the skeleton is essentialfor maintenance of high motility speeds, as it provides attachmentpoints for muscles, stores elastic energy, transmits forces from thelimbs, and helps ventilate lungs (Koob and Long, 2000). The stressimposed by motile activities upon the skeleton results in structuralcosts. This stress is reflected even in the chemical composition ofthe skeleton, which in vertebrates evolved to be dominated by cal-cium phosphate (instead of calcium carbonate used by the rest ofMetazoa) to withstand dissolution due to systemic acidosis causedby intense muscular activity (Ruben and Bennet, 1987).
We can represent kingdoms in a cartoon form as cloudsof different lineages that comprise them, aligned in order ofincreasing budget (Figure 3, left). In this representation, thekingdoms form overlapping strata along the budgetary axis, sup-ported by the data on metabolic rate, structural costs, spatial
Frontiers in Genetics | Systems Biology February 2013 | Volume 4 | Article 16 | 6
Yafremava et al. A framework of economy, flexibility, and robustness
scope size, and lifespan. Some kingdoms remain unresolvedwithin their strata, such that they appear in the following order:Archaea-Bacteria < Protista < Fungi-Plants < Metazoa.
PATTERNS OF FLEXIBILITYShort of enumerating all the flexibility mechanisms, it would bedifficult to prove that one organism is more flexible than another.However, we defined relative flexibility by the number of signalsan organism can use to exploit, avoid or adapt to an environmen-tal change. Thus, we can make a reasonable case by integratingthe comparisons of scope content characteristic of organisms ineach kingdom, with the most obvious features of flexibility. Weillustrate this in Figure 3 (right panel) by adding the informationprocessing dimension to the budgetary axis.
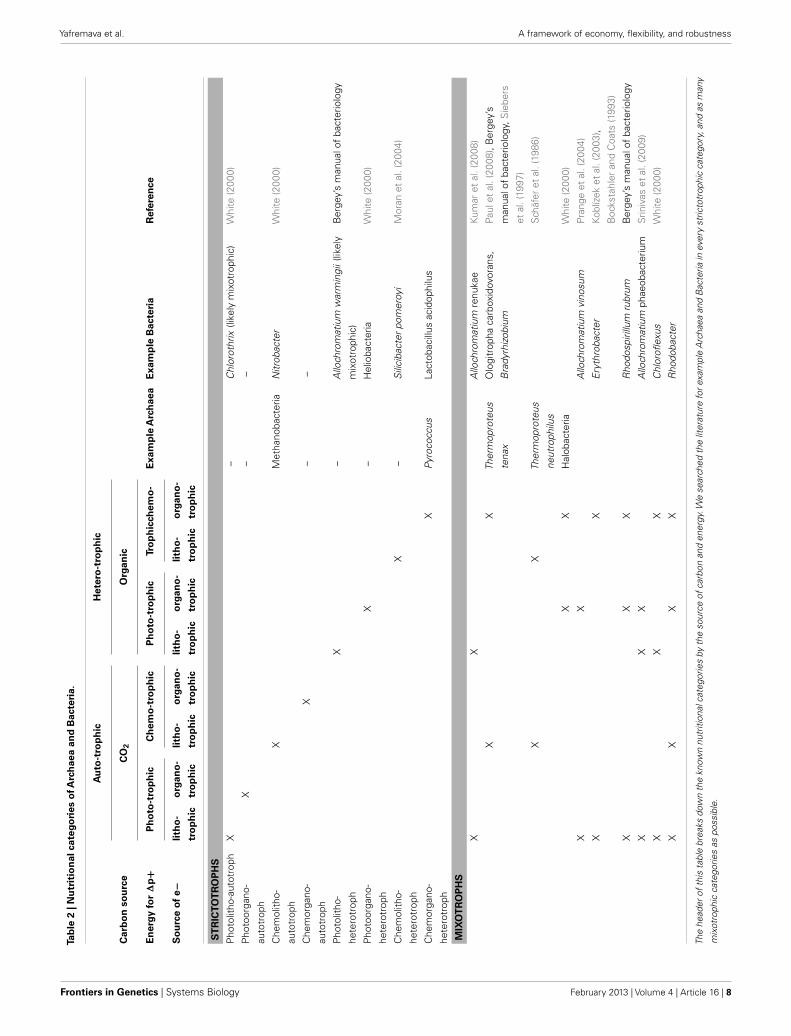
Akarya clearly have the smallest scope size. Most environmen-tal signals vary at spatio-temporal scales significantly greater thanthat of the Akarya and thus appear constant through their scopewindow. Social and nutritive chemical signals are an importantexception: akarya can detect binding of a single molecule, andalter their behavior numerous times throughout the life dependingon the chemical signals they receive. The most obvious differ-ence between bacterial and archaeal scope content seems to liein their nutrition. Archaea prefer energy-stressed environments(Valentine, 2007), where matter-energy yield of nutrients is lowand growth is slow. Bacteria are present in almost all niches whereArchaea are present, but not the other way around. Many bacterialspecies are exposed to and subsist on substantially more nutri-tious elements (White, 2000). They likely process greater fluxesof matter-energy and have bigger budgets than Archaea. This isillustrated in Figure 3 (right) by contracting the Archaeal cloudand stretching the Bacterial cloud along the budgetary axis. Inaddition, the stressed environments favored by Archaea tend tobe fairly stable, such as when stagnant sediments become anoxic,or when still ponds evaporate. Archaea tend to be largely absentfrom the more variable environments (we describe the examplesand argue this point in detail in Datasheet S2 in SupplementaryMaterial). Thus, Archaea appear to have sparser scope and areexposed to fewer signals and less information than Bacteria. Con-sequently, they are likely to evolve fewer flexibility mechanismsthan Bacteria. In contrast, many bacteria are mixotrophic, ableto switch between nutrients depending on their availability in theenvironment (Oren, 2006). These Bacteria are flexible with respectto nutrient kinds and availability. For example, Rhodopseudomonaspalustris can use thiosulfate, hydrogen gas, sulfur compounds,and possibly CO and formate as electron donors in respiration(Larimer et al., 2004). Rhodopseudomonas sp. can use lactate,lamate, butyrate, or acetate as sources of carbon (Barbosa et al.,2001). Allochromatium vinosum is able to use hydrogen, sulfide,thiosulfate, sulfur, and sulfite as electron donors, and formate,propionate, furamate, succinate, malate, and glyconate as sourcesof carbon (Kumar et al., 2008). These Bacteria must process theinformation associated with the changing nutrient content of theenvironment. We found no examples of such metabolic flexi-bility (and metabolic information processing) among archaeons.Table 2 gives examples of archaeal and bacterial species for eachstrictotrophic and a number of mixotrophic categories. It demon-strates the greater metabolic diversity of the bacterial kingdom as
a whole, compared to Archaea. This was illustrated in Figure 3(right) by rotating and stretching the bacterial cloud further alongthe information flux axis, compared to the archaeal cloud. Thus,we separated Bacteria and Archaea within their budgetary stratum.
Protista are substantially more flexible than Akarya. In addi-tion to manipulating chemical stimuli, they can process gradientsof light, while Akarya can only tell light from dark (Sackett et al.,1997). Metabolic flexibility in Protista is limited to photoorgan-otrophy. However, they make up for it with other diverse behaviors.Complex, coordinated ciliary, and flagellar beating, modulated bya number of chemical and light stimuli, yields steered locomotion(Jahn and Votta, 1972; Laybourn-Parry, 1984). Many protists, bothfree-living and parasitic, have complex lifecycles, where each stephas its own scope, and the transitions between them can be regu-lated by a number of environmental signals (e.g., in Plasmodium,Dictyostellium, Trypanosoma, and diatoms). We illustrate Protistaas a cloud that overlaps with Akarya but stretches noticeably alongthe information flux axis (Figure 3, right).
Separating fungi from plants was complicated, as their envi-ronmental niches largely overlap. However, we noticed that theseniches appeared different through the scope window of the organ-isms themselves. Specifically, scope density is greater for Fungithan Plants due to the nature of their nutrient sources. Plantsuse light – a periodically available nutrient. If a plant can survivethrough the night, nutrients will be available again in the morning.Fungi are saprotrophs and generally consume dead organic mat-ter, which can be in fairly steady supply under dense vegetationdue to regular shedding of leaves. Outside of that, dead organ-isms are not renewable sources of nutrients. The food for Fungiis therefore more ephemeral than food for plants, and therefore itcontributes more information to the fungal scope window (Boddy,1999). Soil fungi constantly explore their environment by degrad-ing starved hyphae and moving the material into those that areactively growing. Thereby the mycelium essentially relocates awayfrom unproductive habitats (Bessey, 1950; Alexopoulos and Mims,1979; Pollack et al., 2008). This is a complex behavior driven by anumber of signals from soil and within the hyphae. It is evidenceof flexibility. Plant roots also move through the soil in search ofbetter substrate. However, “whole organism relocation” does notseem to be their innate feature. We illustrate these differences bystretching the fungal cloud along the information flux axis, similarto the case of Archaea-Bacteria separation (Figure 3, right).
Metazoa as a kingdom have the widest spatial dimension ofscope, which for some species encompasses spatial variationson a tremendous scale. Traversing environmental gradients, fre-quently at high speeds (Figure 2) is the trademark of metazoanlifestyle, which endows them with rich, dense scope content. Theyshuttle through steep thermal and chemical gradients across thelandscapes of oceanic and continental vents, sometimes invad-ing areas dangerously close to their thermal death point (Brues,1927; Mason, 1939; VanDover et al., 2002; Kelley et al., 2005;Tarasov et al., 2005). They traverse wide ranges of thermal, aer-obic, and pressure gradients during diving and vertical migrationin the ocean (Carey and Scharold, 1990; Takami et al., 1997;Hooker and Baird, 1999; Smith and Brown, 2002; Pearre, 2003;Rex et al., 2006; Jamieson et al., 2009). They process much ofthis information using sophisticated multicellular sensory organs.
www.frontiersin.org February 2013 | Volume 4 | Article 16 | 7
Yafremava et al. A framework of economy, flexibility, and robustness
Tab
le2
|Nu
trit
ion
alca
tego
ries
ofA
rch
aea
and
Bac
teri
a.
Au
to-t
rop
hic
Het
ero
-tro
ph
ic
Car
bo
nso
urc
eC
O2
Org
anic
En
ergy
for
∆p+
Ph
oto
-tro
ph
icC
hem
o-t
rop
hic
Ph
oto
-tro
ph
icTr
op
hic
chem
o-
Exa
mp
leA
rch
aea
Exa
mp
leB
acte
ria
Ref
eren
ce
So
urc
eo
fe−
lith
o-
tro
ph
ic
org
ano
-
tro
ph
ic
lith
o-
tro
ph
ic
org
ano
-
tro
ph
ic
lith
o-
tro
ph
ic
org
ano
-
tro
ph
ic
lith
o-
tro
ph
ic
org
ano
-
tro
ph
ic
ST
RIC
TOT
RO
PH
S
Pho
tolit
ho-a
utot
roph
X–
Chl
orot
hrix
(like
lym
ixot
roph
ic)
Whi
te(2
000)
Pho
toor
gano
-
auto
trop
h
X–
–
Che
mol
itho-
auto
trop
h
XM
etha
noba
cter
iaN
itrob
acte
rW
hite
(200
0)
Che
mor
gano
-
auto
trop
h
X–
–
Pho
tolit
ho-
hete
rotr
oph
X–
Allo
chro
mat
ium
war
min
gii
(like
ly
mix
otro
phic
)
Ber
gey’
sm
anua
lof
bact
erio
logy
Pho
toor
gano
-
hete
rotr
oph
X–
Hel
ioba
cter
iaW
hite
(200
0)
Che
mol
itho-
hete
rotr
oph
X–
Sili
ciba
cter
pom
eroy
iM
oran
etal
.(20
04)
Che
mor
gano
-
hete
rotr
oph
XP
yroc
occu
sLa
ctob
acill
usac
idop
hilu
s
MIX
OT
RO
PH
S
XX
Allo
chro
mat
ium
renu
kae
Kum
aret
al.(
2008
)
XX
Ther
mop
rote
us
tena
x
Olo
gitr
opha
carb
oxid
ovor
ans,
Bra
dyrh
izob
ium
Paul
etal
.(20
08),
Ber
gey’
s
man
ualo
fba
cter
iolo
gy,S
iebe
rs
etal
.(19
97)
XX
Ther
mop
rote
us
neut
roph
ilus
Sch
äfer
etal
.(19
86)
XX
Hal
obac
teria
Whi
te(2
000)
XX
Allo
chro
mat
ium
vino
sum
Pran
geet
al.(
2004
)
XX
Ery
thro
bact
erKo
blíz
eket
al.(
2003
),
Boc
ksta
hler
and
Coa
ts(1
993)
XX
XR
hodo
spiri
llum
rubr
umB
erge
y’s
man
ualo
fba
cter
iolo
gy
XX
XA
lloch
rom
atiu
mph
aeob
acte
rium
Srin
ivas
etal
.(20
09)
XX
XC
hlor
oflex
usW
hite
(200
0)
XX
XX
Rho
doba
cter
The
head
erof
this
tabl
ebr
eaks
dow
nth
ekn
own
nutr
ition
alca
tego
ries
byth
eso
urce
ofca
rbon
and
ener
gy.W
ese
arch
edth
elit
erat
ure
fore
xam
ple
Arc
haea
and
Bac
teria
inev
ery
stric
totr
ophi
cca
tego
ry,a
ndas
man
y
mix
otro
phic
cate
gorie
sas
poss
ible
.
Frontiers in Genetics | Systems Biology February 2013 | Volume 4 | Article 16 | 8
Yafremava et al. A framework of economy, flexibility, and robustness
Organisms throughout almost the entire Metazoan clade processvisual, tactile, auditory, chemical, olfactory, and gravitational sig-nals (Dusenbery, 1992). Clearly, the diversity among metazoanspecies is tremendous. Most will agree that earthworms proba-bly process fewer signals than lions, and exhibit fewer behaviors.However, the extent to which flexibility has evolved in this king-dom trumps all others. Man transcended the capabilities of hisown body by using tools and devices that allow him to explore thedeepest trenches of the sea, climb the tallest mountains, and flythrough the air and into space! We illustrated this propensity forevolving flexibility by stretching the metazoan cloud far across theinformation flux axis (Figure 3, right).
What makes metazoan information processing particularlyinteresting is that they make heavy use of the correlation betweendifferent physical signals that are generated by the same source. Forexample, ground surface temperature and illuminance are corre-lated. Temperature and pH in the same location of a geothermalpond are correlated. This makes it possible to use one signal (a“proxy”) to make predictions about another, enabling the flexibleMetazoa to clamp some of the “important” signals (like tempera-ture) in their optimum range, by using proxy signals to generatethe necessary responses. For example, migratory animals cross awide range of latitudes, and could potentially be exposed to a widerange of temperatures, as expected from the local seasonal vari-ations. However, those animals do not wait for the temperaturevariations to arrive before they migrate away from the affectedarea. They use proxy signals, such as the changes in diurnal illu-mination patterns, to detect the imminent arrival of the climaticchange, and move out before it happens. These organisms evolveto be exposed only to a fraction of all temperatures that can poten-tially occur within their scope size. The use of proxies is facilitatedby the large size of metazoan bodies, which literally serve as spa-tial projection palettes for the diverse patterns of proxy signals,thereby enabling a larger fraction of umwelt in the scope.
PATTERNS OF ROBUSTNESSComparing organisms in terms of robustness is more difficult thancomparing them in terms of flexibility. A mechanism of flexibil-ity is frequently readily observable, because it works by incurringchange within the organism. In contrast, robustness against a sig-nal is expressed without a response. Consequently, metrics areneeded that could serve as reasonable indicators of robustness.Two such metrics seem obvious. One metric is resistance to dam-age of internal parts and processes. For example, thicker bones areless vulnerable against physical damage than thinner bones. Theother metric is the redundancy of internal parts and processes. Anorganism can carry on after damage to some of its components, ifredundant copies are available to take over their function.
It is easy to compare the six kingdoms based on redundancy,including nutrient storage, genetic redundancy, redundancy ofmicroscopic cellular parts, and macroscopic body parts. Storageof nutrients increases robustness of organisms against nutrientshortages. It is used by organisms in all kingdoms but is promi-nent in most Plants and Fungi, whose vacuoles and specializedtissues serve as containers for a number of useful nutrient sub-strates (Klionsky et al., 1990; Courties et al., 1994; Nordoy et al.,1995; Marty, 1999; Misumi et al., 2005; Lecointre and Le Guyader,
2006). This is essential to Plants and Fungi; they are sessile andunable to actively search for food. However, Plants and Fungi alsouse vacuoles for other functions: plants to increase robustness,fungi to increase flexibility. Plant vacuoles enhance robustnessagainst damages by ultraviolet light, by absorbing it with the vac-uolar solutes. In mycelial fungi, an extensive system of vacuolesconnects hyphae across the mycelia (Veses et al., 2008), and canbe used to transport stored nutrients from the satiated hyphae tothose transiently in need of nutrients (Bessey, 1950; Alexopoulosand Mims, 1979). When a fungal colony is starved, the vacuolesswell with products of decomposition of the older part of themycelium, which then are transported to the apical tip to enablegrowth (Pollack et al., 2008). This flexible use of vacuoles in fungireflects the disturbed nature of fungal nutrient sources, as well asfungal propensity to “forage” underground.
Genetic redundancy, such as polyploidy, genomic repeats, andmultiple gene copies, helps organisms withstand the effects ofdetrimental mutations. While a few gene copies may be damaged,other copies will remain functional, making the organism robustagainst mutation (Comai, 2005). Polyploidy is very prominentin plants (estimated 30–80% species, Otto and Whitton, 2000)and multinucleate fungi. However, again its use in the two king-doms is different. In multinucleated fungi, one hyphal cell canharbor up to hundreds of nuclei (Alexopoulos and Mims, 1979).These nuclei can independently divide, mutate, and move betweenhyphae through perforations in the septa. Fungal nuclei can evenmove between two genetically distinct mycelia through hyphalanastomoses, transporting genetic material to new locations andlocally generating new phenotypes (Gladfelter, 2006; Croll et al.,2009). Thus, in addition to the robustness benefits, fungal poly-ploidy promotes genetic flexibility. Genetic redundancy is lessprominent in Metazoa than Plants and Fungi, and even less soin Akarya and Protista. Interestingly, in Bacteria the genes presentin high copy numbers are usually the highly expressed genes thathelp increase the throughput of matter-energy and informationprocessing channels by providing multiple copies of the internalsubsystems that can work in parallel (Freeman et al., 2006; Popescoet al., 2006). Thus, individuals can match their speed of response tothe rate of signal change within a dense scope, or amplify their pro-ductivity when nutrients are highly abundant. In other words, highgene copy numbers can make an individual robust with respect tothe rate of scope signal change.
Finally, component part redundancy improves robustnessagainst damage to those parts. The only component part redun-dancy available to unicells is the use of multiple copies of proteinsor protein complexes. Multicellular organisms can build organsout of redundant cells, or build redundant body parts (e.g., limbs).The greater is the specialization of cell types and the less reversiblethe differentiation, the less robustness is imparted onto the indi-vidual by the redundancy of cells or organismal parts. Such isthe case of Metazoa, where only the lowest forms (e.g., Hydra,worms) can continue functioning after parts of their body havebeen destroyed (Randolph, 1897; Morgan, 1901). In the wild, lossof even a single limb by a higher animal is usually fatal, despitesome ability for organ regeneration (Yannas, 2001). Fungi andPlants, on the contrary, stand out due to their redundant and rel-atively independent leaves, branches (Gill et al., 1995), hyphae
www.frontiersin.org February 2013 | Volume 4 | Article 16 | 9
Yafremava et al. A framework of economy, flexibility, and robustness
(Alexopoulos and Mims, 1979), and even genetically identicalramets within a genet. Plant and fungal individuals are robustto the loss of a substantial number of these “limbs.” Regrowth, asa rule, occurs after loss of a branch or a hypha, and is a flexibilitymechanism.
These observations point to a pattern: Fungi and Plants aremore robust to damage compared to organisms from other king-doms, at least based on the metric of redundancy. Fungi tendto use the same redundant feature in a more flexible way thanPlants, consistent with our previous observations. Elsewhere inthis section we established that Metazoa are distinctly more flex-ible than the other kingdoms, while unicellular organisms havesmallest budget – are most economical.
THE PERSISTENCE STRATEGY HYPOTHESISThe data presented in the previous section indicate that organismswith a particular propensity toward low budget (greater econ-omy), flexibility, or robustness tend to segregate based on thesizes of matter-energy and information fluxes they process. Asa result, the organism clouds in Figure 3 (right) form a trian-gular shape with vertices corresponding to microbes (economy),Plants/Fungi (robustness), and Metazoa (flexibility). This segre-gation motivates the hypothesis that tradeoffs operate betweeneconomy, robustness, and flexibility. One such tradeoff is betweenmechanisms by which organisms control the balance betweenthe rates of death and birth in a population. This balance iscritical for persistence of a lineage in the context of competi-tion within a variable and potentially hazardous environment(Begon et al., 2006). Flexibility and robustness help decrease deathrates by means of withstanding, adapting, or avoiding adver-sarial environments, and locating beneficial ones. On the otherhand, these strategies also cost matter and energy, which oth-erwise could be spent toward growth and reproduction. Conse-quently, greater flexibility and robustness result in lower birthrates. So long as births and deaths are in balance, the lineagepersists. Less flexibility and/or robustness frees up matter-energyto achieve faster reproduction. This indeed becomes necessary,since the environmental disturbance now is less predictable, lessavoidable, and less endurable by individuals, which as a resultdie at a greater rate. Thus, together flexibility and robustnessare in a tradeoff with economy. An organism’s evolved balanceamong economy, flexibility, and robustness reflects its particu-lar method of persistence, and is of fundamental importance.It corresponds to a particular location on the triangle of organ-isms in Figure 3 (right), which we therefore call the “persistencetriangle.”
Flexibility and robustness are also in a tradeoff relationshipwith one another, because they compete for matter, energy, andspace within the organism. Matter-energy is required to power theparts and the processes that bring forth flexible responses. Yet itis also needed to manufacture and maintain features that conferrobustness, such as the redundant internal parts. For this reason,an evolutionary increase in flexibility may lead to sacrifices inrobustness, if the budget is maintained, and vice versa. In the nextsection, we explore which molecular features are correlated withflexibility, in the effort to corroborate this tradeoff.
MOLECULAR ARCHITECTURE AND FLEXIBILITYFlexibility is measured as the number of responses to external sig-nals, which is likely to increase with the number of different inter-nal processes possible within the organism. In turn, the number ofinternal processes likely increases with the diversity of the organ-ism’s basic internal components (e.g., cells, molecules, cellular, andmolecular parts) and the number of combinations (e.g., multi-part molecules, multi-molecular complexes, networks) that canbe put together out of those components. One molecular estimateof internal part diversity is the number of distinct fold superfam-ilies (FSFs) encoded in the organism’s genome (Caetano-Anolléset al., 2009; Mittenthal et al., 2012). FSFs are groups of familiesof protein domains that have similar three-dimensional structuresand molecular functions, though they may have low identities atthe level of protein sequences (Murzin et al., 1995; Chothia andGough, 2009). The number of FSF is finite and is not expected toexceed much more than∼2,000 (Levitt, 2009). Statistics of FSFs ingenomes are indicative of evolutionary and physiological tenden-cies of organisms (Caetano-Anollés and Caetano-Anollés, 2005).Thus, FSFs can be viewed as low-level protein building blocks forphysiology.
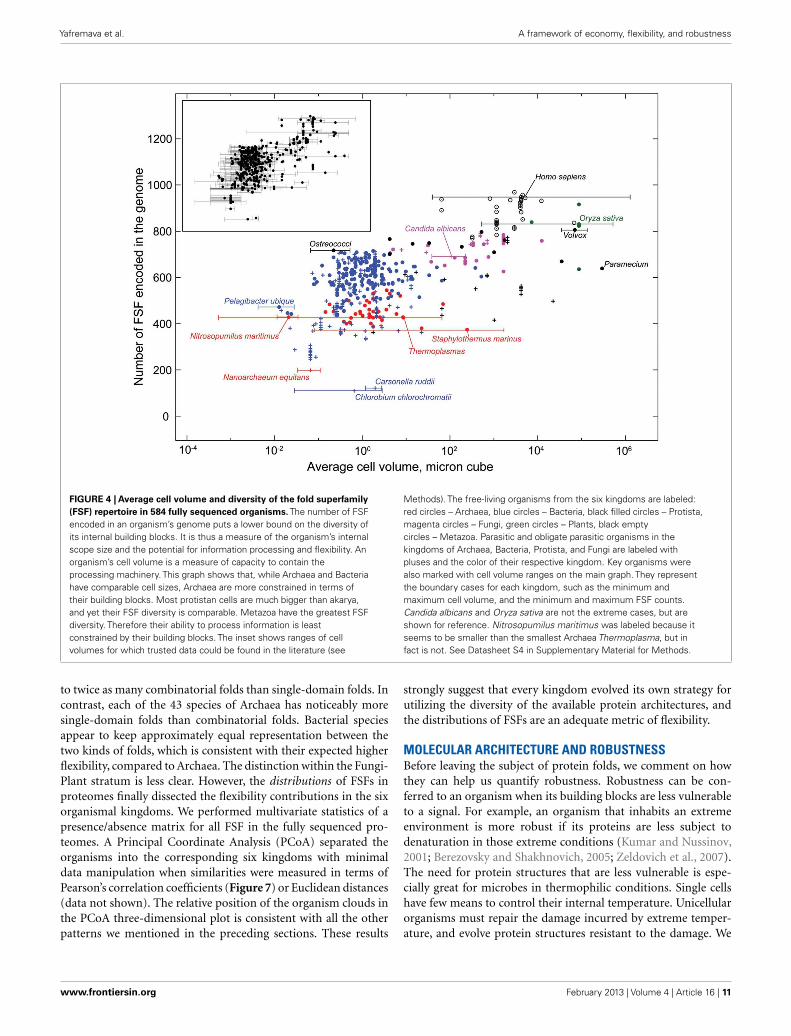
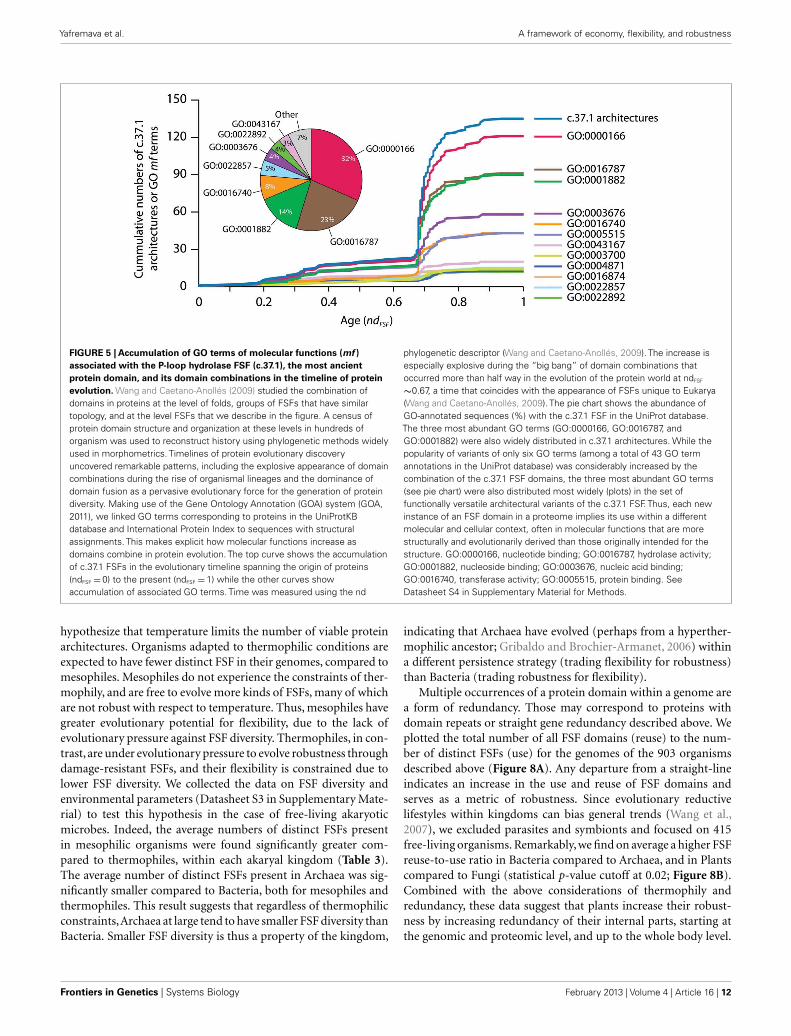
We used data from fully sequenced organisms to evaluatewhether FSF diversity is a good correlate of flexibility. We plot-ted the total number of distinct FSFs against characteristic cellvolume in Figure 4 (see also Datasheet S3 in Supplementary Mate-rial). Cell volume correlates with the cellular capacity to containthe machinery for processing matter-energy and information andis indicative of cellular budget. The resultant grouping of organ-isms turned out to be very similar to that in Figure 3 (right),suggesting that FSF diversity can serve as an approximation ofan organism’s information flux. However, the number of FSFsis limited, and that constrains the complexity of an organism’sphysiology built with single-domain proteins alone, even thoughthe number of possible protein structures is very high (Andreevaand Murzin, 2010). Use of multi-domain proteins dramaticallyexpands the diversity of protein organization and the diversity ofassociated biological functions (Bashton and Chothia, 2007). Eachnew instance of an FSF domain in a proteome implies its use withina different molecular and cellular context. Often the domain isused in molecular functions that are more structurally and evo-lutionarily derived than those originally intended for it. Figure 5illustrates this fact with a structural and functional analysis of theP-loop hydrolase FSF, the most ancient domain structure in theprotein world. Can the number of domain combinations serve asa better correlate of flexibility? Wang and Caetano-Anollés (2009)studied the combination of domains in proteins at the level ofFSFs and folds (groups of FSFs that have similar topology). Theyshowed that some folds participate only in single-domain proteins(single-domain folds) and some only in multi-domain proteins(combinatorial folds). We made use of their published data toshow that organismal kingdoms have different preferences for thebalance between using single-domain and combinatorial folds forfree-living species (Figure 6). The data show that organisms fromthe more flexible kingdoms tend to have more combinatorial foldsthan single-domain folds. This is the case for all Metazoa that havebeen fully sequenced by 2008 (22 animals). Some animals use up
Frontiers in Genetics | Systems Biology February 2013 | Volume 4 | Article 16 | 10
Yafremava et al. A framework of economy, flexibility, and robustness
FIGURE 4 | Average cell volume and diversity of the fold superfamily(FSF) repertoire in 584 fully sequenced organisms. The number of FSFencoded in an organism’s genome puts a lower bound on the diversity ofits internal building blocks. It is thus a measure of the organism’s internalscope size and the potential for information processing and flexibility. Anorganism’s cell volume is a measure of capacity to contain theprocessing machinery. This graph shows that, while Archaea and Bacteriahave comparable cell sizes, Archaea are more constrained in terms oftheir building blocks. Most protistan cells are much bigger than akarya,and yet their FSF diversity is comparable. Metazoa have the greatest FSFdiversity. Therefore their ability to process information is leastconstrained by their building blocks. The inset shows ranges of cellvolumes for which trusted data could be found in the literature (see
Methods). The free-living organisms from the six kingdoms are labeled:red circles – Archaea, blue circles – Bacteria, black filled circles – Protista,magenta circles – Fungi, green circles – Plants, black emptycircles – Metazoa. Parasitic and obligate parasitic organisms in thekingdoms of Archaea, Bacteria, Protista, and Fungi are labeled withpluses and the color of their respective kingdom. Key organisms werealso marked with cell volume ranges on the main graph. They representthe boundary cases for each kingdom, such as the minimum andmaximum cell volume, and the minimum and maximum FSF counts.Candida albicans and Oryza sativa are not the extreme cases, but areshown for reference. Nitrosopumilus maritimus was labeled because itseems to be smaller than the smallest Archaea Thermoplasma, but infact is not. See Datasheet S4 in Supplementary Material for Methods.
to twice as many combinatorial folds than single-domain folds. Incontrast, each of the 43 species of Archaea has noticeably moresingle-domain folds than combinatorial folds. Bacterial speciesappear to keep approximately equal representation between thetwo kinds of folds, which is consistent with their expected higherflexibility, compared to Archaea. The distinction within the Fungi-Plant stratum is less clear. However, the distributions of FSFs inproteomes finally dissected the flexibility contributions in the sixorganismal kingdoms. We performed multivariate statistics of apresence/absence matrix for all FSF in the fully sequenced pro-teomes. A Principal Coordinate Analysis (PCoA) separated theorganisms into the corresponding six kingdoms with minimaldata manipulation when similarities were measured in terms ofPearson’s correlation coefficients (Figure 7) or Euclidean distances(data not shown). The relative position of the organism clouds inthe PCoA three-dimensional plot is consistent with all the otherpatterns we mentioned in the preceding sections. These results
strongly suggest that every kingdom evolved its own strategy forutilizing the diversity of the available protein architectures, andthe distributions of FSFs are an adequate metric of flexibility.
MOLECULAR ARCHITECTURE AND ROBUSTNESSBefore leaving the subject of protein folds, we comment on howthey can help us quantify robustness. Robustness can be con-ferred to an organism when its building blocks are less vulnerableto a signal. For example, an organism that inhabits an extremeenvironment is more robust if its proteins are less subject todenaturation in those extreme conditions (Kumar and Nussinov,2001; Berezovsky and Shakhnovich, 2005; Zeldovich et al., 2007).The need for protein structures that are less vulnerable is espe-cially great for microbes in thermophilic conditions. Single cellshave few means to control their internal temperature. Unicellularorganisms must repair the damage incurred by extreme temper-ature, and evolve protein structures resistant to the damage. We
www.frontiersin.org February 2013 | Volume 4 | Article 16 | 11
Yafremava et al. A framework of economy, flexibility, and robustness
FIGURE 5 | Accumulation of GO terms of molecular functions (mf )associated with the P-loop hydrolase FSF (c.37.1), the most ancientprotein domain, and its domain combinations in the timeline of proteinevolution. Wang and Caetano-Anollés (2009) studied the combination ofdomains in proteins at the level of folds, groups of FSFs that have similartopology, and at the level FSFs that we describe in the figure. A census ofprotein domain structure and organization at these levels in hundreds oforganism was used to reconstruct history using phylogenetic methods widelyused in morphometrics. Timelines of protein evolutionary discoveryuncovered remarkable patterns, including the explosive appearance of domaincombinations during the rise of organismal lineages and the dominance ofdomain fusion as a pervasive evolutionary force for the generation of proteindiversity. Making use of the Gene Ontology Annotation (GOA) system (GOA,2011), we linked GO terms corresponding to proteins in the UniProtKBdatabase and International Protein Index to sequences with structuralassignments. This makes explicit how molecular functions increase asdomains combine in protein evolution. The top curve shows the accumulationof c.37.1 FSFs in the evolutionary timeline spanning the origin of proteins(ndFSF =0) to the present (ndFSF =1) while the other curves showaccumulation of associated GO terms. Time was measured using the nd
phylogenetic descriptor (Wang and Caetano-Anollés, 2009). The increase isespecially explosive during the “big bang” of domain combinations thatoccurred more than half way in the evolution of the protein world at ndFSF
∼0.67, a time that coincides with the appearance of FSFs unique to Eukarya(Wang and Caetano-Anollés, 2009). The pie chart shows the abundance ofGO-annotated sequences (%) with the c.37.1 FSF in the UniProt database.The three most abundant GO terms (GO:0000166, GO:0016787, andGO:0001882) were also widely distributed in c.37.1 architectures. While thepopularity of variants of only six GO terms (among a total of 43 GO termannotations in the UniProt database) was considerably increased by thecombination of the c.37.1 FSF domains, the three most abundant GO terms(see pie chart) were also distributed most widely (plots) in the set offunctionally versatile architectural variants of the c.37.1 FSF. Thus, each newinstance of an FSF domain in a proteome implies its use within a differentmolecular and cellular context, often in molecular functions that are morestructurally and evolutionarily derived than those originally intended for thestructure. GO:0000166, nucleotide binding; GO:0016787, hydrolase activity;GO:0001882, nucleoside binding; GO:0003676, nucleic acid binding;GO:0016740, transferase activity; GO:0005515, protein binding. SeeDatasheet S4 in Supplementary Material for Methods.
hypothesize that temperature limits the number of viable proteinarchitectures. Organisms adapted to thermophilic conditions areexpected to have fewer distinct FSF in their genomes, compared tomesophiles. Mesophiles do not experience the constraints of ther-mophily, and are free to evolve more kinds of FSFs, many of whichare not robust with respect to temperature. Thus, mesophiles havegreater evolutionary potential for flexibility, due to the lack ofevolutionary pressure against FSF diversity. Thermophiles, in con-trast, are under evolutionary pressure to evolve robustness throughdamage-resistant FSFs, and their flexibility is constrained due tolower FSF diversity. We collected the data on FSF diversity andenvironmental parameters (Datasheet S3 in Supplementary Mate-rial) to test this hypothesis in the case of free-living akaryoticmicrobes. Indeed, the average numbers of distinct FSFs presentin mesophilic organisms were found significantly greater com-pared to thermophiles, within each akaryal kingdom (Table 3).The average number of distinct FSFs present in Archaea was sig-nificantly smaller compared to Bacteria, both for mesophiles andthermophiles. This result suggests that regardless of thermophilicconstraints,Archaea at large tend to have smaller FSF diversity thanBacteria. Smaller FSF diversity is thus a property of the kingdom,
indicating that Archaea have evolved (perhaps from a hyperther-mophilic ancestor; Gribaldo and Brochier-Armanet, 2006) withina different persistence strategy (trading flexibility for robustness)than Bacteria (trading robustness for flexibility).
Multiple occurrences of a protein domain within a genome area form of redundancy. Those may correspond to proteins withdomain repeats or straight gene redundancy described above. Weplotted the total number of all FSF domains (reuse) to the num-ber of distinct FSFs (use) for the genomes of the 903 organismsdescribed above (Figure 8A). Any departure from a straight-lineindicates an increase in the use and reuse of FSF domains andserves as a metric of robustness. Since evolutionary reductivelifestyles within kingdoms can bias general trends (Wang et al.,2007), we excluded parasites and symbionts and focused on 415free-living organisms. Remarkably, we find on average a higher FSFreuse-to-use ratio in Bacteria compared to Archaea, and in Plantscompared to Fungi (statistical p-value cutoff at 0.02; Figure 8B).Combined with the above considerations of thermophily andredundancy, these data suggest that plants increase their robust-ness by increasing redundancy of their internal parts, starting atthe genomic and proteomic level, and up to the whole body level.
Frontiers in Genetics | Systems Biology February 2013 | Volume 4 | Article 16 | 12
Yafremava et al. A framework of economy, flexibility, and robustness
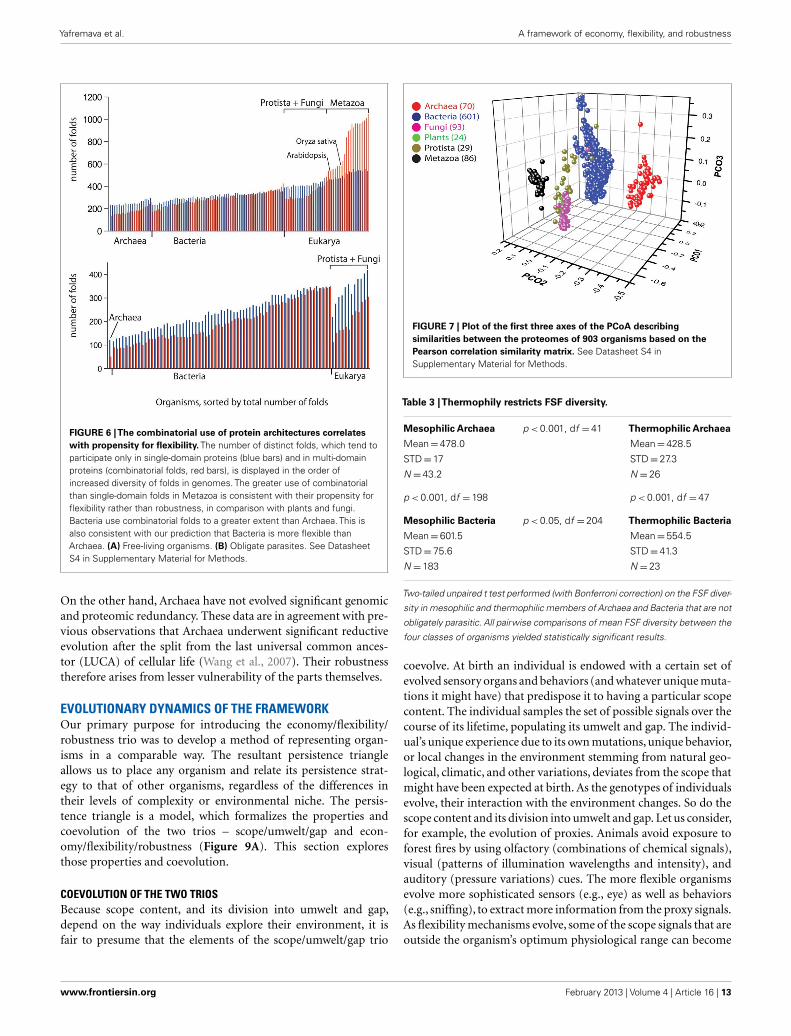
FIGURE 6 |The combinatorial use of protein architectures correlateswith propensity for flexibility. The number of distinct folds, which tend toparticipate only in single-domain proteins (blue bars) and in multi-domainproteins (combinatorial folds, red bars), is displayed in the order ofincreased diversity of folds in genomes. The greater use of combinatorialthan single-domain folds in Metazoa is consistent with their propensity forflexibility rather than robustness, in comparison with plants and fungi.Bacteria use combinatorial folds to a greater extent than Archaea. This isalso consistent with our prediction that Bacteria is more flexible thanArchaea. (A) Free-living organisms. (B) Obligate parasites. See DatasheetS4 in Supplementary Material for Methods.
On the other hand, Archaea have not evolved significant genomicand proteomic redundancy. These data are in agreement with pre-vious observations that Archaea underwent significant reductiveevolution after the split from the last universal common ances-tor (LUCA) of cellular life (Wang et al., 2007). Their robustnesstherefore arises from lesser vulnerability of the parts themselves.
EVOLUTIONARY DYNAMICS OF THE FRAMEWORKOur primary purpose for introducing the economy/flexibility/robustness trio was to develop a method of representing organ-isms in a comparable way. The resultant persistence triangleallows us to place any organism and relate its persistence strat-egy to that of other organisms, regardless of the differences intheir levels of complexity or environmental niche. The persis-tence triangle is a model, which formalizes the properties andcoevolution of the two trios – scope/umwelt/gap and econ-omy/flexibility/robustness (Figure 9A). This section exploresthose properties and coevolution.
COEVOLUTION OF THE TWO TRIOSBecause scope content, and its division into umwelt and gap,depend on the way individuals explore their environment, it isfair to presume that the elements of the scope/umwelt/gap trio
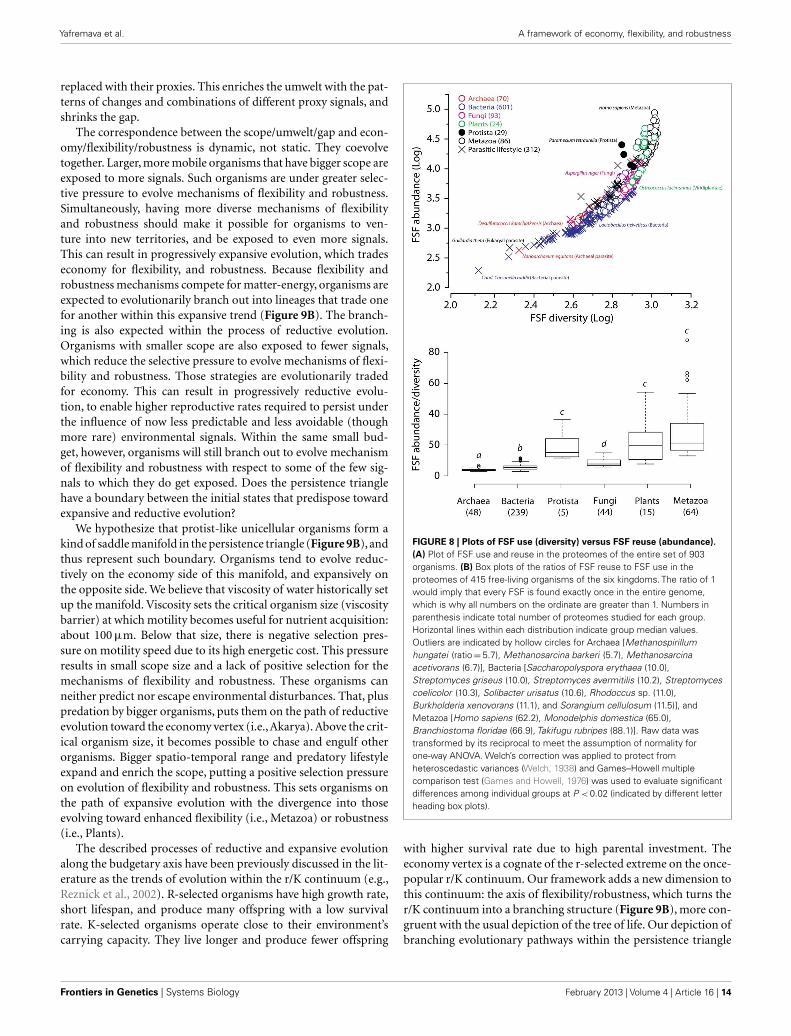
FIGURE 7 | Plot of the first three axes of the PCoA describingsimilarities between the proteomes of 903 organisms based on thePearson correlation similarity matrix. See Datasheet S4 inSupplementary Material for Methods.
Table 3 |Thermophily restricts FSF diversity.
Mesophilic Archaea p < 0.001, df =41 Thermophilic Archaea
Mean=478.0 Mean=428.5
STD=17 STD=27.3
N =43.2 N =26
p < 0.001, df =198 p < 0.001, df =47
Mesophilic Bacteria p < 0.05, df =204 Thermophilic Bacteria
Mean=601.5 Mean=554.5
STD=75.6 STD=41.3
N =183 N =23
Two-tailed unpaired t test performed (with Bonferroni correction) on the FSF diver-
sity in mesophilic and thermophilic members of Archaea and Bacteria that are not
obligately parasitic. All pairwise comparisons of mean FSF diversity between the
four classes of organisms yielded statistically significant results.
coevolve. At birth an individual is endowed with a certain set ofevolved sensory organs and behaviors (and whatever unique muta-tions it might have) that predispose it to having a particular scopecontent. The individual samples the set of possible signals over thecourse of its lifetime, populating its umwelt and gap. The individ-ual’s unique experience due to its own mutations, unique behavior,or local changes in the environment stemming from natural geo-logical, climatic, and other variations, deviates from the scope thatmight have been expected at birth. As the genotypes of individualsevolve, their interaction with the environment changes. So do thescope content and its division into umwelt and gap. Let us consider,for example, the evolution of proxies. Animals avoid exposure toforest fires by using olfactory (combinations of chemical signals),visual (patterns of illumination wavelengths and intensity), andauditory (pressure variations) cues. The more flexible organismsevolve more sophisticated sensors (e.g., eye) as well as behaviors(e.g., sniffing), to extract more information from the proxy signals.As flexibility mechanisms evolve, some of the scope signals that areoutside the organism’s optimum physiological range can become
www.frontiersin.org February 2013 | Volume 4 | Article 16 | 13
Yafremava et al. A framework of economy, flexibility, and robustness
replaced with their proxies. This enriches the umwelt with the pat-terns of changes and combinations of different proxy signals, andshrinks the gap.
The correspondence between the scope/umwelt/gap and econ-omy/flexibility/robustness is dynamic, not static. They coevolvetogether. Larger, more mobile organisms that have bigger scope areexposed to more signals. Such organisms are under greater selec-tive pressure to evolve mechanisms of flexibility and robustness.Simultaneously, having more diverse mechanisms of flexibilityand robustness should make it possible for organisms to ven-ture into new territories, and be exposed to even more signals.This can result in progressively expansive evolution, which tradeseconomy for flexibility, and robustness. Because flexibility androbustness mechanisms compete for matter-energy, organisms areexpected to evolutionarily branch out into lineages that trade onefor another within this expansive trend (Figure 9B). The branch-ing is also expected within the process of reductive evolution.Organisms with smaller scope are also exposed to fewer signals,which reduce the selective pressure to evolve mechanisms of flexi-bility and robustness. Those strategies are evolutionarily tradedfor economy. This can result in progressively reductive evolu-tion, to enable higher reproductive rates required to persist underthe influence of now less predictable and less avoidable (thoughmore rare) environmental signals. Within the same small bud-get, however, organisms will still branch out to evolve mechanismof flexibility and robustness with respect to some of the few sig-nals to which they do get exposed. Does the persistence trianglehave a boundary between the initial states that predispose towardexpansive and reductive evolution?
We hypothesize that protist-like unicellular organisms form akind of saddle manifold in the persistence triangle (Figure 9B),andthus represent such boundary. Organisms tend to evolve reduc-tively on the economy side of this manifold, and expansively onthe opposite side. We believe that viscosity of water historically setup the manifold. Viscosity sets the critical organism size (viscositybarrier) at which motility becomes useful for nutrient acquisition:about 100 µm. Below that size, there is negative selection pres-sure on motility speed due to its high energetic cost. This pressureresults in small scope size and a lack of positive selection for themechanisms of flexibility and robustness. These organisms canneither predict nor escape environmental disturbances. That, pluspredation by bigger organisms, puts them on the path of reductiveevolution toward the economy vertex (i.e.,Akarya). Above the crit-ical organism size, it becomes possible to chase and engulf otherorganisms. Bigger spatio-temporal range and predatory lifestyleexpand and enrich the scope, putting a positive selection pressureon evolution of flexibility and robustness. This sets organisms onthe path of expansive evolution with the divergence into thoseevolving toward enhanced flexibility (i.e., Metazoa) or robustness(i.e., Plants).
The described processes of reductive and expansive evolutionalong the budgetary axis have been previously discussed in the lit-erature as the trends of evolution within the r/K continuum (e.g.,Reznick et al., 2002). R-selected organisms have high growth rate,short lifespan, and produce many offspring with a low survivalrate. K-selected organisms operate close to their environment’scarrying capacity. They live longer and produce fewer offspring
FIGURE 8 | Plots of FSF use (diversity) versus FSF reuse (abundance).(A) Plot of FSF use and reuse in the proteomes of the entire set of 903organisms. (B) Box plots of the ratios of FSF reuse to FSF use in theproteomes of 415 free-living organisms of the six kingdoms. The ratio of 1would imply that every FSF is found exactly once in the entire genome,which is why all numbers on the ordinate are greater than 1. Numbers inparenthesis indicate total number of proteomes studied for each group.Horizontal lines within each distribution indicate group median values.Outliers are indicated by hollow circles for Archaea [Methanospirillumhungatei (ratio=5.7), Methanosarcina barkeri (5.7), Methanosarcinaacetivorans (6.7)], Bacteria [Saccharopolyspora erythaea (10.0),Streptomyces griseus (10.0), Streptomyces avermitilis (10.2), Streptomycescoelicolor (10.3), Solibacter urisatus (10.6), Rhodoccus sp. (11.0),Burkholderia xenovorans (11.1), and Sorangium cellulosum (11.5)], andMetazoa [Homo sapiens (62.2), Monodelphis domestica (65.0),Branchiostoma floridae (66.9), Takifugu rubripes (88.1)]. Raw data wastransformed by its reciprocal to meet the assumption of normality forone-way ANOVA. Welch’s correction was applied to protect fromheteroscedastic variances (Welch, 1938) and Games–Howell multiplecomparison test (Games and Howell, 1976) was used to evaluate significantdifferences among individual groups at P < 0.02 (indicated by different letterheading box plots).
with higher survival rate due to high parental investment. Theeconomy vertex is a cognate of the r-selected extreme on the once-popular r/K continuum. Our framework adds a new dimension tothis continuum: the axis of flexibility/robustness, which turns ther/K continuum into a branching structure (Figure 9B), more con-gruent with the usual depiction of the tree of life. Our depiction ofbranching evolutionary pathways within the persistence triangle
Frontiers in Genetics | Systems Biology February 2013 | Volume 4 | Article 16 | 14
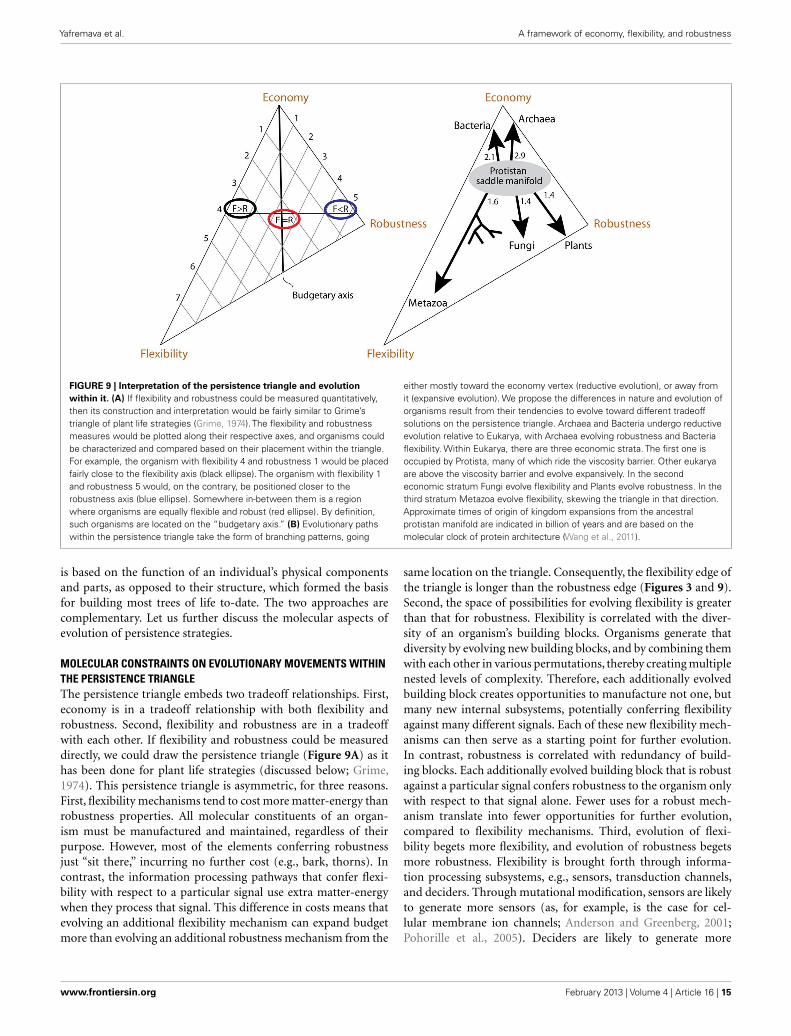
Yafremava et al. A framework of economy, flexibility, and robustness
FIGURE 9 | Interpretation of the persistence triangle and evolutionwithin it. (A) If flexibility and robustness could be measured quantitatively,then its construction and interpretation would be fairly similar to Grime’striangle of plant life strategies (Grime, 1974). The flexibility and robustnessmeasures would be plotted along their respective axes, and organisms couldbe characterized and compared based on their placement within the triangle.For example, the organism with flexibility 4 and robustness 1 would be placedfairly close to the flexibility axis (black ellipse). The organism with flexibility 1and robustness 5 would, on the contrary, be positioned closer to therobustness axis (blue ellipse). Somewhere in-between them is a regionwhere organisms are equally flexible and robust (red ellipse). By definition,such organisms are located on the “budgetary axis.” (B) Evolutionary pathswithin the persistence triangle take the form of branching patterns, going
either mostly toward the economy vertex (reductive evolution), or away fromit (expansive evolution). We propose the differences in nature and evolution oforganisms result from their tendencies to evolve toward different tradeoffsolutions on the persistence triangle. Archaea and Bacteria undergo reductiveevolution relative to Eukarya, with Archaea evolving robustness and Bacteriaflexibility. Within Eukarya, there are three economic strata. The first one isoccupied by Protista, many of which ride the viscosity barrier. Other eukaryaare above the viscosity barrier and evolve expansively. In the secondeconomic stratum Fungi evolve flexibility and Plants evolve robustness. In thethird stratum Metazoa evolve flexibility, skewing the triangle in that direction.Approximate times of origin of kingdom expansions from the ancestralprotistan manifold are indicated in billion of years and are based on themolecular clock of protein architecture (Wang et al., 2011).
is based on the function of an individual’s physical componentsand parts, as opposed to their structure, which formed the basisfor building most trees of life to-date. The two approaches arecomplementary. Let us further discuss the molecular aspects ofevolution of persistence strategies.
MOLECULAR CONSTRAINTS ON EVOLUTIONARY MOVEMENTS WITHINTHE PERSISTENCE TRIANGLEThe persistence triangle embeds two tradeoff relationships. First,economy is in a tradeoff relationship with both flexibility androbustness. Second, flexibility and robustness are in a tradeoffwith each other. If flexibility and robustness could be measureddirectly, we could draw the persistence triangle (Figure 9A) as ithas been done for plant life strategies (discussed below; Grime,1974). This persistence triangle is asymmetric, for three reasons.First, flexibility mechanisms tend to cost more matter-energy thanrobustness properties. All molecular constituents of an organ-ism must be manufactured and maintained, regardless of theirpurpose. However, most of the elements conferring robustnessjust “sit there,” incurring no further cost (e.g., bark, thorns). Incontrast, the information processing pathways that confer flexi-bility with respect to a particular signal use extra matter-energywhen they process that signal. This difference in costs means thatevolving an additional flexibility mechanism can expand budgetmore than evolving an additional robustness mechanism from the
same location on the triangle. Consequently, the flexibility edge ofthe triangle is longer than the robustness edge (Figures 3 and 9).Second, the space of possibilities for evolving flexibility is greaterthan that for robustness. Flexibility is correlated with the diver-sity of an organism’s building blocks. Organisms generate thatdiversity by evolving new building blocks, and by combining themwith each other in various permutations, thereby creating multiplenested levels of complexity. Therefore, each additionally evolvedbuilding block creates opportunities to manufacture not one, butmany new internal subsystems, potentially conferring flexibilityagainst many different signals. Each of these new flexibility mech-anisms can then serve as a starting point for further evolution.In contrast, robustness is correlated with redundancy of build-ing blocks. Each additionally evolved building block that is robustagainst a particular signal confers robustness to the organism onlywith respect to that signal alone. Fewer uses for a robust mech-anism translate into fewer opportunities for further evolution,compared to flexibility mechanisms. Third, evolution of flexi-bility begets more flexibility, and evolution of robustness begetsmore robustness. Flexibility is brought forth through informa-tion processing subsystems, e.g., sensors, transduction channels,and deciders. Through mutational modification, sensors are likelyto generate more sensors (as, for example, is the case for cel-lular membrane ion channels; Anderson and Greenberg, 2001;Pohorille et al., 2005). Deciders are likely to generate more
www.frontiersin.org February 2013 | Volume 4 | Article 16 | 15
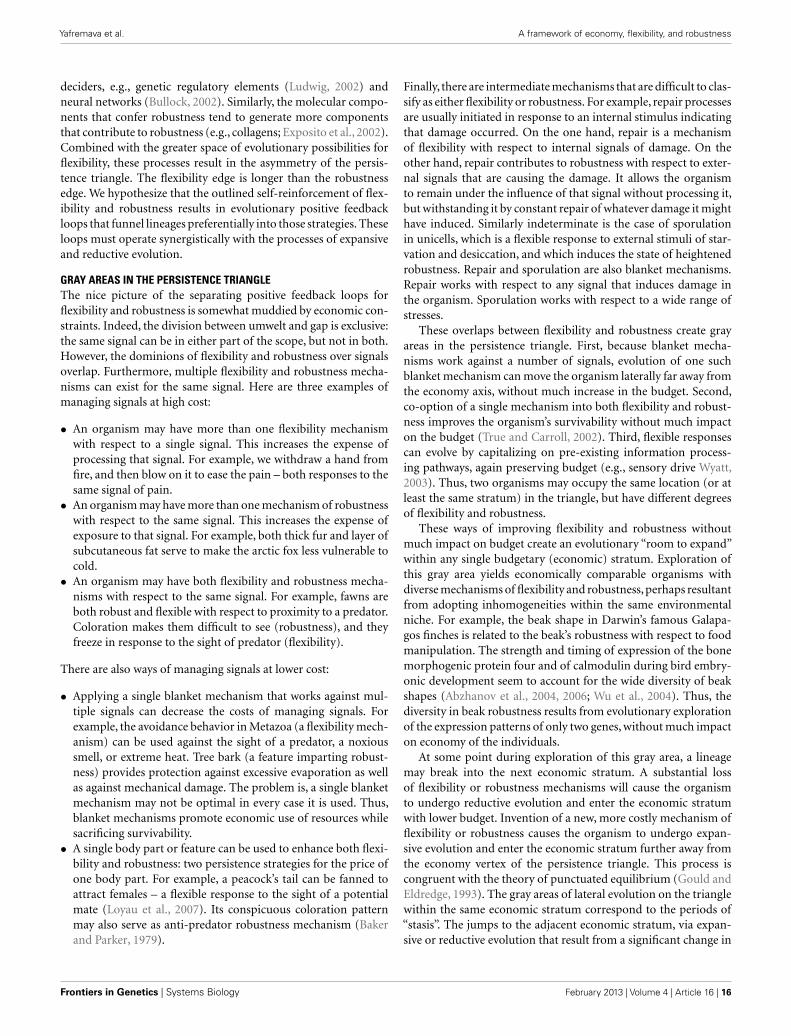
Yafremava et al. A framework of economy, flexibility, and robustness
deciders, e.g., genetic regulatory elements (Ludwig, 2002) andneural networks (Bullock, 2002). Similarly, the molecular compo-nents that confer robustness tend to generate more componentsthat contribute to robustness (e.g., collagens; Exposito et al., 2002).Combined with the greater space of evolutionary possibilities forflexibility, these processes result in the asymmetry of the persis-tence triangle. The flexibility edge is longer than the robustnessedge. We hypothesize that the outlined self-reinforcement of flex-ibility and robustness results in evolutionary positive feedbackloops that funnel lineages preferentially into those strategies. Theseloops must operate synergistically with the processes of expansiveand reductive evolution.
GRAY AREAS IN THE PERSISTENCE TRIANGLEThe nice picture of the separating positive feedback loops forflexibility and robustness is somewhat muddied by economic con-straints. Indeed, the division between umwelt and gap is exclusive:the same signal can be in either part of the scope, but not in both.However, the dominions of flexibility and robustness over signalsoverlap. Furthermore, multiple flexibility and robustness mecha-nisms can exist for the same signal. Here are three examples ofmanaging signals at high cost:
• An organism may have more than one flexibility mechanismwith respect to a single signal. This increases the expense ofprocessing that signal. For example, we withdraw a hand fromfire, and then blow on it to ease the pain – both responses to thesame signal of pain.• An organism may have more than one mechanism of robustness
with respect to the same signal. This increases the expense ofexposure to that signal. For example, both thick fur and layer ofsubcutaneous fat serve to make the arctic fox less vulnerable tocold.• An organism may have both flexibility and robustness mecha-
nisms with respect to the same signal. For example, fawns areboth robust and flexible with respect to proximity to a predator.Coloration makes them difficult to see (robustness), and theyfreeze in response to the sight of predator (flexibility).
There are also ways of managing signals at lower cost:
• Applying a single blanket mechanism that works against mul-tiple signals can decrease the costs of managing signals. Forexample, the avoidance behavior in Metazoa (a flexibility mech-anism) can be used against the sight of a predator, a noxioussmell, or extreme heat. Tree bark (a feature imparting robust-ness) provides protection against excessive evaporation as wellas against mechanical damage. The problem is, a single blanketmechanism may not be optimal in every case it is used. Thus,blanket mechanisms promote economic use of resources whilesacrificing survivability.• A single body part or feature can be used to enhance both flexi-
bility and robustness: two persistence strategies for the price ofone body part. For example, a peacock’s tail can be fanned toattract females – a flexible response to the sight of a potentialmate (Loyau et al., 2007). Its conspicuous coloration patternmay also serve as anti-predator robustness mechanism (Bakerand Parker, 1979).
Finally, there are intermediate mechanisms that are difficult to clas-sify as either flexibility or robustness. For example, repair processesare usually initiated in response to an internal stimulus indicatingthat damage occurred. On the one hand, repair is a mechanismof flexibility with respect to internal signals of damage. On theother hand, repair contributes to robustness with respect to exter-nal signals that are causing the damage. It allows the organismto remain under the influence of that signal without processing it,but withstanding it by constant repair of whatever damage it mighthave induced. Similarly indeterminate is the case of sporulationin unicells, which is a flexible response to external stimuli of star-vation and desiccation, and which induces the state of heightenedrobustness. Repair and sporulation are also blanket mechanisms.Repair works with respect to any signal that induces damage inthe organism. Sporulation works with respect to a wide range ofstresses.
These overlaps between flexibility and robustness create grayareas in the persistence triangle. First, because blanket mecha-nisms work against a number of signals, evolution of one suchblanket mechanism can move the organism laterally far away fromthe economy axis, without much increase in the budget. Second,co-option of a single mechanism into both flexibility and robust-ness improves the organism’s survivability without much impacton the budget (True and Carroll, 2002). Third, flexible responsescan evolve by capitalizing on pre-existing information process-ing pathways, again preserving budget (e.g., sensory drive Wyatt,2003). Thus, two organisms may occupy the same location (or atleast the same stratum) in the triangle, but have different degreesof flexibility and robustness.
These ways of improving flexibility and robustness withoutmuch impact on budget create an evolutionary “room to expand”within any single budgetary (economic) stratum. Exploration ofthis gray area yields economically comparable organisms withdiverse mechanisms of flexibility and robustness,perhaps resultantfrom adopting inhomogeneities within the same environmentalniche. For example, the beak shape in Darwin’s famous Galapa-gos finches is related to the beak’s robustness with respect to foodmanipulation. The strength and timing of expression of the bonemorphogenic protein four and of calmodulin during bird embry-onic development seem to account for the wide diversity of beakshapes (Abzhanov et al., 2004, 2006; Wu et al., 2004). Thus, thediversity in beak robustness results from evolutionary explorationof the expression patterns of only two genes, without much impacton economy of the individuals.
At some point during exploration of this gray area, a lineagemay break into the next economic stratum. A substantial lossof flexibility or robustness mechanisms will cause the organismto undergo reductive evolution and enter the economic stratumwith lower budget. Invention of a new, more costly mechanism offlexibility or robustness causes the organism to undergo expan-sive evolution and enter the economic stratum further away fromthe economy vertex of the persistence triangle. This process iscongruent with the theory of punctuated equilibrium (Gould andEldredge, 1993). The gray areas of lateral evolution on the trianglewithin the same economic stratum correspond to the periods of“stasis”. The jumps to the adjacent economic stratum, via expan-sive or reductive evolution that result from a significant change in
Frontiers in Genetics | Systems Biology February 2013 | Volume 4 | Article 16 | 16
Yafremava et al. A framework of economy, flexibility, and robustness
flexibility/robustness mechanisms correspond to the “punctuatedchange.”
These hypotheses allow us to propose a model for evolution-ary separation of LUCA into the three cellular superkingdoms, asfollows.
EVOLUTIONARY SEGREGATION OF THE THREE SUPERKINGDOMSThe viscosity-bound protistan manifold separates the modernAkarya from the vast majority of modern Eukarya, and thereforeseems to be a reasonable candidate for placement of a primordialorganism, before the three superkingdoms split off into diversi-fied forms. This placement would be consistent with an earlierhypothesis that the ancestor of the three superkingdoms was a rel-atively large (larger than Akarya) phagotrophic organism (Pooleet al., 1999; Kurland et al., 2006). However, it says nothing aboutthe timing and order of the diversification process, or the steps ofchange in cellular make up that led to this primordial entity.
It is likely that phagotrophy placed the selective pressure forreductive evolution on smaller organisms. If that is the case, bac-terial ancestors embraced their status as prey. They went on evolv-ing r-selected traits, taking advantage of habitats with abundantnutrients, where they adapted to reproduce quickly and com-pete ruthlessly for the available resources. The opportunistic andhighly social lifestyle promoted evolution of whatever flexibilitymechanisms could be managed within their tiny budget. Flexi-bility also served well in their interactions with predators. Thus,the ancestors of Bacteria split off the primordial saddle mani-fold, and slid down into the potential well of viscosity-driven,economy-promoting world, with a bias toward the flexibility inthat corner of the triangle. The ancestors of Archaea took analternative reductive path biased toward robustness. They set-tled in flexibility-constraining thermophilic niches, inaccessible toancient bacteria and the phagotrophic common ancestor. Theseancestral archaeal lineages escaped from both competition andpredation. The thermophilic environment constrained their mol-ecular stability, causing them to lose a large number of the primor-dial proteins (Poole et al., 1998; Wang et al., 2007), locking themon this path of reductive evolution with a bias toward robustness.
The phagotrophic members of the early organisms derivedfrom the primordial cellular ancestor went on to produce theancient eukaryal lineage, perhaps when some of them managedto assimilate and establish a symbiosis with members of the evolv-ing bacterial lineage (Cavalier-Smith, 2002b; de Duve, 2007; Jékely,2007). This putative symbiosis could have provided the means ofextremely efficient matter-energy extraction from the nutrientsnecessary to support the costly lifestyle of the budding predator.The new lineage quickly out-competed its less efficient ances-tor, and resulted in the primordial protozoan. Remarkably, theproteomic make up of Bacteria and Protista share distributionpatterns of molecular functions that suggest an ancestral evolu-tionary link between these two groups (Nasir et al., 2011). Fromthere evolution proceeded as described before. The ancestors of theremaining eukaryal kingdoms slid down the protistan saddle man-ifold in the direction of ever-increasing budget, each with a biastoward flexibility or robustness, appropriate for their nutritionallifestyle.
In short, we propose that LUCA split into thermophiles, com-petitors and predators, which went on to become Archaea, Bacte-ria, and Eukarya, respectively. Subsequently Archaea moved intoother extreme environments, where they could thrive despite theenergy-stressed conditions (Valentine, 2007) due to their verysmall budget and low competition. Through secondary adapta-tions, some bacteria also moved into the extreme environments,and some archaeaons became mesophiles. Bacteria went on toperfect their flexible but highly reduced phenotype in form of par-asites. Secondary adaptations in Protista, Fungi and Metazoa (eachgravitating toward flexibility within their own economic stratum)also resulted in emergence of parasitic lineages. The robust plantshad minimal opportunities to evolve such forms.
SUMMARY AND DISCUSSIONTHE NEW SYNTHETIC EVOLUTIONARY FRAMEWORK IN SYSTEMSBIOLOGYIn this work, we aimed to come up with a general, synthetic, andscalable framework that would describe organisms’ methods ofpersistence. We were motivated by the desire to understand theessence and fundamental differences between very large groups oforganisms. We chose kingdoms and superkingdoms. The organ-isms in those groups are very different and comparisons performedthus far used criteria and language that were idiosyncratic to theparticular comparison. We wished to come up with a languagethat would work for any comparison. To that end we foundedour framework on Miller’s theory of living systems (Miller, 1995),which represents all organisms is the same way.
Miller’s theory describes every organism as a network of the20 internal subsystems, which process matter, energy and infor-mation. Some subsystems, such as ingestor, matter-energy stor-age, and producer, process only matter-energy. Some subsystems,such as input transducer, associator, and memory, process onlyinformation. Some, such as reproducer, process both. The the-ory establishes properties and quantitative descriptors for everysubsystem, by describing their structure and process. Finally, itoffers a number of predictions about the relationships betweensubsystems. This theory of living systems was developed by Millerover the course of several decades in collaboration with historians,anthropologists, economists, political scientists, sociologists, psy-chologists, chemists, physicists, physiologists, and medical doctors.It is very detailed and provides a solid base for any comparative,analytical or synthetic work in systems biology. However, it doesnot have good descriptors of the organisms’ environments thatwould work at all spatio-temporal scales. It was thus essential forour purposes to be able to compare the environments characteris-tic of different organisms and to perform that comparison in thecontext of persistence.
Life history theories have developed language to describe theenvironment in the context of lineage persistence. Grime’s univer-sal adaptive strategy theory (UAST) seems particularly attractive,as it uses very general yet intuitive descriptors of the environ-ment, identifying three life strategies: competitive, stressed, andruderal (Grime, 1974). Grime’s theory was very successful, as ithas been supported for organisms within each of the kingdoms(Grime, 1977; Grime and Pierce, 2012). However, it cannot capturepersistence methods of the entire kingdoms and superkingdoms.
www.frontiersin.org February 2013 | Volume 4 | Article 16 | 17
Yafremava et al. A framework of economy, flexibility, and robustness
Superficially, it may appear that Bacteria, Archaea, and Eukaryacan be elegantly described as competitive, stress-tolerant, andruderal, respectively. Bacterial competitiveness is notorious, andArchaeal adaptation to energy-stressed environment has beenconvincingly demonstrated. However, their life histories are verysimilar, whereas UAST theory predicts separation based on repro-ductive rate: high for competitors and low for stress-tolerantorganisms. Similarly, Eukarya may seem to persist in ruderalenvironments, which is characterized by high disturbance (e.g.,intermittent availability of prey for predatory eukaryotes) andlow intensity stress (i.e., due to heterotrophy). However, Eukaryado not seem to fit the profile of ruderal organisms, which areexpected to have rapid life cycle and produce large amount ofoffspring. Some eukaryal lineages fit this profile (e.g., fish andinsects compared to mammals; budding yeast compared to peren-nial plants), but not the entire superkingdom as a group, whencompared to Archaea and Bacteria. UAST is based on the premisethat organisms apportion their material resources between growth,maintenance, or regeneration – three needs that compete formatter and energy. It does not take into account the use of infor-mation, which according to Miller’s theory is crucial for livingsystems.
We here propose a hybrid framework that derives persistencestrategies based on both the use of matter-energy and informa-tion. The latter was incorporated through umwelt. Jacob vonUexkull studied the relationship of animals with their environ-ment and emphasized the meaning of environmental signals foranimals (von Uexküll, 1909). The semiotic aspect was not nec-essary for our framework, but we made use of the concept ofumwelt because it allowed us to represent the environment fromthe perspective of the organism. This made the niches of organismsfrom all kingdoms comparable. The result is the trio of persis-tence strategies: economy, flexibility, and robustness. Every lineageevolves a unique tradeoff solution among these strategies. Thesesolutions are useful for comparison and classification of organ-isms and endow our framework with considerable descriptive andexplanatory power.
This novel framework integrated data on life histories, mor-phology, nutrition, and molecular organization. The metabolictheory of ecology (Brown et al., 2004) was instrumental in ana-lyzing the relationship between scope size and budget. The r/Kselection theory (Pianka, 1970; Boyce, 1984; Reznick et al., 2002)turned out to be embedded in our framework by way of theorganism distribution along the economy axis. The dichotomybetween flexibility and robustness resolves between Archaea andBacteria, and between Plants and Fungi, which could not be doneusing the r/K selection principles. Through this integration ofdata and theories, our synthetic model makes an important con-tribution to systems biology, because our persistence triangle andthe evolutionary movements within it depict an important uni-fying functional and organizational principle that explains thefundamental differences between organisms.
PERSISTENCE TRIANGLE IS A COMPLETE AND UNIVERSAL MODEL OFPERSISTENCE STRATEGIESEconomy, flexibility, and robustness are both necessary and suf-ficient to describe the full set of persistence strategies. This trio
was derived based on the division of scope into umwelt and gap.The umwelt and gap cover scope completely. Any signal is eitherprocessed by an organism, or not. If it is processed, it is part ofthe umwelt, and a flexibility mechanism is in place to processit. If the signal is not processed, then it is part of the gap, andthere is not a flexibility mechanism in place for it. Dependingon the budget, there may or may not be a robustness propertyin place to withstand the effects of that signal. Thus, flexibil-ity and robustness completely describe what an organism doeswith information it encounters. Economy takes into account com-petition between organisms for matter/energy. Hence, the econ-omy/flexibility/robustness trio is necessary and sufficient to fullydescribe an organism’s persistence strategy. Other factors, such asresilience, adaptivity, and vulnerability, have been considered inthe literature, but they are either synonymous with or tangen-tial to economy/flexibility/robustness. Unfortunately, the termsrobustness, resilience, flexibility, and others, are used differently inmechanical engineering, computer engineering, software design,and biology. One has to follow the definitions when comparingour framework and conclusions to the models that are based onobservations in those disciplines.
We believe that our framework is universally applicable to allclasses of organisms. It works at the level of kingdoms, can be gen-eralized to superkingdoms, and is able to resolve closely relatedorganisms, such as Darwin’s finches.
OUTLOOKThree components interplay within our framework: ecological,molecular and evolutionary. Describing all three satisfactorilywould result in a publication of substantial volume, well beyondthe confines of this publication. Thus, here we focus on the eco-logical component and will discuss the other two componentselsewhere. However, the present ecologically oriented expositionallows us to pose useful questions to be addressed from themolecular and evolutionary perspective.
A number of observations and suggestions concerning the evo-lution within the persistence triangle could bear further testing.We made a reasonable conjecture when we discussed molecu-lar constraints on evolutionary movements within the persis-tence triangle that flexibility on average has greater costs thanrobustness. The resultant hypothesis is that addition of novelmechanisms of flexibility tends to stretch matter-energy bud-get more than the addition of novel robustness properties. Thiscould be demonstrated by comparing metabolic rates of closelyrelated organisms that have distinguishable persistence strate-gies. Miller’s theory can help identify the subsystems responsi-ble for the difference in strategies. It can also help determinewhether mechanisms of flexibility are generally more costly thanrobustness properties. This can be done by computing theircosts of manufacture, maintenance and operation for comparablesubsystems.
We also suggested that evolving any of the three persistencestrategies predisposes the lineage toward further exploitation ofthat same strategy. Flexibility begets more flexibility, robustnessbegets more robustness. This sets the stage for known patternsof reductive and expansive evolution along the economy axis.It would be interesting to explore examples of these processes
Frontiers in Genetics | Systems Biology February 2013 | Volume 4 | Article 16 | 18
Yafremava et al. A framework of economy, flexibility, and robustness
for molecules and pathways. Perhaps there are patterns withineach of these evolutionary “positive feedback loops.” Additionalconstraints on the evolutionary paths within the persistencetriangle can be discovered through this exploration.
The diversity and abundance of internal parts of an organism,such as FSF domains, not only dissects organisms into kingdoms(Figures 5–8) but also acts as good repository of organismalhistory (reviewed in Caetano-Anollés et al., 2009) and can helpconfirm the evolutionary generalizations we are here derivingfrom the persistence triangle. Since each new instance of reuseof an FSF is costly and requires genes to duplicate and diver-sify, genomic abundance is correlated to time. A model in whichincreases in genome occurrence unfold progressively in evolutionof proteomes, coupled to standard cladistic principles (Caetano-Anollés and Caetano-Anollés, 2005; Wang et al., 2007; Kim andCaetano-Anollés, 2011), can formalize and systematize the place-ment of organisms in the persistence triangle, this time within aphylogenetic framework. The model of protein evolution predictsa molecular clock of FSFs (Wang et al., 2011) that links phy-logenetic statements derived from phylogenomic analysis to thegeological record (Wang et al., 2011; Kim et al., 2012). Remark-ably, analyses of domain structure and organization at fold, FSFand fold family levels suggest a very early origin of Archaea thatwas reductive, followed by later origins of the lineages of Bac-teria and Eukarya, in that order (Wang et al., 2007; Wang andCaetano-Anollés, 2009; Kim and Caetano-Anollés, 2011, 2012).This phylogenomic-based scenario is compatible with a very earlyepisode of reductive evolution on the economy side of the saddlemanifold of the persistence triangle that streamlined the protist-like ancestors into primordial archaeal organisms. It appears theselineages were slow evolving and their diversity materialized latein evolution (Wang et al., 2007; Wang and Caetano-Anollés, 2009;Kim and Caetano-Anollés, 2011, 2012). It is also likely that thereductive episode was probably triggered by the harsh conditionsof primordial Earth. A second episode of this kind resulted in theancestors of Bacteria and the more efficient coverage of many newmesophilic niches. In contrast, the predator-induced push towardthe flexibility and robustness side of the protistan saddle triggeredthe rise of Protista and then of the other eukaryal kingdoms, withdiversity being attained quite late in evolution. Thus, phyloge-nomic trees describing the evolution of folds, FSFs and domainfamilies and corresponding phylogenies describing the evolutionof proteomes put forth scenarios of origin and evolution of thesix kingdoms and three superkingdoms that are compatible withthe broad generalization of the economy/flexibility/robustnesspersistence triangle.
ACKNOWLEDGMENTSResearch was supported in part with funds from the Univer-sity of Illinois and grants from the National Science Foundation(MCB-0749836), CREES-USDA, the Soybean Disease Biotech-nology Center, and the United Soybean Board, all to GustavoCaetano-Anollés. Any opinions, findings, and conclusions orrecommendations expressed in this material are those of theauthors and do not necessarily reflect the views of the fund-ing agencies. We thank Klaus Høiland for the suggested parallelwith Grime’s theory of plant phenotypes and for the discus-sion with Gustavo Caetano-Anollés that prompted this study,and Charles G. Kurland for fruitful discussions of the preda-tory nature of Eukarya. Many thanks are extended to JohnMainzer for useful discussions and suggestions on the manuscripttext.
SUPPLEMENTARY MATERIALThe Supplementary Material for this article can be foundonline at http://www.frontiersin.org/Systems_Biology/10.3389/fgene.2013.00016/abstract
Datasheet S1 | Motility speeds for single-celled organisms, metazoan,plants, and fungi. Three tables of motility kinds, cellular actuators, mediumappropriate for each motility kind, examples of organism species using eachtype of motility, the ranges of speed, and references.
Datasheet S2 | Archaea tend to have sparser scope than bacteria. Text of ourargumentation as to why Archaea tend to have sparser scope than bacteria,with references.
Datasheet S3 | Worksheet 1: a spreadsheet with the names of fullysequenced organisms, for which we obtained the data on FSF content, cellvolume, and lifestyle. Abbreviations: A, Archaea; B, Bacteria; E, Eukarya; F,Fungi; meta, Metazoa; proto, Protista; pla, Plantae. Each organism has a citationto the source of data on lifestyle and the source of data on cell volume, inseparate columns. When a single source provided information on both, thenonly a single reference column contains the citation. Multiple sources of cellvolume were given when data for mean, minimum and maximum volume couldnot be found in a single publication. All Metazoa are commonly knownfree-living species, and so lifestyle citations are not provided. NCBI refers to theNCBI genome project pages; JGI refers to the JGI finished genome pages.Worksheet 2: a spreadsheet with the names of fully sequenced Akarya, forwhich we obtained the data on nutritional preferences, motility, sporulation,pressure, pH, temperature, salinity and growth rate. Abbreviations: A, Archaea;B, bacteria. The data were obtained from the GOLD genomes online database,NCBI genome projects, and JGI genome projects. When data could not beobtained from those databases, books and published articles were used, aswell as other databases. Citations are provided.
Datasheet S4 | Methods.
REFERENCESAbzhanov, A., Kuo, W. P., Hartmann,
C., Grant, B. R., Grant, P. R., andTabin, C. J. (2006). The calmod-ulin pathway and evolution of elon-gated beak morphology in Darwin’sfinches. Nature 442, 563–567.
Abzhanov, A., Protas, M., Grant, B. R.,Grant, P. R., and Tabin, C. J. (2004).Bmp4 and morphological variationof beaks in Darwin’s finches. Science305, 1462–1465.
Alexopoulos, C. J., and Mims, C. W.(1979). Introductory Mycology. NewYork: John Wiley & Sons.
Allen, F. F., de Paula, W. B. M.,Puthiyaveetil, S., and Nield, J.(2011). A structural phylogeneticmap for chloroplast photo-synthesis. Trends Plant Sci. 16,1360–1385.
Anderson, P. A., and Greenberg, R. M.(2001). Phylogeny of ion channels:clues to structure and function.
Comp. Biochem. Physiol. B Biochem.Mol. Biol. 129, 17–28.
Andreeva, A., and Murzin, A. G.(2010). Structural classification ofproteins and structural genomics:new insights into protein foldingand evolution. Acta Cryst. F66,1190–1197.
Baker, R. R., and Parker, G. A. (1979).The evolution of bird coloration.Philos. Trans. R. Soc. Lond. B Biol.Sci. 287, 63–130.
Barbieri, M. (2008). Biosemiotics: anew understanding of life. Naturwis-senschaften 95, 577–599.
Barbosa, M. J., Rocha, J. M. S., Tramper,J., and Wijffels, R. H. (2001). Acetateas a carbon source for hydrogenproduction by photosynthetic bac-teria. J. Biotechnol. 85, 25–33.
Bashton, M., and Chothia, C. (2007).The generation of new proteinfunctions by the combination ofdomains. Structure 15, 85–99.
www.frontiersin.org February 2013 | Volume 4 | Article 16 | 19
Yafremava et al. A framework of economy, flexibility, and robustness
Begon,M.,Townsend,C. R.,and Harper,J. L. (2006). Ecology. From Individu-als to Ecosystems. New York: Black-well Publishing Ltd.
Bennett, A. F. (1985). Temperature andmuscle. J. Exp. Biol. 115, 333–344.
Bennett, A. F., and Ruben, J. A. (1979).Endothermy and activity in verte-brates. Science 206, 649–654.
Berezovsky, I. N., and Shakhnovich,E. I. (2005). Physics and evolu-tion of thermophilic adaptation.Proc. Natl. Acad. Sci. U.S.A. 102,12742–12747.
Berg, H. C. (1993). Random Walks inBiology. Princeton: Princeton Uni-versity Press.
Berg, H. C., and Purcell, E. M. (1977).Physics of chemoreception. Biophys.J. 20, 193–219.
Bessey, E. A. (1950). Morphology andTaxonomy of Fungi. Philadelphia:The Blakiston Co.
Bockstahler, K. R., and Coats, D. W.(1993). Spatial and temporal aspectsof mixotrophy in Chesapeake Baydinoflagellates. J. Euk. Microbiol. 40,49–60.
Boddy, L. (1999). Saprotrophic cord-forming fungi: meeting the chal-lenge of heterogeneous environ-ments. Mycologia 91, 13–32.
Boyce, M. S. (1984). Restitution ofr- and K-selection as a modelof density-dependent natural selec-tion. Annu. Rev. Ecol. Syst. 15,427–447.
Brown, J. H., Gillooly, J. F., Allen, A.P., Savage, V. M., and West, G. B.(2004). Toward a metabolic theoryof ecology. Ecology 85, 1771–1789.
Brues, C. T. (1927). Animal life in hotsprings. Q. Rev. Biol. 2, 181–203.
Bullock, T. H. (2002). Grades inneural complexity: how large isthe span? Integr. Comp. Biol. 42,757–761.
Byun, D.-S., and Cho, Y.-K. (2006).Estimation of the PAR irradianceratio and its variability under clear-sky conditions at Ieodo in theEast China Sea. Ocean Sci. J. 41,235–244.
Caetano-Anollés, G., and Caetano-Anollés, D. (2005). Universal sharingpatterns in proteomes and evolutionof protein fold architecture and life.J. Mol. Evol. 60, 484–498.
Caetano-Anollés, G., Wang, M.,Caetano-Anollés, D., and Mit-tenthal, J. E. (2009). The origin,evolution and structure of theprotein world. Biochem. J. 417,621–637.
Carey, F. G., and Scharold, J. V. (1990).Movements of blue sharks (Prionaceglauca) in depth and course. Mar.Biol. 106, 329–342.
Carrier, D. R. (1987). The evolutionof locomotor stamina in tetrapods:circumventing a mechanical con-straint. Paleobiology 13, 326–341.
Cavalier-Smith, T. (2002a). Thephagotrophic origin of eukaryotesand phylogenetic classification ofprotozoa. Int. J. Syst. Evol. Microbiol.52, 297–354.
Cavalier-Smith, T. (2002b). The neo-muran origin of archaebacteria, thenegibacterial root of the univer-sal tree and bacterial megaclassifica-tion. Int. J. Syst. Evol. Microbiol. 52,7–76.
Chothia, C., and Gough, J. (2009).Genomic and structural aspects ofprotein evolution. Biochem. J. 419,15–28.
Ciccarelli, F., Doerks, T., von Mer-ing, C., Creevey, C. J., Snel, B.,and Bork, P. (2006). Toward auto-matic reconstruction of a highlyresolved tree of life. Science 311,1283–1287.
Comai, L. (2005). The advantages anddisadvantages of being polyploid.Nat. Rev. Genet. 6, 836–846.
Courties, C., Vaquer, A., Troussellier,M., Lautier, J., Chretiennot-Dinet,M. J., Neveux, J., et al. (1994). Small-est eukaryotic organism. Nature 370,255.
Crawford, D. W. (1992). Metaboliccost of motility in planktonic pro-tists: theoretical considerations onsize scaling and swimming speed.Microb. Ecol. 24, 1–10.
Croll, D., Giovannetti, M., Koch, A.M., Sbrana, C., Ehinger, M., Lam-mers, P. J., et al. (2009). Non-self vegetative fusion and geneticexchange in the arbuscular fungusGlomus intraradices. New Phytol.181, 924–937.
Danovaro, R., Dell’Anno, A., Pusceddu,A., Gambi, C., Heiner, I., andKristensen, R. M. (2010). Thefirst metazoa living in permanentlyanoxic conditions. BMC Biol. 8:30.doi:10.1186/1741-7007-8-30
de Duve, C. (2007). The origin ofeukaryotes: a reappraisal. Nat. Rev.Genet. 8, 395–403.
Ding, G., Yu, Z., Zhao, J., Li, Y.,Xing, X., Wang, C., et al. (2008).Tree of life based on genome con-text networks. PLoS ONE 3:e3357.doi:10.1371/journal.pone.0003357
Dusenbery, D. B. (1992). Sensory Ecol-ogy. New York: Freeman and Com-pany.
Exposito, J.-Y., Cluzel, C., Garrone, R.,and Lethias, C. (2002). Evolution ofcollagens. Anat. Rec. 268, 302–316.
Freeman, J. L., Perry, G. H., Feuk, L.,Redon, R., McCarroll, S. A., Alt-shuler, D. M., et al. (2006). Copy
number variation: new insights ingenome diversity. Genome Res. 16,949–961.
Games, A. P., and Howell, F. J. (1976).Pairwise multiple comparison pro-cedures with unequal N’s and/orvariances: a Monte Carlo study. J.Educ. Stat. 1, 113–125.
Garland, T. Jr. (1983). The relationbetween maximal running speedand body mass in terrestrial mam-mals. J. Zool. 199, 157–170.
Gill, D. E., Chao, L., Perkins, S. L., andWolf, J. B. (1995). Genetic mosaicismin plants and clonal animals. Ann.Rev. Ecol. Syst. 26, 423–444.
Gladfelter, A. S. (2006). Nuclear anar-chy: asynchronous mitosis in multi-nucleated fungal hyphae. Curr. Opin.Microbiol. 9, 547–552.
Glazier, D. S. (2009). Metabolic level andsize scaling of rates of respirationand growth in unicellular organisms.Funct. Ecol. 23, 963–968.
Gogarten, J. P., and Taiz, L. (1992). Evo-lution of proton pumping ATPases:rooting the tree of life. Photosynth.Res. 33, 137–146.
Gould, S. J., and Eldredge, N. (1993).Punctuated equilibrium comes ofage. Nature 366, 223–227.
Gribaldo, S., and Brochier-Armanet, C.(2006). The origin and evolution ofarchaea: a state of the art. Philos.Trans. R. Soc. Lond. B Biol. Sci. 361,1007–1022.
Grime, J. P. (1974). Vegetation classi-fication by reference to strategies.Nature 250, 26–31.
Grime, J. P. (1977). Evidence forthe existence of three primarystrategies in plants and its rel-evance to ecological and evo-lutionary theory. Am. Nat. 111,1169–1194.
Grime, J. P., and Pierce, S. (2012).The Evolutionary Strategies thatShape Ecosystems. Chichester: Wiley-Blackwell.
Harestad, A. S., and Bunnell, F. L.(1979). Home range and bodyweight – a reevaluation. Ecology 60,389–402.
Hedenstrom, A. (2003). Scaling migra-tion speed in animals that run, swimand fly. J. Zool. 259, 155–160.
Hooker, S. K., and Baird, R. W.(1999). Deep-diving behavior ofthe northern bottlenose whale,Hyperoodon ampullatus (Cetacea:Ziphiidae). Proc. Biol. Sci. 266,621–676.
Horiike, T., Hamada, K., and Shinozawa,T. (2002). Origin of eukaryotic cellnuclei by symbiosis of archaea inbacteria supported by the newlyclarified origin of functional genes.Genes Genet. Syst. 77, 369–376.
Jahn, T. L., and Votta, J. J. (1972). Loco-motion of protozoa. Annu. Rev. FluidMech. 2, 93–116
Jamieson, A. J., Fujii, T., Mayor, D. J.,Solan, M., and Priede, I. G. (2009).Hadal trenches: the ecology of thedeepest places on Earth. Trends Ecol.Evol. 25, 190–197.
Jékely, G. (2007). Origin ofphagotrophic eukaryotes as socialcheaters in microbial biofilms. Biol.Direct 2, 3.
Jenkins, S. H. (1981). Common patternsin home range-body size relation-ships of birds and mammals. Am.Nat. 118, 126–128.
Johnson, M. D., Volker, J., Moeller, H.V., Laws, E., Breslauer, K. J., andFalkowski, P. G. (2009). Universalconstant for heat production in pro-tists. Proc. Natl. Acad. Sci. U.S.A. 106,6696–6699.
Kelley, D. S., Karson, J. A., Fruh-Green,G. L., Yoerger, D. R., Shank, T. M.,Butterfield, D. A., et al. (2005). Aserpentinite-hosted ecosystem: theLost City hydrothermal field. Science307, 1428–1434.
Kim, K. M., and Caetano-Anollés, G.(2011). The proteomic complexityand rise of the primordial ancestorof diversified life. BMC Evol. Biol.11:140. doi:10.1186/1471-2148-11-140
Kim, K. M., and Caetano-Anollés, G.(2012). The evolutionary history ofprotein fold families and proteomesconfirms that the archaeal ancestoris more ancient than the ancestorsof other super kingdoms. BMC Evol.Biol. 12:13. doi:10.1186/1471-2148-12-13
Kim, K. M., Qin, T., Jiang, Y.-Y., Chen,L.-L., Xiong, M., Caetano-Anollés,D., et al. (2012). Protein domainstructure uncovers the origin of aer-obic metabolism and the rise ofplanetary oxygenation. Structure 20,67–76.
Klionsky, D. J., Herman, P. K., andEmr, S. D. (1990). The fun-gal vacuole: composition, functionand biogenesis. Microbiol. Rev. 54,266–292.
Koblízek, M., Béjà, O., Bidigare, R. R.,Christensen, S., Benitez-Nelson, B.,Vetriani, C., et al. (2003). Isola-tion and characterization of Ery-throbacter sp. strains from theupper ocean. Arch. Microbiol. 180,327–338.
Koch, A. L. (1998). How did Bacteriacome to be? Adv. Microb. Physiol. 40,353–399.
Koob, T. J., and Long, J. H. Jr. (2000).The vertebrate body axis: evolutionand mechanical function. Am. Zool.40, 1–18.
Frontiers in Genetics | Systems Biology February 2013 | Volume 4 | Article 16 | 20
Yafremava et al. A framework of economy, flexibility, and robustness
Kumar, P. A., Srinivas, T. N. R, Sasikala,C., and Ramana, C. V. (2008).Allochromatium renukae sp. nov.Int. J. Syst. Evol. Microbiol. 58,404–407.
Kumar, S., and Nussinov, R. (2001).How do thermophilic proteins dealwith heat? Cell. Mol. Life Sci. 58,1216–1233.
Kurland, C. G., Collins, L. J., and Penny,D. (2006). Genomics and the irre-ducible nature of eukaryote cells.Science 312, 1011–1014.
Larimer, F. W., Chain, P., Hauser, L.,Lamerdin, J., Malfatti, S., Do, L.,et al. (2004). Complete genomesequence of the metabolicallyversatile photosynthetic bacteriumRhodopseudomonas palustris. Nat.Biotechnol. 22, 55–61.
Laybourn-Parry, J. (1984). A Func-tional Biology of Free-Living Proto-zoa. Berkeley: University of Califor-nia Press.
Lecointre, G., and Le Guyader, H.(2006). The Tree of Life. A Phy-logenetic Classification. Cambridge:Harvard University Press.
Levitt, M. (2009). Nature of the proteinuniverse. Proc. Natl. Acad. Sci. U.S.A.106, 11079–11084.
Loyau, A., Gomez, D., Moureau, B.,Thery, M., Hart, H. S., Jalme, M.S., et al. (2007). Iridescent struc-turally based coloration of eye-spots correlates with mating suc-cess in the peacock. Behav. Ecol. 18,1123–1131.
Ludwig, M. Z. (2002). Functional evolu-tion of noncoding DNA. Curr. Opin.Genet. Dev. 12, 637–639.
Makarieva, A. M., Gorshkov, V. G., Li,B.-L., Chown, S. L., Reich, P. B., andGavrilov, V. M. (2008). Mean mass-specific metabolic rates are strikinglysimilar across life’s major domains:evidence for life’s metabolic opti-mum. Proc. Natl. Acad. Sci. U.S.A.105, 16994–16999.
Marty, F. (1999). Plant vacuoles. PlantCell 11, 587–599.
Mason, I. L. (1939). Studies on the faunaof an Algerian hot spring. J. Exp. Biol.16, 487–498.
McMahon, T. A., and Bonner, J. T.(1983). On Size and Life. New York:Scientific American Books, Inc.
Miller, E. C. (1938). Plant Physiology.New York: McGraw-Hill Book Co.,Inc.
Miller, J. G. (1995). Living Systems.Niwot: University Press of Colorado.
Misumi, O., Matsuzaki, M., Nozaki,H., Miyagishima, S., Mori, T.,Nishida, K., et al. (2005). Cyani-dioschyzon merolae genome. A toolfor facilitating comparable stud-ies on organelle biogenesis in
photosynthetic eukaryotes. PlantPhysiol. 137, 567–585.
Mittenthal, J. E., Caetano-Anollés, D.,and Caetano-Anollés, G. (2012).Biphasic patterns of diversifi-cation and the emergence ofmodules. Front. Genet. 3:147.doi:10.3389/fgene.2012.00147
Moran, M. A., Buchan, A., González,J. M., Heidelberg, J. F., Whitman,W. B., Kiene, R. P., et al. (2004).Genome sequence of Silicibacterpomeroyi reveals adaptations to themarine environment. Nature 432,910–913.
Morgan, T. H. (1901). Regeneration.NewYork: The Macmillan Company.
Morowitz, H., and Smith, E. (2007).Energy flow and the organization oflife. Complexity 13, 51–59.
Mueller, P., and Diamond, J. (2001).Metabolic rate and environmen-tal productivity: well-provisionedanimals evolved to run and idlefast. Proc. Natl. Acad. Sci. 98,12550–12554.
Murzin, A. G., Brenner, S. E., Hub-bard, T., and Chothia, C. (1995).SCOP: a structural classification ofproteins database for the investiga-tion of sequences and structures. J.Mol. Biol. 247, 536–540.
Nasir, A., Naeem, A., Kahn, M. J., LopezNicora, H. D., and Caetano-Anollés,G. (2011). Annotation of proteindomains reveals remarkable conser-vation in the functional make upof proteomes across superkingdoms.Genes 2, 869–911.
Nordoy, E. S., Folkow, L. P., Martensson,P.-E., and Blix, A. S. (1995). Foodrequirements of Northeast Atlanticminke whales. Dev. Mar. Biol. 4,307–317.
Oren, A. (2006). “Prokaryotic life,” inLife as We Know It, ed. J. Seckbach(Dordrecht: Springer), 21–35.
Otto, S., and Whitton, J. (2000).Polyploid incidence and evolution.Annu. Rev. Genet. 34, 401–437.
Owen, R. (1866). On The Anatomyof Vertebrates. Fishes and Reptiles,Vol. 1. London: Longmans, Greenand Co.
Pace, N. (1997). A molecular view ofmicrobial diversity and the bios-phere. Science 276, 734–740.
Papaioannou, G., Papanikolaou, N., andRetails, D. (1993). Relationships ofphotosynthetically active radiationand shortwave irradiance. Theor.Appl. Climatol. 48, 23–27.
Paul, D., Bridges, S., Burgess, S. C.,Dandass, Y., and Lawrence, M. L.(2008). Genome Sequence of theChemolithoautotrophic BacteriumOligotropha carboxidovoransOM5T. J. Bacteriol. 190, 5531–5532.
Pearre, S. Jr. (2003). Eat and run? Thehunger/satiation hypothesis in verti-cal migration: history, evidence andconsequences. Biol. Rev. 78, 1–79.
Pianka, E. R. (1970). On r- and K-selection. Am. Nat. 104, 592–597.
Pianka, E. R. (1972). r and K selectionor b and d selection? Am. Nat. 106,581–588.
Pierce, S., Biron, R., and Rumpho,M. (1996). Endosymbiotic chloro-plasts in molluscan cells con-tain proteins synthesized after plas-tid capture. J. Exp. Biol. 199,2323–2330.
Pohorille, A., Schweighofer, K., and Wil-son, M. A. (2005). The origin andearly evolution of membrane chan-nels. Astrobiology 5, 1–17.
Pollack, J. K., Li, Z. J., and Marten, M.R. (2008). Fungal mycelia show lagtime before re-growth on endoge-nous carbon. Biotechnol. Bioeng. 100,458–465.
Poole, A., Jeffares, D., and Penny, D.(1999). Early evolution: prokaryotes,the new kids on the block. Bioessays21, 880–889.
Poole, A. M., Jeffares, D. C., and Penny,D. (1998). The path from the RNAworld. J. Mol. Evol. 46, 1–17.
Popesco, M. C., MacLaren, E. J., Hop-kins, J., Dumas, L., Cox, M., Melte-sen, L., et al. (2006). Human lineage-specific amplification, selection, andneuronal expression of DUF1220domains. Science 313, 1304–1307.
Prange, A., Engelhardt, H., Trüper, H.G., and Dahl, C. (2004). The roleof the sulfur globule proteins ofAllochromatium vinosum: mutage-nesis of the sulfur globule proteingenes and expression studies by real-time RT-PCR. Arch. Microbiol. 182,165–174.
Purcell, E. M. (1977). Life at lowReynolds number. Am. J. Phys. 45,3–11.
Randolph, H. (1897). Observations andExperiments on Regeneration in Pla-narians. Leipzig: Wilhelm Engel-mann.
Reich, P. B. (2001). Body size, geom-etry, longevity and metabolism:do plant leaves behave like ani-mal bodies? Trends Ecol. Evol. 16,674–680.
Rex, M. A., Etter, R. J., Morris, J. S.,Crouse, J., McClain, C. R., Johnson,N. A., et al. (2006). Global bathymet-ric patterns of standing stock andbody size in the deep-sea benthos.Mar. Ecol. Prog. Ser. 317, 1–8.
Reznick, D., Bryant, M. J., and Bashey,F. (2002). r- and K-selection revis-ited: the role of population regula-tion in life-history evolution. Ecology83, 1509–1520.
Robinson, W. R., Peters, R. H., and Zim-mermann, J. (1983). The effects ofbody size and temperature on meta-bolic rate of organisms. Can. J. Zool.61, 281–288.
Ruben, J. A., and Bennet, A. A. (1987).The evolution of bone. Evolution 41,1187–1197.
Sackett, M. J., Armitage, J. P., Sherwood,E. E., and Pitta, T. P. (1997). Photore-sponses of the purple nonsulfur bac-teria Rhodospirillum centenum andRhodobacter sphaeroides. J. Bacte-riol. 179, 6764–6768.
Schäfer, S., Barkowski, C., and Fuchs,G. (1986). Carbon assimilationby the autotrophic thermophilicarchaebacterium Thermoproteusneutrophilus. Arch. Microbiol. 146,301–308.
Schulz, H. N., and Jorgensen, B. B.(2001). Big bacteria. Annu. Rev.Microbiol. 55, 105–137.
Seibel, B. A., and Drazen, J. C. (2007).The rates of metabolism in marineanimals: environmental constraints,ecological demands and energeticopportunities. Phil. Trans. Roy. Soc.Lond. B. 362, 2061–2078.
Sharma, O. P. (2002). Textbook of Algae.Delhi: Tata McGraw-Hill PublishingCompany Ltd.
Siebers, B., Wendisch, V. F., andHensel, R. (1997). Carbohydratemetabolism in Thermoproteustenax: in vivo utilization of the non-phosphorylative Entner-Doudoroffpathway and characterization ofits first enzyme, glucose dehy-drogenase. Arch. Microbiol. 168,120–127.
Smith, K. F., and Brown, J. H. (2002).Patterns of diversity, depth rangeand body size among pelagic fishesalong a gradient of depth. Glob. Ecol.Biogeogr. 11, 313–322.
Speakman, J. R. (2005). Body size,energy metabolism and lifespan. J.Exp. Biol. 208, 1717–1730.
Srinivas, T. N., Anil Kumar, P.,Sucharitha, K., Sasikala, Ch., andRamana, Ch. V. (2009). Allochro-matium phaeobacterium sp. nov. Int.J. Syst. Evol. Microbiol. 59, 750–753.
Takami, H., Inoue, A., Fuji, F., andHorikoshi,K. (1997). Microbial florain the deepest sea mud of the Mar-iana Trench. FEMS Microbiol. Lett.152, 279–285.
Tarasov, V. G., Gebruk, A. V., Mironov,A. N., and Moskalev, L. I. (2005).Deep-sea and shallow-waterhydrothermal vent communities:Two different phenomena? Chem.Geol. 224, 5–39.
Taylor, D. R., Aarssen, L. W., andLoehle, C. (1990). On the rela-tionship between r/K selection and
www.frontiersin.org February 2013 | Volume 4 | Article 16 | 21
Yafremava et al. A framework of economy, flexibility, and robustness
environmental carrying capacity:a new habitat templet for plantlife history strategies. Oikos 58,239–250.
True, J. R., and Carroll, S. B. (2002).Gene cooption in physiological andmorphological evolution. Annu. Rev.Cell Dev. Biol. 18, 53–80.
Umpleby, S. A. (2007). Physical rela-tionships among matter, energy andinformation. Syst. Res. Behav.Sci. 24,369–372.
Valentine, D. L. (2007). Adaptations toenergy stress dictate the ecology andevolution of the Archaea. Nature 5,316–323.
VanDover, C. L., German, C. R., Speer,K. G., Parson, L. M., and Vri-jenhoek, R. C. (2002). Evolutionand biogeography of deep-sea ventand seep invertebrates. Science 295,1253–1257.
Veses,V., Richards, A., and Gow, N. A. R.(2008). Vacuoles and fungal biology.Curr. Opin. Microbiol. 11, 503–510.
von Uexküll, J. (1909). Umwelt undInnenwelt der Tiere. Berlin: J.Springer.
Wang, M., and Caetano-Anollés, G.(2006). Global phylogeny deter-mined by the combination of pro-tein domains in proteomes. Mol.Biol. Evol. 23, 2444–2453.
Wang, M., and Caetano-Anollés,G. (2009). The evolutionary
mechanics of domain organizationin proteomes and the rise of modu-larity in the protein world. Structure17, 66–78.
Wang, M., Jiang, Y.-Y., Kim, K. M.,Qu, G., Ji, H.-F., Mittenthal, J. E.,et al. (2011). A universal clockof protein folds and its powerin tracing the early history ofaerobic metabolism and planetoxygenation. Mol. Biol. Evol. 28,567–582.
Wang, M., Yafremava, L. S., Caetano-Anollés, D., Mittenthal, J. E., andCaetano-Anollés, G. (2007). Reduc-tive evolution of architectural reper-toires in proteomes and the birth ofthe tripartite world. Genome Res. 17,1572–1585.
Wang, Q., Tenhunen, J., Schmidt, M.,Otieno, D., Kolcun, O., and Droesler,M. (2005). Diffuse PAR irradianceunder clear skies in complex alpineterrain. Agric. Forest Meteorol. 128,1–15.
Weibel, E. R., Bacigalupe, L. D., Schmitt,B., and Hoppeler, H. (2004). Allo-metric scaling of maximal meta-bolic rate in mammals: muscle aer-obic capacity as determinant fac-tor. Respir. Physiol. Neurobiol. 140,115–132.
Welch, B. L. (1938). The significance ofthe difference between two meanswhen the population variances
are unequal. Biometrika 29,350–362.
White, D. (2000). The Physiology andBiochemistry of Prokaryotes. NewYork: Oxford University Press.
Whittaker, R. H. (1969). New conceptsof kingdoms of organisms. Science163, 150–160.
Woese, C. R. (1987). Bacterial evolution.Microbiol. Rev. 51, 221–271.
Woese, C. R. (2002). On the evolutionof cells. Proc. Natl. Acad. Sci. U.S.A.99, 8742–8747.
Wu, P., Jiang, T.-X., Suksaweang,S., Widelitz, R. B., and Chuong,C.-M. (2004). Molecular shap-ing of the beak. Science 305,1465–1466.
Wyatt, T. D. (2003). Pheromonesand Animal Behaviour. Cambridge:Cambridge University Press.
Yannas, I. V. (2001). Tissue and organregeneration in adults. New York:Springer-Verlag.
Young, D. R., and Smith, W. K.(1983). Effect of cloud coveron photosynthesis and transpira-tion in the subalpine understoryspecies Arcina latifolia. Ecology 64,681–687.
Zeldovich, K. B., Chen, P., Shakhnovich,B. E., and Shakhnovich, E. I. (2007).A first-principles model of earlyevolution: emergence of gene fam-ilies, species, and preferred protein
folds. PLoS Comput. Biol. 3:e139.doi:10.1371/journal.pcbi.0030139
Conflict of Interest Statement: Theauthors declare that the research wasconducted in the absence of anycommercial or financial relationshipsthat could be construed as a potentialconflict of interest.
Received: 17 September 2012; paperpending published: 19 October 2012;accepted: 28 January 2013; publishedonline: 25 February 2013.Citation: Yafremava LS, Wielgos M,Thomas S, Nasir A, Wang M, Mitten-thal JE and Caetano-Anollés G (2013) Ageneral framework of persistence strate-gies for biological systems helps explaindomains of life. Front. Genet. 4:16.doi:10.3389/fgene.2013.00016This article was submitted to Frontiers inSystems Biology, a specialty of Frontiersin Genetics.Copyright © 2013 Yafremava, Wiel-gos, Thomas, Nasir , Wang , Mittenthaland Caetano-Anollés. This is an open-access article distributed under the termsof the Creative Commons AttributionLicense, which permits use, distributionand reproduction in other forums, pro-vided the original authors and sourceare credited and subject to any copy-right notices concerning any third-partygraphics etc.
Frontiers in Genetics | Systems Biology February 2013 | Volume 4 | Article 16 | 22