hydrogen exchange methods to study protein folding
TRANSCRIPT
Methods 34 (2004) 51–64
www.elsevier.com/locate/ymeth
Hydrogen exchange methods to study protein folding
Mallela M.G. Krishna,* Linh Hoang, Yan Lin, and S. Walter Englander
Johnson Research Foundation, Department of Biochemistry and Biophysics, University of Pennsylvania School of Medicine,
Philadelphia, PA 19104-6059, USA
Accepted 5 March 2004
Available online 5 June 2004
Abstract
The measurement of amino acid-resolved hydrogen exchange (HX) has provided the most detailed information so far available on
the structure and properties of protein folding intermediates. Direct HX measurements can define the structure of tenuous molten
globule forms that are generally inaccessible to the usual crystallographic and NMR methods (C. Redfield review in this issue). HX
pulse labeling methods can specify the structure, stability and kinetics of folding intermediates that exist for less than 1 s during kinetic
folding. Native state HXmethods can detect and characterize folding intermediates that exist as infinitesimally populated high energy
excited state forms under native conditions. The results obtained in these ways suggest principles that appear to explain the properties
of partially folded intermediates and how they are organized into folding pathways. The application of these methods is detailed here.
� 2004 Elsevier Inc. All rights reserved.
Keywords: Hydrogen exchange; Theory; Pulse labeling; Native state hydrogen exchange; EX1; Protein folding; Protein function; Foldon;
Cytochrome c
1. Introduction
Hydrogen exchange (HX) rates measured by avail-able techniques [1,2] can reveal the presence and the
absence of protecting structure at amino acid resolution,
quantify thermodynamic stability, and determine the
kinetics of structure formation and loss. The challenge
has been to devise methods that can bring these capa-
bilities to bear on invisible, short-lived, and non-isolat-
able folding intermediates. This challenge has been met.
This paper describes some of the major HX methodsthat have been applied to the protein folding problem,
details the theory necessary for interpretation of the
results, and shows some illustrations from the literature.
2. HX rate
Hydrogens on the polar groups of proteins andnucleic acids engage in continual exchange with the
hydrogens of solvent [1,3–7]. Because of the extreme
* Corresponding author.
E-mail address: [email protected] (M.M.G. Krishna).
1046-2023/$ - see front matter � 2004 Elsevier Inc. All rights reserved.
doi:10.1016/j.ymeth.2004.03.005
pKa values of main chain amides, the exchange of their
hydrogens with solvent is relatively slow and is cata-
lyzed only by the strongest of aqueous acids and bases,H3O
þ and OH� ions [5,8,9]. One result is that freely
exposed amide hydrogens exchange rather slowly, in
about 1 s at pH 7 and 0 �C. Protecting (H-bonded)
structure further slows these rates and spreads them
over many orders of magnitude, placing them on a
generally convenient laboratory time scale. Another
fortunate consequence is that amide exchange can be
easily and controllably manipulated. A factor of 10 inrate can be obtained by a change of one pH unit, or
about 22 �C in temperature. Nucleic acid hydrogens
tend to exchange much more rapidly, even in struc-
tured molecules [5,10], which reduces their usefulness,
although hydrogens H-bonded in RNA tertiary struc-
ture can be quite slow.
We focus here on protein amide hydrogens which
have been most useful in folding studies.
2.1. Steady-state theory (Linderstrøm-Lang)
For structurally protected hydrogens, Linderstrøm-
Lang and his colleagues pictured a 2-state situation, as
52 M.M.G. Krishna et al. / Methods 34 (2004) 51–64
in Eq. (1), with hydrogens either non-exchangeable inthe protected state (NH(closed)) or susceptible to ex-
change in some transiently open form (NH(open))
[3,4,11,12]
NHðclosedÞ¡kop
kclNHðopenÞ!kch exchanged: ð1Þ
Here, kop and kcl are the opening (unfolding) and closing
(folding) rates of the protecting structure. The chemical
exchange rate of freely available, unprotected amide
hydrogens, kch, depends on a variety of conditions (pH,temperature, neighboring amino acid side chains, and
isotope effects). These factors have been calibrated to
high precision [13–15] and so can be obtained by
straightforward calculation [16,17]. HX protection is
usually associated with H-bonding, although hydrogens
that are structurally protected even without H-bonding
can be modestly slowed [18–20].
Under steady-state conditions, the exchange rate (kex)determined by reaction scheme (1) is given by Eq. (2)
[3,4]
kex ¼kopkch
kop þ kcl þ kch; ð2Þ
where kch for the unprotected amide can be calculated
independently. Most of the HX literature assumes stable
structure (kop � kcl) and starts with Eq. (3)
kex ¼kopkchkcl þ kch
: ð3Þ
This equation reduces to two limiting cases. Under EX2
(bimolecular exchange) conditions where kcl � kch (lowpH and temperature), the exchange rate becomes
kEX2ex ¼ kopkch
kcl¼ Kopkch; Kop ¼ kop=kcl: ð4Þ
The stabilization free energy of the protecting structure
can then be calculated as
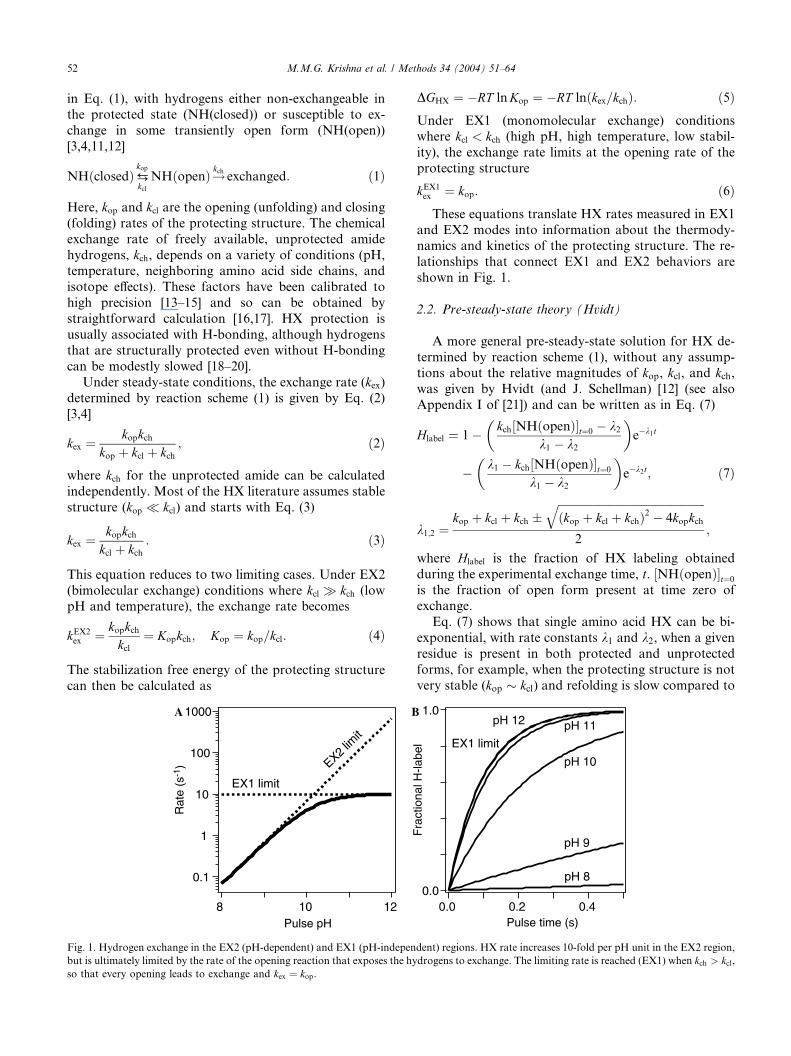
Fig. 1. Hydrogen exchange in the EX2 (pH-dependent) and EX1 (pH-indepen
but is ultimately limited by the rate of the opening reaction that exposes the hy
so that every opening leads to exchange and kex ¼ kop.
DGHX ¼ �RT lnKop ¼ �RT lnðkex=kchÞ: ð5ÞUnder EX1 (monomolecular exchange) conditionswhere kcl < kch (high pH, high temperature, low stabil-
ity), the exchange rate limits at the opening rate of the
protecting structure
kEX1ex ¼ kop: ð6ÞThese equations translate HX rates measured in EX1
and EX2 modes into information about the thermody-namics and kinetics of the protecting structure. The re-
lationships that connect EX1 and EX2 behaviors are
shown in Fig. 1.
2.2. Pre-steady-state theory (Hvidt)
A more general pre-steady-state solution for HX de-
termined by reaction scheme (1), without any assump-tions about the relative magnitudes of kop, kcl, and kch,was given by Hvidt (and J. Schellman) [12] (see also
Appendix I of [21]) and can be written as in Eq. (7)
Hlabel ¼ 1� kch NHðopenÞ½ �t¼0 � k2k1 � k2
� �e�k1t
� k1 � kch NHðopenÞ½ �t¼0
k1 � k2
� �e�k2t; ð7Þ
k1;2 ¼kop þ kcl þ kch �
ffiffiffiffiffiffiffiffiffiffiffiffiffiffiffiffiffiffiffiffiffiffiffiffiffiffiffiffiffiffiffiffiffiffiffiffiffiffiffiffiffiffiffiffiffiffiffiffiffiffiffiffiffiðkop þ kcl þ kchÞ2 � 4kopkch
q2
;
where Hlabel is the fraction of HX labeling obtained
during the experimental exchange time, t. ½NHðopenÞ�t¼0
is the fraction of open form present at time zero ofexchange.
Eq. (7) shows that single amino acid HX can be bi-
exponential, with rate constants k1 and k2, when a given
residue is present in both protected and unprotected
forms, for example, when the protecting structure is not
very stable (kop � kcl) and refolding is slow compared to
dent) regions. HX rate increases 10-fold per pH unit in the EX2 region,
drogens to exchange. The limiting rate is reached (EX1) when kch > kcl,
M.M.G. Krishna et al. / Methods 34 (2004) 51–64 53
exchange (kcl < kch). The k1 term in Eq. (7) refers toinitially unprotected hydrogens, which can exchange
relatively rapidly before reclosing (neither EX1 nor
EX2). The k2 term describes hydrogens that are pro-
tected and can exchange by either EX1 or EX2 modes,
depending on conditions.
The relative amplitude of the kinetic phases, in
brackets, depends on the magnitude of the individual
rate constants and the initial fraction of open form. Ifequilibrium between the open and closed forms is al-
ready established at time zero of the H-exchange period,
½NHðopenÞ�t¼0 can be written as
½NHðopenÞ�eq ¼kop
kop þ kcl: ð8Þ
If exchange is initiated after a folding time of tf (as in a
pulse labeling experiment), ½NHðopenÞ�t¼0 is
½NHðopenÞ�tf ¼kop
kop þ kclþ kclkop þ kcl
e�ðkopþkclÞtf ð9Þ
assuming no protection in the unfolded state.
When structure is fully formed and stable (kcl � kop;k2 � k1; ½NHðopenÞ� � 0), Eq. (7) transforms to Eq. (2).
In the case of pH-competition experiments where the
unfolded protein is mixed directly into refolding condi-
tions at high pH, ½NHðopenÞ�t¼0 is 1. Eq. (7) then
reduces to the pH-competition solution given before [22–
24,58], when the structure that develops in time providescomplete protection against exchange (kcl � kop, kch).
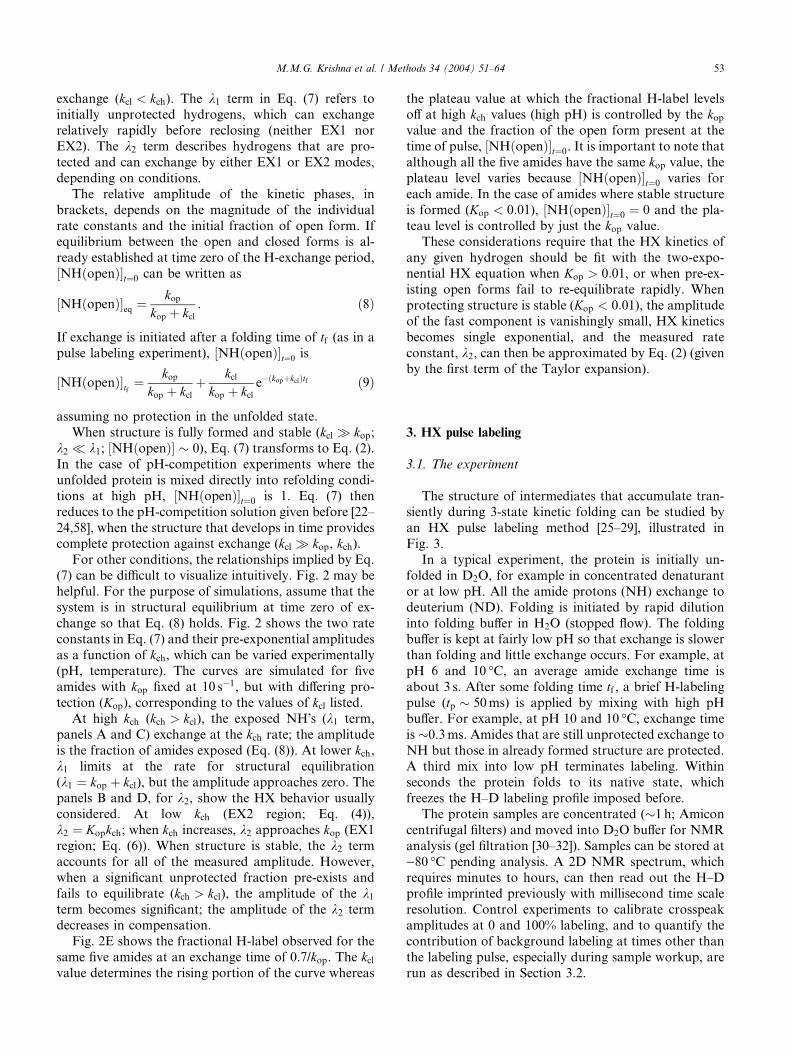
For other conditions, the relationships implied by Eq.
(7) can be difficult to visualize intuitively. Fig. 2 may be
helpful. For the purpose of simulations, assume that the
system is in structural equilibrium at time zero of ex-
change so that Eq. (8) holds. Fig. 2 shows the two rate
constants in Eq. (7) and their pre-exponential amplitudes
as a function of kch, which can be varied experimentally(pH, temperature). The curves are simulated for five
amides with kop fixed at 10 s�1, but with differing pro-
tection (Kop), corresponding to the values of kcl listed.At high kch (kch > kcl), the exposed NH�s (k1 term,
panels A and C) exchange at the kch rate; the amplitude
is the fraction of amides exposed (Eq. (8)). At lower kch,k1 limits at the rate for structural equilibration
(k1 ¼ kop þ kcl), but the amplitude approaches zero. Thepanels B and D, for k2, show the HX behavior usually
considered. At low kch (EX2 region; Eq. (4)),
k2 ¼ Kopkch; when kch increases, k2 approaches kop (EX1
region; Eq. (6)). When structure is stable, the k2 term
accounts for all of the measured amplitude. However,
when a significant unprotected fraction pre-exists and
fails to equilibrate (kch > kcl), the amplitude of the k1term becomes significant; the amplitude of the k2 termdecreases in compensation.
Fig. 2E shows the fractional H-label observed for the
same five amides at an exchange time of 0.7/kop. The kclvalue determines the rising portion of the curve whereas
the plateau value at which the fractional H-label levelsoff at high kch values (high pH) is controlled by the kopvalue and the fraction of the open form present at the
time of pulse, ½NHðopenÞ�t¼0. It is important to note that
although all the five amides have the same kop value, theplateau level varies because ½NHðopenÞ�t¼0 varies for
each amide. In the case of amides where stable structure
is formed (Kop < 0:01), ½NHðopenÞ�t¼0 ¼ 0 and the pla-
teau level is controlled by just the kop value.These considerations require that the HX kinetics of
any given hydrogen should be fit with the two-expo-
nential HX equation when Kop > 0:01, or when pre-ex-
isting open forms fail to re-equilibrate rapidly. When
protecting structure is stable (Kop < 0:01), the amplitude
of the fast component is vanishingly small, HX kinetics
becomes single exponential, and the measured rate
constant, k2, can then be approximated by Eq. (2) (givenby the first term of the Taylor expansion).
3. HX pulse labeling
3.1. The experiment
The structure of intermediates that accumulate tran-siently during 3-state kinetic folding can be studied by
an HX pulse labeling method [25–29], illustrated in
Fig. 3.
In a typical experiment, the protein is initially un-
folded in D2O, for example in concentrated denaturant
or at low pH. All the amide protons (NH) exchange to
deuterium (ND). Folding is initiated by rapid dilution
into folding buffer in H2O (stopped flow). The foldingbuffer is kept at fairly low pH so that exchange is slower
than folding and little exchange occurs. For example, at
pH 6 and 10 �C, an average amide exchange time is
about 3 s. After some folding time tf , a brief H-labeling
pulse (tp � 50ms) is applied by mixing with high pH
buffer. For example, at pH 10 and 10 �C, exchange time
is �0.3ms. Amides that are still unprotected exchange to
NH but those in already formed structure are protected.A third mix into low pH terminates labeling. Within
seconds the protein folds to its native state, which
freezes the H–D labeling profile imposed before.
The protein samples are concentrated (�1 h; Amicon
centrifugal filters) and moved into D2O buffer for NMR
analysis (gel filtration [30–32]). Samples can be stored at
)80 �C pending analysis. A 2D NMR spectrum, which
requires minutes to hours, can then read out the H–Dprofile imprinted previously with millisecond time scale
resolution. Control experiments to calibrate crosspeak
amplitudes at 0 and 100% labeling, and to quantify the
contribution of background labeling at times other than
the labeling pulse, especially during sample workup, are
run as described in Section 3.2.
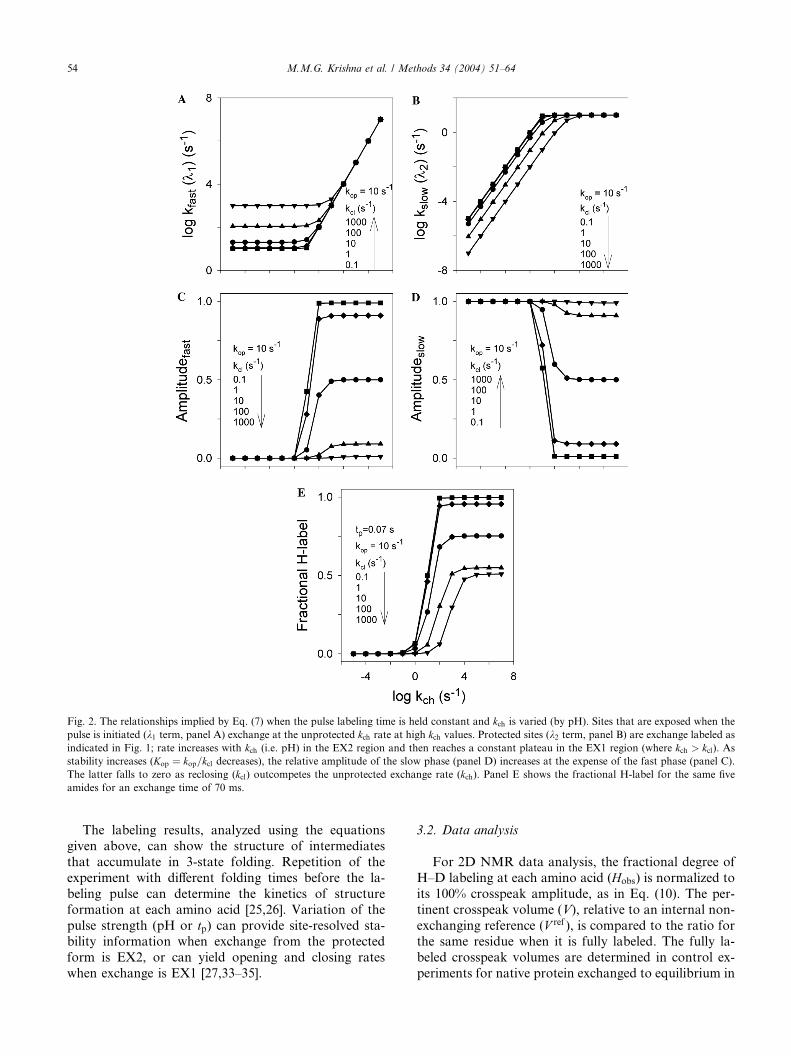
Fig. 2. The relationships implied by Eq. (7) when the pulse labeling time is held constant and kch is varied (by pH). Sites that are exposed when the
pulse is initiated (k1 term, panel A) exchange at the unprotected kch rate at high kch values. Protected sites (k2 term, panel B) are exchange labeled as
indicated in Fig. 1; rate increases with kch (i.e. pH) in the EX2 region and then reaches a constant plateau in the EX1 region (where kch > kcl). As
stability increases (Kop ¼ kop=kcl decreases), the relative amplitude of the slow phase (panel D) increases at the expense of the fast phase (panel C).
The latter falls to zero as reclosing (kcl) outcompetes the unprotected exchange rate (kch). Panel E shows the fractional H-label for the same five
amides for an exchange time of 70 ms.
54 M.M.G. Krishna et al. / Methods 34 (2004) 51–64
The labeling results, analyzed using the equations
given above, can show the structure of intermediates
that accumulate in 3-state folding. Repetition of the
experiment with different folding times before the la-
beling pulse can determine the kinetics of structure
formation at each amino acid [25,26]. Variation of the
pulse strength (pH or tp) can provide site-resolved sta-bility information when exchange from the protected
form is EX2, or can yield opening and closing rates
when exchange is EX1 [27,33–35].
3.2. Data analysis
For 2D NMR data analysis, the fractional degree of
H–D labeling at each amino acid (Hobs) is normalized to
its 100% crosspeak amplitude, as in Eq. (10). The per-
tinent crosspeak volume (V), relative to an internal non-
exchanging reference (V ref ), is compared to the ratio forthe same residue when it is fully labeled. The fully la-
beled crosspeak volumes are determined in control ex-
periments for native protein exchanged to equilibrium in
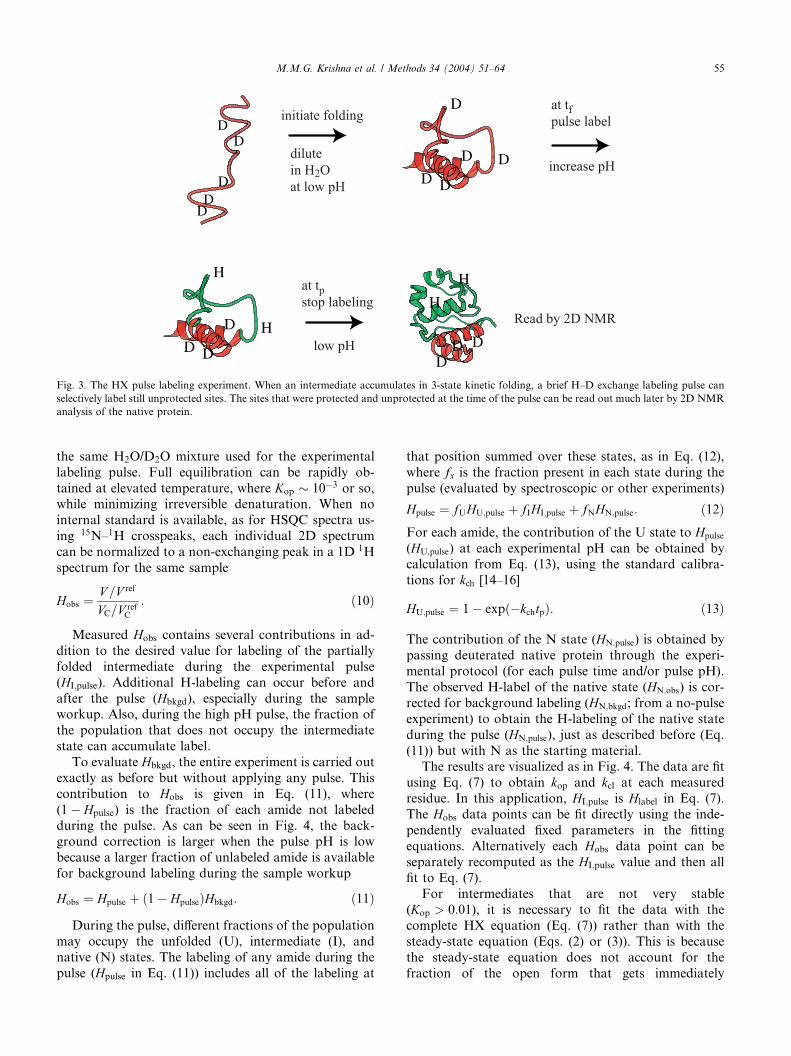
Fig. 3. The HX pulse labeling experiment. When an intermediate accumulates in 3-state kinetic folding, a brief H–D exchange labeling pulse can
selectively label still unprotected sites. The sites that were protected and unprotected at the time of the pulse can be read out much later by 2D NMR
analysis of the native protein.
M.M.G. Krishna et al. / Methods 34 (2004) 51–64 55
the same H2O/D2O mixture used for the experimental
labeling pulse. Full equilibration can be rapidly ob-
tained at elevated temperature, where Kop � 10�3 or so,while minimizing irreversible denaturation. When no
internal standard is available, as for HSQC spectra us-
ing 15N–1H crosspeaks, each individual 2D spectrum
can be normalized to a non-exchanging peak in a 1D 1H
spectrum for the same sample
Hobs ¼V =V ref
VC=V refC
: ð10Þ
Measured Hobs contains several contributions in ad-
dition to the desired value for labeling of the partially
folded intermediate during the experimental pulse
(HI;pulse). Additional H-labeling can occur before and
after the pulse (Hbkgd), especially during the sampleworkup. Also, during the high pH pulse, the fraction of
the population that does not occupy the intermediate
state can accumulate label.
To evaluate Hbkgd, the entire experiment is carried out
exactly as before but without applying any pulse. This
contribution to Hobs is given in Eq. (11), where
(1� Hpulse) is the fraction of each amide not labeled
during the pulse. As can be seen in Fig. 4, the back-ground correction is larger when the pulse pH is low
because a larger fraction of unlabeled amide is available
for background labeling during the sample workup
Hobs ¼ Hpulse þ ð1� HpulseÞHbkgd: ð11Þ
During the pulse, different fractions of the population
may occupy the unfolded (U), intermediate (I), and
native (N) states. The labeling of any amide during the
pulse (Hpulse in Eq. (11)) includes all of the labeling at
that position summed over these states, as in Eq. (12),
where fx is the fraction present in each state during the
pulse (evaluated by spectroscopic or other experiments)
Hpulse ¼ fUHU;pulse þ fIHI;pulse þ fNHN;pulse: ð12ÞFor each amide, the contribution of the U state to Hpulse
(HU;pulse) at each experimental pH can be obtained bycalculation from Eq. (13), using the standard calibra-
tions for kch [14–16]
HU;pulse ¼ 1� expð�kchtpÞ: ð13Þ
The contribution of the N state (HN;pulse) is obtained by
passing deuterated native protein through the experi-
mental protocol (for each pulse time and/or pulse pH).
The observed H-label of the native state (HN;obs) is cor-
rected for background labeling (HN;bkgd; from a no-pulse
experiment) to obtain the H-labeling of the native state
during the pulse (HN;pulse), just as described before (Eq.
(11)) but with N as the starting material.The results are visualized as in Fig. 4. The data are fit
using Eq. (7) to obtain kop and kcl at each measured
residue. In this application, HI;pulse is Hlabel in Eq. (7).
The Hobs data points can be fit directly using the inde-
pendently evaluated fixed parameters in the fitting
equations. Alternatively each Hobs data point can be
separately recomputed as the HI;pulse value and then all
fit to Eq. (7).For intermediates that are not very stable
(Kop > 0:01), it is necessary to fit the data with the
complete HX equation (Eq. (7)) rather than with the
steady-state equation (Eqs. (2) or (3)). This is because
the steady-state equation does not account for the
fraction of the open form that gets immediately
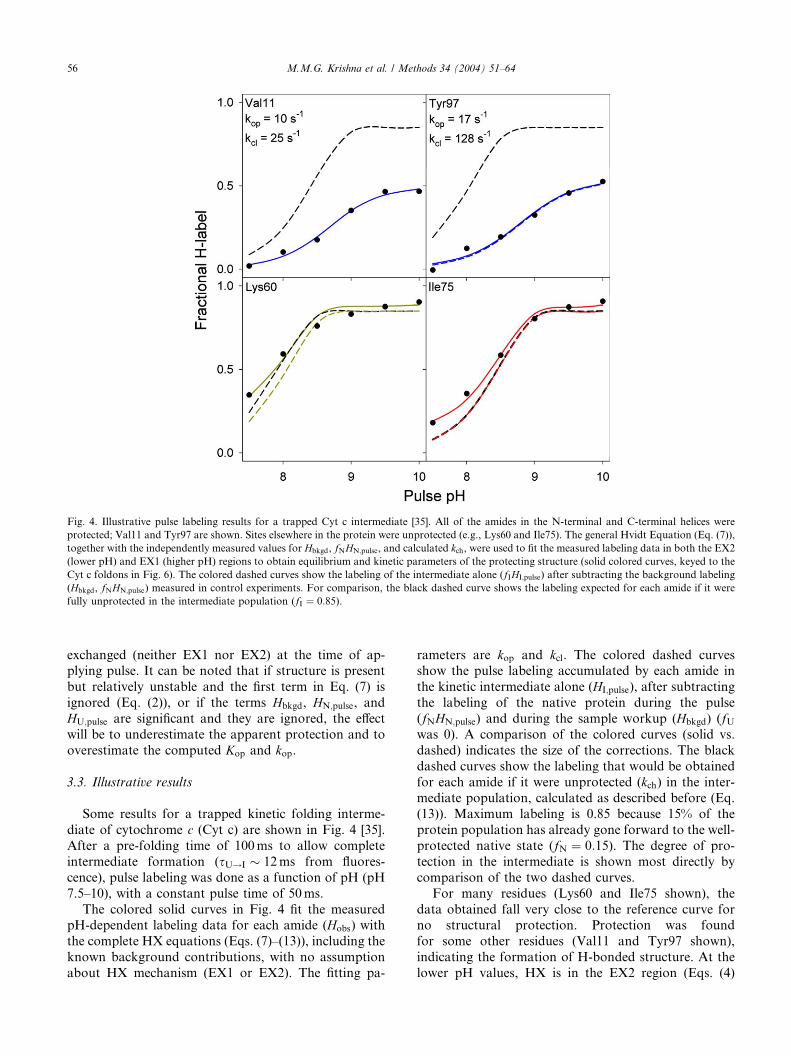
Fig. 4. Illustrative pulse labeling results for a trapped Cyt c intermediate [35]. All of the amides in the N-terminal and C-terminal helices were
protected; Val11 and Tyr97 are shown. Sites elsewhere in the protein were unprotected (e.g., Lys60 and Ile75). The general Hvidt Equation (Eq. (7)),
together with the independently measured values for Hbkgd, fNHN;pulse, and calculated kch, were used to fit the measured labeling data in both the EX2
(lower pH) and EX1 (higher pH) regions to obtain equilibrium and kinetic parameters of the protecting structure (solid colored curves, keyed to the
Cyt c foldons in Fig. 6). The colored dashed curves show the labeling of the intermediate alone (fIHI;pulse) after subtracting the background labeling
(Hbkgd, fNHN;pulse) measured in control experiments. For comparison, the black dashed curve shows the labeling expected for each amide if it were
fully unprotected in the intermediate population (fI ¼ 0:85).
56 M.M.G. Krishna et al. / Methods 34 (2004) 51–64
exchanged (neither EX1 nor EX2) at the time of ap-plying pulse. It can be noted that if structure is present
but relatively unstable and the first term in Eq. (7) is
ignored (Eq. (2)), or if the terms Hbkgd, HN;pulse, and
HU;pulse are significant and they are ignored, the effect
will be to underestimate the apparent protection and to
overestimate the computed Kop and kop.
3.3. Illustrative results
Some results for a trapped kinetic folding interme-
diate of cytochrome c (Cyt c) are shown in Fig. 4 [35].
After a pre-folding time of 100ms to allow complete
intermediate formation (sU!I � 12ms from fluores-
cence), pulse labeling was done as a function of pH (pH
7.5–10), with a constant pulse time of 50ms.
The colored solid curves in Fig. 4 fit the measuredpH-dependent labeling data for each amide (Hobs) with
the complete HX equations (Eqs. (7)–(13)), including the
known background contributions, with no assumption
about HX mechanism (EX1 or EX2). The fitting pa-
rameters are kop and kcl. The colored dashed curvesshow the pulse labeling accumulated by each amide in
the kinetic intermediate alone (HI;pulse), after subtracting
the labeling of the native protein during the pulse
(fNHN;pulse) and during the sample workup (Hbkgd) (fUwas 0). A comparison of the colored curves (solid vs.
dashed) indicates the size of the corrections. The black
dashed curves show the labeling that would be obtained
for each amide if it were unprotected (kch) in the inter-mediate population, calculated as described before (Eq.
(13)). Maximum labeling is 0.85 because 15% of the
protein population has already gone forward to the well-
protected native state (fN ¼ 0:15). The degree of pro-
tection in the intermediate is shown most directly by
comparison of the two dashed curves.
For many residues (Lys60 and Ile75 shown), the
data obtained fall very close to the reference curve forno structural protection. Protection was found
for some other residues (Val11 and Tyr97 shown),
indicating the formation of H-bonded structure. At the
lower pH values, HX is in the EX2 region (Eqs. (4)
M.M.G. Krishna et al. / Methods 34 (2004) 51–64 57
and (5)) and exchange is sensitive to structural stabil-ity, i.e., to the repeated breaking and reformation of
the protecting H-bonds during the labeling pulse. The
horizontal separation between the two dashed lines is
controlled by the stability of the protecting structure,
i.e. the ratio of kop and kcl (Fig. 4 and Fig. 2E). At
higher pH, labeling reaches a plateau determined by
the structural opening rate (EX1 region, Eq. (6)). The
level at which the label levels off at high pH is con-trolled by the opening rate, kop, and the fraction of the
open form at the time of applying the pulse,
½NHðopenÞ�t¼0 (Fig. 4 and Fig. 2E). Thus, the pH-de-
pendent data provide site-resolved information on
equilibrium stability and on structural opening and
closing rates in the trapped intermediate.
The Cyt c experiment followed 46 amides [35]. All of
the residues in the N-terminal and C-terminal heliceswere significantly protected, while most amides else-
where in the protein were labeled at close to their ref-
erence unprotected rates. This pattern of protection
shows that the entire N- and C-terminal helices are
formed in the kinetic intermediate. Protection (DGHX) is
at a maximum, about 1.4 kcal/mol, where the two helices
normally interact in the native protein. They fray in
both directions from the interaction region, with se-quentially decreasing protection apparently due to a
progression in refolding (kcl) rather than unfolding rates
(kop). A surprising suggestion is that helix propagation
may occur far more slowly in the condensed milieu of
the globular intermediate than one finds for isolated
helices. The derived kop and kcl values show that the
intermediate unfolds and refolds repeatedly during the
time it spends in the trapped state, with the averagerefolding rate matching the rate of initial intermediate
formation independently measured by fluorescence.
3.4. Experimental design
One wants to maximize intermediate occupation and
the number of sites that are measured. Intermediate
occupation is increased when the rate of formation(U ! I) is high and loss rate (I ! N) is low. Low de-
naturant tends to increase the formation rate and sta-
bility of the intermediate. It may also decrease the
subsequent forward rate if the blocking barrier repre-
sents a misfolding error that requires some conforma-
tional unfolding in order to repair the error and allow
forward folding to resume [35,36]. Optimum folding
conditions and pulse time can be ascertained by initialspectroscopic studies.
Published pulse labeling experiments have generally
measured only a small number of amides. This degrades
the ability to properly document intermediate structure.
Another major issue is additional labeling during the
sample workup and proper correction for it (Hbkgd
above). To minimize background labeling, temperature
and pH during the sample workup should be kept low(tested in trial experiments) and workup time should be
minimized.
Protein concentration should be kept low to avoid
aggregation, which may be more prevalent than has
generally been appreciated [37,38]. Ampholytes such as
Na2SO4 can help to stabilize intermediates but may also
promote aggregation [39]. 15N-labeled samples reduce
the protein concentrations necessary for the experiment.Pulse strength (time and pH) should be adjusted to
label unprotected sites while minimizing background la-
beling of protected sites. Relatively high pH is necessary
to ensure full labeling of exposed sites during a short
pulse. Accordingly almost all published pulse labeling
experiments have come dangerously close to the EX1 re-
gion. The favorable view is that the experiment can then
access both equilibrium and kinetic parameters. Unfor-tunately, published analyses have always assumed EX2
behavior (Eqs. (2)–(5)). The more complete data analysis
described above is required. Rate constants in the EX1
region are best measured when the pulse time is about
0:7=kop [40] so that amides are about 50% labeled.
The possibly disruptive effects of a high pH pulse can
be monitored spectroscopically in trial stopped-flow
experiments [40,57]. Pulse pH and time should beselected accordingly. The actual buffer mixtures to
be used, chosen for their pertinent pKa values, should
be tested in trial mixing experiments.
4. Native state HX
The HX pulse labeling experiment is applicable onlywhen some intermediate is populated to a significant
level in 3-state kinetic folding. A different approach, the
native state HX method, avoids the problem of hidden
kinetic intermediates by studying intermediates that
exist as infinitesimally populated high energy states un-
der native conditions. Thermodynamic principles re-
quire that protein molecules must constantly unfold and
refold even under native conditions, cycling through allpossible higher energy forms. These forms include all of
the normal folding pathway intermediates. Under fa-
vorable conditions, this otherwise invisible cycling and
the forms visited can be made to determine the HX
behavior of the amino acids that they expose. The
identity of the partially folded forms and their thermo-
dynamic and kinetic properties is then revealed by the
protected and unprotected sites and their measurableHX properties.
This behavior would have been obvious long ago but
for several complications, especially the fact that it is
often obscured by small local fluctuations dominating
the measured HX. Minimally distorted local fluctua-
tional forms that break protecting H-bonds one at a
time [41,42] do not provide information about partially
58 M.M.G. Krishna et al. / Methods 34 (2004) 51–64
structured folding intermediates. The native state HXmethod exploits conditions—including mildly destabi-
lizing denaturant, temperature, pressure, or pH—that
selectively amplify the larger unfolding reactions so that
they come to dominate exchange. Direct HX measure-
ments can then characterize the high energy, partially
unfolded intermediate forms. Under EX2 conditions,
HX rates of the exposed sites depend on equilibrium
unfolding, and lead to the free energy level of the indi-vidually recognizable intermediate forms (Eqs. (4) and
(5)). Under EX1 conditions, HX rate depends on the
rate of unfolding (Eq. (6)), providing a different basis
for identifying intermediates and in addition their ki-
netic parameters.
4.1. Equilibrium mode NHX (EX2 conditions)
Equilibrium NHX experiments are straightforward.
One places the protein in D2O under mildly destabilizing
conditions and records 2D NMR spectra as time pro-
gresses. The decreasing amplitude of each crosspeak can
be fit to a single exponential to obtain the exchange rate
constant (kex). A direct comparison of measured rate
with the computed unprotected rate (kch) for the same
amide under the same conditions yields the free energylevel of the controlling opening (Eqs. (4) and (5) under
EX2 conditions). When the same experiment is repeated
under mildly destabilizing conditions, sizeable unfolding
reactions are selectively promoted and can come to
dominate measured exchange. The unfoldings can then
be identified and characterized.
4.1.1. Illustrative results
As an example, Fig. 5A shows HX data for the amide
hydrogens in the 60�s helix of Cyt c (Green helix in Fig. 6).
At low guanidinium chloride (GdmCl) concentration,
most of the amides exchange through local fluctuations.
This is shown by the lack of dependence of DGHX on de-
naturant concentration (m � 0), indicating that little new
surface is exposed in the transient deprotection steps that
expose the different hydrogens to exchange. In contrast,the computed DGHX of Leu68 (Eqs. (4) and (5)) decreases
sharply with increasing denaturant. Its exchange is
dominated by some large unfolding reaction. At suffi-
ciently high denaturant, but still far below the global
unfolding transition, all of the amide hydrogens that are
protected in the 60�s helix merge into a common HX
isotherm represented by Leu68, indicating that they have
all become dominated by the same large unfolding. Thisresult demonstrates a reversibly populated high energy
state with the entire 60�s helix unfolded as a cooperative
unit. The data in Fig. 5A define the free energy level
(DGHX) of this partially unfolded form (PUF) and its
surface exposure (m value) relative to N [43]. (Other ex-
periments show that the Red andYellowX-loops are alsounfolded in this PUF; see scheme (14).)
Fig. 5B shows the cooperative unfolding of anotherunit, the 40�s and 50�s (Nested yellow) X-loop of Cyt c.
The low pH used to make the exchange of these hy-
drogens measurably slow also serves as the destabilant.
As solution pH is decreased, all nine measurable amide
hydrogens in the Nested yellow X-loop merge to the
same DGHX. A pH-dependent subglobal unfolding co-
mes to dominate the various local unfolding reactions
that control HX of the different amides at higher pH.Only the sequential amides in the Nested yellow X-loopshow this behavior. A similar result is seen when HX is
measured as a function of GdmCl concentration at pH
7. These results define a partially unfolded state with the
entire Nested yellow X-loop cooperatively unfolded [20].
(The selective unfolding of this loop seems to account
for the low pH equilibrium molten globule state of Cyt c
[20].)
4.1.2. Interpretation
The same strategy has revealed five unfolding units in
Cyt c. Fig. 6A shows their structural identity. Each
folding unit (foldon) represents an entire secondary
structural unit or a grouping of two secondary elements.
A quantity of additional experiments indicate that these
foldons determine the steps in a sequential unfoldingpathway [20,40,43–50]. The Nested yellow loop unfolds
first, followed by the Red loop, and so on as follows:
NRYGB¡nRYGB¡nrYGB¡nryGB¡nrygB¡nrygb:
ð14ÞBecause these experiments are done at equilibrium
native conditions, each unfolding reaction must be mat-
ched by an equal and opposite refolding reaction, as in-dicated. Thus, the major unfolding sequence determined
by NHX experiments defines also the major refolding
pathway.
Fig. 6B shows the dependence of each unfolding re-
action on denaturant. From these ‘‘crossover curves,’’
interesting relationships can be inferred. For example, at
high denaturant the usual melting experiment will ap-
pear to show a cooperative 2-state unfolding transitionbecause only the native and globally unfolded states are
significantly populated [51]. However, under more stable
conditions the partially unfolded forms are more pop-
ulated than the U state. Here, the protein unfolds and
refolds in a multi-step way that can be detected and
studied by native state HX.
These results have broad implications. The Cyt c
protein is constructed of foldon building blocks that areessentially coincident with its component intrinsically
cooperative secondary structural units. The cooperative
unit foldons naturally generate a stepwise folding
pathway. The foldons fall into place one at a time to
progressively build the native structure. The pathway
sequence results from the way in which the foldons are
designed to interact in the native protein (Fig. 6A)
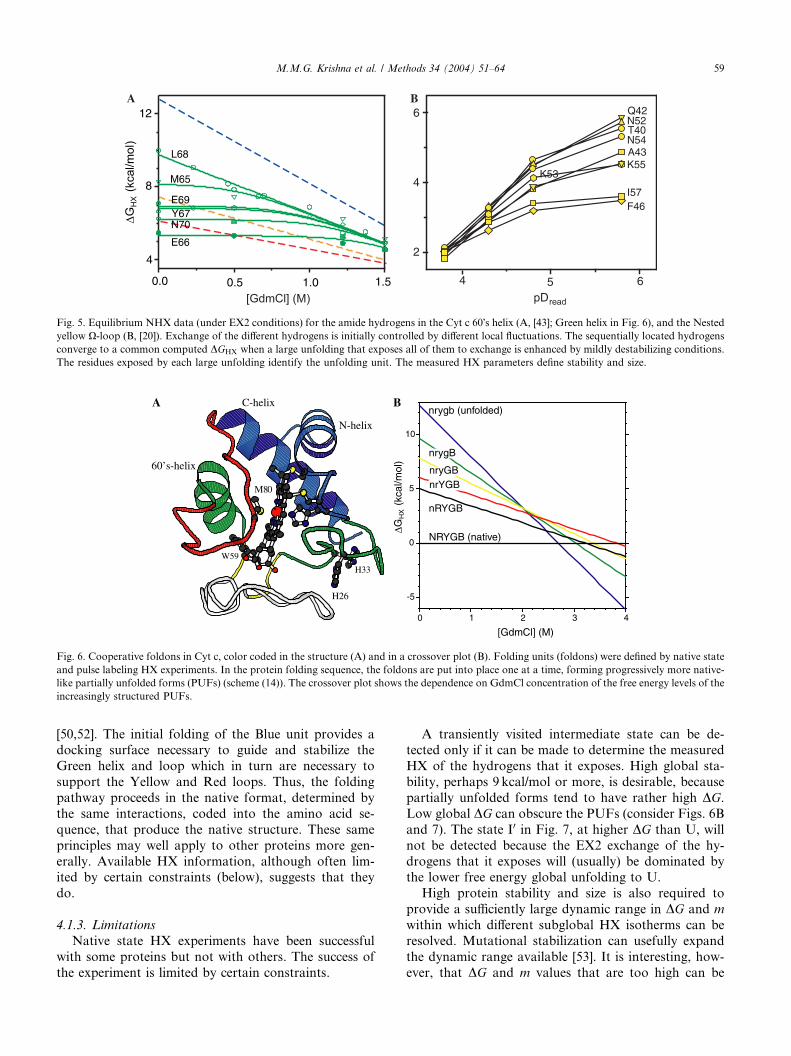
Fig. 6. Cooperative foldons in Cyt c, color coded in the structure (A) and in a crossover plot (B). Folding units (foldons) were defined by native state
and pulse labeling HX experiments. In the protein folding sequence, the foldons are put into place one at a time, forming progressively more native-
like partially unfolded forms (PUFs) (scheme (14)). The crossover plot shows the dependence on GdmCl concentration of the free energy levels of the
increasingly structured PUFs.
Fig. 5. Equilibrium NHX data (under EX2 conditions) for the amide hydrogens in the Cyt c 60�s helix (A, [43]; Green helix in Fig. 6), and the Nested
yellow X-loop (B, [20]). Exchange of the different hydrogens is initially controlled by different local fluctuations. The sequentially located hydrogens
converge to a common computed DGHX when a large unfolding that exposes all of them to exchange is enhanced by mildly destabilizing conditions.
The residues exposed by each large unfolding identify the unfolding unit. The measured HX parameters define stability and size.
M.M.G. Krishna et al. / Methods 34 (2004) 51–64 59
[50,52]. The initial folding of the Blue unit provides adocking surface necessary to guide and stabilize the
Green helix and loop which in turn are necessary to
support the Yellow and Red loops. Thus, the folding
pathway proceeds in the native format, determined by
the same interactions, coded into the amino acid se-
quence, that produce the native structure. These same
principles may well apply to other proteins more gen-
erally. Available HX information, although often lim-ited by certain constraints (below), suggests that they
do.
4.1.3. Limitations
Native state HX experiments have been successful
with some proteins but not with others. The success of
the experiment is limited by certain constraints.
A transiently visited intermediate state can be de-tected only if it can be made to determine the measured
HX of the hydrogens that it exposes. High global sta-
bility, perhaps 9 kcal/mol or more, is desirable, because
partially unfolded forms tend to have rather high DG.Low global DG can obscure the PUFs (consider Figs. 6B
and 7). The state I0 in Fig. 7, at higher DG than U, will
not be detected because the EX2 exchange of the hy-
drogens that it exposes will (usually) be dominated bythe lower free energy global unfolding to U.
High protein stability and size is also required to
provide a sufficiently large dynamic range in DG and m
within which different subglobal HX isotherms can be
resolved. Mutational stabilization can usefully expand
the dynamic range available [53]. It is interesting, how-
ever, that DG and m values that are too high can be
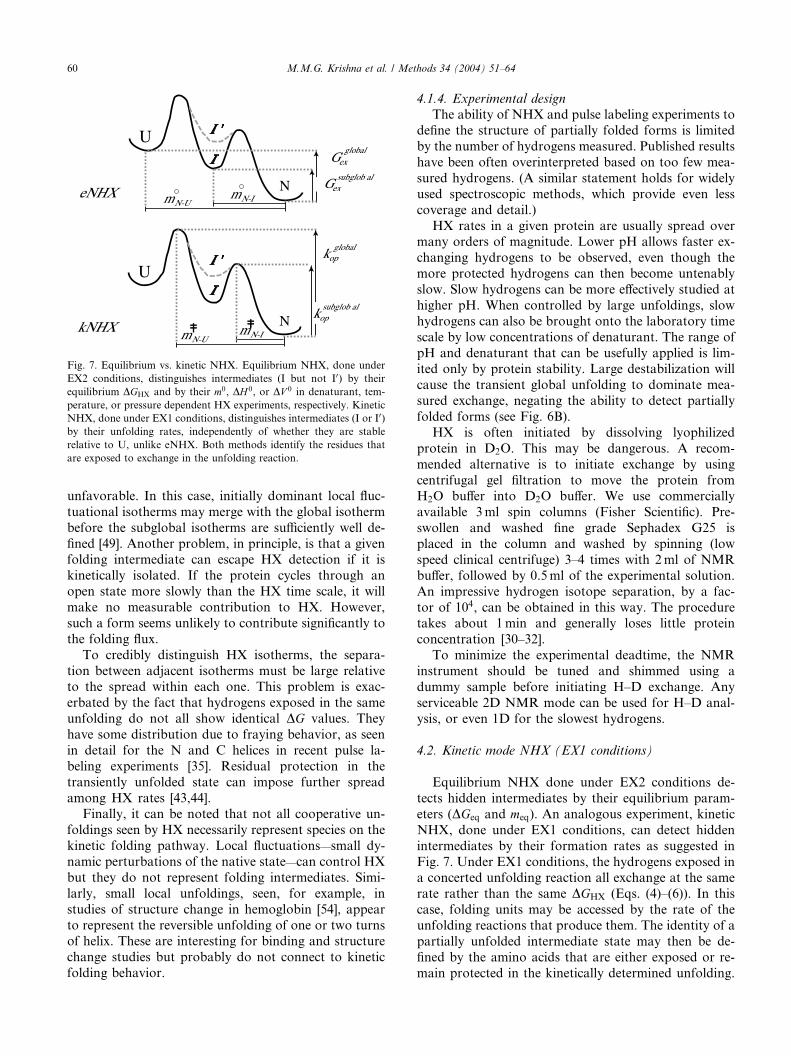
Fig. 7. Equilibrium vs. kinetic NHX. Equilibrium NHX, done under
EX2 conditions, distinguishes intermediates (I but not I0) by their
equilibrium DGHX and by their m0, DH 0, or DV 0 in denaturant, tem-
perature, or pressure dependent HX experiments, respectively. Kinetic
NHX, done under EX1 conditions, distinguishes intermediates (I or I0)by their unfolding rates, independently of whether they are stable
relative to U, unlike eNHX. Both methods identify the residues that
are exposed to exchange in the unfolding reaction.
60 M.M.G. Krishna et al. / Methods 34 (2004) 51–64
unfavorable. In this case, initially dominant local fluc-
tuational isotherms may merge with the global isotherm
before the subglobal isotherms are sufficiently well de-
fined [49]. Another problem, in principle, is that a givenfolding intermediate can escape HX detection if it is
kinetically isolated. If the protein cycles through an
open state more slowly than the HX time scale, it will
make no measurable contribution to HX. However,
such a form seems unlikely to contribute significantly to
the folding flux.
To credibly distinguish HX isotherms, the separa-
tion between adjacent isotherms must be large relativeto the spread within each one. This problem is exac-
erbated by the fact that hydrogens exposed in the same
unfolding do not all show identical DG values. They
have some distribution due to fraying behavior, as seen
in detail for the N and C helices in recent pulse la-
beling experiments [35]. Residual protection in the
transiently unfolded state can impose further spread
among HX rates [43,44].Finally, it can be noted that not all cooperative un-
foldings seen by HX necessarily represent species on the
kinetic folding pathway. Local fluctuations—small dy-
namic perturbations of the native state—can control HX
but they do not represent folding intermediates. Simi-
larly, small local unfoldings, seen, for example, in
studies of structure change in hemoglobin [54], appear
to represent the reversible unfolding of one or two turnsof helix. These are interesting for binding and structure
change studies but probably do not connect to kinetic
folding behavior.
4.1.4. Experimental design
The ability of NHX and pulse labeling experiments to
define the structure of partially folded forms is limited
by the number of hydrogens measured. Published results
have been often overinterpreted based on too few mea-
sured hydrogens. (A similar statement holds for widely
used spectroscopic methods, which provide even less
coverage and detail.)
HX rates in a given protein are usually spread overmany orders of magnitude. Lower pH allows faster ex-
changing hydrogens to be observed, even though the
more protected hydrogens can then become untenably
slow. Slow hydrogens can be more effectively studied at
higher pH. When controlled by large unfoldings, slow
hydrogens can also be brought onto the laboratory time
scale by low concentrations of denaturant. The range of
pH and denaturant that can be usefully applied is lim-ited only by protein stability. Large destabilization will
cause the transient global unfolding to dominate mea-
sured exchange, negating the ability to detect partially
folded forms (see Fig. 6B).
HX is often initiated by dissolving lyophilized
protein in D2O. This may be dangerous. A recom-
mended alternative is to initiate exchange by using
centrifugal gel filtration to move the protein fromH2O buffer into D2O buffer. We use commercially
available 3ml spin columns (Fisher Scientific). Pre-
swollen and washed fine grade Sephadex G25 is
placed in the column and washed by spinning (low
speed clinical centrifuge) 3–4 times with 2ml of NMR
buffer, followed by 0.5ml of the experimental solution.
An impressive hydrogen isotope separation, by a fac-
tor of 104, can be obtained in this way. The proceduretakes about 1min and generally loses little protein
concentration [30–32].
To minimize the experimental deadtime, the NMR
instrument should be tuned and shimmed using a
dummy sample before initiating H–D exchange. Any
serviceable 2D NMR mode can be used for H–D anal-
ysis, or even 1D for the slowest hydrogens.
4.2. Kinetic mode NHX (EX1 conditions)
Equilibrium NHX done under EX2 conditions de-
tects hidden intermediates by their equilibrium param-
eters (DGeq and meq). An analogous experiment, kinetic
NHX, done under EX1 conditions, can detect hidden
intermediates by their formation rates as suggested in
Fig. 7. Under EX1 conditions, the hydrogens exposed ina concerted unfolding reaction all exchange at the same
rate rather than the same DGHX (Eqs. (4)–(6)). In this
case, folding units may be accessed by the rate of the
unfolding reactions that produce them. The identity of a
partially unfolded intermediate state may then be de-
fined by the amino acids that are either exposed or re-
main protected in the kinetically determined unfolding.
M.M.G. Krishna et al. / Methods 34 (2004) 51–64 61
This approach does not require that the intermediatesare ever visibly populated or even that they exist at free
energy levels lower than U (I0 as well as I in Fig. 7). In
addition, kinetic NHX results can show the temporal
order in which recognizably different partially unfolded
states are produced, and may indicate whether unfolding
and refolding occur through one or multiple pathways.
4.2.1. Experimental design and analysis
To reach EX1 conditions, where kch exceeds kcl (Eq.(6)), high pH will generally be required. For example, at
pH 10 and 20 �C, kch for an average amide is �104 s�1.
This HX rate may exceed foldon reclosing rates, pro-
ducing EX1 behavior. As for equilibrium NHX, the ki-
netic NHX method also requires that the large unfolding
that leads to an intermediate form must dominate the
exchangeof the hydrogens that it exposes. In this case, lowconcentrations of denaturant or other mild destabilants
can be useful in the competition with local fluctuational
exchange because they promote kop. In addition dena-
turant will slow reclosing, promoting the EX1 condition
[40]. The dependence of protein stability on these pa-
rameters should be characterized initially.
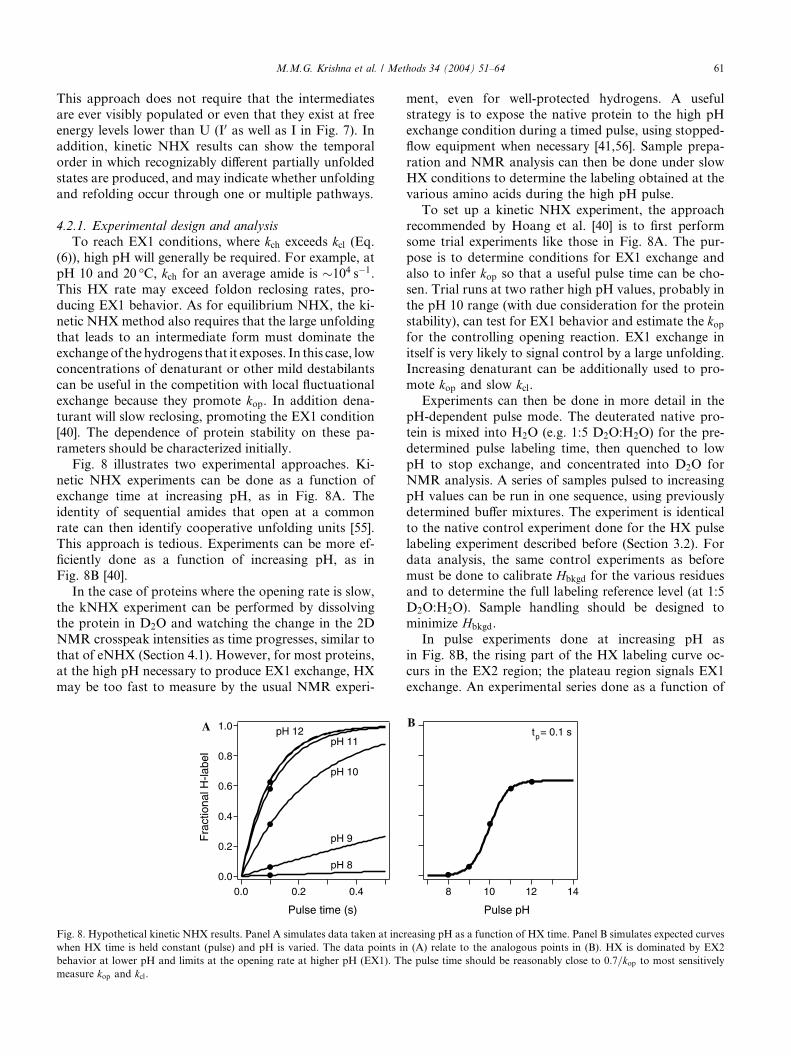
Fig. 8 illustrates two experimental approaches. Ki-
netic NHX experiments can be done as a function ofexchange time at increasing pH, as in Fig. 8A. The
identity of sequential amides that open at a common
rate can then identify cooperative unfolding units [55].
This approach is tedious. Experiments can be more ef-
ficiently done as a function of increasing pH, as in
Fig. 8B [40].
In the case of proteins where the opening rate is slow,
the kNHX experiment can be performed by dissolvingthe protein in D2O and watching the change in the 2D
NMR crosspeak intensities as time progresses, similar to
that of eNHX (Section 4.1). However, for most proteins,
at the high pH necessary to produce EX1 exchange, HX
may be too fast to measure by the usual NMR experi-
Fig. 8. Hypothetical kinetic NHX results. Panel A simulates data taken at inc
when HX time is held constant (pulse) and pH is varied. The data points in
behavior at lower pH and limits at the opening rate at higher pH (EX1). Th
measure kop and kcl.
ment, even for well-protected hydrogens. A usefulstrategy is to expose the native protein to the high pH
exchange condition during a timed pulse, using stopped-
flow equipment when necessary [41,56]. Sample prepa-
ration and NMR analysis can then be done under slow
HX conditions to determine the labeling obtained at the
various amino acids during the high pH pulse.
To set up a kinetic NHX experiment, the approach
recommended by Hoang et al. [40] is to first performsome trial experiments like those in Fig. 8A. The pur-
pose is to determine conditions for EX1 exchange and
also to infer kop so that a useful pulse time can be cho-
sen. Trial runs at two rather high pH values, probably in
the pH 10 range (with due consideration for the protein
stability), can test for EX1 behavior and estimate the kopfor the controlling opening reaction. EX1 exchange in
itself is very likely to signal control by a large unfolding.Increasing denaturant can be additionally used to pro-
mote kop and slow kcl.Experiments can then be done in more detail in the
pH-dependent pulse mode. The deuterated native pro-
tein is mixed into H2O (e.g. 1:5 D2O:H2O) for the pre-
determined pulse labeling time, then quenched to low
pH to stop exchange, and concentrated into D2O for
NMR analysis. A series of samples pulsed to increasingpH values can be run in one sequence, using previously
determined buffer mixtures. The experiment is identical
to the native control experiment done for the HX pulse
labeling experiment described before (Section 3.2). For
data analysis, the same control experiments as before
must be done to calibrate Hbkgd for the various residues
and to determine the full labeling reference level (at 1:5
D2O:H2O). Sample handling should be designed tominimize Hbkgd.
In pulse experiments done at increasing pH as
in Fig. 8B, the rising part of the HX labeling curve oc-
curs in the EX2 region; the plateau region signals EX1
exchange. An experimental series done as a function of
reasing pH as a function of HX time. Panel B simulates expected curves
(A) relate to the analogous points in (B). HX is dominated by EX2
e pulse time should be reasonably close to 0:7=kop to most sensitively
62 M.M.G. Krishna et al. / Methods 34 (2004) 51–64
pH can measure the entire transition between EX2 andEX1 conditions. Results will be most accurate when the
pulse time is set in a range near 0:7=kop [40].
Since the pulse labeling is done with the native pro-
tein, Eq. (7) simplifies to Eq. (15). The usual HX time
variable becomes the constant pulse time (tp) and kex is
given by Eq. (3) with kch set at the computed unpro-
tected HX rate [14–16]. Hlabel (¼ Hpulse) is calculated
from Hobs and Hbkgd (Eq. (11))
Hlabel ¼ 1� expð�kextpÞ: ð15Þ
For each amide, the pH-dependent data (as in Fig. 8B)
can then be fitwithEq. (15), yielding kop and kcl, and henceKop and DGHX. A concerted unfolding unit can then be
recognized by a common kop value shared by sequential
amides. Eq. (15) showswhy the experiment can be done as
a function of either pulse time or pH.
The laboratory work involved in a pH-dependent
series, or in the limited pH-dependent trial suggested,
including buffer preparation, labeling experiments,
sample workup, and NMR analysis each requires aboutone week.
It is important to note that any change in kex as a
function of solution pH can also arise from the pH de-
pendence of protein stability and also kop and kcl [17].This possibility can be tested by monitoring the change
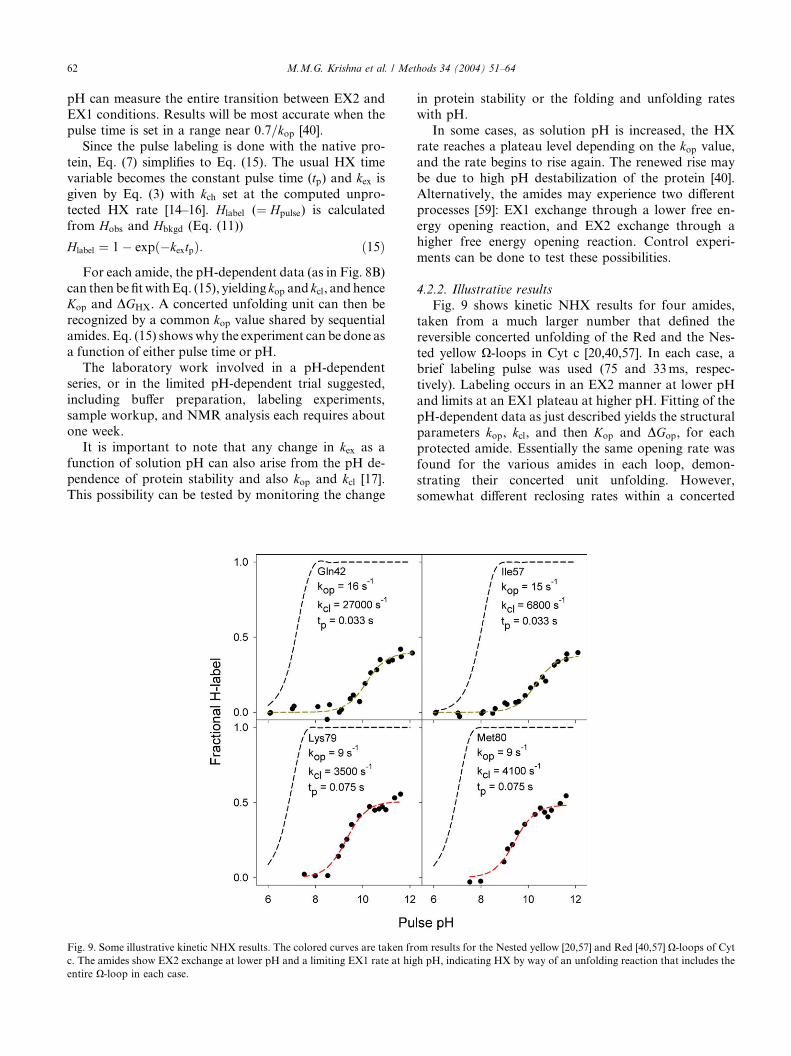
Fig. 9. Some illustrative kinetic NHX results. The colored curves are taken fro
c. The amides show EX2 exchange at lower pH and a limiting EX1 rate at hig
entire X-loop in each case.
in protein stability or the folding and unfolding rateswith pH.
In some cases, as solution pH is increased, the HX
rate reaches a plateau level depending on the kop value,
and the rate begins to rise again. The renewed rise may
be due to high pH destabilization of the protein [40].
Alternatively, the amides may experience two different
processes [59]: EX1 exchange through a lower free en-
ergy opening reaction, and EX2 exchange through ahigher free energy opening reaction. Control experi-
ments can be done to test these possibilities.
4.2.2. Illustrative results
Fig. 9 shows kinetic NHX results for four amides,
taken from a much larger number that defined the
reversible concerted unfolding of the Red and the Nes-
ted yellow X-loops in Cyt c [20,40,57]. In each case, abrief labeling pulse was used (75 and 33ms, respec-
tively). Labeling occurs in an EX2 manner at lower pH
and limits at an EX1 plateau at higher pH. Fitting of the
pH-dependent data as just described yields the structural
parameters kop, kcl, and then Kop and DGop, for each
protected amide. Essentially the same opening rate was
found for the various amides in each loop, demon-
strating their concerted unit unfolding. However,somewhat different reclosing rates within a concerted
m results for the Nested yellow [20,57] and Red [40,57] X-loops of Cyth pH, indicating HX by way of an unfolding reaction that includes the
M.M.G. Krishna et al. / Methods 34 (2004) 51–64 63
unit have been commonly observed, perhaps due tofraying behavior [35].
The same kinetic NHX experiments were able to rank
the temporal order of unfolding for the known Cyt c
foldons [20,40]. The results placed the foldons in the
same pathway order previously inferred from equilib-
rium native state and pulse labeling experiments (reac-
tion scheme (14)).
5. Final note
The methods summarized here were designed to study
protein folding behavior. The results so far obtained lead
to an interesting picture of protein structure itself. It ap-
pears that globular proteins are constructed of recogniz-
ably separate, individually cooperative building blocks,termed foldons. The foldons maintain their separately
cooperative nature within the native protein. Stepwise
protein folding pathways arise as a consequence of this
unit substructure and the way that the units interact in the
native protein. Protein folding, it seems, is an epiphe-
nomenon of the foldon substructure. Recent work further
suggests that the very same foldon substructure can un-
derlie a number of other functional and evolutionaryproperties, in addition to the folding process [20,57].
Acknowledgments
This work was supported by research grants from the
National Institutes of Health and the Mathers Chari-table Foundation. We thank the members of our labo-
ratory, past and present, who have contributed to this
work.
References
[1] J.M. Scholtz, A.D. Robertson, Methods Mol. Biol. 40 (1995) 291–
311.
[2] A.N. Hoofnagle, K.A. Resing, N.G. Ahn, Annu. Rev. Biophys.
Biomol. Struct. 18 (2003) 18.
[3] K. Linderstrøm-Lang, in: A. Neuberger (Ed.), Symposium on
Protein Structure, London, 1958, pp. 23–24.
[4] A. Hvidt, S.O. Nielsen, Adv. Protein Chem. 21 (1966) 287–386.
[5] S.W. Englander, N.R. Kallenbach, Quart. Rev. Biophys. 16 (1983)
521–655.
[6] C.K. Woodward, Curr. Opin. Struct. Biol. 4 (1994) 112–116.
[7] C.E. Dempsey, Prog. NMR Spectrosc. 39 (2001) 135–170.
[8] M. Eigen, Angew. Chem. Int. Ed. 3 (1964) 1–19.
[9] S.W. Englander, N.W. Downer, H. Teitelbaum, Annu. Rev.
Biochem. 41 (1972) 903–924.
[10] S. Nonin, F. Jiang, D.J. Patel, J. Mol. Biol. 268 (1997) 359–374.
[11] K. Linderstrøm-Lang, Chem. Soc. Spec. Publ. 2 (1955) 1–20.
[12] A. Hvidt, C.R. Trav. Lab. Carlsberg 34 (1964) 299–317.
[13] R.S. Molday, S.W. Englander, R.G. Kallen, Biochemistry 11
(1972) 150–158.
[14] Y. Bai, J.S. Milne, L. Mayne, S.W. Englander, Proteins: Struct.
Funct. Genet. 17 (1993) 75–86.
[15] G.P. Connelly, Y. Bai, M.-F. Jeng, S.W. Englander, Proteins:
Struct. Funct. Genet. 17 (1993) 87–92.
[16] http://hx2.med.upenn.edu/download.html.
[17] C.B. Arrington, A.D. Robertson, Methods Enzymol. 323 (2000)
104–124.
[18] B.D. Hilton, C.K. Woodward, Biochemistry 17 (1978) 3325–3332.
[19] S. Mori, C. Abeygunawardana, J.M. Berg, P.C.M. van Zijl,
J. Am. Chem. Soc. 119 (1997) 6844–6852.
[20] M.M.G. Krishna, Y. Lin, J.N. Rumbley, S.W. Englander, J. Mol.
Biol. 331 (2003) 29–36.
[21] H. Qian, S.I. Chan, J. Mol. Biol. 286 (1999) 607–616.
[22] P.S. Kim, R.L. Baldwin, Annu. Rev. Biochem. 51 (1982) 459–489.
[23] H. Roder, Methods Enzymol. 176 (1989) 447–473.
[24] S.T. Gladwin, P.A. Evans, Fold. Des. 1 (1996) 407–417.
[25] H. Roder, G.A. Elove, S.W. Englander, Nature 335 (1988) 700–
704.
[26] J.B. Udgaonkar, R.L. Baldwin, Nature 335 (1988) 694–699.
[27] S.W. Englander, L. Mayne, Annu. Rev. Biophys. Biomol. Struct.
21 (1992) 243–265.
[28] R.L. Baldwin, Curr. Opin. Struct. Biol. 3 (1993) 84–91.
[29] C. Woodward, Trends Biochem. Sci. 18 (1993) 359–360.
[30] M.-F. Jeng, S.W. Englander, J. Mol. Biol. 221 (1991) 1045–1061.
[31] S.W. Englander, J.J. Englander, Methods Enzymol. 26 (1973)
406–413.
[32] S.W. Englander, J.J. Englander, Methods Enzymol. 49 (1978) 24–
39.
[33] J.B. Udgaonkar, R.L. Baldwin, Proc. Natl. Acad. Sci. USA 87
(1990) 8197–8201.
[34] G.A. El€ove, H. Roder, in: G. Georgiou, E.D. Bernardez-Clark
(Eds.), Protein Refolding, American Chemical Society, Washing-
ton, DC, 1991, pp. 50–63.
[35] M.M.G. Krishna, Y. Lin, L. Mayne, S.W. Englander, J. Mol.
Biol. 334 (2003) 501–513.
[36] T.R. Sosnick, L. Mayne, R. Hiller, S.W. Englander, Nat. Struct.
Biol. 1 (1994) 149–156.
[37] M. Silow, M. Oliveberg, Proc. Natl. Acad. Sci. USA 94 (1997)
6084–6086.
[38] J.P. Nawrocki, R.-A. Chu, L.K. Pannell, Y. Bai, J. Mol. Biol. 293
(1999) 991–995.
[39] B.A. Krantz, L. Mayne, J. Rumbley, S.W. Englander, T.R.
Sosnick, J. Mol. Biol. 324 (2002) 359–371.
[40] L. Hoang, S. Bedard, M.M.G. Krishna, Y. Lin, S.W. Englander,
Proc. Natl. Acad. Sci. USA 99 (2002) 12173–12178.
[41] J.S. Milne, L. Mayne, H. Roder, A.J. Wand, S.W. Englander,
Protein Sci. 7 (1998) 739–745.
[42] H. Maity, W.K. Lim, J.N. Rumbley, S.W. Englander, Protein Sci.
12 (2003) 153–160.
[43] Y. Bai, T.R. Sosnick, L. Mayne, S.W. Englander, Science 269
(1995) 192–197.
[44] Y. Bai, S.W. Englander, Proteins: Struct. Funct. Genet. 24 (1996)
145–151.
[45] S.W. Englander, L. Mayne, Y. Bai, T.R. Sosnick, Protein Sci. 6
(1997) 1101–1109.
[46] S.W. Englander, T.R. Sosnick, L.C. Mayne, M. Shtilerman, P.X.
Qi, Y. Bai, Acc. Chem. Res. 31 (1998) 737–744.
[47] Y. Xu, L. Mayne, S.W. Englander, Nat. Struct. Biol. 5 (1998) 774–
778.
[48] Y. Bai, Proc. Natl. Acad. Sci. USA 96 (1999) 477–480.
[49] J.S. Milne, Y. Xu, L.C. Mayne, S.W. Englander, J. Mol. Biol. 290
(1999) 811–822.
[50] J. Rumbley, L. Hoang, L. Mayne, S.W. Englander, Proc. Natl.
Acad. Sci. USA 98 (2001) 105–112.
[51] L. Mayne, S.W. Englander, Protein Sci. 9 (2000) 1873–1877.
[52] S.W. Englander, L. Mayne, J.N. Rumbley, Biophys. Chem. 101–
102 (2002) 57–65.
64 M.M.G. Krishna et al. / Methods 34 (2004) 51–64
[53] J. Takei, W. Pei, D. Vu, Y. Bai, Biochemistry 41 (2002) 12308–
12312.
[54] J.J. Englander, C. DelMar, W. Li, S.W. Englander, J.S. Kim,
D.D. Stranz, Y. Hamuro, V.L. Woods Jr., Proc. Natl. Acad. Sci.
USA 100 (2003) 7057–7062.
[55] S. Yan, S.D. Kennedy, S. Koide, J. Mol. Biol. 323 (2002)
363–375.
[56] C.B. Arrington, A.D. Robertson, J. Mol. Biol. 296 (2000) 1307–
1317.
[57] L. Hoang, H. Maity, M.M.G. Krishna, Y. Lin, S.W. Englander,
J. Mol. Biol. 331 (2003) 37–43.
[58] J.M. Sauder, H. Roder, Fold. Des. 3 (1998) 293–301.
[59] M.J. Cliff, L.D. Higgins, R.B. Sessions, J.P. Waltho, A.R. Clarke,
J. Mol. Biol. 336 (2004) 497–508.