hydraulic responses to height growth in maritime pine trees
TRANSCRIPT
Plant, Cell and Environment
(2004)
27
, 1077–1087
© 2004 Blackwell Publishing Ltd
1077
Blackwell Science, LtdOxford, UKPCEPlant, Cell and Environment0016-8025Blackwell Science Ltd 2004? 2004
27910771087Original Article
Hydraulic responses to height growthS. Delzon
et al.
Correspondence: Sylvain Delzon. Fax: + 33 (0)5 56 68 05 46; e-mail:[email protected]
Hydraulic responses to height growth in maritime pine trees
S. DELZON
1
, M. SARTORE
1
, R. BURLETT
1
, R. DEWAR
2
& D. LOUSTAU
1
1
INRA – EPHYSE, 69 route d’Arcachon, 33612 Gazinet cedex, France and
2
INRA – EPHYSE, Centre de Bordeaux, BP81, 33883 Villenave d’Ornon, France
ABSTRACT
As trees grow taller, decreased xylem path conductanceimposes a major constraint on plant water and carbon bal-ance, and is thus a key factor underlying forest productivitydecline with age. The responses of stomatal conductance,leaf area: sapwood area ratio (
A
L
:
A
S
) and soil–leaf waterpotential gradient (
DDDDYYYY
S–L
) to height growth were investi-gated in maritime pine trees. Extensive measurements of
insitu
sap flow, stomatal conductance and (non-gravitational)needle water potential (
L
=
YYYY
L
----
rrrr
w
gh
) were made during2 years in a chronosequence of four even-aged stands,under both wet and dry soil conditions. Under wet soilconditions,
L
was systematically lower in taller trees onaccount of differences in gravitational potential. In con-trast, under dry soil conditions, our measurements clearlyshowed that
L
was maintained above a minimum thresh-old value of
----
2.0 MPa independently of tree height, thuslimiting the range of compensatory change in
DDDDYYYY
S–L
.Although a decrease in the
A
L
:
A
S
ratio occurred with treeheight, this compensation was not sufficient to prevent adecline in leaf-specific hydraulic conductance,
K
L
(50%lower in 30 m trees than in 10 m trees). An associateddecline in stomatal conductance with tree height thusoccurred to maintain a balance between water supply anddemand. Both the increased investment in non-productiveversus productive tissues (
A
S
:
A
L
) and stomatal closuremay have contributed to the observed decrease in treegrowth efficiency with increasing tree height (by a factor ofthree from smallest to tallest trees), although other growth-limiting responses (e.g. soil nutrient sequestration,increased respiratory costs) cannot be excluded.
Key-words
:
Pinus pinaster
; hydraulic conductance; stomatalregulation; tree height; water potential.
INTRODUCTION
In their review of various hypotheses to explain the declinein above-ground forest productivity with height growth,Ryan & Yoder (1997) concluded that the reduced ability oftall trees to transport water to their crowns plays a keyrole. As xylem path conductance decreases with treeheight, the requirement that trees maintain a balance
Y
Y
Y
between water supply and demand may lead to a reductionin stomatal conductance (
g
s
), resulting in reduced CO
2
uptake and photosynthesis.For tree species that are susceptible to catastrophic
xylem cavitation, or some other dysfunction, if their foliagewater potential falls below a critical threshold, height-related stomatal closure may be crucial to plant survival.Several gas exchange studies have found reductions in sto-matal or crown conductance with increasing tree size andage (Saliendra, Sperry & Comstock 1995; Bond &Kavanagh 1999; Hubbard, Bond & Ryan 1999; Salleo
et al
.2000), in association with decreasing hydraulic conductance(Yoder
et al
. 1994; Hubbard
et al
. 1999; Ryan
et al
. 2000;Schafer, Oren & Tenhunen 2000).
However, adaptations other than stomatal closure mayalso contribute to maintaining plant water balance underheight growth. These include: (a) the production of xylemvessels with increased permeability (Pothier, Margolis &Waring 1989); (b) a decrease in transpiring leaf area rela-tive to xylem conductive area (Vanninen
et al
. 1996;McDowell
et al
. 2002a); (c) an increase in the fine root-foliage ratio (Sperry
et al
. 1998; Magnani, Mencuccini &Grace 2000); (d) an increase in the maximum water poten-tial gradient between soil and leaf (Hacke
et al
. 2000); and(e) increased water storage in the stem (Phillips
et al
.2003b). For many species these mechanisms are insufficientto offset the direct reduction in xylem hydraulic conduc-tance due to height growth (Mencuccini & Grace 1996a, b;Mencuccini & Magnani 2000; McDowell
et al
. 2002b).Therefore, quantifying these hydraulic responses to
height growth is a prerequisite to understanding and pre-dicting water balance and growth throughout the life cycleof trees. The objective of this study was to quantify changesin stomatal conductance (
g
s
), leaf area: sapwood area ratio(
A
L
:
A
S
) and soil-to-leaf water potential gradient (
DY
S–L
)under height growth, for maritime pine trees growing insouth-west France. We aimed to overcome some of thelimitations of previous experimental studies, by combiningindependent measurements of gas exchange (sap flow,porometer,
13
C discrimination), of needle water potential,and of foliage and sapwood areas performed
in situ
onindividual trees within a chronosequence of four ‘ideal’forest stands (monospecific, even-aged, uniform soil char-acteristics, flat topography) over two contrasting growingseasons (wet and dry).
A simple hydraulic model provides a useful frameworkfor studying combined changes in
g
s
,
A
L
:
A
S
and
DY
S–L

1078
S. Delzon
et al
.
© 2004 Blackwell Publishing Ltd,
Plant, Cell and Environment,
27,
1077–1087
under height growth. When needle temperature is equal toair temperature (a good approximation for many conifers),and water storage is ignored, the balance between waterdemand and supply can be expressed by:
(1)
where
E
L
is tree transpiration rate per unit leaf area,
g
s
isstomatal conductance per unit leaf area,
D
is the air watervapour saturation deficit,
K
L
is the leaf-specific hydraulicconductance between the soil and leaves, and
DY
S–L
is thesoil-to-leaf total water potential gradient.
K
L
may beexpressed in terms of physical properties of the conductingsystem (Whitehead, Edwards & Jarvis 1984; Whitehead1998):
(2)
where
k
s
is sapwood-specific hydraulic conductivity,
h
istree height (strictly speaking, soil-to-leaf transport pathlength), and
A
S
and
A
L
are sapwood area and leaf area,respectively. Combining Eqns 1 and 2 then gives:
(3)
where our three factors of interest appear on the left-handside. We see that, for given values of
D
and
k
s
the possiblecombined responses of
g
s
,
A
L
:
A
S
and
DY
S–L
to heightgrowth fall between two extremes. With no change in either
A
L
:
A
S
or
DY
S–L
,
g
s
must decline in inverse proportion toheight. In contrast, with no change in
g
s
, an increase in
A
S
:
A
L
and/or
DY
S–L
must occur, whose multiplicativeeffect is proportional to height.
Our specific objectives were:
1
to determine whether hydraulic homeostasis occurs inmaritime pine trees, such that needle water potential ismaintained above a critical threshold.
2
to quantify the role of variations in
g
s
,
A
L
:
A
S
and
DY
S–L
in maintaining water balance under height growth (Eqn3).
MATERIALS AND METHODS
Site description
We studied a chronosequence of maritime pine stands(
Pinus pinaster
Ait.) in the Landes de Gascogne Forest,south-west France. The regional climate is maritime (meanannual temperature of 13
∞
C, mean annual precipitation of977 mm) with marked drought in late summer (August–September). Four study sites (Hermitage L, Bray, Hermit-age M, Baudes) were selected within even-aged, monospe-cific stands of maritime pine with an understorey consistingmainly of
Molinia coerulea (L)
Moench. Tree age in 2002was 10, 32, 54 and 91 year, respectively. The stands wereselected to minimize genetic variability (Landes prove-nance) and management differences. Each site had a pod-zolic sandy humic soil with a cemented B
h
horizon limiting
E g D KL S L S L= = -DY
K kAA h
L SS
L
=1
gAA
kD h
SL
S S L
S1 1DY -
=
the root depth to
-
0·8 m. The sites had extremely low soilphosphorus and nitrogen levels, and an average pH-H
2
O of4·0. Scaffolding was erected at the centre of each site forcanopy measurements (height range 12–30 m).
Precipitation, air temperature, humidity and radiationwere similar among stands (data not shown). In all stands,significant water stress occurred at the end of summer 2001and throughout summer 2002. In the Results below, wetand dry soil conditions are defined as soil water deficit
<
0.50 and
>
0.65, respectively. Outlier data for the 32-year-old stand in spring–summer 2002, reflecting atypicallysevere soil water stress induced by adjacent agriculturalgroundwater extraction, were excluded from statisticalanalyses.
Sapwood area, leaf area and biomass of trees
The stand characteristics of the chronosequence in 2001,summarized in Table 1, were obtained as follows. Estimatesof diameter at 1·3 m (
d
) in 2001 for each tree in the chro-nosequence were obtained from circumference measure-ments. For each stand, top height (
h
) was measured on
~
100trees stratified according to tree basal area, and diameterunder the live crown (
d
LC
) was obtained from circumfer-ence measurements on 30 trees chosen randomly. For eachof the latter, sapwood area at 1·3 m (
A
S
) and under the livecrown (
A
S,LC
) were estimated as follows. First, the ratio ofheartwood radius to total stem radius was measured onfresh wood cores extracted in three azimuth directions at1·3 m and one azimuth direction under the living crown.The hydroactive part of the xylem was distinguished bytransparency under diffuse light.
A
S
and
A
S,LC
were thencalculated as total wood area under bark minus heartwoodarea, at 1·3 m and under the live crown, respectively. Thetwo youngest stands had negligible heartwood area underthe live crown. In the two oldest sites, the heartwood radiusranged from 20 to 120 mm according tree size. These mea-surements served to establish, for each stand, statisticalrelationships between
d
LC
and
d
(r2 = 0.95–0.98), betweenAS and d (r2 = 0.84–0.94), and between AS,LC and dLC for theentire chronosequence (r2 = 0.97, Delzon et al. 2004). Theserelationships were then used to derive AS and AS,LC in alltrees for which d was measured.
Tree leaf area (AL) was estimated from an allometricrelationship with dLC and specific leaf area (s), asdescribed in Table 2. We also estimated above-groundannual tree biomass increment per unit leaf area (i.e.tree growth efficiency, DWa) from an allometric relation-ship between Wa, d and tree age (Table 2). These rela-tionships were established from previous data (Portéet al. 2000, 2002) complemented by more recent datafrom two other stands aged 10 and 50 year (Trichet andBert, unpublished).
Xylem sap flow measurements
Sap flow in six representative trees in the youngest stand,and in seven trees in each of the older stands, was measured
Hydraulic responses to height growth 1079
© 2004 Blackwell Publishing Ltd, Plant, Cell and Environment, 27, 1077–1087
using a constant heating radial flowmeter (Granier 1985,1987) during the period April 2001 to January 2003 in thethree youngest stands, and during the period March 2002to January 2003 in the 91-year-old stand. Sensors wereinstalled on the east side of the stems 1 m below the livecrown, because at this height azimuthal variation in the sapflux density of maritime pine is small (Loustau, Domec &Bosc 1998). Data were recorded every 10 s and averagedevery 30 min with dataloggers (Model 21X; Campbell Sci-entific Ltd, Shepshed, UK) and multiplexers (modelAM416; Campbell Scientific Ltd). The calibration coeffi-cient of (Granier 1985) was used to calculate the sap fluxdensity, Js (kg m-2 h-1).
Where possible, the two probes within each sensor wereinserted in the same horizontal plane, the temperature dif-ference between the probes with heating turned off thenbeing negligible (< 0·01 mV). When tree stems were toosmall or branch insertions were present, the probes wereinserted one above the other. In this configuration, a verti-cal temperature gradient correction must be applied (Do &Rocheteau 2002a, b; Lundblad, Lagergren & Lindroth2001). Several times during the experiment, we measured
the temperature gradient (dT) between such probes withheating turned off for 3–4 d. Among the variables tested(radiation, air humidity, wind speed and temperature), themost satisfactory statistical correlation for dT was foundwith temperature alone. Such a relationship was establishedfor each tree, allowing continuous correction of dT withoutwhich the mean daily sap flux densities in the 10-, 32-, 54-and 91-year-old trees would have been over-estimated by3, 6, 6 and 5%, respectively.
In two or three trees in each stand, additional mobilesensors were inserted deeper into the sapwood to measurethe radial profile of sap flux density. In all trees, sap fluxdensity declined with increasing depth within the sapwood,the relative decline being greater in larger diameter treesand zero within the heartwood (Delzon et al. 2004), asfound in previous studies ( ermák et al. 1990; Granier et al.1994; Phillips, Oren & Zimmermann 1996; ermák &Nadezhdina 1998; Schafer et al. 2000). These resultsenabled sap flux density measurements made in the outer20 mm to be scaled to the entire sapwood using a correctionfactor (C) that depended on dLC (C = -1.17643 dLC + 1.1936with r2 = 0.90, Delzon et al. 2004).
CC
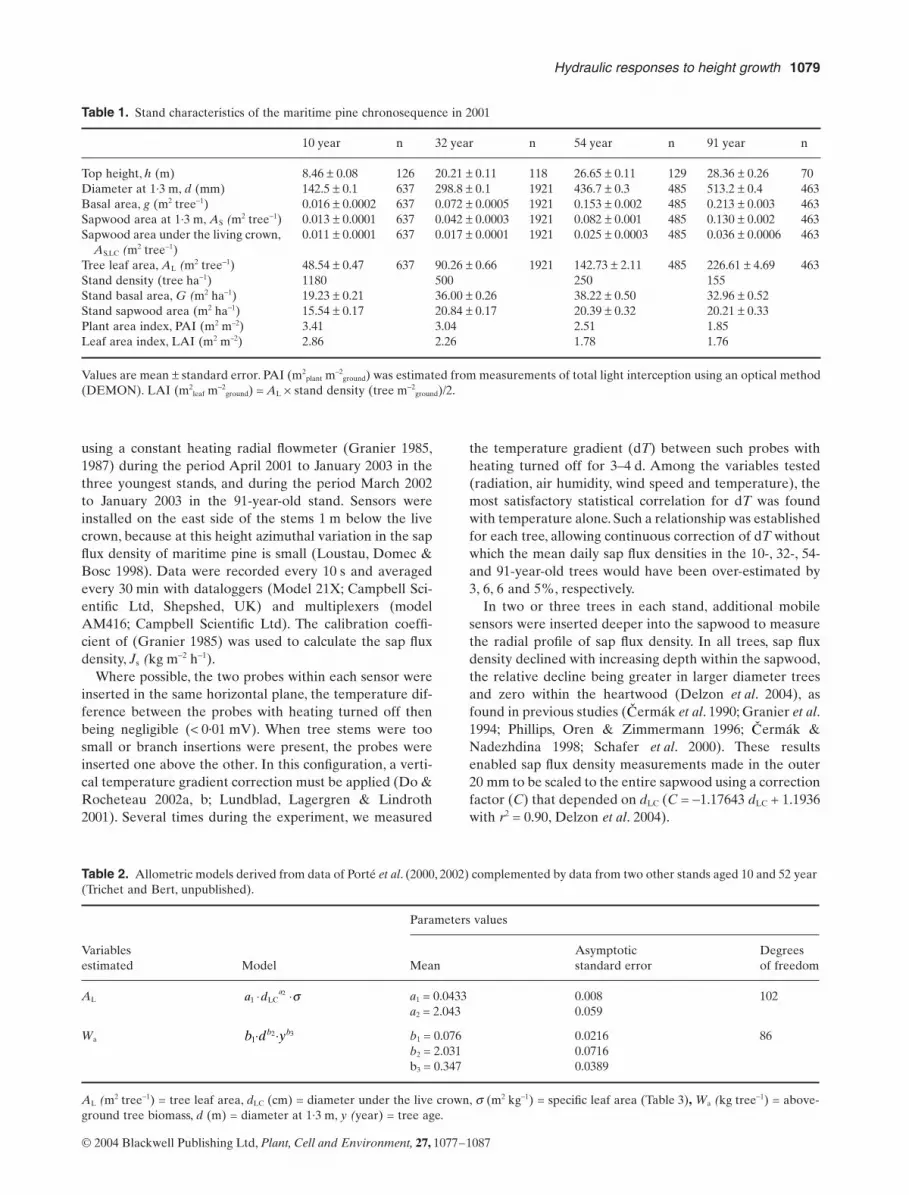
Table 1. Stand characteristics of the maritime pine chronosequence in 2001
10 year n 32 year n 54 year n 91 year n
Top height, h (m) 8.46 ± 0.08 126 20.21 ± 0.11 118 26.65 ± 0.11 129 28.36 ± 0.26 70Diameter at 1·3 m, d (mm) 142.5 ± 0.1 637 298.8 ± 0.1 1921 436.7 ± 0.3 485 513.2 ± 0.4 463Basal area, g (m2 tree-1) 0.016 ± 0.0002 637 0.072 ± 0.0005 1921 0.153 ± 0.002 485 0.213 ± 0.003 463Sapwood area at 1·3 m, AS (m2 tree-1) 0.013 ± 0.0001 637 0.042 ± 0.0003 1921 0.082 ± 0.001 485 0.130 ± 0.002 463Sapwood area under the living crown,
AS,LC (m2 tree-1)0.011 ± 0.0001 637 0.017 ± 0.0001 1921 0.025 ± 0.0003 485 0.036 ± 0.0006 463
Tree leaf area, AL (m2 tree-1) 48.54 ± 0.47 637 90.26 ± 0.66 1921 142.73 ± 2.11 485 226.61 ± 4.69 463Stand density (tree ha-1) 1180 500 250 155Stand basal area, G (m2 ha-1) 19.23 ± 0.21 36.00 ± 0.26 38.22 ± 0.50 32.96 ± 0.52Stand sapwood area (m2 ha-1) 15.54 ± 0.17 20.84 ± 0.17 20.39 ± 0.32 20.21 ± 0.33Plant area index, PAI (m2 m–2) 3.41 3.04 2.51 1.85Leaf area index, LAI (m2 m–2) 2.86 2.26 1.78 1.76
Values are mean ± standard error. PAI (m2plant m–2
ground) was estimated from measurements of total light interception using an optical method(DEMON). LAI (m2
leaf m-2ground) = AL ¥ stand density (tree m-2
ground)/2.
Table 2. Allometric models derived from data of Porté et al. (2000, 2002) complemented by data from two other stands aged 10 and 52 year (Trichet and Bert, unpublished).
Variables estimated Model
Parameters values
MeanAsymptotic standard error
Degrees of freedom
AL a1 = 0.0433 0.008 102a2 = 2.043 0.059
Wa b1 = 0.076 0.0216 86b2 = 2.031 0.0716b3 = 0.347 0.0389
AL (m2 tree-1) = tree leaf area, dLC (cm) = diameter under the live crown, s (m2 kg-1) = specific leaf area (Table 3), Wa (kg tree-1) = above-ground tree biomass, d (m) = diameter at 1·3 m, y (year) = tree age.
a d a1
2◊ ◊LC s
b d yb b1
2 3◊ ◊
1080 S. Delzon et al.
© 2004 Blackwell Publishing Ltd, Plant, Cell and Environment, 27, 1077–1087
Leaf-level measurements
The non-gravitational component of needle water potential( L = YL - rwgh) and stomatal conductance (gs) were mea-sured in each stand during six clear days spanning bothgrowing seasons (June, July and September 2001; June,August and September 2002). Measurements were made onseveral whorls of three trees in each stand. Only the 10- and54-year-old (adjacent) stands could be measured on thesame day; the other two stands were measured one or twodays later. The value of L was estimated as the negativeof the balance pressure applied using pressure chambers onfully expanded needles in the upper crown, every 10 minfrom predawn ( P) until sunset (a total of 2006 such mea-surements during the experiment).
Stomatal conductance (gs) was measured every 10 minwith null-balance porometers (Li-1600; Li-Cor Inc., Lin-coln, NE, USA) equipped with a cylindrical chamber, frommorning (as soon as foliage was completely dry) until1700 h. One-year-old needles were removed and gasexchange measurements were completed within 3 min. Pre-vious work on maritime pine in our laboratory has shownthat the gas exchange of detached needles is the same asthat of attached needles for at least 5 min following detach-ment. Immediately following the porometer measurements,the length (ln) and diameter (dn) of the chamber needleswere measured with an electronic calliper, and the totalsurface area of each needle was estimated as (1 + p/2)lndn.
13c : 12c
Carbon discrimination from annual ring cellulose providedan independent measure of height-related changes in gs perunit of photosynthesis. From the base of each tree on whichsap flow measurements were conducted, cores were takenat the end of the study period and the ratio 13C : 12C deter-mined. For each tree, sampling consisted of four corestaken from four azimuthal directions, from which theannual rings for 2001 and 2002 were extracted and pooledby year. Cellulose was extracted by the method describedby Lambrot & Porté (2000). Cellulose d13C was analysedwith an isotope ratio mass spectrometer (FISONS Isoch-rom, Manchester, UK) at INRA, Laon (France).
Needle nitrogen content
In January 2001 and 2002, 100 needles in the upper crownof 10 trees per stand were harvested and kept cool duringtransfer to the laboratory. One needle from each tree wasfrozen at -20 ∞C and chlorophyll a and b content wereanalysed colorimetrically using a spectrophotometer (Jen-way 6405UV/Vis; Jenway, Felsted, Dunmow Essex, UK)(Inskeep & Bloom 1985). The remaining needles weredried at 70 ∞C for 72 h, mineralized with hot sulphuric acidand assayed colorimetrically for concentrations of N and Pusing a Technicon auto-analyser (O’Neill & Webb 1970).Specific needle area (s) was calculated as the ratio of nee-dle area (estimated as above) to dry weight.
Y
Y
Y
Meteorological measurements
In each stand, micrometeorological data were collectedevery 10 s at 2 m above the canopy and averaged every30 min. These data included wind speed (u, m s-1), air tem-perature (Ta, ∞C), air humidity (Hr, Pa), net radiation (Rn,W m-2), global radiation (R, W m-2), photosyntheticallyactive radiation (PAR, mmol m-2 s-1), atmospheric pressure(P, atm), and precipitation (Pi, mm). All sensors were cross-calibrated before installation.
Soil volumetric water content was measured using twotechniques, an FDR water content reflectometer system(CS615 water content reflectometer; Campbell ScientificLtd), and a TDR-TRASE system (TRASE 6050 ¥ 1: SoilMoisture, Santa Barbara, CA, USA). In each of the twoolder sites (54- and 91-year-old trees), four soil moisturedepth profiles were monitored using stainless steel CS615probes inserted horizontally at depths of 0·15, 0·3, 0·6, 0·9and 1·3 m. At each of the two younger sites, four profileswere monitored using TRASE probes installed verticallyand horizontally at depths of 0·1, 0·15, 0·3, 0·5, 0·7, 0·8 m.Data were collected every 4 h, except at the site of the 32-year-old trees where they were collected on a weekly basis.A cross-comparison of the two techniques was carried outat one site and showed close agreement. The soil waterdeficit (dM) was calculated as:
(4)
where Mmax, Mmin and M are the maximal, minimal andactual soil water contents (0–0·8 m depth), respectively.
Data analysis
Transpiration and canopy conductance
Tree transpiration rate per unit leaf area (EL) was calcu-lated from the measured sap flux density in the outer20 mm (Js) as:
(5)
where AS,LC is the sapwood cross-sectional area under thelive crown, AL is the tree leaf area and C is the correctionfactor for the radial profile of sap flux density. Because sapflux density was measured under the live crown, weassumed that the lag between measured sap flux densityand transpiration was negligible during the experiment.Indeed, the correlation between EL and current values ofD and potential evapotranspiration (PET) was consistentlygreater than that between EL and previous values of D andPET, regardless of the lag time (30–180 min), suggestingthat crown capacitance did not strongly affect EL (Schulzeet al. 1985; Phillips et al. 1997; Phillips & Oren 1998). Standtranspiration (E) was calculated from the mean sap fluxdensity ( ) of six or seven trees per stand, multiplied by aweighted sapwood area for each stand (calculated as thesum over all trees of AS,LC · C for each tree).
dM =-
-M M
M Mmax
max min
E JAA
CL sS,LC
L
= ◊ ◊
Js
Hydraulic responses to height growth 1081
© 2004 Blackwell Publishing Ltd, Plant, Cell and Environment, 27, 1077–1087
As the needle temperature was not measured, canopyconductance for water vapour, gc (mmol m-2 s-1), was esti-mated by inversion of the Penman–Monteith equationusing transpiration and microclimate measurements, as fol-lows:
(6)
where E (W m-2) is the stand transpiration, g (J kg-1) is thepsychometric constant, s (Pa K-1) is the slope of the satura-tion vapour pressure–temperature curve, Rna (W m-2) is thenet radiation absorbed by the canopy, r (kg m-3) is thedensity of dry air, cp (J K-1 kg-1) is the specific heat of air,D (Pa) is the vapour pressure deficit, and ga (m s-1) is theaerodynamic conductance. The latter was estimated fromwind speed as:
(7)
where z0 is the surface roughness (approximately 0.1h), his the mean tree height, d0 is the zero plane displacement(approximately 0.75h), k is the von Karman constant, andu (m s-1) is the wind speed at height z0. In this study, gc wascalculated after excluding data from periods of rainfall orD < 100 Pa.
Leaf-specific hydraulic conductance
Whole-tree leaf-specific hydraulic conductance, KL
(mmol H2O m-2leaf s-1 MPa-1) was calculated for three trees
per stand from linear regressions between tree transpira-tion rate per unit leaf area (EL) and the non-gravitationalcomponent of needle water potential ( L = YL - rwgh) onthe same tree, according to:
gg E
s Rn c D g E sc
a
a p a
=◊ ◊
◊ + ◊ ◊ ◊ - ◊ +( )g
r g
gk u
z d za =
◊-( )[ ]
2
0 0ln /
Y
(8)
Here D P-L = P - L (MPa) is the difference betweenthe measured pre-dawn and current water potentials. Nogravitational correction term rwgh is required in Eqn 8.From Eqn 1 the pre-dawn zero-flow condition (EL = 0)is YS = YP which implies DYS–L = DYP–L; then, becauseDYP–L = D P–L at a given height, Eqn 1 implies Eqn 8.
We used an analysis of variance (ANOVA) to test for astand effect on water potential and needle mineral content,and a repeated-measures ANOVA to test for a height effecton leaf-specific hydraulic conductance (SAS procedureGLM, Version 8.1; SAS Institute, Cary, NC, USA). Non-linear curve fits were performed with SAS procedureNLIN.
RESULTS
Tree above ground increment
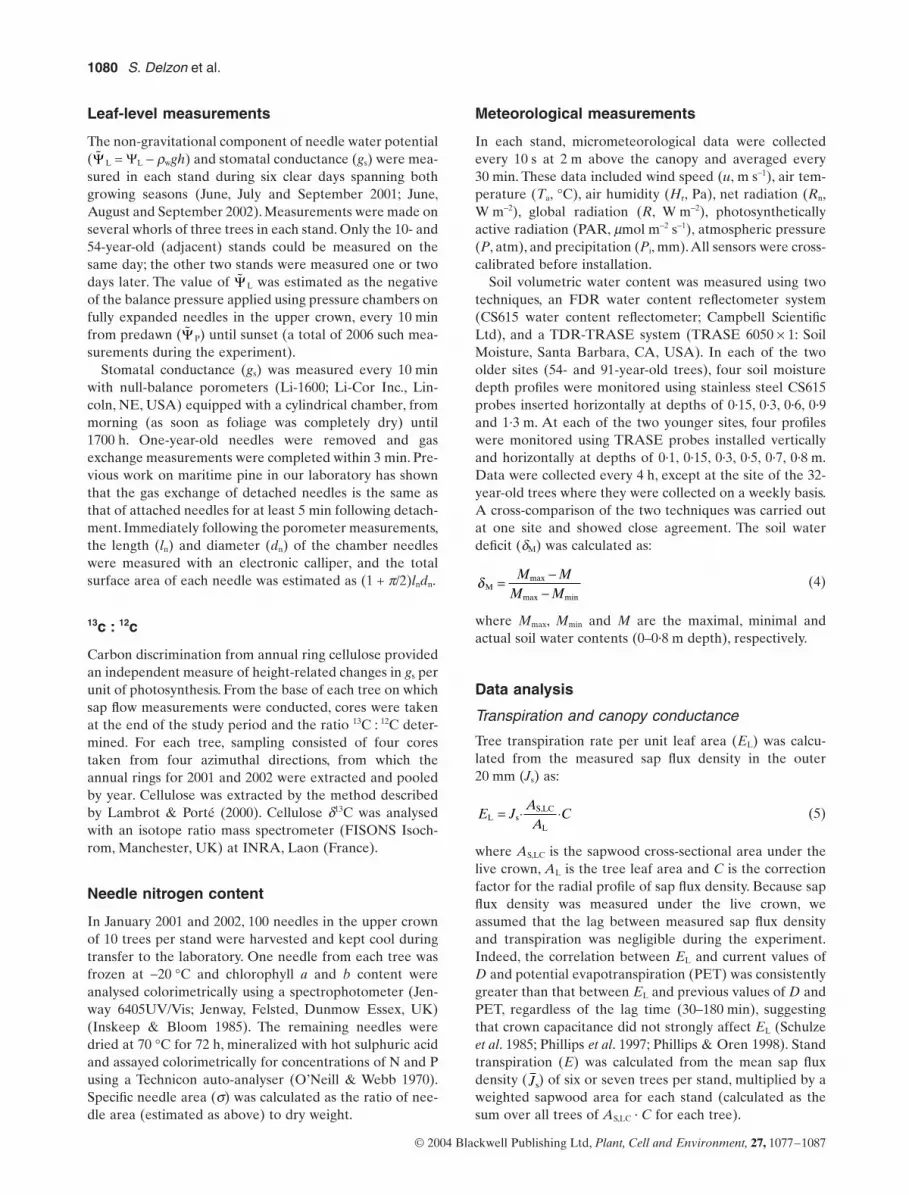
The leaf area : sapwood area ratio was significantly lowerin tall trees (Fig. 1), being on average 7900, 3500 and1700 m2 m-2 for heights of 3, 10 and 28 m, respectively.Although tree leaf area (AL) increased markedly with treeheight (Table 1), the increase in sapwood area at stem base(AS) was proportionately greater (despite an associatedlarge increase in heartwood area), resulting in a largedecrease in AL : AS. In contrast, the ratio AL : AS,LC variedlittle with tree age or height (data not shown).
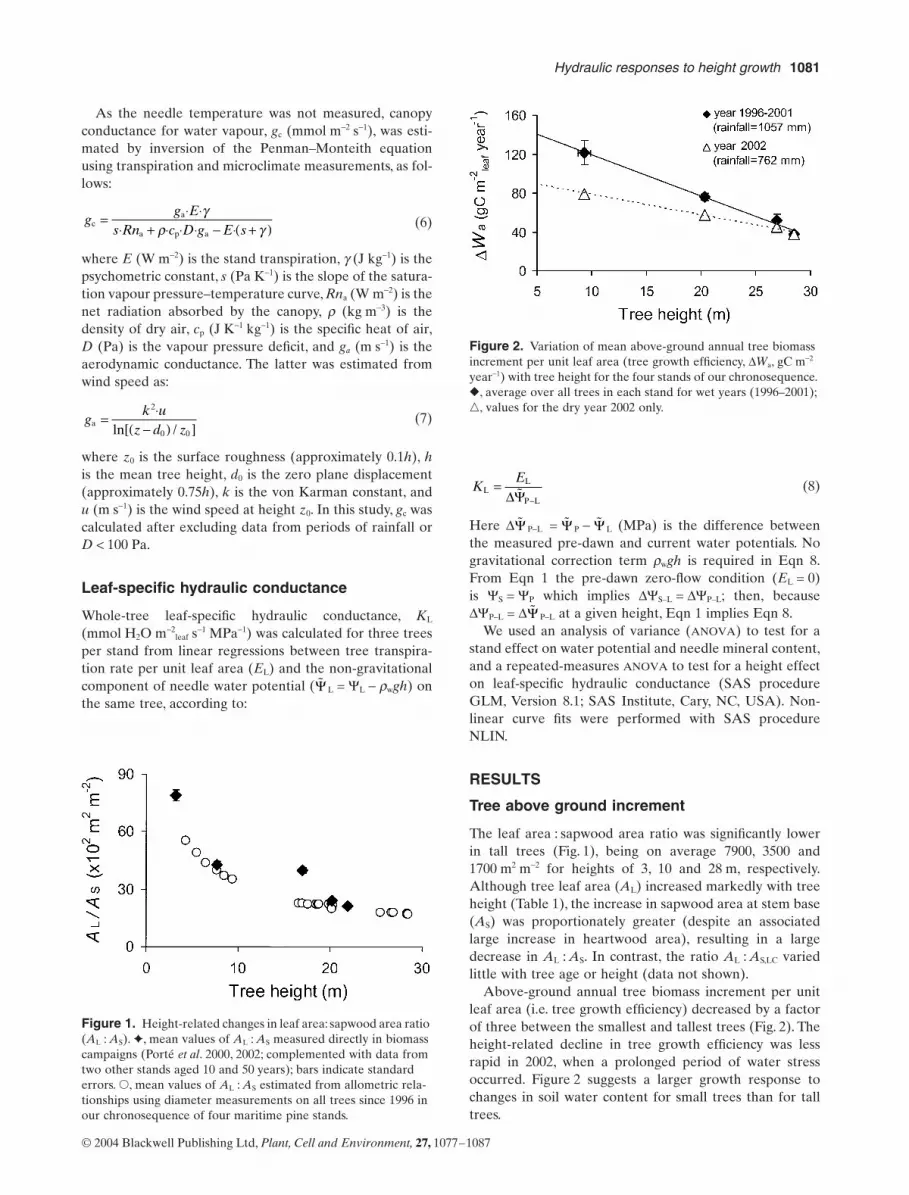
Above-ground annual tree biomass increment per unitleaf area (i.e. tree growth efficiency) decreased by a factorof three between the smallest and tallest trees (Fig. 2). Theheight-related decline in tree growth efficiency was lessrapid in 2002, when a prolonged period of water stressoccurred. Figure 2 suggests a larger growth response tochanges in soil water content for small trees than for talltrees.
KE
LL
P L
=-DY
Y Y Y
Y
Figure 1. Height-related changes in leaf area: sapwood area ratio (AL : AS). ✦, mean values of AL : AS measured directly in biomass campaigns (Porté et al. 2000, 2002; complemented with data from two other stands aged 10 and 50 years); bars indicate standard errors. �, mean values of AL : AS estimated from allometric rela-tionships using diameter measurements on all trees since 1996 in our chronosequence of four maritime pine stands.
Figure 2. Variation of mean above-ground annual tree biomass increment per unit leaf area (tree growth efficiency, DWa, gC m-2 year-1) with tree height for the four stands of our chronosequence. �, average over all trees in each stand for wet years (1996–2001); �, values for the dry year 2002 only.
1082 S. Delzon et al.
© 2004 Blackwell Publishing Ltd, Plant, Cell and Environment, 27, 1077–1087
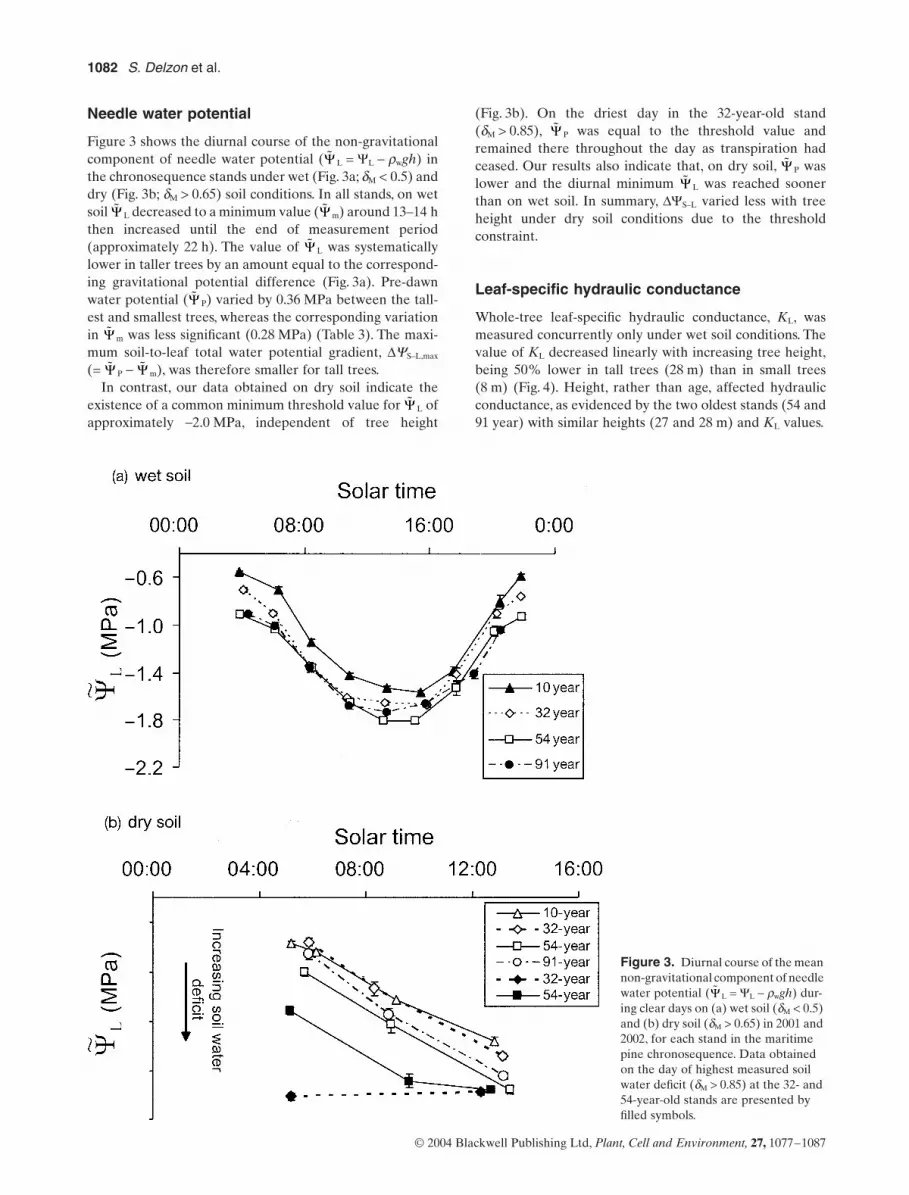
Needle water potential
Figure 3 shows the diurnal course of the non-gravitationalcomponent of needle water potential ( L = YL - rwgh) inthe chronosequence stands under wet (Fig. 3a; dM < 0.5) anddry (Fig. 3b; dM > 0.65) soil conditions. In all stands, on wetsoil L decreased to a minimum value ( m) around 13–14 hthen increased until the end of measurement period(approximately 22 h). The value of L was systematicallylower in taller trees by an amount equal to the correspond-ing gravitational potential difference (Fig. 3a). Pre-dawnwater potential ( P) varied by 0.36 MPa between the tall-est and smallest trees, whereas the corresponding variationin m was less significant (0.28 MPa) (Table 3). The maxi-mum soil-to-leaf total water potential gradient, DYS–L,max
(= P - m), was therefore smaller for tall trees.In contrast, our data obtained on dry soil indicate the
existence of a common minimum threshold value for L ofapproximately -2.0 MPa, independent of tree height
Y
Y Y
Y
Y
Y
Y Y
Y
(Fig. 3b). On the driest day in the 32-year-old stand(dM > 0.85), P was equal to the threshold value andremained there throughout the day as transpiration hadceased. Our results also indicate that, on dry soil, P waslower and the diurnal minimum L was reached soonerthan on wet soil. In summary, DYS–L varied less with treeheight under dry soil conditions due to the thresholdconstraint.
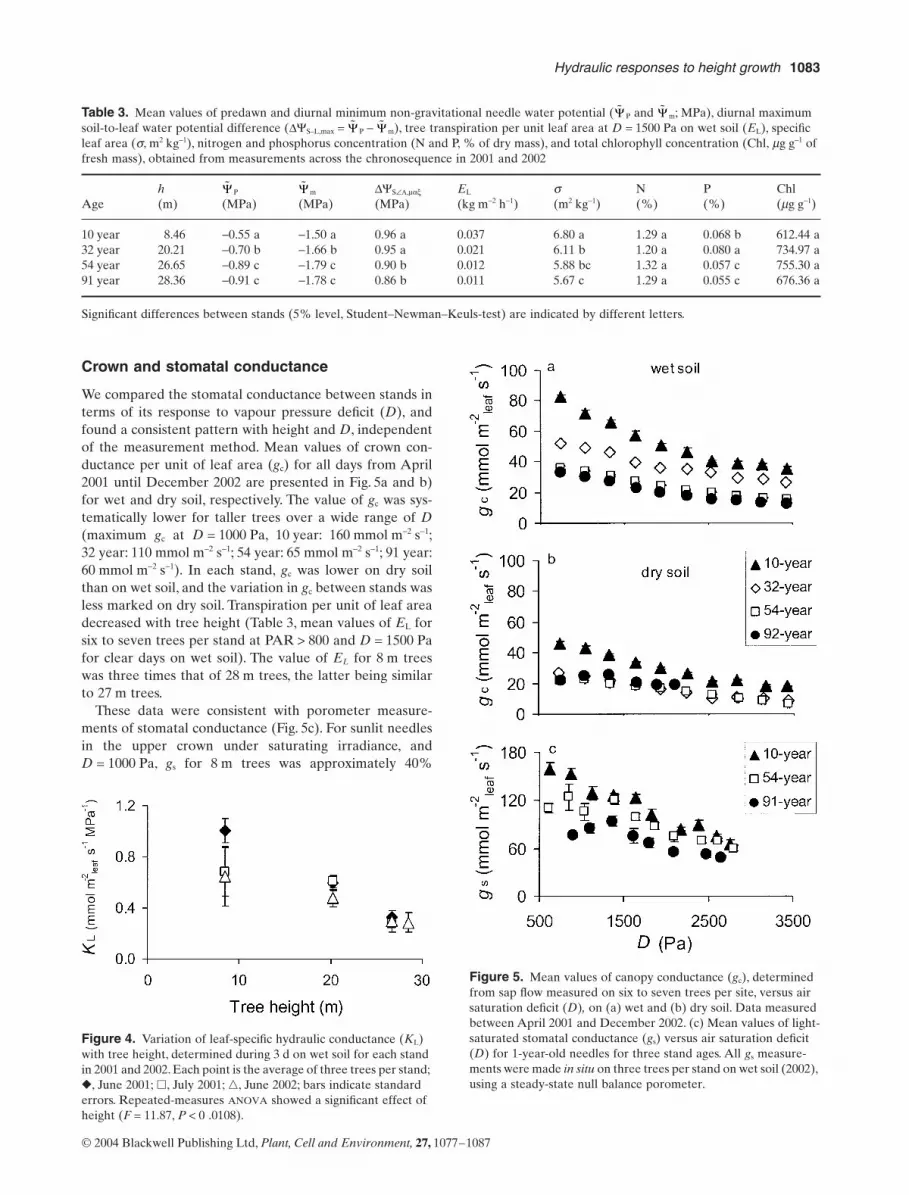
Leaf-specific hydraulic conductance
Whole-tree leaf-specific hydraulic conductance, KL, wasmeasured concurrently only under wet soil conditions. Thevalue of KL decreased linearly with increasing tree height,being 50% lower in tall trees (28 m) than in small trees(8 m) (Fig. 4). Height, rather than age, affected hydraulicconductance, as evidenced by the two oldest stands (54 and91 year) with similar heights (27 and 28 m) and KL values.
Y
YY
Figure 3. Diurnal course of the mean non-gravitational component of needle water potential ( L = YL - rwgh) dur-ing clear days on (a) wet soil (dM < 0.5) and (b) dry soil (dM > 0.65) in 2001 and 2002, for each stand in the maritime pine chronosequence. Data obtained on the day of highest measured soil water deficit (dM > 0.85) at the 32- and 54-year-old stands are presented by filled symbols.
Y
Hydraulic responses to height growth 1083
© 2004 Blackwell Publishing Ltd, Plant, Cell and Environment, 27, 1077–1087
Crown and stomatal conductance
We compared the stomatal conductance between stands interms of its response to vapour pressure deficit (D), andfound a consistent pattern with height and D, independentof the measurement method. Mean values of crown con-ductance per unit of leaf area (gc) for all days from April2001 until December 2002 are presented in Fig. 5a and b)for wet and dry soil, respectively. The value of gc was sys-tematically lower for taller trees over a wide range of D(maximum gc at D = 1000 Pa, 10 year: 160 mmol m-2 s-1;32 year: 110 mmol m-2 s-1; 54 year: 65 mmol m-2 s-1; 91 year:60 mmol m-2 s-1). In each stand, gc was lower on dry soilthan on wet soil, and the variation in gc between stands wasless marked on dry soil. Transpiration per unit of leaf areadecreased with tree height (Table 3, mean values of EL forsix to seven trees per stand at PAR > 800 and D = 1500 Pafor clear days on wet soil). The value of EL for 8 m treeswas three times that of 28 m trees, the latter being similarto 27 m trees.
These data were consistent with porometer measure-ments of stomatal conductance (Fig. 5c). For sunlit needlesin the upper crown under saturating irradiance, andD = 1000 Pa, gs for 8 m trees was approximately 40%
Table 3. Mean values of predawn and diurnal minimum non-gravitational needle water potential ( P and m; MPa), diurnal maximum soil-to-leaf water potential difference (DYS–L,max = P - m), tree transpiration per unit leaf area at D = 1500 Pa on wet soil (EL), specific leaf area (s, m2 kg-1), nitrogen and phosphorus concentration (N and P, % of dry mass), and total chlorophyll concentration (Chl, mg g-1 of fresh mass), obtained from measurements across the chronosequence in 2001 and 2002
Ageh(m)
P (MPa)
m (MPa)
DYS–L,max
(MPa)EL
(kg m-2 h-1)s(m2 kg-1)
N(%)
P(%)
Chl (mg g-1)
10 year 8.46 -0.55 a -1.50 a 0.96 a 0.037 6.80 a 1.29 a 0.068 b 612.44 a32 year 20.21 -0.70 b -1.66 b 0.95 a 0.021 6.11 b 1.20 a 0.080 a 734.97 a54 year 26.65 -0.89 c -1.79 c 0.90 b 0.012 5.88 bc 1.32 a 0.057 c 755.30 a91 year 28.36 -0.91 c -1.78 c 0.86 b 0.011 5.67 c 1.29 a 0.055 c 676.36 a
Significant differences between stands (5% level, Student–Newman–Keuls-test) are indicated by different letters.
Y YY Y
Y Y
Figure 4. Variation of leaf-specific hydraulic conductance (KL) with tree height, determined during 3 d on wet soil for each stand in 2001 and 2002. Each point is the average of three trees per stand; �, June 2001; �, July 2001; �, June 2002; bars indicate standard errors. Repeated-measures ANOVA showed a significant effect of height (F = 11.87, P < 0 .0108).
Figure 5. Mean values of canopy conductance (gc), determined from sap flow measured on six to seven trees per site, versus air saturation deficit (D), on (a) wet and (b) dry soil. Data measured between April 2001 and December 2002. (c) Mean values of light-saturated stomatal conductance (gs) versus air saturation deficit (D) for 1-year-old needles for three stand ages. All gs measure-ments were made in situ on three trees per stand on wet soil (2002), using a steady-state null balance porometer.
1084 S. Delzon et al.
© 2004 Blackwell Publishing Ltd, Plant, Cell and Environment, 27, 1077–1087
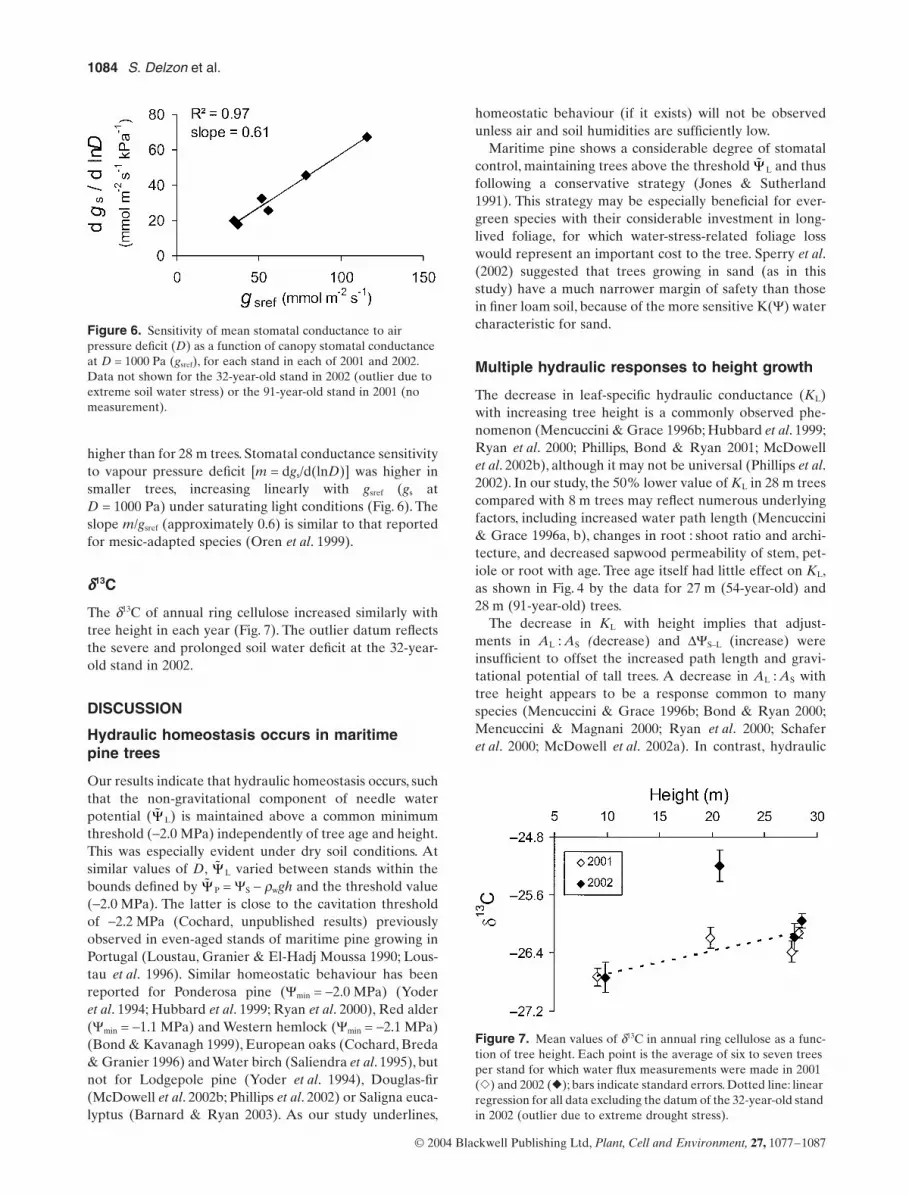
higher than for 28 m trees. Stomatal conductance sensitivityto vapour pressure deficit [m = dgs/d(lnD)] was higher insmaller trees, increasing linearly with gsref (gs atD = 1000 Pa) under saturating light conditions (Fig. 6). Theslope m/gsref (approximately 0.6) is similar to that reportedfor mesic-adapted species (Oren et al. 1999).
dddd13C
The d13C of annual ring cellulose increased similarly withtree height in each year (Fig. 7). The outlier datum reflectsthe severe and prolonged soil water deficit at the 32-year-old stand in 2002.
DISCUSSION
Hydraulic homeostasis occurs in maritime pine trees
Our results indicate that hydraulic homeostasis occurs, suchthat the non-gravitational component of needle waterpotential ( L) is maintained above a common minimumthreshold (-2.0 MPa) independently of tree age and height.This was especially evident under dry soil conditions. Atsimilar values of D, L varied between stands within thebounds defined by P = YS - rwgh and the threshold value(-2.0 MPa). The latter is close to the cavitation thresholdof -2.2 MPa (Cochard, unpublished results) previouslyobserved in even-aged stands of maritime pine growing inPortugal (Loustau, Granier & El-Hadj Moussa 1990; Lous-tau et al. 1996). Similar homeostatic behaviour has beenreported for Ponderosa pine (Ymin = -2.0 MPa) (Yoderet al. 1994; Hubbard et al. 1999; Ryan et al. 2000), Red alder(Ymin = -1.1 MPa) and Western hemlock (Ymin = -2.1 MPa)(Bond & Kavanagh 1999), European oaks (Cochard, Breda& Granier 1996) and Water birch (Saliendra et al. 1995), butnot for Lodgepole pine (Yoder et al. 1994), Douglas-fir(McDowell et al. 2002b; Phillips et al. 2002) or Saligna euca-lyptus (Barnard & Ryan 2003). As our study underlines,
Y
YY
homeostatic behaviour (if it exists) will not be observedunless air and soil humidities are sufficiently low.
Maritime pine shows a considerable degree of stomatalcontrol, maintaining trees above the threshold L and thusfollowing a conservative strategy (Jones & Sutherland1991). This strategy may be especially beneficial for ever-green species with their considerable investment in long-lived foliage, for which water-stress-related foliage losswould represent an important cost to the tree. Sperry et al.(2002) suggested that trees growing in sand (as in thisstudy) have a much narrower margin of safety than thosein finer loam soil, because of the more sensitive K(Y) watercharacteristic for sand.
Multiple hydraulic responses to height growth
The decrease in leaf-specific hydraulic conductance (KL)with increasing tree height is a commonly observed phe-nomenon (Mencuccini & Grace 1996b; Hubbard et al. 1999;Ryan et al. 2000; Phillips, Bond & Ryan 2001; McDowellet al. 2002b), although it may not be universal (Phillips et al.2002). In our study, the 50% lower value of KL in 28 m treescompared with 8 m trees may reflect numerous underlyingfactors, including increased water path length (Mencuccini& Grace 1996a, b), changes in root : shoot ratio and archi-tecture, and decreased sapwood permeability of stem, pet-iole or root with age. Tree age itself had little effect on KL,as shown in Fig. 4 by the data for 27 m (54-year-old) and28 m (91-year-old) trees.
The decrease in KL with height implies that adjust-ments in AL : AS (decrease) and DYS–L (increase) wereinsufficient to offset the increased path length and gravi-tational potential of tall trees. A decrease in AL : AS withtree height appears to be a response common to manyspecies (Mencuccini & Grace 1996b; Bond & Ryan 2000;Mencuccini & Magnani 2000; Ryan et al. 2000; Schaferet al. 2000; McDowell et al. 2002a). In contrast, hydraulic
Y
Figure 6. Sensitivity of mean stomatal conductance to air pressure deficit (D) as a function of canopy stomatal conductance at D = 1000 Pa (gsref), for each stand in each of 2001 and 2002. Data not shown for the 32-year-old stand in 2002 (outlier due to extreme soil water stress) or the 91-year-old stand in 2001 (no measurement).
Figure 7. Mean values of d13C in annual ring cellulose as a func-tion of tree height. Each point is the average of six to seven trees per stand for which water flux measurements were made in 2001 (�) and 2002 (�); bars indicate standard errors. Dotted line: linear regression for all data excluding the datum of the 32-year-old stand in 2002 (outlier due to extreme drought stress).

Hydraulic responses to height growth 1085
© 2004 Blackwell Publishing Ltd, Plant, Cell and Environment, 27, 1077–1087
homeostasis limits the degree to which DYS–L canincrease.
From studies of Douglas-fir (McDowell et al. 2002b; Phil-lips et al. 2002) and Saligna eucalyptus (Barnard & Ryan2003), it has been suggested that decreases in both AL : AS
and the threshold foliage potential can completely compen-sate for increased tree height. In these studies, the authorsput forward the hypothesis of a decrease in minimum waterpotential as trees grow taller. However, because needlewater potential in these studies was measured in unstressedconditions, the diurnal minimum water potential may nothave attained its threshold value. Under such conditions,full adjustment of DYS–L can occur.
In our study, adjustment of DYS–L was limited by thethreshold value of L, and the decrease in AL : AS wasinsufficient to offset the decline in KL with increasing treeheight. Consequently, an associated decline in stomatalconductance with tree height occurred to maintain a bal-ance between water supply and demand. Both canopy (sapflow) and stomatal (porometer) conductance decreaseddramatically with height, results corroborated by carbondiscrimination measurements which integrate stomatalbehaviour over time (Farquhar, Ehleringer & Hubick1989). A similar decrease in stomatal conductance has beenobserved in various tree species, including European beech(Schafer et al. 2000), Ponderosa pine (Yoder et al. 1994;Hubbard et al. 1999; Ryan et al. 2000; Irvine et al. 2002) orlodgepole pine (Yoder et al. 1994) but not, for example, inDouglas-fir (McDowell et al. 2002b) or Saligna eucalyptus(Barnard & Ryan 2003).
In some studies sap flow measurements were used toestimate the crown conductance of individual trees(gc = EL/D), in contrast with other studies (Yoder et al.1994; Hubbard et al. 1999; McDowell et al. 2002b) in whichleaf gas exchange measurements were made on 1-year-oldneedles. McDowell et al. (2002b) failed to find a consistentpattern for height-related changes in stomatal conductanceand foliar d13C, suggesting that selective cuvette measure-ments of gs are inadequate for revealing trends with height.
Y
Our study supports this suggestion; we found that crownconductance estimated from whole stands was a morerobust method for this purpose than leaf-level measure-ments made on selected days. Our data are also self-consis-tent in highlighting the relatively limited response of tallertrees to air and soil drying, in terms of either growth effi-ciency (Fig. 2), crown conductance (Fig. 5a & b) or stomatalconductance (Figs 5c & 6).
To quantify the relative role of compensations via leafarea: sapwood area ratio and stomatal conductance, mea-sured values of canopy conductance (gc) were comparedwith various theoretical estimates of gs (Fig. 8). First, gs waspredicted from Eqn 3 as a function of mid-crown heightusing measured values of AL : AS (Fig. 1) and maximumDYS–L (Table 3) for each stand, and the values so obtainedwere normalized to that for the smallest stand (Fig. 8, solidline). This prediction was in reasonably good agreementwith gc measured on wet soil at 800 < D < 1200 kPa andPAR > 1200 mmol m-2 s-1 (Fig. 8, symbols), suggesting thatsapwood-specific hydraulic conductivity (kS) did not changesignificantly with tree height, in contrast to Pothier et al.(1989). These results fall between the two theoreticalextremes (fixed gs, or fixed AL : AS and DYS–L) evoked in theIntroduction (Fig. 8, dashed lines). Our measurements indi-cate that gs and AL : AS decreased by 38 and 55%, respec-tively, over the range 8 to 28 m in tree height. Similar resultshave been shown for Fagus sylvatica L. by Schafer et al.(2000), where a height-related decrease in stomatal conduc-tance was accompanied by a decrease in AL : AS. Indeedthis pattern occurs in tree species generally, although in onerecent study of Quercus garryana AL : AS increased withtree height (Phillips et al. 2003a).
Potential causes of growth decline with age
We have demonstrated a marked decline in tree growthefficiency with height in maritime pine, as observed else-where (McDowell et al. 2002b; Ryan et al. 2004), althoughour conclusions as to the underlying causes must remain
Figure 8. Diamonds: mean canopy con-ductance per unit leaf area (gc) measured at reference vapour pressure deficit (800 < D < 1200 kPa), radiation (PAR > 1200) and on wet soil, as a func-tion of tree height (h). Solid line: gs pre-dicted from Eqn 3 using measured values of leaf area: sapwood area ratio (AL : AS) and maximum soil-to-leaf water potential gradient (DYS–L,max) in each stand. Lower dashed line: gs predicted from Eqn 3 assuming fixed AL : AS and DYS–L, imply-ing gs µ 1/h. Upper dashed line: hypothet-ical limit of fixed gs, implying from Eqn 3 a decline in AL : AS and/or an increase in DYS–L.
1086 S. Delzon et al.
© 2004 Blackwell Publishing Ltd, Plant, Cell and Environment, 27, 1077–1087
tentative. Our study suggests that at least part of thisdecline may be attributed to a decrease in stomatal conduc-tance, implying a reduction in CO2 diffusion into the leaf(Wong, Cowan & Farquhar 1985). The observed decreasein leaf area : sapwood area ratio, implying an increasedinvestment in non-productive versus productive tissues,may also have contributed to the growth decline. A sto-matal effect is consistent with the observed increase in d13Cwith height. Although the d13C increase could also haveoccurred through an increase in photosynthetic capacity, weobserved no differences in either needle nitrogen contentor photosynthetic capacity between trees in our chronose-quence (A–Ci and A–PAR curves measured on detachedbranches in the laboratory; Delzon, unpublished results).However, from this we cannot exclude the possibility thatpart of the decline in growth efficiency reflected lower soilnutrient availability caused by nutrient sequestration in thebiomass and detritus of older stands, which may induce areduction in total tree needle area even if needle nutrientcontent remains unaffected.
CONCLUSION
Our extensive chronosequence data clearly demonstratethat for maritime pine both the leaf area : sapwood arearatio and stomatal conductance decrease with heightgrowth, whereas compensatory adjustment in soil-to-leafwater potential gradient is limited by the phenomenon ofhydraulic homeostasis, especially evident in dry soil condi-tions. These data significantly reinforce previous observa-tions of combined stomatal and structural compensationsto height growth in other tree species. Further modellingand experimental studies are required to ascertain whether,for maritime pine, the observed height-related decline intree growth efficiency can be attributed to stomatal closureand greater investment in non-productive tissues alone, orwhether other growth-limiting responses (e.g. soil nutrientsequestration, increased respiratory costs) are alsoinvolved.
ACKNOWLEDGMENTS
This study was funded by the EC Environment and ClimateResearch Programme CARBO-AGE project (contractENV4-CT97-0577) and the public institute ADEME. Wethank Alexandre Bosc, Annabel Porté and Fédérico Mag-nani for helpful comments and discussions. Many thanks toAndy Kowalski, Eric Pradel, Frederic Bernier, CatherineLambrot, Mark Bakker, Cedric Roy and Emily Le Rouzicfor help with field data collection.
REFERENCES
Barnard H.R. & Ryan M.G. (2003) A test of the hydraulic limita-tion hypothesis in fast-growing Eucalyptus saligna. Plant, Cell &Environment 26, 1–11.
Bond B.J. & Kavanagh K.L. (1999) Stomatal behavior of fourwoody species in relation to leaf-specific hydraulic conduc-
tance and threshold water potential. Tree Physiology 19, 503–510.
Bond B.J. & Ryan M.G. (2000) Comment on ‘Hydraulic limitationof tree height: a critique’ by Becker, Meinzer & Wullschleger.Functional Ecology 14, 137–140.
ermák J. & Nadezhdina N. (1998) Sapwood as the scaling param-eter – defining according to xylem water content or radial pat-tern of sap flow? Annales Des Sciences Forestières 55, 509–521.
ermák J., Ciencala E., Ku era J. & Hallgren J.E. (1990) Radialvelocity profiles of water flow in trunks of Norway spruce andoak and the response of spruce to severing. Tree Physiology 10,367–380.
Cochard H., Breda N. & Granier A. (1996) Whole tree hydraulicconductance and water loss regulation in Quercus duringdrought: evidence for stomatal control of embolism. AnnalesDes Sciences Forestieres 53, 197–206.
Delzon S., Sartore M., Granier A. & Loustau D. (2004) Radialprofiles of sap flow with increasing tree size in maritime pine.Tree Physiology (in press).
Do F. & Rocheteau A. (2002a) Influence of natural temperaturegradients on measurements of xylem sap flow with thermal dis-sipation probes. 1. Field observations and possible remedies.Tree Physiology 22, 641–648.
Do F. & Rocheteau A. (2002b) Influence of natural temperaturegradients on measurements of xylem sap flow with thermal dis-sipation probes. 2. Advantages and calibration of a noncontinu-ous heating system. Tree Physiology 22, 649–654.
Farquhar G.D., Ehleringer J.R. & Hubick K.T. (1989) Carbonisotope discrimination and photosynthesis. Annual Review ofPlant Physiology and Plant Molecular Biology 40, 503–537.
Granier A. (1985) A new method of sap flow measurement in treestems. [in French] Une nouvelle méthode pour la mesure du fluxde sève brute dans le tronc des arbres. Annales Des SciencesForestieres 42, 193–200.
Granier A. (1987) Sap flow measurement in Douglas fir stemsusing a new thermal method. Annales Des Sciences Forestieres44, 1–14.
Granier A., Anfodillo T., Sabatti M., Cochard H., Dreyer E.,Tomasi M., Valentini R. & Breda N. (1994) Axial and radialwater flow in the trunks of oak trees: a quantitative and quali-tative analysis. Tree Physiology 14, 1383–1396.
Hacke U.G., Sperry J.S., Ewers B.E., Ellsworth D.S., SchaferK.V.R. & Oren R. (2000) Influence of soil porosity on water usein Pinus taeda. Oecologia 124, 495–505.
Hubbard R.M., Bond B.J. & Ryan M.G. (1999) Evidence thathydraulic conductance limits photosynthesis in old Pinus ponde-rosa trees. Tree Physiology 19, 165–172.
Inskeep W.P. & Bloom P.R. (1985) Extinction coefficients of chlo-rophyll a and b in N, N-dimethylformamide and 80% acetone.Plant Physiology 77, 483–485.
Irvine J., Law B.E., Anthoni P.M. & Meinzer F.C. (2002) Waterlimitations to carbon exchange in old-growth and young ponde-rosa pine stands. Tree Physiology 22, 189–196.
Jones H.G. & Sutherland R. (1991) Stomatal control of xylemembolism. Plant, Cell and Environment 14, 607–612.
Lambrot C. & Porté A. (2000) Amélioration du protocoled’extraction de la cellulose et de l’hollocellulose du bois: vérifi-cation de l’absence d’un effet contaminant sur les valeurs decomposition isotopique du carbone dans les cernes de bois. Cah-iers Techniques de L’INRA 45, 19–26.
Loustau D., Berbigier P., Roumagnac P., Arruda-Pacheco C.,David J.S., Ferreira M.I., Pereira J.S. & Tavares R. (1996) Tran-spiration of a 64-year-old maritime pine stand in Portugal. 1.Seasonal course of water flux through maritime pine. Oecologia107, 33–42.
Loustau D., Domec J.C. & Bosc A. (1998) Interpreting the varia-
C
C c
Hydraulic responses to height growth 1087
© 2004 Blackwell Publishing Ltd, Plant, Cell and Environment, 27, 1077–1087
tions in xylem sap flux density within the trunk of maritime pine(Pinus pinaster Ait.): application of a model for calculating waterflows at tree and stand levels. Annales Des Sciences Forestieres55, 29–46.
Loustau D., Granier A. & El-Hadj Moussa F. (1990) Seasonalvariations in sap flow in a maritime pine stand. [in French]Evolution saisonnière du flux de sève dans un peuplement depins maritimes. Annales Des Sciences Forestières 47, 599–618.
Lundblad M., Lagergren F. & Lindroth A. (2001) Evaluation ofheat balance and heat dissipation methods for sap flow measure-ments in pine and spruce. Annals of Forest Science 58, 625–638.
Magnani F., Mencuccini M. & Grace J. (2000) Age-relateddecline in stand productivity: the role of structural acclimationunder hydraulic constraints. Plant, Cell and Environment 23,251–263.
McDowell N., Barnard H., Bond B.J., et al. (2002a) The relation-ship between tree height and leaf area: sapwood area ratio.Oecologia 132, 12–20.
McDowell N.G., Phillips N., Lunch C., Bond B.J. & Ryan M.G.(2002b) An investigation of hydraulic limitation and compensa-tion in large, old Douglas-fir trees. Tree Physiology 22, 763–774.
Mencuccini M. & Grace J. (1996a) Developmental patterns ofabove-ground hydraulic conductance in a Scots pine (Pinussylvestris L.) age sequence. Plant, Cell and Environment 19, 939–948.
Mencuccini M. & Grace J. (1996b) Hydraulic conductance, lightinterception and needle nutrient concentration in Scots pinestands and their relations with net primary productivity. TreePhysiology 16, 459–468.
Mencuccini M. & Magnani F. (2000) Comment on ‘Hydraulic lim-itation of tree height: a critique’ by Becker, Meinzer &Wullschleger. Functional Ecology 14, 135–137.
O’Neill J.V. & Webb R.A. (1970) Simultaneous determination ofnitrogen, phosphorus and potassium in plant material by auto-matic methods. Journal of the Science of Food and Agriculture21, 217–219.
Oren R., Sperry J.S., Katul G.G., Pataki D.E., Ewers B.E., PhillipsN. & Schafer K.V.R. (1999) Survey and synthesis of intra- andinterspecific variation in stomatal sensitivity to vapour pressuredeficit. Plant, Cell and Environment 22, 1515–1526.
Phillips N. & Oren R. (1998) A comparison of daily representa-tions of canopy conductance based on two conditional time-averaging methods and the dependence of daily conductance onenvironmental factors. Annals of Forest Science 55, 217–235.
Phillips N., Bond B.J., McDowell N.G. & Ryan M.G. (2002) Can-opy and hydraulic conductance in young, mature and old Dou-glas-fir trees. Tree Physiology 22, 205–211.
Phillips N., Bond B.J., McDowell N.G., Ryan M.G. & Schauer A.(2003a) Leaf area compounds height-related hydraulic costs ofwater transport in Oregon White Oak trees. Functional Ecology17, 832–840.
Phillips N.G., Ryan M.G., Bond B.J., McDowell N.G., HinckleyT.M. & ermák J. (2003b) Reliance on stored water increaseswith tree size in three species in the Pacific Northwest. TreePhysiology 23, 237–245.
Phillips N., Bond B.J. & Ryan M.G. (2001) Gas exchange andhydraulic properties in the crowns of two tree species in a Pan-amanian moist forest. Trees 15, 123–130.
Phillips N., Nagchaudhuri A., Oren R. & Katul G. (1997) Timeconstant for water transport in loblolly pine trees estimatedfrom time series of evaporative demand and stem sapflow. Trees– Structure and Function 11, 412–419.
Phillips N., Oren R. & Zimmermann R. (1996) Radial patterns ofxylem sap flow in non-, diffuse- and ring-porous tree species.Plant, Cell and Environment 19, 983–990.
C
Porté A., Bosc A., Champion I. & Loustau D. (2000) Estimatingthe foliage area of maritime pine (Pinus pinaster Ait.) branchesand crowns with application to modelling the foliage area distri-bution in the crown. Annals of Forest Science 57, 73–86.
Porté A., Trichet P., Bert D. & Loustau D. (2002) Allometricrelationships for branch and tree woody biomass of Maritimepine (Pinus pinaster Ait.). Forest Ecology and Management 158,71–83.
Pothier D., Margolis H.A. & Waring R.H. (1989) Patterns ofchange of saturated sapwood permeability and sapwood con-ductance with stand development. Canadian Journal of ForestResearch 19, 432–439.
Ryan M.G. & Yoder B.J. (1997) Hydraulic limits to tree height andtree growth: what keeps trees from growing beyond a certainheight. Bioscience 47, 235–242.
Ryan M.G., Binkley D., Fownes J.H., Giardina C.P. & Senock R.S.(2004) An experimental test of the causes of forest growthdecline with stand age. Ecological Monographs (in press).
Ryan M.G., Bond B.J., Law B.E., Hubbard R.M., Woodruff D.,Cienciala E. & Ku era J. (2000) Transpiration and whole-treeconductance in ponderosa pine trees of different heights. Oeco-logia 124, 553–560.
Saliendra N.Z., Sperry J.S. & Comstock J.P. (1995) Influence ofleaf water status on stomatal response to humidity, hydraulicconductance, and soil drought in Betula occidentalis. Planta 196,357–366.
Salleo S., Nardini A., Pitt F. & Gullo M.A.I. (2000) Xylemcavitation and hydraulic control of stomatal conductance inlaurel (Laurus nobilis L.). Plant, Cell and Environment 23, 71–79.
Schafer K.V.R., Oren R. & Tenhunen J.D. (2000) The effect oftree height on crown level stomatal conductance. Plant, Cell andEnvironment 23, 365–375.
Schulze E.D., ermák J., Matyssek R., Penka M., ZimmermannR., Vasicek F., Gries W. & Ku era J. (1985) Canopy transpira-tion and water fluxes in the xylem of the trunk of Larix and Piceatrees – a comparison of xylem flow, porometer and cuvette mea-surements. Oecologia 66, 475–483.
Sperry J.S., Adler F.R., Campbell G.S. & Comstock J.P. (1998)Limitation of plant water use by rhizosphere and xylem conduc-tance: results from a model. Plant, Cell and Environment 21,347–359.
Sperry J.S., Hacke U.G., Oren R. & Comstock J.P. (2002) Waterdeficits and hydraulic limits to leaf water supply. Plant, Cell andEnvironment 25, 251–263.
Vanninen P., Ylitalo H., Sievanen R. & Makela A. (1996) Effectsof age and site quality on the distribution of biomass in Scotspine (Pinus sylvestris L.). Trees 10, 231–238.
Whitehead D. (1998) Regulation of stomatal conductance andtranspiration in forest canopies. Tree Physiology 18, 633–644.
Whitehead D., Edwards W.R.N. & Jarvis P.G. (1984) Conductingsapwood area, foliage area, and permeability in mature trees ofPicea sitchensis and Pinus contorta. Canadian Journal of ForestResearch 14, 940–947.
Wong S.C., Cowan I.R. & Farquhar G.D. (1985) Leaf conductancein relation to rate of CO2 assimilation. I. Influence of nitrogennutrition, phosphorus nutrition, photon flux density, and ambi-ent partial pressure of CO2 during ontogeny. Plant Physiology78, 821–825.
Yoder B.J., Ryan M.G., Waring R.H., Schoettle A.W. & Kauf-mann M.R. (1994) Evidence of reduced photosynthetic rates inold trees. Forest Science 40, 513–527.
Received 13 January 2004; received in revised form 1 April 2004;accepted for publication 13 April 2004
c
Cc