hrs documentation record for bradford island
TRANSCRIPT
HAZARD RANKING SYSTEM (HRS) DOCUMENTATION RECORD – COVER SHEET
Name of Site: Bradford Island
EPA ID No.: ORSFN1002228
Contact Persons
Site Investigation: URS, Upland and River Operable Units, Remedial Investigation Report, Bradford Island, Cascade Locks, Oregon, prepared for the U.S. Army Corps of Engineers, June 2012
Documentation Record: Ken Marcy, National Priorities List Coordinator U.S. Environmental Protection Agency, Region 10 Portland, Oregon
Linda Ader, Project Manager Ecology and Environment, Inc., Member of WSP Seattle, Washington
Pathways, Components, or Threats Not Scored The ground water migration pathway, ground water-to-surface water component and drinking water threat component of the surface water migration pathway, soil exposure and subsurface intrusion pathway, and air migration pathway were not scored as part of this Hazard Ranking System (HRS) Documentation Record. These pathways/components were not included because a release to these media does not significantly affect the overall site score and because the overland flow/flood component of the surface water migration pathway produces an overall site score well above the minimum required for the site to qualify for inclusion on the National Priorities List. These pathways are of concern to the U.S. Environmental Protection Agency (EPA) and may be considered during future evaluations.

Name of Site:
Date Prepared:
EPA Region:
Street Address of Site*:
HRS DOCUMENTATION RECORD
Bradford Island
September 2021
10
Star Route (No street number is available)
City, County, State, Zip Code: Cascade Locks, Multnomah, Oregon, 97014
General Location in the State: Northwestern Oregon
Topographic Map: Bonneville Dam, OR-WA 2017 (Ref. 3).
Latitude: 45° 38’ 32.44” North
Longitude: -121° 56’ 08.80” West
Ref.: Ref. 3 as determined near the center of the Landfill AOPC (source 1);
See Figure 5 of this HRS documentation record
* The street address, coordinates, and contaminant locations presented in this HRS documentation recordidentify the general area where the site is located. They represent one or more locations EPA considers tobe part of the site based on the screening information EPA used to evaluate the site for NPL listing. EPAlists national priorities among the known "releases or threatened releases" of hazardous substances;thus, the focus is on the release, not precisely delineated boundaries. A site is defined as where ahazardous substance has been "deposited, stored, disposed, or placed, or has otherwise come to belocated." Generally, HRS scoring and the subsequent listing of a release merely represent the initialdetermination that a certain area may need to be addressed under CERCLA. Accordingly, EPAcontemplates that the preliminary description of facility boundaries at the time of scoring will be refinedas more information is developed as to where the contamination has come to be located.
Scores Ground Water1 Pathway NS Surface Water Pathway 100.00 Soil Exposure and Subsurface Intrusion Pathway NS Air Pathway NS
HRS SITE SCORE 50.00
NS = Not Scored
1 - “Ground water” and “groundwater” are synonymous; the spelling is different due to “ground water” being codified as part of the HRS, while “groundwater” is the modern spelling.
1

WORKSHEET FOR COMPUTING HRS SITE SCORE
S S2
1. Ground Water Migration Pathway Score (Sgw)(from Table 3-1, line 13) NS NS
2a. Surface Water Overland/Flood Migration Component (from Table 4-1, line 30) 100 10,000
2b. Ground Water to Surface Water Migration Component (from Table 4-25, line 28) NS NS
2c. Surface Water Migration Pathway Score (Ssw) Enter the larger of lines 2a and 2b as the pathway score. 100 10,000
3a. Soil Exposure Component Score (Sse) (from Table 5-1, line 22) NS NS
3b. Subsurface Intrusion Component Score (Sssi) (from Table 5-11, line 12) NS NS
3c. Soil Exposure and Subsurface Intrusion Pathway Score (Ssessi) (from Table 5-11, line 13) NS NS
4. Air Migration Pathway Score (Sa)(from Table 6-1, line 12) NS NS
25. Total of Sgw 2 + Ssw
2 + Ssessi2 + Sa 100 10,000
6. HRS Site ScoreDivide the value on line 5 by 4 and take the square root
50.00
NS = Not Scored
2
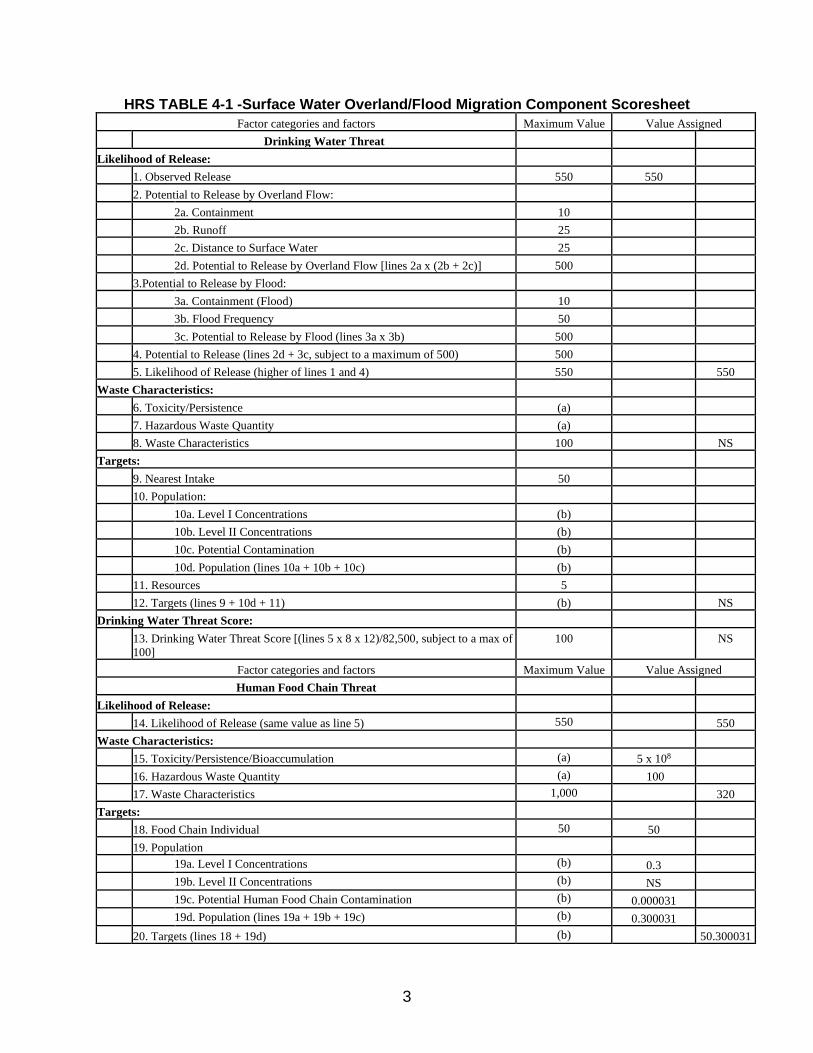
HRS TABLE 4-1 -Surface Water Overland/Flood Migration Component Scoresheet Factor categories and factors Maximum Value Value Assigned
Drinking Water Threat Likelihood of Release:
1. Observed Release 550 550 2. Potential to Release by Overland Flow:
2a. Containment 10 2b. Runoff 25 2c. Distance to Surface Water 25 2d. Potential to Release by Overland Flow [lines 2a x (2b + 2c)] 500
3.Potential to Release by Flood:3a. Containment (Flood) 10 3b. Flood Frequency 50 3c. Potential to Release by Flood (lines 3a x 3b) 500
4. Potential to Release (lines 2d + 3c, subject to a maximum of 500) 500 5. Likelihood of Release (higher of lines 1 and 4) 550 550
Waste Characteristics: 6. Toxicity/Persistence (a) 7. Hazardous Waste Quantity (a) 8. Waste Characteristics 100 NS
Targets: 9. Nearest Intake 50 10. Population:
10a. Level I Concentrations (b) 10b. Level II Concentrations (b) 10c. Potential Contamination (b) 10d. Population (lines 10a + 10b + 10c) (b)
11. Resources 5 12. Targets (lines 9 + 10d + 11) (b) NS
Drinking Water Threat Score: 13. Drinking Water Threat Score [(lines 5 x 8 x 12)/82,500, subject to a max of100]
100 NS
Factor categories and factors Maximum Value Value Assigned Human Food Chain Threat
Likelihood of Release: 14. Likelihood of Release (same value as line 5) 550 550
Waste Characteristics: 15. Toxicity/Persistence/Bioaccumulation (a) 5 x 10⁸
16. Hazardous Waste Quantity (a) 100 17. Waste Characteristics 1,000 320
Targets: 18. Food Chain Individual 50 50 19. Population
19a. Level I Concentrations (b) 0.3 19b. Level II Concentrations (b) NS 19c. Potential Human Food Chain Contamination (b) 0.000031 19d. Population (lines 19a + 19b + 19c) (b) 0.300031
20. Targets (lines 18 + 19d) (b) 50.300031
3
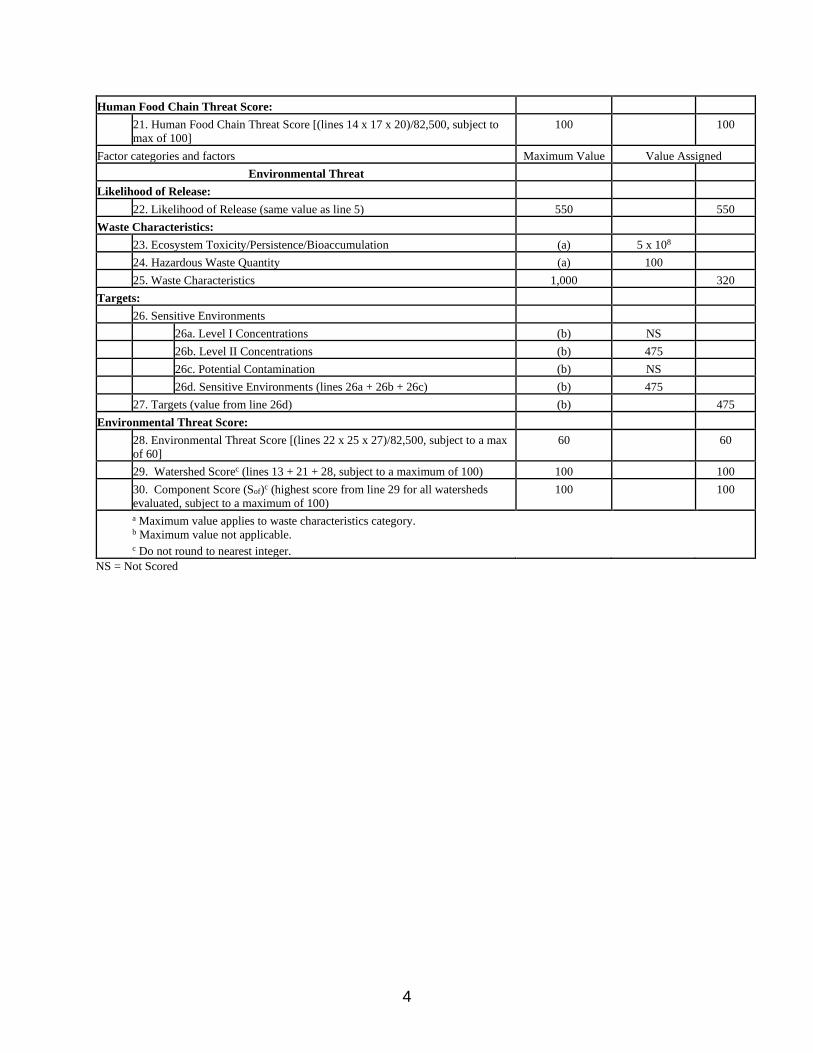
Human Food Chain Threat Score: 21. Human Food Chain Threat Score [(lines 14 x 17 x 20)/82,500, subject tomax of 100]
100 100
Factor categories and factors Maximum Value Value Assigned Environmental Threat
Likelihood of Release: 22. Likelihood of Release (same value as line 5) 550 550
Waste Characteristics: 23. Ecosystem Toxicity/Persistence/Bioaccumulation (a) 5 x 10⁸
24. Hazardous Waste Quantity (a) 100 25. Waste Characteristics 1,000 320
Targets: 26. Sensitive Environments
26a. Level I Concentrations (b) NS 26b. Level II Concentrations (b) 475 26c. Potential Contamination (b) NS 26d. Sensitive Environments (lines 26a + 26b + 26c) (b) 475
27. Targets (value from line 26d) (b) 475 Environmental Threat Score:
28. Environmental Threat Score [(lines 22 x 25 x 27)/82,500, subject to a maxof 60]
60 60
29. Watershed Scorec (lines 13 + 21 + 28, subject to a maximum of 100) 100 100 30. Component Score (Sof)c (highest score from line 29 for all watershedsevaluated, subject to a maximum of 100)
100 100
a Maximum value applies to waste characteristics category. b Maximum value not applicable. c Do not round to nearest integer.
NS = Not Scored
4
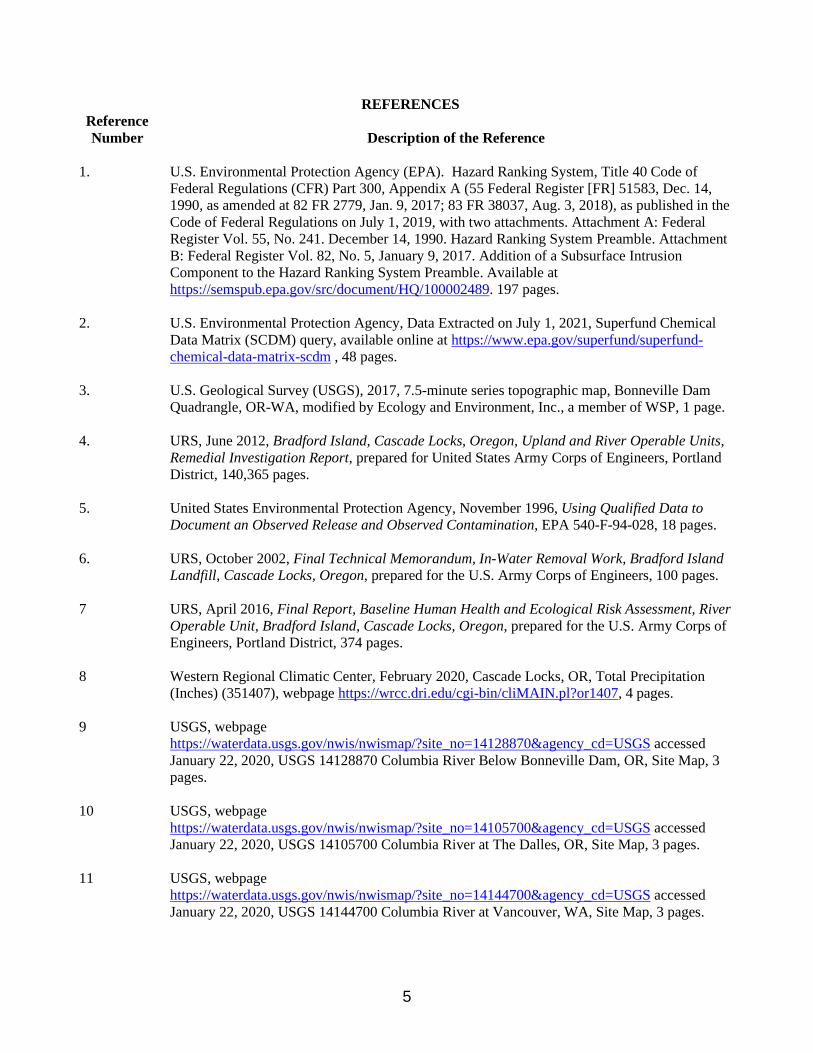
REFERENCES Reference Number Description of the Reference
1. U.S. Environmental Protection Agency (EPA). Hazard Ranking System, Title 40 Code ofFederal Regulations (CFR) Part 300, Appendix A (55 Federal Register [FR] 51583, Dec. 14,1990, as amended at 82 FR 2779, Jan. 9, 2017; 83 FR 38037, Aug. 3, 2018), as published in theCode of Federal Regulations on July 1, 2019, with two attachments. Attachment A: FederalRegister Vol. 55, No. 241. December 14, 1990. Hazard Ranking System Preamble. AttachmentB: Federal Register Vol. 82, No. 5, January 9, 2017. Addition of a Subsurface IntrusionComponent to the Hazard Ranking System Preamble. Available athttps://semspub.epa.gov/src/document/HQ/100002489. 197 pages.
2. U.S. Environmental Protection Agency, Data Extracted on July 1, 2021, Superfund ChemicalData Matrix (SCDM) query, available online at https://www.epa.gov/superfund/superfund-chemical-data-matrix-scdm , 48 pages.
3. U.S. Geological Survey (USGS), 2017, 7.5-minute series topographic map, Bonneville DamQuadrangle, OR-WA, modified by Ecology and Environment, Inc., a member of WSP, 1 page.
4. URS, June 2012, Bradford Island, Cascade Locks, Oregon, Upland and River Operable Units,Remedial Investigation Report, prepared for United States Army Corps of Engineers, PortlandDistrict, 140,365 pages.
5. United States Environmental Protection Agency, November 1996, Using Qualified Data toDocument an Observed Release and Observed Contamination, EPA 540-F-94-028, 18 pages.
6. URS, October 2002, Final Technical Memorandum, In-Water Removal Work, Bradford IslandLandfill, Cascade Locks, Oregon, prepared for the U.S. Army Corps of Engineers, 100 pages.
7 URS, April 2016, Final Report, Baseline Human Health and Ecological Risk Assessment, RiverOperable Unit, Bradford Island, Cascade Locks, Oregon, prepared for the U.S. Army Corps ofEngineers, Portland District, 374 pages.
8 Western Regional Climatic Center, February 2020, Cascade Locks, OR, Total Precipitation(Inches) (351407), webpage https://wrcc.dri.edu/cgi-bin/cliMAIN.pl?or1407, 4 pages.
9 USGS, webpagehttps://waterdata.usgs.gov/nwis/nwismap/?site_no=14128870&agency_cd=USGS accessedJanuary 22, 2020, USGS 14128870 Columbia River Below Bonneville Dam, OR, Site Map, 3pages.
10 USGS, webpagehttps://waterdata.usgs.gov/nwis/nwismap/?site_no=14105700&agency_cd=USGS accessedJanuary 22, 2020, USGS 14105700 Columbia River at The Dalles, OR, Site Map, 3 pages.
11 USGS, webpagehttps://waterdata.usgs.gov/nwis/nwismap/?site_no=14144700&agency_cd=USGS accessedJanuary 22, 2020, USGS 14144700 Columbia River at Vancouver, WA, Site Map, 3 pages.
5
REFERENCES Reference Number Description of the Reference
12 USGS, webpage https://waterdata.usgs.gov/nwis/annual/?referred_module=sw&site_no=14105700&por _14105700_113459=546282,00060,113459,1878,2019&start_dt=2018&end_dt=2018 &year_type=W&format=html_table&date_format=YYYY-MM-DD&rdb_compression=file&submitted_form=parameter_selection_list accessed January 22, 2020, USGS 14105700 Columbia River at The Dalles, OR, Time-Series: Annual Statistics, 2 pages.
13 USGS, webpage https://waterdata.usgs.gov/nwis/annual/?referred_module=sw&site_no=14144700&por_1414470 0_113609=546390,00060,113609,1964,2020&start_dt=2018&end_dt=2018&year_type=W&for mat=html_table&date_format=YYYY-MM-DD&rdb_compression=file&submitted_form=parameter_selection_list accessed January 22, 2020, USGS 14144700 Columbia River at Vancouver, WA, Time-Series: Annual Statistics, 2 pages.
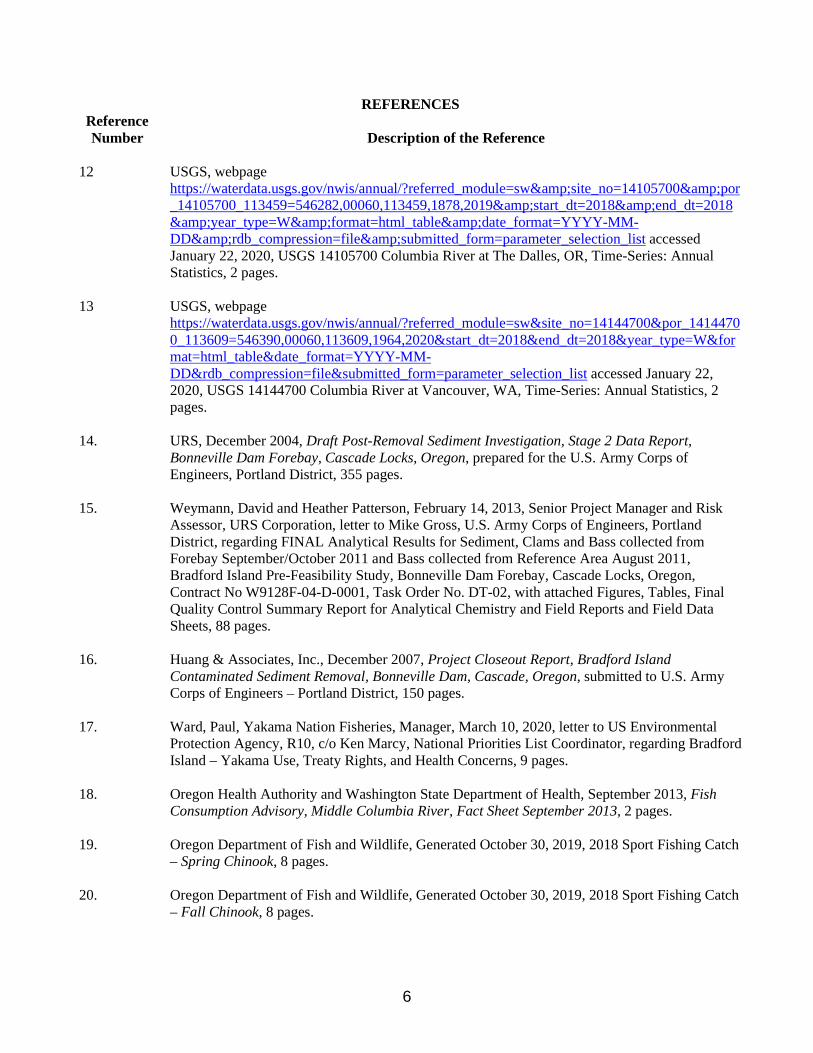
14. URS, December 2004, Draft Post-Removal Sediment Investigation, Stage 2 Data Report,Bonneville Dam Forebay, Cascade Locks, Oregon, prepared for the U.S. Army Corps ofEngineers, Portland District, 355 pages.
15. Weymann, David and Heather Patterson, February 14, 2013, Senior Project Manager and RiskAssessor, URS Corporation, letter to Mike Gross, U.S. Army Corps of Engineers, PortlandDistrict, regarding FINAL Analytical Results for Sediment, Clams and Bass collected fromForebay September/October 2011 and Bass collected from Reference Area August 2011,Bradford Island Pre-Feasibility Study, Bonneville Dam Forebay, Cascade Locks, Oregon,Contract No W9128F-04-D-0001, Task Order No. DT-02, with attached Figures, Tables, FinalQuality Control Summary Report for Analytical Chemistry and Field Reports and Field DataSheets, 88 pages.
16. Huang & Associates, Inc., December 2007, Project Closeout Report, Bradford IslandContaminated Sediment Removal, Bonneville Dam, Cascade, Oregon, submitted to U.S. ArmyCorps of Engineers – Portland District, 150 pages.
17. Ward, Paul, Yakama Nation Fisheries, Manager, March 10, 2020, letter to US EnvironmentalProtection Agency, R10, c/o Ken Marcy, National Priorities List Coordinator, regarding BradfordIsland – Yakama Use, Treaty Rights, and Health Concerns, 9 pages.
18. Oregon Health Authority and Washington State Department of Health, September 2013, FishConsumption Advisory, Middle Columbia River, Fact Sheet September 2013, 2 pages.
19. Oregon Department of Fish and Wildlife, Generated October 30, 2019, 2018 Sport Fishing Catch– Spring Chinook, 8 pages.
20. Oregon Department of Fish and Wildlife, Generated October 30, 2019, 2018 Sport Fishing Catch– Fall Chinook, 8 pages.
6

REFERENCES Reference Number Description of the Reference
21. Oregon Department of Fish and Wildlife, Generated October 30, 2019, 2018 Sport Fishing Catch– Summer Steelhead, 8 pages.
22. Oregon Department of Fish and Wildlife, Generated October 30, 2019, 2018 Sport Fishing Catch– Winter Steelhead, 8 pages.
23. Oregon Department of Fish and Wildlife, Generated October 30, 2019, 2018 Sport Fishing Catch– Coho, 9 pages.
24. Ecology and Environment, Inc., a member of WSP, February 26, 2020, Columbia River fromBonneville Dam to I-5 Bridge, 1 page.
25. Wydoski, Richard S. and Whitney, Richard R, 2003, American Fisheries Society, Inland Fishesof Washington, 21 pages excerpted.
26. Kraig, Eric and Tracey Scalici, September 2019, State of Washington, Washington State SportCatch Report 2017, 83 pages.
27. Ecology and Environment, Inc., a member of WSP, February 26, 2020, Columbia River fromBonneville Dam to an Imaginary Line drawn between Tongue Point, Oregon to Rocky Point,Washington, 1 page.
28. Washington State Department of Fish and Wildlife, last updated on February 14, 2020,Washington Sport Fishing Rules, Effective July 1, 2019 – June 30, 2020 (including Sport FishingRules Pamphlet Corrections and Updates/Clarifications), 140 pages.
29. U.S. Environmental Protection Agency, Data extracted on July, 1 2021, Superfund ChemicalData Matrix (SCDM), Bis(2-ethyhexyl)phthalate and Polychlorinated biphenyls (PCBs), 3 pages.A complete copy of SCDM is available at https://www.epa.gov/superfund/superfund-chemical-data-matrix-scdm.
30. White, Kathryn, Fisheries Biologist, Ecology and Environment, Inc., Member of WSP,November 12, 2020 memorandum with attached figures and references, to Linda Ader, START-IV Team Leader, Ecology and Environment, Inc., Member of WSP, regarding Bradford IslandLandfill Sensitive Environments, Cascade Locks, Oregon, 66 pages.
31. Electronic Code of Federal Regulations, March 20, 2020, Critical habitat for 15 DistrictPopulations Segments (DPSs) of salmon and steelhead (Oncorhynchus spp.) in Washington,Oregon and Idaho, Title 50 (Wildlife and Fisheries), Chapter II, Subchapter C, Part 226(Designated Critical Habitat), 303 pages.
32. U.S. Geological Survey, November 4, 2020,https://nas.er.usgs.gov/viewer/omap.aspx?SpeciesID=92 accessed on November 4, 2020, NAS –Nonindigenous Aquatic Species, Corbicula fluminea, Asian Clam, Mollusks-Bivalves, Exotic, 1page.
7
REFERENCES Reference Number Description of the Reference
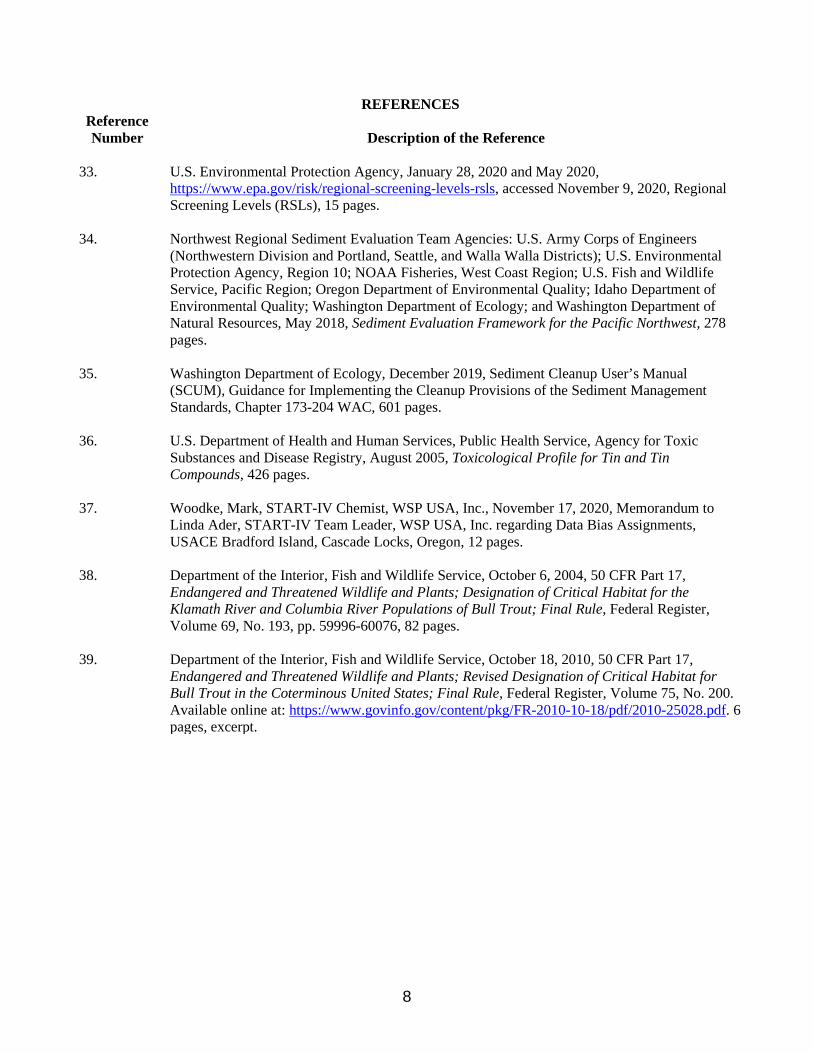
33. U.S. Environmental Protection Agency, January 28, 2020 and May 2020,https://www.epa.gov/risk/regional-screening-levels-rsls, accessed November 9, 2020, RegionalScreening Levels (RSLs), 15 pages.
34. Northwest Regional Sediment Evaluation Team Agencies: U.S. Army Corps of Engineers(Northwestern Division and Portland, Seattle, and Walla Walla Districts); U.S. EnvironmentalProtection Agency, Region 10; NOAA Fisheries, West Coast Region; U.S. Fish and WildlifeService, Pacific Region; Oregon Department of Environmental Quality; Idaho Department ofEnvironmental Quality; Washington Department of Ecology; and Washington Department ofNatural Resources, May 2018, Sediment Evaluation Framework for the Pacific Northwest, 278pages.
35. Washington Department of Ecology, December 2019, Sediment Cleanup User’s Manual(SCUM), Guidance for Implementing the Cleanup Provisions of the Sediment ManagementStandards, Chapter 173-204 WAC, 601 pages.
36. U.S. Department of Health and Human Services, Public Health Service, Agency for ToxicSubstances and Disease Registry, August 2005, Toxicological Profile for Tin and TinCompounds, 426 pages.
37. Woodke, Mark, START-IV Chemist, WSP USA, Inc., November 17, 2020, Memorandum toLinda Ader, START-IV Team Leader, WSP USA, Inc. regarding Data Bias Assignments,USACE Bradford Island, Cascade Locks, Oregon, 12 pages.
38. Department of the Interior, Fish and Wildlife Service, October 6, 2004, 50 CFR Part 17,Endangered and Threatened Wildlife and Plants; Designation of Critical Habitat for theKlamath River and Columbia River Populations of Bull Trout; Final Rule, Federal Register,Volume 69, No. 193, pp. 59996-60076, 82 pages.
39. Department of the Interior, Fish and Wildlife Service, October 18, 2010, 50 CFR Part 17,Endangered and Threatened Wildlife and Plants; Revised Designation of Critical Habitat forBull Trout in the Coterminous United States; Final Rule, Federal Register, Volume 75, No. 200.Available online at: https://www.govinfo.gov/content/pkg/FR-2010-10-18/pdf/2010-25028.pdf. 6pages, excerpt.
8

BRADFORD ISLAND SITE SUMMARY:
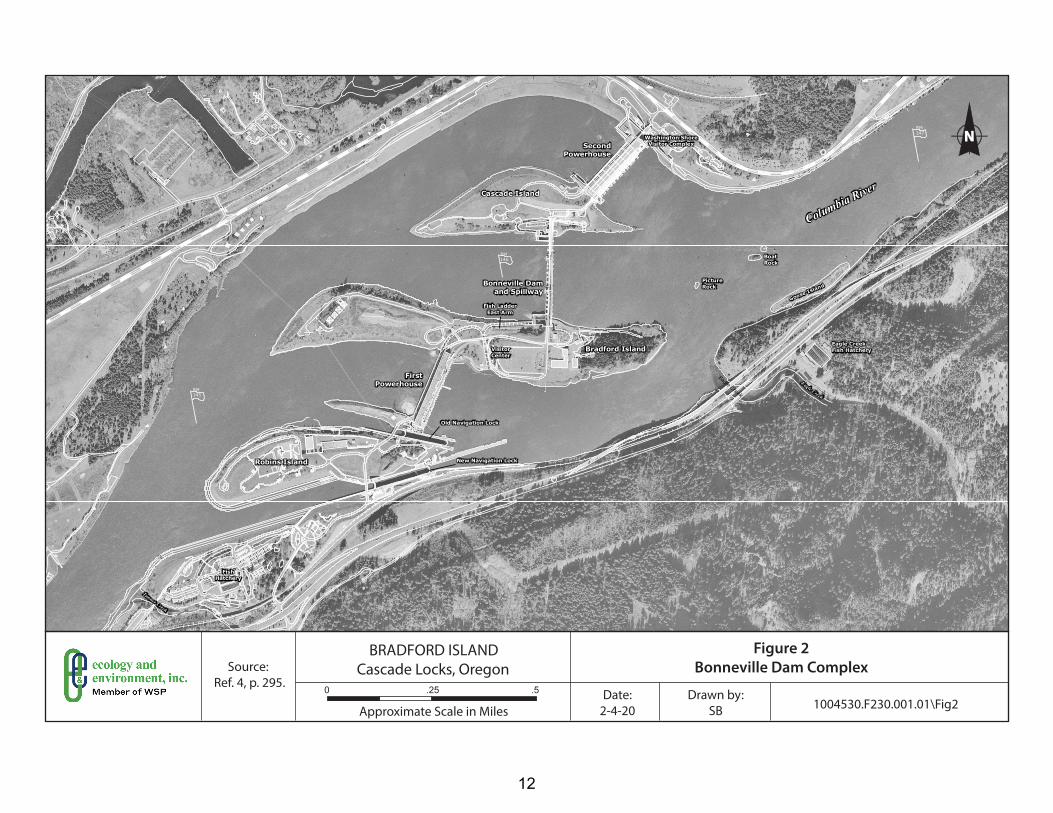
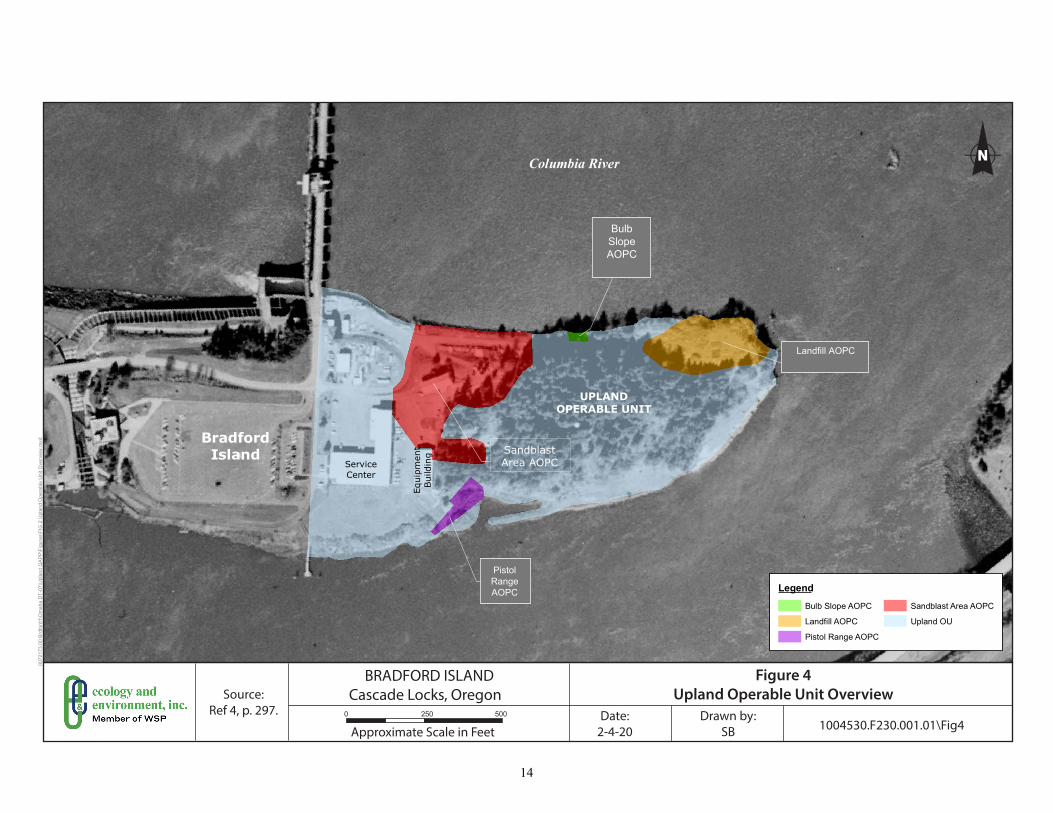
The Bradford Island site is located within the Bonneville Dam complex on Bradford Island within the Columbia River at river mile (RM) 146.1, approximately 40 miles east of Portland, Oregon (Ref. 3; Ref. 4, p. 20) (see Figure 1 of this HRS Documentation Record). This complex is a multipurpose facility that consists of the First and Second Powerhouses, the Old and New Navigation Locks, the Bonneville Dam and Spillway, and a fish hatchery (Ref. 4, pp. 20 and 46) (see Figure 2 of this HRS Documentation Record). The United States Army Corp of Engineers (USACE) operates and maintains the Bonneville Lock and Dam for hydropower, fish and wildlife protection, recreation, and navigation (Ref. 4, p. 46). Numerous environmental investigations have been performed by the USACE and their contractors since 1997, focusing on two operable units (OUs): the Upland OU and the River OU (Ref. 4, p. 20) (see Figure 3 of this HRS Documentation Record). The Upland OU includes four areas of potential concern (AOPCs): the Landfill AOPC, Sandblast Area AOPC, Pistol Range AOPC, and Bulb Slope AOPC (see Figure 4 of this HRS Documentation Record); while the River OU consists only of portions of the Columbia River within the Bonneville Dam Forebay (see Figure 3 of this HRS Documentation Record). The sources scored in this HRS Documentation Record include the Landfill AOPC (Source 1), the Spent Sandblast Grit Disposal Area (Source 2) and the Equipment Laydown Area (Source 3) within the Sandblast Area AOPC, the Bulb Slope AOPC (Source 4), and the River OU Former Debris Piles (Source 5).
The Landfill AOPC, Source 1, is a former waste disposal area at the tip of Bradford Island that was used from the early 1940s until the early 1980s (Ref. 4, p. 20). Waste disposed of in the landfill included household waste, project-related wastes (grease, light bulbs, sandblast grit), electrical debris, ballasts, broken glass, rubber tires, metal debris, wood debris, metal cables, asbestos containing building materials, burned debris, ceramic insulators, and mercury vapor lamps (Ref. 4, p. 20).
The Spent Sandblast Grit Disposal Area, Source 2, is where spent sandblast grit was disposed in the area immediately east of the former sandblast building for an unknown period prior to 1994; resulting in the release of metals and butyltins into the soil (Ref. 4, p. 20).
The Equipment Laydown Area, Source 3, is where industrial equipment and materials are stored along the northern and southern portions of the Landfill access road (Ref. 4, p. 21). Soils in this area have become contaminated (Ref. 4, p. 21).
The Bulb Slope AOPC, Source 4, consists of a fan-shaped accumulation of glass and electrical light bulb debris that extends across a steep slope between the Columbia River and the Landfill access road (Ref. 20, p. 21).
The River OU Former Debris Piles, Source 5, consists of the former location of numerous pieces of electrical equipment and other solid waste that were discovered in the Columbia River adjacent to the Landfill AOPC (Ref. 4, p. 29). The electrical equipment debris included polychlorinated biphenyls (PCB)-containing light ballasts, lightning arresters, and electrical capacitors (Ref. 6, pp. 3 and 16 [Table 4-1]). The electrical debris contaminated the surrounding sediment with PCBs, polycyclic aromatic hydrocarbons (PAHs), and metals (Ref. 4, p. 53; Ref. 6, pp. 3 and 15 [Table 5-2]). Removal of equipment and debris from the Columbia River took place in December 2000 and in February and March 2002 (Ref. 6, pp. 3 and 11).
In June 2012, a Remedial Investigation (RI) of the upland and River OUs was completed on behalf of the USACE (Ref. 4, p. 1). The RI report documents the investigation activities that have taken place over the past 10 years since the report was written (i.e., approximately the period from 2002 to 2012) (Ref. 4, p. 20); including new sampling work conducted during the RI in 2007 and 2009 to fill identified data gaps (Ref. 4, p. 72). Analytical results contained within the RI indicate the presence of hazardous substances in Sources
9

1, 2, 3, and 4 including butyltins, herbicides, metals, PCBs, pesticides, semi volatile organic compounds (SVOCs), and volatile organic compounds (VOCs); while other analytical results obtained during the electrical equipment removal action document the presence of PCBs in Source 5 (see Section 2.2.2, Source Characterization, Tables 1 through 11 of this HRS Documentation Record).
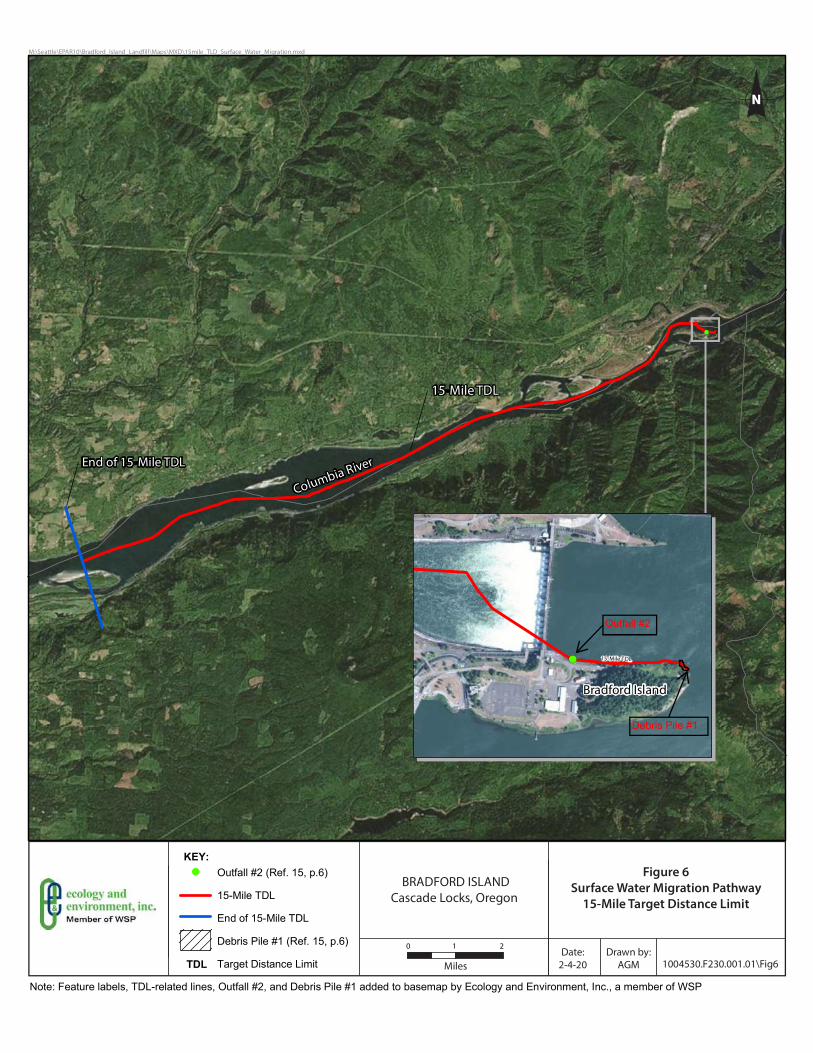
Figure 6 of this HRS Documentation Record depicts the surface water migration pathway 15-mile target distance limit (TDL). In 2011, sediment, clam (Corbicula fluminea; also known as Asian clam) tissue, and smallmouth bass (Micropterus dolomieu) tissue samples were collected from the Bonneville Dam Forebay Area (Ref. 15, pp. 1, 80 through 86; Ref. 32, p. 1). Analytical results indicate the presence of Aroclor-1254 at elevated concentrations in sediment samples collected from the Forebay Area with respect to background concentrations and the presence of Aroclor-1254 at elevated concentrations in the clam and smallmouth bass tissue samples collected from the dam Forebay Area with respect to background concentrations (see Section 4.1.2.1.1, Observed Release, Chemical Analysis, of this HRS Documentation Record for reference citations). A Zone of Actual Contamination is present along the north shore of Bradford Island (see Section 4.1.2.1.1 and Figure 5 of this HRS Documentation Record).
In relation to targets in the surface water migration pathway, it has been documented that a fishery, critical habitats for several fish species, and other threatened or endangered species are present within the Zone of Actual Contamination (see Section 4.1.4.3.1.2).
10

..
. ..
..
..
.
..
. .
..
..
.
...
.
.
.
.
..
.
.. ..
.
... .
.
.. .
..
...
.
..
....
.
.
.
...
.
.
.
..
.
.
..
..
.
...
.....
...
. ..
...
.
.
.. ..
.
. .
.
..
..
. ..
.
.
.
.. ...
.
.
.
.
.
.
..
.
.
.
..
.
.....
.
.
. ..
.
.
.. .
.
.
..
.
.
.
.
..
'
'
'
'
'
›
›
!"
!"
&PO
&PO
!"
&PO
!F
!F
!F
!9 !9
n
n
n
F
F
F
F
1200
800
1600
1600
800
400
800
800
400
400
1200
800
1600
2400
1200
3200
2400
2000
1200
800
1200
400
400
400
1600
2000
1600
2000
1600
800
2400
800
1200
400
1200
2000
800
400
2800
2800
2800
400
1600
40016
00
2400
800
400
1200
400
400
800
2800
1200
3200
800
1200
1600
400
1200
800
1200
400
400
1200 2000
3200
800
3200
3200
1600
800
1200
400
1200
1200
2400
1600
1600
1600
2000
1600
120 0
800
2400
800
2400
1200
1200
2000
800
1600
400
800
400
2000
Key WayAirport
CascadeLocks State
Airport
aC
est Nati
al Scenic Trail
Pacific Crest Nional c
ic Tral
Pacifc
Ce
aona
Scn
Til
Paci
fic
Cr st National Scenic Trail
777
034
043
070
777
211
241
243
242
240
§̈¦84
§̈¦84
£30
£30
¬«14
¬«14
¬«14
EVER
GREEN
HWY
KA
K R
TANNER CREEK RD
BLUE LAKE RD
RED BLUFF RD
M
LE WAY RD
B KER RD
LOOP RD
RED B
UFF RD
DAM RD
IMAN CEME ERY R
LOOP RD
DY C
EEK RD
EBLUFF RD
C
330
FOST R
R
R
SKAAR R
EVERGREEN DR
RC
A W
A
ND T
GIFFORD PINCHOTNATIONAL FOREST
MOUNT HOODNATIONAL FOREST
GIFFORD PINCHOTNATIONAL FOREST
HO
OD
RI V
ER
CO
HO
OD
RIV
ER C
O
MU
LT
NO
MA
H C
O
SKA
MA
NIA
CO
MULTNOM
AH C
O
SKAMANIA C
O
OREGON
WASH
INGTON
WA
SHIN
GTO
N
OR
EG
ON
GovernmentSpring
HotSprings
MoffettsHot Springs
CrystalSpring
MoodySpring
MetlakoFalls
Entrance to
Bonneville Lock
RockCove
Rock Cr
nl
r
ele
Bd
wis
e r
Soren or
n
k
Fore
st C
r
Le Bong Cr
e
uckeC
RocCr
udol h Cr
r
lsr
nn
i
Hlto
r
a
tn
C
Rock Cr
ag e r
Wo
l
Hami on Creek
Colum
bia R
iver
Co
ia v
Columbia River
AshesLake
FrenchLake
LakeBonneville
LavaLakes
LittleIman Lake
CattailLake
CrescentLake
SpringLake
LittleBrush Lake
SardineLake
CarpentersLake
LittleBlack Lake
WishramLake
RandLake
WecomaLake
LittleAshes Lake
GreenleafSlough
GilletteLake
EvergreenLake
BrushLake
Ice HouseLakeButlers
Pond
BlueLakes
MosleyLakes
FernLake
BowlesLakes
BassLake
KidneyLake
HazelLake
SmithLake
LittleDeep Lake
ImanLake
Cascade LocksCem
Iman Cem
Freddie Masterson Grave
Stevenson
CascadeLocks
Bonneville
MoffettsHot Springs
NorthBonneville
FortRains
ToothrockTunnel 4555
TableMtn
GreenleafPeak
Sacagawea andPapoose Rocks
Rock CreekButte
Hamilton Mtn
AldrichButte
BradfordIsland
RobinsIsland
CascadesIsland
Boat Rock
HamiltonIsland
Picture Rock Island
ThunderIsland
BonnevilleDam
RedBluffs
WaunaPoint
SheridanPoint
Bridge ofthe Gods
GreenleafBasin
GoldDustRock
0 .5 1
11
Columbia River
Goose Island
Eag Ele agC ler e Ce reek k
Tanner Creek
RM 147
Washington Shore Second Visitor Complex
Powerhouse
Cascade Island
RM 146
Bonneville Dam and Spillway
Fish Ladder East Arm
Picture Rock
Boat Rock
Eagle Creek Visitor Bradford Island Fish HatcheryCenter
RM 145
First Powerhouse
Old Navigation Lock
Robins Island New Navigation Lock
Fish Hatchery
Figure 2Source: Bonneville Dam Complex
BRADFORD ISLAND Cascade Locks, Oregon
Ref. 4, p. 295. 0 .25 .5 Date: Drawn by: 1004530.F230.001.01\Fig22-4-20 SBApproximate Scale in Miles
12

Columbia River
Goose Island
Eagle Creek
RM 147
Washington Shore
Second Visitor Complex
Powerhouse
Cascade Island
Boat146 Rock
Bonneville Dam Picture and Spillway Rock
Fish Ladder East Arm
Fish Ladder Disposal Piles
RM
Eagle Creek Visitor Bradford Island Fish HatcheryCenter
First Powerhouse
Old Navigation Lock
New Navigation LockRobins Island
Legend Source: Figure 3Ref 4, p. 296.Upland OU Location of Operable Units
BRADFORD ISLAND Cascade Locks, Oregon
Note: Forebay Location in legend added by E&E
River OU 0 .2 .4and Dam Date: Drawn by:from Ref. 4. p. 310 1004530.F230.001.01\Fig3Forebay Area 2-4-20 SB[Figure 6-1]. Approximate Scale in Miles
13
0072
173.
00 B
rdfo
rd1\
Om
aha
DT-
07\U
plan
d Q
APP\
Figu
res\
FIG
2 U
plan
d O
pera
ble
Uni
t Ove
rvie
w.m
xd
0 130 260 390 520 Feet
Landfill AOPC
BradfordIsland
ServiceCenter
Equi
pmen
tBu
ildin
g
Columbia River
SandblastArea AOPC
BulbSlopeAOPC
PistolRangeAOPC
UPLANDOPERABLE UNIT
LegendBulb Slope AOPC
Landfill AOPC
Pistol Range AOPC
Sandblast Area AOPC
Upland OU
Figure 4Upland Operable Unit Overview
BRADFORD ISLAND Cascade Locks, Oregon
Date:2-4-20
Drawn by:SB 1004530.F230.001.01\Fig4Approximate Scale in Feet
0 250 500
Source:Ref 4, p. 297.
Bulb Slope AOPC
Landfill AOPC
PistolRangeAOPC
O:\2
5692
709
USA
CE\
53-F
UPLAND OPERABLE UNIT OVERVIEW
FIGURE 1-4
FIG 1-4111 S.W. Columbia, Suite 1500Portland, Oregon 97201
(tel) 503-222-7200(fax) 503-222-4292www.urscorp.com
DRAWING NUMBER:
GIS FILE NUMBER:
SHEET: REV.
BRADFORD ISLAND
CASCADE LOCKS, OREGON
JOB No. DESIGNED: PROJ. ENGINEER:
DRAWN BY: APPROVED BY:
CHECKED BY: DATE:
25696528 LSM
SB MP
JULY 2010
LSM
SB
14

P115
Bradford Island
P117 ! Outfall 1
PPE 2
Outfall 2 PPE 6 68 Former Debris
P116 #*! Pile #3
62 PPE 3 P118 #*! P4 P115
!( !
EquipmentLaydown Area
Catch Basin #1 EquipmentCatch Basin #2 Laydown Area(Source 3)
Catch Basin #3
Catch Basin #4
Bradford Island
Key: Notes: Mass Wasting The following items were removed from the base map by
Ecology and Environment, Inc. (member of WSP): Surface Water Drainage Direction - Pre-RI Sediment (2007) symbols and labels,
- RI Sculpin Composite (2008) symbols and labels, andCatch Basins and Drain Lines- RI Smallmouth Bass (2006) symbols and labels.
Landfill AOPC (Source 1) Bulb Slope AOPC (Source 4) The following items were added to the base map by
Ecology and Environment, Inc. (member of WSP): Spent Sandblast Grit Disposal Area - Mass wasting arrows (Ref. 4, p. 303),(Source 2) - Former Debris Piles #1, #2, and #3 (Ref. 4, p. 302),
PPE - Probable Point of Entry - Surface Water Drainage Direction Lines (Ref. 4, p. 303), - Catch basins and outfalls (Ref. 4, pp. 301 and 303), andSampling Stations - Landfill AOPC, Spent Sandblast Grit Disposal Area,
! Pre-FS Sediment and Clam (2011) Equipment Laydown Area, and Bulb Slope AOPC source ! locations (Ref. 4, pp. 297, 301, 302, and 303).RI Sediment and Clam (2008)
- PPE 1 through 6 and Sources 1 through 5 labels.# Pre-FS Smallmouth Bass (2011)
Former Debris Pile #2 63 (Source 5) #* PPE 5P114
! !
P113 PPE 1 Former Debris Pile #1
(Source 5) PPE 4P112
!
Source: Ref. 7, p. 212.
BRADFORD ISLAND Cascade Locks, Oregon
Figure 5 Contaminated Sediment and Tissue Sample Locations
0 125 250
Approximate Scale in Feet Date:
2-7-20Drawn by:
SB 1004530.F230.001.01\Fig5
15
!(
!(
KEY:
TDL
Outfall #2 (Ref. 15, p.6)
15-Mile TDL
End of 15-Mile TDL
Debris Pile #1 (Ref. 15, p.6)
Target Distance Limit
Note: Feature labels, TDL-related lines, Outfall #2, and Debris Pile #1 added to basemap by Ecology and Environment, Inc., a member of WSP
Outfall #2
Debris Pile #1

17
SD – Characterization and Containment
SOURCE DESCRIPTION
2.2 SOURCE CHARACTERIZATION
Number of the Source: 1
Name and description of the source: Landfill AOPC (Landfill)
The Landfill AOPC is a former waste disposal site at the tip of Bradford Island that was used from the early 1940s until the early 1980s (Ref. 4, p. 20). Waste disposed of in the Landfill included: household waste, project-related wastes (grease, light bulbs, sandblast grit), electrical debris, up to 50 ballasts, broken glass, rubber tires, metal debris, wood debris, metal cables, asbestos-containing building materials, burned debris, ceramic insulators, and mercury vapor lamps (Ref. 4, p. 20). By 1982, the surface of the Landfill AOPC had been capped with soil, and another layer of soil was added in 1989 (Ref. 4, p. 20).
Historical investigations at the Landfill began in 1998 (Ref. 4, p. 48). In general, the investigations found that for approximately 40 years, the USACE managed, stored, and disposed of waste materials at the landfill in excavated pits or existing depressions on the eastern end of Bradford Island (Ref. 4, p, 48). Some additional wastes were disposed of over the northern and eastern edges of the island (Ref. 4, p. 48).
In 1998, a Site Inspection (SI) was conducted on the landfill to assess the potential for historical disposal practices to have adversely impacted the environment and to assess whether additional investigation or remediation was necessary (Ref. 4, p. 62). The SI report concluded that past disposal practices had impacted soil and groundwater in the Landfill with petroleum hydrocarbons, organochlorine pesticides, PCB Aroclor 1260, PCE, SVOCs, arsenic, and lead (Ref. 4, p. 62). A supplementary investigation of the Landfill was deemed necessary in order to evaluate potential remedial alternatives (Ref. 4, p. 62). Analytical results from the SI were not utilized in the RI Report for multiple reasons (i.e., sample reporting limits did not meet established data quality objectives, depth of soil samples were incompatible with target depths needed for risk evaluations, etc.) (Ref. 4, p. 62).
In 1999 and 2000, a Supplemental Site Inspection (SSI) of the Landfill AOPC was conducted by URS for the USACE (Ref. 4, p. 62). The purpose of the SSI was to augment information presented in the 1998 SI report, fill data gaps, conduct a risk evaluation, and provide a list of alternatives for the long-term management of the Landfill (Ref. 4, pp. 62 and 63). In addition to other work, the SSI included:
• Collection and analysis of 11 surface soil samples (i.e., BIL01SSI through BIL06SSI,BIL09SSI through BIL13SSI) from the Landfill AOPC,
• Installation of a groundwater monitoring well (i.e., MW-5) in September 1999,• Collection and analysis of groundwater samples from the four monitoring wells (MW-1 through
MW-4) in July 1999, and from five monitoring wells (MW-1 through MW-5) in November1999 and January 2000 (Ref. 4, pp. 63 and 427) (see Ref. 4, p. 305 [Figure 5-1] for samplelocations).
Based on comments received from the Oregon Department of Environmental Quality (ODEQ) regarding the conclusions made in the Draft SSI report, the USACE elected not to finalize the report (Ref. 4, p. 63). ODEQ and USACE agreed that additional investigation and analysis were necessary to address ODEQ comments on the SSI report (Ref. 4, p. 63). SSI surface soil samples (i.e., 0 to 0.5 feet below ground surface [bgs]) revealed the presence of PCBs (Aroclor 1260), metals (antimony, arsenic, cadmium, chromium, copper, lead, mercury, nickel, thallium, and zinc), herbicides (2,4,5-T), pesticides (4,4’-DDE

and BHC [beta]), VOCs (PCE and toluene), and SVOCs (acenaphthene, acenaphthylene, anthracene, benzo(a)anthracene, benzo(a)pyrene, benzo(b)fluoranthene, benzo(g,h,i)perylene, benzo(k)fluoranthene, bis(2-ethylhexyl)phthalate, chrysene, dibenz(a,h)anthracene, fluoranthene, fluorene, indeno(1,2,3-cd)pyrene, naphthalene, phenanthrene, and pyrene) (Ref. 4, pp. 427 through 432 [Table 5-1a, Table 5-1b, and Table 5-1c]) (see Table 1 of this HRS Documentation Record). The locations of all SSI surface soil samples are depicted on Figure 5-1 of Reference 4, p. 305.
In 2001/2002, site characterization of the Landfill AOPC was conducted by URS for the USACE, also referred to as a Phase II Supplemental Landfill Site Investigation or Inspection (Ref. 4, pp. 64, 290, and 441). The objective of the additional site characterization investigation was to collect site information to assist in the characterization of known or suspected potential environmental concerns at the Landfill (Ref. 4, p. 64). In addition to other work, the site characterization included:
• Collecting and analyzing 10 primary soil samples from a test pit in the gully area (BIL13 through BIL22);
• Removing mercury vapor lamps from a known area of disposal at the Landfill, and collection and analysis of seven primary soil samples from the Mercury Vapor-Lamp Test Pit (i.e., excavation) area (BIL05 through BIL11);
• Completing a geophysical evaluation of the Landfill using electrical resistivity and seismic refraction methods to estimate the extent of the Landfill;
• Installing and developing four monitoring wells (MW-6, MW-7, MW-8, MW-9); Collecting and analyzing nine primary groundwater samples (one each) from MW-1 through MW-9;
• Collecting and analyzing six Lead Hot Spot Test Pit (i.e., primary) soil samples at the Landfill (BIL24, BIL26, BIL27, BIL30, BIL31, and BIL32);
• Collecting and analyzing six composite soil samples excavated from the gully test pit (BIL01TPG, BIL02TPG, BIL03TPG, and BIL05TPG) and the mercury vapor-lamp test pit (BIL28TPM, BIL29TPM), which were then backfilled at their respective test pits at the Landfill (Ref. 4, pp. 64, 65, and 305 [Figure 5-1]).
Figure 5-1 in Reference 4, p. 305 depicts most sample locations for the Phase II Supplemental Landfill Site Investigation (Inspection); however; some locations are not shown including those for composite samples BIL01TPG, BIL02TPG, BIL03TPG, BIL05TPG, BIL28TPM, and BIL29TPM. For this reason, these samples have not been used in this HRS Documentation Record to demonstrate hazardous substances associated with Source 1.
Gully Test Pit soil samples obtained from depths ranging from 1 to 8 feet bgs within the Landfill AOPC revealed the presence of PCBs (Aroclor 1260), metals (antimony, arsenic, cadmium, chromium, copper, lead, mercury, nickel, thallium, and zinc), VOCs (PCE and toluene), and SVOCs (acenaphthene, anthracene, benzo(a)anthracene, benzo(a)pyrene, benzo(b)fluoranthene, benzo(g,h,i)perylene, benzo(k)fluoranthene, bis(2-ethylhexyl)phthalate, chrysene, dibenz(a,h)anthracene, dibenzofuran, fluoranthene, fluorene, indeno(1,2,3-cd)pyrene, phenanthrene, and pyrene) (Ref. 4, pp. 305, 441 through 448 [Table 5-2a, Table 5-2b, and Table 5-2c]) (see Table 2 of this HRS Documentation Record). Mercury Vapor-Lamp Test Pit soil samples obtained from 5 to 8 feet bgs within the Landfill AOPC revealed the presence of PCBs (Aroclor 1254 and Aroclor 1260) and metals (antimony, copper, lead, and mercury), and Lead Hot Spot Test Pits samples obtained from 2 and 3 feet bgs within the Landfill AOPC revealed the presence of lead (Ref. 4, pp. 305, 441 through 442 [Table 5-2a], and 449 [Table 5-2d]) (see Table 3 of this HRS Documentation Record).
18

In 2007, an Upland Source Evaluation of the Landfill AOPC was conducted by URS for the USACE to qualitatively evaluate the need for source control measures (Ref. 4, pp. 66 and 290). The focus of the evaluation was on direct transport of impacted soil to surface water, either through erosion and transport by storm water or by mass wasting (Ref. 4, p. 66). Six surface soil samples (BIL01USE, BIL02USE, BIL03USE, BIL07USE, BIL08USE, and BIL09USE) were collected from the north slope of the Landfill AOPC between the landfill and the Columbia River and three surface soil samples (BIL04USE, BIL05USE, and BIL06USE) were collected outside of the landfill on the eastern tip of Bradford Island (Ref. 4, pp. 66 and 305 [Figure 5-1]). The samples collected on the north side of the landfill were obtained from 0.5 feet bgs and revealed the presence of PCBs (Aroclor 1254 and Aroclor 1260), metals (chromium, lead, mercury, and nickel), and pesticides (4,4’DDT) (Ref. 4, pp. 305 and 456 [Table 5-3a]) (see Table 4 of this HRS Documentation Record).
In 2009, an Upland OU Data Gaps Report was completed by URS in support of the RI by URS (Ref. 4, pp. 72 and 73). The focus of this work was to fill data gaps related to understanding the nature and extent of contamination, and to provide sufficient information for conducting risk evaluations (Ref. 4, p. 72). During this investigation, a total of eight soil samples were collected from the Gully Area at the Landfill AOPC (Ref. 4, p. 72). These samples were obtained from four test pits (L1 through L4) at depths of 0-1 feet and 1-3 feet bgs; that is two samples per test pit (Ref. 4, pp. 72 and 306 [Figure 5-2]). The samples revealed the presence of polycyclic aromatic hydrocarbons (PAHs) (acenaphthene, acenaphthylene, anthracene, benzo(a)anthracene, benzo(a)pyrene, benzo(b)fluoranthene, benzo(g,h,i)perylene, benzo(k)fluoranthene, chrysene, dibenz(a,h)anthracene, fluoranthene, fluorene, indeno(1,2,3-cd)pyrene, naphthalene, phenanthrene, and pyrene) (Ref. 4, p. 504 [Table 6-2a]) (see Table 5 of this HRS Documentation Record).
Location of the source, with reference to a map: The Landfill AOPC is located on the eastern end of Bradford Island, Oregon (Figure 5 of this HRS Documentation Record; Ref. 4, p. 297).
Containment Release to Surface Water via Overland Migration and/or Flood: By 1982, the surface of the Landfill AOPC had been capped with soil, and another layer of soil was added in 1989 (Ref. 4, p. 20). A release from this source to surface water exists (see sections 4.1.1.1 and 4.1.2.1.1 of this HRS documentation record). The Landfill AOPC is unlined (Ref. 4, p. 37). A surface water containment factor value of 10 is assigned (Ref. 1, Table 4-2).
Containment Factor Value: 10
19
SD – Hazardous Substances Source No.: 1
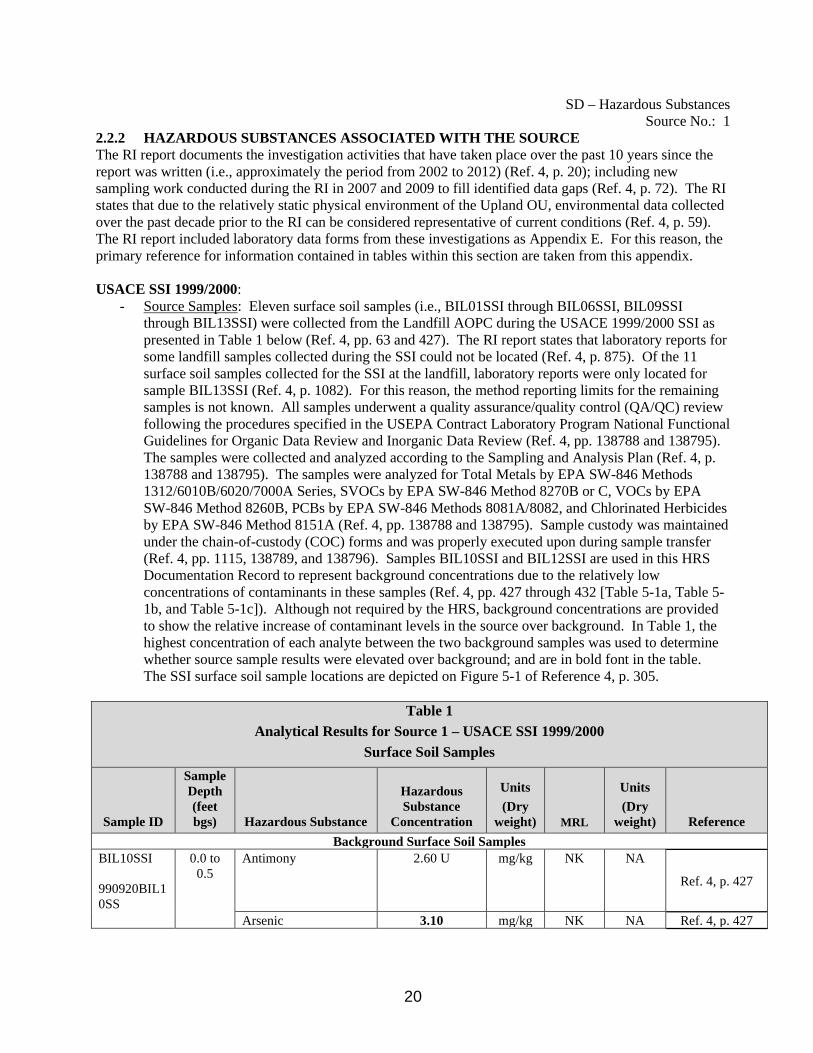
2.2.2 HAZARDOUS SUBSTANCES ASSOCIATED WITH THE SOURCE The RI report documents the investigation activities that have taken place over the past 10 years since the report was written (i.e., approximately the period from 2002 to 2012) (Ref. 4, p. 20); including new sampling work conducted during the RI in 2007 and 2009 to fill identified data gaps (Ref. 4, p. 72). The RI states that due to the relatively static physical environment of the Upland OU, environmental data collected over the past decade prior to the RI can be considered representative of current conditions (Ref. 4, p. 59). The RI report included laboratory data forms from these investigations as Appendix E. For this reason, the primary reference for information contained in tables within this section are taken from this appendix.
USACE SSI 1999/2000: - Source Samples: Eleven surface soil samples (i.e., BIL01SSI through BIL06SSI, BIL09SSI
through BIL13SSI) were collected from the Landfill AOPC during the USACE 1999/2000 SSI as presented in Table 1 below (Ref. 4, pp. 63 and 427). The RI report states that laboratory reports for some landfill samples collected during the SSI could not be located (Ref. 4, p. 875). Of the 11 surface soil samples collected for the SSI at the landfill, laboratory reports were only located for sample BIL13SSI (Ref. 4, p. 1082). For this reason, the method reporting limits for the remaining samples is not known. All samples underwent a quality assurance/quality control (QA/QC) review following the procedures specified in the USEPA Contract Laboratory Program National Functional Guidelines for Organic Data Review and Inorganic Data Review (Ref. 4, pp. 138788 and 138795). The samples were collected and analyzed according to the Sampling and Analysis Plan (Ref. 4, p. 138788 and 138795). The samples were analyzed for Total Metals by EPA SW-846 Methods 1312/6010B/6020/7000A Series, SVOCs by EPA SW-846 Method 8270B or C, VOCs by EPA SW-846 Method 8260B, PCBs by EPA SW-846 Methods 8081A/8082, and Chlorinated Herbicides by EPA SW-846 Method 8151A (Ref. 4, pp. 138788 and 138795). Sample custody was maintained under the chain-of-custody (COC) forms and was properly executed upon during sample transfer (Ref. 4, pp. 1115, 138789, and 138796). Samples BIL10SSI and BIL12SSI are used in this HRS Documentation Record to represent background concentrations due to the relatively low concentrations of contaminants in these samples (Ref. 4, pp. 427 through 432 [Table 5-1a, Table 5-1b, and Table 5-1c]). Although not required by the HRS, background concentrations are provided to show the relative increase of contaminant levels in the source over background. In Table 1, the highest concentration of each analyte between the two background samples was used to determine whether source sample results were elevated over background; and are in bold font in the table. The SSI surface soil sample locations are depicted on Figure 5-1 of Reference 4, p. 305.
Table 1 Analytical Results for Source 1 – USACE SSI 1999/2000
Surface Soil Samples
Sample ID
Sample Depth (feet bgs) Hazardous Substance
Hazardous Substance
Concentration
Units (Dry
weight) MRL
Units (Dry
weight) Reference Background Surface Soil Samples
BIL10SSI
990920BIL1 0SS
0.0 to 0.5
Antimony 2.60 U mg/kg NK NA
Ref. 4, p. 427
Arsenic 3.10 mg/kg NK NA Ref. 4, p. 427
20

Table 1 Analytical Results for Source 1 – USACE SSI 1999/2000
Surface Soil Samples
Sample ID
Sample Depth (feet bgs) Hazardous Substance
Hazardous Substance
Concentration
Units (Dry
weight) MRL
Units (Dry
weight) Reference (Cont.) BIL10SSI
990920BIL1 0SS
0.0 to 0.5
Cadmium 0.260 U mg/kg NK NA Ref. 4, p. 427
Chromium 16.3 mg/kg NK NA Ref. 4, p. 427 Copper 25.5 mg/kg NK NA Ref. 4, p. 427 Lead 19.3 mg/kg NK NA Ref. 4, p. 427 Mercury 0.110 U mg/kg NK NA Ref. 4, p. 427 Nickel 14.9 mg/kg NK NA Ref. 4, p. 427 Thallium 0.260 U mg/kg NK NA Ref. 4, p. 427 Zinc 69.6 mg/kg NK NA Ref. 4, p. 427 2,4,5-T 9.00 U ug/kg NK NA Ref. 4, p. 427 BHC (Beta) 1.80 U ug/kg NK NA Ref. 4, p. 428 Tetrachloroethene 2.10 U ug/kg NK NA Ref. 4, p. 430 Toluene 2.10 U ug/kg NK NA Ref. 4, p. 430 Bis(2-ethylhexyl)phthalate
770 ug/kg NK NA Ref. 4, p. 431
Dibenzofuran 180 U ug/kg NK NA Ref. 4, p. 431 Acenaphthene 180 U ug/kg NK NA Ref. 4, p. 432 Anthracene 180 U ug/kg NK NA Ref. 4, p. 432 Fluorene 180 U ug/kg NK NA Ref. 4, p. 432 Phenanthrene 36.0 J (360) ug/kg NK NA Ref. 4, p. 432;
Ref. 5, p. 15 Benzo(a)anthracene 60.0 J (600) ug/kg NK NA Ref. 4, p. 432;
Ref. 5, p. 14 Benzo(a)pyrene 70.0 J (700) ug/kg NK NA Ref. 4, p. 432;
Ref. 5, p. 14 Benzo(b)fluoranthene 58.0 J (580) ug/kg NK NA Ref. 4, p. 432;
Ref. 5, p. 14 Benzo(g,h,i)perylene 51.0 J (510) ug/kg NK NA Ref. 4, p. 432;
Ref. 5, p. 14 Benzo(k)fluoranthene 64.0 J (640) ug/kg NK NA Ref. 4, p. 432;
Ref. 5, p. 14 Chrysene 79.0 J (790) ug/kg NK NA Ref. 4, p. 432;
Ref. 5, p. 14 Dibenz(a,h)anthracene 24.0 J (240) ug/kg NK NA Ref. 4, p. 432;
Ref. 5, p. 14 Fluoranthene 88.0 J (880) ug/kg NK NA Ref. 4, p. 432;
Ref. 5, p. 15 Indeno(1,2,3-cd)pyrene 48.0 J (480) ug/kg NK NA Ref. 4, p. 432;
Ref. 5, p. 15 Pyrene 98.0 J (1,162.28) ug/kg NK NA Ref. 4, p. 432;
Ref. 5, p. 15
21
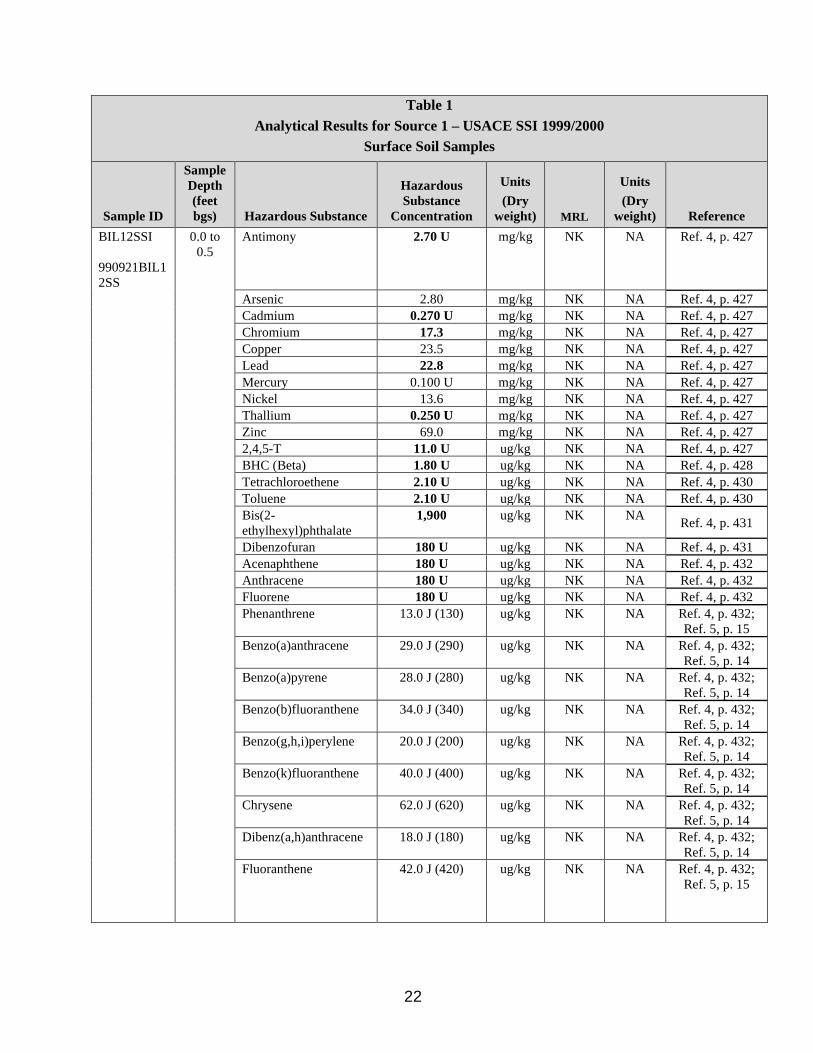
Table 1 Analytical Results for Source 1 – USACE SSI 1999/2000
Surface Soil Samples
Sample ID
Sample Depth (feet bgs) Hazardous Substance
Hazardous Substance
Concentration
Units (Dry
weight) MRL
Units (Dry
weight) Reference BIL12SSI
990921BIL1 2SS
0.0 to 0.5
Antimony 2.70 U mg/kg NK NA Ref. 4, p. 427
Arsenic 2.80 mg/kg NK NA Ref. 4, p. 427 Cadmium 0.270 U mg/kg NK NA Ref. 4, p. 427 Chromium 17.3 mg/kg NK NA Ref. 4, p. 427 Copper 23.5 mg/kg NK NA Ref. 4, p. 427 Lead 22.8 mg/kg NK NA Ref. 4, p. 427 Mercury 0.100 U mg/kg NK NA Ref. 4, p. 427 Nickel 13.6 mg/kg NK NA Ref. 4, p. 427 Thallium 0.250 U mg/kg NK NA Ref. 4, p. 427 Zinc 69.0 mg/kg NK NA Ref. 4, p. 427 2,4,5-T 11.0 U ug/kg NK NA Ref. 4, p. 427 BHC (Beta) 1.80 U ug/kg NK NA Ref. 4, p. 428 Tetrachloroethene 2.10 U ug/kg NK NA Ref. 4, p. 430 Toluene 2.10 U ug/kg NK NA Ref. 4, p. 430 Bis(2-ethylhexyl)phthalate
1,900 ug/kg NK NA Ref. 4, p. 431
Dibenzofuran 180 U ug/kg NK NA Ref. 4, p. 431 Acenaphthene 180 U ug/kg NK NA Ref. 4, p. 432 Anthracene 180 U ug/kg NK NA Ref. 4, p. 432 Fluorene 180 U ug/kg NK NA Ref. 4, p. 432 Phenanthrene 13.0 J (130) ug/kg NK NA Ref. 4, p. 432;
Ref. 5, p. 15 Benzo(a)anthracene 29.0 J (290) ug/kg NK NA Ref. 4, p. 432;
Ref. 5, p. 14 Benzo(a)pyrene 28.0 J (280) ug/kg NK NA Ref. 4, p. 432;
Ref. 5, p. 14 Benzo(b)fluoranthene 34.0 J (340) ug/kg NK NA Ref. 4, p. 432;
Ref. 5, p. 14 Benzo(g,h,i)perylene 20.0 J (200) ug/kg NK NA Ref. 4, p. 432;
Ref. 5, p. 14 Benzo(k)fluoranthene 40.0 J (400) ug/kg NK NA Ref. 4, p. 432;
Ref. 5, p. 14 Chrysene 62.0 J (620) ug/kg NK NA Ref. 4, p. 432;
Ref. 5, p. 14 Dibenz(a,h)anthracene 18.0 J (180) ug/kg NK NA Ref. 4, p. 432;
Ref. 5, p. 14 Fluoranthene 42.0 J (420) ug/kg NK NA Ref. 4, p. 432;
Ref. 5, p. 15
22
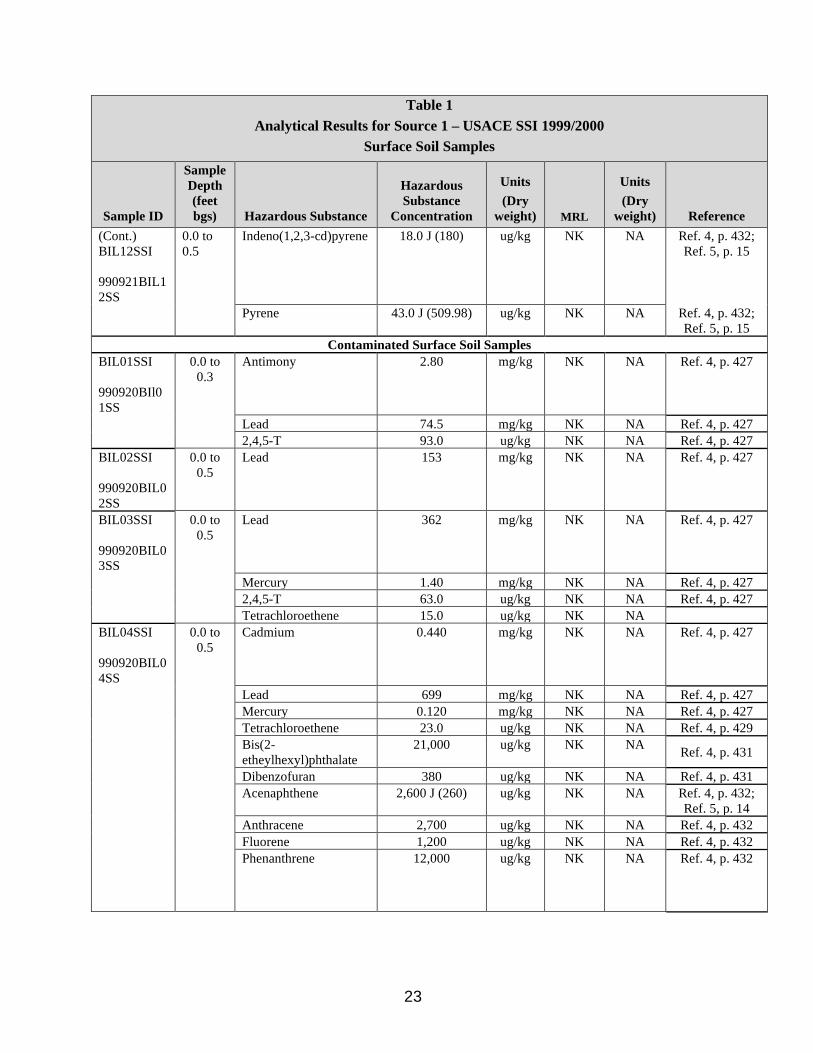
Table 1 Analytical Results for Source 1 – USACE SSI 1999/2000
Surface Soil Samples
Sample ID
Sample Depth (feet bgs) Hazardous Substance
Hazardous Substance
Concentration
Units (Dry
weight) MRL
Units (Dry
weight) Reference (Cont.) BIL12SSI
990921BIL1 2SS
0.0 to 0.5
Indeno(1,2,3-cd)pyrene 18.0 J (180) ug/kg NK NA Ref. 4, p. 432; Ref. 5, p. 15
Ref. 4, p. 432; Ref. 5, p. 15
Pyrene 43.0 J (509.98) ug/kg NK NA
Contaminated Surface Soil Samples BIL01SSI
990920BIl0 1SS
0.0 to 0.3
Antimony 2.80 mg/kg NK NA Ref. 4, p. 427
Lead 74.5 mg/kg NK NA Ref. 4, p. 427 2,4,5-T 93.0 ug/kg NK NA Ref. 4, p. 427
BIL02SSI
990920BIL0 2SS
0.0 to 0.5
Lead 153 mg/kg NK NA Ref. 4, p. 427
BIL03SSI
990920BIL0 3SS
0.0 to 0.5
Lead 362 mg/kg NK NA Ref. 4, p. 427
Mercury 1.40 mg/kg NK NA Ref. 4, p. 427 2,4,5-T 63.0 ug/kg NK NA Ref. 4, p. 427 Tetrachloroethene 15.0 ug/kg NK NA
BIL04SSI
990920BIL0 4SS
0.0 to 0.5
Cadmium 0.440 mg/kg NK NA Ref. 4, p. 427
Lead 699 mg/kg NK NA Ref. 4, p. 427 Mercury 0.120 mg/kg NK NA Ref. 4, p. 427 Tetrachloroethene 23.0 ug/kg NK NA Ref. 4, p. 429 Bis(2-etheylhexyl)phthalate
21,000 ug/kg NK NA Ref. 4, p. 431
Dibenzofuran 380 ug/kg NK NA Ref. 4, p. 431 Acenaphthene 2,600 J (260) ug/kg NK NA Ref. 4, p. 432;
Ref. 5, p. 14 Anthracene 2,700 ug/kg NK NA Ref. 4, p. 432 Fluorene 1,200 ug/kg NK NA Ref. 4, p. 432 Phenanthrene 12,000 ug/kg NK NA Ref. 4, p. 432
23

Table 1 Analytical Results for Source 1 – USACE SSI 1999/2000
Surface Soil Samples
Sample ID
Sample Depth (feet bgs) Hazardous Substance
Hazardous Substance
Concentration
Units (Dry
weight) MRL
Units (Dry
weight) Reference (Cont.) BIL04SSI
990920BIL0 4SS
0.0 to 0.5
Benzo(a)anthracene 32,000 ug/kg NK NA Ref. 4, p. 432
Benzo(a)pyrene 33,000 ug/kg NK NA Ref. 4, p. 432 Benzo(b)fluoranthene 65,000 ug/kg NK NA Ref. 4, p. 432 Benzo(g,h,i)perylene 18,000 ug/kg NK NA Ref. 4, p. 432 Benzo(k)fluoranthene 65,000 ug/kg NK NA Ref. 4, p. 432 Chrysene 32,000 ug/kg NK NA Ref. 4, p. 432 Dibenz(a,h)anthracene 9,900 ug/kg NK NA Ref. 4, p. 432 Fluoranthene 54,000 ug/kg NK NA Ref. 4, p. 432 Indeno(1,2,3-cd)pyrene 19,000 ug/kg NK NA Ref. 4, p. 432 Pyrene 40,000 ug/kg NK NA Ref. 4, p. 432
BIL05SSI
990920BIL0 5SS
0.0 to 0.5
Antimony 4.20 mg/kg NK NA Ref. 4, p. 427
Arsenic 30.1 mg/kg NK NA Ref. 4, p. 427 Cadmium 1.30 mg/kg NK NA Ref. 4, p. 427 Chromium 237 mg/kg NK NA Ref. 4, p. 427 Copper 494 mg/kg NK NA Ref. 4, p. 427 Lead 486 mg/kg NK NA Ref. 4, p. 427 Mercury 0.840 mg/kg NK NA Ref. 4, p. 427 Nickel 170 mg/kg NK NA Ref. 4, p. 427 Zinc 635 mg/kg NK NA Ref. 4, p. 427 Tetrachloroethene 65.0 ug/kg NK NA Ref. 4, p. 429 Toluene 5.30 ug/kg NK NA Ref. 4, p. 429 Acenaphthene 500 ug/kg NK NA Ref. 4, p. 432 Anthracene 460 ug/kg NK NA Ref. 4, p. 432 Phenanthrene 1,900 ug/kg NK NA Ref. 4, p. 432 Benzo(a)anthracene 2,200 ug/kg NK NA Ref. 4, p. 432 Benzo(a)pyrene 2,200 ug/kg NK NA Ref. 4, p. 432 Benzo(g,h,i)perylene 1,800 ug/kg NK NA Ref. 4, p. 432 Fluoranthene 3,300 ug/kg NK NA Ref. 4, p. 432 Indeno(1,2,3-cd)pyrene 1,700 ug/kg NK NA Ref. 4, p. 432
BIL06SSI
990920BIL0 6SS
0.0 to 0.5
Antimony 3.90 mg/kg NK NA Ref. 4, p. 427
24

Table 1 Analytical Results for Source 1 – USACE SSI 1999/2000
Surface Soil Samples
Sample ID
Sample Depth (feet bgs) Hazardous Substance
Hazardous Substance
Concentration
Units (Dry
weight) MRL
Units (Dry
weight) Reference (Cont.) BIL06SSI
990920BIL0 6SS
0.0 to 0.5
Cadmium 1.75 mg/kg NK NA Ref. 4, p. 427
Copper 143 mg/kg NK NA Ref. 4, p. 427 Lead 168 mg/kg NK NA Ref. 4, p. 427 Mercury 4.15 mg/kg NK NA Ref. 4, p. 427 Phenanthrene 1,230 ug/kg NK NA Ref. 4, p. 432 Benzo(b)fluoranthene 2,350 ug/kg NK NA Ref. 4, p. 432 Benzo(k)fluoranthene 2,350 ug/kg NK NA Ref. 4, p. 432
BIL09SSI
990920BIL0 9SS
0.0 to 0.5
Mercury 0.120 mg/kg NK NA Ref. 4, p. 427
BIL11SSI
009021BIL1 1SS
0.0 to 0.5
Arsenic 11.3 mg/kg NK NA Ref. 4, p. 427
BHC (beta) 2.60 ug/kg NK NA Ref. 4, p. 428 BIL13SSI
000413BIL1 3SS
0.0 to 0.5
Cadmium 0.387 mg/kg 0.287 mg/kg Ref. 4, p. 1083
Thallium 0.378 mg/kg 0.287 mg/kg Ref. 4, p. 1083 Notes: Bold font indicates the concentration is the highest of the two background samples.
The direction of bias for sample results having a J qualifier is not known. In this table, background J qualified sample results were assumed to be biased low and contaminated J qualified sample results were assumed to be high. Key:
() = The direction of bias for the qualified result was not reported (Ref. 4, p. 428 and 432) and is assumed to be unknown for the purposes of adjusting the data as per Ref. 5, pp. 7 and 8. The adjusted result was rounded to two decimal places when applicable.
bgs = below ground surface. ID = Identification. J = The reported value is an estimate and the direction of bias was not reported (Ref. 4, pp. 428 and 432). MRL = Method reporting limit. mg/kg = milligrams per kilogram. NA = Not applicable. NK = Not known. U = The analyte was not detected at or above the MDL (Ref. 4, pp. 428, 430, and 432). ug/kg = micrograms per kilogram.
25
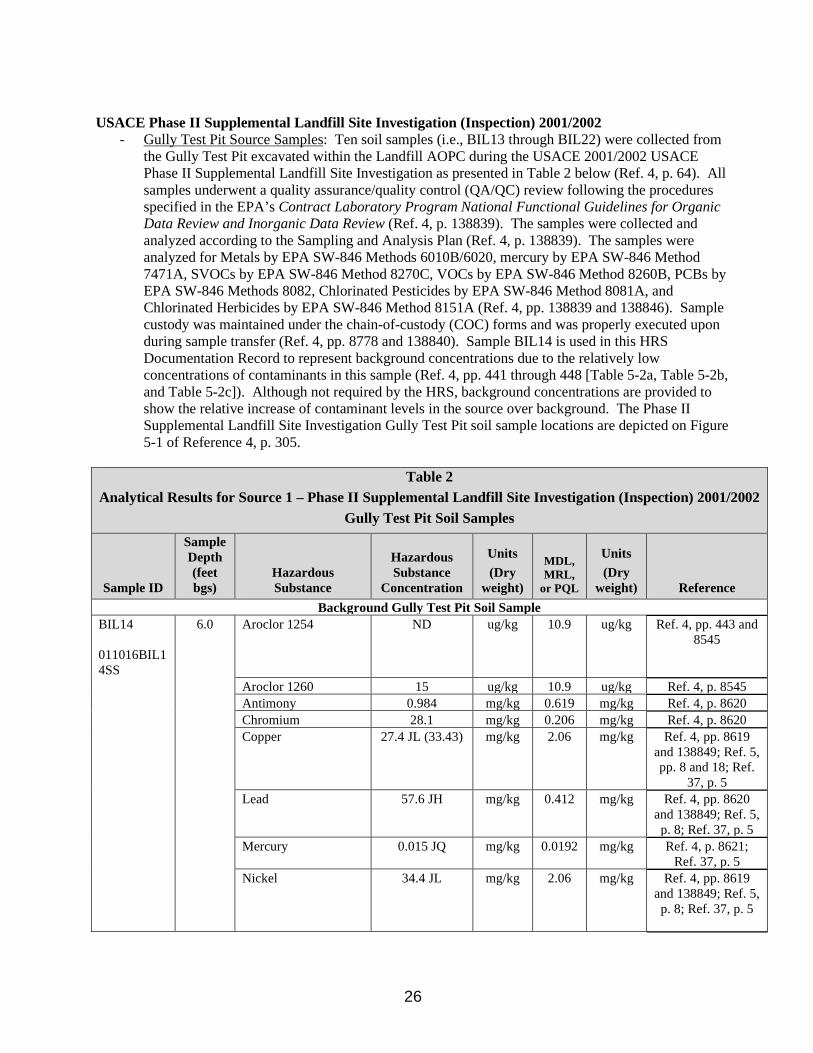
USACE Phase II Supplemental Landfill Site Investigation (Inspection) 2001/2002 - Gully Test Pit Source Samples: Ten soil samples (i.e., BIL13 through BIL22) were collected from
the Gully Test Pit excavated within the Landfill AOPC during the USACE 2001/2002 USACE Phase II Supplemental Landfill Site Investigation as presented in Table 2 below (Ref. 4, p. 64). All samples underwent a quality assurance/quality control (QA/QC) review following the procedures specified in the EPA’s Contract Laboratory Program National Functional Guidelines for Organic Data Review and Inorganic Data Review (Ref. 4, p. 138839). The samples were collected and analyzed according to the Sampling and Analysis Plan (Ref. 4, p. 138839). The samples were analyzed for Metals by EPA SW-846 Methods 6010B/6020, mercury by EPA SW-846 Method 7471A, SVOCs by EPA SW-846 Method 8270C, VOCs by EPA SW-846 Method 8260B, PCBs by EPA SW-846 Methods 8082, Chlorinated Pesticides by EPA SW-846 Method 8081A, and Chlorinated Herbicides by EPA SW-846 Method 8151A (Ref. 4, pp. 138839 and 138846). Sample custody was maintained under the chain-of-custody (COC) forms and was properly executed upon during sample transfer (Ref. 4, pp. 8778 and 138840). Sample BIL14 is used in this HRS Documentation Record to represent background concentrations due to the relatively low concentrations of contaminants in this sample (Ref. 4, pp. 441 through 448 [Table 5-2a, Table 5-2b, and Table 5-2c]). Although not required by the HRS, background concentrations are provided to show the relative increase of contaminant levels in the source over background. The Phase II Supplemental Landfill Site Investigation Gully Test Pit soil sample locations are depicted on Figure 5-1 of Reference 4, p. 305.
Table 2 Analytical Results for Source 1 – Phase II Supplemental Landfill Site Investigation (Inspection) 2001/2002
Gully Test Pit Soil Samples
Sample ID
Sample Depth (feet bgs)
Hazardous Substance
Hazardous Substance
Concentration
Units (Dry
weight)
MDL, MRL,
or PQL
Units (Dry
weight) Reference Background Gully Test Pit Soil Sample
BIL14
011016BIL1 4SS
6.0 Aroclor 1254 ND ug/kg 10.9 ug/kg Ref. 4, pp. 443 and 8545
Aroclor 1260 15 ug/kg 10.9 ug/kg Ref. 4, p. 8545 Antimony 0.984 mg/kg 0.619 mg/kg Ref. 4, p. 8620 Chromium 28.1 mg/kg 0.206 mg/kg Ref. 4, p. 8620 Copper 27.4 JL (33.43) mg/kg 2.06 mg/kg Ref. 4, pp. 8619
and 138849; Ref. 5, pp. 8 and 18; Ref.
37, p. 5 Lead 57.6 JH mg/kg 0.412 mg/kg Ref. 4, pp. 8620
and 138849; Ref. 5, p. 8; Ref. 37, p. 5
Mercury 0.015 JQ mg/kg 0.0192 mg/kg Ref. 4, p. 8621; Ref. 37, p. 5
Nickel 34.4 JL mg/kg 2.06 mg/kg Ref. 4, pp. 8619 and 138849; Ref. 5, p. 8; Ref. 37, p. 5
26
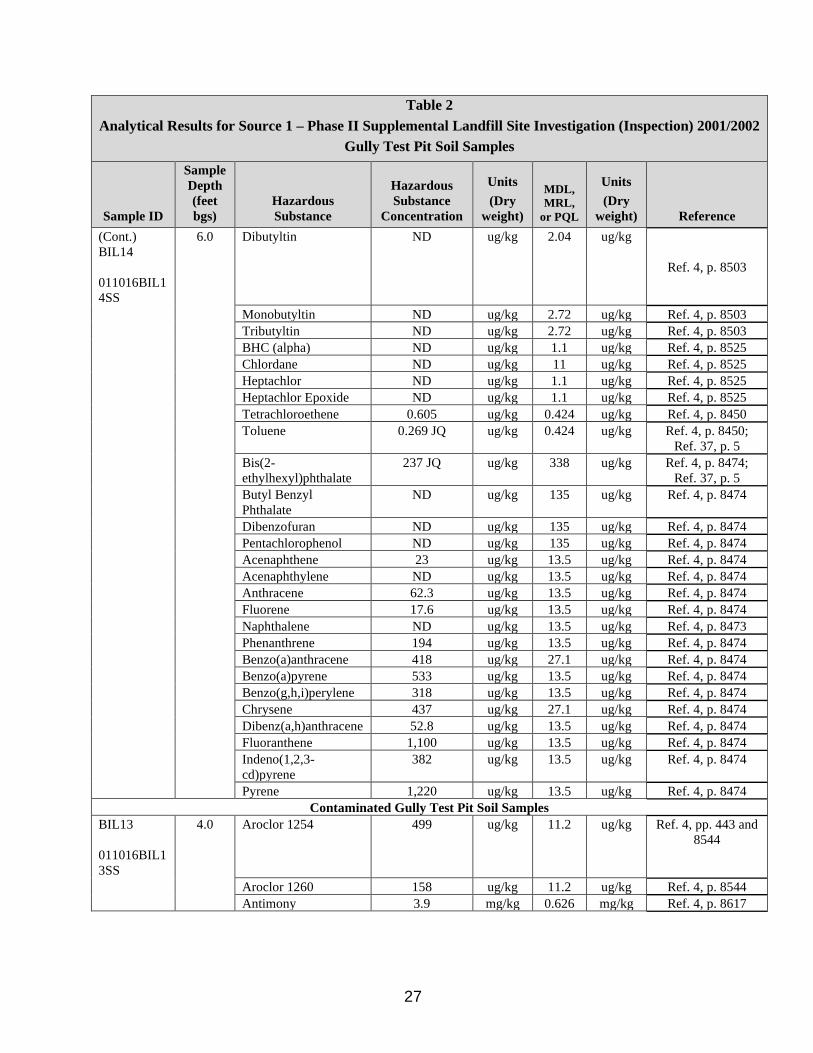
Table 2 Analytical Results for Source 1 – Phase II Supplemental Landfill Site Investigation (Inspection) 2001/2002
Gully Test Pit Soil Samples
Sample ID
Sample Depth (feet bgs)
Hazardous Substance
Hazardous Substance
Concentration
Units (Dry
weight)
MDL, MRL,
or PQL
Units (Dry
weight) Reference (Cont.) BIL14
011016BIL1 4SS
6.0 Dibutyltin ND ug/kg 2.04 ug/kg
Ref. 4, p. 8503
Monobutyltin ND ug/kg 2.72 ug/kg Ref. 4, p. 8503 Tributyltin ND ug/kg 2.72 ug/kg Ref. 4, p. 8503 BHC (alpha) ND ug/kg 1.1 ug/kg Ref. 4, p. 8525 Chlordane ND ug/kg 11 ug/kg Ref. 4, p. 8525 Heptachlor ND ug/kg 1.1 ug/kg Ref. 4, p. 8525 Heptachlor Epoxide ND ug/kg 1.1 ug/kg Ref. 4, p. 8525 Tetrachloroethene 0.605 ug/kg 0.424 ug/kg Ref. 4, p. 8450 Toluene 0.269 JQ ug/kg 0.424 ug/kg Ref. 4, p. 8450;
Ref. 37, p. 5 Bis(2-ethylhexyl)phthalate
237 JQ ug/kg 338 ug/kg Ref. 4, p. 8474; Ref. 37, p. 5
Butyl Benzyl Phthalate
ND ug/kg 135 ug/kg Ref. 4, p. 8474
Dibenzofuran ND ug/kg 135 ug/kg Ref. 4, p. 8474 Pentachlorophenol ND ug/kg 135 ug/kg Ref. 4, p. 8474 Acenaphthene 23 ug/kg 13.5 ug/kg Ref. 4, p. 8474 Acenaphthylene ND ug/kg 13.5 ug/kg Ref. 4, p. 8474 Anthracene 62.3 ug/kg 13.5 ug/kg Ref. 4, p. 8474 Fluorene 17.6 ug/kg 13.5 ug/kg Ref. 4, p. 8474 Naphthalene ND ug/kg 13.5 ug/kg Ref. 4, p. 8473 Phenanthrene 194 ug/kg 13.5 ug/kg Ref. 4, p. 8474 Benzo(a)anthracene 418 ug/kg 27.1 ug/kg Ref. 4, p. 8474 Benzo(a)pyrene 533 ug/kg 13.5 ug/kg Ref. 4, p. 8474 Benzo(g,h,i)perylene 318 ug/kg 13.5 ug/kg Ref. 4, p. 8474 Chrysene 437 ug/kg 27.1 ug/kg Ref. 4, p. 8474 Dibenz(a,h)anthracene 52.8 ug/kg 13.5 ug/kg Ref. 4, p. 8474 Fluoranthene 1,100 ug/kg 13.5 ug/kg Ref. 4, p. 8474 Indeno(1,2,3-cd)pyrene
382 ug/kg 13.5 ug/kg Ref. 4, p. 8474
Pyrene 1,220 ug/kg 13.5 ug/kg Ref. 4, p. 8474 Contaminated Gully Test Pit Soil Samples
BIL13
011016BIL1 3SS
4.0 Aroclor 1254 499 ug/kg 11.2 ug/kg Ref. 4, pp. 443 and 8544
Aroclor 1260 158 ug/kg 11.2 ug/kg Ref. 4, p. 8544 Antimony 3.9 mg/kg 0.626 mg/kg Ref. 4, p. 8617
27

Table 2 Analytical Results for Source 1 – Phase II Supplemental Landfill Site Investigation (Inspection) 2001/2002
Gully Test Pit Soil Samples
Sample ID
Sample Depth (feet bgs)
Hazardous Substance
Hazardous Substance
Concentration
Units (Dry
weight)
MDL, MRL,
or PQL
Units (Dry
weight) Reference (Cont.) BIL13
011016BIL1 3SS
4.0 Copper 312 JL mg/kg 2.09 mg/kg Ref. 4, p. 8616; Ref. 5, p. 8; Ref.
37, p. 5
Lead 488 JH (338.89) mg/kg 0.417 mg/kg Ref. 4, p. 8617; Ref. 5, pp. 8 and 18; Ref. 37, p. 5
Mercury 0.444 mg/kg 0.0237 mg/kg Ref. 4, p. 8618 Chlordane 409 ug/kg 11.2 ug/kg Ref. 4, p. 8524 Tetrachloroethene 8.12 ug/kg 0.483 ug/kg Ref. 4, p. 8448 Bis(2-ethylhexyl)phthalate
2,370 ug/kg 389 ug/kg Ref. 4, p. 8472
Acenaphthene 540 ug/kg 15.6 ug/kg Ref. 4, p. 8472 Acenaphthylene 65.4 ug/kg 15.6 ug/kg Ref. 4, p. 8472 Anthracene 872 ug/kg 15.6 ug/kg Ref. 4, p. 8472 Fluorene 272 ug/kg 15.6 ug/kg Ref. 4, p. 8472 Naphthalene 82.5 ug/kg 15.6 ug/kg Ref. 4, p. 8471 Phenanthrene 3,110 ug/kg 15.6 ug/kg Ref. 4, p. 8472 Benzo(a)anthracene 10,100 ug/kg 31.1 ug/kg Ref. 4, p. 8472 Benzo(a)pyrene 9,840 ug/kg 15.6 ug/kg Ref. 4, p. 8472 Benzo(g,h,i)perylene 5,060 ug/kg 15.6 ug/kg Ref. 4, p. 8472 Chrysene 8,190 ug/kg 31.1 ug/kg Ref. 4, p. 8472 Dibenz(a,h)anthracene 685 ug/kg 15.6 ug/kg Ref. 4, p. 8472 Fluoranthene 19,500 ug/kg 15.6 ug/kg Ref. 4, p. 8472 Indeno(1,2,3-cd)pyrene
6,260 ug/kg 15.6 ug/kg Ref. 4, p. 8472
Pyrene 23,100 ug/kg 15.6 ug/kg Ref. 4, p. 8472 BIL15
011016BIL1 5SS
8.0 Aroclor 1260 52.4 ug/kg 11 ug/kg Ref. 4, pp. 443 and 8546
Mercury 0.021 mg/kg 0.018 mg/kg Ref. 4, p. 8624 Bis(2-ethylhexyl)phthalate
1,170 ug/kg 362 ug/kg Ref. 4, p. 8477
Acenaphthene 113 ug/kg 14.5 ug/kg Ref. 4, p. 8477 Acenaphthylene 27.5 ug/kg 14.5 ug/kg Ref. 4, p. 8477 Anthracene 307 ug/kg 14.5 ug/kg Ref. 4, p. 8477 Fluorene 89.7 ug/kg 14.5 ug/kg Ref. 4, p. 8477 Phenanthrene 1,240 ug/kg 14.5 ug/kg Ref. 4, p. 8477 Benzo(a)anthracene 3,020 ug/kg 28.9 ug/kg Ref. 4, p. 8477 Benzo(a)pyrene 3,160 ug/kg 14.5 ug/kg Ref. 4, p. 8477 Benzo(g,h,i)perylene 1,850 ug/kg 14.5 ug/kg Ref. 4, p. 8477 Chrysene 2,990 ug/kg 28.9 ug/kg Ref. 4, p. 8477
28

Table 2 Analytical Results for Source 1 – Phase II Supplemental Landfill Site Investigation (Inspection) 2001/2002
Gully Test Pit Soil Samples
Sample ID
Sample Depth (feet bgs)
Hazardous Substance
Hazardous Substance
Concentration
Units (Dry
weight)
MDL, MRL,
or PQL
Units (Dry
weight) Reference (Cont.) BIL15
011016BIL1 5SS
8.0 Dibenz(a,h)anthracene 324 ug/kg 14.5 ug/kg Ref. 4, p. 8477
Fluoranthene 6,830 ug/kg 14.5 ug/kg Ref. 4, p. 8477 Indeno(1,2,3-cd)pyrene
2,140 ug/kg 14.5 ug/kg Ref. 4, p. 8477
Pyrene 7,670 ug/kg 14.5 ug/kg Ref. 4, p. 8477 BIL16
011016BIL1 6SS
4.0 Aroclor 1260 445 ug/kg 10.5 ug/kg Ref. 4, pp. 443, and 8547
Tetrachloroethene 5.19 ug/kg 0.416 ug/kg Ref. 4, p. 8454 Bis(2-ethylhexyl)phthalate
1,160 ug/kg 372 ug/kg Ref. 4, p. 8479
Butyl Benzyl Phthalate
152 ug/kg 149 ug/kg Ref. 4, p. 8479
Acenaphthene 87.9 ug/kg 14.9 ug/kg Ref. 4, p. 8479 Acenaphthylene 35.8 ug/kg 14.9 ug/kg Ref. 4, p. 8479 Anthracene 295 ug/kg 14.9 ug/kg Ref. 4, p. 8479 Fluorene 71.5 ug/kg 14.9 ug/kg Ref. 4, p. 8479 Naphthalene 34.3 ug/kg 14.9 ug/kg Ref. 4, p. 8478 Phenanthrene 798 ug/kg 14.9 ug/kg Ref. 4, p. 8479 Benzo(a)anthracene 4,590 ug/kg 29.8 ug/kg Ref. 4, p. 8479 Benzo(a)pyrene 3,310 ug/kg 14.9 ug/kg Ref. 4, p. 8479 Benzo(g,h,i)perylene 1,780 ug/kg 14.9 ug/kg Ref. 4, p. 8479 Chrysene 3,380 ug/kg 29.8 ug/kg Ref. 4, p. 8479 Dibenz(a,h)anthracene 280 ug/kg 14.9 ug/kg Ref. 4, p. 8479 Fluoranthene 9,800 ug/kg 14.9 ug/kg Ref. 4, p. 8479 Indeno(1,2,3-cd)pyrene
1,990 ug/kg 14.9 ug/kg Ref. 4, p. 8479
Pyrene 11,600 ug/kg 14.9 ug/kg Ref. 4, p. 8479 BIL17
011016BIL1 7SS
1.0 Aroclor 1254 78.6 ug/kg 12.4 ug/kg Ref. 4, pp. 443 and 8548
Aroclor 1260 68 ug/kg 12.4 ug/kg Ref. 4, p. 8548 Lead 741 JH (514.58) mg/kg 0.467 mg/kg Ref. 4, pp. 8629
and 138849; Ref. 5, pp. 8 and 18; Ref.
37, p. 5 Mercury 0.122 mg/kg 0.0237 mg/kg Ref. 4, p. 8630 Dibutyltin 20.2 ug/kg 2.41 ug/kg Ref. 4, p. 8506
29
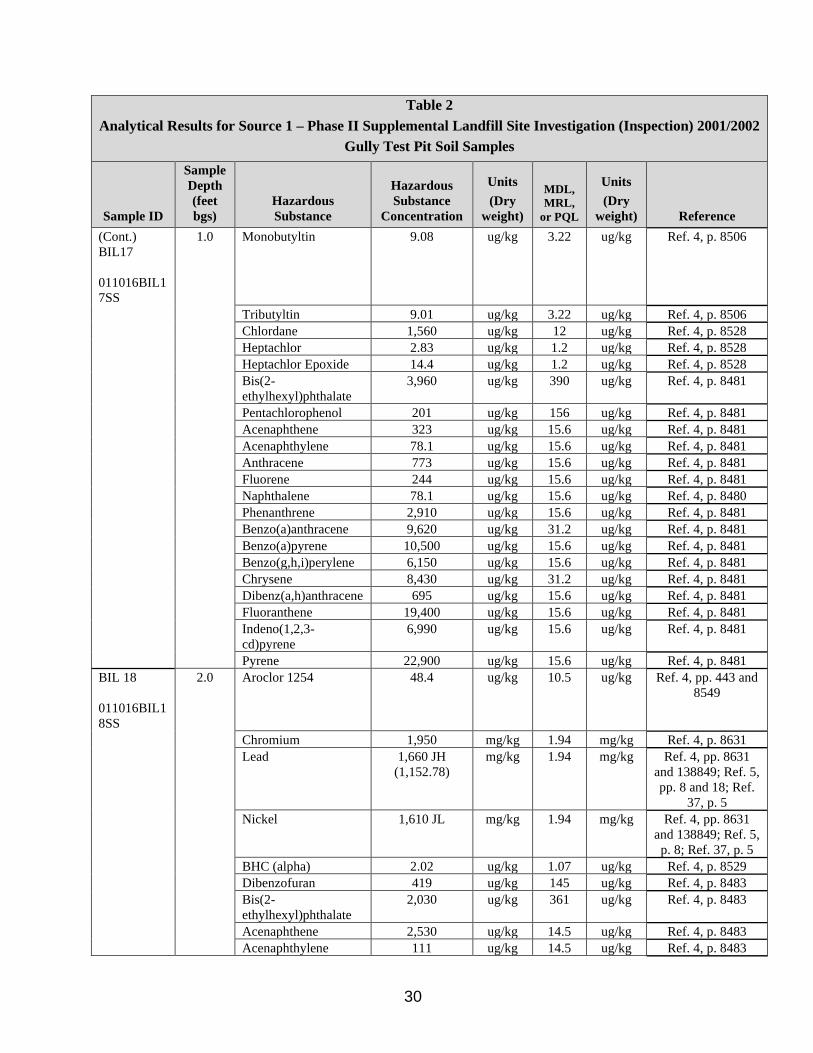
Table 2 Analytical Results for Source 1 – Phase II Supplemental Landfill Site Investigation (Inspection) 2001/2002
Gully Test Pit Soil Samples
Sample ID
Sample Depth (feet bgs)
Hazardous Substance
Hazardous Substance
Concentration
Units (Dry
weight)
MDL, MRL,
or PQL
Units (Dry
weight) Reference (Cont.) BIL17
011016BIL1 7SS
1.0 Monobutyltin 9.08 ug/kg 3.22 ug/kg Ref. 4, p. 8506
Tributyltin 9.01 ug/kg 3.22 ug/kg Ref. 4, p. 8506 Chlordane 1,560 ug/kg 12 ug/kg Ref. 4, p. 8528 Heptachlor 2.83 ug/kg 1.2 ug/kg Ref. 4, p. 8528 Heptachlor Epoxide 14.4 ug/kg 1.2 ug/kg Ref. 4, p. 8528 Bis(2-ethylhexyl)phthalate
3,960 ug/kg 390 ug/kg Ref. 4, p. 8481
Pentachlorophenol 201 ug/kg 156 ug/kg Ref. 4, p. 8481 Acenaphthene 323 ug/kg 15.6 ug/kg Ref. 4, p. 8481 Acenaphthylene 78.1 ug/kg 15.6 ug/kg Ref. 4, p. 8481 Anthracene 773 ug/kg 15.6 ug/kg Ref. 4, p. 8481 Fluorene 244 ug/kg 15.6 ug/kg Ref. 4, p. 8481 Naphthalene 78.1 ug/kg 15.6 ug/kg Ref. 4, p. 8480 Phenanthrene 2,910 ug/kg 15.6 ug/kg Ref. 4, p. 8481 Benzo(a)anthracene 9,620 ug/kg 31.2 ug/kg Ref. 4, p. 8481 Benzo(a)pyrene 10,500 ug/kg 15.6 ug/kg Ref. 4, p. 8481 Benzo(g,h,i)perylene 6,150 ug/kg 15.6 ug/kg Ref. 4, p. 8481 Chrysene 8,430 ug/kg 31.2 ug/kg Ref. 4, p. 8481 Dibenz(a,h)anthracene 695 ug/kg 15.6 ug/kg Ref. 4, p. 8481 Fluoranthene 19,400 ug/kg 15.6 ug/kg Ref. 4, p. 8481 Indeno(1,2,3-cd)pyrene
6,990 ug/kg 15.6 ug/kg Ref. 4, p. 8481
Pyrene 22,900 ug/kg 15.6 ug/kg Ref. 4, p. 8481 BIL 18
011016BIL1 8SS
2.0 Aroclor 1254 48.4 ug/kg 10.5 ug/kg Ref. 4, pp. 443 and 8549
Chromium 1,950 mg/kg 1.94 mg/kg Ref. 4, p. 8631 Lead 1,660 JH
(1,152.78) mg/kg 1.94 mg/kg Ref. 4, pp. 8631
and 138849; Ref. 5, pp. 8 and 18; Ref.
37, p. 5 Nickel 1,610 JL mg/kg 1.94 mg/kg Ref. 4, pp. 8631
and 138849; Ref. 5, p. 8; Ref. 37, p. 5
BHC (alpha) 2.02 ug/kg 1.07 ug/kg Ref. 4, p. 8529 Dibenzofuran 419 ug/kg 145 ug/kg Ref. 4, p. 8483 Bis(2-ethylhexyl)phthalate
2,030 ug/kg 361 ug/kg Ref. 4, p. 8483
Acenaphthene 2,530 ug/kg 14.5 ug/kg Ref. 4, p. 8483 Acenaphthylene 111 ug/kg 14.5 ug/kg Ref. 4, p. 8483
30

Table 2 Analytical Results for Source 1 – Phase II Supplemental Landfill Site Investigation (Inspection) 2001/2002
Gully Test Pit Soil Samples
Sample ID
Sample Depth (feet bgs)
Hazardous Substance
Hazardous Substance
Concentration
Units (Dry
weight)
MDL, MRL,
or PQL
Units (Dry
weight) Reference (Cont.) BIL 18
01106BIL18 SS
2.0 Anthracene 8,440 ug/kg 14.5 ug/kg Ref. 4, p. 8483
Fluorene 1,610 ug/kg 14.5 ug/kg Ref. 4, p. 8483 Naphthalene 176 ug/kg 14.5 ug/kg Ref. 4, p. 8482 Phenanthrene 21,900 ug/kg 14.5 ug/kg Ref. 4, p. 8483 Benzo(a)anthracene 28,200 ug/kg 28.9 ug/kg Ref. 4, p. 8483 Benzo(a)pyrene 34,000 ug/kg 14.5 ug/kg Ref. 4, p. 8483 Benzo(g,h,i)perylene 17,000 ug/kg 14.5 ug/kg Ref. 4, p. 8483 Chrysene 35,300 JK
(3,530) ug/kg 28.9 ug/kg Ref. 4, p. 8483;
Ref. 5, pp. 8 and 9; Ref. 37, p. 5
Dibenz(a,h)anthracene 1,940 ug/kg 14.5 ug/kg Ref. 4, p. 8483 Fluoranthene 48,300 ug/kg 14.5 ug/kg Ref. 4, p. 8483 Indeno(1,2,3-cd)pyrene
20,000 ug/kg 14.5 ug/kg Ref. 4, p. 8483
Pyrene 67,100 ug/kg 14.5 ug/kg Ref. 4, p. 8483 BIL19
011016BIL1 9SS
5.0 Aroclor 1254 54.9 ug/kg 10.6 ug/kg Ref. 4, pp. 443 and 8550
Aroclor 1260 74.6 ug/kg 10.6 ug/kg Ref. 4, p. 8550 Chromium 1,920 mg/kg 1.95 mg/kg Ref. 4, p. 8634 Lead 931 JH (646.53) mg/kg 0.39 mg/kg Ref. 4, pp. 8635
and 138849; Ref. 5, pp. 8 and 18; Ref.
37, p. 5 Nickel 1,760 JL mg/kg 1.95 mg/kg Ref. 4, pp. 8634
and 138849; Ref. 5, p. 8; Ref. 37, p. 5
Bis(2-ethylhexyl)phthalate
1,720 ug/kg 344 ug/kg Ref. 4, p. 8485
Anthracene 5,640 ug/kg 13.7 ug/kg Ref. 4, p. 8485 Fluorene 977 ug/kg 13.7 ug/kg Ref. 4, p. 8485 Naphthalene 77 ug/kg 13.7 ug/kg Ref. 4, p. 8484 Benzo(a)anthracene 31,200 ug/kg 27.5 ug/kg Ref. 4, p. 8485 Benzo(a)pyrene 19,200 ug/kg 13.7 ug/kg Ref. 4, p. 8485 Benzo(g,h,i)perylene 9,530 ug/kg 13.7 ug/kg Ref. 4, p. 8485 Chrysene 24,000 ug/kg 27.5 ug/kg Ref. 4, p. 8485 Fluoranthene 30,700 ug/kg 13.7 ug/kg Ref. 4, p. 8485 Indeno(1,2,3-cd)pyrene
11,300 ug/kg 13.7 ug/kg Ref. 4, p. 8485
Pyrene 37,700 ug/kg 13.7 ug/kg Ref. 4, p. 8485
31
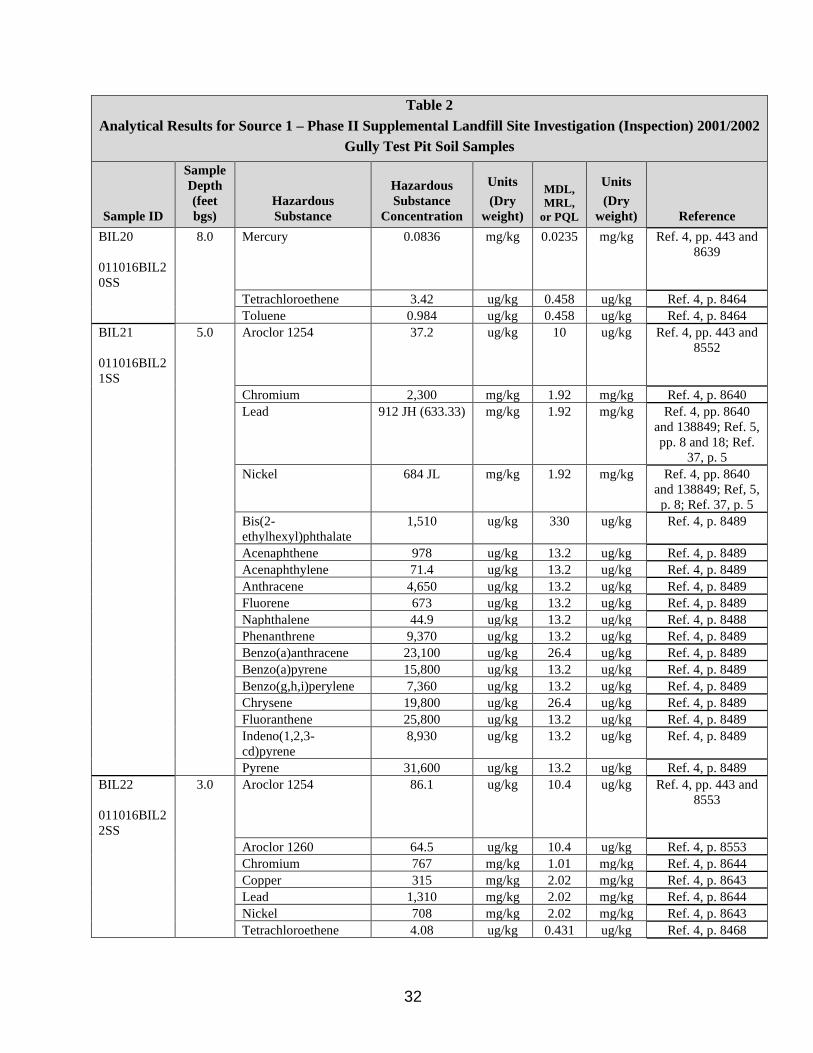
Table 2 Analytical Results for Source 1 – Phase II Supplemental Landfill Site Investigation (Inspection) 2001/2002
Gully Test Pit Soil Samples
Sample ID
Sample Depth (feet bgs)
Hazardous Substance
Hazardous Substance
Concentration
Units (Dry
weight)
MDL, MRL,
or PQL
Units (Dry
weight) Reference BIL20
011016BIL2 0SS
8.0 Mercury 0.0836 mg/kg 0.0235 mg/kg Ref. 4, pp. 443 and 8639
Tetrachloroethene 3.42 ug/kg 0.458 ug/kg Ref. 4, p. 8464 Toluene 0.984 ug/kg 0.458 ug/kg Ref. 4, p. 8464
BIL21
011016BIL2 1SS
5.0 Aroclor 1254 37.2 ug/kg 10 ug/kg Ref. 4, pp. 443 and 8552
Chromium 2,300 mg/kg 1.92 mg/kg Ref. 4, p. 8640 Lead 912 JH (633.33) mg/kg 1.92 mg/kg Ref. 4, pp. 8640
and 138849; Ref. 5, pp. 8 and 18; Ref.
37, p. 5 Nickel 684 JL mg/kg 1.92 mg/kg Ref. 4, pp. 8640
and 138849; Ref, 5, p. 8; Ref. 37, p. 5
Bis(2-ethylhexyl)phthalate
1,510 ug/kg 330 ug/kg Ref. 4, p. 8489
Acenaphthene 978 ug/kg 13.2 ug/kg Ref. 4, p. 8489 Acenaphthylene 71.4 ug/kg 13.2 ug/kg Ref. 4, p. 8489 Anthracene 4,650 ug/kg 13.2 ug/kg Ref. 4, p. 8489 Fluorene 673 ug/kg 13.2 ug/kg Ref. 4, p. 8489 Naphthalene 44.9 ug/kg 13.2 ug/kg Ref. 4, p. 8488 Phenanthrene 9,370 ug/kg 13.2 ug/kg Ref. 4, p. 8489 Benzo(a)anthracene 23,100 ug/kg 26.4 ug/kg Ref. 4, p. 8489 Benzo(a)pyrene 15,800 ug/kg 13.2 ug/kg Ref. 4, p. 8489 Benzo(g,h,i)perylene 7,360 ug/kg 13.2 ug/kg Ref. 4, p. 8489 Chrysene 19,800 ug/kg 26.4 ug/kg Ref. 4, p. 8489 Fluoranthene 25,800 ug/kg 13.2 ug/kg Ref. 4, p. 8489 Indeno(1,2,3-cd)pyrene
8,930 ug/kg 13.2 ug/kg Ref. 4, p. 8489
Pyrene 31,600 ug/kg 13.2 ug/kg Ref. 4, p. 8489 BIL22
011016BIL2 2SS
3.0 Aroclor 1254 86.1 ug/kg 10.4 ug/kg Ref. 4, pp. 443 and 8553
Aroclor 1260 64.5 ug/kg 10.4 ug/kg Ref. 4, p. 8553 Chromium 767 mg/kg 1.01 mg/kg Ref. 4, p. 8644 Copper 315 mg/kg 2.02 mg/kg Ref. 4, p. 8643 Lead 1,310 mg/kg 2.02 mg/kg Ref. 4, p. 8644 Nickel 708 mg/kg 2.02 mg/kg Ref. 4, p. 8643 Tetrachloroethene 4.08 ug/kg 0.431 ug/kg Ref. 4, p. 8468
32
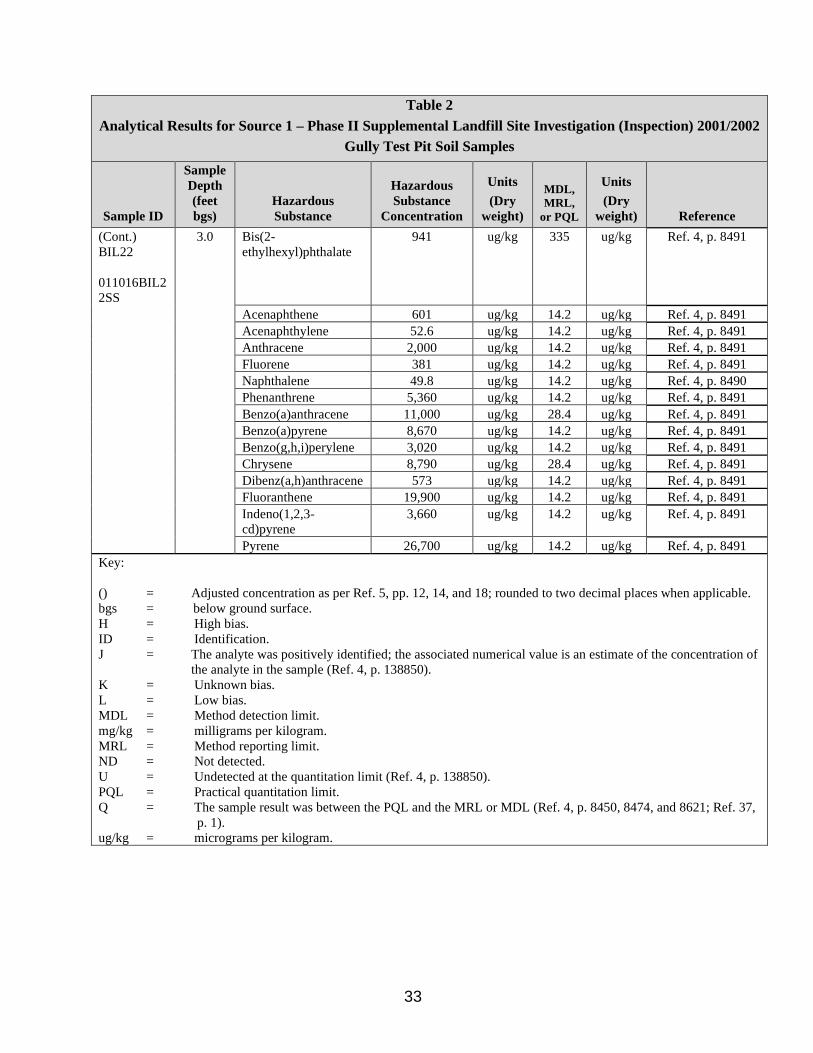
Table 2 Analytical Results for Source 1 – Phase II Supplemental Landfill Site Investigation (Inspection) 2001/2002
Gully Test Pit Soil Samples
Sample ID
Sample Depth (feet bgs)
Hazardous Substance
Hazardous Substance
Concentration
Units (Dry
weight)
MDL, MRL,
or PQL
Units (Dry
weight) Reference (Cont.) BIL22
011016BIL2 2SS
3.0 Bis(2-ethylhexyl)phthalate
941 ug/kg 335 ug/kg Ref. 4, p. 8491
Acenaphthene 601 ug/kg 14.2 ug/kg Ref. 4, p. 8491 Acenaphthylene 52.6 ug/kg 14.2 ug/kg Ref. 4, p. 8491 Anthracene 2,000 ug/kg 14.2 ug/kg Ref. 4, p. 8491 Fluorene 381 ug/kg 14.2 ug/kg Ref. 4, p. 8491 Naphthalene 49.8 ug/kg 14.2 ug/kg Ref. 4, p. 8490 Phenanthrene 5,360 ug/kg 14.2 ug/kg Ref. 4, p. 8491 Benzo(a)anthracene 11,000 ug/kg 28.4 ug/kg Ref. 4, p. 8491 Benzo(a)pyrene 8,670 ug/kg 14.2 ug/kg Ref. 4, p. 8491 Benzo(g,h,i)perylene 3,020 ug/kg 14.2 ug/kg Ref. 4, p. 8491 Chrysene 8,790 ug/kg 28.4 ug/kg Ref. 4, p. 8491 Dibenz(a,h)anthracene 573 ug/kg 14.2 ug/kg Ref. 4, p. 8491 Fluoranthene 19,900 ug/kg 14.2 ug/kg Ref. 4, p. 8491 Indeno(1,2,3-cd)pyrene
3,660 ug/kg 14.2 ug/kg Ref. 4, p. 8491
Pyrene 26,700 ug/kg 14.2 ug/kg Ref. 4, p. 8491 Key:
() = Adjusted concentration as per Ref. 5, pp. 12, 14, and 18; rounded to two decimal places when applicable. bgs = below ground surface. H = High bias. ID = Identification. J = The analyte was positively identified; the associated numerical value is an estimate of the concentration of
the analyte in the sample (Ref. 4, p. 138850). K = Unknown bias. L = Low bias. MDL = Method detection limit. mg/kg = milligrams per kilogram. MRL = Method reporting limit. ND = Not detected. U = Undetected at the quantitation limit (Ref. 4, p. 138850). PQL = Practical quantitation limit. Q = The sample result was between the PQL and the MRL or MDL (Ref. 4, p. 8450, 8474, and 8621; Ref. 37,
p. 1). ug/kg = micrograms per kilogram.
33
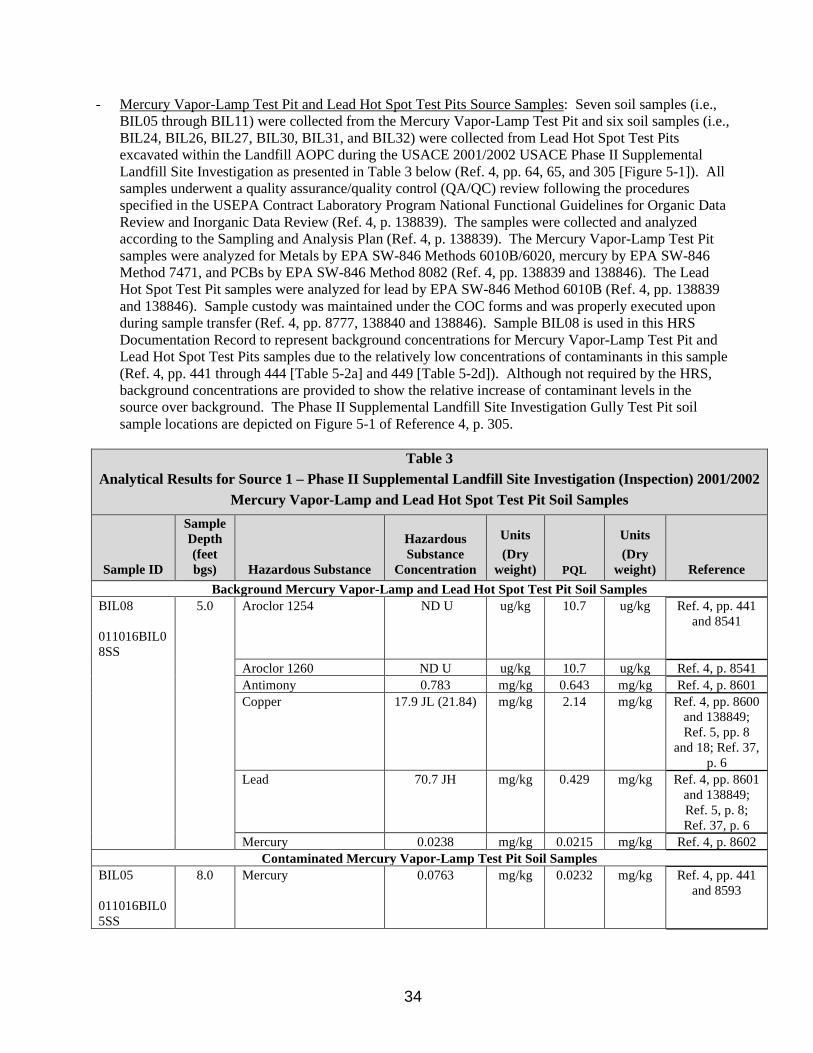
- Mercury Vapor-Lamp Test Pit and Lead Hot Spot Test Pits Source Samples: Seven soil samples (i.e., BIL05 through BIL11) were collected from the Mercury Vapor-Lamp Test Pit and six soil samples (i.e., BIL24, BIL26, BIL27, BIL30, BIL31, and BIL32) were collected from Lead Hot Spot Test Pits excavated within the Landfill AOPC during the USACE 2001/2002 USACE Phase II Supplemental Landfill Site Investigation as presented in Table 3 below (Ref. 4, pp. 64, 65, and 305 [Figure 5-1]). All samples underwent a quality assurance/quality control (QA/QC) review following the procedures specified in the USEPA Contract Laboratory Program National Functional Guidelines for Organic Data Review and Inorganic Data Review (Ref. 4, p. 138839). The samples were collected and analyzed according to the Sampling and Analysis Plan (Ref. 4, p. 138839). The Mercury Vapor-Lamp Test Pit samples were analyzed for Metals by EPA SW-846 Methods 6010B/6020, mercury by EPA SW-846 Method 7471, and PCBs by EPA SW-846 Method 8082 (Ref. 4, pp. 138839 and 138846). The Lead Hot Spot Test Pit samples were analyzed for lead by EPA SW-846 Method 6010B (Ref. 4, pp. 138839 and 138846). Sample custody was maintained under the COC forms and was properly executed upon during sample transfer (Ref. 4, pp. 8777, 138840 and 138846). Sample BIL08 is used in this HRS Documentation Record to represent background concentrations for Mercury Vapor-Lamp Test Pit and Lead Hot Spot Test Pits samples due to the relatively low concentrations of contaminants in this sample (Ref. 4, pp. 441 through 444 [Table 5-2a] and 449 [Table 5-2d]). Although not required by the HRS, background concentrations are provided to show the relative increase of contaminant levels in the source over background. The Phase II Supplemental Landfill Site Investigation Gully Test Pit soil sample locations are depicted on Figure 5-1 of Reference 4, p. 305.
Table 3 Analytical Results for Source 1 – Phase II Supplemental Landfill Site Investigation (Inspection) 2001/2002
Mercury Vapor-Lamp and Lead Hot Spot Test Pit Soil Samples
Sample ID
Sample Depth (feet bgs) Hazardous Substance
Hazardous Substance
Concentration
Units (Dry
weight) PQL
Units (Dry
weight) Reference Background Mercury Vapor-Lamp and Lead Hot Spot Test Pit Soil Samples
BIL08
011016BIL0 8SS
5.0 Aroclor 1254 ND U ug/kg 10.7 ug/kg Ref. 4, pp. 441 and 8541
Aroclor 1260 ND U ug/kg 10.7 ug/kg Ref. 4, p. 8541 Antimony 0.783 mg/kg 0.643 mg/kg Ref. 4, p. 8601 Copper 17.9 JL (21.84) mg/kg 2.14 mg/kg Ref. 4, pp. 8600
and 138849; Ref. 5, pp. 8
and 18; Ref. 37, p. 6
Lead 70.7 JH mg/kg 0.429 mg/kg Ref. 4, pp. 8601 and 138849; Ref. 5, p. 8; Ref. 37, p. 6
Mercury 0.0238 mg/kg 0.0215 mg/kg Ref. 4, p. 8602 Contaminated Mercury Vapor-Lamp Test Pit Soil Samples
BIL05
011016BIL0 5SS
8.0 Mercury 0.0763 mg/kg 0.0232 mg/kg Ref. 4, pp. 441 and 8593
34
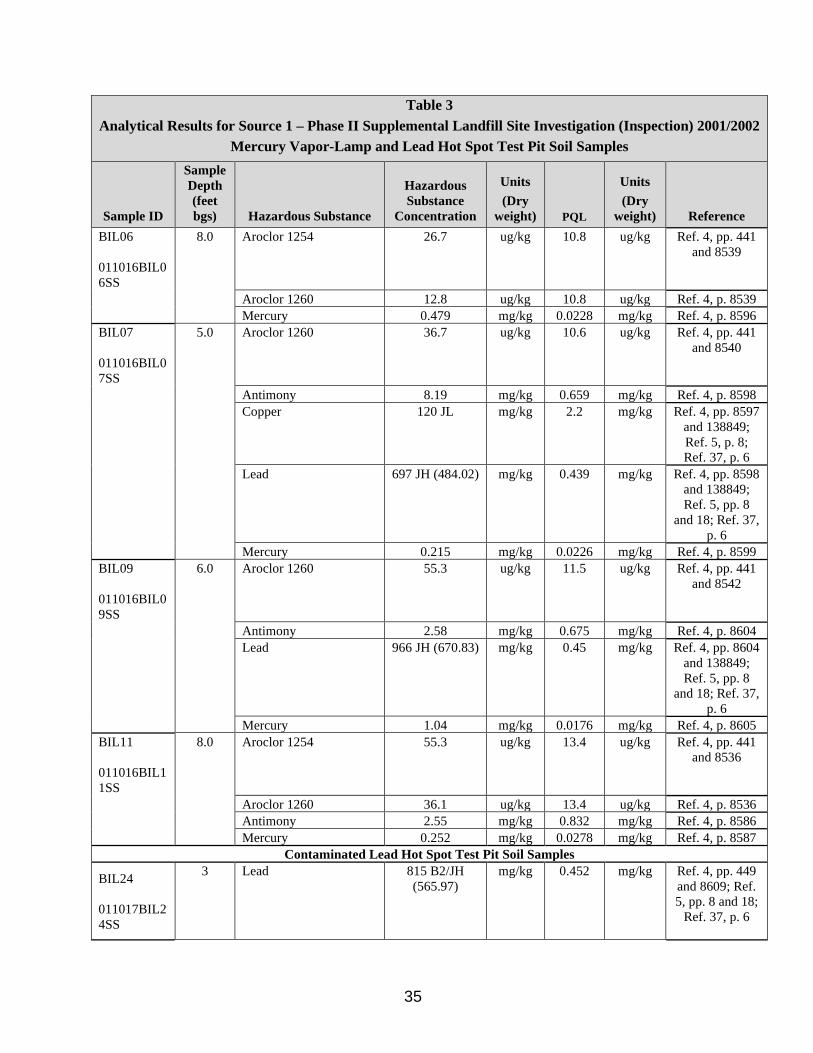
Table 3 Analytical Results for Source 1 – Phase II Supplemental Landfill Site Investigation (Inspection) 2001/2002
Mercury Vapor-Lamp and Lead Hot Spot Test Pit Soil Samples
Sample ID
Sample Depth (feet bgs) Hazardous Substance
Hazardous Substance
Concentration
Units (Dry
weight) PQL
Units (Dry
weight) Reference BIL06
011016BIL0 6SS
8.0 Aroclor 1254 26.7 ug/kg 10.8 ug/kg Ref. 4, pp. 441 and 8539
Aroclor 1260 12.8 ug/kg 10.8 ug/kg Ref. 4, p. 8539 Mercury 0.479 mg/kg 0.0228 mg/kg Ref. 4, p. 8596
BIL07
011016BIL0 7SS
5.0 Aroclor 1260 36.7 ug/kg 10.6 ug/kg Ref. 4, pp. 441 and 8540
Antimony 8.19 mg/kg 0.659 mg/kg Ref. 4, p. 8598 Copper 120 JL mg/kg 2.2 mg/kg Ref. 4, pp. 8597
and 138849; Ref. 5, p. 8; Ref. 37, p. 6
Lead 697 JH (484.02) mg/kg 0.439 mg/kg Ref. 4, pp. 8598 and 138849; Ref. 5, pp. 8
and 18; Ref. 37, p. 6
Mercury 0.215 mg/kg 0.0226 mg/kg Ref. 4, p. 8599 BIL09
011016BIL0 9SS
6.0 Aroclor 1260 55.3 ug/kg 11.5 ug/kg Ref. 4, pp. 441 and 8542
Antimony 2.58 mg/kg 0.675 mg/kg Ref. 4, p. 8604 Lead 966 JH (670.83) mg/kg 0.45 mg/kg Ref. 4, pp. 8604
and 138849; Ref. 5, pp. 8
and 18; Ref. 37, p. 6
Mercury 1.04 mg/kg 0.0176 mg/kg Ref. 4, p. 8605 BIL11
011016BIL1 1SS
8.0 Aroclor 1254 55.3 ug/kg 13.4 ug/kg Ref. 4, pp. 441 and 8536
Aroclor 1260 36.1 ug/kg 13.4 ug/kg Ref. 4, p. 8536 Antimony 2.55 mg/kg 0.832 mg/kg Ref. 4, p. 8586 Mercury 0.252 mg/kg 0.0278 mg/kg Ref. 4, p. 8587
Contaminated Lead Hot Spot Test Pit Soil Samples
BIL24
011017BIL2 4SS
3 Lead 815 B2/JH (565.97)
mg/kg 0.452 mg/kg Ref. 4, pp. 449 and 8609; Ref. 5, pp. 8 and 18;
Ref. 37, p. 6
35
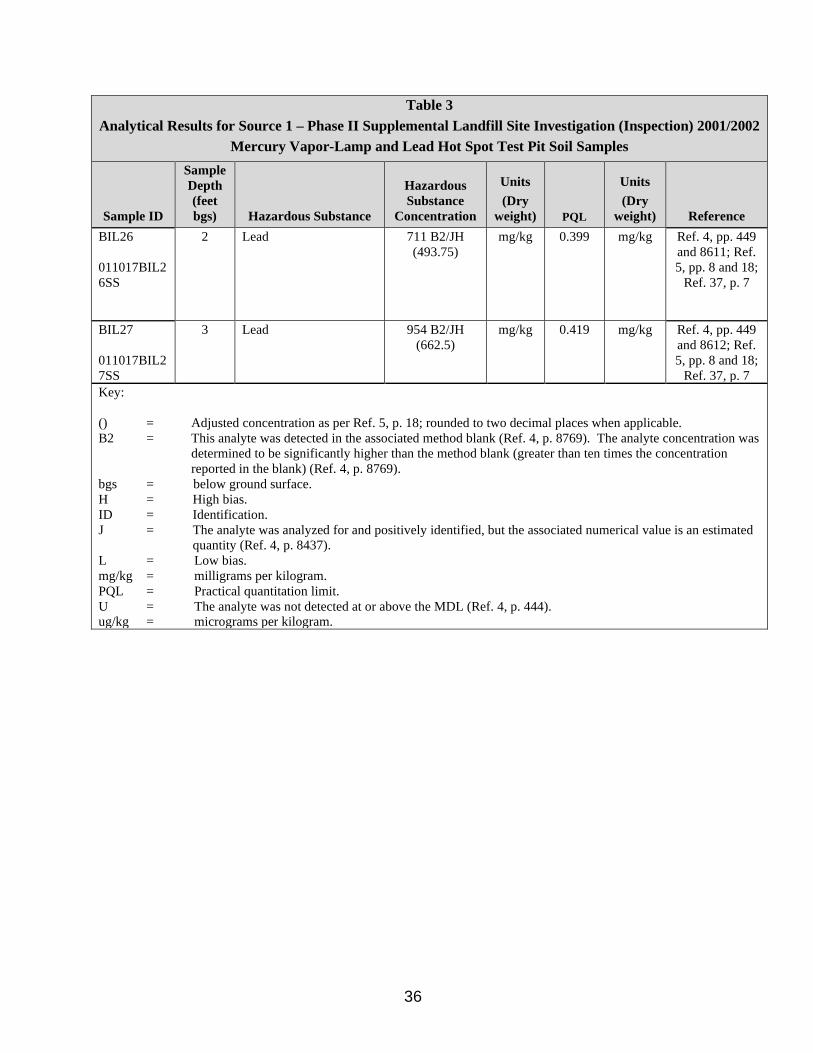
Table 3 Analytical Results for Source 1 – Phase II Supplemental Landfill Site Investigation (Inspection) 2001/2002
Mercury Vapor-Lamp and Lead Hot Spot Test Pit Soil Samples
Sample ID
Sample Depth (feet bgs) Hazardous Substance
Hazardous Substance
Concentration
Units (Dry
weight) PQL
Units (Dry
weight) Reference BIL26 2 Lead 711 B2/JH mg/kg 0.399 mg/kg Ref. 4, pp. 449
(493.75) and 8611; Ref. 011017BIL2 5, pp. 8 and 18; 6SS Ref. 37, p. 7
BIL27 3 Lead 954 B2/JH mg/kg 0.419 mg/kg Ref. 4, pp. 449 (662.5) and 8612; Ref.
011017BIL2 5, pp. 8 and 18; 7SS Ref. 37, p. 7 Key:
() = Adjusted concentration as per Ref. 5, p. 18; rounded to two decimal places when applicable. B2 = This analyte was detected in the associated method blank (Ref. 4, p. 8769). The analyte concentration was
determined to be significantly higher than the method blank (greater than ten times the concentration reported in the blank) (Ref. 4, p. 8769).
bgs = below ground surface. H = High bias. ID = Identification. J = The analyte was analyzed for and positively identified, but the associated numerical value is an estimated
quantity (Ref. 4, p. 8437). L = Low bias. mg/kg = milligrams per kilogram. PQL = Practical quantitation limit. U = The analyte was not detected at or above the MDL (Ref. 4, p. 444). ug/kg = micrograms per kilogram.
36
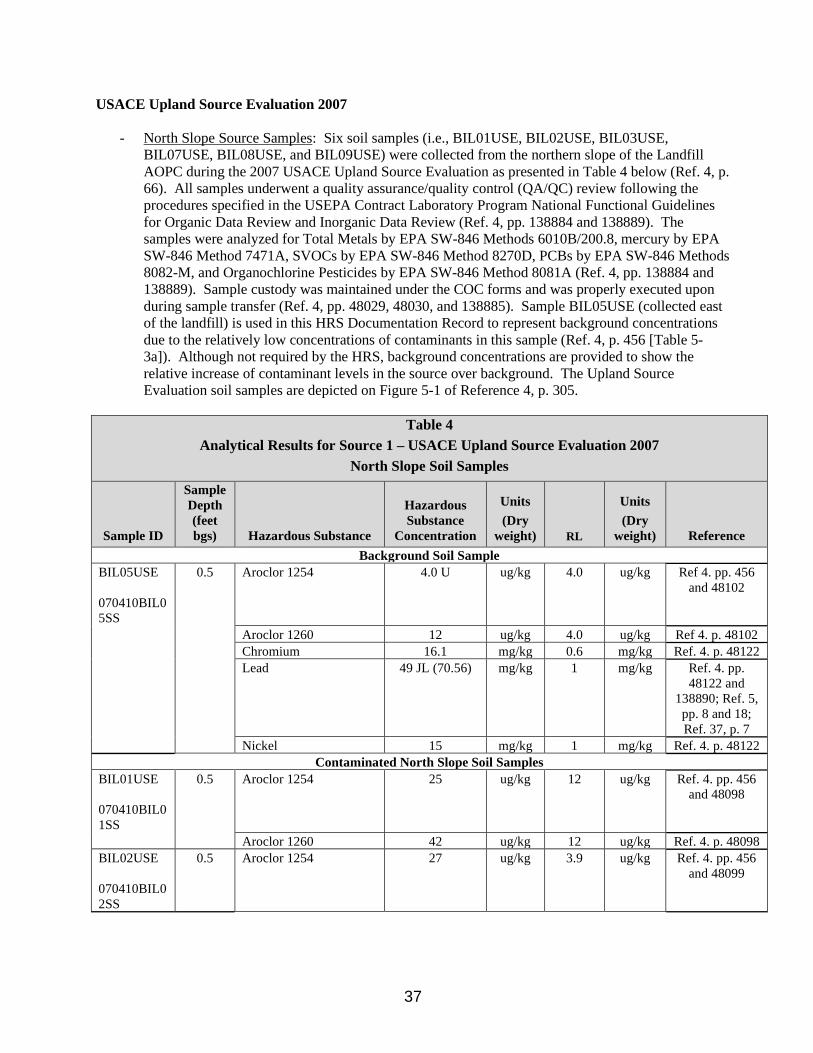
USACE Upland Source Evaluation 2007
- North Slope Source Samples: Six soil samples (i.e., BIL01USE, BIL02USE, BIL03USE, BIL07USE, BIL08USE, and BIL09USE) were collected from the northern slope of the Landfill AOPC during the 2007 USACE Upland Source Evaluation as presented in Table 4 below (Ref. 4, p. 66). All samples underwent a quality assurance/quality control (QA/QC) review following the procedures specified in the USEPA Contract Laboratory Program National Functional Guidelines for Organic Data Review and Inorganic Data Review (Ref. 4, pp. 138884 and 138889). The samples were analyzed for Total Metals by EPA SW-846 Methods 6010B/200.8, mercury by EPA SW-846 Method 7471A, SVOCs by EPA SW-846 Method 8270D, PCBs by EPA SW-846 Methods 8082-M, and Organochlorine Pesticides by EPA SW-846 Method 8081A (Ref. 4, pp. 138884 and 138889). Sample custody was maintained under the COC forms and was properly executed upon during sample transfer (Ref. 4, pp. 48029, 48030, and 138885). Sample BIL05USE (collected east of the landfill) is used in this HRS Documentation Record to represent background concentrations due to the relatively low concentrations of contaminants in this sample (Ref. 4, p. 456 [Table 5-3a]). Although not required by the HRS, background concentrations are provided to show the relative increase of contaminant levels in the source over background. The Upland Source Evaluation soil samples are depicted on Figure 5-1 of Reference 4, p. 305.
Table 4 Analytical Results for Source 1 – USACE Upland Source Evaluation 2007
North Slope Soil Samples
Sample ID
Sample Depth (feet bgs) Hazardous Substance
Hazardous Substance
Concentration
Units (Dry
weight) RL
Units (Dry
weight) Reference Background Soil Sample
BIL05USE
070410BIL0 5SS
0.5 Aroclor 1254 4.0 U ug/kg 4.0 ug/kg Ref 4. pp. 456 and 48102
Aroclor 1260 12 ug/kg 4.0 ug/kg Ref 4. p. 48102 Chromium 16.1 mg/kg 0.6 mg/kg Ref. 4. p. 48122 Lead 49 JL (70.56) mg/kg 1 mg/kg Ref. 4. pp.
48122 and 138890; Ref. 5, pp. 8 and 18; Ref. 37, p. 7
Nickel 15 mg/kg 1 mg/kg Ref. 4. p. 48122 Contaminated North Slope Soil Samples
BIL01USE
070410BIL0 1SS
0.5 Aroclor 1254 25 ug/kg 12 ug/kg Ref. 4. pp. 456 and 48098
Aroclor 1260 42 ug/kg 12 ug/kg Ref. 4. p. 48098 BIL02USE
070410BIL0 2SS
0.5 Aroclor 1254 27 ug/kg 3.9 ug/kg Ref. 4. pp. 456 and 48099
37
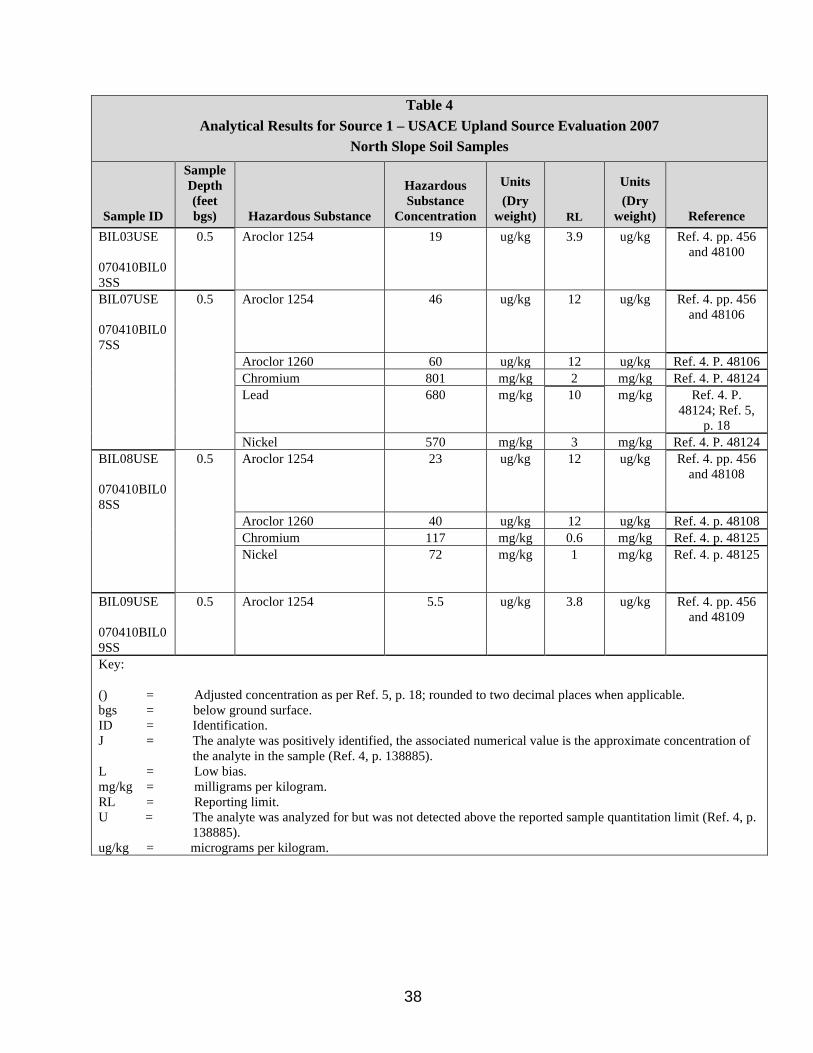
Table 4 Analytical Results for Source 1 – USACE Upland Source Evaluation 2007
North Slope Soil Samples
Sample ID
Sample Depth (feet bgs) Hazardous Substance
Hazardous Substance
Concentration
Units (Dry
weight) RL
Units (Dry
weight) Reference BIL03USE
070410BIL0 3SS
0.5 Aroclor 1254 19 ug/kg 3.9 ug/kg Ref. 4. pp. 456 and 48100
BIL07USE
070410BIL0 7SS
0.5 Aroclor 1254 46 ug/kg 12 ug/kg Ref. 4. pp. 456 and 48106
Aroclor 1260 60 ug/kg 12 ug/kg Ref. 4. P. 48106 Chromium 801 mg/kg 2 mg/kg Ref. 4. P. 48124 Lead 680 mg/kg 10 mg/kg Ref. 4. P.
48124; Ref. 5, p. 18
Nickel 570 mg/kg 3 mg/kg Ref. 4. P. 48124 BIL08USE
070410BIL0 8SS
0.5 Aroclor 1254 23 ug/kg 12 ug/kg Ref. 4. pp. 456 and 48108
Aroclor 1260 40 ug/kg 12 ug/kg Ref. 4. p. 48108 Chromium 117 mg/kg 0.6 mg/kg Ref. 4. p. 48125 Nickel 72 mg/kg 1 mg/kg Ref. 4. p. 48125
BIL09USE
070410BIL0 9SS
0.5 Aroclor 1254 5.5 ug/kg 3.8 ug/kg Ref. 4. pp. 456 and 48109
Key:
() = bgs = ID = J =
L = mg/kg = RL = U =
ug/kg =
Adjusted concentration as per Ref. 5, p. 18; rounded to two decimal places when applicable. below ground surface. Identification. The analyte was positively identified, the associated numerical value is the approximate concentration of the analyte in the sample (Ref. 4, p. 138885). Low bias. milligrams per kilogram. Reporting limit. The analyte was analyzed for but was not detected above the reported sample quantitation limit (Ref. 4, p. 138885).
micrograms per kilogram.
38
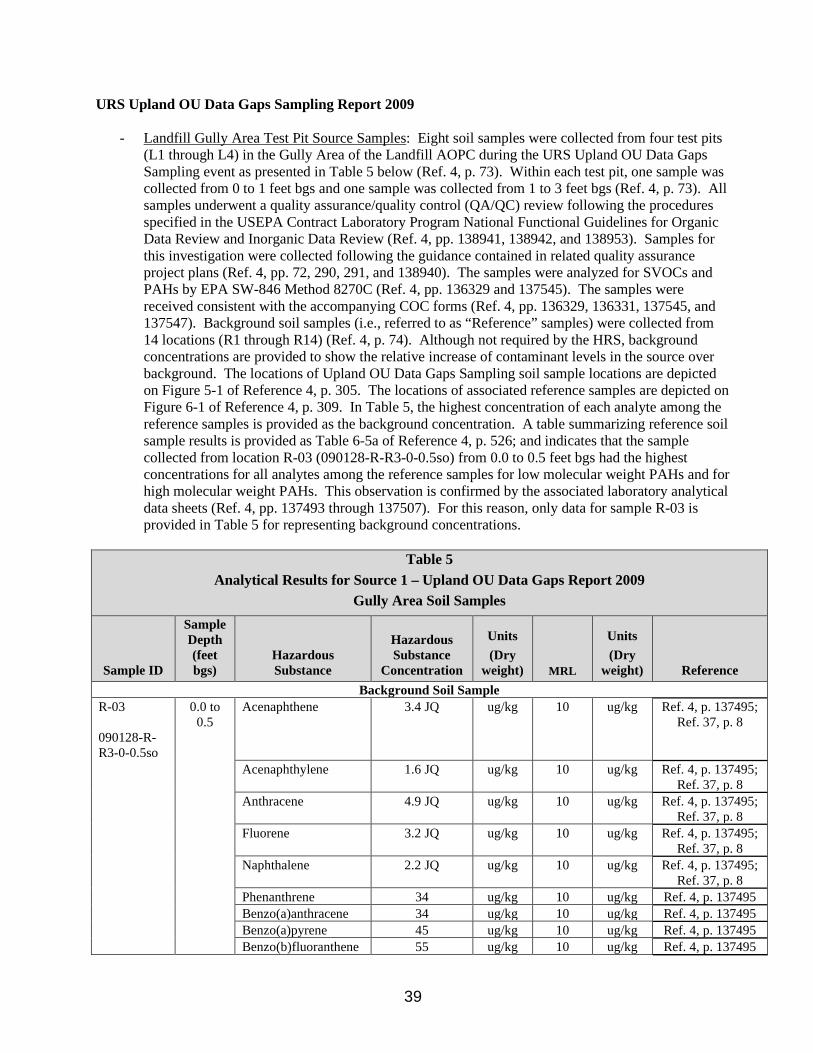
URS Upland OU Data Gaps Sampling Report 2009
- Landfill Gully Area Test Pit Source Samples: Eight soil samples were collected from four test pits (L1 through L4) in the Gully Area of the Landfill AOPC during the URS Upland OU Data Gaps Sampling event as presented in Table 5 below (Ref. 4, p. 73). Within each test pit, one sample was collected from 0 to 1 feet bgs and one sample was collected from 1 to 3 feet bgs (Ref. 4, p. 73). All samples underwent a quality assurance/quality control (QA/QC) review following the procedures specified in the USEPA Contract Laboratory Program National Functional Guidelines for Organic Data Review and Inorganic Data Review (Ref. 4, pp. 138941, 138942, and 138953). Samples for this investigation were collected following the guidance contained in related quality assurance project plans (Ref. 4, pp. 72, 290, 291, and 138940). The samples were analyzed for SVOCs and PAHs by EPA SW-846 Method 8270C (Ref. 4, pp. 136329 and 137545). The samples were received consistent with the accompanying COC forms (Ref. 4, pp. 136329, 136331, 137545, and 137547). Background soil samples (i.e., referred to as “Reference” samples) were collected from 14 locations (R1 through R14) (Ref. 4, p. 74). Although not required by the HRS, background concentrations are provided to show the relative increase of contaminant levels in the source over background. The locations of Upland OU Data Gaps Sampling soil sample locations are depicted on Figure 5-1 of Reference 4, p. 305. The locations of associated reference samples are depicted on Figure 6-1 of Reference 4, p. 309. In Table 5, the highest concentration of each analyte among the reference samples is provided as the background concentration. A table summarizing reference soil sample results is provided as Table 6-5a of Reference 4, p. 526; and indicates that the sample collected from location R-03 (090128-R-R3-0-0.5so) from 0.0 to 0.5 feet bgs had the highest concentrations for all analytes among the reference samples for low molecular weight PAHs and for high molecular weight PAHs. This observation is confirmed by the associated laboratory analytical data sheets (Ref. 4, pp. 137493 through 137507). For this reason, only data for sample R-03 is provided in Table 5 for representing background concentrations.
Table 5 Analytical Results for Source 1 – Upland OU Data Gaps Report 2009
Gully Area Soil Samples
Sample ID
Sample Depth (feet bgs)
Hazardous Substance
Hazardous Substance
Concentration
Units (Dry
weight) MRL
Units (Dry
weight) Reference Background Soil Sample
R-03
090128-R-R3-0-0.5so
0.0 to 0.5
Acenaphthene 3.4 JQ ug/kg 10 ug/kg Ref. 4, p. 137495; Ref. 37, p. 8
Acenaphthylene 1.6 JQ ug/kg 10 ug/kg Ref. 4, p. 137495; Ref. 37, p. 8
Anthracene 4.9 JQ ug/kg 10 ug/kg Ref. 4, p. 137495; Ref. 37, p. 8
Fluorene 3.2 JQ ug/kg 10 ug/kg Ref. 4, p. 137495; Ref. 37, p. 8
Naphthalene 2.2 JQ ug/kg 10 ug/kg Ref. 4, p. 137495; Ref. 37, p. 8
Phenanthrene 34 ug/kg 10 ug/kg Ref. 4, p. 137495 Benzo(a)anthracene 34 ug/kg 10 ug/kg Ref. 4, p. 137495 Benzo(a)pyrene 45 ug/kg 10 ug/kg Ref. 4, p. 137495 Benzo(b)fluoranthene 55 ug/kg 10 ug/kg Ref. 4, p. 137495
39
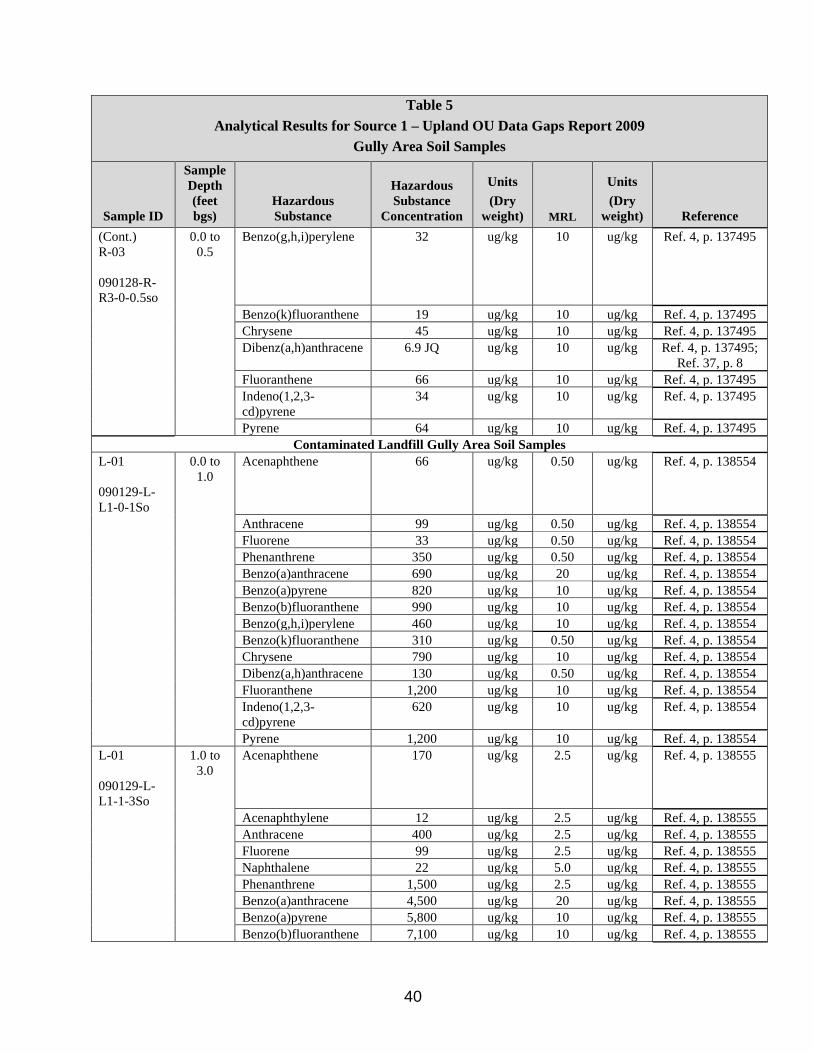
Table 5 Analytical Results for Source 1 – Upland OU Data Gaps Report 2009
Gully Area Soil Samples
Sample ID
Sample Depth (feet bgs)
Hazardous Substance
Hazardous Substance
Concentration
Units (Dry
weight) MRL
Units (Dry
weight) Reference (Cont.) R-03
090128-R-R3-0-0.5so
0.0 to 0.5
Benzo(g,h,i)perylene 32 ug/kg 10 ug/kg Ref. 4, p. 137495
Benzo(k)fluoranthene 19 ug/kg 10 ug/kg Ref. 4, p. 137495 Chrysene 45 ug/kg 10 ug/kg Ref. 4, p. 137495 Dibenz(a,h)anthracene 6.9 JQ ug/kg 10 ug/kg Ref. 4, p. 137495;
Ref. 37, p. 8 Fluoranthene 66 ug/kg 10 ug/kg Ref. 4, p. 137495 Indeno(1,2,3-cd)pyrene
34 ug/kg 10 ug/kg Ref. 4, p. 137495
Pyrene 64 ug/kg 10 ug/kg Ref. 4, p. 137495 Contaminated Landfill Gully Area Soil Samples
L-01
090129-L-L1-0-1So
0.0 to 1.0
Acenaphthene 66 ug/kg 0.50 ug/kg Ref. 4, p. 138554
Anthracene 99 ug/kg 0.50 ug/kg Ref. 4, p. 138554 Fluorene 33 ug/kg 0.50 ug/kg Ref. 4, p. 138554 Phenanthrene 350 ug/kg 0.50 ug/kg Ref. 4, p. 138554 Benzo(a)anthracene 690 ug/kg 20 ug/kg Ref. 4, p. 138554 Benzo(a)pyrene 820 ug/kg 10 ug/kg Ref. 4, p. 138554 Benzo(b)fluoranthene 990 ug/kg 10 ug/kg Ref. 4, p. 138554 Benzo(g,h,i)perylene 460 ug/kg 10 ug/kg Ref. 4, p. 138554 Benzo(k)fluoranthene 310 ug/kg 0.50 ug/kg Ref. 4, p. 138554 Chrysene 790 ug/kg 10 ug/kg Ref. 4, p. 138554 Dibenz(a,h)anthracene 130 ug/kg 0.50 ug/kg Ref. 4, p. 138554 Fluoranthene 1,200 ug/kg 10 ug/kg Ref. 4, p. 138554 Indeno(1,2,3-cd)pyrene
620 ug/kg 10 ug/kg Ref. 4, p. 138554
Pyrene 1,200 ug/kg 10 ug/kg Ref. 4, p. 138554 L-01
090129-L-L1-1-3So
1.0 to 3.0
Acenaphthene 170 ug/kg 2.5 ug/kg Ref. 4, p. 138555
Acenaphthylene 12 ug/kg 2.5 ug/kg Ref. 4, p. 138555 Anthracene 400 ug/kg 2.5 ug/kg Ref. 4, p. 138555 Fluorene 99 ug/kg 2.5 ug/kg Ref. 4, p. 138555 Naphthalene 22 ug/kg 5.0 ug/kg Ref. 4, p. 138555 Phenanthrene 1,500 ug/kg 2.5 ug/kg Ref. 4, p. 138555 Benzo(a)anthracene 4,500 ug/kg 20 ug/kg Ref. 4, p. 138555 Benzo(a)pyrene 5,800 ug/kg 10 ug/kg Ref. 4, p. 138555 Benzo(b)fluoranthene 7,100 ug/kg 10 ug/kg Ref. 4, p. 138555
40
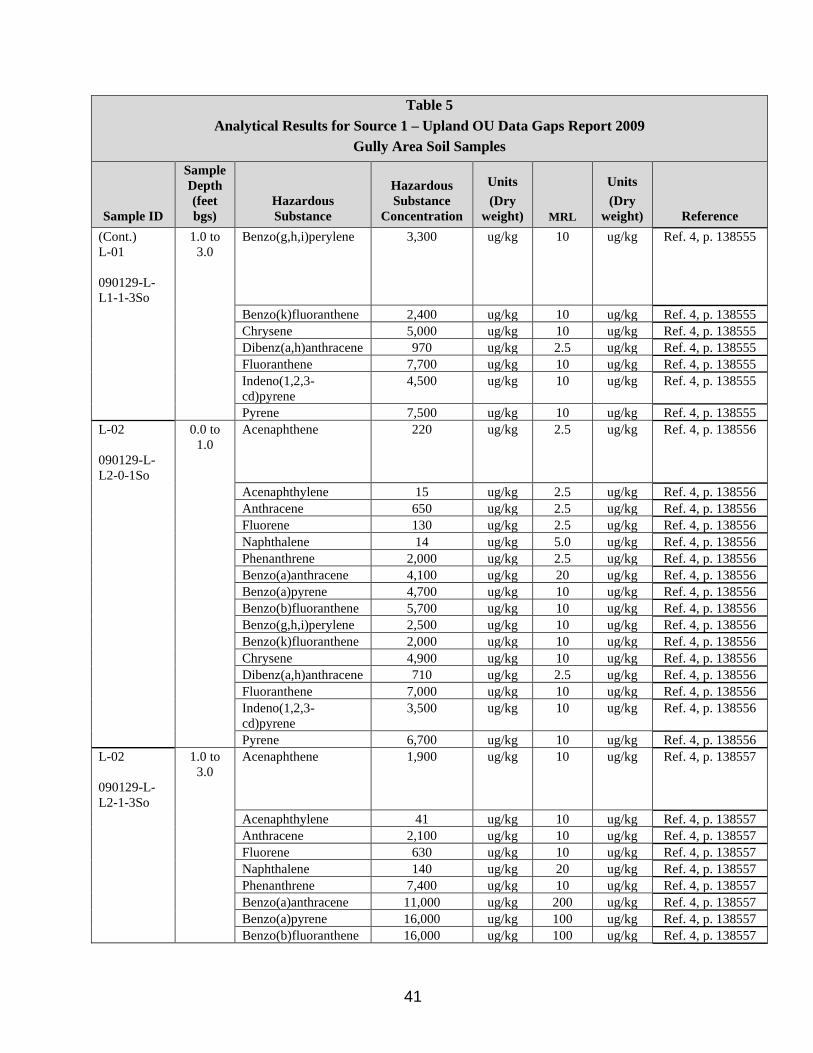
Table 5 Analytical Results for Source 1 – Upland OU Data Gaps Report 2009
Gully Area Soil Samples
Sample ID
Sample Depth (feet bgs)
Hazardous Substance
Hazardous Substance
Concentration
Units (Dry
weight) MRL
Units (Dry
weight) Reference (Cont.) L-01
090129-L-L1-1-3So
1.0 to 3.0
Benzo(g,h,i)perylene 3,300 ug/kg 10 ug/kg Ref. 4, p. 138555
Benzo(k)fluoranthene 2,400 ug/kg 10 ug/kg Ref. 4, p. 138555 Chrysene 5,000 ug/kg 10 ug/kg Ref. 4, p. 138555 Dibenz(a,h)anthracene 970 ug/kg 2.5 ug/kg Ref. 4, p. 138555 Fluoranthene 7,700 ug/kg 10 ug/kg Ref. 4, p. 138555 Indeno(1,2,3-cd)pyrene
4,500 ug/kg 10 ug/kg Ref. 4, p. 138555
Pyrene 7,500 ug/kg 10 ug/kg Ref. 4, p. 138555 L-02
090129-L-L2-0-1So
0.0 to 1.0
Acenaphthene 220 ug/kg 2.5 ug/kg Ref. 4, p. 138556
Acenaphthylene 15 ug/kg 2.5 ug/kg Ref. 4, p. 138556 Anthracene 650 ug/kg 2.5 ug/kg Ref. 4, p. 138556 Fluorene 130 ug/kg 2.5 ug/kg Ref. 4, p. 138556 Naphthalene 14 ug/kg 5.0 ug/kg Ref. 4, p. 138556 Phenanthrene 2,000 ug/kg 2.5 ug/kg Ref. 4, p. 138556 Benzo(a)anthracene 4,100 ug/kg 20 ug/kg Ref. 4, p. 138556 Benzo(a)pyrene 4,700 ug/kg 10 ug/kg Ref. 4, p. 138556 Benzo(b)fluoranthene 5,700 ug/kg 10 ug/kg Ref. 4, p. 138556 Benzo(g,h,i)perylene 2,500 ug/kg 10 ug/kg Ref. 4, p. 138556 Benzo(k)fluoranthene 2,000 ug/kg 10 ug/kg Ref. 4, p. 138556 Chrysene 4,900 ug/kg 10 ug/kg Ref. 4, p. 138556 Dibenz(a,h)anthracene 710 ug/kg 2.5 ug/kg Ref. 4, p. 138556 Fluoranthene 7,000 ug/kg 10 ug/kg Ref. 4, p. 138556 Indeno(1,2,3-cd)pyrene
3,500 ug/kg 10 ug/kg Ref. 4, p. 138556
Pyrene 6,700 ug/kg 10 ug/kg Ref. 4, p. 138556 L-02
090129-L-L2-1-3So
1.0 to 3.0
Acenaphthene 1,900 ug/kg 10 ug/kg Ref. 4, p. 138557
Acenaphthylene 41 ug/kg 10 ug/kg Ref. 4, p. 138557 Anthracene 2,100 ug/kg 10 ug/kg Ref. 4, p. 138557 Fluorene 630 ug/kg 10 ug/kg Ref. 4, p. 138557 Naphthalene 140 ug/kg 20 ug/kg Ref. 4, p. 138557 Phenanthrene 7,400 ug/kg 10 ug/kg Ref. 4, p. 138557 Benzo(a)anthracene 11,000 ug/kg 200 ug/kg Ref. 4, p. 138557 Benzo(a)pyrene 16,000 ug/kg 100 ug/kg Ref. 4, p. 138557 Benzo(b)fluoranthene 16,000 ug/kg 100 ug/kg Ref. 4, p. 138557
41
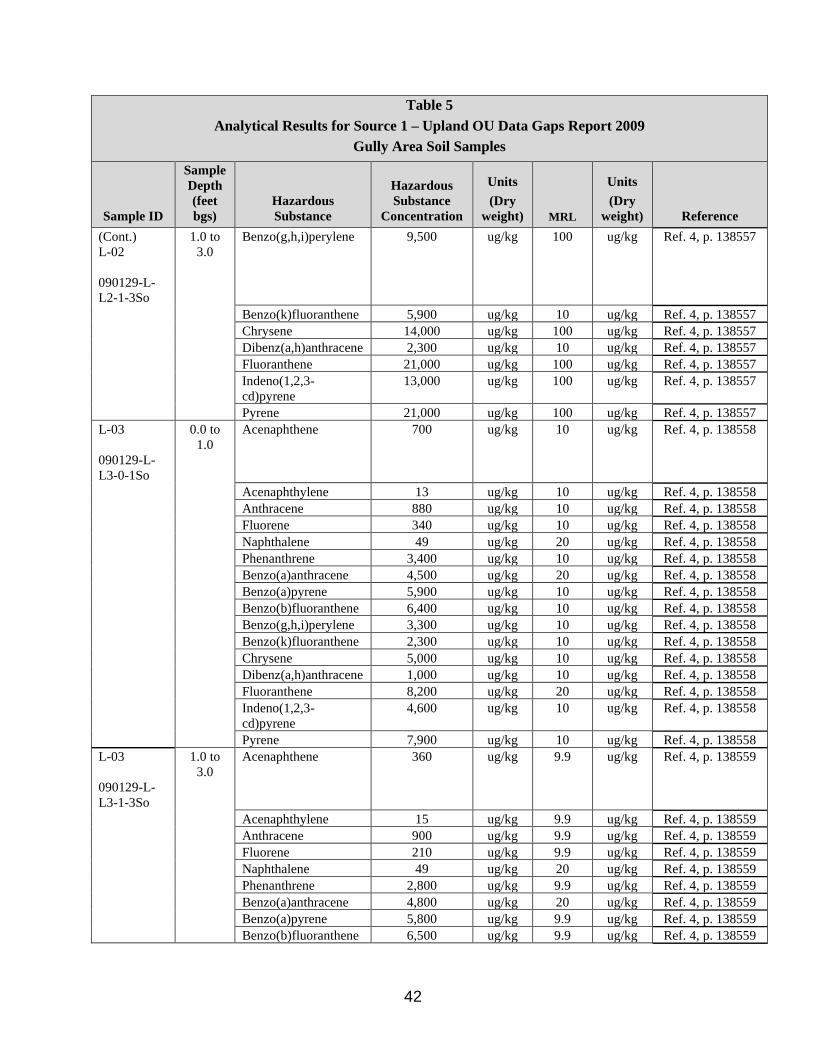
Table 5 Analytical Results for Source 1 – Upland OU Data Gaps Report 2009
Gully Area Soil Samples
Sample ID
Sample Depth (feet bgs)
Hazardous Substance
Hazardous Substance
Concentration
Units (Dry
weight) MRL
Units (Dry
weight) Reference (Cont.) L-02
090129-L-L2-1-3So
1.0 to 3.0
Benzo(g,h,i)perylene 9,500 ug/kg 100 ug/kg Ref. 4, p. 138557
Benzo(k)fluoranthene 5,900 ug/kg 10 ug/kg Ref. 4, p. 138557 Chrysene 14,000 ug/kg 100 ug/kg Ref. 4, p. 138557 Dibenz(a,h)anthracene 2,300 ug/kg 10 ug/kg Ref. 4, p. 138557 Fluoranthene 21,000 ug/kg 100 ug/kg Ref. 4, p. 138557 Indeno(1,2,3-cd)pyrene
13,000 ug/kg 100 ug/kg Ref. 4, p. 138557
Pyrene 21,000 ug/kg 100 ug/kg Ref. 4, p. 138557 L-03
090129-L-L3-0-1So
0.0 to 1.0
Acenaphthene 700 ug/kg 10 ug/kg Ref. 4, p. 138558
Acenaphthylene 13 ug/kg 10 ug/kg Ref. 4, p. 138558 Anthracene 880 ug/kg 10 ug/kg Ref. 4, p. 138558 Fluorene 340 ug/kg 10 ug/kg Ref. 4, p. 138558 Naphthalene 49 ug/kg 20 ug/kg Ref. 4, p. 138558 Phenanthrene 3,400 ug/kg 10 ug/kg Ref. 4, p. 138558 Benzo(a)anthracene 4,500 ug/kg 20 ug/kg Ref. 4, p. 138558 Benzo(a)pyrene 5,900 ug/kg 10 ug/kg Ref. 4, p. 138558 Benzo(b)fluoranthene 6,400 ug/kg 10 ug/kg Ref. 4, p. 138558 Benzo(g,h,i)perylene 3,300 ug/kg 10 ug/kg Ref. 4, p. 138558 Benzo(k)fluoranthene 2,300 ug/kg 10 ug/kg Ref. 4, p. 138558 Chrysene 5,000 ug/kg 10 ug/kg Ref. 4, p. 138558 Dibenz(a,h)anthracene 1,000 ug/kg 10 ug/kg Ref. 4, p. 138558 Fluoranthene 8,200 ug/kg 20 ug/kg Ref. 4, p. 138558 Indeno(1,2,3-cd)pyrene
4,600 ug/kg 10 ug/kg Ref. 4, p. 138558
Pyrene 7,900 ug/kg 10 ug/kg Ref. 4, p. 138558 L-03
090129-L-L3-1-3So
1.0 to 3.0
Acenaphthene 360 ug/kg 9.9 ug/kg Ref. 4, p. 138559
Acenaphthylene 15 ug/kg 9.9 ug/kg Ref. 4, p. 138559 Anthracene 900 ug/kg 9.9 ug/kg Ref. 4, p. 138559 Fluorene 210 ug/kg 9.9 ug/kg Ref. 4, p. 138559 Naphthalene 49 ug/kg 20 ug/kg Ref. 4, p. 138559 Phenanthrene 2,800 ug/kg 9.9 ug/kg Ref. 4, p. 138559 Benzo(a)anthracene 4,800 ug/kg 20 ug/kg Ref. 4, p. 138559 Benzo(a)pyrene 5,800 ug/kg 9.9 ug/kg Ref. 4, p. 138559 Benzo(b)fluoranthene 6,500 ug/kg 9.9 ug/kg Ref. 4, p. 138559
42

Table 5 Analytical Results for Source 1 – Upland OU Data Gaps Report 2009
Gully Area Soil Samples
Sample ID
Sample Depth (feet bgs)
Hazardous Substance
Hazardous Substance
Concentration
Units (Dry
weight) MRL
Units (Dry
weight) Reference (Cont.) L-03
090129-L-L3-1-3So
1.0 to 3.0
Benzo(g,h,i)perylene 3,100 ug/kg 9.9 ug/kg Ref. 4, p. 138559
Benzo(k)fluoranthene 2,400 ug/kg 9.9 ug/kg Ref. 4, p. 138559 Chrysene 5,400 ug/kg 9.9 ug/kg Ref. 4, p. 138559 Dibenz(a,h)anthracene 900 ug/kg 9.9 ug/kg Ref. 4, p. 138559 Fluoranthene 8,700 ug/kg 20 ug/kg Ref. 4, p. 138559 Indeno(1,2,3-cd)pyrene
4,400 ug/kg 9.9 ug/kg Ref. 4, p. 138559
Pyrene 9,400 ug/kg 20 ug/kg Ref. 4, p. 138559 L-04
090129-L-L4-0-1So
0.0 to 1.0
Acenaphthene 2,100 ug/kg 10 ug/kg Ref. 4, p. 138560
Acenaphthylene 26 ug/kg 10 ug/kg Ref. 4, p. 138560 Anthracene 1,700 ug/kg 10 ug/kg Ref. 4, p. 138560 Fluorene 890 ug/kg 10 ug/kg Ref. 4, p. 138560 Naphthalene 120 ug/kg 20 ug/kg Ref. 4, p. 138560 Phenanthrene 6,900 ug/kg 10 ug/kg Ref. 4, p. 138560 Benzo(a)anthracene 5,900 ug/kg 20 ug/kg Ref. 4, p. 138560 Benzo(a)pyrene 7,600 ug/kg 10 ug/kg Ref. 4, p. 138560 Benzo(b)fluoranthene 8,300 ug/kg 20 ug/kg Ref. 4, p. 138560 Benzo(g,h,i)perylene 4,200 ug/kg 10 ug/kg Ref. 4, p. 138560 Benzo(k)fluoranthene 2,900 ug/kg 10 ug/kg Ref. 4, p. 138560 Chrysene 6,700 ug/kg 10 ug/kg Ref. 4, p. 138560 Dibenz(a,h)anthracene 1,200 ug/kg 10 ug/kg Ref. 4, p. 138560 Fluoranthene 12,000 ug/kg 20 ug/kg Ref. 4, p. 138560 Indeno(1,2,3-cd)pyrene
5,800 ug/kg 10 ug/kg Ref. 4, p. 138560
Pyrene 11,000 ug/kg 20 ug/kg Ref. 4, p. 138560 L-04
090129-L-L4-1-3So
1.0 to 3.0
Acenaphthene 420 ug/kg 10 ug/kg Ref. 4, p. 138561
Acenaphthylene 13 ug/kg 10 ug/kg Ref. 4, p. 138561 Anthracene 740 ug/kg 10 ug/kg Ref. 4, p. 138561 Fluorene 240 ug/kg 10 ug/kg Ref. 4, p. 138561 Naphthalene 57 ug/kg 20 ug/kg Ref. 4, p. 138561 Phenanthrene 2,800 ug/kg 10 ug/kg Ref. 4, p. 138561 Benzo(a)anthracene 4,800 ug/kg 20 ug/kg Ref. 4, p. 138561 Benzo(a)pyrene 6,200 ug/kg 10 ug/kg Ref. 4, p. 138561 Benzo(b)fluoranthene 7,200 ug/kg 10 ug/kg Ref. 4, p. 138561
43
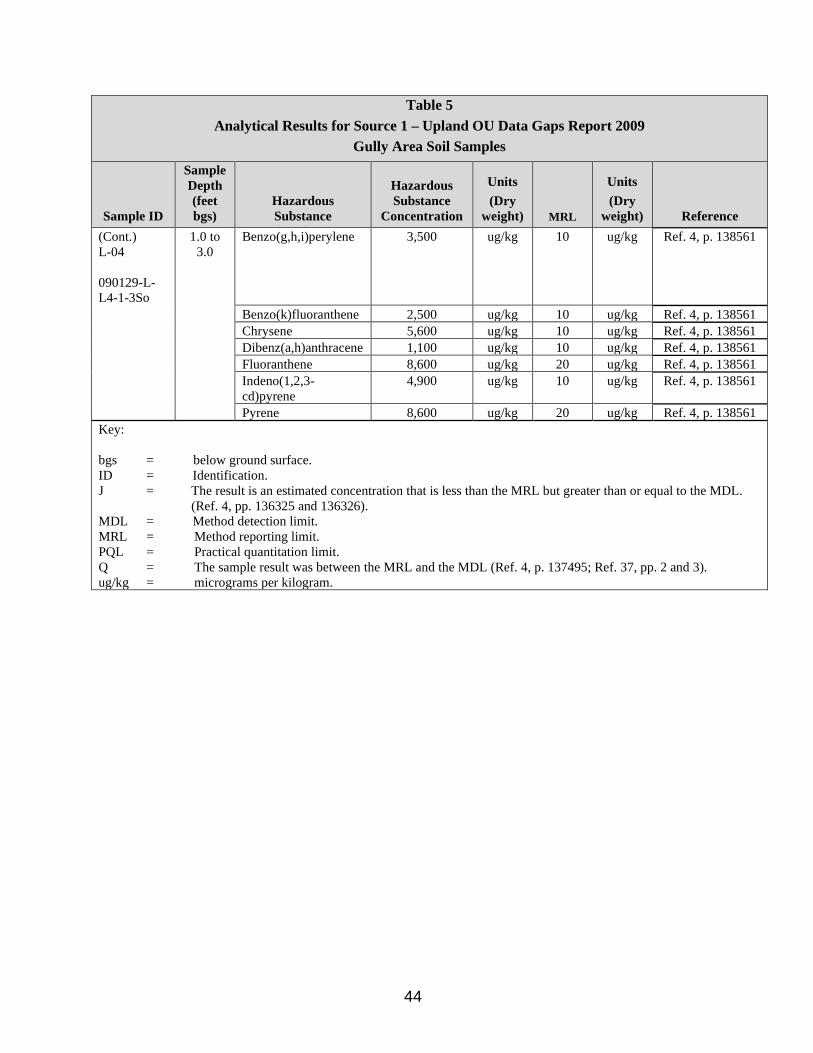
Table 5 Analytical Results for Source 1 – Upland OU Data Gaps Report 2009
Gully Area Soil Samples
Sample ID
Sample Depth (feet bgs)
Hazardous Substance
Hazardous Substance
Concentration
Units (Dry
weight) MRL
Units (Dry
weight) Reference (Cont.) L-04
090129-L-L4-1-3So
1.0 to 3.0
Benzo(g,h,i)perylene 3,500 ug/kg 10 ug/kg Ref. 4, p. 138561
Benzo(k)fluoranthene 2,500 ug/kg 10 ug/kg Ref. 4, p. 138561 Chrysene 5,600 ug/kg 10 ug/kg Ref. 4, p. 138561 Dibenz(a,h)anthracene 1,100 ug/kg 10 ug/kg Ref. 4, p. 138561 Fluoranthene 8,600 ug/kg 20 ug/kg Ref. 4, p. 138561 Indeno(1,2,3-cd)pyrene
4,900 ug/kg 10 ug/kg Ref. 4, p. 138561
Pyrene 8,600 ug/kg 20 ug/kg Ref. 4, p. 138561 Key:
bgs = ID = J =
MDL = MRL = PQL = Q = ug/kg =
below ground surface. Identification. The result is an estimated concentration that is less than the MRL but greater than or equal to the MDL. (Ref. 4, pp. 136325 and 136326). Method detection limit. Method reporting limit. Practical quantitation limit. The sample result was between the MRL and the MDL (Ref. 4, p. 137495; Ref. 37, pp. 2 and 3). micrograms per kilogram.
44
List of Hazardous Substances Associated with Source
PCBs (Aroclor 1254 and Aroclor 1260), metals (antimony, arsenic, cadmium, chromium, copper, lead, mercury, nickel, thallium, and zinc), herbicides (2,4,5-T), pesticides (BHC [alpha], BHC [beta], chlordane, heptachlor, and heptachlor epoxide), VOCs (PCE and toluene), SVOCs (acenaphthene, acenaphthylene, anthracene, benzo(a)anthracene, benzo(a)pyrene, benzo(b)fluoranthene, benzo(g,h,i)perylene, benzo(k)fluoranthene, bis(2-ethylhexyl)phthalate, butyl benzyl phthalate, chrysene, dibenz(a,h)anthracene, dibenzofuran, fluoranthene, fluorene, indeno(1,2,3-cd)pyrene, naphthalene, pentachlorophenol, phenanthrene, and pyrene), and butyltins (dibutyltin, monobutyltin, and tributylin).
Butyltins are pollutants/contaminants found at this site (see Table 2 of this HRS documentation record). Butyltins are a class of compounds that bioaccumulate in sediment and fish tissue and are known to have effects on human health and wildlife (Ref. 35, p. 63). One study found that rats whose mothers were exposed to tributyltin during pregnancy showed altered performance in some neurological tests conducted when they were young adults (Ref. 36, p. 27). Another study, also with tributyltin, found that exposure during gestation, lactation, and post-lactation affected some developmental landmarks in female rats (Ref. 36, p. 27). Dibutyltin, and tributyltin, when administered during pregnancy, have induced developmental and reproductive effects in rodents (Ref. 36, p. 33).
The EPA has developed risk-based residential soil regional screening levels (RSLs) for dibutyltin compounds (i.e., 19 mg/kg) and for tri-n-butyltin (i.e., 23 mg/kg) (Ref. 33, pp. 2, 7, and 15). The Regional Sediment Evaluation Team (RSET) has determined that tributyltin is a bioaccumulative chemical of concern in Oregon, including the Columbia River where it borders Oregon and Washington (Ref. 34, p. 142). RSET has proposed freshwater benthic screening levels for dibutyltin, monobutyltin, and tributyltin (Ref. 34, p. 190) and water quality-based screening levels for tributyltin (Ref. 34, p. 195).
45
SD – Hazardous Waste Quantity Source No.: 1
2.4.2 Hazardous Waste Quantity 2.4.2.1.1 Hazardous Constituent Quantity
The hazardous constituent quantity for Source No. 1 could not be adequately determined according to the HRS requirements; that is, the total mass of all Comprehensive Environmental Response, Compensation, and Liability Act (CERCLA) hazardous substances in the source is not known and cannot be estimated with reasonable confidence (Ref. 1, Section 2.4.2.1.1). There are insufficient historical and current data (Manifests, PRP records, State records, Permits, Waste concentration data, etc.) available to adequately calculate the total mass of all CERCLA hazardous substances in the source and the associated releases from the source. Therefore, there is insufficient information to evaluate the associated releases from the source to calculate the hazardous constituent quantity for Source No. 1 with reasonable confidence.
Hazardous Constituent Quantity Value (S): NS
2.4.2.1.2 Hazardous Wastestream Quantity
The hazardous wastestream quantity for Source No. 1 could not be adequately determined according to the HRS requirements; that is, the total mass of all hazardous wastestreams and CERCLA pollutants and contaminants in the source is not known and cannot be estimated with reasonable confidence (Ref. 1, Section 2.4.2.1.2). There are insufficient historical and current data (Manifests, PRP records, State records, permits, etc.) available to adequately calculate the total mass of all hazardous wastestreams and CERCLA pollutants and contaminants in the source and the associated releases from the source. Therefore, there is insufficient information to evaluate the associated releases from the source to calculate the hazardous wastestream quantity for Source No. 1 with reasonable confidence.
Hazardous Wastestream Quantity (W): NS
2.4.2.1.3 Volume Based on information from site investigations including electrical resistivity data, seismic refraction data, and boring logs, the volume of landfilled material was estimated in the RI report to be between 7,500 cubic yards (cy) and 9,900 cy, with a maximum depth of 15 feet below ground surface (bgs) (Ref. 4, p. 48).
Using the lower estimated landfill volume of 7,500 cy, the volume measure of the source is conservatively calculated to be 3 (i.e., 7,500 cy / 2,500 for a landfill) (Ref. 1, Section 2.4.2.1.3).
Volume Assigned Value (V): 3
2.4.2.1.4 Area
An area measure of 0 is assigned since the volume of the source could be determined (Ref. 1, Sections 2.4.2.1.3 and 2.4.2.1.4).
Area Assigned Value (A): 0
Source Hazardous Waste Quantity Factor Value (Ref. 1, Section 2.4.2.1.5): 3
46

SD – Characterization and Containment
SOURCE DESCRIPTION
2.2 SOURCE CHARACTERIZATION
Number of the Source: 2
Name and description of the source: Spent Sandblast Grit Disposal Area (Contaminated Soil)
The Spent Sandblast Grit Disposal Area is within the Sandblast Area AOPC (Ref. 4, p. 66). The Sandblast Area AOPC generally consists of a north facing slope (Ref. 4, p. 40). A variety of equipment associated with the Bonneville Dam complex has historically been painted with materials that contained metallic (including lead and zinc chromate systems) and organometallic compounds (Ref. 4, p. 50). This equipment was periodically stripped with blast material and repainted in the former sandblast building (Ref. 4, p. 50). The former sandblast building was used for sandblasting operations and painting from approximately 1958 to 1988 (Ref. 4, p. 50). After 1988, the sandblasting and painting operations moved to the service center building (Ref. 4, p. 50). No records of disposal activities for sandblast grit were kept from 1958 to 1994 (Ref. 4, p. 50). Application of lead-based paints has reportedly not occurred at the dam complex since the early 1980s (Ref. 4, p. 50). A record of disposal from 1994 shows 215,680 pounds of sandblast grit were disposed of as Resource Conservation and Recovery Act (RCRA) hazardous waste, and after 1997 waste disposal records indicate that on average, approximately 70 tons of spent blast media were generated per year from sandblasting operations (Ref. 4, p. 50).
Based on the presence of sandblast grit adjacent to the former sandblast building (Ref. 4, p. 301 [Figure 3-4]) spent sandblast grit was historically spread onsite for an unknown period prior to 1994 (Ref. 4, p. 50). Previous investigations concluded that the primary source of soil contamination in the Sandblast Area is from the open disposal of sandblast grit (Ref. 4, p. 50). The disposal of spent sandblast grit in the area immediately east of the former sandblast building has resulted in the release of metallic and organometallic constituents, which were used in historical painting operations, into the surface and subsurface soil (Ref. 4, p. 50). This material has subsequently been transported across the site by surface water runoff into the stormwater drainage features (Ref. 4, p. 50 and p. 301 [Figure 3-4]).
In 2001, a preliminary assessment/site inspection (PA/SI) of the Sandblast Area AOPC was conducted by URS to aid in the characterization of environmental concerns associated with a transformer maintenance area and a former hazardous materials storage area (also referred to as the former drum storage area) (Ref. 4, pp. 67 and 289). This work included the collection of several samples within the Spent Sandblast Grit Disposal Area (Ref. 4, pp. 67 and 306 [Figure 5-2]). Samples collected within the Spent Sandblast Girt Disposal Area include SBB01, SBB03 through SBB07, SBB10, SBB11, SBB12, SBB14, SBB15, SBB17, SBB18, SBB23, and SBB24 Area (Ref. 4, pp. 67 and 306 [Figure 5-2]). These samples were collected from 0 to 0.5 feet bgs with the exception of sample SBB14 (collected at 2.0 feet bgs) and sample SBB15 (collected from 1.0 feet bgs) (Ref. 4, pp. 464 and 465). Co-located deeper soil samples were collected at SBB17 (collected from 3.0 feet bgs) and at SBB18 (collected from 2.5 feet bgs) (Ref. 4, p. 465). Analytical results revealed the presence of PCBs (Aroclor 1260), metals (antimony, arsenic, cadmium, chromium, copper, lead, nickel, and zinc; among other metals), and organotins (dibutyltin, monobutyltin, and tributyltin) (Ref. 4, pp. 464 and 465 [Table 5-4d]) (See Table 6 of this HRS Documentation Record).
In 2004, sampling for an SSI of the Sandblast Area AOPC was conducted to assist in the characterization of known or suspected potential environmental concerns (Ref. 4, p. 68). This work included sampling of 10 locations (i.e., locations DP10, DP11, DP12, HA4 through HA8, HA11, and HA12) within the Spent Sandblast Grit Disposal Area (Ref. 4, pp. 68 and 306 [Figure 5-2]). The soil interval sampled ranged from
47
the ground surface to as deep as 12 feet bgs, and varied by the location sampled (Ref. 4, pp. 467, 468, and 469 [Table 5-5a]). Analytical results revealed the presence of the metals chromium and lead; among other metals (Ref. 4, pp. 467, 468, and 469 [Table 5-5a]) (See Table 7 of this HRS Documentation Record).
Location of the source, with reference to a map: The Spent Sandblast Grit Disposal Area is located on the eastern side of Bradford Island, Oregon (see Figure 5 of this HRS Documentation Record; and Ref. 4, pp. 297 and 301).
Containment Release to Surface Water via Overland Migration and/or Flood: A surface water containment factor value of 10 (Ref. 1, Table 4-2) is assigned because the Spent Sandblast Grit Disposal Area is unlined and uncovered (i.e., the source has no maintained engineered cover, or functioning and maintained run-on control system and runoff management system) (Ref. 4, p. 40).
Containment Factor Value: 10
48

SD – Hazardous Substances Source No.: 2
2.2.2 HAZARDOUS SUBSTANCES ASSOCIATED WITH THE SOURCE The RI report documents the investigation activities that have taken place over the past 10 years since the report was written (i.e., approximately the period from 2002 to 2012) (Ref. 4, p. 20); including new sampling work conducted during the RI in 2007 and 2009 to fill identified data gaps (Ref. 4, p. 72). The RI states that due to the relatively static physical environment of the Upland OU, environmental data collected over the past decade prior to the RI can be considered representative of current conditions (Ref. 4, p. 59). The RI report included laboratory data forms from these investigations as Appendix E. For this reason, the primary reference for information contained in tables within this section are taken from this appendix.
URS PA/SI 2001: - Source Samples: Seventeen sandblast grit and soil samples (i.e., SBB01, SBB03 through SBB07,
SBB10, SBB11, SBB12, SBB14, SBB15, SBB17 [two samples], SBB18 [two samples], SBB23, and SBB24) were collected from the Spent Sandblast Grit Disposal Area during the URS 2001 PA/SI as presented in Table 6 below (Ref. 4, pp. 67 and 306 [Figure 5-2]). The samples were analyzed for organotin compounds in accordance with Puget Sound Estuary Protocols, PCBs using EPA SW-846 Method 8082, and metals using EPA SW-846 Methods 6010B, 6020, and 7470A or 7471A (Ref. 4, pp. 1196, 1198, 1199, and 1201). All samples were maintained under COC (Ref. 4, pp. 1195, 1787, 1790, 1791, 138802). All samples underwent a quality assurance/quality control (QA/QC) review following the procedures specified in the USEPA Contract Laboratory Program National Functional Guidelines for Organic Data Review and Inorganic Data Review (Ref. 4, pp. 138801, 138810, and 138811). Some of these samples were labeled as “sandblast grit” based on field observations to indicate samples containing higher quantities of sandblast (Ref. 4, pp. 67, and 464 and 465 [Table 5-4d]). Soil sample SBB18 is used in this HRS Documentation Record to represent background concentrations due to the relatively low concentrations of contaminants in this sample and since this sample is of soil rather than a soil/sandblast grit mix (Ref. 4, pp. 464 and 465 [Table 5-4d]). Although not required by the HRS, background concentrations are provided to show the relative increase of contaminant levels in the source over background. The locations of all PA/SI samples are depicted on Figure 5-2 of Reference 4, p. 306.
Table 6 Analytical Results for Source 2 – URS PA/SI 2001
Sandblast Grit/Soil Samples
Sample ID
Sample Depth (feet bgs) Hazardous Substance
Hazardous Substance
Concentration
Units (Dry
weight) PQL
Units (Dry
weight) Reference Background Soil Sample
SBB18
011205SBB 20SS
2.5 Aroclor 1260 ND ug/kg 13.2 ug/kg Ref. 4, pp. 465 and 1336a
Arsenic 1.64 mg/kg 1.34 mg/kg Ref. 4, p. 1491a
Antimony 0.597 U mg/kg 4.01 mg/kg Ref. 4, p. 1491a
Cadmium 0.867 mg/kg 0.669 mg/kg Ref. 4, p. 1491a
Chromium 25.1 mg/kg 2.68 mg/kg Ref. 4, p. 1490a
Copper 65.7 mg/kg 2.68 mg/kg Ref. 4, p. 1490a
49
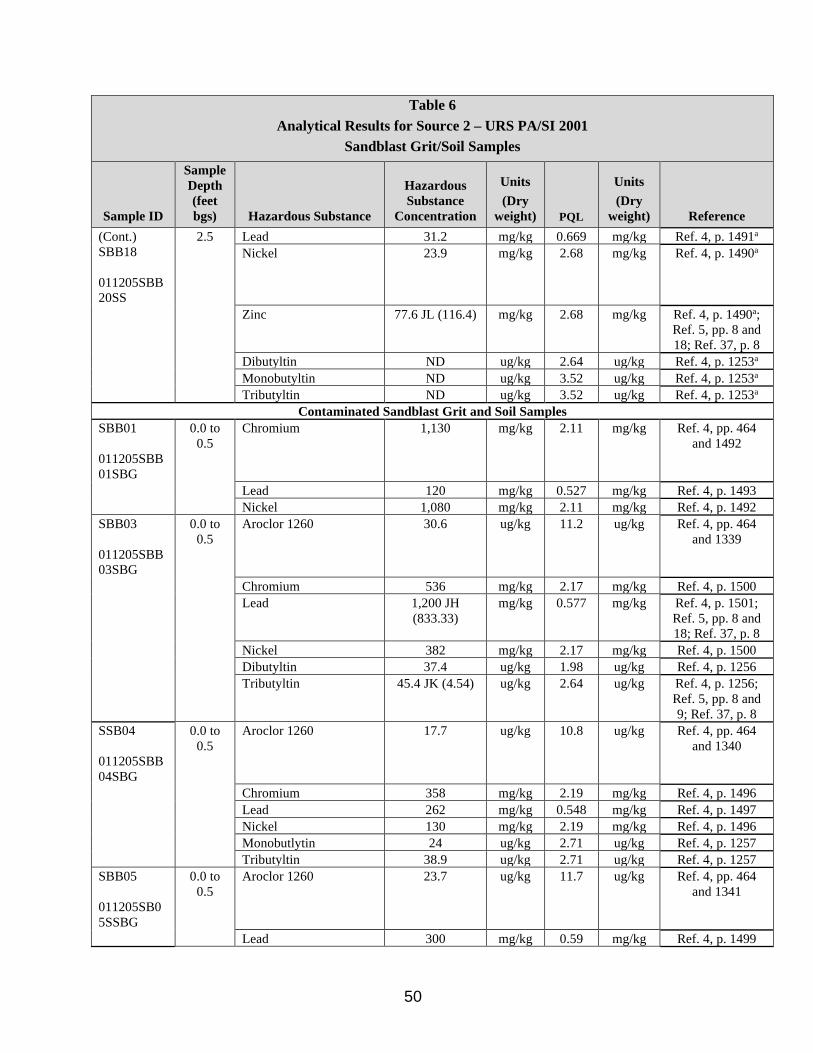
Table 6 Analytical Results for Source 2 – URS PA/SI 2001
Sandblast Grit/Soil Samples
Sample ID
Sample Depth (feet bgs) Hazardous Substance
Hazardous Substance
Concentration
Units (Dry
weight) PQL
Units (Dry
weight) Reference (Cont.) SBB18
011205SBB 20SS
2.5 Lead 31.2 mg/kg 0.669 mg/kg Ref. 4, p. 1491a
Nickel 23.9 mg/kg 2.68 mg/kg Ref. 4, p. 1490a
Zinc 77.6 JL (116.4) mg/kg 2.68 mg/kg Ref. 4, p. 1490a; Ref. 5, pp. 8 and 18; Ref. 37, p. 8
Dibutyltin ND ug/kg 2.64 ug/kg Ref. 4, p. 1253a
Monobutyltin ND ug/kg 3.52 ug/kg Ref. 4, p. 1253a
Tributyltin ND ug/kg 3.52 ug/kg Ref. 4, p. 1253a
Contaminated Sandblast Grit and Soil Samples SBB01
011205SBB 01SBG
0.0 to 0.5
Chromium 1,130 mg/kg 2.11 mg/kg Ref. 4, pp. 464 and 1492
Lead 120 mg/kg 0.527 mg/kg Ref. 4, p. 1493 Nickel 1,080 mg/kg 2.11 mg/kg Ref. 4, p. 1492
SBB03
011205SBB 03SBG
0.0 to 0.5
Aroclor 1260 30.6 ug/kg 11.2 ug/kg Ref. 4, pp. 464 and 1339
Chromium 536 mg/kg 2.17 mg/kg Ref. 4, p. 1500 Lead 1,200 JH
(833.33) mg/kg 0.577 mg/kg Ref. 4, p. 1501;
Ref. 5, pp. 8 and 18; Ref. 37, p. 8
Nickel 382 mg/kg 2.17 mg/kg Ref. 4, p. 1500 Dibutyltin 37.4 ug/kg 1.98 ug/kg Ref. 4, p. 1256 Tributyltin 45.4 JK (4.54) ug/kg 2.64 ug/kg Ref. 4, p. 1256;
Ref. 5, pp. 8 and 9; Ref. 37, p. 8
SSB04
011205SBB 04SBG
0.0 to 0.5
Aroclor 1260 17.7 ug/kg 10.8 ug/kg Ref. 4, pp. 464 and 1340
Chromium 358 mg/kg 2.19 mg/kg Ref. 4, p. 1496 Lead 262 mg/kg 0.548 mg/kg Ref. 4, p. 1497 Nickel 130 mg/kg 2.19 mg/kg Ref. 4, p. 1496 Monobutlytin 24 ug/kg 2.71 ug/kg Ref. 4, p. 1257 Tributyltin 38.9 ug/kg 2.71 ug/kg Ref. 4, p. 1257
SBB05
011205SB0 5SSBG
0.0 to 0.5
Aroclor 1260 23.7 ug/kg 11.7 ug/kg Ref. 4, pp. 464 and 1341
Lead 300 mg/kg 0.59 mg/kg Ref. 4, p. 1499
50

Table 6 Analytical Results for Source 2 – URS PA/SI 2001
Sandblast Grit/Soil Samples
Sample ID
Sample Depth (feet bgs) Hazardous Substance
Hazardous Substance
Concentration
Units (Dry
weight) PQL
Units (Dry
weight) Reference SBB06
011206SBB 06SBG
0.0 to 0.5
Aroclor 1260 15.5 ug/kg 11.4 ug/kg Ref. 4, pp. 464 and 1342
Chromium 880 mg/kg 1.97 mg/kg Ref. 4, p. 1502 Lead 501 JH (347.92) mg/kg 0.492 mg/kg Ref. 4, p. 1503;
Ref. 5, pp. 8 and 18; Ref. 37, p. 8
Nickel 597 mg/kg 1.97 mg/kg Ref. 4, p. 1502 SBB07
011205SBB 07SBG
0.0 to 0.5
Arsenic 4.6 mg/kg 1.37 mg/kg Ref. 4, pp. 464 and 1505
Chromium 127 mg/kg 2.75 mg/kg Ref. 4, p. 1504 Nickel 107 mg/kg 2.75 mg/kg Ref. 4, p. 1504
SBB10
011205SBB 10SBG
0.0 to 0.5
Aroclor 1260 26 ug/kg 10.7 ug/kg Ref. 4, pp. 464 and 1346
Arsenic 6.02 mg/kg 1.07 mg/kg Ref. 4, p. 1511 Chromium 637 mg/kg 2.13 mg/kg Ref. 4, p. 1510 Lead 272 JH (188.89) mg/kg 0.534 mg/kg Ref. 4, p. 1511;
Ref. 5, pp. 8 and 18; Ref. 37, p. 9
Nickel 844 mg/kg 2.13 mg/kg Ref. 4, p. 1510 SBB11
011205SBB 11SBG
0.0 to 0.5
Aroclor 1260 52.1 ug/kg 10.6 ug/kg Ref. 4, pp. 464 and 1347
Chromium 648 mg/kg 2.22 mg/kg Ref. 4, p. 1512 Lead 415 JH (288.19) mg/kg 0.554 mg/kg Ref. 4, p. 1513;
Ref. 5, pp. 8 and 18; Ref. 37, p. 9
Nickel 296 mg/kg 2.22 mg/kg Ref. 4, p. 1512 SBB12
011205SBB 12SBG
0.0 to 0.5
Aroclor 1260 202 ug/kg 11.3 ug/kg Ref. 4, pp. 464 and 1348
Arsenic 6.24 mg/kg 1.09 mg/kg Ref. 4, p. 1515 Antimony 13.7 mg/kg 3.28 mg/kg Ref. 4, p. 1515 Chromium 705 mg/kg 2.19 mg/kg Ref. 4, p. 1514 Lead 863 JH (599.31) mg/kg 0.546 mg/kg Ref. 4, p. 1515;
Ref. 5, pp. 8 and 18; Ref. 37, p. 9
Nickel 347 mg/kg 2.19 mg/kg Ref. 4, p. 1514
51

Table 6 Analytical Results for Source 2 – URS PA/SI 2001
Sandblast Grit/Soil Samples
Sample ID
Sample Depth (feet bgs) Hazardous Substance
Hazardous Substance
Concentration
Units (Dry
weight) PQL
Units (Dry
weight) Reference SBB14
011205SBB 14SBG
2.0 Lead 508 JH (352.78) mg/kg 0.531 mg/kg Ref. 4, pp. 465 and 1519; Ref. 5, pp. 8 and 18; Ref.
37, p. 9
SBB15
011205SBB 15SBG
0.0 to 0.5
Aroclor 1260 64 ug/kg 9.9 ug/kg Ref. 4, pp. 465 and 1351
Cadmium 2.61 mg/kg 0.454 mg/kg Ref. 4, p. 1521 Chromium 1,100 mg/kg 1.81 mg/kg Ref. 4, p. 1520 Lead 280 JH (194.44) mg/kg 0.454 mg/kg Ref. 4, p. 1521;
Ref. 5, pp. 8 and 18; Ref. 37, p. 9
Nickel 444 mg/kg 1.81 mg/kg Ref. 4, p. 1520 Zinc 1,160 mg/kg 1.81 mg/kg Ref. 4, p. 1520
SBB15
011205SBB 21SS
1.0 Aroclor 1260 20.8 ug/kg 11.1 ug/kg Ref. 4, pp. 465 and 1356
Lead 134 JH (93.06) mg/kg 0.545 mg/kg Ref. 4, p. 1531; Ref. 5, pp. 8 and 18; Ref. 37, p. 9
SBB17
01120SBB1 7SBG
0.0 to 0.5
Aroclor 1260 18.7 ug/kg 11.2 ug/kg Ref. 4, pp. 465 and 1353
Chromium 625 mg/kg 2.36 mg/kg Ref. 4, p. 1524 Lead 516 JH (358.33) mg/kg 0.589 mg/kg Ref. 4, p. 1525;
Ref. 5, pp. 8 and 18; Ref. 37, p. 9
Nickel 399 mg/kg 2.36 mg/kg Ref. 4, p. 1524 Monobutyltin 8 ug/kg 2.93 ug/kg Ref. 4, p. 1270 Tributyltin 39.2 ug/kg 2.93 ug/kg Ref. 4, p. 1270
SBB18
01120SBB1 8SBG
0.0 to 0.5
Aroclor 1260 17.4 ug/kg 10.9 ug/kg Ref. 4, pp. 465 and 1354
Antimony 9.51 mg/kg 3.36 mg/kg Ref. 4, p. 1527 Arsenic 80.9 mg/kg 1.12 mg/kg Ref. 4, p. 1527 Chromium 533 mg/kg 2.24 mg/kg Ref. 4, p. 1526 Copper 319 mg/kg 2.24 mg/kg Ref. 4, p. 1526
52
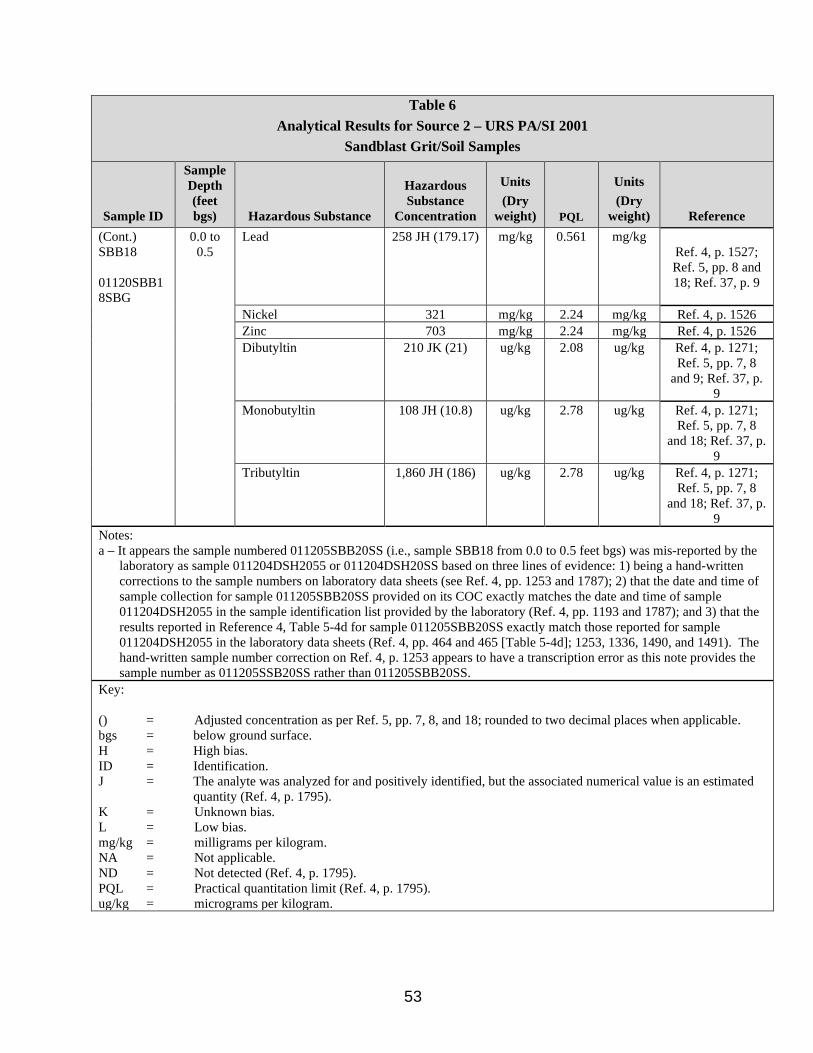
Table 6 Analytical Results for Source 2 – URS PA/SI 2001
Sandblast Grit/Soil Samples
Sample ID
Sample Depth (feet bgs) Hazardous Substance
Hazardous Substance
Concentration
Units (Dry
weight) PQL
Units (Dry
weight) Reference (Cont.) SBB18
01120SBB1 8SBG
0.0 to 0.5
Lead 258 JH (179.17) mg/kg 0.561 mg/kg Ref. 4, p. 1527; Ref. 5, pp. 8 and 18; Ref. 37, p. 9
Nickel 321 mg/kg 2.24 mg/kg Ref. 4, p. 1526 Zinc 703 mg/kg 2.24 mg/kg Ref. 4, p. 1526 Dibutyltin 210 JK (21) ug/kg 2.08 ug/kg Ref. 4, p. 1271;
Ref. 5, pp. 7, 8 and 9; Ref. 37, p.
9 Monobutyltin 108 JH (10.8) ug/kg 2.78 ug/kg Ref. 4, p. 1271;
Ref. 5, pp. 7, 8 and 18; Ref. 37, p.
9 Tributyltin 1,860 JH (186) ug/kg 2.78 ug/kg Ref. 4, p. 1271;
Ref. 5, pp. 7, 8 and 18; Ref. 37, p.
9 Notes: a – It appears the sample numbered 011205SBB20SS (i.e., sample SBB18 from 0.0 to 0.5 feet bgs) was mis-reported by the
laboratory as sample 011204DSH2055 or 011204DSH20SS based on three lines of evidence: 1) being a hand-written corrections to the sample numbers on laboratory data sheets (see Ref. 4, pp. 1253 and 1787); 2) that the date and time of sample collection for sample 011205SBB20SS provided on its COC exactly matches the date and time of sample 011204DSH2055 in the sample identification list provided by the laboratory (Ref. 4, pp. 1193 and 1787); and 3) that the results reported in Reference 4, Table 5-4d for sample 011205SBB20SS exactly match those reported for sample 011204DSH2055 in the laboratory data sheets (Ref. 4, pp. 464 and 465 [Table 5-4d]; 1253, 1336, 1490, and 1491). The hand-written sample number correction on Ref. 4, p. 1253 appears to have a transcription error as this note provides the sample number as 011205SSB20SS rather than 011205SBB20SS.
Key:
() = Adjusted concentration as per Ref. 5, pp. 7, 8, and 18; rounded to two decimal places when applicable. bgs = below ground surface. H = High bias. ID = Identification. J = The analyte was analyzed for and positively identified, but the associated numerical value is an estimated
quantity (Ref. 4, p. 1795). K = Unknown bias. L = Low bias. mg/kg = milligrams per kilogram. NA = Not applicable. ND = Not detected (Ref. 4, p. 1795). PQL = Practical quantitation limit (Ref. 4, p. 1795). ug/kg = micrograms per kilogram.
53
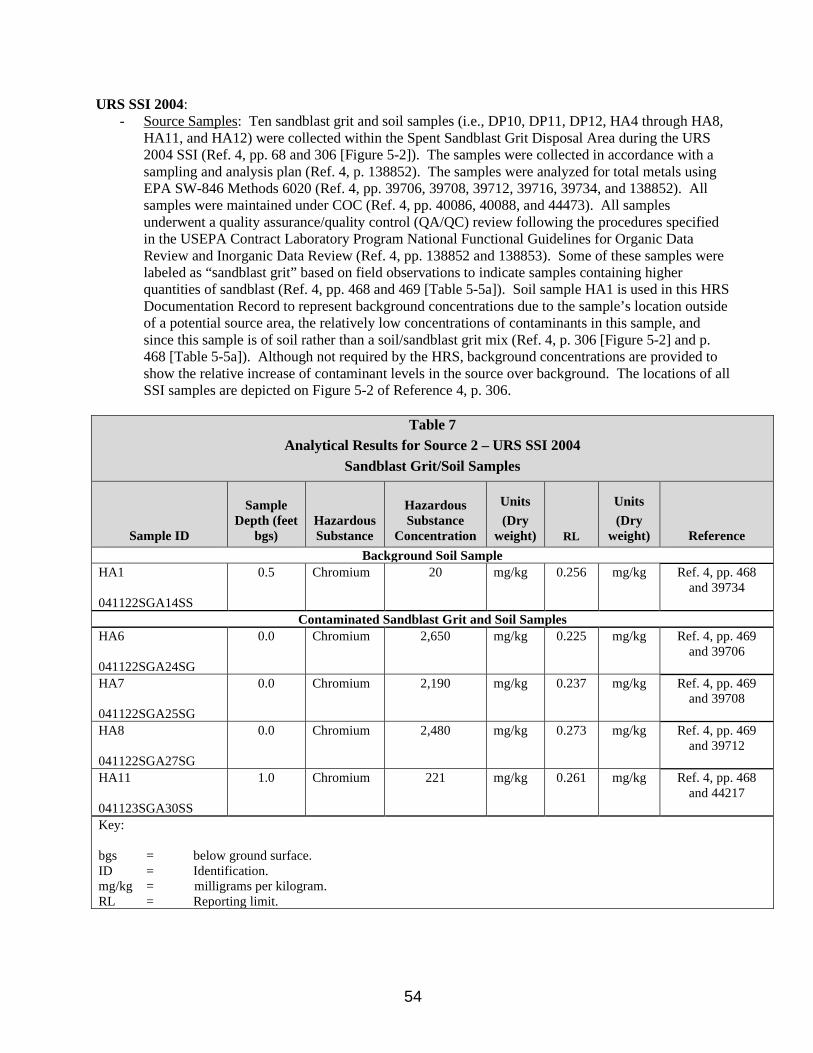
URS SSI 2004: - Source Samples: Ten sandblast grit and soil samples (i.e., DP10, DP11, DP12, HA4 through HA8,
HA11, and HA12) were collected within the Spent Sandblast Grit Disposal Area during the URS 2004 SSI (Ref. 4, pp. 68 and 306 [Figure 5-2]). The samples were collected in accordance with a sampling and analysis plan (Ref. 4, p. 138852). The samples were analyzed for total metals using EPA SW-846 Methods 6020 (Ref. 4, pp. 39706, 39708, 39712, 39716, 39734, and 138852). All samples were maintained under COC (Ref. 4, pp. 40086, 40088, and 44473). All samples underwent a quality assurance/quality control (QA/QC) review following the procedures specified in the USEPA Contract Laboratory Program National Functional Guidelines for Organic Data Review and Inorganic Data Review (Ref. 4, pp. 138852 and 138853). Some of these samples were labeled as “sandblast grit” based on field observations to indicate samples containing higher quantities of sandblast (Ref. 4, pp. 468 and 469 [Table 5-5a]). Soil sample HA1 is used in this HRS Documentation Record to represent background concentrations due to the sample’s location outside of a potential source area, the relatively low concentrations of contaminants in this sample, and since this sample is of soil rather than a soil/sandblast grit mix (Ref. 4, p. 306 [Figure 5-2] and p. 468 [Table 5-5a]). Although not required by the HRS, background concentrations are provided to show the relative increase of contaminant levels in the source over background. The locations of all SSI samples are depicted on Figure 5-2 of Reference 4, p. 306.
Table 7 Analytical Results for Source 2 – URS SSI 2004
Sandblast Grit/Soil Samples
Sample ID
Sample Depth (feet
bgs) Hazardous Substance
Hazardous Substance
Concentration
Units (Dry
weight) RL
Units (Dry
weight) Reference Background Soil Sample
HA1
041122SGA14SS
0.5 Chromium 20 mg/kg 0.256 mg/kg Ref. 4, pp. 468 and 39734
Contaminated Sandblast Grit and Soil Samples HA6
041122SGA24SG
0.0 Chromium 2,650 mg/kg 0.225 mg/kg Ref. 4, pp. 469 and 39706
HA7
041122SGA25SG
0.0 Chromium 2,190 mg/kg 0.237 mg/kg Ref. 4, pp. 469 and 39708
HA8
041122SGA27SG
0.0 Chromium 2,480 mg/kg 0.273 mg/kg Ref. 4, pp. 469 and 39712
HA11
041123SGA30SS
1.0 Chromium 221 mg/kg 0.261 mg/kg Ref. 4, pp. 468 and 44217
Key:
bgs = below ground surface. ID = Identification. mg/kg = milligrams per kilogram. RL = Reporting limit.
54
List of Hazardous Substances Associated with Source
PCBs (Aroclor 1260), antimony, arsenic, cadmium, chromium, copper, lead, nickel, zinc, dibutyltin, monobutyltin, and tributyltin.
Butyltins are pollutants/contaminants found at this site (see Table 6 of this HRS documentation record). Butyltins are a class of compounds that bioaccumulate in sediment and fish tissue and are known to have effects on human health and wildlife (Ref. 35, p. 63). One study found that rats whose mothers were exposed to tributyltin during pregnancy showed altered performance in some neurological tests conducted when they were young adults (Ref. 36, p. 27). Another study, also with tributyltin, found that exposure during gestation, lactation, and post-lactation affected some developmental landmarks in female rats (Ref. 36, p. 27). Dibutyltin, and tributyltin, when administered during pregnancy, have induced developmental and reproductive effects in rodents (Ref. 36, p. 33).
The EPA has developed risk-based residential soil RSLs for dibutyltin compounds (i.e., 19 mg/kg) and for tri-n-butyltin (i.e., 23 mg/kg) (Ref. 33, pp. 2, 7, and 15). The RSET has determined that tributyltin is a bioaccumulative chemical of concern in Oregon, including the Columbia River where it borders Oregon and Washington (Ref. 34, p. 142). RSET has proposed freshwater benthic screening levels for dibutyltin, monobutyltin, and tributyltin (Ref. 34, p. 190) and water quality-based screening levels for tributyltin (Ref. 34, p. 195).
55
SD – Hazardous Waste Quantity Source No.: 2
2.4.2 Hazardous Waste Quantity 2.4.2.1.1 Hazardous Constituent Quantity The hazardous constituent quantity for Source No. 2 could not be adequately determined according to the HRS requirements; that is, the total mass of all Comprehensive Environmental Response, Compensation, and Liability Act (CERCLA) hazardous substances in the source is not known and cannot be estimated with reasonable confidence (Ref. 1, Section 2.4.2.1.1). There are insufficient historical and current data (Manifests, PRP records, State records, Permits, Waste concentration data, etc.) available to adequately calculate the total mass of all CERCLA hazardous substances in the source and the associated releases from the source. Therefore, there is insufficient information to evaluate the associated releases from the source to calculate the hazardous constituent quantity for Source No. 2 with reasonable confidence.
Hazardous Constituent Quantity Value (S): NS
2.4.2.1.2 Hazardous Wastestream Quantity The hazardous wastestream quantity for Source No. 2 could not be adequately determined according to the HRS requirements; that is, the total mass of all hazardous wastestreams and CERCLA pollutants and contaminants in the source is not known and cannot be estimated with reasonable confidence (Ref. 1, Section 2.4.2.1.2). There are insufficient historical and current data (Manifests, PRP records, State records, permits, etc.) available to adequately calculate the total mass of all hazardous wastestreams and CERCLA pollutants and contaminants in the source and the associated releases from the source. Therefore, there is insufficient information to evaluate the associated releases from the source to calculate the hazardous wastestream quantity for Source No. 2 with reasonable confidence.
Hazardous Wastestream Quantity (W): NS
2.4.2.1.3 Volume The URS 2001 PA/SI report estimated that the Spent Sandblast Grit Storage Area covered an area of approximately 20,000 square feet to depths of 1 to 3 feet bgs (Ref. 4, p. 68). Using these measurements the volume of this source is calculated to be between 740 cy (i.e., [20,000 square feet x 1 foot]/27 cubic feet per cy) and 2,222 (i.e., [20,000 square feet x 3 feet]/27 cubic feet per cy). The total volume of sandblast grit present was estimated in this report to be between 1,410 and 2,025 cy (Ref. 4, p. 68). The extent of the Spent Sandblast Grit Storage Area as depicted on Figure 3-4 of Reference 4 shows the approximate extent of the primary sandblast grit disposal area; however, evidence of sandblast grit was also observed in surface soils further to the north (Ref. 4, pp. 68 and 301).
Using the lower estimated volume of 740 cy, the volume measure of the source is conservatively calculated to be 0.296 (i.e., 740 cy / 2,500 for contaminated soil) (Ref. 1, Section 2.4.2.1.3).
Volume Assigned Value (V): 0.296
2.4.2.1.4 Area An area measure of 0 is assigned since the volume of the source could be determined (Ref. 1, Sections 2.4.2.1.3 and 2.4.2.1.4).
Area Assigned Value (A): 0
Source Hazardous Waste Quantity Factor Value (Ref. 1, Section 2.4.2.1.5): 0.296
56
SD – Characterization and Containment
SOURCE DESCRIPTION
2.2 SOURCE CHARACTERIZATION
Number of the Source: 3
Name and description of the source: Equipment Laydown Area (Contaminated Soil)
The USACE stores industrial equipment and materials along the northern and southern portions of the Landfill access road (Ref. 4, pp. 52 and 301 [Figure 3-4]). This area is a part of the Sandblast Area AOPC (Ref. 4, p. 49). Periodic grading of the laydown area has been performed to expand storage capacity (Ref. 4, p. 52). Soils in this area have become contaminated with metals, pesticides, PCBs, and PAHs; among other contaminants (Ref. 4, p. 21).
In 2009, an Upland OU Data Gaps Report was completed by URS in support of the RI (Ref. 4, p. 72). The focus of this work was to fill data gaps related to understanding the nature and extent of contamination, and to provide sufficient information for conducting risk evaluations (Ref. 4, p. 72). During this investigation, a total of 10 soil samples were collected from the Equipment Laydown Area at the Sandblast AOPC (Ref. 4, pp. 306 [Figure 5-2] and 508 [Table 6-3a]). These samples were obtained from five test pits (LD-01 through LD-05) at depths of 0-1 feet and 1-3 feet bgs; that is two samples per test pit (Ref. 4, pp. 306 [Figure 5-2] and 508 [Table 6-3a]). The samples revealed the presence of PCBs, metals, butyltins, pesticides, and SVOCs (Ref. 4, p. 508 [Table 6-3a]) (see Table 8 of this HRS Documentation Record).
Also, during this investigation, an additional sixteen soil samples were collected from the Sandblast AOPC (Ref. 4, pp. 73 and 514 [Table 6-3d]). These samples were obtained from eight locations (SB-01 through SB-08) at depths of 0-1 feet and 1-3 feet bgs; that is two samples per location (Ref. 4, pp. 73, 306 [Figure 5-2], and 514 [Table 6-3d]). Each sample was sieved to obtain two size fractions (less than 250 micrometer and less than 2 millimeters) and analyzed for lead (Ref. 4, pp. 17, 73, and 514 [Table 6-3d)]). Of these sample locations, three (SB-01, SB-02, and SB-03) were within the Equipment Laydown Area (Ref. 4, pp. 306 [Figure 5-2]. These samples revealed the presence of lead (Ref. 4, p. 514 [Table 6-3d]) (see Table 9 of this HRS Documentation Record).
Location of the source, with reference to a map: The Equipment Laydown Area is located on the eastern side of Bradford Island, Oregon (Ref. 4, pp. 297 and 301).
Containment Release to Surface Water via Overland Migration and/or Flood: A surface water containment factor value of 10 (Ref. 1, Table 4-2) is assigned because the Equipment Laydown Area is flat and unvegetated (i.e., the source has no maintained engineered cover, or functioning and maintained run-on control system and runoff management system) (Ref. 4, p. 40).
Containment Factor Value: 10
57
SD – Hazardous Substances Source No.: 3
2.2.2 HAZARDOUS SUBSTANCES ASSOCIATED WITH THE SOURCE The RI report documents the investigation activities that have taken place over the past 10 years since the report was written (i.e., approximately the period from 2002 to 2012) (Ref. 4, p. 20); including new sampling work conducted during the RI in 2007 and 2009 to fill identified data gaps (Ref. 4, p. 72). The RI states that due to the relatively static physical environment of the Upland OU, environmental data collected over the past decade prior to the RI can be considered representative of current conditions (Ref. 4, p. 59). The RI report included laboratory data forms from these investigations as Appendix E. For this reason, the primary reference for information contained in tables within this section are taken from this appendix.
URS Upland OU Data Gaps Sampling Report 2009
- Equipment Laydown Area Source Samples: Soil samples were collected from five test pits (LD-01 through LD-05) in the Equipment Laydown Area of the Sandblast AOPC during the URS Upland OU Data Gaps Sampling event as presented in Table 8 below (Ref. 4, pp. 73, 74, 306 [Figure 5-2], and 508 [Table 6-3a]). At each test pit, one sample was collected from 0 to 1 feet bgs and one sample was collected from 1 to 3 feet bgs (Ref. 4, p. 508 [Table 6-3a]). All samples underwent a quality assurance/quality control (QA/QC) review following the procedures specified in the USEPA Contract Laboratory Program National Functional Guidelines for Organic Data Review and Inorganic Data Review (Ref. 4, p. 138942). Samples for this investigation were collected following the guidance contained in related quality assurance project plans (Ref. 4, pp. 72, 290, and 291). The samples were analyzed for SVOCs by EPA SW-846 Method 8270C, PCBs by EPA SW-846 Method 8082, pesticides by EPA SW-846 Method 8081, total metals by EPA SW-846 6010B and 6020, mercury by EPA SW-845 Method 7471A, and butyltins by Krone; among other analyses (Ref. 4, pp. 131412, 131413 through 131422, 131721, 132264, 132265, 133426, 138941, and 138952). The samples were received consistent with the accompanying COC forms (Ref. 4, pp. 131384 and 131390). Background soil samples (i.e., referred to as “Reference” samples) were collected from 14 locations (R1 through R14) (Ref. 4, p. 74). Although not required by the HRS, background concentrations are provided to show the relative increase of contaminant levels in the source over background. Since none of the reference samples were analyzed for pesticides or butyltins, the samples from test pit LD-04 collected from 0 to 1.0 foot bgs (sample 090320-LD4So-0-1) and from 1.0 to 3.0 feet bgs (sample 090320-LD4So-1-3) will be used in this HRS Documentation Record to represent background concentrations due to these samples’ relatively low concentrations of analytes and since they were analyzed for the same compounds as other Equipment Laydown Area source samples (Ref. 4, pp. 508 and 509 [Table 6-3a], 512 and 513 [Table 6-3c], and 138951). Sample 090320-LD4So-0-1 is used in Table 8 as the background sample for comparison to source samples collected from 0 to 1.0 feet bgs; while sample 090320-LD4So-1-3 is used as the background sample for comparison to source samples collected from 1.0 to 3.0 feet bgs. The Upland OU Data Gaps Sampling soil sample locations are depicted on Figure 5-2 of Reference 4, p. 306 (Ref. 4, pp. 306 [Figure 5-2] and 508 [Table 6-3a]).
58
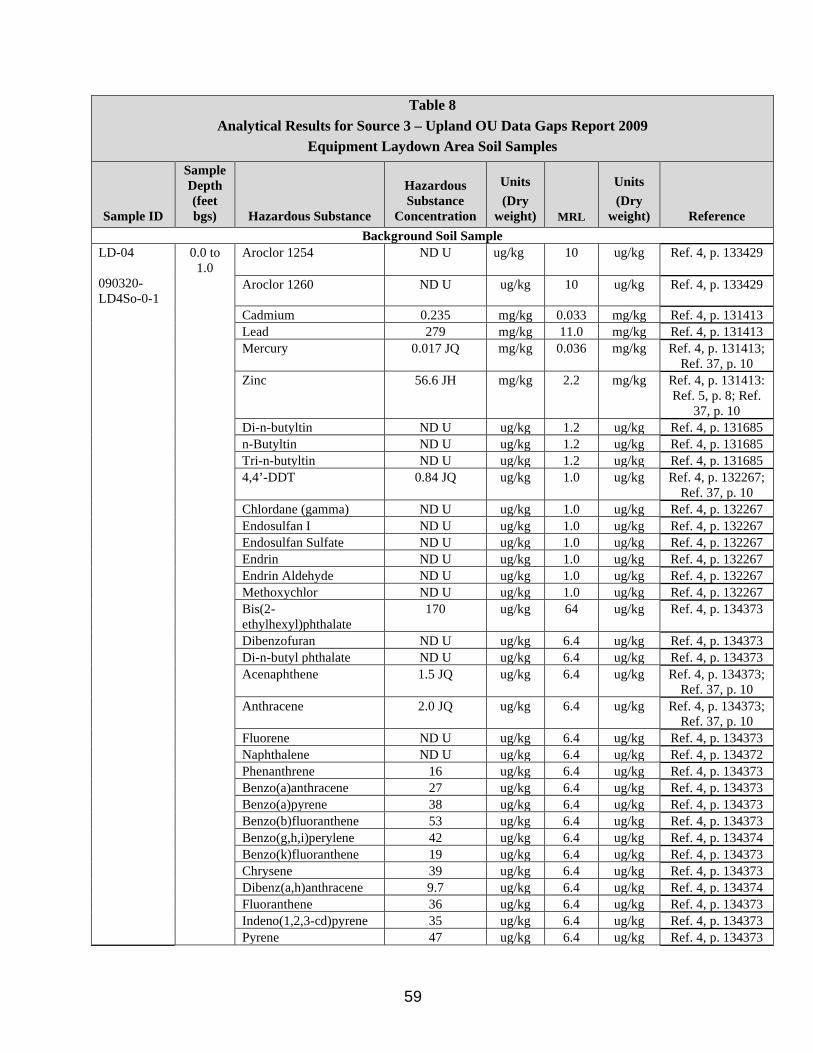
Table 8 Analytical Results for Source 3 – Upland OU Data Gaps Report 2009
Equipment Laydown Area Soil Samples
Sample ID
Sample Depth (feet bgs) Hazardous Substance
Hazardous Substance
Concentration
Units (Dry
weight) MRL
Units (Dry
weight) Reference Background Soil Sample
LD-04
090320-LD4So-0-1
0.0 to 1.0
Aroclor 1254 ND U ug/kg 10 ug/kg Ref. 4, p. 133429
Aroclor 1260 ND U ug/kg 10 ug/kg Ref. 4, p. 133429
Cadmium 0.235 mg/kg 0.033 mg/kg Ref. 4, p. 131413 Lead 279 mg/kg 11.0 mg/kg Ref. 4, p. 131413 Mercury 0.017 JQ mg/kg 0.036 mg/kg Ref. 4, p. 131413;
Ref. 37, p. 10 Zinc 56.6 JH mg/kg 2.2 mg/kg Ref. 4, p. 131413:
Ref. 5, p. 8; Ref. 37, p. 10
Di-n-butyltin ND U ug/kg 1.2 ug/kg Ref. 4, p. 131685 n-Butyltin ND U ug/kg 1.2 ug/kg Ref. 4, p. 131685 Tri-n-butyltin ND U ug/kg 1.2 ug/kg Ref. 4, p. 131685 4,4’-DDT 0.84 JQ ug/kg 1.0 ug/kg Ref. 4, p. 132267;
Ref. 37, p. 10 Chlordane (gamma) ND U ug/kg 1.0 ug/kg Ref. 4, p. 132267 Endosulfan I ND U ug/kg 1.0 ug/kg Ref. 4, p. 132267 Endosulfan Sulfate ND U ug/kg 1.0 ug/kg Ref. 4, p. 132267 Endrin ND U ug/kg 1.0 ug/kg Ref. 4, p. 132267 Endrin Aldehyde ND U ug/kg 1.0 ug/kg Ref. 4, p. 132267 Methoxychlor ND U ug/kg 1.0 ug/kg Ref. 4, p. 132267 Bis(2-ethylhexyl)phthalate
170 ug/kg 64 ug/kg Ref. 4, p. 134373
Dibenzofuran ND U ug/kg 6.4 ug/kg Ref. 4, p. 134373 Di-n-butyl phthalate ND U ug/kg 6.4 ug/kg Ref. 4, p. 134373 Acenaphthene 1.5 JQ ug/kg 6.4 ug/kg Ref. 4, p. 134373;
Ref. 37, p. 10 Anthracene 2.0 JQ ug/kg 6.4 ug/kg Ref. 4, p. 134373;
Ref. 37, p. 10 Fluorene ND U ug/kg 6.4 ug/kg Ref. 4, p. 134373 Naphthalene ND U ug/kg 6.4 ug/kg Ref. 4, p. 134372 Phenanthrene 16 ug/kg 6.4 ug/kg Ref. 4, p. 134373 Benzo(a)anthracene 27 ug/kg 6.4 ug/kg Ref. 4, p. 134373 Benzo(a)pyrene 38 ug/kg 6.4 ug/kg Ref. 4, p. 134373 Benzo(b)fluoranthene 53 ug/kg 6.4 ug/kg Ref. 4, p. 134373 Benzo(g,h,i)perylene 42 ug/kg 6.4 ug/kg Ref. 4, p. 134374 Benzo(k)fluoranthene 19 ug/kg 6.4 ug/kg Ref. 4, p. 134373 Chrysene 39 ug/kg 6.4 ug/kg Ref. 4, p. 134373 Dibenz(a,h)anthracene 9.7 ug/kg 6.4 ug/kg Ref. 4, p. 134374 Fluoranthene 36 ug/kg 6.4 ug/kg Ref. 4, p. 134373 Indeno(1,2,3-cd)pyrene 35 ug/kg 6.4 ug/kg Ref. 4, p. 134373 Pyrene 47 ug/kg 6.4 ug/kg Ref. 4, p. 134373
59

Table 8 Analytical Results for Source 3 – Upland OU Data Gaps Report 2009
Equipment Laydown Area Soil Samples
Sample ID
Sample Depth (feet bgs) Hazardous Substance
Hazardous Substance
Concentration
Units (Dry
weight) MRL
Units (Dry
weight) Reference LD-04
090320-LD4So-1-3
1.0 to 3.0
Aroclor 1254 ND U ug/kg 9.9 ug/kg Ref. 4, p. 133430
Aroclor 1260 ND U ug/kg 9.9 ug/kg Ref. 4, p. 133430 Cadmium 0.077 mg/kg 0.033 mg/kg Ref. 4, p. 131414 Lead 13.4 mg/kg 11.4 mg/kg Ref. 4, p. 131414 Mercury 0.057 mg/kg 0.039 mg/kg Ref. 4, p. 131414 Zinc 50.0 JH (75) mg/kg 2.3 mg/kg Ref. 4, p. 131414;
Ref. 5, pp. 8 and 18; Ref. 37, p. 10
Di-n-butyltin ND U ug/kg 1.2 ug/kg Ref. 4, p. 131686 n-Butyltin ND U ug/kg 1.2 ug/kg Ref. 4, p. 131686 Tri-n-butyltin ND U ug/kg 1.2 ug/kg Ref. 4, p. 131686 4,4’-DDT ND U ug/kg 0.99 ug/kg Ref. 4, p. 132268 Chlordane (gamma) ND U ug/kg 0.99 ug/kg Ref. 4, p. 132268 Endosulfan I ND U ug/kg 0.99 ug/kg Ref. 4, p. 132268 Endosulfan Sulfate ND U ug/kg 0.99 ug/kg Ref. 4, p. 132268 Endrin ND U ug/kg 0.99 ug/kg Ref. 4, p. 132268 Endrin Aldehyde ND U ug/kg 0.99 ug/kg Ref. 4, p. 132268 Methoxychlor ND U ug/kg 0.99 ug/kg Ref. 4, p. 132268 Bis(2-ethylhexyl)phthalate
15 JQ ug/kg 65 ug/kg Ref. 4, p. 134376; Ref. 37, p. 10
Dibenzofuran ND U ug/kg 6.5 ug/kg Ref. 4, p. 134376 Di-n-butyl phthalate ND U ug/kg 6.5 ug/kg Ref. 4, p. 134376 Acenaphthene ND U ug/kg 6.5 ug/kg Ref. 4, p. 134376 Anthracene ND U ug/kg 6.5 ug/kg Ref. 4, p. 134376 Fluorene ND U ug/kg 6.5 ug/kg Ref. 4, p. 134376 Naphthalene ND U ug/kg 6.5 ug/kg Ref. 4, p. 134375 Phenanthrene ND U ug/kg 6.5 ug/kg Ref. 4, p. 134376 Benzo(a)anthracene ND U ug/kg 6.5 ug/kg Ref. 4, p. 134376 Benzo(a)pyrene ND U ug/kg 6.5 ug/kg Ref. 4, p. 134376 Benzo(b)fluoranthene ND U ug/kg 6.5 ug/kg Ref. 4, p. 134376 Benzo(g,h,i)perylene ND U ug/kg 6.5 ug/kg Ref. 4, p. 134377 Benzo(k)fluoranthene ND U ug/kg 6.5 ug/kg Ref. 4, p. 134376 Chrysene 1.8 JQ ug/kg 6.5 ug/kg Ref. 4, p. 134376;
Ref. 37, p. 10 Dibenz(a,h)anthracene ND U ug/kg 6.5 ug/kg Ref. 4, p. 134377 Fluoranthene ND U ug/kg 6.5 ug/kg Ref. 4, p. 134376 Indeno(1,2,3-cd)pyrene ND U ug/kg 6.5 ug/kg Ref. 4, p. 134376 Pyrene 2.1 JQ ug/kg 6.5 ug/kg Ref. 4, p. 134376;
Ref. 37, p. 10
60
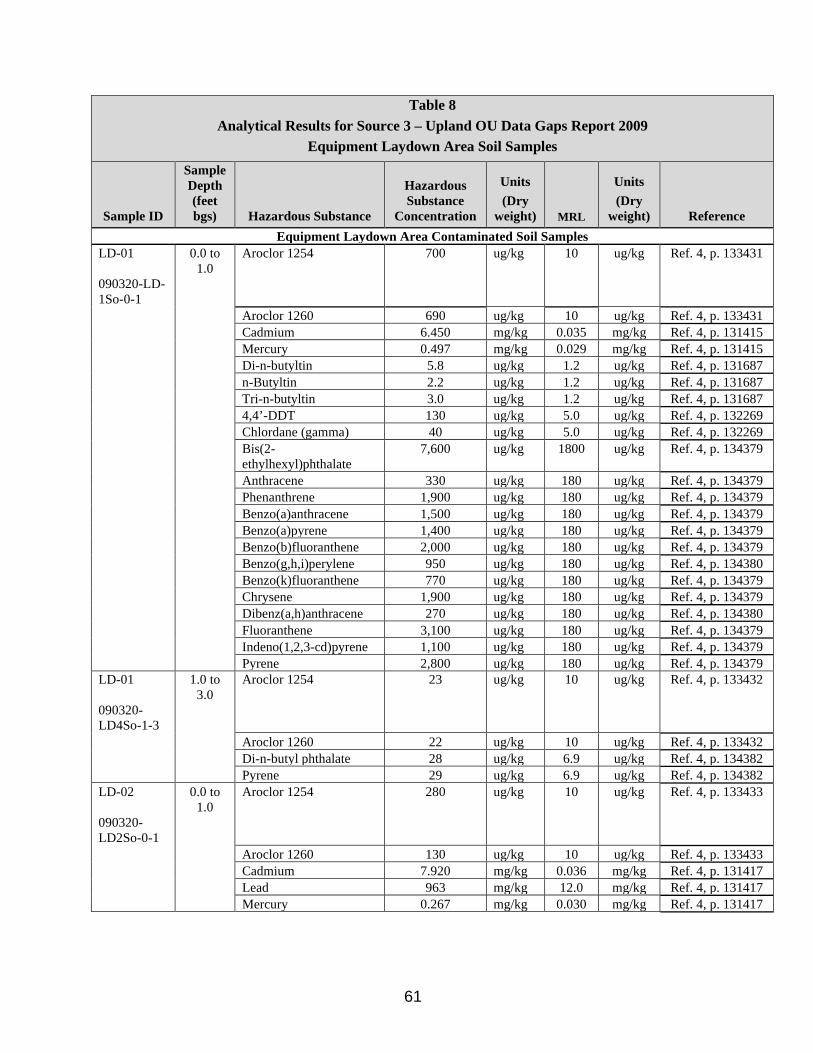
Table 8 Analytical Results for Source 3 – Upland OU Data Gaps Report 2009
Equipment Laydown Area Soil Samples
Sample ID
Sample Depth (feet bgs) Hazardous Substance
Hazardous Substance
Concentration
Units (Dry
weight) MRL
Units (Dry
weight) Reference Equipment Laydown Area Contaminated Soil Samples
LD-01
090320-LD-1So-0-1
0.0 to 1.0
Aroclor 1254 700 ug/kg 10 ug/kg Ref. 4, p. 133431
Aroclor 1260 690 ug/kg 10 ug/kg Ref. 4, p. 133431 Cadmium 6.450 mg/kg 0.035 mg/kg Ref. 4, p. 131415 Mercury 0.497 mg/kg 0.029 mg/kg Ref. 4, p. 131415 Di-n-butyltin 5.8 ug/kg 1.2 ug/kg Ref. 4, p. 131687 n-Butyltin 2.2 ug/kg 1.2 ug/kg Ref. 4, p. 131687 Tri-n-butyltin 3.0 ug/kg 1.2 ug/kg Ref. 4, p. 131687 4,4’-DDT 130 ug/kg 5.0 ug/kg Ref. 4, p. 132269 Chlordane (gamma) 40 ug/kg 5.0 ug/kg Ref. 4, p. 132269 Bis(2-ethylhexyl)phthalate
7,600 ug/kg 1800 ug/kg Ref. 4, p. 134379
Anthracene 330 ug/kg 180 ug/kg Ref. 4, p. 134379 Phenanthrene 1,900 ug/kg 180 ug/kg Ref. 4, p. 134379 Benzo(a)anthracene 1,500 ug/kg 180 ug/kg Ref. 4, p. 134379 Benzo(a)pyrene 1,400 ug/kg 180 ug/kg Ref. 4, p. 134379 Benzo(b)fluoranthene 2,000 ug/kg 180 ug/kg Ref. 4, p. 134379 Benzo(g,h,i)perylene 950 ug/kg 180 ug/kg Ref. 4, p. 134380 Benzo(k)fluoranthene 770 ug/kg 180 ug/kg Ref. 4, p. 134379 Chrysene 1,900 ug/kg 180 ug/kg Ref. 4, p. 134379 Dibenz(a,h)anthracene 270 ug/kg 180 ug/kg Ref. 4, p. 134380 Fluoranthene 3,100 ug/kg 180 ug/kg Ref. 4, p. 134379 Indeno(1,2,3-cd)pyrene 1,100 ug/kg 180 ug/kg Ref. 4, p. 134379 Pyrene 2,800 ug/kg 180 ug/kg Ref. 4, p. 134379
LD-01
090320-LD4So-1-3
1.0 to 3.0
Aroclor 1254 23 ug/kg 10 ug/kg Ref. 4, p. 133432
Aroclor 1260 22 ug/kg 10 ug/kg Ref. 4, p. 133432 Di-n-butyl phthalate 28 ug/kg 6.9 ug/kg Ref. 4, p. 134382 Pyrene 29 ug/kg 6.9 ug/kg Ref. 4, p. 134382
LD-02
090320-LD2So-0-1
0.0 to 1.0
Aroclor 1254 280 ug/kg 10 ug/kg Ref. 4, p. 133433
Aroclor 1260 130 ug/kg 10 ug/kg Ref. 4, p. 133433 Cadmium 7.920 mg/kg 0.036 mg/kg Ref. 4, p. 131417 Lead 963 mg/kg 12.0 mg/kg Ref. 4, p. 131417 Mercury 0.267 mg/kg 0.030 mg/kg Ref. 4, p. 131417
61
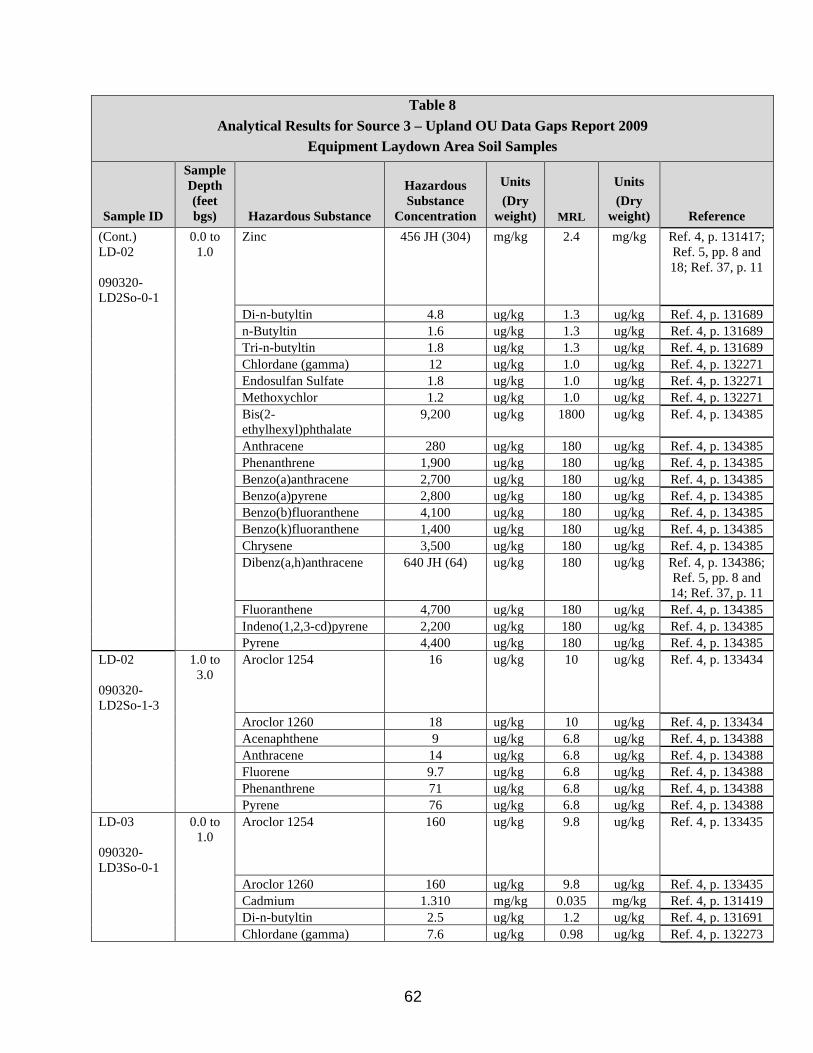
Table 8 Analytical Results for Source 3 – Upland OU Data Gaps Report 2009
Equipment Laydown Area Soil Samples
Sample ID
Sample Depth (feet bgs) Hazardous Substance
Hazardous Substance
Concentration
Units (Dry
weight) MRL
Units (Dry
weight) Reference (Cont.) LD-02
090320-LD2So-0-1
0.0 to 1.0
Zinc 456 JH (304) mg/kg 2.4 mg/kg Ref. 4, p. 131417; Ref. 5, pp. 8 and 18; Ref. 37, p. 11
Di-n-butyltin 4.8 ug/kg 1.3 ug/kg Ref. 4, p. 131689 n-Butyltin 1.6 ug/kg 1.3 ug/kg Ref. 4, p. 131689 Tri-n-butyltin 1.8 ug/kg 1.3 ug/kg Ref. 4, p. 131689 Chlordane (gamma) 12 ug/kg 1.0 ug/kg Ref. 4, p. 132271 Endosulfan Sulfate 1.8 ug/kg 1.0 ug/kg Ref. 4, p. 132271 Methoxychlor 1.2 ug/kg 1.0 ug/kg Ref. 4, p. 132271 Bis(2-ethylhexyl)phthalate
9,200 ug/kg 1800 ug/kg Ref. 4, p. 134385
Anthracene 280 ug/kg 180 ug/kg Ref. 4, p. 134385 Phenanthrene 1,900 ug/kg 180 ug/kg Ref. 4, p. 134385 Benzo(a)anthracene 2,700 ug/kg 180 ug/kg Ref. 4, p. 134385 Benzo(a)pyrene 2,800 ug/kg 180 ug/kg Ref. 4, p. 134385 Benzo(b)fluoranthene 4,100 ug/kg 180 ug/kg Ref. 4, p. 134385 Benzo(k)fluoranthene 1,400 ug/kg 180 ug/kg Ref. 4, p. 134385 Chrysene 3,500 ug/kg 180 ug/kg Ref. 4, p. 134385 Dibenz(a,h)anthracene 640 JH (64) ug/kg 180 ug/kg Ref. 4, p. 134386;
Ref. 5, pp. 8 and 14; Ref. 37, p. 11
Fluoranthene 4,700 ug/kg 180 ug/kg Ref. 4, p. 134385 Indeno(1,2,3-cd)pyrene 2,200 ug/kg 180 ug/kg Ref. 4, p. 134385 Pyrene 4,400 ug/kg 180 ug/kg Ref. 4, p. 134385
LD-02
090320-LD2So-1-3
1.0 to 3.0
Aroclor 1254 16 ug/kg 10 ug/kg Ref. 4, p. 133434
Aroclor 1260 18 ug/kg 10 ug/kg Ref. 4, p. 133434 Acenaphthene 9 ug/kg 6.8 ug/kg Ref. 4, p. 134388 Anthracene 14 ug/kg 6.8 ug/kg Ref. 4, p. 134388 Fluorene 9.7 ug/kg 6.8 ug/kg Ref. 4, p. 134388 Phenanthrene 71 ug/kg 6.8 ug/kg Ref. 4, p. 134388 Pyrene 76 ug/kg 6.8 ug/kg Ref. 4, p. 134388
LD-03
090320-LD3So-0-1
0.0 to 1.0
Aroclor 1254 160 ug/kg 9.8 ug/kg Ref. 4, p. 133435
Aroclor 1260 160 ug/kg 9.8 ug/kg Ref. 4, p. 133435 Cadmium 1.310 mg/kg 0.035 mg/kg Ref. 4, p. 131419 Di-n-butyltin 2.5 ug/kg 1.2 ug/kg Ref. 4, p. 131691 Chlordane (gamma) 7.6 ug/kg 0.98 ug/kg Ref. 4, p. 132273
62

Table 8 Analytical Results for Source 3 – Upland OU Data Gaps Report 2009
Equipment Laydown Area Soil Samples
Sample ID
Sample Depth (feet bgs) Hazardous Substance
Hazardous Substance
Concentration
Units (Dry
weight) MRL
Units (Dry
weight) Reference (Cont.) LD-03
090320-LD3So-0-1
0.0 to 1.0
Endosulfan I 2.2 ug/kg 0.98 ug/kg Ref. 4, p. 132273
Methoxychlor 1.0 ug/kg 0.98 ug/kg Ref. 4, p. 132273 Bis(2-ethylhexyl)phthalate
3,500 ug/kg 1700 ug/kg Ref. 4, p. 134391
Dibenzofuran 220 ug/kg 170 ug/kg Ref. 4, p. 134391 Acenaphthene 430 ug/kg 170 ug/kg Ref. 4, p. 134391 Anthracene 780 ug/kg 170 ug/kg Ref. 4, p. 134391 Fluorene 380 ug/kg 170 ug/kg Ref. 4, p. 134391 Phenanthrene 4,000 ug/kg 170 ug/kg Ref. 4, p. 134391 Benzo(a)anthracene 2,100 ug/kg 170 ug/kg Ref. 4, p. 134391 Benzo(a)pyrene 1,900 ug/kg 170 ug/kg Ref. 4, p. 134391 Benzo(b)fluoranthene 2,600 ug/kg 170 ug/kg Ref. 4, p. 134391 Benzo(g,h,i)perylene 1,100 ug/kg 170 ug/kg Ref. 4, p. 134392 Benzo(k)fluoranthene 880 ug/kg 170 ug/kg Ref. 4, p. 134391 Chrysene 2,300 ug/kg 170 ug/kg Ref. 4, p. 134391 Dibenz(a,h)anthracene 350 ug/kg 170 ug/kg Ref. 4, p. 134392 Fluoranthene 5,000 ug/kg 170 ug/kg Ref. 4, p. 134391 Indeno(1,2,3-cd)pyrene 1,300 ug/kg 170 ug/kg Ref. 4, p. 134391 Pyrene 4,200 ug/kg 170 ug/kg Ref. 4, p. 134391
LD-03
090320-LD3So-1-3
1.0 to 3.0
Aroclor 1254 11 ug/kg 10 ug/kg Ref. 4, p. 133436
Aroclor 1260 11 ug/kg 10 ug/kg Ref. 4, p. 133436 Anthracene 11 ug/kg 6.8 ug/kg Ref. 4, p. 134394 Phenanthrene 59 ug/kg 6.8 ug/kg Ref. 4, p. 134394 Fluoranthene 130 ug/kg 6.8 ug/kg Ref. 4, p. 134394 Pyrene 120 ug/kg 6.8 ug/kg Ref. 4, p. 134394
LD-05
090320-LD5So-0-1
0.0 to 1.0
Aroclor 1254 1,500 ug/kg 49 ug/kg Ref. 4, p. 133437
Aroclor 1260 480 ug/kg 49 ug/kg Ref. 4, p. 133437 Cadmium 17.3 mg/kg 0.034 mg/kg Ref. 4, p. 131421 Mercury 0.723 mg/kg 0.037 mg/kg Ref. 4, p. 131421 4,4’-DDT 140 ug/kg 9.8 ug/kg Ref. 4, p. 132275 Chlordane (gamma) 86 ug/kg 4.9 ug/kg Ref. 4, p. 132275 Endrin 17 ug/kg 4.9 ug/kg Ref. 4, p. 132275 Endrin Aldehyde 16 ug/kg 4.9 ug/kg Ref. 4, p. 132275
63
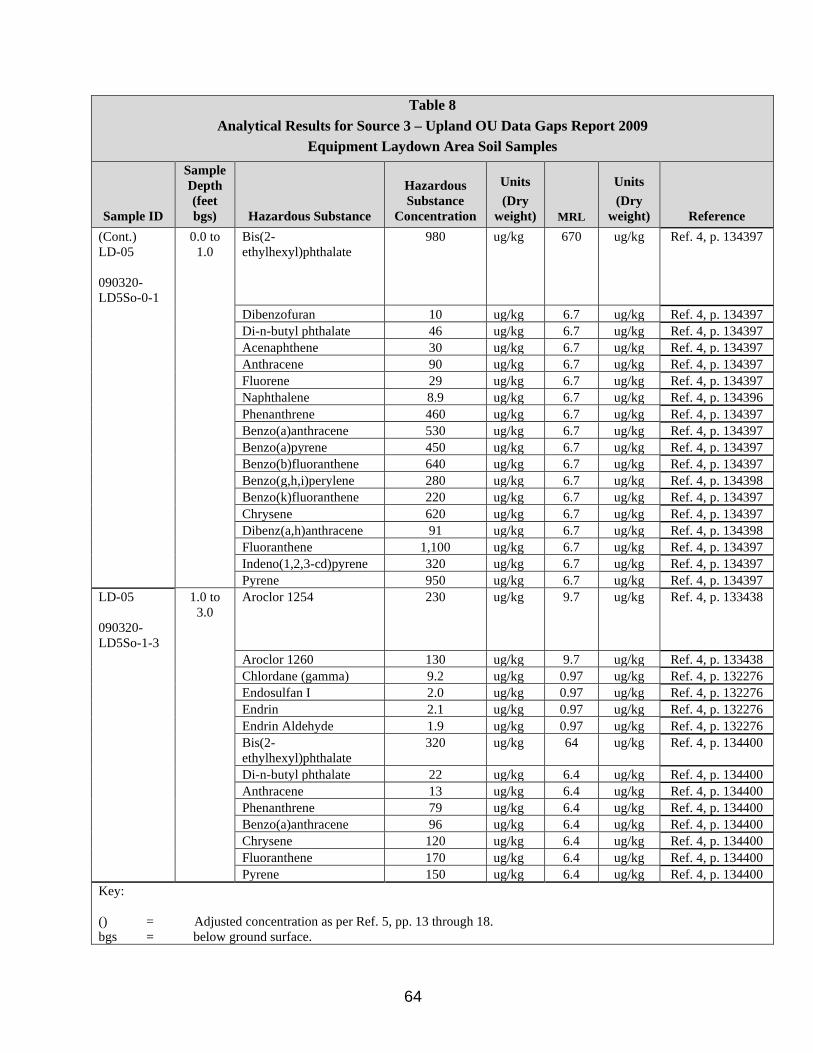
Table 8 Analytical Results for Source 3 – Upland OU Data Gaps Report 2009
Equipment Laydown Area Soil Samples
Sample ID
Sample Depth (feet bgs) Hazardous Substance
Hazardous Substance
Concentration
Units (Dry
weight) MRL
Units (Dry
weight) Reference (Cont.) LD-05
090320-LD5So-0-1
0.0 to 1.0
Bis(2-ethylhexyl)phthalate
980 ug/kg 670 ug/kg Ref. 4, p. 134397
Dibenzofuran 10 ug/kg 6.7 ug/kg Ref. 4, p. 134397 Di-n-butyl phthalate 46 ug/kg 6.7 ug/kg Ref. 4, p. 134397 Acenaphthene 30 ug/kg 6.7 ug/kg Ref. 4, p. 134397 Anthracene 90 ug/kg 6.7 ug/kg Ref. 4, p. 134397 Fluorene 29 ug/kg 6.7 ug/kg Ref. 4, p. 134397 Naphthalene 8.9 ug/kg 6.7 ug/kg Ref. 4, p. 134396 Phenanthrene 460 ug/kg 6.7 ug/kg Ref. 4, p. 134397 Benzo(a)anthracene 530 ug/kg 6.7 ug/kg Ref. 4, p. 134397 Benzo(a)pyrene 450 ug/kg 6.7 ug/kg Ref. 4, p. 134397 Benzo(b)fluoranthene 640 ug/kg 6.7 ug/kg Ref. 4, p. 134397 Benzo(g,h,i)perylene 280 ug/kg 6.7 ug/kg Ref. 4, p. 134398 Benzo(k)fluoranthene 220 ug/kg 6.7 ug/kg Ref. 4, p. 134397 Chrysene 620 ug/kg 6.7 ug/kg Ref. 4, p. 134397 Dibenz(a,h)anthracene 91 ug/kg 6.7 ug/kg Ref. 4, p. 134398 Fluoranthene 1,100 ug/kg 6.7 ug/kg Ref. 4, p. 134397 Indeno(1,2,3-cd)pyrene 320 ug/kg 6.7 ug/kg Ref. 4, p. 134397 Pyrene 950 ug/kg 6.7 ug/kg Ref. 4, p. 134397
LD-05
090320-LD5So-1-3
1.0 to 3.0
Aroclor 1254 230 ug/kg 9.7 ug/kg Ref. 4, p. 133438
Aroclor 1260 130 ug/kg 9.7 ug/kg Ref. 4, p. 133438 Chlordane (gamma) 9.2 ug/kg 0.97 ug/kg Ref. 4, p. 132276 Endosulfan I 2.0 ug/kg 0.97 ug/kg Ref. 4, p. 132276 Endrin 2.1 ug/kg 0.97 ug/kg Ref. 4, p. 132276 Endrin Aldehyde 1.9 ug/kg 0.97 ug/kg Ref. 4, p. 132276 Bis(2-ethylhexyl)phthalate
320 ug/kg 64 ug/kg Ref. 4, p. 134400
Di-n-butyl phthalate 22 ug/kg 6.4 ug/kg Ref. 4, p. 134400 Anthracene 13 ug/kg 6.4 ug/kg Ref. 4, p. 134400 Phenanthrene 79 ug/kg 6.4 ug/kg Ref. 4, p. 134400 Benzo(a)anthracene 96 ug/kg 6.4 ug/kg Ref. 4, p. 134400 Chrysene 120 ug/kg 6.4 ug/kg Ref. 4, p. 134400 Fluoranthene 170 ug/kg 6.4 ug/kg Ref. 4, p. 134400 Pyrene 150 ug/kg 6.4 ug/kg Ref. 4, p. 134400
Key:
() = bgs =
Adjusted concentration as per Ref. 5, pp. 13 through 18. below ground surface.
64
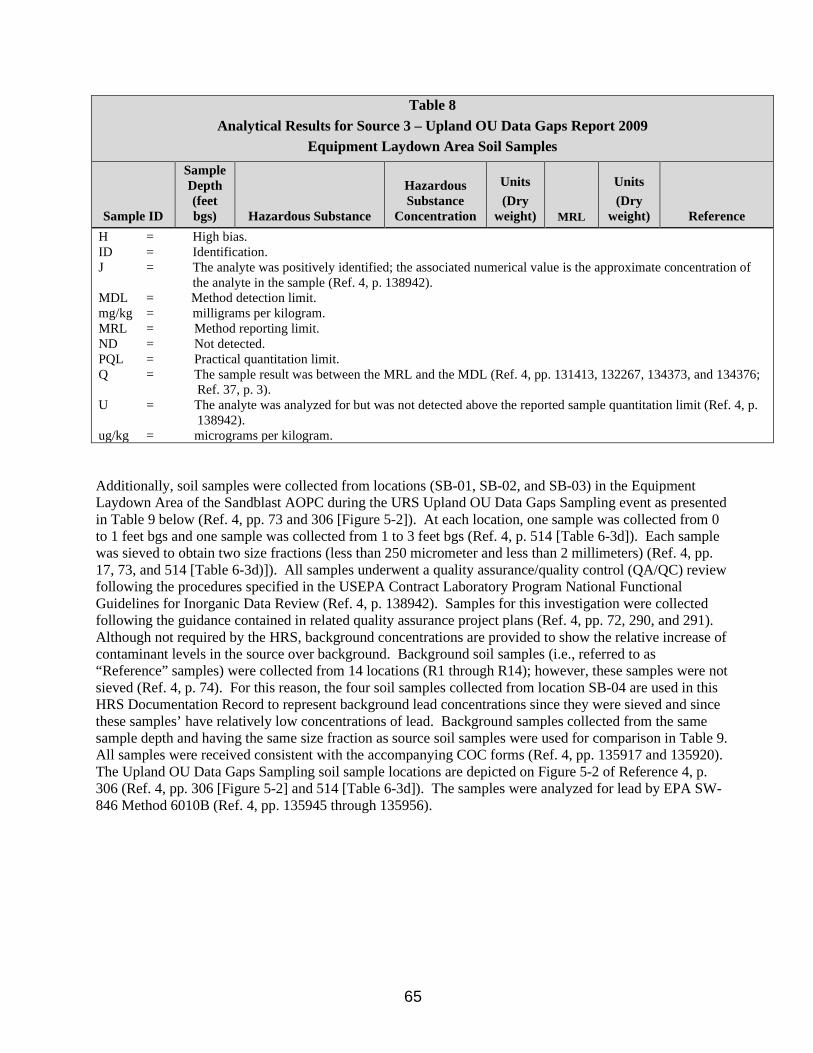
Table 8 Analytical Results for Source 3 – Upland OU Data Gaps Report 2009
Equipment Laydown Area Soil Samples
Sample ID
Sample Depth (feet bgs) Hazardous Substance
Hazardous Substance
Concentration
Units (Dry
weight) MRL
Units (Dry
weight) Reference H = ID = J =
MDL = mg/kg = MRL = ND = PQL = Q =
U =
ug/kg =
High bias. Identification. The analyte was positively identified; the associated numerical value is the approximate concentration of the analyte in the sample (Ref. 4, p. 138942). Method detection limit. milligrams per kilogram. Method reporting limit. Not detected. Practical quantitation limit. The sample result was between the MRL and the MDL (Ref. 4, pp. 131413, 132267, 134373, and 134376; Ref. 37, p. 3). The analyte was analyzed for but was not detected above the reported sample quantitation limit (Ref. 4, p. 138942). micrograms per kilogram.
Additionally, soil samples were collected from locations (SB-01, SB-02, and SB-03) in the Equipment Laydown Area of the Sandblast AOPC during the URS Upland OU Data Gaps Sampling event as presented in Table 9 below (Ref. 4, pp. 73 and 306 [Figure 5-2]). At each location, one sample was collected from 0 to 1 feet bgs and one sample was collected from 1 to 3 feet bgs (Ref. 4, p. 514 [Table 6-3d]). Each sample was sieved to obtain two size fractions (less than 250 micrometer and less than 2 millimeters) (Ref. 4, pp. 17, 73, and 514 [Table 6-3d)]). All samples underwent a quality assurance/quality control (QA/QC) review following the procedures specified in the USEPA Contract Laboratory Program National Functional Guidelines for Inorganic Data Review (Ref. 4, p. 138942). Samples for this investigation were collected following the guidance contained in related quality assurance project plans (Ref. 4, pp. 72, 290, and 291). Although not required by the HRS, background concentrations are provided to show the relative increase of contaminant levels in the source over background. Background soil samples (i.e., referred to as “Reference” samples) were collected from 14 locations (R1 through R14); however, these samples were not sieved (Ref. 4, p. 74). For this reason, the four soil samples collected from location SB-04 are used in this HRS Documentation Record to represent background lead concentrations since they were sieved and since these samples’ have relatively low concentrations of lead. Background samples collected from the same sample depth and having the same size fraction as source soil samples were used for comparison in Table 9. All samples were received consistent with the accompanying COC forms (Ref. 4, pp. 135917 and 135920). The Upland OU Data Gaps Sampling soil sample locations are depicted on Figure 5-2 of Reference 4, p. 306 (Ref. 4, pp. 306 [Figure 5-2] and 514 [Table 6-3d]). The samples were analyzed for lead by EPA SW-846 Method 6010B (Ref. 4, pp. 135945 through 135956).
65
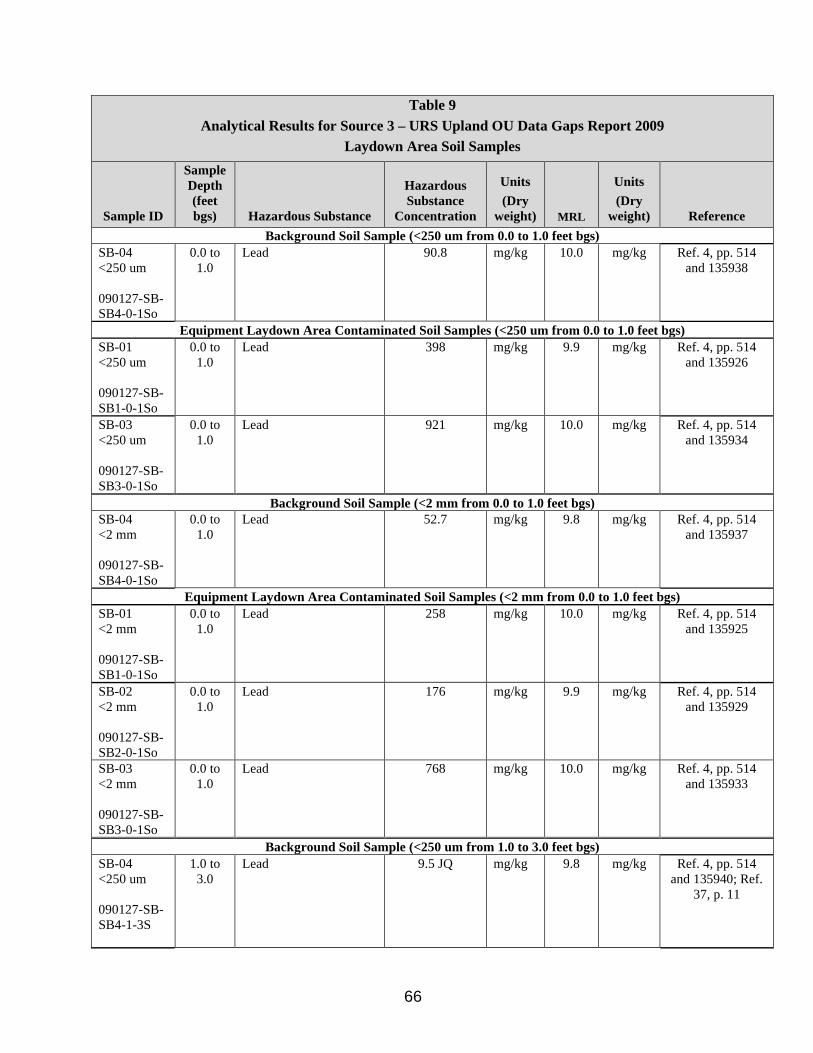
Table 9 Analytical Results for Source 3 – URS Upland OU Data Gaps Report 2009
Laydown Area Soil Samples
Sample ID
Sample Depth (feet bgs) Hazardous Substance
Hazardous Substance
Concentration
Units (Dry
weight) MRL
Units (Dry
weight) Reference Background Soil Sample (<250 um from 0.0 to 1.0 feet bgs)
SB-04 <250 um
090127-SB-SB4-0-1So
0.0 to 1.0
Lead 90.8 mg/kg 10.0 mg/kg Ref. 4, pp. 514 and 135938
Equipment Laydown Area Contaminated Soil Samples (<250 um from 0.0 to 1.0 feet bgs) SB-01 <250 um
090127-SB-SB1-0-1So
0.0 to 1.0
Lead 398 mg/kg 9.9 mg/kg Ref. 4, pp. 514 and 135926
SB-03 <250 um
090127-SB-SB3-0-1So
0.0 to 1.0
Lead 921 mg/kg 10.0 mg/kg Ref. 4, pp. 514 and 135934
Background Soil Sample (<2 mm from 0.0 to 1.0 feet bgs) SB-04 <2 mm
090127-SB-SB4-0-1So
0.0 to 1.0
Lead 52.7 mg/kg 9.8 mg/kg Ref. 4, pp. 514 and 135937
Equipment Laydown Area Contaminated Soil Samples (<2 mm from 0.0 to 1.0 feet bgs) SB-01 <2 mm
090127-SB-SB1-0-1So
0.0 to 1.0
Lead 258 mg/kg 10.0 mg/kg Ref. 4, pp. 514 and 135925
SB-02 <2 mm
090127-SB-SB2-0-1So
0.0 to 1.0
Lead 176 mg/kg 9.9 mg/kg Ref. 4, pp. 514 and 135929
SB-03 <2 mm
090127-SB-SB3-0-1So
0.0 to 1.0
Lead 768 mg/kg 10.0 mg/kg Ref. 4, pp. 514 and 135933
Background Soil Sample (<250 um from 1.0 to 3.0 feet bgs) SB-04 <250 um
090127-SB-SB4-1-3S
1.0 to 3.0
Lead 9.5 JQ mg/kg 9.8 mg/kg Ref. 4, pp. 514 and 135940; Ref.
37, p. 11
66
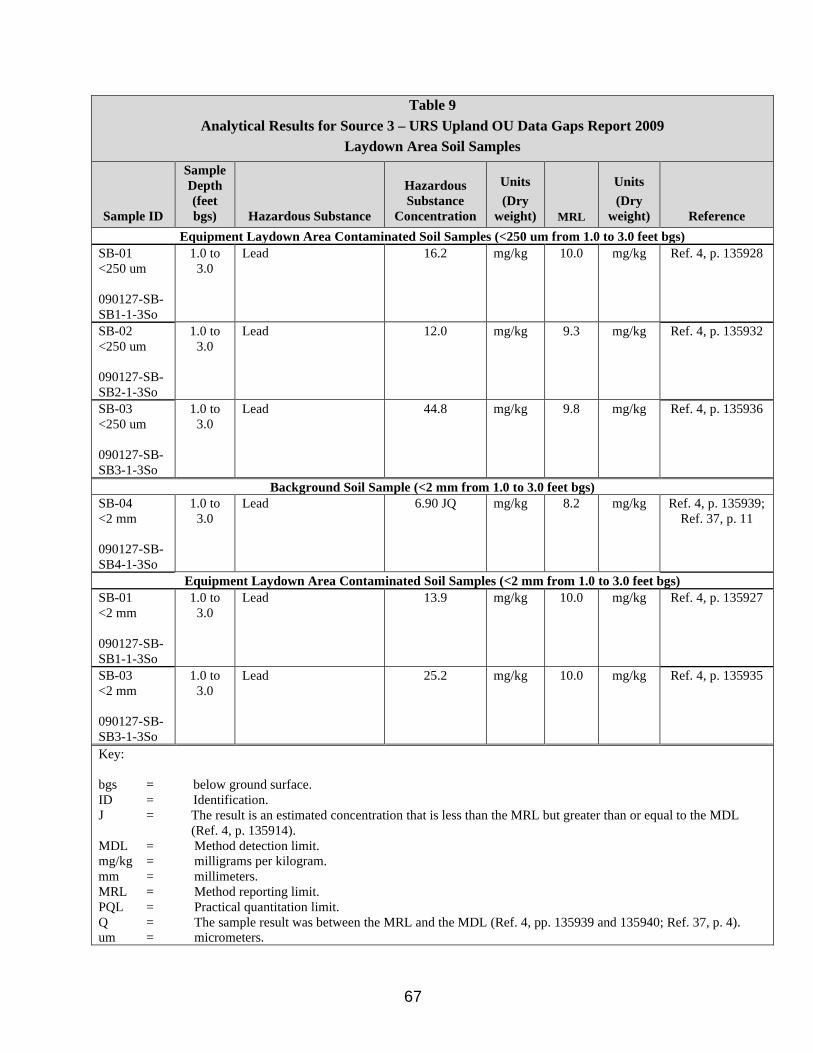
Table 9 Analytical Results for Source 3 – URS Upland OU Data Gaps Report 2009
Laydown Area Soil Samples
Sample ID
Sample Depth (feet bgs) Hazardous Substance
Hazardous Substance
Concentration
Units (Dry
weight) MRL
Units (Dry
weight) Reference Equipment Laydown Area Contaminated Soil Samples (<250 um from 1.0 to 3.0 feet bgs)
SB-01 <250 um
090127-SB-SB1-1-3So
1.0 to 3.0
Lead 16.2 mg/kg 10.0 mg/kg Ref. 4, p. 135928
SB-02 <250 um
090127-SB-SB2-1-3So
1.0 to 3.0
Lead 12.0 mg/kg 9.3 mg/kg Ref. 4, p. 135932
SB-03 <250 um
090127-SB-SB3-1-3So
1.0 to 3.0
Lead 44.8 mg/kg 9.8 mg/kg Ref. 4, p. 135936
Background Soil Sample (<2 mm from 1.0 to 3.0 feet bgs) SB-04 <2 mm
090127-SB-SB4-1-3So
1.0 to 3.0
Lead 6.90 JQ mg/kg 8.2 mg/kg Ref. 4, p. 135939; Ref. 37, p. 11
Equipment Laydown Area Contaminated Soil Samples (<2 mm from 1.0 to 3.0 feet bgs) SB-01 <2 mm
090127-SB-SB1-1-3So
1.0 to 3.0
Lead 13.9 mg/kg 10.0 mg/kg Ref. 4, p. 135927
SB-03 <2 mm
090127-SB-SB3-1-3So
1.0 to 3.0
Lead 25.2 mg/kg 10.0 mg/kg Ref. 4, p. 135935
Key:
bgs = ID = J =
MDL = mg/kg = mm = MRL = PQL = Q = um =
below ground surface. Identification. The result is an estimated concentration that is less than the MRL but greater than or equal to the MDL (Ref. 4, p. 135914). Method detection limit. milligrams per kilogram. millimeters. Method reporting limit. Practical quantitation limit. The sample result was between the MRL and the MDL (Ref. 4, pp. 135939 and 135940; Ref. 37, p. 4). micrometers.
67
List of Hazardous Substances Associated with Source
PCBs (Aroclor 1254 and Aroclor 1260), metals (cadmium, lead, mercury, and zinc), pesticides (4,4’-DDT, chlordane (gamma), endosulfan I, endosulfan sulfate, endrin, endrin aldehyde, and methoxychlor), SVOCs (acenaphthene, anthracene, benzo(a)anthracene, benzo(a)pyrene, benzo(b)fluoranthene, benzo(g,h,i)perylene, benzo(k)fluoranthene, bis(2-ethylhexyl)phthalate, chrysene, dibenz(a,h)anthracene, dibenzofuran, di-n-butyl phthalate, fluoranthene, fluorene, indeno(1,2,3-cd)pyrene, naphthalene, phenanthrene, and pyrene), and butyltins (di-n-butyltin, n-butyltin, and tri-n-butyltin).
Butyltins are pollutants/contaminants found at this site (see Table 8 of this HRS documentation record). Butyltins are a class of compounds that bioaccumulate in sediment and fish tissue and are known to have effects on human health and wildlife (Ref. 35, p. 63). One study found that rats whose mothers were exposed to tributyltin during pregnancy showed altered performance in some neurological tests conducted when they were young adults (Ref. 36, p. 27). Another study, also with tributyltin, found that exposure during gestation, lactation, and post-lactation affected some developmental landmarks in female rats (Ref. 36, p. 27). Dibutyltin, and tributyltin, when administered during pregnancy, have induced developmental and reproductive effects in rodents (Ref. 36, p. 33).
The EPA has developed risk-based residential soil RSLs for dibutyltin compounds (i.e., 19 mg/kg) and for tri-n-butyltin (i.e., 23 mg/kg) (Ref. 33, pp. 2, 7, and 15). The RSET has determined that tributyltin is a bioaccumulative chemical of concern in Oregon, including the Columbia River where it borders Oregon and Washington (Ref. 34, p. 142). RSET has proposed freshwater benthic screening levels for dibutyltin, monobutyltin, and tributyltin (Ref. 34, p. 190) and water quality-based screening levels for tributyltin (Ref. 34, p. 195).
68

SD – Hazardous Waste Quantity Source No.: 3
2.4.2 Hazardous Waste Quantity 2.4.2.1.1 Hazardous Constituent Quantity
The hazardous constituent quantity for Source No. 3 could not be adequately determined according to the HRS requirements; that is, the total mass of all Comprehensive Environmental Response, Compensation, and Liability Act (CERCLA) hazardous substances in the source is not known and cannot be estimated with reasonable confidence (Ref. 1, Section 2.4.2.1.1). There are insufficient historical and current data (Manifests, PRP records, State records, Permits, Waste concentration data, etc.) available to adequately calculate the total mass of all CERCLA hazardous substances in the source and the associated releases from the source. Therefore, there is insufficient information to evaluate the associated releases from the source to calculate the hazardous constituent quantity for Source No. 3 with reasonable confidence.
Hazardous Constituent Quantity Value (S): NS
2.4.2.1.2 Hazardous Wastestream Quantity
The hazardous wastestream quantity for Source No. 3 could not be adequately determined according to the HRS requirements; that is, the total mass of all hazardous wastestreams and CERCLA pollutants and contaminants in the source is not known and cannot be estimated with reasonable confidence (Ref. 1, Section 2.4.2.1.2). There are insufficient historical and current data (Manifests, PRP records, State records, permits, etc.) available to adequately calculate the total mass of all hazardous wastestreams and CERCLA pollutants and contaminants in the source and the associated releases from the source. Therefore, there is insufficient information to evaluate the associated releases from the source to calculate the hazardous wastestream quantity for Source No. 3 with reasonable confidence.
Hazardous Wastestream Quantity (W): NS
2.4.2.1.3 Volume Available data are insufficient to document a volume measure (Ref. 1, Section 2.4.2.1.3).
Volume Assigned Value (V): NS
2.4.2.1.4 Area
The area measure of the source is not known. As a conservative estimate, an area of greater than 0 is assigned (Ref. 1, Section 2.4.2.1.4).
Area Assigned Value (A): >0
Source Hazardous Waste Quantity Factor Value (Ref. 1, Section 2.4.2.1.5): >0
69

SD – Characterization and Containment
SOURCE DESCRIPTION
2.2 SOURCE CHARACTERIZATION
Number of the Source: 4
Name and description of the source: Bulb Slope AOPC (Contaminated Soil)
The Bulb Slope AOPC was identified during the removal of equipment offshore of Bradford Island in February and March of 2002 (Ref. 4, p. 52). The Bulb Slope AOPC consists of a fan-shaped accumulation of glass and electrical light bulb debris that extends over approximately 1,900 square feet of a steep slope between the Columbia River and the Landfill access road (Ref. 4, p. 52). The debris is concentrated in the center of the slope and the types of glass observed included internal/external light bulbs, fluorescent light bulbs, automobile light bulbs, 1- to 1.5-inch-diameter glass tubes, clear window pane glass, white-colored molded glass (possibly lamppost light covers), and miscellaneous glass beverage containers (Ref. 4, p. 52). Potential surface water runoff routes from upland portions of this source area are to the north toward the Columbia River (Ref. 4, p. 303 [Figure 4-1]). The base of the Bulb Slope AOPC is at an elevation of approximately 75 feet above mean sea level (amsl) (Ref. 4, p. 52). The normal operating range for the Bonneville pool is between 71.5 feet amsl elevation and 76.6 feet amsl as measured at the dam (Ref. 4, p. 52). Based on this information, the base of the Bulb Slope AOPC may be partially submerged during some periods (Ref. 4, p. 52).
In November 2002, a reconnaissance investigation of the Bulb Slope Area was conducted by URS (Ref. 4, pp. 69 and 290). During this investigation, soil samples were collected from eight locations (Ref. 4, pp. 69 and 308 [Figure 5-4]). These were locations Area A04, Area A05, Area B06, Area B07, Area C01, Area C02, Area C08, and Area C09 (Ref. 4, pp. 308 [Figure 5-4] and 483 [Table 5-7]). All samples were collected from 0.17 to 0.33 feet bgs, with the exception of sample Area C01 which was collected from 0.08 to 0.25 feet bgs (Ref. 4, p. 483 [Table 5-7]). The samples revealed the presence of PCBs and metals (Ref. 4, p. 483 [Table 5-7]) (see Table 10 of this HRS Documentation Record).
Location of the source, with reference to a map: The Bulb Slope AOPC is located on the eastern side of Bradford Island, Oregon (see Figure 5 of this HRS Documentation Record; Ref. 4, p. 297).
Containment Release to Surface Water via Overland Migration and/or Flood: A surface water containment factor value of 10 (Ref. 1, Table 4-2) is assigned because the Bulb Slope AOPC is vegetated or covered with organic debris (i.e., the source has no maintained engineered cover, or functioning and maintained run-on control system and runoff management system) (Ref. 4, p. 41).
Containment Factor Value: 10
70

SD – Hazardous Substances Source No.: 4
2.2.2 HAZARDOUS SUBSTANCES ASSOCIATED WITH THE SOURCE The RI report documents the investigation activities that have taken place over the past 10 years since the report was written (i.e., approximately the period from 2002 to 2012) (Ref. 4, p. 20); including new sampling work conducted during the RI in 2007 and 2009 to fill identified data gaps (Ref. 4, p. 72). The RI states that due to the relatively static physical environment of the Upland OU, environmental data collected over the past decade prior to the RI can be considered representative of current conditions (Ref. 4, p. 59). The RI report included laboratory data forms from these investigations as Appendix E. For this reason, the primary reference for information contained in tables within this section are taken from this appendix.
URS Bulb Slope Reconnaissance Investigation 2002
- Bulb Slope Area AOPC Source Samples: Soil samples were collected from eight locations (Area A04, Area A05, Area B06, Area B07, Area C01, Area C02, Area C08, and Area C09 in the Bulb Slope AOPC during the URS Bulb Slope Reconnaissance Investigation sampling event as presented in Table 10 below (Ref. 4, pp. 308 [Figure 5-4] and 483 [Table 5-7]). All samples were collected from 0.17 to 0.33 feet bgs, with the exception of sample Area C01 which was collected from 0.08 to 0.25 feet bgs (Ref. 4, p. 483 [Table 5-7]). All samples underwent a quality assurance/quality control (QA/QC) review following the procedures specified in the USEPA Contract Laboratory Program National Functional Guidelines for Organic Data Review and Inorganic Data Review (Ref. 4, p. 138823). Samples for this investigation were collected in accordance with a sampling and analysis plan (Ref. 4, p. 138823). The samples were analyzed for PCBs by EPA SW-846 Method 8082, total lead by EPA SW-846 6010, and total mercury by EPA SW-846 7471A (Ref. 4, p. 138823). The samples were received consistent with the accompanying COC forms (Ref. 4, pp. 5101 and 138824). Soil sample Area C09 is used in this HRS Documentation Record to represent background concentrations since the sample was collected within the same area as other Bulb Slope AOPC samples and due to the sample’s relatively low concentrations of contaminants (Ref. 4, p. 308 [Figure 5-4] and p. 483 [Table 5-7]). Although not required by the HRS, background concentrations are provided to show the relative increase of contaminant levels in the source over background. The URS Bulb Slope Reconnaissance Investigation soil sample locations are depicted on Figure 5-4 of Reference 4, p. 308.
Table 10 Analytical Results for Source 4 – Bulb Slope Reconnaissance Investigation 2002
Bulb Slope AOPC Soil Samples
Sample ID
Sample Depth
(feet bgs) Hazardous Substance
Hazardous Substance
Concentration
Units (Dry
weight) MDL/
RL
Units (Dry
weight) Reference Background Soil Samples
Area C09
021120BSC 09SS
0.17 to 0.33
Aroclor 1260 20 U ug/kg NR ug/kg Ref. 4, pp. 483 and 5120
Lead 25 mg/kg 3 mg/kg Ref. 4, p. 5142 Mercury 0.13 mg/kg 0.06 mg/kg Ref. 4, p. 5142
71
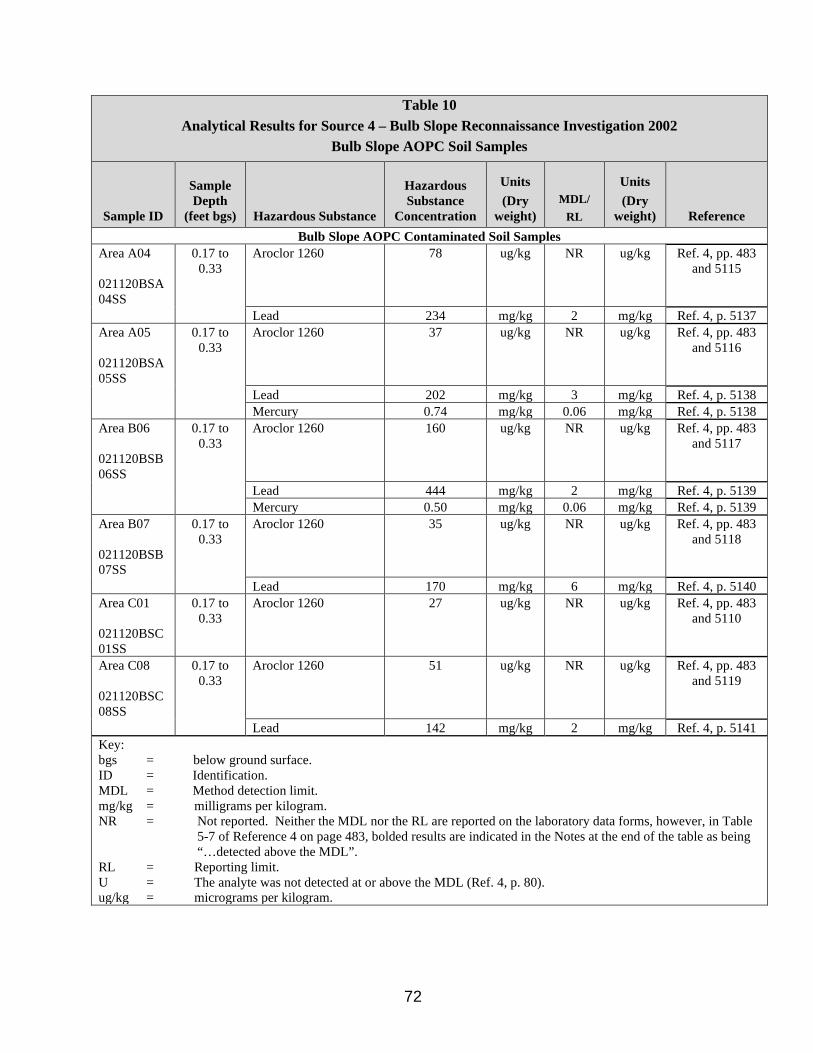
Table 10 Analytical Results for Source 4 – Bulb Slope Reconnaissance Investigation 2002
Bulb Slope AOPC Soil Samples
Sample ID
Sample Depth
(feet bgs) Hazardous Substance
Hazardous Substance
Concentration
Units (Dry
weight) MDL/
RL
Units (Dry
weight) Reference Bulb Slope AOPC Contaminated Soil Samples
Area A04
021120BSA 04SS
0.17 to 0.33
Aroclor 1260 78 ug/kg NR ug/kg Ref. 4, pp. 483 and 5115
Lead 234 mg/kg 2 mg/kg Ref. 4, p. 5137 Area A05
021120BSA 05SS
0.17 to 0.33
Aroclor 1260 37 ug/kg NR ug/kg Ref. 4, pp. 483 and 5116
Lead 202 mg/kg 3 mg/kg Ref. 4, p. 5138 Mercury 0.74 mg/kg 0.06 mg/kg Ref. 4, p. 5138
Area B06
021120BSB 06SS
0.17 to 0.33
Aroclor 1260 160 ug/kg NR ug/kg Ref. 4, pp. 483 and 5117
Lead 444 mg/kg 2 mg/kg Ref. 4, p. 5139 Mercury 0.50 mg/kg 0.06 mg/kg Ref. 4, p. 5139
Area B07
021120BSB 07SS
0.17 to 0.33
Aroclor 1260 35 ug/kg NR ug/kg Ref. 4, pp. 483 and 5118
Lead 170 mg/kg 6 mg/kg Ref. 4, p. 5140 Area C01
021120BSC 01SS
0.17 to 0.33
Aroclor 1260 27 ug/kg NR ug/kg Ref. 4, pp. 483 and 5110
Area C08
021120BSC 08SS
0.17 to 0.33
Aroclor 1260 51 ug/kg NR ug/kg Ref. 4, pp. 483 and 5119
Lead 142 mg/kg 2 mg/kg Ref. 4, p. 5141 Key: bgs = ID = MDL = mg/kg = NR =
RL = U = ug/kg =
below ground surface. Identification. Method detection limit. milligrams per kilogram. Not reported. Neither the MDL nor the RL are reported on the laboratory data forms, however, in Table 5-7 of Reference 4 on page 483, bolded results are indicated in the Notes at the end of the table as being “…detected above the MDL”. Reporting limit. The analyte was not detected at or above the MDL (Ref. 4, p. 80). micrograms per kilogram.
72
List of Hazardous Substances Associated with Source
PCBs (Aroclor 1260), lead, and mercury.
73
SD – Hazardous Waste Quantity Source No.: 4
2.4.2 Hazardous Waste Quantity 2.4.2.1.1 Hazardous Constituent Quantity The hazardous constituent quantity for Source No. 4 could not be adequately determined according to the HRS requirements; that is, the total mass of all Comprehensive Environmental Response, Compensation, and Liability Act (CERCLA) hazardous substances in the source is not known and cannot be estimated with reasonable confidence (Ref. 1, Section 2.4.2.1.1). There are insufficient historical and current data (Manifests, PRP records, State records, Permits, Waste concentration data, etc.) available to adequately calculate the total mass of all CERCLA hazardous substances in the source and the associated releases from the source. Therefore, there is insufficient information to evaluate the associated releases from the source to calculate the hazardous constituent quantity for Source No. 4 with reasonable confidence.
Hazardous Constituent Quantity Value (S): NS
2.4.2.1.2 Hazardous Wastestream Quantity The hazardous wastestream quantity for Source No. 4 could not be adequately determined according to the HRS requirements; that is, the total mass of all hazardous wastestreams and CERCLA pollutants and contaminants in the source is not known and cannot be estimated with reasonable confidence (Ref. 1, Section 2.4.2.1.2). There are insufficient historical and current data (Manifests, PRP records, State records, permits, etc.) available to adequately calculate the total mass of all hazardous wastestreams and CERCLA pollutants and contaminants in the source and the associated releases from the source. Therefore, there is insufficient information to evaluate the associated releases from the source to calculate the hazardous wastestream quantity for Source No. 4 with reasonable confidence.
Hazardous Wastestream Quantity (W): NS
2.4.2.1.3 Volume In November 2002, an investigation concluded that PCBs as Aroclor 1260, lead, and mercury were present in soils within the area of visually observed glass debris at the Bulb Slope AOPC (Ref. 4, pp. 69 and 70). At this time, it was estimated that approximately 95 to 125 cy of debris and impacted soil was present at the Bulb Slope AOPC on top of a bedrock base (Ref. 4, p. 70).
Using the lower estimated volume of 95 cy, the volume measure of the source is conservatively calculated to be 0.038 (i.e., 95 cy / 2,500 for contaminated soil) (Ref. 1, Section 2.4.2.1.3).
Volume Assigned Value (V): 0.038
2.4.2.1.4 Area
An area measure of 0 is assigned since the volume of the source could be estimated (Ref. 1, Section 2.4.2.1.4).
Area Assigned Value (A): 0
Source Hazardous Waste Quantity Factor Value (Ref. 1, Section 2.4.2.1.5): 0.038
74
SD – Characterization and Containment
SOURCE DESCRIPTION
2.2 SOURCE CHARACTERIZATION
Number of the Source: 5
Name and description of the source: River OU Former Debris Piles (other)
In October and November 2000, underwater dive surveys were conducted along the north shore of Bradford Island and numerous pieces of electrical equipment and other solid waste in three distinct piles (designated as Former Debris Piles #1, #2, and #3) were discovered in the Columbia River adjacent to the Landfill AOPC (Ref. 4, pp. 29, 53, and 70). The electrical equipment debris in piles #1 and #2 included PCB-containing light ballasts, lightning arresters, and electrical capacitors (Ref. 6, pp. 3 and 13 [Table 4-1]). Photographs of the types of electrical equipment recovered are included as Appendix B of Reference 6 (Ref. 6, pp. 25 through 36). PCB containing items were not recovered from Pile #3 (Ref. 6, p. 8). Since Piles #1 and #2 are the same source type, contain the same types of electrical equipment, are both within the Columbia River, and effect the same targets, they have been aggregated into one source for the purposes of this HRS Documentation Record.
The electrical debris contaminated the surrounding sediment with PCBs, PAHs, and metals (Ref. 4, p. 53; Ref. 6, pp. 3 and 15 [Table 5-2]). The removal of equipment and debris from the Columbia River along the north shore of Bradford Island took place in December 2000 and in February and March 2002 (Ref. 6, pp. 3 and 11). Approximately 32 tons of solid waste was removed and disposed of off-site including four 55-gallon drums of PCB-containing electrical debris (Ref. 4, p. 11). Prior to removing items, the type of item was identified and assessed as to whether the item could contain liquids (e.g., inerteen capacitors) or contained solid PCBs (e.g., lighting ballasts), and whether the item was damaged (Ref. 6, p. 6). Samples of recovered equipment were collected to determine disposal options and these samples contained Aroclor 1248, Aroclor 1254, and Aroclor 1268 (Ref. 6, pp. 10 and 16 [Table 5-3]) (See Table 11 of this HRS Documentation Record). Figure 2-2 on page 19 of Reference 6 depicts the historic in-water locations of three former debris piles. Sediments adjacent to damaged items were removed using a small hydraulic pump fitted to a hose (Ref. 6, p. 6). Sediment samples collected from drums of sediment recovered within Debris Pile #1 contained between 116,000 to 1,440,000 ug/kg Aroclor 1254 (Ref. 6, pp. 10 and 15 [Table 5-2]). Sediment samples collected from drums of sediment recovered within Debris Pile #2 contained 149 and 286 ug/kg Aroclor 1254 (Ref. 6, pp. 10 and 15 [Table 5-2]).
Following the removal of electrical equipment debris from the Columbia River, investigations were completed in 2002 and 2003 to assess the extent of sediment-related impacts from the waste-related items (Ref. 4, p. 70). Aroclor 1254 was found to be present in 77 sediment samples (S1-29 through S1-42, S1-44 through S1-52, S2-53 through S2-78, and TR-1 through TR-28; see Reference 14, Figure 6-1 on page 92 and Reference 7, Figure 5-1B on page 212 for sample locations) collected near the former debris piles at concentrations ranging from 1 to 690,000 ug/kg (Ref. 14, pp. 42, 77 [Table 6-6], and 240 [Table B-1). Aroclor 1254 was not detected above method detection limits (i.e., ranging from <0.05 to <1.16 ug/kg) in 20 sediment samples (RF-91 through RF-100; see Reference 14, Figure 6-2 on page 93 for sample locations) collected from upstream, reference locations (Ref. 14, pp. 42, 79 [Table 6-8], and 241 [Table B-1]). These results indicated that the source of PCBs to Forebay sediments was the former debris found in the waste piles (Pile #1, #2, and #3) (Ref. 14, p. 8). Some of the PCB-contaminated sediment associated with the former debris piles was removed in 2007 (Ref. 4, p. 53). See Section 4.1.2.1.1, Observed Release, of this HRS Documentation Record for documentation of residual Forebay sediment contamination based on sampling events conducted after sediment removal activities.
75

Location of the source, with reference to a map: The River OU Former Debris Piles were located on the northern shore of Bradford Island and within the Columbia River (see Figure 5 of this HRS Documentation Record; Ref. 6, p. 19 [Figure 2-2]).
Containment Release to Surface Water via Overland Migration and/or Flood: A surface water containment factor value of 10 (Ref. 1, Table 4-2) is assigned because former Debris Piles #1 and #2 were present within the Columbia River and have caused sediment contamination (Ref. 6, p. 11).
Containment Factor Value: 10
76
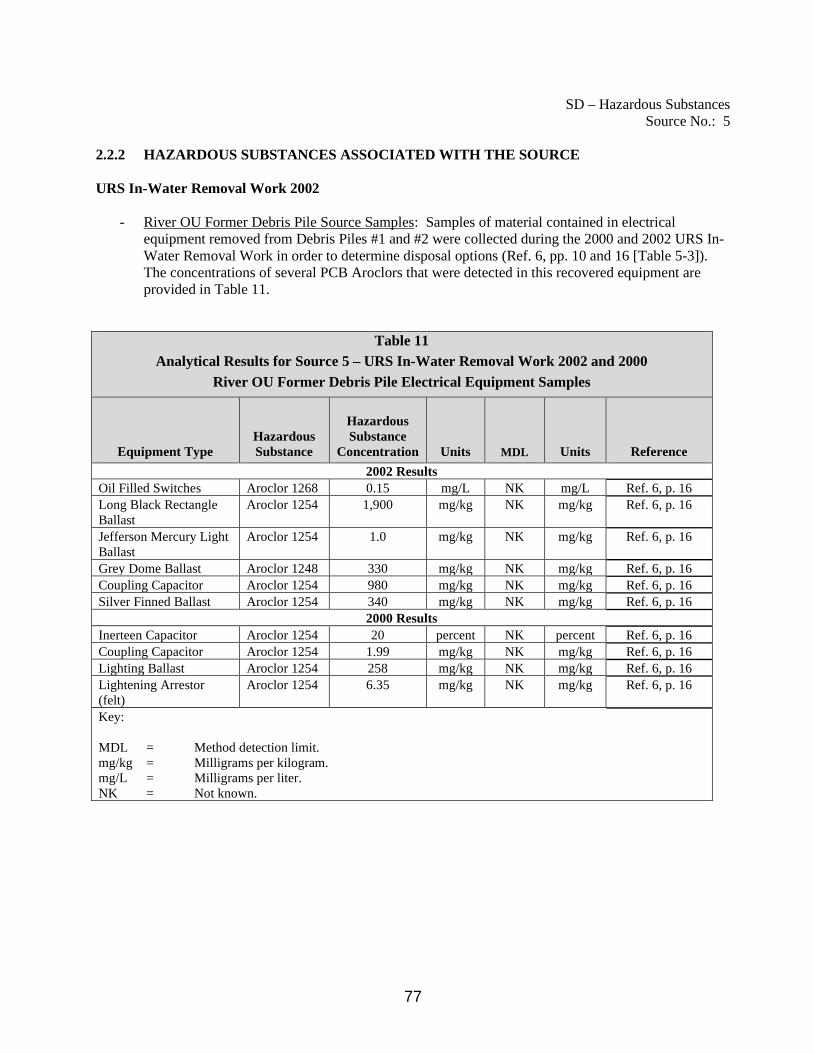
SD – Hazardous Substances Source No.: 5
2.2.2 HAZARDOUS SUBSTANCES ASSOCIATED WITH THE SOURCE
URS In-Water Removal Work 2002
- River OU Former Debris Pile Source Samples: Samples of material contained in electrical equipment removed from Debris Piles #1 and #2 were collected during the 2000 and 2002 URS In-Water Removal Work in order to determine disposal options (Ref. 6, pp. 10 and 16 [Table 5-3]). The concentrations of several PCB Aroclors that were detected in this recovered equipment are provided in Table 11.
Table 11 Analytical Results for Source 5 – URS In-Water Removal Work 2002 and 2000
River OU Former Debris Pile Electrical Equipment Samples
Equipment Type Hazardous Substance
Hazardous Substance
Concentration Units MDL Units Reference 2002 Results
Oil Filled Switches Aroclor 1268 0.15 mg/L NK mg/L Ref. 6, p. 16 Long Black Rectangle Ballast
Aroclor 1254 1,900 mg/kg NK mg/kg Ref. 6, p. 16
Jefferson Mercury Light Ballast
Aroclor 1254 1.0 mg/kg NK mg/kg Ref. 6, p. 16
Grey Dome Ballast Aroclor 1248 330 mg/kg NK mg/kg Ref. 6, p. 16 Coupling Capacitor Aroclor 1254 980 mg/kg NK mg/kg Ref. 6, p. 16 Silver Finned Ballast Aroclor 1254 340 mg/kg NK mg/kg Ref. 6, p. 16
2000 Results Inerteen Capacitor Aroclor 1254 20 percent NK percent Ref. 6, p. 16 Coupling Capacitor Aroclor 1254 1.99 mg/kg NK mg/kg Ref. 6, p. 16 Lighting Ballast Aroclor 1254 258 mg/kg NK mg/kg Ref. 6, p. 16 Lightening Arrestor (felt)
Aroclor 1254 6.35 mg/kg NK mg/kg Ref. 6, p. 16
Key:
MDL = Method detection limit. mg/kg = Milligrams per kilogram. mg/L = Milligrams per liter. NK = Not known.
77
List of Hazardous Substances Associated with Source
PCBs (Aroclor 1248, Aroclor 1254, and Aroclor 1268).
78
SD – Hazardous Waste Quantity Source No.: 5
2.4.2 Hazardous Waste Quantity 2.4.2.1.1 Hazardous Constituent Quantity
The hazardous constituent quantity for Source No. 5 could not be adequately determined according to the HRS requirements; that is, the total mass of all Comprehensive Environmental Response, Compensation, and Liability Act (CERCLA) hazardous substances in the source is not known and cannot be estimated with reasonable confidence (Ref. 1, Section 2.4.2.1.1). There are insufficient historical and current data (Manifests, PRP records, State records, Permits, Waste concentration data, etc.) available to adequately calculate the total mass of all CERCLA hazardous substances in the source and the associated releases from the source. Therefore, there is insufficient information to evaluate the associated releases from the source to calculate the hazardous constituent quantity for Source No. 5 with reasonable confidence.
Hazardous Constituent Quantity Value (S): NS
2.4.2.1.2 Hazardous Wastestream Quantity
The hazardous wastestream quantity for Source No. 5 could not be adequately determined according to the HRS requirements; that is, the total mass of all hazardous wastestreams and CERCLA pollutants and contaminants in the source is not known and cannot be estimated with reasonable confidence (Ref. 1, Section 2.4.2.1.2). There are insufficient historical and current data (Manifests, PRP records, State records, permits, etc.) available to adequately calculate the total mass of all hazardous wastestreams and CERCLA pollutants and contaminants in the source and the associated releases from the source. Therefore, there is insufficient information to evaluate the associated releases from the source to calculate the hazardous wastestream quantity for Source No. 5 with reasonable confidence.
Hazardous Wastestream Quantity (W): NS
2.4.2.1.3 Volume
Four 55-gallon drums of PCB-containing electrical debris were removed from the Columbia River (Ref. 6, p. 11). The volume measure of the source is not known. As a conservative estimate, a volume of greater than 0 is assigned (Ref. 1, Section 2.4.2.1.3).
Volume Assigned Value (V): >0
2.4.2.1.4 Area
An area measure of 0 is assigned since the volume of the source could be determined (Ref. 1, Sections 2.4.2.1.3 and 2.4.2.1.4).
Area Assigned Value (A): 0
Source Hazardous Waste Quantity Factor Value (Ref. 1, Section 2.4.2.1.5): >0
79
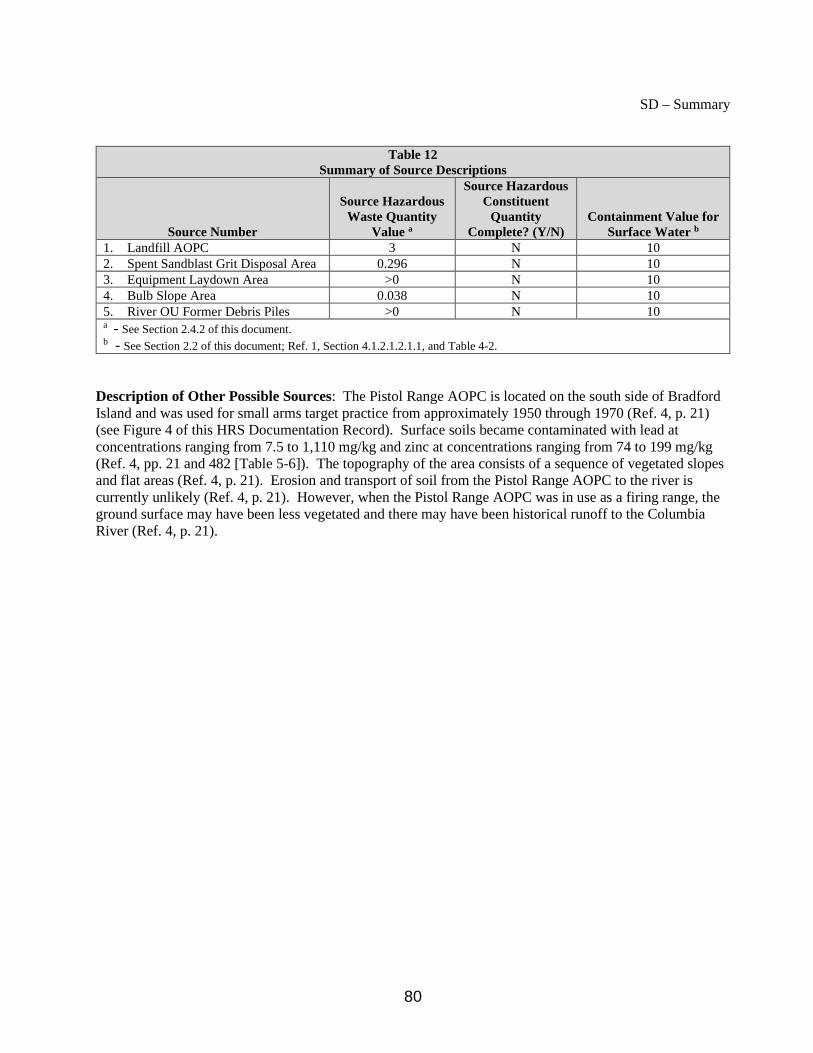
SD – Summary
Table 12 Summary of Source Descriptions
Source Number
Source Hazardous Waste Quantity
Value a
Source Hazardous Constituent
Quantity Complete? (Y/N)
Containment Value for Surface Water b
1. Landfill AOPC 3 N 10 2. Spent Sandblast Grit Disposal Area 0.296 N 10 3. Equipment Laydown Area >0 N 10 4. Bulb Slope Area 0.038 N 10 5. River OU Former Debris Piles >0 N 10 a - See Section 2.4.2 of this document. b - See Section 2.2 of this document; Ref. 1, Section 4.1.2.1.2.1.1, and Table 4-2.
Description of Other Possible Sources: The Pistol Range AOPC is located on the south side of Bradford Island and was used for small arms target practice from approximately 1950 through 1970 (Ref. 4, p. 21) (see Figure 4 of this HRS Documentation Record). Surface soils became contaminated with lead at concentrations ranging from 7.5 to 1,110 mg/kg and zinc at concentrations ranging from 74 to 199 mg/kg (Ref. 4, pp. 21 and 482 [Table 5-6]). The topography of the area consists of a sequence of vegetated slopes and flat areas (Ref. 4, p. 21). Erosion and transport of soil from the Pistol Range AOPC to the river is currently unlikely (Ref. 4, p. 21). However, when the Pistol Range AOPC was in use as a firing range, the ground surface may have been less vegetated and there may have been historical runoff to the Columbia River (Ref. 4, p. 21).
80
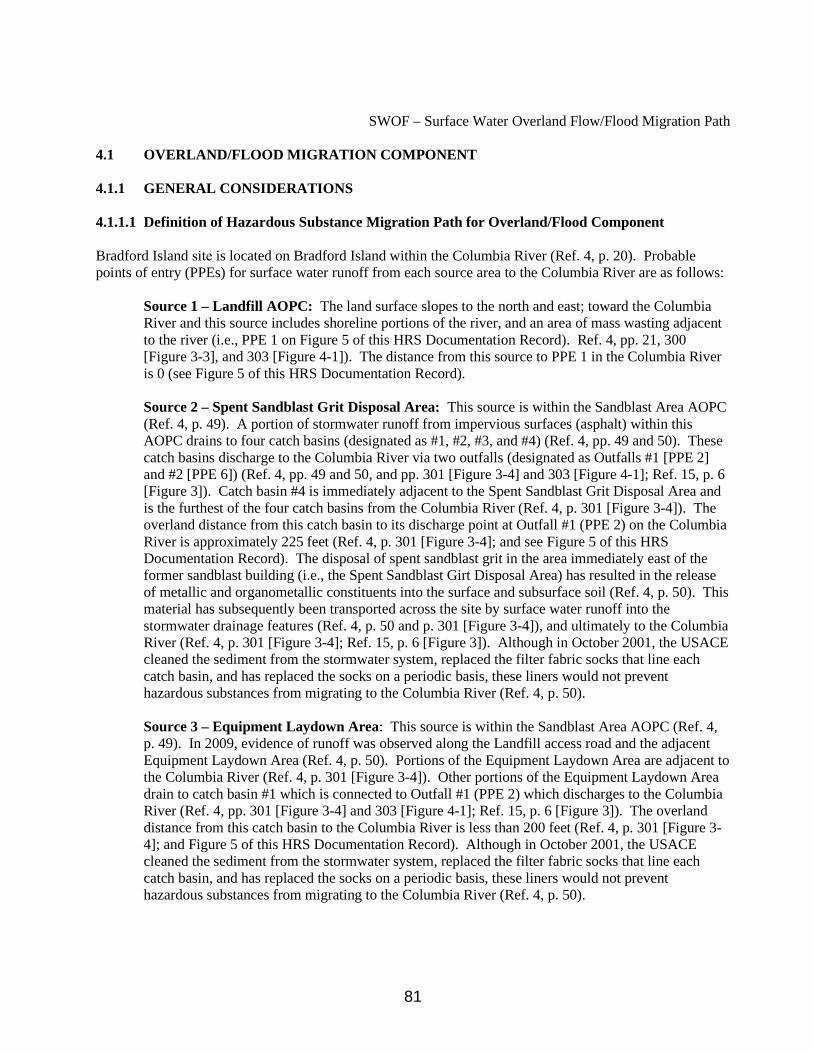
SWOF – Surface Water Overland Flow/Flood Migration Path
4.1 OVERLAND/FLOOD MIGRATION COMPONENT
4.1.1 GENERAL CONSIDERATIONS
4.1.1.1 Definition of Hazardous Substance Migration Path for Overland/Flood Component
Bradford Island site is located on Bradford Island within the Columbia River (Ref. 4, p. 20). Probable points of entry (PPEs) for surface water runoff from each source area to the Columbia River are as follows:
Source 1 – Landfill AOPC: The land surface slopes to the north and east; toward the Columbia River and this source includes shoreline portions of the river, and an area of mass wasting adjacent to the river (i.e., PPE 1 on Figure 5 of this HRS Documentation Record). Ref. 4, pp. 21, 300 [Figure 3-3], and 303 [Figure 4-1]). The distance from this source to PPE 1 in the Columbia River is 0 (see Figure 5 of this HRS Documentation Record).
Source 2 – Spent Sandblast Grit Disposal Area: This source is within the Sandblast Area AOPC (Ref. 4, p. 49). A portion of stormwater runoff from impervious surfaces (asphalt) within this AOPC drains to four catch basins (designated as #1, #2, #3, and #4) (Ref. 4, pp. 49 and 50). These catch basins discharge to the Columbia River via two outfalls (designated as Outfalls #1 [PPE 2] and #2 [PPE 6]) (Ref. 4, pp. 49 and 50, and pp. 301 [Figure 3-4] and 303 [Figure 4-1]; Ref. 15, p. 6 [Figure 3]). Catch basin #4 is immediately adjacent to the Spent Sandblast Grit Disposal Area and is the furthest of the four catch basins from the Columbia River (Ref. 4, p. 301 [Figure 3-4]). The overland distance from this catch basin to its discharge point at Outfall #1 (PPE 2) on the Columbia River is approximately 225 feet (Ref. 4, p. 301 [Figure 3-4]; and see Figure 5 of this HRS Documentation Record). The disposal of spent sandblast grit in the area immediately east of the former sandblast building (i.e., the Spent Sandblast Girt Disposal Area) has resulted in the release of metallic and organometallic constituents into the surface and subsurface soil (Ref. 4, p. 50). This material has subsequently been transported across the site by surface water runoff into the stormwater drainage features (Ref. 4, p. 50 and p. 301 [Figure 3-4]), and ultimately to the Columbia River (Ref. 4, p. 301 [Figure 3-4]; Ref. 15, p. 6 [Figure 3]). Although in October 2001, the USACE cleaned the sediment from the stormwater system, replaced the filter fabric socks that line each catch basin, and has replaced the socks on a periodic basis, these liners would not prevent hazardous substances from migrating to the Columbia River (Ref. 4, p. 50).
Source 3 – Equipment Laydown Area: This source is within the Sandblast Area AOPC (Ref. 4, p. 49). In 2009, evidence of runoff was observed along the Landfill access road and the adjacentEquipment Laydown Area (Ref. 4, p. 50). Portions of the Equipment Laydown Area are adjacent tothe Columbia River (Ref. 4, p. 301 [Figure 3-4]). Other portions of the Equipment Laydown Areadrain to catch basin #1 which is connected to Outfall #1 (PPE 2) which discharges to the ColumbiaRiver (Ref. 4, pp. 301 [Figure 3-4] and 303 [Figure 4-1]; Ref. 15, p. 6 [Figure 3]). The overlanddistance from this catch basin to the Columbia River is less than 200 feet (Ref. 4, p. 301 [Figure 3-4]; and Figure 5 of this HRS Documentation Record). Although in October 2001, the USACEcleaned the sediment from the stormwater system, replaced the filter fabric socks that line eachcatch basin, and has replaced the socks on a periodic basis, these liners would not preventhazardous substances from migrating to the Columbia River (Ref. 4, p. 50).
81
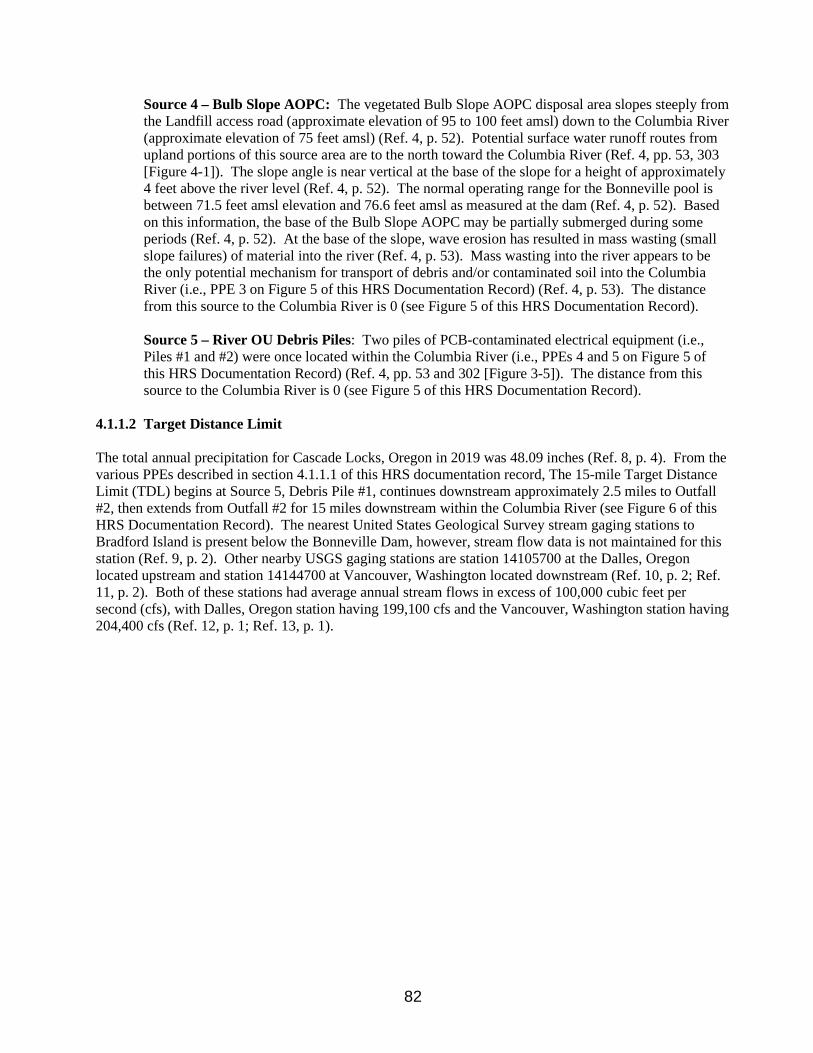
Source 4 – Bulb Slope AOPC: The vegetated Bulb Slope AOPC disposal area slopes steeply from the Landfill access road (approximate elevation of 95 to 100 feet amsl) down to the Columbia River (approximate elevation of 75 feet amsl) (Ref. 4, p. 52). Potential surface water runoff routes from upland portions of this source area are to the north toward the Columbia River (Ref. 4, pp. 53, 303 [Figure 4-1]). The slope angle is near vertical at the base of the slope for a height of approximately 4 feet above the river level (Ref. 4, p. 52). The normal operating range for the Bonneville pool is between 71.5 feet amsl elevation and 76.6 feet amsl as measured at the dam (Ref. 4, p. 52). Based on this information, the base of the Bulb Slope AOPC may be partially submerged during some periods (Ref. 4, p. 52). At the base of the slope, wave erosion has resulted in mass wasting (small slope failures) of material into the river (Ref. 4, p. 53). Mass wasting into the river appears to be the only potential mechanism for transport of debris and/or contaminated soil into the Columbia River (i.e., PPE 3 on Figure 5 of this HRS Documentation Record) (Ref. 4, p. 53). The distance from this source to the Columbia River is 0 (see Figure 5 of this HRS Documentation Record).
Source 5 – River OU Debris Piles: Two piles of PCB-contaminated electrical equipment (i.e., Piles #1 and #2) were once located within the Columbia River (i.e., PPEs 4 and 5 on Figure 5 of this HRS Documentation Record) (Ref. 4, pp. 53 and 302 [Figure 3-5]). The distance from this source to the Columbia River is 0 (see Figure 5 of this HRS Documentation Record).
4.1.1.2 Target Distance Limit
The total annual precipitation for Cascade Locks, Oregon in 2019 was 48.09 inches (Ref. 8, p. 4). From the various PPEs described in section 4.1.1.1 of this HRS documentation record, The 15-mile Target Distance Limit (TDL) begins at Source 5, Debris Pile #1, continues downstream approximately 2.5 miles to Outfall #2, then extends from Outfall #2 for 15 miles downstream within the Columbia River (see Figure 6 of this HRS Documentation Record). The nearest United States Geological Survey stream gaging stations to Bradford Island is present below the Bonneville Dam, however, stream flow data is not maintained for this station (Ref. 9, p. 2). Other nearby USGS gaging stations are station 14105700 at the Dalles, Oregon located upstream and station 14144700 at Vancouver, Washington located downstream (Ref. 10, p. 2; Ref. 11, p. 2). Both of these stations had average annual stream flows in excess of 100,000 cubic feet per second (cfs), with Dalles, Oregon station having 199,100 cfs and the Vancouver, Washington station having 204,400 cfs (Ref. 12, p. 1; Ref. 13, p. 1).
82
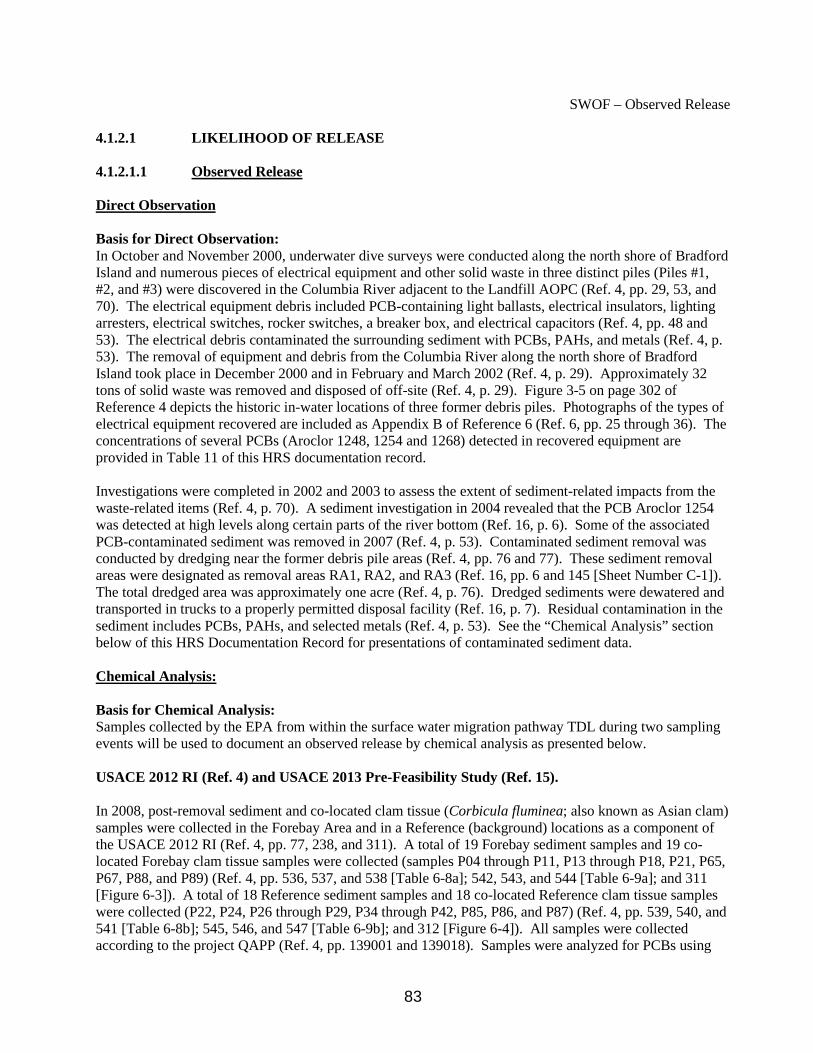
SWOF – Observed Release
4.1.2.1 LIKELIHOOD OF RELEASE
4.1.2.1.1 Observed Release
Direct Observation
Basis for Direct Observation: In October and November 2000, underwater dive surveys were conducted along the north shore of Bradford Island and numerous pieces of electrical equipment and other solid waste in three distinct piles (Piles #1, #2, and #3) were discovered in the Columbia River adjacent to the Landfill AOPC (Ref. 4, pp. 29, 53, and 70). The electrical equipment debris included PCB-containing light ballasts, electrical insulators, lighting arresters, electrical switches, rocker switches, a breaker box, and electrical capacitors (Ref. 4, pp. 48 and 53). The electrical debris contaminated the surrounding sediment with PCBs, PAHs, and metals (Ref. 4, p. 53). The removal of equipment and debris from the Columbia River along the north shore of Bradford Island took place in December 2000 and in February and March 2002 (Ref. 4, p. 29). Approximately 32 tons of solid waste was removed and disposed of off-site (Ref. 4, p. 29). Figure 3-5 on page 302 of Reference 4 depicts the historic in-water locations of three former debris piles. Photographs of the types of electrical equipment recovered are included as Appendix B of Reference 6 (Ref. 6, pp. 25 through 36). The concentrations of several PCBs (Aroclor 1248, 1254 and 1268) detected in recovered equipment are provided in Table 11 of this HRS documentation record.
Investigations were completed in 2002 and 2003 to assess the extent of sediment-related impacts from the waste-related items (Ref. 4, p. 70). A sediment investigation in 2004 revealed that the PCB Aroclor 1254 was detected at high levels along certain parts of the river bottom (Ref. 16, p. 6). Some of the associated PCB-contaminated sediment was removed in 2007 (Ref. 4, p. 53). Contaminated sediment removal was conducted by dredging near the former debris pile areas (Ref. 4, pp. 76 and 77). These sediment removal areas were designated as removal areas RA1, RA2, and RA3 (Ref. 16, pp. 6 and 145 [Sheet Number C-1]). The total dredged area was approximately one acre (Ref. 4, p. 76). Dredged sediments were dewatered and transported in trucks to a properly permitted disposal facility (Ref. 16, p. 7). Residual contamination in the sediment includes PCBs, PAHs, and selected metals (Ref. 4, p. 53). See the “Chemical Analysis” section below of this HRS Documentation Record for presentations of contaminated sediment data.
Chemical Analysis:
Basis for Chemical Analysis: Samples collected by the EPA from within the surface water migration pathway TDL during two sampling events will be used to document an observed release by chemical analysis as presented below.
USACE 2012 RI (Ref. 4) and USACE 2013 Pre-Feasibility Study (Ref. 15).
In 2008, post-removal sediment and co-located clam tissue (Corbicula fluminea; also known as Asian clam) samples were collected in the Forebay Area and in a Reference (background) locations as a component of the USACE 2012 RI (Ref. 4, pp. 77, 238, and 311). A total of 19 Forebay sediment samples and 19 co-located Forebay clam tissue samples were collected (samples P04 through P11, P13 through P18, P21, P65, P67, P88, and P89) (Ref. 4, pp. 536, 537, and 538 [Table 6-8a]; 542, 543, and 544 [Table 6-9a]; and 311 [Figure 6-3]). A total of 18 Reference sediment samples and 18 co-located Reference clam tissue samples were collected (P22, P24, P26 through P29, P34 through P42, P85, P86, and P87) (Ref. 4, pp. 539, 540, and 541 [Table 6-8b]; 545, 546, and 547 [Table 6-9b]; and 312 [Figure 6-4]). All samples were collected according to the project QAPP (Ref. 4, pp. 139001 and 139018). Samples were analyzed for PCBs using
83
EPA SW-846 Method 8082, SVOCs using EPA SW-846 Method 8270, and grain size using PSEP (sediment only), among other analyses (Ref. 4, pp. 139001 and 139002). Data results were reviewed in accordance with EPA’s Contract Laboratory Program National Functional Guidelines for Organic Data Review (Ref. 4, pp. 139002, 139012, 139019, and 139030). All samples were maintained under proper COC (Ref. 4, pp. 79461, 79462, 90272, 90274, 90276, 91618, 91619, 91620, 139003, 139012, and 139020).
Analytical results from the 2008 RI indicate the presence of Aroclor-1254 and bis(2-ethylhexyl)phthalate at elevated concentrations in sediment samples collected from the Forebay Area with respect to background concentrations based on the highest concentrations of these analytes in the background sediment samples; regardless of grain size (see Table 13 for reference citations). Additionally, analytical results indicate the presence of Aroclor-1254 at elevated concentrations in the clam tissue samples collected from the Forebay Area with respect to background concentrations based on the highest concentration of this analyte in the background clam tissue samples (see Table 14 for reference citations). Many of the Forebay Area clam tissue samples contained the SVOCs benzo(a)pyrene, benzo(b)fluoranthene, and pyrene at concentrations that may be elevated with respect to background concentrations; however, since the MRLs associated with the background clam tissue samples were generally about five times higher than the MRLs associated the Forebay Area clam tissue samples, observed releases for these analytes could not be confirmed (see Reference 4 sample numbers in Table 6-7b [page 535] and Table 6-9a [pages 542, 543, and 544] and corresponding laboratory data sheets for background and Forebay Area clam tissue samples on pages 78537, 78538, 78540, 78541, 78542, 78545, 78546, 78547, 81077 through 81083, 81085 through 81092, 81094, 81790, 81791, 83672, and 83675).
In 2011, URS collected sediment, clam (Corbicula fluminea; also known as Asian clam) tissue, and smallmouth bass (Micropterus dolomieu) tissue samples from the Forebay Area and smallmouth bass from the Reference Area in support of a 2013 pre-feasibility study on behalf the USACE (Ref. 15, pp. 1, 80 through 86). In total seven sediment samples (P112 through P118) were collected and co-located clam tissue samples were collected and analyzed at locations P112 through P115 and at location P118 (Ref. 15, pp. 6 [Figure 3], 12 [Table 3], and 13 [Table 4]; Ref. 7, p. 212 [Figure 1-5B]). Regarding smallmouth bass, nineteen locations were sampled in the Forebay Area (62 through 65, 67 through 74, 76, 78, 79, and 81 through 84) and 19 locations were sampled in the Reference Area (39, 41 through 50, 52, and 55 through 61) (Ref. 15, pp. 4 [Figure 1], 5 [Figure 2], 8 and 9 [Table 1], and 10 and 11 [Table 2]). All samples were collected in accordance with a QAPP (Ref. 15, p. 29). Samples were analyzed for PCBs using EPA SW-846 Method 8082, metals using EPA SW-846 6000/7000 series, total mercury using EPA SW-846 7471A, SVOCs using EPA SW-846 8270C/8270D-SIM, pesticides using EPA SW-846 Method 8081, butyltins using CAS SOP, and grain size (sediments only) using PSEP, among other analyses (Ref. 15, pp. 30 and 43 through 46). Data results were reviewed in accordance with EPA’s Contract Laboratory Program National Functional Guidelines for Organic Data Review and EPA’s National Functional Guidelines for Inorganic Superfund Data Review (Ref. 15, pp. 30 and 31). All samples were maintained under proper COC (Ref. 15, pp. 31). Since reference sediment and clam tissue samples were not collected during this investigation, the reference samples from the 2008 RI sampling are used for comparison to the 2011 pre-feasibility study results and these sample results have been included in Tables 13 and 14 below.
Analytical results from the 2011 pre-feasibility sampling event indicate the presence of Aroclor-1254 at elevated concentrations in sediment samples collected from the Forebay Area with respect to background concentrations based on the highest concentrations of these analytes in the background sediment samples; regardless of grain size (see Table 13 for reference citations). Additionally, analytical results indicate the presence of Aroclor-1254 at elevated concentrations in the clam tissue samples collected from the Forebay Area with respect to background concentrations based on the highest concentration of this analyte in the background clam tissue samples (see Table 14 for reference citations).
84
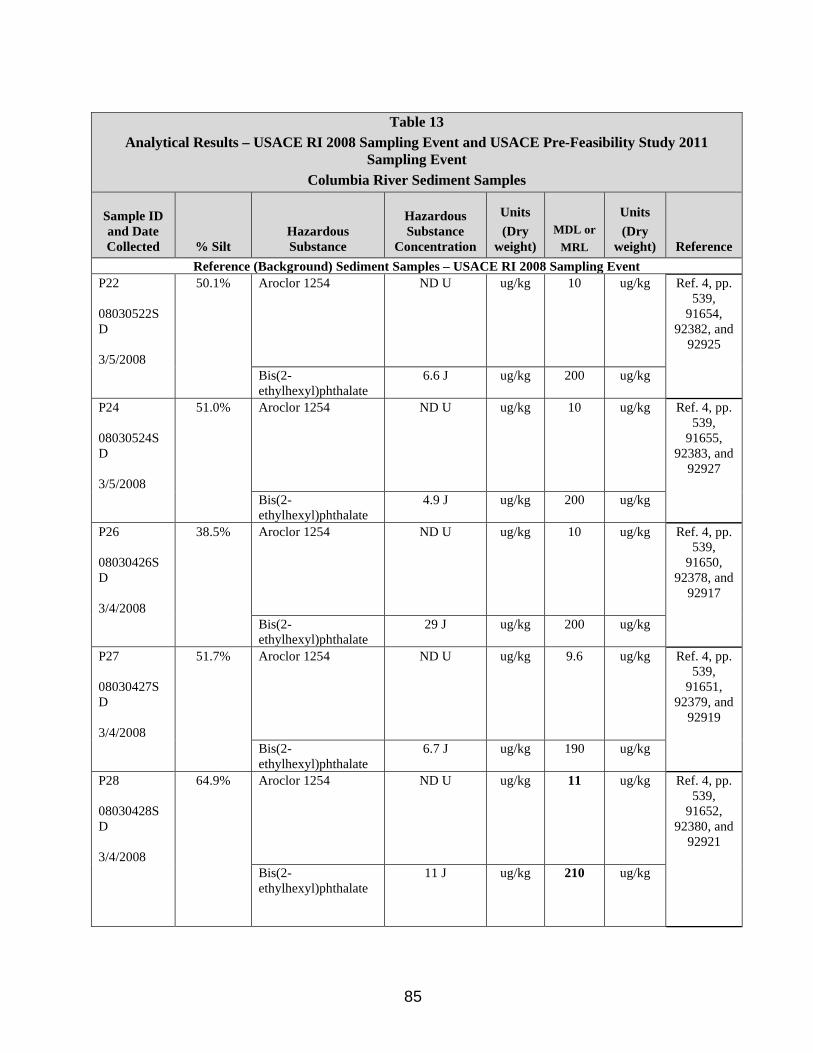
Analytical Results – USACE RI 200
Colum
Table 13 8 Sampling Event and USACE Pre-Feasibility Study 2011
Sampling Event bia River Sediment Samples
Sample ID and Date Collected % Silt
Hazardous Substance
Hazardous Substance
Concentration
Units (Dry
weight) MDL or
MRL
Units (Dry
weight) Reference Reference (Background) Sediment Samples – USACE RI 2008 Sampling Event
P22 08030
D 3/5/2008
522S
50.1%
Aroclor 1254 ND U ug/kg 10 ug/kg Ref. 4, pp. 539,
91654, 92382, and
92925
Bis(2- ethylhexyl)phthalate
6.6 J ug/kg 200 ug/kg
P24 08030
D 3/5/2008
524S
51.0%
Aroclor 1254 ND U ug/kg 10 ug/kg Ref. 4, pp. 539,
91655, 92383, and
92927
Bis(2- ethylhexyl)phthalate
4.9 J ug/kg 200 ug/kg
P26 08030
D 3/4/2008
426S
38.5%
Aroclor 1254 ND U ug/kg 10 ug/kg Ref. 4, pp. 539,
91650, 92378, and
92917
Bis(2- ethylhexyl)phthalate
29 J ug/kg 200 ug/kg
P27 08030
D 3/4/2008
427S
51.7%
Aroclor 1254 ND U ug/kg 9.6 ug/kg Ref. 4, pp. 539,
91651, 92379, and
92919
Bis(2- ethylhexyl)phthalate
6.7 J ug/kg 190 ug/kg
P28 08030
D 3/4/2008
428S
64.9%
Aroclor 1254 ND U ug/kg 11 ug/kg Ref. 4, pp. 539,
91652, 92380, and
92921
Bis(2- ethylhexyl)phthalate
11 J ug/kg 210 ug/kg
85
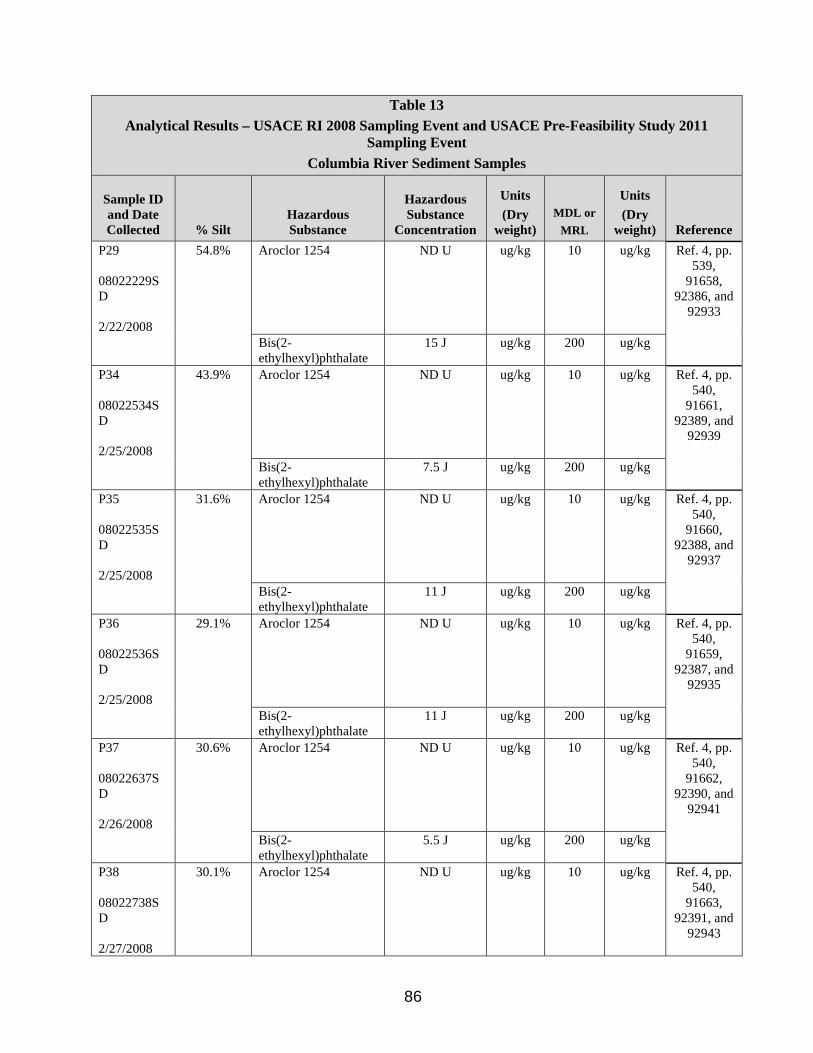
Analytical Results – USACE RI 200
Colum
Table 13 8 Sampling Event and USACE Pre-Feasibility Study 2011
Sampling Event bia River Sediment Samples
Sample ID and Date Collected % Silt
Hazardous Substance
Hazardous Substance
Concentration
Units (Dry
weight) MDL or
MRL
Units (Dry
weight) Reference P29 080222
D 2/22/2008
29S
54.8%
Aroclor 1254 ND U ug/kg 10 ug/kg Ref. 4, pp. 539,
91658, 92386, and
92933
Bis(2- ethylhexyl)phthalate
15 J ug/kg 200 ug/kg
P34 080225
D 2/25/2008
34S
43.9%
Aroclor 1254 ND U ug/kg 10 ug/kg Ref. 4, pp. 540,
91661, 92389, and
92939
Bis(2- ethylhexyl)phthalate
7.5 J ug/kg 200 ug/kg
P35 080225
D 2/25/2008
35S
31.6%
Aroclor 1254 ND U ug/kg 10 ug/kg Ref. 4, pp. 540,
91660, 92388, and
92937
Bis(2- ethylhexyl)phthalate
11 J ug/kg 200 ug/kg
P36 080225
D 2/25/2008
36S
29.1%
Aroclor 1254 ND U ug/kg 10 ug/kg Ref. 4, pp. 540,
91659, 92387, and
92935
Bis(2- ethylhexyl)phthalate
11 J ug/kg 200 ug/kg
P37 080226
D 2/26/2008
37S
30.6%
Aroclor 1254 ND U ug/kg 10 ug/kg Ref. 4, pp. 540,
91662, 92390, and
92941
Bis(2- ethylhexyl)phthalate
5.5 J ug/kg 200 ug/kg
P38 080227
D 2/27/2008
38S
30.1% Aroclor 1254 ND U ug/kg 10 ug/kg Ref. 4, pp. 540,
91663, 92391, and
92943
86
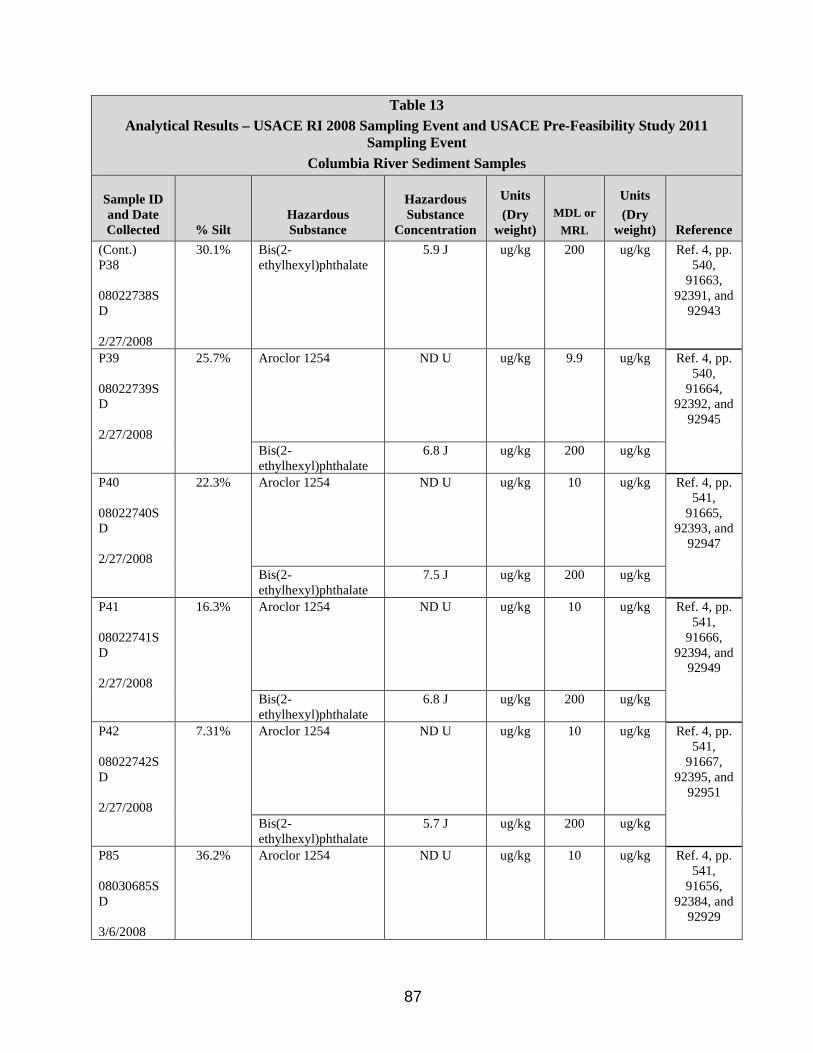
Analytical Results – USACE RI 200
Colum
Table 13 8 Sampling Event and USACE Pre-Feasibility Study 2011
Sampling Event bia River Sediment Samples
Sample ID and Date Collected % Silt
Hazardous Substance
Hazardous Substance
Concentration
Units (Dry
weight) MDL or
MRL
Units (Dry
weight) Reference (Cont.)
P38 08022738S
D
2/27/2008
30.1% Bis(2- ethylhexyl)phthalate
5.9 J ug/kg 200 ug/kg Ref. 4, pp. 540,
91663, 92391, and
92943
P39 080227
D 2/27/2008
39S
25.7%
Aroclor 1254 ND U ug/kg 9.9 ug/kg Ref. 4, pp. 540,
91664, 92392, and
92945
Bis(2- ethylhexyl)phthalate
6.8 J ug/kg 200 ug/kg
P40 080227
D 2/27/2008
40S
22.3%
Aroclor 1254 ND U ug/kg 10 ug/kg Ref. 4, pp. 541,
91665, 92393, and
92947
Bis(2- ethylhexyl)phthalate
7.5 J ug/kg 200 ug/kg
P41 080227
D 2/27/2008
41S
16.3%
Aroclor 1254 ND U ug/kg 10 ug/kg Ref. 4, pp. 541,
91666, 92394, and
92949
Bis(2- ethylhexyl)phthalate
6.8 J ug/kg 200 ug/kg
P42 080227
D 2/27/2008
42S
7.31%
Aroclor 1254 ND U ug/kg 10 ug/kg Ref. 4, pp. 541,
91667, 92395, and
92951
Bis(2- ethylhexyl)phthalate
5.7 J ug/kg 200 ug/kg
P85 08030
D 3/6/2008
685S
36.2% Aroclor 1254 ND U ug/kg 10 ug/kg Ref. 4, pp. 541,
91656, 92384, and
92929
87
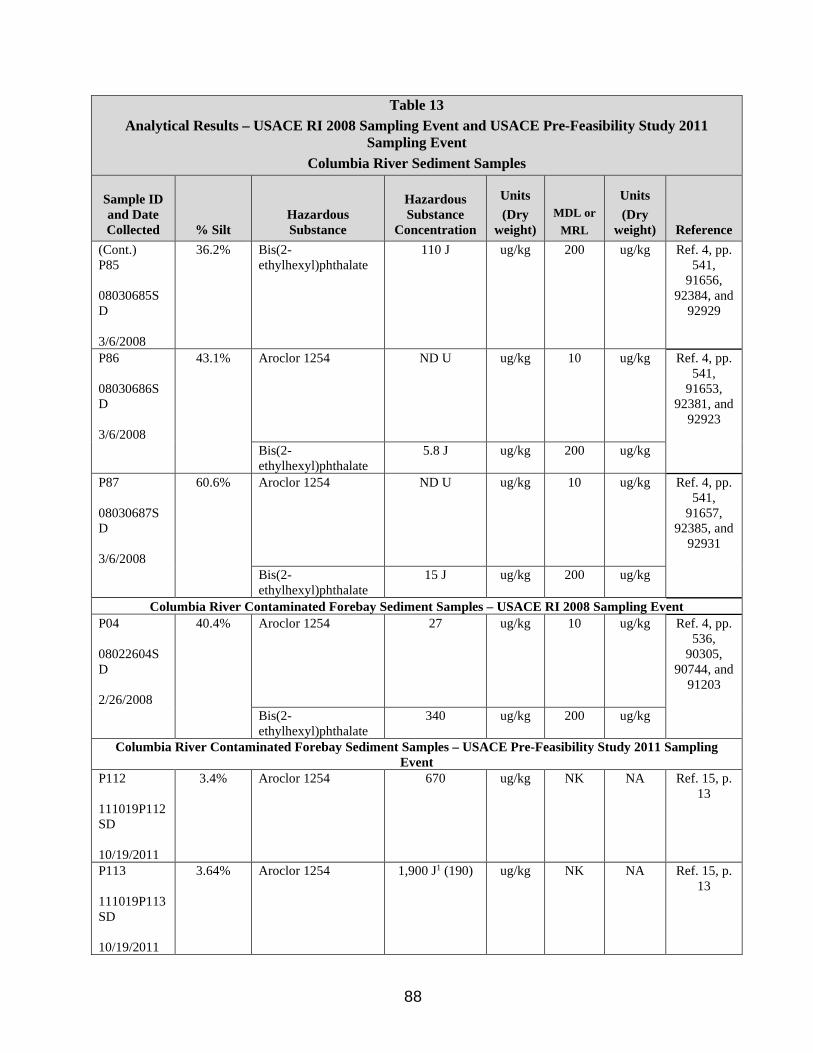
Table 13 Analytical Results – USACE RI 2008 Sampling Event and USACE Pre-Feasibility Study 2011
Sampling Event Columbia River Sediment Samples
Sample ID and Date Collected % Silt
Hazardous Substance
Hazardous Substance
Concentration
Units (Dry
weight) MDL or
MRL
Units (Dry
weight) Reference (Cont.)
P85 08030685S
D
3/6/2008
36.2% Bis(2- ethylhexyl)phthalate
110 J ug/kg 200 ug/kg Ref. 4, pp. 541,
91656, 92384, and
92929
P86 08030686S
D
3/6/2008
43.1%
Aroclor 1254 ND U ug/kg 10 ug/kg Ref. 4, pp. 541,
91653, 92381, and
92923
Bis(2- ethylhexyl)phthalate
5.8 J ug/kg 200 ug/kg
P87 08030687S
D
3/6/2008
60.6%
Aroclor 1254 ND U ug/kg 10 ug/kg Ref. 4, pp. 541,
91657, 92385, and
92931
Bis(2- ethylhexyl)phthalate
15 J ug/kg 200 ug/kg
Columbia River Contaminated Forebay Sediment Samples – USACE RI 2008 Sampling Event P04 08022604S
D
2/26/2008
40.4%
Aroclor 1254 27 ug/kg 10 ug/kg Ref. 4, pp. 536,
90305, 90744, and
91203
Bis(2- ethylhexyl)phthalate
340 ug/kg 200 ug/kg
Columbia River Contaminated Forebay Sediment Samples – USACE Pre-Feasibility Study 2011 Sampling Event
P112 111019P112 SD
10/19/2011
3.4% Aroclor 1254 670 ug/kg NK NA Ref. 15, p. 13
P113 111019P113 SD
10/19/2011
3.64% Aroclor 1254 1,900 J1 (190) ug/kg NK NA Ref. 15, p. 13
88
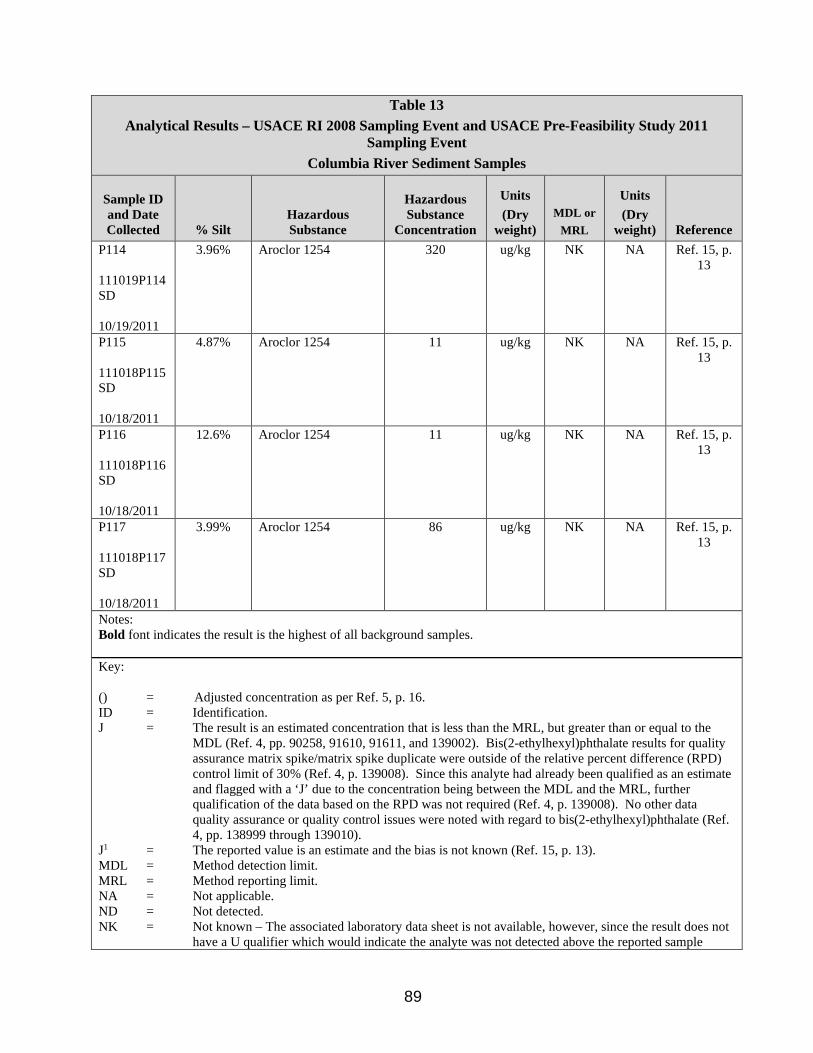
Table 13 Analytical Results – USACE RI 2008 Sampling Event and USACE Pre-Feasibility Study 2011
Sampling Event Columbia River Sediment Samples
Sample ID and Date Hazardous
Hazardous Substance
Units (Dry MDL or
Units (Dry
Collected % Silt Substance Concentration weight) MRL weight) Reference P114 3.96% Aroclor 1254 320 ug/kg NK NA Ref. 15, p.
13 111019P114 SD
10/19/2011 P115 4.87% Aroclor 1254 11 ug/kg NK NA Ref. 15, p.
13 111018P115 SD
10/18/2011 P116 12.6% Aroclor 1254 11 ug/kg NK NA Ref. 15, p.
13 111018P116 SD
10/18/2011 P117 3.99% Aroclor 1254 86 ug/kg NK NA Ref. 15, p.
13 111018P117 SD
10/18/2011 Notes: Bold font indicates the result is the highest of all background samples.
Key:
() = Adjusted concentration as per Ref. 5, p. 16. ID = Identification. J = The result is an estimated concentration that is less than the MRL, but greater than or equal to the
MDL (Ref. 4, pp. 90258, 91610, 91611, and 139002). Bis(2-ethylhexyl)phthalate results for quality assurance matrix spike/matrix spike duplicate were outside of the relative percent difference (RPD) control limit of 30% (Ref. 4, p. 139008). Since this analyte had already been qualified as an estimate and flagged with a ‘J’ due to the concentration being between the MDL and the MRL, further qualification of the data based on the RPD was not required (Ref. 4, p. 139008). No other data quality assurance or quality control issues were noted with regard to bis(2-ethylhexyl)phthalate (Ref. 4, pp. 138999 through 139010).
J1 = The reported value is an estimate and the bias is not known (Ref. 15, p. 13). MDL = Method detection limit. MRL = Method reporting limit. NA = Not applicable. ND = Not detected. NK = Not known – The associated laboratory data sheet is not available, however, since the result does not
have a U qualifier which would indicate the analyte was not detected above the reported sample
89

Table 13 Analytical Results – USACE RI 200 8 Sampling Event and USACE Pre-Feasibility Study 2011
Sampling Event Colum bia River Sediment Samples
Sample ID Hazardous Units Units and Date Hazardous Substance (Dry MDL or (Dry Collected % Silt Substance Concentration weight) MRL weight) Reference
Table 14 Analytical Results – USACE RI 2008 Sampling Event and USA
Event Columbia River Clam Tissue S
CE Pre-Feasibility Study 2011 Sampling
amples
Sample ID and Date Collected
Hazardous Substance
Hazardous Substance
Concentration
Units (wet
weight) MDL or
MRL
Units (wet
weight) Reference Reference (Background) Clam Tissue Samples – USACE RI 2008 Sampling Event
P22 08030 3/5/2008
522TC
Aroclor 1254 36 ug/kg 10 ug/kg Ref. 4, pp. 545 and 82076
P24 08030 3/5/2008
524TC
Aroclor 1254 30 ug/kg 9.7 ug/kg Ref. 4, pp. 545 and 82075
P26
08030426TC
3/4/2008
Aroclor 1254 35 ug/kg 9.9 ug/kg Ref. 4, pp. 545 and 82081
P27 08030 3/4/2008
427TC
Aroclor 1254 37 ug/kg 9.9 ug/kg Ref. 4, pp. 545 and 82082
P28 08030 3/4/2008
428TC
Aroclor 1254 33 ug/kg 9.8 ug/kg Ref. 4, pp. 545 and 82077
quantitation limit (Ref. 15, pp. 13 and 31), it can be inferred that the result is above the reported sample quantitation limit.
U = The compound was analyzed for, but was not detected (“Non-detect”) at or above the MRL/MDL (Ref. 4, pp. 90258, 91610, and 91611).
ug/kg = micrograms per kilogram.
90
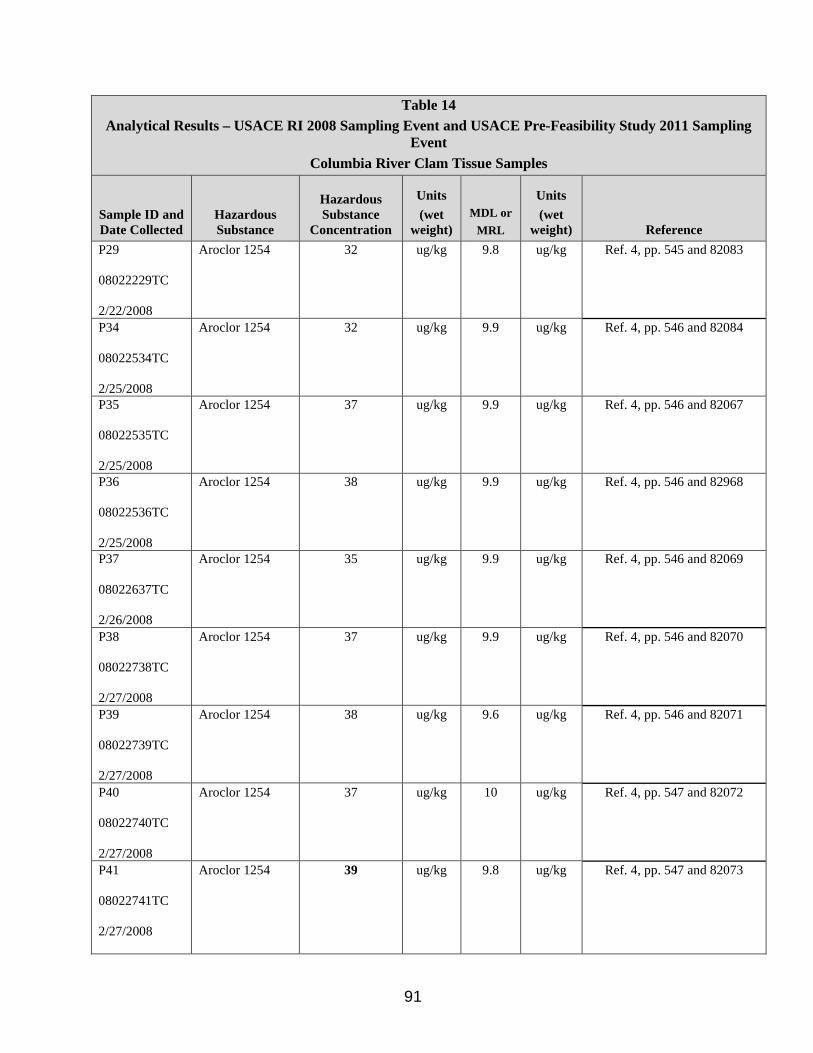
Table 14 Analytical Results – USACE RI 2008 Sampling Event and USACE Pre-Feasibility Study 2011 Sampling
Event Columbia River Clam Tissue Samples
Units Units Hazardous Sample ID and MDL or Hazardous Substance (wet (wet Date Collected Substance Concentration weight) weight) Reference MRL P29 Aroclor 1254 32 ug/kg 9.8 ug/kg Ref. 4, pp. 545 and 82083
08022229TC
2/22/2008 P34 Aroclor 1254 32 ug/kg 9.9 ug/kg Ref. 4, pp. 546 and 82084
08022534TC
2/25/2008 P35 Aroclor 1254 37 ug/kg 9.9 ug/kg Ref. 4, pp. 546 and 82067
08022535TC
2/25/2008 P36 Aroclor 1254 38 ug/kg 9.9 ug/kg Ref. 4, pp. 546 and 82968
08022536TC
2/25/2008 P37 Aroclor 1254 35 ug/kg 9.9 ug/kg Ref. 4, pp. 546 and 82069
08022637TC
2/26/2008 P38 Aroclor 1254 37 ug/kg 9.9 ug/kg Ref. 4, pp. 546 and 82070
08022738TC
2/27/2008 P39 Aroclor 1254 38 ug/kg 9.6 ug/kg Ref. 4, pp. 546 and 82071
08022739TC
2/27/2008 P40 Aroclor 1254 37 ug/kg 10 ug/kg Ref. 4, pp. 547 and 82072
08022740TC
2/27/2008 P41 Aroclor 1254 39 ug/kg 9.8 ug/kg Ref. 4, pp. 547 and 82073
08022741TC
2/27/2008
91
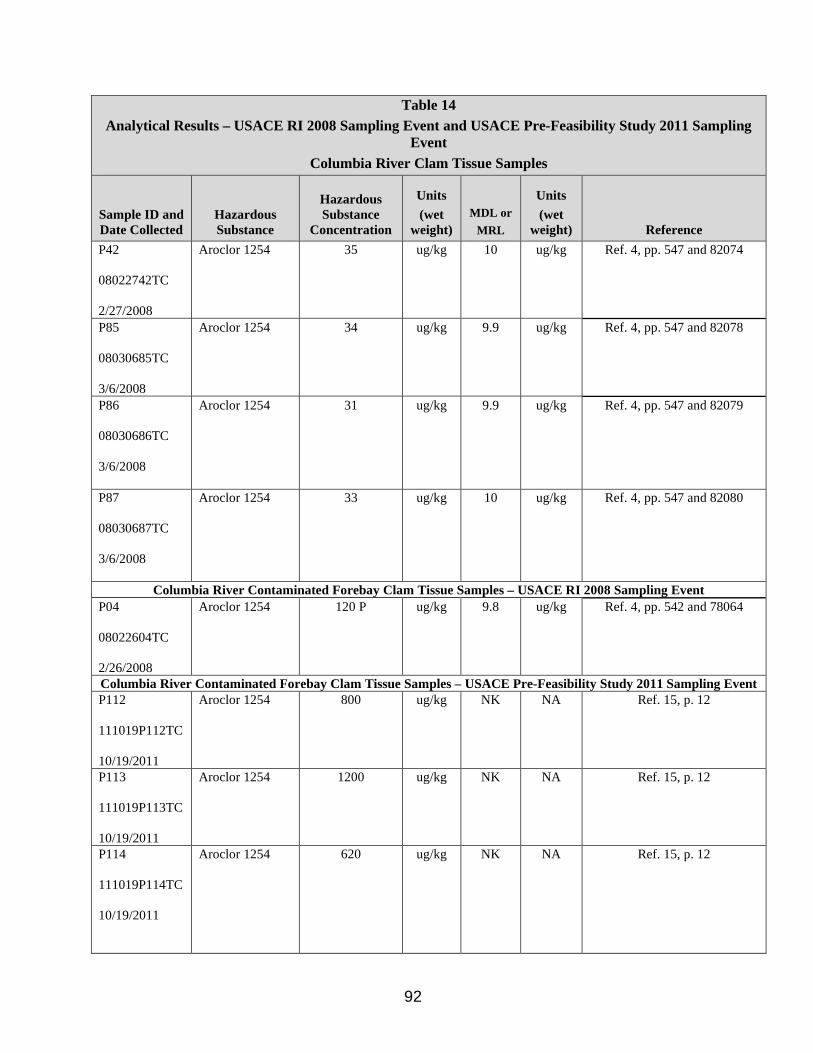
Table 14 Analytical Results – USACE RI 2008 Sampling Event and USACE Pre-Feasibility Study 2011 Sampling
Event Columbia River Clam Tissue Samples
Units Units Hazardous Sample ID and MDL or Hazardous Substance (wet (wet Date Collected Substance Concentration weight) weight) Reference MRL P42 Aroclor 1254 35 ug/kg 10 ug/kg Ref. 4, pp. 547 and 82074
08022742TC
2/27/2008 P85 Aroclor 1254 34 ug/kg 9.9 ug/kg Ref. 4, pp. 547 and 82078
08030685TC
3/6/2008 P86 Aroclor 1254 31 ug/kg 9.9 ug/kg Ref. 4, pp. 547 and 82079
08030686TC
3/6/2008
P87 Aroclor 1254 33 ug/kg 10 ug/kg Ref. 4, pp. 547 and 82080
08030687TC
3/6/2008
Columbia River Contaminated Forebay Clam Tissue Samples – USACE RI 2008 Sampling Event P04 Aroclor 1254 120 P ug/kg 9.8 ug/kg Ref. 4, pp. 542 and 78064
08022604TC
2/26/2008 Columbia River Contaminated Forebay Clam Tissue Samples – USACE Pre-Feasibility Study 2011 Sampling Event P112 Aroclor 1254 800 ug/kg NK NA Ref. 15, p. 12
111019P112TC
10/19/2011 P113 Aroclor 1254 1200 ug/kg NK NA Ref. 15, p. 12
111019P113TC
10/19/2011 P114 Aroclor 1254 620 ug/kg NK NA Ref. 15, p. 12
111019P114TC
10/19/2011
92
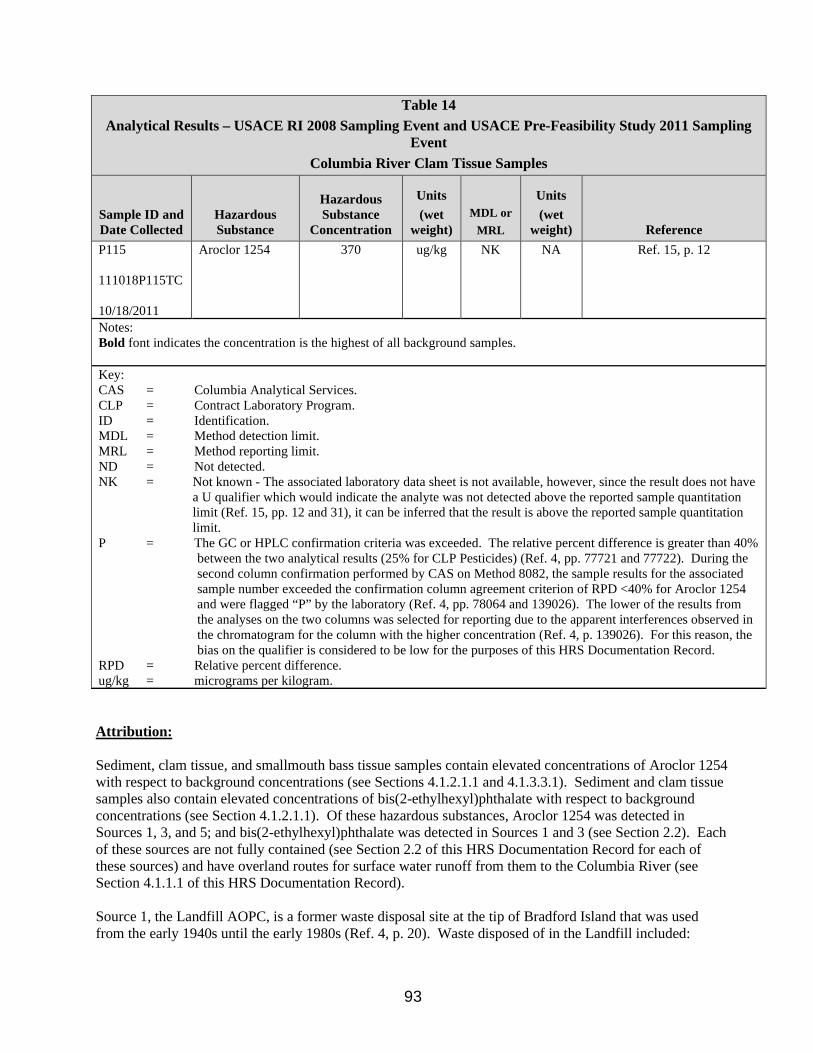
Table 14 Analytical Results – USACE RI 2008 Sampling Event and USACE Pre-Feasibility Study 2011 Sampling
Event Columbia River Clam Tissue S amples
Hazardous Units Units Sample ID and Hazardous Substance (wet MDL or (wet
Date Collected Substance Concentration weight) MRL weight) Reference P115 Aroclor 1254 370 ug/kg NK NA Ref. 15, p. 12
111018P 115TC 10/18/2011
Notes: Bold font indicates the concentration is the highest of all background samples. Key: CAS = Columbia Analytical Services. CLP = Contract Laboratory Program. ID = Identification. MDL = Method detection limit. MRL = Method reporting limit. ND = Not detected. NK = Not known - The associated laboratory data sheet is not available, however, since the result does not have
a U qualifier which would indicate the analyte was not detected above the reported sample quantitation limit (Ref. 15, pp. 12 and 31), it can be inferred that the result is above the reported sample quantitation limit.
P = The GC or HPLC confirmation criteria was exceeded. The relative percent difference is greater than 40% between the two analytical results (25% for CLP Pesticides) (Ref. 4, pp. 77721 and 77722). During the second column confirmation performed by CAS on Method 8082, the sample results for the associated sample number exceeded the confirmation column agreement criterion of RPD <40% for Aroclor 1254 and were flagged “P” by the laboratory (Ref. 4, pp. 78064 and 139026). The lower of the results from the analyses on the two columns was selected for reporting due to the apparent interferences observed in the chromatogram for the column with the higher concentration (Ref. 4, p. 139026). For this reason, the bias on the qualifier is considered to be low for the purposes of this HRS Documentation Record.
RPD = Relative percent difference. ug/kg = micrograms per kilogram.
Attribution:
Sediment, clam tissue, and smallmouth bass tissue samples contain elevated concentrations of Aroclor 1254 with respect to background concentrations (see Sections 4.1.2.1.1 and 4.1.3.3.1). Sediment and clam tissue samples also contain elevated concentrations of bis(2-ethylhexyl)phthalate with respect to background concentrations (see Section 4.1.2.1.1). Of these hazardous substances, Aroclor 1254 was detected in Sources 1, 3, and 5; and bis(2-ethylhexyl)phthalate was detected in Sources 1 and 3 (see Section 2.2). Each of these sources are not fully contained (see Section 2.2 of this HRS Documentation Record for each of these sources) and have overland routes for surface water runoff from them to the Columbia River (see Section 4.1.1.1 of this HRS Documentation Record).
Source 1, the Landfill AOPC, is a former waste disposal site at the tip of Bradford Island that was used from the early 1940s until the early 1980s (Ref. 4, p. 20). Waste disposed of in the Landfill included:
93

household waste, project-related wastes (grease, light bulbs, sandblast grit), electrical debris, up to 50 ballasts, broken glass, rubber tires, metal debris, wood debris, metal cables, asbestos-containing building materials, burned debris, ceramic insulators, and mercury vapor lamps (Ref. 4, p. 20). In general, the investigations found that for approximately 40 years, the USACE managed, stored, and disposed of waste materials at the landfill in excavated pits or existing depressions on the eastern end of Bradford Island (Ref. 4, p, 48). Some additional wastes were disposed of over the northern and eastern edges of the island (Ref. 4, p. 48). Soil samples collected from within the Landfill AOPC revealed the presence of PCBs including Aroclor 1254), metals, herbicides, pesticides, VOCs, and SVOCs including bis(2-ethylhexyl)phthalate (see Section 2.2 of this HRS Documentation Record). The land surface slopes to the north and east; toward the Columbia River, and closer to the river, an area of mass wasting is present (Ref. 4, pp. 300 [Figure 3-3] and 303 [Figure 4-1]). By 1982, the surface of the Landfill AOPC had been capped with soil, and another layer of soil was added in 1989 (Ref. 4, p. 20). Given that the RI describes that precipitation that falls on the Landfill AOPC footprint percolates to groundwater, it is evident that this source does not have a liner (Ref. 4, p. 37).
Source 2, the Sandblast Grit Disposal Area, is an area adjacent to the former sandblast building were spent sandblast grit was historically spread on the ground over an unknown period prior to 1994 (Ref. 4, p. 50). The disposal of spent sandblast grit in the area immediately east of the former sandblast building has resulted in the release of metallic and organometallic constituents, which were used in historical painting operations, into the surface and subsurface soil (Ref. 4, p. 50). This material has subsequently been transported across the site by surface water runoff into the stormwater drainage features (Ref. 4, p. 50 and p. 301 [Figure 3-4]), and ultimately to the Columbia River (Ref. 4, p. 301 [Figure 3-4]; Ref. 15, p. 6 [Figure 3]). Although available sample results do not indicate the presence of significant concentrations of bis(2-ethylhexyl)phthalate or Aroclor 1254 with respect to background concentrations in this source, the samples did reveal the presence of Aroclor 1260, several metals, and several organotins at significant concentrations with respect to background concentrations (see Table 6 of this HRS Documentation Record) and these analytes have the potential to impact the Columbia River.
Source 3, the Equipment Laydown Area, is used by the USACE to store industrial equipment and materials (Ref. 4, p. 52). Soil samples from this area revealed the presence of PCBs including Aroclor 1254, metals, butyltins, pesticides, and SVOCs including bis(2-ethylhexyl)phthalate (Ref. 4, pp. 508 [Table 6-3a] and 512 [Table 6-3c]). The Equipment Laydown Area is a herbaceously vegetated area (See Figure 5 of this HRS documentation record; Ref. 4, p. 40). Portions of the Equipment Laydown Area are immediately adjacent to the Columbia River (Ref. 4, p. 301 [Figure 3-4]). Other portions of the Equipment Laydown Area drain to catch basin #1 which is connected to Outfall #1 which discharges to the Columbia River (Ref. 4, pp. 301 [Figure 3-4] and 303 [Figure 4-1]; Ref. 15, p. 6 [Figure 3]).
Source 4, the Bulb Slope AOPC, consists of a fan-shaped accumulation of glass and electrical light bulb debris that extends over approximately 1,900 square feet of a steep slope between the Columbia River and the Landfill access road (Ref. 4, p. 52). The debris is concentrated in the center of the slope and the types of glass observed included internal/external light bulbs, fluorescent light bulbs, automobile light bulbs, 1- to 1.5-inch-diameter glass tubes, clear window pane glass, white-colored molded glass (possibly lamppost light covers), and miscellaneous glass beverage containers (Ref. 4, pp. 52 and 53). The majority of the Bulb Slope AOPC is herbaceously vegetated and/or covered with organic debris (Ref. 4, p. 41). The base of the Bulb Slope AOPC may be partially submerged in the Columbia River during some periods (Ref. 4, p. 52). At the base of the slope, wave erosion has resulted in mass wasting (small slope failures) of material into the river (Ref. 4, p. 53). Although available sample results do not indicate the presence of significant concentrations of bis(2-ethylhexyl)phthalate or Aroclor 1254 with respect to background concentrations in this source, the samples did reveal the presence of Aroclor 1260, lead, and mercury at significant concentrations with respect to background concentrations (see Table 10 of this HRS Documentation Record) and these analytes have the potential to impact the Columbia River.
94
Source 5, the River OU Former Debris Piles, consisted of piles within the Columbia River of electrical equipment debris including PCB-containing light ballasts, lightning arresters, and electrical capacitors (Ref. 4, pp. 29, 53, and 70; Ref. 6, pp. 3 and 13 [Table 4-1]). The removal of equipment and debris from the Columbia River along the north shore of Bradford Island took place in December 2000 and in February and March 2002 (Ref. 6, pp. 3 and 11). Samples of recovered equipment were collected to determine disposal options and these samples contained Aroclor 1248, Aroclor 1254, and Aroclor 1268 (Ref. 6, pp. 10 and 16 [Table 5-3]) (See Table 11 of this HRS Documentation Record). The documentation of these PCB containing debris piles in direct contact with the Columbia River forms the basis for documenting an observed release from the site by direct observation (see section 4.1.2.1.1 of this HRS Documentation Record).
95
Hazardous Substances Released Aroclor 1248, Aroclor 1254, Aroclor 1268, and bis(2-ethylhexyl)phthalate.
Observed Release Factor Value: 550
96

SWOF/Food Chain – Toxicity/Persistence/Bioaccumulation
4.1.3.2 WASTE CHARACTERISTICS 4.1.3.2.1 Toxicity/Persistence/Bioaccumulation
Table 15 below provides Human Food Chain Threat Waste Characteristics Factor Values for those hazardous substances present in the sources at the Bradford Island (see Section 2.2).
Table 15 Human Food Chain Threat Waste Characteristics Factor Values
Hazardous Substance Source Toxicity Factor
Value a
Persis-tence
Factor Value
b
Bioaccumul -ationFactorValue c
Toxicity/Per-sistence/Bioaccu -mulation Value(Ref. 1, Table 4-
16) Reference Aroclor-1248c 5 10,000 1 50,000 5 x 10⁸ Ref. 2, p.
41 Aroclor-1254c 1, 3, 5 10,000 1 50,000 5 x 10⁸ Ref. 2, p.
41 Aroclor-1260c 1, 2, 3, 4 10,000 1 50,000 5 x 10⁸ Ref. 2, p.
41 Aroclor-1268c 5 10,000 1 50,000 5 x 10⁸ Ref. 2, p.
41 Antimony 1, 2 10,000 1 5 50,000 Ref. 2, p.
5 Arsenic 1, 2 10,000 1 5 50,000 Ref. 2, p.
6 Cadmium 1, 2, 3 10,000 1 50,000 5 x 10⁸ Ref. 2, p.
14 Chromium 1, 2 10,000 1 5 50,000 Ref. 2, p.
17 Copper 1, 2 100 1 50,000 5 x 10⁶ Ref. 2, p.
19 Lead 1, 2, 3, 4 10,000 1 5,000 5 x 10⁷ Ref. 2, p.
34 Mercury 1, 3, 4 10,000 1 50,000 5 x 10⁸ Ref. 2, p.
35 Nickel 1, 2 10,000 1 5 50,000 Ref. 2, p.
38 Thallium 1 10,000 1 500 5 x 10⁷ Ref. 2, p.
44 Zinc 1, 2, 3 10 1 500 5,000 Ref. 2, p.
48 2,4,5-T 1 100 1 500 50,000 Ref. 2, p.
47 4,4’-DDT 3 1,000 1 50,000 5 x 10⁷ Ref. 2, p.
20 BHC (alpha) (aka Hexachlorocyclohexane, alpha-)
1 10,000 1 5,000 5 x 10⁷ Ref. 2, p. 31
BHC (beta) (aka Hexachlorocyclohexane, beta-)
1 1,000 1 500 500,000 Ref. 2, p. 32
Chlordane 1 1,000 1 5,000 5 x 10⁶ Ref. 2, p. 15
97
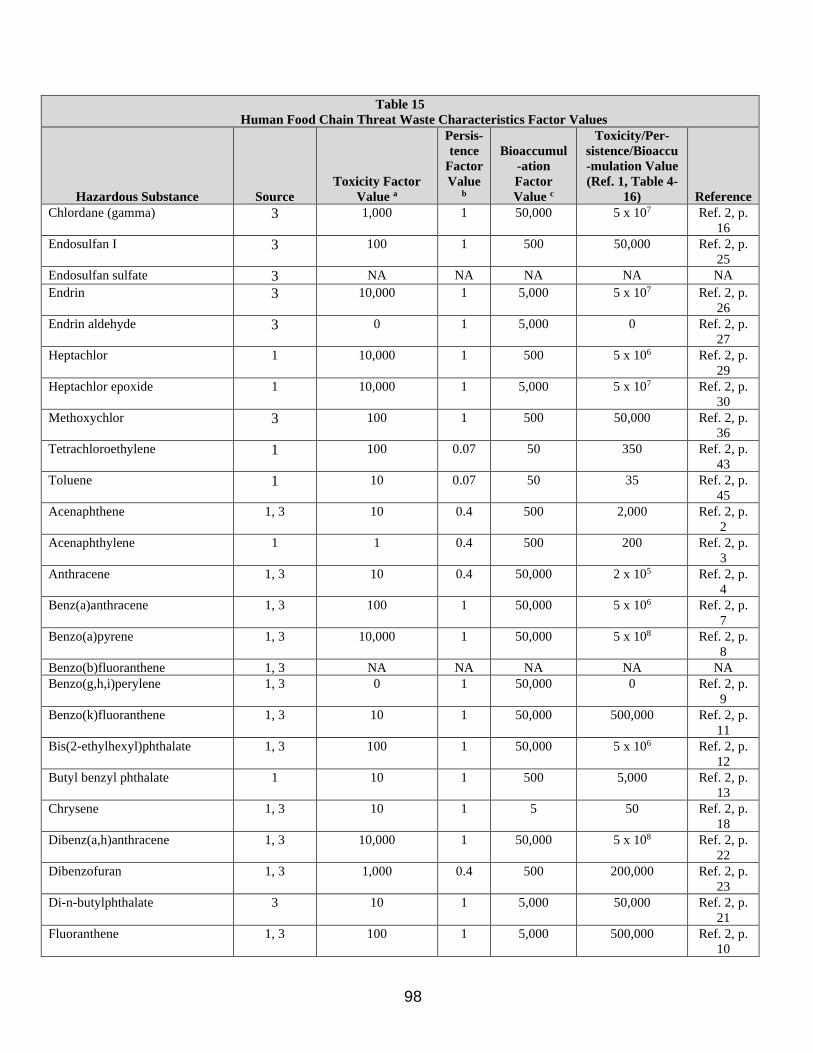
Table 15 Human Food Chain Threat Waste Characteristics Factor Values
Hazardous Substance Source Toxicity Factor
Value a
Persis-tence
Factor Value
b
Bioaccumul -ation Factor Value c
Toxicity/Per-sistence/Bioaccu -mulation Value (Ref. 1, Table 4-
16) Reference Chlordane (gamma) 3 1,000 1 50,000 5 x 10⁷ Ref. 2, p.
16 Endosulfan I 3 100 1 500 50,000 Ref. 2, p.
25 Endosulfan sulfate 3 NA NA NA NA NA Endrin 3 10,000 1 5,000 5 x 10⁷ Ref. 2, p.
26 Endrin aldehyde 3 0 1 5,000 0 Ref. 2, p.
27 Heptachlor 1 10,000 1 500 5 x 10⁶ Ref. 2, p.
29 Heptachlor epoxide 1 10,000 1 5,000 5 x 10⁷ Ref. 2, p.
30 Methoxychlor 3 100 1 500 50,000 Ref. 2, p.
36 Tetrachloroethylene 1 100 0.07 50 350 Ref. 2, p.
43 Toluene 1 10 0.07 50 35 Ref. 2, p.
45 Acenaphthene 1, 3 10 0.4 500 2,000 Ref. 2, p.
2 Acenaphthylene 1 1 0.4 500 200 Ref. 2, p.
3 Anthracene 1, 3 10 0.4 50,000 2 x 10⁵ Ref. 2, p.
4 Benz(a)anthracene 1, 3 100 1 50,000 5 x 10⁶ Ref. 2, p.
7 Benzo(a)pyrene 1, 3 10,000 1 50,000 5 x 10⁸ Ref. 2, p.
8 Benzo(b)fluoranthene 1, 3 NA NA NA NA NA Benzo(g,h,i)perylene 1, 3 0 1 50,000 0 Ref. 2, p.
9 Benzo(k)fluoranthene 1, 3 10 1 50,000 500,000 Ref. 2, p.
11 Bis(2-ethylhexyl)phthalate 1, 3 100 1 50,000 5 x 10⁶ Ref. 2, p.
12 Butyl benzyl phthalate 1 10 1 500 5,000 Ref. 2, p.
13 Chrysene 1, 3 10 1 5 50 Ref. 2, p.
18 Dibenz(a,h)anthracene 1, 3 10,000 1 50,000 5 x 10⁸ Ref. 2, p.
22 Dibenzofuran 1, 3 1,000 0.4 500 200,000 Ref. 2, p.
23 Di-n-butylphthalate 3 10 1 5,000 50,000 Ref. 2, p.
21 Fluoranthene 1, 3 100 1 5,000 500,000 Ref. 2, p.
10
98
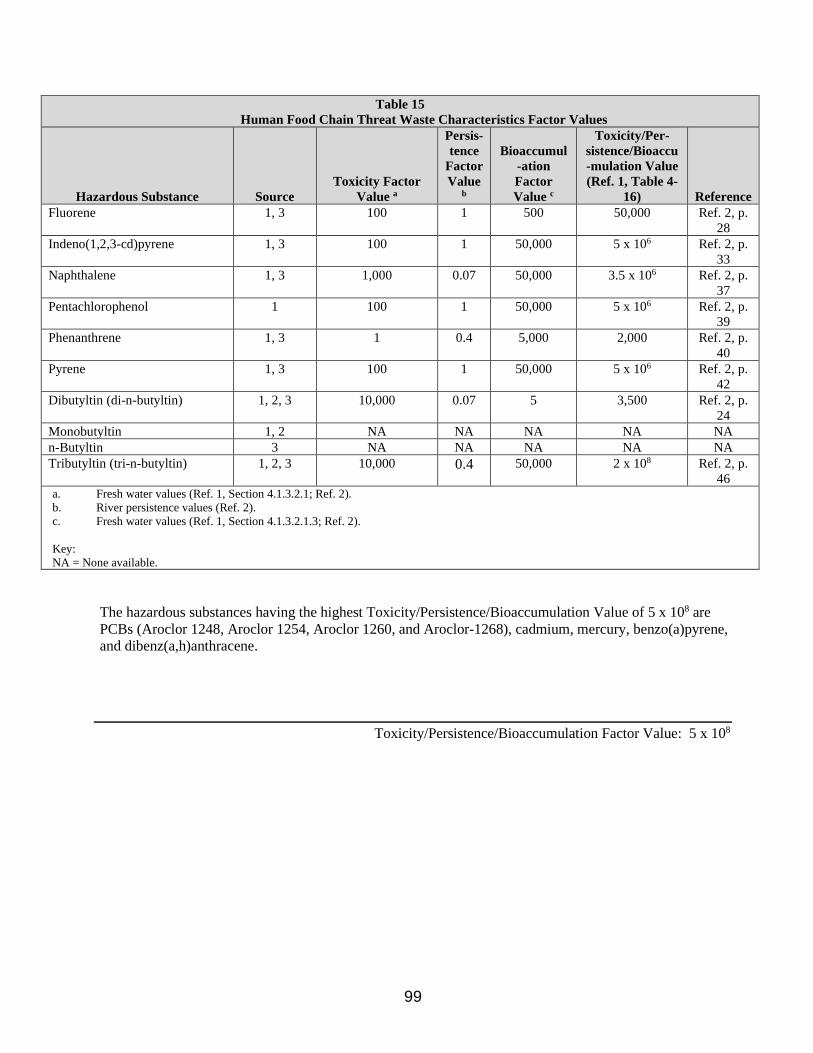
Table 15 Human Food Chain Threat Waste Characteristics Factor Values
Hazardous Substance Source Toxicity Factor
Value a
Persis-tence
Factor Value
b
Bioaccumul -ation Factor Value c
Toxicity/Per-sistence/Bioaccu -mulation Value (Ref. 1, Table 4-
16) Reference Fluorene 1, 3 100 1 500 50,000 Ref. 2, p.
28 Indeno(1,2,3-cd)pyrene 1, 3 100 1 50,000 5 x 10⁶ Ref. 2, p.
33 Naphthalene 1, 3 1,000 0.07 50,000 3.5 x 10⁶ Ref. 2, p.
37 Pentachlorophenol 1 100 1 50,000 5 x 10⁶ Ref. 2, p.
39 Phenanthrene 1, 3 1 0.4 5,000 2,000 Ref. 2, p.
40 Pyrene 1, 3 100 1 50,000 5 x 10⁶ Ref. 2, p.
42 Dibutyltin (di-n-butyltin) 1, 2, 3 10,000 0.07 5 3,500 Ref. 2, p.
24 Monobutyltin 1, 2 NA NA NA NA NA n-Butyltin 3 NA NA NA NA NA Tributyltin (tri-n-butyltin) 1, 2, 3 10,000 0.4 50,000 2 x 10⁸ Ref. 2, p.
46 a. Fresh water values (Ref. 1, Section 4.1.3.2.1; Ref. 2). b. River persistence values (Ref. 2). c. Fresh water values (Ref. 1, Section 4.1.3.2.1.3; Ref. 2).
Key: NA = None available.
The hazardous substances having the highest Toxicity/Persistence/Bioaccumulation Value of 5 x 10⁸ are PCBs (Aroclor 1248, Aroclor 1254, Aroclor 1260, and Aroclor-1268), cadmium, mercury, benzo(a)pyrene, and dibenz(a,h)anthracene.
Toxicity/Persistence/Bioaccumulation Factor Value: 5 x 10⁸
99
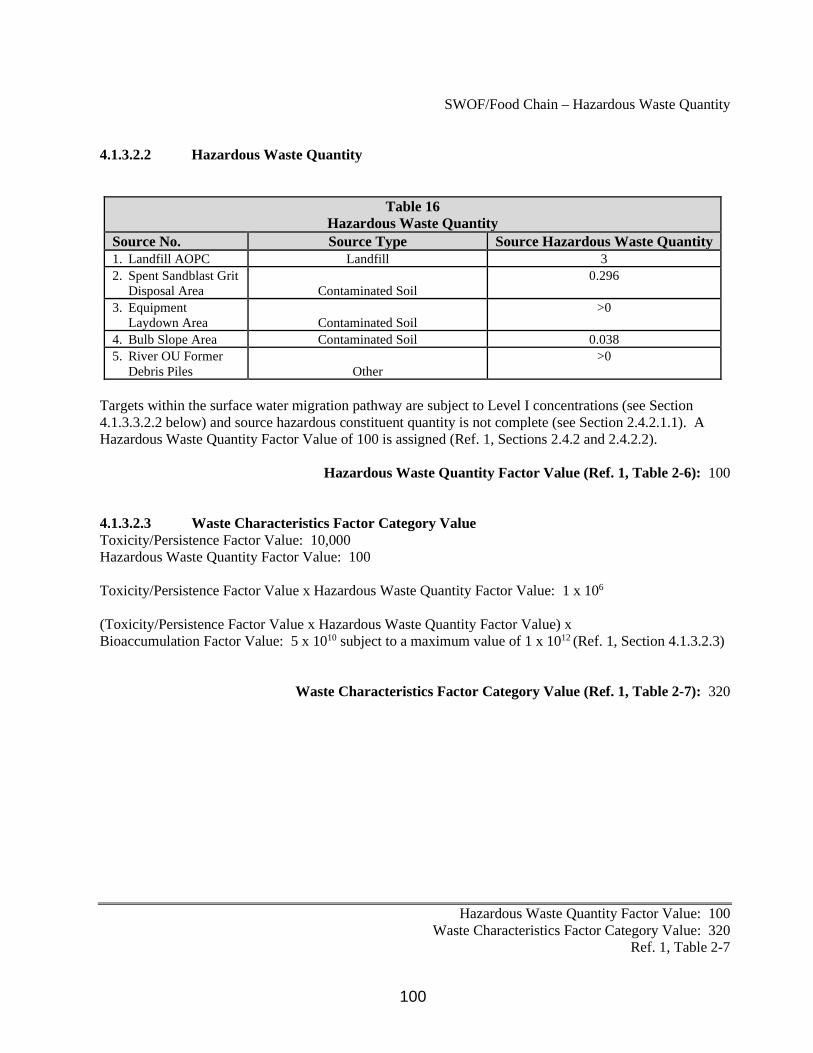
SWOF/Food Chain – Hazardous Waste Quantity
4.1.3.2.2 Hazardous Waste Quantity
Table 16 Hazardous Waste Quantity
Source No. Source Type Source Hazardous Waste Quantity 1. Landfill AOPC Landfill 3 2. Spent Sandblast Grit
Disposal Area Contaminated Soil 0.296
3. Equipment Laydown Area Contaminated Soil
>0
4. Bulb Slope Area Contaminated Soil 0.038 5. River OU Former
Debris Piles Other >0
Targets within the surface water migration pathway are subject to Level I concentrations (see Section 4.1.3.3.2.2 below) and source hazardous constituent quantity is not complete (see Section 2.4.2.1.1). A Hazardous Waste Quantity Factor Value of 100 is assigned (Ref. 1, Sections 2.4.2 and 2.4.2.2).
Hazardous Waste Quantity Factor Value (Ref. 1, Table 2-6): 100
4.1.3.2.3 Waste Characteristics Factor Category Value Toxicity/Persistence Factor Value: 10,000 Hazardous Waste Quantity Factor Value: 100
Toxicity/Persistence Factor Value x Hazardous Waste Quantity Factor Value: 1 x 10⁶
(Toxicity/Persistence Factor Value x Hazardous Waste Quantity Factor Value) x Bioaccumulation Factor Value: 5 x 10¹⁰ subject to a maximum value of 1 x 10¹² (Ref. 1, Section 4.1.3.2.3)
Waste Characteristics Factor Category Value (Ref. 1, Table 2-7): 320
Hazardous Waste Quantity Factor Value: 100 Waste Characteristics Factor Category Value: 320
Ref. 1, Table 2-7
100
SWOF/ Food Chain – Targets
4.1.3.3 HUMAN FOOD CHAIN TARGETS
4.1.3.3.1 Food Chain Individual
Level I Concentrations -Hydraulic modeling of the waters near Bradford Island was conducted by the USACE (Ref. 4, p. 41). This modeling indicates that a large eddy forms behind the dam and creates a reverse current flow next to Bradford Island (Ref. 4, p. 41). This reverse flow appears to attract adult salmonids exiting the fish ladder on their way upstream and may result in the fish being swept back over the dam (Ref. 4, p. 41). Introduced fish species may be present in the Dam’s Forebay for prolonged periods throughout the year and are popular recreational species with a recognized societal value (Ref. 4, p. 41).
Consumption of shellfish from the Bonneville Dam Forebay Area is not known to occur, particularly for subsistence fishers (Ref. 4, p. 187). Smallmouth bass is a resident species that is known to occur in the River OU (Ref. 7, p. 26). It has a small home range and high fidelity to its range and, therefore, has the potential to spend its entire lifetime in the River OU (Ref. 7, p. 26). It is a trophic level 3/4 species feeding on smaller fish such as sculpin, peamouth, and juvenile fish, as well as crayfish and insect larvae (Ref. 7, p. 26). All these characteristics make it likely that the smallmouth bass is a fish species that may represent reasonable maximum exposure to contaminants of potential concern (Ref. 7, p. 26). It is also extremely popular with sport fishers, nontribal high consumption anglers, and also, to some extent, tribal fishermen (Ref. 7, p. 26; Ref. 17, pp. 1, 2, and 9).
In 2011, URS collected smallmouth bass (Micropterus dolomieu) tissue samples from the Forebay Area and smallmouth bass from a Reference Area in support of a 2013 pre-feasibility study on behalf the USACE (Ref. 15, pp. 1, and 8 through 11). Smallmouth bass were collected from 19 locations in the Forebay Area (62 through 65, 67 through 74, 76, 78, 79, and 81 through 84) and from 19 locations in the Reference Area (39 through 52, and 55 through 61) (Ref. 15, pp. 4 [Figure 1], 5 [Figure 2], 8 and 9 [Table 1], and 10 and 11 [Table 2]). All samples were collected in accordance with a QAPP with the exception of a few deviations that were documented in a Work Plan Memorandum (Ref. 15, p. 29). Samples were analyzed for PCBs using EPA SW-846 Method 8082, metals using EPA SW-846 6000/7000 series, total mercury using EPA SW-846 7471A, SVOCs using EPA SW-846 8270, pesticides using EPA SW-846 Method 8081, butyltins using CAS SOP, and percent lipids using NOAA (Ref. 15, p. 30). Data results were reviewed in accordance with EPA’s Contract Laboratory Program National Functional Guidelines for Organic Data Review and EPA’s National Functional Guidelines for Inorganic Superfund Data Review (Ref. 15, pp. 30 and 31). All samples were maintained under proper COC (Ref. 15, pp. 31).
Table 17 provides tissue sample results for three smallmouth bass samples obtained from the Zone of Actual Contamination demonstrating the presence of Aroclor-1254 in these samples (see Figure 6 of this HRS Documentation Record). Notably, the concentrations of Aroclor-1254 in these samples (i.e., ranging from 13,000 ug/kg to 65,000 ug/kg) were more than 59 times the highest concentration of Aroclor-1254 detected in the smallmouth bass tissue samples collected from the reference locations (i.e., ranging from not detected at 9.80 ug/kg to detected at 220 ug/kg) (Ref. 15, pp. 8 and 9; Ref. 29, p. 3).
101
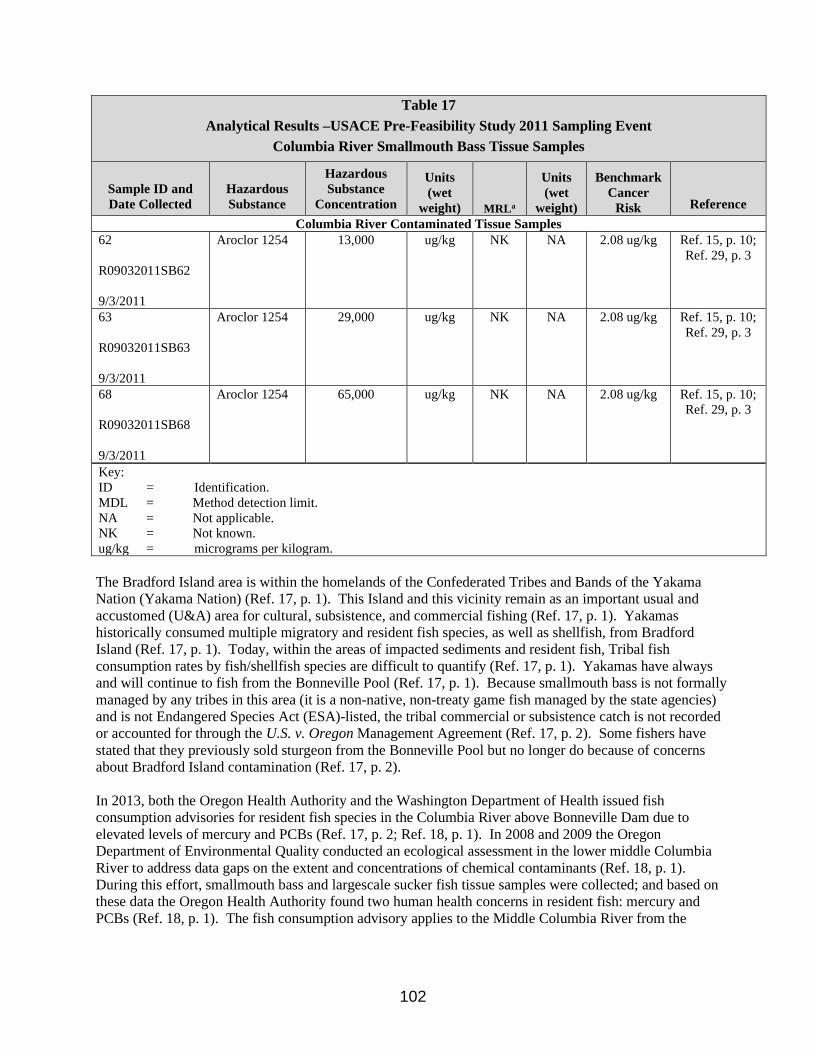
Table 17 Analytical Results –USACE Pre-Feasibility Study 2011 Sampling Event
Columbia River Smallmouth Bass Tissue Samples
Sample ID and Date Collected
Hazardous Substance
Hazardous Substance
Concentration
Units (wet
weight) MRLa
Units (wet
weight)
Benchmark Cancer
Risk Reference Columbia River Contaminated Tissue Samples
62
R09032011SB62
9/3/2011
Aroclor 1254 13,000 ug/kg NK NA 2.08 ug/kg Ref. 15, p. 10; Ref. 29, p. 3
63
R09032011SB63
9/3/2011
Aroclor 1254 29,000 ug/kg NK NA 2.08 ug/kg Ref. 15, p. 10; Ref. 29, p. 3
68
R09032011SB68
9/3/2011
Aroclor 1254 65,000 ug/kg NK NA 2.08 ug/kg Ref. 15, p. 10; Ref. 29, p. 3
Key: ID = Identification. MDL = Method detection limit. NA = Not applicable. NK = Not known. ug/kg = micrograms per kilogram.
The Bradford Island area is within the homelands of the Confederated Tribes and Bands of the Yakama Nation (Yakama Nation) (Ref. 17, p. 1). This Island and this vicinity remain as an important usual and accustomed (U&A) area for cultural, subsistence, and commercial fishing (Ref. 17, p. 1). Yakamas historically consumed multiple migratory and resident fish species, as well as shellfish, from Bradford Island (Ref. 17, p. 1). Today, within the areas of impacted sediments and resident fish, Tribal fish consumption rates by fish/shellfish species are difficult to quantify (Ref. 17, p. 1). Yakamas have always and will continue to fish from the Bonneville Pool (Ref. 17, p. 1). Because smallmouth bass is not formally managed by any tribes in this area (it is a non-native, non-treaty game fish managed by the state agencies) and is not Endangered Species Act (ESA)-listed, the tribal commercial or subsistence catch is not recorded or accounted for through the U.S. v. Oregon Management Agreement (Ref. 17, p. 2). Some fishers have stated that they previously sold sturgeon from the Bonneville Pool but no longer do because of concerns about Bradford Island contamination (Ref. 17, p. 2).
In 2013, both the Oregon Health Authority and the Washington Department of Health issued fish consumption advisories for resident fish species in the Columbia River above Bonneville Dam due to elevated levels of mercury and PCBs (Ref. 17, p. 2; Ref. 18, p. 1). In 2008 and 2009 the Oregon Department of Environmental Quality conducted an ecological assessment in the lower middle Columbia River to address data gaps on the extent and concentrations of chemical contaminants (Ref. 18, p. 1). During this effort, smallmouth bass and largescale sucker fish tissue samples were collected; and based on these data the Oregon Health Authority found two human health concerns in resident fish: mercury and PCBs (Ref. 18, p. 1). The fish consumption advisory applies to the Middle Columbia River from the
102

Bonneville Dam to the McNary Dam (see “Middle Columbia River Fish Advisory” map in Reference 18, p. 1).
A food chain individual factor value of 50 is assigned because a fishery is subject to Level I concentrations.
Level II Concentrations – Not scored.
Potential Contamination – Not scored.
Food Chain Individual Factor Value: 50 Ref. 1, Section 4.1.3.3.1
103
4.1.3.3.2 Population
4.1.3.3.2.1 Level I Concentrations
Smallmouth bass tissue samples obtained from the Zone of Actual Contamination contain PCBs at concentrations that exceed the human food chain cancer risk benchmark (see Table 17 and Figure 6 of this HRS Documentation Record). Smallmouth bass is a resident species (Ref. 7, p. 26). It has a small home range and high fidelity to its range and, therefore, has the potential to spend its entire lifetime in the River OU (Ref. 7, p. 26). The Zone of Actual Contamination is within the Yakama Nation’s U&A fishing grounds (Ref. 17, p. 1). Although a U&A treaty fishing area, enrolled Yakama members are currently prohibited (by tribal regulation) from building fishing platforms on Bradford Island (Ref. 17, p. 2). This decision to issue tribal regulations prohibiting fishing platforms on Bradford Island is a direct result of contamination issues and safety concerns (Ref. 17, p. 2). Some fishers have stated that they previously sold sturgeon from the Bonneville Pool but no longer do because of concerns about Bradford Island contamination (Ref. 17, p. 2).
The lower Bonneville pool tribal treaty harvests are continuing despite fish advisory warnings, and that includes smallmouth bass being harvested as non-target by-catch in tribal commercial, ceremonial, and subsistence fisheries at Fort Rains Treaty Fishing Access Site and other nearby sites (Ref. 17, pp. 1 and 2). Because smallmouth bass is not formally managed by any tribes in this area (it is a non-native, non-treaty game fish managed by the state agencies) and is not Endangered Species Act-listed, the tribal commercial or subsistence catch is not recorded or accounted for through the U.S. v. Oregon Management Agreement (Ref. 17, p. 2). The amount of harvest is unknown but greater than zero pounds per year (Ref. 17, p. 2).
A Level I concentrations value of 0.3 is calculated (i.e., a human food chain value of 0.03 x 10 for Level I concentrations) (Ref. 1, Section 4.1.3.3.2.1 [Table 4-18]). A value of 0.3 is assigned to Level I concentrations.
Level I Concentrations Factor Value: 0.3
4.1.3.3.2.2 Level II Concentrations
Not scored.
Level II Concentrations Human Food Chain Factor Value: Not scored Ref. 1, Section 4.1.3.3.2.2 and Table 4-18
104
4.1.3.3.2.3 Potential Human Food Chain Contamination
The Bradford Island area is within the homelands of the Yakama Nation (Ref. 17, p. 1). This Island and this vicinity remain as an important U&A area for cultural, subsistence, and commercial fishing (Ref. 17, p. 1). Yakamas historically consumed multiple migratory and resident fish species, as well as shellfish, from Bradford Island (Ref. 17, p. 1). Yakamas have always and will continue to fish from the Bonneville Pool (Ref. 17, p. 1). Because smallmouth bass is not formally managed by any tribes in this area (it is a non-native, non-treaty game fish managed by the state agencies) and is not Endangered Species Act (ESA)-listed, the tribal commercial or subsistence catch is not recorded or accounted for through the U.S. v. Oregon Management Agreement (Ref. 17, p. 2). Some Yakama Nation fishers have stated that they previously sold sturgeon from the Bonneville Pool but no longer do because of concerns about Bradford Island contamination (Ref. 17, p. 2). Three other tribes are allowed to fish at U&A locations within the Columbia River (Ref. 7, p. 23). These are the Confederated Tribes of the Warm Springs Reservation, the Nez Perce Tribe, and the Confederated Tribes of the Umatilla Indian Reservation (Ref. 7, p. 23). Bradford Island is a historic customary fishing location for these tribes (Ref. 7, p. 23). Subsistence activity is expected to occur year-round (Ref. 7, p. 24). Fish catch numbers are not available.
Sport fishing is known to occur within the 15-mile TDL. The latest sport fish catch data from the Oregon Department of Fish and Wildlife is for 2018 (Ref. 19; Ref. 20; Ref. 21; Ref. 22; and Ref. 23). The 15-mile TDL is within the approximate 39-mile catch area reported for the portion of the Columbia River from the Bonneville Dam to the Interstate 5 (I-5) bridge (Ref. 19, p. 6; Ref. 20, p. 7; Ref. 21, p. 7; Ref. 22, p. 7; Ref. 23, p. 7; Ref. 24, p. 1; Ref. 28, p. 50). The 15-mile TDL represents approximately 38 percent of this 39-mile catch area (i.e., [15 miles / 39 miles] x 100; rounded to the nearest integer) (Ref. 24, p. 1).
The latest sport fish catch report from the Washington State Department of Fish and Wildlife is for 2017 (Ref. 26, p. 1). The 15-mile TDL is within the approximate 118-mile salmon catch area reported for the portion of the Columbia River from the Bonneville Dam to a line drawn between Tongue Point, Oregon and Rocky Point, Washington (Ref. 27, p. 1; Ref. 28, p. 53). The 15-mile TDL represents approximately 13 percent of this 118-mile catch area (i.e., [15 miles / 118 miles] x 100; rounded to the nearest integer) (Ref. 27, p. 1). The 15-mile TDL is also within the approximate 39-mile steelhead catch area reported for the portion of the Columbia River from the Bonneville Dam to the Interstate 5 (I-5) bridge (Ref. 24, p. 1; Ref. 28, p. 53). The 15-mile TDL represents approximately 38 percent of this 39-mile catch area (i.e., [15 miles / 39 miles] x 100; rounded to the nearest integer) (Ref. 24, p. 1).
Estimated potential human food chain fish harvest numbers for catch within the 15-mile TDL is provided in Table 18 below.
105
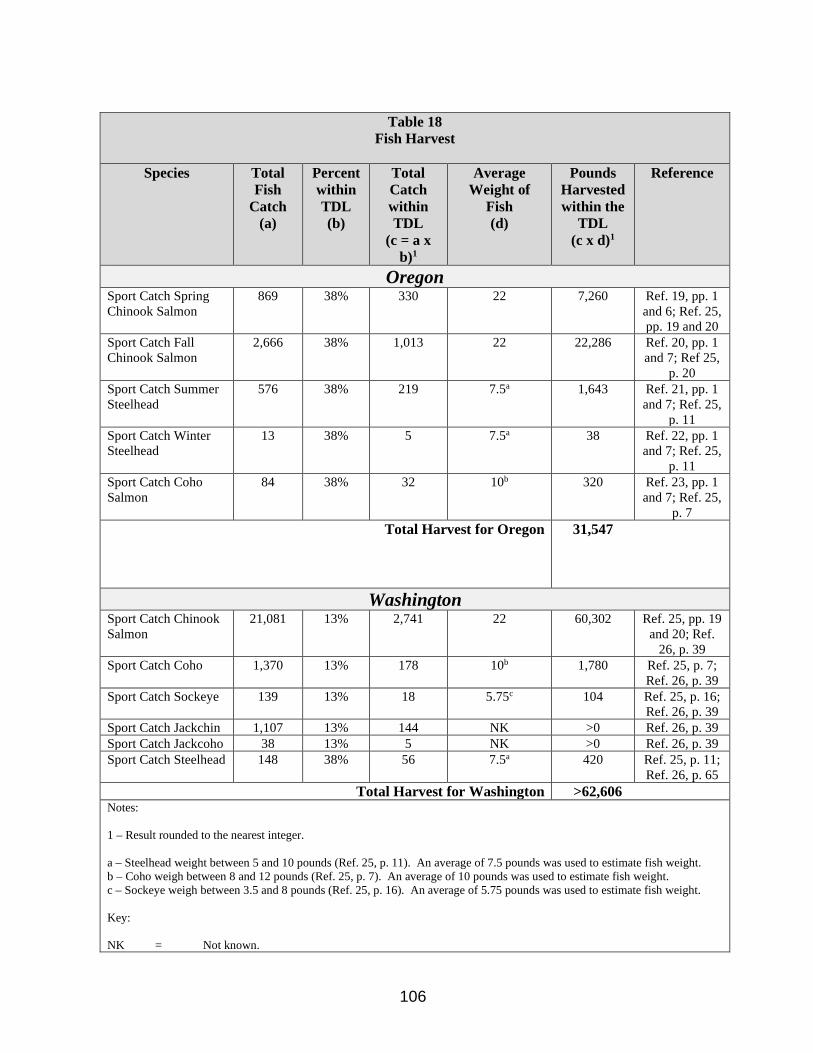
Table 18 Fish Harvest
Species Total Fish
Catch (a)
Percent within TDL (b)
Total Catch within TDL
(c = a x b)1
Average Weight of
Fish (d)
Pounds Harvested within the
TDL (c x d)1
Reference
Oregon Sport Catch Spring Chinook Salmon
869 38% 330 22 7,260 Ref. 19, pp. 1 and 6; Ref. 25, pp. 19 and 20
Sport Catch Fall Chinook Salmon
2,666 38% 1,013 22 22,286 Ref. 20, pp. 1 and 7; Ref 25,
p. 20 Sport Catch Summer Steelhead
576 38% 219 7.5a 1,643 Ref. 21, pp. 1 and 7; Ref. 25,
p. 11 Sport Catch Winter Steelhead
13 38% 5 7.5a 38 Ref. 22, pp. 1 and 7; Ref. 25,
p. 11 Sport Catch Coho Salmon
84 38% 32 10b 320 Ref. 23, pp. 1 and 7; Ref. 25,
p. 7 Total Harvest for Oregon 31,547
Washington Sport Catch Chinook Salmon
21,081 13% 2,741 22 60,302 Ref. 25, pp. 19 and 20; Ref.
26, p. 39 Sport Catch Coho 1,370 13% 178 10b 1,780 Ref. 25, p. 7;
Ref. 26, p. 39 Sport Catch Sockeye 139 13% 18 5.75c 104 Ref. 25, p. 16;
Ref. 26, p. 39 Sport Catch Jackchin 1,107 13% 144 NK >0 Ref. 26, p. 39 Sport Catch Jackcoho 38 13% 5 NK >0 Ref. 26, p. 39 Sport Catch Steelhead 148 38% 56 7.5a 420 Ref. 25, p. 11;
Ref. 26, p. 65 Total Harvest for Washington >62,606
Notes:
1 – Result rounded to the nearest integer.
a – Steelhead weight between 5 and 10 pounds (Ref. 25, p. 11). An average of 7.5 pounds was used to estimate fish weight. b – Coho weigh between 8 and 12 pounds (Ref. 25, p. 7). An average of 10 pounds was used to estimate fish weight. c – Sockeye weigh between 3.5 and 8 pounds (Ref. 25, p. 16). An average of 5.75 pounds was used to estimate fish weight.
Key:
NK = Not known.
106

Table 19 below indicates the calculation for Potential Human Food Chain Contamination Factor Value.
Table 19 Potential Human Food Chain Contamination Factor Value Calculation
Pounds Human Food Dilution Weight Dilution Reference Harvested Chain Population Weighted Target
Value Value >94,153 31 0.00001 0.00031 Ref. 1, Table 4-13
and Table 4-18; Ref. 12, p. 1; Ref. 13, p. 1. For Pounds Harvested see Table 18.
Total dilution weighted target value 0.00031/ 10 = 0.000031
Potential Human Food Chain Contamination Factor Value: 0.000031 Ref. 1, Section 4.1.3.3.2.3
107

SWOF/Environment – Toxicity/Persistence/Bioaccumulation
4.1.4.2 WASTE CHARACTERISTICS 4.1.4.2.1 Ecosystem Toxicity/Persistence/Bioaccumulation
Table 20 below provides Environmental Threat Waste Characteristics Factor Values for those hazardous substances present in the sources at the Bradford Island (see Section 2.2).
Table 20 Environmental Threat Waste Characteristics Factor Values
Hazardous Substance Source
Ecosystem Toxicity Factor Value a
Persis-tence
Factor Value
b
Environmental Bioaccumul-ation Factor
Value c
Ecosystem Toxicity/Per-
sistence/Environ-mental Bioaccu-mulation Value (Ref. 1, Table 4-
16) Reference Aroclor-1248c 5 10,000 1 50,000 5 x 10⁸ Ref. 2, p.
41 Aroclor-1254c 1, 3, 5 10,000 1 50,000 5 x 10⁸ Ref. 2, p.
41 Aroclor-1260c 1, 2, 3, 4 10,000 1 50,000 5 x 10⁸ Ref. 2, p.
41 Aroclor-1268c 5 10,000 1 50,000 5 x 10⁸ Ref. 2, p.
41 Antimony 1, 2 1 1 5 5 Ref. 2, p.
5 Arsenic 1, 2 10 1 50,000 500,000 Ref. 2, p.
6 Cadmium 1, 2, 3 10,000 1 50,000 5 x 10⁸ Ref. 2, p.
14 Chromium 1, 2 10,000 1 500 5 x 10⁶ Ref. 2, p.
17 Copper 1, 2 1,000 1 50,000 5 x 10⁷ Ref. 2, p.
19 Lead 1, 2, 3, 4 1,000 1 50,000 5 x 10⁷ Ref. 2, p.
34 Mercury 1, 3, 4 10,000 1 50,000 5 x 10⁸ Ref. 2, p.
35 Nickel 1, 2 100 1 50,000 5 x 10⁶ Ref. 2, p.
38 Thallium 1 100 1 500 50,000 Ref. 2, p.
44 Zinc 1, 2, 3 10 1 50,000 500,000 Ref. 2, p.
48 2,4,5-T 1 10,000 1 500 5 x 10⁶ Ref. 2, p.
47 4,4’-DDT 3 10,000 1 50,000 5 x 10⁸ Ref. 2, p.
20 BHC (alpha) (aka Hexachlorocyclohexane, alpha-)
1 1,000 1 5,000 5 x 10⁶ Ref. 2, p. 31
BHC (beta) (aka Hexachlorocyclohexane, beta-)
1 1,000 1 5,000 5 x 10⁶ Ref. 2, p. 32
108
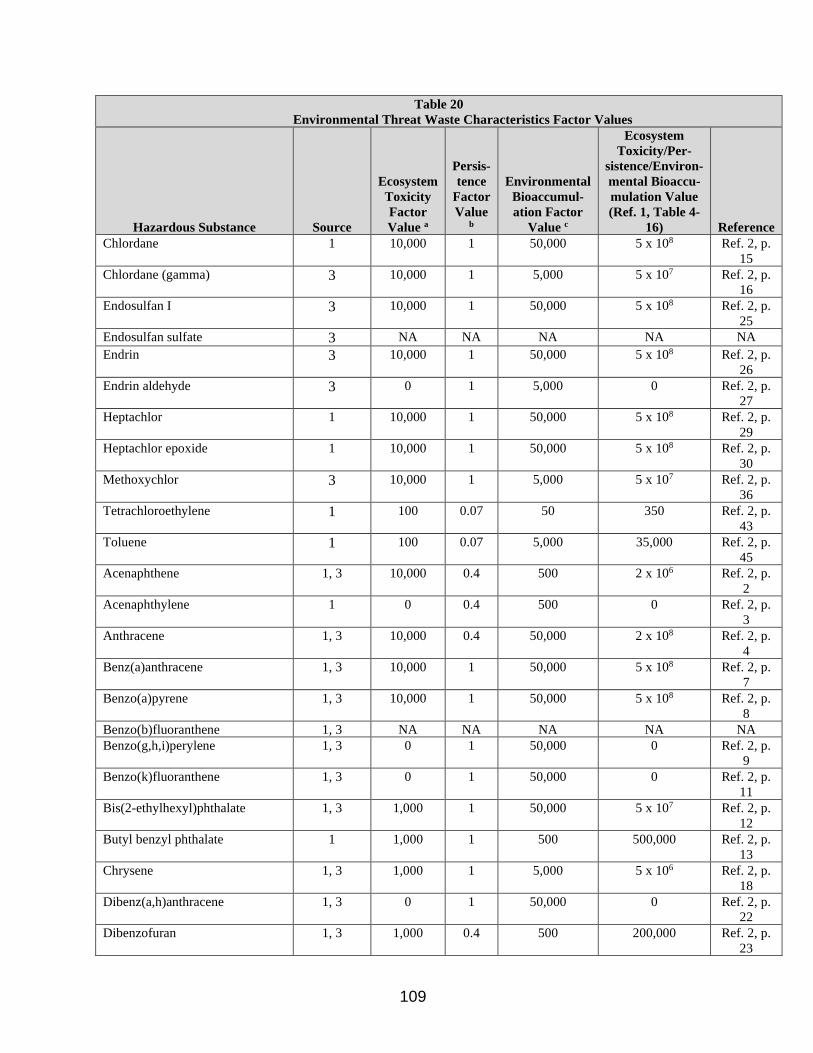
Table 20 Environmental Threat Waste Characteristics Factor Values
Hazardous Substance Source
Ecosystem Toxicity Factor Value a
Persis-tence
Factor Value
b
Environmental Bioaccumul-ation Factor
Value c
Ecosystem Toxicity/Per-
sistence/Environ-mental Bioaccu-mulation Value (Ref. 1, Table 4-
16) Reference Chlordane 1 10,000 1 50,000 5 x 10⁸ Ref. 2, p.
15 Chlordane (gamma) 3 10,000 1 5,000 5 x 10⁷ Ref. 2, p.
16 Endosulfan I 3 10,000 1 50,000 5 x 10⁸ Ref. 2, p.
25 Endosulfan sulfate 3 NA NA NA NA NA Endrin 3 10,000 1 50,000 5 x 10⁸ Ref. 2, p.
26 Endrin aldehyde 3 0 1 5,000 0 Ref. 2, p.
27 Heptachlor 1 10,000 1 50,000 5 x 10⁸ Ref. 2, p.
29 Heptachlor epoxide 1 10,000 1 50,000 5 x 10⁸ Ref. 2, p.
30 Methoxychlor 3 10,000 1 5,000 5 x 10⁷ Ref. 2, p.
36 Tetrachloroethylene 1 100 0.07 50 350 Ref. 2, p.
43 Toluene 1 100 0.07 5,000 35,000 Ref. 2, p.
45 Acenaphthene 1, 3 10,000 0.4 500 2 x 10⁶ Ref. 2, p.
2 Acenaphthylene 1 0 0.4 500 0 Ref. 2, p.
3 Anthracene 1, 3 10,000 0.4 50,000 2 x 10⁸ Ref. 2, p.
4 Benz(a)anthracene 1, 3 10,000 1 50,000 5 x 10⁸ Ref. 2, p.
7 Benzo(a)pyrene 1, 3 10,000 1 50,000 5 x 10⁸ Ref. 2, p.
8 Benzo(b)fluoranthene 1, 3 NA NA NA NA NA Benzo(g,h,i)perylene 1, 3 0 1 50,000 0 Ref. 2, p.
9 Benzo(k)fluoranthene 1, 3 0 1 50,000 0 Ref. 2, p.
11 Bis(2-ethylhexyl)phthalate 1, 3 1,000 1 50,000 5 x 10⁷ Ref. 2, p.
12 Butyl benzyl phthalate 1 1,000 1 500 500,000 Ref. 2, p.
13 Chrysene 1, 3 1,000 1 5,000 5 x 10⁶ Ref. 2, p.
18 Dibenz(a,h)anthracene 1, 3 0 1 50,000 0 Ref. 2, p.
22 Dibenzofuran 1, 3 1,000 0.4 500 200,000 Ref. 2, p.
23
109
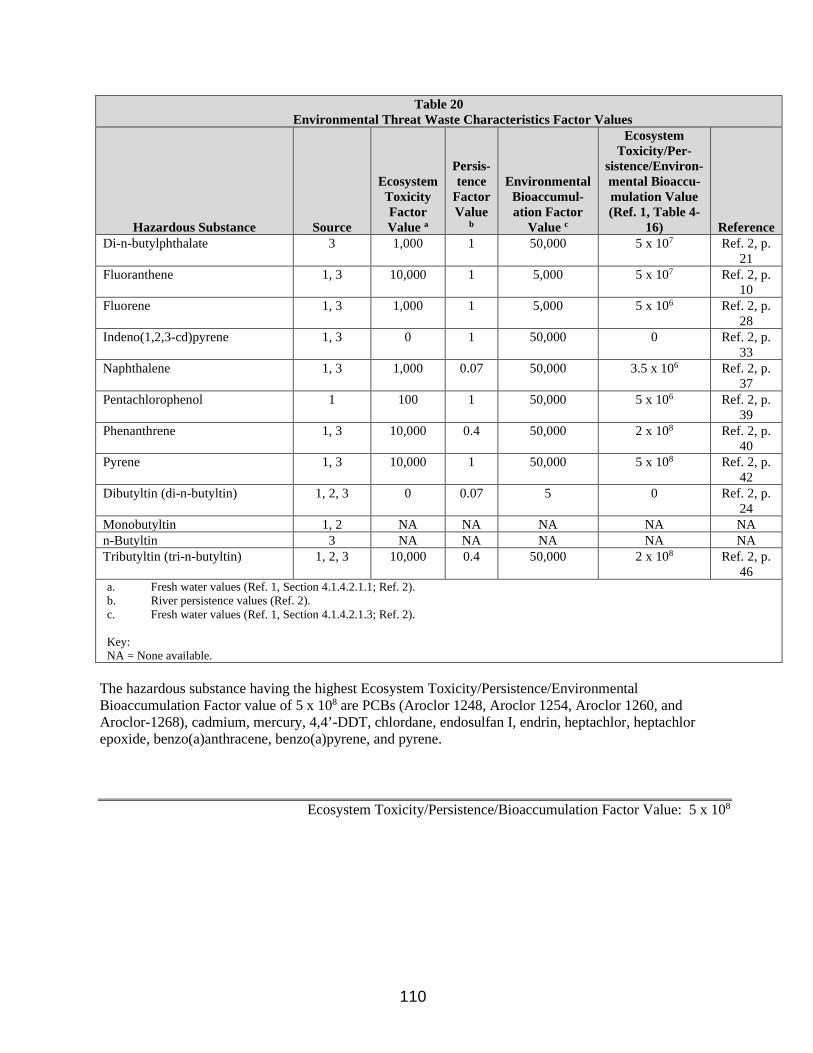
Table 20 Environmental Threat Waste Characteristics Factor Values
Hazardous Substance Source
Ecosystem Toxicity Factor Value a
Persis-tence
Factor Value
b
Environmental Bioaccumul-ation Factor
Value c
Ecosystem Toxicity/Per-
sistence/Environ-mental Bioaccu-mulation Value (Ref. 1, Table 4-
16) Reference Di-n-butylphthalate 3 1,000 1 50,000 5 x 10⁷ Ref. 2, p.
21 Fluoranthene 1, 3 10,000 1 5,000 5 x 10⁷ Ref. 2, p.
10 Fluorene 1, 3 1,000 1 5,000 5 x 10⁶ Ref. 2, p.
28 Indeno(1,2,3-cd)pyrene 1, 3 0 1 50,000 0 Ref. 2, p.
33 Naphthalene 1, 3 1,000 0.07 50,000 3.5 x 10⁶ Ref. 2, p.
37 Pentachlorophenol 1 100 1 50,000 5 x 10⁶ Ref. 2, p.
39 Phenanthrene 1, 3 10,000 0.4 50,000 2 x 10⁸ Ref. 2, p.
40 Pyrene 1, 3 10,000 1 50,000 5 x 10⁸ Ref. 2, p.
42 Dibutyltin (di-n-butyltin) 1, 2, 3 0 0.07 5 0 Ref. 2, p.
24 Monobutyltin 1, 2 NA NA NA NA NA n-Butyltin 3 NA NA NA NA NA Tributyltin (tri-n-butyltin) 1, 2, 3 10,000 0.4 50,000 2 x 10⁸ Ref. 2, p.
46 a. Fresh water values (Ref. 1, Section 4.1.4.2.1.1; Ref. 2). b. River persistence values (Ref. 2). c. Fresh water values (Ref. 1, Section 4.1.4.2.1.3; Ref. 2).
Key: NA = None available.
The hazardous substance having the highest Ecosystem Toxicity/Persistence/Environmental Bioaccumulation Factor value of 5 x 10⁸ are PCBs (Aroclor 1248, Aroclor 1254, Aroclor 1260, and Aroclor-1268), cadmium, mercury, 4,4’-DDT, chlordane, endosulfan I, endrin, heptachlor, heptachlor epoxide, benzo(a)anthracene, benzo(a)pyrene, and pyrene.
Ecosystem Toxicity/Persistence/Bioaccumulation Factor Value: 5 x 10⁸
110
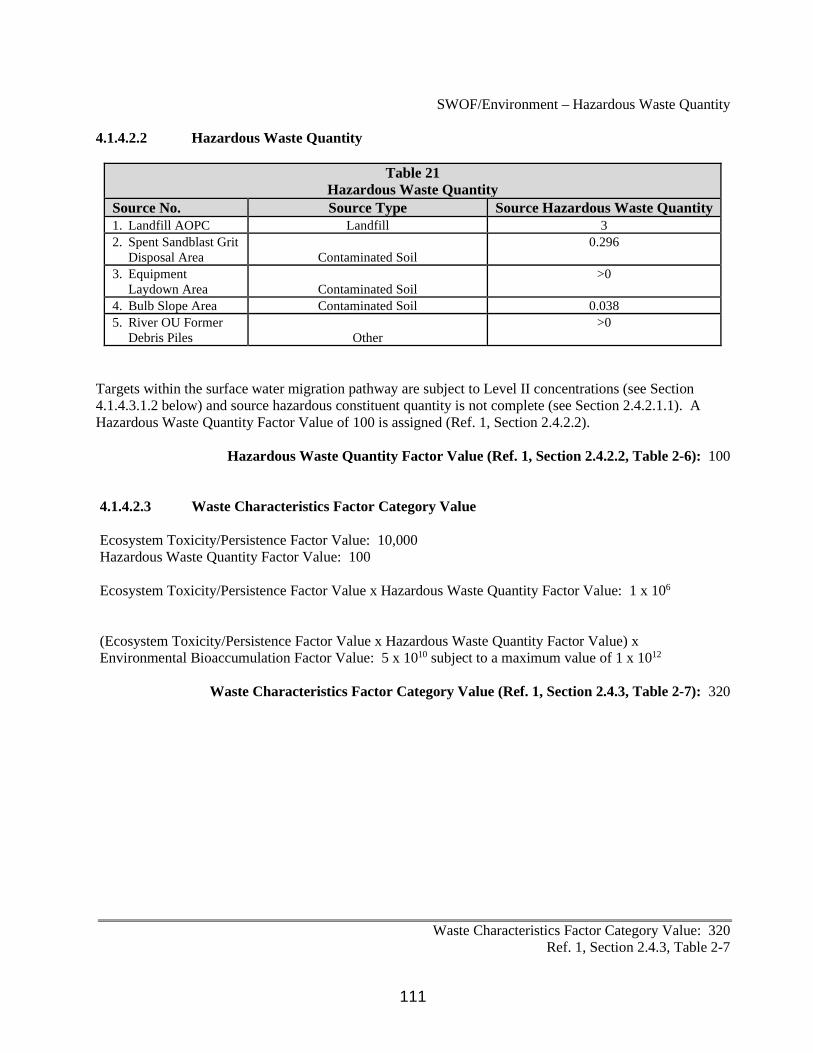
SWOF/Environment – Hazardous Waste Quantity
4.1.4.2.2 Hazardous Waste Quantity
Table 21 Hazardous Waste Quantity
Source No. Source Type Source Hazardous Waste Quantity 1. Landfill AOPC Landfill 3 2. Spent Sandblast Grit
Disposal Area Contaminated Soil 0.296
3. Equipment Laydown Area Contaminated Soil
>0
4. Bulb Slope Area Contaminated Soil 0.038 5. River OU Former
Debris Piles Other >0
Targets within the surface water migration pathway are subject to Level II concentrations (see Section 4.1.4.3.1.2 below) and source hazardous constituent quantity is not complete (see Section 2.4.2.1.1). A Hazardous Waste Quantity Factor Value of 100 is assigned (Ref. 1, Section 2.4.2.2).
Hazardous Waste Quantity Factor Value (Ref. 1, Section 2.4.2.2, Table 2-6): 100
4.1.4.2.3 Waste Characteristics Factor Category Value
Ecosystem Toxicity/Persistence Factor Value: 10,000 Hazardous Waste Quantity Factor Value: 100
Ecosystem Toxicity/Persistence Factor Value x Hazardous Waste Quantity Factor Value: 1 x 10⁶
(Ecosystem Toxicity/Persistence Factor Value x Hazardous Waste Quantity Factor Value) x Environmental Bioaccumulation Factor Value: 5 x 10¹⁰ subject to a maximum value of 1 x 10¹²
Waste Characteristics Factor Category Value (Ref. 1, Section 2.4.3, Table 2-7): 320
Waste Characteristics Factor Category Value: 320 Ref. 1, Section 2.4.3, Table 2-7
111
SWOF/ Environment – Targets
4.1.4.3 ENVIRONMENTAL THREAT – TARGETS
Level I concentrations for the Environmental Threat is not being scored.
4.1.4.3.1 Sensitive Environments
4.1.4.3.1.1 Level I Concentrations
Sensitive Environments
Not scored.
Wetlands
Not scored.
Level I Concentrations Factor Value: Not Scored
112

SWOF/Environmental – Level II Concentrations
4.1.4.3.1.2 Level II Concentrations
Sensitive Environments
Based on historic photographs and USACE hydroacoustic sounding data, a submerged shelf appears to be adjacent to the north side of Bradford Island at a depth of about 30 feet below pool level (Ref. 4, p. 41). This shelf appears to be about 50 feet wide, parallel to the north shore of the island (Ref. 4, p. 41). The shelf could be critical habitat for ESA-listed salmonids (Ref. 4, p. 41). Shallow water (20 feet deep or less) also occupies a band approximately 50 feet wide along the south shoreline of Bradford Island (Ref. 4, p. 41).
The Yakama Nation has stated that anadromous and resident fish species use the Bradford Island area of the Columbia River for foraging, migration, rearing, spawning, and overwintering habitat (Ref. 17, p. 3). All fish species, adult and juvenile, would be expected to swim in, adjacent to or near the Zone of Actual Contamination (Ref. 17, p. 3). They also stated that several ESA-listed species are found in the waters surrounding Bradford Island, including their designated critical habitat and essential fish habitat (Ref. 17, p. 3).
A Zone of Actual Contamination subject to Level II concentrations is present along the north shore of Bradford Island (see section 4.1.2.1.1 and Figure 5). This Zone of Actual Contamination contains critical habitat for a several federal threatened species, as well as other sensitive environments as indicated in Table 22. A critical migratory pathway for Bull trout, Sockeye salmon, summer Chinook, and fall Chum is expected to exist within the Zone of Actual Contamination as these species migrate to and/or from critical spawning habitats (Ref. 30, p. 1).
Table 22 Sensitive Environments Subject to Level II Concentrations
Sensitive Environment
Distance from Nearest PPE to
Sensitive Environment
Sensitive Environment Value (Ref. 1, Table 4-23)
References
Critical Habitat for the Federal Threatened Chinook salmon (Oncorhynchus tshawytscha) – Lower Columbia River ESU
0 feet 100 Ref. 30, p. 3; Ref. 31, pp. 27, 28, 32 and 33
Critical Habitat for the Federal Threatened Chum salmon (Oncorhynchus keta) – Columbia River ESU
0 feet 100 Figure 5 of this HRS Documentation
Record; Ref. 3, p. 1; Ref. 30, p. 2; Ref. 31, pp. 70, 71, 73, and 74
Critical Habitat for the Federal Threatened Steelhead salmon (Oncorhynchus mykiss) – Lower Columbia River ESU
0 feet 100 Ref. 30, p. 2; Ref. 31, pp. 160, 167, 176, 177, 185, and 186
Critical Habitat for the Federal Threatened Bull trout (Salvelinus confluentus) – Lower Columbia River Basin
0 feet 100 Ref. 30, pp. 2, 58, and 59; Ref. 38, pp. 45 and 75; Ref. 39,
pp. 4, 5, and 6
113
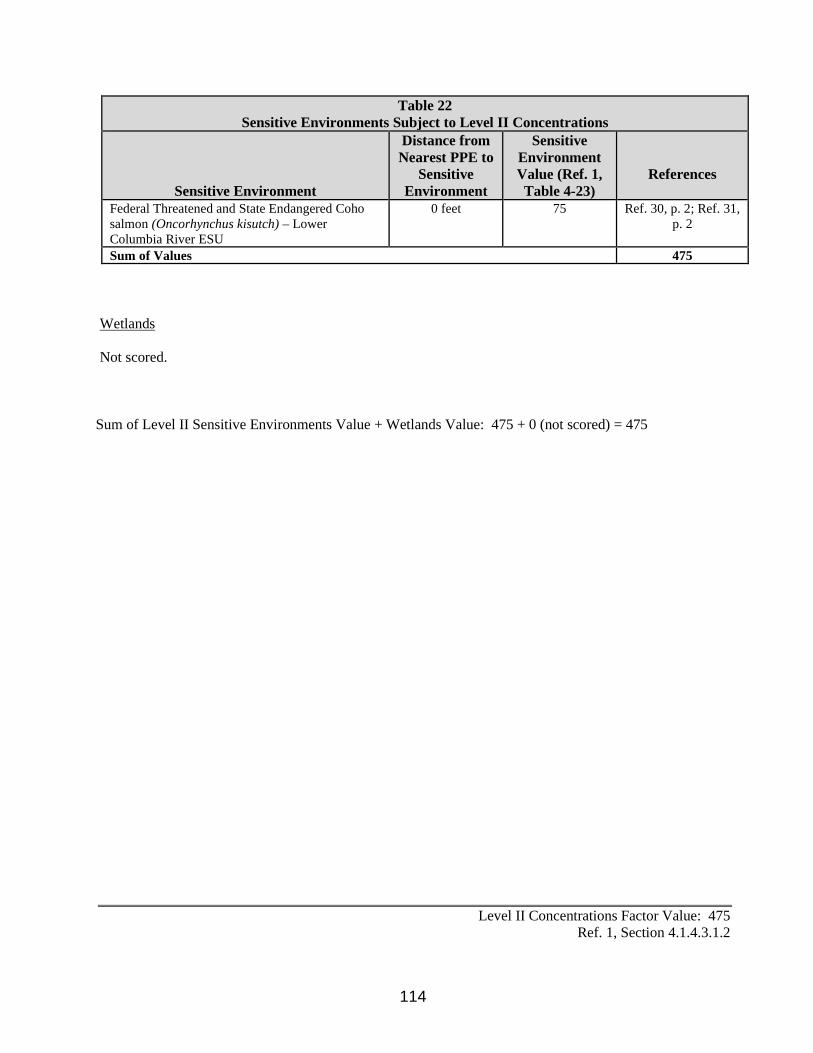
Table 22 Sensitive Environments Subject to Level II Concentrations
Sensitive Environment
Distance from Nearest PPE to
Sensitive Environment
Sensitive Environment Value (Ref. 1, Table 4-23)
References
Federal Threatened and State Endangered Coho salmon (Oncorhynchus kisutch) – Lower Columbia River ESU
0 feet 75 Ref. 30, p. 2; Ref. 31, p. 2
Sum of Values 475
Wetlands
Not scored.
Sum of Level II Sensitive Environments Value + Wetlands Value: 475 + 0 (not scored) = 475
Level II Concentrations Factor Value: 475 Ref. 1, Section 4.1.4.3.1.2
114
SWOF/ Environment – Potential Contamination
4.1.4.3.1.3 Potential Contamination
Potential Sensitive Environment Targets
Not Scored.
Potential Wetland Frontages
Not scored.
Potential Contamination Factor Value: Not Scored
115