how to succeed by doing nothing
TRANSCRIPT

How to Succeed by Doing Nothing: Cotton Compensationafter Simulated Early Season Pest Damage
Lewis J. Wilson,* Victor O. Sadras, Simone C. Heimoana, and Dallas Gibb
ABSTRACT are difficult to obtain because, for instance, the smallsize and fast movement of thrips and the elusive behav-Clarifying the amount of pest damage that can be tolerated withoutior of green mirids. Accurate estimates of Helicoverpajustifying insecticidal control will be useful in reducing insecticide usespp. can be made, but often plants are found damagedand in development of integrated pest management (IPM) systems.with no Helicoverpa spp. being observed. These issuesThis study investigated the ability of irrigated, high-yielding cottonmake thresholds based on pest abundance alone less(Gossypium hirsutum L.) to recover from artificially applied damagereliable, undermining grower confidence and encourag-simulating that of early season insect pests. Six experiments were
done across five cotton-growing seasons. Damage included defolia- ing use of preventative insecticide applications. Under-tion, terminal damage, and flower bud removal in a range of timings, standing the capacity of cotton to recover or compensatecombinations, and intensities. Crop yield was unaffected by defoliation for early season pest damage will enable pest thresholdsapplied before first flower buds appeared, even when 100% of true to be coupled with damage thresholds. This will allowleaves were removed on three occasions (Nodes 2, 4, and 6). Crop in the development of improved IPM systems for cottonmaturity was affected by sustained high levels of leaf loss with a peak by providing a more rational basis for pest control de-delay of 10 d after 100% defoliation three times. Up to three light cisions.tip damage events or one heavy damage event had no effect on yield Cotton can recover from a degree of early pest dam-and only a slight effect on crop maturity (�5-d delay to harvest).
age, often without loss of yield or delay in crop maturity,Heavy early fruit loss (100% fruit removal from the first four fruitinga process known as compensation. Compensation inbranches) did not affect yield but caused a delay in maturity of ≈7 d.cotton has been reported following damage by thripsEquations describing the relationship between damage type, intensity,(Terry, 1992; Sadras and Wilson, 1998) and by Helicov-and repetition and the yield and maturity of cotton were developederpa spp. (Brook et al., 1992a) and has been reportedand used in sensitivity analysis to define tentative damage thresholdsin range of other plant species (Trumble et al., 1993).for IPM systems in cotton.Given the difficulties of manipulating populations ofpests in field experiments, manually inflicted or simu-
Cotton is attacked by a range of insect pests, some lated damage is often used to help understand the re-of which are prevalent through the early portion sponses of plants to herbivore damage. Simulated dam-
of the growing cycle, such as tobacco thrips (Thrips age is different from real pest damage, in part becausetabaci Lindeman), tomato thrips [Frankliniella schult- simulated damage does not involve the saliva of thezei (Trybom)], the native budworm [Helicoverpa punc- pests, which may affect plant responses. Nevertheless,tigera (Wallengren)], the cotton bollworm [H. armigera because it can be inflicted more uniformly, it provides(Hubner)], the green mirid [Creontiades dilutus (Stal)], valuable insights into likely plant responses to damage.and the cotton tip-worm (Crocidosema plebejana Importantly, manual removal of buds and leaves triggersZeller) (Pyke and Brown, 1996). Application of insecti- morphological and physiological plant responses thatcides to prevent damage caused by these pests (i) in- closely mimic major changes induced by actual pestcreases the risk of inadvertent environmental pollution, damage (Brook et al., 1992a,b,c; Sadras, 1996a,b).(ii) increases selection pressure for insecticide resistance We investigated the response of cotton to the typesboth in target and nontarget pests, and (iii) often re- of damage similar to that most likely to be inflicted byduces the abundance of beneficials, thereby contributing insect pests early in the season. This includes reducedto secondary pest outbreaks (Wilson et al., 1998). Nota- leaf area (thrips damage); death of the apical meristem,bly, the pest thrips are also important predators of the known as tipping out (thrips, mirids, tip-worm, or Heli-eggs of twospotted spider mite (Tetranychus urticae coverpa spp.), and damage to and loss of flower budsKoch), which is a key secondary pest (Wilson et al., or squares (Helicoverpa spp. or mirids). As different1996). It is therefore critical to accurately assess if pests pests cause different degrees of terminal damage, werequire control, taking into account the capacity of the also considered the effects of different severities of tipplant to recover from some degree of damage. damage. While a number of studies have investigated
Accurate estimates of the abundance of some pests the responses of cotton to defoliation, and loss of vegeta-tive and reproductive buds, most reports have dealt witha single type of damage (Evenson, 1969; Bishop et al.,L.J. Wilson and S.C. Heimoana, CSIRO Division of Plant Industry1977; Brook et al., 1992b; Danobrega, 1993; Longer,and Australian Cotton Cooperative Research Centre, and D. Gibb,1993; Sadras, 1996b). Here, we emphasized a combina-NSW Agriculture and Australian Cotton Cooperative Research Cen-
tre Cotton Research Unit, Locked Bag 59, Narrabri, NSW, Australia, tion of damage types (defoliation, tipping out, fruit loss),2390; V.O. Sadras, CSIRO Land and Water, Private Bag No. 2, Glen as they often coincide in the field and imposed extremeOsmond, South Australia, 5064. Received 21 Dec. 2002. *Correspond- levels of damage to assess their effects on yield anding author ([email protected]).
timing of maturity of field-grown cotton.Published in Crop Sci. 43:2125–2134 (2003). Crop Science Society of America Abbreviations: DAS, days after sowing; DWT, dry weight; IPM, inte-
grated pest management.677 S. Segoe Rd., Madison, WI 53711 USA
2125

2126 CROP SCIENCE, VOL. 43, NOVEMBER–DECEMBER 2003
exception of Exp. 1, the cotyledons were not damaged, as weMATERIALS AND METHODSnoticed they generally suffer little pest damage. Light terminal
Six experiments were done across five cotton-growing sea- damage, simulating damage by thrips, mirids, or Helicoverpa,sons (Exp. 1, 1994-1995; Exp. 2 and 3, 1996-1997; Exp. 4, 1997- involved pinching out the terminal and the surrounding two1998; Exp. 5, 1999-2000; and Exp. 6, 2000-2001) to allow for unfurled leaf primordia with curved forceps. Cotton tipwormdifferent damage combinations and for differences between bores down through the terminal into the stem cortex, oftenseasons. Experiments 1, 2, 4, 5, and 6 were conducted at the resulting in the death of the terminal and of one or two nodesAustralian Cotton Research Institute (30�13� S, 149�47� E), below the terminal. Such heavy tip damage was simulated by25 km west of Narrabri in New South Wales. Experiment 3 pinching off the terminal and upper two nodes, as defined bywas done on a commercial cotton property, Redmill, ≈120 km the presence of unfurled leaves. In some experiments, defolia-northeast of Narrabri, NSW. tion and tip damage were imposed repeatedly to better simu-
All experiments were sown into 1-m beds in early October late the effect of prolonged damage to the plant by a pestand grown under conditions of nonlimiting N (120–150 kg N population. Where terminal damage was repeated, all of theha�1 applied presowing) or water inputs (furrow irrigated at new dominant terminals were removed, which meant that fora soil water deficit of ≈60 mm below field capacity), in line some plants, more than one terminal was removed. Helicov-with commercial practices. To prevent damage from pests, erpa spp. damage was simulated by removing all of the youngwhich could confound manually applied damage, systemic in- squares from the first four sympodial branches. The growthsecticides were applied at sowing with the seed [phorate (O,O- stage of plants was defined each time damage was inflicteddiethyl S-ethylmercaptomethyl dithiophosphate) at 600 g a.i. by counting the number of main-stem nodes of 20 undamagedha�1 in 1994-1995, aldicarb (2-methyl-2-methylsulfenylpropio- plants in an area immediately adjacent to the experiment.naldehyde) at 450 g a.i. ha�1 for the remainder]. Experiments Where damage resulted in significantly delayed growth, thewere also sprayed with insecticides in accordance with stan- timing of repeated damage was delayed as necessary to ensuredard thresholds to prevent damage from pests not controlled that sufficient regrowth had occurred for the damage to beby phorate or aldicarb and to prevent damage after the efficacy imposed accurately.of these compounds had declined (4–6 wk after emergence). The effect of damage was assessed in terms of yield ofIn Exp. 1, the nontransgenic cultivar Siokra V15 was used, cotton lint and the date of maturity of the crop. Maturity waswhich is an okra-leaf variety. In Exp. 2 to 6, a normal-leaf defined as the date at which 60% of mature fruit (bolls) hadtransgenic cotton cultivar, Sicala V 2i, was used, which contains matured and dehisced (Snipes and Baskin, 1994). We har-a gene from Bacillus thuringiensis that produces the insectici- vested all of the open bolls each week from each plot, begin-dal protein, CryIAc, and provides control of Helicoverpa spp. ning from the date that open bolls were first found in the
In each experiment, a randomized block design was used. experiment. Analysis of variance was used to test for differ-Five replicates were used in Exp. 1 and four in the remainder. ences in yield, lint weight per mature boll, and date of cropIn Exp. 1 to 3, plots were 2 m long and 3 rows wide (3 m). maturity between treatments and the undamaged controlThe plots and blocks were laid out contiguously both end- (Genstat Version 5, Lawes Agricultural Trust, IACR, Ro-to-end and across-the-rows. The two outer rows of each plot thamsted, UK). When the analysis of variance was significant,were buffers across the rows, and in each plot the 0.5 m on Fisher’s Protected LSD was used to compare treatment meanseither end of the central row was a buffer. Only the middle with the control. The treatments imposed in each experiment1 m of cotton in the central row was used for yield and maturity and rationale is outlined below.assessments (described below). In Exp. 4, plots were 3 rowswide but were increased in length to 6 m to allow for destruc-tive samples to be taken (described below). As above, 1 m in Experiment 1—Defoliation and Tip Damagethe central row of each plot, with a buffer of 0.5 m at each
Treatments were (i) defoliation by removing 50% of theend was preserved for yield and maturity assessments. In allarea of all leaves, including the cotyledons, (ii) light tip damageexperiments, damage treatments were applied to all three rows(see description under Exp. 5), and (iii) the combination ofof each plot. Plant densities were in the range of 10 to 12(i) and (ii). Damage was imposed when plants had ≈3, 5, andplants m�1 across all experiments.8 nodes, either at each node individually (i.e., 3, 5, or 8), orThrips damage was simulated by leaf area removal of trueprogressively (i.e., 3, 3 plus 5, 3 plus 5 plus 8). There whereleaves and entailed cutting off the whole leaf at the top of the16 treatments in total, including an undamaged controlpetiole (100% reduction) or cutting off portions of leaves
to simulate different degrees of reduced leaf area. With the (Table 1). On each damage date, the number of main-stem
Table 1. Treatments imposed in each experiment and plant growth measurements taken.
Nodes tip damage inflicted (T) Defoliation (D) InteractionsMeasurements
Control DryExp. Light Heavy Nodes % removed Fruit (F) T � D T � D � F plants matter
1 3, 5, 8 – 3, 5, 8 50 No Yes No Yes No3 � 5 3 � 5, 503 � 5 � 8 3 � 5 � 8 50
2 2 � 4 – 2 � 4 50, 100 Yes Yes Yes Yes No2 � 4 � 6 � 8 50 No No No
3 2 � 4 – 2 � 4 50, 100 Yes Yes Yes No No2 � 4 � 6 � 8 50 No No No
4 – – 2 � 4 50, 75, 87.5, 100 No No No Yes Yes2 � 4 � 6 50, 75, 87.5, 100
5 3 3 – – – – – Yes No3 � 4 � 6 3 � 4 � 63 � 4 � 6 � 10 � 12 3 � 4 � 6 � 10 � 123 � 4 � 6 � 10 � 12 � 13 � 14
6 3 3 – – – – – Yes No3 � 6 � 9 3 � 6 � 93 � 6 � 9 � 11 � 12 3 � 6 � 9 � 11 � 123 � 6 � 9 � 11 � 12 � 14 � 15

WILSON ET AL.: COTTON COMPENSATION AFTER EARLY PEST DAMAGE 2127
nodes and total leaf area of undamaged plants, measured with Experiment 4a leaf area meter (LI-300, LI-COR Inc., Lincoln, NE), was
Experiment 4 investigated in more detail the plant re-recorded for four samples of five plants.sponses to defoliation in terms of yield and maturity, but alsoin terms of growth and development (Table 1). Defoliation
Experiments 2 and 3—Defoliation, Tip Damage levels of 0, 40, 60, 80, and 100% true leaf damage were im-and Fruit Loss posed. Each damage level was imposed at either Nodes 2 and
4 or at Nodes 2, 4, and 6. There were nine treatments in total.In these experiments, we investigated the effects of defolia-Destructive harvests of 0.5 m of row were collected to moni-tion imposed alone and in combination with light tip damage
tor the amount of leaf area actually removed and the recoveryand/or square removal (Table 1). The treatments were de-of plants in terms of mass (shoot � tap root) and leaf area.signed to simulate (i) moderate thrips damage: 50% defolia-Immediately following each damage event (28, 36, and 44 dtion of each leaf twice (when plants had two and four nodes)after sowing, DAS) and at 62 and 104 DAS, 0.5 m of row wasor four times (when plants had 2, 4, 6, and 8 nodes); (ii)harvested from the central row of each plot. The number ofmoderate thrips damage as in (i), followed by square loss, toplants in each 0.5 m was recorded and the plants partitionedsimulate damage by Helicoverpa spp.; (iii) heavy thrips dam-into leaves, squares, green bolls, open bolls, and either stemage: 100% defoliation twice (two and four nodes); (iv) heavyand stems plus tap-root (first three harvests) or stems and rootthrips damage as in (iii), with tip damage at the same times;separately (final two harvests). Total leaf area was determined(v) heavy thrips damage with square removal; (vi) heavy thripswith a leaf area meter, the samples dried at 80�C and the drydamage with tip damage at the same time, followed by squareweight (DWT) of each structure type recorded.removal; and (vii) square removal alone. There were 10 treat-
ments in total, including the undamaged control (see x-axisExperiments 5 and 6of Fig. 1). For Exp. 2, we recorded additional details of plant
growth status at each damage event by collecting four samples These experiments investigated the effects of different num-of five undamaged plants from similar cotton adjacent to the bers of events of heavy or light tip damage (Table 1). Lightexperimental area and counting the number of main-stem tip damage was repeated weekly three, five, or seven timesnodes and fruit for each plant and total leaf area of each group beginning from Node 2; heavy damage was inflicted one, three,of plants. These data were analyzed separately for Exp. 2, or five times beginning at Node 2. Repeated events of heavybut the yield and maturity data for both experiments were damage were often delayed for up to an extra week to allowanalyzed together for Exp. 2 and 3. time for sufficient regrowth for further damage to be imposed
accurately. There were seven treatments in total, including theundamaged control. These two experiments were replicates ofthe same experimental design and hence were analyzed to-gether.
RESULTSExperiment 1
Actual timing of damage was close to the nominaltreatments of 3, 5, and 8 nodes, that is, 3.5, 5.1, and 8.0nodes. At these stages, undamaged plants had leaf areasof 97, 222, and 662 cm2 respectively. Neither 50% defoli-ation nor tip damage, or the combination of the two,affected the number of harvested bolls per meter(109.6 � 1.7, mean � SE; F � 1.28; df � 4, 60; P �0.24), mean boll weight (2.2 � 0.01 g, mean � SE; F �1.75; df � 4, 60; P � 0.065), lint yield (240.8 � 3.8 gm�2; F � 0.97; df � 4, 60; P � 0.5) or maturity date(DAS) (179.1 � 0.5 d; F � 1.59; df � 4, 60; P � 0.1)of cotton, even when both defoliation and tip damagecombined were repeated on three occasions.
Experiments 2 and 3In Exp. 2, damage was imposed when undamaged
plants had 2.1, 3.9, 6.4, and 6.8 nodes and leaf areas of142, 197, 345, and 374 cm2, respectively. Square removalwas done on 19 Dec. 1996 when control plants had 12.8nodes, a leaf area of 2536 cm2, and six squares per plant.An average of 24.9 young squares were removed perFig. 1. Effect of defoliation, tip damage, and early fruit loss on matu-
rity of cotton in Exp. 2 and 3. Values are means � SE. Asterisks meter of row. This value is less than expected (i.e.,indicate treatments significantly different from the control at P � expect six squares per plant � 10 plants m�1 � 600.05. For treatments, F indicates removal of fruit from first four squares m�1 removed) because some of the squares onfruiting branches; 50L or 100L are percentages of the leaf tissue
later fruiting branches and some very small squares wereremoved; number of damage events is indicated by � 2 (twice)or � 4 (four times); and tip damage is indicated by T. overlooked in the field but were counted on plants parti-
2128 CROP SCIENCE, VOL. 43, NOVEMBER–DECEMBER 2003
tioned in the laboratory. The 100% defoliation treat- were analyzed on a per-plant basis, as there were strongeffects of plant density in earlier sample dates (28, 36,ments had delayed growth so removal of squares in
these plots was delayed until 30 December in the 100% and 44 DAS). Root, square, and boll DWTs were ana-lyzed on a per-square-meter basis, as plant density ef-defoliation twice treatments, when 37 squares m�1 were
removed, and until 7 January for the 100% defoliation fects were generally not significant at this stage.Leaf area and shoot DWT differed among damagetwice plus tip damage treatment, when 42 squares m�1
were removed. treatments and the control for dates following damage(28, 36, and 44 DAS) as expected (leaf area: F � 21.7In Exp. 2, the effect of damage on plant height (cm)
was assessed and both leaf damage and tip damage to 38.2; df � 8, 24; P � 0.001; DWT: F � 3.4 to 30.1;df � 8, 24; P � 0.01 to P � 0.001), with the exceptioncaused significant reductions. After the damage event
at Node 4, plants with 50% (9.4 � 0.4) and 100% (8.2 � of 50% defoliation three times, which was not differentfrom the control at 44 DAS (Fig. 2). At 62 DAS, the0.2) defoliation and 100% defoliation plus tip damage
(7.3 � 0.3) were shorter than the control (10.3 � 0.4) 50% defoliation treatments and the 75% defoliationtwice treatment were no different from the control, but(F � 12.7; df � 4, 95; P � 0.001). After the final damage
event at Node 8, plants with 50% defoliation twice the higher defoliation treatments were different (leafarea: F � 8.7; df � 8, 24; P � 0.001; DWT: F � 10.6;(14.6 � 0.4) were no different from the control (14.8 �
0.7), while plants with 50% defoliation four times df � 8, 24; P � 0.001). At 104 DAS, no treatments weredifferent to the control (leaf area: F � 0.55 to 38.2; df �(13.3 � 0.3), 100% defoliation twice (10.6 � 0.4) or
100% defoliation twice plus tip damage (8.8 � 0.3) were 8, 24; P � 0.81; DWT: F � 0.9; df � 8, 24; P � 0.53).The development of cotton with heavier damageshorter than the control (F � 36.9; df � 4, 95; P � 0.001).
Yield, yield components, and maturity for Exp. 2 and treatments was slower than the control. Node produc-tion of cotton with 100% defoliation twice (36 DAS:3 were analyzed together, with experiment as a treat-3.4 � 0.6; 44 DAS: 4.2 � 0.2 nodes) or three times (36ment in the ANOVA. Neither boll number (92.9 � 1.1DAS, 3.4 � 0.4; 44 DAS, 4.5 � 0.3) was behind that ofm�2; F � 1.64; df � 9, 63; P � 0.12), boll weight (2.12 �the control (36 DAS: 5.0 � 0.5; 44 DAS, 6.4 � 0.3) (360.02 g; F � 1.65; df � 9, 63; P � 0.12) nor lint yieldDAS: F � 2.37; df � 8, 24; P � 0.049; 44 DAS: F �(196.0 � 2.9 g m�2; F � 1.49; df � 9, 63; P � 0.17)7.1; df � 8, 24; P � 0.001). Other treatments were similarwere affected by early season defoliation, tipping out,to the control on all dates.or square removal, even in the treatments combining
Specific leaf weight [DWT of leaves (g)/leaf area (m2)]100% leaf removal and tipping out on two occasionsof damaged and undamaged treatments was comparedwith early square loss.as it could indicate differences in leaf thickness. SpecificThere was a significant interaction between experi-leaf weight was not different among treatments at 28ments, defoliation, and square damage (F � 2.91; df �or 36 DAS, which was immediately after the first and3, 50; P � 0.044) (Fig. 1) for crop maturity. On plantssecond damage event, or at 62 or 104 DAS (F � 1.88with no square damage, moderate defoliation (50%to 2.35; df � 8, 24; P � 0.051 to 0.11). However, thetwice or four times) caused a small but significant delayspecific leaf weight of all treatments, except 50% defoli-of 3 to 6 d across both experiments. Heavier defoliationation twice, was lower than the control at 44 DAS,(100% twice) caused a significant delay, which wasindicating that leaves of damaged plants could be thin-longer in Exp. 2 (19 d) than Exp. 1 (13 d). When squarener than those of the control (F � 3.69; df � 8, 24; P �damage was combined with moderate defoliation, de-0.006) (Table 2).lays (8 to 11 d) were similar to that caused by square
Tap-root DWT at 62 DAS was reduced, compareddamage alone (8 to 9 d). This means that square damagewith the control, by most defoliation treatments (F �increased the delay from moderate defoliation by ≈4 d,12.0; df � 8, 23; P � 0.001) with the exception of theindicating that the effect of square damage was less than50% defoliation twice treatments (Table 2). At 104additive (i.e., extended maturity by 4 d rather than 8 d).DAS, there was no difference in root DWT (F � 0.9;When square damage was combined with heavy defolia-df � 8, 24; P � 0.56). Square biomass was lower in thetion, the increase in the delay in maturity was additivemore severe damage treatments at 62 DAS, as indicatedfor Exp. 1; that is, 13 to 21 d, an increase of 8 d. Inby square DWT (F � 6.2; df � 8, 24; P � 0.001)Exp. 2, however, addition of square damage caused little(Table 2). At 104 DAS, most damage treatments hadadditional delay; that is, 19 to 21 d, an increase of 2 d.greater square biomass than the controls (F � 6.4; df �8, 24; P � 0.001), especially the most severe damageExperiment 4 treatment. Boll biomass at 104 DAS was also affectedby treatments (F � 4.3; df � 8, 24; P � 0.002) with bollDamage treatments were applied at 2.6, 4.9, and 6.4
nodes, which occurred at 28, 36, and 44 DAS, respec- DWT being lower than the controls in the two 100%defoliation treatments (Table 2). Allometric analysis oftively. As expected leaf area differed between defolia-
tion treatments (leaf removal twice: F � 142; df � 4, reproductive allocation [slope of ln(reproductive DWT)against ln(vegetative DWT)] was lower in many of the27; P � 0.001; leaf removal three times: F � 185; df � 4,
42; P � 0.001) (Fig. 2). heavier damage treatments (F � 4.1; df � 8, 24; P �0.003) in the period between 62 and 104 DAS, indicatingDamage resulted in reductions in total leaf area (true
leaves plus cotyledons), total shoot DWT (Fig. 2), and lower allocation of resources to reproductive tissue inthese treatments during this period (Table 2).root DWT (Table 2). Data for leaf area and shoot DWT

WILSON ET AL.: COTTON COMPENSATION AFTER EARLY PEST DAMAGE 2129
Fig. 2. Relative leaf area and shoot dry weight of cotton in Exp. 4. Bars indicate Fisher’s Protected LSD values at P � 0.05; arrows indicatethe timing of damage treatments; and numbers on each graph indicate the actual leaf area (cm2) or shoot dry weight (g) of undamaged plantsat the time samples were collected. Legend refers to amount of leaf area removed (i.e., 100%) by the number of damage events (i.e., � 2or � 3).
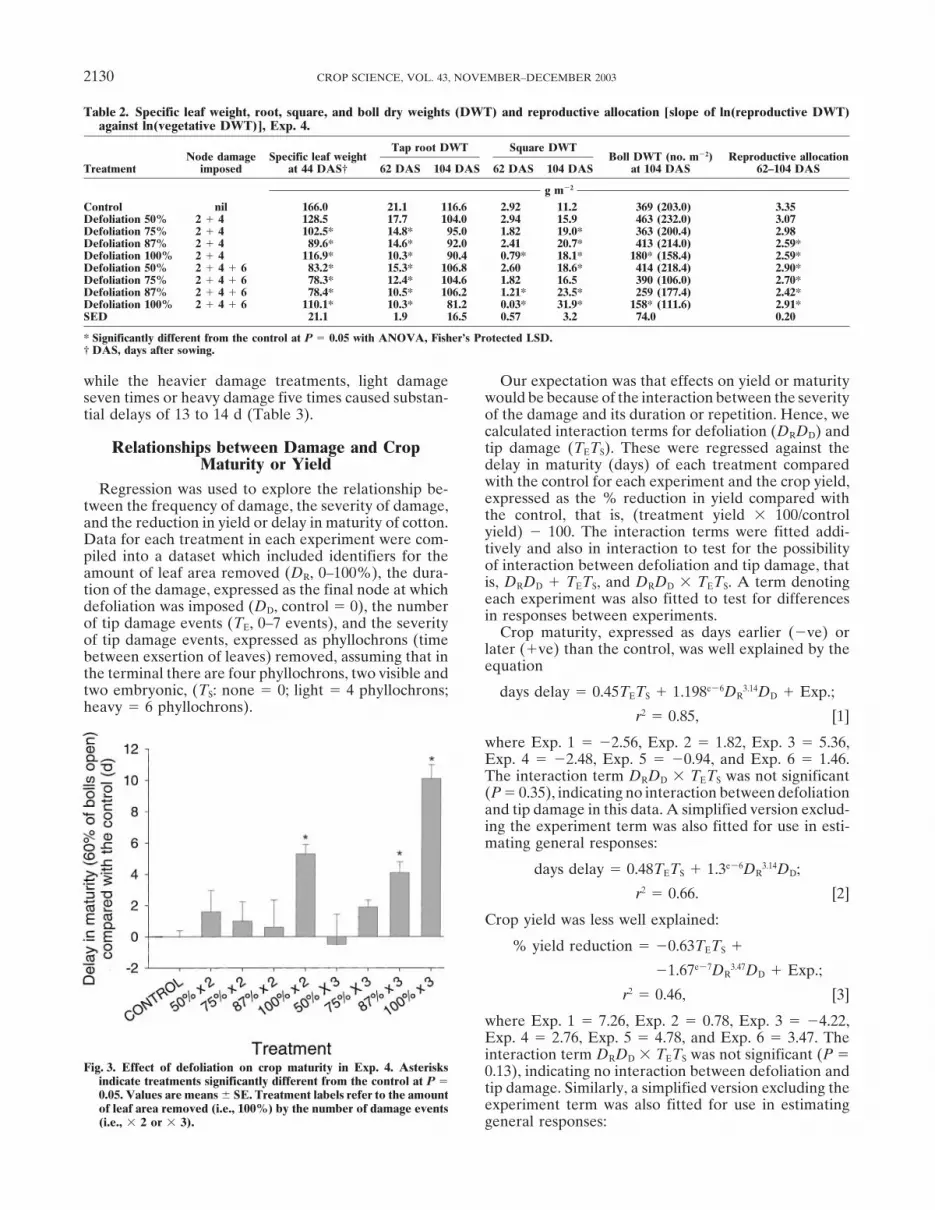
Defoliation had no significant effect on final boll num- df � 6, 36; P � 0.78) averaging 91.8 � 2.1 bolls m�2
(mean � SE) at maturity. Boll weight differed betweenber (125.8 � 3.6 m�2, F � 0.6; df � 8, 24; P � 0.73),experiments (Exp. 5, 1.86 g; Exp. 6, 2.05 g)(F � 13.3;mean boll weight (2.3 � 0.02 g, F � 0.6; df � 8, 24; P �df � 1, 3; P � 0.035) and among treatments (F � 3.5;0.87) or yield (288.1 � 7.8 g m�2, F � 0.4; df � 8,df � 3, 36; P � 0.008). Light damage seven times or24; P � 0.88). Only the heavier defoliation treatmentsheavy damage three or five times reduced boll weightaffected time of maturity (F � 9.2; df � 8, 24; P �(Table 3). Yield did not differ between experiments0.001) (Fig. 3). Defoliation of 87% twice, 100% twice,(F � 2.44; df � 1, 3; P � 0.21) but differed amongor 100% three times caused significant delays of ≈4, 5,treatments (F � 3.2; df � 3, 36; P � 0.012). Light damageor 10 d, respectively.seven times or heavy damage five times reduced yieldcompared with the control (Table 3). Maturity dateExperiments 5 and 6(DAS) differed between experiments (Exp. 5, 176.7 g;
Tip damage was inflicted up to seven times, when the Exp. 6, 188.6 d; F � 739.8; df � 1, 3; P � 0.001) andundamaged control had 3.4, 4.3, 6.1, 10.5, 12.2, 13.8, and among treatments (F � 23.6; df � 3, 36; P � 0.001).14.3 nodes in Exp. 5 or at 2.7, 5.9, 9.5, 11.2, 11.3, 14.9, Lighter damage treatments, light damage three timesand 15.2 nodes in Exp. 6. or heavy damage once caused minor delays of 2 to 5 d.
Boll number did not differ between experiments (F � Intermediate damage, light damage five times or heavydamage three times caused longer delays of 8 to 9 d,0.33; df � 1, 3; P � 0.6) or among treatments (F � 0.53;
2130 CROP SCIENCE, VOL. 43, NOVEMBER–DECEMBER 2003
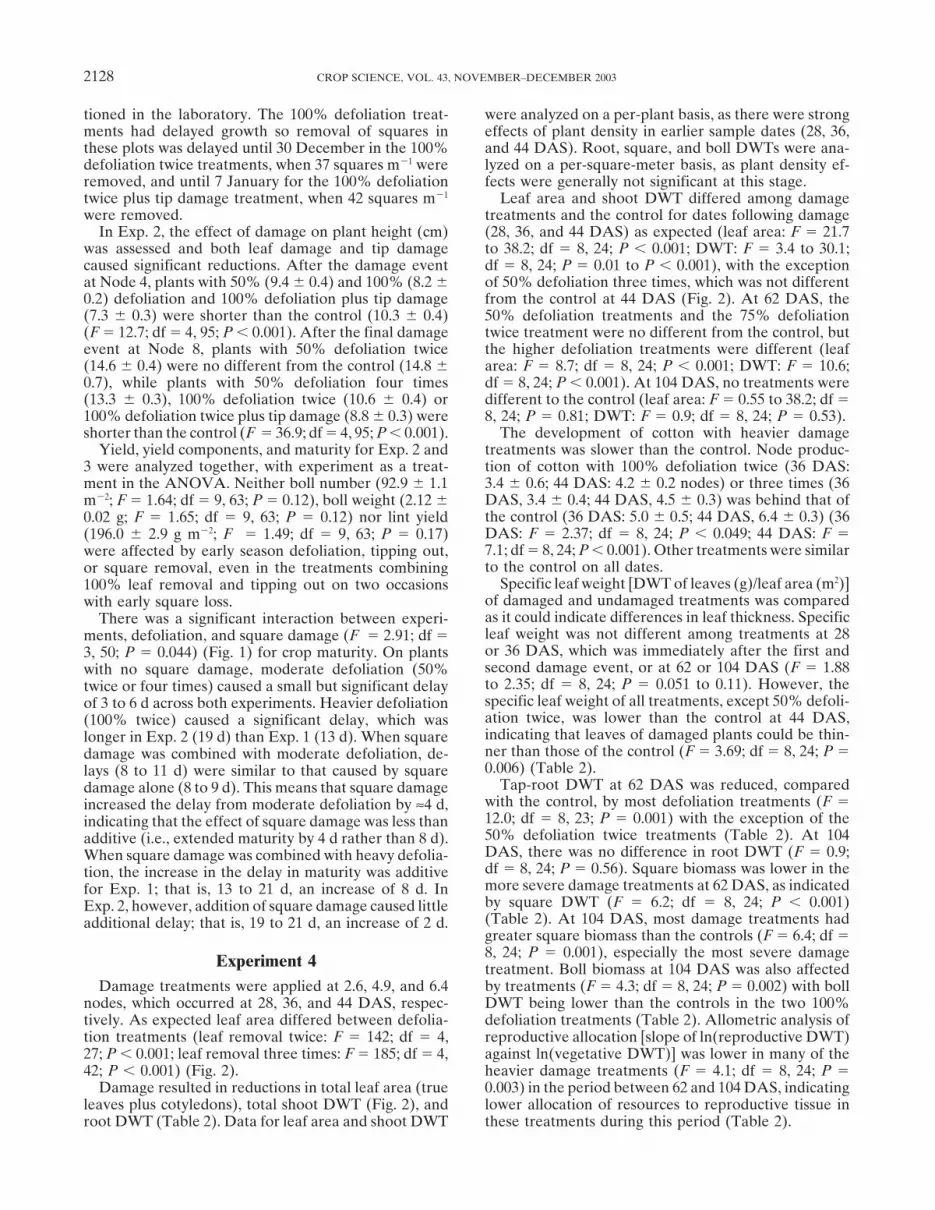
Table 2. Specific leaf weight, root, square, and boll dry weights (DWT) and reproductive allocation [slope of ln(reproductive DWT)against ln(vegetative DWT)], Exp. 4.
Tap root DWT Square DWTNode damage Specific leaf weight Boll DWT (no. m�2) Reproductive allocation
Treatment imposed at 44 DAS† 62 DAS 104 DAS 62 DAS 104 DAS at 104 DAS 62–104 DAS
g m�2
Control nil 166.0 21.1 116.6 2.92 11.2 369 (203.0) 3.35Defoliation 50% 2 � 4 128.5 17.7 104.0 2.94 15.9 463 (232.0) 3.07Defoliation 75% 2 � 4 102.5* 14.8* 95.0 1.82 19.0* 363 (200.4) 2.98Defoliation 87% 2 � 4 89.6* 14.6* 92.0 2.41 20.7* 413 (214.0) 2.59*Defoliation 100% 2 � 4 116.9* 10.3* 90.4 0.79* 18.1* 180* (158.4) 2.59*Defoliation 50% 2 � 4 � 6 83.2* 15.3* 106.8 2.60 18.6* 414 (218.4) 2.90*Defoliation 75% 2 � 4 � 6 78.3* 12.4* 104.6 1.82 16.5 390 (106.0) 2.70*Defoliation 87% 2 � 4 � 6 78.4* 10.5* 106.2 1.21* 23.5* 259 (177.4) 2.42*Defoliation 100% 2 � 4 � 6 110.1* 10.3* 81.2 0.03* 31.9* 158* (111.6) 2.91*SED 21.1 1.9 16.5 0.57 3.2 74.0 0.20
* Significantly different from the control at P � 0.05 with ANOVA, Fisher’s Protected LSD.† DAS, days after sowing.
while the heavier damage treatments, light damage Our expectation was that effects on yield or maturitywould be because of the interaction between the severityseven times or heavy damage five times caused substan-
tial delays of 13 to 14 d (Table 3). of the damage and its duration or repetition. Hence, wecalculated interaction terms for defoliation (DRDD) andtip damage (TETS). These were regressed against theRelationships between Damage and Crop
Maturity or Yield delay in maturity (days) of each treatment comparedwith the control for each experiment and the crop yield,Regression was used to explore the relationship be-expressed as the % reduction in yield compared withtween the frequency of damage, the severity of damage,the control, that is, (treatment yield � 100/controland the reduction in yield or delay in maturity of cotton.yield) � 100. The interaction terms were fitted addi-Data for each treatment in each experiment were com-tively and also in interaction to test for the possibilitypiled into a dataset which included identifiers for theof interaction between defoliation and tip damage, thatamount of leaf area removed (DR, 0–100%), the dura-is, DRDD � TETS, and DRDD � TETS. A term denotingtion of the damage, expressed as the final node at whicheach experiment was also fitted to test for differencesdefoliation was imposed (DD, control � 0), the numberin responses between experiments.of tip damage events (TE, 0–7 events), and the severity
Crop maturity, expressed as days earlier (�ve) orof tip damage events, expressed as phyllochrons (timelater (�ve) than the control, was well explained by thebetween exsertion of leaves) removed, assuming that inequationthe terminal there are four phyllochrons, two visible and
two embryonic, (TS: none � 0; light � 4 phyllochrons; days delay � 0.45TETS � 1.198e�6DR3.14DD � Exp.;
heavy � 6 phyllochrons).r2 � 0.85, [1]
where Exp. 1 � �2.56, Exp. 2 � 1.82, Exp. 3 � 5.36,Exp. 4 � �2.48, Exp. 5 � �0.94, and Exp. 6 � 1.46.The interaction term DRDD � TETS was not significant(P � 0.35), indicating no interaction between defoliationand tip damage in this data. A simplified version exclud-ing the experiment term was also fitted for use in esti-mating general responses:
days delay � 0.48TETS � 1.3e�6DR3.14DD;
r2 � 0.66. [2]
Crop yield was less well explained:
% yield reduction � �0.63TETS �
�1.67e�7DR3.47DD � Exp.;
r2 � 0.46, [3]
where Exp. 1 � 7.26, Exp. 2 � 0.78, Exp. 3 � �4.22,Exp. 4 � 2.76, Exp. 5 � 4.78, and Exp. 6 � 3.47. Theinteraction term DRDD � TETS was not significant (P �
Fig. 3. Effect of defoliation on crop maturity in Exp. 4. Asterisks 0.13), indicating no interaction between defoliation andindicate treatments significantly different from the control at P � tip damage. Similarly, a simplified version excluding the0.05. Values are means � SE. Treatment labels refer to the amount
experiment term was also fitted for use in estimatingof leaf area removed (i.e., 100%) by the number of damage events(i.e., � 2 or � 3). general responses:

WILSON ET AL.: COTTON COMPENSATION AFTER EARLY PEST DAMAGE 2131
Table 3. Number of bolls, boll weight, and yield of treatments in combined Exp. 5 and 6.
Crop maturityNo. of tip
Damage type damage events Boll wt. Yield 60% open bolls Difference from control
g g m�2 DAS† dControl 0 2.12 193.4 175.1Light 3 1.99 192.1 179.8* 4.7Light 5 1.96 178.2 184.3* 9.2Light 7 1.81* 157.6* 189.6* 14.5Heavy 1 2.04 195.8 178.0 2.9Heavy 3 1.93* 176.5 183.2* 8.1Heavy 5 1.85* 161.4* 188.5* 13.4SED 0.08 12.15 1.56
† DAS, days after sowing.
% yield reduction � �0.41TETS � �1.41e�7DR3.47DD; exponential response to loss of leaf area in the seedling
stages (up to eight true leaves) (Eq. [1] and [2]), i.e.,r2 � 0.31. [4]defoliation had little effect on either yield or maturityuntil high levels, in excess of 90% removal, regardlessof how often imposed. For instance, at 44 DAS, plantsDISCUSSIONwith 100% true leaf removal three times lagged behind
Defoliation the controls by 1.7 nodes and at 62 DAS their leaf areaand leaf DWT were below that of the control. This delayDamage by pests such as thrips often results in re-in recovery probably explains the delays in both squareduced leaf area and size of cotton plants which is visuallyand boll production. Recovery of leaf area and plantvery striking (Sadras and Wilson, 1998). In field experi-DWT was complete by 104 DAS, and yield was notments involving actual thrips damage, the dynamics ofaffected, though maturity was, as would be expectedleaf area, expressed as the ratio between crops damagedfrom the delay in fruit production. These findings sug-by thrips and insecticide-protected crops, showed a typi-gest that complete, or almost-complete loss of leaf areacal biphasic pattern, including an initial phase whenresults in an extreme shortage of assimilate as new leafreductions in leaf area reached a maximum of 20 toarea developed during the early stages of recovery is50% ≈40 DAS, and a second phase when leaf area ineffectively a sink rather than a significant exporter ofcrops damaged by thrips increased faster than in con-assimilate. This shortage of assimilate may delay growth,trols (Sadras and Wilson, 1998). A similar biphasic pat-as indicated by delays in node production in Exp. 4, andtern that was displaced by ≈10 d was observed for shoothence ultimately result in delayed fruit developmentgrowth (Sadras and Wilson, 1998). Here, we were ablewith eventual delayed crop maturity and reduced yieldto reproduce very similar patterns of leaf area and shootif the delay pushes boll maturation into unfavorable con-dry matter reduction and recovery, summarized in Fig. 2.ditions.The overall similarity between the patterns of leaf area,
The mechanisms of recovery from such damage areshoot dry matter, crop yield, and maturity found innot clear; however, our results provide some supportprevious studies involving actual insect damage (i.e.,for the hypothesis of Sadras and Wilson (1998), thatSadras and Wilson, 1998), and the responses generatedreduced specific leaf weight may contribute to plantswith manual leaf removal reinforces the confidence inrecovering from defoliation. That is, defoliated plantsthis technique.are able to increase their leaf area, and hence lightWe found that moderate to intense levels of damage,interception, by making leaves thinner. This hypothesisup to 50 to 87.5% loss of true leaf area twice, hadwould need to be tested, however, with assessment oftransient effects on plant growth. Plants recovered fromthe specific leaf weight of individual leaves on damagedsuch damage rapidly with little effect on the onset ofvs. undamaged leaves. In this study, the younger averagefruiting, or ultimately on the yield or maturity of cotton.age of leaves on damaged plants may have caused aFor example, in Exp. 4, plants with 75% leaf area re-bias toward lower specific leaf weight that we cannotmoved twice had recovered in leaf area and DWT by 62exclude.DAS (34 d after damage). Earlier studies have similarly
Allometric analysis further indicated that treatmentsfound that large reductions in leaf area in excess ofwith more severe damage had a reduced allocation of75% are required before cotton yield was affected. Lanedry matter to reproductive structures, enhancing recov-(1959) simulated loss of 25, 50, 75, or 100% of leaf areaery of vegetative structures and, hence, leaf area index.at the seedling, squaring, flowering, or boll-filling stages.This enabled plants to recover without loss of yieldAt the seedling and squaring stages, only the 100% leafthough with delayed maturity, suggesting that the allo-removal treatments consistently reduced yield. Kerbymetric ratio of heavily damaged plants eventuallyand Keely (1987) also found that manual removal ofachieved that of undamaged plants. The postponementthe first two true leaves had no significant effect onof allocation to reproductive structures partially ex-early plant growth.plains the delay in crop maturity of heavily damagedLonger et al. (1993) and Kerby and Keely (1987)treatments. More frequent dry matter harvests wouldfound that severe artificial defoliation damage could
reduce the growth rate of cotton. We also found a similar allow greater discrimination between more and less se-

2132 CROP SCIENCE, VOL. 43, NOVEMBER–DECEMBER 2003
vere damage treatments in the rate and mechanism of compared with undamaged cotton, whereas heavy earlyfruit loss resulted in a loss of 63 kg lint ha�1. The combi-recovery following defoliation.nation of these treatments resulted in a gain of 100 kglint ha�1, hence Brook et al. (1992b) found that tip andTip Damagefruit damage were statistically additive. Nevertheless,
Our results show that cotton is able to compensate in Exp. 2 and 3 there was a nonsignificant trend forwell for repeated tip damage events up to a point. Cot- plants with both defoliation and tip damage to haveton tolerated up to seven light tip damage events without higher yields than plants with defoliation alone, sug-affecting yield and up to three without affecting matu- gesting that further investigation of the interactions be-rity. Lower amounts of heavy tip damage could be toler- tween tip damage and other types of damage may be jus-ated; for example, three events did not reduce yield and tified.one event caused only a minor delay in maturity. Othershave similarly reported a high tolerance of cotton for Evenness of Damageterminal damage. Brook et al. (1992b) reported that tipdamage applied at four or six true leaves or at first- In our studies, plants within a treatment were uni-
formly damaged; that is, all plants were damaged. How-square did not reduce yield and caused delays of 1 to4 d. They found in one experiment that early (Node 4) ever, pest distributions in cotton fields are rarely uni-
form, often showing patchy or aggregated distributionsor late (first square) damage resulted in a significantyield increase. (Wilson and Room, 1983; Wilson and Morton, 1993). It
is therefore likely that the distribution of damage is lessThe main effect of tip damage is to cause productionof vegetative branches (monopodia), which in turn pro- uniform than in our experiments. Our studies examine
the capacity of plants suffering a simulated level of dam-duce fruiting branches (sympodia). Tip damage couldtherefore be expected to cause an initial delay in the age to recover, that is, plant level responses. Sadras
(1996d), however, showed that the uneven distributiondevelopment of fruiting branches, but thereafter ahigher number of vegetative branches would potentially of damage allows for population level compensation;
that is, when “herbivore attack on one individual allowslead to a faster rate of production of fruiting branchesand therefore fruiting sites (Lei and Gaff, 2003). The another to grow more rapidly” (Crawley, 1983). Sadras
(1996d) compared crops that were uniformly tip dam-delay in reestablishment of vegetative branch growthand hence fruiting could be expected to be related to aged, uniformly undamaged, or unevenly damaged,
where every second plant was tip damaged, and foundthe severity and repetition of damage, as our resultsshow. Light tip damage could be expected to delay the evidence of strong plant–plant interactions. It is likely
that damage from thrips is uneven and this should beonset of fruiting less than heavy damage of a similarfrequency. The delay in fruiting caused by tip damage considered in future research.would be expected to have a greater effect on maturitythan yield, because provided growing conditions are Implications for Pest Managementadequate the plant should have time to mature a similar
The results presented here therefore confirm the con-fruit load, and our results support this assertion. Atclusion of Sadras and Wilson (1998), that early seasonsome point, extensive tip damage could be expected topest damage is often largely cosmetic, with little effectresult in yield loss as well as delayed maturity, as aon crop yield or maturity, despite its highly visual andplant’s growth is delayed sufficiently to push the fruitdramatic appearance. These experiments were all donematuration period into less favorable growing condi-in fully irrigated, well-fertilized crops in the lower Na-tions at the end of the season or because of the plant’smoi Valley, which is a full season region. Season length,capacity to develop a full canopy is curtailed, therebyas limited by temperature or water availability, and nu-reducing light interception and the plant’s assimilatetrient availability could constrain the potential abilitysupply and hence yield potential. Intraspecific variationof plants to compensate for herbivory (Oesterheld andin cotton responses to tip damage has been identifiedMcNaughton, 1991; Sadras, 1996c). Weather could alsoand also needs to be considered, as the recovery ofaffect recovery; for instance, in cooler regions there maysome varieties is faster following tip damage than othersnot be sufficient time for recovery before crop growth(Sadras and Fitt, 1997).is limited by temperature. In some of the cooler regionsin the more north-easterly cotton production zones ofInteraction between Damage Types the USA, thrips damage has often been shown to stuntgrowth, delay maturity, and reduce yield (Hawkins etThere was no significant interaction between defolia-
tion, tip damage, and fruit damage. The effects of each al., 1966; Johnson et al., 1988). Similarly, soil type couldalso be important; for instance, poorer soils with lowtype of damage were additive (see Eq. [1] and [2]). Tip
damage might be expected to promote recovery from water-holding capacity may not support as vigorousgrowth or recovery compared with the soils in this study.other forms of damage by increasing branching and,
hence, leaf area and fruiting sites. However, others have Our results therefore cannot be reliably extrapolatedto dryland crops, or to cooler or shorter season regions,similarly found that tip damage interacts additively with
other types of damage, such as fruit loss. For instance, which require further research.Improvements in IPM in Australian cotton need toBrook et al. (1992b) found that early tip damage in the
variety Siokra 1-1 increased yield by 211 kg lint ha�1 take into account the early season compensatory capac-

WILSON ET AL.: COTTON COMPENSATION AFTER EARLY PEST DAMAGE 2133
Table 4. Effect of defoliation of true leaves and of tip damage on maturity of cotton, from Eq. [2]. Underscoring indicates damagecombinations resulting in a delay of 5 d or less.
Defoliation Tip damage events
Light tip damage Heavy tip damage(4 phyllochrons) (6 phyllochrons)
Duration (node offinal damage) Removed None 1 2 3 4 1 2 3
% days of delay0 0 0.0 1.9 3.8 5.8 7.7 2.9 5.8 8.66 40 0.8 2.8 4.7 6.6 8.5 3.7 6.6 9.56 50 1.7 3.6 5.5 7.4 9.4 4.6 7.4 10.36 60 3.0 4.9 6.8 8.7 10.7 5.9 8.7 11.66 70 4.8 6.8 8.7 10.6 12.5 7.7 10.6 13.53 80 3.7 5.6 7.5 9.4 11.4 6.6 9.4 12.33 85 4.5 6.4 8.3 10.2 12.1 7.3 10.2 13.13 90 5.3 7.3 9.2 11.1 13.0 8.2 11.1 14.03 100 7.4 9.4 11.3 13.2 15.1 10.3 13.2 16.1
ity of cotton. This period is critically important in Aus- practice, we assumed that delay was significant if it waslonger than 5 d, which is the level that normally beginstralia, as it corresponds with the movements of benefi-
cial populations into cotton from other hosts. Disruption to cause concern for cotton growers. We assumed yieldloss was economically important if it was 4%. Thisof these populations by broad-spectrum insecticides can
increase the risk of outbreaks of secondary pests such was based on a grower wanting to do more than coverthe cost of control, that is, double his money, assumingas spider mites (Wilson et al., 1998) or aphids (Wilson
et al., 1999), as well as reducing the effect of beneficials that the crop is valued at $2800 U.S. ha�1 (7 bales, 227kg per bale, $400 per bale) and control costs of $50 ha�1on primary pests such as Helicoverpa spp. In terms of
IPM, therefore, the results suggest that reasonably high ($40 insecticide � $10 application), hence a yield lossof ≈2% is required just to recoup control costs. Bothlevels of defoliation and/or tipping-out can be tolerated
without the need to spray, thereby reducing costs, envi- crop yield and maturity are relatively insensitive to defo-liation, because of the power nature of their responseronmental pollution, and helping to conserve beneficial
insect populations. Significantly, amongst the pests of- to the proportion of leaf area removed. This can beseen for crop maturity in Fig. 3. Defoliation up to 70%ten targeted early season, the phytophagous thrips are
also important predators of mite eggs (Wilson et al., continuing as late as six true leaves has no economiceffect on yield or maturity. Single terminal damage1996).
A limitation of many current pest thresholds is that events had no effect on maturity or yield but multipleevents affected both. For instance, three light damagethey are developed assuming an average level of damage
from given pest density. However, a given pest density events or two heavy damage events caused a delay of5 d or yield loss exceeding 5%. In the field, plants arecan be associated with a range of levels of plant damage,
depending on earlier pest numbers and on plant growing often exposed to combinations of both tip damage anddefoliation, and it is possible to derive estimates of delayconditions. Thresholds that took into account both pest
abundance and plant damage levels would allow for or yield loss combining both types of damage (Tables4, 5).the possibility that a pest may exceed an abundance
threshold but plant damage does not exceed a damage The values shown in Tables 4 and 5 can serve astentative thresholds for plant damage that can be usedthreshold; therefore, control could be avoided or
delayed. in conjunction with pest abundance thresholds to allowbetter decisions. This is provided the growing condi-Simple sensitivity analyses were done with Eq. [2]
and [4] to help derive potential thresholds for manage- tions, soil types, crop nutrition, and irrigation are similarto those in these experiments. As an example, modifiedment of defoliation or tip damage (Tables 4, 5). As an
indication of a link between damage and commercial thresholds for thrips and Helicoverpa spp. in Australia
Table 5. Effect of defoliation of true leaves and of tip damage on yield of cotton, expressed as yield relative to undamaged cotton, fromEq. [4]. Underscoring indicates damage combinations resulting in yield reduction of 4% or less.
Defoliation Tip damage events
Light tip damage Heavy tip damage(4 phyllochrons) (6 phyllochrons)
Duration (node offinal damage) Removed None 1 2 3 4 1 2 3
%0 0 100 98 97 95 93 98 95 936 40 100 98 96 95 93 97 95 926 50 99 98 96 94 93 97 94 926 60 99 97 95 94 92 96 94 916 70 98 96 95 93 91 95 93 913 80 98 97 95 93 92 96 93 913 85 98 96 95 93 91 95 93 913 90 97 96 94 93 91 95 93 903 100 96 95 93 91 90 94 91 89

2134 CROP SCIENCE, VOL. 43, NOVEMBER–DECEMBER 2003
Kerby, T.A., and M. Keely. 1987. Cotton seedlings can withstandnow incorporate assessment of both pest abundance andsome early leaf loss. Calif. Agric. 2:18–19.plant damage and emphasize that both must be over
Lane, H.C. 1959. Simulated hail damage in cotton. Bull. 934. Texasthreshold before pest control is justified (Deutscher and Agric. Exp. Stn., College Station, TX.Wilson, 1999; Mensah and Wilson, 1999). The actual Lei, T.T., and N. Gaff. 2003. Recovery from terminal and fruit damage
by dry season cotton crops in tropical Australia. J. Econ. Entomol.damage thresholds used are based on the studies re-(in press).ported here as well as results of real pest damage studies
Longer, D., D.M. Oosterhuis, and M. Withrow. 1993. Cotton seedling(Brook et al., 1992a; Sadras and Wilson, 1998). In the recovery from partial and complete defoliation. Arkansas Farmfuture, the information obtained in Exp. 4, where the Res. 42:10–11.
Mensah, R.K., and L.J. Wilson. 1999. Integrated pest managementrecovery of damaged plants was monitored, may be usedguidelines for Australian cotton. Australian Cotton Cooperativeto link the effects of reduced leaf area from pests suchResearch Centre, Narrabri, NSW, Australia.as thrips with crop simulation models via their effects
Oesterheld, M., and S.J. McNaughton. 1991. Effects of stress and timeon plant growth. for recovery on the amount of compensatory growth after grazing.
Oecologia 85:305–313.Pyke, B.A., and E.H. Brown. 1996. The cotton pest and beneficialACKNOWLEDGMENTS
guide. Cotton Research and Development Corporation, Narrabri,We thank Dee Hamilton, Mark Laird, Allison Wales, Sally NSW, Australia.
Sadras, V.O. 1996a. Cotton responses to simulated insect damage:Kennedy, Lesley Burke, Deanne Johnson, Deirdre Lally, LesRadiation-use efficiency, canopy architecture and leaf nitrogenBauer, Lyn Gett, Trudy Staines, Kelly Scott, Mike Mennell,content as affected by loss of reproductive organs. Field Cropsand Kym Bush for technical assistance under trying conditions.Res. 48:199–208.Thanks to Greg Constable, Stephen Milroy, and Tom Lei
Sadras, V.O. 1996b. Population-level compensation after loss of vege-(CSIRO Plant Industry) for critical review of the manuscript.tative buds: Interactions among damaged and undamaged cottonThis research was funded by the Cotton Research and Devel- neighbours. Oecologia 106:432–439.
opment Corporation (Grants CSP46C, CSP74C). Sadras, V.O. 1996c. Cotton compensatory growth after loss of repro-ductive organs as affected by availability of resources and durationof recovery period. Oecologia 106:432–439.REFERENCES
Sadras, V.O. 1996d. Population-level compensation after loss of vege-Bishop, A.L., R.E. Day, P.R.B. Blood, and J.P. Evenson. 1977. Effect tative buds: Interactions among damaged and undamaged cotton
of damaging main stem terminals at various stages of flowering, neighbours. Oecologia 106:417–423.on yield of cotton in south-east Queensland. Aust. J. Exp. Agric. Sadras, V., and G. Fitt. 1997. Apical dominance: Variability amongAnim. Husb. 17:1032–1035. Gossypium genotypes and its association with resistance to insect
Brook, K.D., A.B. Hearn, and C.F. Kelly. 1992a. Responses of cotton, herbivory. Environ. Exp. Bot. 38:145–153.Gossypium hirsutum L., to damage by insect pests in Australia: Sadras, V.O., and L.J. Wilson. 1998. Recovery of cotton crops afterPest management trials. J. Econ. Entomol. 85:1356–1367. early season damage by thrips (Thysanoptera). Crop Sci. 38:
Brook, K.D., A.B. Hearn, and C.F. Kelly. 1992b. Responses of cotton, 399–409.Gossypium hirsutum L., to damage by insect pests in Australia: Snipes, C.E., and C.C. Baskin. 1994. Influence of defoliation on cottonManual simulation of damage. J. Econ. Entomol. 85:1368–1377. yield, seed quality, and fiber properties. Field Crops Res. 37:
Brook, K.D., A.B. Hearn, and C.F. Kelly. 1992c. Responses of cotton, 137–143.Gossypium hirsutum L., to damage by insect pests in Australia: Terry, L.I. 1992. Effect of early season insecticide use and squareCompensation for early season fruit damage. J. Econ. Entomol. removal on fruiting patterns and fiber quality of cotton. J. Econ.85:1378–1386. Entomol. 85:1402–1412.
Crawley, M.J. 1983. Herbivory: The dynamics of animal–plant interac- Trumble, J.T., D.M. Kolodny-Hirsh, and I.P. Ting. 1993. Plant com-tions. Blackwell Sci. Publ., Oxford. pensation for arthropod herbivory. Annu. Rev. Entomol. 38:
Danobrega, L., N.E.D. Beltrao, D.J. Vieira, M.D. Diniz, and D.M.P. 93–119.Deazevedo. 1993. Effect of plant spacing and of apical bud removal Wilson, L.J., L.R. Bauer, and D.A. Lally. 1998. Effect of early seasonperiod on herbaceous cotton. Pesqui. Agropecu. Bras. 28: insecticide use on predators and outbreaks of spider mites (Acari:1379–1384. Tetranychidae) in cotton. Bull. Entomol. Res. 88:477–488.
Deutscher, S., and L.J. Wilson. 1999. Insect thresholds. ENTOpak– Wilson, L.J., L.R. Bauer, and D.A. Lally. 1999. Insecticide-inducedIPM Guidelines Supporting Document 8. Australian Cotton Coop- increases in aphid abundance in cotton. Aust. J. Entomol. 38:erative Research Centre, Narrabri, NSW, Australia. 242–243.
Evenson, J.P. 1969. Effects of floral and terminal bud removal on the Wilson, L.J., L.R. Bauer, and G.H. Walter. 1996. ‘Phytophagous’yield and structure of the cotton plant in the Ord Valley, north thrips are facultative predators of two-spotted spider mites (Acari:western Australia. Cotton Grow. Rev. 46:37–44. Tetranychidae) on cotton in Australia. Bull. Entomol. Res. 86:
Hawkins, B.S., H.A. Peacock, and T.E. Steele. 1966. Thrips injury to 297–305.upland cotton (Gossypium hirsutum L.) varieties. Crop Sci. 6: Wilson, L.J., and R. Morton. 1993. Seasonal abundance and distribu-256–258. tion of Tetranychus urticae (Acari: Tetranychidae), the two spotted
Johnson, D.R., J.J. Kimbrough, and J.S. McConnell. 1988. The effect spider mite, on cotton in Australia and implications for manage-of thrips control on cotton as influenced by insecticides irrigation ment. Bull. Entomol. Res. 83:291–303.and variety. p. 144–145. In Beltwide Cotton Production Res. Conf., Wilson, L.T., and P.M. Room. 1983. Clumping patterns of fruit andNew Orleans, LA. 3–9 Jan. 1988. National Cotton Council of Amer- arthropods in cotton, with implications for binomial sampling. Envi-
ron. Entomol. 12:50–54.ica, Memphis, TN.