how much does online interview mode matter? - plos
TRANSCRIPT
RESEARCH ARTICLE
Audio, video, chat, email, or survey: How
much does online interview mode matter?
Maggie Oates*, Kyle CrichtonID, Lorrie CranorID, Storm Budwig, Erica J. L. Weston,
Brigette M. Bernagozzi, Julie Pagaduan
Carnegie Mellon University, Pittsburgh, Pennsylvania, United States of America
Abstract
In the design of qualitative interview studies, researchers are faced with the challenge of
choosing between many different methods of interviewing participants. This decision is par-
ticularly important when sensitive topics are involved. Even prior to the Covid-19 pandemic,
considerations of cost, logistics, and participant anonymity have increasingly pushed more
interviews online. While previous work has anecdotally compared the advantages of differ-
ent online interview methods, no empirical evaluation has been undertaken. To fill this gap,
we conducted 154 interviews with sensitive questions across seven randomly assigned
conditions, exploring differences arising from the mode (video, audio, email, instant chat,
survey), anonymity level, and scheduling requirements. We surveyed interviewers and inter-
viewees after their interview for perceptions on rapport, anonymity, and honesty. In addition,
we completed a mock qualitative analysis, using the resulting codes as a measure of data
equivalence. We note several qualitative differences across mode related to rapport, disclo-
sure, and anonymity. However, we found little evidence to suggest that interview data was
impacted by mode for outcomes related to interview experience or data equivalence. The
most substantial differences were related logistics where we found substantially lower eligi-
bility and completion rates, and higher time and monetary costs for audio and video modes.
Introduction
In 2018, two of the authors conducted a pilot interview study to probe consumers’ concerns
when making online purchases of sensitive items such as sex aids, illegal drugs, or medical
items. Fearing that participants would be wary to disclose their experiences to researchers,
we focused on designing an online interview that minimized privacy concerns. We chose to
eschew video in favor of instant messaging and invested substantial energy in a platform with
strong security and privacy guarantees. After the study, we realized that despite our efforts
against it, many participants had chosen to provide identifying information (e.g., a name or
personal email address) and a few expressed difficulties with using the anonymous chat sys-
tem. This experience led us to question whether our assumptions about mode and anonymity
were aligned with practical priorities. After searching the literature, we were left without satis-
fying guidance on our questions about how to choose an online interview mode and how
PLOS ONE
PLOS ONE | https://doi.org/10.1371/journal.pone.0263876 February 22, 2022 1 / 43
a1111111111
a1111111111
a1111111111
a1111111111
a1111111111
OPEN ACCESS
Citation: Oates M, Crichton K, Cranor L, Budwig S,
Weston EJL, Bernagozzi BM, et al. (2022) Audio,
video, chat, email, or survey: How much does
online interview mode matter? PLoS ONE 17(2):
e0263876. https://doi.org/10.1371/journal.
pone.0263876
Editor: Janet E Rosenbaum, SUNY Downstate
Health Sciences University, UNITED STATES
Received: April 26, 2021
Accepted: January 28, 2022
Published: February 22, 2022
Peer Review History: PLOS recognizes the
benefits of transparency in the peer review
process; therefore, we enable the publication of
all of the content of peer review and author
responses alongside final, published articles. The
editorial history of this article is available here:
https://doi.org/10.1371/journal.pone.0263876
Copyright: © 2022 Oates et al. This is an open
access article distributed under the terms of the
Creative Commons Attribution License, which
permits unrestricted use, distribution, and
reproduction in any medium, provided the original
author and source are credited.
Data Availability Statement: Research data cannot
be shared publicly due to data-sharing restrictions
present in the protocol approved by the CMU
Institutional Review Board resulting from the
much interviewees’ anonymity and perceptions of anonymity were likely to impact interview
results.
In the current literature, there are many guides outlining online interviewing methods [1,
2], most of which tend to provide general guidelines with a few examples from the authors’
experience or case studies. While useful, their recommendations often rely on conjecture
when discussing the topic of mode. For example, in their chapter “Remote Interviewing” [1,
p. 95-96], King and Horrocks suggest that
. . . people may be more willing to disclose personal information online than they would be
face to face (Joinson, 2005), probably due to the sense of anonymity they feel through com-
municating only by text. This tendency is likely to be present in any online interview tech-
nique, but the chatty, spontaneous style of IM [instant messaging] may be especially likely
to facilitate openness from participants.
Many researchers in survey methods and communication theory have explored the impact
of communication synchronicity, perceived anonymity, and other factors on interview-based
research (see Related Work for examples and discussion). However, these studies are often
conducted in specific contexts which limits broader applicability to qualitative interviewing
generally. For example, while a health survey may be interested in eliminating desirability bias,
a discursive qualitative researcher may be as interested in the retelling of a health event as hear-
ing its “true” form. Similarly, while a lower completion rate across modes might cause concern
for survey researchers concerned about self-selection bias, qualitative researchers are often
focused on diverse or purposive sampling instead.
In comparing across different types of interviews, a substantial body of work has grown
around online interviews and its use in qualitative research. However, these studies have
focused exclusively on evaluating the effect of the online medium, comparing in-person to
online interviews directly [1–7]. In contrast, the comparison between different types of online
interviews has been left largely unexplored, leaving little guidance for researchers when decid-
ing between different online platforms.
To address this gap, we conducted a mixed-methods study that randomized participants
across seven different interview conditions. Our primary research question in this study is
how do interview mode, scheduling requirements, and participant anonymity affect the expe-
rience of the interview and the data collected? As such, five of the conditions were used to eval-
uate differences across interview mode (video, audio, email, instant messaging, and survey). A
sixth condition did not require the participant to schedule their interview, in this case a second
survey condition, ahead of time and was used to evaluate the barrier posed by scheduling con-
straints. The seventh condition, a second chat interview, was designed to make the participant
feel that they were not anonymous in order to assess how a participant’s perception of ano-
nymity affected their responses. Our dependent measures included qualitative data equiva-
lence, rapport, completion rate, honesty, self-disclosure, and enjoyment. Surveys, which lack
the conversational aspect and spontaneous followup questions valued in traditional interviews,
are typically viewed as a distinct form of data collection. We chose to include surveys in our
evaluation of mode to provide a baseline for comparison and to specifically assess the effects of
scheduling. Acknowledging the inherent differences between these methods, most of our
quantitative comparisons are done both with and without the survey conditions. In total, we
conducted 154 online interviews between June and September 2019. Additional surveys were
collected from both interviewees and interviewers after each interview and the transcripts
were coded thematically to simulate a qualitative interview study.
PLOS ONE Audio, video, chat, email, or survey: How much does online interview mode matter?
PLOS ONE | https://doi.org/10.1371/journal.pone.0263876 February 22, 2022 2 / 43
sensitive nature of the topics discussed in
participant’s interviews. The interview protocol
contains questions that are highly sensitive in
nature regarding topics such as death, sex, and
relationships. Data collected during the interview
from participants often contained detailed
information about participant’s past experiences.
As such, the research team and the IRB agreed that
the risk of re-identification, participant safety in
participating in the study, and the potential mental
health concerns related to the sensitive topics
discussed in the interviews precluded, on an ethical
level, the distribution of this data publicly even in
an anonymized form. Aggregate data and results
are provided in the manuscript and/or Supporting
information files.
Funding: L.C. was named an Andrew Carnegie
Fellow in 2019. The associated award, provided by
the Carnegie Corporation of New York (https://
www.carnegie.org/), helped to fund this study. The
funders had no role in study design, data collection
and analysis, decision to publish, or preparation of
the manuscript.
Competing interests: The authors have declared
that no competing interests exist.
In this study, we provide a detailed comparison between the common methods of conduct-
ing online interviews, which even prior to the Covid-19 pandemic had become increasingly
used in qualitative research. With that in mind, we focus the interpretation of our results on
interviews as a data collection method commonly used in qualitative research, rather than
qualitative research methods more broadly. In this context, we find little evidence that inter-
view mode affects the data collected and that the largest observed differences pertain to logis-
tics, like eligibility and completion rates. Our contributions include: (1) the first systematic
comparison of common online interview modes, (2) a new mixed-method approach to evalu-
ate qualitative interview methods, and (3) practical advice for researchers designing online
interviews.
Related work
There is no one universal rubber-stamped method for conducting and analyzing qualitative
interviews. However, best practices have been developed across a broad set of academic disci-
plines. These guidelines, which form the foundation of our experimental design, have been
developed from a mix of theoretical grounding and practical experiential knowledge. In the
following sections, we highlight related work pertaining to interview best-practices, experi-
ments on survey modes and online communication psychology, and several empirical studies
comparing interview modes.
Desirable qualities of research interviews
King and Horrocks suggest three defining characteristics that make a good generic qualitative
interview. First, the flexibility to deviate from the interview script and allow for open-ended
follow up questions. Second, a focus on the interviewee’s actual experience rather than their
beliefs or opinions. Third, a positive relationship between the interviewer and the interviewee
[1, p. 3].
Within these bounds, interviewers and methods researchers have constructed a diversity of
(often overlapping) factors to help define what constitutes “actual experience” and evaluate the
interviewer-interviewee relationship.
Rapport and trust. Intuitively, it is not surprising that many sources providing practical
interview advice emphasize the importance of building rapport between the interviewer and
interviewee. Rapport has been described as the “key ingredient of successful qualitative inter-
viewing” [8]. Previous work has hypothesized that, in establishing a friendly and comforting
relationship, an interviewee may be more motivated to participate and to provide accurate
information during an interview [9]. However, researchers have also argued that high levels of
rapport may motivate the interviewee to alter their responses to align with what they think the
interviewer wants to hear or are generally more socially acceptable. This problem, also known
as social desirability bias, is particularly challenging in interviews on sensitive topics where an
interviewee’s true behavior may not align socially defined norms [10].
Evaluating and measuring rapport as an operational concept has been criticized for its
ambiguity and lack of structure [11]. Yet despite its murky underpinnings, rapport is widely
recognized and discussed among interview researchers. Practical advice for building rapport
includes negotiating clear expectations, dressing to an appropriate level of formality, mirroring
terminology used by participants, and avoiding judgmental response [1]. Previous studies have
measured rapport using a variety of methods. Hill and Hall (1963) evaluated rapport using
post-interview surveys in which interviewer reported how ill-at-ease they felt during the inter-
view and the degree to which the respondent was favorable to the interview [8]. Rapport has
also been measured using eye contact [12], attentiveness [12, 13], interviewee motivation [1],
PLOS ONE Audio, video, chat, email, or survey: How much does online interview mode matter?
PLOS ONE | https://doi.org/10.1371/journal.pone.0263876 February 22, 2022 3 / 43
and empathetic moments [14]. Due to the multiple interview conditions evaluated in this
study, most conducted without being able to see the interviewee, we opted for a self-reported
measure based on Hill and Hall’s questionnaire.
Honesty. In human subjects research, whether qualitative or quantitative, researchers face
the fundamental challenge of accurately capturing how participants behave and think in the
real world. This can be particularly challenging when using self-reported measures or inter-
view responses, as the validity of the data collected is reliant on the honesty of the participant’s
responses. However, due to the lack of ground truth information, a participant’s honesty is dif-
ficult to assess directly. This has been of particular interest to researchers who focus on sensi-
tive behaviors like sexual activity and drug use. Fortunately, previous work in this area has
found that self-reported measures of honesty are noisy but often correlated with actual behav-
ior [15–17]. Therefore, we included a self-reported honesty measure in this study.
Self-disclosure and intimacy. While self-disclosure has many definitions, we prefer that
of Moon (2000) which simply defines it as “any personal information that a person communi-
cates to another” [18]. Conceptually, self-disclosure is closely related to the intimacy of a con-
versation. To measure this in an interview, self-disclosure is often separated into breadth, the
quantity of different topics of information shared, and depth, the amount of personal detail
shared in each topic [19]. Measures of self-disclosure have included counting the number of
topics volunteered by participants [19], using a survey instrument [20], asking participants to
self-rate their level of disclosure, asking conversation partners to rate each other, and using
independent coders [20, 21]. In this study we employ two of these methods, one that leverages
a previously validated instrument and another that applied qualitative coding to interview
transcripts.
Other factors that affect interview experience
While the purpose of this study is to measure the effects of interview mode, previous literature
has identified several other factors that impact the interview experience and, as a result, the
data that is collected.
Interviewer effects. Racism and race [22, 23], gender, age, and other identity factors can
affect interview data and the interviewer-interviewee relationship [24, 25]. Several studies
speculate that online modes with fewer visual cues (e.g. email) can minimize these effects. This
is supported by evidence that interviewer effects are smaller in telephone interviews than face-
to-face ones [3]. While we aimed to capture interview affects across mode, we also wanted to
minimize this effect within mode. Therefore, our three interviewers were all of similar age and
were of the same race and gender.
Sensitive content. In their review of previous studies involving surveys on sensitive topics,
Tourangeau and Yan (2007) found that the inclusion of sensitive topics reduced the response
rate in some surveys [26]. Sensitive topics have introduced additional challenges for research
teams including intrusiveness, the threat of disclosure, potential consequences of disclosure
such as legal sanctions, and social desirability bias [6]. Nandi and Platt (2017), in their study
comparing face-to-face and telephone questionnaires, did not observe any mode-related dif-
ferences except in response to a sensitive question on political identity [27]. This suggests that
sensitive questions may heighten differences observed across mode. Since the interview ques-
tions in this study focused on sensitive topics, the research team took several steps to protect
interviewees and interviewers. It was made clear to the interviewees in the beginning of the
interview that they could skip any questions they felt uncomfortable with and at any point dur-
ing or after the interview they could rescind their participation in the study. The study protocol
included a process to follow in cases where interviewees had strong negative reactions to the
PLOS ONE Audio, video, chat, email, or survey: How much does online interview mode matter?
PLOS ONE | https://doi.org/10.1371/journal.pone.0263876 February 22, 2022 4 / 43
interview and ways to escalate any problems encountered during or after. The protocol also
included contingency plans for cases where the interviewer felt uncomfortable or unsafe
including the ability to end the interview immediately at their discretion.
Social desirability bias. Social desirability bias is a phenomenon where interviewees alter
or withhold their response because they are aware of the possible social implications of their
intended answer. Social desirability bias has been interpreted by researchers as something that
is inherent in the participant, possibly a part of their personality, or inherent to the topic of the
interview question, as some behaviors and preferences are socially less accepted [28]. While
the factor is difficult to measure directly, it is closely related to rapport, honesty, and self-dis-
closure. In our research design, we attempted to limit the opportunity for social desirability
bias by randomizing interviewers across mode and collecting self-reported measures of hon-
esty and rapport to validate our results.
Perceived anonymity. Often, interactions conducted in an online setting provide users
with greater opportunities for anonymity. Previous work has hypothesized that this factor cre-
ates opportunities for greater self-disclosure than in face-to-face conversation. Suler (2004)
hypothesized that there exists an online disinhibition effect that allows individuals to express
different aspects of themselves online that they would not in person [29]. Supporting this the-
ory through empirical evidence, Joinson (2001) concluded that when people feel less identifi-
able, they tend to reveal more information about themselves and are less influenced by social
desirability bias [30]. However, this effect may be context specific as Hollenbaugh and Evereett
(2013) found an opposite relationship between anonymity and disclosure in their study of per-
sonal blogs online [31].
To measure perceived anonymity, Hite et al. (2014) developed and validated a five-ques-
tion, context-independent measurement instrument to capture how users perceived their own
anonymity [32]. In this study we leverage this instrument to assess how anonymous users felt
across conditions.
Evaluating online communication
Research in the fields of information processing and communication offer many useful para-
digms to assess interviews in an online context. However, taken as a whole, these disciplines
provide ambiguous or even contradictory recommendations. Media Richness Theory (MRT)
proposes that “media richness” should be a key factor in choosing interview mode. The theory
further claims that face-to-face communication is richer than digital communication and
online modes that more closely resemble in-person communication, like video conferencing,
are better suited for complex tasks like interviews [33]. However, a recent empirical study
comparing audio and video communication online found that groups were more successful in
collaboratively solving problems using audio conferencing. The study observed that groups
interacted more cohesively, speaking out of turn less frequently, when there was a lack of video
cues. As a result, teams were more successful in solving group problems, an ability known as
Collective Intelligence (CI) [34]. In addition, Dennis et al. (2008), in their expansion on Media
Richness Theory called Media Synchronicity Theory, push back on the idea that media rich-
ness is the ultimate quality for communication, concluding that there is no single media that is
best for all tasks. They point out that that asynchronous modes are stronger for “conveyance
processes” that convey or transmit information, and synchronous modes are better for “con-
vergence processes” that find common meaning from information. [33]. While most research
interviews are likely hybrid processes, they tend to have a greater focus on conveyance rather
than convergence.
PLOS ONE Audio, video, chat, email, or survey: How much does online interview mode matter?
PLOS ONE | https://doi.org/10.1371/journal.pone.0263876 February 22, 2022 5 / 43
Other relevant theoretical models include the Social Information Processing theory (SIP)
and the Social Identity Model of Deindividualization (SIDE). In their systematic review of
studies that compared online and offline communication, Nguyen et al. (2012) applied these
communication theories to predict whether self-disclosure varies by digital modes. However,
they found that some theories did not clearly apply to digital modes and that some yielded con-
tradictory predictions. Furthermore, in examining the literature as a whole, they found an
inconclusive mix of studies reporting more, equal, and less self-disclosure for online modes as
compared to offline [21]. In an earlier review of 18 experimental studies comparing group
face-to-face communication with digital communications, Bordia (1997) found that conversa-
tions via digital communication tend to be longer, generate more ideas, have greater equity in
participation, and reduce shared social pressures among participants. However, digital com-
munication also lowered participant comprehension of the conversation [35].
Comparing survey modes
A substantial body of work has been generated focusing on the effect that different methods of
conducting surveys has on the quality of data collected. Several of these studies did not find
any substantial differences across mode. Nandi and Platt (2017), in comparing social identity
questions between face-to-face and telephone questionnaires, found “little evidence for specific
mode effects.” The only exception was for a sensitive question on political identity. They cau-
tiously suggest this difference may be related to sensitivity, social desirability, or randomness
[27]. Similarly, in comparing an online survey to an online instant chat questionnaire, Stieger
(2006) found no differences in data quality [36].
Of the studies that did report differences across mode, two trends emerge. First, the effects
that are found tend to be small. Second, no consensus arises between studies as to which
modes are preferable [27]. One study that is particularly relevant to our work is that conducted
by Tourangeau and Smith (1996) which collected information about sexual behavior using a
digital survey, a digital survey that read questions aloud, and a face-to-face verbal survey where
the interviewer recorded information digitally. They found that response rates did not differ
across mode, but voluntary self-disclosure was higher in the digital surveys. However, their
interpretation was that “computerization” itself had little impact on the level of reporting, but
that the presence of an interviewer did [6].
Comparing online interviews
Of the previous literature pertaining to online interviews, a large proportion has focused on
comparing the online medium to traditional face-to-face methods. In general, these studies
have found that online interviews provide several advantages over in-person interviews. This
includes the ability to be geographically distant from participants, flexible scheduling, cost sav-
ings, and the mitigation of accessibility issues [2, 3, 7]. Common disadvantages include techni-
cal difficulties, lack of access to technology, digital privacy issues, and difficulties establishing
rapport [1, 2, 4, 7]. Highlighting the double-edged nature of online modes, Weller (2017)
observed that remote interviewing can increase disclosure, but can also lead to participants
oversharing details, possibly to the point of harm [4].
Although online interviews have been typically conducted using audio or video chat plat-
forms, email also provides an opportunity for remote interviewing. While previous work has
suggested that email has fewer context clues to support clear communication and inhibits the
building of rapport, it can also reduce interviewer effects and allow time for reflection. An
additional concern unique to asynchronous interviews is that it is more common for inter-
viewees to not respond and drop from the study in the middle of an interview, resulting in a
PLOS ONE Audio, video, chat, email, or survey: How much does online interview mode matter?
PLOS ONE | https://doi.org/10.1371/journal.pone.0263876 February 22, 2022 6 / 43
higher rate of incomplete interviews [3]. Comparing face-to-face and email interviews on
breast feeding, a sensitive topic, Dowling (2012) noted several comparative benefits of using
email. First, the asynchronous nature of email provided room for reflexivity and enabled
“more thoughtful and considered responses.” Second, email reduced the time required to con-
duct the interviews and the cost of transcription. Third, it alleviated the interviewing fatigue of
the interviewer. Fourth, the researcher noted that “open and honest disclosure felt easier” in e-
mail interviews. However, as previous literature has hypothesized, establishing rapport was
more difficult and took more time [5].
More similar to our study, Jenner and Myers (2018) completed a mixed-methods examina-
tion of data equivalence, rapport, and disclosure between in-person and video interviews.
They observed no differences in intimate self-disclosure, scheduling rates, or interview length
between the two modes, but did observe less intimate disclosure for interviews held in public
places. In one interview where a participant refused to share their video feed, effectively mak-
ing it an audio interview, the researchers noted that the lack of nonverbal cues was challenging
for the interviewer and resulted in a shorter interview. In particular, they note that it was diffi-
cult to assess whether “silence meant the participant was thinking about a response, confused
by a question, or waiting for the interviewer to ask another question” [7].
While many studies have compared online and offline interview modes, or have evaluated
the advantages or disadvantages of a specific online interview method, there has been no com-
prehensive empirical evaluation of online interview modes. This gap leaves researchers with-
out clear guidance when designing online interview studies. As the trend towards online
communication continues to grow, especially in light of the Covid-19 pandemic, the need to
understand how different online modes impact communication only becomes more impor-
tant. In this study, we contribute the first mixed-methods empirical comparison of different
methods of conducting online interviews and provide insight into the effect of mode on
recruitment, cost, rapport, honesty, self-disclosure, perceived anonymity, and qualitative data
equivalence.
Methods
Interviews are often used as part of qualitative and exploratory studies. However, to compare
across online interview mode we employed an experimental approach that randomly assigned
participants to conditions. This allows for a systematic comparison between conditions. Yet,
we were wary of attempting to assess a qualitative method using quantitative experimental
methods. As a result, we opted for an experimental, mixed-methods approach. In the following
sections we provide an overview of the research study design, describe each of the seven exper-
imental conditions, and outline the design of the interviews.
Study design
To compare between different types of online interviews, we conducted 154 interviews
between June and September 2019 in which participants were randomly assigned to one of the
seven study conditions. Participants were recruited through Prolific Academic and screened
using a short survey. We received 1,240 responses to our screening survey, of which 360 were
eligible for participation, 337 consented to participate, and 154 ended up completing inter-
views. Eligible participants were then randomly assigned an interviewer and interview condi-
tion. After each interview completed, both the interviewee and interviewer completed a survey
about their experience. Individuals who completed the screening survey were compensated $1
USD and those who completed the interview process were compensated $10 USD. An analysis
team transcribed and coded all interview transcripts for themes to prepare the data for
PLOS ONE Audio, video, chat, email, or survey: How much does online interview mode matter?
PLOS ONE | https://doi.org/10.1371/journal.pone.0263876 February 22, 2022 7 / 43
analysis. This study received approval from the Institutional Review Board (IRB) at Carnegie
Mellon University.
Wherever possible, we controlled for variables that are known to influence interviewer
quality and experience, such as interviewer training and interviewer race (see Interviewers).
At the same time, we were cognizant of the fact that one of the oft-cited benefits of qualitative
interviewing is the capability of flexibility and spontaneous contextual adjustment [1, 2]. As a
result, our study design decisions aimed for a precarious balance of ecological validity (e.g., are
these interviews true to practical uses and qualitative methods?) and internal validity (e.g., can
we make systematic comparisons across modes?).
A note on terminology, there were three teams involved in this study. The interviewer teamand the analysis team, which included transcribers and coders, members were not aware of
the high-level study design or research question. The research team members were aware
of the study design. We sometimes abbreviate interviewers and interviewees as IER and IEE
respectively.
Experimental conditions
We assigned interviewees randomly to one of seven online interview conditions: video, audio,
chat, non-anonymous chat, email, survey, and scheduled survey. The survey conditions were
intended as a baseline to understand the effects that the presence of an interviewer would
have. In these conditions, the lack of an interviewer precluded any interviewer-interviewee
interactions and the possibility to ask followup questions. The anonymous and non-anony-
mous chat conditions served as as a test to evaluate the impact of anonymity. The survey and
scheduled survey conditions were used to assess the cost of having to schedule an interview
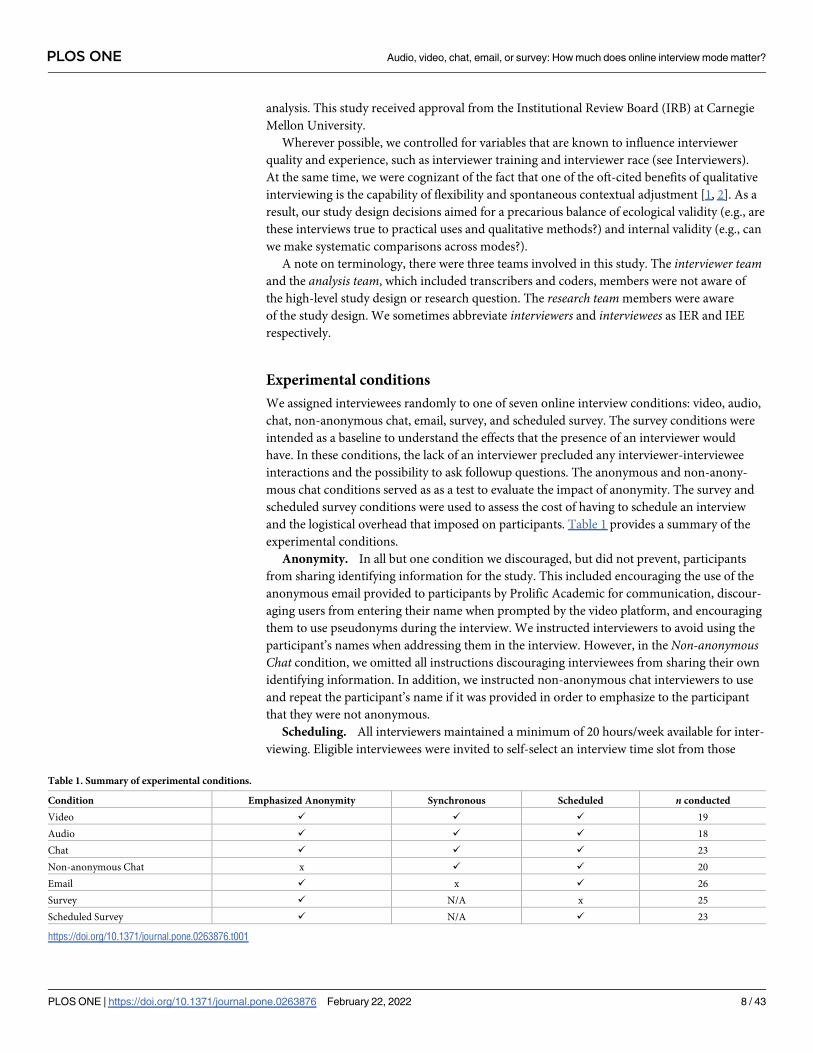
and the logistical overhead that imposed on participants. Table 1 provides a summary of the
experimental conditions.
Anonymity. In all but one condition we discouraged, but did not prevent, participants
from sharing identifying information for the study. This included encouraging the use of the
anonymous email provided to participants by Prolific Academic for communication, discour-
aging users from entering their name when prompted by the video platform, and encouraging
them to use pseudonyms during the interview. We instructed interviewers to avoid using the
participant’s names when addressing them in the interview. However, in the Non-anonymousChat condition, we omitted all instructions discouraging interviewees from sharing their own
identifying information. In addition, we instructed non-anonymous chat interviewers to use
and repeat the participant’s name if it was provided in order to emphasize to the participant
that they were not anonymous.
Scheduling. All interviewers maintained a minimum of 20 hours/week available for inter-
viewing. Eligible interviewees were invited to self-select an interview time slot from those
Table 1. Summary of experimental conditions.
Condition Emphasized Anonymity Synchronous Scheduled n conducted
Video ✓ ✓ ✓ 19
Audio ✓ ✓ ✓ 18
Chat ✓ ✓ ✓ 23
Non-anonymous Chat x ✓ ✓ 20
Email ✓ x ✓ 26
Survey ✓ N/A x 25
Scheduled Survey ✓ N/A ✓ 23
https://doi.org/10.1371/journal.pone.0263876.t001
PLOS ONE Audio, video, chat, email, or survey: How much does online interview mode matter?
PLOS ONE | https://doi.org/10.1371/journal.pone.0263876 February 22, 2022 8 / 43
available using the Calendly scheduling platform. To control for possible selection effects
resulting from scheduling, we required all participants assigned to the Email and ScheduledSurvey conditions to schedule the start of their interview.
Interview design
The research team developed the interview script to balance a number of considerations. On
one hand we reasoned that differences in self-disclosure, perceived anonymity, and honesty
would be more pronounced across mode if the interviews focused on sensitive topics [27]. For
interviews containing less sensitive content, we would expect mode to have a smaller effect. At
the same time, we wanted to avoid topics that had a high likelihood of re-traumatizing partici-
pants, elicited health information, or elicited reports of illegal behavior. In addition, we wanted
the interview to cover a variety of topics for increased generalizability. It is likely that inter-
views focused on a highly sensitive topic like sex result in a substantially different experience
than interviews focused on something less intrusive like personal reflection. To provide conti-
nuity, we needed a plausible overarching research topic that united the questions and gave
motivation to both interviewees and interviewers. The research team felt that his would allow
interviewers to direct their questions and interviewees to provide answers in an organic way.
Lastly, we aimed for an interview protocol that could be completed within 30–40 minutes.
To meet these goals, we selected a subset of questions from an interview study conducted
by Moon et al. (2000) that examined online surveys on sensitive topics [18]. The subset of
questions were selected to fit the above criteria, slightly modifying outdated language. Ques-
tions were roughly ordered by increasing sensitivity in order to allow the interviewee to get
comfortable and build rapport with interviewer before getting into more the more difficult
parts of the conversation. Interviewers were required to follow the interview script, but were
encouraged to ask their own followup probes. The interview questions are summarized below
and the full interview protocol is available in S1 Protocol.
1. What are your favorite things to do in your free time? (Free Time)
2. What characteristics of yourself are you most proud of? (Pride)
3. What are your feelings and attitudes about death? (Death)
4. What has been the biggest disappointment in your life? (Disappointment)
5. What is your most common sexual fantasy? (Sex)
6. What have you done in your life that you feel most guilty about? (Guilt)
7. What characteristics of your best friend really bother you? (Best Friend)
8. Is there anything you want to add? (Anything To Add)
Interview logistics. We chose online platforms to use based on interviewee usability, pri-
vacy options, and a feature set that matched our condition requirements. For video, audio,
and chat conditions, we used Zoom cloud meetings. For email conditions, participants were
encouraged to use the anonymous email address and platform provided by Prolific Academic,
but they could also choose to use a personal email address and platform of their choice. Survey
conditions were hosted on Qualtrics.
Interview calendar invites were automatically sent via email immediately after sign-up and
a reminder email was sent 24 hours before and 30 minutes before the interview start time.
Reminders included instructions on how to access and test the assigned platform. In pilot
PLOS ONE Audio, video, chat, email, or survey: How much does online interview mode matter?
PLOS ONE | https://doi.org/10.1371/journal.pone.0263876 February 22, 2022 9 / 43
testing, we found that interviews usually lasted around 30 minutes. This included email, where
we asked pilot testers to track the cumulative time they spent reading and answering study
emails. We asked both interviewers and interviewees to allot at least 45 minutes per interview
to allow ample time to complete the interview. Participants who completed an interview were
compensated $10 USD.
Interviewers. Unlike many studies, our interviewers were considered research partici-
pants due to the fact that we analyzed their behavior in addition to interviewee behavior. For
recruitment, we opened a screening survey for paid interviewers and distributed it across the
departments at our university. Given that interviewer identity and presentation is a known
variable in interview experience (See Interviewer Effects), we hoped to find a set of interview-
ers with similar demographics and levels of experience. All applicants were students at our uni-
versity. From our pool, we selected three interviewers with similar traits: all three were White,
women, aged 20–25 years, fluent English-speakers, willing to broach sensitive topics, with a
similar gender presentation and hairstyles, and who had no previous experience with research
interviewing. All interviewers received the same paid five hour training. The training curricu-
lum included information on research ethics, safety, confidentiality, followup probes, and
hands-on practice. Given the sensitive topic matter, interviewers were encouraged to stop an
interview at any point if they felt uncomfortable, without loss of compensation. All interview-
ers completed a consent form and took the required human subjects training approved by the
Institutional Review Board at Carnegie Mellon University.
During the study, each interviewer met weekly with a member of the research team to
review progress, check compliance with the research protocol, debrief emotional concerns,
and troubleshoot technical issues. Interviewers were compensated $60 USD for training, $12
USD per check-in meeting, $12 USD for each completed interview, and a 7% bonus on all
earnings if they completed the entire study. One interviewer chose to leave the study early due
to time constraints, so interviewees were reassigned to the remaining interviewers at random.
As a result, Interviewer 1 and Interviewer 2 completed 42% and 36% of all interviews respec-
tively, while Interviewer 3 completed only 22% of the interviews.
While interviewer effects are difficult to measure directly, we looked for differences in inter-
views conducted by different interviewers using several indirect measures. This included the
interviewee’s self-reported rapport rating with the interviewer, the interviewee’s self-reported
honesty, interview word count, qualitative code count, technical difficulties and completion
rates. No substantial differences were found between interviewers across any of these metrics,
indicating that interviewer effects were likely not a source of differences.
Deception. To mitigate confirmation bias, the research design included mild deception
for both the interviewees and interviewers. This use of deception was approved by the Institu-
tional Review Board at Carnegie Mellon University. We informed interviewees that the study
broadly focused on improving online interviews. We informed interviewers that the study
focused broadly on improving interviewer training. Real-world interviews require a research
question to guide the arc of the interview, so we also informed interviewers, transcribers, and
coders that the study specifically focused on how research participants narrativize sensitive
memories, and encouraged interviewers to ask followup questions that elicited anecdotes and
details. If the interviewees inquired about the study purpose, the interviewer was instructed to
give a broad answer about improving online interviews, and direct further questions to the
research team.
We debriefed interviewees in writing on the last page of their followup survey that they
completed after their interview. This followup included information about how they would
receive their compensation. We debriefed interviewers, transcribers, and coders in person
when they concluded their portion of the study.
PLOS ONE Audio, video, chat, email, or survey: How much does online interview mode matter?
PLOS ONE | https://doi.org/10.1371/journal.pone.0263876 February 22, 2022 10 / 43
Data collection
The data for this study was collected from multiple sources. This includes the interviewee
screening survey, interview transcripts, and post-interview surveys. In addition, the transcripts
were coded as if conducting a qualitative study to evaluate differences in data equivalence.
Interviewee recruitment. Interviewees were recruited using the Prolific Academic digital
research platform. Participants were recruited from a pool of individuals who were 18 years of
age or older and resided in the United States. A 5-minute screening survey was used to deter-
mine eligibility for the study and individuals who completed the survey were compensated $1
USD. A full version of the screening survey can be found in S4 Protocol. The screening survey
included questions related to demographics, work habits, willingness to complete five different
types of online interviews, and reliable access to the technology needed to participate in the
interviews. Participants were deemed eligible if they were willing to complete all five modes of
interviewing, were willing to be recorded, and had regular access to a private, quiet space.
Of 1,240 people screened, 27% were eligible to participate. The most common reason for
ineligibility was being unwilling to participate in one or more of different interview modes
(usually Video or Audio) and/or being unwilling to be recorded (see Recruitment and Logis-
tics). Eligible participants were batched and randomly assigned an interviewer and interview
mode. Interviewers sent a uniform interview invitation to all participants. If a participant did
not schedule an interview within two weeks of the invitation, they were dropped from the
active pool and replaced with a new randomly-assigned interviewee candidate.
We anticipated that different modes would yield different completion rates. Following reli-
ability guidance from Simmons et al. (2011), we aimed to complete at least 20 interviews in
each mode [37]. For scheduling and monetary reasons, we capped each condition at 25 partici-
pants. After having difficulty completing enough Video and Audio interviews, we extended
the duration of our study for an additional month. Due to monetary and scheduling con-
straints, we chose to end interviews after this time period, yielding 18–26 interviews per condi-
tion. See Table 1 for the complete list of interviews conducted per mode.
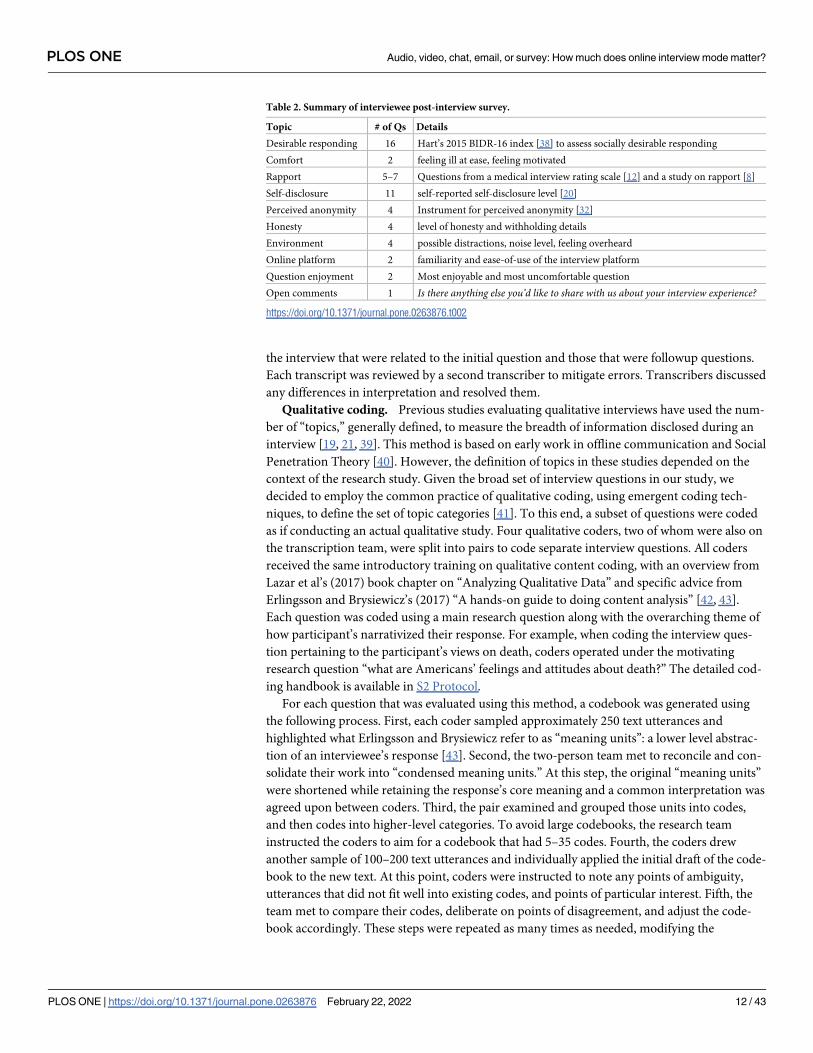
Post-interview survey. After each completed interview, both the interviewee and inter-
viewer were required to immediately complete a post-interview survey. For interviewers, this
survey inquired about technical difficulties, interruptions, their discomfort, and their percep-
tion of the interviewee’s comfort. It required less than three minutes to complete. A full version
of the interviewer survey can be found in S5 Protocol. For interviewees, the post-interview sur-
vey focused on perceptions of the interview experience, the online platform used for the inter-
view, and their opinions on their own disclosures. This survey took less than 15 minutes to
complete and was slightly tailored by mode. For example, rating the audio quality was not rele-
vant for all modes. Table 2 summarizes the interviewee followup survey, and a full version can
be found in S4 Protocol.
Interview transcription. In order to compare the interview content on relatively even
footing, interviews were all transcribed and reformatted uniformly. For audio and video inter-
views, Zoom’s automatic transcription service was used to generate the initial text transcript.
Then, a four-person team validated the transcription and removed personally identifiable
information. In order to maintain possible non-textual communication, transcribers were
asked to capture any changes in tone of voice, meaningful pauses, and body language used
(e.g., laughs or haltingly). For the chat, email, and survey conditions, transcribers consolidated
emails, exported timestamps, tagged the responses by question, and broke up long responses
into shorter utterances. Other text-based communication vectors like emojis or spelling
choices were retained in chat, email, and survey conditions. For all modes, the text transcripts
were consolidated into a standard format. Coders were instructed to separately flag portions of
PLOS ONE Audio, video, chat, email, or survey: How much does online interview mode matter?
PLOS ONE | https://doi.org/10.1371/journal.pone.0263876 February 22, 2022 11 / 43
the interview that were related to the initial question and those that were followup questions.
Each transcript was reviewed by a second transcriber to mitigate errors. Transcribers discussed
any differences in interpretation and resolved them.
Qualitative coding. Previous studies evaluating qualitative interviews have used the num-
ber of “topics,” generally defined, to measure the breadth of information disclosed during an
interview [19, 21, 39]. This method is based on early work in offline communication and Social
Penetration Theory [40]. However, the definition of topics in these studies depended on the
context of the research study. Given the broad set of interview questions in our study, we
decided to employ the common practice of qualitative coding, using emergent coding tech-
niques, to define the set of topic categories [41]. To this end, a subset of questions were coded
as if conducting an actual qualitative study. Four qualitative coders, two of whom were also on
the transcription team, were split into pairs to code separate interview questions. All coders
received the same introductory training on qualitative content coding, with an overview from
Lazar et al’s (2017) book chapter on “Analyzing Qualitative Data” and specific advice from
Erlingsson and Brysiewicz’s (2017) “A hands-on guide to doing content analysis” [42, 43].
Each question was coded using a main research question along with the overarching theme of
how participant’s narrativized their response. For example, when coding the interview ques-
tion pertaining to the participant’s views on death, coders operated under the motivating
research question “what are Americans’ feelings and attitudes about death?” The detailed cod-
ing handbook is available in S2 Protocol.
For each question that was evaluated using this method, a codebook was generated using
the following process. First, each coder sampled approximately 250 text utterances and
highlighted what Erlingsson and Brysiewicz refer to as “meaning units”: a lower level abstrac-
tion of an interviewee’s response [43]. Second, the two-person team met to reconcile and con-
solidate their work into “condensed meaning units.” At this step, the original “meaning units”
were shortened while retaining the response’s core meaning and a common interpretation was
agreed upon between coders. Third, the pair examined and grouped those units into codes,
and then codes into higher-level categories. To avoid large codebooks, the research team
instructed the coders to aim for a codebook that had 5–35 codes. Fourth, the coders drew
another sample of 100–200 text utterances and individually applied the initial draft of the code-
book to the new text. At this point, coders were instructed to note any points of ambiguity,
utterances that did not fit well into existing codes, and points of particular interest. Fifth, the
team met to compare their codes, deliberate on points of disagreement, and adjust the code-
book accordingly. These steps were repeated as many times as needed, modifying the
Table 2. Summary of interviewee post-interview survey.
Topic # of Qs Details
Desirable responding 16 Hart’s 2015 BIDR-16 index [38] to assess socially desirable responding
Comfort 2 feeling ill at ease, feeling motivated
Rapport 5–7 Questions from a medical interview rating scale [12] and a study on rapport [8]
Self-disclosure 11 self-reported self-disclosure level [20]
Perceived anonymity 4 Instrument for perceived anonymity [32]
Honesty 4 level of honesty and withholding details
Environment 4 possible distractions, noise level, feeling overheard
Online platform 2 familiarity and ease-of-use of the interview platform
Question enjoyment 2 Most enjoyable and most uncomfortable question
Open comments 1 Is there anything else you’d like to share with us about your interview experience?
https://doi.org/10.1371/journal.pone.0263876.t002
PLOS ONE Audio, video, chat, email, or survey: How much does online interview mode matter?
PLOS ONE | https://doi.org/10.1371/journal.pone.0263876 February 22, 2022 12 / 43
codebook until both coders were in agreement or they thought that disagreements stemmed
from subjectivity of the reader rather than ambiguity in the codebook. In practice, the pairs
developed three to five different drafts of the codebook per question. In the final step, each
coder individually re-coded the entire response set with the final codebook (�150 interviews
and�1500 text utterances). The pair met a final time to reconcile final codes. We emphasized
to coders that differences in codes were not necessarily errors, they could also be the product
of reasonable differences in interpretation or experience. As a result, the coders could agree to
include both their codes. The coding teams did not use specific qualitative data analysis soft-
ware. Instead, shared spreadsheet templates were used to generate the codebooks and code the
responses.
To practice, each two-person coding team was assigned one question set to get hands-on
experience with the coding process. These codebooks and codes were not used in our analysis.
After the initial practice round, coding team 1 coded the questions related to guilt, best friends,
and death. Coding team 2 coded pride and sex. Rather than do a full qualitative analysis of
themes, we stopped our qualitative coding at the level of codes and categories. Our intention
was to create data that could both summarize an interview as a qualitative researcher genuinely
might and allow for a meaningful quantitative and qualitative comparison across interview
modes. After all transcripts were coded, we divided the texts by mode in order to analyze possi-
ble differences in data equivalence.
Edge cases
Throughout our analyses, there were minor variations in sample sizes due to anomalies in the
protocol. In general, we included edge cases in the analysis except where they would bias
results. Sub-sample sizes and exclusions are noted throughout where relevant.
Partial interviews. Several interviews were only partially completed during the course of
the study due to several factors. In five interviews (four chat, one email) the interviewer
skipped a question. These interviews were considered complete and were included in the anal-
ysis done at the question level for those that were not skipped. These interviews were excluded
from any analysis done on the content of the interview as a whole. For example, when comput-
ing average word count at the question level, we included interviews missing questions, but
excluded them for word counts at the interview level (see Word Count). Notably, missing
questions were distributed evenly across interviewers, but occurred only in text-based modes.
This suggests that text modes were more prone to interviewer error. In three separate cases
(two email, one chat) an interview was started but abandoned by the interviewee. These inter-
views were considered incomplete and were excluded from all aspects of the analysis. As an
additional note, in one email interview the participant did not provide responses to several fol-
low-up questions. This interview was also considered complete and included in all aspects of
the analysis.
Missing survey data. There were also several gaps in the screening and post-interview
surveys. Participants were never required to answer any survey questions except to provide
their ID number, so some questions were skipped or missed. Four participants completed an
interview, but did not complete their post-interview survey (one audio, two email, and one
survey). They were all compensated despite failing to complete the survey. Interviewers did
not perfectly complete the task of filling out post-interview survey reports (see Technical
Issues).
Missing qualitative data. Despite implementing double-coding and double-transcribing,
occasional errors were introduced when analyzing interview content. Most of these were dis-
covered and addressed during the coding process. However, after the coding team completed
PLOS ONE Audio, video, chat, email, or survey: How much does online interview mode matter?
PLOS ONE | https://doi.org/10.1371/journal.pone.0263876 February 22, 2022 13 / 43
their work, they retired from the project team, and were not available to correct errors discov-
ered much later. As a result, in a few interviews the occasional utterance was left without a cor-
responding code and in one case an entire audio transcript was not qualitatively coded.
Quantitative analysis
We conducted an exploratory analysis to visualize our results and check for any confounding
factors that might have introduced bias into the data. This included the influence of individual
interviewers, participant demographics, participant familiarity with the technology platforms
employed, and the number of logistical or technical issues that arose during the interview. No
substantial differences were observed for these factors across mode.
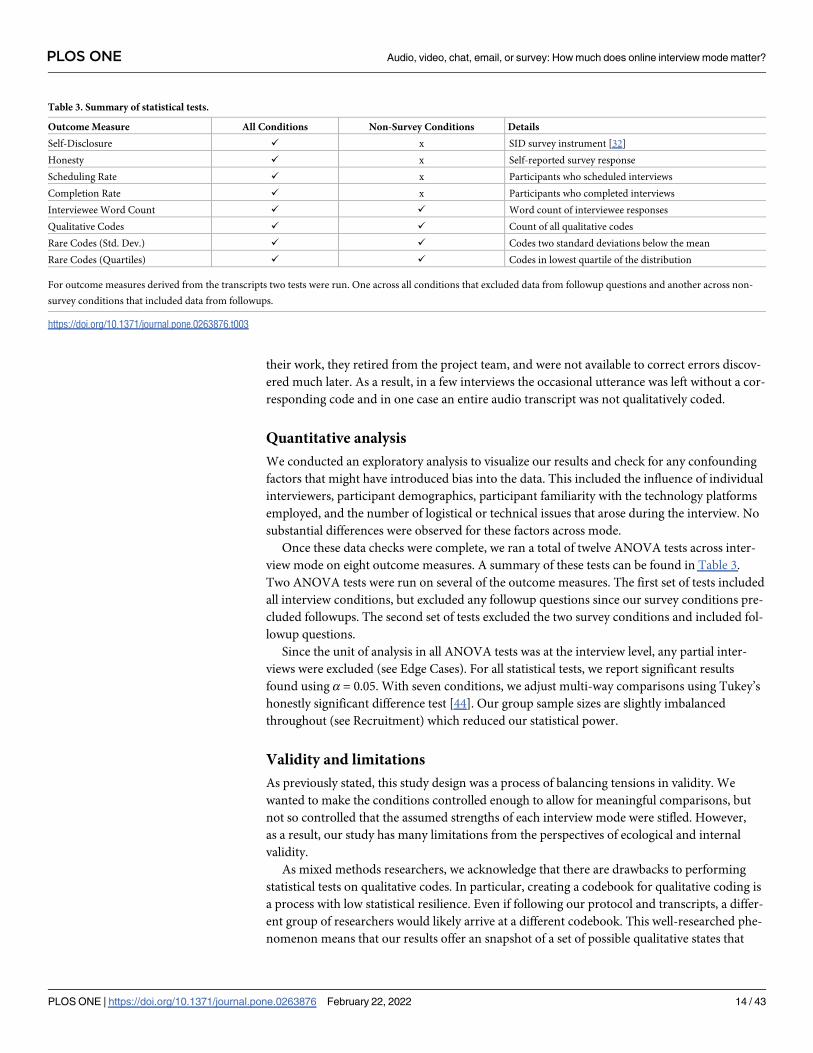
Once these data checks were complete, we ran a total of twelve ANOVA tests across inter-
view mode on eight outcome measures. A summary of these tests can be found in Table 3.
Two ANOVA tests were run on several of the outcome measures. The first set of tests included
all interview conditions, but excluded any followup questions since our survey conditions pre-
cluded followups. The second set of tests excluded the two survey conditions and included fol-
lowup questions.
Since the unit of analysis in all ANOVA tests was at the interview level, any partial inter-
views were excluded (see Edge Cases). For all statistical tests, we report significant results
found using α = 0.05. With seven conditions, we adjust multi-way comparisons using Tukey’s
honestly significant difference test [44]. Our group sample sizes are slightly imbalanced
throughout (see Recruitment) which reduced our statistical power.
Validity and limitations
As previously stated, this study design was a process of balancing tensions in validity. We
wanted to make the conditions controlled enough to allow for meaningful comparisons, but
not so controlled that the assumed strengths of each interview mode were stifled. However,
as a result, our study has many limitations from the perspectives of ecological and internal
validity.
As mixed methods researchers, we acknowledge that there are drawbacks to performing
statistical tests on qualitative codes. In particular, creating a codebook for qualitative coding is
a process with low statistical resilience. Even if following our protocol and transcripts, a differ-
ent group of researchers would likely arrive at a different codebook. This well-researched phe-
nomenon means that our results offer an snapshot of a set of possible qualitative states that
Table 3. Summary of statistical tests.
Outcome Measure All Conditions Non-Survey Conditions Details
Self-Disclosure ✓ x SID survey instrument [32]
Honesty ✓ x Self-reported survey response
Scheduling Rate ✓ x Participants who scheduled interviews
Completion Rate ✓ x Participants who completed interviews
Interviewee Word Count ✓ ✓ Word count of interviewee responses
Qualitative Codes ✓ ✓ Count of all qualitative codes
Rare Codes (Std. Dev.) ✓ ✓ Codes two standard deviations below the mean
Rare Codes (Quartiles) ✓ ✓ Codes in lowest quartile of the distribution
For outcome measures derived from the transcripts two tests were run. One across all conditions that excluded data from followup questions and another across non-
survey conditions that included data from followups.
https://doi.org/10.1371/journal.pone.0263876.t003
PLOS ONE Audio, video, chat, email, or survey: How much does online interview mode matter?
PLOS ONE | https://doi.org/10.1371/journal.pone.0263876 February 22, 2022 14 / 43
may have been produced from our data [45, 46]. As such, the reproducibility of this study may
be limited in this regard.
From a quantitative perspective, the relatively small sample size severely limits our statisti-
cal power. While we completed 154 interviews, the Audio (n = 18) and Video (n = 19) condi-
tions in particular were lower than our sampling targets. However, we are also cognizant of the
fact that in practice, many fields and methodologies often have sample sizes of 10–25 partici-
pants [47, 48]. As a result, if our work here shows few statistically meaningful differences in
data equivalence, then studies in the wild are also unlikely to have differences as a practical
matter.
Recruiting from Prolific Academic limits the generalizability of our results. For example, as
our participants were digital workers who are usually paid to complete survey or similar text-
based tasks, their propensity towards surveys may not align with other online research pools.
In addition, our participants are likely especially susceptible to desirability effects. For example,
when asked to self-report their honesty levels, we assured participants that their response
would not affect their compensation or Prolific reputation. However, in open responses we
saw occasional evidence that the uneven power dynamic was still salient to some participants.
One Scheduled Survey participant noted, “I was honest because I really try to be honest now
that I am in recovery. I was really excited to be invited to high paying interview and need the
money so I don’t want anything to get in the way of my ability to make money and contribute
to my household.” Although such factors are likely to play a role in other qualitative studies
with monetary incentives, certain platforms and participant pools may not have the same level
of effect.
Findings
In the following six sections we detail our findings that cover a broad spectrum of factors to be
considered when designing and conducting online interview studies. We report both our
quantitative comparisons across mode and our qualitative findings based on the responses of
the interviewees and interviewers who took part in the study. First, we find that participant
demographics remained consistent across mode and demographic factors did not affect com-
pletion rates. However, we also observe that challenges pertaining to recruitment and logistics
were higher in audio and video modes. Second, we discuss how rapport did not differ greatly
among non-survey interviews, but anecdotally chat had a polarizing effect with some partici-
pants feeling like they could share more and others left feeling disconnected. Third, we observe
that there is little evidence to support differences in self-reported honesty or social desirability
bias across mode. Fourth, we show that empirically there were no differences in disclosure,
self-reported or measured, across mode but at an individual level, participants reported being
cognizant of mode and that it affected how much they were willing to share. Fifth, we find that
participants did report statistically significant differences in perceived anonymity between the
non-anonymous and anonymous chat conditions. However, between the anonymous condi-
tions we do not observe differences in perceived anonymity despite differences in real threats
of de-identification (e.g. revealing one’s face in a video interview). Sixth, we find that while
structurally we observe statistically significant differences in word count across mode, themati-
cally we do not observe differences in data-equivalence upon applying qualitative codes.
Demographics, recruitment, and logistics
We screened 1,240 people and invited 310 eligible participants to an interview. Of this group,
200 initiated the interview scheduling process and 154 completed interviews. Overall, we
observe that mode does not affect the ability of different demographic groups to schedule and
PLOS ONE Audio, video, chat, email, or survey: How much does online interview mode matter?
PLOS ONE | https://doi.org/10.1371/journal.pone.0263876 February 22, 2022 15 / 43
complete the interviews. However, we do find that the overall recruitment rate, completion
rate, cost, and technical difficulties encountered vary across mode.
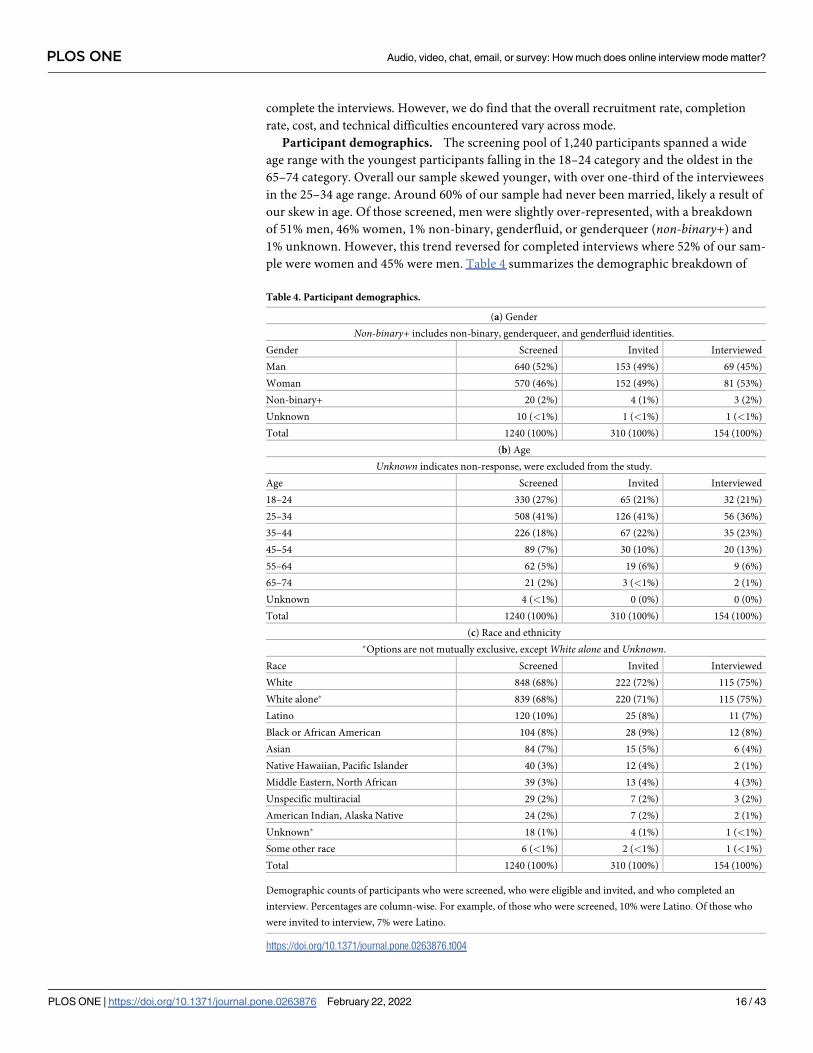
Participant demographics. The screening pool of 1,240 participants spanned a wide
age range with the youngest participants falling in the 18–24 category and the oldest in the
65–74 category. Overall our sample skewed younger, with over one-third of the interviewees
in the 25–34 age range. Around 60% of our sample had never been married, likely a result of
our skew in age. Of those screened, men were slightly over-represented, with a breakdown
of 51% men, 46% women, 1% non-binary, genderfluid, or genderqueer (non-binary+) and
1% unknown. However, this trend reversed for completed interviews where 52% of our sam-
ple were women and 45% were men. Table 4 summarizes the demographic breakdown of
Table 4. Participant demographics.
(a) Gender
Non-binary+ includes non-binary, genderqueer, and genderfluid identities.
Gender Screened Invited Interviewed
Man 640 (52%) 153 (49%) 69 (45%)
Woman 570 (46%) 152 (49%) 81 (53%)
Non-binary+ 20 (2%) 4 (1%) 3 (2%)
Unknown 10 (<1%) 1 (<1%) 1 (<1%)
Total 1240 (100%) 310 (100%) 154 (100%)
(b) Age
Unknown indicates non-response, were excluded from the study.
Age Screened Invited Interviewed
18–24 330 (27%) 65 (21%) 32 (21%)
25–34 508 (41%) 126 (41%) 56 (36%)
35–44 226 (18%) 67 (22%) 35 (23%)
45–54 89 (7%) 30 (10%) 20 (13%)
55–64 62 (5%) 19 (6%) 9 (6%)
65–74 21 (2%) 3 (<1%) 2 (1%)
Unknown 4 (<1%) 0 (0%) 0 (0%)
Total 1240 (100%) 310 (100%) 154 (100%)
(c) Race and ethnicity
�Options are not mutually exclusive, except White alone and Unknown.
Race Screened Invited Interviewed
White 848 (68%) 222 (72%) 115 (75%)
White alone� 839 (68%) 220 (71%) 115 (75%)
Latino 120 (10%) 25 (8%) 11 (7%)
Black or African American 104 (8%) 28 (9%) 12 (8%)
Asian 84 (7%) 15 (5%) 6 (4%)
Native Hawaiian, Pacific Islander 40 (3%) 12 (4%) 2 (1%)
Middle Eastern, North African 39 (3%) 13 (4%) 4 (3%)
Unspecific multiracial 29 (2%) 7 (2%) 3 (2%)
American Indian, Alaska Native 24 (2%) 7 (2%) 2 (1%)
Unknown� 18 (1%) 4 (1%) 1 (<1%)
Some other race 6 (<1%) 2 (<1%) 1 (<1%)
Total 1240 (100%) 310 (100%) 154 (100%)
Demographic counts of participants who were screened, who were eligible and invited, and who completed an
interview. Percentages are column-wise. For example, of those who were screened, 10% were Latino. Of those who
were invited to interview, 7% were Latino.
https://doi.org/10.1371/journal.pone.0263876.t004
PLOS ONE Audio, video, chat, email, or survey: How much does online interview mode matter?
PLOS ONE | https://doi.org/10.1371/journal.pone.0263876 February 22, 2022 16 / 43
the screening pool, those who were invited to an interview, and those who completed their
interview.
In the screening survey, participants were presented with two freeform text boxes to allow
participants to self-report race, ethnicity, and any cultural group they felt was significant to
them. Answers ranged from “Mostly midwestern caucasian american, with some asian ameri-
can and malaysian aspects thrown in” to “Black, cosmic” to “White, Burning Man.” Full
responses were shared with interviewers to provide context about their interviewees. To pro-
vide a summary and assess the distribution of our sample, we adapted the US Census Bureau
guidelines to standardize these responses [49]. Our estimates of race and ethnicity roughly
track the 2010 census data. However, our sample over-represents White participants and
under-represents black, African American, and Latino participants.
Our exploratory data analysis indicated that, after random assignment, the gender and race
of participants were distributed relatively evenly across modes. However, on average, inter-
views conducted with black participants were shorter in terms of word count (μ = 585 σ = 347)
and yielded slightly fewer qualitative codes (μ = 14.8 σ = 4.2) than Latino (word count: μ = 974
σ = 754, codes: μ = 17.4 σ = 6.1) or white (word count: μ = 870 σ = 762, codes: μ = 18.1 σ = 7.4)
participants, but were generally within a standard deviation of each other. Since the number of
black and Latino participants were relatively small (1–2 participants of each minority group
per condition) we were unable to do any meaningful sub-group analysis across mode. As a
result, we cannot say with any certainty whether mode would be more or less of an effect for
these groups. This raises some question of external validity that indicate our findings should
be generalized cautiously, particularly for studies focusing on minority communities (see
Accessibility for additional discussion of external validity).
Age was less evenly distributed which raised concern of internal validity. For example, we
examined whether age might affect completion rates in different interview modes. We hypoth-
esized that older participants would be more likely to complete email or audio interviews
where younger participants would be more likely to complete chat interviews. However, we
did not observe an effect and, in general, we found no evidence to suggest that demographics
had an impact on scheduling rates, completion rates, or completion by mode.
Technology and environment access. Access to the necessary technology and environ-
ment to participate in an online interview is a limiting factor when recruiting participants and
is a more restrictive factor for audio and video interviews. Of our screening pool, 99% reported
having access to a computer with a keyboard, as opposed to a touch screen device like a smart-
phone or tablet. A keyboard was required for eligibility in this study because it is very useful
for text-based interviews, though not a prerequisite. However, only 70% of those screened had
access to a webcam. This precluded participation in video interviews conducted using a com-
puter, however these participants might have a tablet or smartphone with a camera suitable for
video interviews.
In addition to technology, Jenner and Myers (2018) noted that a private space was a more
salient factor than mode for their participants [7]. Of our respondents, 80% had access to a
quiet, private room. More than 90% reported that they usually completed Prolific tasks at
home, followed by 8% at an office space, and a final 2% mix of specific locations such as coffee
shops. However, in interviews, several participants were concerned about being overheard in
their space. In one case, an Audio participant was concerned about responding to a question
about sex. While laughing, they responded “oh my god. can I answer this?. . .I’m not alone in
the house.” The Audio participant eventually opted instead to write their response in the chat
box. In another case, a Video participant got up to close the door, saying “I have a 16-year-old
son who might walk by, so. . . [laughs]”. In follow-up surveys, nine participants (6% of 125)
PLOS ONE Audio, video, chat, email, or survey: How much does online interview mode matter?
PLOS ONE | https://doi.org/10.1371/journal.pone.0263876 February 22, 2022 17 / 43
reported that their conversation was easily overheard and six (4%) reported that they were
interrupted.
While we did not collect socioeconomic data directly, the high level of access to technology
and private space, combined with a sample that is disproportionately white, indicates that our
sample likely overrepresents individuals with a higher socioeconomic background. Since par-
ticipants’ race was distributed relatively equally across mode and access to suitable technology
and private space was a prerequisite for eligibility, we conclude that this skew does not affect
the internal validity of the study or bias our findings related to interview mode. However, this
does challenge the external validity of our results. While our study draws on participants from
a large online panel of respondents, it is likely that there are other populations for which par-
ticular modes may have more of an effect. This is indicative of a broader issue of representation
in online studies that researchers should take into consideration when deciding to conduct
their research online. Since participants in most online panels are digital laborers, it’s likely
their access to technology does not represent the access of the broader population, especially
those of lower income and members of marginalized communities. At the same time, other
online research studies using large panels of digital workers are likely to encounter similar
bias. Therefore, researchers using similar recruitment methods can likely apply our findings
directly. However, those working with participants of lower income, those with less access to
online resources, or members of marginalized groups should use our results cautiously.
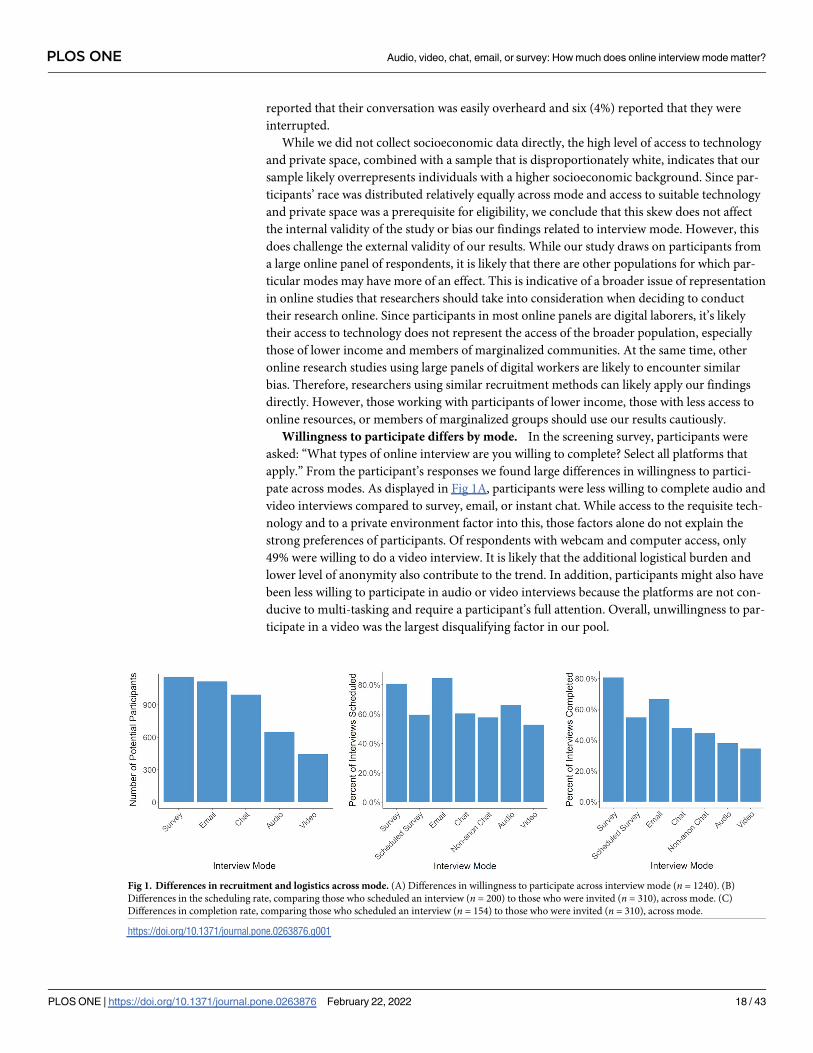
Willingness to participate differs by mode. In the screening survey, participants were
asked: “What types of online interview are you willing to complete? Select all platforms that
apply.” From the participant’s responses we found large differences in willingness to partici-
pate across modes. As displayed in Fig 1A, participants were less willing to complete audio and
video interviews compared to survey, email, or instant chat. While access to the requisite tech-
nology and to a private environment factor into this, those factors alone do not explain the
strong preferences of participants. Of respondents with webcam and computer access, only
49% were willing to do a video interview. It is likely that the additional logistical burden and
lower level of anonymity also contribute to the trend. In addition, participants might also have
been less willing to participate in audio or video interviews because the platforms are not con-
ducive to multi-tasking and require a participant’s full attention. Overall, unwillingness to par-
ticipate in a video was the largest disqualifying factor in our pool.
Fig 1. Differences in recruitment and logistics across mode. (A) Differences in willingness to participate across interview mode (n = 1240). (B)
Differences in the scheduling rate, comparing those who scheduled an interview (n = 200) to those who were invited (n = 310), across mode. (C)
Differences in completion rate, comparing those who scheduled an interview (n = 154) to those who were invited (n = 310), across mode.
https://doi.org/10.1371/journal.pone.0263876.g001
PLOS ONE Audio, video, chat, email, or survey: How much does online interview mode matter?
PLOS ONE | https://doi.org/10.1371/journal.pone.0263876 February 22, 2022 18 / 43
Respondents were also asked about their willingness to be recorded as a part of the inter-
view. Since “in most qualitative traditions it is strongly preferable, if not essential, to have a full
record of each interview,” this is an important factor for qualitative research teams to consider
when recruiting [1, p. 44]. Specifically participants were asked “are you willing to conduct an
interview where the video is recorded?” Only 45% responded affirmatively. However, this sen-
timent appears to be driven largely by the video mode itself rather than the recording. Of those
who were willing to do a video interview, 95% were willing to be recorded. However, it is pos-
sible that respondents assumed that all interviews would be recorded when indicating their
willingness to participate in interview modes; we did not specifically ask about the counterfac-
tual of participating in a non-recorded video interview.
Scheduling rates differ by mode. Although all participants who were eligible to partici-
pate in the study indicated they were willing to participate in any type of interview, we
observed substantial differences in the rate that participant’s scheduled interviews across
mode. As shown in Fig 1B, 310 participants received an email inviting them to schedule an
interview. Of those, 200 (65%) initiated the interview process. We found a statistically signifi-
cant difference (F6,303 = 2.657, p<.05) in the scheduling rate across mode. The post-hoc Tukey
pairwise comparisons showed that the video and email conditions differed significantly at
p< 0.05, with a 20% drop in engagement from email to video. The other 20 comparison com-
binations were not significantly different. A summary of the results can be found in S1 Table.
Note that the participants received their interview invitation via email, thus the increased
scheduling rate for the email condition may be in part the product of platform familiarity or
self-selection (i.e., people that checked their email are more likely to use email). While not sta-
tistically significant, the drop in engagement from the Survey condition to the Scheduled Sur-
vey condition illustrates the cost of scheduling. With all other factors held constant, asking a
participant to schedule a time to take their survey, as opposed to taking it immediately, appears
to have caused a drop in engagement.
Completion rates differ by mode. Similar to scheduling rates, we also observed statisti-
cally significant differences in the rate that participant’s completed interviews across mode.
Overall, the completion rates aligned with the overall screening pool’s willingness to complete
an interview by mode. As shown in Fig 1C, participants completed surveys and email inter-
views at higher rates than the chat conditions. Audio and video interviews were completed at
the lowest rate. An ANOVA test (F6,303 = 4.46, p<.001) and subsequent Tukey revealed statis-
tically significant differences in survey versus audio, video, chat, and non-anonymous chat, as
well as in email versus video. There was only one instance where an interviewer missed a
scheduled interview. However, the single occurrence indicates that interviewer error was not a
substantial factor in completion rates.
The chat and non-anonymous chat conditions had nearly identical scheduling and comple-
tion rates. The invitation emails and scheduling site did have small differences between these
conditions to emphasize the lack of anonymity in the non-anonymous condition. This sug-
gests that emphasizing anonymity had little effect on recruiting for this population.
Estimated cost. While there are many considerations that a researcher must weigh when
designing a study, cost is often one of the most important driving factors. Based on our experi-
ence running this study, we found that the cost of conducting an interview study varies widely
depending on mode. These estimates, summarized in Table 5, are based on conducting 25
interviews using our interview script. To provide context, the median duration of a video
interview, the mode that most closely mimics an in-person interview, was just over 17 minutes.
In our our study, we compensated interviewers and participants $10 equally across mode,
regardless of the duration of the interview. However, in designing an interview study research-
ers are likely to set compensation according the the expected duration of an interview.
PLOS ONE Audio, video, chat, email, or survey: How much does online interview mode matter?
PLOS ONE | https://doi.org/10.1371/journal.pone.0263876 February 22, 2022 19 / 43
Therefore, in this estimate we assume participants are compensated $1 for completing the
screening survey and both interviewers and interviewees are compensated at a $12 per hour
rate upon completion of an interview. These estimates were calculated using five factors that
we found varied widely across mode. The first was the screening eligibility rate: the percent of
eligible participants (18+ with access to a computer) that are willing to participate in a given
type of interview. This affects the number of participants that must be screened and compen-
sated for completing screening. The second was the completion rate: the percent of eligible
participants that go on to complete an interview. This also affects the number of participants
that must be screened. The third factor was the no-show rate: The proportion of participants
who do not show up at their scheduled interview to those that do. This incurs a cost assuming
that the interviewer is compensated for the lost time that they had blocked off for the interview
even though it did not occur. For some studies this might not be applicable. The fourth vari-
able was the duration of the interview which influences the compensation paid both the inter-
viewer and interviewee. With the exception of email interviews, we used the median interview
duration for scheduled, anonymous interview conditions. Email interviews, which are inher-
ently asynchronous, could not be measured in the same fashion. For this mode, the research
team timed a mock interview that reproduced an interview transcript of median length. The
fifth and final factor was the time required to process transcribed data, in the case of audio and
video modes, and to process all of the transcripts (e.g. compile, clean, format, and anonymize).
We should note that our estimates do not account for the cost of recruiting participants to
take the screening survey or fees for using a participant pool or crowd working service. In
addition, they do not include other potential costs such as transcription, qualitative data cod-
ing, fees to use a survey platform, or the researchers’ time.
With a total cost of $143, a survey is the least expensive way to collect data. Since there is no
interviewer to compensate and, screening aside, no cost to a participant who does not show up
or complete the survey this is not surprising. However, it is important to remember that this
mode does not provide researchers with the ability to follow up immediately on a participant’s
response with follow-up questions (researchers would have to contact participants later to ask
follow-up questions). On the other end of the spectrum, we find that chat-based interviews are
the most expensive costing a total of $652. While chat interview do not require transcription,
Table 5. Estimated costs to complete interviews by mode.
Survey Email Chat Audio Video
Parameters Screening Eligibility Rate 94.7% 91.1% 81.4% 53.1% 36.4%
Completion Rate 80.6% 66.7% 47.9% 38.0% 34.5%
No-Show Rate 0.0% 15.4% 26.1% 57.9% 47.4%
Interview Duration (Minutes) 10.0� 14.5† 46.2� 16.7� 17.2�
Costs Screening Compensation $33 $42 $65 $124 $200
Interview Compensation $50 $145 $462 $167 $172
No Shows‡ $0 $12 $65 $50 $41
Transcription & Processing $60 $60 $60 $225 $225
Total $143 $259 $652 $566 $638
Estimated costs across mode based on the screening rate, now show rate, completion rate, and interview duration of each interview type. Costs were computed using a
target of 25 completed interviews, $1 compensation for screening, and an equivalent $12 per hour compensation for both the interviewer and interviewee.
�Measured using median interview duration to account for several outliers.†Estimated using a timed mock interview that reproduced a median length email transcript.‡Assumes the interviewer is compensated for lost time due to a no show.
https://doi.org/10.1371/journal.pone.0263876.t005
PLOS ONE Audio, video, chat, email, or survey: How much does online interview mode matter?
PLOS ONE | https://doi.org/10.1371/journal.pone.0263876 February 22, 2022 20 / 43
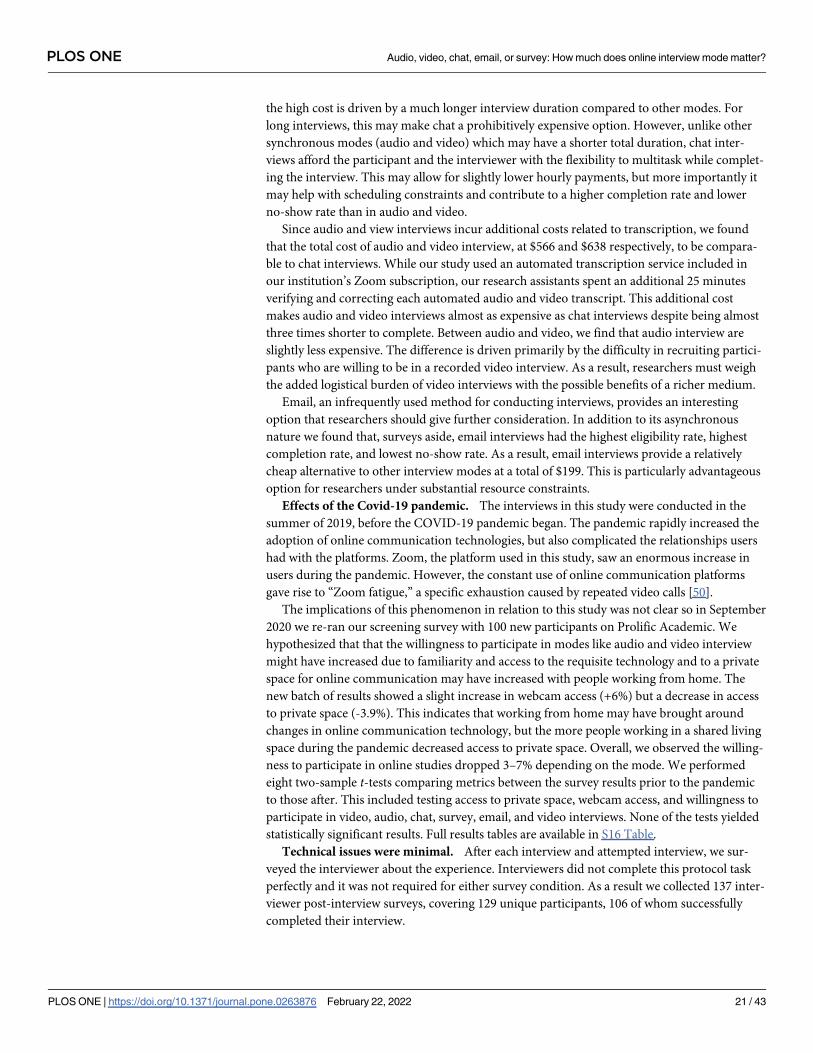
the high cost is driven by a much longer interview duration compared to other modes. For
long interviews, this may make chat a prohibitively expensive option. However, unlike other
synchronous modes (audio and video) which may have a shorter total duration, chat inter-
views afford the participant and the interviewer with the flexibility to multitask while complet-
ing the interview. This may allow for slightly lower hourly payments, but more importantly it
may help with scheduling constraints and contribute to a higher completion rate and lower
no-show rate than in audio and video.
Since audio and view interviews incur additional costs related to transcription, we found
that the total cost of audio and video interview, at $566 and $638 respectively, to be compara-
ble to chat interviews. While our study used an automated transcription service included in
our institution’s Zoom subscription, our research assistants spent an additional 25 minutes
verifying and correcting each automated audio and video transcript. This additional cost
makes audio and video interviews almost as expensive as chat interviews despite being almost
three times shorter to complete. Between audio and video, we find that audio interview are
slightly less expensive. The difference is driven primarily by the difficulty in recruiting partici-
pants who are willing to be in a recorded video interview. As a result, researchers must weigh
the added logistical burden of video interviews with the possible benefits of a richer medium.
Email, an infrequently used method for conducting interviews, provides an interesting
option that researchers should give further consideration. In addition to its asynchronous
nature we found that, surveys aside, email interviews had the highest eligibility rate, highest
completion rate, and lowest no-show rate. As a result, email interviews provide a relatively
cheap alternative to other interview modes at a total of $199. This is particularly advantageous
option for researchers under substantial resource constraints.
Effects of the Covid-19 pandemic. The interviews in this study were conducted in the
summer of 2019, before the COVID-19 pandemic began. The pandemic rapidly increased the
adoption of online communication technologies, but also complicated the relationships users
had with the platforms. Zoom, the platform used in this study, saw an enormous increase in
users during the pandemic. However, the constant use of online communication platforms
gave rise to “Zoom fatigue,” a specific exhaustion caused by repeated video calls [50].
The implications of this phenomenon in relation to this study was not clear so in September
2020 we re-ran our screening survey with 100 new participants on Prolific Academic. We
hypothesized that that the willingness to participate in modes like audio and video interview
might have increased due to familiarity and access to the requisite technology and to a private
space for online communication may have increased with people working from home. The
new batch of results showed a slight increase in webcam access (+6%) but a decrease in access
to private space (-3.9%). This indicates that working from home may have brought around
changes in online communication technology, but the more people working in a shared living
space during the pandemic decreased access to private space. Overall, we observed the willing-
ness to participate in online studies dropped 3–7% depending on the mode. We performed
eight two-sample t-tests comparing metrics between the survey results prior to the pandemic
to those after. This included testing access to private space, webcam access, and willingness to
participate in video, audio, chat, survey, email, and video interviews. None of the tests yielded
statistically significant results. Full results tables are available in S16 Table.
Technical issues were minimal. After each interview and attempted interview, we sur-
veyed the interviewer about the experience. Interviewers did not complete this protocol task
perfectly and it was not required for either survey condition. As a result we collected 137 inter-
viewer post-interview surveys, covering 129 unique participants, 106 of whom successfully
completed their interview.
PLOS ONE Audio, video, chat, email, or survey: How much does online interview mode matter?
PLOS ONE | https://doi.org/10.1371/journal.pone.0263876 February 22, 2022 21 / 43
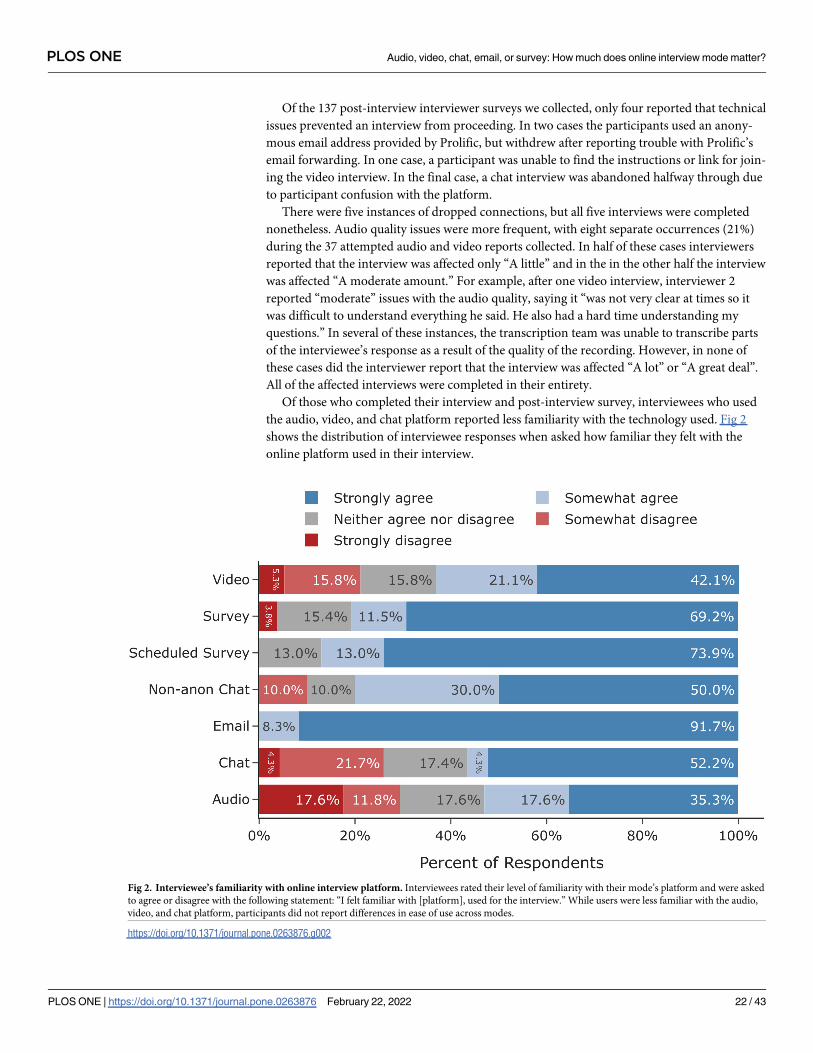
Of the 137 post-interview interviewer surveys we collected, only four reported that technical
issues prevented an interview from proceeding. In two cases the participants used an anony-
mous email address provided by Prolific, but withdrew after reporting trouble with Prolific’s
email forwarding. In one case, a participant was unable to find the instructions or link for join-
ing the video interview. In the final case, a chat interview was abandoned halfway through due
to participant confusion with the platform.
There were five instances of dropped connections, but all five interviews were completed
nonetheless. Audio quality issues were more frequent, with eight separate occurrences (21%)
during the 37 attempted audio and video reports collected. In half of these cases interviewers
reported that the interview was affected only “A little” and in the in the other half the interview
was affected “A moderate amount.” For example, after one video interview, interviewer 2
reported “moderate” issues with the audio quality, saying it “was not very clear at times so it
was difficult to understand everything he said. He also had a hard time understanding my
questions.” In several of these instances, the transcription team was unable to transcribe parts
of the interviewee’s response as a result of the quality of the recording. However, in none of
these cases did the interviewer report that the interview was affected “A lot” or “A great deal”.
All of the affected interviews were completed in their entirety.
Of those who completed their interview and post-interview survey, interviewees who used
the audio, video, and chat platform reported less familiarity with the technology used. Fig 2
shows the distribution of interviewee responses when asked how familiar they felt with the
online platform used in their interview.
Fig 2. Interviewee’s familiarity with online interview platform. Interviewees rated their level of familiarity with their mode’s platform and were asked
to agree or disagree with the following statement: “I felt familiar with [platform], used for the interview.” While users were less familiar with the audio,
video, and chat platform, participants did not report differences in ease of use across modes.
https://doi.org/10.1371/journal.pone.0263876.g002
PLOS ONE Audio, video, chat, email, or survey: How much does online interview mode matter?
PLOS ONE | https://doi.org/10.1371/journal.pone.0263876 February 22, 2022 22 / 43
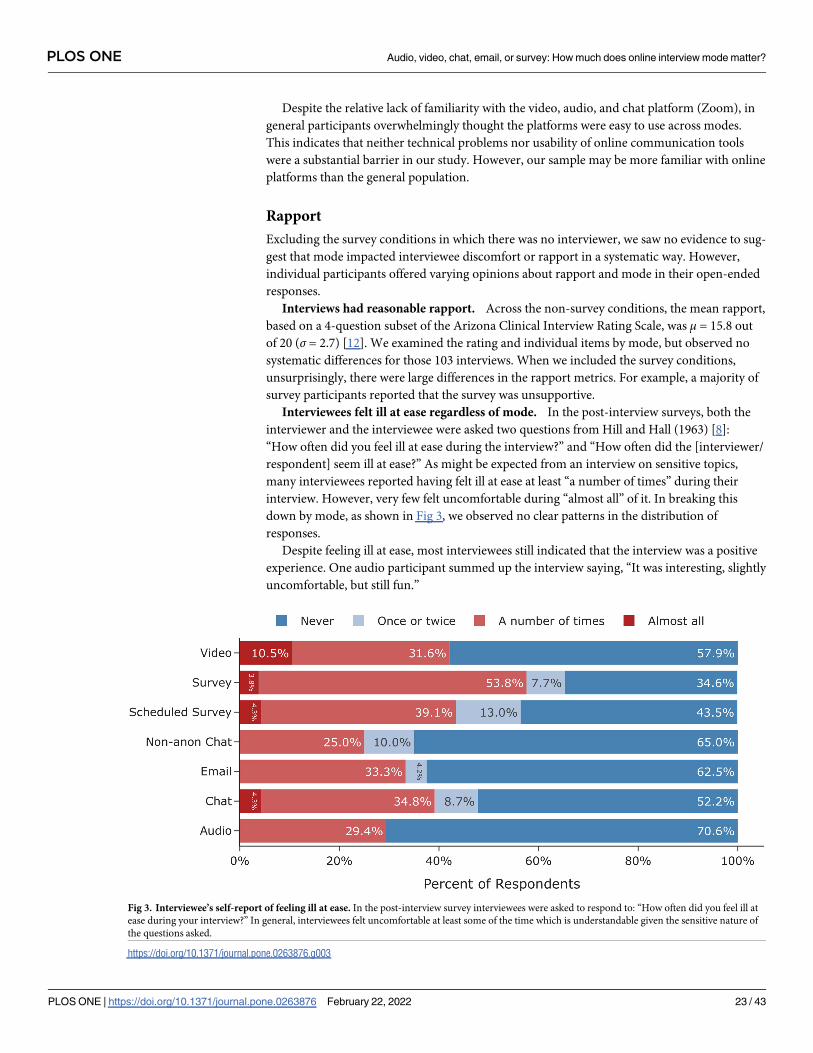
Despite the relative lack of familiarity with the video, audio, and chat platform (Zoom), in
general participants overwhelmingly thought the platforms were easy to use across modes.
This indicates that neither technical problems nor usability of online communication tools
were a substantial barrier in our study. However, our sample may be more familiar with online
platforms than the general population.
Rapport
Excluding the survey conditions in which there was no interviewer, we saw no evidence to sug-
gest that mode impacted interviewee discomfort or rapport in a systematic way. However,
individual participants offered varying opinions about rapport and mode in their open-ended
responses.
Interviews had reasonable rapport. Across the non-survey conditions, the mean rapport,
based on a 4-question subset of the Arizona Clinical Interview Rating Scale, was μ = 15.8 out
of 20 (σ = 2.7) [12]. We examined the rating and individual items by mode, but observed no
systematic differences for those 103 interviews. When we included the survey conditions,
unsurprisingly, there were large differences in the rapport metrics. For example, a majority of
survey participants reported that the survey was unsupportive.
Interviewees felt ill at ease regardless of mode. In the post-interview surveys, both the
interviewer and the interviewee were asked two questions from Hill and Hall (1963) [8]:
“How often did you feel ill at ease during the interview?” and “How often did the [interviewer/
respondent] seem ill at ease?” As might be expected from an interview on sensitive topics,
many interviewees reported having felt ill at ease at least “a number of times” during their
interview. However, very few felt uncomfortable during “almost all” of it. In breaking this
down by mode, as shown in Fig 3, we observed no clear patterns in the distribution of
responses.
Despite feeling ill at ease, most interviewees still indicated that the interview was a positive
experience. One audio participant summed up the interview saying, “It was interesting, slightly
uncomfortable, but still fun.”
Fig 3. Interviewee’s self-report of feeling ill at ease. In the post-interview survey interviewees were asked to respond to: “How often did you feel ill at
ease during your interview?” In general, interviewees felt uncomfortable at least some of the time which is understandable given the sensitive nature of
the questions asked.
https://doi.org/10.1371/journal.pone.0263876.g003
PLOS ONE Audio, video, chat, email, or survey: How much does online interview mode matter?
PLOS ONE | https://doi.org/10.1371/journal.pone.0263876 February 22, 2022 23 / 43
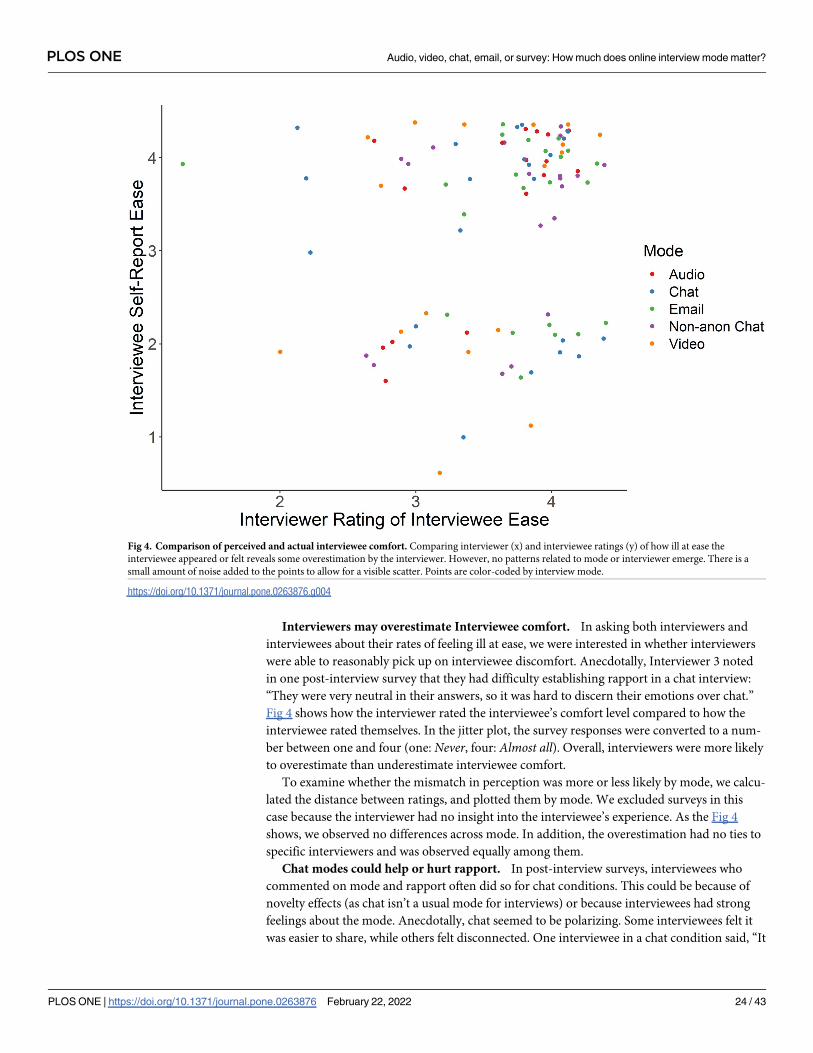
Interviewers may overestimate Interviewee comfort. In asking both interviewers and
interviewees about their rates of feeling ill at ease, we were interested in whether interviewers
were able to reasonably pick up on interviewee discomfort. Anecdotally, Interviewer 3 noted
in one post-interview survey that they had difficulty establishing rapport in a chat interview:
“They were very neutral in their answers, so it was hard to discern their emotions over chat.”
Fig 4 shows how the interviewer rated the interviewee’s comfort level compared to how the
interviewee rated themselves. In the jitter plot, the survey responses were converted to a num-
ber between one and four (one: Never, four: Almost all). Overall, interviewers were more likely
to overestimate than underestimate interviewee comfort.
To examine whether the mismatch in perception was more or less likely by mode, we calcu-
lated the distance between ratings, and plotted them by mode. We excluded surveys in this
case because the interviewer had no insight into the interviewee’s experience. As the Fig 4
shows, we observed no differences across mode. In addition, the overestimation had no ties to
specific interviewers and was observed equally among them.
Chat modes could help or hurt rapport. In post-interview surveys, interviewees who
commented on mode and rapport often did so for chat conditions. This could be because of
novelty effects (as chat isn’t a usual mode for interviews) or because interviewees had strong
feelings about the mode. Anecdotally, chat seemed to be polarizing. Some interviewees felt it
was easier to share, while others felt disconnected. One interviewee in a chat condition said, “It
Fig 4. Comparison of perceived and actual interviewee comfort. Comparing interviewer (x) and interviewee ratings (y) of how ill at ease the
interviewee appeared or felt reveals some overestimation by the interviewer. However, no patterns related to mode or interviewer emerge. There is a
small amount of noise added to the points to allow for a visible scatter. Points are color-coded by interview mode.
https://doi.org/10.1371/journal.pone.0263876.g004
PLOS ONE Audio, video, chat, email, or survey: How much does online interview mode matter?
PLOS ONE | https://doi.org/10.1371/journal.pone.0263876 February 22, 2022 24 / 43
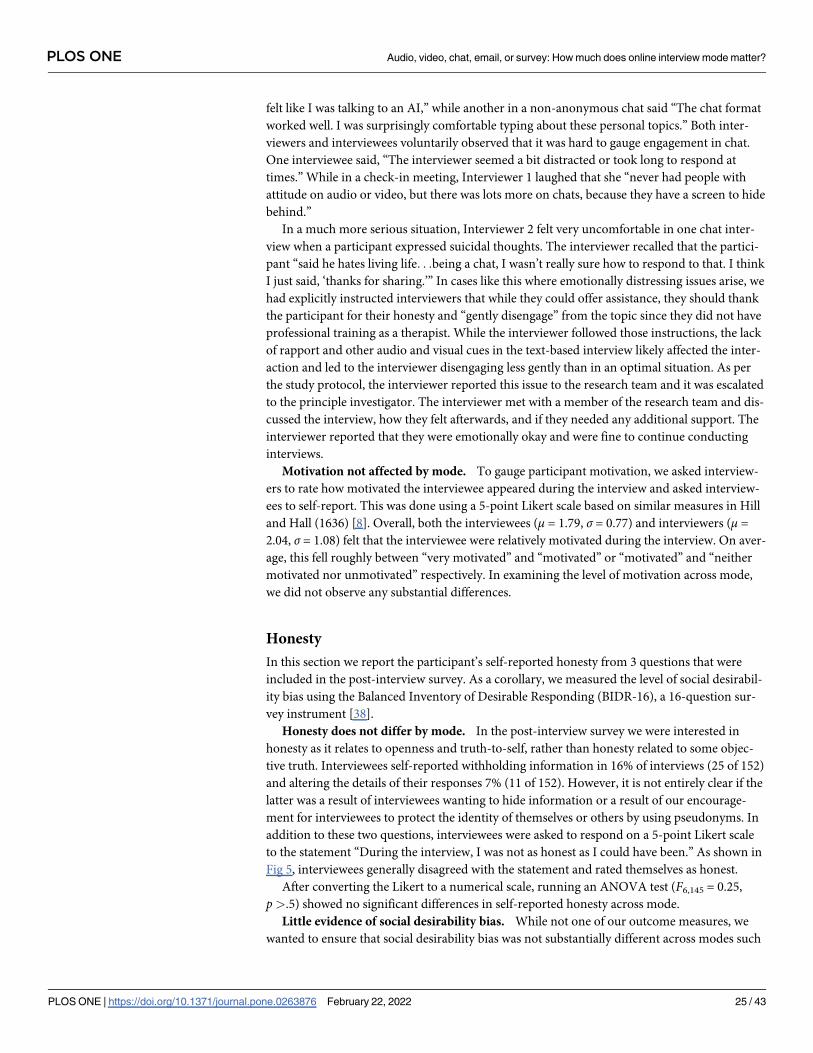
felt like I was talking to an AI,” while another in a non-anonymous chat said “The chat format
worked well. I was surprisingly comfortable typing about these personal topics.” Both inter-
viewers and interviewees voluntarily observed that it was hard to gauge engagement in chat.
One interviewee said, “The interviewer seemed a bit distracted or took long to respond at
times.” While in a check-in meeting, Interviewer 1 laughed that she “never had people with
attitude on audio or video, but there was lots more on chats, because they have a screen to hide
behind.”
In a much more serious situation, Interviewer 2 felt very uncomfortable in one chat inter-
view when a participant expressed suicidal thoughts. The interviewer recalled that the partici-
pant “said he hates living life. . .being a chat, I wasn’t really sure how to respond to that. I think
I just said, ‘thanks for sharing.’” In cases like this where emotionally distressing issues arise, we
had explicitly instructed interviewers that while they could offer assistance, they should thank
the participant for their honesty and “gently disengage” from the topic since they did not have
professional training as a therapist. While the interviewer followed those instructions, the lack
of rapport and other audio and visual cues in the text-based interview likely affected the inter-
action and led to the interviewer disengaging less gently than in an optimal situation. As per
the study protocol, the interviewer reported this issue to the research team and it was escalated
to the principle investigator. The interviewer met with a member of the research team and dis-
cussed the interview, how they felt afterwards, and if they needed any additional support. The
interviewer reported that they were emotionally okay and were fine to continue conducting
interviews.
Motivation not affected by mode. To gauge participant motivation, we asked interview-
ers to rate how motivated the interviewee appeared during the interview and asked interview-
ees to self-report. This was done using a 5-point Likert scale based on similar measures in Hill
and Hall (1636) [8]. Overall, both the interviewees (μ = 1.79, σ = 0.77) and interviewers (μ =
2.04, σ = 1.08) felt that the interviewee were relatively motivated during the interview. On aver-
age, this fell roughly between “very motivated” and “motivated” or “motivated” and “neither
motivated nor unmotivated” respectively. In examining the level of motivation across mode,
we did not observe any substantial differences.
Honesty
In this section we report the participant’s self-reported honesty from 3 questions that were
included in the post-interview survey. As a corollary, we measured the level of social desirabil-
ity bias using the Balanced Inventory of Desirable Responding (BIDR-16), a 16-question sur-
vey instrument [38].
Honesty does not differ by mode. In the post-interview survey we were interested in
honesty as it relates to openness and truth-to-self, rather than honesty related to some objec-
tive truth. Interviewees self-reported withholding information in 16% of interviews (25 of 152)
and altering the details of their responses 7% (11 of 152). However, it is not entirely clear if the
latter was a result of interviewees wanting to hide information or a result of our encourage-
ment for interviewees to protect the identity of themselves or others by using pseudonyms. In
addition to these two questions, interviewees were asked to respond on a 5-point Likert scale
to the statement “During the interview, I was not as honest as I could have been.” As shown in
Fig 5, interviewees generally disagreed with the statement and rated themselves as honest.
After converting the Likert to a numerical scale, running an ANOVA test (F6,145 = 0.25,
p>.5) showed no significant differences in self-reported honesty across mode.
Little evidence of social desirability bias. While not one of our outcome measures, we
wanted to ensure that social desirability bias was not substantially different across modes such
PLOS ONE Audio, video, chat, email, or survey: How much does online interview mode matter?
PLOS ONE | https://doi.org/10.1371/journal.pone.0263876 February 22, 2022 25 / 43
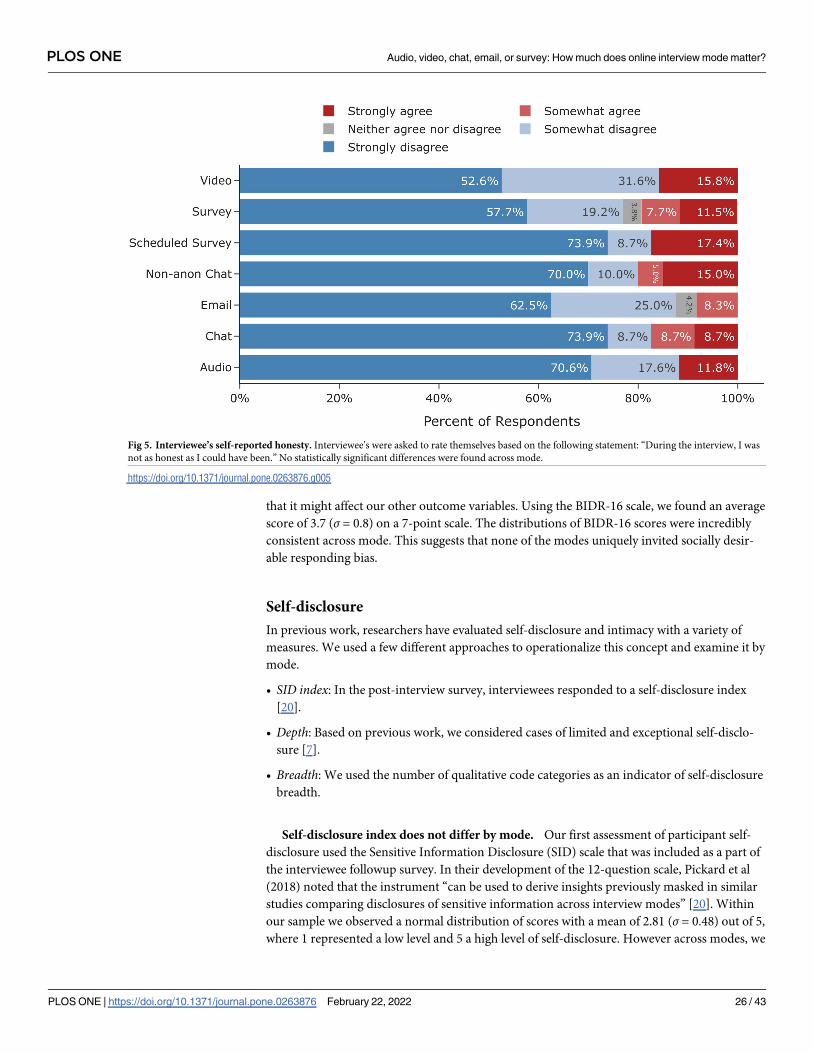
that it might affect our other outcome variables. Using the BIDR-16 scale, we found an average
score of 3.7 (σ = 0.8) on a 7-point scale. The distributions of BIDR-16 scores were incredibly
consistent across mode. This suggests that none of the modes uniquely invited socially desir-
able responding bias.
Self-disclosure
In previous work, researchers have evaluated self-disclosure and intimacy with a variety of
measures. We used a few different approaches to operationalize this concept and examine it by
mode.
• SID index: In the post-interview survey, interviewees responded to a self-disclosure index
[20].
• Depth: Based on previous work, we considered cases of limited and exceptional self-disclo-
sure [7].
• Breadth: We used the number of qualitative code categories as an indicator of self-disclosure
breadth.
Self-disclosure index does not differ by mode. Our first assessment of participant self-
disclosure used the Sensitive Information Disclosure (SID) scale that was included as a part of
the interviewee followup survey. In their development of the 12-question scale, Pickard et al
(2018) noted that the instrument “can be used to derive insights previously masked in similar
studies comparing disclosures of sensitive information across interview modes” [20]. Within
our sample we observed a normal distribution of scores with a mean of 2.81 (σ = 0.48) out of 5,
where 1 represented a low level and 5 a high level of self-disclosure. However across modes, we
Fig 5. Interviewee’s self-reported honesty. Interviewee’s were asked to rate themselves based on the following statement: “During the interview, I was
not as honest as I could have been.” No statistically significant differences were found across mode.
https://doi.org/10.1371/journal.pone.0263876.g005
PLOS ONE Audio, video, chat, email, or survey: How much does online interview mode matter?
PLOS ONE | https://doi.org/10.1371/journal.pone.0263876 February 22, 2022 26 / 43
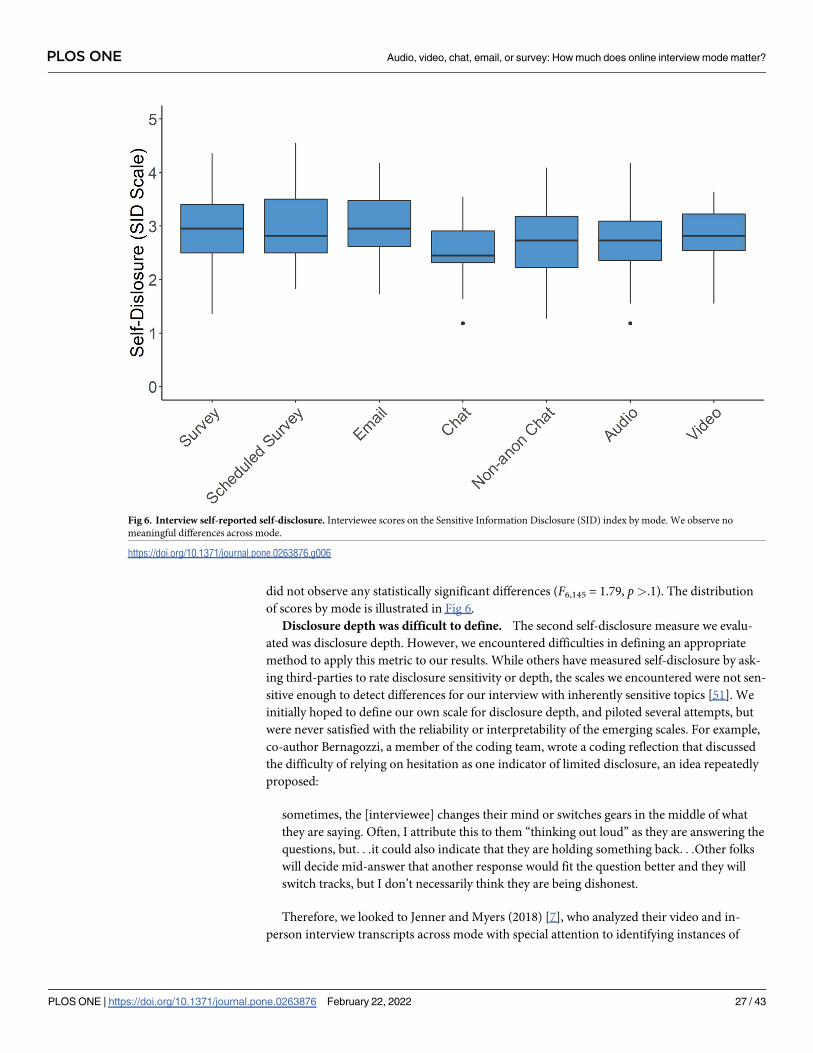
did not observe any statistically significant differences (F6,145 = 1.79, p>.1). The distribution
of scores by mode is illustrated in Fig 6.
Disclosure depth was difficult to define. The second self-disclosure measure we evalu-
ated was disclosure depth. However, we encountered difficulties in defining an appropriate
method to apply this metric to our results. While others have measured self-disclosure by ask-
ing third-parties to rate disclosure sensitivity or depth, the scales we encountered were not sen-
sitive enough to detect differences for our interview with inherently sensitive topics [51]. We
initially hoped to define our own scale for disclosure depth, and piloted several attempts, but
were never satisfied with the reliability or interpretability of the emerging scales. For example,
co-author Bernagozzi, a member of the coding team, wrote a coding reflection that discussed
the difficulty of relying on hesitation as one indicator of limited disclosure, an idea repeatedly
proposed:
sometimes, the [interviewee] changes their mind or switches gears in the middle of what
they are saying. Often, I attribute this to them “thinking out loud” as they are answering the
questions, but. . .it could also indicate that they are holding something back. . .Other folks
will decide mid-answer that another response would fit the question better and they will
switch tracks, but I don’t necessarily think they are being dishonest.
Therefore, we looked to Jenner and Myers (2018) [7], who analyzed their video and in-
person interview transcripts across mode with special attention to identifying instances of
Fig 6. Interview self-reported self-disclosure. Interviewee scores on the Sensitive Information Disclosure (SID) index by mode. We observe no
meaningful differences across mode.
https://doi.org/10.1371/journal.pone.0263876.g006
PLOS ONE Audio, video, chat, email, or survey: How much does online interview mode matter?
PLOS ONE | https://doi.org/10.1371/journal.pone.0263876 February 22, 2022 27 / 43
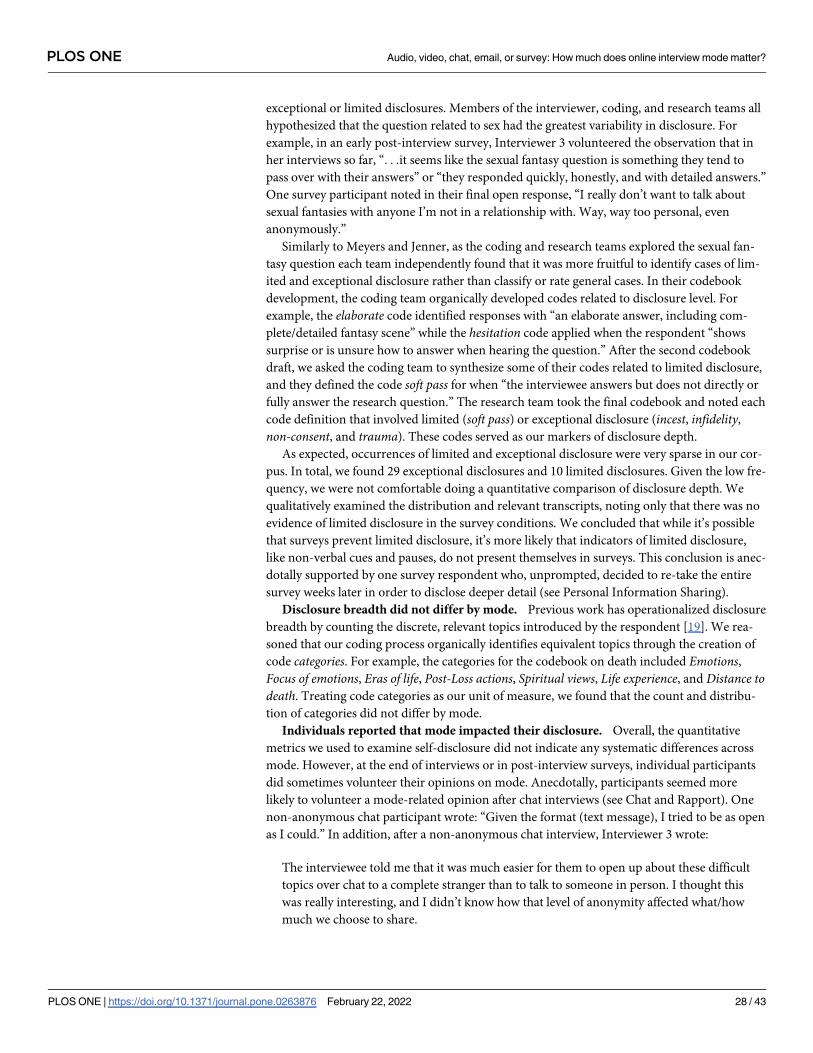
exceptional or limited disclosures. Members of the interviewer, coding, and research teams all
hypothesized that the question related to sex had the greatest variability in disclosure. For
example, in an early post-interview survey, Interviewer 3 volunteered the observation that in
her interviews so far, “. . .it seems like the sexual fantasy question is something they tend to
pass over with their answers” or “they responded quickly, honestly, and with detailed answers.”
One survey participant noted in their final open response, “I really don’t want to talk about
sexual fantasies with anyone I’m not in a relationship with. Way, way too personal, even
anonymously.”
Similarly to Meyers and Jenner, as the coding and research teams explored the sexual fan-
tasy question each team independently found that it was more fruitful to identify cases of lim-
ited and exceptional disclosure rather than classify or rate general cases. In their codebook
development, the coding team organically developed codes related to disclosure level. For
example, the elaborate code identified responses with “an elaborate answer, including com-
plete/detailed fantasy scene” while the hesitation code applied when the respondent “shows
surprise or is unsure how to answer when hearing the question.” After the second codebook
draft, we asked the coding team to synthesize some of their codes related to limited disclosure,
and they defined the code soft pass for when “the interviewee answers but does not directly or
fully answer the research question.” The research team took the final codebook and noted each
code definition that involved limited (soft pass) or exceptional disclosure (incest, infidelity,
non-consent, and trauma). These codes served as our markers of disclosure depth.
As expected, occurrences of limited and exceptional disclosure were very sparse in our cor-
pus. In total, we found 29 exceptional disclosures and 10 limited disclosures. Given the low fre-
quency, we were not comfortable doing a quantitative comparison of disclosure depth. We
qualitatively examined the distribution and relevant transcripts, noting only that there was no
evidence of limited disclosure in the survey conditions. We concluded that while it’s possible
that surveys prevent limited disclosure, it’s more likely that indicators of limited disclosure,
like non-verbal cues and pauses, do not present themselves in surveys. This conclusion is anec-
dotally supported by one survey respondent who, unprompted, decided to re-take the entire
survey weeks later in order to disclose deeper detail (see Personal Information Sharing).
Disclosure breadth did not differ by mode. Previous work has operationalized disclosure
breadth by counting the discrete, relevant topics introduced by the respondent [19]. We rea-
soned that our coding process organically identifies equivalent topics through the creation of
code categories. For example, the categories for the codebook on death included Emotions,Focus of emotions, Eras of life, Post-Loss actions, Spiritual views, Life experience, and Distance todeath. Treating code categories as our unit of measure, we found that the count and distribu-
tion of categories did not differ by mode.
Individuals reported that mode impacted their disclosure. Overall, the quantitative
metrics we used to examine self-disclosure did not indicate any systematic differences across
mode. However, at the end of interviews or in post-interview surveys, individual participants
did sometimes volunteer their opinions on mode. Anecdotally, participants seemed more
likely to volunteer a mode-related opinion after chat interviews (see Chat and Rapport). One
non-anonymous chat participant wrote: “Given the format (text message), I tried to be as open
as I could.” In addition, after a non-anonymous chat interview, Interviewer 3 wrote:
The interviewee told me that it was much easier for them to open up about these difficult
topics over chat to a complete stranger than to talk to someone in person. I thought this
was really interesting, and I didn’t know how that level of anonymity affected what/how
much we choose to share.
PLOS ONE Audio, video, chat, email, or survey: How much does online interview mode matter?
PLOS ONE | https://doi.org/10.1371/journal.pone.0263876 February 22, 2022 28 / 43
In contrast, one email participant explicitly described that they withheld or altered their
response during the interview, but felt comfortable discussing them in a post-interview survey.
I wasn’t dishonest but I was super uncomfortable about the sexual fantasy question. I have a
lot of insecurities about my body so I’m just not really open about sex because of that. And
I don’t like talking about it. I also wasn’t as open about my depression as I should have been
—I didn’t mention the time I was laid off from work and didn’t leave my apartment once in
five months. Dunno why I’m now comfortable enough to admit this stuff. Maybe it’s easier
when I don’t feel like I’m having a conversation with someone.
On one hand, we observe evidence that text-based communication may allow for greater
disclosure, but at the same time the presence of an interviewer, even in as abstract a form as
email, can have an affect on both the interviewee’s level of comfort and their disclosure.
Perceived anonymity
In post-interview surveys, interviewees responded to a 5-question perceived anonymity instru-
ment developed by Hite et al. (2014) [32]. In general, the interviewees felt more anonymous
than not, with an average score of 5.66 (σ = 1.15) on a 7-point scale.
We hypothesized that there would be differences between the chat and non-anonymous
chat modes since the non-anonymous chat condition was designed to de-emphasize anonym-
ity. Given the unbalanced sample sizes, n = 20 for Non-anon Chat and n = 23 for Chat, we
tested this using Welch’s t-test (t = −2.0795, p<.05). We found that perceived anonymity in
the non-anonymous chat (μ = 5.44, σ = 1.15) was statistically significantly lower than the regu-
lar (anonymous) chat condition (μ = 6.16, σ = 0.72). Thus, in the chat conditions, when we
removed advice on participating anonymously and addressed participants by name, it did
decrease the perception of anonymity.
However, differences between other modes were lower than what we had anticipated. For
example, we had anticipated that participants in the video condition might have more privacy
concerns than participants in other conditions, as interviewers could see the interviewee’s face
even if they didn’t know their name. Yet, we found no evidence to support this hypothesis and
none of the video participants volunteered any information about privacy-related discomfort
or concerns. This suggests that perceived anonymity was not dependent on “actual” threats of
de-identification.
Participants provided more personal information than requested. All conditions except
for the non-anonymous chat mode discouraged participants from sharing personally-identify-
ing information and gave them instructions on how to prevent doing so (see Anonymity).
However, there were cases where participants still provided us with personal information
despite the instructions. In our scheduling sign-up form and interview platform, we auto-filled
any personal information fields with reminders such as “Do not provide your name.” Nonethe-
less, some participants chose to provide their name or use a personal email address rather than
the anonymous one provided by Prolific. We logged 191 scheduling forms, including individ-
ual reschedules, noting whether the name fields appeared to be personally-identifying or likely
pseudonymous. Of the 27 scheduling forms for the non-anonymous chat condition, 26 partici-
pants provided an identifying name and one provided a name that was possibly pseudony-
mous. In contrast, only 17 of 164 participants (10%) in the remaining (anonymous) modes
chose to overwrite the default values with an identifying name. For audio and video modes, we
checked whether the participants chose to provide an identifying name when prompted for a
username by the Zoom platform. Of the 36 interviews, 30% shared a likely identifying name.
PLOS ONE Audio, video, chat, email, or survey: How much does online interview mode matter?
PLOS ONE | https://doi.org/10.1371/journal.pone.0263876 February 22, 2022 29 / 43
We do not fully understand why participants chose to provide personally-identifying infor-
mation despite explicit instructions not to do so. It is possible that participants were confused
by instructions, lacked tools to protect their identity if they desired, or felt ambivalent. One
email participant did provide insights in a post-interview survey, reporting:
I thought the process for answering the survey through Prolific looked complicated, and I
worried that I wouldn’t get notifications for Prolific messages and would then not answer
fast enough, so I didn’t try that route and just set up my email address to be used. However,
my email address contained identifying features, and I now kind of regret using it.
Another email participant responded:
I want to point out that I accidentally shared my first and last name with my interviewer
when responding to her the first time, which is the reason for my answers to the privacy
questions in this survey. That was my fault, but I don’t believe that my personal identifica-
tion will result in any privacy concerns.
Individuals were conscious of anonymity. While the mode did not appear to have sub-
stantial effects on the perceived anonymity, interviewers and interviewees both indicated that
anonymity was a factor during their interviews. Interviewer 2 noted in a post-interview survey
that after answering all the questions, a non-anonymous chat participant “was concerned
about how his identity would be kept confidential.” In addition, a survey participant said, “I
was honest in describing everything due to the fact that the survey is anonymous,” and a
scheduled survey participant said clearly, “I have nothing to hide when I am anonymous.” Fur-
thermore, after being asked the sensitive question pertaining to guilt, one video participant
paused to confirm that the researchers were not collecting any personal information about
them.
While researchers often collect identifying information from otherwise anonymous partici-
pants for logistical reasons, for example to facilitate scheduling and compensation, sometimes
it is beneficial to shield participant identity even from researchers. For example, one scheduled
survey participant said:
There were some questions, in which I could have gone more in-depth with, but because I
know several people who go to [the university conducting the study] (and of which, one of
whom is the subject of the questions of what I feel most guilty about), I felt as though I’d be
discovered by them somehow, so I didn’t feel comfortable in elaborating as much as I could
have on some topics.
In one unusual case, a survey participant completed their interview and post-interview sur-
vey with quality answers and received their compensation. Curiously, five weeks later, the par-
ticipant re-took both the survey and the post-interview survey. The participant was able to
retake the surveys because our survey mechanisms were set up to minimize the use of trackers
and thus did not automatically block retakes. The participant identified themselves by provid-
ing their anonymous Prolific ID in the survey, the primary identifier that was asked of all par-
ticipants and was used to match between screening, interview, and post-interview tasks. In
their second submission of the post-interview survey, the participant stated that they had pur-
posefully decided to fill out the surveys a second time. This was the only instance of a partici-
pant completing an interview multiple times. The responses in both were similar except for a
few instances related to the question about what the participant felt most guilty about. In the
PLOS ONE Audio, video, chat, email, or survey: How much does online interview mode matter?
PLOS ONE | https://doi.org/10.1371/journal.pone.0263876 February 22, 2022 30 / 43
first iteration, the participant provided a general response about the betrayal of trust and in the
post-interview survey said, “I am not comfortable sharing the worst thing I’ve ever done in my
life.” However in the second survey, the participant disclosed a much more serious situation in
which they expressed guilt over a past event involving sexual violence without disclosing any
details. It seems the participant had been thinking about the interview response and, of their
own volition and without notifying the research team, decided to re-take the survey interview
in order to include this deeper disclosure. While it is difficult to interpret this story in the con-
text of this study, it’s interesting that the survey condition afforded the participant (1) a degree
of anonymity and (2) the ability to take the full initiative in updating their response without
needing to interact with anyone to do so. In the re-take the participant closed by saying, “I
sure hope this is anonymous,” illustrating that that the participant took a risk with disclosure
despite having privacy concerns. As with other sensitive issues that arose during the course of
this study, this case was immediately escalated to the principal investigator. The research team
discussed this situation at length and considered what actions might be taken as a result. Ulti-
mately, given the anonymity of the participant and the lack of any specific details surrounding
the event, the team decided not to escalate further.
Qualitative data equivalence
A central question in our analysis was not whether different interview modes produce different
data, but whether those differences could in turn yield substantially different results. As such,
we evaluated the data equivalence across modes using differences in structure (word count)
and theme (qualitative codes).
Interviewer followup probes can have a substantial impact on the direction and length of an
interview. Because surveys do not allow for followup questions, we reasoned that it would be
difficult to interpret direct comparisons between surveys and other modes. We also reasoned
that followup questions were the main vector for interviewer effects, as they were the one fac-
tor that interviewers had a large amount of control over. As a result, we decided to examine
data equivalence factors on two different subsets of transcripts. First, we evaluated responses
prior to any interviewer follow up questions across all seven modes. This subset allowed us to
compare the “first impression” responses to questions, putting all the modes on a more con-
trolled footing. Second, we excluded the two survey conditions and evaluated the participant’s
full response including followup questions. This subset limited the comparisons to the condi-
tions that most resembled traditional interview modes.
Word counts were higher for verbal modes. Word count is a structural feature of inter-
view data, but previous work has applied it to content-related constructs like self-disclosure
depth or engagement [19]. Our own interviewers and coders also implied that they associated
response length with content quality. For example, Interviewer 1 was concerned that in one
chat interview “the answers were short and [the participant] not too willing.” The coding team
who worked on the question pertaining to sex even defined a code called short for responses
that “give a very short answer.” This further indicates that the team thought length had the-
matic implications worth investigating.
To calculate a word count for the main interview questions, we excluded non-interview
related conversations at the start or close of interviews and included any non-verbal annota-
tions that the transcribers noted. The mean across all completed interviews was 312 words (σ =
318.4) for the followups removed subset and 889 words (σ = 629.0) words for the followupsincluded subset. In particular, the video and audio conditions had the most words, approach-
ing twice as much as surveys and chats.
PLOS ONE Audio, video, chat, email, or survey: How much does online interview mode matter?
PLOS ONE | https://doi.org/10.1371/journal.pone.0263876 February 22, 2022 31 / 43
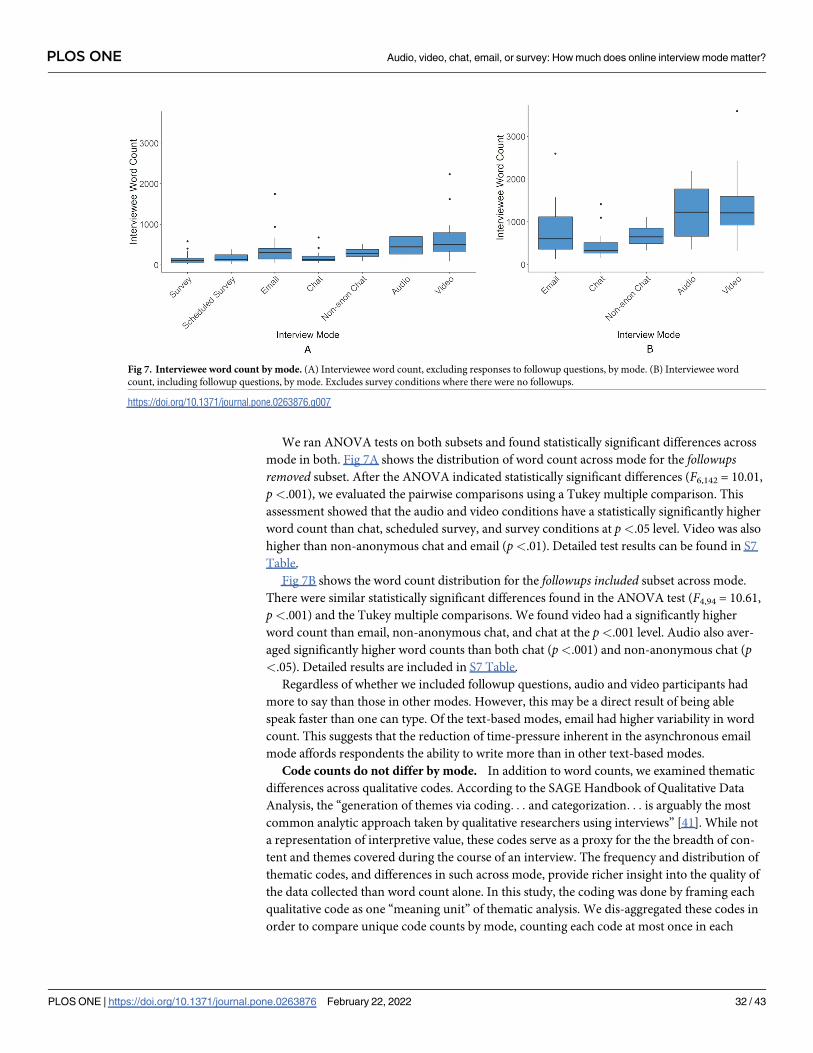
We ran ANOVA tests on both subsets and found statistically significant differences across
mode in both. Fig 7A shows the distribution of word count across mode for the followupsremoved subset. After the ANOVA indicated statistically significant differences (F6,142 = 10.01,
p<.001), we evaluated the pairwise comparisons using a Tukey multiple comparison. This
assessment showed that the audio and video conditions have a statistically significantly higher
word count than chat, scheduled survey, and survey conditions at p<.05 level. Video was also
higher than non-anonymous chat and email (p<.01). Detailed test results can be found in S7
Table.
Fig 7B shows the word count distribution for the followups included subset across mode.
There were similar statistically significant differences found in the ANOVA test (F4,94 = 10.61,
p<.001) and the Tukey multiple comparisons. We found video had a significantly higher
word count than email, non-anonymous chat, and chat at the p<.001 level. Audio also aver-
aged significantly higher word counts than both chat (p<.001) and non-anonymous chat (p<.05). Detailed results are included in S7 Table.
Regardless of whether we included followup questions, audio and video participants had
more to say than those in other modes. However, this may be a direct result of being able
speak faster than one can type. Of the text-based modes, email had higher variability in word
count. This suggests that the reduction of time-pressure inherent in the asynchronous email
mode affords respondents the ability to write more than in other text-based modes.
Code counts do not differ by mode. In addition to word counts, we examined thematic
differences across qualitative codes. According to the SAGE Handbook of Qualitative Data
Analysis, the “generation of themes via coding. . . and categorization. . . is arguably the most
common analytic approach taken by qualitative researchers using interviews” [41]. While not
a representation of interpretive value, these codes serve as a proxy for the the breadth of con-
tent and themes covered during the course of an interview. The frequency and distribution of
thematic codes, and differences in such across mode, provide richer insight into the quality of
the data collected than word count alone. In this study, the coding was done by framing each
qualitative code as one “meaning unit” of thematic analysis. We dis-aggregated these codes in
order to compare unique code counts by mode, counting each code at most once in each
Fig 7. Interviewee word count by mode. (A) Interviewee word count, excluding responses to followup questions, by mode. (B) Interviewee word
count, including followup questions, by mode. Excludes survey conditions where there were no followups.
https://doi.org/10.1371/journal.pone.0263876.g007
PLOS ONE Audio, video, chat, email, or survey: How much does online interview mode matter?
PLOS ONE | https://doi.org/10.1371/journal.pone.0263876 February 22, 2022 32 / 43
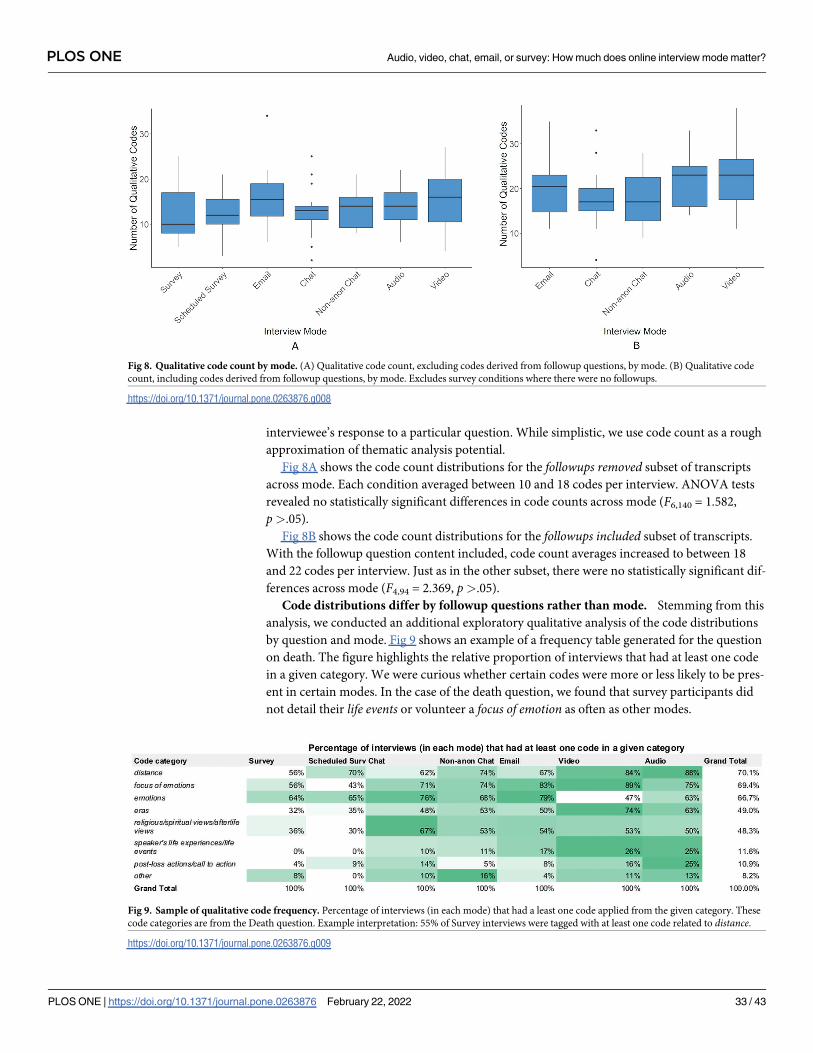
interviewee’s response to a particular question. While simplistic, we use code count as a rough
approximation of thematic analysis potential.
Fig 8A shows the code count distributions for the followups removed subset of transcripts
across mode. Each condition averaged between 10 and 18 codes per interview. ANOVA tests
revealed no statistically significant differences in code counts across mode (F6,140 = 1.582,
p>.05).
Fig 8B shows the code count distributions for the followups included subset of transcripts.
With the followup question content included, code count averages increased to between 18
and 22 codes per interview. Just as in the other subset, there were no statistically significant dif-
ferences across mode (F4,94 = 2.369, p>.05).
Code distributions differ by followup questions rather than mode. Stemming from this
analysis, we conducted an additional exploratory qualitative analysis of the code distributions
by question and mode. Fig 9 shows an example of a frequency table generated for the question
on death. The figure highlights the relative proportion of interviews that had at least one code
in a given category. We were curious whether certain codes were more or less likely to be pres-
ent in certain modes. In the case of the death question, we found that survey participants did
not detail their life events or volunteer a focus of emotion as often as other modes.
Fig 8. Qualitative code count by mode. (A) Qualitative code count, excluding codes derived from followup questions, by mode. (B) Qualitative code
count, including codes derived from followup questions, by mode. Excludes survey conditions where there were no followups.
https://doi.org/10.1371/journal.pone.0263876.g008
Fig 9. Sample of qualitative code frequency. Percentage of interviews (in each mode) that had a least one code applied from the given category. These
code categories are from the Death question. Example interpretation: 55% of Survey interviews were tagged with at least one code related to distance.
https://doi.org/10.1371/journal.pone.0263876.g009
PLOS ONE Audio, video, chat, email, or survey: How much does online interview mode matter?
PLOS ONE | https://doi.org/10.1371/journal.pone.0263876 February 22, 2022 33 / 43
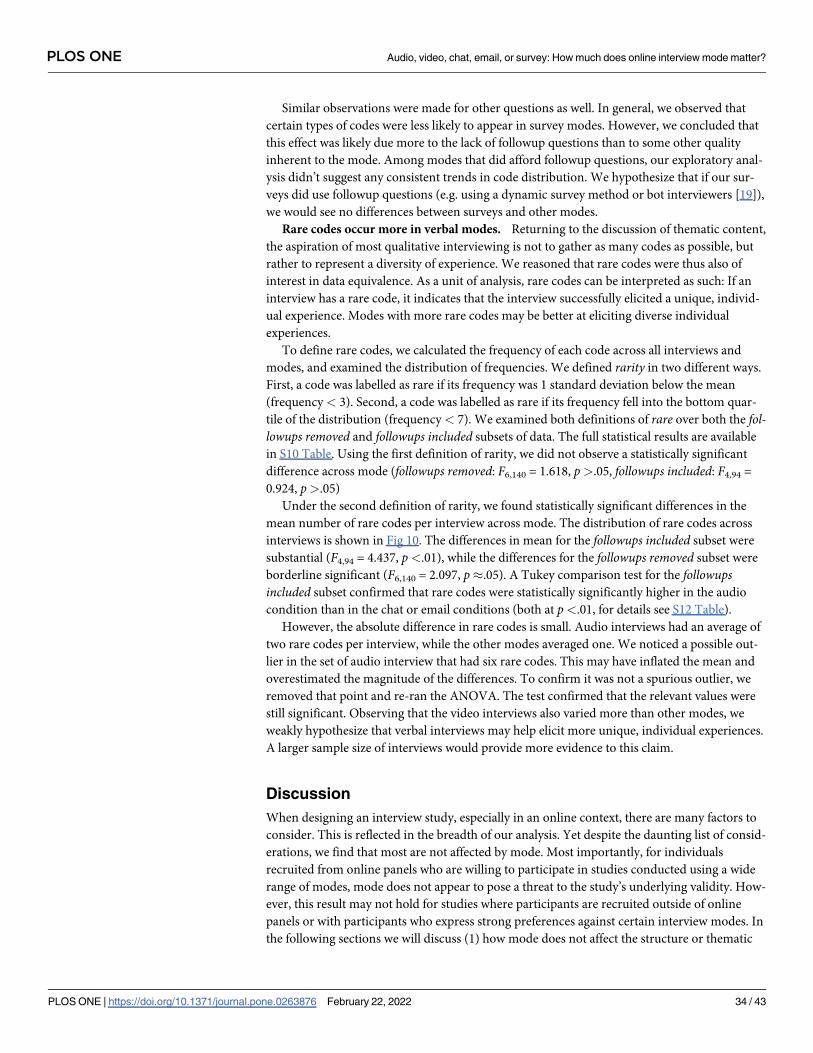
Similar observations were made for other questions as well. In general, we observed that
certain types of codes were less likely to appear in survey modes. However, we concluded that
this effect was likely due more to the lack of followup questions than to some other quality
inherent to the mode. Among modes that did afford followup questions, our exploratory anal-
ysis didn’t suggest any consistent trends in code distribution. We hypothesize that if our sur-
veys did use followup questions (e.g. using a dynamic survey method or bot interviewers [19]),
we would see no differences between surveys and other modes.
Rare codes occur more in verbal modes. Returning to the discussion of thematic content,
the aspiration of most qualitative interviewing is not to gather as many codes as possible, but
rather to represent a diversity of experience. We reasoned that rare codes were thus also of
interest in data equivalence. As a unit of analysis, rare codes can be interpreted as such: If an
interview has a rare code, it indicates that the interview successfully elicited a unique, individ-
ual experience. Modes with more rare codes may be better at eliciting diverse individual
experiences.
To define rare codes, we calculated the frequency of each code across all interviews and
modes, and examined the distribution of frequencies. We defined rarity in two different ways.
First, a code was labelled as rare if its frequency was 1 standard deviation below the mean
(frequency < 3). Second, a code was labelled as rare if its frequency fell into the bottom quar-
tile of the distribution (frequency < 7). We examined both definitions of rare over both the fol-lowups removed and followups included subsets of data. The full statistical results are available
in S10 Table. Using the first definition of rarity, we did not observe a statistically significant
difference across mode (followups removed: F6,140 = 1.618, p>.05, followups included: F4,94 =
0.924, p>.05)
Under the second definition of rarity, we found statistically significant differences in the
mean number of rare codes per interview across mode. The distribution of rare codes across
interviews is shown in Fig 10. The differences in mean for the followups included subset were
substantial (F4,94 = 4.437, p<.01), while the differences for the followups removed subset were
borderline significant (F6,140 = 2.097, p�.05). A Tukey comparison test for the followupsincluded subset confirmed that rare codes were statistically significantly higher in the audio
condition than in the chat or email conditions (both at p<.01, for details see S12 Table).
However, the absolute difference in rare codes is small. Audio interviews had an average of
two rare codes per interview, while the other modes averaged one. We noticed a possible out-
lier in the set of audio interview that had six rare codes. This may have inflated the mean and
overestimated the magnitude of the differences. To confirm it was not a spurious outlier, we
removed that point and re-ran the ANOVA. The test confirmed that the relevant values were
still significant. Observing that the video interviews also varied more than other modes, we
weakly hypothesize that verbal interviews may help elicit more unique, individual experiences.
A larger sample size of interviews would provide more evidence to this claim.
Discussion
When designing an interview study, especially in an online context, there are many factors to
consider. This is reflected in the breadth of our analysis. Yet despite the daunting list of consid-
erations, we find that most are not affected by mode. Most importantly, for individuals
recruited from online panels who are willing to participate in studies conducted using a wide
range of modes, mode does not appear to pose a threat to the study’s underlying validity. How-
ever, this result may not hold for studies where participants are recruited outside of online
panels or with participants who express strong preferences against certain interview modes. In
the following sections we will discuss (1) how mode does not affect the structure or thematic
PLOS ONE Audio, video, chat, email, or survey: How much does online interview mode matter?
PLOS ONE | https://doi.org/10.1371/journal.pone.0263876 February 22, 2022 34 / 43
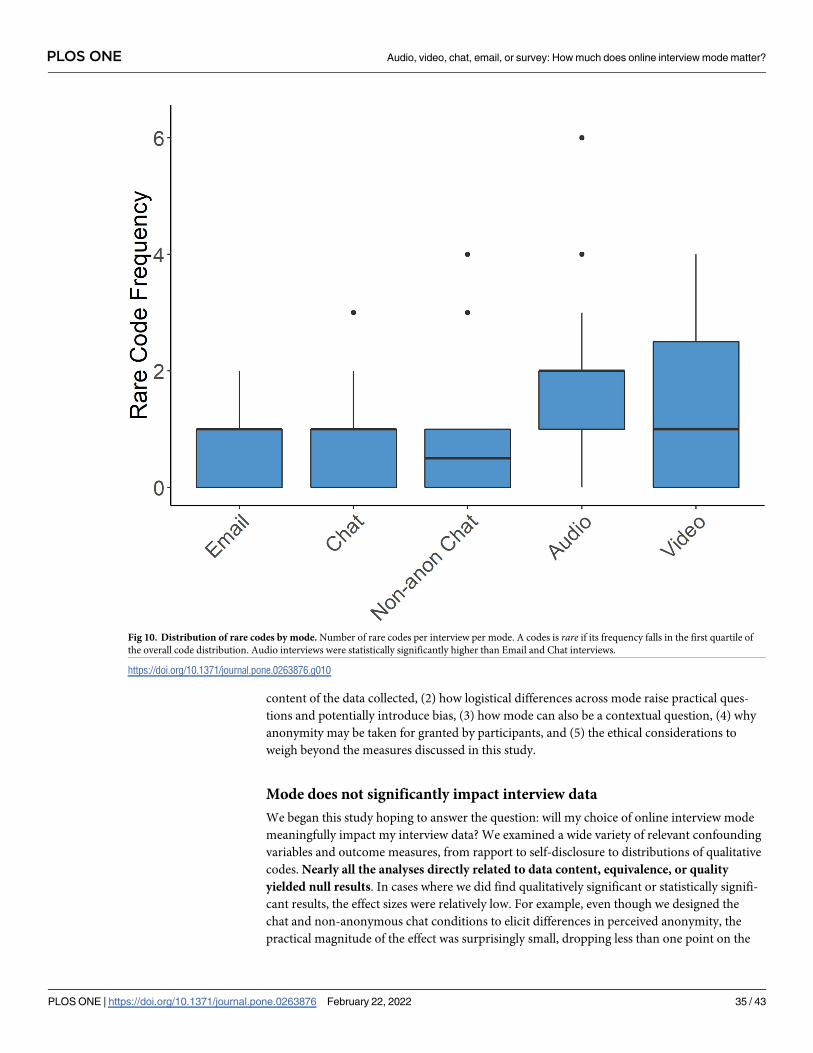
content of the data collected, (2) how logistical differences across mode raise practical ques-
tions and potentially introduce bias, (3) how mode can also be a contextual question, (4) why
anonymity may be taken for granted by participants, and (5) the ethical considerations to
weigh beyond the measures discussed in this study.
Mode does not significantly impact interview data
We began this study hoping to answer the question: will my choice of online interview mode
meaningfully impact my interview data? We examined a wide variety of relevant confounding
variables and outcome measures, from rapport to self-disclosure to distributions of qualitative
codes. Nearly all the analyses directly related to data content, equivalence, or quality
yielded null results. In cases where we did find qualitatively significant or statistically signifi-
cant results, the effect sizes were relatively low. For example, even though we designed the
chat and non-anonymous chat conditions to elicit differences in perceived anonymity, the
practical magnitude of the effect was surprisingly small, dropping less than one point on the
Fig 10. Distribution of rare codes by mode. Number of rare codes per interview per mode. A codes is rare if its frequency falls in the first quartile of
the overall code distribution. Audio interviews were statistically significantly higher than Email and Chat interviews.
https://doi.org/10.1371/journal.pone.0263876.g010
PLOS ONE Audio, video, chat, email, or survey: How much does online interview mode matter?
PLOS ONE | https://doi.org/10.1371/journal.pone.0263876 February 22, 2022 35 / 43
seven point scale. In another example, while we observed that audio and video conditions
yielded a greater number of rare topics, the difference amounted to one or two additional rare
topics per interview.
While the null results can be attributed to the low statistical power in our relatively small
sample of interviews, our sample sizes, ranging from 18 to 26 interviews per mode, align with
those used across a variety of academic disciplines. Therefore, we would expect that studies of
a similar size are unlikely to observe statistically significant differences as well. In addition, the
average effect size (Cohen’s d) for the number of qualitative codes that we observe across non-
survey modes, none of which were statistically significant, was 0.39 (σ = 0.26). This is generally
considered to be a small to medium effect. Increasing the sample size, while possibly making
these effects significant, would only further decrease the effect size [52]. Thus despite low
power, the effects of mode on interview data are likely small enough that most interviewers
can cautiously ignore them. Furthermore, evidence from previous work suggests that the
effect of mode is likely even smaller for interviews that focus on less sensitive content [27]. Of
course, this conclusion does not apply to large-scale collection methods like the broad distribu-
tion of a survey or questionnaire interview.
Logistical differences across mode are important
Instead, the most qualitatively and quantitatively significant effects of interview mode
were related to logistics. This raises two important considerations for researchers: one regard-
ing practicality and a second regarding validity. First, in terms of practical considerations, we
observe differences in recruitment, cost, and difficulty across mode. From the outset, a major-
ity of our participant pool was unwilling to complete audio, video, and/or recorded interviews.
Even among those who were willing to participate in these kinds of interviews, scheduling and
completion rates aligned with the general trend in mode preferences: audio and video inter-
views trailed behind other modes at<40% completion. The estimated costs associated with
audio, video, and chat modes were also substantially higher than survey and email. Even word
count, the outcome with the largest effect sizes by mode, was arguably better interpreted as a
logistical constraint, as in the cost of transcription, rather than some meaningful difference in
qualitative data.
While these factors are significant for resource constraints, they are also represent impor-
tant personal constraints for researchers to consider. In weekly check-in meetings during the
course of this study, interviewers frequently voiced irritation with participants dropping out
last minute or not showing up for interviews. For example, in a post-interview survey Inter-
viewer 3 reported being frustrated with one of the participants who had signed up to complete
an audio interview stating, “This was frustrating. The interviewee did not show for their first
interview, then chose to reschedule. Then they did not show for their rescheduled inter-
view. . .” This event, which was not an isolated occurrence, shows that matters of practical con-
cern also have personal and emotional consequences that researchers should consider. These
factors are likely even more important in the context of large-scale or longitudinal interview
studies.
Second, the logistical differences across mode also raise concerns over validity and potential
bias. Specifically, difficulty in recruiting participants for audio and video interviews, evidenced
by the low willingness to participate and high drop out rates, may lead to self-selection bias in
these modes. While the majority of potential participants had access to a webcam and key-
board, it is possible some participants did not feel comfortable using the technology. Even if
we assume general comfort with the process of using a device, they may not be comfortable
with having an interviewer see their face or their surroundings, hear their voice, or risk being
PLOS ONE Audio, video, chat, email, or survey: How much does online interview mode matter?
PLOS ONE | https://doi.org/10.1371/journal.pone.0263876 February 22, 2022 36 / 43
overheard by others who live or work in their space. While we do not have direct measure-
ments of these effects, it is possible that these more personally revealing modes (i.e. revealing
voice and appearance) may dissuade shy, self-conscious, or privacy-concerned individuals.
Audio and video modes are also less conducive to multi-tasking as text-based modes. This
may make these modes less attractive to participants, especially digital workers, and pose more
significant scheduling challenges. Furthermore, a lack of private space, the risk of being over-
heard by those around them, or a limited internet connection may cause users who have access
to the requisite devices to still not participate. These hurdles are likely to be even more signifi-
cant for individuals with lower income.
Mode can also be a personal, contextual question
While our statistical analysis did not provide evidence that mode affects interview data in a
substantial way, the responses of several individual participants provide a different perspective.
For some interviewees, mode was salient enough that they voluntarily discussed its impacts on
their experience without any prompting. These comments tended to be offered from (1) those
who valued anonymity, (2) those who found it easier to disclose information with less direct
interviewer contact, or (3) those in chat modes, where novelty may have played a role. While
these individual experiences do not reflect general trends, qualitative researchers rightfully
strongly emphasize the importance of individual experiences. Additional consideration should
be given to the population being studied when deciding upon interview mode.
Previous research has argued that specific details surrounding the context of an interview
should be a large consideration. Salmons (2011) encourages study designers to ask whether
the interview mode is “aligned with research purpose, interview style, and access/prefer-
ence of participants” and whether the interview experience “mirrors interactions being stud-
ied” [2, p. 13,21]. In some cases, the answers to these questions are clear. For example, Stanko
and Richter (2011) explored the role of identity and routine in online worlds (e.g., Second Life,
World of Warcraft), and chose a virtual world environment to conduct interviews as it was
organic to the topic [53]. In a study of a teen after-school writing program, Deegan chose Face-
book chat and email, as the pool of teens had an already established community on Facebook
[54]. Generally, researchers who want to watch their interviewees react to something visual or
interact with a user interface may choose a video mode or possibly another mode augmented
with video screen capture.
However, in many cases the alignment of research environment and mode is not so clear.
Many communities of interest do not have clear online home communities yet. Particularly in
the context of the 2020 pandemic, human subjects research has rapidly moved to online
modes. However, many participant pools may have heterogeneous digital preferences or may
not have a coherent virtual analogue for their community as they lack an obvious “contextual
naturalness” [55]. In these circumstances, mode and communication preferences may be sub-
ject to individual factors, such as personality or personal experiences, that are inaccessible to
interviewers prior to the study. Furthermore, the context of the methodological approach
underpinning the study, the aim of the research, and the target population may dictate the
choice of interview mode. The design of certain studies might not be amenable to all interview
modes equally and specific populations may be easier to recruit using certain modes due to
access, comfort, or anonymity issues. It is in these cases where we hope that this study is of
help to qualitative researchers, relieving the concern that any mode generally affects interview
data or its validity. As many interviewers long before us have noted, it’s generally advantageous
to be flexible with mode, allowing the participant to guide the decision [1, p. 44]. Our results
also provide evidence that mixing interview modes within a study is unlikely to be a source of
PLOS ONE Audio, video, chat, email, or survey: How much does online interview mode matter?
PLOS ONE | https://doi.org/10.1371/journal.pone.0263876 February 22, 2022 37 / 43
data validity issues. Taking all of these factors into account, we conclude that in the general
case, choosing a mode is better framed as a practical, personal, or contextual question
rather than a meaningful threat to the data collected.
Many participants trust that they are anonymous
As researchers who often work in the realm of online privacy, we took extra steps in the design
of the interview process to ensure that most participants had a strong guarantee of anonymity
if they chose to take it. Privacy and anonymity were valued and remarked on by many partici-
pants. However, on the whole, participants seemed to feel they were essentially anonymous
regardless of condition, whether they provided their name, or showed their face. As a result,
building extra logistical or infrastructural steps to protect privacy may not be necessary if done
in the name of participant comfort. That said, steps for protecting participant privacy may still
be advisable or even required for responsible data protection. Steps that ensure that partici-
pants’ identifying information is either not collected at all or not stored with interview record-
ings or transcripts can reduce the chance that participants might be identified in the event that
interview data is accidentally or maliciously released or subject to legal subpoena.
Ethical considerations: Extracting guts and hearts
Whatever the methodological unpinning, at their strength qualitative interviews are collabora-
tive endeavors that cultivate fertile ground for responses rather than simply extracting them.
While we investigated outcomes such as self-disclosure, honesty, and perceived anonymity, it
is likely never the case that these are outcomes to strongly optimize for. For example, respectful
interview design not only considers the participant’s perceived anonymity, but also thought-
fully models possible threats to privacy and confidentiality.
One Video participant said tongue-in-cheek in their post-interview survey: “I ripped into
my guts and pulled out the beating heart as it was. you’re welcome.” We examined an abun-
dance of outcome factors in our analysis, because simply optimizing for self-disclosure or inti-
macy can result in ripped guts rather than rich interaction.
Conclusions
Audio, video, chat, email, or survey: How much does online interview mode matter? Overall,
we found little evidence to suggest that any of these modes had substantial impacts on the
validity or data equivalence of interviews. However, we observed that mode was more likely to
impact logistical factors. In particular, substantial differences in recruitment difficulty, time,
and cost were found across mode. In addition, we note some anecdotal qualitative differences
between modes related to rapport, disclosure, and anonymity. While we observed that individ-
uals had a diversity of experiences across modes, in general we conclude that when choosing
between online interview modes researchers can safely de-emphasize data validity as a source
of concern.
Many of our observations were likely intuitive to interview researchers. We are pleased to
add a new, focused, and experimental voice that affirms much of the experiential knowledge of
these researchers.
Supporting information
S1 Protocol. Interviewer handbook. Handbook containing interviewer instructions, inter-
view script, and procedures.
(PDF)
PLOS ONE Audio, video, chat, email, or survey: How much does online interview mode matter?
PLOS ONE | https://doi.org/10.1371/journal.pone.0263876 February 22, 2022 38 / 43
S2 Protocol. Qualitative coding handbook. Handbook containing qualitative coding instruc-
tions and procedures.
(PDF)
S3 Protocol. Interviewee screening survey. Transcript of the screening survey taken by poten-
tial participants to determine their eligibility.
(PDF)
S4 Protocol. Interviewee post-interview survey. Transcript of the post-interview survey
taken by the interviewee after their interview.
(PDF)
S5 Protocol. Interviewer post-interview survey. Transcript of the post-interview survey
taken by the interviewer after each interview they conducted.
(PDF)
S1 Table. Interview scheduling rates. ANOVA and Tukey comparison results testing differ-
ences in scheduling rates across mode.
(PDF)
S2 Table. Interview completion rates. ANOVA and Tukey comparison results testing differ-
ences in completion rates across mode.
(PDF)
S3 Table. Self-reported self-disclosure. ANOVA and Tukey comparison results testing differ-
ences in interviewees’ self-reported self-disclosure across mode.
(PDF)
S4 Table. Self-reported honesty. ANOVA and Tukey comparison results testing differences
in interviewees’ self-reported honesty across mode.
(PDF)
S5 Table. Self-reported perceived anonymity. ANOVA and Tukey comparison results testing
differences in interviewees’ self-reported perceived anonymity across mode.
(PDF)
S6 Table. Interviewee word count. ANOVA and Tukey comparison results testing differences
in interviewee word across mode.
(PDF)
S7 Table. Interviewee word count excluding followup questions. ANOVA and Tukey com-
parison results testing differences in interviewee word across mode excluding responses to fol-
lowup questions.
(PDF)
S8 Table. Qualitative codes. ANOVA and Tukey comparison results testing differences in the
frequency of qualitative codes across mode.
(PDF)
S9 Table. Qualitative codes excluding followup questions. ANOVA and Tukey comparison
results testing differences in the frequency of qualitative codes across mode excluding
responses to followup questions.
(PDF)
S10 Table. Rare qualitative codes (standard deviation). ANOVA and Tukey comparison
results testing differences in the frequency of rare qualitative codes (two standard deviations
PLOS ONE Audio, video, chat, email, or survey: How much does online interview mode matter?
PLOS ONE | https://doi.org/10.1371/journal.pone.0263876 February 22, 2022 39 / 43
method) across mode.
(PDF)
S11 Table. Rare qualitative codes (standard deviation) excluding followup questions.
ANOVA and Tukey comparison results testing differences in the frequency of rare qualitative
codes (two standard deviations method) across mode excluding responses to followup ques-
tions.
(PDF)
S12 Table. Rare qualitative codes (quartiles). ANOVA and Tukey comparison results testing
differences in the frequency of rare qualitative codes (first quartile method) across mode.
(PDF)
S13 Table. Rare qualitative codes (quartiles) excluding followup questions. ANOVA and
Tukey comparison results testing differences in the frequency of rare qualitative codes (first
quartile method) across mode excluding responses to followup questions.
(PDF)
S14 Table. Rare qualitative codes (quartiles) excluding outlier. ANOVA and Tukey compar-
ison results testing differences in the frequency of rare qualitative codes (first quartile method)
across mode. One outlier was removed to test its effect.
(PDF)
S15 Table. Rare qualitative codes (quartiles) excluding outlier and followup questions.
ANOVA and Tukey comparison results testing differences in the frequency of rare qualitative
codes (first quartile method) across mode excluding responses to followup questions. One out-
lier was removed to test its effect.
(PDF)
S16 Table. Willingness to participate. Multiple t-test results comparing screening survey
results pre-pandemic and during the pandemic including the availability of remote interview
resources, accessibility of a private space, and willingness to participate in various interview
modes.
(PDF)
Acknowledgments
Many thanks to our interviewer team for their dedication and flexibility. Gratitude to all the
interviewees for their openness and generosity. Soraya Alli and Era Vuksani both crucially
helped frame the study in its early days.
Author Contributions
Conceptualization: Maggie Oates, Kyle Crichton, Lorrie Cranor.
Data curation: Maggie Oates, Kyle Crichton, Storm Budwig, Erica J. L. Weston, Brigette M.
Bernagozzi, Julie Pagaduan.
Formal analysis: Maggie Oates, Kyle Crichton, Storm Budwig, Erica J. L. Weston, Brigette M.
Bernagozzi, Julie Pagaduan.
Funding acquisition: Lorrie Cranor.
Investigation: Maggie Oates, Kyle Crichton, Storm Budwig, Erica J. L. Weston, Brigette M.
Bernagozzi, Julie Pagaduan.
PLOS ONE Audio, video, chat, email, or survey: How much does online interview mode matter?
PLOS ONE | https://doi.org/10.1371/journal.pone.0263876 February 22, 2022 40 / 43
Methodology: Maggie Oates, Kyle Crichton.
Project administration: Maggie Oates, Kyle Crichton, Lorrie Cranor.
Resources: Lorrie Cranor.
Software: Maggie Oates, Kyle Crichton.
Supervision: Maggie Oates, Kyle Crichton, Lorrie Cranor.
Validation: Maggie Oates, Kyle Crichton, Lorrie Cranor.
Visualization: Maggie Oates, Kyle Crichton.
Writing – original draft: Maggie Oates, Kyle Crichton, Lorrie Cranor.
Writing – review & editing: Maggie Oates, Kyle Crichton, Lorrie Cranor.
References1. King N, Horrocks C, Brooks J. Interviews in qualitative research. SAGE Publications Limited; 2018.
2. Salmons J. Cases in Online Interview Research. SAGE Publications; 2011. Available from: https://
market.android.com/details?id=book-kCFAQhFa2GcC.
3. Meho LI. E-mail interviewing in qualitative research: A methodological discussion. J Am Soc Inf Sci.
2006; 57(10):1284–1295. https://doi.org/10.1002/asi.20416
4. Weller S. Using internet video calls in qualitative (longitudinal) interviews: Some implications for rapport.
International Journal of Social Research Methodology. 2017; 20(6):613–625. https://doi.org/10.1080/
13645579.2016.1269505
5. Dowling S. Online asynchronous and face-to-face interviewing: Comparing methods for exploring wom-
en’s experiences of breastfeeding long term. Cases in online interview research. 2012; p. 277–296.
https://doi.org/10.4135/9781506335155.n11
6. Tourangeau R, Smith TW. Asking sensitive questions: The impact of data collection mode, question for-
mat, and question context. Public opinion quarterly. 1996; 60(2):275–304. https://doi.org/10.1086/297751
7. Jenner BM, Myers KC. Intimacy, rapport, and exceptional disclosure: a comparison of in-person and
mediated interview contexts. Int J Soc Res Methodol. 2018; p. 1–13. https://doi.org/10.1080/13645579.
2018.1512694
8. Hill RJ, Hall NE. A Note on Rapport and the Quality of Interview Data. The Southwestern Social Science
Quarterly. 1963; 44(3):247–255.
9. Holbrook A, Green M, Krosnick J. Telephone versus Face-to-Face Interviewing of National Probability
Samples with Long Questionnaires: Comparisons of Respondent Satisficing and Social Desirability
Response Bias. Public Opinion Quarterly. 2003; 67:79–125. https://doi.org/10.1086/346010
10. Weiss CH. Validity of welfare mothers’ interview responses. Public Opinion Quarterly. 1968; 32:622–
633. https://doi.org/10.1086/267650
11. Goudy WJ, Potter HR. Interview Rapport: Demise of a Concept. Public Opin Q. 1975; 39(4):529–543.
https://doi.org/10.1086/268250
12. Arizona. Educational Instruments: Arizona Clinical Interview Medical Rating Scale. Medical Teacher.
1980; 2(5):248–251. https://doi.org/10.3109/01421598009081200
13. Abbe A, Brandon SE. The role of rapport in investigative interviewing: A review. Journal of investigative
psychology and offender profiling. 2013; 10(3):237–249. https://doi.org/10.1002/jip.1386
14. Prior MT. Accomplishing “rapport” in qualitative research interviews: Empathic moments in interaction.
Applied Linguistics Review. 2018;.
15. Siegel DM, Aten M, Roghmann K. Self-reported honesty among middle and high school students
responding to a sexual behavior questionnaire. The Journal of adolescent health: official publication of
the Society for Adolescent Medicine. 1998; 23 1:20–8. https://doi.org/10.1016/S1054-139X(97)00274-7
PMID: 9648019
16. Halevy R, Shalvi S, Verschuere B. Being Honest about Dishonesty: Correlating Self-Reports and Actual
Lying. Hum Commun Res. 2014; 40(1):54–72. https://doi.org/10.1111/hcre.12019
17. Zimmerman RS, Langer LM. Improving estimates of prevalence rates of sensitive behaviors: The ran-
domized lists technique and consideration of self-reported honesty. The Journal of Sex Research.
1995; 32(2):107–117. https://doi.org/10.1080/00224499509551781
PLOS ONE Audio, video, chat, email, or survey: How much does online interview mode matter?
PLOS ONE | https://doi.org/10.1371/journal.pone.0263876 February 22, 2022 41 / 43
18. Moon Y. Intimate Exchanges: Using Computers to Elicit Self-Disclosure from Consumers. J Consum
Res. 2000; 26(4):323–339. https://doi.org/10.1086/209566
19. Xiao Z, Zhou MX, Liao QV, Mark G, Chi C, Chen W, et al. Tell Me About Yourself: Using an AI-Powered
Chatbot to Conduct Conversational Surveys with Open-ended Questions. ACM Trans Comput-Hum
Interact. 2020; 27(3):1–37. https://doi.org/10.1145/3381804
20. Pickard MD, Wilson D, Roster CA. Development and application of a self-report measure for assessing
sensitive information disclosures across multiple modes. Behav Res Methods. 2018; 50(4):1734–1748.
https://doi.org/10.3758/s13428-017-0953-z PMID: 28842851
21. Nguyen M, Bin YS, Campbell A. Comparing online and offline self-disclosure: a systematic review.
Cyberpsychol Behav Soc Netw. 2012; 15(2):103–111. https://doi.org/10.1089/cyber.2011.0277 PMID:
22032794
22. Osanami Torngren S, Ngeh J. Reversing the gaze: methodological reflections from the perspective of
racial- and ethnic-minority researchers. Qual Res. 2018; 18(1):3–18. https://doi.org/10.1177/
1468794116683991
23. Holbrook AL, Johnson TP, Krysan M. Race-and Ethnicity-of-Interviewer Effects. Experimental Methods
in Survey Research: Techniques that Combine Random Sampling with Random Assignment. 2019; p.
197–224. https://doi.org/10.1002/9781119083771.ch11
24. Benney M, Riesman D, Star SA. Age and Sex in the Interview. American Journal of Sociology. 1956; 62
(2):143–152. https://doi.org/10.1086/221954
25. Thurnell-Read T. In: Masculinity, Age and Rapport in Qualitative Research. vol. 14; 2016. p. 23–41.
26. Tourangeau R, Yan T. Sensitive questions in surveys. Psychol Bull. 2007; 133(5):859–883. https://doi.
org/10.1037/0033-2909.133.5.859 PMID: 17723033
27. Nandi A, Platt L. Are there differences in responses to social identity questions in face-to-face versus
telephone interviews? Results of an experiment on a longitudinal survey. Int J Soc Res Methodol. 2017;
20(2):151–166. https://doi.org/10.1080/13645579.2016.1165495
28. Krumpal I. Determinants of social desirability bias in sensitive surveys: a literature review. Quality &
Quantity. 2013; 47(4):2025–2047. https://doi.org/10.1007/s11135-011-9640-9
29. Suler J. The Online Disinhibition Effect. Cyberpsychology & behavior: the impact of the Internet, multi-
media and virtual reality on behavior and society. 2004; 7:321–6. https://doi.org/10.1089/
1094931041291295 PMID: 15257832
30. Joinson AN. Self-disclosure in computer-mediated communication: The role of self-awareness and
visual anonymity. Eur J Soc Psychol. 2001; 31(2):177–192. https://doi.org/10.1002/ejsp.36
31. Hollenbaugh EE, Everett MK. The Effects of Anonymity on Self-Disclosure in Blogs: An Application of
the Online Disinhibition Effect. Journal of Computer-Mediated Communication. 2013; 18(3):283–302.
https://doi.org/10.1111/jcc4.12008
32. Hite DM, Voelker T, Robertson A. Measuring Perceived Anonymity: The Development of a Context
Independent Instrument. Journal of Methods and Measurement in the Social Sciences. 2014; 5(1):22–
39. https://doi.org/10.2458/jmm.v5i1.18305
33. Dennis AR, Fuller RM, Valacich JS. Media, Tasks, and Communication Processes: A Theory of Media
Synchronicity. Miss Q. 2008; 32(3):575–600. https://doi.org/10.2307/25148857
34. Tomprou M, Kim YJ, Chikersal P, Woolley AW, Dabbish LA. Speaking out of turn: How video conferenc-
ing reduces vocal synchrony and collective intelligence. PLOS ONE. 2021; 16(3):1–14. https://doi.org/
10.1371/journal.pone.0247655
35. Bordia P. Face-to-face versus computer-mediated communication: A synthesis of the experimental lit-
erature. The Journal of Business Communication (1973). 1997; 34(1):99–118. https://doi.org/10.1177/
002194369703400106
36. Stieger S, Goritz AS. Using instant messaging for Internet-based interviews. CyberPsychology &
Behavior. 2006; 9(5):552–559. https://doi.org/10.1089/cpb.2006.9.552 PMID: 17034322
37. Simmons JP, Nelson LD, Simonsohn U. False-positive psychology: undisclosed flexibility in data collec-
tion and analysis allows presenting anything as significant. Psychol Sci. 2011; 22(11):1359–1366.
https://doi.org/10.1177/0956797611417632 PMID: 22006061
38. Hart CM, Ritchie TD, Hepper EG, Gebauer JE. The Balanced Inventory of Desirable Responding Short
Form (BIDR-16). SAGE Open. 2015; 5(4):2158244015621113. https://doi.org/10.1177/
2158244015621113
39. Cozby P. Self-disclosure: a literature review. Psychological bulletin. 1973; 79 2:73–91. https://doi.org/
10.1037/h0033950 PMID: 4567729
40. Altman I, Taylor DA. In: Social penetration: the development of interpersonal relationships. Holt, Rine-
hart and Winston; 1973.
PLOS ONE Audio, video, chat, email, or survey: How much does online interview mode matter?
PLOS ONE | https://doi.org/10.1371/journal.pone.0263876 February 22, 2022 42 / 43
41. Roulston K. Analysing Interviews. The SAGE handbook of qualitative data analysis. 2014; p. 297–312.
42. Lazar J, Feng J, Hochheiser H. In: Analyzing qualitative data; 2017. p. 299–327.
43. Erlingsson C, Brysiewicz P. A hands-on guide to doing content analysis. Afr J Emerg Med. 2017; 7
(3):93–99. https://doi.org/10.1016/j.afjem.2017.08.001 PMID: 30456117
44. Abdi H, Williams LJ. Tukey’s honestly significant difference (HSD) test. Encyclopedia of research
design. 2010; 3:583–585.
45. Wertz FJ. Five Ways of Doing Qualitative Analysis: Phenomenological Psychology, Grounded Theory,
Discourse Analysis, Narrative Research, and Intuitive Inquiry. Guilford Press; 2011.
46. Madill A, Jordan A, Shirley C. Objectivity and reliability in qualitative analysis: realist, contextualist and
radical constructionist epistemologies. Br J Psychol. 2000; 91 (Pt 1):1–20. https://doi.org/10.1348/
000712600161646 PMID: 10717768
47. Caine K. Local Standards for Sample Size at CHI. In: Proceedings of the 2016 CHI Conference on
Human Factors in Computing Systems. CHI’16. New York, NY, USA: Association for Computing
Machinery; 2016. p. 981–992. Available from: https://doi.org/10.1145/2858036.2858498.
48. Vasileiou K, Barnett J, Thorpe S, Young T. Characterising and justifying sample size sufficiency in inter-
view-based studies: systematic analysis of qualitative health research over a 15-year period. BMC Med
Res Methodol. 2018; 18(1):148. https://doi.org/10.1186/s12874-018-0594-7 PMID: 30463515
49. Humes KR, Jones NA, Ramirez RR. Overview of race and Hispanic origin: 2010. US Census Bureau;
2011. C2010BR-02. Available from: https://www.census.gov/prod/cen2010/briefs/c2010br-02.pdf.
50. Wiederhold BK. Connecting Through Technology During the Coronavirus Disease 2019 Pandemic:
Avoiding “Zoom Fatigue”. Cyberpsychol Behav Soc Netw. 2020; 23(7):437–438. https://doi.org/10.
1089/cyber.2020.29188.bkw PMID: 32551981
51. Rubin Z. Disclosing oneself to a stranger: Reciprocity and its limits. J Exp Soc Psychol. 1975; 11
(3):233–260. https://doi.org/10.1016/S0022-1031(75)80025-4
52. Sawilowsky SS. New Effect Size Rules of Thumb. Journal of Modern Applied Statistical Methods. 2009;
8:26. https://doi.org/10.22237/jmasm/1257035100
53. Stanko T, Richter J. Learning to work in world: Conducting qualitative research in virtual worlds using in-
depth interviews. In Salmons J. (Ed). Cases in online interview research. Sage Publications.; 2011.
54. Deegan A. Stranger in a strange land: The challenges and benefits of online interviews in the social net-
working space. Cases in online interview research. 2012; p. 69–90. https://doi.org/10.4135/
9781506335155.n3
55. Mann C, Stewart F. Internet interviewing. Handbook of interview research: Context and method. 2002;
29:603–627.
PLOS ONE Audio, video, chat, email, or survey: How much does online interview mode matter?
PLOS ONE | https://doi.org/10.1371/journal.pone.0263876 February 22, 2022 43 / 43