how does sense emerge in the visual system? the cognitive
TRANSCRIPT
HAL Id: tel-00736494https://tel.archives-ouvertes.fr/tel-00736494
Submitted on 28 Sep 2012
HAL is a multi-disciplinary open accessarchive for the deposit and dissemination of sci-entific research documents, whether they are pub-lished or not. The documents may come fromteaching and research institutions in France orabroad, or from public or private research centers.
L’archive ouverte pluridisciplinaire HAL, estdestinée au dépôt et à la diffusion de documentsscientifiques de niveau recherche, publiés ou non,émanant des établissements d’enseignement et derecherche français ou étrangers, des laboratoirespublics ou privés.
How does sense emerge in the visual system? Thecognitive visual system explored from categories to
consciousnessRoger Koenig
To cite this version:Roger Koenig. How does sense emerge in the visual system? The cognitive visual system explored fromcategories to consciousness. Neurons and Cognition [q-bio.NC]. Université Paul Sabatier - ToulouseIII, 2012. English. �tel-00736494�
tre :
École doctorale et discipline ou spécialité :
Université Toulouse 3 Paul Sabatier (UT3 Paul Sabatier)
ED CLESCO : Neurosciences, comportement et cognition
A. Roger Koenig
mercredi 19 septembre 2012
How does sense emerge in the visual system? The cognitive visual system
explored from categories to consciousness— Comment le sens est-il extrait de
l’information visuelle ? Le système visuel exploré des catégories à la conscience.
Centre de Recherche Cerveau et Cognition (CerCo), UMR5549
Dr. Rufin VanRullen
Dr. Thomas Carlson - Maryland Vision Science Lab - Maryland, USA
Dr. Jean Lorenceau - Cogimage, ICM - Paris, France
Dr. Bruno Rossion - IPSY, IoNS - Louvain-La-Neuve, Belgique
Dr. Lionel Naccache - CRICM, UPMC - Paris, France
Dr. Pier-Giorgio Zanone - PRISSMH - Toulouse, France


2
“In God we trust, all others bring data”.
William Edwards Deming

3
i
Publications
Revues internationales à comité de lecture
Koenig-Robert, R. & VanRullen, R. (2011). “Spatiotemporal mapping of visual
attention”. Journal of Vision. 11(14), 12.
Girard, P. & Koenig-Robert, R. (2011). “Ultra-rapid categorization of Fourier-spectrum
equalized natural images: Macaques and Humans perform similarly”. PLoS One. 6,
e16453.
Vidal, R., Ramírez, OA., Sandoval, L., Koenig-Robert, R., Härtel, S. and Couve, A.
(2007). “Marlin-1 and conventional kinesin link GABAB receptors to the cytoskeleton
and regulate receptor transport”. Molecular and Cellular Neurosciences. 35, 501-
512.
Posters et Présentations à des conférences internationales
Koenig-Robert, R. & VanRullen, R. (2012). “Semantic Wavelet-Induced Frequency
Tagging (SWIFT) tracks perceptual awareness alternations in an all-or-none fashion”.
Talk at the 12th Vision Sciences Society annual meeting, Naples (Florida, USA).
Koenig-Robert, R. & VanRullen, R. (2011). “SWIFT: A new method to track object
representations”. Poster at the 34th European Conference on Visual Perception,
Toulouse (France).
Koenig-Robert, R. & VanRullen, R. (2011). “Frequency-tagging object awareness”,
Poster at the 11th Vision Sciences Society annual meeting, Naples (Florida, USA).
Koenig-Robert, R. & VanRullen, R. (2010). “Spatiotemporal mapping of exogenous
and endogenous attention”, Poster at the 10th Vision Sciences Society annual
meeting, Naples (Florida, USA).
Girard, P. & Koenig-Robert, R. (2009). “Macaques and humans share the same mid-
level cues for ultra-rapid categorization”, Poster at the 31st Conférence
internationale d'éthologie, Rennes (France).
ii
Abstract
How does sense emerge in the visual system? The cognitive visual system
explored from categories to consciousness.
How does sense emerges in the visual system? In this thesis we will be focused on the visual system of human and non-human primates and their large capacity of extract and represent visual information. We studied several levels of visual representations from those related to the extraction of coarse visual features to the emergence of conscious visual representations. This manuscript presents six works in which we explored: (1) the visual features necessary to perform ultra-rapid visual categorization in monkeys and humans using psychophysics, (2) the spatio-temporal dynamics of visual attention in humans using psychophysics, (3) the neural correlates of high-level visual representations using EEG tanks to the development of an innovative technique called SWIFT, (4) the neural correlates of visual consciousness under binocular rivalry using EEG, (5) the synchrony of brain signals as a function of conscious recognition using intracranial electrodes implanted in epileptic patients and (6) the neural correlates associated with conscious perception in monkeys using intracranial electrodes. The results of these works allowed outlining a tentative model of visual perception aimed to dissociate attention and consciousness.
Keywords: visual perception, consciousness, attention, oscillations, EEG, ECoG, SSVEP, SWIFT.
Comment le sens est-il extrait de l’information visuelle ? Le système visuel
exploré des catégories à la conscience.
Comment le sens est-il extrait de l’information visuelle ? Cette thèse est focalisée sur la capacité du système visuel d’humains et de singes à extraire et représenter l’information visuelle sur différents niveaux de complexité. Nous avons étudié différent niveaux de représentations visuelles, de la production de représentations visuelles primaires jusqu’à l’élaboration de représentations visuelles conscientes. Ce manuscrit présente six travaux dans lesquels nous avons exploré : (1) les attributs visuels nécessaires pour réaliser la tâche de catégorisation ultra rapide chez l’homme et le singe au moyen de méthodes psychophysiques, (2) la dynamique spatio-temporelle de l’attention visuelle chez l’homme au moyen de méthodes psychophysiques, (3) les corrélats neuronaux des représentations de haut niveau en EEG grâce au développement d’une nouvelle technique appelée SWIFT, (4) les corrélats neuronaux de la conscience visuelle dans la rivalité binoculaire en EEG, (5) la synchronie des signaux cérébraux en fonction de la reconnaissance consciente au moyen d’enregistrements intracrâniens chez des patients épileptiques et (6) les corrélats neuronaux associés à la prise de conscience chez le singe au moyen d’enregistrements intracrâniens. Les résultats de ces travaux nous ont permis d’ébaucher un modèle de la perception visuelle cherchant à dissocier l’attention et la conscience.
Mots-clés : perception visuelle, conscience, attention, oscillations, EEG, ECoG, SSVEP, SWIFT.
Résumé substantiel
iii
Résumé substantiel
Comment le sens est-il extrait de l’information visuelle ?
À chaque fois que nous ouvrons les yeux un phénomène remarquable a lieu : nous sommes
capables de percevoir et de reconnaitre les éléments qui nous entourent de façon presque
instantanée sans que cela ne nous demande aucun effort. La chose la plus surprenante est
que nous pouvons associer une expérience subjective à ce processus : nous pouvons être
conscients de ce que nous voyons.
Dans ce contexte, nous pouvons nous poser une série de questions, comme par exemple :
Quels sont les phénomènes cérébraux qui sont à l’origine de l’extraction de l’information
visuelle ? Quels processus permettent de rendre cette information consciente ? Et quelles
sont les activités dans notre cerveau qui sont corrélées à la reconnaissance consciente de
l’information visuelle ?
Différent travaux, réalisés surtout chez des modèles animaux, ont montré que dans un
premier temps le traitement visuel est dédié à extraire l’information physique du stimulus et
ce n’est que postérieurement que le sens de l’image est représenté de façon plus explicite
pour finalement accéder à la conscience.
Ainsi, les signaux visuels voyagent dès la rétine où ils sont d’abord codés sous la forme
d’impulsions électrochimiques grâce à un processus connu sous le nom de photo-
transduction. Cette information est cheminée d’abord vers des structures sous-corticales
comme le thalamus visuel, pour après activer des aires visuelles dites de bas-niveau. À ce
niveau, un premier traitement de l’information visuelle est fait. Il permet notamment
d’extraire des caractéristiques physiques de l’image comme son contraste local et son
contenu en fréquences spatiales.
Dans ces stades précoces de traitement, selon le postulat classique du domaine des
neurosciences visuelles, les représentations formées ne seraient pas associées à des
catégories sémantiques et ce n’est qu’au terme d’une série de processus neuronaux
Résumé substantiel
iv
ultérieurs en charge de traiter cette information, que les représentations catégorielles
émergeront.
Ainsi, des aires visuelles situées au-delà des aires visuelles de bas-niveau seraient à l’origine
des représentations sémantiques. Dans ces aires, les neurones sont, en effet, sensibles à des
caractéristiques visuelles comme la forme ou la couleur entre autres, qui permettraient
d’associer les caractéristiques du stimulus à des classifications catégorielles. Dans certaines
aires, les neurones sont même davantage sensibles à des attributs assez complexes comme
des visages connus et des parties du corps. A ce niveau, l’activité des neurones est
suffisamment sélective pour représenter les catégories sémantiques des stimuli qui sont
présentés, permettant par exemple de classer une image comme contenant un animal ou un
véhicule. Néanmoins, la dynamique temporelle des représentations permettant de classer
des images complexes est, jusqu’à peu, restée méconnue. A quel moment précis les
représentations neuronales permettant la catégorisation d’images naturelles sont-elles
disponibles? Cette question a été intensivement traitée dans notre laboratoire depuis une
série d’études menées afin de mesurer de façon précise le temps requis pour catégoriser
une image complexe.
Force est de constater que le temps nécessaire pour catégoriser des images naturelles est
particulièrement court : le temps de réaction se situe autour de 200ms pour des réponses
manuelles et autour de 100ms pour des réponses oculaires ou saccades. Ces délais
contraignent fortement le traitement de l’information au long de la voie visuelle. En prenant
en compte les latences neuronales au long de différentes aires visuelles, les temps de
réaction manuels (autours de 200ms) suggèrent que l’information visuelle n’a le temps de
générer qu’un potentiel d’action par étape de traitement, dès son entrée rétinienne jusqu’à
la réponse manuelle. C'est-à-dire que l’information serait traitée de façon purement feed-
forward lors de cette tâche par la chaîne complète d’aires visuelles corticales depuis les aires
visuelles de bas-niveau vers celles de haut niveau, pour ensuite activer le cortex préfrontal et
les aires motrices. Par rapport aux tâches de saccades, les temps de réaction autour de
100ms sont encore plus contraignants, suggérant que l’information n’aurait même pas le
temps d’être traitée par toutes les aires mentionnées auparavant. Ainsi, lors de la réalisation
de la tâche de catégorisation visuelle rapide utilisant des réponses saccadiques, les aires
oculomotrices (comme le FEF ou le colliculus supérieur) ne pourraient utiliser que
Résumé substantiel
v
l’information provenant de l’analyse visuelle faite dans des aires de bas ou moyen niveau
hiérarchique pour déclencher la réponse motrice. Ainsi, l’activité des aires en position basse
et moyenne dans la hiérarchie encoderait explicitement des caractéristiques du stimulus,
dites diagnostiques, permettant son classement dans des catégories sémantiques (par
exemple animal, véhicule, visage, etc.).
La nature exacte des caractéristiques de l’image utilisées par le système visuel pour
accomplir cette tâche reste débattue. Certaines études ont montré que des indices de très
bas niveau codés dans des aires visuelles primaires, comme le contenu en fréquences
spatiales de l’image (qui peuvent être dissociées des formes présentées, porteuses du
contenu sémantique) peuvent influencer la catégorisation visuelle rapide. Alors, quels sont
les attributs de l’image qui permettent cette catégorisation ? Cette question est abordée par
la première étude de cette thèse dans laquelle nous avons réalisé une étude comparative
chez le singe et l’homme tout en contrôlant les indices de bas niveau dans nos images. Nos
résultats montrent que tant les êtres humains que les macaques peuvent réaliser la tâche de
catégorisation ultra-rapide, lorsque les indices de bas niveau des images de différentes
catégories sont contrôlés (spécifiquement le contenu en fréquences spatiales et le
contraste). Nos résultats suggèrent aussi que les attributs de l’image utilisés pour la
catégorisation chez l’homme et chez le macaque sont similaires et que ces attributs peuvent
être contenus dans les basses fréquences de l’image (égal ou inférieur à 6 cycles/image),
appuyant ainsi l’idée que les attributs nécessaires pour la catégorisation ultra-rapide
pourraient reposer sur des représentations incomplètes de l’image.
Bien qu’il soit évident que la tâche de catégorisation visuelle rapide permette d’extraire de
l’information catégorielle à partir d’une image complexe—ce qui correspond à un processus
relativement complexe du point de vue cognitif—, elle semble ne pas avoir besoin de
conscience pour être accomplie. En fait, il existe des études chez des patients agnosiques
(des patients qui, à la suite de lésions cérébrales, ont des troubles pour reconnaitre
explicitement des objets) montrant qu’ils peuvent réaliser la tâche de catégorisation rapide
sans reconnaitre explicitement (c.-à-d. consciemment) les images. Des autres études qui ont
utilisé des paradigmes de double tâche, afin de capturer l’attention sur un endroit de l’écran
de présentation, ont notamment permis de montrer que la catégorisation visuelle rapide
Résumé substantiel
vi
peut être faite en absence (ou quasi absence) d’attention pour la catégorisation d’images
naturelles.
Des nombreuses études ont montré qu’en l’absence d’attention, notre perception
consciente est fortement dégradée. Ces études suggèrent alors que l’attention est la porte
vers la conscience, ce qui veut dire que l’attention serait un préalable pour l’accès conscient
à l’information visuelle. Ainsi, le rôle de l’attention visuelle est de sélectionner juste une
partie de l’information qui est disponible pour la traiter au détriment de l’information qui
n’est pas sélectionnée. Cette sélection peut être faite à plusieurs niveaux ; ainsi l’attention
peut sélectionner, par exemple, une caractéristique des objets présentés (c’est ce qui est
connu sous les termes d’attention basée sur les caractéristiques), comme leur couleur, et de
cette façon focaliser le traitement sur les objets contenant la couleur choisie, ou elle peut
sélectionner la forme d’un objet (attention basée sur l’objet), ou encore une partie du
champ visuel (attention spatiale). Grâce à de nombreuses études, les propriétés de
déploiement spatial de l’attention sont bien connues. Ceci a permis l’émergence du concept
du focus de l’attention et de différents modèles qui ont tenté de corréler les propriétés
spatiales du focus de l’attention avec le comportement lors de différentes tâches.
Indépendamment, d’autres travaux de recherche se sont davantage concentrés sur le profil
temporel d’activation de l’attention visuelle. Celle-ci est activée plus précocement par des
stimuli saillants flashés brièvement (processus que l’on désigne sous les termes d’activation
exogène de l’attention), que lorsqu’elle est dirigée vers un endroit du champ visuel par suite
d’une action volontaire (activation endogène de l’attention). Néanmoins, les propriétés
spatiales et temporelles de l’attention n’ont été que rarement étudiées conjointement.
Ainsi, à ce jour, nous ne possédons aucune vision globale permettant de comprendre
comment les composantes spatiales et temporelles de l’attention visuelle interagissent. Le
motif spatial de l’attention change-t-il au cours du temps ? C’est dans la deuxième partie de
cette thèse que nous étudierons cette problématique grâce à un dispositif expérimental
innovateur qui nous a permis d’obtenir la première cartographie détaillée de l’attention
visuelle dans l’espace et le temps.
Après avoir étudié l’attention qui semble être la clef des représentations conscientes, nous
allons revenir à notre question initiale, à savoir, les représentations des objets visuels, afin
d’étudier cette fois les représentations visuelles de haut niveau. Comme on l’a vu
Résumé substantiel
vii
précédemment, les représentations visuelles gagnent en complexité au cours du traitement
visuel. Alors que les aires visuelles de bas-niveau encodent des attributs physiques de
l’image, des aires de plus haut niveau contiennent des représentations plus complexes des
objets visuels, notamment des représentations porteuses d’attributs sémantiques. Différents
modèles proposent que ce ne soit qu’au terme de ce processus que ces représentations
permettent la reconnaissance explicite des objets visuels. Comment peut-on dissocier les
représentations des bas-niveau et celles qui sont à la base de la reconnaissance consciente
des objets ? Dans une troisième série de travaux présentés dans cette thèse, nous avons
développé un nouveau paradigme de stimulation appelé SWIFT (semantic wavelet-induced
frequency-tagging) qui est basé sur des techniques de traitement du signal (transformée en
ondelettes) et du SSVEP (steady state visual evoked potentials) afin de manipuler le contenu
sémantique présenté aux sujets de façon périodique tout en égalisant les propriétés de bas-
niveau de l’image. Le but de cette technique était d’activer périodiquement à une fréquence
déterminée les aires cérébrales chargées de coder l’information sémantique pendant que les
aires codant pour des attributs de bas-niveau sont stimulées avec un flux constant
d’attributs de bas-niveau. Cette approche cherche ainsi à dissocier les activités de ces aires
grâce à leurs profils d’activation au cours du temps, en identifiant notamment les aires
codant l’information sémantique comme celles qui répondent périodiquement à la
fréquence de modulation.
Ce protocole de stimulation a permis d’isoler l’activité cérébrale (enregistrée grâce à l’EEG)
évoquée spécifiquement par la reconnaissance consciente des images naturelles. Des aires
centro-pariétales n’ont pas montré de réponse en potentiels évoqués lorsque des
séquences de stimulation SWIFT sans contenu sémantique ont été présentées, de même que
lorsque ces séquences n’avaient pas encore été reconnues (dont le contenu sémantique
n’est pas encore accessible). Une fois que le contenu sémantique a été révélé, les mêmes
séquences qui n’avaient pas été reconnues précédemment, ont évoqué des réponses
significatives ainsi que celles qui ont été reconnues spontanément. Ces résultats montrent
que l’activité évoquée par SWIFT est sélective de la reconnaissance consciente des images.
Nous avons aussi testé l’effet de l’attention spatiale sur les signaux enregistrés utilisant
SWIFT. Nos résultats montrent que les signaux évoqués utilisant SWIFT présentent des
modulations attentionnelles plusieurs ordres de grandeur supérieures à celles enregistrées
Résumé substantiel
viii
en utilisant des techniques traditionnelles, suggérant que ces signaux correspondent à des
représentations de haut niveau, car il est connu que les effets attentionnels sont amplifiés
au cours de la hiérarchie visuelle. Finalement, nous avons testé la dynamique temporelle des
représentations évoquées par SWIFT. Nos résultats suggèrent que le système visuel ne peut
produire qu’un maximum de 4 à 7 représentations conscientes par seconde.
Lors des expériences permettant de mettre en évidence la sélectivité des signaux évoqués
par SWIFT par rapport à la reconnaissance consciente, le stimulus visuel était toujours visible
par le sujet et seul son contenu sémantique (c.-à-d., la reconnaissance explicite des objets
contenus dans la séquence) a été manipulé, pouvant être consciemment accessible ou pas.
Ainsi, nous pouvons différencier deux processus grâce à ce protocole: la reconnaissance
consciente du stimulus (que nous avons manipulée) et la visibilité consciente du stimulus
(que nous n’avons pas manipulée lors de notre expérience). En conséquence nous nous
posons la question suivante : Quel type de modulations du signal SWIFT obtiendrions-nous
en manipulant l’accessibilité consciente aux stimuli d’une façon plus claire? C’est dans une
quatrième expérience que nous avons étudié les modulations du signal SWIFT en utilisant la
rivalité binoculaire. Pendant la rivalité binoculaire, des images différentes sont présentées à
chaque œil et au lieu d’être fusionnées dans un même percept, elles entrent en compétition
pour l’accès à la perception consciente qui alterne alors entre une image et l’autre. Ceci
permet de présenter des stimuli qui ne sont pas consciemment perçus mais qui font tout de
même l’objet d’un traitement visuel. Les résultats de travaux utilisant des techniques
traditionnelles, ont montré que les modulations du signal sont modestes lorsque le stimulus
passe de l’état consciemment perçu à l’état non-perçu. Ceci est dû au fait que les techniques
traditionnelles enregistrent de façon confondue les activations résultant du traitement de
bas-niveau de l’image (qui est largement non-conscient) et celles provenant des
représentations de haut niveau qui sont plus proches de l’accès conscient. En utilisant
SWIFT, nous avons montré des modulations en tout-ou-rien : l’activité est évoquée par
SWIFT lorsque le stimulus est perçu consciemment, par contre aucune activité n’est évoquée
lorsqu’il n’est pas perçu. Ceci indique que les activités évoquées par SWIFT correspondent à
des représentations conscientes. Nos résultats suggèrent également que l’activité
représentant l’accès conscient serait associée à une augmentation de la cohérence de la
Résumé substantiel
ix
dynamique temporelle de ces signaux au cours du temps et non à une augmentation de
l’amplitude du signal.
Les résultats obtenus avec la technique SWIFT montrent qu’il est possible d’isoler les
corrélats neuronaux des représentations de haut niveau, avec une spécificité remarquable
pour les activités conscientes. Dans les deux derniers travaux présentés dans ce manuscrit,
nous allons explorer une question fondamentale pour l’étude des représentations
conscientes : Où et à quel moment les représentations conscientes émergent-elles dans le
cerveau ? Afin de répondre à cette question nous avons utilisé des techniques permettant
d’obtenir des enregistrements de l’activité neuronale avec une haute résolution spatiale et
temporelle. Ces techniques correspondent à des enregistrements électriques intracrâniens
qui ont été possibles grâce à des collaborations avec les équipes du Dr Denis Fize et Dr
Emmanuel Barbeau. Ces collaborations sont toujours en cours ainsi que l’acquisition de
données. Néanmoins des résultats préliminaires sont déjà disponibles et sont présentés dans
cette thèse dans la forme de deux rapports indépendants.
Ainsi, le cinquième travail présenté dans ce manuscrit est consacré à l’étude des signaux
obtenus grâce à la technique SWIFT enregistrés sur des électrodes intracrâniennes chez des
patients épileptiques. Ces patients sont implantés avec des électrodes profondes pour des
raisons médicales, afin de connaitre la localisation des foyers épileptiques lors d’épilepsies
résistantes à de traitements pharmacologiques. Lors de cette expérience nous avons
reproduit la tâche de reconnaissance consciente d’objet. Nos résultats montrent des
comportements différents entre la synchronie, dite externe, de différentes aires cérébrales
(la synchronie des signaux avec la stimulation SWIFT au cours des présentations) et la
synchronie dite interne (la synchronie au sein de chaque aire cérébrale au cours des
présentations) en fonction de la reconnaissance consciente des images. Ces résultats
suggèrent des corrélats électrophysiologiques qui permettraient de dissocier les
phénomènes attentionnels de la conscience.
Le sixième et dernier travail traite d’une étude chez un singe macaque implanté avec des
électrodes intracrâniennes, cherchant à mettre en évidence des activités liées à la prise de
conscience ainsi que l’exploration de la dynamique spatiale et temporelle de ces activités.
L’animal, étant entrainé à faire une tâche de catégorisation animal/non-animal, a été l’objet
Résumé substantiel
x
d’une étude lors d’une version modifiée du paradigme de reconnaissance consciente utilisé
auparavant. Une analyse en potentiel évoqué a révélé l’existence de deux composantes
principales dans nos enregistrements. Une première composante fut évidente à des délais
précoces (avec une amplitude maximale vers les 100 ms) après l’apparition de l’information
sémantique. Cette composante était présente pour tous les types de stimuli (cibles,
distracteurs et fausses alarmes) et son amplitude semble être corrélée avec la réponse
motrice de l’animal (go ou no-go). Une deuxième composante plus tardive (présente après
200 ms) était présente seulement pour les cibles classifiées en tant que telles, ce que l’on
pourrait associer à la reconnaissance consciente chez l’animal. Il mérite d’être souligné que
les activités enregistrées sont compatibles avec le modèle de l’espace de travail neuronal
global d’accès à la conscience. Ces résultats mettent en évidence des corrélats
électrophysiologiques associés à la reconnaissance consciente chez le singe qui sont
comparables à ceux observés chez l’homme.
Dans la dernière partie de la thèse un modèle de perception visuelle est proposé. Ce modèle
est compatible avec les résultats obtenus lors des différents travaux présentés ainsi qu’avec
des éléments d’autres modèles. Il s’appuie sur une architecture hiérarchique du système
visuelle dissociant notamment des processus conscients et non-conscients. Une dissociation
à la fois hiérarchique et fonctionnelle est proposée pour l’attention et pour la perception
consciente, et des hypothèses sont exposées concernant les bases électrophysiologiques
pour identifier chacun de ces processus.
xi
Publications ................................................................................................................................. i
Abstract ...................................................................................................................................... ii
Résumé substantiel ................................................................................................................... iii
A. Introduction ........................................................................................................................ 1
I. Overview: sensing the world ....................................................................................................... 1
II. The visual system as a hierarchical network ............................................................................... 3
a) The retina ................................................................................................................................ 3
b) The lateral geniculate nucleus ................................................................................................. 6
c) The primary visual cortex ........................................................................................................ 8
d) Visual area V2 ........................................................................................................................ 12
e) Ventral and dorsal visual pathways ....................................................................................... 14
f) The ventral visual pathway and object recognition .............................................................. 16
g) Visual hierarchy in perspective ............................................................................................. 20
h) Feedforward model of object categorization ........................................................................ 24
III. Visual attention ..................................................................................................................... 31
a) Selective processing of sensory information ......................................................................... 31
b) Attending to different dimensions of the visual world ......................................................... 33
c) Models of spatial attention deployment ............................................................................... 34
d) Two ways to activate attention: endogenous and exogenous.............................................. 35
e) Attention at the neuronal level ............................................................................................. 36
f) Attention as a network .......................................................................................................... 37
IV. Consciousness ....................................................................................................................... 39
a) What is consciousness for? ................................................................................................... 39
b) The hard and the easy problem of consciousness ................................................................ 41
c) Is attention necessary for conscious perception? ................................................................. 42
d) Is attention sufficient for conscious perception? .................................................................. 43
e) The neural correlates of visual consciousness ...................................................................... 44
f) Current theories of consciousness ........................................................................................ 45
1. The neurobiological theory of consciousness of Crick and Koch ...................................... 46
2. The dynamic core and the information integration theory .............................................. 46
3. Recurrent processing theory ............................................................................................. 47
4. Micro-consciousness theory .............................................................................................. 48
5. The Global Workspace theory of consciousness ............................................................... 48
xii
5.1 The global neuronal workspace and its neurocomputational implementation ........ 49
5.2 Spatio-temporal dynamics of the global neuronal workspace ................................. 51
V. Thesis aims ................................................................................................................................ 55
B. Looking for the necessary features to categorize a natural image in a glimpse .............. 58
I. The paper of Honey et al. 2008 ................................................................................................. 59
II. PAPER 1. Girard and Koenig-Robert, PLoS One, 2011. .............................................................. 63
III. Discussion .............................................................................................................................. 77
IV. Attempting a cooling study in high-level visual areas ........................................................... 78
C. Where and when spatial is attention deployed? .............................................................. 81
I. The paper of Tse, 2004 .............................................................................................................. 81
II. Paper 2. Koenig-Robert & VanRullen, Journal of Vision ............................................................ 84
D. Searching for the neural correlates of object recognition ............................................. 102
I. Dissociating visual information extraction from visual recognition. The paper of Carlson et al.
2006 ................................................................................................................................................. 103
II. Manipulating the object information in the Fourier domain. The paper of Sadr and Sinha
2004. ................................................................................................................................................ 110
III. Tracking visual stimuli in brain signals: the frequency-tagging technique.......................... 113
IV. Summing-up ........................................................................................................................ 115
V. PAPER 3: Koenig-Robert & VanRullen, submitted to Journal of Neuroscience. ...................... 116
E. Isolating the neural correlates of conscious vision ......................................................... 144
I. The paper of Tononi et al, 1998. ............................................................................................. 146
II. PAPER 4 (in preparation). Koenig-Robert & VanRullen. .......................................................... 148
F. Intracranial recordings using SWIFT: ongoing collaborative work ................................. 169
I. REPORT 1. Koenig-Robert, Barbeau, Valton & VanRullen. ...................................................... 170
II. REPORT 2. Koenig-Robert, Collet, Fize & VanRullen. .............................................................. 189
G. General discussion .......................................................................................................... 202
I. Recapitulation ......................................................................................................................... 202
II. On the relationship between ultra-rapid categorization and conscious object recognition .. 206
III. On the relationship between attention and conscious object recognition ........................ 208
IV. Comparing the study in binocular rivalry with the studies on conscious object recognition
209
V. Late ERP components, phase-resetting and consciousness .................................................... 211
VI. Conscious object recognition in humans and monkeys ...................................................... 212

xiii
VII. Spatial localization and time course of consciousness dependent activity ........................ 212
VIII. How does sense emerge in the visual system? ................................................................... 213
IX. Future directions ................................................................................................................. 218
H. References ...................................................................................................................... 219

Introduction
1
A. Introduction
I. Overview: sensing the world
Interpreting the world by extracting relevant information is critical for every living being in
order to set an appropriate response to the environmental constrains. The extraction of
information, in its most rudimentary sense, is made at all levels of the phylogenetic scale.
Think for instance of a bacterium using a quite complex molecular machinery in order to
recognize the host cell by acquiring information from its cell membrane proteins, or a tree
modulating the turgor pressure of its leaves in response to the direction of the light in order
to orient them toward the sun or a bat hearing the reverberations of its own voice coming
from the walls in order to navigate into a cave using eco-location.
Different signals from the environment are thus more or less integrated by the sensing
machinery of different living beings across the phylogenetic tree, allowing the emergence of
only very peripheral representations of the environmental state in less-evolved creatures to
more central and integrated representations in higher-order organisms.
Over millions of years, evolution has fashioned the organisms to be more efficient to extract
information from their environment. The emergence of the first nervous systems in animals:
the Coelenterates, between 600 and 540 million of years ago and subsequently the
emergence of the first central nervous systems with the Bilateria animals marked a
revolution in the integration of environmental information (Galliot & Quiquand, 2011). The
possibilities for information integration and management increased rapidly as the neural
systems grew bigger. Evolving neural systems allowed creatures to adapt better to their
environment avoiding risks and finding new nutriment resources. The improvements in the
way that living beings sensed the world were selected by their fitness value and thus
perpetuated in future generations. The emergence of brains in evolution allowed setting
internal plans in order to guide and predict the changes in a dynamic environment. Thus,
central nervous systems and brains are thought to have primarily evolved because of the
Introduction
2
need to integrate sensory information and predict motor behavior (see for instance
Maturana & Varela, 1992; Llinás, 2002). The evolution of ever more sophisticated sensory
organs diversified the possibilities of sensing the environment and interacting with it. One of
the most sophisticated sensory organs designed by evolution is the eye. The importance of
vision is attested by the fact that eyes evolved many times in an independent fashion in
different species (Fishman, 2008; Lamb, Arendt, & Collin, 2009).
In primates, the sense of vision is by far the most developed. As a consequence, much of the
primate cortex is devoted to visual processing. In the macaque monkey at least 50% of the
neocortex is associated with vision, involving over thirty distinct areas (Desimone &
Ungerleider, 1989; Van Essen & Gallant, 1994). Visual inputs allow primates to produce a
virtually infinite repertoire of more or less complex behavioral responses, which in turn are
pinpointed by neural representations with different levels of complexity.
Some behavioral responses guided by visual information such as oculomotor responses
appeared early in evolution and rely on very rudimentary visual information which is
represented by small neural circuits which generate reflexive responses (Martínez-García,
Puelles, Donkelaar, & González, 2012). These reflex behaviors—such as vergence adaptation,
saccadic movements and smooth pursuit—involve archaic areas within the central nervous
system such as the brain stem and the cerebellum, but can be also modulated by cortical
visual areas (Voogd, Schraa-Tam, van der Geest, & De Zeeuw, 2010). These visuomotor loops
are poorly flexible, stereotyped behaviors that are executed automatically. The visual
information managed by this kind of systems remains often subjectively unnoticed; that is,
the visual input is not consciously perceived. However, non-conscious processes are not an
exclusive property of small neural circuits and simple neural computations. In fact, quite
complex cognitive operations such as extracting the semantic information of a rapidly
flashed word is also possible in absence of conscious perception (Dehaene et al., 1998).
On the other hand, visual information can be the object of subjective sensation, that is, it
can be consciously perceived. The emergence of consciousness in the phylogenetic scale
marked a quite singular event. However it is unclear why evolution selected conscious
perception. Taking a cognitive stance, the main role of consciousness would be the
unification and integration of otherwise independent brain functions in a coherent whole
Introduction
3
(Bransford, 1979; Baars, 2002). This would represent an evolutionary advantage for
conscious animals which would integrate information in novel ways, thus enlarging their
repertoire of internal representations and in consequence also their behavior (Baars, 1990;
Baars, 2005; Shanahan, 2010; Ward, 2011).
While visual operations are relatively well understood at the level of single neurons and
brain areas, its relationship with subjective experience has only recently begun to be studied
scientifically. How does neural activity in the brain give rise to consciousness? An
explanatory gap still lies between the function of neurons and our capacity to represent the
world subjectively.
In this thesis we will be focused on the visual system of human and non-human primates and
its large capacity of information extraction from the very fundamental mechanisms allowing
extracting coarse features carrying on some semantic value to the search for neural
correlates of conscious representations.
In the introduction we will see how visual information is extracted in a cascade of automatic
processes and then integrated along the visual hierarchy. Then, we will focus on visual
attention and we will see how this process enables the emergence of higher-level visual
cognitive functions. Then we will focus on visual consciousness and the neural mechanisms
allowing representing visual information consciously, completing the introduction with a
brief summary of the current neurobiological theories of consciousness.
II. The visual system as a hierarchical network
a) The retina
The retina is the first center that processes visual information. The retina is a thin multi-layer
tissue (no more than 250µm in humans) where the light focused by the eye’s optical
structures is projected (Alamouti, 2003). In the retina, photoreceptor cells transform light
into neural activity in a process known as phototransduction. Photoreceptors come in two
Introduction
4
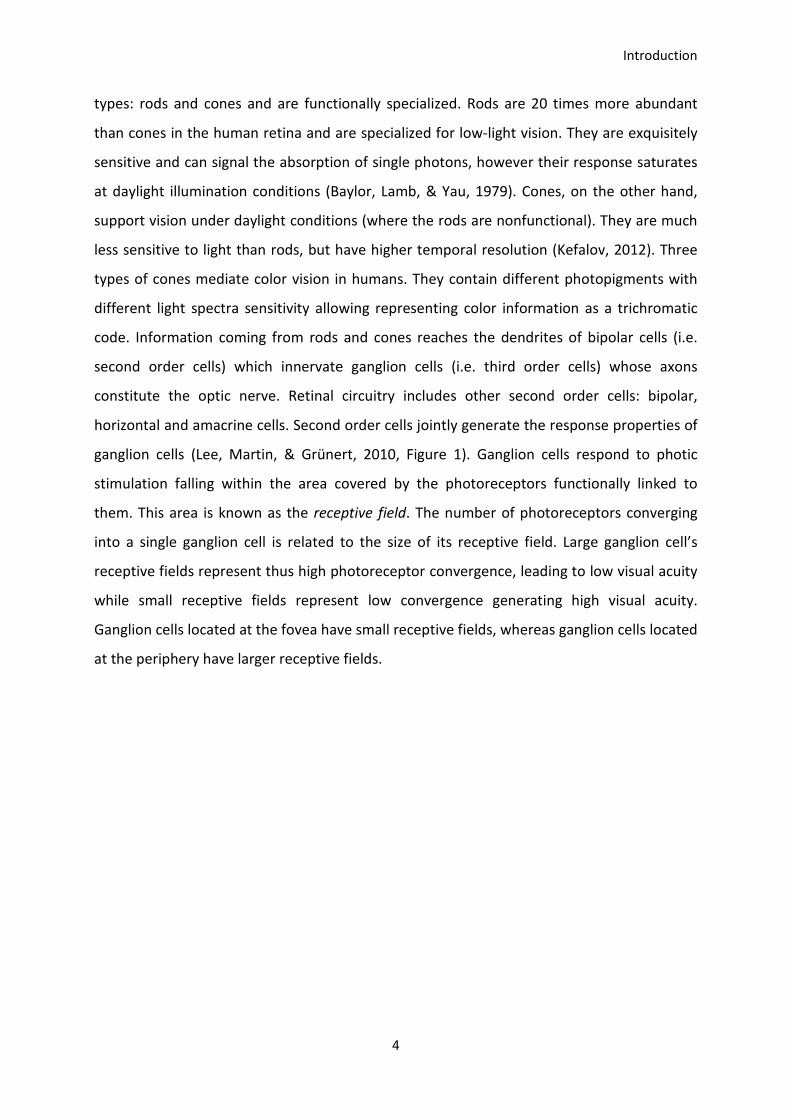
types: rods and cones and are functionally specialized. Rods are 20 times more abundant
than cones in the human retina and are specialized for low-light vision. They are exquisitely
sensitive and can signal the absorption of single photons, however their response saturates
at daylight illumination conditions (Baylor, Lamb, & Yau, 1979). Cones, on the other hand,
support vision under daylight conditions (where the rods are nonfunctional). They are much
less sensitive to light than rods, but have higher temporal resolution (Kefalov, 2012). Three
types of cones mediate color vision in humans. They contain different photopigments with
different light spectra sensitivity allowing representing color information as a trichromatic
code. Information coming from rods and cones reaches the dendrites of bipolar cells (i.e.
second order cells) which innervate ganglion cells (i.e. third order cells) whose axons
constitute the optic nerve. Retinal circuitry includes other second order cells: bipolar,
horizontal and amacrine cells. Second order cells jointly generate the response properties of
ganglion cells (Lee, Martin, & Grünert, 2010, Figure 1). Ganglion cells respond to photic
stimulation falling within the area covered by the photoreceptors functionally linked to
them. This area is known as the receptive field. The number of photoreceptors converging
into a single ganglion cell is related to the size of its receptive field. Large ganglion cell’s
receptive fields represent thus high photoreceptor convergence, leading to low visual acuity
while small receptive fields represent low convergence generating high visual acuity.
Ganglion cells located at the fovea have small receptive fields, whereas ganglion cells located
at the periphery have larger receptive fields.
Introduction
5
Figure 1. Histological preparation and functional circuitry of primate retina. A.
Macaque monkey retina stained with Toluidine blue (Nissl). The bar represents 50 μm. B.
Disposition of neuronal layers. Silhouettes show cell soma and nuclei from cells shown in
panel A; inner and outer segments of some rod and cone receptors are also drawn
(Modified from Lee et al., 2010).
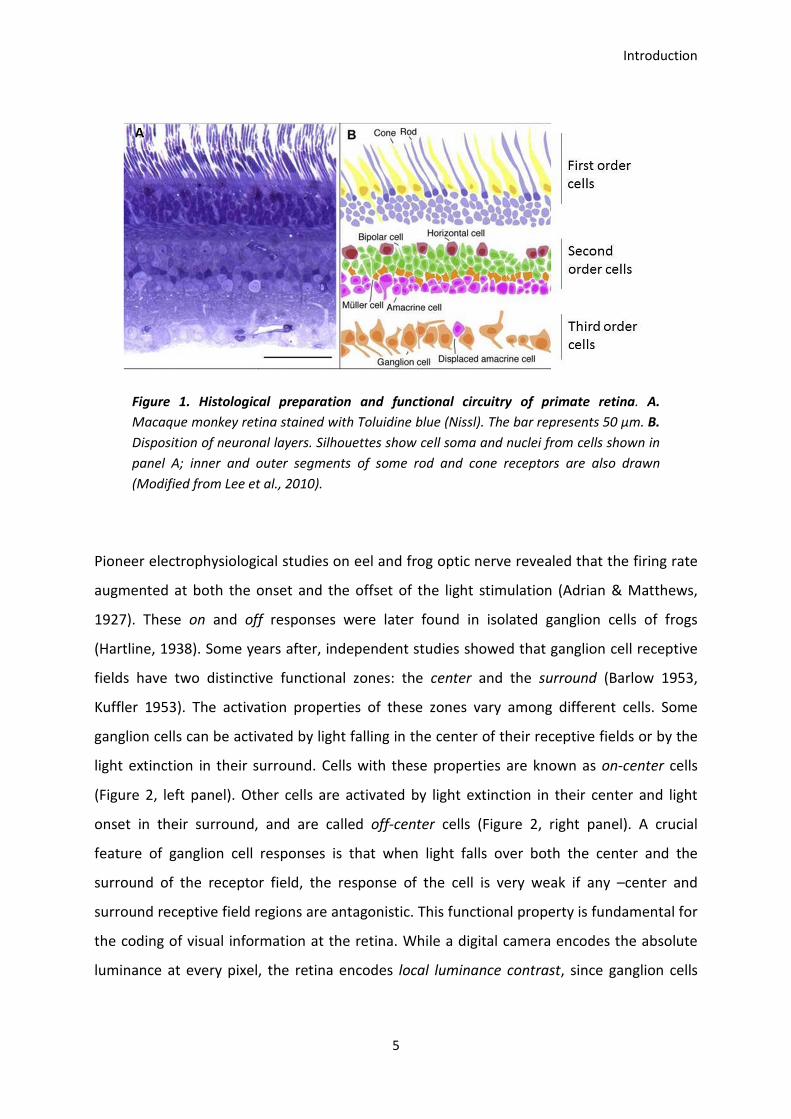
Pioneer electrophysiological studies on eel and frog optic nerve revealed that the firing rate
augmented at both the onset and the offset of the light stimulation (Adrian & Matthews,
1927). These on and off responses were later found in isolated ganglion cells of frogs
(Hartline, 1938). Some years after, independent studies showed that ganglion cell receptive
fields have two distinctive functional zones: the center and the surround (Barlow 1953,
Kuffler 1953). The activation properties of these zones vary among different cells. Some
ganglion cells can be activated by light falling in the center of their receptive fields or by the
light extinction in their surround. Cells with these properties are known as on-center cells
(Figure 2, left panel). Other cells are activated by light extinction in their center and light
onset in their surround, and are called off-center cells (Figure 2, right panel). A crucial
feature of ganglion cell responses is that when light falls over both the center and the
surround of the receptor field, the response of the cell is very weak if any –center and
surround receptive field regions are antagonistic. This functional property is fundamental for
the coding of visual information at the retina. While a digital camera encodes the absolute
luminance at every pixel, the retina encodes local luminance contrast, since ganglion cells
Introduction
6
only respond when there is a luminance difference within their receptive fields. Thus the
critical feature of visual information encoded by the retina is local contrast.
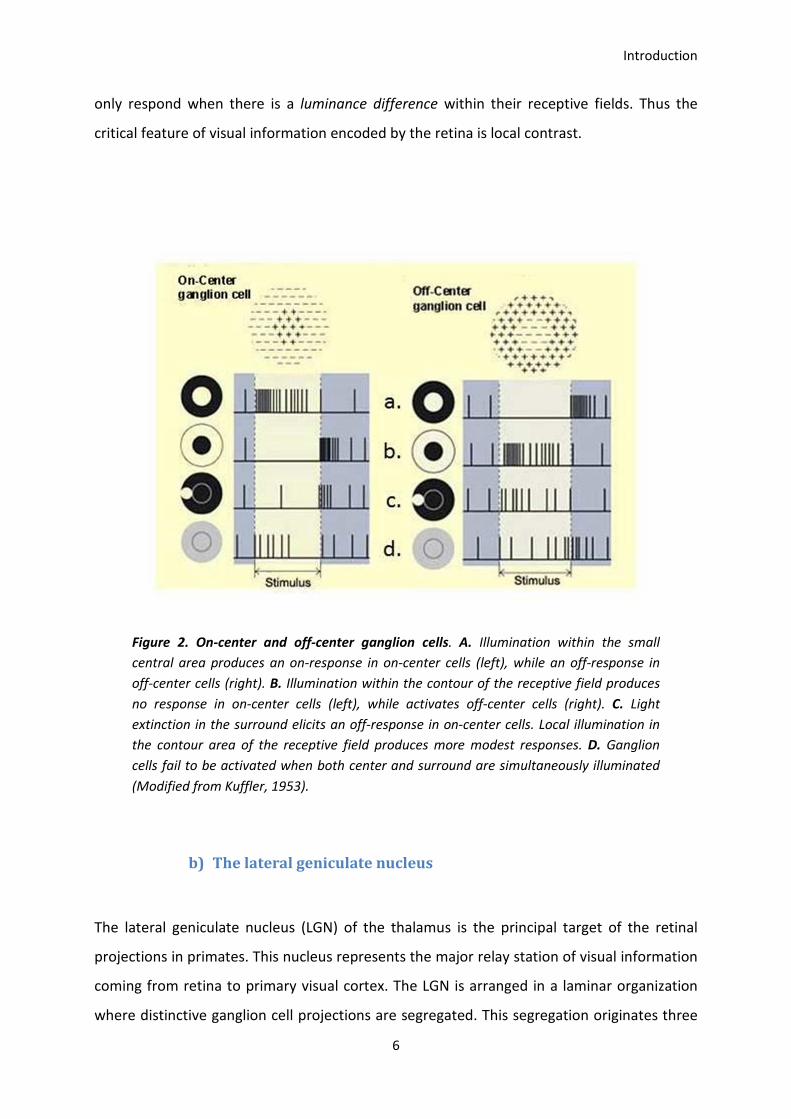
Figure 2. On-center and off-center ganglion cells. A. Illumination within the small
central area produces an on-response in on-center cells (left), while an off-response in
off-center cells (right). B. Illumination within the contour of the receptive field produces
no response in on-center cells (left), while activates off-center cells (right). C. Light
extinction in the surround elicits an off-response in on-center cells. Local illumination in
the contour area of the receptive field produces more modest responses. D. Ganglion
cells fail to be activated when both center and surround are simultaneously illuminated
(Modified from Kuffler, 1953).
b) The lateral geniculate nucleus
The lateral geniculate nucleus (LGN) of the thalamus is the principal target of the retinal
projections in primates. This nucleus represents the major relay station of visual information
coming from retina to primary visual cortex. The LGN is arranged in a laminar organization
where distinctive ganglion cell projections are segregated. This segregation originates three
Introduction
7
different pathways: magnocellular, parvocellular and koniocellular (Kaas, Huerta, Weber, &
Harting, 1978).
In the primate LGN, four parvocellular layers receive projections from midget ganglion cells.
These ganglion cells have small dendritic trees, thus receiving inputs from relatively few rods
and cones (i.e. low degree of convergence). Parvocellular neurons are sensitive to color and
have a finer spatial resolution than magnocellular neurons (Xu et al., 2001).
Magnocellular neurons in the two bottom layers LGN receive inputs from parasol ganglion
cells. They have large dendritic trees and thus receive inputs from many rods and cones (i.e.
high degree of convergence and thus low visual acuity). They can respond to low-contrast
stimuli but are not sensitive to color (Wiesel & Hubel, 1966). In particular, these cells are
responsible for resolving motion (Xu et al., 2001). The coarse (i.e. low-acuity) visual
information carried by the magnocellular pathway can play a major role in cognitive tasks
such as rapid-categorization as suggested by the first work presented in this thesis.
Koniocellular neurons are located between the magnocelullar and parvocellular layers in the
LGN, and receive inputs from bistratified ganglion cells where visual information from short-
wavelength cones converge. Throughout each koniocellular layer are neurons that innervate
extrastriate cortex (i.e., visual areas beyond V1), and may sustain some visual behaviors in
the absence of V1 (Hendry & Reid, 2000), which is the case of pathological conditions such as
blindsight (Zeki, 1995).
Visual response latencies of parvocelullar neurons are longer than those of magnocellular
cells, supporting the idea that visual cortex is activated first by magnocelullar projections
providing a coarse preview of the visual world in the first wave of activity (see for instance
Bullier, 2001). However, some authors have argued that due to the fact that parvocellular
neurons are far more numerous than magnocellular neurons, convergence in cortex could
reduce the magnocellular advantage by allowing parvocellular signals to generate detectable
responses sooner than expected based on the responses of individual parvocellular neurons,
and it could even reverse the magnocellular advantage (Maunsell et al., 1999).
Classically, the LGN has been considered as a simple relay system. However, in terms of
numbers of synapses on the geniculate relay cells, retinal inputs provide only about 5% (Van
Introduction
8
Horn, Erişir, & Sherman, 2000). The remaining 90%-95% of synaptic inputs are roughly
equally divided among local inhibitory inputs, brainstem inputs and cortical feedback. These
cortico-thalamic connections targeting the LGN and other thalamic nuclei have been
highlighted as crucial features for models aimed to explain sensory representations
(Mumford, 1991), attention (Koch and Ullman 1985, Kustov & Robinson, 1996), and
conscious perception (Lumer, Edelman, & Tononi, 1997), among other functions.
There is also evidence supporting the idea that LGN relay cells can actively shape the
temporal dynamics of activation of the primary visual cortex, having a key role in the
generation of the cortical alpha rhythm (see for instance da Silva et al. 1973, Llinás 1988,
(Lőrincz, Kékesi, Juhász, Crunelli, & Hughes, 2009), which would be fundamental in
maintaining the functional connectivity among brain areas (Sauseng & Klimesch, 2008;
Wang, 2010). Thus, the role of the LGN apparently goes further from the relay function
proposed for classic views.
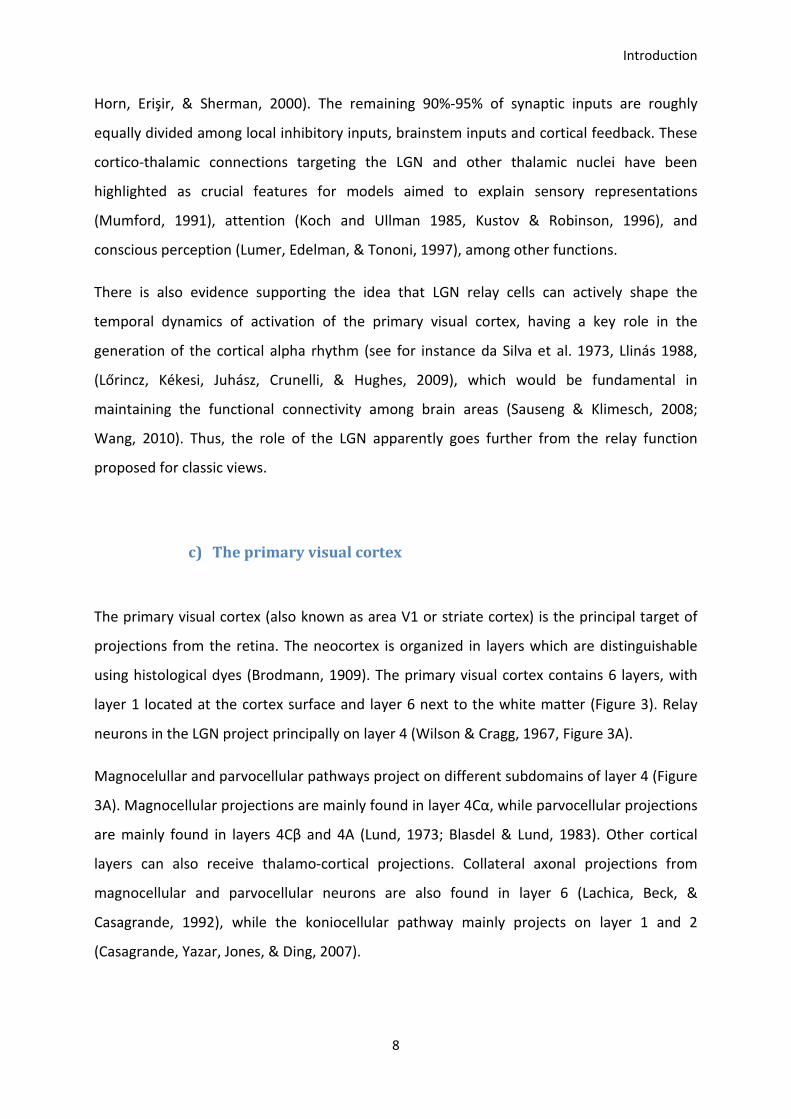
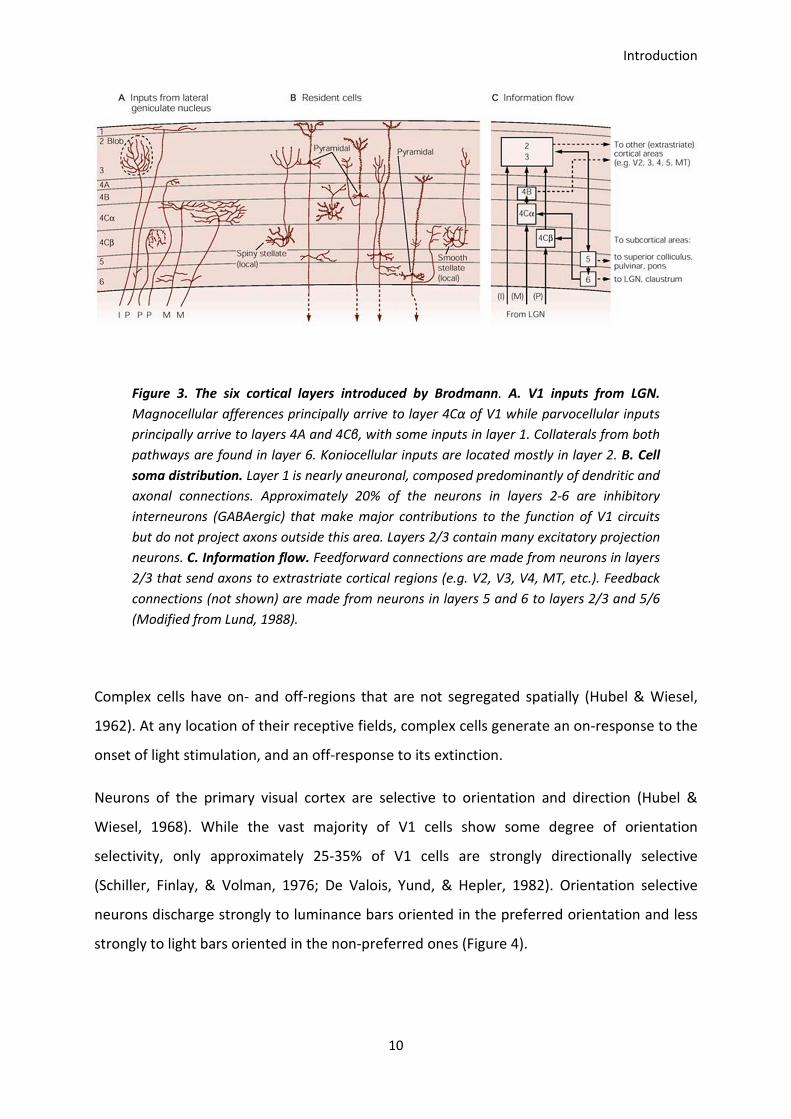
c) The primary visual cortex
The primary visual cortex (also known as area V1 or striate cortex) is the principal target of
projections from the retina. The neocortex is organized in layers which are distinguishable
using histological dyes (Brodmann, 1909). The primary visual cortex contains 6 layers, with
layer 1 located at the cortex surface and layer 6 next to the white matter (Figure 3). Relay
neurons in the LGN project principally on layer 4 (Wilson & Cragg, 1967, Figure 3A).
Magnocelullar and parvocellular pathways project on different subdomains of layer 4 (Figure
3A). Magnocellular projections are mainly found in layer 4Cα, while parvocellular projections
are mainly found in layers 4Cβ and 4A (Lund, 1973; Blasdel & Lund, 1983). Other cortical
layers can also receive thalamo-cortical projections. Collateral axonal projections from
magnocellular and parvocellular neurons are also found in layer 6 (Lachica, Beck, &
Casagrande, 1992), while the koniocellular pathway mainly projects on layer 1 and 2
(Casagrande, Yazar, Jones, & Ding, 2007).
Introduction
9
Also, there are some koniocellular axons that project beyond the primary visual cortex, in
regions such as V2 (Yoshida & Benevento, 1981; Fries 1981; Bullier and Kennedy 1983), V4
(Tanaka, Lindsley, Lausmann, & Creutzfeldt, 1990), the inferotemporal cortex (Hernández-
González, Cavada, & Reinoso-Suárez, 1994) and the medial temporal area MT (Bullier &
Kennedy, 1983 ; Sincich, Park, Wohlgemuth, & Horton, 2004), which, besides from
supporting visuospatial behaviors in pathological conditions affecting V1 as discussed above,
could also shortcut visual information in normal vision, producing the unexpected early
neural responses (less than 80 ms) in higher level visual areas such as MT and the prefrontal
cortex (Bullier, 2001).
While receptive fields in LGN are organized concentrically (with on- and off-centers and
antagonistic surrounds), receptive fields in the primary visual cortex have a more complex
organization. The pioneer works of Hubel and Wiesel in cat and monkey cortices led to the
distinction of two kinds of neurons: simple and complex which have different receptive field
properties (Hubel & Wiesel, 1959; Hubel & Wiesel, 1962; Hubel & Wiesel, 1965; Hubel &
Wiesel, 1968).
Simple cells have from 2 to 4 easily distinguishable on and off regions in their receptive
fields. On and off regions emerge as a consequence of the convergence of on-center and off-
center LGN cells respectively (Tanaka 1983; Alonso, Usrey, & Reid, 2001). Simple cells show a
push-pull organization within the regions of their receptive fields. Bright stimuli falling within
off-regions and dark stimuli falling within on-regions inhibit neuronal response (Palmer &
Davis, 1981; Ferster, 1988). Thus, when on- and off-regions are stimulated at the same time,
the neural response is less important than responses obtained by stimulating on- and off-
regions alone.
Introduction
10
Figure 3. The six cortical layers introduced by Brodmann. A. V1 inputs from LGN.
Magnocellular afferences principally arrive to layer 4Cα of V1 while parvocellular inputs
principally arrive to layers 4A and 4Cβ, with some inputs in layer 1. Collaterals from both
pathways are found in layer 6. Koniocellular inputs are located mostly in layer 2. B. Cell
soma distribution. Layer 1 is nearly aneuronal, composed predominantly of dendritic and
axonal connections. Approximately 20% of the neurons in layers 2-6 are inhibitory
interneurons (GABAergic) that make major contributions to the function of V1 circuits
but do not project axons outside this area. Layers 2/3 contain many excitatory projection
neurons. C. Information flow. Feedforward connections are made from neurons in layers
2/3 that send axons to extrastriate cortical regions (e.g. V2, V3, V4, MT, etc.). Feedback
connections (not shown) are made from neurons in layers 5 and 6 to layers 2/3 and 5/6
(Modified from Lund, 1988).
Complex cells have on- and off-regions that are not segregated spatially (Hubel & Wiesel,
1962). At any location of their receptive fields, complex cells generate an on-response to the
onset of light stimulation, and an off-response to its extinction.
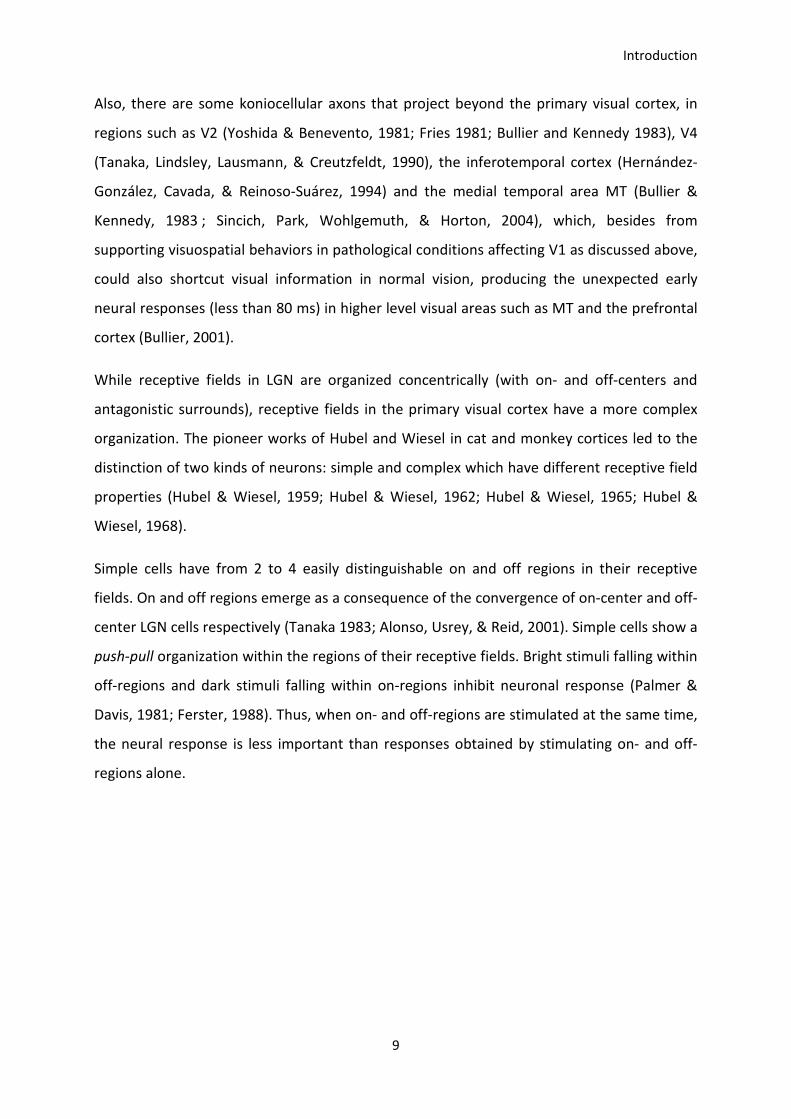
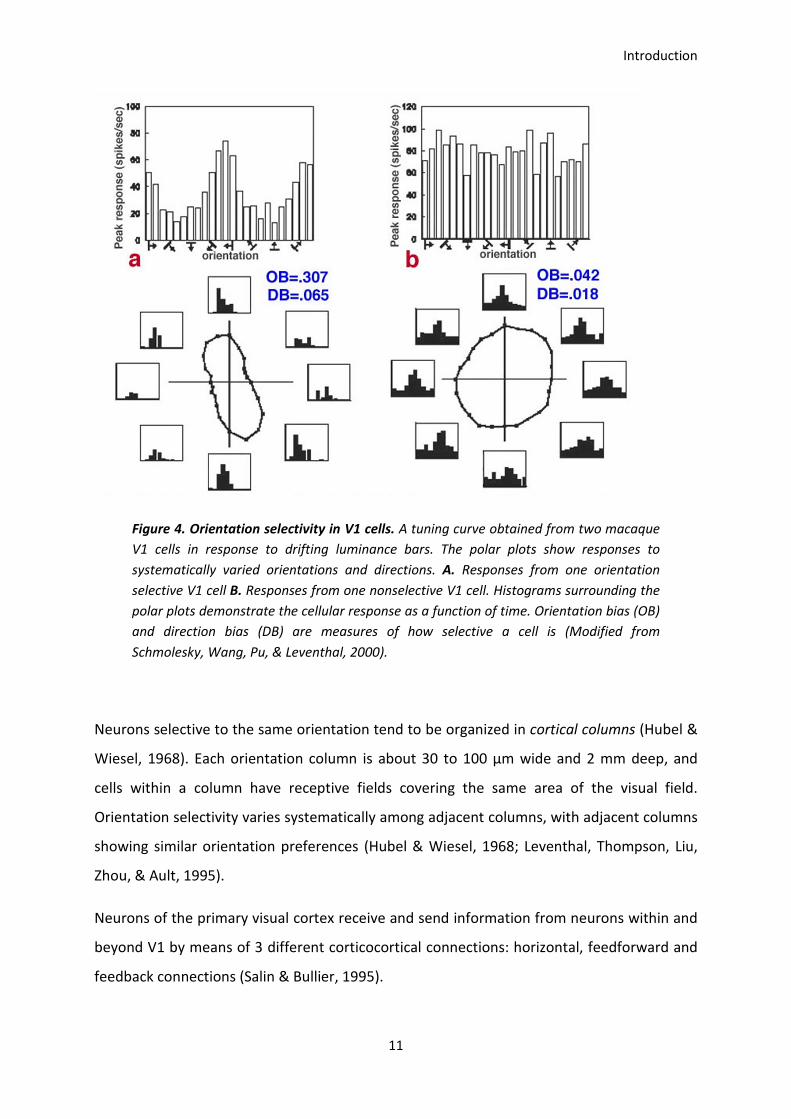
Neurons of the primary visual cortex are selective to orientation and direction (Hubel &
Wiesel, 1968). While the vast majority of V1 cells show some degree of orientation
selectivity, only approximately 25-35% of V1 cells are strongly directionally selective
(Schiller, Finlay, & Volman, 1976; De Valois, Yund, & Hepler, 1982). Orientation selective
neurons discharge strongly to luminance bars oriented in the preferred orientation and less
strongly to light bars oriented in the non-preferred ones (Figure 4).
Introduction
11
Figure 4. Orientation selectivity in V1 cells. A tuning curve obtained from two macaque
V1 cells in response to drifting luminance bars. The polar plots show responses to
systematically varied orientations and directions. A. Responses from one orientation
selective V1 cell B. Responses from one nonselective V1 cell. Histograms surrounding the
polar plots demonstrate the cellular response as a function of time. Orientation bias (OB)
and direction bias (DB) are measures of how selective a cell is (Modified from
Schmolesky, Wang, Pu, & Leventhal, 2000).
Neurons selective to the same orientation tend to be organized in cortical columns (Hubel &
Wiesel, 1968). Each orientation column is about 30 to 100 µm wide and 2 mm deep, and
cells within a column have receptive fields covering the same area of the visual field.
Orientation selectivity varies systematically among adjacent columns, with adjacent columns
showing similar orientation preferences (Hubel & Wiesel, 1968; Leventhal, Thompson, Liu,
Zhou, & Ault, 1995).
Neurons of the primary visual cortex receive and send information from neurons within and
beyond V1 by means of 3 different corticocortical connections: horizontal, feedforward and
feedback connections (Salin & Bullier, 1995).
Introduction
12
Horizontal connections link neurons within the same cortical area, linking columns with
shared orientation preferences and represent the vast majority of synapses in V1. Horizontal
connections are often made between neurons within the same layer (Binzegger, Douglas, &
Martin, 2004). Feedforward connections, on the other hand, are made from lower to higher
cortical areas. These connections are made from pyramidal cells of layers 2 and 3 to neurons
in layer 4 in the target area (Figure 3C). Feedback connections are made from higher to
lower cortical areas (Figure 3C). These connections are made from neurons in layers 5 and 6
to layers 2/3 and 5/6 (Rockland & Pandya, 1979; Maunsell & van Essen, 1983).
This connectivity pattern was used to propose a hierarchical organization among visual areas
in the monkey brain (Felleman & Van Essen, 1991).
d) Visual area V2
In monkey V2 two-thirds of the projections are provided by V1 (Sincich, Adams, & Horton,
2003). V2 receptive fields are larger than those in V1 which is produced by the convergence
of multiple V1 cells onto each V2 neuron. V2 cells are sensitive to depth, motion, color, and
simple contours (Levitt, Kiper, & Movshon, 1994; Thomas, Cumming, & Parker, 2002).
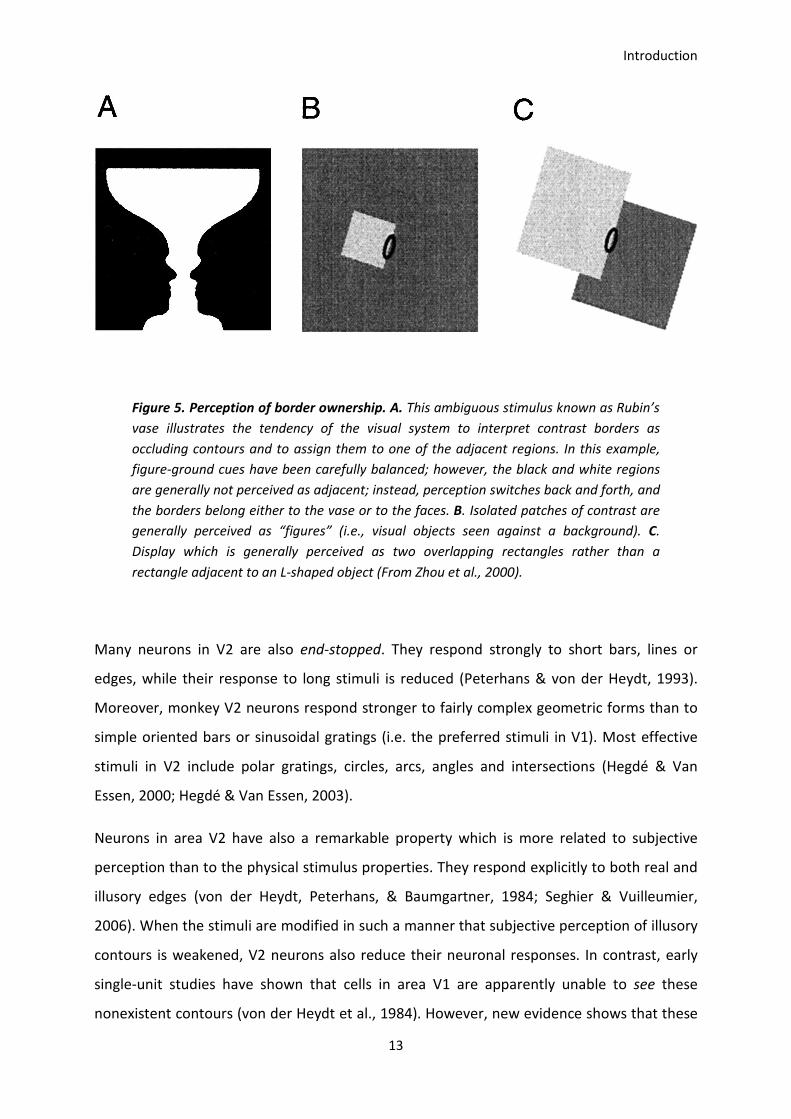
Area V2 neurons show more complex responses than V1 neurons. They can be sensitive to
border ownership (i.e., the object-appartenance of occluding contours defining the limits of
such objects). Border ownership can be manipulated when the same local feature (contrast
edge or line) is presented as part of different figures. For example, the same light-dark edge
could be the left side of a dark square or the right side of a light square (Figure 5). More than
a half of V2 neurons modulate their firing rate by border ownership, while less than one-fifth
of V1 cells are sensitive to border ownership (Zhou, Friedman, & von der Heydt, 2000;
Zhaoping, 2005). This information has an important role in the emergence of object
recognition as it would be used in later stages on the processing to separate object from
background (Orban, 2008).
Introduction
13
Figure 5. Perception of border ownership. A. This ambiguous stimulus known as Rubin’s
vase illustrates the tendency of the visual system to interpret contrast borders as
occluding contours and to assign them to one of the adjacent regions. In this example,
figure-ground cues have been carefully balanced; however, the black and white regions
are generally not perceived as adjacent; instead, perception switches back and forth, and
the borders belong either to the vase or to the faces. B. Isolated patches of contrast are
generally perceived as “figures” (i.e., visual objects seen against a background). C.
Display which is generally perceived as two overlapping rectangles rather than a
rectangle adjacent to an L-shaped object (From Zhou et al., 2000).
Many neurons in V2 are also end-stopped. They respond strongly to short bars, lines or
edges, while their response to long stimuli is reduced (Peterhans & von der Heydt, 1993).
Moreover, monkey V2 neurons respond stronger to fairly complex geometric forms than to
simple oriented bars or sinusoidal gratings (i.e. the preferred stimuli in V1). Most effective
stimuli in V2 include polar gratings, circles, arcs, angles and intersections (Hegdé & Van
Essen, 2000; Hegdé & Van Essen, 2003).
Neurons in area V2 have also a remarkable property which is more related to subjective
perception than to the physical stimulus properties. They respond explicitly to both real and
illusory edges (von der Heydt, Peterhans, & Baumgartner, 1984; Seghier & Vuilleumier,
2006). When the stimuli are modified in such a manner that subjective perception of illusory
contours is weakened, V2 neurons also reduce their neuronal responses. In contrast, early
single-unit studies have shown that cells in area V1 are apparently unable to see these
nonexistent contours (von der Heydt et al., 1984). However, new evidence shows that these
Introduction
14
responses can be also found in V1 (Seghier & Vuilleumier, 2006; Schmid, 2008; Zhan & Baker,
2008).
e) Ventral and dorsal visual pathways
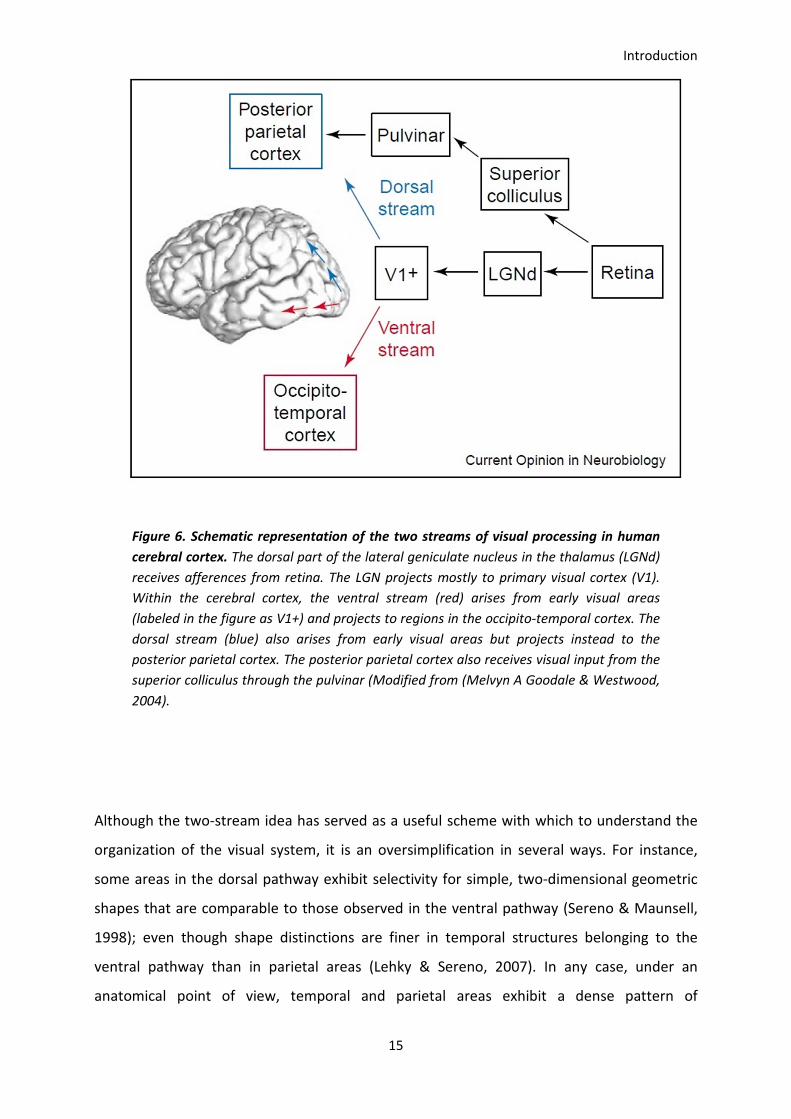
It has been proposed that beyond area V2 visual information is divided in two pathways: the
ventral and the dorsal visual pathways. Experiments in monkeys revealed selective
impairments following lesions in the occipitoparietal and occipitotemporal visual cortices
suggesting that temporal areas are relatively specialized in object recognition, whereas
parietal areas would be specialized in carrying out spatial localization of stimuli, sensing of
motion and visual guidance of motor actions (Mishkin & Ungerleider, 1982; Ungerleider and
Mishkin 1982 ; reviewed in Mishkin, Ungerleider, & Macko, 1983 ; and Goodale and Milner
1992).
Anatomically, the dorsal pathway extends along the occipito-parietal and parietal cortices,
while the ventral pathway includes the occipito-temporal and inferotemporal cortices (see
Figure 6).
Clinical evidence for the ventral and dorsal pathways model has been found also in humans.
Lesions in temporal regions have been associated with impairments in recognition of objects
(such as faces and animals) and the inability to perceive colors; while lesions in the parietal
cortex causes failures in perceiving movement, visuo-motor disorders and hemineglect—i.e.,
incapacity to notice objects in one side of the visual field—(Newcombe, Ratcliff, & Damasio,
1987; Warrington, 1982; Postma, Sterken, de Vries, & de Haan, 2000; Rizzolatti & Berti,
1990). Functional dissociation between these two pathways in humans has been also
supported by functional neuroimaging studies in normal subjects (see for instance
Ungerleider & Haxby, 1994).
Introduction
15
Figure 6. Schematic representation of the two streams of visual processing in human
cerebral cortex. The dorsal part of the lateral geniculate nucleus in the thalamus (LGNd)
receives afferences from retina. The LGN projects mostly to primary visual cortex (V1).
Within the cerebral cortex, the ventral stream (red) arises from early visual areas
(labeled in the figure as V1+) and projects to regions in the occipito-temporal cortex. The
dorsal stream (blue) also arises from early visual areas but projects instead to the
posterior parietal cortex. The posterior parietal cortex also receives visual input from the
superior colliculus through the pulvinar (Modified from (Melvyn A Goodale & Westwood,
2004).
Although the two-stream idea has served as a useful scheme with which to understand the
organization of the visual system, it is an oversimplification in several ways. For instance,
some areas in the dorsal pathway exhibit selectivity for simple, two-dimensional geometric
shapes that are comparable to those observed in the ventral pathway (Sereno & Maunsell,
1998); even though shape distinctions are finer in temporal structures belonging to the
ventral pathway than in parietal areas (Lehky & Sereno, 2007). In any case, under an
anatomical point of view, temporal and parietal areas exhibit a dense pattern of
Introduction
16
interconnection (Baizer, Ungerleider, & Desimone, 1991), which suggests a high-degree of
functional interaction between both visual pathways. Furthermore, recent evidence shows
that functional dissociations may be less pure than previously suggested (see for example
Farivar, 2009; Goodale & Westwood, 2004).
In the next section we will focus on the ventral pathway in order to explore the neural basis
of object recognition.
f) The ventral visual pathway and object recognition
The ventral pathway in monkeys includes occipital and temporal visual areas such as V1, V2,
V4 and the inferotemporal cortex IT (Desimone & Ungerleider, 1989). The different cortical
areas in the ventral pathway contain populations of cells sensitive to shape, color, and/or
texture. While progressing in the visual hierarchy, cells have larger receptive fields and tend
to be selective to more complex stimuli (Enns, 2004). For instance, while most of V1 neurons
serve as local spatial filters, signaling the presence of contours at particular positions and
orientations in the visual field, as we have seen in Section c; an increasingly higher
proportion of cells in higher areas (e.g., V2 and beyond) respond to illusory contours (as we
have seen in Section D), across increasingly larger regions of the visual field. This integration
of features would lead to the representation of complex object features representations at
the higher steps of the ventral pathway (Grill-Spector, 2003; Blumberg & Kreiman, 2010),
which would be coded explicitly by neural populations within the ventral pathway (Tanaka,
2003).
The selectivity for forms and complex object features in areas V4 and IT has been intensely
studied in monkeys thanks to electrophysiological recordings. Neurons in area V4 are
selective to 2D and 3D shapes (Desimone & Schein, 1987; Gallant, Braun, and Van Essen
1993; Hegdé & Van Essen, 2005; Hegdé & Van Essen, 2006). Compared to V2 cells, area V4
neurons respond more strongly to more complex geometrical patterns (Hegdé & Van Essen,
2007). Lesion studies in monkey have revealed that V4 is important for shape discrimination,
recognition and for generalization (Schiller & Lee, 1991; Schiller, 1995). In humans, area V4v
has been proposed as the homologous of area V4 in monkeys. It has been suggested that
Introduction
17
area V4 would serve to code visual representations of intermediate complexity which would
be completed by inferotemporal areas where more complex object features are coded
(Pasupathy & Connor, 1999; Schiller, 1995).
Area V4 projects primarily to the inferotemporal cortex (IT) (Desimone, Fleming, & Gross,
1980; Baizer et al., 1991; Felleman and Van Essen 1991). Area IT is subdivided in posterior
(PIT), central (CIT), and anterior (AIT) regions. In area IT one can find the neurons with the
greatest object selectivity. Several studies revealed that some IT neurons are activated by
several objects categories such as faces, flowers and hands, but are poorly activated by
simple stimuli or scrambled versions of objects (Gross, Rocha-Miranda, & Bender, 1972;
Desimone, Albright, Gross, & Bruce, 1984; Young & Yamane, 1992; reviewed by Logothetis &
Sheinberg, 1996). These areas can be also activated by synthetic objects (i.e., non-natural
stimuli) that are learned during intensive training (N K Logothetis, Pauls, & Poggio, 1995). In
a series of studies using a systematic method to reduce stimulus complexity, it was shown
that AIT neurons coding for related object features are organized in a column-like pattern
(Fujita, Tanaka, Ito, & Cheng, 1992; Kobatake & Tanaka, 1994; Tanaka, 1996; Tsunoda,
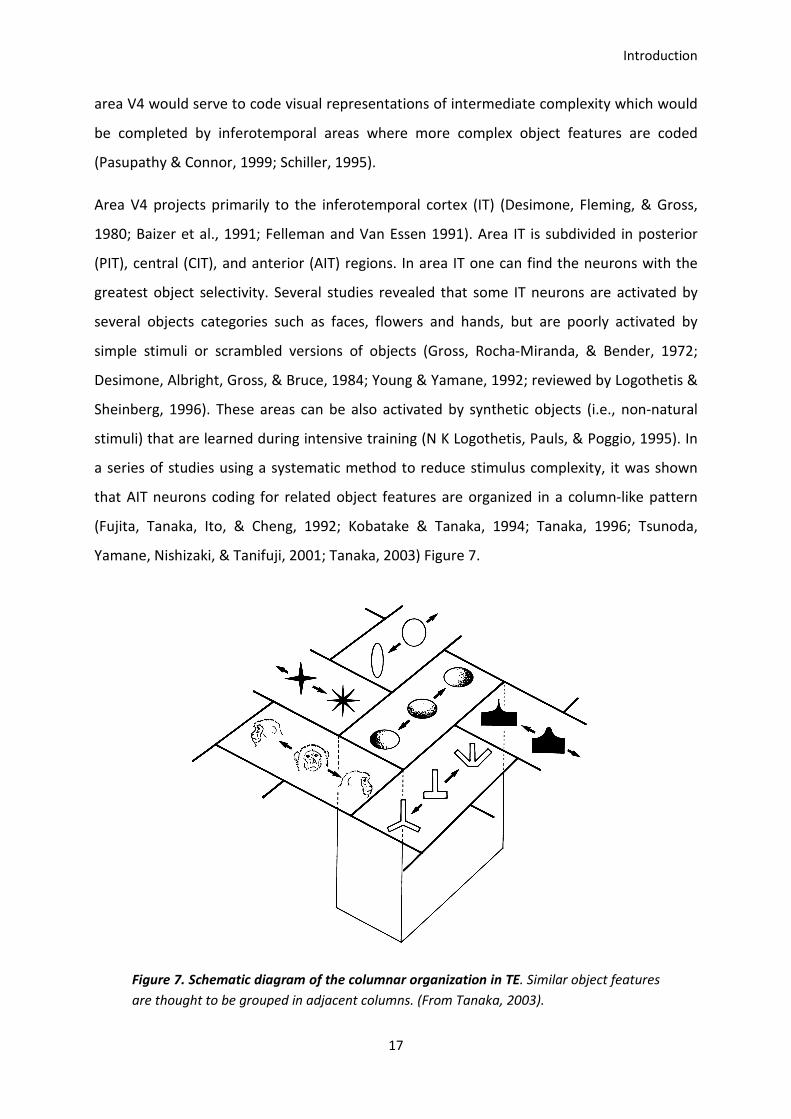
Yamane, Nishizaki, & Tanifuji, 2001; Tanaka, 2003) Figure 7.
Figure 7. Schematic diagram of the columnar organization in TE. Similar object features
are thought to be grouped in adjacent columns. (From Tanaka, 2003).
Introduction
18
In the human brain, visual areas within the ventral pathway that show preferent responses
to a group of object categories have also been identified. Using fMRI, regions responding
more to objects than to scrambled stimuli were found in the lateral occipital complex (LOC),
(Malach et al., 1995). Brain areas specialized for faces, the fusiform face area (FFA) (Puce,
Allison, Gore, & McCarthy, 1995); (Kanwisher, McDermott, & Chun, 1997), and scenes, the
parahypocampal place area (PPA) (Epstein, Harris, Stanley, & Kanwisher, 1999) have been
also found.
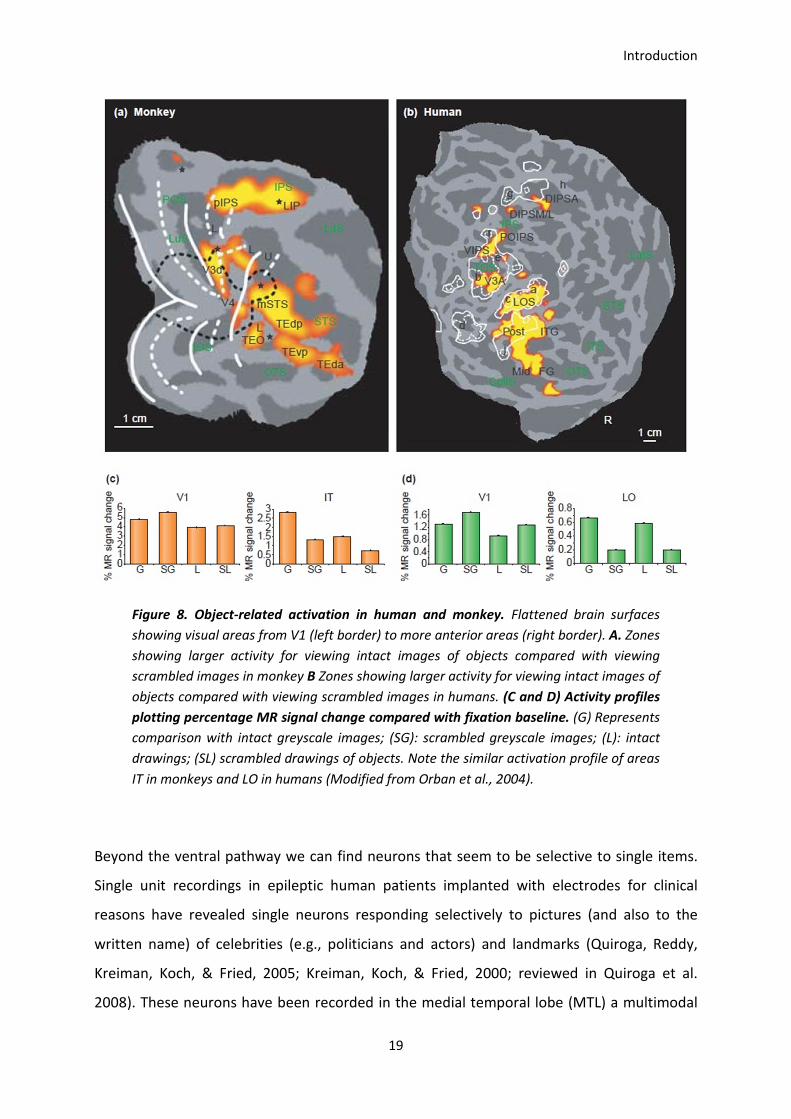
A good deal of homology between different visual areas between monkeys and humans has
been established as illustrated in Figure 8 (Denys et al., 2004 ; Orban, Van Essen, &
Vanduffel, 2004; Pinsk et al., 2009; Nasr et al., 2011). The ventral surface of the human
brain, extending from around the occipito-temporal border to the middle part of the
temporal cortex (LO area), has been designated as the human homologue of the monkey
inferotemporal cortex IT, Figure 8 (Tanaka, 1997; Orban et al., 2004). Activations around the
occipito-temporal border are generally driven by complex object images without selectivity
to a particular class of objects (Haxby et al., 1991; Tootell, Dale, Sereno, & Malach, 1996;
Nancy Kanwisher, Woods, Iacoboni, & Mazziotta, 1997). In the middle part of the temporal
cortex, some regions are activated more significantly by faces (Puce et al., 1995; Kanwisher
et al., 1997) whereas other regions are more activated by non-face objects (Malach et al.,
1995; Grill-Spector, 2003). The presence of regions activated specifically by letter strings has
also been suggested (Puce, Allison, Asgari, Gore, & McCarthy, 1996; Borowsky, Esopenko,
Cummine, & Sarty, 2007), however its actual existence is still debated (see for example Price
& Devlin, 2003). It has been proposed that the functional modularity seen in the visual brain
has probably evolved as a result of the differential characteristics of visual images of
different object classes which led to the functional specialization of particular visual areas
(Tanaka, 1997).
Introduction
19
Figure 8. Object-related activation in human and monkey. Flattened brain surfaces
showing visual areas from V1 (left border) to more anterior areas (right border). A. Zones
showing larger activity for viewing intact images of objects compared with viewing
scrambled images in monkey B Zones showing larger activity for viewing intact images of
objects compared with viewing scrambled images in humans. (C and D) Activity profiles
plotting percentage MR signal change compared with fixation baseline. (G) Represents
comparison with intact greyscale images; (SG): scrambled greyscale images; (L): intact
drawings; (SL) scrambled drawings of objects. Note the similar activation profile of areas
IT in monkeys and LO in humans (Modified from Orban et al., 2004).
Beyond the ventral pathway we can find neurons that seem to be selective to single items.
Single unit recordings in epileptic human patients implanted with electrodes for clinical
reasons have revealed single neurons responding selectively to pictures (and also to the
written name) of celebrities (e.g., politicians and actors) and landmarks (Quiroga, Reddy,
Kreiman, Koch, & Fried, 2005; Kreiman, Koch, & Fried, 2000; reviewed in Quiroga et al.
2008). These neurons have been recorded in the medial temporal lobe (MTL) a multimodal
Introduction
20
area which receives massive inputs from the ventral pathway (Lavenex & Amaral, 2000;
Suzuki 1996; Saleem & Tanaka, 1996). Specifically, these neurons have been found in the
parahippocampal complex (PHC) which involves structures such as hippocampus, amygdala,
entorhinal cortex, parahippocampal cortex and perirhinal cortex. These areas are thought to
maintain a memory of task-related information such as the identity or category of a target
(Miyashita & Hayashi, 2000; Suzuki, 1996; Suzuki, 1999).
g) Visual hierarchy in perspective
There are several hallmarks of the hierarchic functional organization in the visual cortex.
First, anatomically speaking, visual projections show convergence from a stage to another,
which is associated with the integration of information at both the spatial and the feature
level (Rust & Dicarlo, 2010). Monkey area V1 contains ~190·106 neurons whereof ~37·106
would project to the next area, while area AIT contains ~16·106 neurons whereof ~10·106
would send projections (Collins, Airey, Young, Leitch, & Kaas, 2010; O’Kusky & Colonnier,
1982). Convergence leads to an increase of the size of receptive fields from V1 (where they
are smaller than 1° of visual angle) to IT (where they can include the entire visual field).
Functionally, neurons along the ventral pathway respond to more complex features as one
ascends the hierarchy, as we have seen in the previous sections. However, these selectivities
emerge progressively along the visual pathway and different areas can show a high degree
of overlapping regarding their preferred stimuli. Indeed, there are commonalities of visual
shape representation across different hierarchical levels, from V1 to V4, and they may reflect
the replication of neural circuits used in generating complex shape representations at
multiple spatial scales (Hegdé & Van Essen, 2007), rendering thus the functional divisions
along the visual hierarchy less sharp than previously suggested.
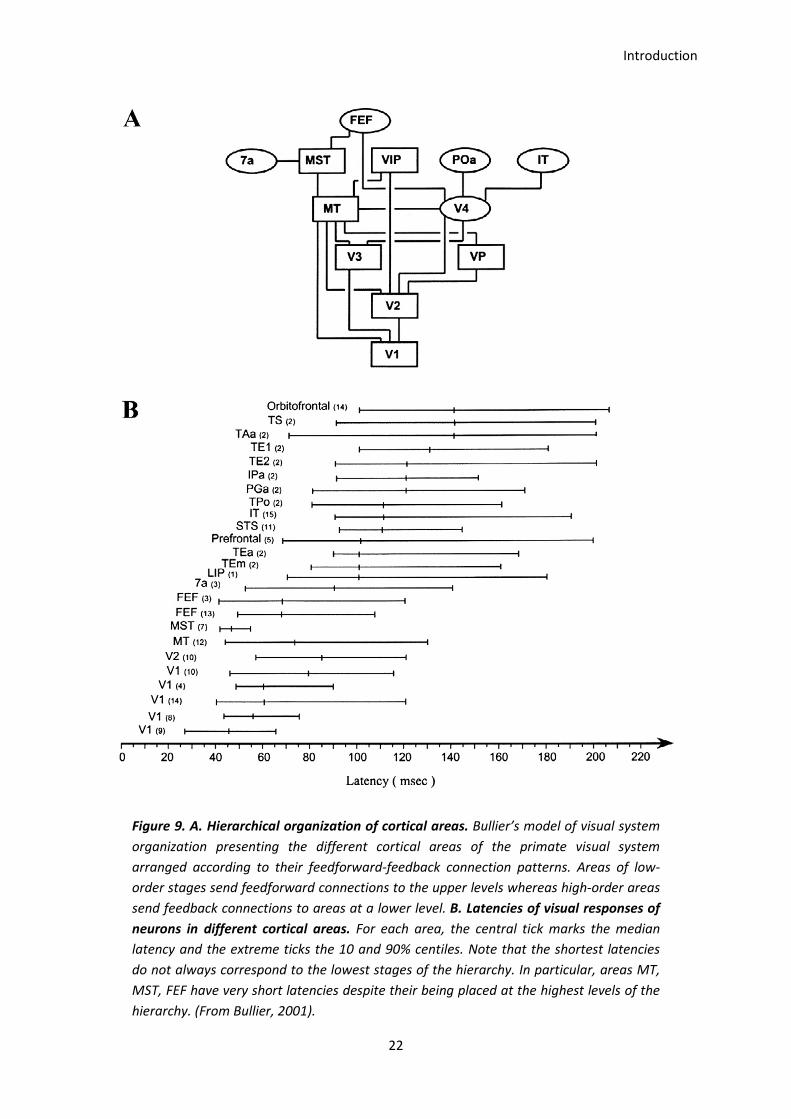
Although median response times to photic stimulation across areas of the ventral stream
tends to follow a hierarchical scheme, there is a high degree of temporal overlapping of the
neural latencies across areas, as seen in Figure 9 (Schmolesky et al., 1998; Bullier, 2001). For
instance, frontal areas which deal with executive functions are activated quite soon (see FEF,
Prefrontal and Orbitofrontal, Figure 8B), all of them showing their earliest responses before
Introduction
21
100 ms. These early responses seem to violate the premise that visual information is
processed serially along the visual pathway, as is predicted by the bottom-up hierarchical
theory popularized in the 70’ (Marr, 1976). An alternative model (Bar 2003; Bar et al., 2006)
proposes a shortcut mechanism in which early cortical visual areas or subcortical projections
would send coarse, partially analyzed visual information through the magnocellular
pathway, to the prefrontal cortex (PFC) (Kveraga, Boshyan, & Bar, 2007). This model
conceives that possible interpretations of the crude visual input would be generated in the
PFC and then sent back to the inferotemporal cortex (IT) subsequently activating relevant
object representations which are then incorporated into the slower, bottom-up process
(Fenske, Aminoff, Gronau, & Bar, 2006). This “shortcut” is meant to minimize the amount of
object representations required for matching thereby facilitating object recognition.
Introduction
22
Figure 9. A. Hierarchical organization of cortical areas. Bullier’s model of visual system
organization presenting the different cortical areas of the primate visual system
arranged according to their feedforward-feedback connection patterns. Areas of low-
order stages send feedforward connections to the upper levels whereas high-order areas
send feedback connections to areas at a lower level. B. Latencies of visual responses of
neurons in different cortical areas. For each area, the central tick marks the median
latency and the extreme ticks the 10 and 90% centiles. Note that the shortest latencies
do not always correspond to the lowest stages of the hierarchy. In particular, areas MT,
MST, FEF have very short latencies despite their being placed at the highest levels of the
hierarchy. (From Bullier, 2001).
Introduction
23
Thus, neural processing in the object recognition pathway does not seem to be a simple
elaboration of information from lower order to higher order areas. At all stages, the neural
connections are reciprocal, such that an area receiving feedforward projections from an area
earlier in the ventral stream also provides feedback projections to that area (Spatz, Tigges, &
Tigges, 1970; Felleman and Van Essen 1991; Salin & Bullier, 1995; Lamme, Supèr, and
Spekreijse 1998; Anderson & Martin, 2009; Anderson & Martin, 2006; Anderson & Martin,
2005). Long-range nonreciprocal connections, such as from temporal areas back to V1, also
exist (Kennedy & Bullier, 1985; Rockland & Van Hoesen, 1994; Rockland & Drash, 1996), and
reversible inactivation of these connections can affect receptive field characteristics in V1
neurons (Huang, Wang, & Dreher, 2007). The role of feedforward excitatory projections is to
provide bottom-up, sensory-driven inputs to subsequent visual areas, driving their responses
(i.e., triggering action potentials in target neural populations), while feedback projections
would not drive neural responses directly but would modulate their ongoing activity (Crick
and Koch 1998; Sherman & Guillery, 1998). Functional properties of feedback are not yet
fully understood. However, some functions of feedback connections are relatively well
established, for instance feedback among early visual areas play a role in figure/ground
segregation (Hupé et al., 1998; Roelfsema, Lamme, Spekreijse, & Bosch, 2002; Scholte, Jolij,
Fahrenfort, & Lamme, 2008; Likova & Tyler, 2008) and selection of attentded objects by top-
down attention (Neggers et al., 2007; Rossi, Pessoa, Desimone, & Ungerleider, 2009; Soltani
& Koch, 2010).
All areas within the ventral stream also are heavily interconnected with subcortical
structures, notably the pulvinar, claustrum, and basal ganglia (Spatz et al., 1970; Wong-Riley,
1977; Wong-Riley, 1978), which connections allowing visual information to travel back and
forth from visual cortex to subcortical structures. In addition, each ventral stream area also
receives subcortical modulatory inputs from ascending cholinergic projections from the
basal forebrain, and ascending noradrenergic projections from the locus coeruleus (Tomycz
& Friedlander, 2011). These projections are thought to play a role in the storage of
information in the cortex, and the influence of arousal on information processing,
respectively (Solari & Stoner, 2011).
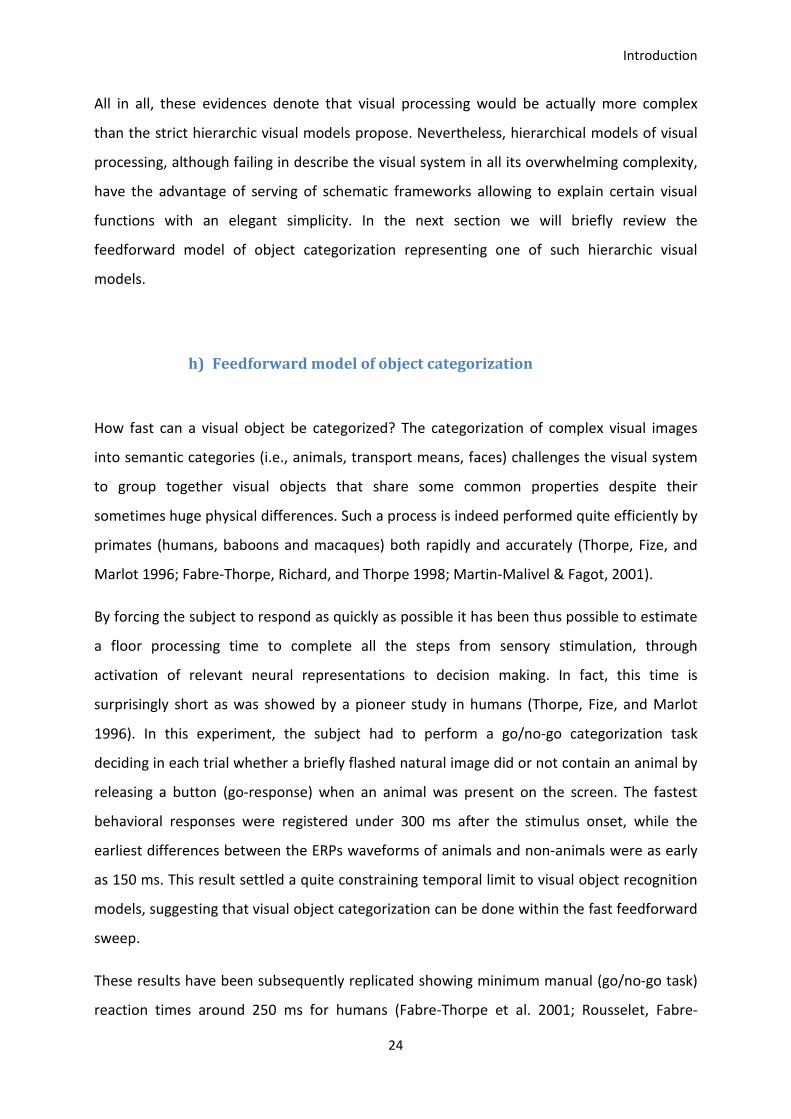
Introduction
24
All in all, these evidences denote that visual processing would be actually more complex
than the strict hierarchic visual models propose. Nevertheless, hierarchical models of visual
processing, although failing in describe the visual system in all its overwhelming complexity,
have the advantage of serving of schematic frameworks allowing to explain certain visual
functions with an elegant simplicity. In the next section we will briefly review the
feedforward model of object categorization representing one of such hierarchic visual
models.
h) Feedforward model of object categorization
How fast can a visual object be categorized? The categorization of complex visual images
into semantic categories (i.e., animals, transport means, faces) challenges the visual system
to group together visual objects that share some common properties despite their
sometimes huge physical differences. Such a process is indeed performed quite efficiently by
primates (humans, baboons and macaques) both rapidly and accurately (Thorpe, Fize, and
Marlot 1996; Fabre-Thorpe, Richard, and Thorpe 1998; Martin-Malivel & Fagot, 2001).
By forcing the subject to respond as quickly as possible it has been thus possible to estimate
a floor processing time to complete all the steps from sensory stimulation, through
activation of relevant neural representations to decision making. In fact, this time is
surprisingly short as was showed by a pioneer study in humans (Thorpe, Fize, and Marlot
1996). In this experiment, the subject had to perform a go/no-go categorization task
deciding in each trial whether a briefly flashed natural image did or not contain an animal by
releasing a button (go-response) when an animal was present on the screen. The fastest
behavioral responses were registered under 300 ms after the stimulus onset, while the
earliest differences between the ERPs waveforms of animals and non-animals were as early
as 150 ms. This result settled a quite constraining temporal limit to visual object recognition
models, suggesting that visual object categorization can be done within the fast feedforward
sweep.
These results have been subsequently replicated showing minimum manual (go/no-go task)
reaction times around 250 ms for humans (Fabre-Thorpe et al. 2001; Rousselet, Fabre-
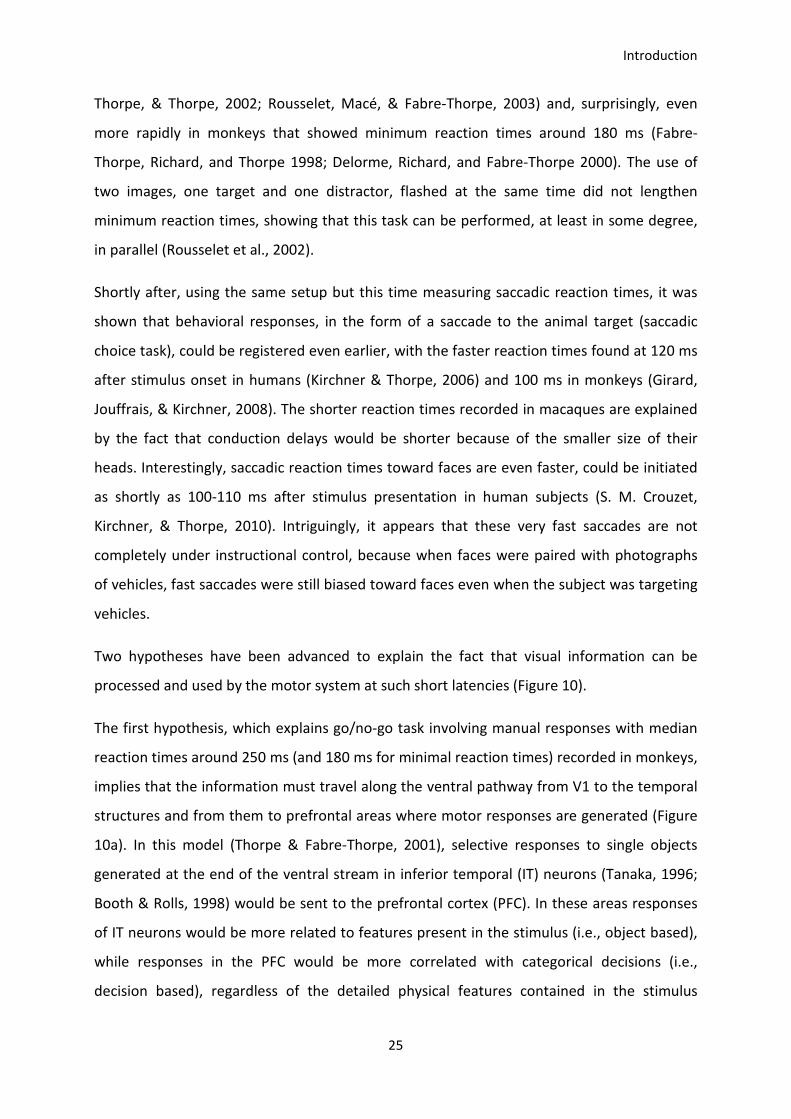
Introduction
25
Thorpe, & Thorpe, 2002; Rousselet, Macé, & Fabre-Thorpe, 2003) and, surprisingly, even
more rapidly in monkeys that showed minimum reaction times around 180 ms (Fabre-
Thorpe, Richard, and Thorpe 1998; Delorme, Richard, and Fabre-Thorpe 2000). The use of
two images, one target and one distractor, flashed at the same time did not lengthen
minimum reaction times, showing that this task can be performed, at least in some degree,
in parallel (Rousselet et al., 2002).
Shortly after, using the same setup but this time measuring saccadic reaction times, it was
shown that behavioral responses, in the form of a saccade to the animal target (saccadic
choice task), could be registered even earlier, with the faster reaction times found at 120 ms
after stimulus onset in humans (Kirchner & Thorpe, 2006) and 100 ms in monkeys (Girard,
Jouffrais, & Kirchner, 2008). The shorter reaction times recorded in macaques are explained
by the fact that conduction delays would be shorter because of the smaller size of their
heads. Interestingly, saccadic reaction times toward faces are even faster, could be initiated
as shortly as 100-110 ms after stimulus presentation in human subjects (S. M. Crouzet,
Kirchner, & Thorpe, 2010). Intriguingly, it appears that these very fast saccades are not
completely under instructional control, because when faces were paired with photographs
of vehicles, fast saccades were still biased toward faces even when the subject was targeting
vehicles.
Two hypotheses have been advanced to explain the fact that visual information can be
processed and used by the motor system at such short latencies (Figure 10).
The first hypothesis, which explains go/no-go task involving manual responses with median
reaction times around 250 ms (and 180 ms for minimal reaction times) recorded in monkeys,
implies that the information must travel along the ventral pathway from V1 to the temporal
structures and from them to prefrontal areas where motor responses are generated (Figure
10a). In this model (Thorpe & Fabre-Thorpe, 2001), selective responses to single objects
generated at the end of the ventral stream in inferior temporal (IT) neurons (Tanaka, 1996;
Booth & Rolls, 1998) would be sent to the prefrontal cortex (PFC). In these areas responses
of IT neurons would be more related to features present in the stimulus (i.e., object based),
while responses in the PFC would be more correlated with categorical decisions (i.e.,
decision based), regardless of the detailed physical features contained in the stimulus
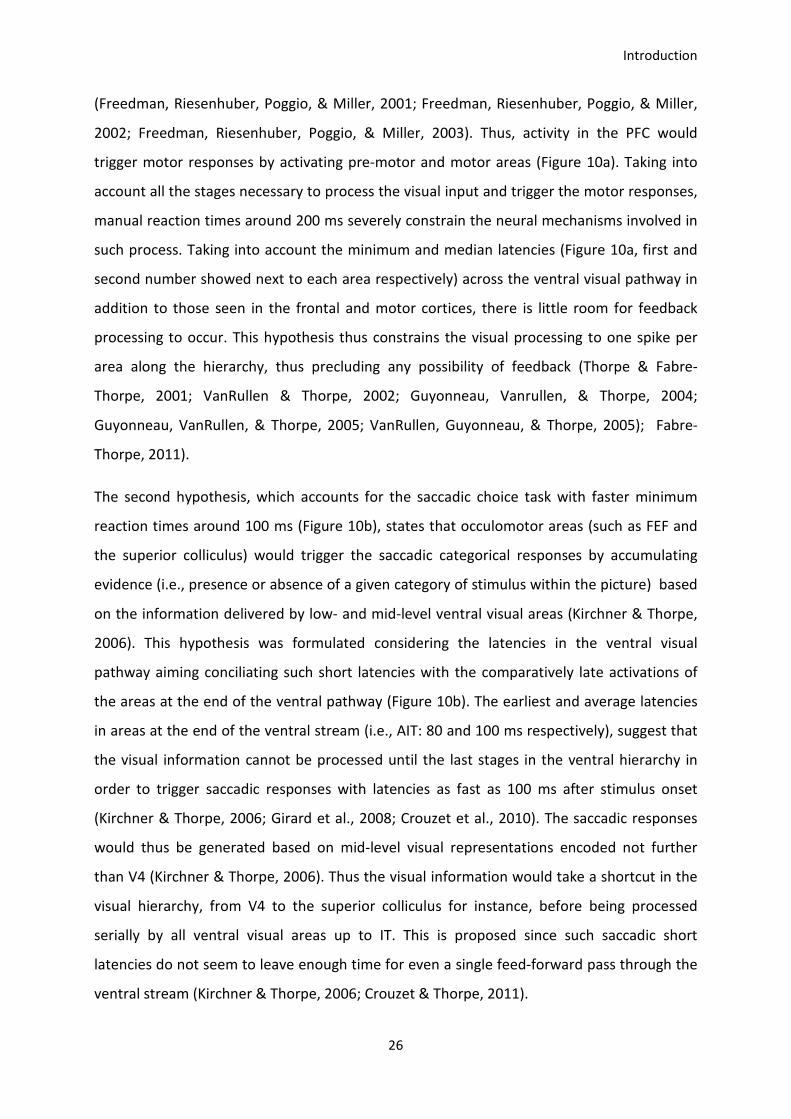
Introduction
26
(Freedman, Riesenhuber, Poggio, & Miller, 2001; Freedman, Riesenhuber, Poggio, & Miller,
2002; Freedman, Riesenhuber, Poggio, & Miller, 2003). Thus, activity in the PFC would
trigger motor responses by activating pre-motor and motor areas (Figure 10a). Taking into
account all the stages necessary to process the visual input and trigger the motor responses,
manual reaction times around 200 ms severely constrain the neural mechanisms involved in
such process. Taking into account the minimum and median latencies (Figure 10a, first and
second number showed next to each area respectively) across the ventral visual pathway in
addition to those seen in the frontal and motor cortices, there is little room for feedback
processing to occur. This hypothesis thus constrains the visual processing to one spike per
area along the hierarchy, thus precluding any possibility of feedback (Thorpe & Fabre-
Thorpe, 2001; VanRullen & Thorpe, 2002; Guyonneau, Vanrullen, & Thorpe, 2004;
Guyonneau, VanRullen, & Thorpe, 2005; VanRullen, Guyonneau, & Thorpe, 2005); Fabre-
Thorpe, 2011).
The second hypothesis, which accounts for the saccadic choice task with faster minimum
reaction times around 100 ms (Figure 10b), states that occulomotor areas (such as FEF and
the superior colliculus) would trigger the saccadic categorical responses by accumulating
evidence (i.e., presence or absence of a given category of stimulus within the picture) based
on the information delivered by low- and mid-level ventral visual areas (Kirchner & Thorpe,
2006). This hypothesis was formulated considering the latencies in the ventral visual
pathway aiming conciliating such short latencies with the comparatively late activations of
the areas at the end of the ventral pathway (Figure 10b). The earliest and average latencies
in areas at the end of the ventral stream (i.e., AIT: 80 and 100 ms respectively), suggest that
the visual information cannot be processed until the last stages in the ventral hierarchy in
order to trigger saccadic responses with latencies as fast as 100 ms after stimulus onset
(Kirchner & Thorpe, 2006; Girard et al., 2008; Crouzet et al., 2010). The saccadic responses
would thus be generated based on mid-level visual representations encoded not further
than V4 (Kirchner & Thorpe, 2006). Thus the visual information would take a shortcut in the
visual hierarchy, from V4 to the superior colliculus for instance, before being processed
serially by all ventral visual areas up to IT. This is proposed since such saccadic short
latencies do not seem to leave enough time for even a single feed-forward pass through the
ventral stream (Kirchner & Thorpe, 2006; Crouzet & Thorpe, 2011).
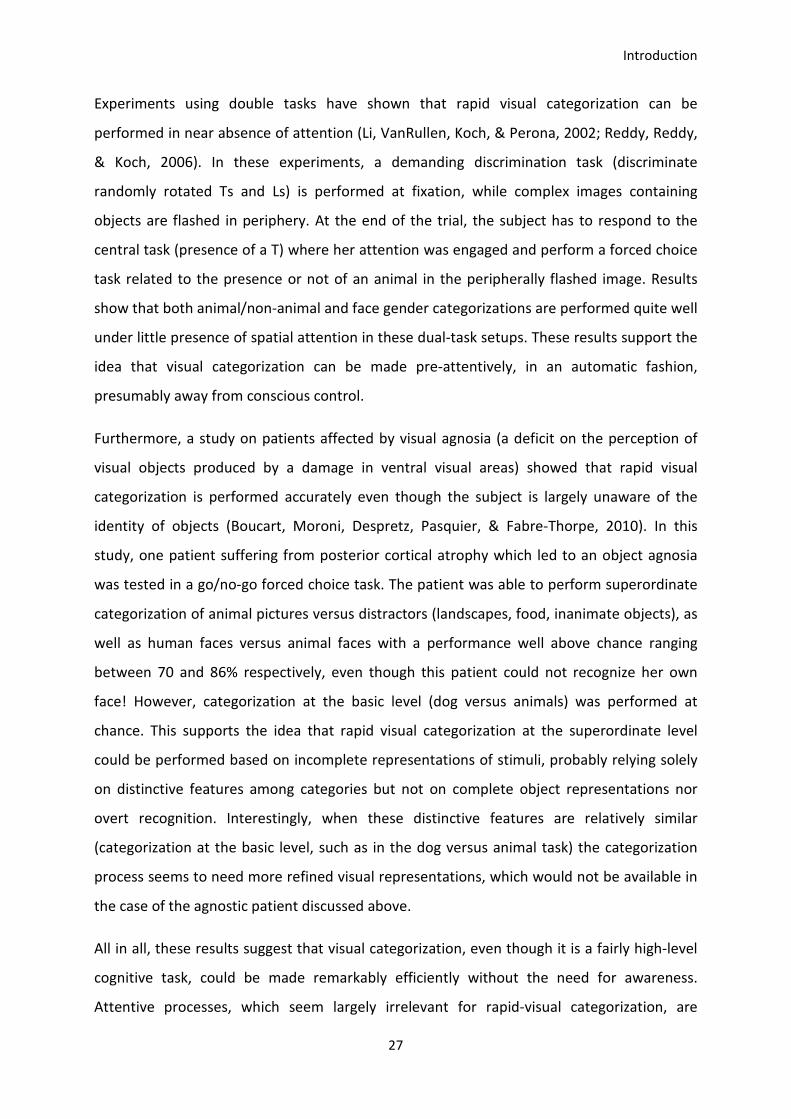
Introduction
27
Experiments using double tasks have shown that rapid visual categorization can be
performed in near absence of attention (Li, VanRullen, Koch, & Perona, 2002; Reddy, Reddy,
& Koch, 2006). In these experiments, a demanding discrimination task (discriminate
randomly rotated Ts and Ls) is performed at fixation, while complex images containing
objects are flashed in periphery. At the end of the trial, the subject has to respond to the
central task (presence of a T) where her attention was engaged and perform a forced choice
task related to the presence or not of an animal in the peripherally flashed image. Results
show that both animal/non-animal and face gender categorizations are performed quite well
under little presence of spatial attention in these dual-task setups. These results support the
idea that visual categorization can be made pre-attentively, in an automatic fashion,
presumably away from conscious control.
Furthermore, a study on patients affected by visual agnosia (a deficit on the perception of
visual objects produced by a damage in ventral visual areas) showed that rapid visual
categorization is performed accurately even though the subject is largely unaware of the
identity of objects (Boucart, Moroni, Despretz, Pasquier, & Fabre-Thorpe, 2010). In this
study, one patient suffering from posterior cortical atrophy which led to an object agnosia
was tested in a go/no-go forced choice task. The patient was able to perform superordinate
categorization of animal pictures versus distractors (landscapes, food, inanimate objects), as
well as human faces versus animal faces with a performance well above chance ranging
between 70 and 86% respectively, even though this patient could not recognize her own
face! However, categorization at the basic level (dog versus animals) was performed at
chance. This supports the idea that rapid visual categorization at the superordinate level
could be performed based on incomplete representations of stimuli, probably relying solely
on distinctive features among categories but not on complete object representations nor
overt recognition. Interestingly, when these distinctive features are relatively similar
(categorization at the basic level, such as in the dog versus animal task) the categorization
process seems to need more refined visual representations, which would not be available in
the case of the agnostic patient discussed above.
All in all, these results suggest that visual categorization, even though it is a fairly high-level
cognitive task, could be made remarkably efficiently without the need for awareness.
Attentive processes, which seem largely irrelevant for rapid-visual categorization, are

Introduction
28
perhaps the key to higher level processes and ultimately the key to consciousness. In the
next section we will briefly review the huge literature on visual attention and trying to
emphasize its role in visual perception and ultimately in the access to conscious
representations of the visual wolrd.
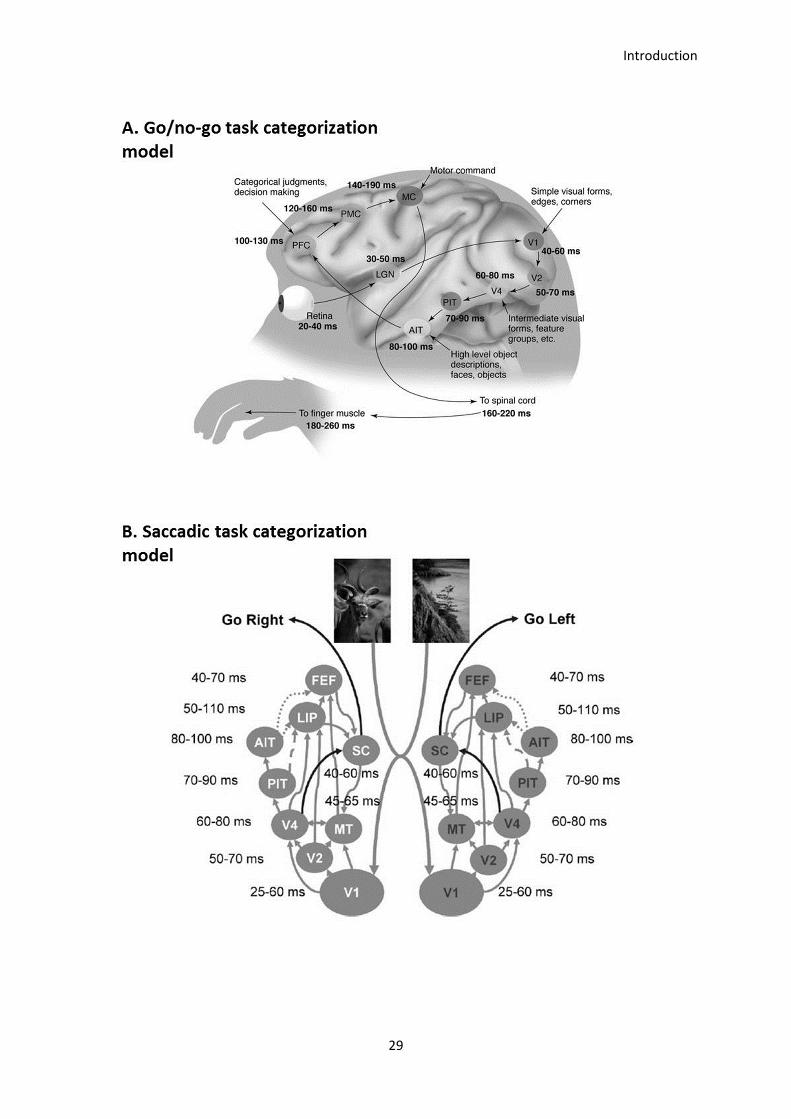
Introduction
29
Introduction
30
Figure 10. Go/no-go and saccadic categorization models. Two different models have
been proposed in order to account for categorization reaction times obtained with two
different response paradigms. A. Go/no-go task categorization model. This model was
proposed in order to account manual reaction times around 200 ms and involves a
feedfoward pass from lower (V1) to higher (AIT) visual cortices which would activate the
PFC which in turn triggers the manual response. The neuronal latencies recorded in these
areas preclude the involvement of feedback iteration within this process. B. Saccadic
task categorization model. This model was proposed in order to account saccadic
reaction times around 100 ms and involves a partial processing of visual information
within the ventral stream, with a putative role of V4 and lower areas in sending evidence
to visuomotor areas such as the FEF and superior colliculus which would accumulate this
evidence in order to decide of the presence of a given category in the stimulus. Dotted
and dashed arrows denote connections that are either insignificant or absent. (Modified
from Thorpe & Fabre-Thorpe, 2001 and Kirchner & Thorpe, 2006).
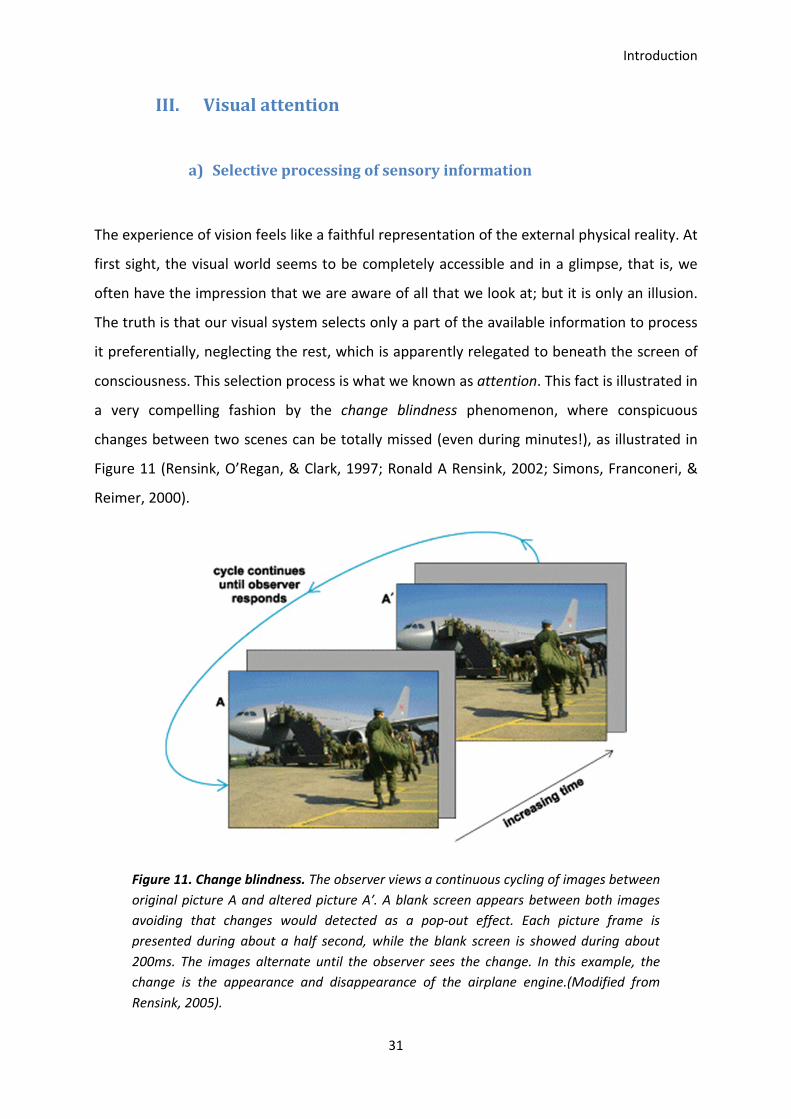
Introduction
31
III. Visual attention
a) Selective processing of sensory information
The experience of vision feels like a faithful representation of the external physical reality. At
first sight, the visual world seems to be completely accessible and in a glimpse, that is, we
often have the impression that we are aware of all that we look at; but it is only an illusion.
The truth is that our visual system selects only a part of the available information to process
it preferentially, neglecting the rest, which is apparently relegated to beneath the screen of
consciousness. This selection process is what we known as attention. This fact is illustrated in
a very compelling fashion by the change blindness phenomenon, where conspicuous
changes between two scenes can be totally missed (even during minutes!), as illustrated in
Figure 11 (Rensink, O’Regan, & Clark, 1997; Ronald A Rensink, 2002; Simons, Franconeri, &
Reimer, 2000).
Figure 11. Change blindness. The observer views a continuous cycling of images between
original picture A and altered picture A′. A blank screen appears between both images
avoiding that changes would detected as a pop-out effect. Each picture frame is
presented during about a half second, while the blank screen is showed during about
200ms. The images alternate until the observer sees the change. In this example, the
change is the appearance and disappearance of the airplane engine.(Modified from
Rensink, 2005).
Introduction
32
This phenomenon denotes the inability to consciously access visual information which is not
directly attended. This compelling phenomenon has been taken as an argument for the idea
that the perceived richness of our visual world is only an illusion resulting from a
constructive process in our minds which is aimed to mask (or counterbalance) the relatively
sparseness of our actual sensorial perception (Blackmore, Brelstaff, Nelson, & Trościanko,
1995; Blackmore, 2005).
Another phenomenon which is closely related to change blindness is inattentional blindness
(Neisser & Becklen, 1975; Mack & Rock, 1998; Simons & Chabris, 1999; Most et al., 2001).
This phenomenon consists in the failure to experience a conspicuous object or event when
the observer is engaged in an attentionally-demanding task elsewhere, and does not expect
the object or event. This is exploited by the illusionists in the presentation of "magic shows"
in the performance of some tricks by focusing the audience's attention upon some
distracting element, away from elements of the scene under manipulation by the performer,
which is called misdirection by magicians. In many ways, both inattentional and change
blindness are similar. However, inattentional blindness is concerned with first-order
information—the presence of quantities—while change blindness involves second-order
information—the transitions between quantities (Rensink, 2000). The two therefore refer to
somewhat different aspects of the visual world, with somewhat different mechanisms likely
involved in each; however they illustrate compellingly the idea that visual awareness would
strongly dependent on visual attention (Rensink, 2000; Mack & Rock, 1998; Simons &
Chabris, 1999; Simons & Rensink, 2003).
At this point, a fundamental question naturally arises: why does a massively parallel system
such as the brain need attention to select information in the first place? We can distinguish
two different schools which propose two different explanations about the need for attention
in the visual system. The first school alludes to an intrinsic processing capacity limit of the
perceptual system, which was mainly inspired by making the analogy between the visual
system and the capacity limited computers (Broadbent, 1987; Ullman 1984; Tsotsos 1997;
Sanders, 1997). The second school attributes the need for selection to the unaffordable
metabolic cost that would entail the processing of all the available sensory information
(Attwell & Laughlin, 2001; Laughlin, 2001; Lennie, 2003; Howarth, Gleeson, & Attwell, 2012).
Introduction
33
In any case, the main function of attention is to select sensory information and to allocate
perceptual resources in order to process it more efficiently than the remaining information.
This selection is manifested as higher perceptual sensibility where attention is deployed,
which is measurable behaviorally in different ways, for example as an increase in
performance in perceiving selected visual attributes in several dimensions, as we shall see in
the next section.
b) Attending to different dimensions of the visual world
Benefits produced by attention can involve qualitative perceptual improvements of attended
stimuli such as enhanced contrast sensitivity (Cameron, Tai, & Carrasco, 2002) or improved
spatial resolution (Yeshurun & Carrasco, 1999). Furthermore, attention improves
performance in detecting or discriminating a target, which are performed faster, more
accurately or both (Posner, 1980; Posner, Snyder, & Davidson, 1980).
Attention can select visual information using one of a combination of the following
strategies: it can select a region of the visual field, which is known as spatial attention,
therefore, the zone selected by spatial attention is called the focus of attention (Shulman,
Remington, & McLean, 1979; Posner, Snyder, and Davidson 1980; Posner 1980; Sagi & Julesz,
1986). Attention can also select a visual attribute, such as color, to focus on objects bearing
such attribute regardless of their location, which is known as feature based attention
(Treisman, 1988; Wolfe, Cave, & Franzel, 1989; Dehaene 1989; Treisman & Sato, 1990). And,
finally, attention can also be directed toward groups of features enclosed within discrete
objects, which is known as object based attention (Duncan, 1993; Vecera & Farah, 1994;
Behrmann, Zemel, & Mozer, 1998; Scholl & Pylyshyn, 1999; Driver, Davis, Russell, Turatto, &
Freeman, 2001).
In the spatial domain, the most obvious way to orient and deploy attention is to look at the
attended location. By doing so, we place the foveal area over the attended object which
benefits from the higher visual acuity at the center of the visual field. This kind of spatial
orienting of attention is known as overt attention. We can also attend to a region of the
visual field, which is different from the foveal area, while keeping fixation elsewhere. This
Introduction
34
form of attention spatial orienting is known as covert attention (Posner 1980; Wright &
Ward, 2008). The differences between these two types of attention orienting were already
acknowledged in the seminal works of Hermann von Helmholtz (Helmholtz, 1867). Overt and
covert orienting of attention are complementary in everyday life (i.e., think while you play a
collective sport as basketball and you pay attention overtly to the ball while you covertly
attend to your team mates in order to hide your next move). The spatial deployment of the
focus of attention seems to be quite flexible, adapting its spatial properties in order to
match the requirements of the task at hand. Several models have been proposed in order to
account its spatial properties. In the next section we will briefly review some of these
models.
c) Models of spatial attention deployment
Several models have been proposed in order to represent the different spatial properties of
the spatial attention deployment over the visual field. Each model elaborates predictions
about the size and the form of the focus of attention, as well as the size and distribution of
enhancing and inhibitory zones. Spatial attention has been considered as a spotlight
(Shulman et al., 1979), lightening with a fixed shape, a part of the visual field and moving
from object to object in order to render them noticeable. A modification of the spotlight
metaphor was later suggested in the gradient model (LaBerge & Brown, 1989), which
introduces a transition zone between the focus of attention and the periphery. In other
models which take another body of evidence into account, spatial attention has been
compared to zoom-lenses which would be adaptable to the size and spatial frequency of the
attended objects (Eriksen & St James, 1986; Shulman & Wilson, 1987). Another account for
explaining the spatial properties of visual attention is represented by the suppressive
annulus (Tombu & Tsotsos, 2008 ; Cutzu & Tsotsos, 2003) derived from the selective tuning
model (Tsotsos et al., 1995) in which a inhibitory zone would surround the facilitation zone
of attention. These different models, derived from different sets of experimental evidences,
seem to be different faces of a same phenomenon, and presumably they actively interact in
everyday vision.
Introduction
35
d) Two ways to activate attention: endogenous and exogenous
As early as in the 19th century, William James, one of the founders of contemporary
psychology, defined two types of attention (James, 1890). On the one hand, we have a type
of attention which is reflexive and involuntary, while on the other hand we have another
type of attention which is voluntary. We now know these two types of attention as
exogenous and endogenous attention (Nakayama & Mackeben, 1989; Cheal & Lyon, 1991;
Hein, Rolke, & Ulrich, 2006; Yeshurun, Montagna, & Carrasco, 2008; Chica & Lupiáñez, 2009).
Exogenous attention corresponds to an automatic orienting response to a spatial location
triggered by abrupt-onset or salient stimuli and is mostly reflexive (i.e., bottom-up) with little
contribution from volitional states (Yantis & Jonides, 1990; Giordano, McElree, & Carrasco,
2009). Endogenous attention, on the other hand, corresponds to a voluntary process
allowing us to monitor information at a given location at will, being triggered by higher level
mechanisms (i.e., top-down) and largely depending on the subject’s expectations and
knowledge (Yantis & Jonides, 1990; Hopfinger, Buonocore, & Mangun, 2000; Giordano et al.,
2009; for reviews on exogenous and endogenous attention see Egeth & Yantis, 1997;
Corbetta and Shulman 2002). Exogenous attention is transient, meaning it rises and decays
quickly if not stabilized by top-down mechanisms, peaking at about 100–120 ms; whereas
endogenous attention is slower, taking around 300 ms to be deployed and it can be
sustained as long as necessary to perform the task (Nakayama & Mackeben, 1989; Müller
and Rabbitt 1989; Cheal & Lyon, 1991; Cheal, Lyon, & Hubbard, 1991; Remington, Johnston,
& Yantis, 1992; Hein et al., 2006; Liu, Stevens, & Carrasco, 2007).
Neural circuits underlying these two forms of spatial orienting of attention are thought to
share some neural mechanisms (Corbetta and Shulman 2002; Wright & Ward, 2008). Some
areas within a dorsal frontoparietal network would be shared by top-down and stimulus-
driven attention (specifically the right frontal eye field and the right intraparietal sulcus),
while the ventral frontal cortex and the temporoparietal juntion would be dedicated to
stimulus-driven orienting mechanisms (Corbetta & Shulman, 2002).
Introduction
36
e) Attention at the neuronal level
As we have seen, the role of visual attention is to select a particular source of visual
information among all the available information. Now, the question is: how is this selection
implemented at the neuronal level? Several studies have revealed that the firing rate of
neurons in several visual areas is actively modulated by attention. Let’s consider a monkey
V4 neuron which is maximally activated by vertical bars (i.e., preferred stimulus, figure 12,
black top line) and poorly activated by horizontal bars (i.e., non-preferred stimulus, figure
12, black bottom line) within its receptive field. When both vertical and horizontal bars are
presented together, the intensity of the cell response is intermediate between the preferred
and the non-preferred stimulus (dotted line). Now, when attention is deployed over the
preferred stimulus while both bars are presented, the response is comparable to the one to
the preferred stimulus alone (figure 12, top gray line). Said otherwise, the cell seems to
ignore the presence of the non-preferred stimulus, thus attention would filter the irrelevant
stimulus. Conversely, if attention is deployed over the non-preferred stimulus, the response
is comparable to the response to the non-preferred stimulus alone; again, attention makes
the cell to ignore the unattended stimulus, said otherwise, it filters non-attended stimuli.
The effects of attention under these conditions are quite clear: the response of the
population is biased towards its normal response to the attended stimulus when it is
presented alone. This behavior has been observed in several areas of the monkey visual
system from V2 to MT and IT (Moran & Desimone, 1985; Miller, Gochin, & Gross, 1993 ; Rolls
& Tovee, 1995; Chelazzi, Miller, Duncan, & Desimone, 1993; Treue & Maunsell, 1996; Luck,
Chelazzi, Hillyard, & Desimone, 1997; Reynolds, Chelazzi, & Desimone, 1999; Rolls,
Aggelopoulos, & Zheng, 2003).
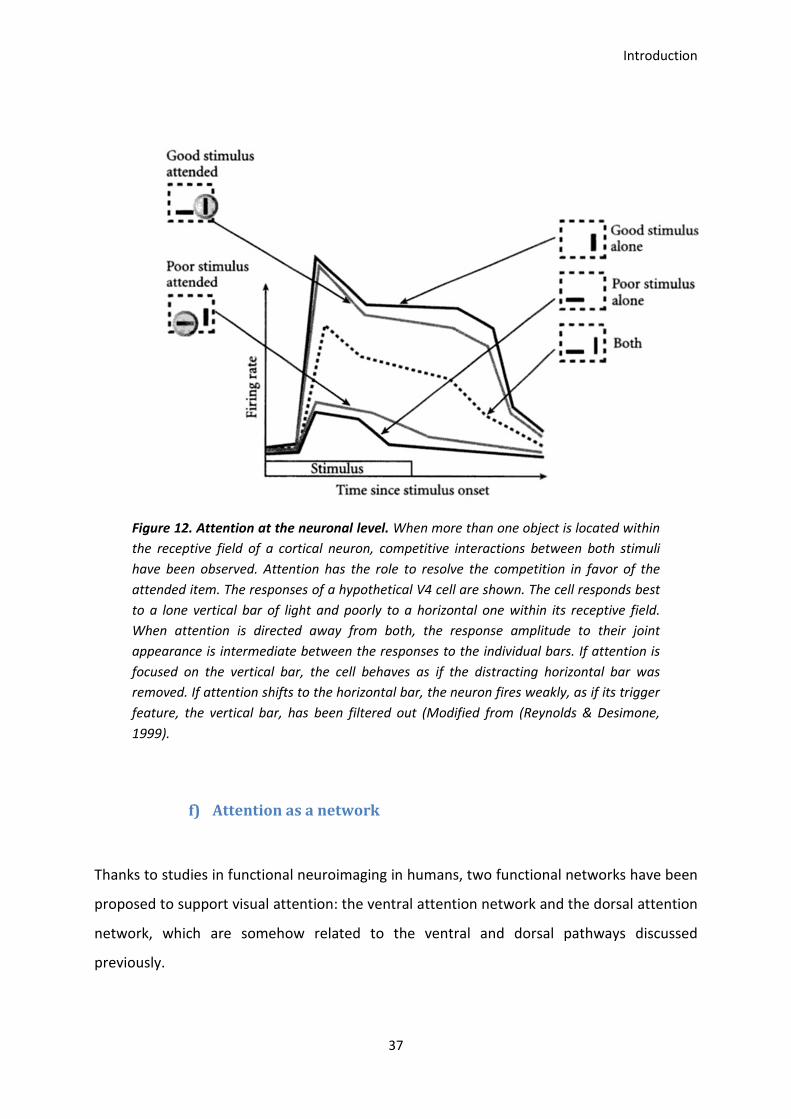
Introduction
37
Figure 12. Attention at the neuronal level. When more than one object is located within
the receptive field of a cortical neuron, competitive interactions between both stimuli
have been observed. Attention has the role to resolve the competition in favor of the
attended item. The responses of a hypothetical V4 cell are shown. The cell responds best
to a lone vertical bar of light and poorly to a horizontal one within its receptive field.
When attention is directed away from both, the response amplitude to their joint
appearance is intermediate between the responses to the individual bars. If attention is
focused on the vertical bar, the cell behaves as if the distracting horizontal bar was
removed. If attention shifts to the horizontal bar, the neuron fires weakly, as if its trigger
feature, the vertical bar, has been filtered out (Modified from (Reynolds & Desimone,
1999).
f) Attention as a network
Thanks to studies in functional neuroimaging in humans, two functional networks have been
proposed to support visual attention: the ventral attention network and the dorsal attention
network, which are somehow related to the ventral and dorsal pathways discussed
previously.
Introduction
38
The ventral attention network detects salient and behaviorally relevant stimuli in the
environment, especially when unattended and is thought to support exogenous attention
(Arrington, Carr, Mayer, & Rao, 2000; Corbetta, Kincade, Ollinger, McAvoy, & Shulman,
2000; Kincade, Abrams, Astafiev, Shulman, & Corbetta, 2005; Vossel, Thiel, & Fink, 2006).
The ventral attention network is lateralized in the right hemisphere and includes regions
such as the temporoparietal junction (TPJ) cortex and ventral frontal cortex (VFC).
The dorsal attention network enables the selection of sensory stimuli based on internal goals
or expectations (Corbetta and Shulman 2002), thus supporting endogenous attention and
links them to appropriate motor responses. Regions included in the dorsal attention network
are the intraparietal sulcus (IPS), superior parietal lobule (SPL), and dorsal frontal cortex
along the pre-central sulcus, near or at the frontal eye field (FEF) (Kastner, Pinsk, De Weerd,
Desimone, & Ungerleider, 1999; Corbetta et al., 2000; Hopfinger et al., 2000).
The damage in the functional interconnectivity between these two networks leads to severe
cognitive deficits, often involving visual awareness, such as spatial neglect (He et al. 2007).
Neglect patients are unaware of large objects, even people, towards their neglected side of
the visual field –which is contralateral to the brain damage (usually after a ventral frontal or
temporoparietal stroke). They may eat from only one side of a dish, write on one side of a
page, make-up only the non-neglected side of their face. The spatial bias of neglect depends
on a physiological imbalance between left and right dorsal parietal cortex (IPS/SPL), which is
caused by structural and physiological abnormalities in the ventral attention network
(Corbetta & Shulman, 2011). Interestingly, neglect patients seem to lose their capacity to
consciously access to the visual contents included in the neglected side of their world.
Interestingly, these patients do not notice anything wrong with their perception; the
neglected area of their visual field is basically gone, without leaving any trace of its previous
existence.
Pathologies such as neglect and phenomena such as inattentional and change blindness
highlight the close relationship between attention and consciousness. In the next section we
shall concentrate on consciousness and evaluate its putative relationships with attention.
Introduction
39
IV. Consciousness
We have briefly reviewed how the visual world is processed by the visual system. We have
seen how the meaning of the visual information is extracted by different specialized
modules in the visual hierarchy. Along the visual processing, visual information can trigger
motor responses (such as in ultra-rapid categorization), it can be selected by attention, and
eventually enter to consciousness. Which are the mechanisms allowing the access of visual
representations into the realm of consciousness? How can we account for the neural
activities supporting awareness?
The study of consciousness is the study of the nature of our existence. Differently from other
studies that are related to objectively measurable phenomena such as physics, the study of
consciousness is aimed to explain the subjective mental world, which involves the scientific
challenge of deal and measure subjective inner states in the mind of subjects. Currently, we
lack a comprehensive view of how these subjective states emerge from brain activity. In this
section we shall briefly review current views regarding this fascinating subject.
a) What is consciousness for?
“…Suppose also that the machines have been carefully programmed and fed with
great quantity of data of an appropriate kind. The manufacturers are claiming
that the devices actually think. Perhaps they are also claiming them to be
genuinely intelligent. Or they may go further and make the suggestion that the
devices actually feel—pain, happiness, compassion, pride, etc.—and they are
aware of, and actually understand what they are doing. Indeed, the claim seems
to be being made that they are conscious”. From ‘The emperor’s new mind’ by
Roger Penrose, 1990.
Introduction
40
From a cognitive point of view, consciousness is surmised to have substantially different
functions from attention. These include summarizing all information that pertains to the
current state of the organism and its environment, making this summary available to
planning and executive areas of the brain; which would lead, among others, to detect
anomalies and errors, decision making, language, inferring the internal state of other
animals, setting long-term goals (van Gaal, de Lange, & Cohen, 2012; Bor & Seth, 2012;
Shanahan, 2010; Edelman, and Tononi 2000; Butler, 2012).
As we stated at the very beginning of this introduction, consciousness would help to set
flexible means of behavior which are pinpointed by the integrative function of
consciousness. Thus, cognitive theories relate consciousness to constructive functions,
allowing the unification and integration of diverse components in a coherent whole
(Bransford, 1979; Baars, 2002; Ward, 2011). This integrative framework would lead to
interaction of specialized modules in the brain in an “on-demand” fashion in order to create
flexible behaviors to resolve the task at hand (Baars, 1990; Baars, 2005; Shanahan, 2010).
This would probably had a fitness advantage for conscious animals over the non-conscious
ones and thus consciousness would has been selected by evolution (Judd, 1910; Fetzer,
2002; Butler, 2008; Shanahan, 2010). However, it is not easy task to demonstrate that
consciousness is an adaptation in the strict sense; that is, that it was originally selected for
because it increased the fitness of its bearers. In fact, this point is still hotly debated and
some authors have considered that consciousness would have no immediate use and it
would thus be a mere epiphenomenon, implying that creatures without any conscious
sensation would be able to behave indistinguishable from conscious ones (see for instance
(Kirk, 1974; Flanagan, 1994; Chalmers, 1996).
My guess is that unless we understand how consciousness actually works at the
neurobiological level we will hardly be aware of the adaptive advantages related to it.
Introduction
41
b) The hard and the easy problem of consciousness
“[A lot of writing] addresses the ‘easy’ problem of consciousness: How does the
brain process environmental stimulation? How does it integrate information?
How do we produce reports on internals states? These are important questions,
but to answer them is not to solve the hard problem: Why is all this processing
accompanied by an experienced inner life?” From “The conscious mind” by
(Chalmers, 1996).
The mystery of consciousness has many faces. Different explanatory levels have been
distinguished and addressed for both philosophic and biological points of views. Here we
introduce the so-called hard and easy problems of consciousness.
The hard problem of consciousness can be summarized as follows: Why do physical
phenomena occurring in the brain give rise to our subjective experience? There seems to be
a dichotomy between physical world (and the laws governing it) and our subjective
experiences, which are summarized by the concept of qualia. The concept of qualia (singular
quale) comes from philosophy and it is referred to the subjective inner conscious experience
in its most fundamental sense. Qualia are related to the conscious feeling associated to any
conscious experience, for instance the redness of red or the warm sound of an oboe, which
are only accessible by direct experience but are largely ineffable by other means. No matter
how hard one tries, it is impossible to communicate the qualia of red—or redness—to a born
blind person, neither we can remotely imagine how does it fell to perceive the world by
using echolocation as dolphins or bats do—however, there are indeed blind subjects capable
to fairly ‘navigate’ by hearing the echo emitted by the surrounding objects (Schenkman &
Nilsson, 2010; Schenkman & Nilsson, 2011; Teng, Puri, & Whitney, 2012).
Several questions about consciousness must be resolved in order to acquire a full
understanding about the relationship between qualia and brain processes. These questions
include, but are not limited to, whether being conscious could be wholly described in
physical terms, invoking emergent material properties from complex neural interactions. In
the case that consciousness could not be explained exclusively by physical events in the
brain, it implies that consciousness would be governed by different laws from those of
Introduction
42
physical systems and require an explanation in a non-physical background, or the discovery
of new physical interactions—such as those proposed by the quantum consciousness theory
(Penrose, 1990; Hameroff, 1998). For philosophers who state that consciousness is
nonphysical in nature (see for example Chalmers, 1996), there remains a question about
what mechanisms (other than physical ones) could support consciousness.
The so-called easy problem, on the other hand, can be enunciated as follows: what are the
brain processes that are correlated with our subjective experience? In this case the problem
of why certain physical phenomena in our brains are accompanied by a subjective
experience is not directly addressed.
While the hard problem of consciousness is difficult (if not impossible) to address
scientifically, the easy problem is a scientifically tractable problem and it can now be
approached using the modern tools of neurobiology. Therefore, we will only concentrate on
the so-called easy problem of consciousness.
c) Is attention necessary for conscious perception?
Intuition tells us that attention would be necessary to be aware of something. Think about
all the errors that we make when we do not pay attention; an overwhelming body of data
have demonstrated that our sensory sensitivity and reaction times are severely impaired
when we are not attending. As discussed above, the compelling phenomena of change
blindness and inattentionnal blindness (Mack & Rock, 1998; Rensink et al., 1997), suggest
that whatever remains outside the spotlight of attention cannot be seen (or if it is vaguely
experienced in some way, at least cannot be later recalled or reported).
However, some scholars argue that consciousness can sometimes occur in total absence of
attention (Koch & Tsuchiya, 2007; Boxtel, Tsuchiya, & Koch, 2010), but it is still highly
debated (see for instance Prinz, 2010). Other authors acknowledge that consciousness can
occur in absence of attention, but in this case all content of consciousness would remain out
of the reach of working memory and would thus be hard to be reported (Lamme, 2003;
Koivisto, Kainulainen, & Revonsuo, 2009). Phenomenologically, the former case of
Introduction
43
attentionless consciousness would be equal to a very vague feeling of “seeing something”.
This kind of consciousness would be close to the philosophical concept of consciousness
called phenomenal consciousness or primary consciousness (Block 1995; Block, 2008), which
would account for rich subjective experience that is hardly reportable and elusive to
memory encoding (note that under this point of view, the richness of perception would not
be an illusion and phenomena such as change blindness would be explained by the failure in
the processes allowing to report the overwhelming richness of such subjective states).
Phenomenal consciousness would be thus preattentive, and it would have no particular limit
on the amount of information held in it.
Access consciousness (or reflective consciousness), on the other hand, refers to a kind of
consciousness which is available for use in high-level cognitive processes such as thinking,
speech, or action planning. Access consciousness is limited in capacity (as attention),
allowing accessing a limited number of representations at a given time (Block, 2008).
Due to the nature of phenomenal consciousness which is information hardly accessed by
other modules allowing overt report such as language and higher cognitive functions as
memory, it is hard to study it in laboratory conditions. Consequently, here we shall only
consider access consciousness, which is always verbally reportable and relies on attention.
d) Is attention sufficient for conscious perception?
The concept of attention has sometimes almost replaced the concept of consciousness, and
the underlying suggestion is that consciousness might be identical to attention or at least not
fundamentally different from it (Posner, 1994; O’Regan & Noë, 2001; Mole, 2008; De Brigard
& Prinz, 2009; Posner, 2012). However, attention and consciousness seems to be dissociable
and the study of attention would not become automatically the study of consciousness.
Attentional selection and enhancing of visual information can take place at levels of
processing that are outside or before consciousness, in other words, we can attend to
objects which are not consciously perceived. For example, an emotional word or image can
draw attention and cause larger responses in the brain even if not consciously perceived
Introduction
44
(Carlson et al. 2012; Carlson et al. 2011). It has been also showed that blindsight patients can
use consciously perceived cues to enhance unconscious processing of visual targets
(Kentridge, Heywood, & Weiskrantz, 1999; Kentridge, Heywood, & Weiskrantz, 2004). When
a target was presented in their blind visual field, blindsighted patients responded faster and
more accurately when it was validly cued by a consciously perceptible arrow pointing to it,
than when it was invalidly cued. In both cases, the patients still claimed that they could not
see the target. Spatial visual attention can enhance invisible stimuli processing in normal
subjects too (Ward and Jackson 2002; Kentridge, Nijboer, & Heywood, 2008; Lu, Cai, Shen,
Zhou, & Han, 2012). It has been also shown that attention is necessary for priming invisible
words (suppressed by a combination of forward and backward masking). In conditions
without attention, the same word fails to elicit an effective priming (Naccache, Blandin, &
Dehaene, 2002). A recent study in functional imaging using binocular suppression has shown
a clear neural dissociation between attention and consciousness in V1 (Watanabe et al.,
2011). While BOLD signal was enhanced by attention for both visible and invisible targets,
visibility itself did not elicit any significant effect on BOLD signal in V1, indicating that
attention can enhance non-conscious neural representations.
e) The neural correlates of visual consciousness
Which are the neurons that pinpoint consciousness? Historically, several brain areas –within
the visual cortex as well as beyond it—have been argued to support visual experience. For
instance, René Descartes believed that the pineal gland was the seat of consciousness and
thought (Descartes, 1649). Today we are more prudent and there are few that would
attribute all conscious functions to a single brain structure. Before reviewing the brain areas
that have been found as correlated with visual conscious experience, we have to distinguish
between the enabling factors and the neural correlates of consciousness proper. While the
neural correlates of consciousness (NCC) are defined as the minimal neuronal mechanisms
that are jointly sufficient for any one specific conscious percept (Koch, 2004), the enabling
factors stand for the brain processes that are needed for any form of consciousness to occur
at all. These factors include maintaining a certain level of vigilance (i.e. while asleep in a
dreamless sleep or in coma no conscious perception is possible). Several areas have been
Introduction
45
identified as enabling factors. Some examples include the mesencephalic reticular formation
(MRF) that controls the level of arousal or wakefulness in animals and when it is damaged
produces stupor or coma (Steriade, Oakson, & Ropert, 1982; Jones, 2003). Another
subcortical area is the locus coeruleus which sends diffuse connections to many brain areas
from thalamus to frontal and visual cortex and regulate some aspects of the sleep-wake
cycle (Luppi et al., 2006; Gottesmann, 2008).
In experiments involving the reversible suppression of the visibility of a stimulus by dichoptic
suppression, several areas of the brain respond selectively to the visual stimulus. Indeed, the
selectivity to conscious perceived stimuli is increased along the visual hierarchy. While about
20% of V1 neurons are activated selectively by consciously perceived stimuli, about 40% of
V4 and MT cells can show selective responses, and the proportion of consciousness selective
neurons can reach about 90% in temporal visual areas in monkeys (Leopold & Logothetis,
1996; Logothetis 1998). Activations in higher visual areas in the human brain, such as the
fusiform face area, can also be tightly correlated with conscious reports, suggesting that the
representations supported in these regions are readily brought to consciousness (Tong et al.
1998). However, non-conscious visual stimulation can also activate these regions (Jiang &
He, 2006), and it is also possible to decode categories in these areas from invisible stimuli
(Sterzer, Haynes, & Rees, 2008). These results suggest that the activity in these areas is not
sufficient for consciousness. All in all we lack a comprehensive view on where in the brain we
find the NCC.
f) Current theories of consciousness
A science that deals with consciousness requires a theory of consciousness that explains
what consciousness is and how it fits with available data. Discussing all current theories of
consciousness goes beyond the scope of this introduction and some remarkable theories
have thus been not included here. Here we will briefly review some of the most influential
theories of consciousness.
Introduction
46
1. The neurobiological theory of consciousness of Crick and
Koch
Crick and Koch outlined a research program for the study of consciousness rather than a
detailed theory. According to them, we should not try to precisely define consciousness at
this stage, because it is impossible, and we should not worry about explaining the hard
problem (such as the existence of qualia); these problems can be left for later. They
proposed that what neuroscientist can and must do is to concentrate on finding the neural
correlates of consciousness which are defined as the smallest set of brain mechanisms
sufficient for some specific phenomenal state (Crick & Koch, 1990; Crick and Koch 2003). In
their theory, essential nodes located in sensory areas are connected to a wider network
represented by high-level, executive areas located in frontal areas of the brain which could
interact at distinctive frequency bands—such as the gamma frequency— (Crick and Koch
1998b; Crick and Koch 1998c; Crick & Koch, 1995; Koch, 2004). The authors suggest the
existence of a subset of anatomically and physiological special types of neurons within the
network that would be necessary to pinpoint consciousness. The importance of the early
works of Crick and Koch was to consolidate the study of consciousness as a valid scientific
endeavor; contrarily to the previous thought standing that consciousness would be a subject
of exclusive philosophical study.
2. The dynamic core and the information integration theory
The dynamic core is a holistic functional cluster involving the recurring neural activity in the
thalamocortical system as a key element which would represent a functional cluster
composed by neuronal groups that interact with each other (Lumer et al., 1997; Edelman &
Tononi, 2000). The spatiotemporal coordination of activity within this cluster would thus
bind the different perceptual elements into coherent objects and further to unified
conscious perceptual states (Edelman, and Tononi 2000). This activity is not identified with
particular types of neurons nor localized in specific brain areas. Rather, different neural
populations can participate in the dynamic core at different times, and it is the integrated
activity of these otherwise unrelated components that would correlate with conscious
Introduction
47
states. In the scope of this theory, conscious information would have two main features: (1)
it is highly integrated (that is, it always appears as a globally unified field of experience) and,
at the same time, (2) it would be highly differentiated (that is, every single conscious state is
different from all possible states). Thus, what counts for the emergence of consciousness
would be how much integrated information is generated by the system (Tononi 2004b), and
the level or deepness of consciousness would be defined by the differentiation of a
particular mental state from the number of different possible states available at one
particular moment (Edelman, and Tononi 2000). Therefore, only integrated information can
access consciousness, if a particular neural group is excluded from the dynamic core, its
activity would not be capable to elicit any conscious sensation. On the other hand, if the
activity of the dynamic does not achieve differentiability from the rest of the system (which
can be accounted by their activity profile) its state would not be differentiable from other
states of the system and it would thus not be informative. This is exemplified by epileptic
seizures (where the subject often loses consciousness) in which the pattern of activity
among vast areas of the brain is highly indistinguishable since different brain areas are highly
synchronized.
3. Recurrent processing theory
In the theory of recurrent processing the crucial factor to the emergence of awareness is the
direction of processing in the visual cortex. As we have previously seen, a first wave of
activity travels from early visual cortex to executive areas. This feedforward sweep would
carry a non-conscious representation of visual information and thus the information cannot
be verbally reported yet, but it would be able to drive rapid, unconscious, reflex-like actions
(Lamme 2000). After the feedforward sweep all areas remain active and two kind of neural
connections come into play. Within each visual area, neurons start to interact through
horizontal connections, generating local recurrent activity. Between lower- and higher-level
areas, recurrent interactions are settled through feedback connections. These types of
interactions establish a resonant processing which would be associated with consciousness.
The emergence of consciousness according this model would be triggered by the exchange
and integration of information among different brain areas through recurrent processing,
binding together different stimulus features. When recurrent processing reaches parietal
Introduction
48
and frontal cortex, the contents of perception would become fully accessible to higher
cognitive functions as memory and would thus become reportable. However, this theory
also considers awareness beyond reportability which would be represented by the recurrent
activity prior to the reaching of the parieto-frontal network (Lamme, 2003; Lamme, 2004).
4. Micro-consciousness theory
Whereas several theories identify consciousness with information integration, the micro-
consciousness theory of consciousness argues that stimuli features, once extracted –that is,
explicitly represented by a neural population—would become consciously accessible in the
form of a micro-consciousness (Zeki & Bartels, 1999; Zeki, 2003; Zeki, 2008). This theory
implies that consciousness is fundamentally non-unified and its neural correlates are
distributed and restricted to the sensory cortex; and the quality of being conscious of a
certain visual feature would only depend in the degree of activation of the cortical area
coding for it (Moutoussis & Zeki, 2002). There would thus be no single unified neural
mechanism of consciousness to be found since the nature of the neural correlated of
consciousness would be fragmented. This theory states that when we are presented with a
complex visual stimulus, each feature of it would emerge independently at different
moments defined by their processing and explicit representation by different neural
populations. This asynchrony would pass unnoticed because it is above the temporal
resolution of our phenomenal experience.
5. The Global Workspace theory of consciousness
The global workspace theory is a simple and elegant cognitive architecture relating
conscious experiences with the interaction of specialized brain modules that would allow to
make the sensory (and inner) information accessible to different modules (Baars, 1990). The
term "global workspace" comes from artificial intelligence, where it refers to a fleeting
memory domain that allows for cooperative problem-solving by large collections of
specialized programs. The global workspace theory therefore assumes that the brain can be
viewed as a group of highly specialized modules which would interact through a functional
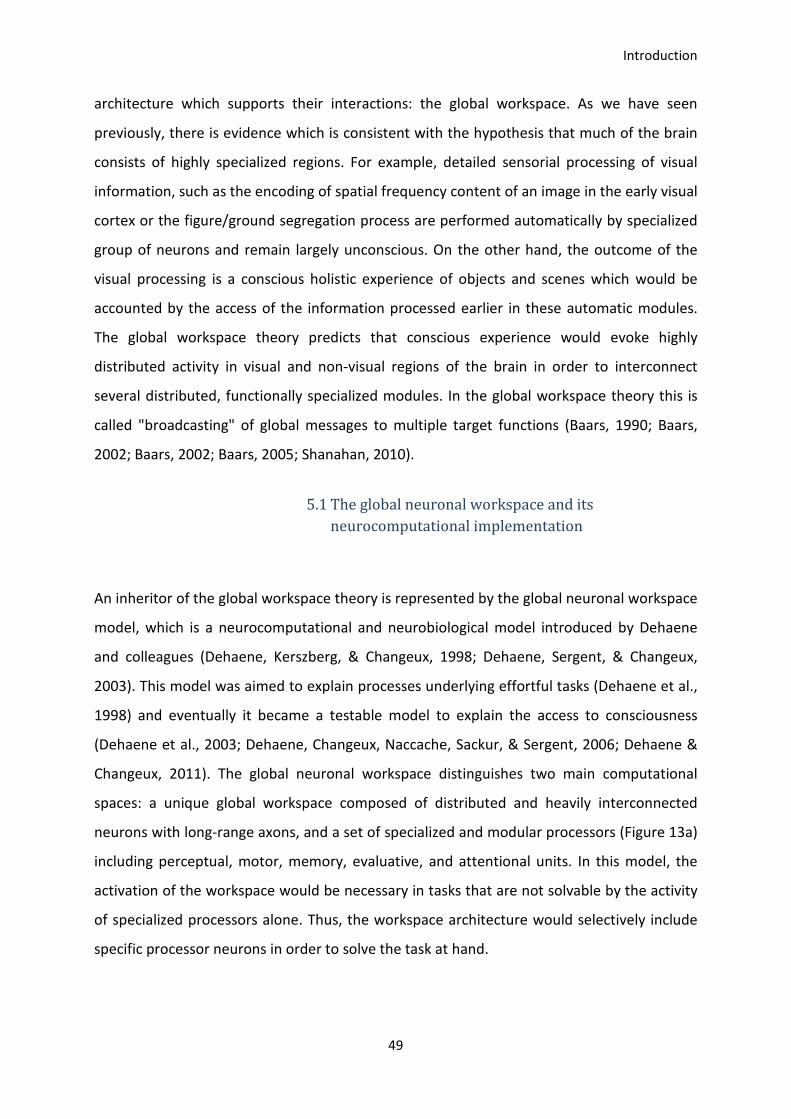
Introduction
49
architecture which supports their interactions: the global workspace. As we have seen
previously, there is evidence which is consistent with the hypothesis that much of the brain
consists of highly specialized regions. For example, detailed sensorial processing of visual
information, such as the encoding of spatial frequency content of an image in the early visual
cortex or the figure/ground segregation process are performed automatically by specialized
group of neurons and remain largely unconscious. On the other hand, the outcome of the
visual processing is a conscious holistic experience of objects and scenes which would be
accounted by the access of the information processed earlier in these automatic modules.
The global workspace theory predicts that conscious experience would evoke highly
distributed activity in visual and non-visual regions of the brain in order to interconnect
several distributed, functionally specialized modules. In the global workspace theory this is
called "broadcasting" of global messages to multiple target functions (Baars, 1990; Baars,
2002; Baars, 2002; Baars, 2005; Shanahan, 2010).
5.1 The global neuronal workspace and its
neurocomputational implementation
An inheritor of the global workspace theory is represented by the global neuronal workspace
model, which is a neurocomputational and neurobiological model introduced by Dehaene
and colleagues (Dehaene, Kerszberg, & Changeux, 1998; Dehaene, Sergent, & Changeux,
2003). This model was aimed to explain processes underlying effortful tasks (Dehaene et al.,
1998) and eventually it became a testable model to explain the access to consciousness
(Dehaene et al., 2003; Dehaene, Changeux, Naccache, Sackur, & Sergent, 2006; Dehaene &
Changeux, 2011). The global neuronal workspace distinguishes two main computational
spaces: a unique global workspace composed of distributed and heavily interconnected
neurons with long-range axons, and a set of specialized and modular processors (Figure 13a)
including perceptual, motor, memory, evaluative, and attentional units. In this model, the
activation of the workspace would be necessary in tasks that are not solvable by the activity
of specialized processors alone. Thus, the workspace architecture would selectively include
specific processor neurons in order to solve the task at hand.
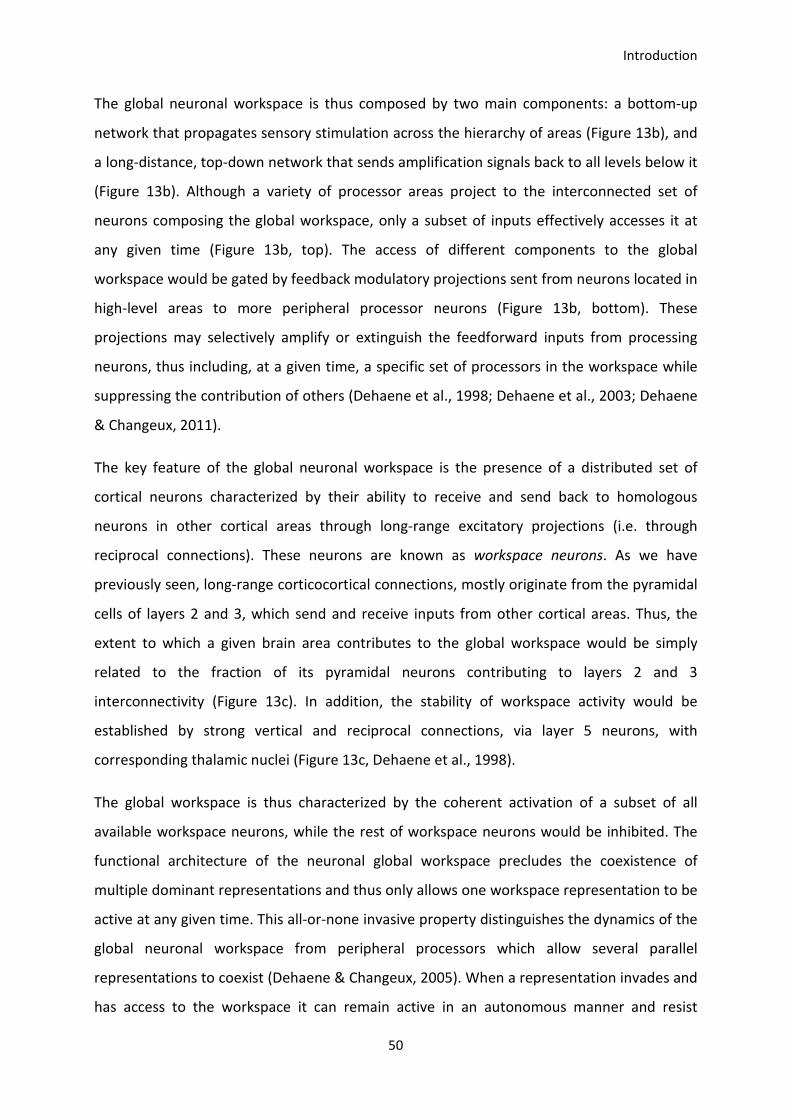
Introduction
50
The global neuronal workspace is thus composed by two main components: a bottom-up
network that propagates sensory stimulation across the hierarchy of areas (Figure 13b), and
a long-distance, top-down network that sends amplification signals back to all levels below it
(Figure 13b). Although a variety of processor areas project to the interconnected set of
neurons composing the global workspace, only a subset of inputs effectively accesses it at
any given time (Figure 13b, top). The access of different components to the global
workspace would be gated by feedback modulatory projections sent from neurons located in
high-level areas to more peripheral processor neurons (Figure 13b, bottom). These
projections may selectively amplify or extinguish the feedforward inputs from processing
neurons, thus including, at a given time, a specific set of processors in the workspace while
suppressing the contribution of others (Dehaene et al., 1998; Dehaene et al., 2003; Dehaene
& Changeux, 2011).
The key feature of the global neuronal workspace is the presence of a distributed set of
cortical neurons characterized by their ability to receive and send back to homologous
neurons in other cortical areas through long-range excitatory projections (i.e. through
reciprocal connections). These neurons are known as workspace neurons. As we have
previously seen, long-range corticocortical connections, mostly originate from the pyramidal
cells of layers 2 and 3, which send and receive inputs from other cortical areas. Thus, the
extent to which a given brain area contributes to the global workspace would be simply
related to the fraction of its pyramidal neurons contributing to layers 2 and 3
interconnectivity (Figure 13c). In addition, the stability of workspace activity would be
established by strong vertical and reciprocal connections, via layer 5 neurons, with
corresponding thalamic nuclei (Figure 13c, Dehaene et al., 1998).
The global workspace is thus characterized by the coherent activation of a subset of all
available workspace neurons, while the rest of workspace neurons would be inhibited. The
functional architecture of the neuronal global workspace precludes the coexistence of
multiple dominant representations and thus only allows one workspace representation to be
active at any given time. This all-or-none invasive property distinguishes the dynamics of the
global neuronal workspace from peripheral processors which allow several parallel
representations to coexist (Dehaene & Changeux, 2005). When a representation invades and
has access to the workspace it can remain active in an autonomous manner and resist
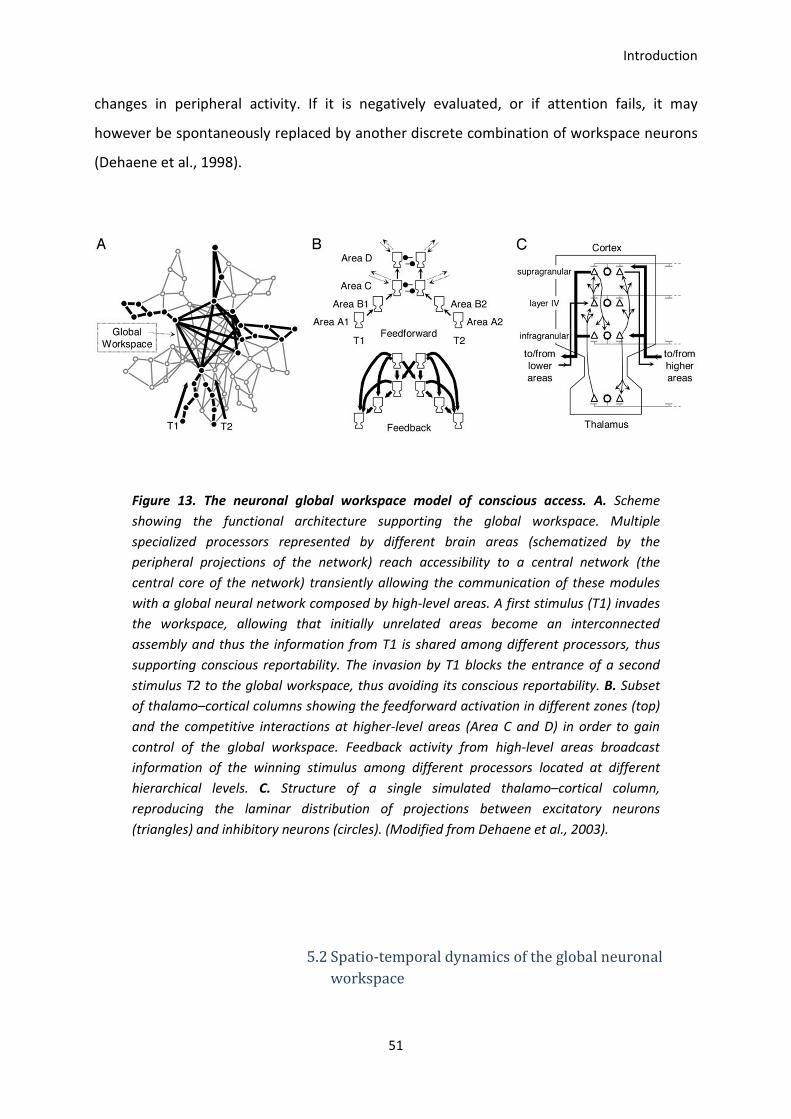
Introduction
51
changes in peripheral activity. If it is negatively evaluated, or if attention fails, it may
however be spontaneously replaced by another discrete combination of workspace neurons
(Dehaene et al., 1998).
Figure 13. The neuronal global workspace model of conscious access. A. Scheme
showing the functional architecture supporting the global workspace. Multiple
specialized processors represented by different brain areas (schematized by the
peripheral projections of the network) reach accessibility to a central network (the
central core of the network) transiently allowing the communication of these modules
with a global neural network composed by high-level areas. A first stimulus (T1) invades
the workspace, allowing that initially unrelated areas become an interconnected
assembly and thus the information from T1 is shared among different processors, thus
supporting conscious reportability. The invasion by T1 blocks the entrance of a second
stimulus T2 to the global workspace, thus avoiding its conscious reportability. B. Subset
of thalamo–cortical columns showing the feedforward activation in different zones (top)
and the competitive interactions at higher-level areas (Area C and D) in order to gain
control of the global workspace. Feedback activity from high-level areas broadcast
information of the winning stimulus among different processors located at different
hierarchical levels. C. Structure of a single simulated thalamo–cortical column,
reproducing the laminar distribution of projections between excitatory neurons
(triangles) and inhibitory neurons (circles). (Modified from Dehaene et al., 2003).
5.2 Spatio-temporal dynamics of the global neuronal
workspace
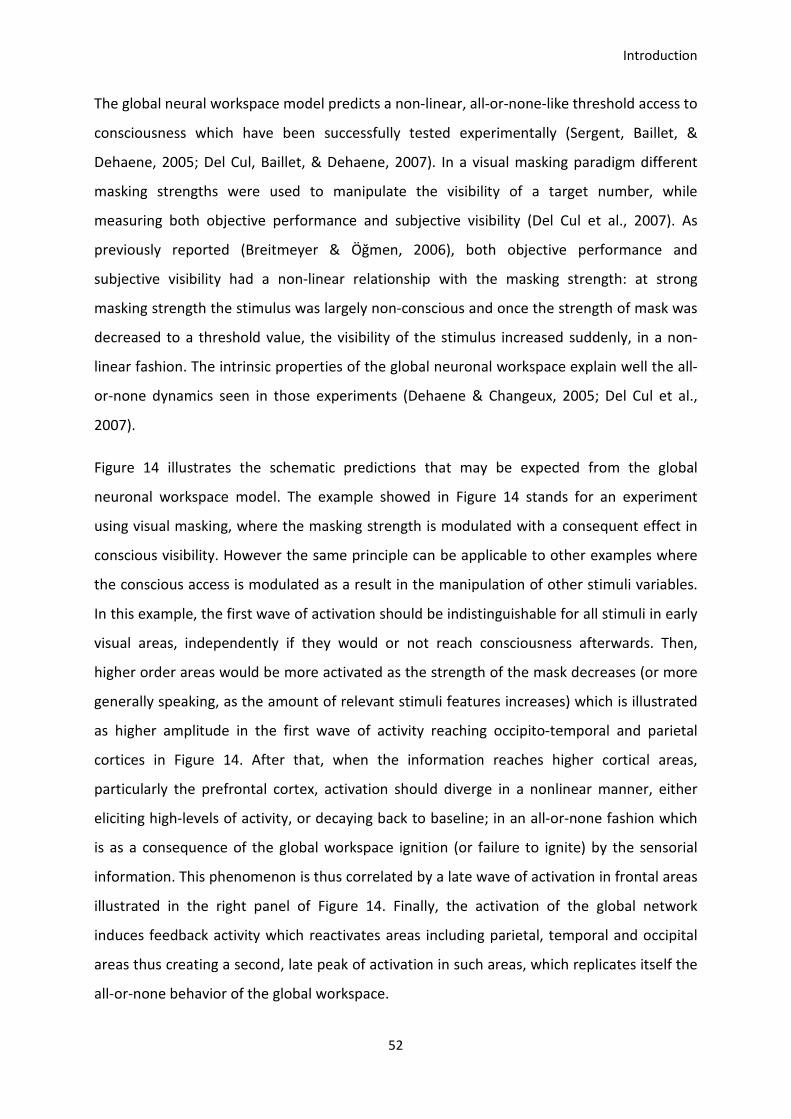
Introduction
52
The global neural workspace model predicts a non-linear, all-or-none-like threshold access to
consciousness which have been successfully tested experimentally (Sergent, Baillet, &
Dehaene, 2005; Del Cul, Baillet, & Dehaene, 2007). In a visual masking paradigm different
masking strengths were used to manipulate the visibility of a target number, while
measuring both objective performance and subjective visibility (Del Cul et al., 2007). As
previously reported (Breitmeyer & Öğmen, 2006), both objective performance and
subjective visibility had a non-linear relationship with the masking strength: at strong
masking strength the stimulus was largely non-conscious and once the strength of mask was
decreased to a threshold value, the visibility of the stimulus increased suddenly, in a non-
linear fashion. The intrinsic properties of the global neuronal workspace explain well the all-
or-none dynamics seen in those experiments (Dehaene & Changeux, 2005; Del Cul et al.,
2007).
Figure 14 illustrates the schematic predictions that may be expected from the global
neuronal workspace model. The example showed in Figure 14 stands for an experiment
using visual masking, where the masking strength is modulated with a consequent effect in
conscious visibility. However the same principle can be applicable to other examples where
the conscious access is modulated as a result in the manipulation of other stimuli variables.
In this example, the first wave of activation should be indistinguishable for all stimuli in early
visual areas, independently if they would or not reach consciousness afterwards. Then,
higher order areas would be more activated as the strength of the mask decreases (or more
generally speaking, as the amount of relevant stimuli features increases) which is illustrated
as higher amplitude in the first wave of activity reaching occipito-temporal and parietal
cortices in Figure 14. After that, when the information reaches higher cortical areas,
particularly the prefrontal cortex, activation should diverge in a nonlinear manner, either
eliciting high-levels of activity, or decaying back to baseline; in an all-or-none fashion which
is as a consequence of the global workspace ignition (or failure to ignite) by the sensorial
information. This phenomenon is thus correlated by a late wave of activation in frontal areas
illustrated in the right panel of Figure 14. Finally, the activation of the global network
induces feedback activity which reactivates areas including parietal, temporal and occipital
areas thus creating a second, late peak of activation in such areas, which replicates itself the
all-or-none behavior of the global workspace.
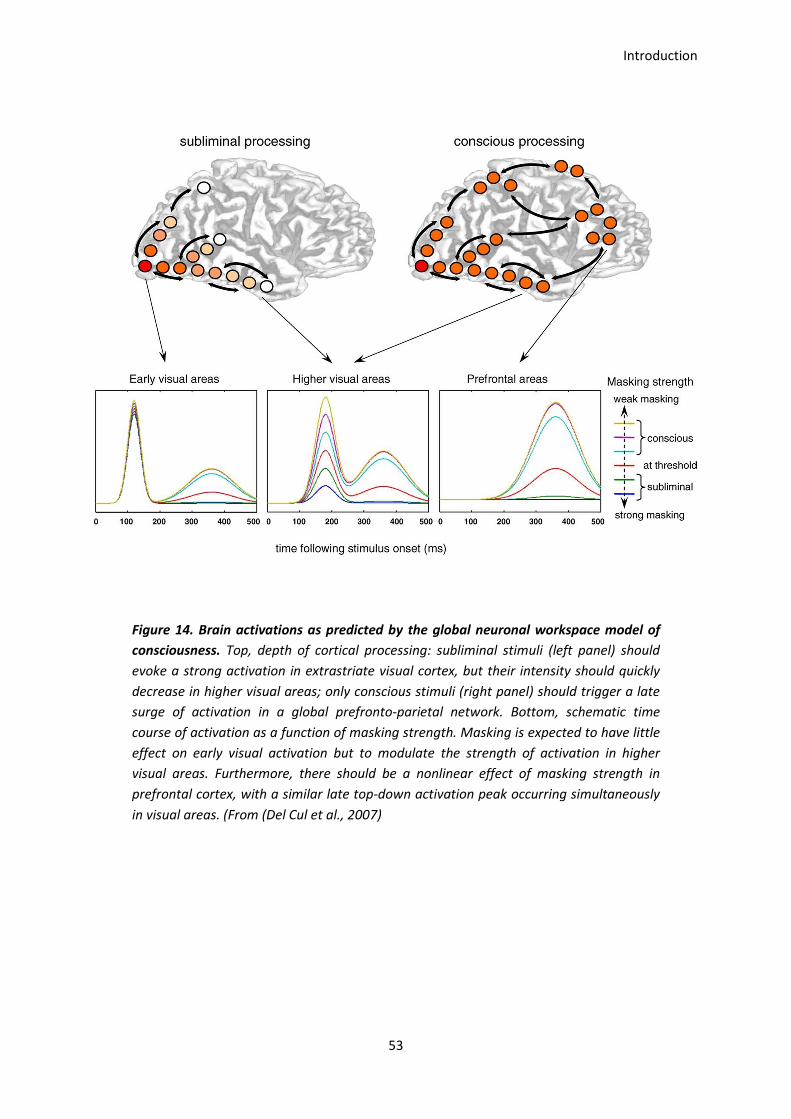
Introduction
53
Figure 14. Brain activations as predicted by the global neuronal workspace model of
consciousness. Top, depth of cortical processing: subliminal stimuli (left panel) should
evoke a strong activation in extrastriate visual cortex, but their intensity should quickly
decrease in higher visual areas; only conscious stimuli (right panel) should trigger a late
surge of activation in a global prefronto-parietal network. Bottom, schematic time
course of activation as a function of masking strength. Masking is expected to have little
effect on early visual activation but to modulate the strength of activation in higher
visual areas. Furthermore, there should be a nonlinear effect of masking strength in
prefrontal cortex, with a similar late top-down activation peak occurring simultaneously
in visual areas. (From (Del Cul et al., 2007)

Introduction
54
The global neuronal workspace has been tested in a variety of cognitive paradigms including
Stroop’s test, attentional blink, visual masking and others experiments involving the
psychological refractory period (Dehaene et al., 1998; Dehaene et al., 2003; Del Cul et al.,
2007; Hesselmann, Naccache, Cohen, & Dehaene, 2012). However it is still unclear whether
this model can account for other paradigms involving conscious access and if it is a valid
model for general conscious access. In the last work presented in this thesis I present
evidence supporting this model in a recognition task performed by monkeys.
Introduction
55
V. Thesis aims
In this thesis we will be focused on the visual system of human and non-human primates and
their large capacity of information extraction from fundamental mechanisms allowing
extracting coarse visual features associated to some semantic values to the emergence of
the neural correlates of conscious recognition.
First we will explore the image features that the visual system can use in order to distinguish
between categories of complex visual stimuli under high temporal constraints. This was done
by studying ultra-rapid categorization, a paradigm allowing exploring the minimal set of
neural processes that allow categorizing semantic categories. In this chapter we will explore
to which extent the global low-level visual features are necessary to perform ultra-rapid
categorization, and test if these features are used similarly by two different primate species:
macaque and humans, in order to infer to which extent they use similar strategies.
Then, we will explore visual attention, which is the door to higher-level cognitive processes
such as consciousness. In this part we will focus on the relationship between the spatial
deployment and temporal dynamics of both endogenous and exogenous attention in
humans and we will ask if the spatial pattern of attention deployment evolves across time, a
question largely deferred by direct analysis. We will tackle this question by introducing a
new method to explore spatial attention in the temporal domain using psychophysics.
We will then focus on high-level representations of objects: the paramount product of the
visual processing. Is there a way to specifically extract such representations? In this part we
will focus on a new stimulation method called SWIFT which allows isolating brain activity
underlying high-level visual representations. In a first work we will focus on the development
of this technique and the test of its capacity in isolating the neural correlates of conscious
object recognition, the interaction of these representations with attention and we will
explore the temporal dynamics of high-level representations.
In a second work involving the innovative SWIFT method we will show how this technique
tracks conscious objects representations which are modulated in an all-or-none fashion
Introduction
56
under binocular rivalry and we study the nature of brain activity underlying conscious
representations.
In the final part, two ongoing studies will be presented. The aim of these studies is to couple
the SWIFT technique with intracranial recordings—a unique technique that allows obtaining
both high temporal and high spatial resolution measures of brain activity—in order to
address the following question: where and when do conscious representations emerge? The
first study involves intracranial recordings in epileptic patients and the second intracranial
recordings in macaque monkey.
The relationship among these works is represented in Figure 15. A main axis of research is
aimed to decipher the nature of the neural representations used in different sense-
extraction processes at different levels of the visual system. This axis regroups four different
works dealing with different cognitive phenomena from ultra-rapid categorization to
conscious object recognition. Two more works explore parallel questions which were
important in order to gain a deeper insight into the main problem of how does the brain
extract the sense from the visual world. The first parallel study was aimed to visual attention
as a cornerstone in the access of visual representations to consciousness. In a second work
we thus examined the following problem: What are the spatiotemporal dynamics of visual
attention? After studying how the shape of the doors of perception is modulated across
time, I was interested in seeing what was behind these doors, and thus in the third work I
return to my original quest trying to answer the following question: can we isolate the
neural correlates of high-level representations? In this work we developed a new method in
order to isolate the neural correlates of conscious object recognition. This method allowed
extracting neural activities specifically representing the conscious recognition of natural
images. Later on we were confronted with the question: can we isolate the neural correlates
of visual consciousness under binocular rivalry using the SWIFT technique? This parallel
question was tested in the fourth work. In this work we used the binocular rivalry paradigm
in order to manipulate visual conscious representations. We thus measured the evoked
responses under conscious and non-conscious states under binocular rivalry using the SWIFT
technique. The final two works are aimed to gain insight into the following question: where
and when are the neural correlates of conscious object recognition generated in the brain?
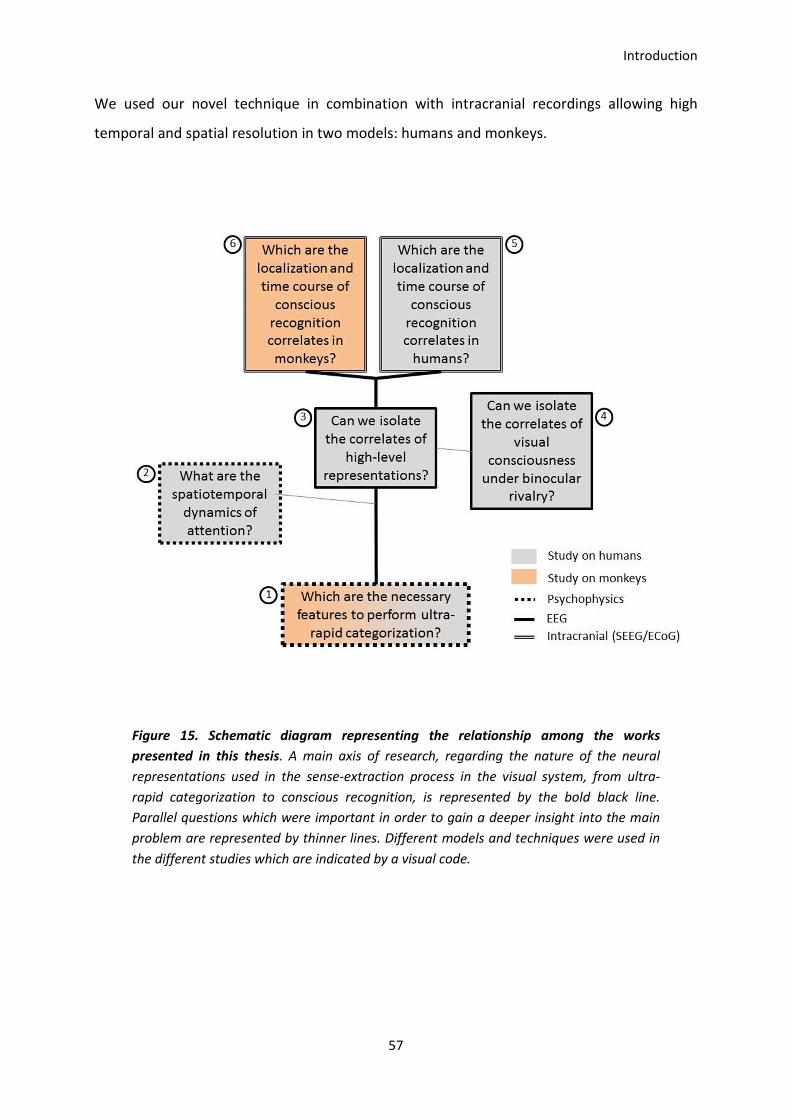
Introduction
57
We used our novel technique in combination with intracranial recordings allowing high
temporal and spatial resolution in two models: humans and monkeys.
Figure 15. Schematic diagram representing the relationship among the works
presented in this thesis. A main axis of research, regarding the nature of the neural
representations used in the sense-extraction process in the visual system, from ultra-
rapid categorization to conscious recognition, is represented by the bold black line.
Parallel questions which were important in order to gain a deeper insight into the main
problem are represented by thinner lines. Different models and techniques were used in
the different studies which are indicated by a visual code.
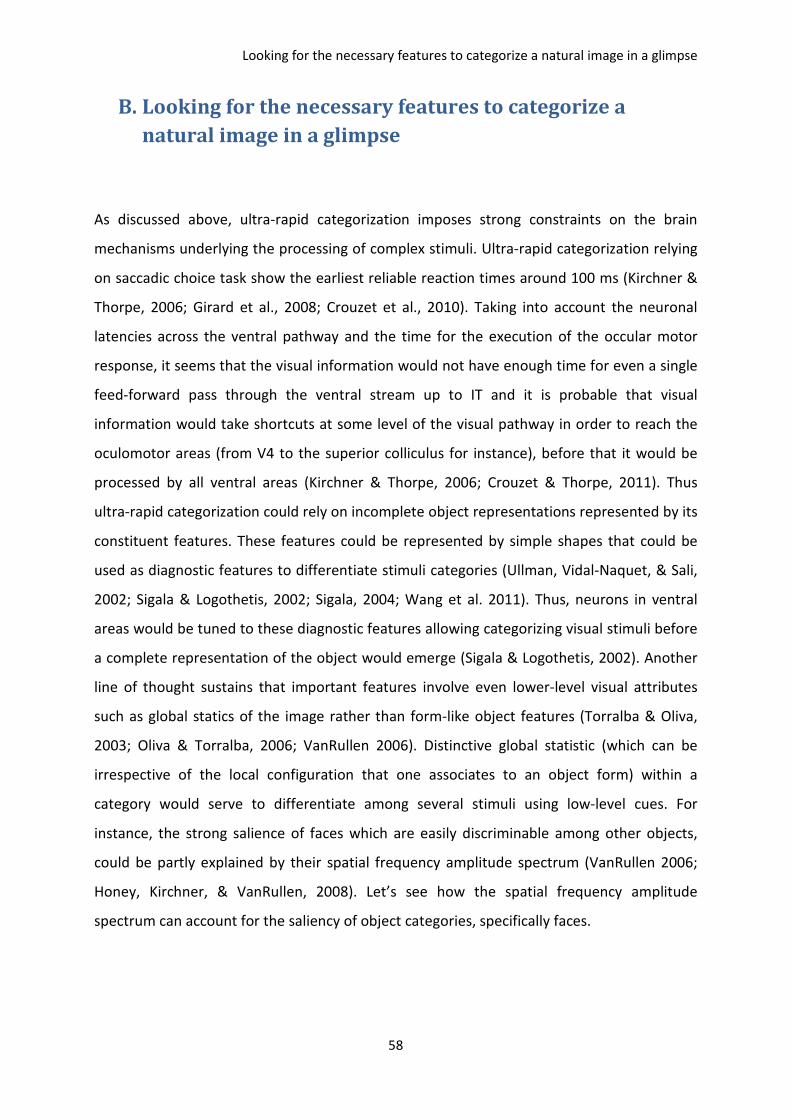
Looking for the necessary features to categorize a natural image in a glimpse
58
B. Looking for the necessary features to categorize a
natural image in a glimpse
As discussed above, ultra-rapid categorization imposes strong constraints on the brain
mechanisms underlying the processing of complex stimuli. Ultra-rapid categorization relying
on saccadic choice task show the earliest reliable reaction times around 100 ms (Kirchner &
Thorpe, 2006; Girard et al., 2008; Crouzet et al., 2010). Taking into account the neuronal
latencies across the ventral pathway and the time for the execution of the occular motor
response, it seems that the visual information would not have enough time for even a single
feed-forward pass through the ventral stream up to IT and it is probable that visual
information would take shortcuts at some level of the visual pathway in order to reach the
oculomotor areas (from V4 to the superior colliculus for instance), before that it would be
processed by all ventral areas (Kirchner & Thorpe, 2006; Crouzet & Thorpe, 2011). Thus
ultra-rapid categorization could rely on incomplete object representations represented by its
constituent features. These features could be represented by simple shapes that could be
used as diagnostic features to differentiate stimuli categories (Ullman, Vidal-Naquet, & Sali,
2002; Sigala & Logothetis, 2002; Sigala, 2004; Wang et al. 2011). Thus, neurons in ventral
areas would be tuned to these diagnostic features allowing categorizing visual stimuli before
a complete representation of the object would emerge (Sigala & Logothetis, 2002). Another
line of thought sustains that important features involve even lower-level visual attributes
such as global statics of the image rather than form-like object features (Torralba & Oliva,
2003; Oliva & Torralba, 2006; VanRullen 2006). Distinctive global statistic (which can be
irrespective of the local configuration that one associates to an object form) within a
category would serve to differentiate among several stimuli using low-level cues. For
instance, the strong salience of faces which are easily discriminable among other objects,
could be partly explained by their spatial frequency amplitude spectrum (VanRullen 2006;
Honey, Kirchner, & VanRullen, 2008). Let’s see how the spatial frequency amplitude
spectrum can account for the saliency of object categories, specifically faces.
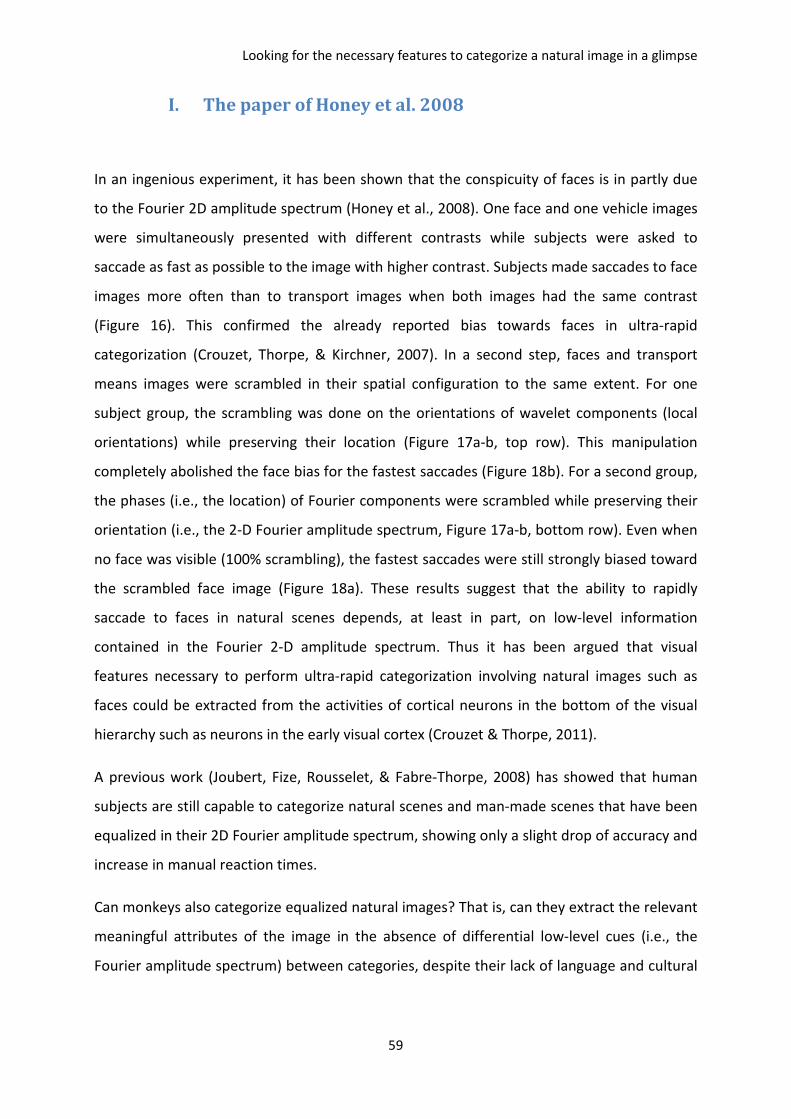
Looking for the necessary features to categorize a natural image in a glimpse
59
I. The paper of Honey et al. 2008
In an ingenious experiment, it has been shown that the conspicuity of faces is in partly due
to the Fourier 2D amplitude spectrum (Honey et al., 2008). One face and one vehicle images
were simultaneously presented with different contrasts while subjects were asked to
saccade as fast as possible to the image with higher contrast. Subjects made saccades to face
images more often than to transport images when both images had the same contrast
(Figure 16). This confirmed the already reported bias towards faces in ultra-rapid
categorization (Crouzet, Thorpe, & Kirchner, 2007). In a second step, faces and transport
means images were scrambled in their spatial configuration to the same extent. For one
subject group, the scrambling was done on the orientations of wavelet components (local
orientations) while preserving their location (Figure 17a-b, top row). This manipulation
completely abolished the face bias for the fastest saccades (Figure 18b). For a second group,
the phases (i.e., the location) of Fourier components were scrambled while preserving their
orientation (i.e., the 2-D Fourier amplitude spectrum, Figure 17a-b, bottom row). Even when
no face was visible (100% scrambling), the fastest saccades were still strongly biased toward
the scrambled face image (Figure 18a). These results suggest that the ability to rapidly
saccade to faces in natural scenes depends, at least in part, on low-level information
contained in the Fourier 2-D amplitude spectrum. Thus it has been argued that visual
features necessary to perform ultra-rapid categorization involving natural images such as
faces could be extracted from the activities of cortical neurons in the bottom of the visual
hierarchy such as neurons in the early visual cortex (Crouzet & Thorpe, 2011).
A previous work (Joubert, Fize, Rousselet, & Fabre-Thorpe, 2008) has showed that human
subjects are still capable to categorize natural scenes and man-made scenes that have been
equalized in their 2D Fourier amplitude spectrum, showing only a slight drop of accuracy and
increase in manual reaction times.
Can monkeys also categorize equalized natural images? That is, can they extract the relevant
meaningful attributes of the image in the absence of differential low-level cues (i.e., the
Fourier amplitude spectrum) between categories, despite their lack of language and cultural
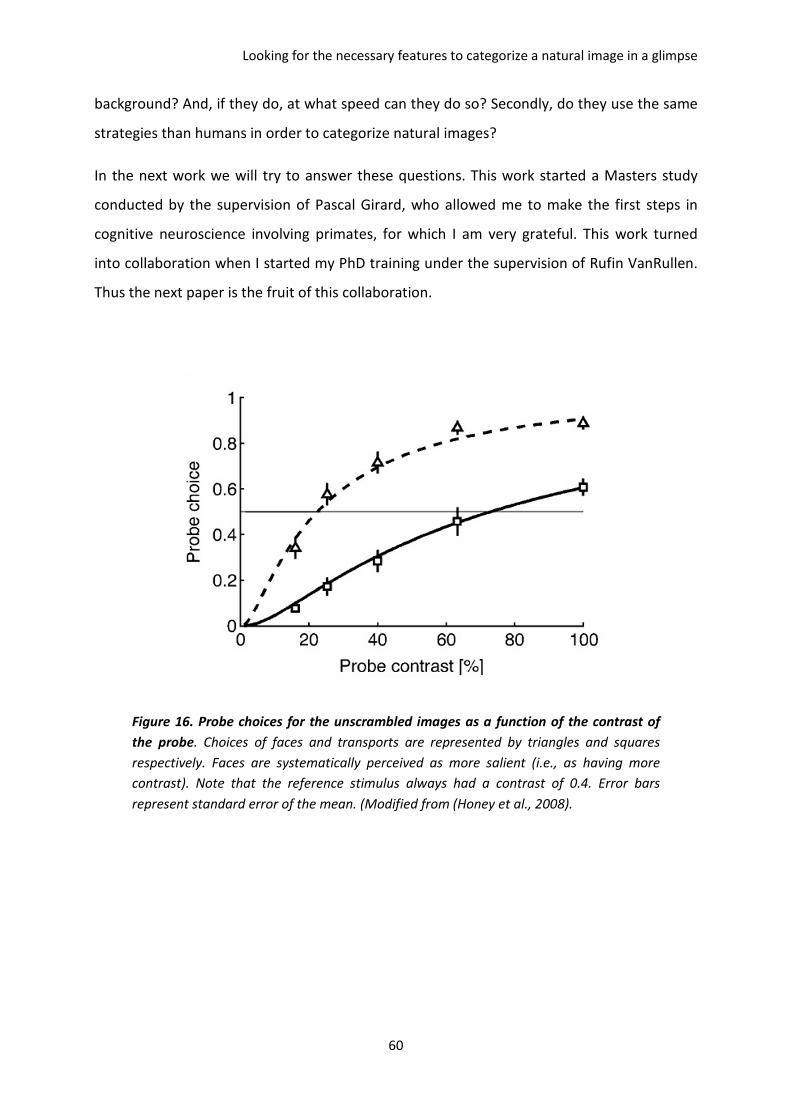
Looking for the necessary features to categorize a natural image in a glimpse
60
background? And, if they do, at what speed can they do so? Secondly, do they use the same
strategies than humans in order to categorize natural images?
In the next work we will try to answer these questions. This work started a Masters study
conducted by the supervision of Pascal Girard, who allowed me to make the first steps in
cognitive neuroscience involving primates, for which I am very grateful. This work turned
into collaboration when I started my PhD training under the supervision of Rufin VanRullen.
Thus the next paper is the fruit of this collaboration.
Figure 16. Probe choices for the unscrambled images as a function of the contrast of
the probe. Choices of faces and transports are represented by triangles and squares
respectively. Faces are systematically perceived as more salient (i.e., as having more
contrast). Note that the reference stimulus always had a contrast of 0.4. Error bars
represent standard error of the mean. (Modified from (Honey et al., 2008).
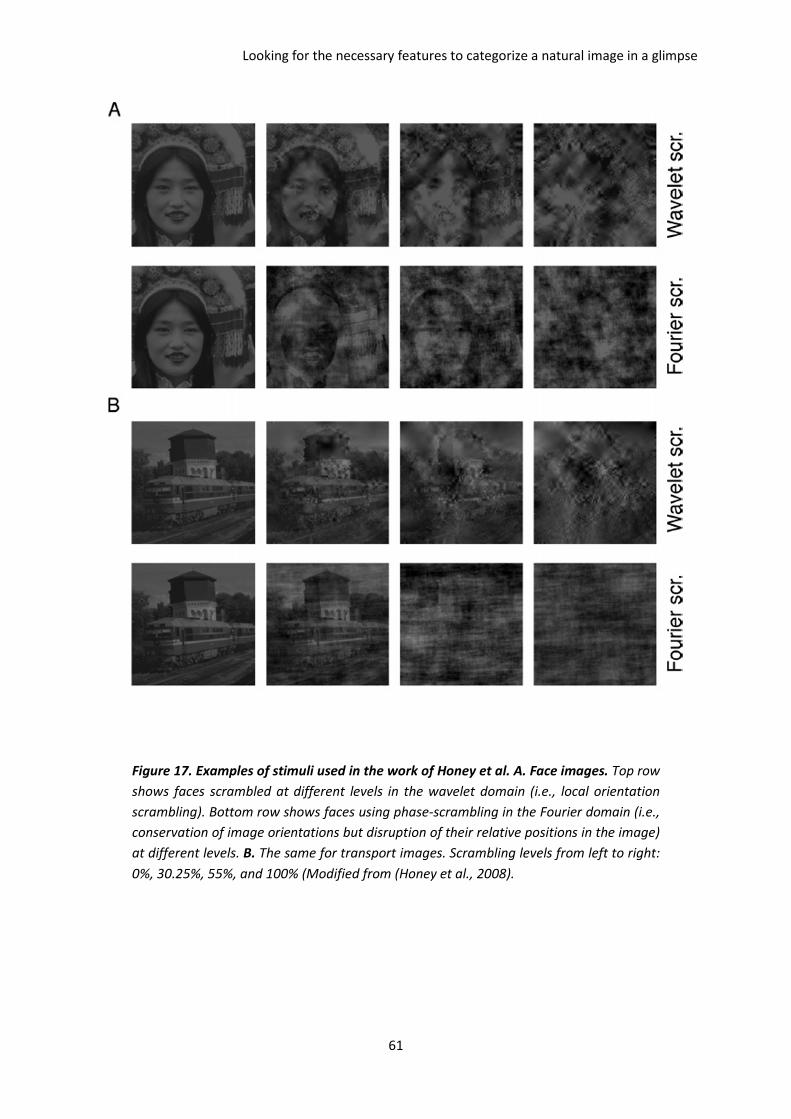
Looking for the necessary features to categorize a natural image in a glimpse
61
Figure 17. Examples of stimuli used in the work of Honey et al. A. Face images. Top row
shows faces scrambled at different levels in the wavelet domain (i.e., local orientation
scrambling). Bottom row shows faces using phase-scrambling in the Fourier domain (i.e.,
conservation of image orientations but disruption of their relative positions in the image)
at different levels. B. The same for transport images. Scrambling levels from left to right:
0%, 30.25%, 55%, and 100% (Modified from (Honey et al., 2008).
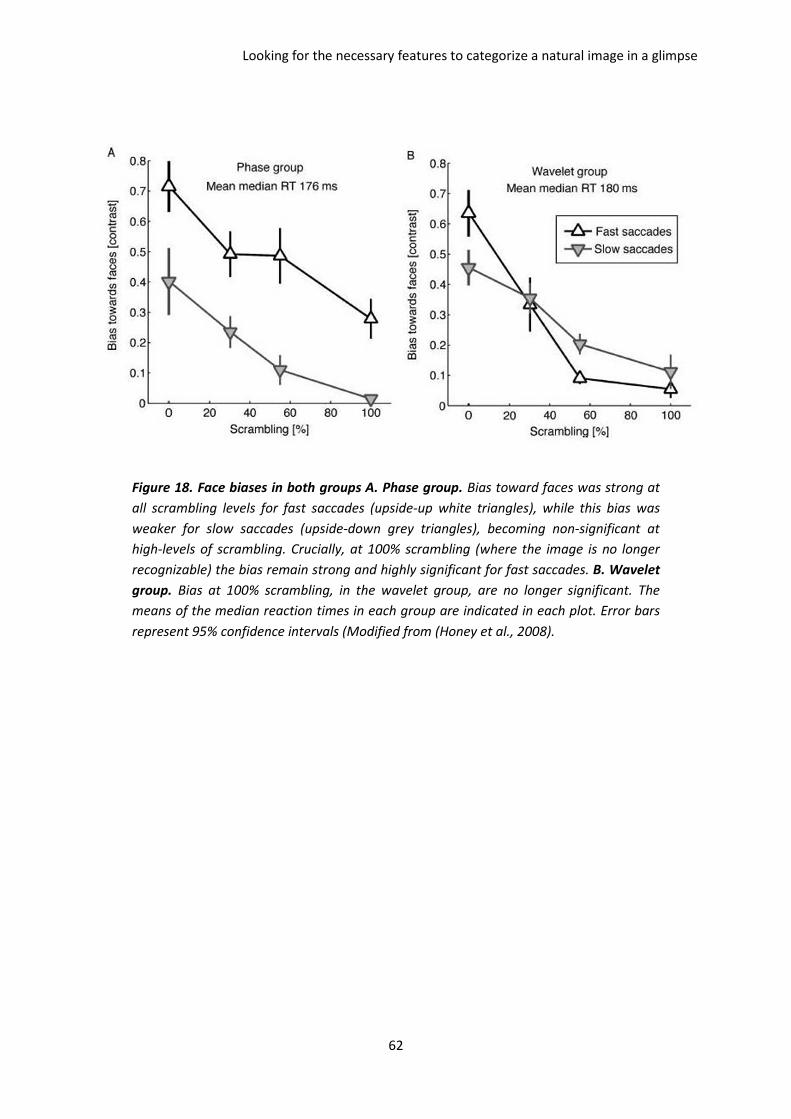
Looking for the necessary features to categorize a natural image in a glimpse
62
Figure 18. Face biases in both groups A. Phase group. Bias toward faces was strong at
all scrambling levels for fast saccades (upside-up white triangles), while this bias was
weaker for slow saccades (upside-down grey triangles), becoming non-significant at
high-levels of scrambling. Crucially, at 100% scrambling (where the image is no longer
recognizable) the bias remain strong and highly significant for fast saccades. B. Wavelet
group. Bias at 100% scrambling, in the wavelet group, are no longer significant. The
means of the median reaction times in each group are indicated in each plot. Error bars
represent 95% confidence intervals (Modified from (Honey et al., 2008).

Looking for the necessary features to categorize a natural image in a glimpse
63
II. PAPER 1. Girard and Koenig-Robert, PLoS One, 2011.
Ultra-Rapid Categorization of Fourier-SpectrumEqualized Natural Images: Macaques and HumansPerform SimilarlyPascal Girard1,2,3*, Roger Koenig-Robert1,2
1 Universite de Toulouse, UPS, Centre de Recherche Cerveau et Cognition (CerCo), Toulouse, France, 2 Centre National de la Recherche Scientifique (CNRS), CerCo,
Toulouse, France, 3 Institut National de la Sante et de la Recherche Medicale (INSERM), Toulouse, France
Abstract
Background: Comparative studies of cognitive processes find similarities between humans and apes but also monkeys.Even high-level processes, like the ability to categorize classes of object from any natural scene under ultra-rapid timeconstraints, seem to be present in rhesus macaque monkeys (despite a smaller brain and the lack of language and a culturalbackground). An interesting and still open question concerns the degree to which the same images are treated with thesame efficacy by humans and monkeys when a low level cue, the spatial frequency content, is controlled.
Methodology/Principal Findings: We used a set of natural images equalized in Fourier spectrum and asked whether it isstill possible to categorize them as containing an animal and at what speed. One rhesus macaque monkey performed aforced-choice saccadic task with a good accuracy (67.5% and 76% for new and familiar images respectively) althoughperformance was lower than with non-equalized images. Importantly, the minimum reaction time was still very fast(100 ms). We compared the performances of human subjects with the same setup and the same set of (new) images.Overall mean performance of humans was also lower than with original images (64% correct) but the minimum reactiontime was still short (140 ms).
Conclusion: Performances on individual images (% correct but not reaction times) for both humans and the monkey weresignificantly correlated suggesting that both species use similar features to perform the task. A similar advantage for full-face images was seen for both species. The results also suggest that local low spatial frequency information could beimportant, a finding that fits the theory that fast categorization relies on a rapid feedforward magnocellular signal.
Citation: Girard P, Koenig-Robert R (2011) Ultra-Rapid Categorization of Fourier-Spectrum Equalized Natural Images: Macaques and Humans PerformSimilarly. PLoS ONE 6(2): e16453. doi:10.1371/journal.pone.0016453
Editor: Gonzalo de Polavieja, Cajal Institute, Consejo Superior de Investigaciones Cientıficas, Spain
Received October 25, 2010; Accepted December 16, 2010; Published February 4, 2011
Copyright: � 2011 Girard, Koenig-Robert. This is an open-access article distributed under the terms of the Creative Commons Attribution License, which permitsunrestricted use, distribution, and reproduction in any medium, provided the original author and source are credited.
Funding: The work was funded by Centre National de la Recherche Scientifique. The funders had no role in study design, data collection and analysis, decision topublish, or preparation of the manuscript.
Competing Interests: The authors have declared that no competing interests exist.
* E-mail: [email protected]
Introduction
The macaque monkey provides one of the closest animal models
for studies of the mechanisms of human brain function [1]
including cognitive processes such as visual categorization. Recent
studies have revealed that monkeys can categorize natural scenes
very efficiently (review in [2]). They have shown that Rhesus
macaque monkeys are as accurate as humans in categorization
tasks involving large sets of images [3–5]. Furthermore, these
studies also revealed that the categorization can be extremely fast,
with behavioural responses reaching a minimum of 100 ms in a
forced-choice saccadic task [4]. It is important to stress that such
values place severe constraints on the processing involved in such
elaborate cognitive tasks. In particular, it is well established that
selectivity to complex stimuli is present in the inferotemporal
cortex of the macaque (for a recent review, see [6] but neuronal
latencies are such that little processing time is available between
stimulus onset and a motor output at 100 ms [7–9].
One relatively simple hypothesis can be put forward to explain
these extremely fast reaction times in cognitive tasks: subjects
could perform the categorization on the basis of low-level
attributes of the images, putatively processed in lower order areas
with faster neuronal responses. Such a hypothesis is supported by
the work of Oliva and Torralba who have shown that the gist of a
natural scene can be grasped on the basis of the spatial frequency
content of the image [10]. In the same vein, in humans, fast
saccades are still biased toward images of faces in which phase
components are randomized and thus must presumably depend on
the 2D amplitude spectrum of the images [11]. Hence, in a
categorization task, one cannot formally exclude the possibility
that images belonging to one category (animal targets for instance)
have a spectral content different from that of images of other
categories. This is an important issue since former studies have
shown that monkeys can use low-level cues that are unrelated to a
category per se, for instance a colour patch, to classify stimuli [12].
One solution to avoid a low-level response bias toward one
category consists in normalizing all the images of the study in term
of mean luminance and RMS contrast and equalizing them in
spectral energy. A recent study [13] showed that human subjects
are still able to categorize natural scenes and man-made scenes
PLoS ONE | www.plosone.org 1 February 2011 | Volume 6 | Issue 2 | e16453
that have been equalized by giving them the same averaged power
spectrum. The main consequences of the equalization process
were a slight drop of accuracy and an increase in manual reaction
time. Our first aim was to determine whether monkeys can also
categorize equalized images and at what speed. In the present
study, we successfully trained one rhesus macaque monkey to
perform a forced-choice saccadic categorization task of equalized
images of animals in natural scenes.
Our second aim was to compare the performance of the
monkey with that of human subjects with the same set of equalized
images. When tested in the same conditions and with the same
images, monkeys are somewhat less accurate but faster than
human in a manual go-nogo categorization task of animals in
naturalistic scenes [14]. Recent work has emphasised the striking
similarity between the cortical representation of categories in both
species of primates using passive presentation of numerous natural
stimuli [15,16]. Multidimensional analyses of fMRI in humans and
neuronal responses in macaques showed that inferotemporal
cortex contains separate representations for animate and inani-
mate objects in which subcategories like face and bodies are
distinguishable. Under the methodological constraint of equalized
images, we further explored whether monkeys and humans use the
same strategies to categorize the same images in the demanding
force-choice saccadic task. We focused on several important
characteristics of the images such as the angle of view with which
the faces were displayed. Humans are readily able to categorize
many different species as animals, even odd-looking ones such as
ant-eaters or armadillos. Because humans have an obvious cultural
advantage, we examined the similarity of categorization across
various types of animals. Both species achieved fast reaction times
and have a comparable overall accuracy. They also had a similar
accuracy on individual images and gave precedence to full-face
and close-up views of the faces of the animal targets.
The last question was related to the theoretical possibility that
fast categorization could rely on the quantity of relevant
information contained in the low spatial frequencies. Authors
have postulated that low spatial frequencies could allow building
up a quick hypothesis about the content of the image [17] to help
recognition or categorization. In the forced-choice saccadic task,
there is little time to elaborate a full description of the image and
efficiency could rely on the use of low spatial frequencies. Since
images were equalized and the phase was not disrupted, they had
all the same global frequency content. However, if the target in the
image was more salient because of the combination of local low
spatial frequencies, it should have been more easily categorized in
the saccadic task, considering the hypothesis of Bar. We
investigated the potential role of low spatial frequencies in
humans, in a rating psychophysical task.
Methods
Ethic statementAll experiments on human subjects were approved by the local
ethical committee ‘Comite Consultatif de Protection des Personnes
dans la Recherche Biomedicale Toulouse II’ (permit Nu ‘Avis Nu2-
03-34/Avis Nu2’). All subjects gave informed written consent to
participate in the experiment.
All experiments on the monkey subject were in conformity with
the ethical rules of the EEC (EEC, Directive No. 86–609,
November 24, 1986). All procedures were in accordance with
the Weatherall report, ‘The use of non-human primates in
research’ and were fully approved by the local ethical committee
named ‘comite regional d’ethique pour l’experimentation animale
de Midi Pyrenees (permit Nu MP/04/04/01/05). The surgical
procedures necessary for head fixation are described in [4]. No
extra surgical procedure was necessary at any time during the
present experiment. The general health status of the animal could
be monitored every day by competent and authorized personal.
The animal was paired-housed during the whole duration of the
experiment.
Behavioural taskOne female rhesus macaque monkey (Macaca mulatta, age: 13
years, weight: 3 kg) was used in this study. The animal was already
expert in the categorization of images by means of saccadic eye
movements (monkey M1 in [4]). We used the same behavioural
task as in the former study but with a new set of images. The
animal sat in front of a screen (Iiyama vision masterpro 512,
75 Hz frame-rate) with the head immobilized (see [4]). Every trial
required first the monkey to fixate a central dot (0.15u, 300 to
450 ms fixation period). A gap period with a blank screen (200 ms)
followed the fixation dot, then 2 pictures appeared simultaneously
(centered on the horizontal meridian at 5 degrees eccentricity, one
in each hemifield) with a presentation duration of 400 ms. One
image contained an animal (‘‘target’’) and the other did not
(‘‘distractor’’). As soon as the pictures appeared, the monkey was
allowed to make a saccade onto the target. Eye movements were
monitored by an ISCAN camera (120 Hz). A drop of water was
given after each correct trial; errors were indicated by a low white-
noise sound and sanctioned by a slightly prolonged inter-trial
delay. We kept careful records of the weight of the water-deprived
monkey and gave extra water if needed.
Nine human subjects (3 male and 6 female; mean age 2664
years) were involved in the same categorization task as the monkey
in the same experimental setup and room. They were instructed to
make a saccade to the picture that contained an animal. The same
CORTEX (NIMH CORTEX) program, in a DOS operating
system, was used to monitor the behaviour of both the humans
and the monkey. The human subjects sat in front of the same
screen as the animal, at the same distance (57 cm); the monkey
experiments have been terminated 6 months before and the
experimental setup cleaned. Human subjects had their head
stabilized by a chin and front device. Their eye movements were
monitored with the same camera and software as the monkey. On
each correct trial, the subjects could hear the sound of the monkey
reward system. All subjects gave informed written consent to
participate in the experiment.
StimuliAll images were 8-bit BMP gray level pictures of natural scenes
(2436356 pixels, 567 degrees of visual angle). About half were
taken from the Corel Database and the other half were taken from
internet searches in order to display a larger variety of animal
species in the targets (see Table S1) and to have a large number of
distractors displaying salient objects. All images in the study were
first equalized in luminance (mean grey value = 128) and in RMS
contrast (standard deviation of 20.4). In a second step, they were
equalized in spectral energy. Equalization was performed by the
following operation: we computed the mean power spectrum of
the whole set of images (targets+distractors). Then, we applied the
mean power spectrum to each image while keeping the original
phases [18]. Examples of images before and after the equalization
process can be seen in figure 1. The background of the monitor
was set to a uniform gray (luminance 14 Cd/m2).
In each daily session, the monkey saw 50 pairs of images, 10 of
which were composed of completely new images while the
remaining ones were familiar. All pairs were displayed in a
randomized order and appeared several times in the session. New
Categorization of Equalized Natural Images
PLoS ONE | www.plosone.org 2 February 2011 | Volume 6 | Issue 2 | e16453
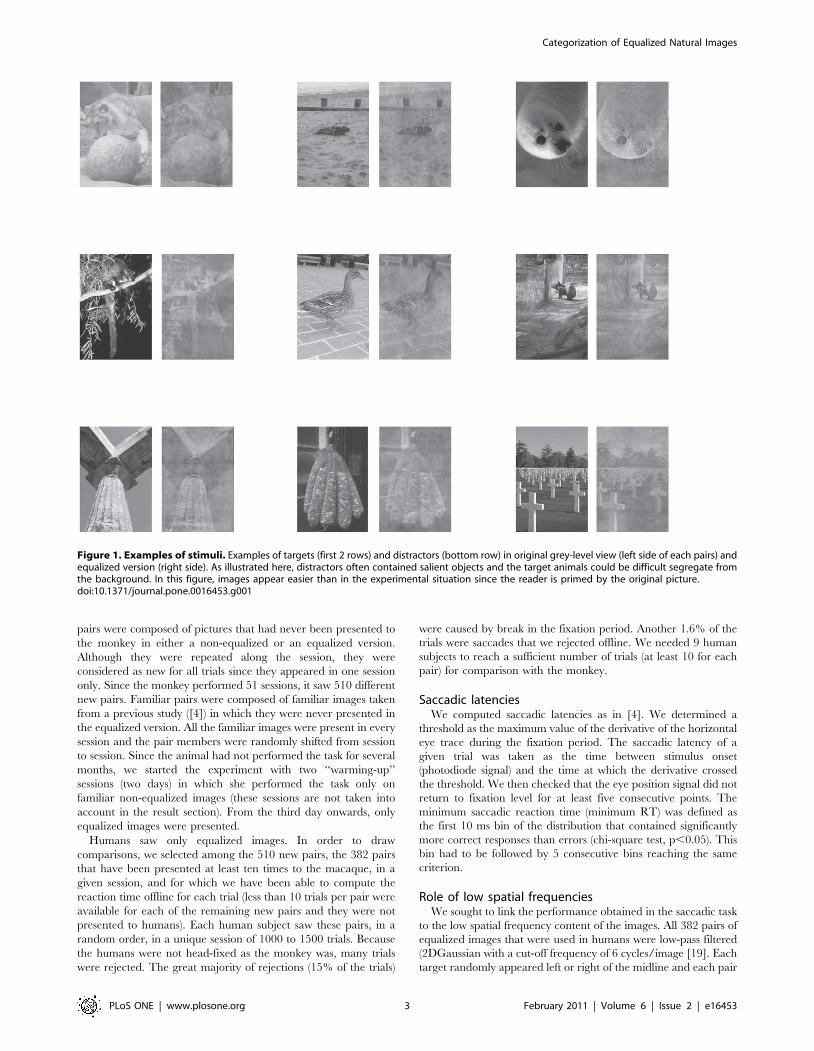
pairs were composed of pictures that had never been presented to
the monkey in either a non-equalized or an equalized version.
Although they were repeated along the session, they were
considered as new for all trials since they appeared in one session
only. Since the monkey performed 51 sessions, it saw 510 different
new pairs. Familiar pairs were composed of familiar images taken
from a previous study ([4]) in which they were never presented in
the equalized version. All the familiar images were present in every
session and the pair members were randomly shifted from session
to session. Since the animal had not performed the task for several
months, we started the experiment with two ‘‘warming-up’’
sessions (two days) in which she performed the task only on
familiar non-equalized images (these sessions are not taken into
account in the result section). From the third day onwards, only
equalized images were presented.
Humans saw only equalized images. In order to draw
comparisons, we selected among the 510 new pairs, the 382 pairs
that have been presented at least ten times to the macaque, in a
given session, and for which we have been able to compute the
reaction time offline for each trial (less than 10 trials per pair were
available for each of the remaining new pairs and they were not
presented to humans). Each human subject saw these pairs, in a
random order, in a unique session of 1000 to 1500 trials. Because
the humans were not head-fixed as the monkey was, many trials
were rejected. The great majority of rejections (15% of the trials)
were caused by break in the fixation period. Another 1.6% of the
trials were saccades that we rejected offline. We needed 9 human
subjects to reach a sufficient number of trials (at least 10 for each
pair) for comparison with the monkey.
Saccadic latenciesWe computed saccadic latencies as in [4]. We determined a
threshold as the maximum value of the derivative of the horizontal
eye trace during the fixation period. The saccadic latency of a
given trial was taken as the time between stimulus onset
(photodiode signal) and the time at which the derivative crossed
the threshold. We then checked that the eye position signal did not
return to fixation level for at least five consecutive points. The
minimum saccadic reaction time (minimum RT) was defined as
the first 10 ms bin of the distribution that contained significantly
more correct responses than errors (chi-square test, p,0.05). This
bin had to be followed by 5 consecutive bins reaching the same
criterion.
Role of low spatial frequenciesWe sought to link the performance obtained in the saccadic task
to the low spatial frequency content of the images. All 382 pairs of
equalized images that were used in humans were low-pass filtered
(2DGaussian with a cut-off frequency of 6 cycles/image [19]. Each
target randomly appeared left or right of the midline and each pair
Figure 1. Examples of stimuli. Examples of targets (first 2 rows) and distractors (bottom row) in original grey-level view (left side of each pairs) andequalized version (right side). As illustrated here, distractors often contained salient objects and the target animals could be difficult segregate fromthe background. In this figure, images appear easier than in the experimental situation since the reader is primed by the original picture.doi:10.1371/journal.pone.0016453.g001
Categorization of Equalized Natural Images
PLoS ONE | www.plosone.org 3 February 2011 | Volume 6 | Issue 2 | e16453
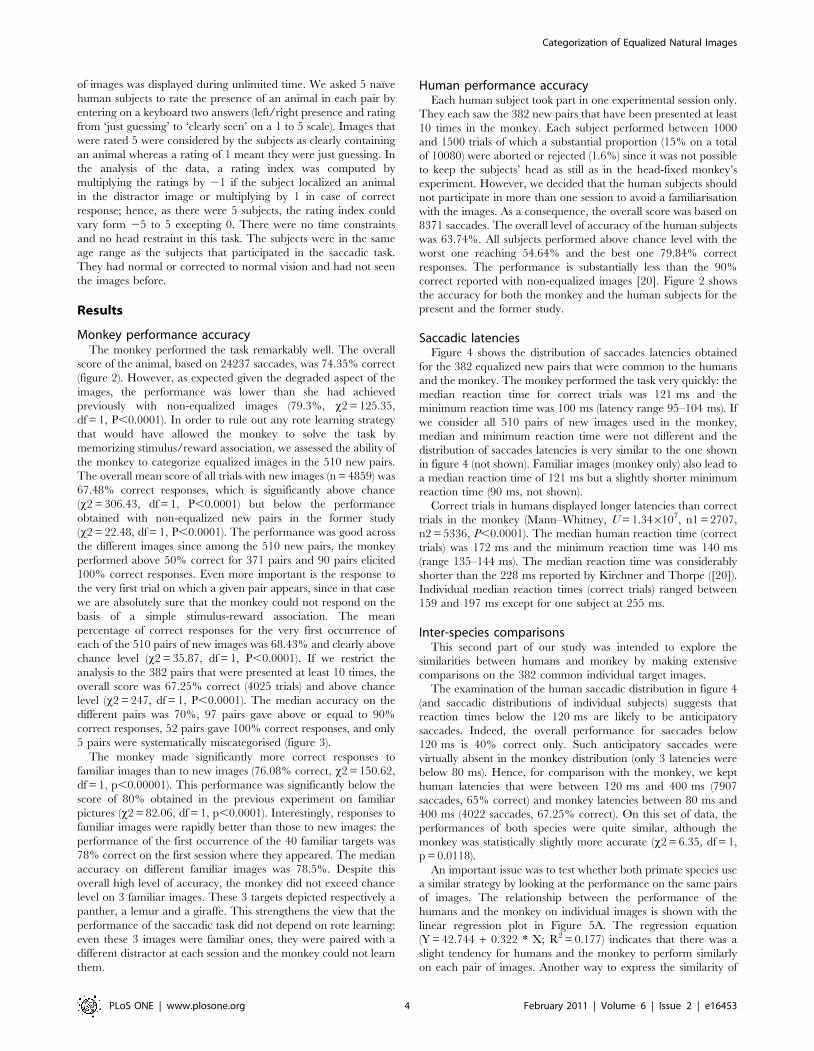
of images was displayed during unlimited time. We asked 5 naıve
human subjects to rate the presence of an animal in each pair by
entering on a keyboard two answers (left/right presence and rating
from ‘just guessing’ to ‘clearly seen’ on a 1 to 5 scale). Images that
were rated 5 were considered by the subjects as clearly containing
an animal whereas a rating of 1 meant they were just guessing. In
the analysis of the data, a rating index was computed by
multiplying the ratings by 21 if the subject localized an animal
in the distractor image or multiplying by 1 in case of correct
response; hence, as there were 5 subjects, the rating index could
vary form 25 to 5 excepting 0. There were no time constraints
and no head restraint in this task. The subjects were in the same
age range as the subjects that participated in the saccadic task.
They had normal or corrected to normal vision and had not seen
the images before.
Results
Monkey performance accuracyThe monkey performed the task remarkably well. The overall
score of the animal, based on 24237 saccades, was 74.35% correct
(figure 2). However, as expected given the degraded aspect of the
images, the performance was lower than she had achieved
previously with non-equalized images (79.3%, x2 = 125.35,
df = 1, P,0.0001). In order to rule out any rote learning strategy
that would have allowed the monkey to solve the task by
memorizing stimulus/reward association, we assessed the ability of
the monkey to categorize equalized images in the 510 new pairs.
The overall mean score of all trials with new images (n = 4859) was
67.48% correct responses, which is significantly above chance
(x2 = 306.43, df = 1, P,0.0001) but below the performance
obtained with non-equalized new pairs in the former study
(x2 = 22.48, df = 1, P,0.0001). The performance was good across
the different images since among the 510 new pairs, the monkey
performed above 50% correct for 371 pairs and 90 pairs elicited
100% correct responses. Even more important is the response to
the very first trial on which a given pair appears, since in that case
we are absolutely sure that the monkey could not respond on the
basis of a simple stimulus-reward association. The mean
percentage of correct responses for the very first occurrence of
each of the 510 pairs of new images was 68.43% and clearly above
chance level (x2 = 35.87, df = 1, P,0.0001). If we restrict the
analysis to the 382 pairs that were presented at least 10 times, the
overall score was 67.25% correct (4025 trials) and above chance
level (x2 = 247, df = 1, P,0.0001). The median accuracy on the
different pairs was 70%, 97 pairs gave above or equal to 90%
correct responses, 52 pairs gave 100% correct responses, and only
5 pairs were systematically miscategorised (figure 3).
The monkey made significantly more correct responses to
familiar images than to new images (76.08% correct, x2 = 150.62,
df = 1, p,0.00001). This performance was significantly below the
score of 80% obtained in the previous experiment on familiar
pictures (x2 = 82.06, df = 1, p,0.0001). Interestingly, responses to
familiar images were rapidly better than those to new images: the
performance of the first occurrence of the 40 familiar targets was
78% correct on the first session where they appeared. The median
accuracy on different familiar images was 78.5%. Despite this
overall high level of accuracy, the monkey did not exceed chance
level on 3 familiar images. These 3 targets depicted respectively a
panther, a lemur and a giraffe. This strengthens the view that the
performance of the saccadic task did not depend on rote learning:
even these 3 images were familiar ones, they were paired with a
different distractor at each session and the monkey could not learn
them.
Human performance accuracyEach human subject took part in one experimental session only.
They each saw the 382 new pairs that have been presented at least
10 times in the monkey. Each subject performed between 1000
and 1500 trials of which a substantial proportion (15% on a total
of 10080) were aborted or rejected (1.6%) since it was not possible
to keep the subjects’ head as still as in the head-fixed monkey’s
experiment. However, we decided that the human subjects should
not participate in more than one session to avoid a familiarisation
with the images. As a consequence, the overall score was based on
8371 saccades. The overall level of accuracy of the human subjects
was 63.74%. All subjects performed above chance level with the
worst one reaching 54.64% and the best one 79.84% correct
responses. The performance is substantially less than the 90%
correct reported with non-equalized images [20]. Figure 2 shows
the accuracy for both the monkey and the human subjects for the
present and the former study.
Saccadic latenciesFigure 4 shows the distribution of saccades latencies obtained
for the 382 equalized new pairs that were common to the humans
and the monkey. The monkey performed the task very quickly: the
median reaction time for correct trials was 121 ms and the
minimum reaction time was 100 ms (latency range 95–104 ms). If
we consider all 510 pairs of new images used in the monkey,
median and minimum reaction time were not different and the
distribution of saccades latencies is very similar to the one shown
in figure 4 (not shown). Familiar images (monkey only) also lead to
a median reaction time of 121 ms but a slightly shorter minimum
reaction time (90 ms, not shown).
Correct trials in humans displayed longer latencies than correct
trials in the monkey (Mann–Whitney, U = 1.346107, n1 = 2707,
n2 = 5336, P,0.0001). The median human reaction time (correct
trials) was 172 ms and the minimum reaction time was 140 ms
(range 135–144 ms). The median reaction time was considerably
shorter than the 228 ms reported by Kirchner and Thorpe ([20]).
Individual median reaction times (correct trials) ranged between
159 and 197 ms except for one subject at 255 ms.
Inter-species comparisonsThis second part of our study was intended to explore the
similarities between humans and monkey by making extensive
comparisons on the 382 common individual target images.
The examination of the human saccadic distribution in figure 4
(and saccadic distributions of individual subjects) suggests that
reaction times below the 120 ms are likely to be anticipatory
saccades. Indeed, the overall performance for saccades below
120 ms is 40% correct only. Such anticipatory saccades were
virtually absent in the monkey distribution (only 3 latencies were
below 80 ms). Hence, for comparison with the monkey, we kept
human latencies that were between 120 ms and 400 ms (7907
saccades, 65% correct) and monkey latencies between 80 ms and
400 ms (4022 saccades, 67.25% correct). On this set of data, the
performances of both species were quite similar, although the
monkey was statistically slightly more accurate (x2 = 6.35, df = 1,
p = 0.0118).
An important issue was to test whether both primate species use
a similar strategy by looking at the performance on the same pairs
of images. The relationship between the performance of the
humans and the monkey on individual images is shown with the
linear regression plot in Figure 5A. The regression equation
(Y = 42.744 + 0.322 * X; R2 = 0.177) indicates that there was a
slight tendency for humans and the monkey to perform similarly
on each pair of images. Another way to express the similarity of
Categorization of Equalized Natural Images
PLoS ONE | www.plosone.org 4 February 2011 | Volume 6 | Issue 2 | e16453
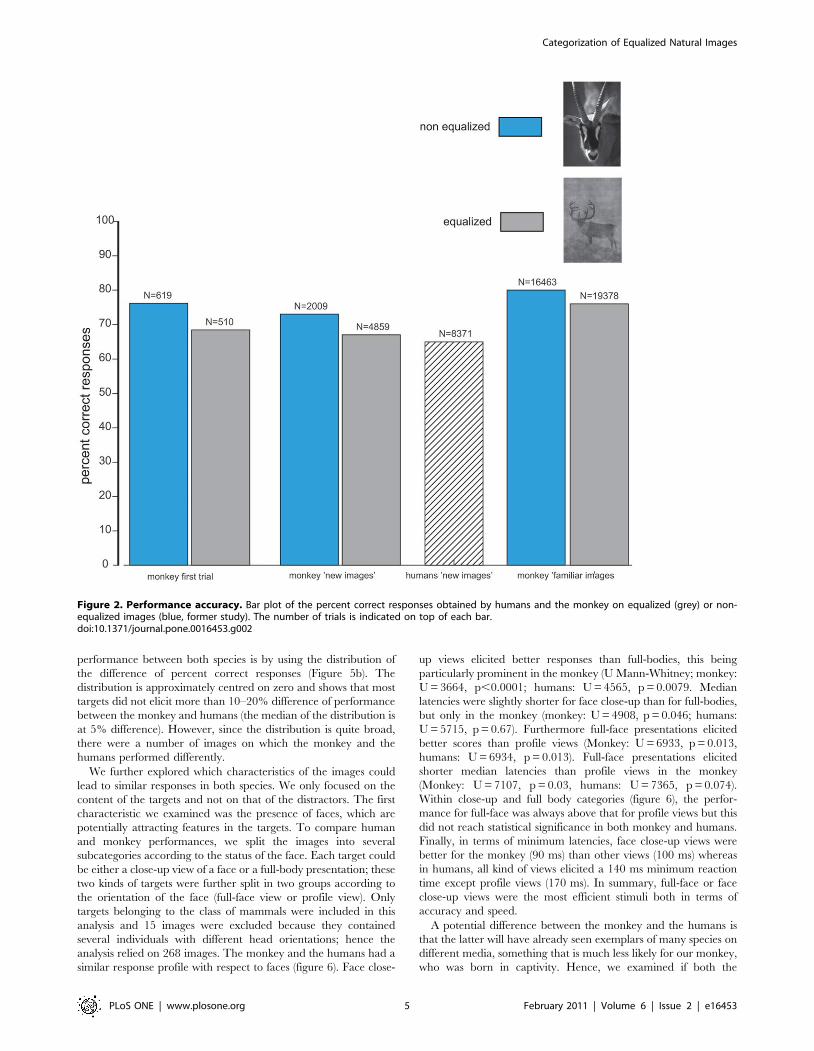
performance between both species is by using the distribution of
the difference of percent correct responses (Figure 5b). The
distribution is approximately centred on zero and shows that most
targets did not elicit more than 10–20% difference of performance
between the monkey and humans (the median of the distribution is
at 5% difference). However, since the distribution is quite broad,
there were a number of images on which the monkey and the
humans performed differently.
We further explored which characteristics of the images could
lead to similar responses in both species. We only focused on the
content of the targets and not on that of the distractors. The first
characteristic we examined was the presence of faces, which are
potentially attracting features in the targets. To compare human
and monkey performances, we split the images into several
subcategories according to the status of the face. Each target could
be either a close-up view of a face or a full-body presentation; these
two kinds of targets were further split in two groups according to
the orientation of the face (full-face view or profile view). Only
targets belonging to the class of mammals were included in this
analysis and 15 images were excluded because they contained
several individuals with different head orientations; hence the
analysis relied on 268 images. The monkey and the humans had a
similar response profile with respect to faces (figure 6). Face close-
up views elicited better responses than full-bodies, this being
particularly prominent in the monkey (U Mann-Whitney; monkey:
U = 3664, p,0.0001; humans: U = 4565, p = 0.0079. Median
latencies were slightly shorter for face close-up than for full-bodies,
but only in the monkey (monkey: U = 4908, p = 0.046; humans:
U = 5715, p = 0.67). Furthermore full-face presentations elicited
better scores than profile views (Monkey: U = 6933, p = 0.013,
humans: U = 6934, p = 0.013). Full-face presentations elicited
shorter median latencies than profile views in the monkey
(Monkey: U = 7107, p = 0.03, humans: U = 7365, p = 0.074).
Within close-up and full body categories (figure 6), the perfor-
mance for full-face was always above that for profile views but this
did not reach statistical significance in both monkey and humans.
Finally, in terms of minimum latencies, face close-up views were
better for the monkey (90 ms) than other views (100 ms) whereas
in humans, all kind of views elicited a 140 ms minimum reaction
time except profile views (170 ms). In summary, full-face or face
close-up views were the most efficient stimuli both in terms of
accuracy and speed.
A potential difference between the monkey and the humans is
that the latter will have already seen exemplars of many species on
different media, something that is much less likely for our monkey,
who was born in captivity. Hence, we examined if both the
Figure 2. Performance accuracy. Bar plot of the percent correct responses obtained by humans and the monkey on equalized (grey) or non-equalized images (blue, former study). The number of trials is indicated on top of each bar.doi:10.1371/journal.pone.0016453.g002
Categorization of Equalized Natural Images
PLoS ONE | www.plosone.org 5 February 2011 | Volume 6 | Issue 2 | e16453
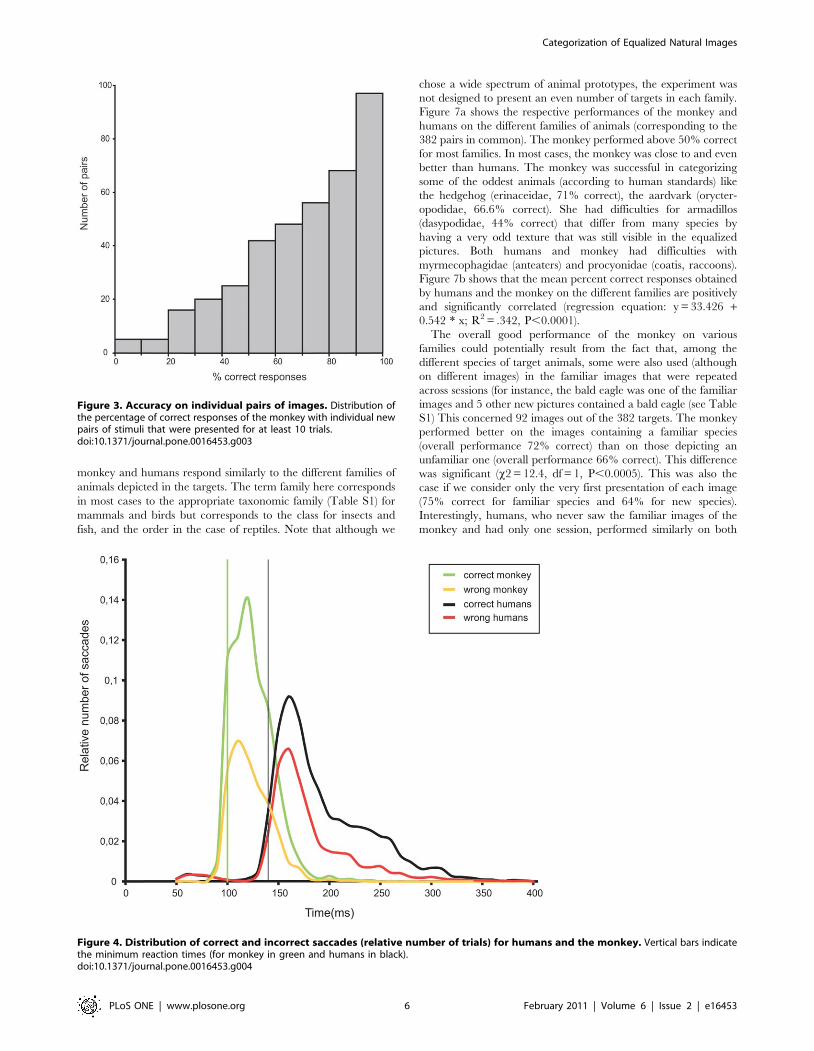
monkey and humans respond similarly to the different families of
animals depicted in the targets. The term family here corresponds
in most cases to the appropriate taxonomic family (Table S1) for
mammals and birds but corresponds to the class for insects and
fish, and the order in the case of reptiles. Note that although we
chose a wide spectrum of animal prototypes, the experiment was
not designed to present an even number of targets in each family.
Figure 7a shows the respective performances of the monkey and
humans on the different families of animals (corresponding to the
382 pairs in common). The monkey performed above 50% correct
for most families. In most cases, the monkey was close to and even
better than humans. The monkey was successful in categorizing
some of the oddest animals (according to human standards) like
the hedgehog (erinaceidae, 71% correct), the aardvark (orycter-
opodidae, 66.6% correct). She had difficulties for armadillos
(dasypodidae, 44% correct) that differ from many species by
having a very odd texture that was still visible in the equalized
pictures. Both humans and monkey had difficulties with
myrmecophagidae (anteaters) and procyonidae (coatis, raccoons).
Figure 7b shows that the mean percent correct responses obtained
by humans and the monkey on the different families are positively
and significantly correlated (regression equation: y = 33.426 +0.542 * x; R2 = .342, P,0.0001).
The overall good performance of the monkey on various
families could potentially result from the fact that, among the
different species of target animals, some were also used (although
on different images) in the familiar images that were repeated
across sessions (for instance, the bald eagle was one of the familiar
images and 5 other new pictures contained a bald eagle (see Table
S1) This concerned 92 images out of the 382 targets. The monkey
performed better on the images containing a familiar species
(overall performance 72% correct) than on those depicting an
unfamiliar one (overall performance 66% correct). This difference
was significant (x2 = 12.4, df = 1, P,0.0005). This was also the
case if we consider only the very first presentation of each image
(75% correct for familiar species and 64% for new species).
Interestingly, humans, who never saw the familiar images of the
monkey and had only one session, performed similarly on both
Figure 3. Accuracy on individual pairs of images. Distribution ofthe percentage of correct responses of the monkey with individual newpairs of stimuli that were presented for at least 10 trials.doi:10.1371/journal.pone.0016453.g003
Figure 4. Distribution of correct and incorrect saccades (relative number of trials) for humans and the monkey. Vertical bars indicatethe minimum reaction times (for monkey in green and humans in black).doi:10.1371/journal.pone.0016453.g004
Categorization of Equalized Natural Images
PLoS ONE | www.plosone.org 6 February 2011 | Volume 6 | Issue 2 | e16453
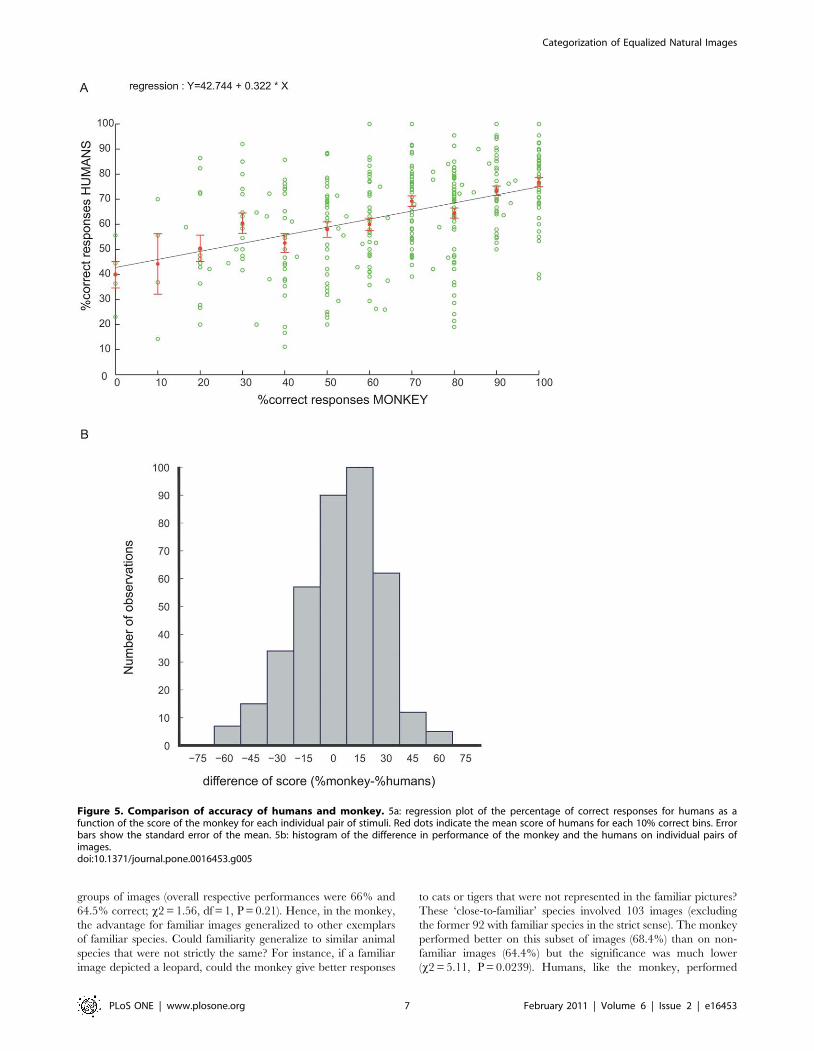
groups of images (overall respective performances were 66% and
64.5% correct; x2 = 1.56, df = 1, P = 0.21). Hence, in the monkey,
the advantage for familiar images generalized to other exemplars
of familiar species. Could familiarity generalize to similar animal
species that were not strictly the same? For instance, if a familiar
image depicted a leopard, could the monkey give better responses
to cats or tigers that were not represented in the familiar pictures?
These ‘close-to-familiar’ species involved 103 images (excluding
the former 92 with familiar species in the strict sense). The monkey
performed better on this subset of images (68.4%) than on non-
familiar images (64.4%) but the significance was much lower
(x2 = 5.11, P = 0.0239). Humans, like the monkey, performed
Figure 5. Comparison of accuracy of humans and monkey. 5a: regression plot of the percentage of correct responses for humans as afunction of the score of the monkey for each individual pair of stimuli. Red dots indicate the mean score of humans for each 10% correct bins. Errorbars show the standard error of the mean. 5b: histogram of the difference in performance of the monkey and the humans on individual pairs ofimages.doi:10.1371/journal.pone.0016453.g005
Categorization of Equalized Natural Images
PLoS ONE | www.plosone.org 7 February 2011 | Volume 6 | Issue 2 | e16453
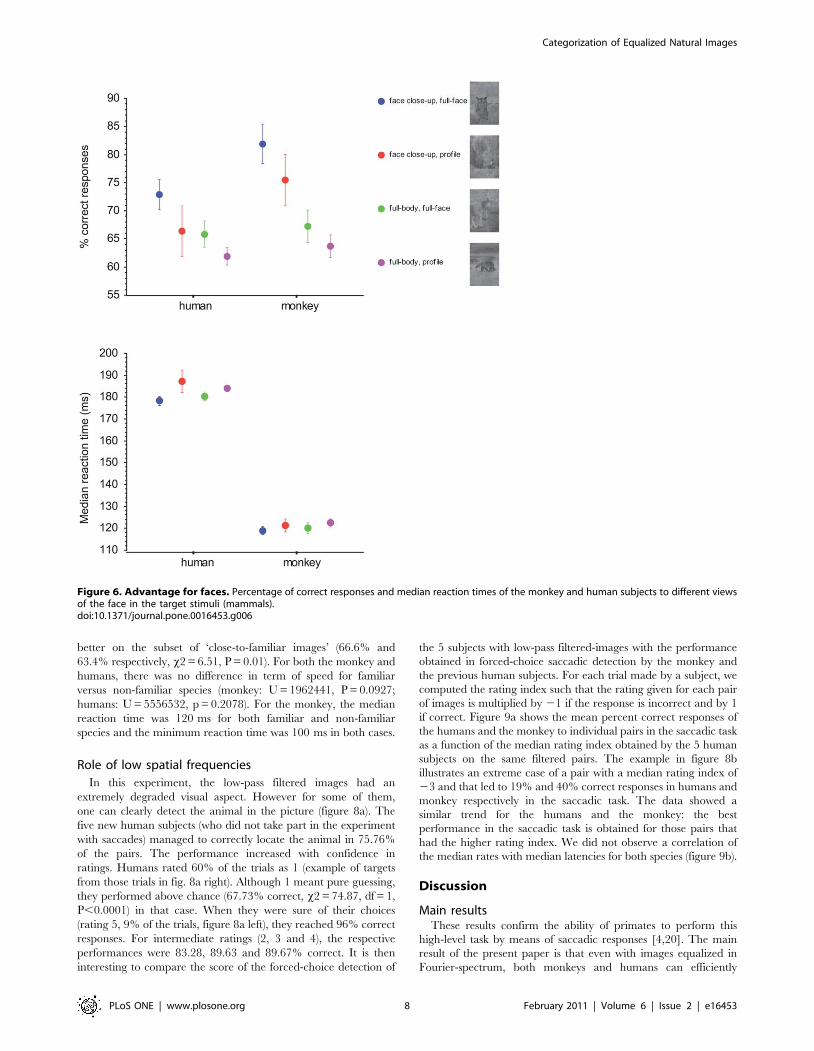
better on the subset of ‘close-to-familiar images’ (66.6% and
63.4% respectively, x2 = 6.51, P = 0.01). For both the monkey and
humans, there was no difference in term of speed for familiar
versus non-familiar species (monkey: U = 1962441, P = 0.0927;
humans: U = 5556532, p = 0.2078). For the monkey, the median
reaction time was 120 ms for both familiar and non-familiar
species and the minimum reaction time was 100 ms in both cases.
Role of low spatial frequencies
In this experiment, the low-pass filtered images had an
extremely degraded visual aspect. However for some of them,
one can clearly detect the animal in the picture (figure 8a). The
five new human subjects (who did not take part in the experiment
with saccades) managed to correctly locate the animal in 75.76%
of the pairs. The performance increased with confidence in
ratings. Humans rated 60% of the trials as 1 (example of targets
from those trials in fig. 8a right). Although 1 meant pure guessing,
they performed above chance (67.73% correct, x2 = 74.87, df = 1,
P,0.0001) in that case. When they were sure of their choices
(rating 5, 9% of the trials, figure 8a left), they reached 96% correct
responses. For intermediate ratings (2, 3 and 4), the respective
performances were 83.28, 89.63 and 89.67% correct. It is then
interesting to compare the score of the forced-choice detection of
the 5 subjects with low-pass filtered-images with the performance
obtained in forced-choice saccadic detection by the monkey and
the previous human subjects. For each trial made by a subject, we
computed the rating index such that the rating given for each pair
of images is multiplied by 21 if the response is incorrect and by 1
if correct. Figure 9a shows the mean percent correct responses of
the humans and the monkey to individual pairs in the saccadic task
as a function of the median rating index obtained by the 5 human
subjects on the same filtered pairs. The example in figure 8b
illustrates an extreme case of a pair with a median rating index of
23 and that led to 19% and 40% correct responses in humans and
monkey respectively in the saccadic task. The data showed a
similar trend for the humans and the monkey: the best
performance in the saccadic task is obtained for those pairs that
had the higher rating index. We did not observe a correlation of
the median rates with median latencies for both species (figure 9b).
Discussion
Main resultsThese results confirm the ability of primates to perform this
high-level task by means of saccadic responses [4,20]. The main
result of the present paper is that even with images equalized in
Fourier-spectrum, both monkeys and humans can efficiently
Figure 6. Advantage for faces. Percentage of correct responses and median reaction times of the monkey and human subjects to different viewsof the face in the target stimuli (mammals).doi:10.1371/journal.pone.0016453.g006
Categorization of Equalized Natural Images
PLoS ONE | www.plosone.org 8 February 2011 | Volume 6 | Issue 2 | e16453
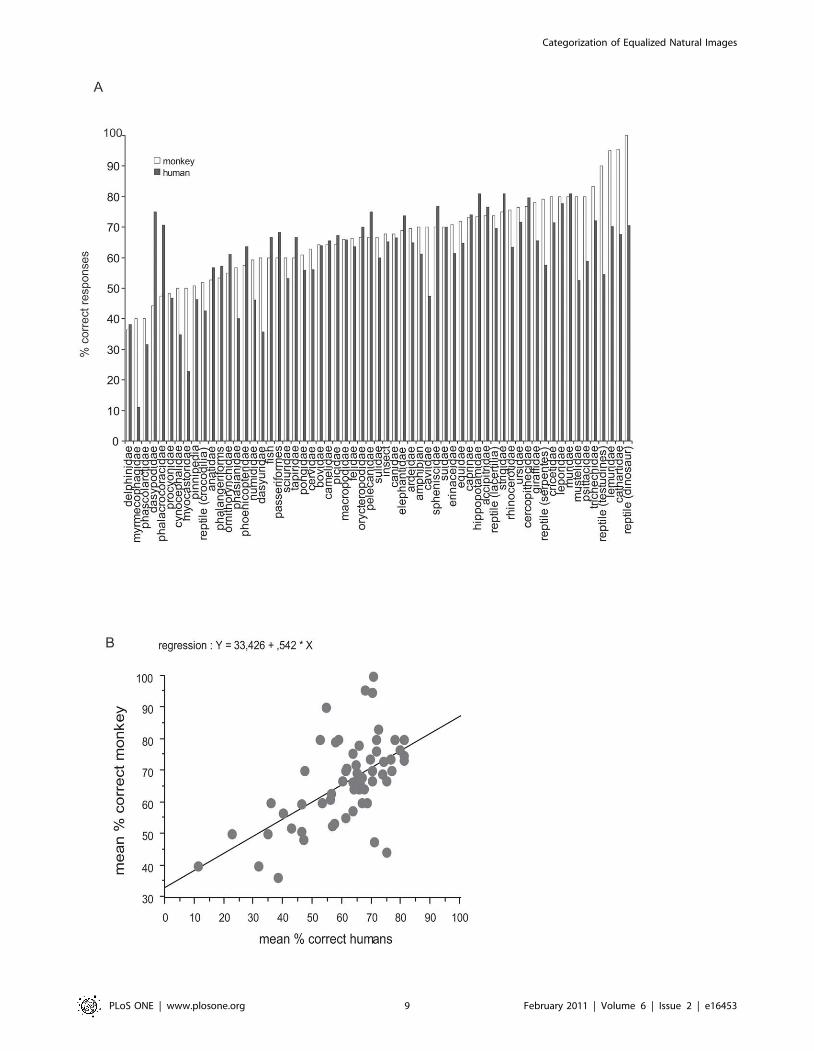
Categorization of Equalized Natural Images
PLoS ONE | www.plosone.org 9 February 2011 | Volume 6 | Issue 2 | e16453
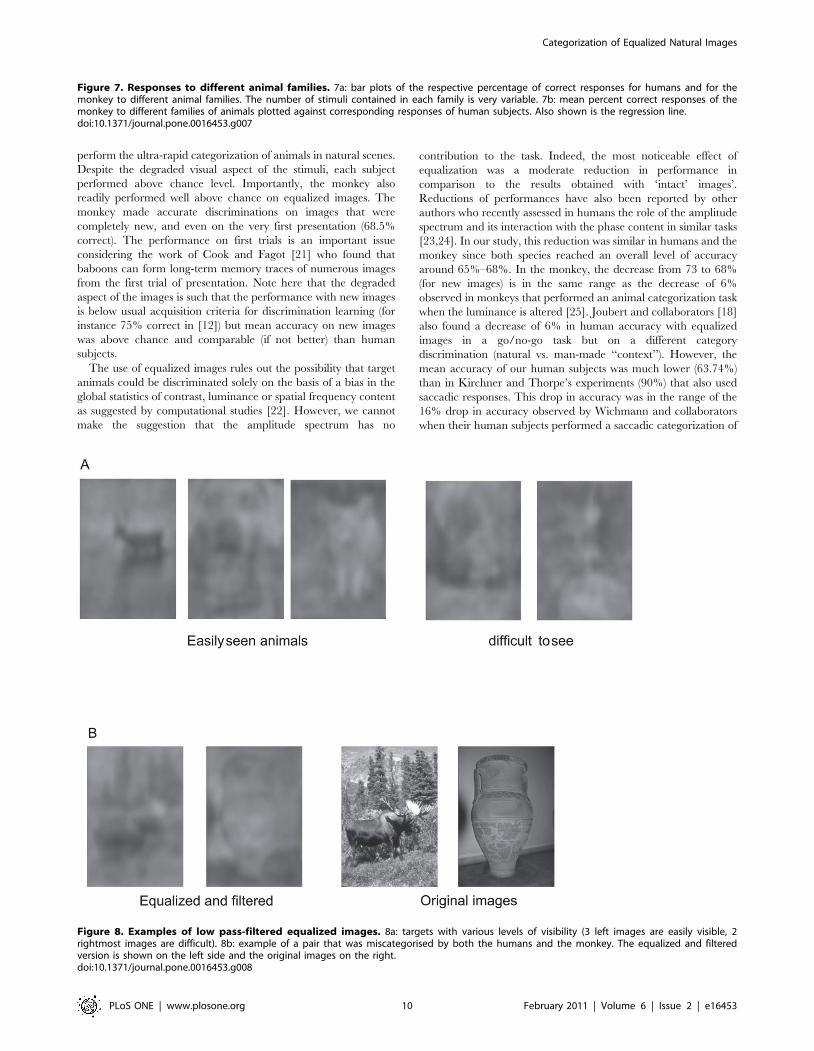
perform the ultra-rapid categorization of animals in natural scenes.
Despite the degraded visual aspect of the stimuli, each subject
performed above chance level. Importantly, the monkey also
readily performed well above chance on equalized images. The
monkey made accurate discriminations on images that were
completely new, and even on the very first presentation (68.5%
correct). The performance on first trials is an important issue
considering the work of Cook and Fagot [21] who found that
baboons can form long-term memory traces of numerous images
from the first trial of presentation. Note here that the degraded
aspect of the images is such that the performance with new images
is below usual acquisition criteria for discrimination learning (for
instance 75% correct in [12]) but mean accuracy on new images
was above chance and comparable (if not better) than human
subjects.
The use of equalized images rules out the possibility that target
animals could be discriminated solely on the basis of a bias in the
global statistics of contrast, luminance or spatial frequency content
as suggested by computational studies [22]. However, we cannot
make the suggestion that the amplitude spectrum has no
contribution to the task. Indeed, the most noticeable effect of
equalization was a moderate reduction in performance in
comparison to the results obtained with ‘intact’ images’.
Reductions of performances have also been reported by other
authors who recently assessed in humans the role of the amplitude
spectrum and its interaction with the phase content in similar tasks
[23,24]. In our study, this reduction was similar in humans and the
monkey since both species reached an overall level of accuracy
around 65%–68%. In the monkey, the decrease from 73 to 68%
(for new images) is in the same range as the decrease of 6%
observed in monkeys that performed an animal categorization task
when the luminance is altered [25]. Joubert and collaborators [18]
also found a decrease of 6% in human accuracy with equalized
images in a go/no-go task but on a different category
discrimination (natural vs. man-made ‘‘context’’). However, the
mean accuracy of our human subjects was much lower (63.74%)
than in Kirchner and Thorpe’s experiments (90%) that also used
saccadic responses. This drop in accuracy was in the range of the
16% drop in accuracy observed by Wichmann and collaborators
when their human subjects performed a saccadic categorization of
Figure 8. Examples of low pass-filtered equalized images. 8a: targets with various levels of visibility (3 left images are easily visible, 2rightmost images are difficult). 8b: example of a pair that was miscategorised by both the humans and the monkey. The equalized and filteredversion is shown on the left side and the original images on the right.doi:10.1371/journal.pone.0016453.g008
Figure 7. Responses to different animal families. 7a: bar plots of the respective percentage of correct responses for humans and for themonkey to different animal families. The number of stimuli contained in each family is very variable. 7b: mean percent correct responses of themonkey to different families of animals plotted against corresponding responses of human subjects. Also shown is the regression line.doi:10.1371/journal.pone.0016453.g007
Categorization of Equalized Natural Images
PLoS ONE | www.plosone.org 10 February 2011 | Volume 6 | Issue 2 | e16453
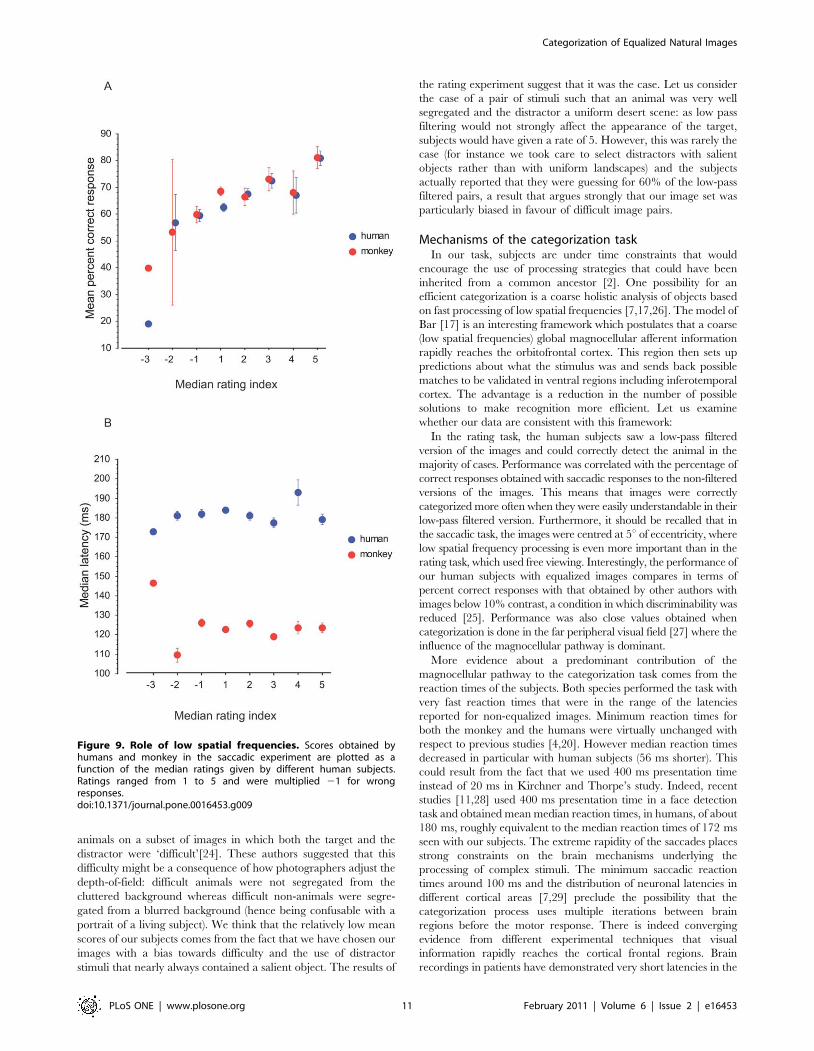
animals on a subset of images in which both the target and the
distractor were ‘difficult’[24]. These authors suggested that this
difficulty might be a consequence of how photographers adjust the
depth-of-field: difficult animals were not segregated from the
cluttered background whereas difficult non-animals were segre-
gated from a blurred background (hence being confusable with a
portrait of a living subject). We think that the relatively low mean
scores of our subjects comes from the fact that we have chosen our
images with a bias towards difficulty and the use of distractor
stimuli that nearly always contained a salient object. The results of
the rating experiment suggest that it was the case. Let us consider
the case of a pair of stimuli such that an animal was very well
segregated and the distractor a uniform desert scene: as low pass
filtering would not strongly affect the appearance of the target,
subjects would have given a rate of 5. However, this was rarely the
case (for instance we took care to select distractors with salient
objects rather than with uniform landscapes) and the subjects
actually reported that they were guessing for 60% of the low-pass
filtered pairs, a result that argues strongly that our image set was
particularly biased in favour of difficult image pairs.
Mechanisms of the categorization taskIn our task, subjects are under time constraints that would
encourage the use of processing strategies that could have been
inherited from a common ancestor [2]. One possibility for an
efficient categorization is a coarse holistic analysis of objects based
on fast processing of low spatial frequencies [7,17,26]. The model of
Bar [17] is an interesting framework which postulates that a coarse
(low spatial frequencies) global magnocellular afferent information
rapidly reaches the orbitofrontal cortex. This region then sets up
predictions about what the stimulus was and sends back possible
matches to be validated in ventral regions including inferotemporal
cortex. The advantage is a reduction in the number of possible
solutions to make recognition more efficient. Let us examine
whether our data are consistent with this framework:
In the rating task, the human subjects saw a low-pass filtered
version of the images and could correctly detect the animal in the
majority of cases. Performance was correlated with the percentage of
correct responses obtained with saccadic responses to the non-filtered
versions of the images. This means that images were correctly
categorized more often when they were easily understandable in their
low-pass filtered version. Furthermore, it should be recalled that in
the saccadic task, the images were centred at 5u of eccentricity, where
low spatial frequency processing is even more important than in the
rating task, which used free viewing. Interestingly, the performance of
our human subjects with equalized images compares in terms of
percent correct responses with that obtained by other authors with
images below 10% contrast, a condition in which discriminability was
reduced [25]. Performance was also close values obtained when
categorization is done in the far peripheral visual field [27] where the
influence of the magnocellular pathway is dominant.
More evidence about a predominant contribution of the
magnocellular pathway to the categorization task comes from the
reaction times of the subjects. Both species performed the task with
very fast reaction times that were in the range of the latencies
reported for non-equalized images. Minimum reaction times for
both the monkey and the humans were virtually unchanged with
respect to previous studies [4,20]. However median reaction times
decreased in particular with human subjects (56 ms shorter). This
could result from the fact that we used 400 ms presentation time
instead of 20 ms in Kirchner and Thorpe’s study. Indeed, recent
studies [11,28] used 400 ms presentation time in a face detection
task and obtained mean median reaction times, in humans, of about
180 ms, roughly equivalent to the median reaction times of 172 ms
seen with our subjects. The extreme rapidity of the saccades places
strong constraints on the brain mechanisms underlying the
processing of complex stimuli. The minimum saccadic reaction
times around 100 ms and the distribution of neuronal latencies in
different cortical areas [7,29] preclude the possibility that the
categorization process uses multiple iterations between brain
regions before the motor response. There is indeed converging
evidence from different experimental techniques that visual
information rapidly reaches the cortical frontal regions. Brain
recordings in patients have demonstrated very short latencies in the
Figure 9. Role of low spatial frequencies. Scores obtained byhumans and monkey in the saccadic experiment are plotted as afunction of the median ratings given by different human subjects.Ratings ranged from 1 to 5 and were multiplied 21 for wrongresponses.doi:10.1371/journal.pone.0016453.g009
Categorization of Equalized Natural Images
PLoS ONE | www.plosone.org 11 February 2011 | Volume 6 | Issue 2 | e16453
frontal eye fields [30] reaching the amazing value of 45 ms with
depth electrodes [31]. MEG and FMRI experiments in humans
show that in a picture recognition task, the orbitofrontal cortex is
rapidly activated by visual signals carrying low spatial frequencies
(the reported MEG activity starts to develop before 100 ms), that
could well originate from fast dorsal magnocellular pathways [32].
Our results point to a fast recognition mechanism based on low
frequency contents that fits with Bar’s framework, although our use
of equalized scenes makes it unlikely that a simple categorization
rule could be used. Intermediate level cues such as specific contours
[33–35], may reflect the set of templates elaborated in frontal
regions (after the arrival of the fast feedforward magnocellular
information) in order to generate a set of initial hypotheses.
Have we some evidence of such ‘templates’ from our data? Faces
are known to have a special significance and attractiveness in
primates [36–38]. Recent fMRI investigations in both macaques
and humans revealed that more brain areas are devoted in face
processing than in other body parts [39]. Furthermore, fMRI
reveals that face patches have the same relative size in the cortices of
humans and monkey [40]. In agreement with these studies, we
found in both the monkey and humans a similar trend towards
much higher performance with full-face and close-up views of faces
with respect to profile and full-body views. Although there is clear
evidence of a special status of conspecific faces through expertise
[41–43], we found that close-up view of full-faces of a large variety
of animals (at least mammals) were also more attractive than profile
views and full bodies. Hence prototypes of faces are the most
obvious candidates as default templates used for guessing the
identity of the input stimulus in fast categorization. Our results fit
with the recent results of Crouzet and collaborators [28] who found
an excellent saccadic detection of conspecific faces in humans and of
Fletcher Watson et al [44] who found systematic attraction by faces
in free-gazing of natural scenes. Reactions are extremely fast in all
these studies. However, more experiments are required to decide
between two alternatives. The first one would rely exclusively on
feedforward mechanisms, with no time for the use of feedback. The
second possibility is that a fast top-down signal carrying the most
probable guess (the face) comes into play to trigger fast reaction
times. However in that case, because of the saccadic response
constraint, it would have no time to be compared with the slower
detailed information arriving into the ventral pathway to validate
the guess (latencies were not longer for difficult pairs and this was
also the case in the study by Wichmann et al. [24]).
Role of familiarityIn addition, our results seem to indicate that the formation of
templates can be quite rapidly modulated ‘on line’ over the period of
the experiment sessions. Humans seem to be perfectly able to
categorize even very unusual animal species as animals (at least for
vertebrates). Each one of us is able to recognize a platypus or an
anteater as an animal, and we can even do the same thing for very
unusual prehistoric or even imaginary species [45]. The contribu-
tion of innate or cultural factors to picture recognition may not be a
trivial issue but some studies have shown that people remote from
the imaged-overloaded ‘modern’ civilization can recognize the
presence of animals in pictures [46]. Since macaque monkeys do not
normally have access to human media (although they could see
some occasional TV programs as enrichment in our animal facility),
it was interesting to assess the monkey’s cognitive capacities in
categorizing diverse types of animals. As a whole, the monkey
performed similarly to humans for a large variety of families of
mammals and members of other animal classes. Nevertheless, the
correlation of the performances of both species on individual pairs
of stimuli was rather modest. It is then important to emphasize the
fact that the monkey made correct responses even if the animal
targets belonged to a species that had never been presented before,
although she performed more accurately on images that contained a
species already presented in familiar images. In contrast, humans do
not get advantage from their cultural background in the task since
the percentage of correct responses obtained by humans and
monkey on the non-familiar images are very similar (humans
perform below the level reached by the monkey with familiar
images). Hence the higher scores obtained with familiar species by
the monkey is likely to be caused by a priming by the familiar images
that were randomly interleaved with new ones rather than a natural
propensity of monkeys to recognize these species or an inadvertent
bias towards ‘easy features’ contained in these images. The effect of
familiarity seems to occur rapidly since responses to first
presentation of familiar species are about 10% better than responses
to first presentations of new species. Determining to what extent this
familiarity process takes place in the frontal cortical regions would
be an interesting future experiment since, in the framework of Bar’s
model, this may influence the selection of the templates that are used
to perform the task.
Supporting Information
Table S1 Details of animal species used in the study.Each line corresponds to one target. Columns indicate the class, the
family, the common name and the scientific name. Last two columns
indicate whether the image was used in humans and whether the
animal target belonged to the familiar species seen by the monkey. At
least 165 species were used. 97 could be determined with certainty; the
others were undetermined and could belong to more than 68 different
species. For mammals and birds, these species belonged to 56 different
taxonomic families (53 used in both monkey and humans), with the
following deliberate misclassifications: passeriforms (order), caprinae
(subfamilia), phalangeriforms (suborder) for possums, echidna and
okapi were deliberately misclassified in erinaceidae and equidae
respectively, according to their aspect. Reptiles, amphibians, insects
and fish were considered under the class name only.
(XLS)
Acknowledgments
Denis Fize for help in the design of stimuli, Angeline Mantione, Benedicte
Leveille for animal husbandry, Pascal Barone, Simon Thorpe and Lionel
Nowak for discussion.
Author Contributions
Conceived and designed the experiments: PG. Performed the experiments:
PG RKR. Analyzed the data: PG RKR. Wrote the paper: PG.
References
1. Passingham R (2009) How good is the macaque monkey model of the human
brain? Curr Opin Neurobiol 19: 6–11.
2. Fabre-Thorpe M (2003) Visual categorization: accessing abstraction in non-
human primates. Philos Trans R Soc Lond B Biol Sci 358: 1215–1223.
3. Delorme A, Richard G, Fabre-Thorpe M (2000) Ultra-rapid categorisation of
natural scenes does not rely on colour cues: a study in monkeys and humans.
Vision Res 40: 2187–2200.
4. Girard P, Jouffrais C, Kirchner H (2008) Ultra-rapid categorisation in non-
human primates. Anim Cogn 11: 485–493.
5. Mace MJ, Richard G, Delorme A, Fabre-Thorpe M (2005) Rapid categorization
of natural scenes in monkeys: target predictability and processing speed.
Neuroreport 16: 349–354.
6. Tompa T, Sary G (2010) A review on the inferior temporal cortex of the
macaque. Brain Res Rev 62: 165–182.
Categorization of Equalized Natural Images
PLoS ONE | www.plosone.org 12 February 2011 | Volume 6 | Issue 2 | e16453
7. Nowak LG, Bullier J (1997) The timing of information transfer in the visual
system. In: Rockland KS, Kaas JH, Peters A, eds. Extrastriate visual cortex inprimates. New York: Plenum Press. pp 205–241.
8. Liu H, Agam Y, Madsen JR, Kreiman G (2009) Timing, timing, timing: fast
decoding of object information from intracranial field potentials in human visualcortex. Neuron 62: 281–290.
9. VanRullen R, Thorpe SJ (2002) Surfing a spike wave down the ventral stream.Vision Res 42: 2593–2615.
10. Oliva A, Torralba A (2006) Building the gist of a scene: the role of global image
features in recognition. Prog Brain Res 155PB: 23–36.11. Honey C, Kirchner H, VanRullen R (2008) Faces in the cloud: Fourier power
spectrum biases ultrarapid face detection. J Vis 8: 1–13.12. D’Amato MR, Van Sant P (1988) The person concept in monkeys (Cebus
apella). J Exp Psychol Anim Behav Process 14: 43–55.13. Joubert OR, Fize D, Rousselet GA, Fabre-Thorpe M (2008) Early interference
of context congruence on object processing in rapid visual categorization of
natural scenes. J Vision 8: 1–18.14. Fabre-Thorpe M, Richard G, Thorpe SJ (1998) Rapid categorization of natural
images by rhesus monkeys. Neuroreport 9: 303–308.15. Kiani R, Esteky H, Mirpour K, Tanaka K (2007) Object category structure in
response patterns of neuronal population in monkey inferior temporal cortex.
J Neurophysiol 97: 4296–4309.16. Kriegeskorte N, Mur M, Ruff DA, Kiani R, Bodurka J, et al. (2008) Matching
categorical object representations in inferior temporal cortex of man andmonkey. Neuron 60: 1126–1141.
17. Bar M (2003) A cortical mechanism for triggering top-down facilitation in visualobject recognition. J Cogn Neurosci 15: 600–609.
18. Joubert OR, Rousselet GA, Fabre-Thorpe M, Fize D (2009) Rapid visual
categorization of natural scene contexts with equalized amplitude spectrum andincreasing phase noise. J Vis 9: 1–16.
19. Bar M, Kassam KS, Ghuman AS, Boshyan J, Schmidt AM, et al. (2006) Top-down facilitation of visual recognition. Proc Natl Acad Sci U S A 103: 449–454.
20. Kirchner H, Thorpe SJ (2006) Ultra-rapid object detection with saccadic eye
movements: Visual processing speed revisited. Vision Res 46: 1762–1776.21. Cook R, Fagot J (2009) First trial rewards promote 1-trial learning and
prolonged memory in pigeon and baboon. Proc Natl Acad Sci U S A 106:9530–9533.
22. Torralba A, Oliva A (2003) Statistics of natural image categories. Network 14:391–412.
23. Gaspar CM, Rousselet GA (2009) How do amplitude spectra influence rapid
animal detection? Vision Res 49: 3001–3012.24. Wichmann FA, Drewes J, Rosas P, Gegenfurtner KR (2010) Animal detection in
natural scenes: Critical features revisited. J Vis 10: 1–27.25. Mace MJ, Delorme A, Richard G, Fabre-Thorpe M (2010) Spotting animals in
natural scenes: efficiency of humans and monkeys at very low contrasts. Anim
Cogn 13: 405–418.26. Bullier J (2001) Integrated model of visual processing. Brain Res Brain Res Rev
36: 96–107.
27. Thorpe SJ, Gegenfurtner KR, Fabre-Thorpe M, Bulthoff HH (2001) Detection
of animals in natural images using far peripheral vision. Eur J Neurosci 14:869–876.
28. Crouzet SM, Kirchner H, Thorpe SJ (2010) Fast saccades towards faces: Face
detection in just 100 ms. J Vis 10: 1–17.29. Schmolesky MT, Wang Y, Hanes DP, Thompson KG, Leutgeb S, et al. (1998)
Signal timing across the macaque visual system. J Neurophysiol 79: 3272–3278.30. Blanke O, Morand S, Thut G, Michel CM, Spinelli L, et al. (1999) Visual
activity in the human frontal eye field. Neuroreport 10: 925–930.
31. Kirchner H, Barbeau EJ, Thorpe SJ, Regis J, Liegeois-Chauvel C (2009) Ultra-rapid sensory responses in the human frontal eye field region. J Neurosci 29:
7599–7606.32. Kveraga K, Boshyan J, Bar M (2007) Magnocellular projections as the trigger of
top-down facilitation in recognition. J Neurosci 27: 13232–13240.33. Biederman I, Cooper EE (1991) Priming contour-deleted images: evidence for
intermediate representations in visual object recognition. Cognit Psychol 23:
393–419.34. Biederman I, Ju G (1988) Surface versus edge-based determinants of visual
recognition. Cognit Psychol 20: 38–64.35. Lloyd-Jones TJ, Gehrke J, Lauder J (2010) Animal recognition and eye
movements: the contribution of outline contour and local feature information.
Exp Psychol 57: 117–125.36. Pascalis O, Petit O, Kim JH, Campbell R (1999) Picture perception in primates:
The case of face perception; Picture perception in animals. Cahiers dePsychologie Cognitive 18: 889–921.
37. Sugita Y (2008) Face perception in monkeys reared with no exposure to faces.Proc Natl Acad Sci U S A 105: 394–398.
38. Gilchrist ID, Proske H (2006) Anti-saccades away from faces: evidence for an
influence of high-level visual processes on saccade programming. Exp Brain Res173: 708–712.
39. Pinsk MA, Arcaro M, Weiner KS, Kalkus JF, Inati SJ, et al. (2009) Neuralrepresentations of faces and body parts in macaque and human cortex: a
comparative FMRI study. J Neurophysiol 101: 2581–2600.
40. Tsao DY, Freiwald WA, Knutsen TA, Mandeville JB, Tootell RB (2003) Facesand objects in macaque cerebral cortex. Nat Neurosci 6: 989–995.
41. Dufour V, Pascalis O, Petit O (2006) Face processing limitation to own species inprimates: a comparative study in brown capuchins, Tonkean macaques and
humans. Behav Processes 73: 107–113.42. Dahl CD, Wallraven C, Bulthoff HH, Logothetis NK (2009) Humans and
Macaques Employ Similar Face-Processing Strategies. Curr Biol 19: 509–513.
43. Gothard KM, Brooks KN, Peterson MA (2009) Multiple perceptual strategiesused by macaque monkeys for face recognition. Anim Cogn 12: 155–167.
44. Fletcher-Watson S, Findlay JM, Leekam SR, Benson V (2008) Rapid detectionof person information in a naturalistic scene. Perception 37: 571–583.
45. Dixon D (1981) After man: A zoology of the future. New York: St Martin’s Press:
124.46. Deregowski JB, Muldrow ES, Muldrow WF (1972) Pictorial recognition in a
remote Ethiopian population. Perception 1: 417–425.
Categorization of Equalized Natural Images
PLoS ONE | www.plosone.org 13 February 2011 | Volume 6 | Issue 2 | e16453
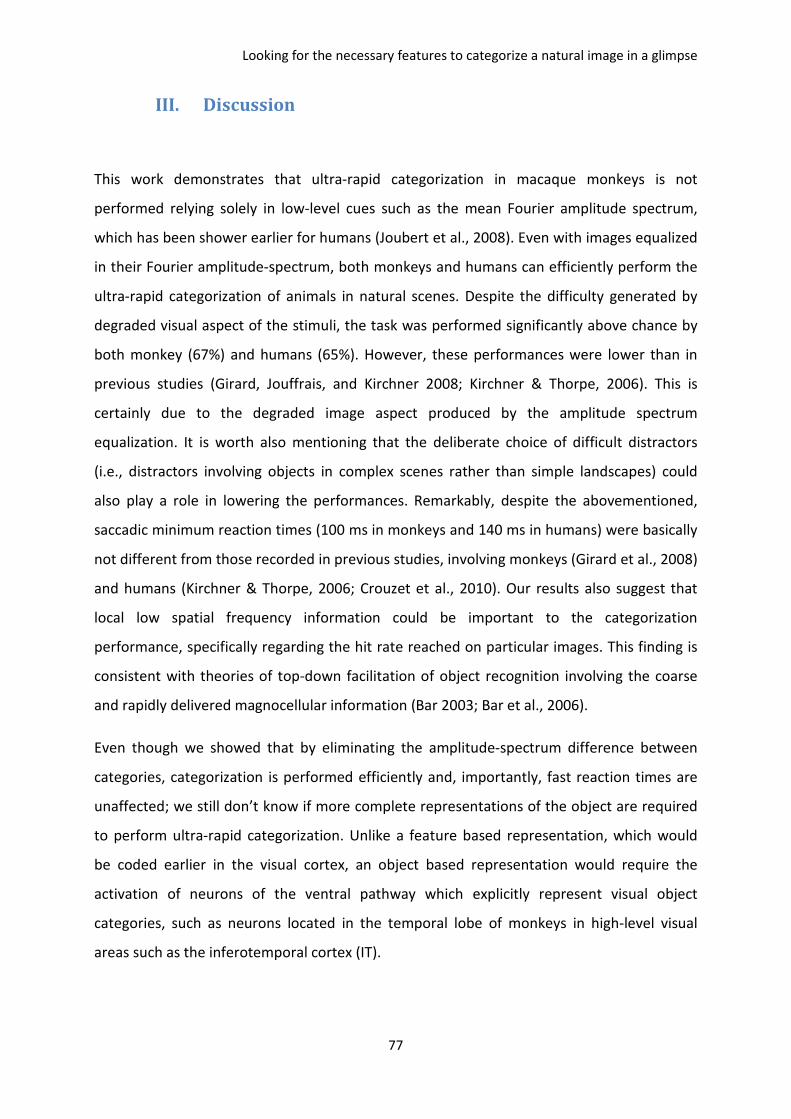
Looking for the necessary features to categorize a natural image in a glimpse
77
III. Discussion
This work demonstrates that ultra-rapid categorization in macaque monkeys is not
performed relying solely in low-level cues such as the mean Fourier amplitude spectrum,
which has been shower earlier for humans (Joubert et al., 2008). Even with images equalized
in their Fourier amplitude-spectrum, both monkeys and humans can efficiently perform the
ultra-rapid categorization of animals in natural scenes. Despite the difficulty generated by
degraded visual aspect of the stimuli, the task was performed significantly above chance by
both monkey (67%) and humans (65%). However, these performances were lower than in
previous studies (Girard, Jouffrais, and Kirchner 2008; Kirchner & Thorpe, 2006). This is
certainly due to the degraded image aspect produced by the amplitude spectrum
equalization. It is worth also mentioning that the deliberate choice of difficult distractors
(i.e., distractors involving objects in complex scenes rather than simple landscapes) could
also play a role in lowering the performances. Remarkably, despite the abovementioned,
saccadic minimum reaction times (100 ms in monkeys and 140 ms in humans) were basically
not different from those recorded in previous studies, involving monkeys (Girard et al., 2008)
and humans (Kirchner & Thorpe, 2006; Crouzet et al., 2010). Our results also suggest that
local low spatial frequency information could be important to the categorization
performance, specifically regarding the hit rate reached on particular images. This finding is
consistent with theories of top-down facilitation of object recognition involving the coarse
and rapidly delivered magnocellular information (Bar 2003; Bar et al., 2006).
Even though we showed that by eliminating the amplitude-spectrum difference between
categories, categorization is performed efficiently and, importantly, fast reaction times are
unaffected; we still don’t know if more complete representations of the object are required
to perform ultra-rapid categorization. Unlike a feature based representation, which would
be coded earlier in the visual cortex, an object based representation would require the
activation of neurons of the ventral pathway which explicitly represent visual object
categories, such as neurons located in the temporal lobe of monkeys in high-level visual
areas such as the inferotemporal cortex (IT).
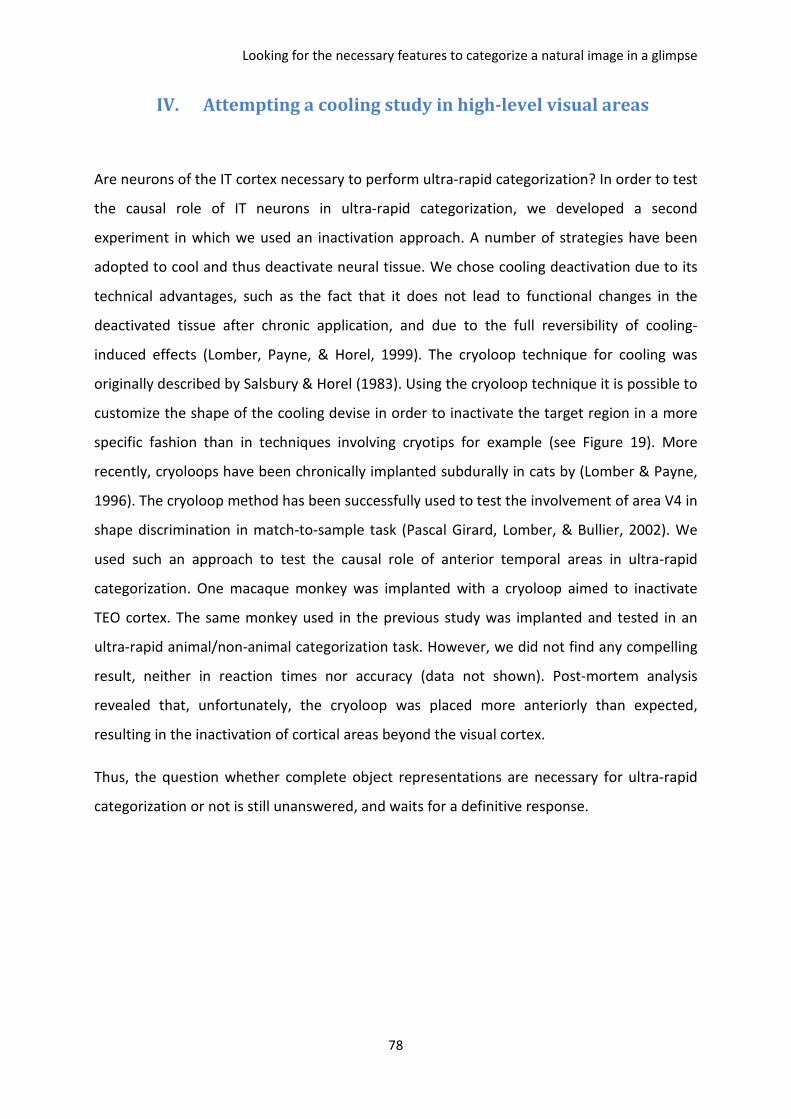
Looking for the necessary features to categorize a natural image in a glimpse
78
IV. Attempting a cooling study in high-level visual areas
Are neurons of the IT cortex necessary to perform ultra-rapid categorization? In order to test
the causal role of IT neurons in ultra-rapid categorization, we developed a second
experiment in which we used an inactivation approach. A number of strategies have been
adopted to cool and thus deactivate neural tissue. We chose cooling deactivation due to its
technical advantages, such as the fact that it does not lead to functional changes in the
deactivated tissue after chronic application, and due to the full reversibility of cooling-
induced effects (Lomber, Payne, & Horel, 1999). The cryoloop technique for cooling was
originally described by Salsbury & Horel (1983). Using the cryoloop technique it is possible to
customize the shape of the cooling devise in order to inactivate the target region in a more
specific fashion than in techniques involving cryotips for example (see Figure 19). More
recently, cryoloops have been chronically implanted subdurally in cats by (Lomber & Payne,
1996). The cryoloop method has been successfully used to test the involvement of area V4 in
shape discrimination in match-to-sample task (Pascal Girard, Lomber, & Bullier, 2002). We
used such an approach to test the causal role of anterior temporal areas in ultra-rapid
categorization. One macaque monkey was implanted with a cryoloop aimed to inactivate
TEO cortex. The same monkey used in the previous study was implanted and tested in an
ultra-rapid animal/non-animal categorization task. However, we did not find any compelling
result, neither in reaction times nor accuracy (data not shown). Post-mortem analysis
revealed that, unfortunately, the cryoloop was placed more anteriorly than expected,
resulting in the inactivation of cortical areas beyond the visual cortex.
Thus, the question whether complete object representations are necessary for ultra-rapid
categorization or not is still unanswered, and waits for a definitive response.
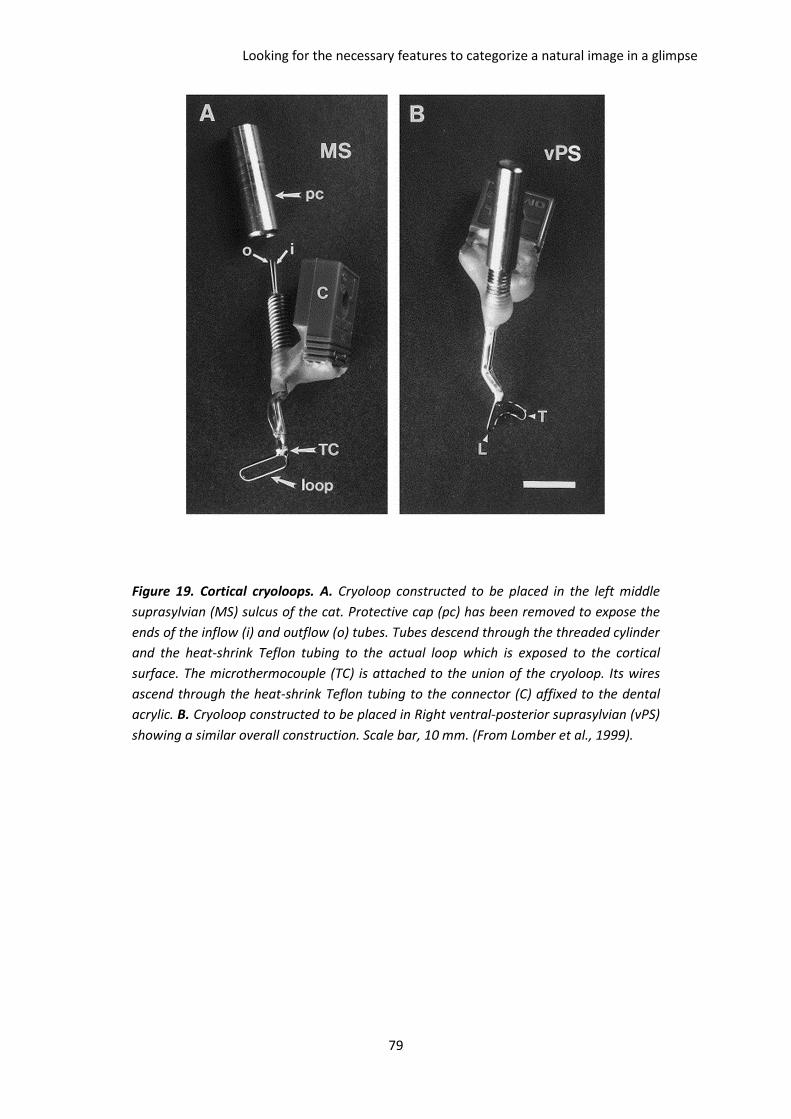
Looking for the necessary features to categorize a natural image in a glimpse
79
Figure 19. Cortical cryoloops. A. Cryoloop constructed to be placed in the left middle
suprasylvian (MS) sulcus of the cat. Protective cap (pc) has been removed to expose the
ends of the inflow (i) and outflow (o) tubes. Tubes descend through the threaded cylinder
and the heat-shrink Teflon tubing to the actual loop which is exposed to the cortical
surface. The microthermocouple (TC) is attached to the union of the cryoloop. Its wires
ascend through the heat-shrink Teflon tubing to the connector (C) affixed to the dental
acrylic. B. Cryoloop constructed to be placed in Right ventral-posterior suprasylvian (vPS)
showing a similar overall construction. Scale bar, 10 mm. (From Lomber et al., 1999).
Looking for the necessary features to categorize a natural image in a glimpse
80
As discussed in the introduction, there is a body of evidence supporting the fact that ultra-
rapid categorization is performed automatically and pre-attentively (VanRullen and Koch
2003; Li et al., 2002; Reddy et al., 2006; Honey et al., 2008). Moreover, it was shown that
agnostic patients (with disorders involving the conscious recognition of objects) can perform
rapid categorization (Boucart et al., 2010).
Ultra-rapid categorization is useful to study the minimal mechanisms to process visual
stimuli in order to class them into semantic categories. In order to study conscious objects
representations, less stringent approaches are needed. As we have discussed in the
introduction, attention is the door to higher-level and conscious representations. In the next
section we will temporary set aside our study on visual representations in order to study the
dynamics of attention: the key to higher level representations.
Where and when spatial is attention deployed?
81
C. Where and when spatial is attention deployed?
Attention is the key to the doors of conscious perception. Selecting a part of all available
information, it guides the visual system towards the elements of the visual field that deserve
to be treated as priority. It allows making sense of the plethora of information arriving from
our sensory systems by filtering irrelevant stimuli. It can select stimuli attributes belonging
to a variety of dimensions—color, location, shape, etc. In the case of spatial attention,
stimuli lying within the part of the visual field where it is deployed are processed faster
and/or more accurately. The deployment of spatial attention takes some time and it fades
away after a while. Even though many studies of spatial attention have been separately
focused on its spatial deployment or temporal dynamics, few studies have considered its
spatiotemporal dynamics as a subject of study.
Thus, no systematical approach has succeeded in generating a complete picture of where
and when the doors of perception are opened by spatial attention. Does the spatial pattern
of attention evolve across time?
I. The paper of Tse, 2004
Few works have directly addressed the question of how spatial attention evolves over time.
One of these attempts is the work of Peter Tse (Tse, 2004), in which a mapping of attention
in space and time was performed using a change blindness paradigm. The experimental
setup consisted in a colored point-pattern (Figure 20a, frame 1) which was showed during
306 ms (Figure 20a, frame 2). After that, an exogenous cue was flashed during 47 ms at 1 of
4 possible locations (Figure 20a, frame 3). This pattern was maintained for a certain amount
of time (12, 82, 153 or 447 ms) followed by a blank screen flashed for 47 ms (Figure 20a,
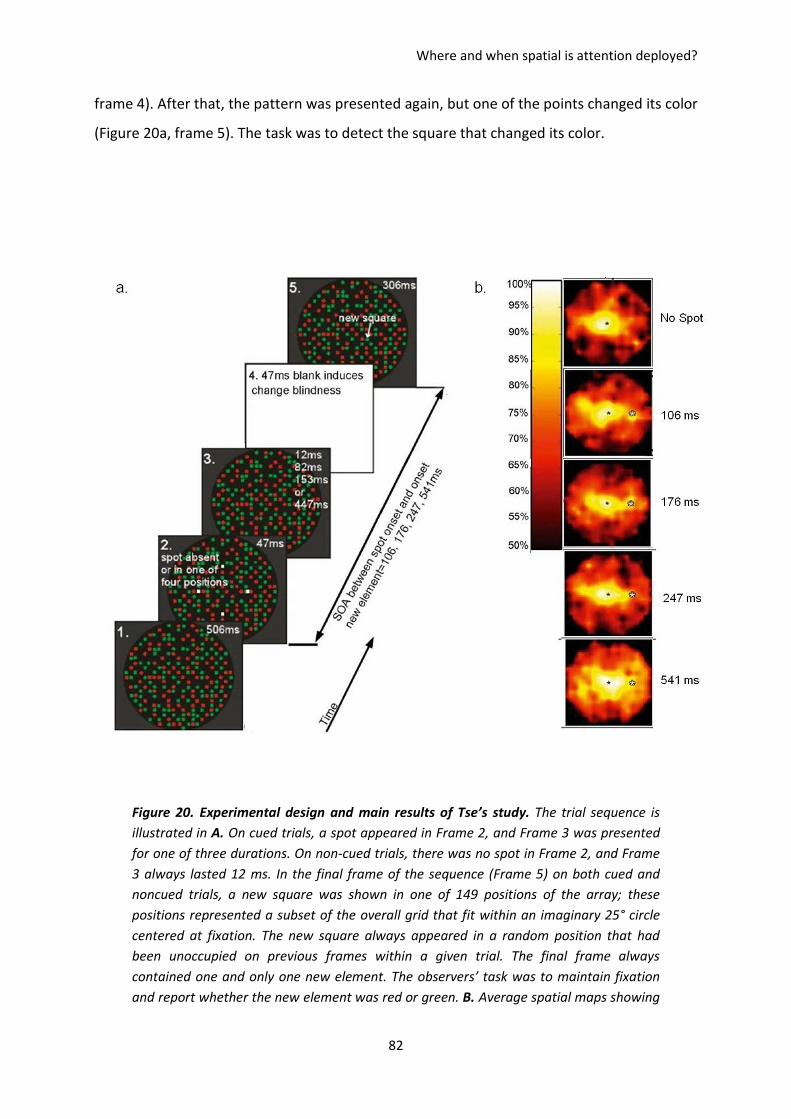
Where and when spatial is attention deployed?
82
frame 4). After that, the pattern was presented again, but one of the points changed its color
(Figure 20a, frame 5). The task was to detect the square that changed its color.
Figure 20. Experimental design and main results of Tse’s study. The trial sequence is
illustrated in A. On cued trials, a spot appeared in Frame 2, and Frame 3 was presented
for one of three durations. On non-cued trials, there was no spot in Frame 2, and Frame
3 always lasted 12 ms. In the final frame of the sequence (Frame 5) on both cued and
noncued trials, a new square was shown in one of 149 positions of the array; these
positions represented a subset of the overall grid that fit within an imaginary 25° circle
centered at fixation. The new square always appeared in a random position that had
been unoccupied on previous frames within a given trial. The final frame always
contained one and only one new element. The observers’ task was to maintain fixation
and report whether the new element was red or green. B. Average spatial maps showing
Where and when spatial is attention deployed?
83
the attention effects as a color code. The attention effect is represented as the
percentage correct for no-cue trials (top panel, ‘no spot’) and cued trials (the cue position
is represented by a white star) with each SOA. Each of the 149 tested locations shown in
panel A could have a maximum of 30 correct responses. The fixation point is indicated at
the center of each map (Modified from Tse, 2004).
The principal result of this work is an enhancing attentional effect opposite the cued
location, which, in some cases, was greater than the one at the cued location. Still, this work
failed to show any clear modulation of the attentional pattern across time. By and large, the
interdependence between spatial and temporal dimensions of attention remains an
unanswered question: How does the spatial pattern of attention evolve across time?

Where and when spatial is attention deployed?
84
II. Paper 2. Koenig-Robert & VanRullen, Journal of Vision
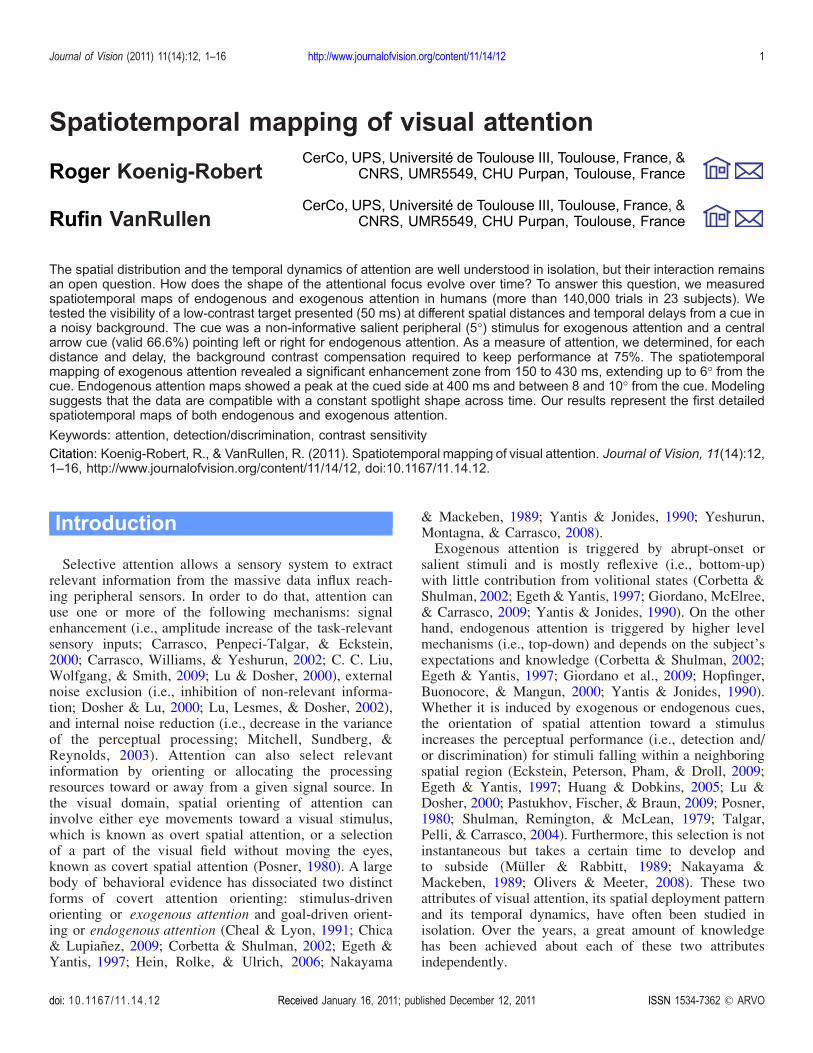
Spatiotemporal mapping of visual attentionCerCo, UPS, Université de Toulouse III, Toulouse, France, &
CNRS, UMR5549, CHU Purpan, Toulouse, FranceRoger Koenig-Robert
CerCo, UPS, Université de Toulouse III, Toulouse, France, &CNRS, UMR5549, CHU Purpan, Toulouse, FranceRufin VanRullen
The spatial distribution and the temporal dynamics of attention are well understood in isolation, but their interaction remainsan open question. How does the shape of the attentional focus evolve over time? To answer this question, we measuredspatiotemporal maps of endogenous and exogenous attention in humans (more than 140,000 trials in 23 subjects). Wetested the visibility of a low-contrast target presented (50 ms) at different spatial distances and temporal delays from a cue ina noisy background. The cue was a non-informative salient peripheral (5-) stimulus for exogenous attention and a centralarrow cue (valid 66.6%) pointing left or right for endogenous attention. As a measure of attention, we determined, for eachdistance and delay, the background contrast compensation required to keep performance at 75%. The spatiotemporalmapping of exogenous attention revealed a significant enhancement zone from 150 to 430 ms, extending up to 6- from thecue. Endogenous attention maps showed a peak at the cued side at 400 ms and between 8 and 10- from the cue. Modelingsuggests that the data are compatible with a constant spotlight shape across time. Our results represent the first detailedspatiotemporal maps of both endogenous and exogenous attention.
Keywords: attention, detection/discrimination, contrast sensitivity
Citation: Koenig-Robert, R., & VanRullen, R. (2011). Spatiotemporal mapping of visual attention. Journal of Vision, 11(14):12,1–16, http://www.journalofvision.org/content/11/14/12, doi:10.1167/11.14.12.
Introduction
Selective attention allows a sensory system to extractrelevant information from the massive data influx reach-ing peripheral sensors. In order to do that, attention canuse one or more of the following mechanisms: signalenhancement (i.e., amplitude increase of the task-relevantsensory inputs; Carrasco, Penpeci-Talgar, & Eckstein,2000; Carrasco, Williams, & Yeshurun, 2002; C. C. Liu,Wolfgang, & Smith, 2009; Lu & Dosher, 2000), externalnoise exclusion (i.e., inhibition of non-relevant informa-tion; Dosher & Lu, 2000; Lu, Lesmes, & Dosher, 2002),and internal noise reduction (i.e., decrease in the varianceof the perceptual processing; Mitchell, Sundberg, &Reynolds, 2003). Attention can also select relevantinformation by orienting or allocating the processingresources toward or away from a given signal source. Inthe visual domain, spatial orienting of attention caninvolve either eye movements toward a visual stimulus,which is known as overt spatial attention, or a selectionof a part of the visual field without moving the eyes,known as covert spatial attention (Posner, 1980). A largebody of behavioral evidence has dissociated two distinctforms of covert attention orienting: stimulus-drivenorienting or exogenous attention and goal-driven orient-ing or endogenous attention (Cheal & Lyon, 1991; Chica& Lupianez, 2009; Corbetta & Shulman, 2002; Egeth &Yantis, 1997; Hein, Rolke, & Ulrich, 2006; Nakayama
& Mackeben, 1989; Yantis & Jonides, 1990; Yeshurun,Montagna, & Carrasco, 2008).Exogenous attention is triggered by abrupt-onset or
salient stimuli and is mostly reflexive (i.e., bottom-up)with little contribution from volitional states (Corbetta &Shulman, 2002; Egeth &Yantis, 1997; Giordano, McElree,& Carrasco, 2009; Yantis & Jonides, 1990). On the otherhand, endogenous attention is triggered by higher levelmechanisms (i.e., top-down) and depends on the subject’sexpectations and knowledge (Corbetta & Shulman, 2002;Egeth & Yantis, 1997; Giordano et al., 2009; Hopfinger,Buonocore, & Mangun, 2000; Yantis & Jonides, 1990).Whether it is induced by exogenous or endogenous cues,the orientation of spatial attention toward a stimulusincreases the perceptual performance (i.e., detection and/or discrimination) for stimuli falling within a neighboringspatial region (Eckstein, Peterson, Pham, & Droll, 2009;Egeth & Yantis, 1997; Huang & Dobkins, 2005; Lu &Dosher, 2000; Pastukhov, Fischer, & Braun, 2009; Posner,1980; Shulman, Remington, & McLean, 1979; Talgar,Pelli, & Carrasco, 2004). Furthermore, this selection is notinstantaneous but takes a certain time to develop andto subside (Muller & Rabbitt, 1989; Nakayama &Mackeben, 1989; Olivers & Meeter, 2008). These twoattributes of visual attention, its spatial deployment patternand its temporal dynamics, have often been studied inisolation. Over the years, a great amount of knowledgehas been achieved about each of these two attributesindependently.
Journal of Vision (2011) 11(14):12, 1–16 http://www.journalofvision.org/content/11/14/12 1
doi: 10 .1167 /11 .14 .12 Received January 16, 2011; published December 12, 2011 ISSN 1534-7362 * ARVO
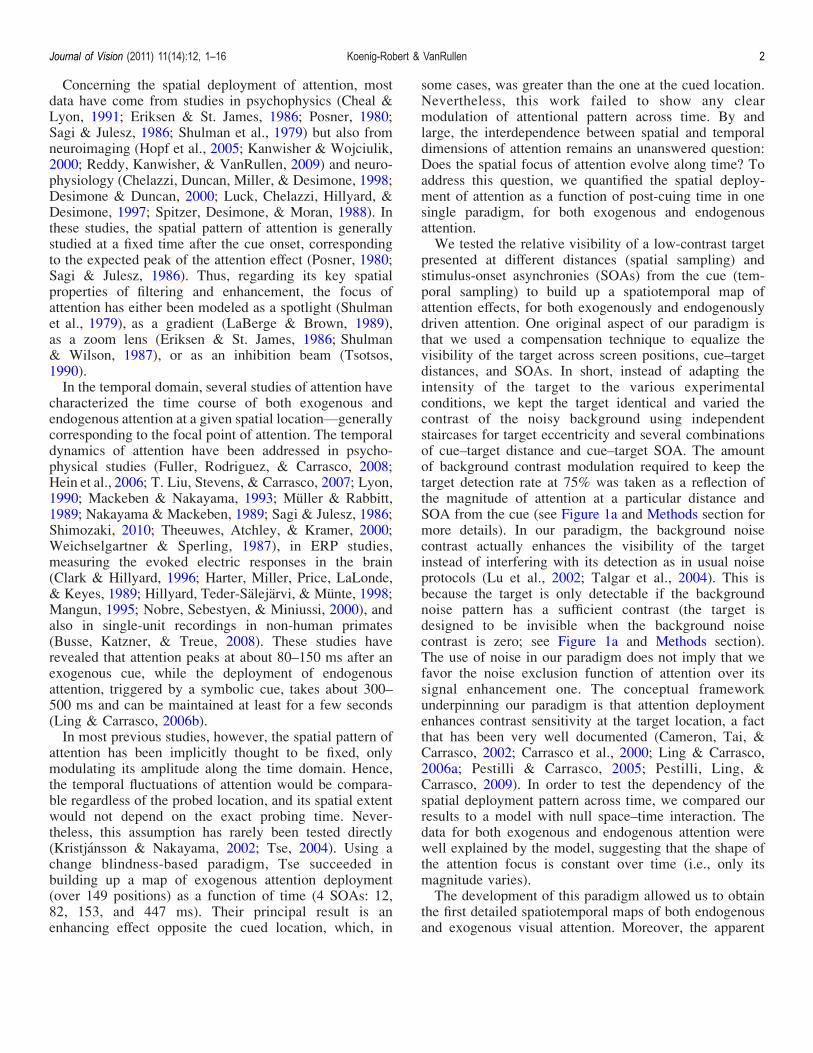
Concerning the spatial deployment of attention, mostdata have come from studies in psychophysics (Cheal &Lyon, 1991; Eriksen & St. James, 1986; Posner, 1980;Sagi & Julesz, 1986; Shulman et al., 1979) but also fromneuroimaging (Hopf et al., 2005; Kanwisher & Wojciulik,2000; Reddy, Kanwisher, & VanRullen, 2009) and neuro-physiology (Chelazzi, Duncan, Miller, & Desimone, 1998;Desimone & Duncan, 2000; Luck, Chelazzi, Hillyard, &Desimone, 1997; Spitzer, Desimone, & Moran, 1988). Inthese studies, the spatial pattern of attention is generallystudied at a fixed time after the cue onset, correspondingto the expected peak of the attention effect (Posner, 1980;Sagi & Julesz, 1986). Thus, regarding its key spatialproperties of filtering and enhancement, the focus ofattention has either been modeled as a spotlight (Shulmanet al., 1979), as a gradient (LaBerge & Brown, 1989),as a zoom lens (Eriksen & St. James, 1986; Shulman& Wilson, 1987), or as an inhibition beam (Tsotsos,1990).In the temporal domain, several studies of attention have
characterized the time course of both exogenous andendogenous attention at a given spatial locationVgenerallycorresponding to the focal point of attention. The temporaldynamics of attention have been addressed in psycho-physical studies (Fuller, Rodriguez, & Carrasco, 2008;Hein et al., 2006; T. Liu, Stevens, & Carrasco, 2007; Lyon,1990; Mackeben & Nakayama, 1993; Muller & Rabbitt,1989; Nakayama & Mackeben, 1989; Sagi & Julesz, 1986;Shimozaki, 2010; Theeuwes, Atchley, & Kramer, 2000;Weichselgartner & Sperling, 1987), in ERP studies,measuring the evoked electric responses in the brain(Clark & Hillyard, 1996; Harter, Miller, Price, LaLonde,& Keyes, 1989; Hillyard, Teder-Salejarvi, & Munte, 1998;Mangun, 1995; Nobre, Sebestyen, & Miniussi, 2000), andalso in single-unit recordings in non-human primates(Busse, Katzner, & Treue, 2008). These studies haverevealed that attention peaks at about 80–150 ms after anexogenous cue, while the deployment of endogenousattention, triggered by a symbolic cue, takes about 300–500 ms and can be maintained at least for a few seconds(Ling & Carrasco, 2006b).In most previous studies, however, the spatial pattern of
attention has been implicitly thought to be fixed, onlymodulating its amplitude along the time domain. Hence,the temporal fluctuations of attention would be compara-ble regardless of the probed location, and its spatial extentwould not depend on the exact probing time. Never-theless, this assumption has rarely been tested directly(Kristjansson & Nakayama, 2002; Tse, 2004). Using achange blindness-based paradigm, Tse succeeded inbuilding up a map of exogenous attention deployment(over 149 positions) as a function of time (4 SOAs: 12,82, 153, and 447 ms). Their principal result is anenhancing effect opposite the cued location, which, in
some cases, was greater than the one at the cued location.Nevertheless, this work failed to show any clearmodulation of attentional pattern across time. By andlarge, the interdependence between spatial and temporaldimensions of attention remains an unanswered question:Does the spatial focus of attention evolve along time? Toaddress this question, we quantified the spatial deploy-ment of attention as a function of post-cuing time in onesingle paradigm, for both exogenous and endogenousattention.We tested the relative visibility of a low-contrast target
presented at different distances (spatial sampling) andstimulus-onset asynchronies (SOAs) from the cue (tem-poral sampling) to build up a spatiotemporal map ofattention effects, for both exogenously and endogenouslydriven attention. One original aspect of our paradigm isthat we used a compensation technique to equalize thevisibility of the target across screen positions, cue–targetdistances, and SOAs. In short, instead of adapting theintensity of the target to the various experimentalconditions, we kept the target identical and varied thecontrast of the noisy background using independentstaircases for target eccentricity and several combinationsof cue–target distance and cue–target SOA. The amountof background contrast modulation required to keep thetarget detection rate at 75% was taken as a reflection ofthe magnitude of attention at a particular distance andSOA from the cue (see Figure 1a and Methods section formore details). In our paradigm, the background noisecontrast actually enhances the visibility of the targetinstead of interfering with its detection as in usual noiseprotocols (Lu et al., 2002; Talgar et al., 2004). This isbecause the target is only detectable if the backgroundnoise pattern has a sufficient contrast (the target isdesigned to be invisible when the background noisecontrast is zero; see Figure 1a and Methods section).The use of noise in our paradigm does not imply that wefavor the noise exclusion function of attention over itssignal enhancement one. The conceptual frameworkunderpinning our paradigm is that attention deploymentenhances contrast sensitivity at the target location, a factthat has been very well documented (Cameron, Tai, &Carrasco, 2002; Carrasco et al., 2000; Ling & Carrasco,2006a; Pestilli & Carrasco, 2005; Pestilli, Ling, &Carrasco, 2009). In order to test the dependency of thespatial deployment pattern across time, we compared ourresults to a model with null space–time interaction. Thedata for both exogenous and endogenous attention werewell explained by the model, suggesting that the shape ofthe attention focus is constant over time (i.e., only itsmagnitude varies).The development of this paradigm allowed us to obtain
the first detailed spatiotemporal maps of both endogenousand exogenous visual attention. Moreover, the apparent
Journal of Vision (2011) 11(14):12, 1–16 Koenig-Robert & VanRullen 2
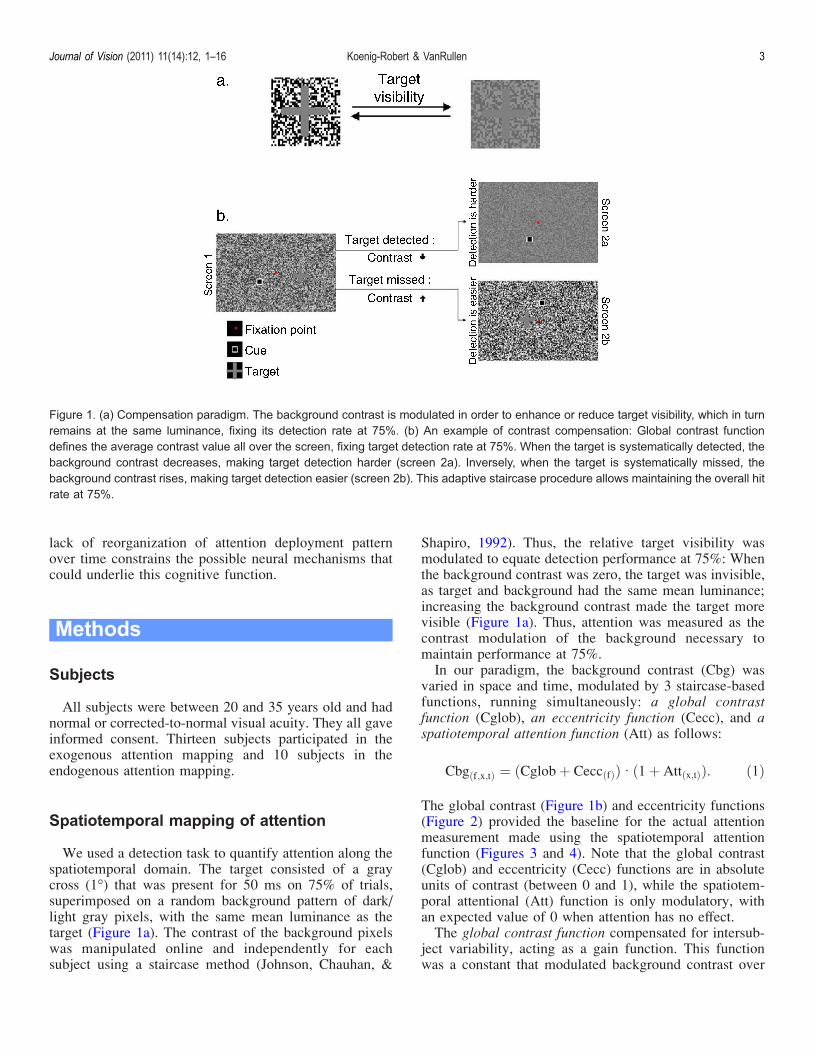
lack of reorganization of attention deployment patternover time constrains the possible neural mechanisms thatcould underlie this cognitive function.
Methods
Subjects
All subjects were between 20 and 35 years old and hadnormal or corrected-to-normal visual acuity. They all gaveinformed consent. Thirteen subjects participated in theexogenous attention mapping and 10 subjects in theendogenous attention mapping.
Spatiotemporal mapping of attention
We used a detection task to quantify attention along thespatiotemporal domain. The target consisted of a graycross (1-) that was present for 50 ms on 75% of trials,superimposed on a random background pattern of dark/light gray pixels, with the same mean luminance as thetarget (Figure 1a). The contrast of the background pixelswas manipulated online and independently for eachsubject using a staircase method (Johnson, Chauhan, &
Shapiro, 1992). Thus, the relative target visibility wasmodulated to equate detection performance at 75%: Whenthe background contrast was zero, the target was invisible,as target and background had the same mean luminance;increasing the background contrast made the target morevisible (Figure 1a). Thus, attention was measured as thecontrast modulation of the background necessary tomaintain performance at 75%.In our paradigm, the background contrast (Cbg) was
varied in space and time, modulated by 3 staircase-basedfunctions, running simultaneously: a global contrastfunction (Cglob), an eccentricity function (Cecc), and aspatiotemporal attention function (Att) as follows:
Cbgðf;x;tÞ ¼ ðCglobþ CeccðfÞÞ I ð1þ Attðx;tÞÞ: ð1Þ
The global contrast (Figure 1b) and eccentricity functions(Figure 2) provided the baseline for the actual attentionmeasurement made using the spatiotemporal attentionfunction (Figures 3 and 4). Note that the global contrast(Cglob) and eccentricity (Cecc) functions are in absoluteunits of contrast (between 0 and 1), while the spatiotem-poral attentional (Att) function is only modulatory, withan expected value of 0 when attention has no effect.The global contrast function compensated for intersub-
ject variability, acting as a gain function. This functionwas a constant that modulated background contrast over
Figure 1. (a) Compensation paradigm. The background contrast is modulated in order to enhance or reduce target visibility, which in turnremains at the same luminance, fixing its detection rate at 75%. (b) An example of contrast compensation: Global contrast functiondefines the average contrast value all over the screen, fixing target detection rate at 75%. When the target is systematically detected, thebackground contrast decreases, making target detection harder (screen 2a). Inversely, when the target is systematically missed, thebackground contrast rises, making target detection easier (screen 2b). This adaptive staircase procedure allows maintaining the overall hitrate at 75%.
Journal of Vision (2011) 11(14):12, 1–16 Koenig-Robert & VanRullen 3
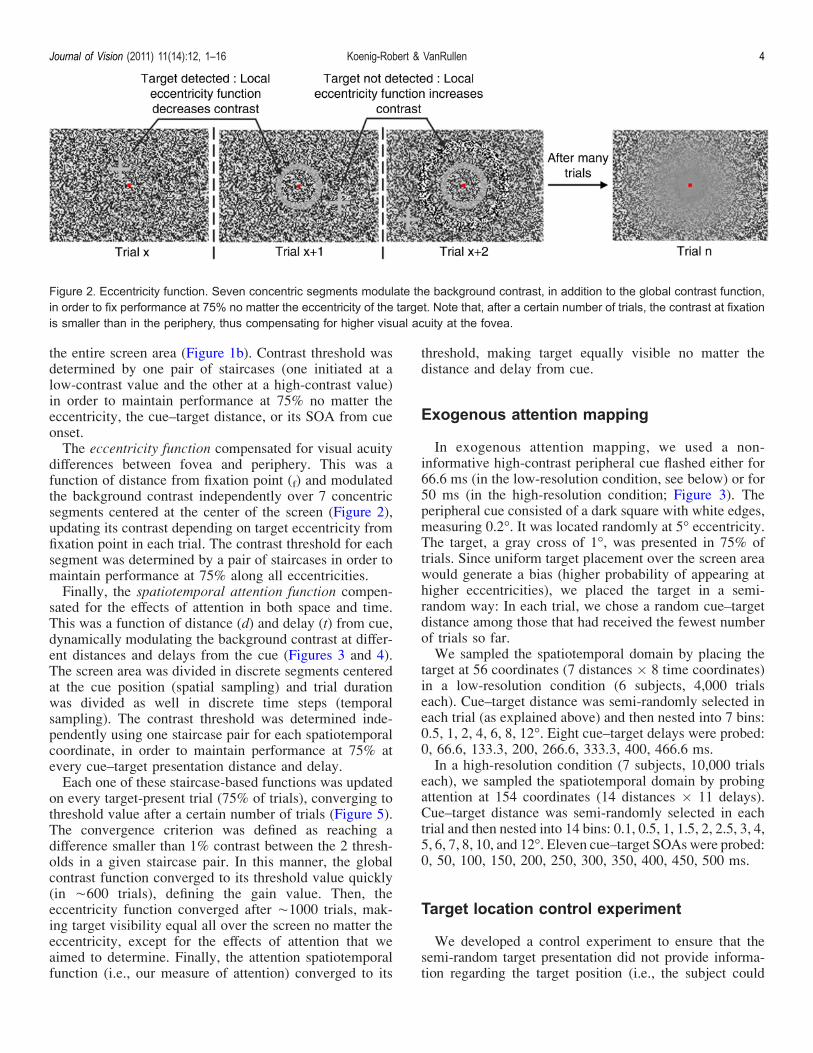
the entire screen area (Figure 1b). Contrast threshold wasdetermined by one pair of staircases (one initiated at alow-contrast value and the other at a high-contrast value)in order to maintain performance at 75% no matter theeccentricity, the cue–target distance, or its SOA from cueonset.The eccentricity function compensated for visual acuity
differences between fovea and periphery. This was afunction of distance from fixation point (f) and modulatedthe background contrast independently over 7 concentricsegments centered at the center of the screen (Figure 2),updating its contrast depending on target eccentricity fromfixation point in each trial. The contrast threshold for eachsegment was determined by a pair of staircases in order tomaintain performance at 75% along all eccentricities.Finally, the spatiotemporal attention function compen-
sated for the effects of attention in both space and time.This was a function of distance (d) and delay (t) from cue,dynamically modulating the background contrast at differ-ent distances and delays from the cue (Figures 3 and 4).The screen area was divided in discrete segments centeredat the cue position (spatial sampling) and trial durationwas divided as well in discrete time steps (temporalsampling). The contrast threshold was determined inde-pendently using one staircase pair for each spatiotemporalcoordinate, in order to maintain performance at 75% atevery cue–target presentation distance and delay.Each one of these staircase-based functions was updated
on every target-present trial (75% of trials), converging tothreshold value after a certain number of trials (Figure 5).The convergence criterion was defined as reaching adifference smaller than 1% contrast between the 2 thresh-olds in a given staircase pair. In this manner, the globalcontrast function converged to its threshold value quickly(in È600 trials), defining the gain value. Then, theeccentricity function converged after È1000 trials, mak-ing target visibility equal all over the screen no matter theeccentricity, except for the effects of attention that weaimed to determine. Finally, the attention spatiotemporalfunction (i.e., our measure of attention) converged to its
threshold, making target equally visible no matter thedistance and delay from cue.
Exogenous attention mapping
In exogenous attention mapping, we used a non-informative high-contrast peripheral cue flashed either for66.6 ms (in the low-resolution condition, see below) or for50 ms (in the high-resolution condition; Figure 3). Theperipheral cue consisted of a dark square with white edges,measuring 0.2-. It was located randomly at 5- eccentricity.The target, a gray cross of 1-, was presented in 75% oftrials. Since uniform target placement over the screen areawould generate a bias (higher probability of appearing athigher eccentricities), we placed the target in a semi-random way: In each trial, we chose a random cue–targetdistance among those that had received the fewest numberof trials so far.We sampled the spatiotemporal domain by placing the
target at 56 coordinates (7 distances � 8 time coordinates)in a low-resolution condition (6 subjects, 4,000 trialseach). Cue–target distance was semi-randomly selected ineach trial (as explained above) and then nested into 7 bins:0.5, 1, 2, 4, 6, 8, 12-. Eight cue–target delays were probed:0, 66.6, 133.3, 200, 266.6, 333.3, 400, 466.6 ms.In a high-resolution condition (7 subjects, 10,000 trials
each), we sampled the spatiotemporal domain by probingattention at 154 coordinates (14 distances � 11 delays).Cue–target distance was semi-randomly selected in eachtrial and then nested into 14 bins: 0.1, 0.5, 1, 1.5, 2, 2.5, 3, 4,5, 6, 7, 8, 10, and 12-. Eleven cue–target SOAswere probed:0, 50, 100, 150, 200, 250, 300, 350, 400, 450, 500 ms.
Target location control experiment
We developed a control experiment to ensure that thesemi-random target presentation did not provide informa-tion regarding the target position (i.e., the subject could
Figure 2. Eccentricity function. Seven concentric segments modulate the background contrast, in addition to the global contrast function,in order to fix performance at 75% no matter the eccentricity of the target. Note that, after a certain number of trials, the contrast at fixationis smaller than in the periphery, thus compensating for higher visual acuity at the fovea.
Journal of Vision (2011) 11(14):12, 1–16 Koenig-Robert & VanRullen 4
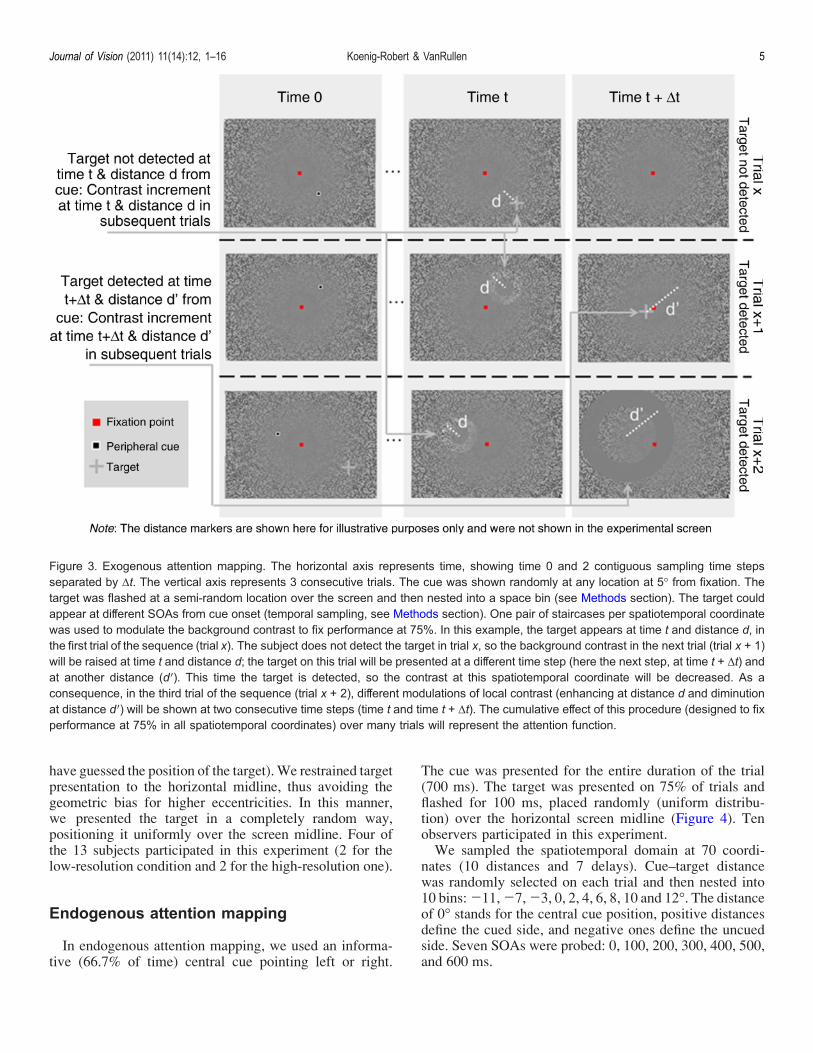
have guessed the position of the target).We restrained targetpresentation to the horizontal midline, thus avoiding thegeometric bias for higher eccentricities. In this manner,we presented the target in a completely random way,positioning it uniformly over the screen midline. Four ofthe 13 subjects participated in this experiment (2 for thelow-resolution condition and 2 for the high-resolution one).
Endogenous attention mapping
In endogenous attention mapping, we used an informa-tive (66.7% of time) central cue pointing left or right.
The cue was presented for the entire duration of the trial(700 ms). The target was presented on 75% of trials andflashed for 100 ms, placed randomly (uniform distribu-tion) over the horizontal screen midline (Figure 4). Tenobservers participated in this experiment.We sampled the spatiotemporal domain at 70 coordi-
nates (10 distances and 7 delays). Cue–target distancewas randomly selected on each trial and then nested into10 bins:j11,j7,j3, 0, 2, 4, 6, 8, 10 and 12-. The distanceof 0- stands for the central cue position, positive distancesdefine the cued side, and negative ones define the uncuedside. Seven SOAs were probed: 0, 100, 200, 300, 400, 500,and 600 ms.
Figure 3. Exogenous attention mapping. The horizontal axis represents time, showing time 0 and 2 contiguous sampling time stepsseparated by $t. The vertical axis represents 3 consecutive trials. The cue was shown randomly at any location at 5- from fixation. Thetarget was flashed at a semi-random location over the screen and then nested into a space bin (see Methods section). The target couldappear at different SOAs from cue onset (temporal sampling, see Methods section). One pair of staircases per spatiotemporal coordinatewas used to modulate the background contrast to fix performance at 75%. In this example, the target appears at time t and distance d, inthe first trial of the sequence (trial x). The subject does not detect the target in trial x, so the background contrast in the next trial (trial x + 1)will be raised at time t and distance d; the target on this trial will be presented at a different time step (here the next step, at time t + $t) andat another distance (dV). This time the target is detected, so the contrast at this spatiotemporal coordinate will be decreased. As aconsequence, in the third trial of the sequence (trial x + 2), different modulations of local contrast (enhancing at distance d and diminutionat distance dV) will be shown at two consecutive time steps (time t and time t + $t). The cumulative effect of this procedure (designed to fixperformance at 75% in all spatiotemporal coordinates) over many trials will represent the attention function.
Journal of Vision (2011) 11(14):12, 1–16 Koenig-Robert & VanRullen 5
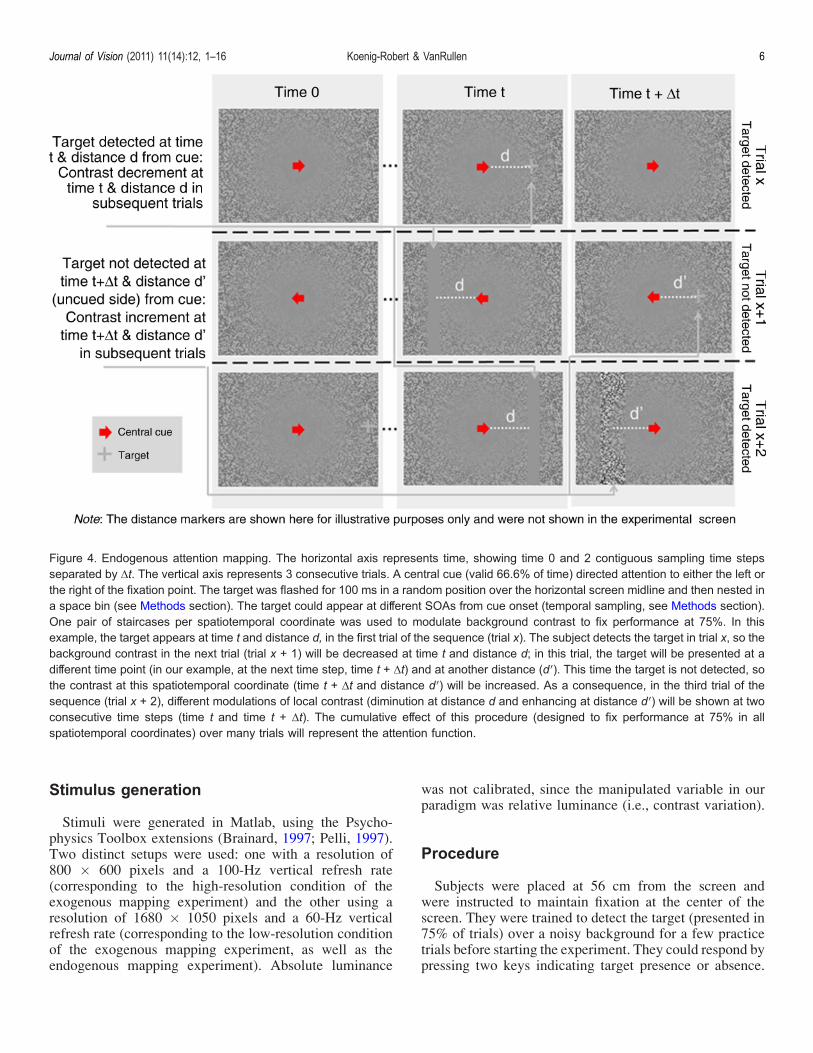
Stimulus generation
Stimuli were generated in Matlab, using the Psycho-physics Toolbox extensions (Brainard, 1997; Pelli, 1997).Two distinct setups were used: one with a resolution of800 � 600 pixels and a 100-Hz vertical refresh rate(corresponding to the high-resolution condition of theexogenous mapping experiment) and the other using aresolution of 1680 � 1050 pixels and a 60-Hz verticalrefresh rate (corresponding to the low-resolution conditionof the exogenous mapping experiment, as well as theendogenous mapping experiment). Absolute luminance
was not calibrated, since the manipulated variable in ourparadigm was relative luminance (i.e., contrast variation).
Procedure
Subjects were placed at 56 cm from the screen andwere instructed to maintain fixation at the center of thescreen. They were trained to detect the target (presented in75% of trials) over a noisy background for a few practicetrials before starting the experiment. They could respond bypressing two keys indicating target presence or absence.
Figure 4. Endogenous attention mapping. The horizontal axis represents time, showing time 0 and 2 contiguous sampling time stepsseparated by $t. The vertical axis represents 3 consecutive trials. A central cue (valid 66.6% of time) directed attention to either the left orthe right of the fixation point. The target was flashed for 100 ms in a random position over the horizontal screen midline and then nested ina space bin (see Methods section). The target could appear at different SOAs from cue onset (temporal sampling, see Methods section).One pair of staircases per spatiotemporal coordinate was used to modulate background contrast to fix performance at 75%. In thisexample, the target appears at time t and distance d, in the first trial of the sequence (trial x). The subject detects the target in trial x, so thebackground contrast in the next trial (trial x + 1) will be decreased at time t and distance d; in this trial, the target will be presented at adifferent time point (in our example, at the next time step, time t + $t) and at another distance (dV). This time the target is not detected, sothe contrast at this spatiotemporal coordinate (time t + $t and distance dV) will be increased. As a consequence, in the third trial of thesequence (trial x + 2), different modulations of local contrast (diminution at distance d and enhancing at distance dV) will be shown at twoconsecutive time steps (time t and time t + $t). The cumulative effect of this procedure (designed to fix performance at 75% in allspatiotemporal coordinates) over many trials will represent the attention function.
Journal of Vision (2011) 11(14):12, 1–16 Koenig-Robert & VanRullen 6
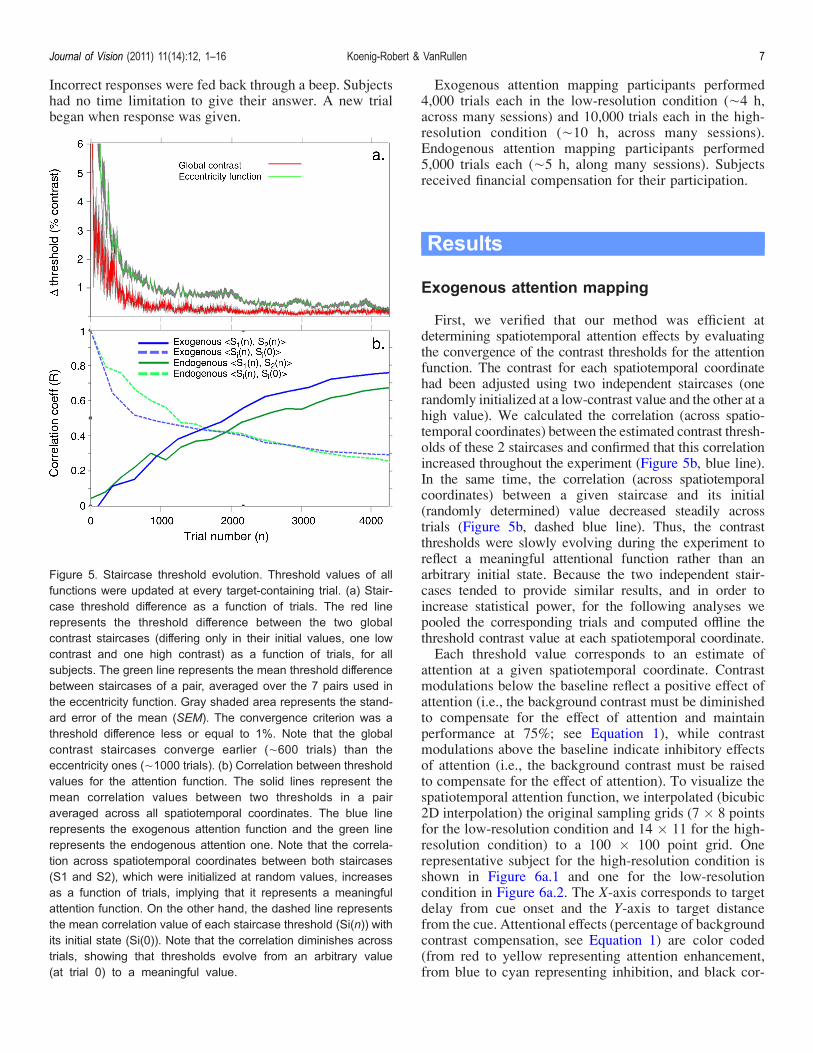
Incorrect responses were fed back through a beep. Subjectshad no time limitation to give their answer. A new trialbegan when response was given.
Exogenous attention mapping participants performed4,000 trials each in the low-resolution condition (È4 h,across many sessions) and 10,000 trials each in the high-resolution condition (È10 h, across many sessions).Endogenous attention mapping participants performed5,000 trials each (È5 h, along many sessions). Subjectsreceived financial compensation for their participation.
Results
Exogenous attention mapping
First, we verified that our method was efficient atdetermining spatiotemporal attention effects by evaluatingthe convergence of the contrast thresholds for the attentionfunction. The contrast for each spatiotemporal coordinatehad been adjusted using two independent staircases (onerandomly initialized at a low-contrast value and the other at ahigh value). We calculated the correlation (across spatio-temporal coordinates) between the estimated contrast thresh-olds of these 2 staircases and confirmed that this correlationincreased throughout the experiment (Figure 5b, blue line).In the same time, the correlation (across spatiotemporalcoordinates) between a given staircase and its initial(randomly determined) value decreased steadily acrosstrials (Figure 5b, dashed blue line). Thus, the contrastthresholds were slowly evolving during the experiment toreflect a meaningful attentional function rather than anarbitrary initial state. Because the two independent stair-cases tended to provide similar results, and in order toincrease statistical power, for the following analyses wepooled the corresponding trials and computed offline thethreshold contrast value at each spatiotemporal coordinate.Each threshold value corresponds to an estimate of
attention at a given spatiotemporal coordinate. Contrastmodulations below the baseline reflect a positive effect ofattention (i.e., the background contrast must be diminishedto compensate for the effect of attention and maintainperformance at 75%; see Equation 1), while contrastmodulations above the baseline indicate inhibitory effectsof attention (i.e., the background contrast must be raisedto compensate for the effect of attention). To visualize thespatiotemporal attention function, we interpolated (bicubic2D interpolation) the original sampling grids (7 � 8 pointsfor the low-resolution condition and 14 � 11 for the high-resolution condition) to a 100 � 100 point grid. Onerepresentative subject for the high-resolution condition isshown in Figure 6a.1 and one for the low-resolutioncondition in Figure 6a.2. The X-axis corresponds to targetdelay from cue onset and the Y-axis to target distancefrom the cue. Attentional effects (percentage of backgroundcontrast compensation, see Equation 1) are color coded(from red to yellow representing attention enhancement,from blue to cyan representing inhibition, and black cor-
Figure 5. Staircase threshold evolution. Threshold values of allfunctions were updated at every target-containing trial. (a) Stair-case threshold difference as a function of trials. The red linerepresents the threshold difference between the two globalcontrast staircases (differing only in their initial values, one lowcontrast and one high contrast) as a function of trials, for allsubjects. The green line represents the mean threshold differencebetween staircases of a pair, averaged over the 7 pairs used inthe eccentricity function. Gray shaded area represents the stand-ard error of the mean (SEM). The convergence criterion was athreshold difference less or equal to 1%. Note that the globalcontrast staircases converge earlier (È600 trials) than theeccentricity ones (È1000 trials). (b) Correlation between thresholdvalues for the attention function. The solid lines represent themean correlation values between two thresholds in a pairaveraged across all spatiotemporal coordinates. The blue linerepresents the exogenous attention function and the green linerepresents the endogenous attention one. Note that the correla-tion across spatiotemporal coordinates between both staircases(S1 and S2), which were initialized at random values, increasesas a function of trials, implying that it represents a meaningfulattention function. On the other hand, the dashed line representsthe mean correlation value of each staircase threshold (Si(n)) withits initial state (Si(0)). Note that the correlation diminishes acrosstrials, showing that thresholds evolve from an arbitrary value(at trial 0) to a meaningful value.
Journal of Vision (2011) 11(14):12, 1–16 Koenig-Robert & VanRullen 7
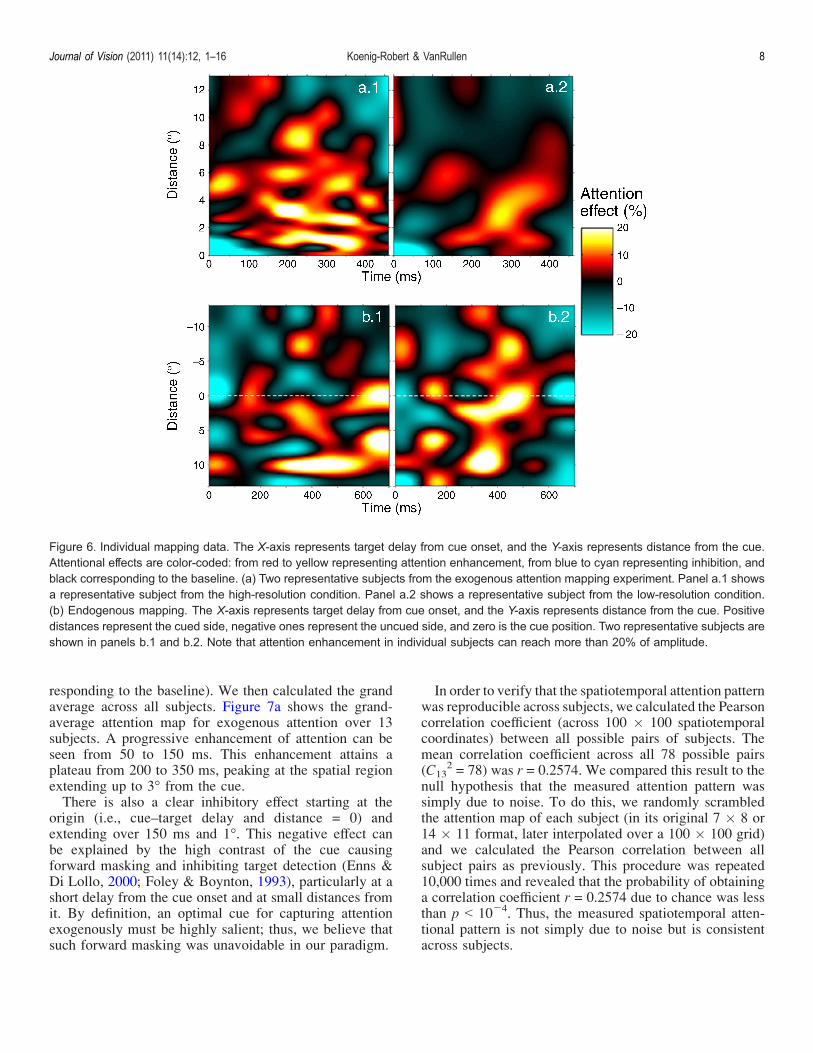
responding to the baseline). We then calculated the grandaverage across all subjects. Figure 7a shows the grand-average attention map for exogenous attention over 13subjects. A progressive enhancement of attention can beseen from 50 to 150 ms. This enhancement attains aplateau from 200 to 350 ms, peaking at the spatial regionextending up to 3- from the cue.There is also a clear inhibitory effect starting at the
origin (i.e., cue–target delay and distance = 0) andextending over 150 ms and 1-. This negative effect canbe explained by the high contrast of the cue causingforward masking and inhibiting target detection (Enns &Di Lollo, 2000; Foley & Boynton, 1993), particularly at ashort delay from the cue onset and at small distances fromit. By definition, an optimal cue for capturing attentionexogenously must be highly salient; thus, we believe thatsuch forward masking was unavoidable in our paradigm.
In order to verify that the spatiotemporal attention patternwas reproducible across subjects, we calculated the Pearsoncorrelation coefficient (across 100 � 100 spatiotemporalcoordinates) between all possible pairs of subjects. Themean correlation coefficient across all 78 possible pairs(C13
2 = 78) was r = 0.2574. We compared this result to thenull hypothesis that the measured attention pattern wassimply due to noise. To do this, we randomly scrambledthe attention map of each subject (in its original 7 � 8 or14 � 11 format, later interpolated over a 100 � 100 grid)and we calculated the Pearson correlation between allsubject pairs as previously. This procedure was repeated10,000 times and revealed that the probability of obtaininga correlation coefficient r = 0.2574 due to chance was lessthan p G 10j4. Thus, the measured spatiotemporal atten-tional pattern is not simply due to noise but is consistentacross subjects.
Figure 6. Individual mapping data. The X-axis represents target delay from cue onset, and the Y-axis represents distance from the cue.Attentional effects are color-coded: from red to yellow representing attention enhancement, from blue to cyan representing inhibition, andblack corresponding to the baseline. (a) Two representative subjects from the exogenous attention mapping experiment. Panel a.1 showsa representative subject from the high-resolution condition. Panel a.2 shows a representative subject from the low-resolution condition.(b) Endogenous mapping. The X-axis represents target delay from cue onset, and the Y-axis represents distance from the cue. Positivedistances represent the cued side, negative ones represent the uncued side, and zero is the cue position. Two representative subjects areshown in panels b.1 and b.2. Note that attention enhancement in individual subjects can reach more than 20% of amplitude.
Journal of Vision (2011) 11(14):12, 1–16 Koenig-Robert & VanRullen 8
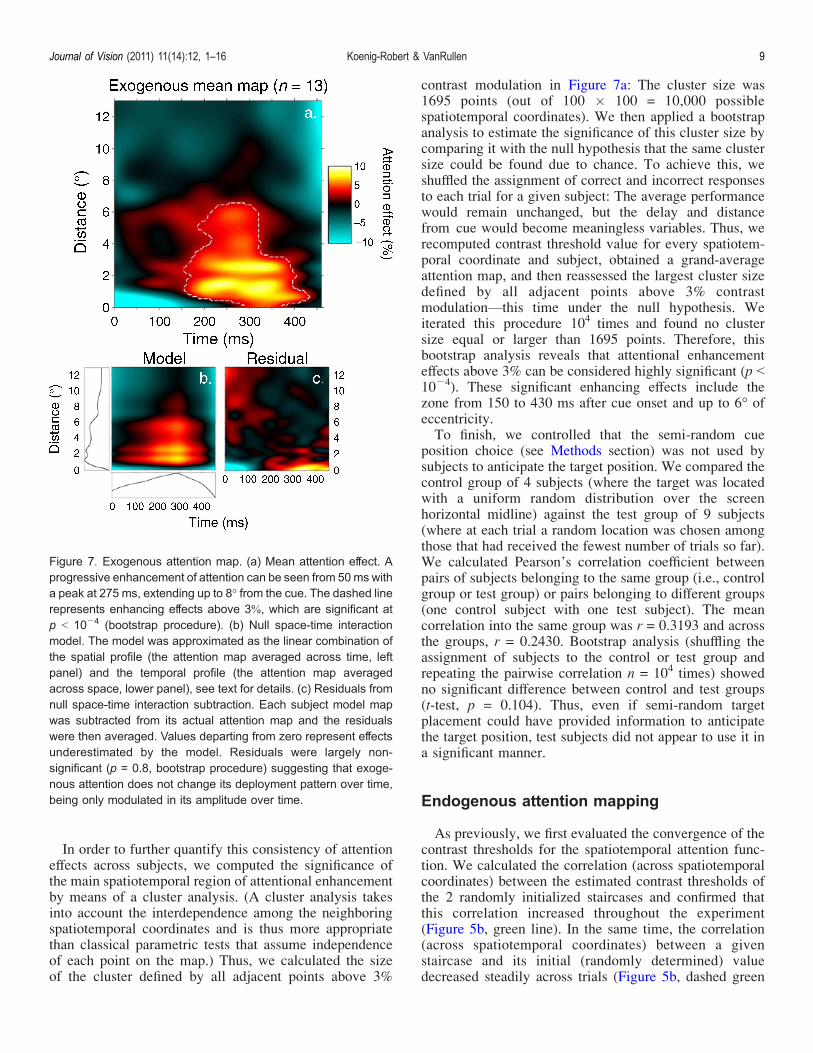
In order to further quantify this consistency of attentioneffects across subjects, we computed the significance ofthe main spatiotemporal region of attentional enhancementby means of a cluster analysis. (A cluster analysis takesinto account the interdependence among the neighboringspatiotemporal coordinates and is thus more appropriatethan classical parametric tests that assume independenceof each point on the map.) Thus, we calculated the sizeof the cluster defined by all adjacent points above 3%
contrast modulation in Figure 7a: The cluster size was1695 points (out of 100 � 100 = 10,000 possiblespatiotemporal coordinates). We then applied a bootstrapanalysis to estimate the significance of this cluster size bycomparing it with the null hypothesis that the same clustersize could be found due to chance. To achieve this, weshuffled the assignment of correct and incorrect responsesto each trial for a given subject: The average performancewould remain unchanged, but the delay and distancefrom cue would become meaningless variables. Thus, werecomputed contrast threshold value for every spatiotem-poral coordinate and subject, obtained a grand-averageattention map, and then reassessed the largest cluster sizedefined by all adjacent points above 3% contrastmodulationVthis time under the null hypothesis. Weiterated this procedure 104 times and found no clustersize equal or larger than 1695 points. Therefore, thisbootstrap analysis reveals that attentional enhancementeffects above 3% can be considered highly significant (p G10j4). These significant enhancing effects include thezone from 150 to 430 ms after cue onset and up to 6- ofeccentricity.To finish, we controlled that the semi-random cue
position choice (see Methods section) was not used bysubjects to anticipate the target position. We compared thecontrol group of 4 subjects (where the target was locatedwith a uniform random distribution over the screenhorizontal midline) against the test group of 9 subjects(where at each trial a random location was chosen amongthose that had received the fewest number of trials so far).We calculated Pearson’s correlation coefficient betweenpairs of subjects belonging to the same group (i.e., controlgroup or test group) or pairs belonging to different groups(one control subject with one test subject). The meancorrelation into the same group was r = 0.3193 and acrossthe groups, r = 0.2430. Bootstrap analysis (shuffling theassignment of subjects to the control or test group andrepeating the pairwise correlation n = 104 times) showedno significant difference between control and test groups(t-test, p = 0.104). Thus, even if semi-random targetplacement could have provided information to anticipatethe target position, test subjects did not appear to use it ina significant manner.
Endogenous attention mapping
As previously, we first evaluated the convergence of thecontrast thresholds for the spatiotemporal attention func-tion. We calculated the correlation (across spatiotemporalcoordinates) between the estimated contrast thresholds ofthe 2 randomly initialized staircases and confirmed thatthis correlation increased throughout the experiment(Figure 5b, green line). In the same time, the correlation(across spatiotemporal coordinates) between a givenstaircase and its initial (randomly determined) valuedecreased steadily across trials (Figure 5b, dashed green
Figure 7. Exogenous attention map. (a) Mean attention effect. Aprogressive enhancement of attention can be seen from 50ms witha peak at 275 ms, extending up to 8- from the cue. The dashed linerepresents enhancing effects above 3Q, which are significant atp G 10j4 (bootstrap procedure). (b) Null space-time interactionmodel. The model was approximated as the linear combination ofthe spatial profile (the attention map averaged across time, leftpanel) and the temporal profile (the attention map averagedacross space, lower panel), see text for details. (c) Residuals fromnull space-time interaction subtraction. Each subject model mapwas subtracted from its actual attention map and the residualswere then averaged. Values departing from zero represent effectsunderestimated by the model. Residuals were largely non-significant (p = 0.8, bootstrap procedure) suggesting that exoge-nous attention does not change its deployment pattern over time,being only modulated in its amplitude over time.
Journal of Vision (2011) 11(14):12, 1–16 Koenig-Robert & VanRullen 9
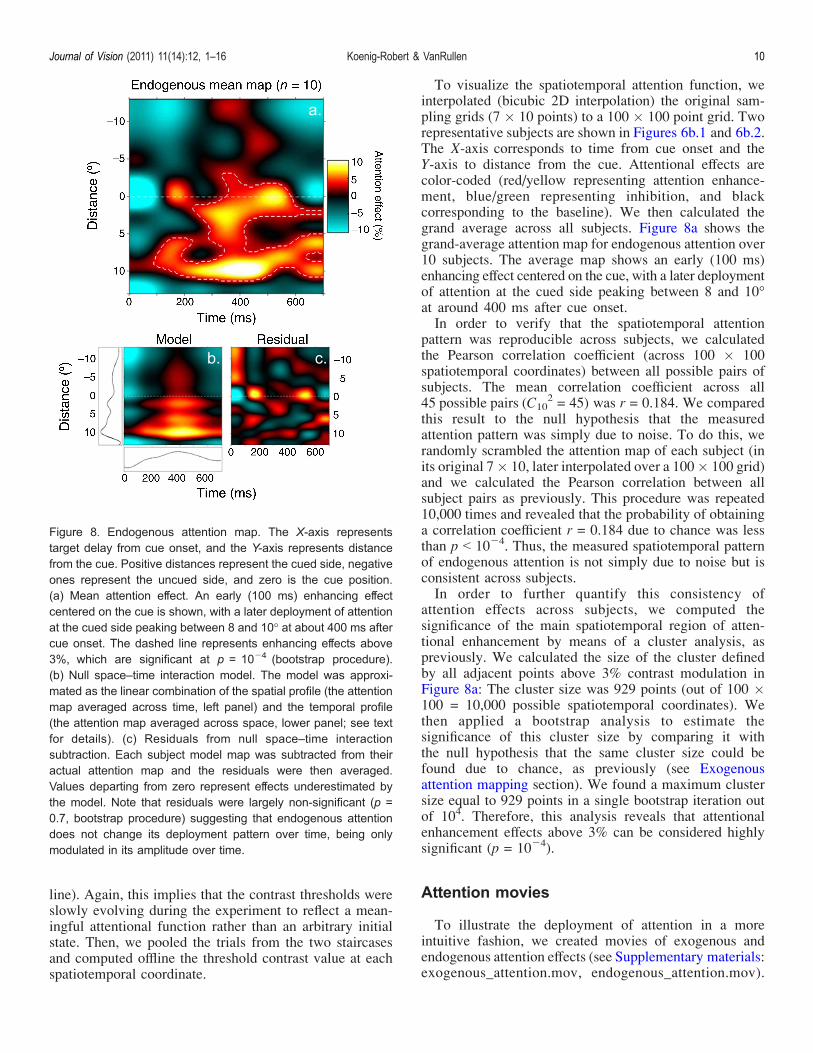
line). Again, this implies that the contrast thresholds wereslowly evolving during the experiment to reflect a mean-ingful attentional function rather than an arbitrary initialstate. Then, we pooled the trials from the two staircasesand computed offline the threshold contrast value at eachspatiotemporal coordinate.
To visualize the spatiotemporal attention function, weinterpolated (bicubic 2D interpolation) the original sam-pling grids (7 � 10 points) to a 100 � 100 point grid. Tworepresentative subjects are shown in Figures 6b.1 and 6b.2.The X-axis corresponds to time from cue onset and theY-axis to distance from the cue. Attentional effects arecolor-coded (red/yellow representing attention enhance-ment, blue/green representing inhibition, and blackcorresponding to the baseline). We then calculated thegrand average across all subjects. Figure 8a shows thegrand-average attention map for endogenous attention over10 subjects. The average map shows an early (100 ms)enhancing effect centered on the cue, with a later deploymentof attention at the cued side peaking between 8 and 10-at around 400 ms after cue onset.In order to verify that the spatiotemporal attention
pattern was reproducible across subjects, we calculatedthe Pearson correlation coefficient (across 100 � 100spatiotemporal coordinates) between all possible pairs ofsubjects. The mean correlation coefficient across all45 possible pairs (C10
2 = 45) was r = 0.184. We comparedthis result to the null hypothesis that the measuredattention pattern was simply due to noise. To do this, werandomly scrambled the attention map of each subject (inits original 7� 10, later interpolated over a 100� 100 grid)and we calculated the Pearson correlation between allsubject pairs as previously. This procedure was repeated10,000 times and revealed that the probability of obtaininga correlation coefficient r = 0.184 due to chance was lessthan p G 10j4. Thus, the measured spatiotemporal patternof endogenous attention is not simply due to noise but isconsistent across subjects.In order to further quantify this consistency of
attention effects across subjects, we computed thesignificance of the main spatiotemporal region of atten-tional enhancement by means of a cluster analysis, aspreviously. We calculated the size of the cluster definedby all adjacent points above 3% contrast modulation inFigure 8a: The cluster size was 929 points (out of 100 �100 = 10,000 possible spatiotemporal coordinates). Wethen applied a bootstrap analysis to estimate thesignificance of this cluster size by comparing it withthe null hypothesis that the same cluster size could befound due to chance, as previously (see Exogenousattention mapping section). We found a maximum clustersize equal to 929 points in a single bootstrap iteration outof 104. Therefore, this analysis reveals that attentionalenhancement effects above 3% can be considered highlysignificant (p = 10j4).
Attention movies
To illustrate the deployment of attention in a moreintuitive fashion, we created movies of exogenous andendogenous attention effects (see Supplementary materials:exogenous_attention.mov, endogenous_attention.mov).
Figure 8. Endogenous attention map. The X-axis representstarget delay from cue onset, and the Y-axis represents distancefrom the cue. Positive distances represent the cued side, negativeones represent the uncued side, and zero is the cue position.(a) Mean attention effect. An early (100 ms) enhancing effectcentered on the cue is shown, with a later deployment of attentionat the cued side peaking between 8 and 10- at about 400 ms aftercue onset. The dashed line represents enhancing effects above3%, which are significant at p = 10j4 (bootstrap procedure).(b) Null space–time interaction model. The model was approxi-mated as the linear combination of the spatial profile (the attentionmap averaged across time, left panel) and the temporal profile(the attention map averaged across space, lower panel; see textfor details). (c) Residuals from null space–time interactionsubtraction. Each subject model map was subtracted from theiractual attention map and the residuals were then averaged.Values departing from zero represent effects underestimated bythe model. Note that residuals were largely non-significant (p =0.7, bootstrap procedure) suggesting that endogenous attentiondoes not change its deployment pattern over time, being onlymodulated in its amplitude over time.
Journal of Vision (2011) 11(14):12, 1–16 Koenig-Robert & VanRullen 10
The movies represent the experimental screen, centeringthe attention effects over the peripheral cue for exogenousattention mapping, and over the central cue for theendogenous one.
Space–time interdependence
Our compensation method was efficient at providing adetailed spatiotemporal map of exogenous and endoge-nous attention. One important question to address iswhether the shape of the attentional focus changes overtime from cue onset. To assess this, we compared ourresults to a null space–time interaction model. Themodeled attention maps (Figure 7c for exogenous atten-tion and Figure 8c for endogenous attention) wereapproximated as the linear combination of the spatialprofile (i.e., the attention map averaged across time) andthe temporal profile (i.e., the attention map averagedacross space) as follows:
Attðx;tÞ ¼ kðSðxÞ I MðtÞÞ þ b; ð2Þ
where the spatiotemporal attention function Att(s,t) isdecomposed in two parts: one spatial subfunction S(s) thatcorresponds to the shape of the attentional focus and oneactivation function M(t) that reflects the magnitude ofattentional modulation as a function of time. The constantb represents baseline (i.e., average value of the spatio-temporal attention function), and k is a constant ofproportionality obtained as follows:
k ¼ 1=
ZZðAtt j bÞdxdt; ð3Þ
defining S and M as
SðxÞ ¼Z
ðAttj bÞdt; ð4Þ
MðtÞ ¼Z
ðAttj bÞdx: ð5Þ
We calculated the modeled map for each subject andthen subtracted it from the original map. The remainder ofthis subtraction is the attention effect that cannot beexplained by a null space–time interaction. The residualsof the exogenous (Figure 7d) and endogenous (Figure 8d)mapping do not show significant values (cluster analysis,p = 0.8 and p = 0.7, respectively), suggesting that thespatial attention deployment pattern does not changesignificantly over time but only modulates its amplitude.
Discussion
Spatiotemporal dynamics
Our paradigm allowed us to estimate, for the first time,a detailed spatiotemporal map for exogenous and endog-enous attentional effects, showing both enhancing andinhibitory effects.The exogenous attention map reveals a significant
enhancing effect zone from 150 to 430 ms, extending upto 6 deg from the cue. The enhancing effect is alreadyvisible (although not yet significant) at earlier latencies,rising progressively from 50 up to 150 ms. This slow andgradual rise could be due, in part, to forward masking bythe cue over the target (Enns & Di Lollo, 2000; Foley &Boynton, 1993), inducing inhibitory effects that couldcover up any earlier facilitatory attentional modulation.The enhancing effect in the exogenous attention map goesabove 7% of modulation (yellow blobs, Figure 7a) andplateaus from 200 to 350 ms, in a spatial region extendingup to 3- from the cue. This sustained effect could indicatea stabilization of the exogenous cuing, known to betriggered by predictive or interesting direct cues (Ward,2008). The peak of the enhancement effect reaches valuesof about 10% contrast modulation. This means that, in thisspatiotemporal facilitation zone, the target visibility is10% higher than in the rest of the screen. A weakerinhibitory effect surrounds this zone, with a peak value ofabout j5% between 100 and 200 ms and reaching aboutj8% of modulation after 450 ms. However, analysis ofindividual subjects’ data revealed that this later inhibitoryzone in the grand-average map was only due to twosubjects who adopted a strategy of reporting the absenceof the target whenever it appeared after 450 ms. None ofthe late inhibitory effects is suggestive of inhibition ofreturn (IOR)Vi.e., inhibition at previous attended loca-tions. The absence of IOR can be explained by the factthat our exogenous attention map is limited in time to466.6 ms, whereas IOR is known to appear with differentonsets, ranging from 300 to 600 ms (Klein, 2000); thus, itis possible that we did not sample enough delays to revealIOR in our paradigm. Previous reports have shown earliermodulations of transient attention using different para-digms. In a rapid serial visual presentation (RSVP)paradigm, Weichselgartner and Sperling (1987) measuredthe recall probability of the stream items occurring withand after the cue. They showed a cuing effect at latenciesas early as 20 ms, with a decline at about 200 ms. In adiscrimination task with a peripheral cue lasting 33 ms,Nakayama and Mackeben (1989) showed an enhancingpeak in accuracy at about 100 ms, with a fast onset (from0 toÈ100 ms) and a slower decline (fromÈ100 to 500 ms).In a similar setting, Muller and Rabbitt (1989) revealed apeak of performance at 175 ms after the cue onset.
Journal of Vision (2011) 11(14):12, 1–16 Koenig-Robert & VanRullen 11
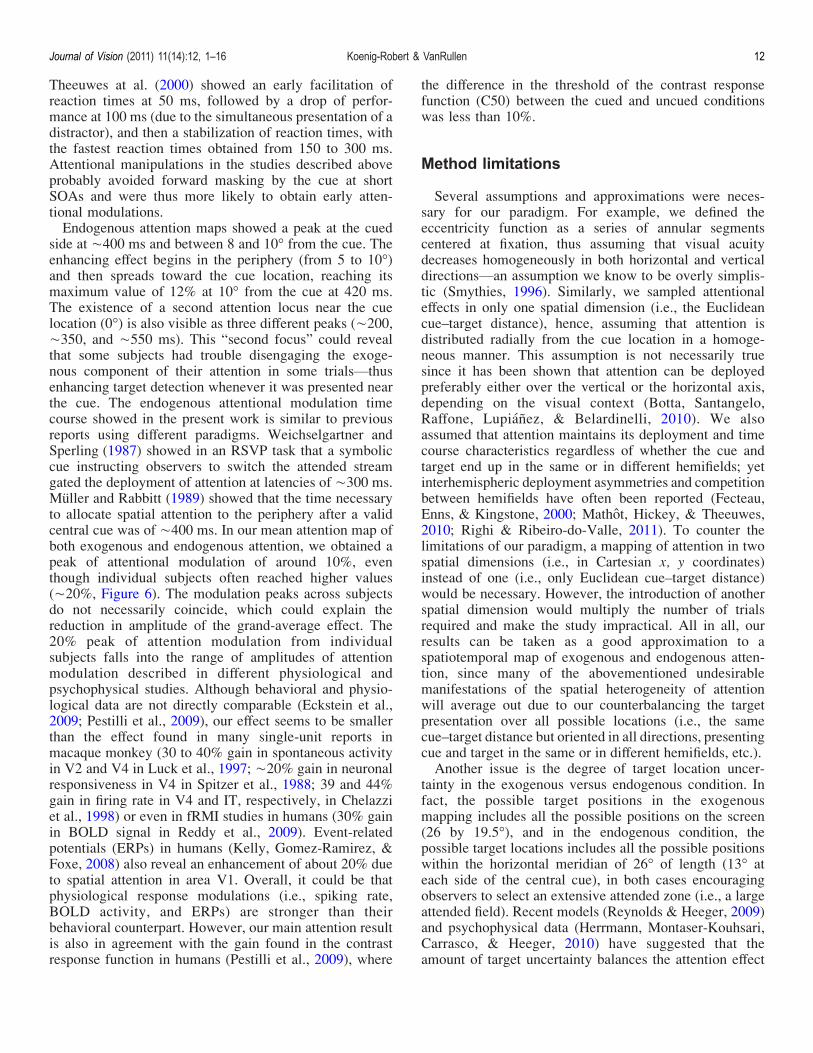
Theeuwes at al. (2000) showed an early facilitation ofreaction times at 50 ms, followed by a drop of perfor-mance at 100 ms (due to the simultaneous presentation of adistractor), and then a stabilization of reaction times, withthe fastest reaction times obtained from 150 to 300 ms.Attentional manipulations in the studies described aboveprobably avoided forward masking by the cue at shortSOAs and were thus more likely to obtain early atten-tional modulations.Endogenous attention maps showed a peak at the cued
side at È400 ms and between 8 and 10- from the cue. Theenhancing effect begins in the periphery (from 5 to 10-)and then spreads toward the cue location, reaching itsmaximum value of 12% at 10- from the cue at 420 ms.The existence of a second attention locus near the cuelocation (0-) is also visible as three different peaks (È200,È350, and È550 ms). This “second focus” could revealthat some subjects had trouble disengaging the exoge-nous component of their attention in some trialsVthusenhancing target detection whenever it was presented nearthe cue. The endogenous attentional modulation timecourse showed in the present work is similar to previousreports using different paradigms. Weichselgartner andSperling (1987) showed in an RSVP task that a symboliccue instructing observers to switch the attended streamgated the deployment of attention at latencies of È300 ms.Muller and Rabbitt (1989) showed that the time necessaryto allocate spatial attention to the periphery after a validcentral cue was of È400 ms. In our mean attention map ofboth exogenous and endogenous attention, we obtained apeak of attentional modulation of around 10%, eventhough individual subjects often reached higher values(È20%, Figure 6). The modulation peaks across subjectsdo not necessarily coincide, which could explain thereduction in amplitude of the grand-average effect. The20% peak of attention modulation from individualsubjects falls into the range of amplitudes of attentionmodulation described in different physiological andpsychophysical studies. Although behavioral and physio-logical data are not directly comparable (Eckstein et al.,2009; Pestilli et al., 2009), our effect seems to be smallerthan the effect found in many single-unit reports inmacaque monkey (30 to 40% gain in spontaneous activityin V2 and V4 in Luck et al., 1997; È20% gain in neuronalresponsiveness in V4 in Spitzer et al., 1988; 39 and 44%gain in firing rate in V4 and IT, respectively, in Chelazziet al., 1998) or even in fRMI studies in humans (30% gainin BOLD signal in Reddy et al., 2009). Event-relatedpotentials (ERPs) in humans (Kelly, Gomez-Ramirez, &Foxe, 2008) also reveal an enhancement of about 20% dueto spatial attention in area V1. Overall, it could be thatphysiological response modulations (i.e., spiking rate,BOLD activity, and ERPs) are stronger than theirbehavioral counterpart. However, our main attention resultis also in agreement with the gain found in the contrastresponse function in humans (Pestilli et al., 2009), where
the difference in the threshold of the contrast responsefunction (C50) between the cued and uncued conditionswas less than 10%.
Method limitations
Several assumptions and approximations were neces-sary for our paradigm. For example, we defined theeccentricity function as a series of annular segmentscentered at fixation, thus assuming that visual acuitydecreases homogeneously in both horizontal and verticaldirectionsVan assumption we know to be overly simplis-tic (Smythies, 1996). Similarly, we sampled attentionaleffects in only one spatial dimension (i.e., the Euclideancue–target distance), hence, assuming that attention isdistributed radially from the cue location in a homoge-neous manner. This assumption is not necessarily truesince it has been shown that attention can be deployedpreferably either over the vertical or the horizontal axis,depending on the visual context (Botta, Santangelo,Raffone, Lupianez, & Belardinelli, 2010). We alsoassumed that attention maintains its deployment and timecourse characteristics regardless of whether the cue andtarget end up in the same or in different hemifields; yetinterhemispheric deployment asymmetries and competitionbetween hemifields have often been reported (Fecteau,Enns, & Kingstone, 2000; Mathot, Hickey, & Theeuwes,2010; Righi & Ribeiro-do-Valle, 2011). To counter thelimitations of our paradigm, a mapping of attention in twospatial dimensions (i.e., in Cartesian x, y coordinates)instead of one (i.e., only Euclidean cue–target distance)would be necessary. However, the introduction of anotherspatial dimension would multiply the number of trialsrequired and make the study impractical. All in all, ourresults can be taken as a good approximation to aspatiotemporal map of exogenous and endogenous atten-tion, since many of the abovementioned undesirablemanifestations of the spatial heterogeneity of attentionwill average out due to our counterbalancing the targetpresentation over all possible locations (i.e., the samecue–target distance but oriented in all directions, presentingcue and target in the same or in different hemifields, etc.).Another issue is the degree of target location uncer-
tainty in the exogenous versus endogenous condition. Infact, the possible target positions in the exogenousmapping includes all the possible positions on the screen(26 by 19.5-), and in the endogenous condition, thepossible target locations includes all the possible positionswithin the horizontal meridian of 26- of length (13- ateach side of the central cue), in both cases encouragingobservers to select an extensive attended zone (i.e., a largeattended field). Recent models (Reynolds & Heeger, 2009)and psychophysical data (Herrmann, Montaser-Kouhsari,Carrasco, & Heeger, 2010) have suggested that theamount of target uncertainty balances the attention effect
Journal of Vision (2011) 11(14):12, 1–16 Koenig-Robert & VanRullen 12
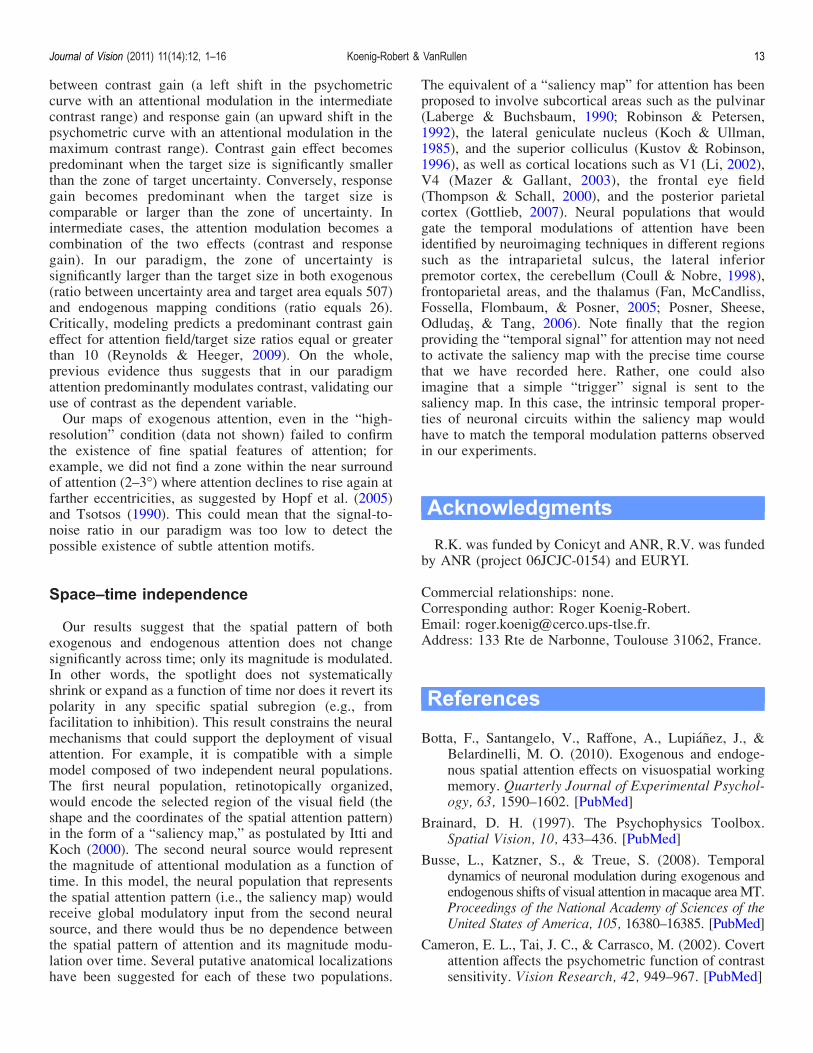
between contrast gain (a left shift in the psychometriccurve with an attentional modulation in the intermediatecontrast range) and response gain (an upward shift in thepsychometric curve with an attentional modulation in themaximum contrast range). Contrast gain effect becomespredominant when the target size is significantly smallerthan the zone of target uncertainty. Conversely, responsegain becomes predominant when the target size iscomparable or larger than the zone of uncertainty. Inintermediate cases, the attention modulation becomes acombination of the two effects (contrast and responsegain). In our paradigm, the zone of uncertainty issignificantly larger than the target size in both exogenous(ratio between uncertainty area and target area equals 507)and endogenous mapping conditions (ratio equals 26).Critically, modeling predicts a predominant contrast gaineffect for attention field/target size ratios equal or greaterthan 10 (Reynolds & Heeger, 2009). On the whole,previous evidence thus suggests that in our paradigmattention predominantly modulates contrast, validating ouruse of contrast as the dependent variable.Our maps of exogenous attention, even in the “high-
resolution” condition (data not shown) failed to confirmthe existence of fine spatial features of attention; forexample, we did not find a zone within the near surroundof attention (2–3-) where attention declines to rise again atfarther eccentricities, as suggested by Hopf et al. (2005)and Tsotsos (1990). This could mean that the signal-to-noise ratio in our paradigm was too low to detect thepossible existence of subtle attention motifs.
Space–time independence
Our results suggest that the spatial pattern of bothexogenous and endogenous attention does not changesignificantly across time; only its magnitude is modulated.In other words, the spotlight does not systematicallyshrink or expand as a function of time nor does it revert itspolarity in any specific spatial subregion (e.g., fromfacilitation to inhibition). This result constrains the neuralmechanisms that could support the deployment of visualattention. For example, it is compatible with a simplemodel composed of two independent neural populations.The first neural population, retinotopically organized,would encode the selected region of the visual field (theshape and the coordinates of the spatial attention pattern)in the form of a “saliency map,” as postulated by Itti andKoch (2000). The second neural source would representthe magnitude of attentional modulation as a function oftime. In this model, the neural population that representsthe spatial attention pattern (i.e., the saliency map) wouldreceive global modulatory input from the second neuralsource, and there would thus be no dependence betweenthe spatial pattern of attention and its magnitude modu-lation over time. Several putative anatomical localizationshave been suggested for each of these two populations.
The equivalent of a “saliency map” for attention has beenproposed to involve subcortical areas such as the pulvinar(Laberge & Buchsbaum, 1990; Robinson & Petersen,1992), the lateral geniculate nucleus (Koch & Ullman,1985), and the superior colliculus (Kustov & Robinson,1996), as well as cortical locations such as V1 (Li, 2002),V4 (Mazer & Gallant, 2003), the frontal eye field(Thompson & Schall, 2000), and the posterior parietalcortex (Gottlieb, 2007). Neural populations that wouldgate the temporal modulations of attention have beenidentified by neuroimaging techniques in different regionssuch as the intraparietal sulcus, the lateral inferiorpremotor cortex, the cerebellum (Coull & Nobre, 1998),frontoparietal areas, and the thalamus (Fan, McCandliss,Fossella, Flombaum, & Posner, 2005; Posner, Sheese,Odludas, & Tang, 2006). Note finally that the regionproviding the “temporal signal” for attention may not needto activate the saliency map with the precise time coursethat we have recorded here. Rather, one could alsoimagine that a simple “trigger” signal is sent to thesaliency map. In this case, the intrinsic temporal proper-ties of neuronal circuits within the saliency map wouldhave to match the temporal modulation patterns observedin our experiments.
Acknowledgments
R.K. was funded by Conicyt and ANR, R.V. was fundedby ANR (project 06JCJC-0154) and EURYI.
Commercial relationships: none.Corresponding author: Roger Koenig-Robert.Email: [email protected]: 133 Rte de Narbonne, Toulouse 31062, France.
References
Botta, F., Santangelo, V., Raffone, A., Lupianez, J., &Belardinelli, M. O. (2010). Exogenous and endoge-nous spatial attention effects on visuospatial workingmemory. Quarterly Journal of Experimental Psychol-ogy, 63, 1590–1602. [PubMed]
Brainard, D. H. (1997). The Psychophysics Toolbox.Spatial Vision, 10, 433–436. [PubMed]
Busse, L., Katzner, S., & Treue, S. (2008). Temporaldynamics of neuronal modulation during exogenous andendogenous shifts of visual attention inmacaque areaMT.Proceedings of the National Academy of Sciences of theUnited States of America, 105, 16380–16385. [PubMed]
Cameron, E. L., Tai, J. C., & Carrasco, M. (2002). Covertattention affects the psychometric function of contrastsensitivity. Vision Research, 42, 949–967. [PubMed]
Journal of Vision (2011) 11(14):12, 1–16 Koenig-Robert & VanRullen 13
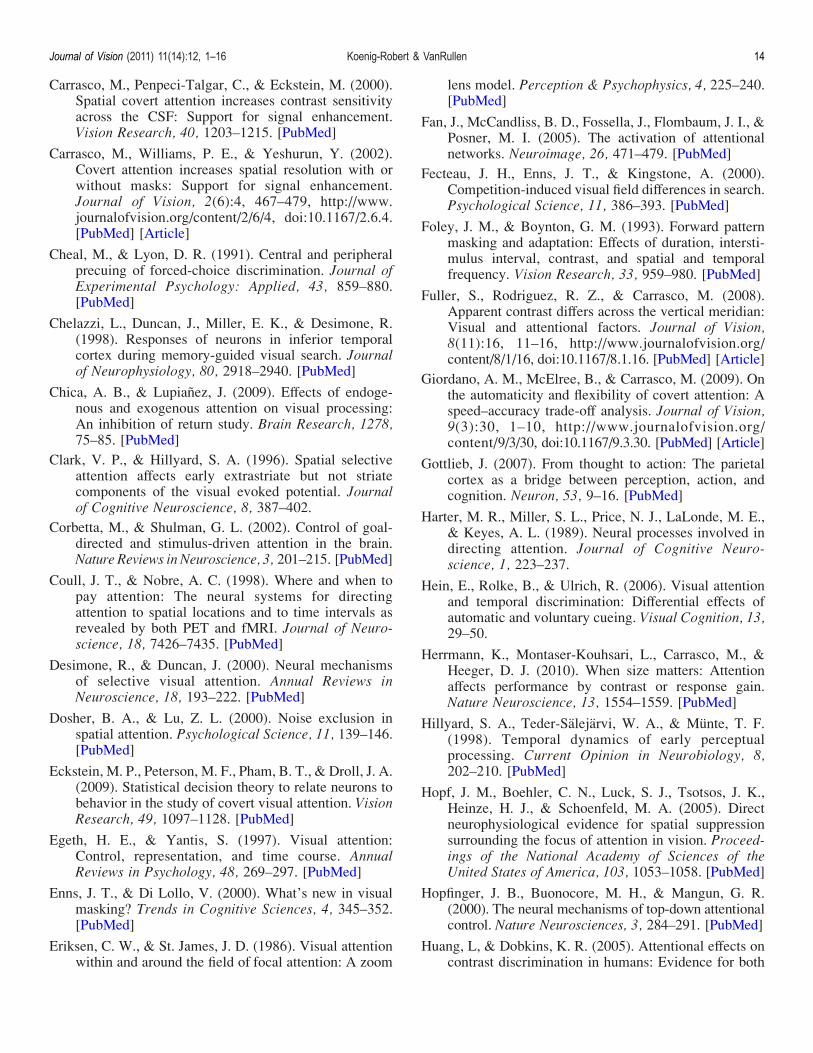
Carrasco, M., Penpeci-Talgar, C., & Eckstein, M. (2000).Spatial covert attention increases contrast sensitivityacross the CSF: Support for signal enhancement.Vision Research, 40, 1203–1215. [PubMed]
Carrasco, M., Williams, P. E., & Yeshurun, Y. (2002).Covert attention increases spatial resolution with orwithout masks: Support for signal enhancement.Journal of Vision, 2(6):4, 467–479, http://www.journalofvision.org/content/2/6/4, doi:10.1167/2.6.4.[PubMed] [Article]
Cheal, M., & Lyon, D. R. (1991). Central and peripheralprecuing of forced-choice discrimination. Journal ofExperimental Psychology: Applied, 43, 859–880.[PubMed]
Chelazzi, L., Duncan, J., Miller, E. K., & Desimone, R.(1998). Responses of neurons in inferior temporalcortex during memory-guided visual search. Journalof Neurophysiology, 80, 2918–2940. [PubMed]
Chica, A. B., & Lupianez, J. (2009). Effects of endoge-nous and exogenous attention on visual processing:An inhibition of return study. Brain Research, 1278,75–85. [PubMed]
Clark, V. P., & Hillyard, S. A. (1996). Spatial selectiveattention affects early extrastriate but not striatecomponents of the visual evoked potential. Journalof Cognitive Neuroscience, 8, 387–402.
Corbetta, M., & Shulman, G. L. (2002). Control of goal-directed and stimulus-driven attention in the brain.Nature Reviews in Neuroscience, 3, 201–215. [PubMed]
Coull, J. T., & Nobre, A. C. (1998). Where and when topay attention: The neural systems for directingattention to spatial locations and to time intervals asrevealed by both PET and fMRI. Journal of Neuro-science, 18, 7426–7435. [PubMed]
Desimone, R., & Duncan, J. (2000). Neural mechanismsof selective visual attention. Annual Reviews inNeuroscience, 18, 193–222. [PubMed]
Dosher, B. A., & Lu, Z. L. (2000). Noise exclusion inspatial attention. Psychological Science, 11, 139–146.[PubMed]
Eckstein, M. P., Peterson, M. F., Pham, B. T., & Droll, J. A.(2009). Statistical decision theory to relate neurons tobehavior in the study of covert visual attention. VisionResearch, 49, 1097–1128. [PubMed]
Egeth, H. E., & Yantis, S. (1997). Visual attention:Control, representation, and time course. AnnualReviews in Psychology, 48, 269–297. [PubMed]
Enns, J. T., & Di Lollo, V. (2000). What’s new in visualmasking? Trends in Cognitive Sciences, 4, 345–352.[PubMed]
Eriksen, C. W., & St. James, J. D. (1986). Visual attentionwithin and around the field of focal attention: A zoom
lens model. Perception & Psychophysics, 4, 225–240.[PubMed]
Fan, J., McCandliss, B. D., Fossella, J., Flombaum, J. I., &Posner, M. I. (2005). The activation of attentionalnetworks. Neuroimage, 26, 471–479. [PubMed]
Fecteau, J. H., Enns, J. T., & Kingstone, A. (2000).Competition-induced visual field differences in search.Psychological Science, 11, 386–393. [PubMed]
Foley, J. M., & Boynton, G. M. (1993). Forward patternmasking and adaptation: Effects of duration, intersti-mulus interval, contrast, and spatial and temporalfrequency. Vision Research, 33, 959–980. [PubMed]
Fuller, S., Rodriguez, R. Z., & Carrasco, M. (2008).Apparent contrast differs across the vertical meridian:Visual and attentional factors. Journal of Vision,8(11):16, 11–16, http://www.journalofvision.org/content/8/1/16, doi:10.1167/8.1.16. [PubMed] [Article]
Giordano, A. M., McElree, B., & Carrasco, M. (2009). Onthe automaticity and flexibility of covert attention: Aspeed–accuracy trade-off analysis. Journal of Vision,9(3):30, 1–10, http://www.journalofvision.org/content/9/3/30, doi:10.1167/9.3.30. [PubMed] [Article]
Gottlieb, J. (2007). From thought to action: The parietalcortex as a bridge between perception, action, andcognition. Neuron, 53, 9–16. [PubMed]
Harter, M. R., Miller, S. L., Price, N. J., LaLonde, M. E.,& Keyes, A. L. (1989). Neural processes involved indirecting attention. Journal of Cognitive Neuro-science, 1, 223–237.
Hein, E., Rolke, B., & Ulrich, R. (2006). Visual attentionand temporal discrimination: Differential effects ofautomatic and voluntary cueing. Visual Cognition, 13,29–50.
Herrmann, K., Montaser-Kouhsari, L., Carrasco, M., &Heeger, D. J. (2010). When size matters: Attentionaffects performance by contrast or response gain.Nature Neuroscience, 13, 1554–1559. [PubMed]
Hillyard, S. A., Teder-Salejarvi, W. A., & Munte, T. F.(1998). Temporal dynamics of early perceptualprocessing. Current Opinion in Neurobiology, 8,202–210. [PubMed]
Hopf, J. M., Boehler, C. N., Luck, S. J., Tsotsos, J. K.,Heinze, H. J., & Schoenfeld, M. A. (2005). Directneurophysiological evidence for spatial suppressionsurrounding the focus of attention in vision. Proceed-ings of the National Academy of Sciences of theUnited States of America, 103, 1053–1058. [PubMed]
Hopfinger, J. B., Buonocore, M. H., & Mangun, G. R.(2000). The neural mechanisms of top-down attentionalcontrol. Nature Neurosciences, 3, 284–291. [PubMed]
Huang, L, & Dobkins, K. R. (2005). Attentional effects oncontrast discrimination in humans: Evidence for both
Journal of Vision (2011) 11(14):12, 1–16 Koenig-Robert & VanRullen 14
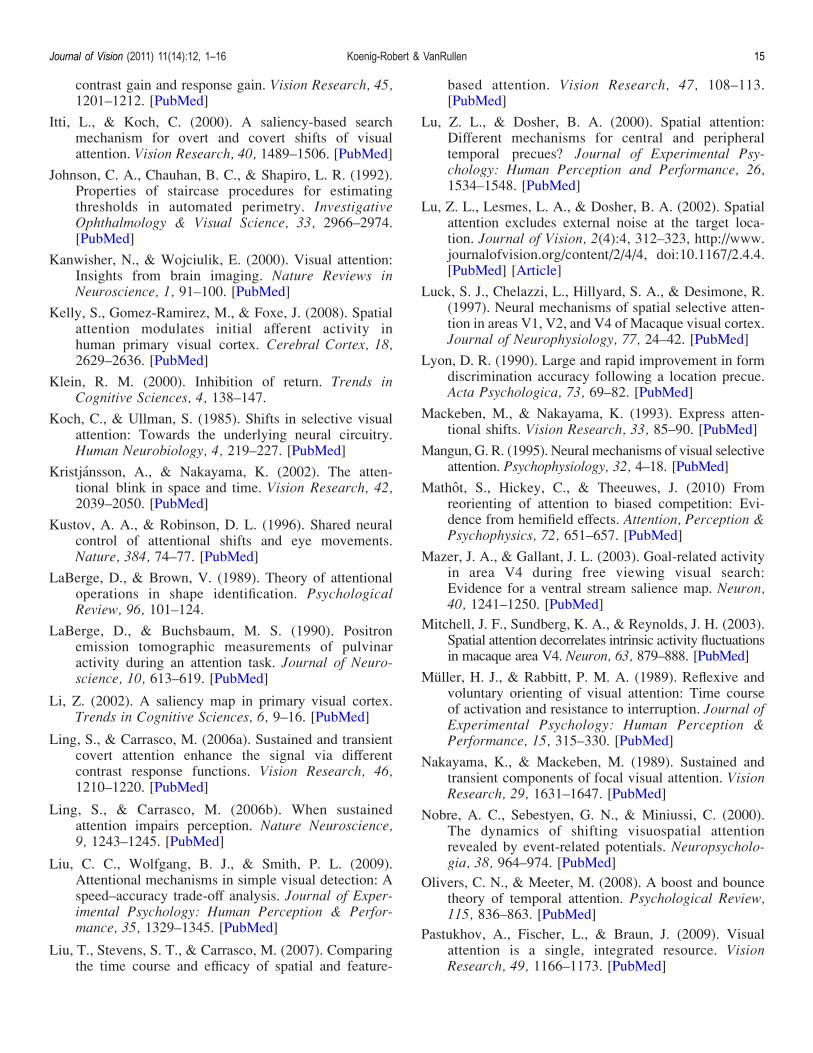
contrast gain and response gain. Vision Research, 45,1201–1212. [PubMed]
Itti, L., & Koch, C. (2000). A saliency-based searchmechanism for overt and covert shifts of visualattention. Vision Research, 40, 1489–1506. [PubMed]
Johnson, C. A., Chauhan, B. C., & Shapiro, L. R. (1992).Properties of staircase procedures for estimatingthresholds in automated perimetry. InvestigativeOphthalmology & Visual Science, 33, 2966–2974.[PubMed]
Kanwisher, N., & Wojciulik, E. (2000). Visual attention:Insights from brain imaging. Nature Reviews inNeuroscience, 1, 91–100. [PubMed]
Kelly, S., Gomez-Ramirez, M., & Foxe, J. (2008). Spatialattention modulates initial afferent activity inhuman primary visual cortex. Cerebral Cortex, 18,2629–2636. [PubMed]
Klein, R. M. (2000). Inhibition of return. Trends inCognitive Sciences, 4, 138–147.
Koch, C., & Ullman, S. (1985). Shifts in selective visualattention: Towards the underlying neural circuitry.Human Neurobiology, 4, 219–227. [PubMed]
Kristjansson, A., & Nakayama, K. (2002). The atten-tional blink in space and time. Vision Research, 42,2039–2050. [PubMed]
Kustov, A. A., & Robinson, D. L. (1996). Shared neuralcontrol of attentional shifts and eye movements.Nature, 384, 74–77. [PubMed]
LaBerge, D., & Brown, V. (1989). Theory of attentionaloperations in shape identification. PsychologicalReview, 96, 101–124.
LaBerge, D., & Buchsbaum, M. S. (1990). Positronemission tomographic measurements of pulvinaractivity during an attention task. Journal of Neuro-science, 10, 613–619. [PubMed]
Li, Z. (2002). A saliency map in primary visual cortex.Trends in Cognitive Sciences, 6, 9–16. [PubMed]
Ling, S., & Carrasco, M. (2006a). Sustained and transientcovert attention enhance the signal via differentcontrast response functions. Vision Research, 46,1210–1220. [PubMed]
Ling, S., & Carrasco, M. (2006b). When sustainedattention impairs perception. Nature Neuroscience,9, 1243–1245. [PubMed]
Liu, C. C., Wolfgang, B. J., & Smith, P. L. (2009).Attentional mechanisms in simple visual detection: Aspeed–accuracy trade-off analysis. Journal of Exper-imental Psychology: Human Perception & Perfor-mance, 35, 1329–1345. [PubMed]
Liu, T., Stevens, S. T., & Carrasco, M. (2007). Comparingthe time course and efficacy of spatial and feature-
based attention. Vision Research, 47, 108–113.[PubMed]
Lu, Z. L., & Dosher, B. A. (2000). Spatial attention:Different mechanisms for central and peripheraltemporal precues? Journal of Experimental Psy-chology: Human Perception and Performance, 26,1534–1548. [PubMed]
Lu, Z. L., Lesmes, L. A., & Dosher, B. A. (2002). Spatialattention excludes external noise at the target loca-tion. Journal of Vision, 2(4):4, 312–323, http://www.journalofvision.org/content/2/4/4, doi:10.1167/2.4.4.[PubMed] [Article]
Luck, S. J., Chelazzi, L., Hillyard, S. A., & Desimone, R.(1997). Neural mechanisms of spatial selective atten-tion in areas V1, V2, and V4 of Macaque visual cortex.Journal of Neurophysiology, 77, 24–42. [PubMed]
Lyon, D. R. (1990). Large and rapid improvement in formdiscrimination accuracy following a location precue.Acta Psychologica, 73, 69–82. [PubMed]
Mackeben, M., & Nakayama, K. (1993). Express atten-tional shifts. Vision Research, 33, 85–90. [PubMed]
Mangun, G. R. (1995). Neural mechanisms of visual selectiveattention. Psychophysiology, 32, 4–18. [PubMed]
Mathot, S., Hickey, C., & Theeuwes, J. (2010) Fromreorienting of attention to biased competition: Evi-dence from hemifield effects. Attention, Perception &Psychophysics, 72, 651–657. [PubMed]
Mazer, J. A., & Gallant, J. L. (2003). Goal-related activityin area V4 during free viewing visual search:Evidence for a ventral stream salience map. Neuron,40, 1241–1250. [PubMed]
Mitchell, J. F., Sundberg, K. A., & Reynolds, J. H. (2003).Spatial attention decorrelates intrinsic activity fluctuationsin macaque area V4. Neuron, 63, 879–888. [PubMed]
Muller, H. J., & Rabbitt, P. M. A. (1989). Reflexive andvoluntary orienting of visual attention: Time courseof activation and resistance to interruption. Journal ofExperimental Psychology: Human Perception &Performance, 15, 315–330. [PubMed]
Nakayama, K., & Mackeben, M. (1989). Sustained andtransient components of focal visual attention. VisionResearch, 29, 1631–1647. [PubMed]
Nobre, A. C., Sebestyen, G. N., & Miniussi, C. (2000).The dynamics of shifting visuospatial attentionrevealed by event-related potentials. Neuropsycholo-gia, 38, 964–974. [PubMed]
Olivers, C. N., & Meeter, M. (2008). A boost and bouncetheory of temporal attention. Psychological Review,115, 836–863. [PubMed]
Pastukhov, A., Fischer, L., & Braun, J. (2009). Visualattention is a single, integrated resource. VisionResearch, 49, 1166–1173. [PubMed]
Journal of Vision (2011) 11(14):12, 1–16 Koenig-Robert & VanRullen 15
Pelli, D. G. (1997). The VideoToolbox software for visualpsychophysics: Transforming numbers into movies.Spatial Vision, 10, 437–442. [PubMed]
Pestilli, F., & Carrasco, M. (2005). Attention enhancescontrast sensitivity at cued and impairs it at uncuedlocations. Vision Research, 45, 1867–1875. [PubMed]
Pestilli, F., Ling, S., & Carrasco, M. (2009). A population-coding model of attention’s influence on contrastresponse: Estimating neural effects from psychophys-ical data. Vision Research, 49, 1144–1153. [PubMed]
Posner, M. I. (1980). Orienting of attention. The QuarterlyJournal of Experimental Psychology, 32, 3–25.[PubMed]
Posner, M. I., Sheese, B. E., Odludas, Y., & Tang, Y.(2006) Analyzing and shaping human attentional net-works. Neural Networks, 19, 1422–1429. [PubMed]
Reddy, L., Kanwisher, N. G., & VanRullen, R. (2009)Attention and biased competition in multi-voxelobject representations. Proceedings of the NationalAcademy of Sciences of the United States of America,15, 21447–21452. [PubMed]
Reynolds, J. H., & Heeger, D. J. (2009). The normal-ization model of attention. Neuron, 61, 168–185.[PubMed]
Righi, L. L., & Ribeiro-do-Valle, L. E. (2011). Automaticattention lateral asymmetry in visual discriminationtasks. Psychological Research, 75, 24–34. [PubMed]
Robinson, D. L., & Petersen, S. E. (1992). The pulvinarand visual salience. Trends Neuroscience, 15, 127–132.[PubMed]
Sagi, D., & Julesz, B. (1986). Enhanced detection in theaperture of focal attention during simple discrimina-tion tasks. Nature, 321, 693–695. [PubMed]
Shimozaki, S. S. (2010). Uncued and cued dynamicsmeasured by response classification. Journal ofVision, 10(8):10, 1–27, http://www.journalofvision.org/content/10/8/10, doi:10.1167/10.8.10. [PubMed][Article]
Shulman, G. L., Remington, R., & McLean, J. (1979).Moving attention through visual space. Journal ofExperimental Psychology, 92, 428–431. [PubMed]
Shulman, G. L., & Wilson, J. (1987). Spatial frequencyand selective attention to local and global informa-tion. Perception, 16, 89–101. [PubMed]
Smythies, J. (1996). A note on the concept of the visualfield in neurology, psychology, and visual neuro-science. Perception, 25, 369–371. [PubMed]
Spitzer, H., Desimone, R., & Moran, J. (1988). Increasedattention enhances both behavioral and neuronalperformance. Science, 15, 338–340. [PubMed]
Talgar, C. P., Pelli, D. G., & Carrasco, M. (2004). Covertattention enhances letter identification without affect-ing channel tuning. Journal of Vision, 4(1):3, 22–31,http://www.journalofvision.org/content/4/1/3,doi:10.1167/4.1.3. [PubMed] [Article]
Theeuwes, J., Atchley, P., & Kramer, A. F. (2000). On thetime course of top-down and bottom-up control ofvisual attention. In S. Monsell & J. Driver (Eds.),Attention and performance XVIII (pp. 105–124). MITPress.
Thompson, K. G., & Schall, J. D. (2000). Antecedents andcorrelates of visual detection and awareness inmacaque prefrontal cortex. Vision Research, 40,1523–1538. [PubMed]
Tse, P. U. (2004). Mapping visual attention with changeblindness: New directions for a new method. Cogni-tive Science, 28, 241–258. [PubMed]
Tsotsos, J. K. (1990). A complexity level analysis ofvision. Behavioral and Brain Sciences, 13, 423–445.
Ward, L. M. (2008). Attention. Scholarpedia, 3, 1538.Available at http://www.scholarpedia.org/article/Attention.
Weichselgartner, E., & Sperling, G. (1987). Dynamics ofautomatic and controlled visual attention. Science,238, 778–780. [PubMed]
Yantis, S., & Jonides, J. (1990). Abrupt visual onsets andselective attention: Voluntary versus automatic allo-cation. Journal of Experimental Psychology: HumanPerception and Performance, 16, 121–134. [PubMed]
Yeshurun, Y., Montagna, B., & Carrasco, M. (2008). Onthe flexibility of sustained attention and its effectson a texture segmentation task. Vision Research, 48,80–95. [PubMed]
Journal of Vision (2011) 11(14):12, 1–16 Koenig-Robert & VanRullen 16
Searching for the neural correlates of object recognition
102
D. Searching for the neural correlates of object recognition
In the previous study we have seen the spatiotemporal deployment of visual attention has a
significant effect in the detection of very simple stimuli. Several studies performed over the
last decades have suggested that visual attention is the door to the conscious visual
perception from detection to discrimination and recognition (for a review on visual attention
and its properties on visual perception see Carrasco, 2011). Behind these doors represented
by attention we can thus found higher order cognitive processes such as conscious object
recognition.
As we have seen, explicit object recognition is supported by preliminary stages which are
devoted to encode physical stimulus features in the form of neural activities across different
brain areas (Pollen, 1999; Pollen, 2003; DiCarlo, Zoccolan, & Rust, 2012). These stages
involve myriads of neural computations in specialized modules which serve to encode
stimulus features as activities within specialized neural groups, with neural groups coding for
the local contrast in the image and its frequency content (both in the primary visual cortex),
figure/ground segregation and border ownership (mostly in V2), form encoding (along the
ventral pathway, mostly in V4) etc. These processes are performed automatically and are
thought to be largely unconscious (however see Zeki, 2008). An additional step (namely
recurrent activity according to Lamme’s theory, dynamic core inclusion in Edelman &
Tononi’s theory or the activation of the global workspace in Dehaene’s theory) would render
the output of these processes accessible for explicit recognition. However in order to
investigate the neural representations beyond these primary or low-level visual processing,
one has to somehow dissociate the activities occurring downstream these low-level
processes.
A simple assumption is to consider all short-latency processes as low-level processes and
those with later latencies as high-level visual processing representing explicit object
recognition. However to decide which are early and late visual processes is somehow
arbitrary; moreover, we know that high-level areas such as the prefrontal cortex can show
very early responses (with earliest responses around 70 ms, Introduction, section G) and it is
unclear if these early activities can be considered as low-level processes.
Searching for the neural correlates of object recognition
103
Another commonly approach used to extract the neural activity correlated with explicit
recognition is to use subtractive methods, where activity from non-recognized trials is
subtracted from activity obtained in recognized trials by simple linear subtraction (see for
example Bar et al., 2001; Koivisto et al., 2008). Subtractive methods rely on the assumption
that the several stages from low-level visual processing to object recognition are
independent and thus it is possible to dissociate by developing a control task containing all
the visual process that are exactly identical, except for the absence of the recognition
processes, and thus, by subtracting the activity in the control condition to recognition
condition, it would be possible to dissociate different processes. However, the validity of
linear subtractive methods, relying in the implicit premise of a lack of interactions among the
neural processes of a task, have been criticized by many authors (Friston et al., 1996; Sidtis,
Strother, Anderson, & Rottenberg, 1999; Sartori & Umiltà, 2000; Overgaard, 2004; Banerjee,
Tognoli, Assisi, Kelso, & Jirsa, 2008; Logothetis, 2008).
Thus, dissociating between the processes supporting the encoding of physical visual features
from object recognition proper has not been an easy task. Can we isolate the neural
correlates of object recognition? We shall briefly review two inspiring works that have shed
light on the proper ways to approach the study of object recognition.
I. Dissociating visual information extraction from visual
recognition. The paper of Carlson et al. 2006
One way to dissociate between recognition and feature extraction processes was brilliantly
introduced by (Carlson, Grol, & Verstraten, 2006) which used fMRI in order to identify the
brain areas underlying the encoding of visual features and those involved in the actual object
recognition. The idea of this work was to dissociate these two processes (feature extraction
and recognition) by distinguishing their distinctive dynamics which was assessed by
manipulating the temporal dynamics of the information presentation within the stimulation
protocol.
Searching for the neural correlates of object recognition
104
The principle was the following: discrete parts of visual information (represented by pictures
of famous faces and written words) were unveiled step-by-step in this way distributing
across time the amount of image information that was delivered to the visual system (Figure
21A and B). The linear accumulation of information on the screen would lead thus to a linear
increase in the activity of areas involved in the feature extraction processes, which can be
modeled as a linear increase in the hemodynamic response function (Figure 21C).
The accumulation of visual information eventually triggers the recognition of the object or
the word which is represented as a discrete event. The recognition event would entrain a
sudden increase in the activity of the areas involved in this process. This activity increase can
be thus modeled as a discrete increase in the hemodynamic response locked to the moment
of recognition, which is reported by the subject (Figure 21C).
A third response model profile accounted for the task related activity, which is invariant to
the amount of visual information presented but continually active over the time needed to
complete the task. Thus, a sustained response model was represented by a box car function
corresponding to the time subjects were performing the recognition task (Figure 21C).
This approach effectively dissociated between cortical areas involved in visual feature
extraction and recognition according to their response characteristics (i.e., information
driven, sustained, and recognition-dependent) for the two tested tasks (faces and words).
For the face task, different brain areas were correlated with each one of the models
proposed. For the information response model, significant activations were found in the
cingulate, frontal and occipital cortex (Figure 22, upper panel, first row). For the sustained
response model, significant effects were found in a distributed network involving cingulate
cortex, bilateral central sulcus, bilateral intraparietal sulcus, the left insula, the caudate
nucleus, the thalamus, bilateral fusiform and lateral occipital regions (Figure 22, upper panel,
second row). For the recognition response model, correlated activity was found in thalamus,
bilateral fusiform, supplementary motor areas, the anterior cingulate, right superior frontal
sulcus, and the left precentral sulcus (Figure 22, upper panel, third row).
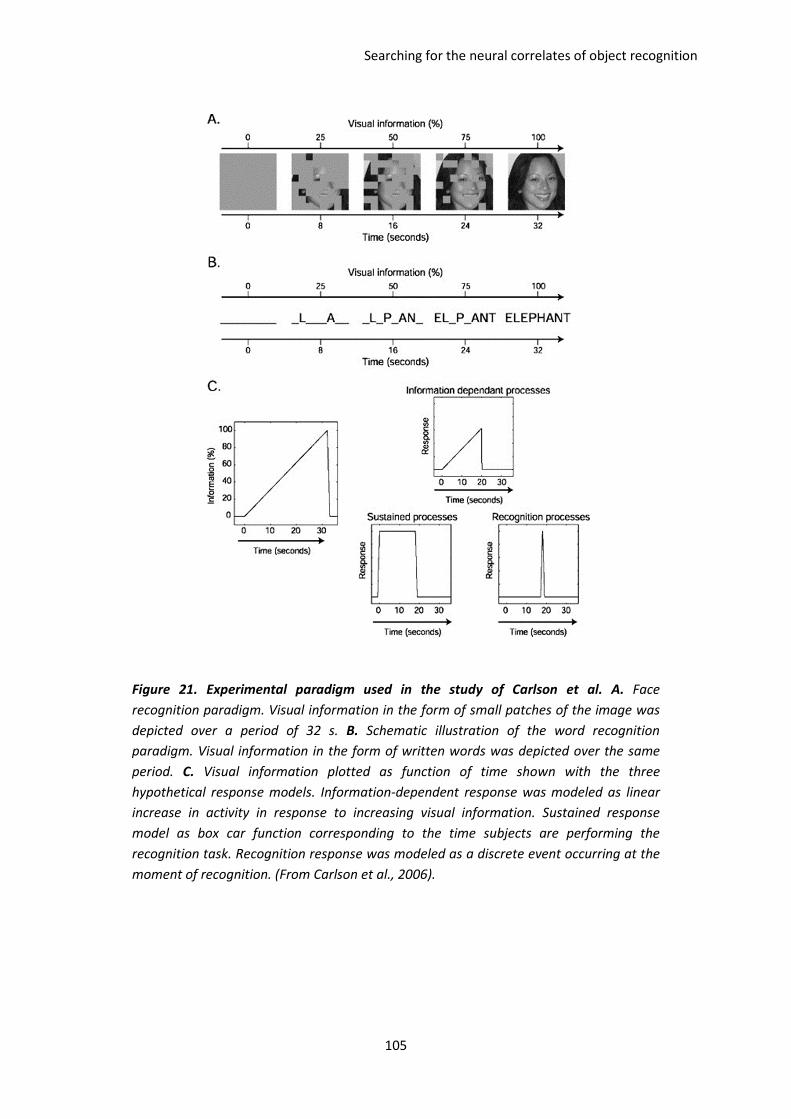
Searching for the neural correlates of object recognition
105
Figure 21. Experimental paradigm used in the study of Carlson et al. A. Face
recognition paradigm. Visual information in the form of small patches of the image was
depicted over a period of 32 s. B. Schematic illustration of the word recognition
paradigm. Visual information in the form of written words was depicted over the same
period. C. Visual information plotted as function of time shown with the three
hypothetical response models. Information-dependent response was modeled as linear
increase in activity in response to increasing visual information. Sustained response
model as box car function corresponding to the time subjects are performing the
recognition task. Recognition response was modeled as a discrete event occurring at the
moment of recognition. (From Carlson et al., 2006).
Searching for the neural correlates of object recognition
106
For the word task, the information response model revealed significant patterns of activity in
bilateral intraparietal sulcus, bilateral occipital gyri, and the left fusiform (Figure 22, lower
panel, first row). For the sustained response model, correlated activity was found in
cingulate sulcus, and precuneus (Figure 22, middle panel, second row). For the recognition
response model, the areas significantly correlated with the recognition model included
supplementary motor areas and the anterior cingulate, the right superior frontal sulcus,
bilateral lateral parietal cortex, and bilateral inferior frontal gyrus (Figure 20, middle panel,
third row).
A conjunction analysis revealed common activations between the face and the world task
(Figure 22, lower panel). While no significant overlapping activations were observed for the
information or the sustained response model (Figure 20, lower panel, 2 first rows), a
common network of frontal activation was observed for the recognition response model
(Figure 22, lower panel, bottom row). These overlaps were observed in supplementary
motor areas, the anterior cingulate, bilateral parietal cortex, the right superior frontal sulcus,
bilateral inferior frontal gyrus, and the thalamus.
Thus, these results showed that early visual areas are correlated with the information
response model, which is consistent with the role of early visual areas in coding local
features of the image. On the other hand, activations correlated the sustained response
model were found in both LO and FFA and were interpreted as a reflection of a process of
maintaining object-based representations which is invariantly to the amount of information
received, perhaps representing a pre-activation of object-based representations related to
the task expectations. Finally, activations correlated with the recognition response model
were identified as activations in high-level areas such as the fusiform, lateral parietal and
frontal regions.
This work showed that by manipulating the available image information across time, it is
possible to discriminate between brain mechanisms involved in extracting visual features
and brain processes involved in visual recognition based in their respective activation time
courses.
In the experiment discussed above, the recognition process emerged as result of the
accumulation of the image information. In other words the semantic information of the
Searching for the neural correlates of object recognition
107
image was accessible when a sufficient amount of the physical information, represented for
the unveiled area of the image, was available. Now, let’s consider the following possibility: is
it possible to manipulate the semantic information of the image independently of its physical
information?
Image processing techniques allow manipulating the particular spatial arrangement of visual
features which are associated with objects forms and carry on the semantic properties.
These manipulations allow conserving some of their physical properties, such as spatial
frequency or contrast. Let’s see how the can the tools of image processing be used to
manipulate object recognition.
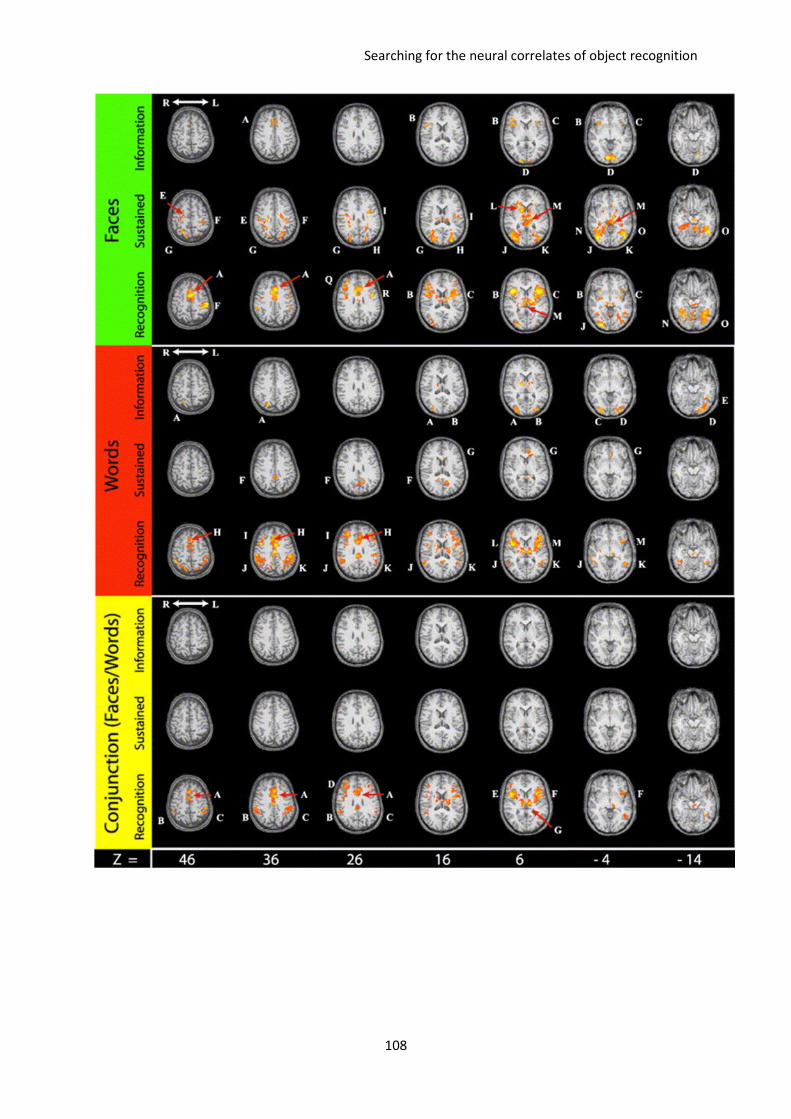
Searching for the neural correlates of object recognition
108
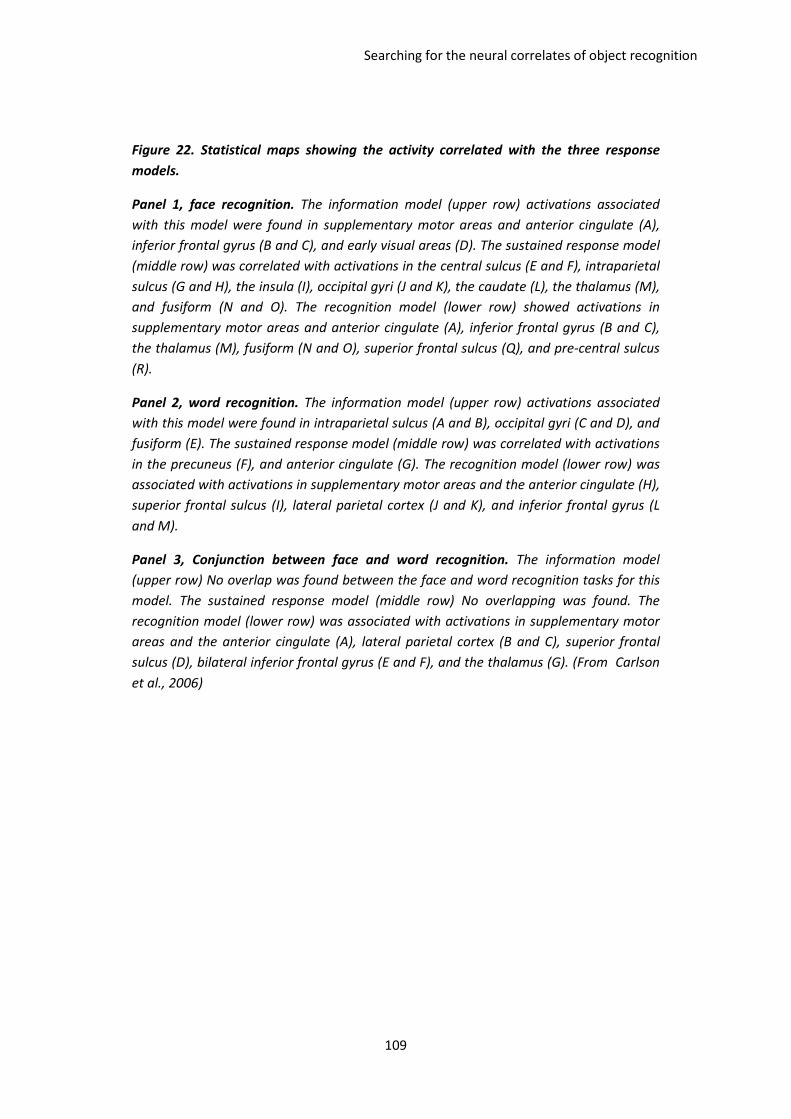
Searching for the neural correlates of object recognition
109
Figure 22. Statistical maps showing the activity correlated with the three response
models.
Panel 1, face recognition. The information model (upper row) activations associated
with this model were found in supplementary motor areas and anterior cingulate (A),
inferior frontal gyrus (B and C), and early visual areas (D). The sustained response model
(middle row) was correlated with activations in the central sulcus (E and F), intraparietal
sulcus (G and H), the insula (I), occipital gyri (J and K), the caudate (L), the thalamus (M),
and fusiform (N and O). The recognition model (lower row) showed activations in
supplementary motor areas and anterior cingulate (A), inferior frontal gyrus (B and C),
the thalamus (M), fusiform (N and O), superior frontal sulcus (Q), and pre-central sulcus
(R).
Panel 2, word recognition. The information model (upper row) activations associated
with this model were found in intraparietal sulcus (A and B), occipital gyri (C and D), and
fusiform (E). The sustained response model (middle row) was correlated with activations
in the precuneus (F), and anterior cingulate (G). The recognition model (lower row) was
associated with activations in supplementary motor areas and the anterior cingulate (H),
superior frontal sulcus (I), lateral parietal cortex (J and K), and inferior frontal gyrus (L
and M).
Panel 3, Conjunction between face and word recognition. The information model
(upper row) No overlap was found between the face and word recognition tasks for this
model. The sustained response model (middle row) No overlapping was found. The
recognition model (lower row) was associated with activations in supplementary motor
areas and the anterior cingulate (A), lateral parietal cortex (B and C), superior frontal
sulcus (D), bilateral inferior frontal gyrus (E and F), and the thalamus (G). (From Carlson
et al., 2006)
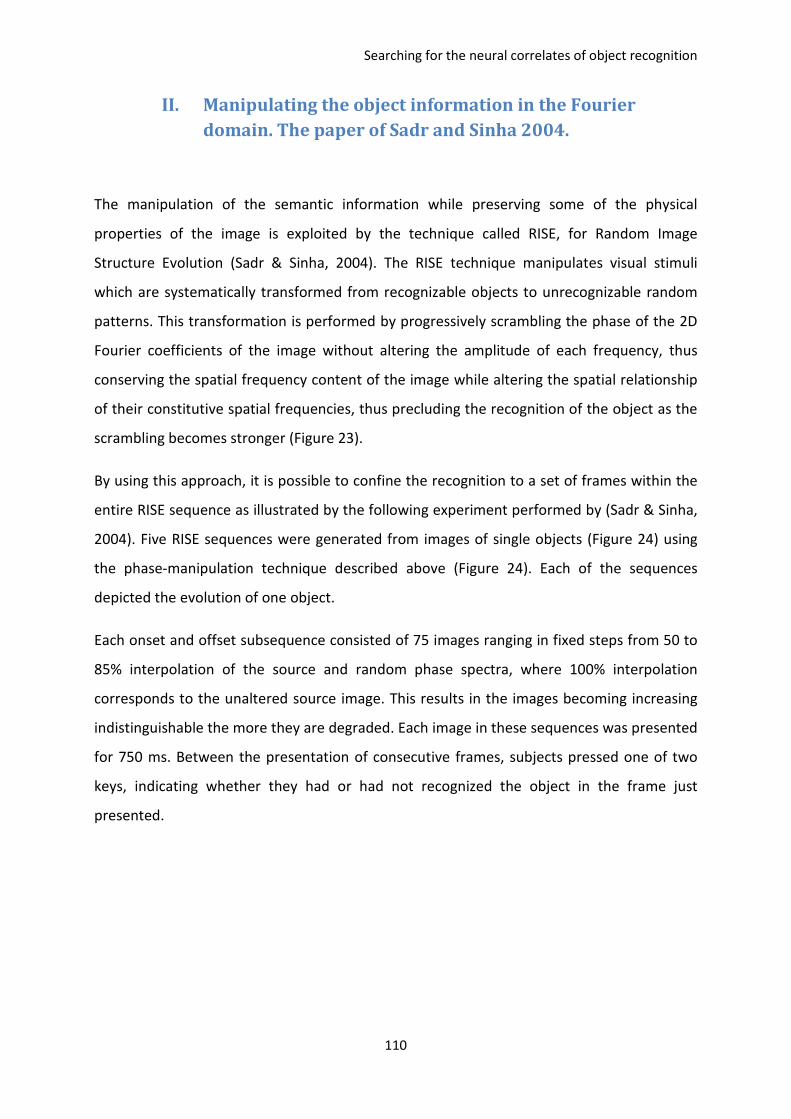
Searching for the neural correlates of object recognition
110
II. Manipulating the object information in the Fourier
domain. The paper of Sadr and Sinha 2004.
The manipulation of the semantic information while preserving some of the physical
properties of the image is exploited by the technique called RISE, for Random Image
Structure Evolution (Sadr & Sinha, 2004). The RISE technique manipulates visual stimuli
which are systematically transformed from recognizable objects to unrecognizable random
patterns. This transformation is performed by progressively scrambling the phase of the 2D
Fourier coefficients of the image without altering the amplitude of each frequency, thus
conserving the spatial frequency content of the image while altering the spatial relationship
of their constitutive spatial frequencies, thus precluding the recognition of the object as the
scrambling becomes stronger (Figure 23).
By using this approach, it is possible to confine the recognition to a set of frames within the
entire RISE sequence as illustrated by the following experiment performed by (Sadr & Sinha,
2004). Five RISE sequences were generated from images of single objects (Figure 24) using
the phase-manipulation technique described above (Figure 24). Each of the sequences
depicted the evolution of one object.
Each onset and offset subsequence consisted of 75 images ranging in fixed steps from 50 to
85% interpolation of the source and random phase spectra, where 100% interpolation
corresponds to the unaltered source image. This results in the images becoming increasing
indistinguishable the more they are degraded. Each image in these sequences was presented
for 750 ms. Between the presentation of consecutive frames, subjects pressed one of two
keys, indicating whether they had or had not recognized the object in the frame just
presented.
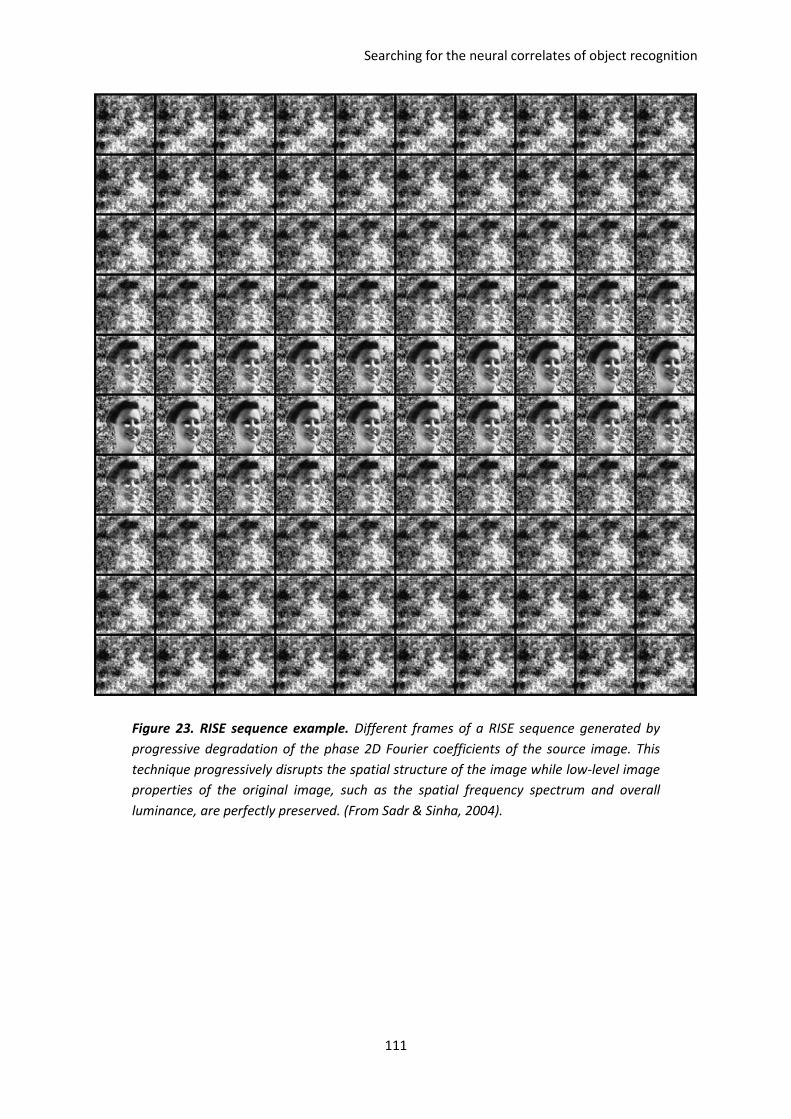
Searching for the neural correlates of object recognition
111
Figure 23. RISE sequence example. Different frames of a RISE sequence generated by
progressive degradation of the phase 2D Fourier coefficients of the source image. This
technique progressively disrupts the spatial structure of the image while low-level image
properties of the original image, such as the spatial frequency spectrum and overall
luminance, are perfectly preserved. (From Sadr & Sinha, 2004).
Searching for the neural correlates of object recognition
112
Figure 24. Recognition as a function of phase-coherence. The recognition of objects was
manipulated by the amount of phase-coherence of single frames within a RISE sequence.
The onset and the offset parts of the sequence are represented by the left and right side
of each bar. Perceptual hysteresis (i.e., recognition at higher levels of phase-scrambling
after the recognition of the image) was evident during the offset of the sequence which
is represented by the dark gray part of the bar. (From Sadr & Sinha, 2004).
Figure 24 shows the onset and offset of recognition as a function of phase coherence. The
onset of object recognition was situated between 70 and 80% of phase coherence; while the
offset was located between 60 and 70% due to hysteresis effects (i.e. the subject already
knew the identity of the object).
This work showed that the recognition of an image can be controlled by disturbing its
semantic content, while preserving some of their physical attributes. Such an approach is
suitable in order to dissociate between the neural correlates of object recognition and the
neural correlates of the encoding of its physical features, at least for those involving the
encoding of the spatial frequency content and overall luminance. Now, a last element is
missing in order to create a stimulation method in which: (1) the semantic content is
modulated, (2) the physical features are conserved (3) the responses driven by low-level
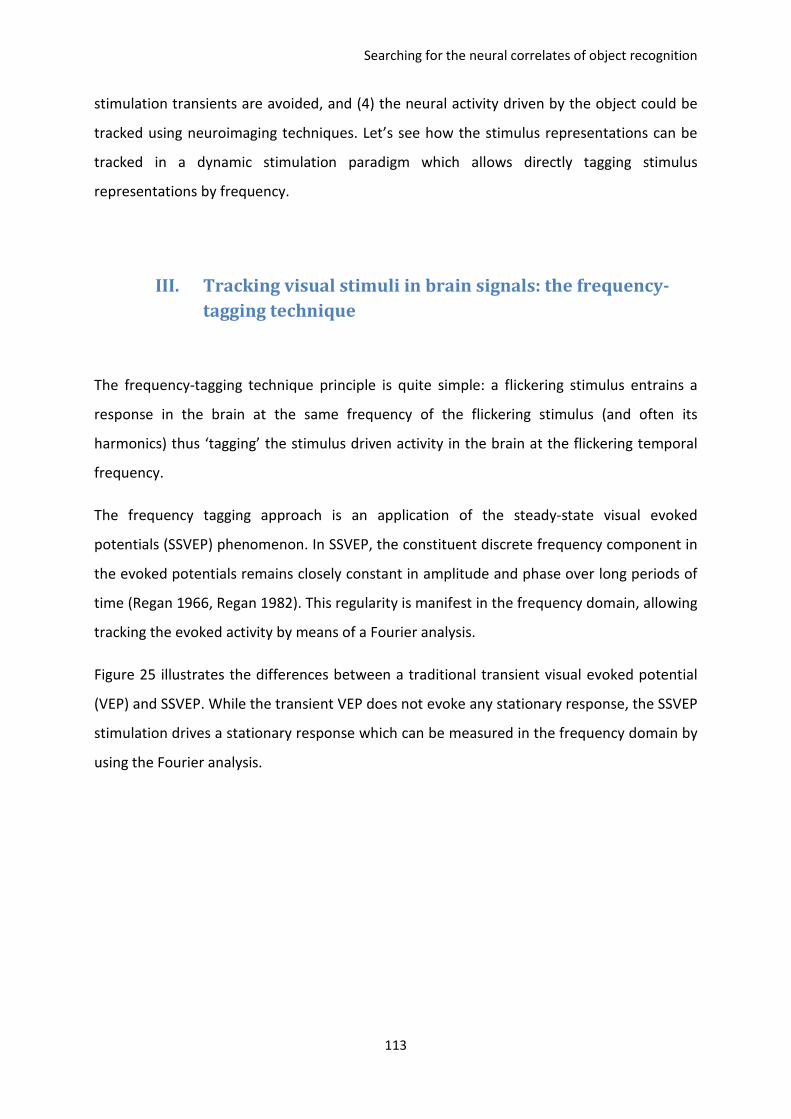
Searching for the neural correlates of object recognition
113
stimulation transients are avoided, and (4) the neural activity driven by the object could be
tracked using neuroimaging techniques. Let’s see how the stimulus representations can be
tracked in a dynamic stimulation paradigm which allows directly tagging stimulus
representations by frequency.
III. Tracking visual stimuli in brain signals: the frequency-
tagging technique
The frequency-tagging technique principle is quite simple: a flickering stimulus entrains a
response in the brain at the same frequency of the flickering stimulus (and often its
harmonics) thus ‘tagging’ the stimulus driven activity in the brain at the flickering temporal
frequency.
The frequency tagging approach is an application of the steady-state visual evoked
potentials (SSVEP) phenomenon. In SSVEP, the constituent discrete frequency component in
the evoked potentials remains closely constant in amplitude and phase over long periods of
time (Regan 1966, Regan 1982). This regularity is manifest in the frequency domain, allowing
tracking the evoked activity by means of a Fourier analysis.
Figure 25 illustrates the differences between a traditional transient visual evoked potential
(VEP) and SSVEP. While the transient VEP does not evoke any stationary response, the SSVEP
stimulation drives a stationary response which can be measured in the frequency domain by
using the Fourier analysis.
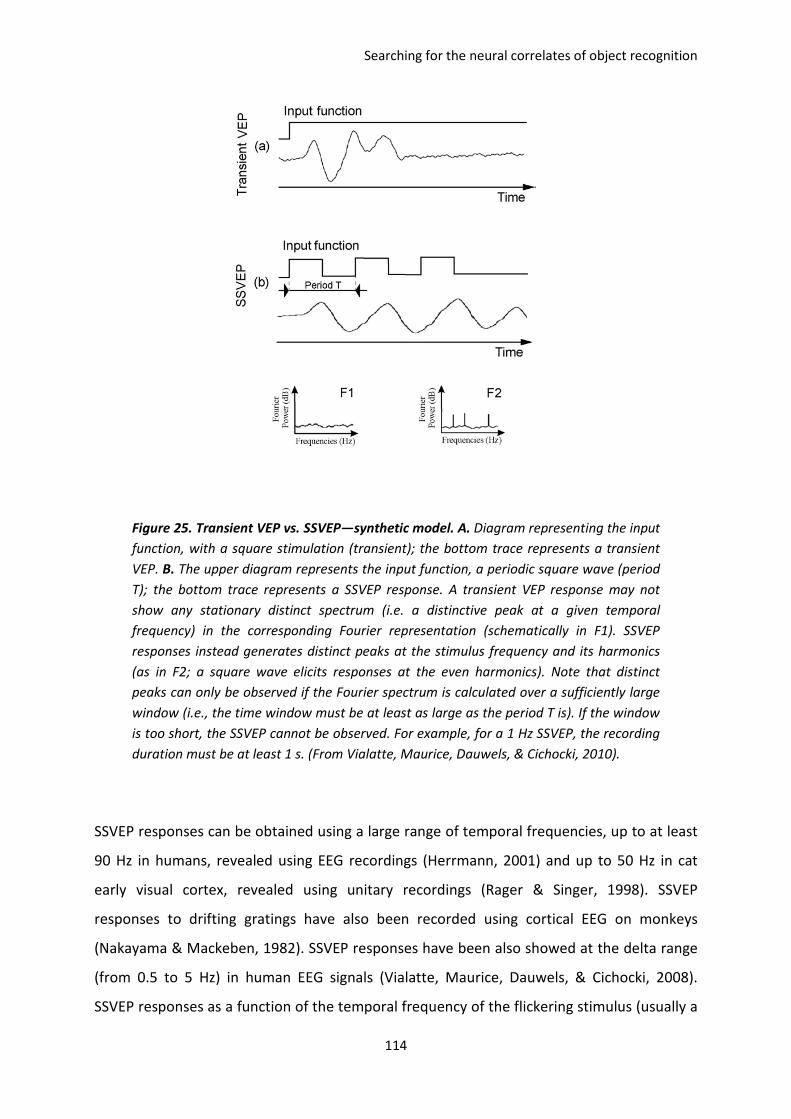
Searching for the neural correlates of object recognition
114
Figure 25. Transient VEP vs. SSVEP—synthetic model. A. Diagram representing the input
function, with a square stimulation (transient); the bottom trace represents a transient
VEP. B. The upper diagram represents the input function, a periodic square wave (period
T); the bottom trace represents a SSVEP response. A transient VEP response may not
show any stationary distinct spectrum (i.e. a distinctive peak at a given temporal
frequency) in the corresponding Fourier representation (schematically in F1). SSVEP
responses instead generates distinct peaks at the stimulus frequency and its harmonics
(as in F2; a square wave elicits responses at the even harmonics). Note that distinct
peaks can only be observed if the Fourier spectrum is calculated over a sufficiently large
window (i.e., the time window must be at least as large as the period T is). If the window
is too short, the SSVEP cannot be observed. For example, for a 1 Hz SSVEP, the recording
duration must be at least 1 s. (From Vialatte, Maurice, Dauwels, & Cichocki, 2010).
SSVEP responses can be obtained using a large range of temporal frequencies, up to at least
90 Hz in humans, revealed using EEG recordings (Herrmann, 2001) and up to 50 Hz in cat
early visual cortex, revealed using unitary recordings (Rager & Singer, 1998). SSVEP
responses to drifting gratings have also been recorded using cortical EEG on monkeys
(Nakayama & Mackeben, 1982). SSVEP responses have been also showed at the delta range
(from 0.5 to 5 Hz) in human EEG signals (Vialatte, Maurice, Dauwels, & Cichocki, 2008).
SSVEP responses as a function of the temporal frequency of the flickering stimulus (usually a
Searching for the neural correlates of object recognition
115
contrast-reversing check board) have showed three frequency bands centered at ~10Hz,
~20Hz and ~40Hz at which the SSVEP responses amplitude are enhanced (Spekreijse,
Estevez, & Reitz, 1977; Regan, 1982; Regan, 1989). These frequency bands are associated
with preferred resonance frequencies within the visual system related with its temporal
processing dynamics (Vialatte et al., 2010).
IV. Summing-up
By taking elements from each of these paradigms we developed a novel stimulation
technique aimed to investigate the neural correlates of high-level representations. From the
paradigm of Carlson et al. we take the idea of depicting the semantic image content at
discrete amounts in order to dissociate neural activity associated to the encoding of image
features and the recognition proper. From the paradigm of Sadr and Sinha we borrowed the
concept of manipulation of the image recognizability while conserving some of the image’s
low-level properties. Finally, we combined those ideas with SSVEP in order to produce a
steady flow of low-level features stimulation avoiding thus neural responses evoked by low-
level transients and, at the same time, allowing studying the temporal dynamics of high-level
representations in the visual system. Let’s see how this works.

Searching for the neural correlates of object recognition
116
V. PAPER 3: Koenig-Robert & VanRullen, submitted to
Journal of Neuroscience.
1
Isolating and tracking the neural correlates of object recognition. 1
Roger Koenig-Robert1,2 & Rufin VanRullen1,2 2
3
1 Centre de recherche cerveau et cognition (CerCo), UMR5549, CNRS. 4
2 Université Paul Sabatier, CHU Purpan, Toulouse, France. 5
Corresponding author: Roger Koenig-Robert. 6
Address: 7
Centre de Recherche Cerveau et Cognition (CerCo) – CNRS 8
Pavillon Baudot CHU Purpan 9
BP 25202 10
31052 Toulouse Cedex – France 11
email: [email protected] 12
13
Isolating the neural correlates of object recognition and studying their fine temporal dynamics has 14
been a great challenge in neuroscience. A major obstacle has been the difficulty to dissociate low-15
level feature extraction from the actual object recognition activity. Here we present a new 16
technique called semantic wavelet-induced frequency-tagging (SWIFT), where cyclic wavelet-17
scrambling allowed us to isolate neural correlates of object recognition from low-level feature 18
extraction. We show that SWIFT is insensitive to unrecognized objects, which were presented up 19
to 30 s, but is highly selective to the recognition of the same objects after their identity has been 20
revealed. The enhancement of object representations by top-down attention was particularly 21
strong with SWIFT due to its selectivity for high-level representations. Finally, SWIFT allowed us to 22
measure the temporal dynamics of conscious object representation: we found it to reach its limit 23
between 4 and 7 conscious representations per second. 24
25
26
Running title: Tracking the neural correlates of object awareness. 27
28
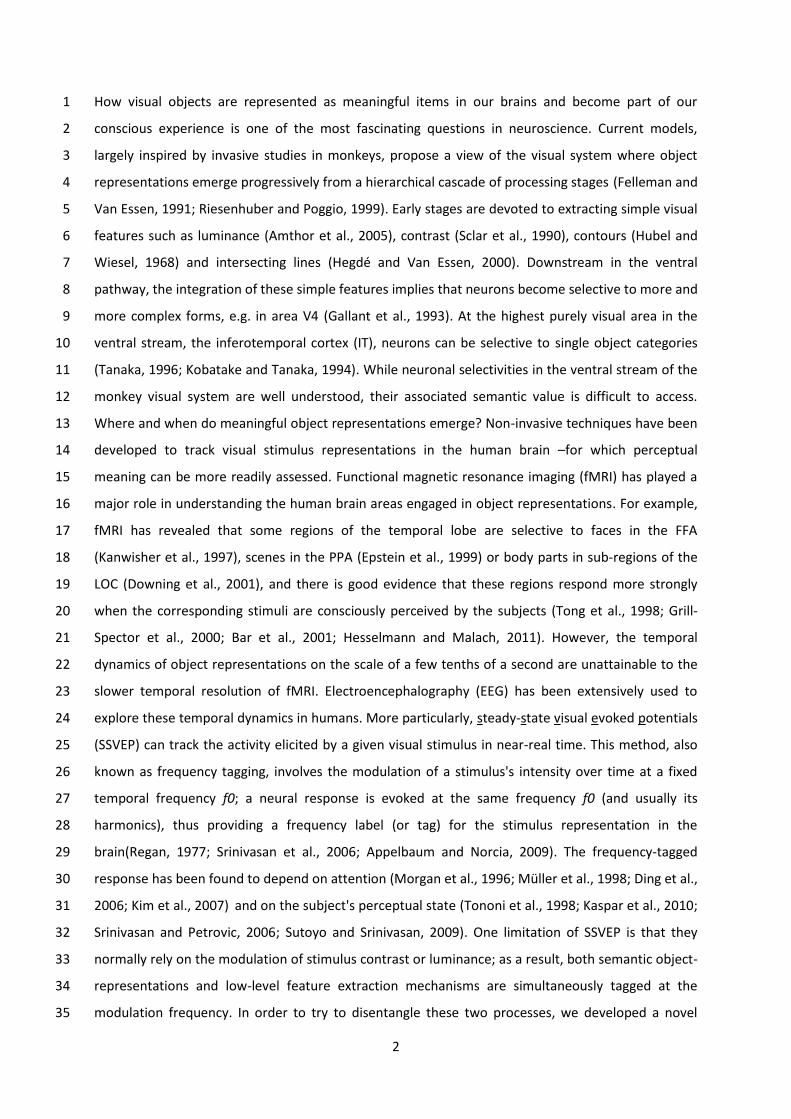
2
How visual objects are represented as meaningful items in our brains and become part of our 1
conscious experience is one of the most fascinating questions in neuroscience. Current models, 2
largely inspired by invasive studies in monkeys, propose a view of the visual system where object 3
representations emerge progressively from a hierarchical cascade of processing stages (Felleman and 4
Van Essen, 1991; Riesenhuber and Poggio, 1999). Early stages are devoted to extracting simple visual 5
features such as luminance (Amthor et al., 2005), contrast (Sclar et al., 1990), contours (Hubel and 6
Wiesel, 1968) and intersecting lines (Hegdé and Van Essen, 2000). Downstream in the ventral 7
pathway, the integration of these simple features implies that neurons become selective to more and 8
more complex forms, e.g. in area V4 (Gallant et al., 1993). At the highest purely visual area in the 9
ventral stream, the inferotemporal cortex (IT), neurons can be selective to single object categories 10
(Tanaka, 1996; Kobatake and Tanaka, 1994). While neuronal selectivities in the ventral stream of the 11
monkey visual system are well understood, their associated semantic value is difficult to access. 12
Where and when do meaningful object representations emerge? Non-invasive techniques have been 13
developed to track visual stimulus representations in the human brain –for which perceptual 14
meaning can be more readily assessed. Functional magnetic resonance imaging (fMRI) has played a 15
major role in understanding the human brain areas engaged in object representations. For example, 16
fMRI has revealed that some regions of the temporal lobe are selective to faces in the FFA 17
(Kanwisher et al., 1997), scenes in the PPA (Epstein et al., 1999) or body parts in sub-regions of the 18
LOC (Downing et al., 2001), and there is good evidence that these regions respond more strongly 19
when the corresponding stimuli are consciously perceived by the subjects (Tong et al., 1998; Grill-20
Spector et al., 2000; Bar et al., 2001; Hesselmann and Malach, 2011). However, the temporal 21
dynamics of object representations on the scale of a few tenths of a second are unattainable to the 22
slower temporal resolution of fMRI. Electroencephalography (EEG) has been extensively used to 23
explore these temporal dynamics in humans. More particularly, steady-state visual evoked potentials 24
(SSVEP) can track the activity elicited by a given visual stimulus in near-real time. This method, also 25
known as frequency tagging, involves the modulation of a stimulus's intensity over time at a fixed 26
temporal frequency f0; a neural response is evoked at the same frequency f0 (and usually its 27
harmonics), thus providing a frequency label (or tag) for the stimulus representation in the 28
brain(Regan, 1977; Srinivasan et al., 2006; Appelbaum and Norcia, 2009). The frequency-tagged 29
response has been found to depend on attention (Morgan et al., 1996; Müller et al., 1998; Ding et al., 30
2006; Kim et al., 2007) and on the subject's perceptual state (Tononi et al., 1998; Kaspar et al., 2010; 31
Srinivasan and Petrovic, 2006; Sutoyo and Srinivasan, 2009). One limitation of SSVEP is that they 32
normally rely on the modulation of stimulus contrast or luminance; as a result, both semantic object-33
representations and low-level feature extraction mechanisms are simultaneously tagged at the 34
modulation frequency. In order to try to disentangle these two processes, we developed a novel 35
3
technique called SWIFT (semantic wavelet-induced frequency tagging) in which we equalized low-1
level physical attributes (luminance, contrast and spatial frequency spectrum) across all frames of a 2
sequence, while modulating, at a fixed frequency f0, the mid- and higher-level image properties 3
carried by the spatial configuration of local contours. This novel approach allowed us to isolate the 4
neural correlates of object recognition: we show that SWIFT is insensitive to unrecognized objects 5
presented up to 30 s, but is highly selective to the recognition of the same objects once their identity 6
has been explicitly revealed. As a further confirmation of their high-level nature, we demonstrate 7
that SWIFT signals are strongly modulated by top-down attention –considerably more so than classic 8
SSVEP signals. Finally, SWIFT allowed us to measure the temporal capacity of conscious object 9
representations: we found a limit between 4 and 7 items per second. 10
11
12
Results 13
SWIFT sequences properties: 14
By scrambling information in the wavelet domain (see Experimental procedures and Fig 1), we 15
created image sequences in which the contours of the image were disrupted cyclically at a fixed 16
frequency f0, while low-level properties (in particular global luminance, local luminance modulation, 17
contrast and spatial frequency spectrum) were preserved at all time-points. As a result, visual 18
processing mechanisms that are sensitive to these low-level features should be equally engaged by 19
all frames in the sequence, and their response profile should thus be independent of f0. On the other 20
hand, higher-level mechanisms responsible for extracting semantic information would only come 21
into play once during each cycle: around the onset of the original, unscrambled image. By analyzing 22
the neural activity evoked at f0 we should thus be able to isolate form-sensitive and higher-level 23
mechanisms. 24
Our first step was to verify that our SWIFT procedure indeed preserved low-level image features at 25
both the local and global levels. In our procedure (see Methods section), each wavelet was 26
temporally modulated at a different harmonic (i.e. multiple) frequency of f0, such that individual 27
contour elements returned to their original orientation several times per cycle –but the entire image 28
was restored only once per cycle. As a result, the luminance of individual pixels was modulated 29
equally over a wide range of frequencies, and the average temporal frequency spectrum of pixel 30
luminance was thus found to be constant around the frequency of interest f0 (fig 1b, upper panel, 31
red curve); in contrast, classic SSVEP methods using luminance or contrast modulation produce a 32
sharp peak at f0 in this temporal frequency spectrum (fig 1b, upper panel, black curve). Similarly, 33

4
global image contrast was also preserved over time in SWIFT sequences (fig 1b, lower panel, red 1
curve), but not in classic SSVEP sequences (fig 1b, lower panel, black curve). Finally, our wavelet 2
scrambling procedure also conserves the local distribution of spatial frequencies, since (by design) it 3
only affects the orientation, but not the energy or spatial frequency of each wavelet. 4
Phenomenologically, SWIFT sequences are perceived as a periodic flow of discernible information 5
(i.e. the embedded image) recurringly fading-out into an indistinguishable pattern –like an image 6
reflected in a water surface suddenly vanishing into chaotic ripples (see Movie S1 at http://cerco.ups-7
tlse.fr/~koenig/SWIFT_manuscript/Movie_S1.avi). The recurrence of the embedded image is 8
pulsatile, rather than sinusoidal. This is a consequence of the introduction of multiple harmonic 9
frequencies in the wavelet scrambling: the original image is only visible when the phases of the 10
different harmonic modulations come into alignment. With the five harmonics used here (see 11
Methods section) the embedded image was recognizable in only ~10% of the individual frames (see 12
Figure S1). This visibility can be manipulated by varying the temporal frequency f0 and the number of 13
harmonic frequencies used in the wavelet scrambling. We exploited this property to create 14
sequences where the embedded object was difficult to identify. Crucially, after priming the content 15
of the sequence by revealing the original image, the same unrecognized objects became easy to 16
recognize in a second presentation, enabling us to compare EEG activity when subjects were aware 17
and unaware of the embedded object, as illustrated in the next section. 18
19
Isolating object recognition awareness: 20
To determine our method's sensitivity to semantic processing, we compared the activity elicited by 21
SWIFT sequences in three different conditions: (1) when the semantic content was present and 22
perceived, (2) when it was present and not perceived and (3) when there was no semantic content. 23
To create these conditions, SWIFT sequences were produced containing natural images that could be 24
either recognized (i.e. semantic information is available and perceived) or not recognized (i.e. 25
semantic information is available but not perceived); we also produced sequences containing 26
abstract textures (i.e. no semantic information), which were used as a baseline. We showed each 27
sequence twice, the second time after having explicitly revealed the embedded semantic content 28
(when available), such that we could compare the activity elicited by exactly the same sequence 29
before and after the subject had access to the semantic information. 30
More precisely, we presented SWIFT sequences (n=100) containing either grayscale natural images 31
with one principal visual object (80%) or low-level matched textures (20%). The image contours were 32

5
modulated cyclically over time at f0=1.5 Hz, meaning that the original image reappeared regularly 1
with a period of ~0.67 s. Importantly, each sequence contained only one embedded image (either a 2
natural image or an abstract texture), and was used only once in the experiment. Each trial consisted 3
of two distinct periods (figure 2a): the first "naïve" period (30 s), followed by a steady presentation of 4
the original image contained in the sequence (2 s), and finally the "cognizant" period (10 s). In the 5
naïve period, subjects saw the SWIFT sequence for the first time; their task consisted in reporting the 6
identification of a visual object (i.e. a non-abstract item) by a button press as fast as possible. Two 7
different response keys were provided corresponding to distinct confidence levels: “I perceive an 8
object-like item, but I am not sure of which object it is” (key 1), and “I see an object and I have 9
identified it confidently” (key 2). It was possible to press the second key directly, or the first key 10
subsequently followed by the second one. When subjects did not perceive any object no key press 11
was required. After the naïve period, the image embedded in the sequence was revealed and 12
presented steadily for 2 s. Subjects were instructed to explore it freely and to seek the features (if 13
any) that had not been recognized during the naïve period. Finally, in the cognizant period the SWIFT 14
sequence was showed again (10 s), and subjects were asked to try and identify the object and/or the 15
details they had missed during the naïve period. The natural images used to construct the sequences 16
contained non-canonical views of bodies, faces, animals and manmade objects, which means that 17
several images were not recognized during the naïve period, but only during the cognizant period, 18
i.e. after their identity had been revealed. This allowed us to compare the activity elicited by SWIFT 19
when the same object was recognized and when it was not. 20
Trials were classified as 'quickly recognized' when a natural image was presented and the subject 21
recognized an object with high confidence within the first 10 s of the naïve period (22.2% of trials). 22
Trials were classified as 'tardily recognized' when a natural image was presented but the subject did 23
not recognize an object during the 30 sec of the naïve period (22.4% of trials). Trials were classified 24
as 'no-object' when abstract textures where presented (20%, regardless of the subject's response: 25
the false alarm rate at low confidence was 2.86%, and at high confidence only 0.14%). Sequences 26
presenting natural images where the objects were not confidently detected (i.e. only with low 27
confidence, or with high confidence but only after the first 10s of presentation) were not analyzed 28
(35.4% of trials). 29
We analyzed EEG data (64 channels) of 17 participants. Each wavelet-scrambling cycle (669 ms), 30
starting at the moment when the original image was fully recognizable, was taken as an epoch to 31
compute the event-related potential (ERP). Based on the ERP topography (Fig 2b), we selected 4 32
central electrodes where the ERP was highest, and we present the corresponding ERP in figure 2b. 33
The ERP for no-object trials can be used as a baseline (green line, fig 2b), since there was no semantic 34
6
information present in these trials. The quickly recognized trials (where the semantic information 1
was present and perceived, black line, fig 2b) showed a positive peak around 300 ms, both during the 2
naïve period (with a significant difference to the 'no-object' baseline from 261 to 387ms, two-tailed, 3
paired t-test, p<0.05) and during the cognizant period (significant difference from 269 to 411ms). 4
Tardily recognized trials in the naïve period (where the semantic information was present but not yet 5
perceived, red line, Figure 2b, left panel), on the other hand, were not significantly different from no-6
object trials (two-tailed, paired t-test, p>0.05), but only showed a significant difference during the 7
cognizant period (where the semantic information was present and this time perceived, red line, 8
Figure 2b, right panel) from 269 to 388 ms (two-tailed, paired t-test, p<0.05). ERP topographies, 9
computed over time points when quickly-recognized ERPs differed from baseline for the naïve period 10
(261 - 387 ms), and over time points when both quickly-recognized ERPs and tardily-recognized ERPs 11
differed from baseline for the cognizant period (269 -388 ms), show a positive central potential 12
which is selective to object recognition: it is present whenever an object is recognized (whether 13
spontaneously, during the naïve period, or after explicit priming, during the cognizant period), but it 14
is absent otherwise. 15
Finally, the similarity of SWIFT responses across subjects was assessed by computing the phase-16
locking value of ERPs, band-pass filtered at f0, across the subjects' population (see Experimental 17
procedures for details). Whenever an object was recognized (quickly recognized trials in both naïve 18
and cognizant periods, and tardily recognized trials in cognizant period) a significant phase-locking 19
emerged, indicative of a globally similar ERP waveform across subjects (Figure 2c). Importantly, no 20
significant phase locking was observed for unrecognized objects or no-object sequences. Thus, SWIFT 21
responses appear to constitute a reliable index of conscious recognition. 22
23
Measuring attention deployment: 24
Top-down attentional modulations are known to be stronger in higher-level visual areas than in 25
lower-level ones (Lauritzen et al., 2009; Müller and Kleinschmidt, 2003; Beck and Kastner, 2005; 26
McMains and Kastner, 2011). As a result, the conscious representation of an object must be 27
enhanced more strongly by attention than the physical attributes of the same object. Hence, SWIFT 28
responses should be more strongly modulated by attention than the responses from more classic 29
frequency-tagging methods. To test this we quantified attention deployment to a face image using 30
either (on randomly interleaved trials) a simple contrast modulation (classic SSVEP) or our wavelet-31
scrambling method (SWIFT). In each trial, two faces were presented on either side of fixation, each 32
one oscillating at a different frequency (1.5 Hz or 2.03 Hz, positions counterbalanced across trials). A 33
7
central cue, pointing either to the left or right, indicated which face had to be attended (Figure 3a). In 1
order to engage the subjects' attention, the task was to report whether a "deviant" cycle (20% 2
probability) had occurred in the attended sequence (i.e. a cycle in which the circular wavelet 3
scrambling or the SSVEP contrast modulation did not return to the original image, see Experimental 4
procedures for details). The effect of attention was measured as the relative increase of phase-5
locking values across trials at f0 over all channels, for the target sequence compared to the distractor 6
sequence (Figure 3b; see Experimental procedures for details). The amplitude of the attentional 7
effect revealed by the classic SSVEP technique was 30.1% (±6%, s.e.m. across 8 subjects), consistent 8
with existing findings (Kim et al., 2007; Müller et al., 1998; Morgan et al., 1996). In SWIFT trials, the 9
attentional effect reached 208.5% (±23%, s.e.m.). This impressive difference (p<10-4, two-tailed, 10
paired t-test) confirms that SWIFT selectively tags high-level object representations, which are more 11
strongly modulated by top-down attention than the lower-level feature extraction processes 12
associated with more classic SSVEP sequences. 13
14
Probing the temporal dynamics of object representations: 15
Finally, we used SWIFT to measure the rate at which the visual system can produce semantic object 16
representations. To this aim, we presented SWIFT sequences at different modulation frequencies f0: 17
the maximum frequency at which SWIFT can successfully tag object representations should indicate 18
the fastest rate at which the visual system can extract and integrate visual information to lead to a 19
conscious perception. SWIFT sequences containing grayscale natural images (n=20) were shown at 8 20
frequencies in different trials (1.5, 2.03, 2.62, 3.4, 4.32, 6.96, 8.42 and 12.31 Hz). As in the previous 21
experiment, the subjects' task was to detect any deviant cycle (present in 20% of trials). We 22
measured the tagging as the mean phase-locking factor across trials at f0 (Figure 4; see Experimental 23
procedures). This tagging was significant from 1.5 to 4.32 Hz (two-tailed, one sample t-test, fdr-24
corrected, p = 3.3∙10-5, 2.6∙10-5, 8.5∙10-4, 3.3∙10-5, 2.9∙10-5). Thus, the high-level object representations 25
that are selectively tagged by the SWIFT method appear to reach their limit between 4 and 7 object 26
representations per second. 27
28
Discussion 29
We have developed a new technique to explore the neural correlates of object perception 30
awareness. As a consequence of the conservation of low-level features on each frame, SWIFT isolates 31
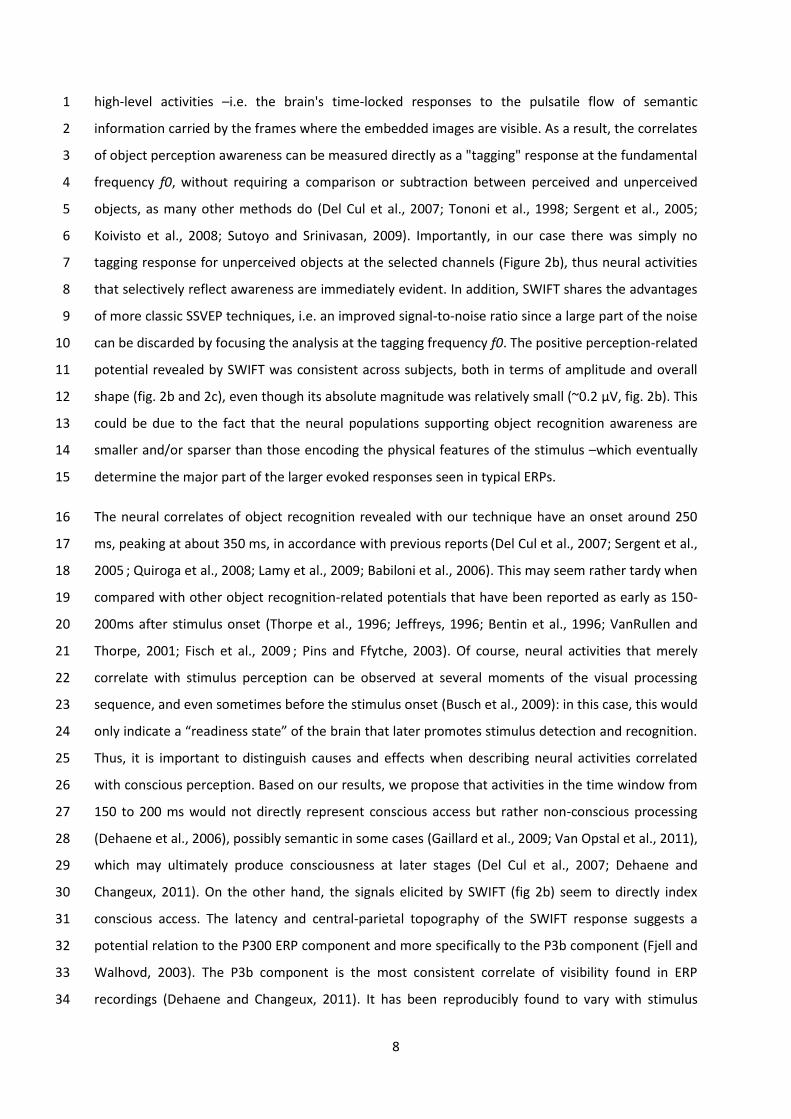
8
high-level activities –i.e. the brain's time-locked responses to the pulsatile flow of semantic 1
information carried by the frames where the embedded images are visible. As a result, the correlates 2
of object perception awareness can be measured directly as a "tagging" response at the fundamental 3
frequency f0, without requiring a comparison or subtraction between perceived and unperceived 4
objects, as many other methods do (Del Cul et al., 2007; Tononi et al., 1998; Sergent et al., 2005; 5
Koivisto et al., 2008; Sutoyo and Srinivasan, 2009). Importantly, in our case there was simply no 6
tagging response for unperceived objects at the selected channels (Figure 2b), thus neural activities 7
that selectively reflect awareness are immediately evident. In addition, SWIFT shares the advantages 8
of more classic SSVEP techniques, i.e. an improved signal-to-noise ratio since a large part of the noise 9
can be discarded by focusing the analysis at the tagging frequency f0. The positive perception-related 10
potential revealed by SWIFT was consistent across subjects, both in terms of amplitude and overall 11
shape (fig. 2b and 2c), even though its absolute magnitude was relatively small (~0.2 µV, fig. 2b). This 12
could be due to the fact that the neural populations supporting object recognition awareness are 13
smaller and/or sparser than those encoding the physical features of the stimulus –which eventually 14
determine the major part of the larger evoked responses seen in typical ERPs. 15
The neural correlates of object recognition revealed with our technique have an onset around 250 16
ms, peaking at about 350 ms, in accordance with previous reports (Del Cul et al., 2007; Sergent et al., 17
2005 ; Quiroga et al., 2008; Lamy et al., 2009; Babiloni et al., 2006). This may seem rather tardy when 18
compared with other object recognition-related potentials that have been reported as early as 150-19
200ms after stimulus onset (Thorpe et al., 1996; Jeffreys, 1996; Bentin et al., 1996; VanRullen and 20
Thorpe, 2001; Fisch et al., 2009 ; Pins and Ffytche, 2003). Of course, neural activities that merely 21
correlate with stimulus perception can be observed at several moments of the visual processing 22
sequence, and even sometimes before the stimulus onset (Busch et al., 2009): in this case, this would 23
only indicate a “readiness state” of the brain that later promotes stimulus detection and recognition. 24
Thus, it is important to distinguish causes and effects when describing neural activities correlated 25
with conscious perception. Based on our results, we propose that activities in the time window from 26
150 to 200 ms would not directly represent conscious access but rather non-conscious processing 27
(Dehaene et al., 2006), possibly semantic in some cases (Gaillard et al., 2009; Van Opstal et al., 2011), 28
which may ultimately produce consciousness at later stages (Del Cul et al., 2007; Dehaene and 29
Changeux, 2011). On the other hand, the signals elicited by SWIFT (fig 2b) seem to directly index 30
conscious access. The latency and central-parietal topography of the SWIFT response suggests a 31
potential relation to the P300 ERP component and more specifically to the P3b component (Fjell and 32
Walhovd, 2003). The P3b component is the most consistent correlate of visibility found in ERP 33
recordings (Dehaene and Changeux, 2011). It has been reproducibly found to vary with stimulus 34
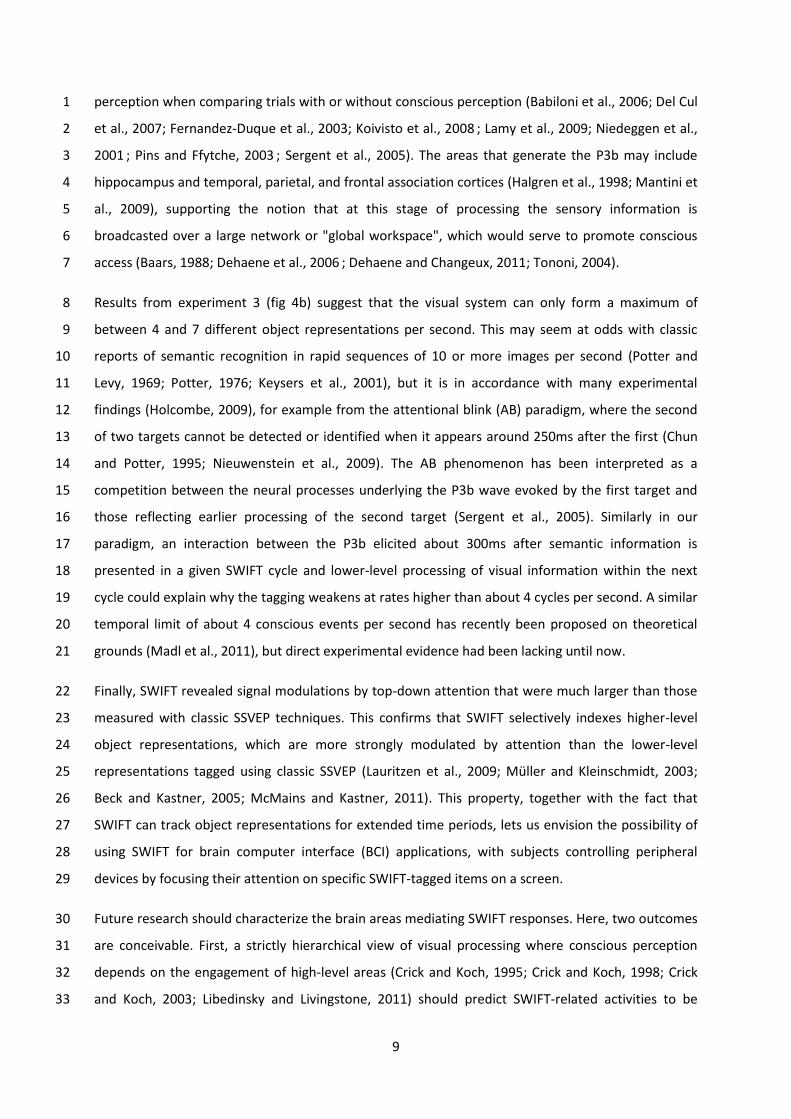
9
perception when comparing trials with or without conscious perception (Babiloni et al., 2006; Del Cul 1
et al., 2007; Fernandez-Duque et al., 2003; Koivisto et al., 2008 ; Lamy et al., 2009; Niedeggen et al., 2
2001 ; Pins and Ffytche, 2003 ; Sergent et al., 2005). The areas that generate the P3b may include 3
hippocampus and temporal, parietal, and frontal association cortices (Halgren et al., 1998; Mantini et 4
al., 2009), supporting the notion that at this stage of processing the sensory information is 5
broadcasted over a large network or "global workspace", which would serve to promote conscious 6
access (Baars, 1988; Dehaene et al., 2006 ; Dehaene and Changeux, 2011; Tononi, 2004). 7
Results from experiment 3 (fig 4b) suggest that the visual system can only form a maximum of 8
between 4 and 7 different object representations per second. This may seem at odds with classic 9
reports of semantic recognition in rapid sequences of 10 or more images per second (Potter and 10
Levy, 1969; Potter, 1976; Keysers et al., 2001), but it is in accordance with many experimental 11
findings (Holcombe, 2009), for example from the attentional blink (AB) paradigm, where the second 12
of two targets cannot be detected or identified when it appears around 250ms after the first (Chun 13
and Potter, 1995; Nieuwenstein et al., 2009). The AB phenomenon has been interpreted as a 14
competition between the neural processes underlying the P3b wave evoked by the first target and 15
those reflecting earlier processing of the second target (Sergent et al., 2005). Similarly in our 16
paradigm, an interaction between the P3b elicited about 300ms after semantic information is 17
presented in a given SWIFT cycle and lower-level processing of visual information within the next 18
cycle could explain why the tagging weakens at rates higher than about 4 cycles per second. A similar 19
temporal limit of about 4 conscious events per second has recently been proposed on theoretical 20
grounds (Madl et al., 2011), but direct experimental evidence had been lacking until now. 21
Finally, SWIFT revealed signal modulations by top-down attention that were much larger than those 22
measured with classic SSVEP techniques. This confirms that SWIFT selectively indexes higher-level 23
object representations, which are more strongly modulated by attention than the lower-level 24
representations tagged using classic SSVEP (Lauritzen et al., 2009; Müller and Kleinschmidt, 2003; 25
Beck and Kastner, 2005; McMains and Kastner, 2011). This property, together with the fact that 26
SWIFT can track object representations for extended time periods, lets us envision the possibility of 27
using SWIFT for brain computer interface (BCI) applications, with subjects controlling peripheral 28
devices by focusing their attention on specific SWIFT-tagged items on a screen. 29
Future research should characterize the brain areas mediating SWIFT responses. Here, two outcomes 30
are conceivable. First, a strictly hierarchical view of visual processing where conscious perception 31
depends on the engagement of high-level areas (Crick and Koch, 1995; Crick and Koch, 1998; Crick 32
and Koch, 2003; Libedinsky and Livingstone, 2011) should predict SWIFT-related activities to be 33

10
restricted to higher levels of the hierarchy (e.g. temporal lobe or frontal regions). A second possibility 1
stems from the notion that conscious perception reflects recurrent activity at multiple stages of the 2
visual system (Baars, 1988; Tononi, 2004; Lamme and Roelfsema, 2000; Dehaene and Changeux, 3
2011; Dehaene et al., 2006). In this case, SWIFT-related signals should also be found upstream in the 4
visual pathway, indicating recurrent engagement of earlier visual areas. 5
6
7
8
9
10
11
12
13
14
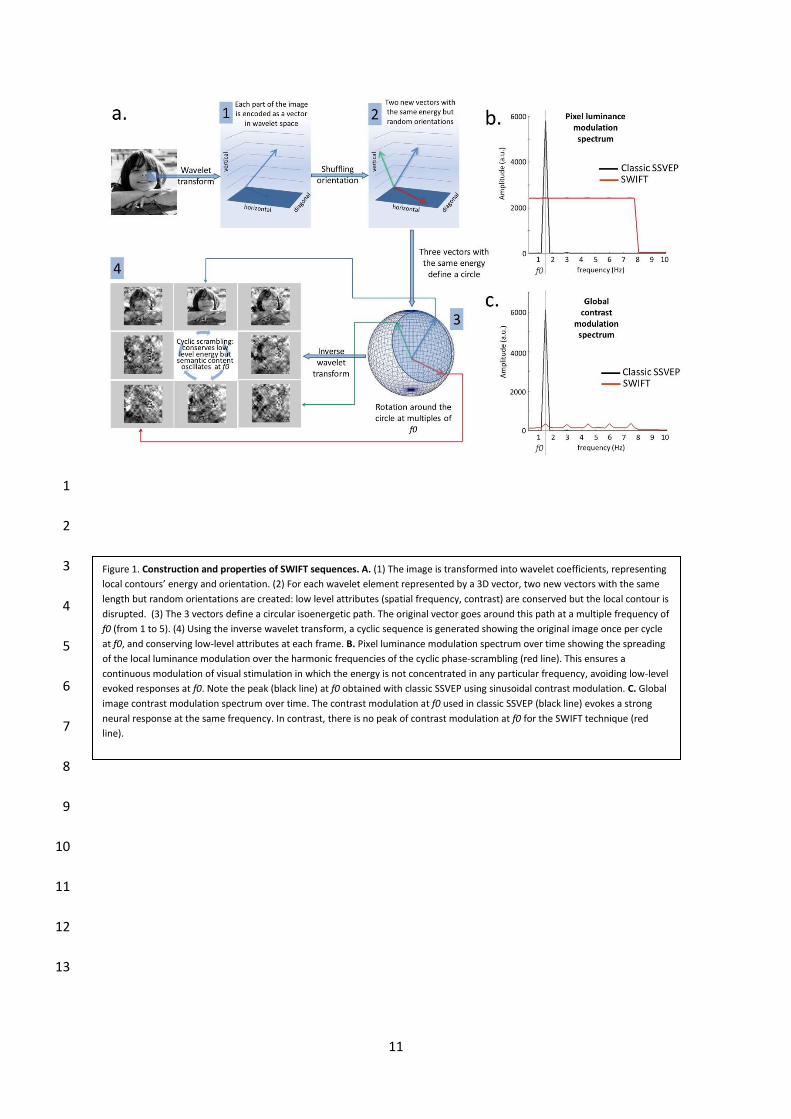
11
1
2
3
4
5
6
7
8
9
10
11
12
13
Figure 1. Construction and properties of SWIFT sequences. A. (1) The image is transformed into wavelet coefficients, representing
local contours’ energy and orientation. (2) For each wavelet element represented by a 3D vector, two new vectors with the same
length but random orientations are created: low level attributes (spatial frequency, contrast) are conserved but the local contour is
disrupted. (3) The 3 vectors define a circular isoenergetic path. The original vector goes around this path at a multiple frequency of
f0 (from 1 to 5). (4) Using the inverse wavelet transform, a cyclic sequence is generated showing the original image once per cycle
at f0, and conserving low-level attributes at each frame. B. Pixel luminance modulation spectrum over time showing the spreading
of the local luminance modulation over the harmonic frequencies of the cyclic phase-scrambling (red line). This ensures a
continuous modulation of visual stimulation in which the energy is not concentrated in any particular frequency, avoiding low-level
evoked responses at f0. Note the peak (black line) at f0 obtained with classic SSVEP using sinusoidal contrast modulation. C. Global
image contrast modulation spectrum over time. The contrast modulation at f0 used in classic SSVEP (black line) evokes a strong
neural response at the same frequency. In contrast, there is no peak of contrast modulation at f0 for the SWIFT technique (red
line).
b.
12
1
2
3
4
5
6
7
8
9
10
11
12
13
14
15
16
17
18
19 Figure 2. Isolating object perception awareness. A. Paradigm to compare activity elicited by SWIFT under recognition and non-recognition of objects (see
results section). Two SWIFT epochs composed each trial: the naïve period (30 s, where the sequence was presented for the first time) and the cognizant
period (10 s, where the sequence was presented again). In between, the original image was presented steadily for 2 s, ensuring that the object (if any)
would be later perceived in the cognizant period. Trials in which the object was detected in the first 10s of the naïve period were labeled as quickly
recognized trials (QR). Trials in which objects were recognized only in the cognizant period (no button press during the naïve period) were labeled as
tardily recognized trials (TR). In no-object trials (NO), abstract textures were shown and no object was ever recognized. B. ERP analysis over 4 central
electrodes (marked by a dot in the topographies) taking each wavelet-scrambling cycle (667 ms) as an epoch. Zero time indicates the frame where the
original (unscrambled) image was presented. Shaded areas represent S.E.M. During the naïve period, only the activity elicited in QR, but not in TR trials
differed (p < 0.05, gray box) from the baseline measured in the NO trials. In the cognizant period, however, both the QR and the TR conditions differed
from the NO condition (p < 0.05, gray box), and the waveforms elicited by QR and TR trials were very similar in this period. To summarize, a significant
response only occurred when subjects consciously recognized the objects in the sequences. Topographies were calculated over the time points falling
within the gray box (marking statistical significance). Object recognition activity peaked over central electrodes, and was only observed when an object
was recognized. C. Phase-locking analysis representing the similarity of ERP waveforms across subjects. EEG phase-locking across subjects at f0 was
significant (p<0.05) when an object was recognized, but did not differ from chance level when no object was recognized.
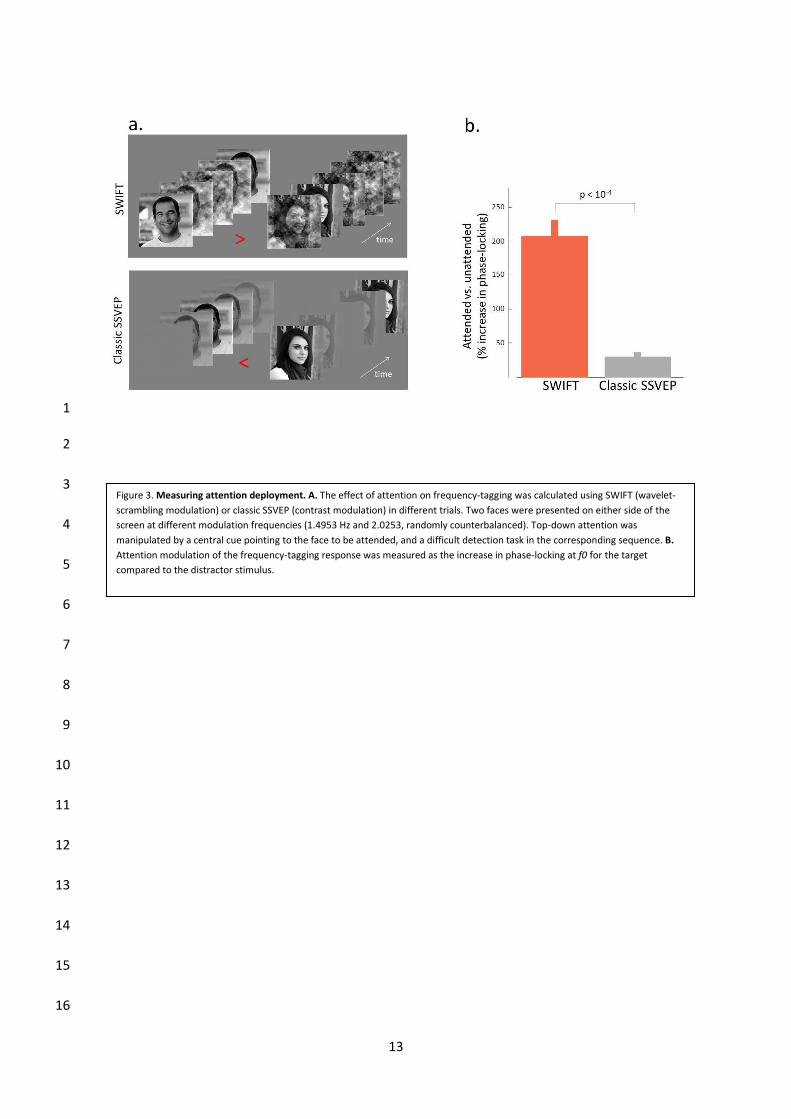
13
1
2
3
4
5
6
7
8
9
10
11
12
13
14
15
16
Figure 3. Measuring attention deployment. A. The effect of attention on frequency-tagging was calculated using SWIFT (wavelet-
scrambling modulation) or classic SSVEP (contrast modulation) in different trials. Two faces were presented on either side of the
screen at different modulation frequencies (1.4953 Hz and 2.0253, randomly counterbalanced). Top-down attention was
manipulated by a central cue pointing to the face to be attended, and a difficult detection task in the corresponding sequence. B.
Attention modulation of the frequency-tagging response was measured as the increase in phase-locking at f0 for the target
compared to the distractor stimulus.
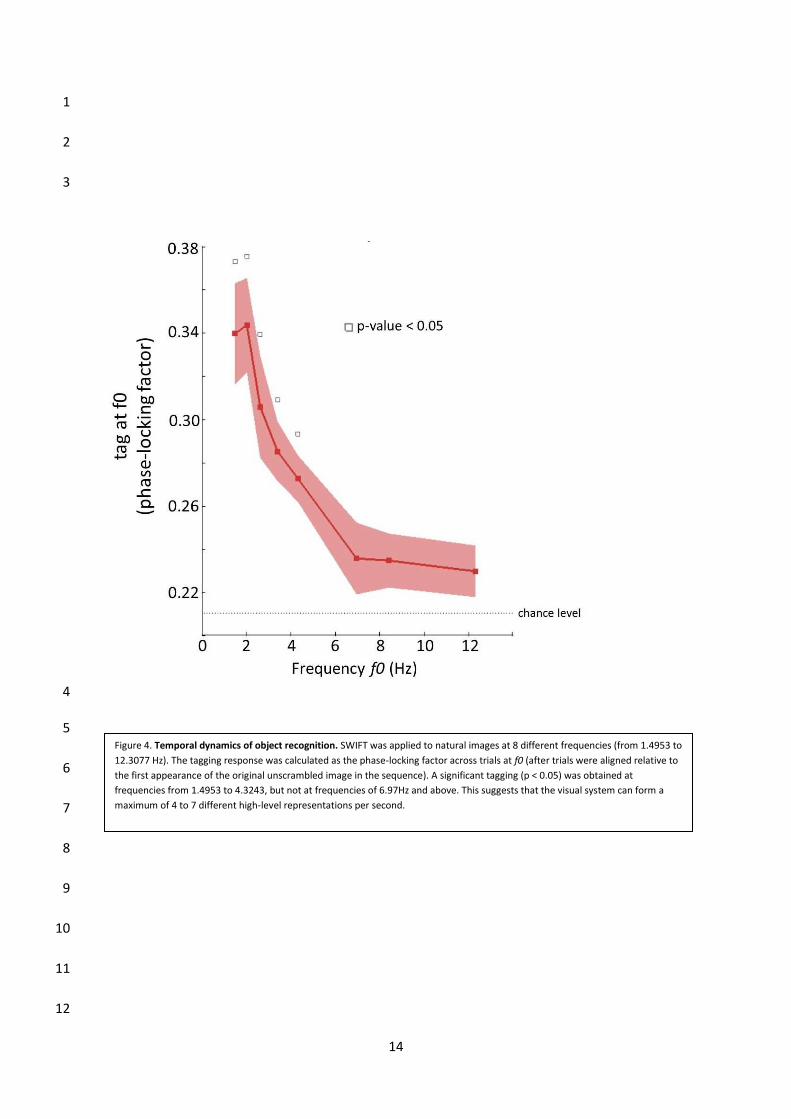
14
1
2
3
4
5
6
7
8
9
10
11
12
Figure 4. Temporal dynamics of object recognition. SWIFT was applied to natural images at 8 different frequencies (from 1.4953 to
12.3077 Hz). The tagging response was calculated as the phase-locking factor across trials at f0 (after trials were aligned relative to
the first appearance of the original unscrambled image in the sequence). A significant tagging (p < 0.05) was obtained at
frequencies from 1.4953 to 4.3243, but not at frequencies of 6.97Hz and above. This suggests that the visual system can form a
maximum of 4 to 7 different high-level representations per second.
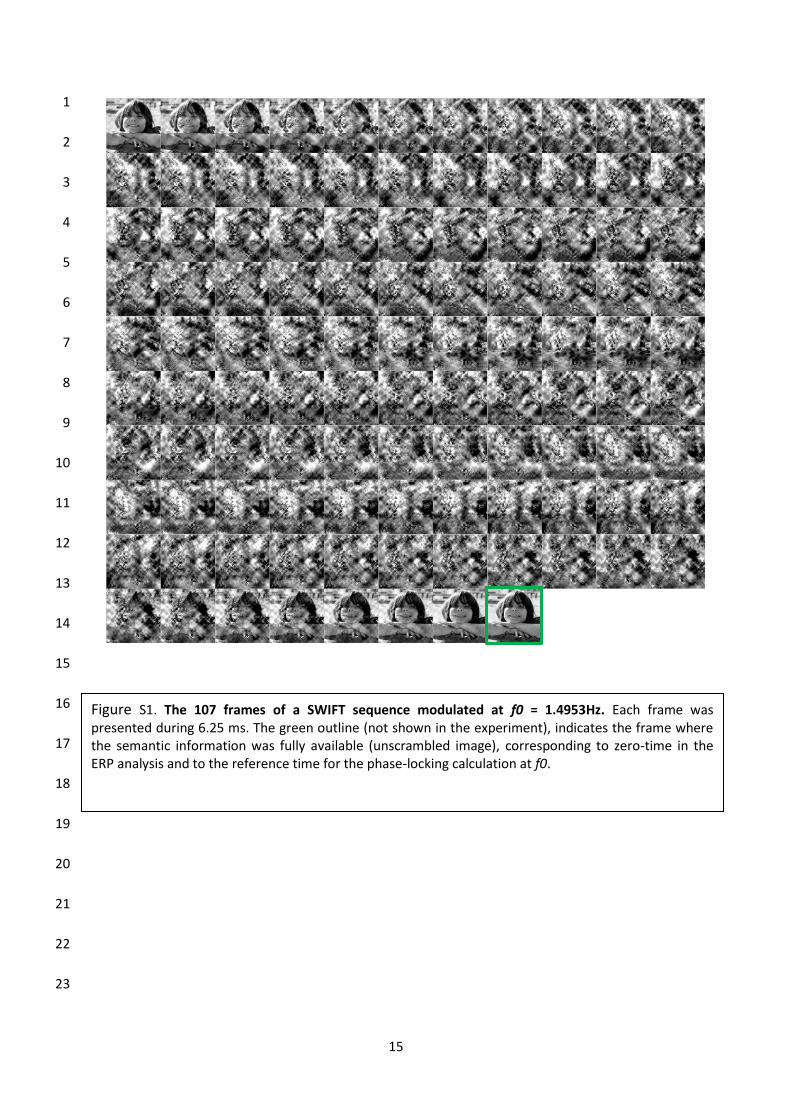
15
1
2
3
4
5
6
7
8
9
10
11
12
13
14
15
16
17
18
19
20
21
22
23
Figure S1. The 107 frames of a SWIFT sequence modulated at f0 = 1.4953Hz. Each frame was presented during 6.25 ms. The green outline (not shown in the experiment), indicates the frame where the semantic information was fully available (unscrambled image), corresponding to zero-time in the ERP analysis and to the reference time for the phase-locking calculation at f0.
16
Methods 1
SWIFT sequences creation. SWIFT sequences were created by cyclic wavelet scrambling in the 2
wavelets 3D space. We chose wavelet image decomposition rather than other types of image 3
transformation (such as the Fourier transform) because wavelet functions (contrary to Fourier 4
functions) are localized in space: this allowed us to scramble contours while conserving local low-5
level attributes. The first step was to apply a wavelet transform based on the discrete Meyer (dmey) 6
wavelet and 6 decomposition levels, using the Wavelet toolbox under Matlab (MathWorks); in other 7
words, the image was converted to a multi-scale pyramid of spatially organized maps. At each 8
location and scale, the local contour is represented by a 3D vector , with the 3 dimensions 9
representing the strengths of horizontal, vertical and diagonal orientations. The vector length is 10
a measure of local contour energy. In a second step, for each location and scale, two random vectors 11
( and ) were defined that shared the length of the original vector (| | | | ), thus 12
conserving local energy. By definition, the 3 vectors describe a unique circular path over an 13
isoenergetic sphere where all surface points share the same energy (i.e., the same Euclidian distance 14
from the origin) but represent differently oriented versions of the local image contour. The cyclic 15
wavelet-scrambling was then performed by rotating each original vector (representing the actual 16
image contour), along the circular path defined above. Some wavelet elements (defined by a specific 17
spatial location and decomposition scale) underwent this rotation once per cycle (i.e., at the 18
fundamental frequency f0) while others rotated multiple (integer) times per cycle (i.e., at harmonic 19
frequencies of f0, from the 2nd up to the 5th harmonic). The introduction of harmonics was crucial to 20
spread the temporal luminance modulation over a broader frequency band, avoiding low-level 21
evoked activity at the tagging frequency f0. The 5 harmonic frequencies were distributed equally and 22
randomly among all the wavelet elements. Finally, the inverse wavelet transform was used to obtain 23
the image sequences in the pixel domain. By construction, the original unscrambled image appeared 24
once in each cycle, with a number of intervening wavelet-scrambled frames that depended on the 25
monitor refresh rate and the tagging frequency f0. For each original image, several distinct wavelet-26
scrambling cycles were computed (5 cycles in experiment 1, 2 cycles in experiment 2 and 4 cycles in 27
experiment 3), with different randomly chosen values for the wavelet-scrambling trajectories and the 28
harmonic rotation frequency at each wavelet element. These different cycles were presented in 29
random alternation during the experimental sequences. Two final normalization steps were 30
necessary in order to ensure that the temporal luminance modulation for every pixel was constant 31
(i.e. without any peaks at the individual harmonics frequencies) within the range of harmonic 32
modulation frequencies, and also to ensure the conservation of the mean luminance across frames. 33

17
First, we calculated the Fourier transform across frames for every pixel and normalized their 1
luminance modulation spectra. Second, mean frame luminance was equalized over time. (NB: A 2
Matlab script following this procedure to create a wavelet-scrambling sequence based on any given 3
original image is available as supplementary material). 4
Subjects. All subjects gave informed consent to take part in these studies that were approved by the 5
local ethics committee. A total of 49 observers (26 women, aged 22 to 53) participated in the 3 6
experiments (19 in Experiment 1, 8 in Experiment 2 and 24 in Experiment 3). 7
Stimuli and procedure. For all 3 experiments, subjects were placed at 57 cm of a CRT screen with a 8
refresh rate of 170 Hz in a dark room. 9
In Experiment 1, 100 SWIFT sequences containing either grayscale natural images (bodies with faces 10
29%, bodies with no visible faces 16%, animals 21% and manmade objects 14%, downloaded from 11
the Internet) or low-level matched textures synthesized using the texture synthesis algorithm 12
developed by Portilla & Simoncelli(Portilla and Simoncelli, 2000) were shown. The image contours 13
were modulated cyclically over time at f0=1.4953 Hz. The experiment was divided in 4 blocks of 25 14
trials each. Each trial lasted 42 sec (30 sec of naïve period + 2 sec of steady image presentation + 10 15
sec of cognizant period). Sequences (10.5° x 10.5° visual angle) were presented at the center of the 16
screen over a grey background. Subjects were asked to keep their fixation over a red cross at the 17
center of the display during the trial. They gave their responses (presence of a non-abstract item) at 18
any time during the first naïve period by pressing the left arrow of the computer keyboard for the 19
low confidence threshold (key 1: "I perceive an object-like item, but I am not sure of which object it 20
is”) and the right arrow for the high confidence threshold (key 2: “I see an object and I have 21
identified it confidently”). Trials were classified as 'quickly recognized' when a natural image was 22
presented and the subject recognized an object with high confidence within the first 10 s of the naïve 23
period. Trials were classified as 'tardily recognized' when a natural image was presented but the 24
subject did not recognize an object during the 30 sec of the naïve period. Trials were classified as 'no-25
object' when abstract textures were presented. Two of 19 subjects were not considered in the 26
analysis because they had less than 7 tardily recognized trials. For the 17 remaining subjects, the 27
mean number of quickly recognized trials was 22.2, tardily recognized was 22.4 and 20 no-object 28
trials were presented systematically (the remaining trials, corresponding to incomplete or erroneous 29
recognition, were not included in the analysis). Response time for key 2 (“I see an object and I have 30
identified it confidently”) in fast recognized trials was 4.4 s (mean) and 3.5 s (median). 31
In experiment 2, 360 pairs of sequences containing human faces (n = 120, downloaded from the 32
Internet) were presented. The 2 sequences (8.5° x 8.5° visual angle) were presented over a grey 33
18
background, on either side of the screen, separated by 5.8° visual angle. In half of the trials both face 1
pictures were modulated in the contrast domain (by manipulating the contrast from 0 to 100% 2
through a sinusoidal envelope: "classic SSVEP") and the other half in the wavelet domain (SWIFT). In 3
each trial, the two sequences were modulated at two different, non-harmonically related 4
frequencies = 1.4953 Hz or 2.0253 Hz (counter balanced per presentation side across trials). The 5
experiment was divided in 4 blocks of 90 trials each. Subjects were instructed to attend the sequence 6
indicated by the central cue (a red arrow of 0.8° visual angle) and ignore the other, while keeping 7
fixation on the central arrow. The task consisted in detecting a deviant cycle (present in 20% of trials) 8
which was only presented in the target sequence. Deviant cycles under SWIFT modulation were 9
produced by inserting a cycle in which the embedded image was itself a wavelet scrambled version of 10
the face showed in the sequence, with the result that the face did not re-appear in this deviant cycle. 11
For the classic SSVEP modulation, the original face was replaced by a wavelet scrambled version in 12
the deviant cycle. Deviant cycles were placed randomly during the trial, excluding the first and last 13
cycle. Each trial lasted 10 seconds and the response (presence/absence of a deviant cycle) was given 14
at the end of the trial by pressing either the left (presence) or right (absence) arrow on a computer 15
keyboard. 16
In experiment 3, SWIFT sequences (10.5 x 10.5° visual angle) containing natural images (41% animals, 17
16% faces, 14% bodies with visible faces and 29% manmade, downloaded from the Internet), were 18
presented at the center of the screen over a grey background. Participants were asked to keep 19
fixation over a red cross at the center of the sequence during the trial. SWIFT modulation was 20
performed on different trials at 8 different, non-harmonically related frequencies (f0 = 1.4953, 21
2.0253, 2.6230, 3.4043, 4.3243, 6.9665, 8.4211 or 12.3077 Hz). The experimental session contained 22
160 trials, each lasting 10 sec. The task consisted in detecting the deviant cycles (present 20% of 23
trials) as explained above. The answer was given at the end of the trial by pressing the left arrow key 24
(present) or right arrow key (absent). 25
EEG acquisition and data processing. Continuous EEG was acquired with a 64-channel ActiveTwo 26
system (Biosemi). Two additional electrodes [CMS (common mode sense) and DRL (driven right leg)] 27
were used as reference and ground. Electrodes were placed according to the international 10/10 28
system. The vertical and horizontal electrooculogram were recorded by attaching additional 29
electrodes below the left eye and at the outer canthi of both eyes. An active electrode (CMS) and a 30
passive electrode (DRL) were used to compose a feedback loop for amplifier reference. Details of this 31
circuitry can be found on the Biosemi website (www.biosemi.com/faq/cms&drl.htm). All signals were 32
digitized at 1024 Hz, 24-bit A/D conversion. All data were analyzed off-line under Matlab 33
(MathWorks) using the EEGLAB toolbox (Delorme and Makeig, 2004). Average reference was 34
19
computed, the data was downsampled at 128 Hz and band-pass filtered between 0.5 and 30 Hz. DC 1
offset was removed from continuous EEG data. The linear trend was removed from each trial, using 2
Andreas Widman’s function for EEGLAB. Independent component analysis (ICA plugin from EEGLAB) 3
was performed to remove eye blinks and muscular artifacts. Artifactual components were removed 4
manually (from 2 to 5 out of 64 components per subject) according to their activity time course and 5
topography (frontal for eye blinks and temporal for muscular artifacts). 6
7
Event related potentials (ERP) analysis. Data was first low-pass filtered at 3.5 Hz in order to 8
concentrate the analysis on the responses evoked at the tagging frequency (1.4952 Hz). ERP epochs 9
were selected for the naïve and cognizant periods between -0.1 and 0.6688 sec, locked to the onset 10
of the embedded image in each SWIFT cycle (44.86 cycles in the naïve period and 14.95 in the 11
cognizant period; only full cycles were considered). A bootstrap procedure (resampling without 12
replacement, n = 1000) was used to equalize the number of trials entered in the computation of the 13
ERP for all conditions, periods (naïve vs. cognizant) and subjects, resampling 80 epochs at each 14
iteration. 4 central-parietal channels (Cz, CP1, CPz and CP2) were selected as a region of interest 15
using the amplitude of differential activities between perceived/non-perceived conditions as the 16
selection criterion. Onset latencies were evaluated using the statistical criteria proposed by Rugg et 17
al (Rugg et al., 1995): at least 15 consecutive time points with p-values (two-tailed, paired t test) 18
equal or below 0.05. 19
20
Phase-locking analysis. Time-locked responses generated at the tagging frequency f0 were assessed 21
by measuring the response phase delay conservation, relative to the onsets of the semantic 22
information (i.e. the onsets of the embedded image during the trial), at f0. Phase-locking analysis was 23
selected over other spectral measures (i.e. spectral power) because of its relative robustness to the 24
noise. By definition, noise is not time locked with the stimulus and can be readily discarded by phase 25
conservation analysis, whereas power analysis is insensitive to the delay of the response and thus 26
more prone to be influenced by noise. The phase of the EEG signals was calculated by means of the 27
fast Fourier transform (FFT) algorithm under Matlab (MathWorks). In experiments 2 and 3, the FFT 28
algorithm was applied over the entire epoch (10 s, 1280 time-points, frequency resolution = 0.1 Hz) 29
and the phase was extracted at the tagging frequency (f0 = 1.4953 Hz for experiment 1, f0 = 1.4953, 30
2.0253 Hz for experiment 2 and f0 = 1.4953, 2.0253, 2.6230, 3.4043, 4.3243, 6.9665, 8.4211 or 31
12.3077 Hz for experiment 3). The FFT transform at f0 of the time-domain signal for trial k is a 32
complex number in which A represents the amplitude of the signal and its phase: 33
20
( )
Phase-locking factor (PLF, also called inter-trial coherence or phase-locking value) was calculated as 1
follows: 2
|
∑
|
The PLF measure takes values between 0 and 1. A value of 0 represents absence of synchronization 3
across trials between EEG data and the time- locking events, and a value of 1 indicates perfect 4
synchronization. PLF is computed by normalizing the lengths of the complex vectors (representing 5
amplitude and phase) to 1 for all trials and then computing their complex average. Thus, only the 6
information about the phase of the spectral estimate of each trial is taken into account. 7
In experiment 2, the attentional effect was calculated as follows: 8
(
)
Were and are the phase-locking factors at the tagging frequency of the target and the 9
distractor, respectively. The ratio was calculated frequency-wise in order to compare activities 10
elicited at the same frequencies. This was done by dividing the PLF of the target and distractor at the 11
same tagging frequency (either both at f0 = 1.4953 or both at 2.0253 and thus representing activities 12
elicited in different trials). Overall attentional effect was obtained by averaging the ratios at the 2 13
tagging frequencies. 14
In experiment 3, the SWIFT response as a function of the different tagging frequencies (f0 = 1.4953, 15
2.0253, 2.6230, 3.4043, 4.3243, 6.9665, 8.4211 or 12.3077 Hz) was obtained directly as the PLF at the 16
given frequency: 17
PLF values for each f0 were averaged across subjects and the standard error of the mean (s.e.m.) 18
among them was calculated (shaded area fig 4b). Significance was assessed by comparing the PLF 19
values at each tagging frequency against the null hypothesis that all phases were distributed 20
randomly (the random PLF value over 16 trials = 0.2102, Monte Carlo simulation, 106 iterations) by 21
two-tailed, one-sample t-test. To correct for multiple comparisons, we analyzed the resulting 22
distributions of p values with the false discovery rate (FDR) procedure to compute a p threshold that 23
set the expected rate of falsely rejected null hypotheses to 5%. 24
21
Inter-subject phase-locking factor in experiment 1 was obtained by applying the FFT transform to the 1
ERP waveform of each subject (0.6641s, 85 time-points, frequency resolution 1.5058 Hz). The same 4 2
central-parietal channels of the ERP calculation were selected (Cz, CP1, CPz and CP2) and PLF at f0 = 3
1.4952 across subjects was calculated as follows: 4
|
∑
|
Where s is the number of subjects (n = 17). Significance thresholds were estimated by Monte Carlo 5
simulation. After 106 iterations the random PLF value over 17 subjects is 0.2037 (i.e. chance level). 6
Based on the PLF values distribution of the Monte Carlo simulation, 5% confidence interval is 7
represented by a PLF value of 0.4172 and 1% confidence interval by a PLF value = 0.5112. 8
9
10
11
12
13
14
15
16
17
18
19
20
21
22
23
22
REFERENCES 1
Amthor, F.R., Tootle, J.S., and Gawne, T.J. (2005). Retinal ganglion cell coding in simulated active 2
vision. Visual neuroscience 22, 789–806. 3
Appelbaum, L.G., and Norcia, A.M. (2009). Attentive and pre-attentive aspects of figural processing. 4
Journal of vision 9, 18.1–12. 5
Baars, B.J. (1988). A Cognitive Theory of Consciousness (Cambridge: Cambridge University Press). 6
Babiloni, C., Vecchio, F., Miriello, M., Romani, G.L., and Rossini, P.M. (2006). Visuo-spatial 7
consciousness and parieto-occipital areas: a high-resolution EEG study. Cerebral cortex (New York, 8
N.Y. : 1991) 16, 37–46. 9
Bar, M., Tootell, R.B., Schacter, D.L., Greve, D.N., Fischl, B., Mendola, J.D., Rosen, B.R., and Dale, a M. 10
(2001). Cortical mechanisms specific to explicit visual object recognition. Neuron 29, 529–535. 11
Beck, D.M., and Kastner, S. (2005). Stimulus context modulates competition in human extrastriate 12
cortex. Nature neuroscience 8, 1110–1116. 13
Bentin, S., Allison, T., Puce, A., Perez, E., and McCarthy, G. (1996). Electrophysiological studies of face 14
perception in humans. Journal of cognitive neuroscience 8, 551–565. 15
Busch, N. a, Dubois, J., and VanRullen, R. (2009). The phase of ongoing EEG oscillations predicts visual 16
perception. The Journal of neuroscience : the official journal of the Society for Neuroscience 29, 17
7869–7876. 18
Chun, M.M., and Potter, M.C. (1995). A two-stage model for multiple target detection in rapid serial 19
visual presentation. Journal of experimental psychology. Human perception and performance 21, 20
109–127. 21
Crick, F., and Koch, C. (1995). Are we aware of neural activity in primary visual cortex? Nature 375, 22
121–123. 23
Crick, F., and Koch, C. (1998). Constraints on cortical and thalamic projections: the no-strong-loops 24
hypothesis. Nature 391, 245–250. 25
Crick, F., and Koch, C. (2003). A framework for consciousness. Nature neuroscience 6, 119–126. 26
23
Del Cul, A., Baillet, S., and Dehaene, S. (2007). Brain dynamics underlying the nonlinear threshold for 1
access to consciousness. PLoS biology 5, e260. 2
Dehaene, S., and Changeux, J.-P. (2011). Experimental and theoretical approaches to conscious 3
processing. Neuron 70, 200–227. 4
Dehaene, S., Changeux, J.-P., Naccache, L., Sackur, J., and Sergent, C. (2006). Conscious, 5
preconscious, and subliminal processing: a testable taxonomy. Trends in cognitive sciences 10, 204–6
211. 7
Delorme, A., and Makeig, S. (2004). EEGLAB: an open source toolbox for analysis of single-trial EEG 8
dynamics including independent component analysis. Journal of Neuroscience Methods 134, 9–21. 9
Ding, J., Sperling, G., and Srinivasan, R. (2006). Attentional modulation of SSVEP power depends on 10
the network tagged by the flicker frequency. Cerebral cortex (New York, N.Y. : 1991) 16, 1016–1029. 11
Downing, P.E., Jiang, Y., Shuman, M., and Kanwisher, N. (2001). A cortical area selective for visual 12
processing of the human body. Science (New York, N.Y.) 293, 2470–2473. 13
Epstein, R., Harris, a, Stanley, D., and Kanwisher, N. (1999). The parahippocampal place area: 14
recognition, navigation, or encoding? Neuron 23, 115–125. 15
Felleman, D.J., and Van Essen, D.C. (1991). Distributed hierarchical processing in the primate cerebral 16
cortex. Cerebral cortex (New York, N.Y. : 1991) 1, 1–47. 17
Fernandez-Duque, D., Grossi, G., Thornton, I.M., and Neville, H.J. (2003). Representation of change: 18
separate electrophysiological markers of attention, awareness, and implicit processing. Journal of 19
cognitive neuroscience 15, 491–507. 20
Fisch, L., Privman, E., Ramot, M., Harel, M., Nir, Y., Kipervasser, S., Andelman, F., Neufeld, M.Y., 21
Kramer, U., Fried, I., et al. (2009). Neural “ignition”: enhanced activation linked to perceptual 22
awareness in human ventral stream visual cortex. Neuron 64, 562–574. 23
Fjell, A.M., and Walhovd, K.B. (2003). On the topography of P3a and P3b across the adult lifespan–a 24
factor-analytic study using orthogonal procrustes rotation. Brain topography 15, 153–164. 25
Gaillard, R., Dehaene, S., Adam, C., and Clémenceau, S. (2009). Converging intracranial markers of 26
conscious access. PLoS biology 7,. 27
24
Gallant, J.L., Braun, J., and Van Essen, D.C. (1993). Selectivity for polar, hyperbolic, and Cartesian 1
gratings in macaque visual cortex. Science (New York, N.Y.) 259, 100–103. 2
Grill-Spector, K., Kushnir, T., Hendler, T., and Malach, R. (2000). The dynamics of object-selective 3
activation correlate with recognition performance in humans. Nature neuroscience 3, 837–843. 4
Halgren, E., Marinkovic, K., and Chauvel, P. (1998). Generators of the late cognitive potentials in 5
auditory and visual oddball tasks. Electroencephalography and clinical neurophysiology 106, 156–6
164. 7
Hegdé, J., and Van Essen, D.C. (2000). Selectivity for complex shapes in primate visual area V2. The 8
Journal of neuroscience : the official journal of the Society for Neuroscience 20, RC61. 9
Hesselmann, G., and Malach, R. (2011). The Link between fMRI-BOLD Activation and Perceptual 10
Awareness Is “Stream-Invariant” in the Human Visual System. Cerebral cortex (New York, N.Y. : 1991) 11
21, 2829–2837. 12
Holcombe, A.O. (2009). Seeing slow and seeing fast: two limits on perception. Trends in cognitive 13
sciences 13, 216–221. 14
Hubel, D.H., and Wiesel, T.N. (1968). Receptive fields and functional architecture of monkey striate 15
cortex. The Journal of physiology 195, 215–243. 16
Jeffreys, D.A. (1996). Evoked Potential Studies of Face and Object Processing. Visual Cognition 3, 1–17
38. 18
Kanwisher, N., McDermott, J., and Chun, M.M. (1997). The fusiform face area: a module in human 19
extrastriate cortex specialized for face perception. The Journal of neuroscience : the official journal of 20
the Society for Neuroscience 17, 4302–4311. 21
Kaspar, K., Hassler, U., Martens, U., Trujillo-Barreto, N., and Gruber, T. (2010). Steady-state visually 22
evoked potential correlates of object recognition. Brain research 1343, 112–121. 23
Keysers, C., Xiao, D.K., Földiák, P., and Perrett, D.I. (2001). The speed of sight. J Cogn Neurosci 13, 90–24
101. 25
Kim, Y.J., Grabowecky, M., Paller, K. a, Muthu, K., and Suzuki, S. (2007). Attention induces 26
synchronization-based response gain in steady-state visual evoked potentials. Nature neuroscience 27
10, 117–125. 28
25
Kobatake, E., and Tanaka, K. (1994). Neuronal selectivities to complex object features in the ventral 1
visual pathway of the macaque cerebral cortex. Journal of neurophysiology 71, 856–867. 2
Koivisto, M., Lähteenmäki, M., SU00F8 rensen, T.A., Vangkilde, S., Overgaard, M., and Revonsuo, A. 3
(2008). The earliest electrophysiological correlate of visual awareness? Brain and cognition 66, 91–4
103. 5
Lamme, V. a, and Roelfsema, P.R. (2000). The distinct modes of vision offered by feedforward and 6
recurrent processing. Trends in neurosciences 23, 571–579. 7
Lamy, D., Salti, M., and Bar-Haim, Y. (2009). Neural correlates of subjective awareness and 8
unconscious processing: an ERP study. Journal of cognitive neuroscience 21, 1435–1446. 9
Lauritzen, T.Z., D’Esposito, M., Heeger, D.J., and Silver, M.A. (2009). Top-down flow of visual spatial 10
attention signals from parietal to occipital cortex. J Vis 9, 18.1–14. 11
Libedinsky, C., and Livingstone, M. (2011). Role of prefrontal cortex in conscious visual perception. 12
The Journal of neuroscience : the official journal of the Society for Neuroscience 31, 64–69. 13
Madl, T., Baars, B.J., and Franklin, S. (2011). The timing of the cognitive cycle. PloS one 6, e14803. 14
Mantini, D., Corbetta, M., Perrucci, M.G., Romani, G.L., and Del Gratta, C. (2009). Large-scale brain 15
networks account for sustained and transient activity during target detection. NeuroImage 44, 265–16
274. 17
McMains, S., and Kastner, S. (2011). Interactions of top-down and bottom-up mechanisms in human 18
visual cortex. The Journal of neuroscience : the official journal of the Society for Neuroscience 31, 19
587–597. 20
Morgan, S.T., Hansen, J.C., and Hillyard, S. a (1996). Selective attention to stimulus location 21
modulates the steady-state visual evoked potential. Proceedings of the National Academy of Sciences 22
of the United States of America 93, 4770–4774. 23
Müller, M.M., Picton, T.W., Valdes-Sosa, P., Riera, J., Teder-Sälejärvi, W. a, and Hillyard, S. a (1998). 24
Effects of spatial selective attention on the steady-state visual evoked potential in the 20-28 Hz 25
range. Cognitive brain research 6, 249–261. 26
26
Müller, N.G., and Kleinschmidt, A. (2003). Dynamic interaction of object- and space-based attention 1
in retinotopic visual areas. The Journal of neuroscience : the official journal of the Society for 2
Neuroscience 23, 9812–9816. 3
Niedeggen, M., Wichmann, P., and Stoerig, P. (2001). Change blindness and time to consciousness. 4
The European journal of neuroscience 14, 1719–1726. 5
Nieuwenstein, M., Burg, E.V.D., and Potter, M. (2009). Temporal constraints on conscious vision : On 6
the ubiquitous nature of the attentional blink. Journal of Vision 9, 1–14. 7
Van Opstal, F., de Lange, F.P., and Dehaene, S. (2011). Rapid parallel semantic processing of numbers 8
without awareness. Cognition 120, 136–147. 9
Pins, D., and Ffytche, D. (2003). The neural correlates of conscious vision. Cerebral cortex (New York, 10
N.Y. : 1991) 13, 461–474. 11
Portilla, J., and Simoncelli, E.P. (2000). A Parametric Texture Model Based on Joint Statistics of 12
Complex Wavelet Coefficients. International Journal of Computer Vision 40, 49–71. 13
Potter, M.C. (1976). Short-term conceptual memory for pictures. Journal of experimental psychology. 14
Human learning and memory 2, 509–522. 15
Potter, M.C., and Levy, E.I. (1969). Recognition memory for a rapid sequence of pictures. Journal of 16
experimental psychology 81, 10–15. 17
Quiroga, R.Q., Mukamel, R., Isham, E. a, Malach, R., and Fried, I. (2008). Human single-neuron 18
responses at the threshold of conscious recognition. Proceedings of the National Academy of 19
Sciences of the United States of America 105, 3599–3604. 20
Regan, D. (1977). Steady-state evoked potentials. Journal of the Optical Society of America 67, 1475–21
1489. 22
Riesenhuber, M., and Poggio, T. (1999). Hierarchical models of object recognition in cortex. Nature 23
neuroscience 2, 1019–1025. 24
Rugg, M.D., Doyle, M.C., and Wells, T. (1995). Word and Nonword Repetition Within- and Across-25
Modality: An Event-Related Potential Study. Journal of Cognitive Neuroscience 7, 209–227. 26
27
Sclar, G., Maunsell, J.H., and Lennie, P. (1990). Coding of image contrast in central visual pathways of 1
the macaque monkey. Vision research 30, 1–10. 2
Sergent, C., Baillet, S., and Dehaene, S. (2005). Timing of the brain events underlying access to 3
consciousness during the attentional blink. Nature neuroscience 8, 1391–1400. 4
Srinivasan, R., Bibi, F.A., and Nunez, P.L. (2006). Steady-state visual evoked potentials: distributed 5
local sources and wave-like dynamics are sensitive to flicker frequency. Brain topography 18, 167–6
187. 7
Srinivasan, R., and Petrovic, S. (2006). MEG phase follows conscious perception during binocular 8
rivalry induced by visual stream segregation. Cerebral cortex (New York, N.Y. : 1991) 16, 597–608. 9
Sutoyo, D., and Srinivasan, R. (2009). Nonlinear SSVEP responses are sensitive to the perceptual 10
binding of visual hemifields during conventional “eye” rivalry and interocular “percept” rivalry. Brain 11
research 1251, 245–255. 12
Tanaka, K. (1996). Inferotemporal cortex and object vision. Annual review of neuroscience 19, 109–13
139. 14
Thorpe, S., Fize, D., and Marlot, C. (1996). Speed of processing in the human visual system. nature 15
381, 520–522. 16
Tong, F., Nakayama, K., Vaughan, J.T., and Kanwisher, N. (1998). Binocular rivalry and visual 17
awareness in human extrastriate cortex. Neuron 21, 753–759. 18
Tononi, G. (2004). An information integration theory of consciousness. BMC neuroscience 5, 42. 19
Tononi, G., Srinivasan, R., Russell, D.P., and Edelman, G.M. (1998). Investigating neural correlates of 20
conscious perception by frequency-tagged neuromagnetic responses. Proceedings of the National 21
Academy of Sciences of the United States of America 95, 3198–3203. 22
VanRullen, R., and Thorpe, S.J. (2001). The time course of visual processing: from early perception to 23
decision-making. Journal of cognitive neuroscience 13, 454–461. 24
25
26
27
Isolating the neural correlates of conscious vision
144
E. Isolating the neural correlates of conscious vision
In the previous experiment we have seen that our low-level feature equalization frequency-
tagging method (SWIFT) allowed us to isolate the neural correlates of conscious object
recognition. This result was obtained by presenting a SWIFT movie in which the semantic
content could be either consciously perceived or not. However, in both cases the movie itself
was always visible and it thus underwent a certain degree of conscious processing (without
any conscious association to a semantic value whatsoever when the image was not
recognized or when the movie contained an abstract image). Thus, in the previous paradigm,
two conscious processes were involved: the conscious visibility of the stimulation and the
conscious recognition of the image. While the latter (conscious recognition) was
manipulated in the previous paradigm, the former (conscious visibility) was not. Considering
the aforementioned, a consequent question arises: by using a paradigm where the conscious
visibility is manipulated, which kind of modulations between activities elicited by visible and
non-visible stimuli can we obtain using SWIFT?
A suitable paradigm to test this is binocular rivalry. During binocular rivalry, conflicting
monocular images compete for access to consciousness alternating every few seconds
between one image and the other. Binocular rivalry is produced by the lateral inhibitory
interactions between monocular columns in V1. This process is then amplified through
successive steps in the visual hierarchy (Figure 26). Nonetheless, information about the
suppressed stimulus travels along the visual pathway and can reach higher brain areas
(Tong, Meng, & Blake, 2006). Thus neural activity related to the invisible stimulus is still
processed by the visual system even though we cannot notice it at all and can be detected in
several brain structures such as the amygdala (Pasley, Mayes, & Schultz, 2004), dorsal
regions such as the intra-parietal sulcus (IPS) (Fang & He, 2005), the FFA and STS (Jiang & He,
2006). Thus, this paradigm is a great manner to dissociate visual representations which are
consciously accessible and those which are not, while both kinds of representations are
processed in some amount by the visual system.
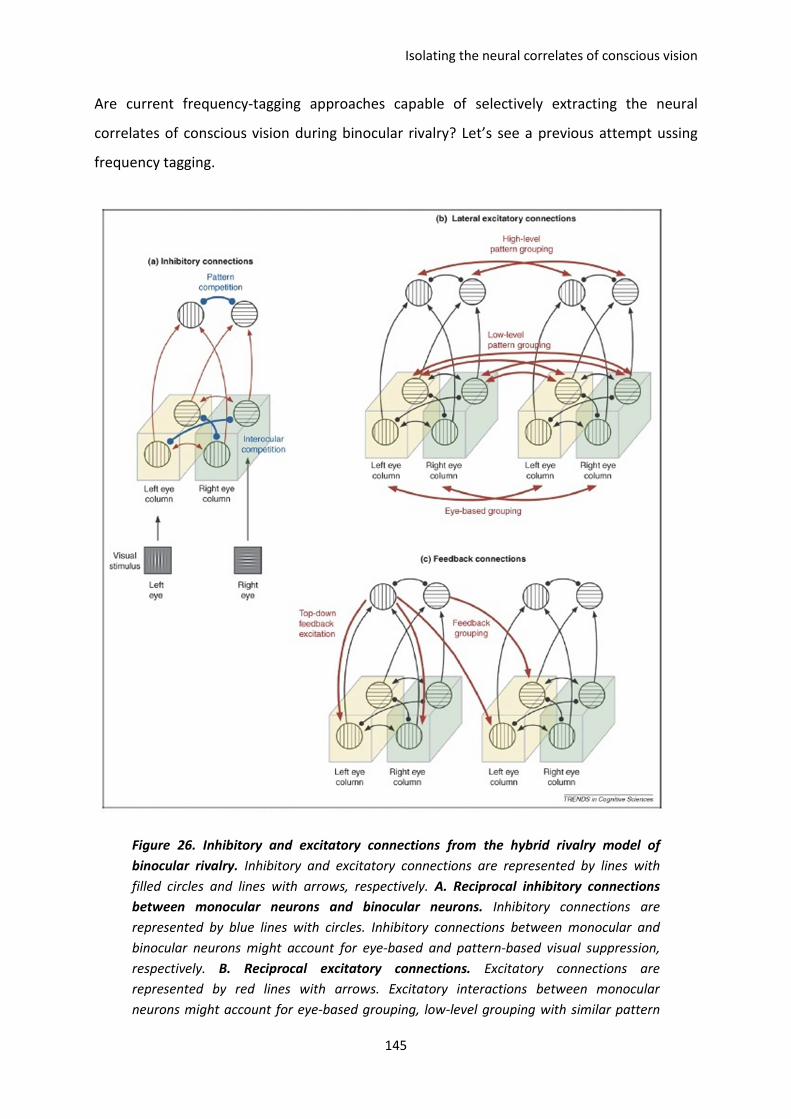
Isolating the neural correlates of conscious vision
145
Are current frequency-tagging approaches capable of selectively extracting the neural
correlates of conscious vision during binocular rivalry? Let’s see a previous attempt ussing
frequency tagging.
Figure 26. Inhibitory and excitatory connections from the hybrid rivalry model of
binocular rivalry. Inhibitory and excitatory connections are represented by lines with
filled circles and lines with arrows, respectively. A. Reciprocal inhibitory connections
between monocular neurons and binocular neurons. Inhibitory connections are
represented by blue lines with circles. Inhibitory connections between monocular and
binocular neurons might account for eye-based and pattern-based visual suppression,
respectively. B. Reciprocal excitatory connections. Excitatory connections are
represented by red lines with arrows. Excitatory interactions between monocular
neurons might account for eye-based grouping, low-level grouping with similar pattern
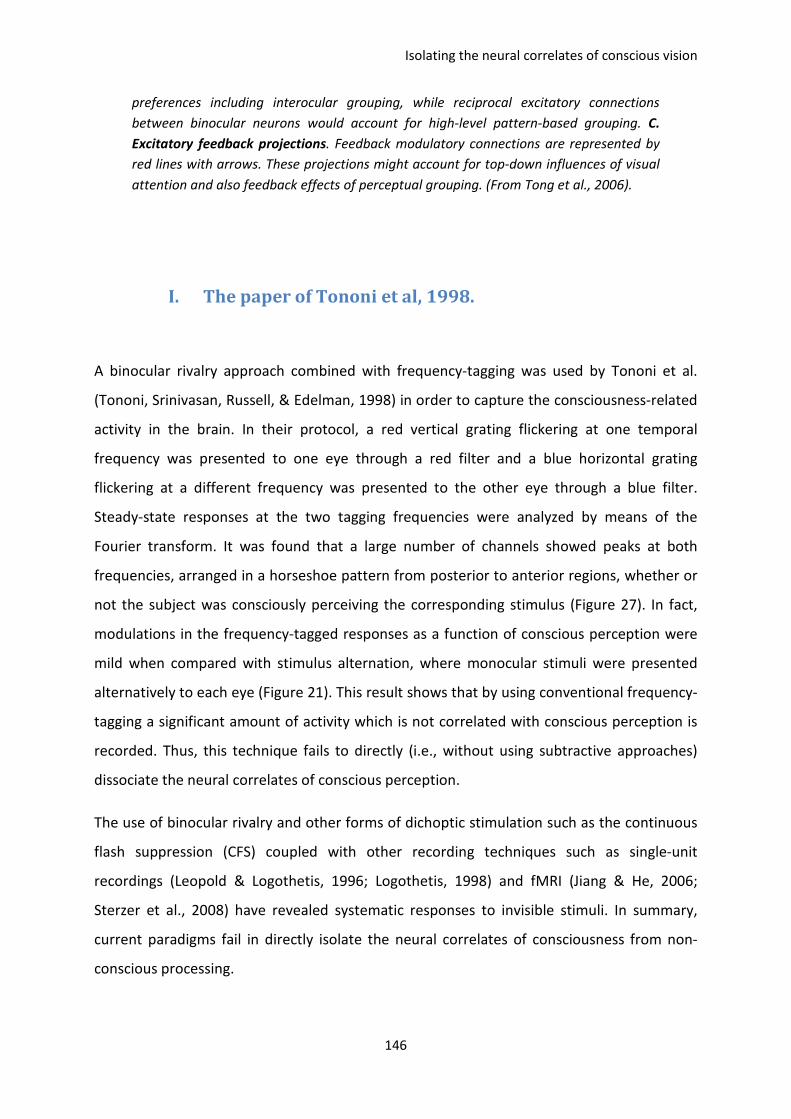
Isolating the neural correlates of conscious vision
146
preferences including interocular grouping, while reciprocal excitatory connections
between binocular neurons would account for high-level pattern-based grouping. C.
Excitatory feedback projections. Feedback modulatory connections are represented by
red lines with arrows. These projections might account for top-down influences of visual
attention and also feedback effects of perceptual grouping. (From Tong et al., 2006).
I. The paper of Tononi et al, 1998.
A binocular rivalry approach combined with frequency-tagging was used by Tononi et al.
(Tononi, Srinivasan, Russell, & Edelman, 1998) in order to capture the consciousness-related
activity in the brain. In their protocol, a red vertical grating flickering at one temporal
frequency was presented to one eye through a red filter and a blue horizontal grating
flickering at a different frequency was presented to the other eye through a blue filter.
Steady-state responses at the two tagging frequencies were analyzed by means of the
Fourier transform. It was found that a large number of channels showed peaks at both
frequencies, arranged in a horseshoe pattern from posterior to anterior regions, whether or
not the subject was consciously perceiving the corresponding stimulus (Figure 27). In fact,
modulations in the frequency-tagged responses as a function of conscious perception were
mild when compared with stimulus alternation, where monocular stimuli were presented
alternatively to each eye (Figure 21). This result shows that by using conventional frequency-
tagging a significant amount of activity which is not correlated with conscious perception is
recorded. Thus, this technique fails to directly (i.e., without using subtractive approaches)
dissociate the neural correlates of conscious perception.
The use of binocular rivalry and other forms of dichoptic stimulation such as the continuous
flash suppression (CFS) coupled with other recording techniques such as single-unit
recordings (Leopold & Logothetis, 1996; Logothetis, 1998) and fMRI (Jiang & He, 2006;
Sterzer et al., 2008) have revealed systematic responses to invisible stimuli. In summary,
current paradigms fail in directly isolate the neural correlates of consciousness from non-
conscious processing.
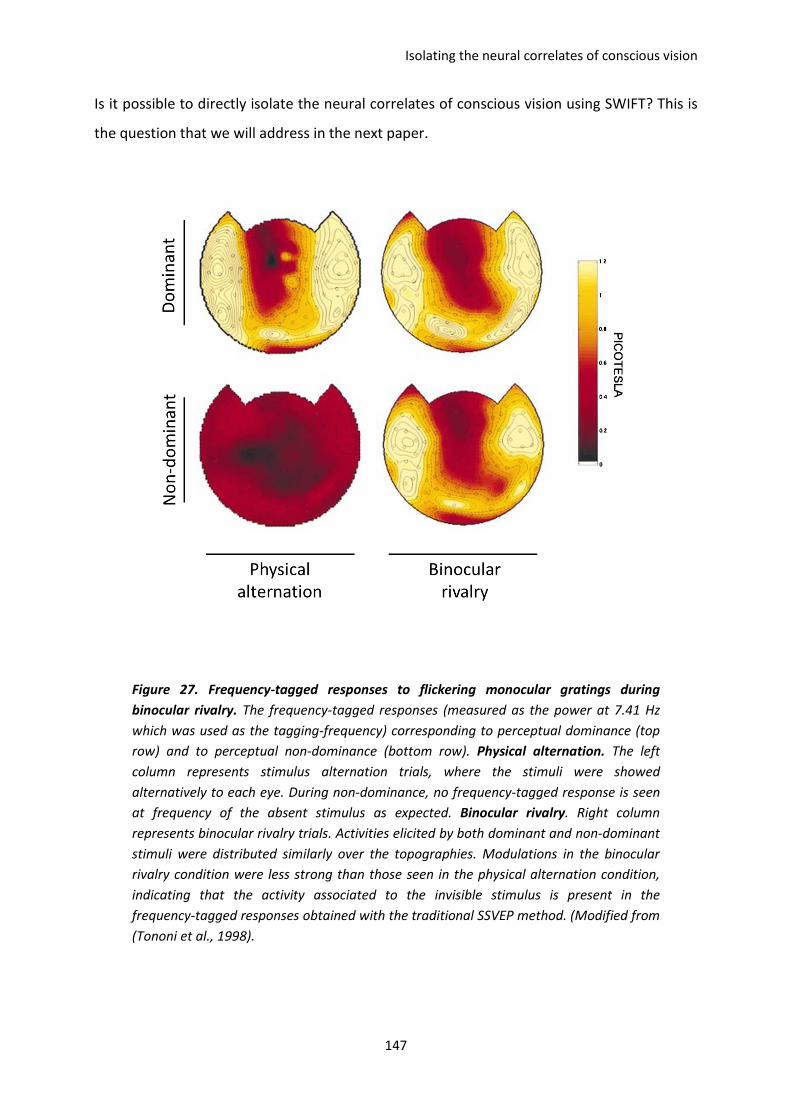
Isolating the neural correlates of conscious vision
147
Is it possible to directly isolate the neural correlates of conscious vision using SWIFT? This is
the question that we will address in the next paper.
Figure 27. Frequency-tagged responses to flickering monocular gratings during
binocular rivalry. The frequency-tagged responses (measured as the power at 7.41 Hz
which was used as the tagging-frequency) corresponding to perceptual dominance (top
row) and to perceptual non-dominance (bottom row). Physical alternation. The left
column represents stimulus alternation trials, where the stimuli were showed
alternatively to each eye. During non-dominance, no frequency-tagged response is seen
at frequency of the absent stimulus as expected. Binocular rivalry. Right column
represents binocular rivalry trials. Activities elicited by both dominant and non-dominant
stimuli were distributed similarly over the topographies. Modulations in the binocular
rivalry condition were less strong than those seen in the physical alternation condition,
indicating that the activity associated to the invisible stimulus is present in the
frequency-tagged responses obtained with the traditional SSVEP method. (Modified from
(Tononi et al., 1998).

Isolating the neural correlates of conscious vision
148
II. PAPER 4 (in preparation). Koenig-Robert & VanRullen.
1
Temporal consistency of neural activity as the direct correlate of visual
consciousness
Roger Koenig-Robert1,2 & Rufin VanRullen1,2
1 Centre de recherche cerveau et cognition (CerCo), UMR5549, CNRS.
2 Université Paul Sabatier, CHU Purpan, Toulouse, France.
Defining the neural correlates of awareness has been difficult due to the lack of selective
means to measure consciousness-dependent activity. A widely used paradigm to explore
visual awareness is binocular rivalry: conflicting monocular images alternate every few
seconds, with the dominant stimulus transiently gaining access to consciousness, while the
non-dominant becomes invisible. From single-unit recordings in primates to whole brain
EEG or fMRI recordings in humans, current techniques have only found moderate
modulations of neural activity when stimuli are dominant versus when they are not; all
techniques systematically reveal a significant response to invisible stimuli at different
levels of the visual hierarchy. SWIFT (semantic wavelet-induced frequency-tagging) is a
recently developed EEG technique which selectively tracks high-level representations with
high temporal resolution (Koenig-Robert and VanRullen, submitted). SWIFT uses cyclic
wavelet-scrambling to modulate the semantic content of an image at a temporal
frequency called the tagging frequency, while conserving low-level features. We used
SWIFT to measure perceptual alternations during binocular rivalry. Two face pictures were
modulated under SWIFT at different tagging frequencies (1.4894 and 2 Hz) and presented
monocularly. Two kinds of alternations were used: binocular rivalry, where the two stimuli
were presented simultaneously (and only one was perceived at a time), and physical
alternation, where the stimuli were presented alternately in each eye. Fronto-central and
occipito-temporal EEG activities were elicited by dominant stimuli, and were comparable
in their topography and amplitude in physical alternation and binocular rivalry conditions.
2
Crucially, invisible stimuli in binocular rivalry elicited no more activity than the response to
a blank screen in physical alternation. Considering that visual awareness could cause both
increase in the amplitude response and activity synchronization, we found that the feature
characterizing consciousness-specific activities is the temporal consistency of brain
potentials across onsets of the semantic information in different brain areas, which is
consistent with current models of consciousness which highlight massive long-distance
interactions.
One of the fundamental aims of neuroscience is to explain conscious experience in terms of
brain activity. In the visual modality, several processing steps are completed before light
stimulation can be consciously perceived. Since visual stimuli that are not consciously
perceived (e.g., suppressed, masked or subliminal images) can activate similar brain areas as
consciously perceived stimuli (Moutoussis and Zeki 2002; Tong, Meng, and Blake 2006), it is
crucial to characterize the signatures of neural activity which differentiate conscious from
unconscious processing. A classic paradigm to study neural activities correlated to conscious
representations is to present a single visual stimuli that allows more than one percept. Thus,
by recording neural activity as a function of subjective report, it is possible to study neural
changes correlated with subjective perception, while the physical stimulation remains
constant. Binocular rivalry is an example of such a stimulus. In binocular rivalry, different
images are presented to each eye, and, instead of being fused into a single percept, are
alternatively perceived, with the dominant image transiently gaining access to consciousness
for a few seconds, while the non-dominant becomes invisible. Differential neural activations
have been recorded as a function of subjective report (Lansing 1964; Logothetis and Schall
1989; Tononi et al. 1998; Polonsky et al. 2000) and it has been possible to accurately predict
perceptual alternations from brain activity (Haynes and Rees 2005). However, current
techniques fall short in directly isolating the activities supporting conscious perception. By
definition, neural activities supporting conscious perception must exactly mirror subjective
states. In the case of binocular rivalry, this implies in practice that neural representations
supporting the conscious perception of a given stimulus should systematically emerge when
the stimulus is visible and completely vanish when the stimulus becomes invisible. However,
neural activity recorded so far systematically includes neural activity belonging to non-
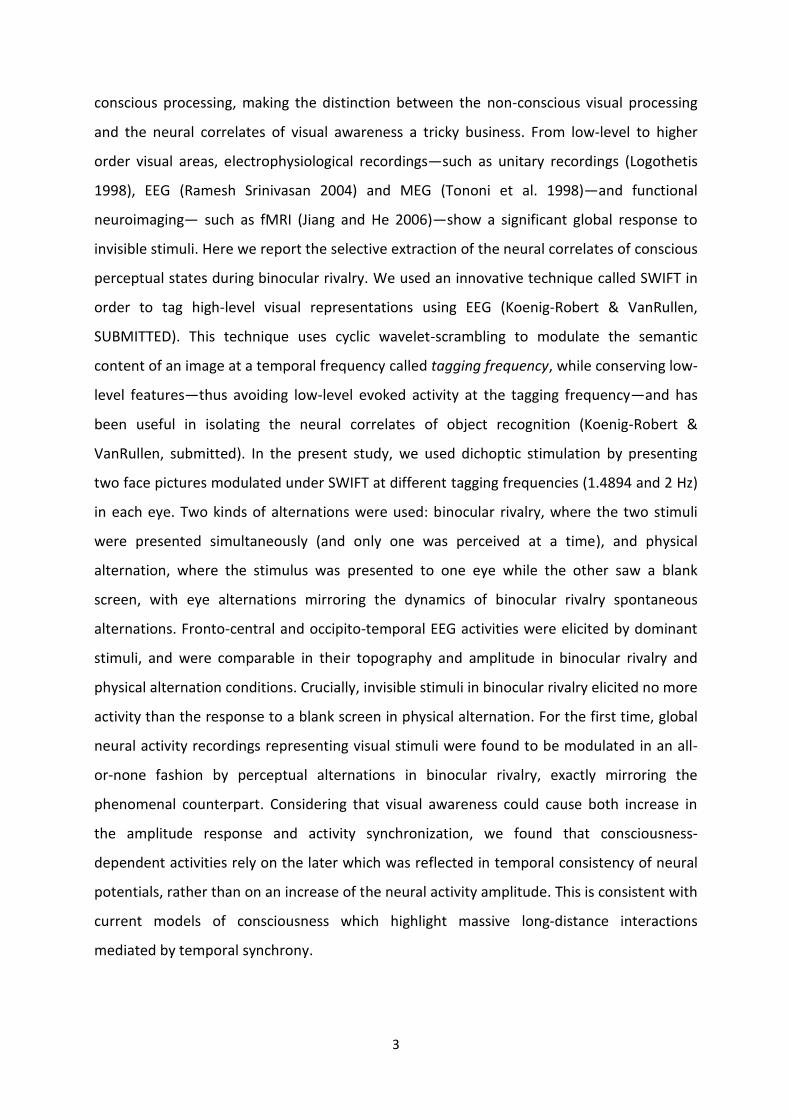
3
conscious processing, making the distinction between the non-conscious visual processing
and the neural correlates of visual awareness a tricky business. From low-level to higher
order visual areas, electrophysiological recordings—such as unitary recordings (Logothetis
1998), EEG (Ramesh Srinivasan 2004) and MEG (Tononi et al. 1998)—and functional
neuroimaging— such as fMRI (Jiang and He 2006)—show a significant global response to
invisible stimuli. Here we report the selective extraction of the neural correlates of conscious
perceptual states during binocular rivalry. We used an innovative technique called SWIFT in
order to tag high-level visual representations using EEG (Koenig-Robert & VanRullen,
SUBMITTED). This technique uses cyclic wavelet-scrambling to modulate the semantic
content of an image at a temporal frequency called tagging frequency, while conserving low-
level features—thus avoiding low-level evoked activity at the tagging frequency—and has
been useful in isolating the neural correlates of object recognition (Koenig-Robert &
VanRullen, submitted). In the present study, we used dichoptic stimulation by presenting
two face pictures modulated under SWIFT at different tagging frequencies (1.4894 and 2 Hz)
in each eye. Two kinds of alternations were used: binocular rivalry, where the two stimuli
were presented simultaneously (and only one was perceived at a time), and physical
alternation, where the stimulus was presented to one eye while the other saw a blank
screen, with eye alternations mirroring the dynamics of binocular rivalry spontaneous
alternations. Fronto-central and occipito-temporal EEG activities were elicited by dominant
stimuli, and were comparable in their topography and amplitude in binocular rivalry and
physical alternation conditions. Crucially, invisible stimuli in binocular rivalry elicited no more
activity than the response to a blank screen in physical alternation. For the first time, global
neural activity recordings representing visual stimuli were found to be modulated in an all-
or-none fashion by perceptual alternations in binocular rivalry, exactly mirroring the
phenomenal counterpart. Considering that visual awareness could cause both increase in
the amplitude response and activity synchronization, we found that consciousness-
dependent activities rely on the later which was reflected in temporal consistency of neural
potentials, rather than on an increase of the neural activity amplitude. This is consistent with
current models of consciousness which highlight massive long-distance interactions
mediated by temporal synchrony.
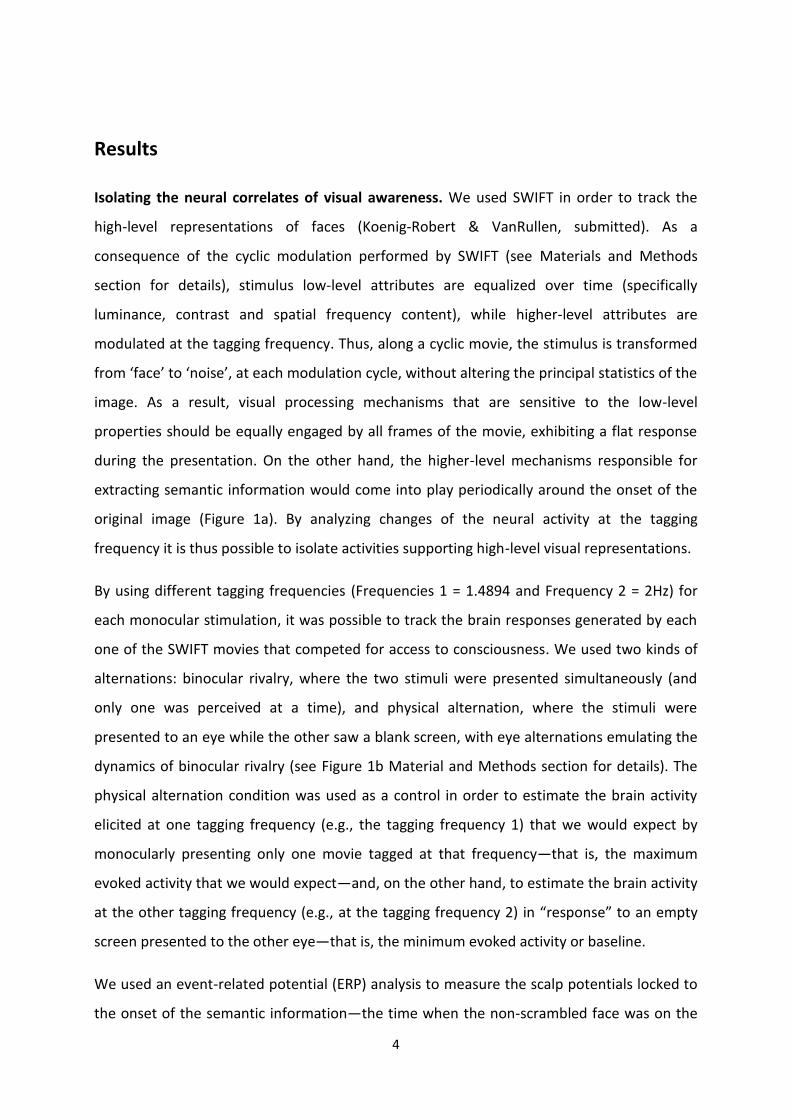
4
Results
Isolating the neural correlates of visual awareness. We used SWIFT in order to track the
high-level representations of faces (Koenig-Robert & VanRullen, submitted). As a
consequence of the cyclic modulation performed by SWIFT (see Materials and Methods
section for details), stimulus low-level attributes are equalized over time (specifically
luminance, contrast and spatial frequency content), while higher-level attributes are
modulated at the tagging frequency. Thus, along a cyclic movie, the stimulus is transformed
from ‘face’ to ‘noise’, at each modulation cycle, without altering the principal statistics of the
image. As a result, visual processing mechanisms that are sensitive to the low-level
properties should be equally engaged by all frames of the movie, exhibiting a flat response
during the presentation. On the other hand, the higher-level mechanisms responsible for
extracting semantic information would come into play periodically around the onset of the
original image (Figure 1a). By analyzing changes of the neural activity at the tagging
frequency it is thus possible to isolate activities supporting high-level visual representations.
By using different tagging frequencies (Frequencies 1 = 1.4894 and Frequency 2 = 2Hz) for
each monocular stimulation, it was possible to track the brain responses generated by each
one of the SWIFT movies that competed for access to consciousness. We used two kinds of
alternations: binocular rivalry, where the two stimuli were presented simultaneously (and
only one was perceived at a time), and physical alternation, where the stimuli were
presented to an eye while the other saw a blank screen, with eye alternations emulating the
dynamics of binocular rivalry (see Figure 1b Material and Methods section for details). The
physical alternation condition was used as a control in order to estimate the brain activity
elicited at one tagging frequency (e.g., the tagging frequency 1) that we would expect by
monocularly presenting only one movie tagged at that frequency—that is, the maximum
evoked activity that we would expect—and, on the other hand, to estimate the brain activity
at the other tagging frequency (e.g., at the tagging frequency 2) in “response” to an empty
screen presented to the other eye—that is, the minimum evoked activity or baseline.
We used an event-related potential (ERP) analysis to measure the scalp potentials locked to
the onset of the semantic information—the time when the non-scrambled face was on the
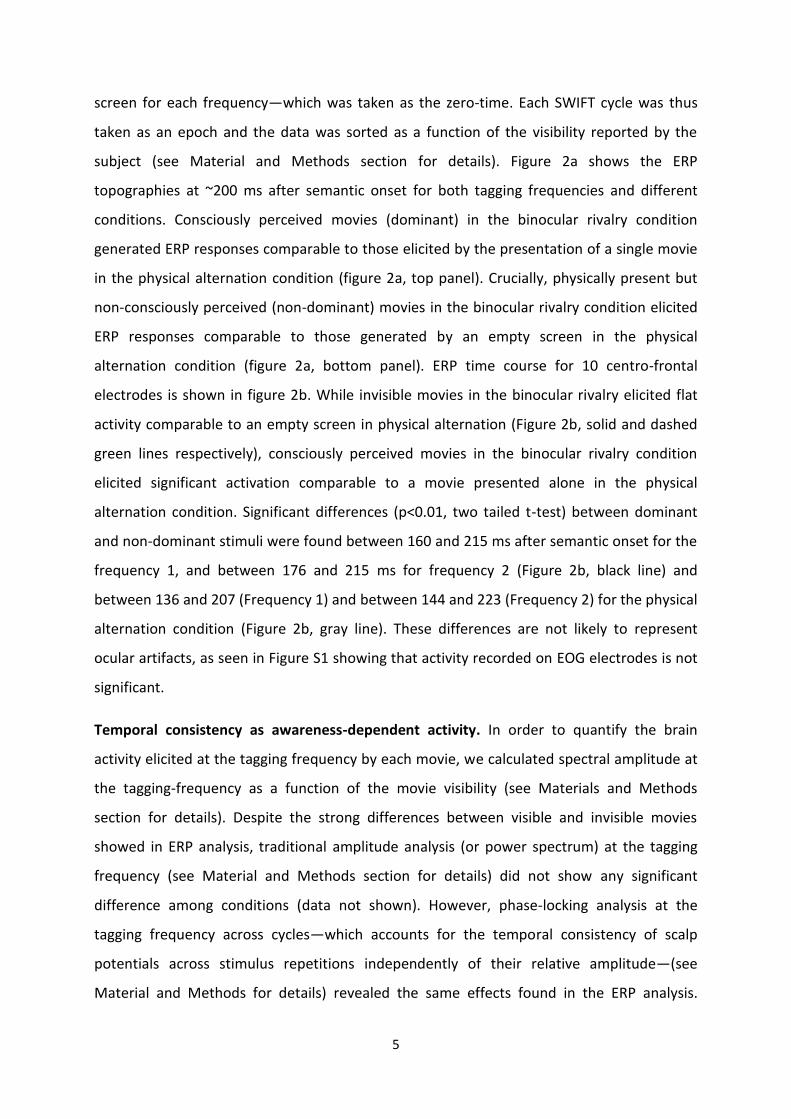
5
screen for each frequency—which was taken as the zero-time. Each SWIFT cycle was thus
taken as an epoch and the data was sorted as a function of the visibility reported by the
subject (see Material and Methods section for details). Figure 2a shows the ERP
topographies at ~200 ms after semantic onset for both tagging frequencies and different
conditions. Consciously perceived movies (dominant) in the binocular rivalry condition
generated ERP responses comparable to those elicited by the presentation of a single movie
in the physical alternation condition (figure 2a, top panel). Crucially, physically present but
non-consciously perceived (non-dominant) movies in the binocular rivalry condition elicited
ERP responses comparable to those generated by an empty screen in the physical
alternation condition (figure 2a, bottom panel). ERP time course for 10 centro-frontal
electrodes is shown in figure 2b. While invisible movies in the binocular rivalry elicited flat
activity comparable to an empty screen in physical alternation (Figure 2b, solid and dashed
green lines respectively), consciously perceived movies in the binocular rivalry condition
elicited significant activation comparable to a movie presented alone in the physical
alternation condition. Significant differences (p<0.01, two tailed t-test) between dominant
and non-dominant stimuli were found between 160 and 215 ms after semantic onset for the
frequency 1, and between 176 and 215 ms for frequency 2 (Figure 2b, black line) and
between 136 and 207 (Frequency 1) and between 144 and 223 (Frequency 2) for the physical
alternation condition (Figure 2b, gray line). These differences are not likely to represent
ocular artifacts, as seen in Figure S1 showing that activity recorded on EOG electrodes is not
significant.
Temporal consistency as awareness-dependent activity. In order to quantify the brain
activity elicited at the tagging frequency by each movie, we calculated spectral amplitude at
the tagging-frequency as a function of the movie visibility (see Materials and Methods
section for details). Despite the strong differences between visible and invisible movies
showed in ERP analysis, traditional amplitude analysis (or power spectrum) at the tagging
frequency (see Material and Methods section for details) did not show any significant
difference among conditions (data not shown). However, phase-locking analysis at the
tagging frequency across cycles—which accounts for the temporal consistency of scalp
potentials across stimulus repetitions independently of their relative amplitude—(see
Material and Methods for details) revealed the same effects found in the ERP analysis.
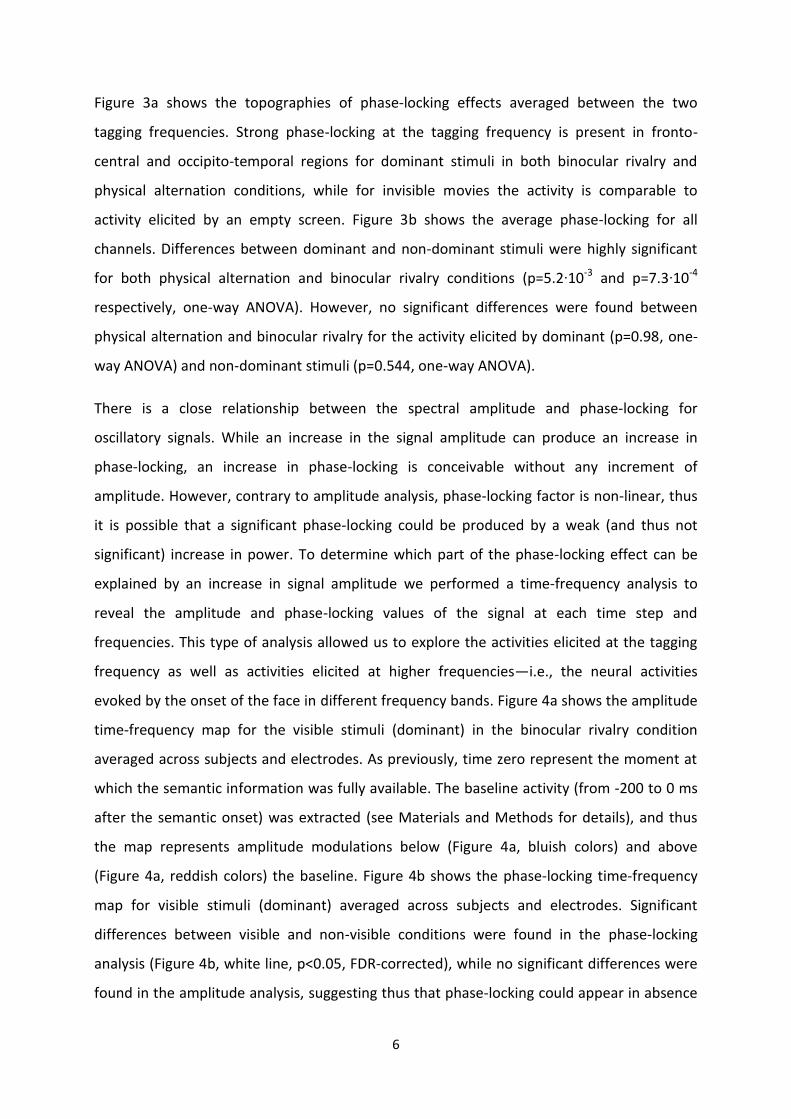
6
Figure 3a shows the topographies of phase-locking effects averaged between the two
tagging frequencies. Strong phase-locking at the tagging frequency is present in fronto-
central and occipito-temporal regions for dominant stimuli in both binocular rivalry and
physical alternation conditions, while for invisible movies the activity is comparable to
activity elicited by an empty screen. Figure 3b shows the average phase-locking for all
channels. Differences between dominant and non-dominant stimuli were highly significant
for both physical alternation and binocular rivalry conditions (p=5.2∙10-3 and p=7.3∙10-4
respectively, one-way ANOVA). However, no significant differences were found between
physical alternation and binocular rivalry for the activity elicited by dominant (p=0.98, one-
way ANOVA) and non-dominant stimuli (p=0.544, one-way ANOVA).
There is a close relationship between the spectral amplitude and phase-locking for
oscillatory signals. While an increase in the signal amplitude can produce an increase in
phase-locking, an increase in phase-locking is conceivable without any increment of
amplitude. However, contrary to amplitude analysis, phase-locking factor is non-linear, thus
it is possible that a significant phase-locking could be produced by a weak (and thus not
significant) increase in power. To determine which part of the phase-locking effect can be
explained by an increase in signal amplitude we performed a time-frequency analysis to
reveal the amplitude and phase-locking values of the signal at each time step and
frequencies. This type of analysis allowed us to explore the activities elicited at the tagging
frequency as well as activities elicited at higher frequencies—i.e., the neural activities
evoked by the onset of the face in different frequency bands. Figure 4a shows the amplitude
time-frequency map for the visible stimuli (dominant) in the binocular rivalry condition
averaged across subjects and electrodes. As previously, time zero represent the moment at
which the semantic information was fully available. The baseline activity (from -200 to 0 ms
after the semantic onset) was extracted (see Materials and Methods for details), and thus
the map represents amplitude modulations below (Figure 4a, bluish colors) and above
(Figure 4a, reddish colors) the baseline. Figure 4b shows the phase-locking time-frequency
map for visible stimuli (dominant) averaged across subjects and electrodes. Significant
differences between visible and non-visible conditions were found in the phase-locking
analysis (Figure 4b, white line, p<0.05, FDR-corrected), while no significant differences were
found in the amplitude analysis, suggesting thus that phase-locking could appear in absence
7
of power increment. To test that, we discarded the phase-locking values at the time-
frequencies coordinates where amplitude modulations were equal or above zero (i.e., where
the amplitude was equal or stronger than baseline), in every subject and electrode map. The
remaining phase-locking values represent the phase-locking values at the time-frequency
locations where the amplitude modulations were negative (i.e., where the amplitude was
weaker than baseline). The mean of these values across subjects and electrodes is
represented in Figure 4c, showing that significant phase-locking is still visible (Figure 4c,
white line, p<0.05, FDR-corrected), thus demonstrating that the phase-locking (i.e., temporal
consistency) effect is independent from an increase in amplitude.
Discussion
We have isolated the neural correlates of conscious visibility, which are modulated in an all-
or-none fashion by perceptual alternation in binocular rivalry. Previous attempts to measure
neural activity changes during binocular rivalry using frequency tagging have shown only
mild modulations between consciously perceived and invisible stimuli (Tononi et al. 1998;
Srinivasan et al. 1999; Ramesh Srinivasan 2004; Srinivasan and Petrovic 2006; Sutoyo and
Srinivasan 2009). Single-unit recordings studies have also been used to measure neural
activity changes during binocular rivalry, this time without tagging each stimulus by
frequency but rather by studying neurons that respond selectively to the stimulus, showing
that neural activity increases its selectivity to consciously perceived stimuli as one ascends
on the visual hierarchy. While ~20% of cells are selective to consciously perceived activity in
areas V1 and V2 of monkeys, this proportion increases to near 40% in V4 and MT, and up to
~90% in visual temporal areas (Logothetis 1998). It is thus tempting to conclude that the
neural correlates of consciousness can be isolated just by picking the activities of higher
visual areas, as some functional neuroimaging studies in humans suggest, in which conscious
perception modulates neural activity profusely in areas such as FFA (Tong et al. 1998).
However, significant activations to invisible stimuli can also be found in these high-level
areas (Jiang and He 2006) and, moreover, it is possible to classify well above chance the
category-specific information elicited by invisible stimuli in the same areas (Sterzer, Haynes,
8
and Rees 2008). Thus, our work represents the first result in which neural correlates of
awareness are isolated from global brain activity.
Once the neural correlates of conscious vision were isolated, we concentrated our analysis
on the nature of these neural activities. Since our paradigm includes a constant influx of
visual information, we could either expect an increase of the amplitude response at the
onset of the semantic information or a constant amplitude response with a rearranging of
the temporal response around the onset of the semantic information. We found that
awareness-dependent activities correspond to an increase in temporal consistency across
different presentations of the semantic information (i.e., the face), and this effect is
independent of the increase in the amplitude response. An increase in the temporal
consistency can reflect a key feature of the nervous system such as phase resetting (Shah et
al. 2004) that allows the interaction among different brain areas which would support the
emergence of consciousness, as proposed by several authors (Rodriguez et al. 1999; Varela
et al. 2001; Dehaene, Sergent, and Changeux 2003; Melloni et al. 2007).
Methods
Stimuli generation. We used an innovative technique called SWIFT: semantic wavelet-
induced frequency-tagging, which uses manipulations in the wavelet domain to create a
movie from a single natural image (Koenig-Robert & VanRullen, submitted). Each frame of
the movie equalizes low-level properties of the natural image while modulating its high- and
mid-level information content cyclically at a fixed temporal frequency, called tagging
frequency. As a result, visual processing mechanisms that are sensitive to the low-level
properties should be equally engaged by all frames of the movie, exhibiting a flat response
during the presentation. On the other hand, the higher-level mechanisms responsible for
extracting semantic information would come into play periodically around the onset of the
original image. By analyzing changes of the neural activity at the tagging frequency it is thus
possible to isolate activities supporting high-level visual representations. Details of the
stimulus construction are published elsewhere (Koenig-Robert & VanRullen, submitted).
Briefly, SWIFT movies were created by cyclic wavelet scrambling in the wavelets multi-scale
domain. At each location and scale, local image contours were represented by a 3D vector in
the wavelets space, with the 3 dimensions representing the strengths of horizontal, vertical
9
and diagonal orientations. For each location and scale, two new vectors with random
orientations but the same length were defined. The unique isoenergetic circular path
described by the 3 vectors was used to modulate local contour orientation cyclically, thus
obtaining different wavelet-scrambled versions of the image, while conserving low-level
properties (local luminance, contrast and spatial frequency) across frames.
Subjects. All subjects gave informed consent to take part in these studies that were
approved by the local ethics committee. All nine subjects (4 women, aged 22 to 30) have
normal or corrected-to-normal vision. One of them was one of the authors, 6 had intensive
experience as observers in psychophysics experiments and 2 were naïve observers.
Experimental setup and procedure. Subjects were placed at 57 cm of a CRT screen with a
refresh rate of 100 Hz in a dark room. Six faces (3 women, 3 men), were modulated under
SWIFT at 2 different non-harmonic frequencies (1.4894 and 2 Hz). The movies were 10x10°
and were separated by 4.3 cm over the computer screen and superimposed on the same
region of the visual field of each eye thanks to a stereoscope. Each eye was stimulated by a
single face using the ‘version 2’ stereoscope described by Randolph Blake:
http://www.psy.vanderbilt.edu/faculty/blake/Stereoscope/stereoscope.html. Mirrors
located close to the eyes allowed each eye to view only half of the computer screen. Mirrors
were adjusted for each participant to ensure that both faces overlap exactly in the same
portion of the visual field. Each face was colored (red or green) and the subject reported the
color of the perceived face by pressing and maintaining a key (left arrow for green and right
arrow for red) on a computer keyboard during the whole period of dominance. Subjects
were instructed to press no button if dominance was incomplete (i.e., piecemeal). Two types
of stimuli alternation were used: binocular rivalry and physical alternation. In binocular
rivalry, both stimuli were presented simultaneously. In physical alternation, stimuli were
presented alternatively, using smooth transitions that lasted from 0.5 to 1 sec. Dominance
durations on physical alternations were defined semi-randomly, following the gamma
distribution of binocular rivalry dominance durations of one of the subjects. The 15 possible
pairs of different faces were counter-balanced for frequency, color, eye and type of
alternation, yielding 240 trials. Each trial lasted 25 seconds and the experiment was divided
in 4 blocks lasting about 3 hours. All subjects showed long periods of dominance at both
modulation frequencies: mean dominance duration 2.95 (±0.11) sec for 1.4894 Hz and 2.86
10
(±0.14) sec for 2 Hz. Such stable dominance states are likely to be induced by the dynamic
nature of stimuli. For both binocular rivalry and physical alternation conditions mean
dominance durations were comparable: 2.94 (±0.23) sec and 3.19 (±0.06) respectively.
EEG acquisition and data processing. Continuous EEG was acquired with a 64-channel
ActiveTwo system (Biosemi). Two additional electrodes [CMS (common mode sense) and
DRL (driven right leg)] were used as reference and ground. Electrodes were placed according
to the international 10/10 system. The vertical and horizontal electrooculogram were
recorded by attaching additional electrodes below the left eye and at the outer canthi of
both eyes. An active electrode (CMS) and a passive electrode (DRL) were used to compose a
feedback loop for amplifier reference. Details of this circuitry can be found on the Biosemi
website (www.biosemi.com/faq/cms&drl.htm). All signals were digitized at 1024 Hz, 24-bit
A/D conversion. All data were analyzed off-line under Matlab (MathWorks) using the
EEGLAB toolbox (Delorme and Makeig 2004). Average reference was computed, the data
was downsampled at 512 Hz and no filter was applied. DC offset was removed from
continuous EEG data. The linear trend was removed from each trial, using Andreas Widman’s
function for EEGLAB. Independent component analysis (ICA plugin from EEGLAB) was
performed to remove eye blinks and muscular artifacts. Artifactual components were
removed manually (from 1 to 5 out of 64 components per subject, mean 2.33) according to
their activity time course and topography (frontal for eye blinks and temporal for muscular
artifacts).
Event related potentials (ERP) analysis. Data was downsampled to 128 Hz and filtered
between 0.5 and 30 Hz. Each SWIFT cycle period (from -100 to 671 ms for 1.4894 Hz and
from -100 to 500 ms for 2 Hz) was taken as an epoch, in which zero-time represents the
onset of the frame that contains all the semantic information. ERP epochs were sorted as a
function of the reported visibility, while a stimulus was reported as dominant the other was
labeled as non-dominant. Only complete epochs were considered and epochs occurring at
the moment of alternation were discarded. A bootstrap procedure (resampling without
replacement, n = 1000) was used to equalize the number of trials entered in the
computation of the ERP for conditions (binocular rivalry vs. physical alternation), frequencies
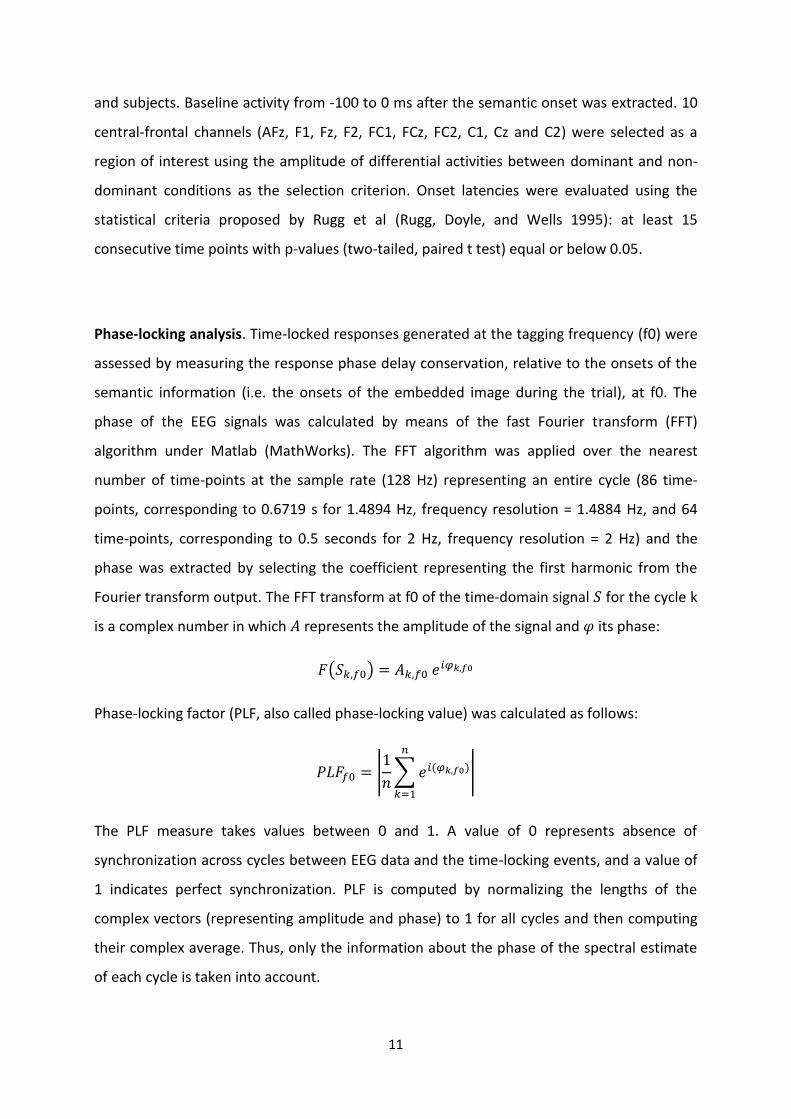
11
and subjects. Baseline activity from -100 to 0 ms after the semantic onset was extracted. 10
central-frontal channels (AFz, F1, Fz, F2, FC1, FCz, FC2, C1, Cz and C2) were selected as a
region of interest using the amplitude of differential activities between dominant and non-
dominant conditions as the selection criterion. Onset latencies were evaluated using the
statistical criteria proposed by Rugg et al (Rugg, Doyle, and Wells 1995): at least 15
consecutive time points with p-values (two-tailed, paired t test) equal or below 0.05.
Phase-locking analysis. Time-locked responses generated at the tagging frequency (f0) were
assessed by measuring the response phase delay conservation, relative to the onsets of the
semantic information (i.e. the onsets of the embedded image during the trial), at f0. The
phase of the EEG signals was calculated by means of the fast Fourier transform (FFT)
algorithm under Matlab (MathWorks). The FFT algorithm was applied over the nearest
number of time-points at the sample rate (128 Hz) representing an entire cycle (86 time-
points, corresponding to 0.6719 s for 1.4894 Hz, frequency resolution = 1.4884 Hz, and 64
time-points, corresponding to 0.5 seconds for 2 Hz, frequency resolution = 2 Hz) and the
phase was extracted by selecting the coefficient representing the first harmonic from the
Fourier transform output. The FFT transform at f0 of the time-domain signal for the cycle k
is a complex number in which represents the amplitude of the signal and its phase:
( )
Phase-locking factor (PLF, also called phase-locking value) was calculated as follows:
|
∑
|
The PLF measure takes values between 0 and 1. A value of 0 represents absence of
synchronization across cycles between EEG data and the time-locking events, and a value of
1 indicates perfect synchronization. PLF is computed by normalizing the lengths of the
complex vectors (representing amplitude and phase) to 1 for all cycles and then computing
their complex average. Thus, only the information about the phase of the spectral estimate
of each cycle is taken into account.
12
Time-frequency analysis. EEG data (512 Hz, not filtered) was epoched between -600 and
1100 ms around the semantic onset. A bootstrap procedure (resampling without
replacement, n = 500) was used to equalize the number of trials entered in the computation
for conditions (binocular rivalry vs. physical alternation), frequencies and subjects. A
wavelet-based time-frequency decomposition was performed using the EEG lab function
‘timefreq’. Each time-frequency map included 348 time-points (from -412 to 913 ms) and 52
frequencies spaced in regular steps (from 3.5 to 50 Hz). Three cycles were used at the lowest
frequency and at each frequency step this value was increased by 0.5. The amplitude was
computed as the absolute value of the complex time-frequency map. Baseline activity from -
100 to 0 ms after semantic onset was subtracted from the amplitude map which thus
reflects amplitude modulations above and below the baseline. Phase-locking across cycles
was obtained as described above.
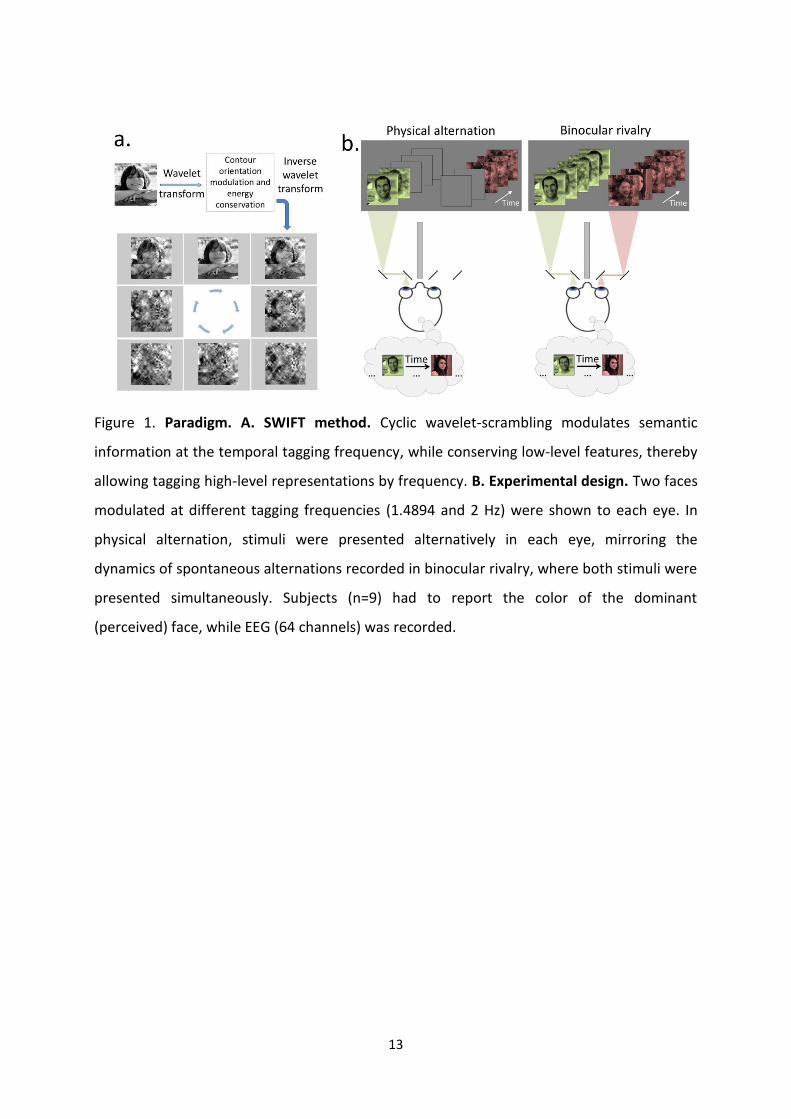
13
Figure 1. Paradigm. A. SWIFT method. Cyclic wavelet-scrambling modulates semantic
information at the temporal tagging frequency, while conserving low-level features, thereby
allowing tagging high-level representations by frequency. B. Experimental design. Two faces
modulated at different tagging frequencies (1.4894 and 2 Hz) were shown to each eye. In
physical alternation, stimuli were presented alternatively in each eye, mirroring the
dynamics of spontaneous alternations recorded in binocular rivalry, where both stimuli were
presented simultaneously. Subjects (n=9) had to report the color of the dominant
(perceived) face, while EEG (64 channels) was recorded.
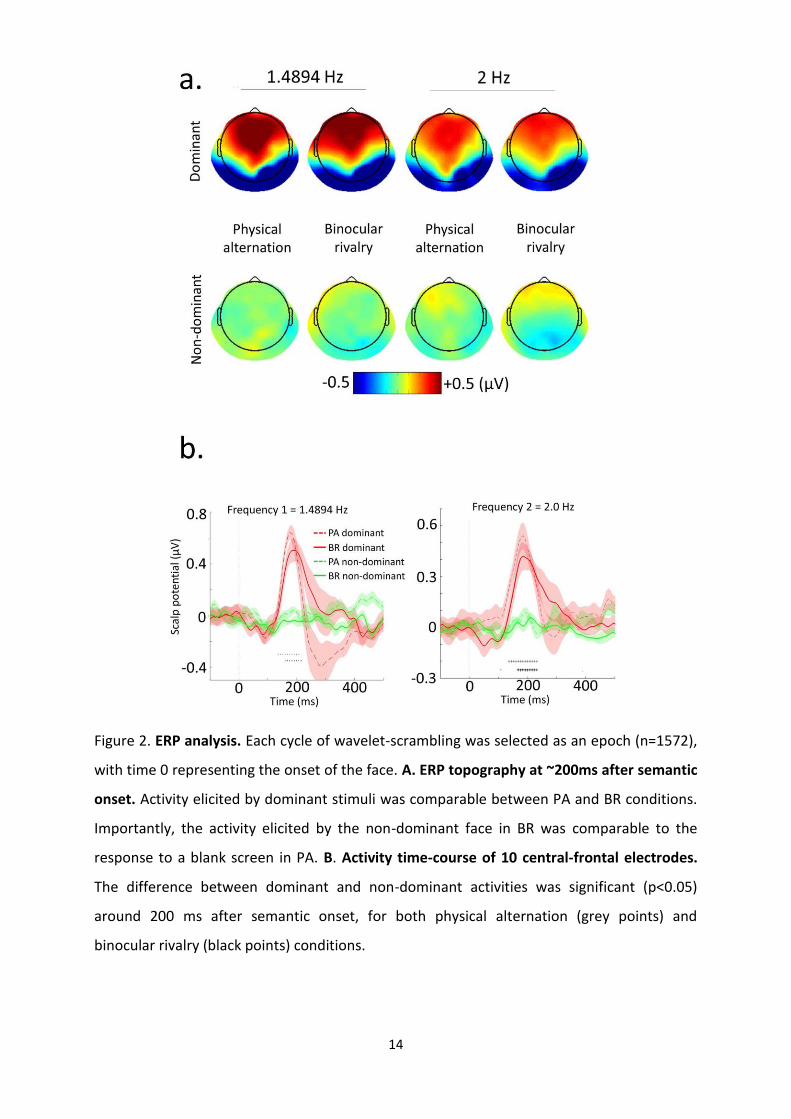
14
Figure 2. ERP analysis. Each cycle of wavelet-scrambling was selected as an epoch (n=1572),
with time 0 representing the onset of the face. A. ERP topography at ~200ms after semantic
onset. Activity elicited by dominant stimuli was comparable between PA and BR conditions.
Importantly, the activity elicited by the non-dominant face in BR was comparable to the
response to a blank screen in PA. B. Activity time-course of 10 central-frontal electrodes.
The difference between dominant and non-dominant activities was significant (p<0.05)
around 200 ms after semantic onset, for both physical alternation (grey points) and
binocular rivalry (black points) conditions.
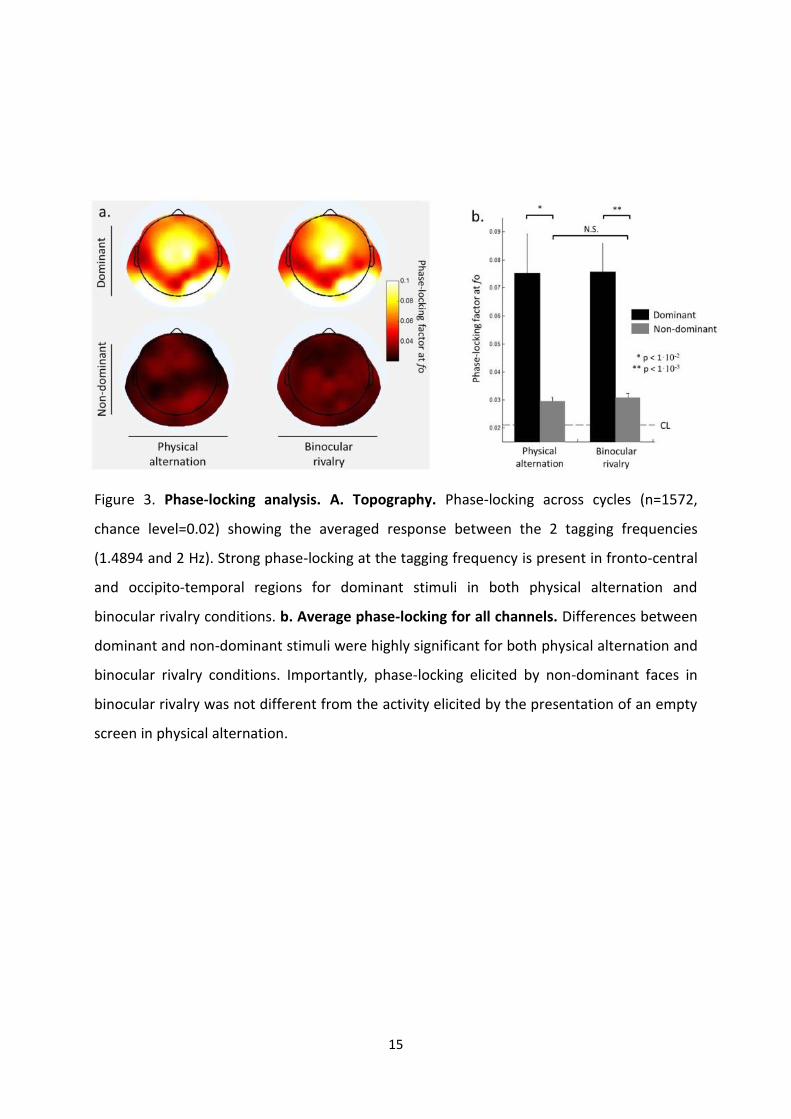
15
Figure 3. Phase-locking analysis. A. Topography. Phase-locking across cycles (n=1572,
chance level=0.02) showing the averaged response between the 2 tagging frequencies
(1.4894 and 2 Hz). Strong phase-locking at the tagging frequency is present in fronto-central
and occipito-temporal regions for dominant stimuli in both physical alternation and
binocular rivalry conditions. b. Average phase-locking for all channels. Differences between
dominant and non-dominant stimuli were highly significant for both physical alternation and
binocular rivalry conditions. Importantly, phase-locking elicited by non-dominant faces in
binocular rivalry was not different from the activity elicited by the presentation of an empty
screen in physical alternation.
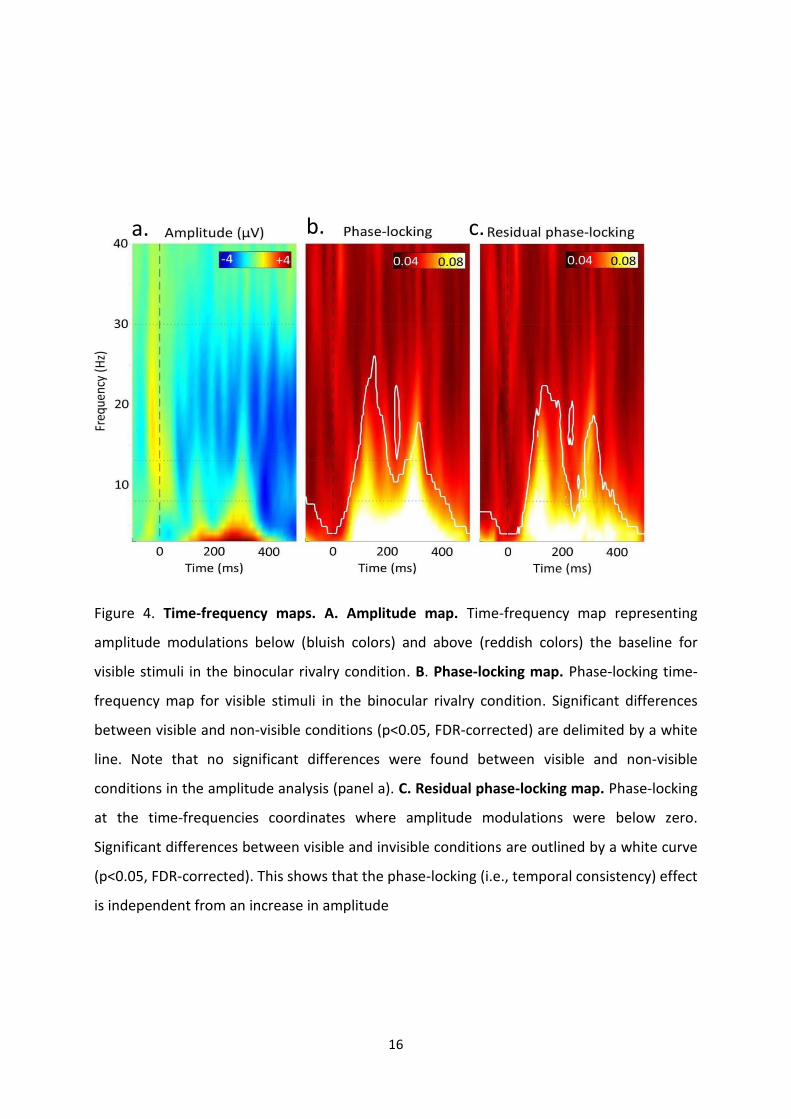
16
Figure 4. Time-frequency maps. A. Amplitude map. Time-frequency map representing
amplitude modulations below (bluish colors) and above (reddish colors) the baseline for
visible stimuli in the binocular rivalry condition. B. Phase-locking map. Phase-locking time-
frequency map for visible stimuli in the binocular rivalry condition. Significant differences
between visible and non-visible conditions (p<0.05, FDR-corrected) are delimited by a white
line. Note that no significant differences were found between visible and non-visible
conditions in the amplitude analysis (panel a). C. Residual phase-locking map. Phase-locking
at the time-frequencies coordinates where amplitude modulations were below zero.
Significant differences between visible and invisible conditions are outlined by a white curve
(p<0.05, FDR-corrected). This shows that the phase-locking (i.e., temporal consistency) effect
is independent from an increase in amplitude
a. b. c.
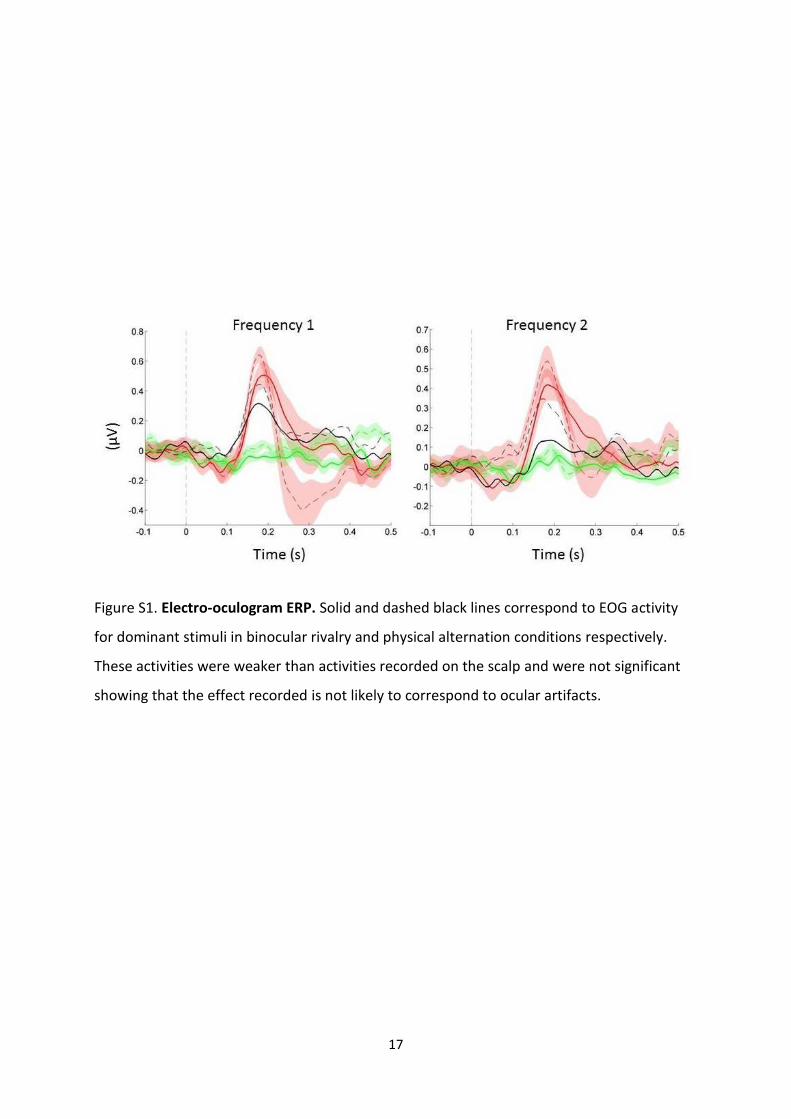
17
Figure S1. Electro-oculogram ERP. Solid and dashed black lines correspond to EOG activity
for dominant stimuli in binocular rivalry and physical alternation conditions respectively.
These activities were weaker than activities recorded on the scalp and were not significant
showing that the effect recorded is not likely to correspond to ocular artifacts.
18
References
Dehaene, Stanislas, Claire Sergent, and Jean-Pierre Changeux. 2003. “A Neuronal Network Model
Linking Subjective Reports and Objective Physiological Data During Conscious Perception.”
Proceedings of the National Academy of Sciences of the United States of America 100 (14)
(July 8): 8520–8525. doi:10.1073/pnas.1332574100.
Delorme, Arnaud, and Scott Makeig. 2004. “EEGLAB: An Open Source Toolbox for Analysis of Single-
trial EEG Dynamics Including Independent Component Analysis.” Journal of Neuroscience
Methods 134 (1) (March 15): 9–21. doi:10.1016/j.jneumeth.2003.10.009.
Haynes, John-Dylan, and Geraint Rees. 2005. “Predicting the Stream of Consciousness from Activity in
Human Visual Cortex.” Current Biology: CB 15 (14) (July 26): 1301–1307.
doi:10.1016/j.cub.2005.06.026.
Jiang, Yi, and Sheng He. 2006. “Cortical Responses to Invisible Faces: Dissociating Subsystems for
Facial-information Processing.” Current Biology: CB 16 (20) (October 24): 2023–2029.
doi:10.1016/j.cub.2006.08.084.
Koenig-Robert, R, and R VanRullen. “Isolating and Tracking the Neural Correlates of Object
Recognition.”
Lansing, R W. 1964. “Electroencephalographic Correlates of Binocular Rivalry in Man.” Science (New
York, N.Y.) 146 (3649) (December 4): 1325–1327.
Logothetis, N K. 1998. “Single Units and Conscious Vision.” Philosophical Transactions of the Royal
Society of London. Series B, Biological Sciences 353 (1377) (November 29): 1801–1818.
doi:10.1098/rstb.1998.0333.
Logothetis, N K, and J D Schall. 1989. “Neuronal Correlates of Subjective Visual Perception.” Science
(New York, N.Y.) 245 (4919) (August 18): 761–763.
Melloni, Lucia, Carlos Molina, Marcela Pena, David Torres, Wolf Singer, and Eugenio Rodriguez. 2007.
“Synchronization of Neural Activity Across Cortical Areas Correlates with Conscious
Perception.” The Journal of Neuroscience: The Official Journal of the Society for Neuroscience
27 (11) (March 14): 2858–2865. doi:10.1523/JNEUROSCI.4623-06.2007.
Moutoussis, K., and S. Zeki. 2002. “The Relationship Between Cortical Activation and Perception
Investigated with Invisible Stimuli.” Proceedings of the National Academy of Sciences 99 (14)
(June 27): 9527–9532. doi:10.1073/pnas.142305699.
19
Polonsky, A, R Blake, J Braun, and D J Heeger. 2000. “Neuronal Activity in Human Primary Visual
Cortex Correlates with Perception During Binocular Rivalry.” Nature Neuroscience 3 (11)
(November): 1153–1159. doi:10.1038/80676.
Rodriguez, E, N George, J P Lachaux, J Martinerie, B Renault, and F J Varela. 1999. “Perception’s
Shadow: Long-distance Synchronization of Human Brain Activity.” Nature 397 (6718)
(February 4): 430–433. doi:10.1038/17120.
Rugg, Michael D., Michael C. Doyle, and Tony Wells. 1995. “Word and Nonword Repetition Within-
and Across-Modality: An Event-Related Potential Study.” Journal of Cognitive Neuroscience 7
(2) (April): 209–227. doi:10.1162/jocn.1995.7.2.209.
Shah, Ankoor S, Steven L Bressler, Kevin H Knuth, Mingzhou Ding, Ashesh D Mehta, Istvan Ulbert, and
Charles E Schroeder. 2004. “Neural Dynamics and the Fundamental Mechanisms of Event-
related Brain Potentials.” Cerebral Cortex (New York, N.Y.: 1991) 14 (5) (May): 476–483.
doi:10.1093/cercor/bhh009.
Srinivasan, R, D P Russell, G M Edelman, and G Tononi. 1999. “Increased Synchronization of
Neuromagnetic Responses During Conscious Perception.” The Journal of Neuroscience: The
Official Journal of the Society for Neuroscience 19 (13) (July 1): 5435–5448.
Srinivasan, Ramesh. 2004. “Internal and External Neural Synchronization During Conscious
Perception.” International Journal of Bifurcation and Chaos in Applied Sciences and
Engineering 14 (2) (February): 825–842. doi:10.1142/S0218127404009399.
Srinivasan, Ramesh, and Sanja Petrovic. 2006. “MEG Phase Follows Conscious Perception During
Binocular Rivalry Induced by Visual Stream Segregation.” Cerebral Cortex (New York, N.Y.:
1991) 16 (5) (May): 597–608. doi:10.1093/cercor/bhj016.
Sterzer, P., J. D. Haynes, and G. Rees. 2008. “Fine-scale Activity Patterns in High-level Visual Areas
Encode the Category of Invisible Objects.” Journal of Vision 8 (15) (November 1): 10–10.
doi:10.1167/8.15.10.
Sutoyo, David, and Ramesh Srinivasan. 2009. “Nonlinear SSVEP Responses Are Sensitive to the
Perceptual Binding of Visual Hemifields During Conventional ‘Eye’ Rivalry and Interocular
‘Percept’ Rivalry.” Brain Research 1251 (January 28): 245–255.
doi:10.1016/j.brainres.2008.09.086.
Tong, F, K Nakayama, J T Vaughan, and N Kanwisher. 1998. “Binocular Rivalry and Visual Awareness
in Human Extrastriate Cortex.” Neuron 21 (4) (October): 753–759.
Tong, Frank, Ming Meng, and Randolph Blake. 2006. “Neural Bases of Binocular Rivalry.” Trends in
Cognitive Sciences 10 (11) (November): 502–511. doi:10.1016/j.tics.2006.09.003.

20
Tononi, G, R Srinivasan, D P Russell, and G M Edelman. 1998. “Investigating Neural Correlates of
Conscious Perception by Frequency-tagged Neuromagnetic Responses.” Proceedings of the
National Academy of Sciences of the United States of America 95 (6) (March 17): 3198–3203.
Varela, F, J P Lachaux, E Rodriguez, and J Martinerie. 2001. “The Brainweb: Phase Synchronization
and Large-scale Integration.” Nature Reviews. Neuroscience 2 (4) (April): 229–239.
doi:10.1038/35067550.

Intracranial recordings using SWIFT: ongoing collaborative work
169
F. Intracranial recordings using SWIFT: ongoing
collaborative work
Where and when in the brain does neural activity generate visual consciousness? In order to
try to answer this question I wanted to combine SWIFT with intracranial recordings which
maximize the advantages of the high-temporal resolving properties of SWIFT adding
improved spatial resolution compared with EEG recordings. This method provides both
millisecond-level temporal resolution and millimeter-level spatial resolution of brain activity,
which cannot be achieved with EEG recordings that lack spatial resolution. The application of
this method would provide high spatio-temporal resolution measures of neural activity
related to visual consciousness across the brain and, at the same time help us to understand
the functional interactions among different areas and how they pinpoint conscious
perception.
We had the unique opportunity to use this technique thanks to two fruitful collaborations. A
first collaboration with Dr. Emmanuel Barbeau, researcher in our laboratory and Dr. Luc
Valton, from the department of epileptology of Rangueil Hospital, allowed us to have access
to epileptic patients implanted with deep electrodes (SEEG) for clinical reasons. A second
collaboration with Dr. Denis Fize and his Masters student, Anne-Claire Collet, allowed us to
have access to one implanted macaque monkey implanted with intracranial electrodes
(ECoG).
Using these models we want to address questions such as the causal relationships in the
emergence of consciousness in different areas, the propagation of the consciousness related
activity across brain areas, the nature of conscious activity and the participation of
distinctive activity frequency bands in its generation, among others.
These collaborations are still ongoing and the data collection stage is not yet completed.
However, even at this stage, we have obtained very promising results which will be
presented in the form of two separate preliminary reports.

Intracranial recordings using SWIFT: ongoing collaborative work
170
I. REPORT 1. Koenig-Robert, Barbeau, Valton & VanRullen.
Intracranial recordings using SWIFT: ongoing collaborative work
171
The time course and spatial distribution of consciousness-dependent activity in the human
brain.
Roger Koenig-Robert, Emmanuel Barbeau, Luc Valton & Rufin VanRullen
Exploring neural correlates of awareness with both high spatial and temporal resolution has been a
difficult challenge. Current neuroimaging techniques can attain outstanding temporal resolution
(EEG and MEG) or great spatial resolution (fMRI) but rarely both. Epileptic patients implanted with
deep electrodes for clinical reasons provide a unique opportunity to explore the neural correlates
of awareness with both high temporal and spatial resolutions. We used stereotaxic-
electroencephalogram (SEEG) to record activity from both superficial and deep structures, mainly
from temporal and parietal lobes. We used an innovative technique called SWIFT (semantic
wavelet-induced frequency-tagging), in which periodic scrambling in the wavelets domain
modulates an image semantic content (object form) over time, without disturbing its low-level
attributes. This technique already proved highly effective in isolating conscious object
representations by EEG frequency-tagging (Koenig-Robert & VanRullen, submitted). In the present
study, we presented to epileptic patients SWIFT sequences containing natural images containing
an object, and subjects reported conscious recognition of the object. If it was not recognized after
a few scrambling cycles, the original image was shown steadily for 3 seconds to reveal object
identity and then the sequence was presented again. Comparing frequency-tagging responses
before vs. after conscious object recognition, we found consciousness-dependent activity involving
theta, alpha, beta and gamma bands in different brain regions.
Intracranial recordings using SWIFT: ongoing collaborative work
172
Materials and Methods
Subjects. Three patients suffering from drug-resistant epilepsy and candidates for surgery
participated in the study. Because the location of the epileptic focus could not be identified
using non-invasive methods, the patients underwent intracerebral EEG recordings using
stereotactically implanted depth electrodes (SEEG). The selection of electrode implantation
sites was solely based on clinical considerations directly related to the presurgical evaluation
and without any reference to the present experimental investigations. All patients provided
informed consent prior to their participation in the experiment and experimental procedures
were approved by the French ethics committee.
Intracerebral recordings. A multi-channel video-SEEG acquisition and monitoring system
(Micromed, Treviso, Italy) was used to simultaneously record the intracerebral activity from
up to 128 depth-EEG electrodes (512 Hz sampling rate and a 0.1 to 200 Hz bandpass filter).
Twelve to fourteen semi-rigid multi-lead electrodes were implanted in each patient. Each
electrode had a diameter of 0.8 mm and, depending on the target structure, comprised
between 5 and 18 contact leads 2 mm long and 1.5 mm apart (Alcys, Besançon, France). In
addition, computer-assisted matching between a post-implantation CT-scan and a pre-
implantation 3-D MRI data set allowed for direct visualization of the electrode contacts on
the patient's brain anatomy. Bipolar reference was calculated offline.
Experimental procedure. SWIFT sequences containing either grayscale natural images
(bodies with faces, bodies with no visible faces, animals and manmade objects, downloaded
from the Internet) or no-object pictures (low-level matched textures obtained by using the
algorithm developed by Portilla & Simoncelli (Portilla & Simoncelli, 2000)) were shown. The
image contours were modulated cyclically over time at two tagging frequencies, f0 = 1.4894
or 1Hz. In each trial a SWIFT movie containing a single natural image was presented in two
different periods. In the first period or naïve period, the movie was presented by the first
time to the patient. Within this period, the patient could give her response by pressing a
computer key (the key was pressed when an object was recognized by the patient). In
between the periods, the image contained in the movie was showed steadily as a prime
whether the object was recognized or not in the first period. In the second or cognizant

Intracranial recordings using SWIFT: ongoing collaborative work
173
period, the same movie presented in the naïve period was presented again. This assures that
all movies containing meaningful natural images (i.e. the movies not containing abstract
textures) were recognized in the cognizant period. The experiment was divided in blocks of
25 trials each. Each trial lasted 23 sec (10 sec of naïve period + 3 sec of steady image priming
+ 10 sec of cognizant period). Subjects completed from 4 to 10 blocks, within a period of
several days. Sequences were presented at the center of the screen over a black
background. Subjects were asked to keep their fixation over a red cross at the center of the
display during the trial. They gave their responses (presence of a non-abstract item) at any
time during the first naïve period by pressing the right arrow on a computer keyboard. Our
analysis was focused only on the trials that were not recognized during the first period of
presentation (i.e., naïve period) and the no-objects trials that were used as a baseline. This
yielded three conditions: non-recognized (i.e., unrecognized objects showed in the naïve
period, prior to priming), recognized (i.e., the same objects that were recognized in the
cognizant period, once the prime was presented) and no-object (trials where an abstract
texture was shown).
Responsive recording sites selection. Several electrode contacts were not functional either
because they laid on the white matter (~50%) or they were placed on areas that were
functionally impaired (i.e., epileptogenic zones), which was the most usual case. Among the
functional contacts, we were interested in the brain areas that responded selectively to the
semantic visual information. Thus we had to set a criterion in order to select the contacts to
focus our analysis. Electrode contact responsiveness was assessed by measuring the phase-
locking factor at the tagging frequency, and also at its 2nd harmonic, across trials (see below
for details). Phase-locking was defined as significant by comparing it with the null hypothesis
of random phase distribution based on the number of trials performed (Monte Carlo
simulation, 106 iterations). Only electrode contacts showing phase-locking factor at the
tagging frequency for the recognition condition above a threshold value (represented by
p=10-5) and below this threshold for the no-object and non-recognized condition were
selected. The selected contacts represented 5.4% of contacts (7 over 128 contacts) for
subject 1, 3.4% (4 over 119 contacts) for subject 2, and 5.8% (7 over 120 contacts) for
subject 3.
Intracranial recordings using SWIFT: ongoing collaborative work
174
Event-related potential (ERP) analysis. SEEG data (512 Hz sampling rate) was low-pass
filtered at 15 Hz and epoched between -100 and 671 ms or between -100 and 1000 ms
(depending on the tagging frequency used in a particular subject), taking as 0 time the
moment at which the semantic information was fully available within a SWIFT scrambling
cycle. Linear detrending correction was performed in order to ensure that potential at time-
points 0 and [1/tagging frequency] remained at 0µV for every epoch.
Phase-locking analysis across trials. Time-locked responses generated at the tagging
frequency (f0) were assessed by measuring the response phase delay conservation, relative
to the onsets of the semantic information (i.e. the onsets of the embedded image during the
trial), across trials. A bootstrap procedure (resampling without replacement, n = 500) was
used to equalize the number of trials entered in the computation for conditions. The phase
of the EEG signals was calculated by means of the fast Fourier transform (FFT) algorithm
under Matlab (MathWorks). The FFT algorithm was applied over a whole period of 10 sec
(5120 time-points, frequency resolution = 0.1 Hz) and the phase was extracted by selecting
the coefficient representing the closest frequency to the tagging frequency from the Fourier
transform output. The FFT transform at f0 of the time-domain signal � for the trial k is a
complex number in which � represents the amplitude of the signal and � its phase:
����,� = ��,� ���,��
Phase-locking factor across trials (tPLF, also called phase-locking value or inter trial
coherence) was calculated as follows:
���� = �1�� �(��)�
����
The PLF measure takes values between 0 and 1. A value of 0 represents absence of
synchronization across cycles between EEG data and the time-locking events, and a value of
1 indicates perfect synchronization. tPLF is computed by normalizing the lengths of the
complex vectors (representing amplitude and phase) to 1 for all cycles and then computing
their complex average. Thus, only the information about the phase of the spectral estimate
of each trial is taken into account.
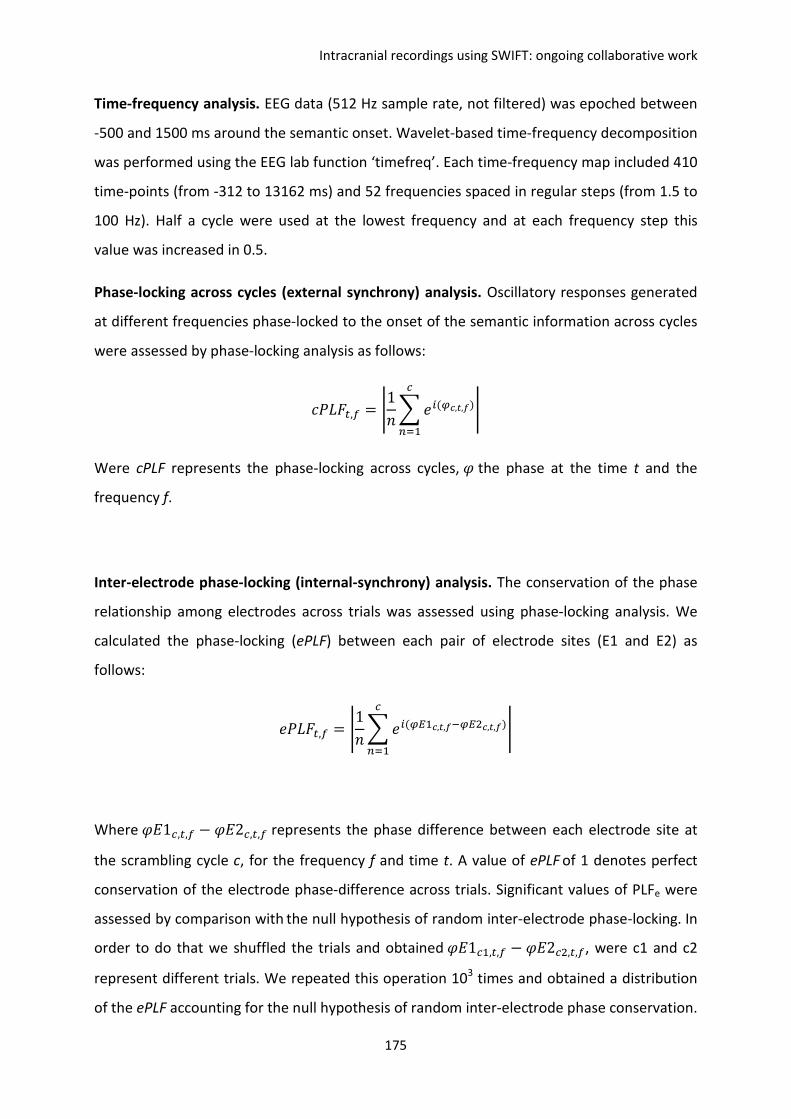
Intracranial recordings using SWIFT: ongoing collaborative work
175
Time-frequency analysis. EEG data (512 Hz sample rate, not filtered) was epoched between
-500 and 1500 ms around the semantic onset. Wavelet-based time-frequency decomposition
was performed using the EEG lab function ‘timefreq’. Each time-frequency map included 410
time-points (from -312 to 13162 ms) and 52 frequencies spaced in regular steps (from 1.5 to
100 Hz). Half a cycle were used at the lowest frequency and at each frequency step this
value was increased in 0.5.
Phase-locking across cycles (external synchrony) analysis. Oscillatory responses generated
at different frequencies phase-locked to the onset of the semantic information across cycles
were assessed by phase-locking analysis as follows:
���� ,� = �1�� �(�!,",�)#
����
Were cPLF represents the phase-locking across cycles, � the phase at the time t and the
frequency f.
Inter-electrode phase-locking (internal-synchrony) analysis. The conservation of the phase
relationship among electrodes across trials was assessed using phase-locking analysis. We
calculated the phase-locking (ePLF) between each pair of electrode sites (E1 and E2) as
follows:
��� ,� = �1�� �(�$�!,",�%�$&!,",�)#
����
Where �'1#, ,� − �'2#, ,� represents the phase difference between each electrode site at
the scrambling cycle c, for the frequency f and time t. A value of ePLF of 1 denotes perfect
conservation of the electrode phase-difference across trials. Significant values of PLFe were
assessed by comparison with the null hypothesis of random inter-electrode phase-locking. In
order to do that we shuffled the trials and obtained�'1#�, ,� − �'2#&, ,�, were c1 and c2
represent different trials. We repeated this operation 103 times and obtained a distribution
of the ePLF accounting for the null hypothesis of random inter-electrode phase conservation.
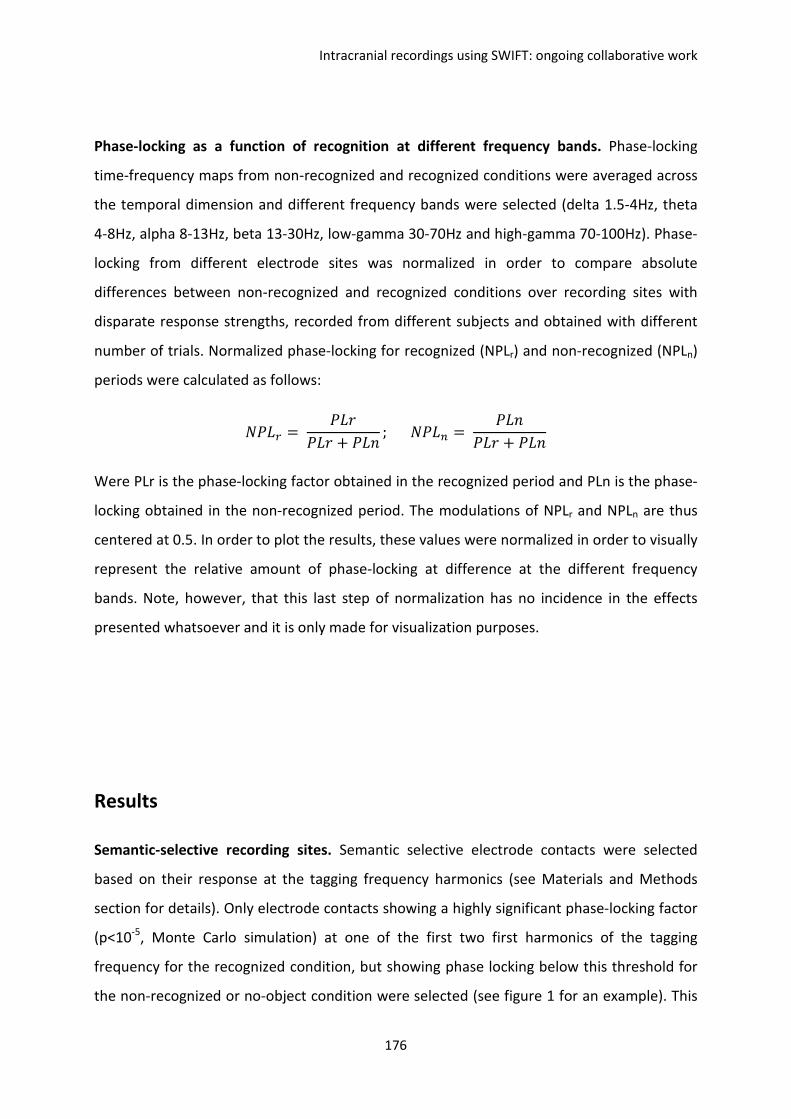
Intracranial recordings using SWIFT: ongoing collaborative work
176
Phase-locking as a function of recognition at different frequency bands. Phase-locking
time-frequency maps from non-recognized and recognized conditions were averaged across
the temporal dimension and different frequency bands were selected (delta 1.5-4Hz, theta
4-8Hz, alpha 8-13Hz, beta 13-30Hz, low-gamma 30-70Hz and high-gamma 70-100Hz). Phase-
locking from different electrode sites was normalized in order to compare absolute
differences between non-recognized and recognized conditions over recording sites with
disparate response strengths, recorded from different subjects and obtained with different
number of trials. Normalized phase-locking for recognized (NPLr) and non-recognized (NPLn)
periods were calculated as follows:
*��+ = ��,��, + ��� ; *��� = �����, + ���
Were PLr is the phase-locking factor obtained in the recognized period and PLn is the phase-
locking obtained in the non-recognized period. The modulations of NPLr and NPLn are thus
centered at 0.5. In order to plot the results, these values were normalized in order to visually
represent the relative amount of phase-locking at difference at the different frequency
bands. Note, however, that this last step of normalization has no incidence in the effects
presented whatsoever and it is only made for visualization purposes.
Results
Semantic-selective recording sites. Semantic selective electrode contacts were selected
based on their response at the tagging frequency harmonics (see Materials and Methods
section for details). Only electrode contacts showing a highly significant phase-locking factor
(p<10-5, Monte Carlo simulation) at one of the first two first harmonics of the tagging
frequency for the recognized condition, but showing phase locking below this threshold for
the non-recognized or no-object condition were selected (see figure 1 for an example). This
Intracranial recordings using SWIFT: ongoing collaborative work
177
selection was made because several electrode contacts were not functional either because
they laid on the white matter (more than 50%) or they were placed on areas that were
functionally impaired (i.e., epileptogenic zones). Among the functional contacts, we were
interested in the brain areas that responded selectively to the semantic visual information. A
mean of 4.9% of the electrode contacts (representing 18 contacts over 3 subjects) fulfilled
our selection criterion.
Event related potential analysis. We used an event-related potential (ERP) analysis to
measure the scalp potentials locked to the onset of the semantic information—the time
when the non-scrambled picture was on the screen—which was taken as the zero-time. Each
SWIFT modulation cycle was thus taken as an epoch. Examples of ERPs for different
recording sites for the 3 subjects are shown in figure 2. No significant differences between
no-objects (Figure 2, green line) and non-recognized objects (Figure 2, black line) were seen
in the majority of selected electrodes. Once the same previously non-recognized objects
were primed and thus recognized and showed again, ERP responses (Figure 2, red line)
became significantly different (Figure 2, black underscore, p<0.01, one-way ANOVA) from
no-objects (green line). However the significance of these effects is trivial since they are
expected from our selection criterion. What is not trivial is the timing of these differences
which can be informative regarding the causal relationship among areas in the emergence of
activities associated to conscious recognition. Thus, earliest significant differences were
found on parietal and temporal electrodes around 100 ms, while most of significant
differences were seen between 200 and 300 ms after the semantic onset, with a great
amount of jitter among areas (data not shown).
External synchrony analysis. A time-frequency phase-locking analysis allowed us to
investigate the neural activities evoked by the semantic information at every SWIFT
modulation cycle for the recognized and non-recognized conditions. Significant phase-
locking values denote oscillatory activities systematically elicited with the same phase
relationship across trials relative to the semantic onset of the stimulation. The time-
frequency analysis allows assessing the degree of synchrony of the recorded area relative to
the stimulation (from now on called external synchrony) across several frequency bands.
Figure 3 shows phase-locking time-frequency maps for the recognized and non-recognized
conditions for the 3 subjects (same recording sites as showed in figure 2). A slight increase in
Intracranial recordings using SWIFT: ongoing collaborative work
178
the phase-locking value can be observed in some cases for recognized objects at frequencies
below 20 Hz. Note that a high value of phase-locking around the tagging frequency for
recognized objects is trivial since it was used as the selection criterion for the electrode
contacts. However, significant phase-locking factor at higher frequencies are not a priori
expected and may denote a phase-resetting evoked by the semantic information. In order to
quantify the differences in phase-locking at different frequency bands, we compared the
phase-locking across cycles for non-recognized and recognized conditions for all 18 recording
sites (Figure 4). Differences in phase-locking between non-recognized and recognized
conditions were highly significant in the delta range (1.5-4Hz, p=2.3·10-6, one-way ANOVA,
although trivial since it was used as the selection criterion), theta range (4-8Hz, p=8·10-5,
one-way ANOVA), alpha range (8-13Hz, p=4.5·10-3, one-way ANOVA) and beta range (13-
30Hz, p=2.4·10-3, one-way ANOVA). Interestingly, while an increase in phase-locking in the
recognized condition was observed at low frequencies (from delta to alpha), the contrary
was observed in the beta band, where a decrease in phase-locking was shown (Figure 4).
Inter-electrode (internal) synchrony analysis. Functional connectivity between brain areas
was assessed by means of a phase-locking analysis between electrode pairs. Our hypothesis
is that if two areas are functionally coupled, their phase relationship would be conserved
across trials. Since we were interested by the electrode interactions modulated by the onset
of the semantic information, we extracted the baseline activity (from -100 to 0 ms after
semantic onset, which reflects intrinsic phase-locking across areas) in order to showcase
modulations due to the processing of semantic information during non-recognized and
recognized periods (Figure 5). Significant modulations above and below the baseline were
shown at different frequencies (Figure 5, outlined regions). Interestingly, inversions in the
inter-electrode phase-locking modulation (from positive to negative modulations or
inversely) were seen between non-recognized and recognized conditions (i.e., Figure 5,
Subject 1, from positive to negative around 40Hz and Subject 2, from negative to positive
below 20Hz), denoting inter-area synchronization and de-synchronization as a function of
recognition. In order to quantify the global behavior of inter-electrode phase-locking as a
function of recognition, we calculated the difference of inter-electrode phase-locking at
different frequency bands for all recording sites pairs (Figure 6). While global differences in
inter-electrode phase locking were not significant at lower frequencies (Figure 6, delta,
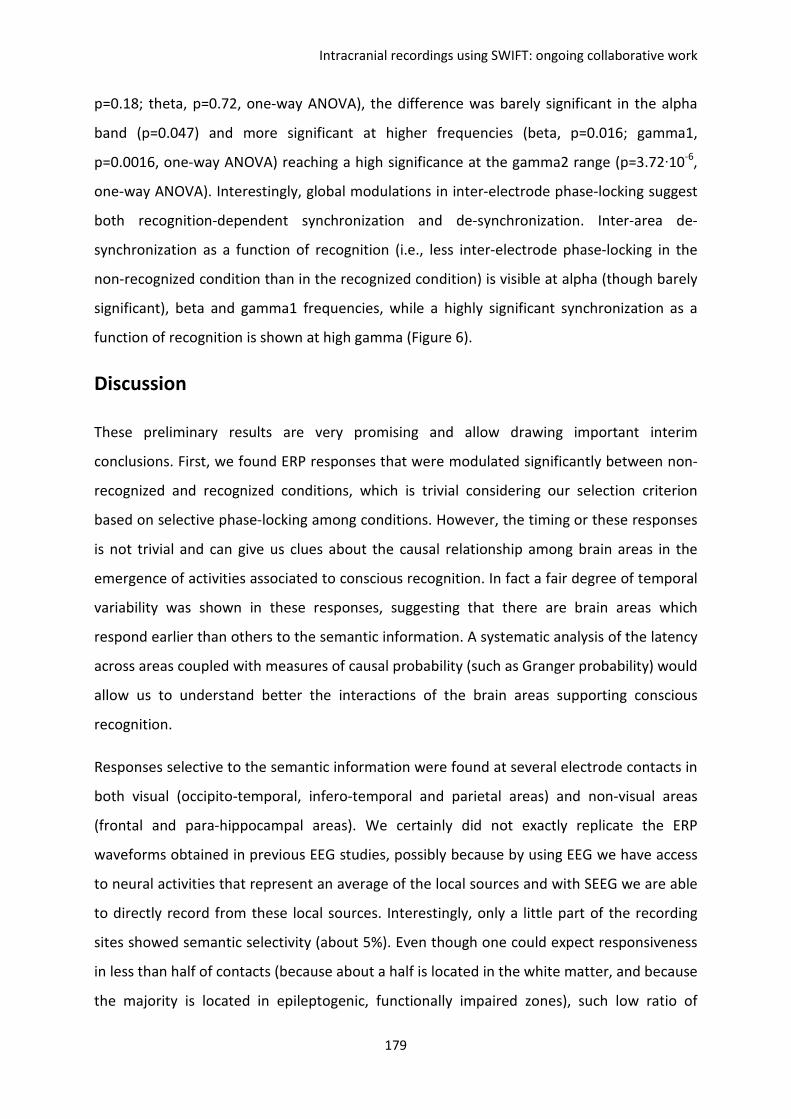
Intracranial recordings using SWIFT: ongoing collaborative work
179
p=0.18; theta, p=0.72, one-way ANOVA), the difference was barely significant in the alpha
band (p=0.047) and more significant at higher frequencies (beta, p=0.016; gamma1,
p=0.0016, one-way ANOVA) reaching a high significance at the gamma2 range (p=3.72·10-6,
one-way ANOVA). Interestingly, global modulations in inter-electrode phase-locking suggest
both recognition-dependent synchronization and de-synchronization. Inter-area de-
synchronization as a function of recognition (i.e., less inter-electrode phase-locking in the
non-recognized condition than in the recognized condition) is visible at alpha (though barely
significant), beta and gamma1 frequencies, while a highly significant synchronization as a
function of recognition is shown at high gamma (Figure 6).
Discussion
These preliminary results are very promising and allow drawing important interim
conclusions. First, we found ERP responses that were modulated significantly between non-
recognized and recognized conditions, which is trivial considering our selection criterion
based on selective phase-locking among conditions. However, the timing or these responses
is not trivial and can give us clues about the causal relationship among brain areas in the
emergence of activities associated to conscious recognition. In fact a fair degree of temporal
variability was shown in these responses, suggesting that there are brain areas which
respond earlier than others to the semantic information. A systematic analysis of the latency
across areas coupled with measures of causal probability (such as Granger probability) would
allow us to understand better the interactions of the brain areas supporting conscious
recognition.
Responses selective to the semantic information were found at several electrode contacts in
both visual (occipito-temporal, infero-temporal and parietal areas) and non-visual areas
(frontal and para-hippocampal areas). We certainly did not exactly replicate the ERP
waveforms obtained in previous EEG studies, possibly because by using EEG we have access
to neural activities that represent an average of the local sources and with SEEG we are able
to directly record from these local sources. Interestingly, only a little part of the recording
sites showed semantic selectivity (about 5%). Even though one could expect responsiveness
in less than half of contacts (because about a half is located in the white matter, and because
the majority is located in epileptogenic, functionally impaired zones), such low ratio of
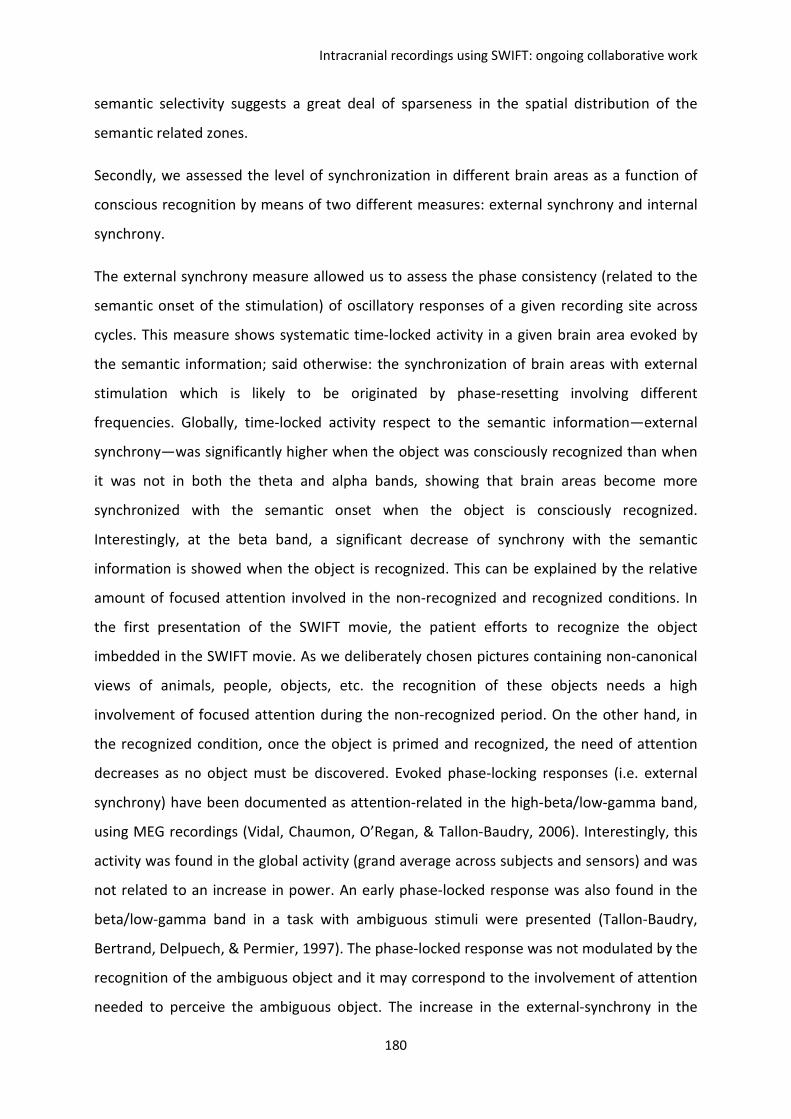
Intracranial recordings using SWIFT: ongoing collaborative work
180
semantic selectivity suggests a great deal of sparseness in the spatial distribution of the
semantic related zones.
Secondly, we assessed the level of synchronization in different brain areas as a function of
conscious recognition by means of two different measures: external synchrony and internal
synchrony.
The external synchrony measure allowed us to assess the phase consistency (related to the
semantic onset of the stimulation) of oscillatory responses of a given recording site across
cycles. This measure shows systematic time-locked activity in a given brain area evoked by
the semantic information; said otherwise: the synchronization of brain areas with external
stimulation which is likely to be originated by phase-resetting involving different
frequencies. Globally, time-locked activity respect to the semantic information—external
synchrony—was significantly higher when the object was consciously recognized than when
it was not in both the theta and alpha bands, showing that brain areas become more
synchronized with the semantic onset when the object is consciously recognized.
Interestingly, at the beta band, a significant decrease of synchrony with the semantic
information is showed when the object is recognized. This can be explained by the relative
amount of focused attention involved in the non-recognized and recognized conditions. In
the first presentation of the SWIFT movie, the patient efforts to recognize the object
imbedded in the SWIFT movie. As we deliberately chosen pictures containing non-canonical
views of animals, people, objects, etc. the recognition of these objects needs a high
involvement of focused attention during the non-recognized period. On the other hand, in
the recognized condition, once the object is primed and recognized, the need of attention
decreases as no object must be discovered. Evoked phase-locking responses (i.e. external
synchrony) have been documented as attention-related in the high-beta/low-gamma band,
using MEG recordings (Vidal, Chaumon, O’Regan, & Tallon-Baudry, 2006). Interestingly, this
activity was found in the global activity (grand average across subjects and sensors) and was
not related to an increase in power. An early phase-locked response was also found in the
beta/low-gamma band in a task with ambiguous stimuli were presented (Tallon-Baudry,
Bertrand, Delpuech, & Permier, 1997). The phase-locked response was not modulated by the
recognition of the ambiguous object and it may correspond to the involvement of attention
needed to perceive the ambiguous object. The increase in the external-synchrony in the
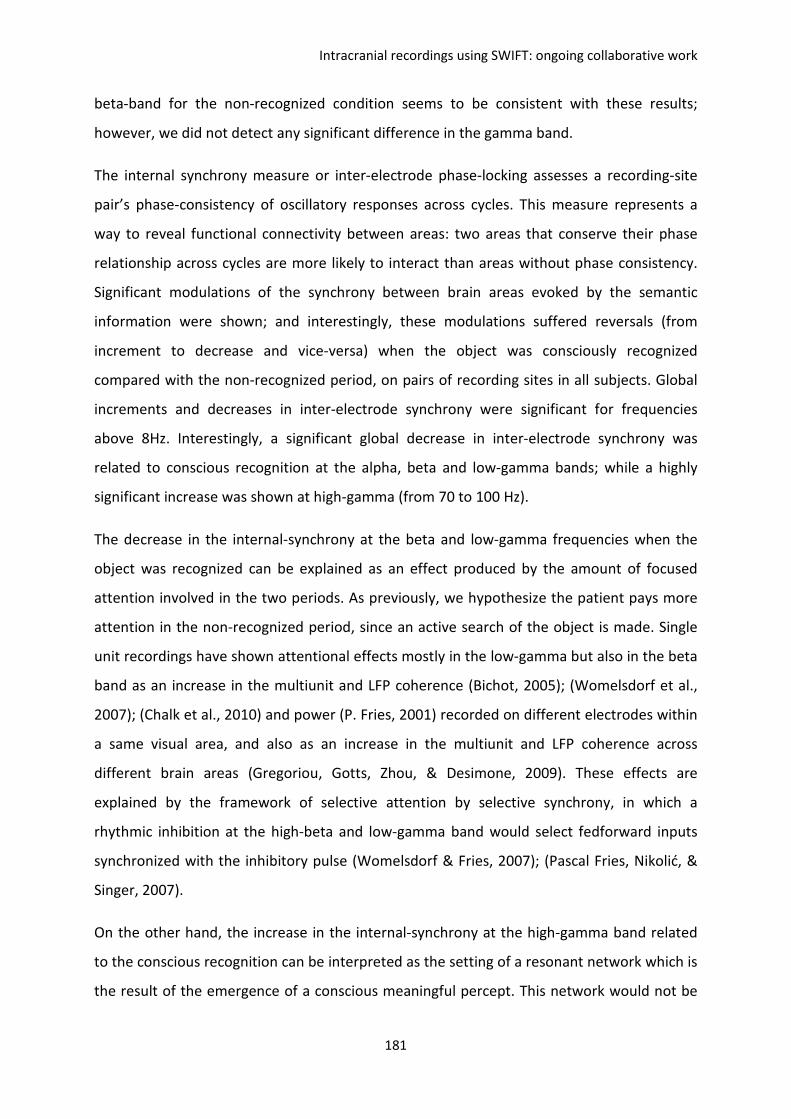
Intracranial recordings using SWIFT: ongoing collaborative work
181
beta-band for the non-recognized condition seems to be consistent with these results;
however, we did not detect any significant difference in the gamma band.
The internal synchrony measure or inter-electrode phase-locking assesses a recording-site
pair’s phase-consistency of oscillatory responses across cycles. This measure represents a
way to reveal functional connectivity between areas: two areas that conserve their phase
relationship across cycles are more likely to interact than areas without phase consistency.
Significant modulations of the synchrony between brain areas evoked by the semantic
information were shown; and interestingly, these modulations suffered reversals (from
increment to decrease and vice-versa) when the object was consciously recognized
compared with the non-recognized period, on pairs of recording sites in all subjects. Global
increments and decreases in inter-electrode synchrony were significant for frequencies
above 8Hz. Interestingly, a significant global decrease in inter-electrode synchrony was
related to conscious recognition at the alpha, beta and low-gamma bands; while a highly
significant increase was shown at high-gamma (from 70 to 100 Hz).
The decrease in the internal-synchrony at the beta and low-gamma frequencies when the
object was recognized can be explained as an effect produced by the amount of focused
attention involved in the two periods. As previously, we hypothesize the patient pays more
attention in the non-recognized period, since an active search of the object is made. Single
unit recordings have shown attentional effects mostly in the low-gamma but also in the beta
band as an increase in the multiunit and LFP coherence (Bichot, 2005); (Womelsdorf et al.,
2007); (Chalk et al., 2010) and power (P. Fries, 2001) recorded on different electrodes within
a same visual area, and also as an increase in the multiunit and LFP coherence across
different brain areas (Gregoriou, Gotts, Zhou, & Desimone, 2009). These effects are
explained by the framework of selective attention by selective synchrony, in which a
rhythmic inhibition at the high-beta and low-gamma band would select fedforward inputs
synchronized with the inhibitory pulse (Womelsdorf & Fries, 2007); (Pascal Fries, Nikolić, &
Singer, 2007).
On the other hand, the increase in the internal-synchrony at the high-gamma band related
to the conscious recognition can be interpreted as the setting of a resonant network which is
the result of the emergence of a conscious meaningful percept. This network would not be

Intracranial recordings using SWIFT: ongoing collaborative work
182
phase-locked to the stimulus onset as it would reflect dynamic and metastable inter-area
synchrony.
For the increase in the internal synchrony in the non-recognized we have no compelling
explanation until now. It can either be the product of noise or would have a functional role
in the formation of transient neuronal assemblies (Palva & Palva, 2007).
The different synchronic response profiles of brain oscillations in different frequency bands
may provide new insights into the neural correlates of conscious recognition and also can
help us to understand how attention and consciousness are dissociated at the neuronal
level. We look forward to reproducing these results in next patients in order to draw more
definitive conclusions at that time.
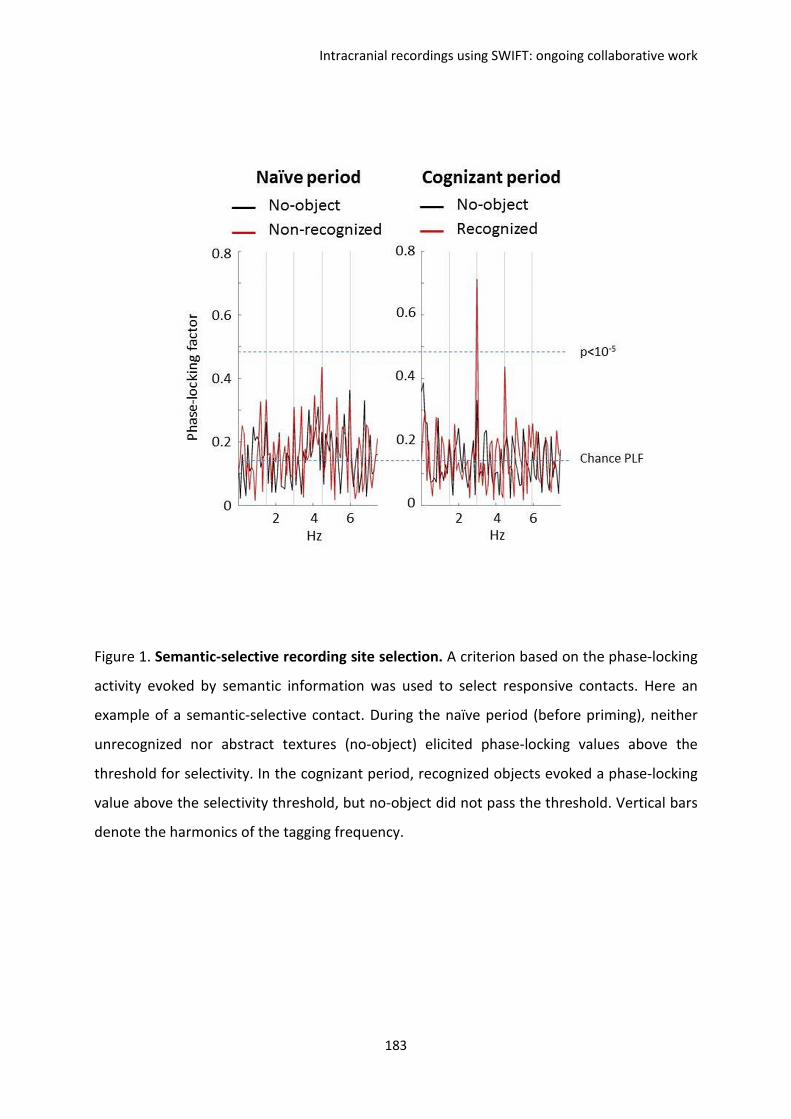
Intracranial recordings using SWIFT: ongoing collaborative work
183
Figure 1. Semantic-selective recording site selection. A criterion based on the phase-locking
activity evoked by semantic information was used to select responsive contacts. Here an
example of a semantic-selective contact. During the naïve period (before priming), neither
unrecognized nor abstract textures (no-object) elicited phase-locking values above the
threshold for selectivity. In the cognizant period, recognized objects evoked a phase-locking
value above the selectivity threshold, but no-object did not pass the threshold. Vertical bars
denote the harmonics of the tagging frequency.
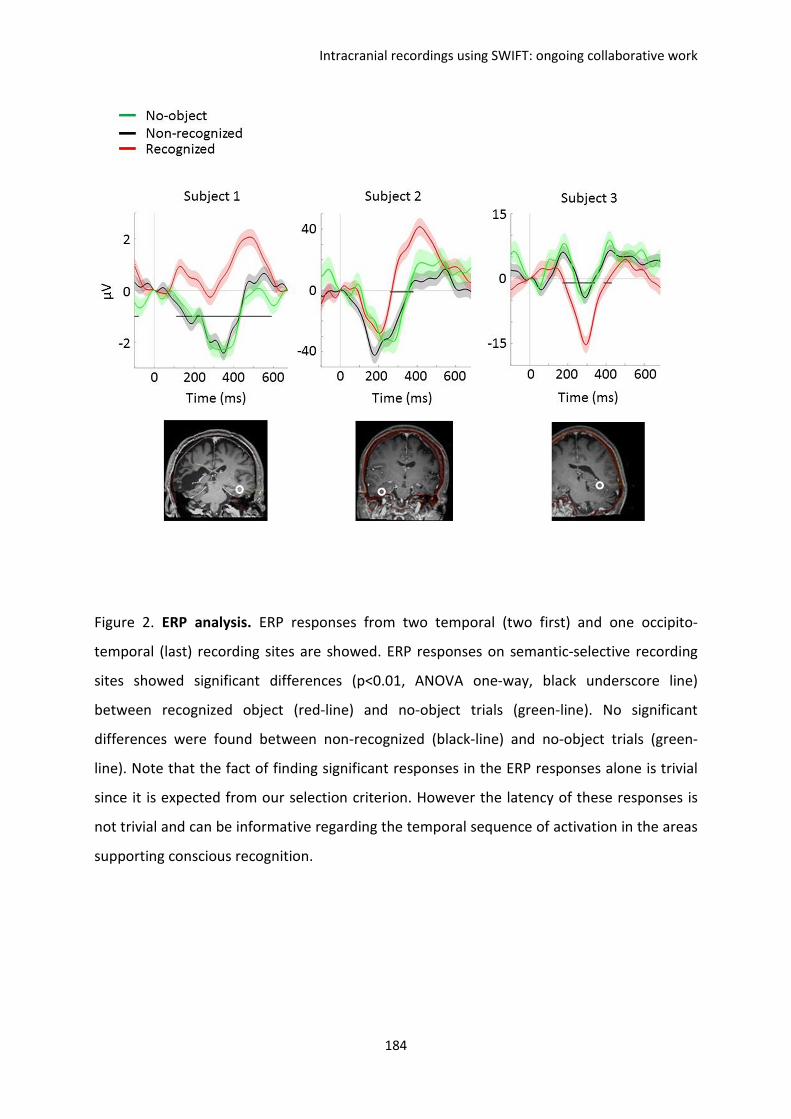
Intracranial recordings using SWIFT: ongoing collaborative work
184
Figure 2. ERP analysis. ERP responses from two temporal (two first) and one occipito-
temporal (last) recording sites are showed. ERP responses on semantic-selective recording
sites showed significant differences (p<0.01, ANOVA one-way, black underscore line)
between recognized object (red-line) and no-object trials (green-line). No significant
differences were found between non-recognized (black-line) and no-object trials (green-
line). Note that the fact of finding significant responses in the ERP responses alone is trivial
since it is expected from our selection criterion. However the latency of these responses is
not trivial and can be informative regarding the temporal sequence of activation in the areas
supporting conscious recognition.
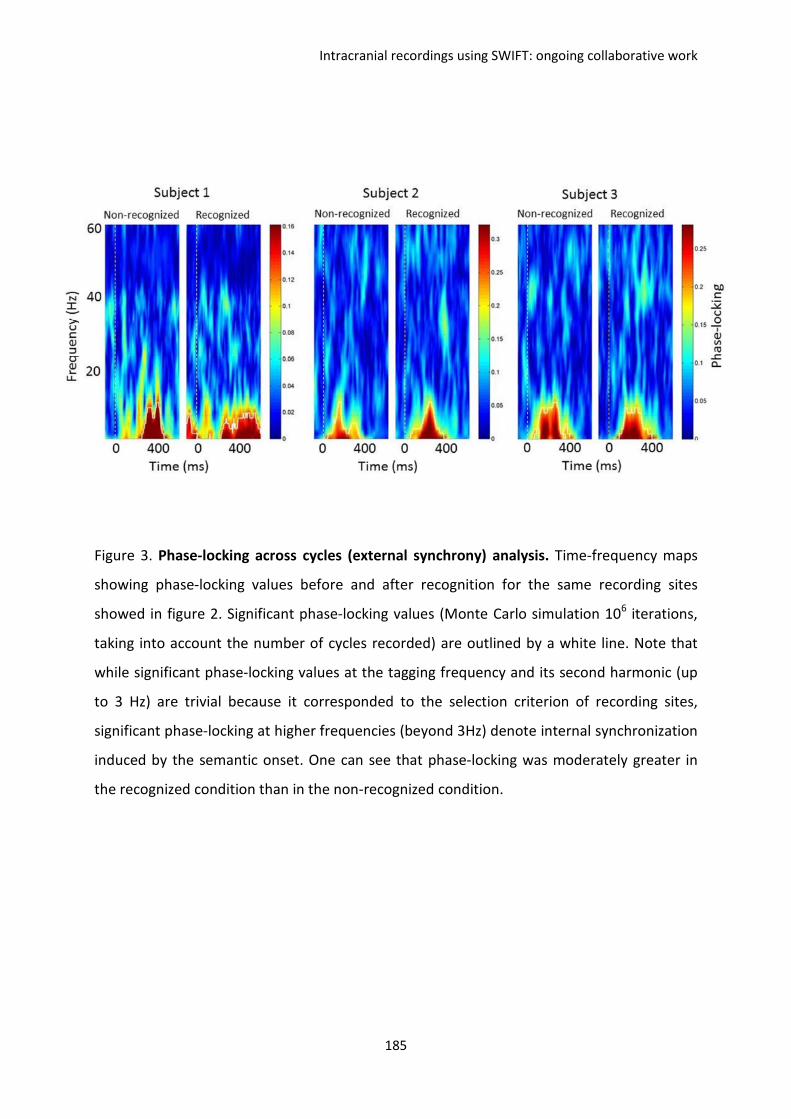
Intracranial recordings using SWIFT: ongoing collaborative work
185
Figure 3. Phase-locking across cycles (external synchrony) analysis. Time-frequency maps
showing phase-locking values before and after recognition for the same recording sites
showed in figure 2. Significant phase-locking values (Monte Carlo simulation 106 iterations,
taking into account the number of cycles recorded) are outlined by a white line. Note that
while significant phase-locking values at the tagging frequency and its second harmonic (up
to 3 Hz) are trivial because it corresponded to the selection criterion of recording sites,
significant phase-locking at higher frequencies (beyond 3Hz) denote internal synchronization
induced by the semantic onset. One can see that phase-locking was moderately greater in
the recognized condition than in the non-recognized condition.
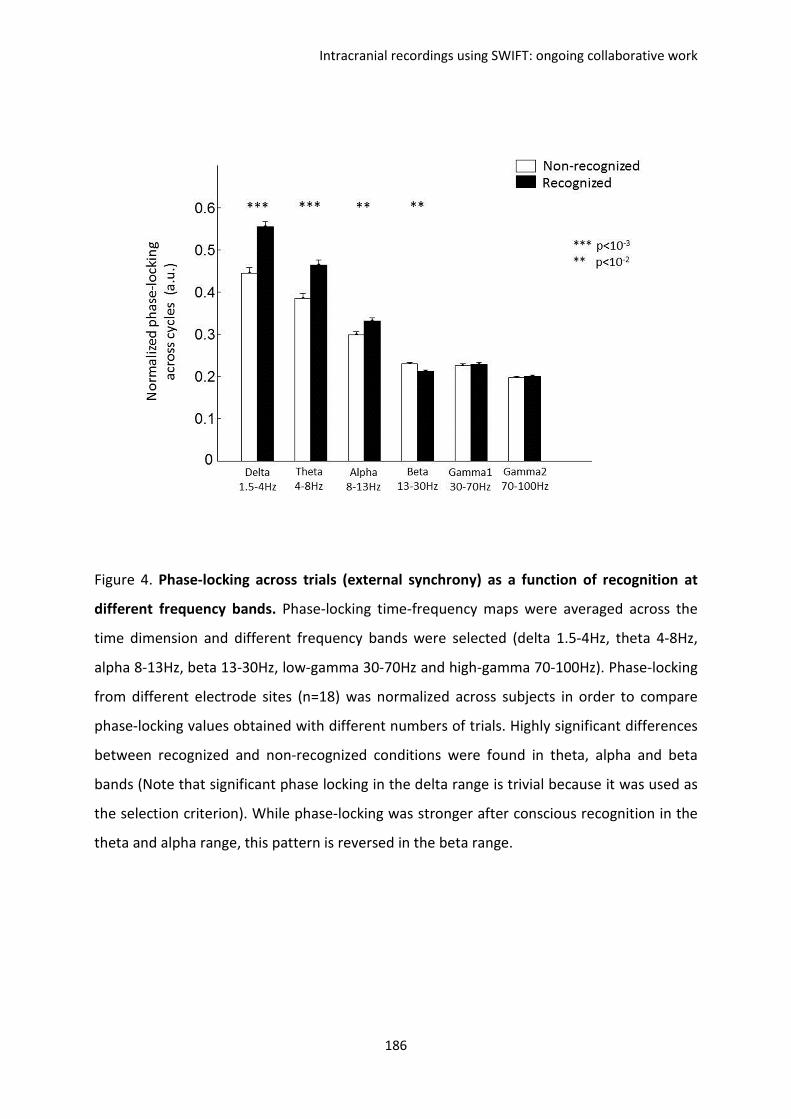
Intracranial recordings using SWIFT: ongoing collaborative work
186
Figure 4. Phase-locking across trials (external synchrony) as a function of recognition at
different frequency bands. Phase-locking time-frequency maps were averaged across the
time dimension and different frequency bands were selected (delta 1.5-4Hz, theta 4-8Hz,
alpha 8-13Hz, beta 13-30Hz, low-gamma 30-70Hz and high-gamma 70-100Hz). Phase-locking
from different electrode sites (n=18) was normalized across subjects in order to compare
phase-locking values obtained with different numbers of trials. Highly significant differences
between recognized and non-recognized conditions were found in theta, alpha and beta
bands (Note that significant phase locking in the delta range is trivial because it was used as
the selection criterion). While phase-locking was stronger after conscious recognition in the
theta and alpha range, this pattern is reversed in the beta range.
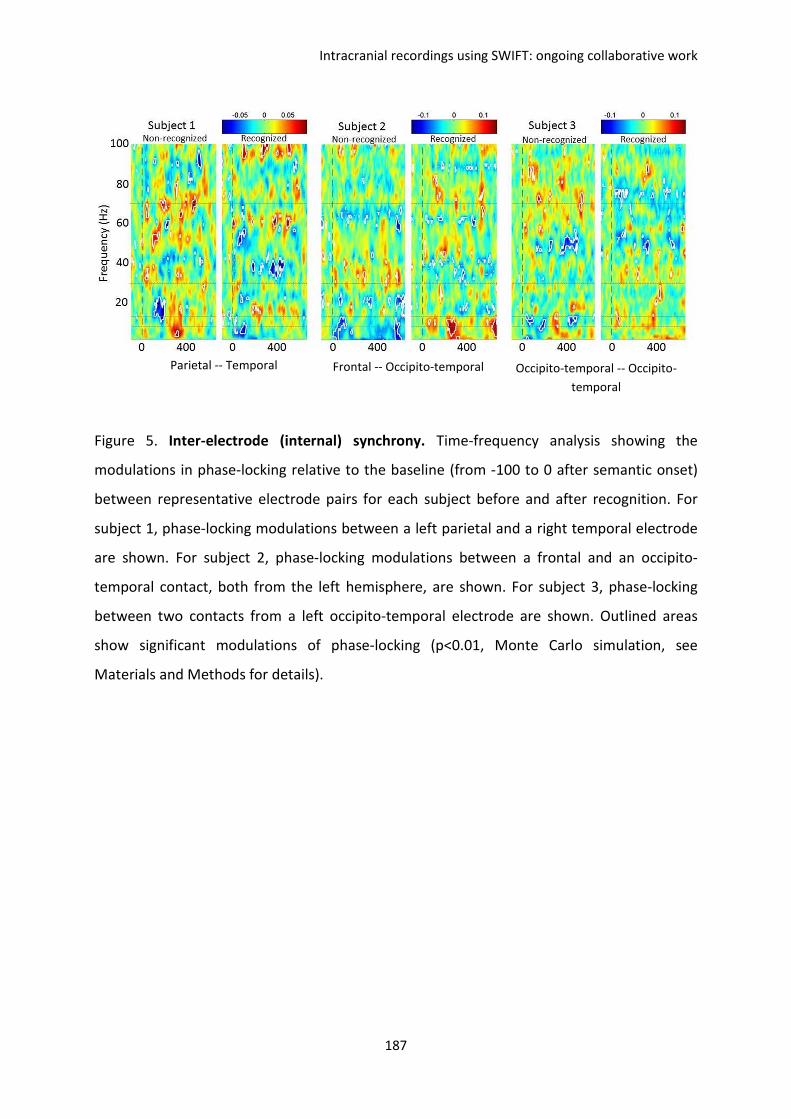
Intracranial recordings using SWIFT: ongoing collaborative work
187
Figure 5. Inter-electrode (internal) synchrony. Time-frequency analysis showing the
modulations in phase-locking relative to the baseline (from -100 to 0 after semantic onset)
between representative electrode pairs for each subject before and after recognition. For
subject 1, phase-locking modulations between a left parietal and a right temporal electrode
are shown. For subject 2, phase-locking modulations between a frontal and an occipito-
temporal contact, both from the left hemisphere, are shown. For subject 3, phase-locking
between two contacts from a left occipito-temporal electrode are shown. Outlined areas
show significant modulations of phase-locking (p<0.01, Monte Carlo simulation, see
Materials and Methods for details).
Parietal -- Temporal Frontal -- Occipito-temporal Occipito-temporal -- Occipito-
temporal
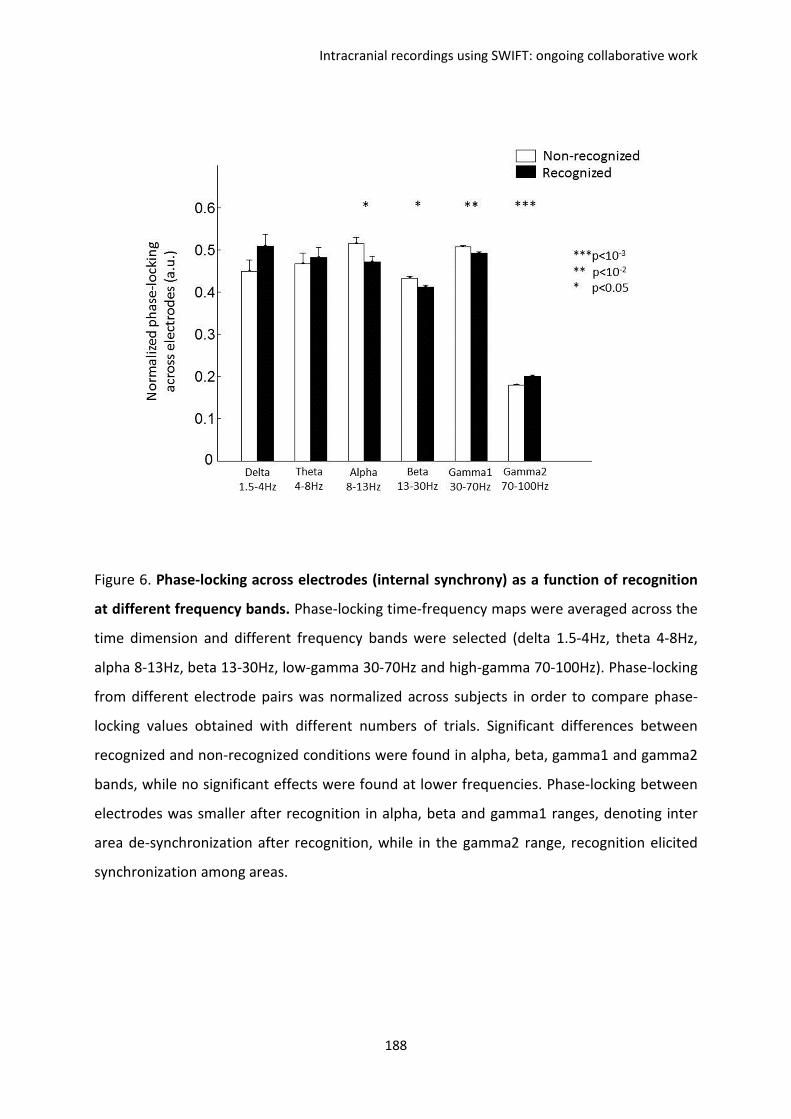
Intracranial recordings using SWIFT: ongoing collaborative work
188
Figure 6. Phase-locking across electrodes (internal synchrony) as a function of recognition
at different frequency bands. Phase-locking time-frequency maps were averaged across the
time dimension and different frequency bands were selected (delta 1.5-4Hz, theta 4-8Hz,
alpha 8-13Hz, beta 13-30Hz, low-gamma 30-70Hz and high-gamma 70-100Hz). Phase-locking
from different electrode pairs was normalized across subjects in order to compare phase-
locking values obtained with different numbers of trials. Significant differences between
recognized and non-recognized conditions were found in alpha, beta, gamma1 and gamma2
bands, while no significant effects were found at lower frequencies. Phase-locking between
electrodes was smaller after recognition in alpha, beta and gamma1 ranges, denoting inter
area de-synchronization after recognition, while in the gamma2 range, recognition elicited
synchronization among areas.

Intracranial recordings using SWIFT: ongoing collaborative work
189
II. REPORT 2. Koenig-Robert, Collet, Fize & VanRullen.
Intracranial recordings using SWIFT: ongoing collaborative work
190
All-or-none feedback activity as a correlate of conscious object recognition revealed by
SWIFT in monkey ventral visual areas.
Roger Koenig-Robert, Anne-Claire Collet, Denis Fize and Rufin VanRullen
Recurring activity in visual areas has been argued to have an essential role in conscious
object recognition. However, this has been hard to prove, mainly due to the difficulty in
dissociating low-level feature extraction from the actual object recognition activity. We
used an innovative technique called semantic wavelet-induced frequency-tagging (SWIFT),
where cyclic wavelet-scrambling allowed us to isolate neural correlates of the semantic
extraction from low-level feature processing of the image. Electrocorticogram (ECoG)
electrodes placed intracranially over ventral visual areas from V2 to TEO allowed us to
record neural activity with both high temporal and spatial resolution. One macaque
monkey was trained to perform an animal/non-animal categorization task. In each trial a
SWIFT sequence containing either a target (an animal) or a distractor (a landscape, object
or meaningless texture) was presented. The monkey reported the presence or absence of
a target by a go or no-go manual response respectively. In each session, one third of the
trials corresponded to new images, making the task quite challenging (64% correct
responses on targets). Event-related potential (ERP) analysis of local sources revealed that
correctly recognized targets elicited two ERP components in ventral visual areas. A first
positive (P1) component, representing the feedforward sweep, peaked between 100 and
200 ms; while a second positive (P2) component, representing recurring reactivation,
appeared from 200 ms after the semantic onset. The P1 component was present whether
the target was recognized or not and its amplitude was modulated by stimulus category
(low amplitude for meaningless texture distractors, medium amplitude for object
distractors and high amplitude for animal targets). On the other hand, the P2 component
was only present when the target was recognized, but totally absent otherwise (either
Intracranial recordings using SWIFT: ongoing collaborative work
191
when the target was not recognized, or when a distractor was presented); we controlled
that this component was not related to motor response. Thus, P2 was modulated in an all-
or-none fashion by conscious target recognition. Importantly, the same P2 modulation was
observed when comparing responses to the same image before and after the monkey
learned to recognize it as a target, demonstrating that the P2 component is a specific
feature related to conscious target recognition. By using SWIFT we were thus able to
demonstrate that recurring reactivation of visual areas is necessary for conscious object
recognition, a key prediction of the Global Neuronal Workspace model.
Methods
Stimuli generation. We used an innovative technique called SWIFT: semantic wavelet-
induced frequency-tagging, which uses manipulations in the wavelet domain to create a
movie from a single natural image (Koenig-Robert & VanRullen, submitted). Each frame of
the movie equalizes low-level properties of the natural image while modulating its high- and
mid-level information content cyclically at a fixed temporal frequency, called the tagging
frequency. As a result, visual processing mechanisms that are sensitive to the low-level
properties should be equally engaged by all frames of the movie, exhibiting a flat response
during the presentation. On the other hand, the higher-level mechanisms responsible for
extracting semantic information would come into play periodically around the onset of the
original image. By analyzing changes of the neural activity at the tagging frequency it is thus
possible to isolate activities supporting high-level visual representations. Details of the
stimulus construction are explained elsewhere (Koenig-Robert & VanRullen, submitted).
Briefly, SWIFT movies were created by cyclic wavelet scrambling in the wavelets multi-scale
domain. At each location and scale, local image contours were represented by a 3D vector in
the wavelets space, with the 3 dimensions representing the strengths of horizontal, vertical
and diagonal orientations. For each location and scale, two new vectors with random
orientations but the same length were defined. The unique isoenergetic circular path
Intracranial recordings using SWIFT: ongoing collaborative work
192
described by the 3 vectors was used to modulate local contour orientation cyclically, thus
obtaining different wavelet-scrambled versions of the image, while conserving low-level
properties (local luminance, contrast and spatial frequency) across frames.
Behavioral task. One male rhesus monkey (Maccaca mulata, aged 19 years, 12 Kg) was used
in this study. The animal was an expert in fast animal/non-animal categorization task on
natural images. The monkey was trained to perform a go/no-go task to categorize briefly
flashed natural scene pictures as containing (or not containing) animals. The animal gave its
response by touching the screen as fast as possible (go response) when a target (i.e., an
animal picture) was showed, while ignoring the stimuli when they contained a distractor (no-
go response). A total of 10 training sessions were necessary in order to adapt the monkey to
respond on SWIFT movies and to lengthen trials in order to present up to 3 SWIFT
modulations cycles within a trial. On these sessions, familiar stimuli used in previous
experiments were presented either as a steady image or modulated under SWIFT. During the
training sessions, we lengthened the trials from 100 to 2400 ms while increasing the
percentage of SWIFT trials from 0 to 100%. In the experimental sessions (n=21), each trial
consisted in the presentation of a SWIFT movie modulated at 1.4894 Hz during 2400 ms.
Target trials consisted in SWIFT movies containing an animal natural image (50% of trials)
and distractor trials could contain either a landscape or a manmade object image (25% of
trials) or an abstract texture (25% of trials). The monkey could give its response anytime
during the trial. Correct responses (go-responses to animals or no-go responses to
distractors), were rewarded by juice or water drops which were provided at the end of the
trial. Incorrect responses (no-go responses to animal or go responses to distractors) were
punished by showing the steady image during 1.5 seconds. In each session 60 different
SWIFT movies were shown. Twenty of them corresponded to new stimuli, 20 to recent ones
(i.e., showed in another session) and 20 to familiar ones (well-known stimuli used in the
training sessions). Each one of these images was presented repeatedly during each session,
in a semi-random manner. Each session started with 20 trials of familiar stimuli, followed by
600 trials in which new, recent and familiar stimuli were equally represented. In case the
monkey performed more than 620 trials, familiar stimuli were shown. In each session, the
monkey performed from 300 to 1000 trials (mean ~400 trials), during about 1 hour. All
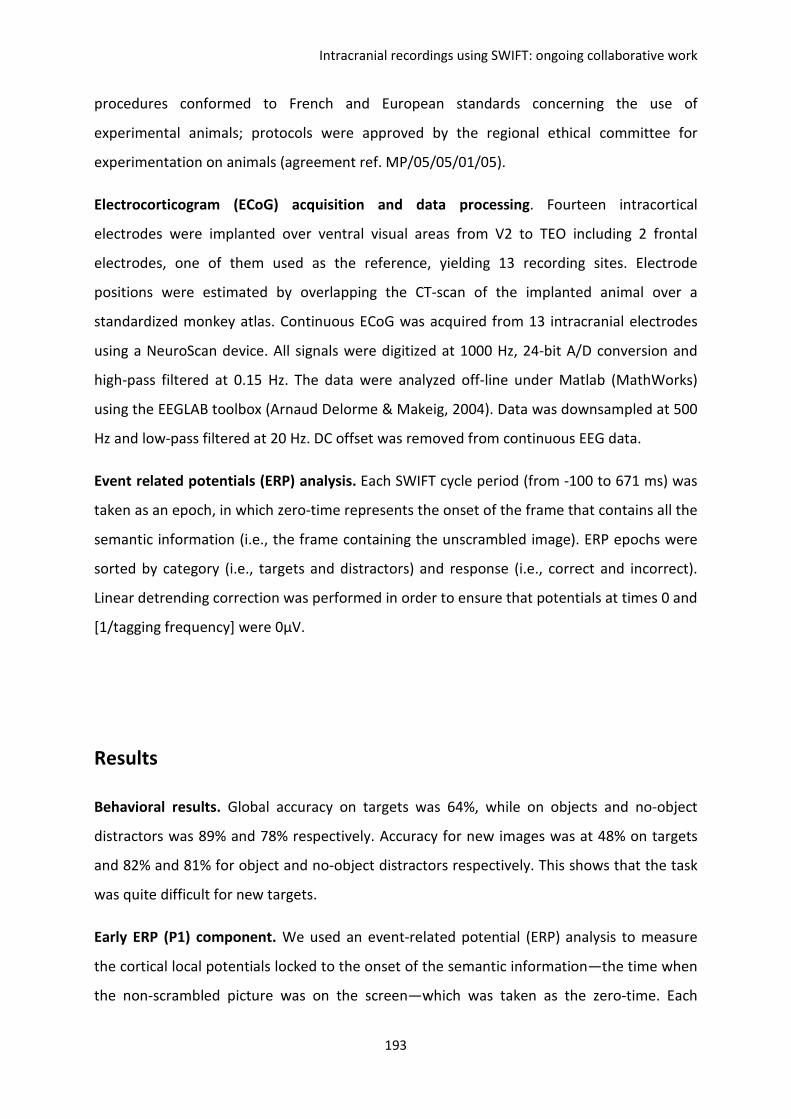
Intracranial recordings using SWIFT: ongoing collaborative work
193
procedures conformed to French and European standards concerning the use of
experimental animals; protocols were approved by the regional ethical committee for
experimentation on animals (agreement ref. MP/05/05/01/05).
Electrocorticogram (ECoG) acquisition and data processing. Fourteen intracortical
electrodes were implanted over ventral visual areas from V2 to TEO including 2 frontal
electrodes, one of them used as the reference, yielding 13 recording sites. Electrode
positions were estimated by overlapping the CT-scan of the implanted animal over a
standardized monkey atlas. Continuous ECoG was acquired from 13 intracranial electrodes
using a NeuroScan device. All signals were digitized at 1000 Hz, 24-bit A/D conversion and
high-pass filtered at 0.15 Hz. The data were analyzed off-line under Matlab (MathWorks)
using the EEGLAB toolbox (Arnaud Delorme & Makeig, 2004). Data was downsampled at 500
Hz and low-pass filtered at 20 Hz. DC offset was removed from continuous EEG data.
Event related potentials (ERP) analysis. Each SWIFT cycle period (from -100 to 671 ms) was
taken as an epoch, in which zero-time represents the onset of the frame that contains all the
semantic information (i.e., the frame containing the unscrambled image). ERP epochs were
sorted by category (i.e., targets and distractors) and response (i.e., correct and incorrect).
Linear detrending correction was performed in order to ensure that potentials at times 0 and
[1/tagging frequency] were 0µV.
Results
Behavioral results. Global accuracy on targets was 64%, while on objects and no-object
distractors was 89% and 78% respectively. Accuracy for new images was at 48% on targets
and 82% and 81% for object and no-object distractors respectively. This shows that the task
was quite difficult for new targets.
Early ERP (P1) component. We used an event-related potential (ERP) analysis to measure
the cortical local potentials locked to the onset of the semantic information—the time when
the non-scrambled picture was on the screen—which was taken as the zero-time. Each
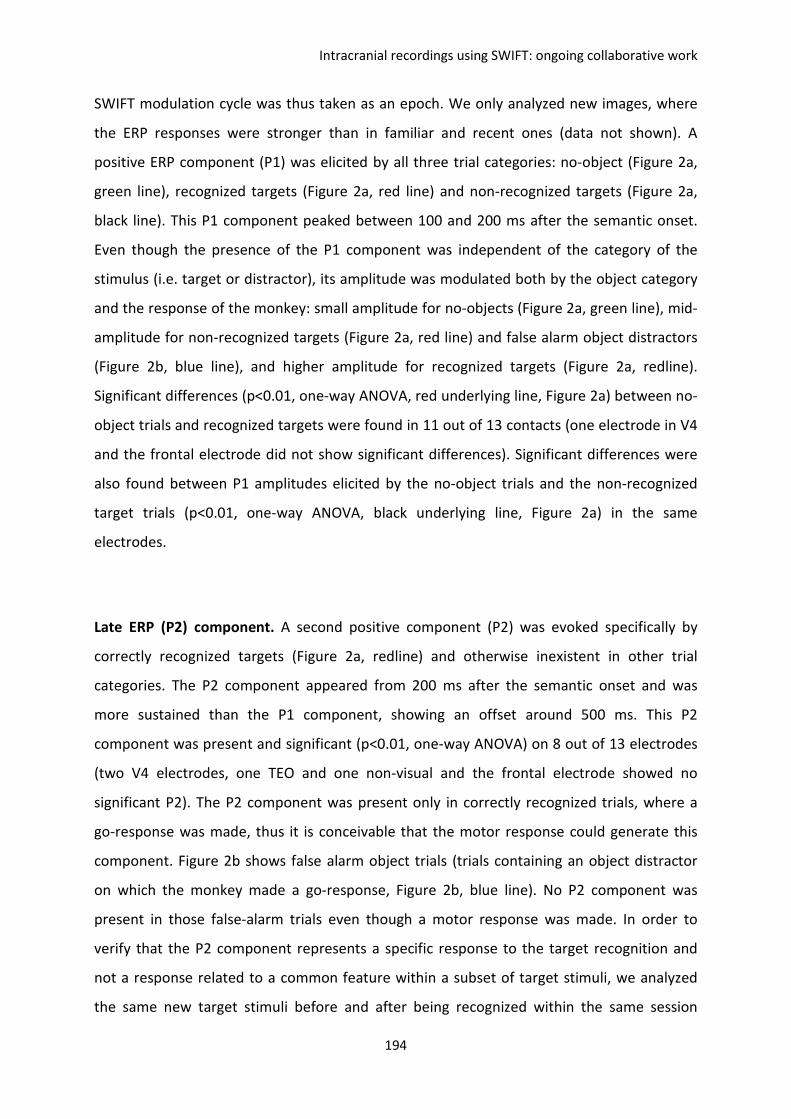
Intracranial recordings using SWIFT: ongoing collaborative work
194
SWIFT modulation cycle was thus taken as an epoch. We only analyzed new images, where
the ERP responses were stronger than in familiar and recent ones (data not shown). A
positive ERP component (P1) was elicited by all three trial categories: no-object (Figure 2a,
green line), recognized targets (Figure 2a, red line) and non-recognized targets (Figure 2a,
black line). This P1 component peaked between 100 and 200 ms after the semantic onset.
Even though the presence of the P1 component was independent of the category of the
stimulus (i.e. target or distractor), its amplitude was modulated both by the object category
and the response of the monkey: small amplitude for no-objects (Figure 2a, green line), mid-
amplitude for non-recognized targets (Figure 2a, red line) and false alarm object distractors
(Figure 2b, blue line), and higher amplitude for recognized targets (Figure 2a, redline).
Significant differences (p<0.01, one-way ANOVA, red underlying line, Figure 2a) between no-
object trials and recognized targets were found in 11 out of 13 contacts (one electrode in V4
and the frontal electrode did not show significant differences). Significant differences were
also found between P1 amplitudes elicited by the no-object trials and the non-recognized
target trials (p<0.01, one-way ANOVA, black underlying line, Figure 2a) in the same
electrodes.
Late ERP (P2) component. A second positive component (P2) was evoked specifically by
correctly recognized targets (Figure 2a, redline) and otherwise inexistent in other trial
categories. The P2 component appeared from 200 ms after the semantic onset and was
more sustained than the P1 component, showing an offset around 500 ms. This P2
component was present and significant (p<0.01, one-way ANOVA) on 8 out of 13 electrodes
(two V4 electrodes, one TEO and one non-visual and the frontal electrode showed no
significant P2). The P2 component was present only in correctly recognized trials, where a
go-response was made, thus it is conceivable that the motor response could generate this
component. Figure 2b shows false alarm object trials (trials containing an object distractor
on which the monkey made a go-response, Figure 2b, blue line). No P2 component was
present in those false-alarm trials even though a motor response was made. In order to
verify that the P2 component represents a specific response to the target recognition and
not a response related to a common feature within a subset of target stimuli, we analyzed
the same new target stimuli before and after being recognized within the same session
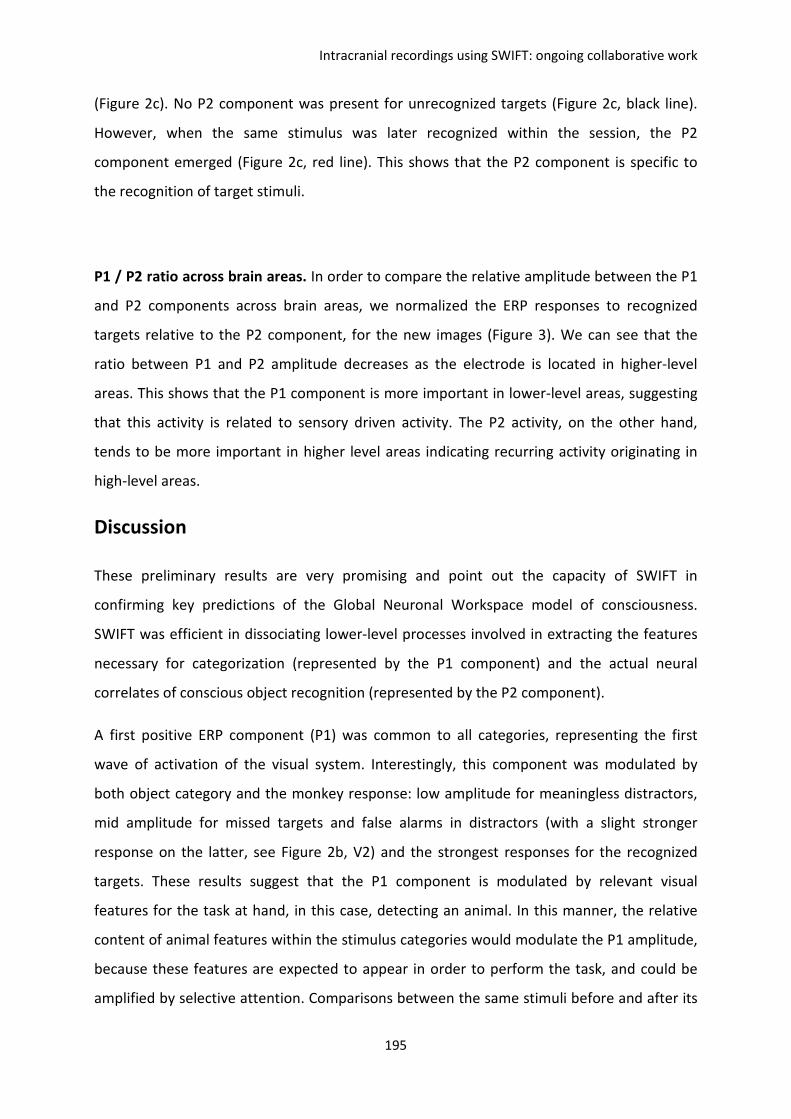
Intracranial recordings using SWIFT: ongoing collaborative work
195
(Figure 2c). No P2 component was present for unrecognized targets (Figure 2c, black line).
However, when the same stimulus was later recognized within the session, the P2
component emerged (Figure 2c, red line). This shows that the P2 component is specific to
the recognition of target stimuli.
P1 / P2 ratio across brain areas. In order to compare the relative amplitude between the P1
and P2 components across brain areas, we normalized the ERP responses to recognized
targets relative to the P2 component, for the new images (Figure 3). We can see that the
ratio between P1 and P2 amplitude decreases as the electrode is located in higher-level
areas. This shows that the P1 component is more important in lower-level areas, suggesting
that this activity is related to sensory driven activity. The P2 activity, on the other hand,
tends to be more important in higher level areas indicating recurring activity originating in
high-level areas.
Discussion
These preliminary results are very promising and point out the capacity of SWIFT in
confirming key predictions of the Global Neuronal Workspace model of consciousness.
SWIFT was efficient in dissociating lower-level processes involved in extracting the features
necessary for categorization (represented by the P1 component) and the actual neural
correlates of conscious object recognition (represented by the P2 component).
A first positive ERP component (P1) was common to all categories, representing the first
wave of activation of the visual system. Interestingly, this component was modulated by
both object category and the monkey response: low amplitude for meaningless distractors,
mid amplitude for missed targets and false alarms in distractors (with a slight stronger
response on the latter, see Figure 2b, V2) and the strongest responses for the recognized
targets. These results suggest that the P1 component is modulated by relevant visual
features for the task at hand, in this case, detecting an animal. In this manner, the relative
content of animal features within the stimulus categories would modulate the P1 amplitude,
because these features are expected to appear in order to perform the task, and could be
amplified by selective attention. Comparisons between the same stimuli before and after its
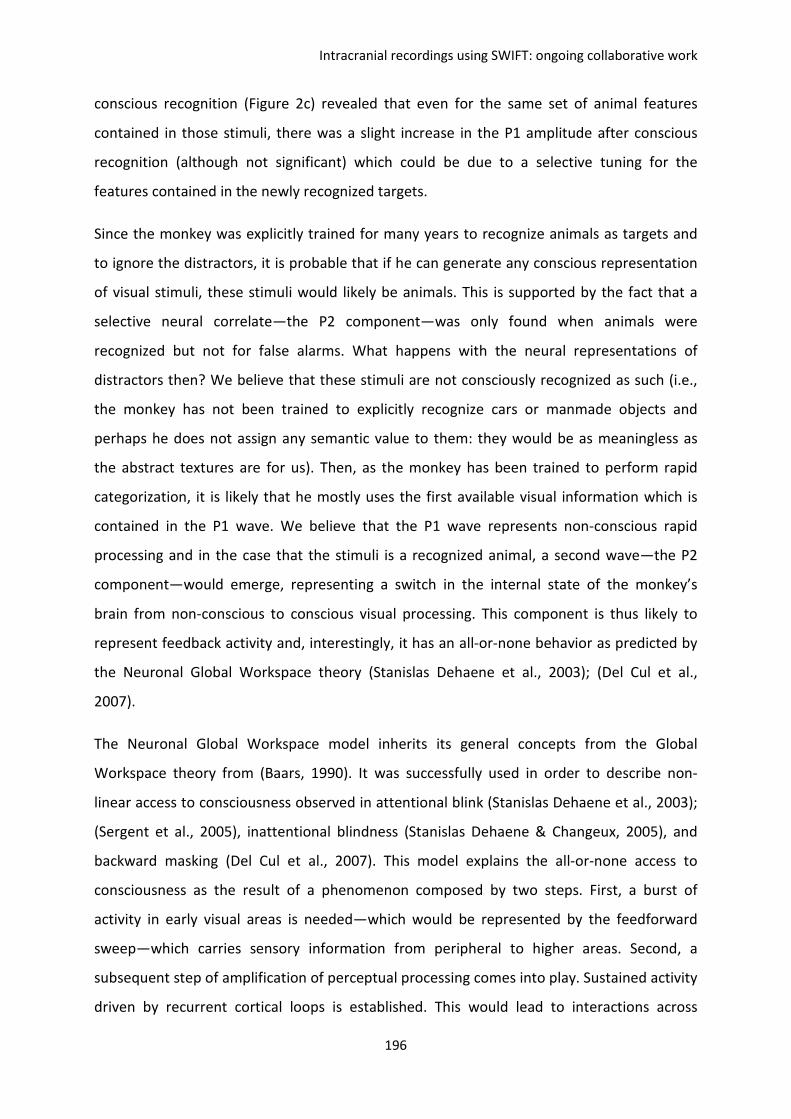
Intracranial recordings using SWIFT: ongoing collaborative work
196
conscious recognition (Figure 2c) revealed that even for the same set of animal features
contained in those stimuli, there was a slight increase in the P1 amplitude after conscious
recognition (although not significant) which could be due to a selective tuning for the
features contained in the newly recognized targets.
Since the monkey was explicitly trained for many years to recognize animals as targets and
to ignore the distractors, it is probable that if he can generate any conscious representation
of visual stimuli, these stimuli would likely be animals. This is supported by the fact that a
selective neural correlate—the P2 component—was only found when animals were
recognized but not for false alarms. What happens with the neural representations of
distractors then? We believe that these stimuli are not consciously recognized as such (i.e.,
the monkey has not been trained to explicitly recognize cars or manmade objects and
perhaps he does not assign any semantic value to them: they would be as meaningless as
the abstract textures are for us). Then, as the monkey has been trained to perform rapid
categorization, it is likely that he mostly uses the first available visual information which is
contained in the P1 wave. We believe that the P1 wave represents non-conscious rapid
processing and in the case that the stimuli is a recognized animal, a second wave—the P2
component—would emerge, representing a switch in the internal state of the monkey’s
brain from non-conscious to conscious visual processing. This component is thus likely to
represent feedback activity and, interestingly, it has an all-or-none behavior as predicted by
the Neuronal Global Workspace theory (Stanislas Dehaene et al., 2003); (Del Cul et al.,
2007).
The Neuronal Global Workspace model inherits its general concepts from the Global
Workspace theory from (Baars, 1990). It was successfully used in order to describe non-
linear access to consciousness observed in attentional blink (Stanislas Dehaene et al., 2003);
(Sergent et al., 2005), inattentional blindness (Stanislas Dehaene & Changeux, 2005), and
backward masking (Del Cul et al., 2007). This model explains the all-or-none access to
consciousness as the result of a phenomenon composed by two steps. First, a burst of
activity in early visual areas is needed—which would be represented by the feedforward
sweep—which carries sensory information from peripheral to higher areas. Second, a
subsequent step of amplification of perceptual processing comes into play. Sustained activity
driven by recurrent cortical loops is established. This would lead to interactions across
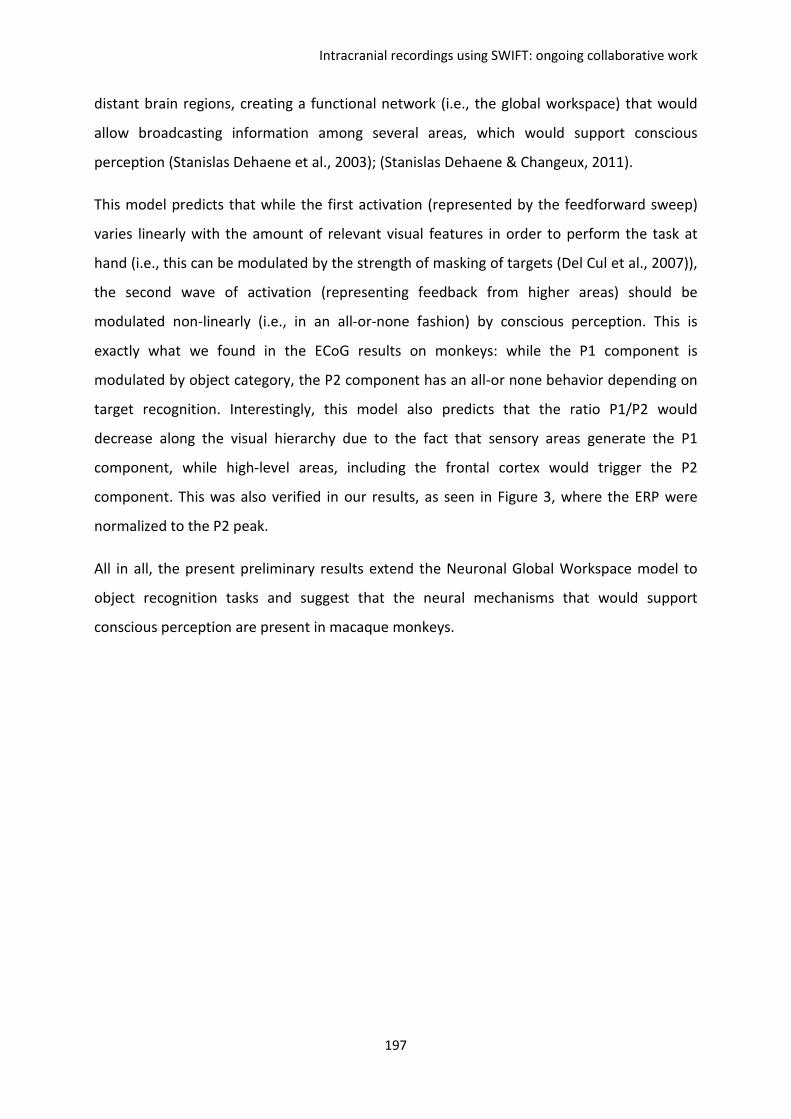
Intracranial recordings using SWIFT: ongoing collaborative work
197
distant brain regions, creating a functional network (i.e., the global workspace) that would
allow broadcasting information among several areas, which would support conscious
perception (Stanislas Dehaene et al., 2003); (Stanislas Dehaene & Changeux, 2011).
This model predicts that while the first activation (represented by the feedforward sweep)
varies linearly with the amount of relevant visual features in order to perform the task at
hand (i.e., this can be modulated by the strength of masking of targets (Del Cul et al., 2007)),
the second wave of activation (representing feedback from higher areas) should be
modulated non-linearly (i.e., in an all-or-none fashion) by conscious perception. This is
exactly what we found in the ECoG results on monkeys: while the P1 component is
modulated by object category, the P2 component has an all-or none behavior depending on
target recognition. Interestingly, this model also predicts that the ratio P1/P2 would
decrease along the visual hierarchy due to the fact that sensory areas generate the P1
component, while high-level areas, including the frontal cortex would trigger the P2
component. This was also verified in our results, as seen in Figure 3, where the ERP were
normalized to the P2 peak.
All in all, the present preliminary results extend the Neuronal Global Workspace model to
object recognition tasks and suggest that the neural mechanisms that would support
conscious perception are present in macaque monkeys.
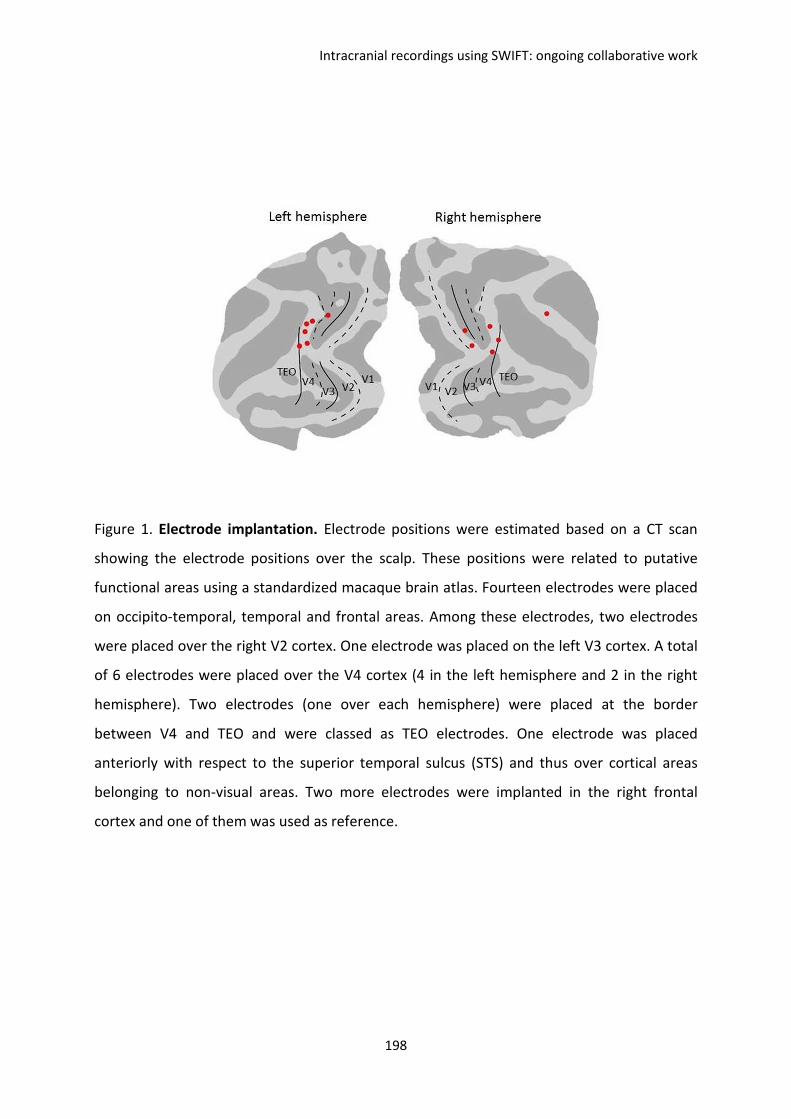
Intracranial recordings using SWIFT: ongoing collaborative work
198
Figure 1. Electrode implantation. Electrode positions were estimated based on a CT scan
showing the electrode positions over the scalp. These positions were related to putative
functional areas using a standardized macaque brain atlas. Fourteen electrodes were placed
on occipito-temporal, temporal and frontal areas. Among these electrodes, two electrodes
were placed over the right V2 cortex. One electrode was placed on the left V3 cortex. A total
of 6 electrodes were placed over the V4 cortex (4 in the left hemisphere and 2 in the right
hemisphere). Two electrodes (one over each hemisphere) were placed at the border
between V4 and TEO and were classed as TEO electrodes. One electrode was placed
anteriorly with respect to the superior temporal sulcus (STS) and thus over cortical areas
belonging to non-visual areas. Two more electrodes were implanted in the right frontal
cortex and one of them was used as reference.
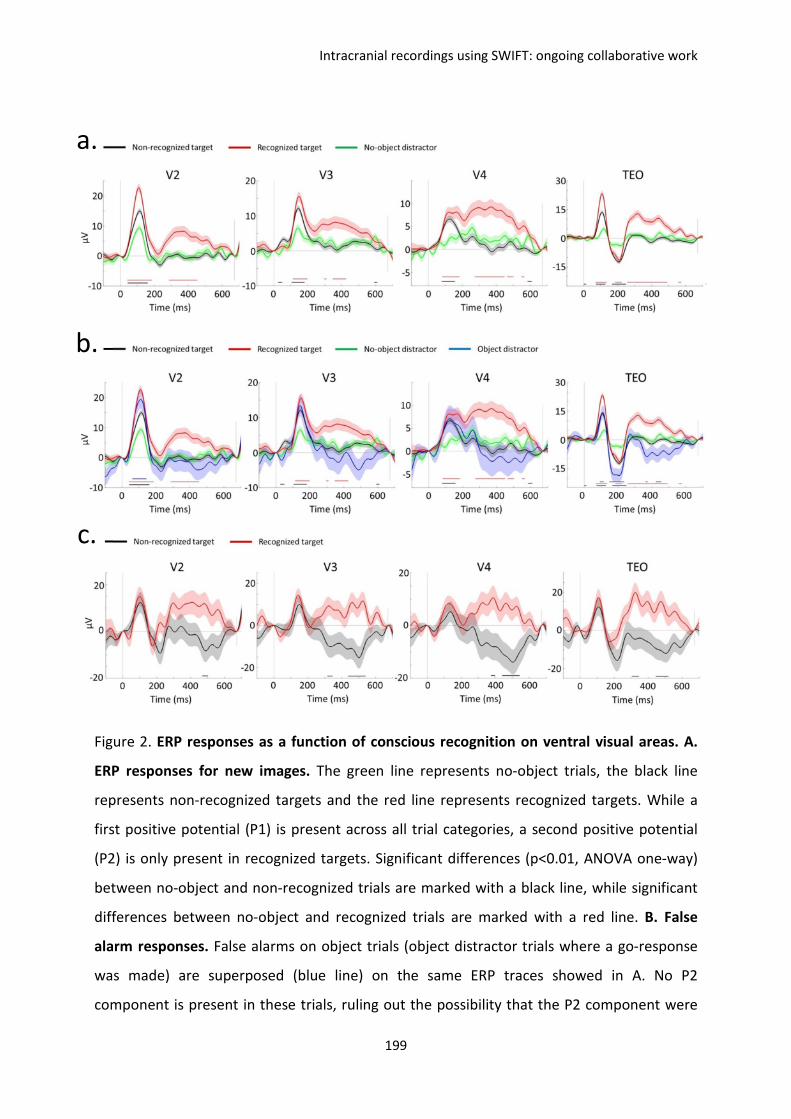
Intracranial recordings using SWIFT: ongoing collaborative work
199
Figure 2. ERP responses as a function of conscious recognition on ventral visual areas. A.
ERP responses for new images. The green line represents no-object trials, the black line
represents non-recognized targets and the red line represents recognized targets. While a
first positive potential (P1) is present across all trial categories, a second positive potential
(P2) is only present in recognized targets. Significant differences (p<0.01, ANOVA one-way)
between no-object and non-recognized trials are marked with a black line, while significant
differences between no-object and recognized trials are marked with a red line. B. False
alarm responses. False alarms on object trials (object distractor trials where a go-response
was made) are superposed (blue line) on the same ERP traces showed in A. No P2
component is present in these trials, ruling out the possibility that the P2 component were
a.
b.
c.
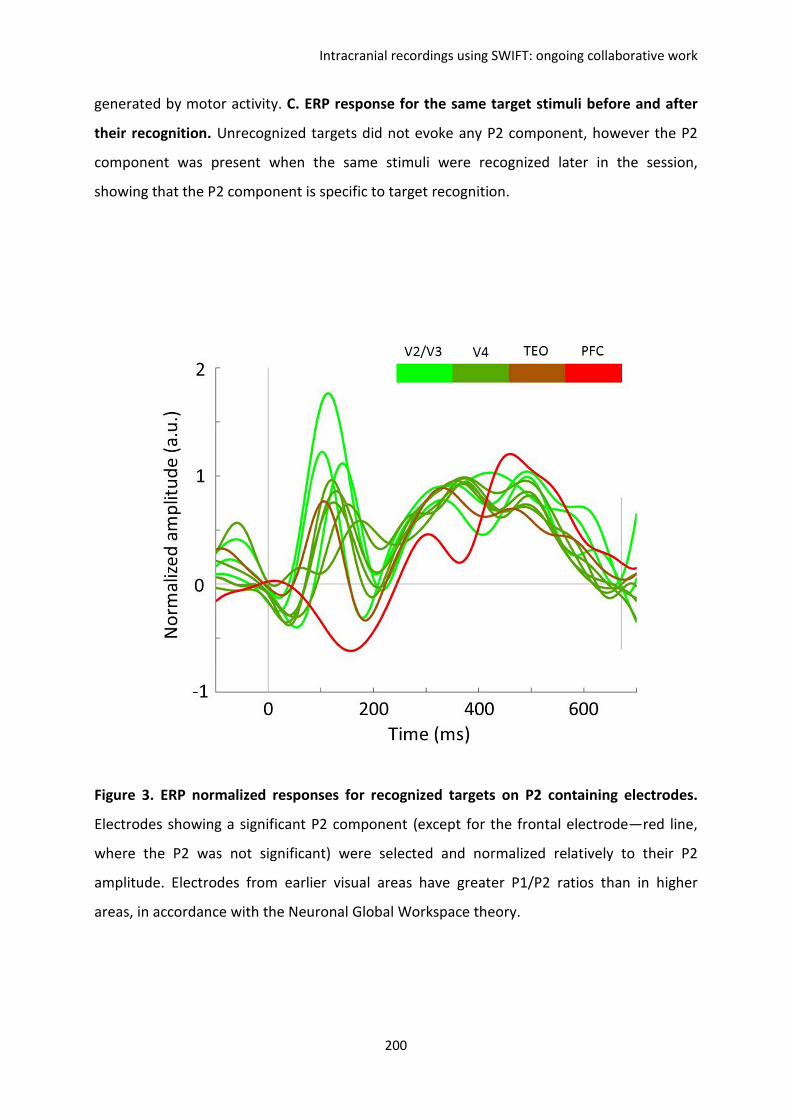
Intracranial recordings using SWIFT: ongoing collaborative work
200
generated by motor activity. C. ERP response for the same target stimuli before and after
their recognition. Unrecognized targets did not evoke any P2 component, however the P2
component was present when the same stimuli were recognized later in the session,
showing that the P2 component is specific to target recognition.
Figure 3. ERP normalized responses for recognized targets on P2 containing electrodes.
Electrodes showing a significant P2 component (except for the frontal electrode—red line,
where the P2 was not significant) were selected and normalized relatively to their P2
amplitude. Electrodes from earlier visual areas have greater P1/P2 ratios than in higher
areas, in accordance with the Neuronal Global Workspace theory.

Intracranial recordings using SWIFT: ongoing collaborative work
201
General discussion
202
G. General discussion
I. Recapitulation
We have explored the visual system from categories to awareness. We presented six
different works in which diverse questions were addressed at different levels of the visual
system, using two different models: monkeys and humans and using both behavior and
neural activity recordings (Figure 28). Along this quest, we found answers to the
abovementioned questions which represent new contributions to the field (Figure 28). We
will recapitulate the most significant conclusions derived from the presented works.
In the first work, we addressed the question of whether ultra-rapid categorization can be
performed efficiently for both monkeys and humans when the low-level attributes of the
image (namely the Fourier amplitude spectrum) are equalized across categories. We used a
saccadic choice task in both monkeys and humans. We found that the fastest reaction times
were practically unaltered when compared with other studies were no equalization was
used (Girard et al., 2008; Kirchner & Thorpe, 2006). However, taking in to account the global
performance, hit rates were significantly degraded for equalized images when compared
with studies using intact images. This is explained by the degraded aspect of equalized
images and also by the choice of difficult distractor images. Interestingly, in a second
experiment we correlated the performance in categorizing a given image with its quality of
being recognizable when only its low-frequency spectrum was preserved. This result suggest
that the spatial arrangement of low-frequencies in an image is an important feature used by
the visual system to perform ultra-rapid categorization, and also points out an involvement
of the magnocellular pathway in the processing of visual information.
In the second work we addressed the question of whether the spatial pattern of both
exogenous and endogenous spatial attention evolves across time in human subjects. We
used a detection task involving a unique cueing paradigm where the background contrast
was equalized in order to take into in account the effects of attention, with the aim of
creating detailed maps of the spatial deployment of attention as a function of time. We
General discussion
203
found that the spatiotemporal map of exogenous attention showed a significant
enhancement zone from 150 to 430 ms, extending up to 6° from the cue. For endogenous
spatial attention, a peak at the cued side at 400 ms and between 8 and 10° from the cue was
found in the spatiotemporal maps. The results from the spatiotemporal maps were well
explained by a model of null spatiotemporal interaction, suggesting that the spatial pattern
of attention deployment does not change across time and only modulates its amplitude.
In the third work we developed a new stimulation paradigm called SWIFT which equalizes
the low-level attributes of an image and modulates its sematic content cyclically. Using this
paradigm, we explored its possibilities in tracking high-level visual representations in human
subjects. SWIFT was developed using an approach involving image scrambling in the
wavelets-domain in combination with frequency-tagging. In a first experiment, using a
recognition task, we successfully isolated the neural correlates of conscious object
recognition with no need to apply subtractive approaches: non-recognized objects simply
did not evoke significant activities over centro-parietal electrodes. In a second experiment
we manipulated spatial attention deployed over frequency-tagged face pictures and
discovered that attentional effects were tracked more effectively by using SWIFT than with
the classic frequency-tagging approach. In a third experiment we tested the temporal limits
of SWIFT and we could conclude that a maximum of between 4 and 7 conscious object
representations can be produced by the visual system.
In the fourth work we addressed the question of whether, by using SWIFT, we can track
visual consciousness when it is modulated between all-or-none states (i.e., between visibility
and invisibility). In order to do so, we used the binocular rivalry paradigm in combination
with SWIFT in human subjects. We found that frequency-tagged signals evoked by SWIFT
were modulated in an all-or-none fashion, just as their phenomenal counterpart. This
represents the first time that conscious related activity is isolated from global brain
activations. Using these ‘pure conscious’ signals we studied the properties of these signals. Is
activity supporting conscious states characterized by an augmentation of the signal
amplitude or are they better explained by an increase in synchrony? We found that an
increase in synchrony, specifically the temporal consistency of brain signals across
presentations, and not an increase in signal amplitude accounted for the conscious states.
General discussion
204
In the fifth work we reproduced the conscious recognition experiment using SWIFT on
patients implanted with intracranial electrodes which allows obtaining brain activity
recordings with both high spatial and high temporal resolution. We addressed the question
of how different types of synchrony support conscious object recognition in different
frequency bands. We found that brain activity in several regions of the visual cortex and
beyond significantly synchronize their activities with the stimulus presentation when an
object was recognized at the theta and alpha frequencies but a de-synchronization was
revealed at the beta frequency. When we studied the synchrony among brain areas, we
found that object recognition elicited a de-synchronization at the alpha, beta and low-
gamma frequencies, but an increase of synchrony was shown at high-gamma.
In the sixth work we addressed the question of whether the electrophysiological features of
object-recognition could be found in macaques. We adapted the recognition task for a
monkey trained in rapid animal/non-animal categorization. We found that feed-back activity
registered on electrodes of the ventral visual pathway was present only when targets were
correctly recognized. The ERP patterns effectively corresponded to the predictions from the
Neuronal Global Workspace model.
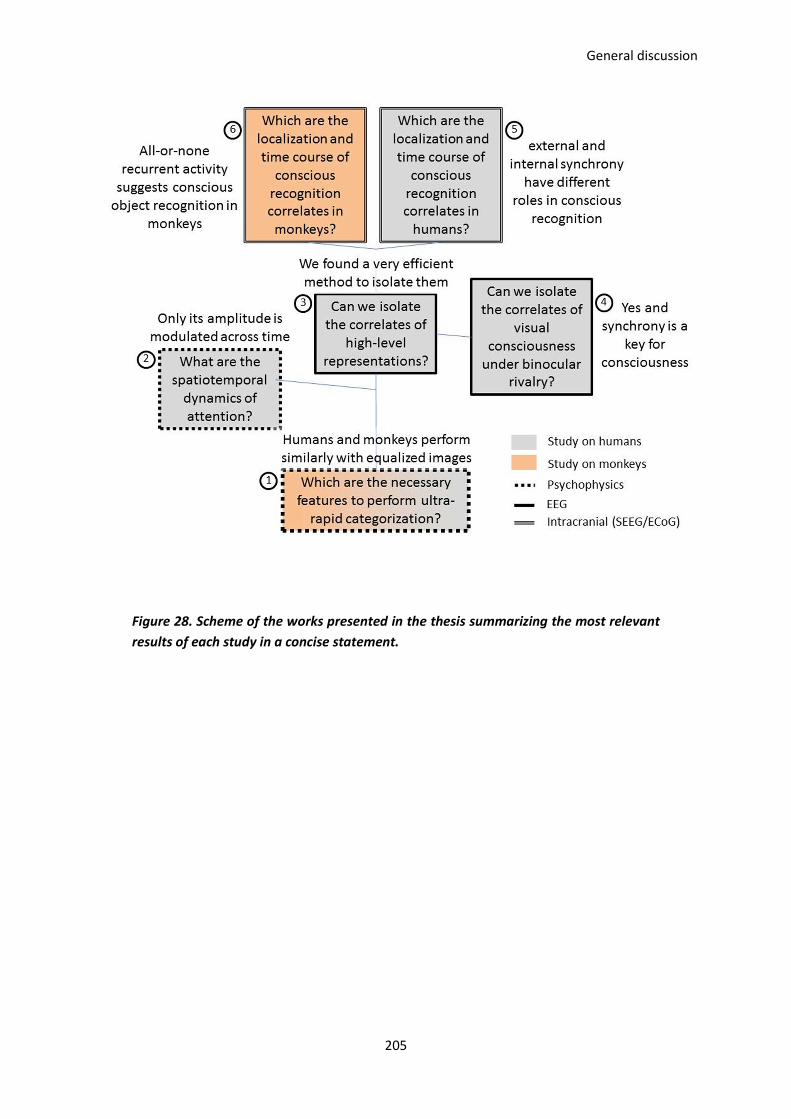
General discussion
205
Figure 28. Scheme of the works presented in the thesis summarizing the most relevant
results of each study in a concise statement.
General discussion
206
II. On the relationship between ultra-rapid categorization
and conscious object recognition
Ultra-rapid categorization corresponds to an extremely time-efficient mechanism allowing
rapidly exploiting the visual information in order to sort images according to arbitrary
semantic categories despite their physical differences. One widely accepted proposal is that
categorization can be performed on the basis of diagnostic features, without the need of
processing all visual information (Gosselin & Schyns, 2001 ; Ullman et al., 2002; Schyns,
Gosselin, & Smith, 2009; Wang et al. 2011). These features can be extracted and represented
explicitly in early stages of visual processing. In the specific case of faces, it was argued that
diagnostic information could potentially be extracted very early in the visual hierarchy,
possibly as early as V1 and V2 (Crouzet & Thorpe, 2011), being thus available within the first
stages of the feedforward sweep.
Our behavioral results in ultra-rapid categorization are compatible with a view where
incomplete representations of visual objects would suffice to perform rapid categorization.
However, our results showed that ultra-rapid categorization does not exclusively rely on the
mean Fourier spectrum. Even though performances decreased with amplitude-spectrum
equalized images, the minimum reaction time remained comparable with previous results
(100 ms for monkeys and 140 ms for humans). Based on a second experiment in which the
performance on a given image was correlated with its capacity of being recognized when
only its low-frequency content was presented, we conclude that the necessary features to
perform ultra-rapid categorization are likely to be included within this coarse version of the
images. All in all, these results are compatible with the idea that complete object
representations would not be necessary to perform ultra-rapid categorization and a coarse
summary of the relevant features contained (represented by the low-frequency information
contained in the image) would suffice to perform the task. However, these features would
be more complex than the mean frequency spectrum.
In the literature there are numerous reports suggesting that this process can be done with
little attention (Li et al., 2002) and non-consciously (Boucart et al., 2010), suggesting that
conscious recognition would be a further step in the visual processing. Our work in
General discussion
207
implanted macaques has suggested dissociations between visual categorization and
conscious object recognition. We have seen that categorization seems to depend on the first
positive component (P1) peaking between 50 and 150 ms and corresponding to the
feedforward sweep, which amplitude is modulated by the object category, while conscious
perception of the target seems to be associated with a second positive wave (P2). This P2
component represents recurrent activation on visual areas, said otherwise, a feedback
activation driven relatively later in the visual processing. This latter activation was
compatible with the P3 wave recorded in humans with EEG. Another piece of evidence
supporting the idea of the implication of the P2 in conscious recognition is represented by
the fact that the pattern of activation across ventral areas was compatible with the Neuronal
Global Workspace model which predicts non-linear dynamics in the activations supporting
conscious perception.
Thus I propose that rapid categorization processes represent a preliminary step in the path
leading to conscious object recognition. Rapid categorization would rely on incomplete
information of the scene, carried in the feedforward sweep, while conscious object
recognition would rely on global feedback reactivation of distributed brain areas that would
allow the interaction of different bits of visual information represented by different areas in
the visual pathway.
Our study revealed that the features used by humans and monkeys are quite similar,
suggesting that rapid visual categorical mechanisms would be conserved in evolution due to
their adaptive value. Ecologically, this process is important in order to react rapidly to
environmental threats. Rapid categorization is specially needed when the visual system
cannot wait to produce a conscious representation (which may be accessed tardily), in
situations where important behavioral decisions have to be triggered rapidly. Based on our
results it seems that conscious perception need a non-negligible amount of time (at least
200ms), and it thus seems to quite expensive in temporal terms. Perhaps the brain is quite
prepared to deal with sensorial information and prepare behavioral responses without any
conscious sensation. Due to the slow activation dynamics of consciousness, it may not
directly guide our behavior as often as we think and only would be used when is necessary.
General discussion
208
III. On the relationship between attention and conscious
object recognition
Even though the relationship between attention and consciousness is still highly debated
(see for instance Christof Koch & Tsuchiya, 2007; Boxtel et al., 2010), we do believe that
attention is necessary for conscious object recognition, although it is not equal to. This idea
is supported by our results in the first study using SWIFT, where we manipulated spatial
attention while showing frequency-tagged face images. In this experiment we showed two
frequency-tagged faces on each side of the screen and a central arrow indicated the face to
be attended. In a given trial the faces could be either frequency-tagged using SWIFT or
classic frequency-tagging. We thus compared the amount of tagging, represented by the
synchrony of brain signals with the onsets of the face—measured as phase-locking—and we
compared the amount of tagging elicited by distractors (the non-cued faces) and targets (the
cued faces). Besides the main finding—showing that the attentional effect was more
noticeable using SWIFT than classic frequency-tagging—we found that the amount of
tagging elicited by SWIFT distractors was not different (p>0.05) from baseline. If we consider
that SWIFT elicited signals correspond to conscious representations, this result means that
neural representations devoided of attention would fail to be included in the contents of
consciousness.
We propose that the role of attention on conscious recognition would be causal;
representing a prior step which is necessary for the activation of metastable resonant state
where fragmentary stimulus representations would interact transiently. This interaction
driven by attention would compel the possible set of feature conjunctions into a competitive
evaluation in a sort of ‘arena’ represented by initial states of a Neuronal Global Workspace-
like assembly. In the case that selective attention would select few features, the number of
possible conjunctions would be limited and evaluation of their relevance would be made
quickly, thus the winning feature conjunction would emerge rapidly. On the other hand, if
attention is distributed among several features (think on the case of subjects trying to make
General discussion
209
sense of our ambiguous SWIFT movies) the conjunction among features would be less likely
to match a meaningful internal representation.
Based on our preliminary results obtained in the epileptic implanted patients, we propose a
compatible model in which the activation of the metastable state by attention would by
driven by modulatory feedback inputs that would increase in transient inter-area
interactions at the beta and low-gamma frequency bands, which is compatible with the idea
of selective attention by selective synchrony (Womelsdorf et al., 2007). This inter-area
synchrony would be the neural correlate of the transient evaluation of the possible
configurations within the constitutive features. This metastable state would perish soon if no
stable assembly emerges, being thus promptly replaced by the next candidate assembly.
Stable assemblies would entrain long-distance interactions at high frequencies and
superfluous assemblies would perish.
IV. Comparing the study in binocular rivalry with the studies
on conscious object recognition
All studies using SWIFT using both EEG and intracranial recordings showed specific activities
that were only present in conscious states. Among all the consciousness-specific activities
revealed across different experiments, the dissociations found in the binocular rivalry
studies were among the clearest. This fact is easy to explain when considering the
experimental conditions used in that experiment (Figure 29). I will use an extremely
schematic framework to make this point. Let’s say that the visual system can produce
different levels of visual representations, as illustrated by the color bar in Figure 29. Let’s say
now that at some point of this hierarchy of different representations one can become
conscious, and this point thus defines a threshold of the access to consciousness. In this
manner, the visual representations below the threshold will remain devoid of any conscious
quality whatsoever (including its visibility); and visual representations above this threshold
can be associated with conscious experiences. In the conscious part we will distinguish
several levels of conscious representations. Just crossing the threshold of consciousness, the
very first level is represented by the capacity of a stimulus to be visible. Beyond this level a
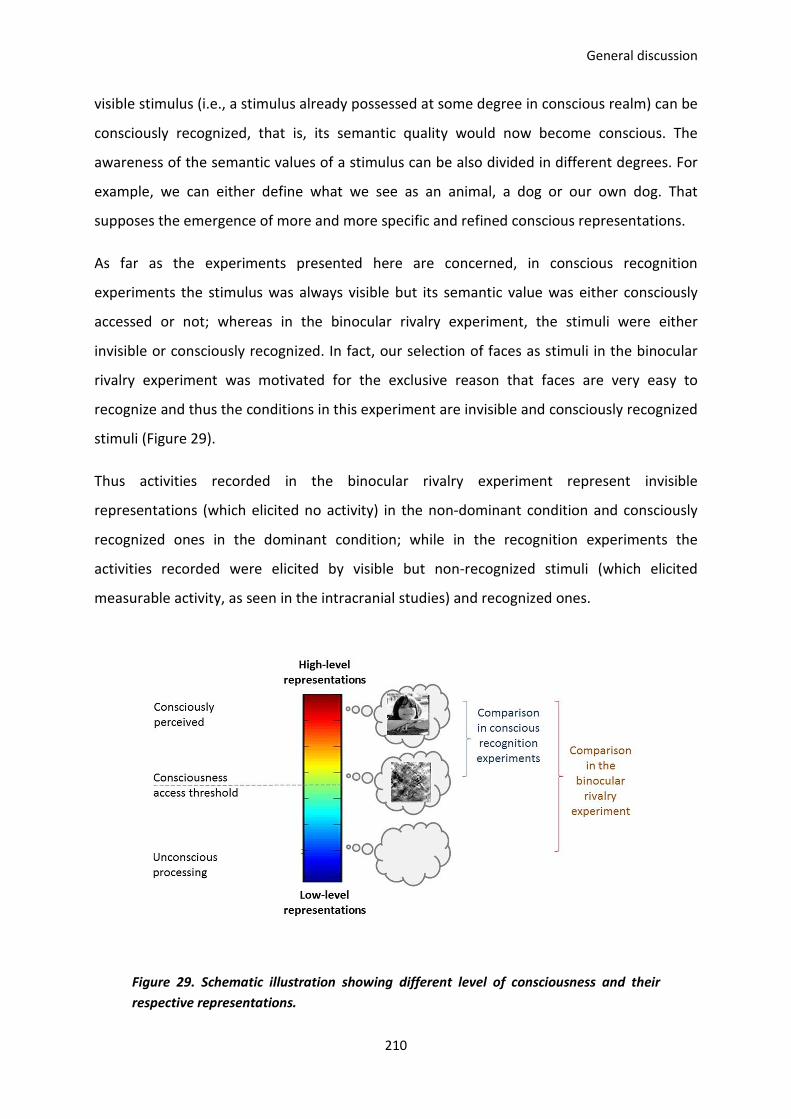
General discussion
210
visible stimulus (i.e., a stimulus already possessed at some degree in conscious realm) can be
consciously recognized, that is, its semantic quality would now become conscious. The
awareness of the semantic values of a stimulus can be also divided in different degrees. For
example, we can either define what we see as an animal, a dog or our own dog. That
supposes the emergence of more and more specific and refined conscious representations.
As far as the experiments presented here are concerned, in conscious recognition
experiments the stimulus was always visible but its semantic value was either consciously
accessed or not; whereas in the binocular rivalry experiment, the stimuli were either
invisible or consciously recognized. In fact, our selection of faces as stimuli in the binocular
rivalry experiment was motivated for the exclusive reason that faces are very easy to
recognize and thus the conditions in this experiment are invisible and consciously recognized
stimuli (Figure 29).
Thus activities recorded in the binocular rivalry experiment represent invisible
representations (which elicited no activity) in the non-dominant condition and consciously
recognized ones in the dominant condition; while in the recognition experiments the
activities recorded were elicited by visible but non-recognized stimuli (which elicited
measurable activity, as seen in the intracranial studies) and recognized ones.
Figure 29. Schematic illustration showing different level of consciousness and their
respective representations.
General discussion
211
V. Late ERP components, phase-resetting and consciousness
We found very compelling consciousness-related effects in the late components of the ERP
waveforms in all experiments performed using SWIFT. We confirmed that these effects were
supported by temporal consistency of oscillatory activities across different instances of
stimulus presentation, which was measured as an increase in phase locking at the tagging
frequency but also at other frequency bands (see the results obtained in the binocular rivalry
experiment and the intracranial recordings in epileptic patients). This increase in phase-
locking represents the synchronization of the visual system with the external stimulation and
was independent of an increase in amplitude of ongoing oscillatory brain signals, as showed
in the binocular rivalry experiment. The latter suggests that the first requirement for a
stimulus to enter to consciousness it would be a resetting of the phase of ongoing
oscillations around 100ms in several brain areas. If this turns to be true, an interesting
question arises regarding the role of this external synchronization. What is the role of phase-
resetting? Does it set a start signal in order to allow the interaction of different brain areas
at certain frequency bands? This would suppose that external synchronization would have a
causal role in inter area functional connectivity, which in turn would be important for
conscious perception. We found some support for this claim in the preliminary results
obtained by intracranial recordings in humans, where inter-area synchrony was increased at
high-gamma as a function of conscious recognition.
However, we did not obtained any conclusive result regarding the role of synchrony in the
emergence of conscious perception. This is clearly a question to be addressed in future
research.
General discussion
212
VI. Conscious object recognition in humans and monkeys
Our results support the idea that macaque monkey would have access to conscious object
representations. This is supported by the similarities between the results obtained using
SWIFT in humans and monkeys in tasks of object recognition. In our first EEG study in
humans, we found that a later ERP potential, located in centro-parietal regions and peaking
after 300 ms (with an onset between 200 and 300 ms) was present only when objects were
recognized. In monkeys a late ERP potential was also found when the target stimuli where
correctly identified, along the ventral pathway. This ERP potential was present after 200 ms
and is likely to represent recurrent activation in areas of the ventral visual stream. This late
potential was preceded by an earlier positive potential, representing the feedforward sweep
and which was present for all stimulus categories including meaningless ones. Moreover, the
ERP amplitudes of the P1 component relative to the P2 across the visual hierarchy and the
fact that the P2 component presents an all-or-none behavior are the hallmarks predicted by
the Neuronal Global Workspace model of non-linear access to consciousness (Dehaene et
al., 2003; Del Cul et al., 2007).
The commonalities found in the electrophysiological features related to the visual
identification of objects in both humans and monkeys suggest the existence of
consciousness in macaque monkeys. Further analyses will reveal if other electrophysiological
features related with conscious perception such as synchrony at distinctive frequency bands
are also present.
VII. Spatial localization and time course of consciousness
dependent activity
Intracranial recordings in both human and macaques revealed several brain areas which
showed late activities (beyond 200 ms) related with conscious perception. In the macaque,
late activations (after 200 ms) along the ventral visual pathway (from V2 to TEO) were
associated with conscious recognition. In implanted patients, significant activities correlated
General discussion
213
with conscious recognition were found after 200 ms, however significant activations were
also found earlier (between 100 and 200 ms). The areas showing selective responses to
conscious recognition were found in occipito-temporal, infero-temporal, parietal, and frontal
zones.
At this stage we do not have enough data to achieve a clear understanding about the brain
areas supporting conscious perception, their profile of temporal activation and the
directionality of their communication in order to support consciousness. We hope that the
results obtained from more implanted patients would give us the necessary understanding
to draw a more complete picture regarding these phenomena.
VIII. How does sense emerge in the visual system?
This last part is devoted to discussing a speculative model aimed to explain how sense
emerges in the visual system. This model has no great pretentions and is intended to have
some explicative and integrative value concerning the results presented in this thesis as well
as to introduce some tentative hypothesis to be tested in future research. Following the
classification of theories introduced by Sir Roger Penrose (in which we distinguish among:
superb, useful, tentative and misguided), at this point this theory only aspires to a tentative
status.
In the model, a first step is represented by extraction of visual features within the
feedforward sweep (Figure 30a). At this stage, quite raw and incomplete stimulus
representations emerge within visual areas. The sense of the visual information represented
at this point consists in the content of coarse visual features in the stimulus, represented in
Figure 24 as ‘legs’, ‘face’ or ‘horns’. Nevertheless, these incomplete stimulus informations
can be certainly sufficient to diagnose the presence or absence of a category (animal/non-
animal) and could guide some forms of simple behaviors such as saccades or go-responses,
all this in a feedforward manner and pre-consciously. Such processing would be exploited by
rapid categorization experiments.
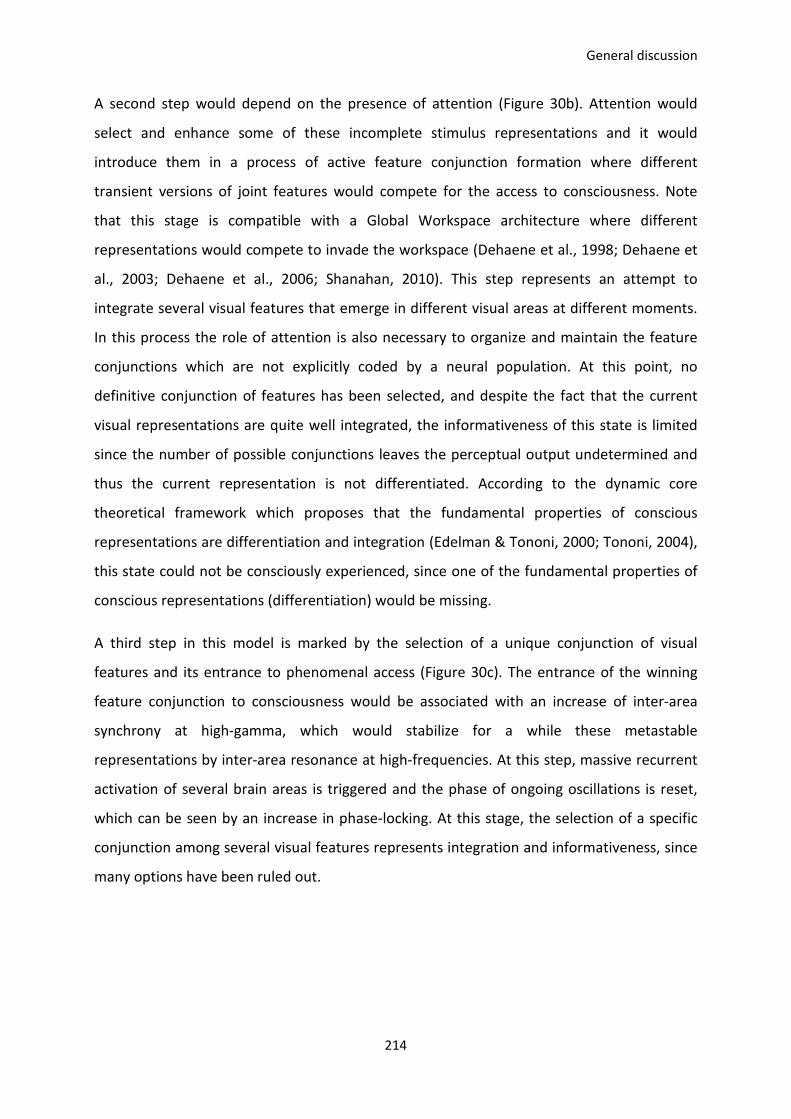
General discussion
214
A second step would depend on the presence of attention (Figure 30b). Attention would
select and enhance some of these incomplete stimulus representations and it would
introduce them in a process of active feature conjunction formation where different
transient versions of joint features would compete for the access to consciousness. Note
that this stage is compatible with a Global Workspace architecture where different
representations would compete to invade the workspace (Dehaene et al., 1998; Dehaene et
al., 2003; Dehaene et al., 2006; Shanahan, 2010). This step represents an attempt to
integrate several visual features that emerge in different visual areas at different moments.
In this process the role of attention is also necessary to organize and maintain the feature
conjunctions which are not explicitly coded by a neural population. At this point, no
definitive conjunction of features has been selected, and despite the fact that the current
visual representations are quite well integrated, the informativeness of this state is limited
since the number of possible conjunctions leaves the perceptual output undetermined and
thus the current representation is not differentiated. According to the dynamic core
theoretical framework which proposes that the fundamental properties of conscious
representations are differentiation and integration (Edelman & Tononi, 2000; Tononi, 2004),
this state could not be consciously experienced, since one of the fundamental properties of
conscious representations (differentiation) would be missing.
A third step in this model is marked by the selection of a unique conjunction of visual
features and its entrance to phenomenal access (Figure 30c). The entrance of the winning
feature conjunction to consciousness would be associated with an increase of inter-area
synchrony at high-gamma, which would stabilize for a while these metastable
representations by inter-area resonance at high-frequencies. At this step, massive recurrent
activation of several brain areas is triggered and the phase of ongoing oscillations is reset,
which can be seen by an increase in phase-locking. At this stage, the selection of a specific
conjunction among several visual features represents integration and informativeness, since
many options have been ruled out.
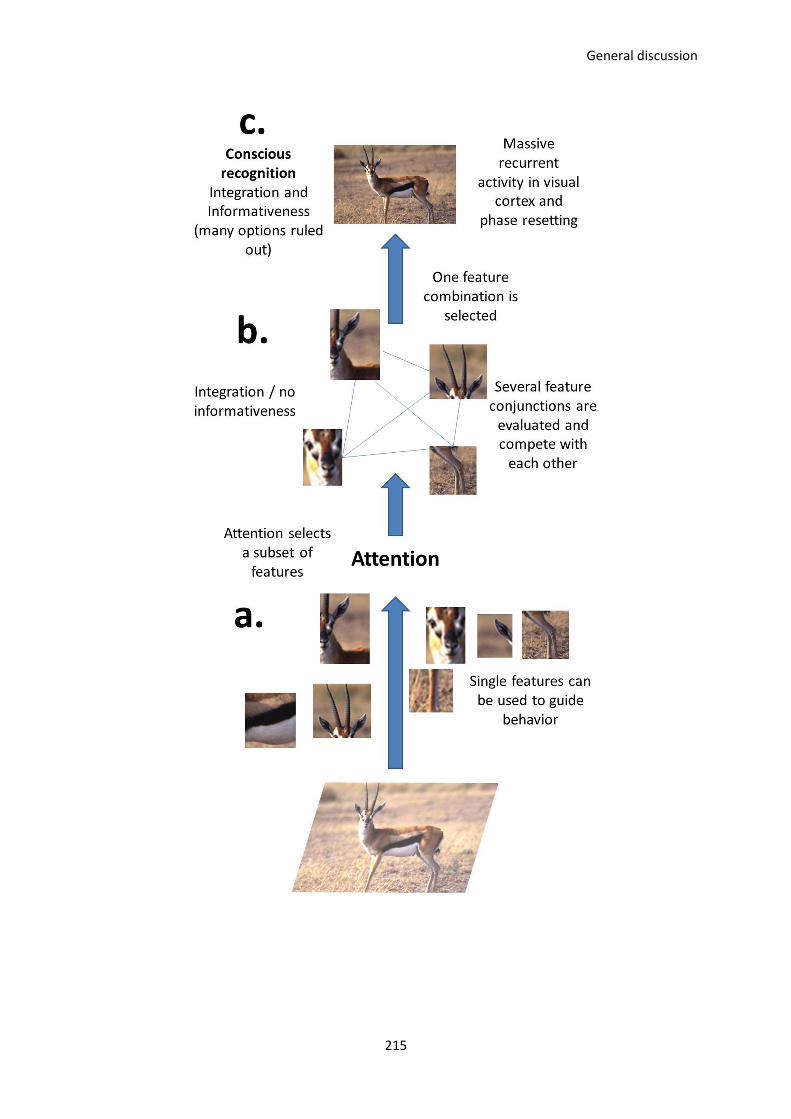
General discussion
215
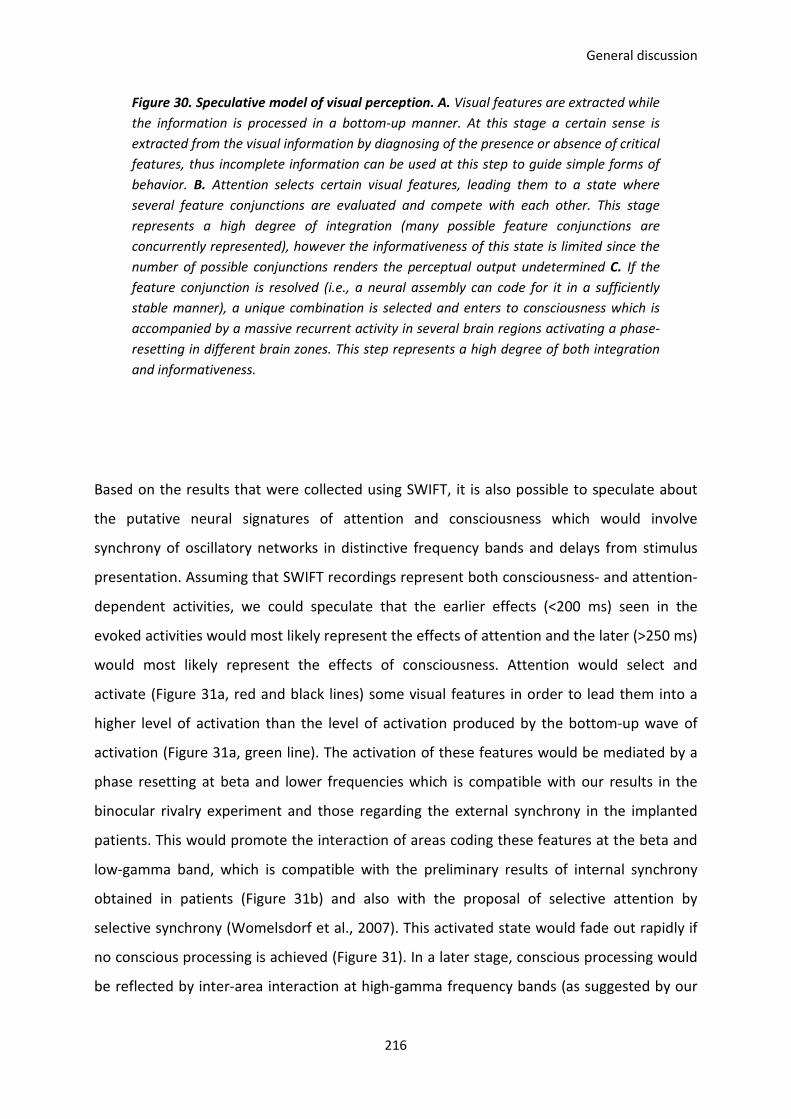
General discussion
216
Figure 30. Speculative model of visual perception. A. Visual features are extracted while
the information is processed in a bottom-up manner. At this stage a certain sense is
extracted from the visual information by diagnosing of the presence or absence of critical
features, thus incomplete information can be used at this step to guide simple forms of
behavior. B. Attention selects certain visual features, leading them to a state where
several feature conjunctions are evaluated and compete with each other. This stage
represents a high degree of integration (many possible feature conjunctions are
concurrently represented), however the informativeness of this state is limited since the
number of possible conjunctions renders the perceptual output undetermined C. If the
feature conjunction is resolved (i.e., a neural assembly can code for it in a sufficiently
stable manner), a unique combination is selected and enters to consciousness which is
accompanied by a massive recurrent activity in several brain regions activating a phase-
resetting in different brain zones. This step represents a high degree of both integration
and informativeness.
Based on the results that were collected using SWIFT, it is also possible to speculate about
the putative neural signatures of attention and consciousness which would involve
synchrony of oscillatory networks in distinctive frequency bands and delays from stimulus
presentation. Assuming that SWIFT recordings represent both consciousness- and attention-
dependent activities, we could speculate that the earlier effects (<200 ms) seen in the
evoked activities would most likely represent the effects of attention and the later (>250 ms)
would most likely represent the effects of consciousness. Attention would select and
activate (Figure 31a, red and black lines) some visual features in order to lead them into a
higher level of activation than the level of activation produced by the bottom-up wave of
activation (Figure 31a, green line). The activation of these features would be mediated by a
phase resetting at beta and lower frequencies which is compatible with our results in the
binocular rivalry experiment and those regarding the external synchrony in the implanted
patients. This would promote the interaction of areas coding these features at the beta and
low-gamma band, which is compatible with the preliminary results of internal synchrony
obtained in patients (Figure 31b) and also with the proposal of selective attention by
selective synchrony (Womelsdorf et al., 2007). This activated state would fade out rapidly if
no conscious processing is achieved (Figure 31). In a later stage, conscious processing would
be reflected by inter-area interaction at high-gamma frequency bands (as suggested by our
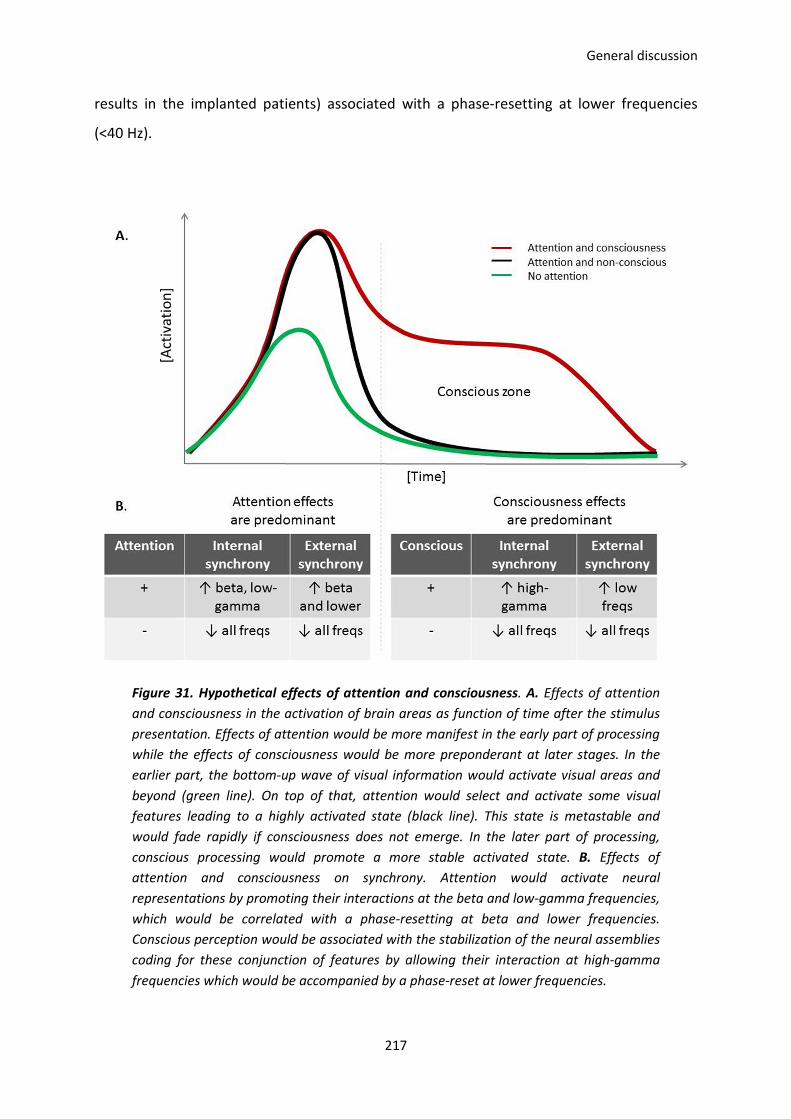
General discussion
217
results in the implanted patients) associated with a phase-resetting at lower frequencies
(<40 Hz).
Figure 31. Hypothetical effects of attention and consciousness. A. Effects of attention
and consciousness in the activation of brain areas as function of time after the stimulus
presentation. Effects of attention would be more manifest in the early part of processing
while the effects of consciousness would be more preponderant at later stages. In the
earlier part, the bottom-up wave of visual information would activate visual areas and
beyond (green line). On top of that, attention would select and activate some visual
features leading to a highly activated state (black line). This state is metastable and
would fade rapidly if consciousness does not emerge. In the later part of processing,
conscious processing would promote a more stable activated state. B. Effects of
attention and consciousness on synchrony. Attention would activate neural
representations by promoting their interactions at the beta and low-gamma frequencies,
which would be correlated with a phase-resetting at beta and lower frequencies.
Conscious perception would be associated with the stabilization of the neural assemblies
coding for these conjunction of features by allowing their interaction at high-gamma
frequencies which would be accompanied by a phase-reset at lower frequencies.
[Act
ivat
ion
]
General discussion
218
IX. Future directions
The development of the SWIFT technique has opened a door to the exploration of
consciousness and I believe that several fundamental questions can be addressed at this
point by using this novel paradigm. Future directions on the research using SWIFT involve
three fundamental questions to be addressed: where does consciousness emerges in the
brain? What is the causal relationship between brain areas in the emergence of
consciousness?
Regarding the brain areas supporting consciousness, further research on both implanted
patients and monkey will give us more information about the areas showing consciousness-
dependent activity. Different electrode implantation schemes across different subjects will
allow testing different brain areas and unveiling their role in conscious perception. In
another vein, fMRI studies could represent a great alternative to define the brain areas that
generate the consciousness-dependent activity under SWIFT stimulation.
The causal relationship among brain areas regarding the emergence of consciousness can be
addressed by statistical measures, such as Granger causality, applied to intracranial
recordings and fMRI recordings. This will allow us to obtain a clearer idea of the interactions
among the components of the conscious brain network.
References
219
H. References
Adrian, E. D., & Matthews, R. (1927). The action of light on the eye: Part I. The discharge of
impulses in the optic nerve and its relation to the electric changes in the retina. The
Journal of Physiology, 63(4), 378–414.
Alamouti, B. (2003). Retinal thickness decreases with age: an OCT study. British Journal of
Ophthalmology, 87(7), 899–901. doi:10.1136/bjo.87.7.899
Alonso, J. M., Usrey, W. M., & Reid, R. C. (2001). Rules of connectivity between geniculate
cells and simple cells in cat primary visual cortex. The Journal of Neuroscience: The
Official Journal of the Society for Neuroscience, 21(11), 4002–4015.
Anderson, J. C., & Martin, K. A. C. (2005). Connection from cortical area V2 to V3 A in
macaque monkey. The Journal of Comparative Neurology, 488(3), 320–330.
doi:10.1002/cne.20580
Anderson, J. C., & Martin, K. A. C. (2006). Synaptic connection from cortical area V4 to V2 in
macaque monkey. The Journal of Comparative Neurology, 495(6), 709–721.
doi:10.1002/cne.20914
Anderson, J. C., & Martin, K. A. C. (2009). The synaptic connections between cortical areas
V1 and V2 in macaque monkey. The Journal of Neuroscience: The Official Journal of
the Society for Neuroscience, 29(36), 11283–11293. doi:10.1523/JNEUROSCI.5757-
08.2009
Arrington, C. M., Carr, T. H., Mayer, A. R., & Rao, S. M. (2000). Neural mechanisms of visual
attention: object-based selection of a region in space. Journal of Cognitive
Neuroscience, 12 Suppl 2, 106–117. doi:10.1162/089892900563975
References
220
Attwell, D., & Laughlin, S. B. (2001). An energy budget for signaling in the grey matter of the
brain. Journal of Cerebral Blood Flow and Metabolism: Official Journal of the
International Society of Cerebral Blood Flow and Metabolism, 21(10), 1133–1145.
doi:10.1097/00004647-200110000-00001
Baars, B. J. (1990). A cognitive theory of consciousness. Cambridge: Cambridge University
Press.
Baars, B. J. (2002). The conscious access hypothesis: origins and recent evidence. Trends in
Cognitive Sciences, 6(1), 47–52. doi:10.1016/S1364-6613(00)01819-2
Baars, B. J. (2005). Global workspace theory of consciousness: toward a cognitive
neuroscience of human experience. Progress in Brain Research, 150, 45–53.
doi:10.1016/S0079-6123(05)50004-9
Baizer, J. S., Ungerleider, L. G., & Desimone, R. (1991). Organization of visual inputs to the
inferior temporal and posterior parietal cortex in macaques. The Journal of
Neuroscience: The Official Journal of the Society for Neuroscience, 11(1), 168–190.
Banerjee, A., Tognoli, E., Assisi, C. G., Kelso, J. A. S., & Jirsa, V. K. (2008). Mode level cognitive
subtraction (MLCS) quantifies spatiotemporal reorganization in large-scale brain
topographies. NeuroImage, 42(2), 663–674. doi:10.1016/j.neuroimage.2008.04.260
Bar, M, Kassam, K. S., Ghuman, A. S., Boshyan, J., Schmid, A. M., Schmidt, A. M., Dale, A. M.,
et al. (2006). Top-down facilitation of visual recognition. Proceedings of the National
Academy of Sciences of the United States of America, 103(2), 449–454.
doi:10.1073/pnas.0507062103
Bar, M, Tootell, R. B., Schacter, D. L., Greve, D. N., Fischl, B., Mendola, J. D., Rosen, B. R., et
al. (2001). Cortical mechanisms specific to explicit visual object recognition. Neuron,
29(2), 529–535.
References
221
Bar, Moshe. (2003). A cortical mechanism for triggering top-down facilitation in visual object
recognition. Journal of cognitive neuroscience, 15(4), 600–609.
doi:10.1162/089892903321662976
Barlow, H. B. (1953). Summation and inhibition in the frog’s retina. The Journal of Physiology,
119(1), 69–88.
Baylor, D. A., Lamb, T. D., & Yau, K. W. (1979). Responses of retinal rods to single photons.
The Journal of Physiology, 288, 613–634.
Behrmann, M., Zemel, R. S., & Mozer, M. C. (1998). Object-based attention and occlusion:
evidence from normal participants and a computational model. Journal of
Experimental Psychology. Human Perception and Performance, 24(4), 1011–1036.
Bichot, N. P. (2005). Parallel and Serial Neural Mechanisms for Visual Search in Macaque
Area V4. Science, 308(5721), 529–534. doi:10.1126/science.1109676
Binzegger, T., Douglas, R. J., & Martin, K. A. C. (2004). A quantitative map of the circuit of cat
primary visual cortex. The Journal of Neuroscience: The Official Journal of the Society
for Neuroscience, 24(39), 8441–8453. doi:10.1523/JNEUROSCI.1400-04.2004
Blackmore, S. (2005). Consciousness: A Very Short Introduction. Oxford University Press.
Blackmore, S. J., Brelstaff, G., Nelson, K., & Trościanko, T. (1995). Is the richness of our visual
world an illusion? Transsaccadic memory for complex scenes. Perception, 24(9),
1075–1081.
Blasdel, G. G., & Lund, J. S. (1983). Termination of afferent axons in macaque striate cortex.
The Journal of Neuroscience: The Official Journal of the Society for Neuroscience, 3(7),
1389–1413.
Block, N. (1995). On a confusion about a function of consciousness. Behavioral and Brain
Sciences, 18(02), 227. doi:10.1017/S0140525X00038188
References
222
Block, N. (2008). Consciousness, accessibility, and the mesh between psychology and
neuroscience. Behavioral and Brain Sciences, 30(5-6).
doi:10.1017/S0140525X07002786
Blumberg, J., & Kreiman, G. (2010). How cortical neurons help us see: visual recognition in
the human brain. Journal of Clinical Investigation, 120(9), 3054–3063.
doi:10.1172/JCI42161
Booth, M. C., & Rolls, E. T. (1998). View-invariant representations of familiar objects by
neurons in the inferior temporal visual cortex. Cerebral Cortex (New York, N.Y.: 1991),
8(6), 510–523.
Bor, D., & Seth, A. K. (2012). Consciousness and the prefrontal parietal network: insights
from attention, working memory, and chunking. Frontiers in psychology, 3, 63.
doi:10.3389/fpsyg.2012.00063
Borowsky, R., Esopenko, C., Cummine, J., & Sarty, G. E. (2007). Neural representations of
visual words and objects: a functional MRI study on the modularity of reading and
object processing. Brain Topography, 20(2), 89–96. doi:10.1007/s10548-007-0034-1
Boucart, M., Moroni, C., Despretz, P., Pasquier, F., & Fabre-Thorpe, M. (2010). Rapid
categorization of faces and objects in a patient with impaired object recognition.
Neurocase, 16(2), 157–168. doi:10.1080/13554790903339637
Boxtel, J. J. A. van, Tsuchiya, N., & Koch, C. (2010). Consciousness and attention: on
sufficiency and necessity. Frontiers in Consciousness Research, 1, 217.
doi:10.3389/fpsyg.2010.00217
Bransford, J. D. (1979). Human Cognition: Learning, Understanding and Remembering.
Wadsworth Publishing Co Inc.
References
223
Breitmeyer, B. G., & Öğmen, H. (2006). Visual masking: Time slices through conscious and
unconscious vision (2nd ed.). Oxford psychology series. New York, NY, US: Oxford
University Press.
Broadbent, D. E. (1987). Perception and communication. Oxford [Oxfordshire]; New York:
Oxford University Press.
Brodmann, K. (1909). Brodmann’s: Localisation in the Cerebral Cortex (1st ed. Softcover of
orig. ed. 2006.). Springer-Verlag New York Inc.
Bullier, J. (2001). Integrated model of visual processing. Brain Research. Brain Research
Reviews, 36(2-3), 96–107.
Bullier, J., & Kennedy, H. (1983). Projection of the lateral geniculate nucleus onto cortical
area V2 in the macaque monkey. Experimental Brain Research. Experimentelle
Hirnforschung. Expérimentation Cérébrale, 53(1), 168–172.
Butler, A. B. (2008). Evolution of brains, cognition, and consciousness. Brain Research
Bulletin, 75(2-4), 442–449. doi:10.1016/j.brainresbull.2007.10.017
Butler, A. B. (2012). Hallmarks of Consciousness. In C. López-Larrea (Ed.), Sensing in Nature,
Advances in Experimental Medicine and Biology (Vol. 739, pp. 291–309). Springer US.
Retrieved from
http://www.springerlink.com.gate1.inist.fr/content/g6j2723463207730/abstract/
Cameron, E. L., Tai, J. C., & Carrasco, M. (2002). Covert attention affects the psychometric
function of contrast sensitivity. Vision Research, 42(8), 949–967.
Carlson, J. M., Beacher, F., Reinke, K. S., Habib, R., Harmon-Jones, E., Mujica-Parodi, L. R., &
Hajcak, G. (2012). Nonconscious attention bias to threat is correlated with anterior
cingulate cortex gray matter volume: a voxel-based morphometry result and
replication. NeuroImage, 59(2), 1713–1718. doi:10.1016/j.neuroimage.2011.09.040
References
224
Carlson, J. M., Reinke, K. S., LaMontagne, P. J., & Habib, R. (2011). Backward masked fearful
faces enhance contralateral occipital cortical activity for visual targets within the
spotlight of attention. Social Cognitive and Affective Neuroscience, 6(5), 639–645.
doi:10.1093/scan/nsq076
Carlson, T., Grol, M. J., & Verstraten, F. A. J. (2006). Dynamics of visual recognition revealed
by fMRI. NeuroImage, 32(2), 892–905. doi:10.1016/j.neuroimage.2006.03.059
Carrasco, M. (2011). Visual attention: the past 25 years. Vision Research, 51(13), 1484–1525.
doi:10.1016/j.visres.2011.04.012
Casagrande, V. A., Yazar, F., Jones, K. D., & Ding, Y. (2007). The morphology of the
koniocellular axon pathway in the macaque monkey. Cerebral Cortex (New York, N.Y.:
1991), 17(10), 2334–2345. doi:10.1093/cercor/bhl142
Chalk, M., Herrero, J. L., Gieselmann, M. A., Delicato, L. S., Gotthardt, S., & Thiele, A. (2010).
Attention Reduces Stimulus-Driven Gamma Frequency Oscillations and Spike Field
Coherence in V1. Neuron, 66(1), 114–125. doi:10.1016/j.neuron.2010.03.013
Chalmers, D. J. (1996). The conscious mind : in search of a fundamental theory. New York:
Oxford University Press.
Cheal, M., & Lyon, D. R. (1991). Central and peripheral precuing of forced-choice
discrimination. The Quarterly Journal of Experimental Psychology. A, Human
Experimental Psychology, 43(4), 859–880.
Cheal, M., Lyon, D. R., & Hubbard, D. C. (1991). Does attention have different effects on line
orientation and line arrangement discrimination? The Quarterly Journal of
Experimental Psychology. A, Human Experimental Psychology, 43(4), 825–857.
Chelazzi, L., Miller, E. K., Duncan, J., & Desimone, R. (1993). A neural basis for visual search in
inferior temporal cortex. Nature, 363(6427), 345–347. doi:10.1038/363345a0
References
225
Chica, A. B., & Lupiáñez, J. (2009). Effects of endogenous and exogenous attention on visual
processing: an Inhibition of Return study. Brain Research, 1278, 75–85.
doi:10.1016/j.brainres.2009.04.011
Collins, C. E., Airey, D. C., Young, N. A., Leitch, D. B., & Kaas, J. H. (2010). Neuron densities
vary across and within cortical areas in primates. Proceedings of the National
Academy of Sciences of the United States of America, 107(36), 15927–15932.
doi:10.1073/pnas.1010356107
Corbetta, M, Kincade, J. M., Ollinger, J. M., McAvoy, M. P., & Shulman, G. L. (2000).
Voluntary orienting is dissociated from target detection in human posterior parietal
cortex. Nature Neuroscience, 3(3), 292–297. doi:10.1038/73009
Corbetta, Maurizio, & Shulman, G. L. (2002a). Control of goal-directed and stimulus-driven
attention in the brain. Nature Reviews. Neuroscience, 3(3), 201–215.
doi:10.1038/nrn755
Corbetta, Maurizio, & Shulman, G. L. (2002b). Control of goal-directed and stimulus-driven
attention in the brain. Nature Reviews. Neuroscience, 3(3), 201–215.
doi:10.1038/nrn755
Corbetta, Maurizio, & Shulman, G. L. (2011). Spatial neglect and attention networks. Annual
Review of Neuroscience, 34, 569–599. doi:10.1146/annurev-neuro-061010-113731
Crick, F, & Koch, C. (1995). Are we aware of neural activity in primary visual cortex? Nature,
375(6527), 121–123. doi:10.1038/375121a0
Crick, F, & Koch, C. (1998a). Consciousness and neuroscience. Cerebral cortex (New York,
N.Y.: 1991), 8(2), 97–107.
Crick, F, & Koch, C. (1990). Towards a Neurobiological Theory of Consciousness. Seminars in
the Neurosciences, 2, 263–275.
References
226
Crick, F, & Koch, C. (1998b). Constraints on cortical and thalamic projections: the no-strong-
loops hypothesis. Nature, 391(6664), 245–250. doi:10.1038/34584
Crick, Francis, & Koch, C. (2003). A framework for consciousness. Nature neuroscience, 6(2),
119–126. doi:10.1038/nn0203-119
Crouzet, S. M., Kirchner, H., & Thorpe, S. J. (2010). Fast saccades toward faces: face
detection in just 100 ms. Journal of Vision, 10(4), 16.1–17. doi:10.1167/10.4.16
Crouzet, S. M., & Thorpe, S. J. (2011). Low-level cues and ultra-fast face detection. Frontiers
in Psychology, 2, 342. doi:10.3389/fpsyg.2011.00342
Crouzet, S., Thorpe, S. J., & Kirchner, H. (2007). Category-dependent variations in visual
processing time. Journal of Vision, 7(9), 922–922. doi:10.1167/7.9.922
Cutzu, F., & Tsotsos, J. K. (2003). The selective tuning model of attention: psychophysical
evidence for a suppressive annulus around an attended item. Vision Research, 43(2),
205–219.
De Brigard, F., & Prinz, J. (2009). Attention and consciousness. Wiley Interdisciplinary
Reviews: Cognitive Science, 1(1), 51–59. doi:10.1002/wcs.27
De Valois, R. L., Yund, E. W., & Hepler, N. (1982). The orientation and direction selectivity of
cells in macaque visual cortex. Vision Research, 22(5), 531–544.
Dehaene, S. (1989). Discriminability and dimensionality effects in visual search for featural
conjunctions: a functional pop-out. Perception & Psychophysics, 46(1), 72–80.
Dehaene, S, Naccache, L., Le Clec’H, G., Koechlin, E., Mueller, M., Dehaene-Lambertz, G., van
de Moortele, P. F., et al. (1998). Imaging unconscious semantic priming. Nature,
395(6702), 597–600. doi:10.1038/26967
References
227
Dehaene, Stanislas, Kerszberg, M., & Changeux, J.-P. (1998). A Neuronal Model of a Global
Workspace in Effortful Cognitive Tasks. Proceedings of the National Academy of
Sciences, 95(24), 14529–14534. doi:10.1073/pnas.95.24.14529
Dehaene, Stanislas, & Changeux, J.-P. (2005). Ongoing spontaneous activity controls access
to consciousness: a neuronal model for inattentional blindness. PLoS Biology, 3(5),
e141. doi:10.1371/journal.pbio.0030141
Dehaene, Stanislas, & Changeux, J.-P. (2011). Experimental and Theoretical Approaches to
Conscious Processing. Neuron, 70(2), 200–227. doi:10.1016/j.neuron.2011.03.018
Dehaene, Stanislas, Changeux, J.-P., Naccache, L., Sackur, J., & Sergent, C. (2006). Conscious,
preconscious, and subliminal processing: a testable taxonomy. Trends in Cognitive
Sciences, 10(5), 204–211. doi:10.1016/j.tics.2006.03.007
Dehaene, Stanislas, Sergent, C., & Changeux, J.-P. (2003). A neuronal network model linking
subjective reports and objective physiological data during conscious perception.
Proceedings of the National Academy of Sciences of the United States of America,
100(14), 8520–8525. doi:10.1073/pnas.1332574100
Del Cul, A., Baillet, S., & Dehaene, S. (2007). Brain dynamics underlying the nonlinear
threshold for access to consciousness. PLoS Biology, 5(10), e260.
doi:10.1371/journal.pbio.0050260
Delorme, A, Richard, G., & Fabre-Thorpe, M. (2000). Ultra-rapid categorisation of natural
scenes does not rely on colour cues: a study in monkeys and humans. Vision
Research, 40(16), 2187–2200.
Delorme, Arnaud, & Makeig, S. (2004). EEGLAB: an open source toolbox for analysis of
single-trial EEG dynamics including independent component analysis. Journal of
Neuroscience Methods, 134(1), 9–21. doi:10.1016/j.jneumeth.2003.10.009
References
228
Denys, K., Vanduffel, W., Fize, D., Nelissen, K., Peuskens, H., Van Essen, D., & Orban, G. A.
(2004). The processing of visual shape in the cerebral cortex of human and
nonhuman primates: a functional magnetic resonance imaging study. The Journal of
Neuroscience: The Official Journal of the Society for Neuroscience, 24(10), 2551–2565.
doi:10.1523/JNEUROSCI.3569-03.2004
Descartes, R., Meyer, M., & Timmermans, B. (1649). Les Passions de l’âme. Paris: Librairie
générale française.
Desimone, R., Albright, T. D., Gross, C. G., & Bruce, C. (1984). Stimulus-selective properties of
inferior temporal neurons in the macaque. The Journal of Neuroscience: The Official
Journal of the Society for Neuroscience, 4(8), 2051–2062.
Desimone, R., Fleming, J., & Gross, C. G. (1980). Prestriate afferents to inferior temporal
cortex: an HRP study. Brain Research, 184(1), 41–55.
Desimone, R., & Schein, S. J. (1987). Visual properties of neurons in area V4 of the macaque:
sensitivity to stimulus form. Journal of Neurophysiology, 57(3), 835–868.
Desimone, R., & Ungerleider, L. (1989). Handbook of neuropsychology (Vol. 2). Boller, F
Grafman, J.
DiCarlo, J. J., Zoccolan, D., & Rust, N. C. (2012). How Does the Brain Solve Visual Object
Recognition? Neuron, 73(3), 415–434. doi:10.1016/j.neuron.2012.01.010
Driver, J., Davis, G., Russell, C., Turatto, M., & Freeman, E. (2001). Segmentation, attention
and phenomenal visual objects. Cognition, 80(1-2), 61–95.
Duncan, J. (1993). Similarity between concurrent visual discriminations: dimensions and
objects. Perception & Psychophysics, 54(4), 425–430.
Edelman, G. M., & Tononi, G. (2000). A universe of consciousness : how matter becomes
imagination. New York, NY: Basic Books.
References
229
Egeth, H. E., & Yantis, S. (1997). Visual attention: control, representation, and time course.
Annual Review of Psychology, 48, 269–297. doi:10.1146/annurev.psych.48.1.269
Enns, J. T. (2004). The thinking eye, the seeing brain : explorations in visual cognition. New
York: W.W. Norton.
Epstein, R., Harris, A., Stanley, D., & Kanwisher, N. (1999). The parahippocampal place area:
recognition, navigation, or encoding? Neuron, 23(1), 115–125.
Eriksen, C. W., & St James, J. D. (1986). Visual attention within and around the field of focal
attention: a zoom lens model. Perception & Psychophysics, 40(4), 225–240.
Fabre-Thorpe, M, Delorme, A., Marlot, C., & Thorpe, S. (2001). A limit to the speed of
processing in ultra-rapid visual categorization of novel natural scenes. Journal of
Cognitive Neuroscience, 13(2), 171–180.
Fabre-Thorpe, M, Richard, G., & Thorpe, S. J. (1998). Rapid categorization of natural images
by rhesus monkeys. Neuroreport, 9(2), 303–308.
Fabre-Thorpe, Michèle. (2011). The characteristics and limits of rapid visual categorization.
Frontiers in Psychology, 2. doi:10.3389/fpsyg.2011.00243
Fang, F., & He, S. (2005). Cortical responses to invisible objects in the human dorsal and
ventral pathways. Nature Neuroscience, 8(10), 1380–1385. doi:10.1038/nn1537
Farivar, R. (2009). Dorsal-ventral integration in object recognition. Brain Research Reviews,
61(2), 144–153. doi:10.1016/j.brainresrev.2009.05.006
Felleman, D. J., & Van Essen, D. C. (1991). Distributed hierarchical processing in the primate
cerebral cortex. Cerebral Cortex (New York, N.Y.: 1991), 1(1), 1–47.
Fenske, M. J., Aminoff, E., Gronau, N., & Bar, M. (2006). Top-down facilitation of visual object
recognition: object-based and context-based contributions. Progress in brain
research, 155, 3–21. doi:10.1016/S0079-6123(06)55001-0
References
230
Ferster, D. (1988). Spatially opponent excitation and inhibition in simple cells of the cat
visual cortex. The Journal of Neuroscience: The Official Journal of the Society for
Neuroscience, 8(4), 1172–1180.
Fetzer, J. H. (2002). Consciousness Evolving. John Benjamins Publishing Company.
Fishman, R. S. (2008). Evolution and the eye: the Darwin bicentennial and the
sesquicentennial of the origin of species. Archives of Ophthalmology, 126(11), 1586–
1592. doi:10.1001/archopht.126.11.1586
Flanagan. (1994). Consciousness reconsidered. Cambridge. Journal of the History of the
Behavioral Sciences, 30(1), 61–65. doi:10.1002/1520-6696(199401)30:1<61::AID-
JHBS2300300109>3.0.CO;2-5
Freedman, D J, Riesenhuber, M., Poggio, T., & Miller, E. K. (2001). Categorical representation
of visual stimuli in the primate prefrontal cortex. Science (New York, N.Y.), 291(5502),
312–316. doi:10.1126/science.291.5502.312
Freedman, David J, Riesenhuber, M., Poggio, T., & Miller, E. K. (2002). Visual categorization
and the primate prefrontal cortex: neurophysiology and behavior. Journal of
Neurophysiology, 88(2), 929–941.
Freedman, David J, Riesenhuber, M., Poggio, T., & Miller, E. K. (2003). A comparison of
primate prefrontal and inferior temporal cortices during visual categorization. The
Journal of Neuroscience: The Official Journal of the Society for Neuroscience, 23(12),
5235–5246.
Fries, P. (2001). Modulation of Oscillatory Neuronal Synchronization by Selective Visual
Attention. Science, 291(5508), 1560–1563. doi:10.1126/science.1055465
Fries, Pascal, Nikolić, D., & Singer, W. (2007). The gamma cycle. Trends in Neurosciences,
30(7), 309–316. doi:10.1016/j.tins.2007.05.005
References
231
Fries, W. (1981). The projection from the lateral geniculate nucleus to the prestriate cortex
of the macaque monkey. Proceedings of the Royal Society of London. Series B,
Containing Papers of a Biological Character. Royal Society (Great Britain), 213(1190),
73–86.
Friston, K. J., Price, C. J., Fletcher, P., Moore, C., Frackowiak, R. S., & Dolan, R. J. (1996). The
trouble with cognitive subtraction. NeuroImage, 4(2), 97–104.
doi:10.1006/nimg.1996.0033
Fujita, I., Tanaka, K., Ito, M., & Cheng, K. (1992). Columns for visual features of objects in
monkey inferotemporal cortex. Nature, 360(6402), 343–346. doi:10.1038/360343a0
Gallant, J. L., Braun, J., & Van Essen, D. C. (1993). Selectivity for polar, hyperbolic, and
Cartesian gratings in macaque visual cortex. Science (New York, N.Y.), 259(5091),
100–103.
Galliot, B., & Quiquand, M. (2011). A two-step process in the emergence of neurogenesis.
European Journal of Neuroscience, 34(6), 847–862. doi:10.1111/j.1460-
9568.2011.07829.x
Giordano, A. M., McElree, B., & Carrasco, M. (2009). On the automaticity and flexibility of
covert attention: A speed-accuracy trade-off analysis. Journal of Vision, 9(3), 30–30.
doi:10.1167/9.3.30
Girard, P, Jouffrais, C., & Kirchner, C. H. (2008). Ultra-rapid categorisation in non-human
primates. Animal Cognition, 11(3), 485–493. doi:10.1007/s10071-008-0139-2
Girard, Pascal, Lomber, S. G., & Bullier, J. (2002). Shape discrimination deficits during
reversible deactivation of area V4 in the macaque monkey. Cerebral Cortex (New
York, N.Y.: 1991), 12(11), 1146–1156.
References
232
Goodale, M A, & Milner, A. D. (1992). Separate visual pathways for perception and action.
Trends in Neurosciences, 15(1), 20–25.
Goodale, Melvyn A, & Westwood, D. A. (2004). An evolving view of duplex vision: separate
but interacting cortical pathways for perception and action. Current opinion in
neurobiology, 14(2), 203–211. doi:10.1016/j.conb.2004.03.002
Gosselin, F., & Schyns, P. G. (2001). Bubbles: a technique to reveal the use of information in
recognition tasks. Vision Research, 41(17), 2261–2271. doi:10.1016/S0042-
6989(01)00097-9
Gottesmann, C. (2008). Noradrenaline involvement in basic and higher integrated REM sleep
processes. Progress in Neurobiology, 85(3), 237–272.
doi:10.1016/j.pneurobio.2008.04.002
Gregoriou, G. G., Gotts, S. J., Zhou, H., & Desimone, R. (2009). High-frequency, long-range
coupling between prefrontal and visual cortex during attention. Science (New York,
N.Y.), 324(5931), 1207–1210. doi:10.1126/science.1171402
Grill-Spector, K. (2003). The neural basis of object perception. Current Opinion in
Neurobiology, 13(2), 159–166. doi:10.1016/S0959-4388(03)00040-0
Gross, C. G., Rocha-Miranda, C. E., & Bender, D. B. (1972). Visual properties of neurons in
inferotemporal cortex of the Macaque. Journal of Neurophysiology, 35(1), 96–111.
Guyonneau, R., Vanrullen, R., & Thorpe, S. J. (2004). Temporal codes and sparse
representations: a key to understanding rapid processing in the visual system. Journal
of Physiology, Paris, 98(4-6), 487–497. doi:10.1016/j.jphysparis.2005.09.004
Guyonneau, R., VanRullen, R., & Thorpe, S. J. (2005). Neurons tune to the earliest spikes
through STDP. Neural Computation, 17(4), 859–879. doi:10.1162/0899766053429390
References
233
Hameroff, S. (1998). Quantum Computation in Brain Microtubules? The Penrose–Hameroff
‘Orch OR‘ Model of Consciousness. Philosophical Transactions of the Royal Society of
London. Series A: Mathematical, Physical and Engineering Sciences, 356(1743), 1869–
1896. doi:10.1098/rsta.1998.0254
Hartline, H. K. (1938). The response of single optic nerve fibers of the vertebrate eye to
illumination of the retina. American J Physiol, 121, 400–415.
Haxby, J. V., Grady, C. L., Horwitz, B., Ungerleider, L. G., Mishkin, M., Carson, R. E.,
Herscovitch, P., et al. (1991). Dissociation of object and spatial visual processing
pathways in human extrastriate cortex. Proceedings of the National Academy of
Sciences of the United States of America, 88(5), 1621–1625.
He, B. J., Snyder, A. Z., Vincent, J. L., Epstein, A., Shulman, G. L., & Corbetta, M. (2007).
Breakdown of functional connectivity in frontoparietal networks underlies behavioral
deficits in spatial neglect. Neuron, 53(6), 905–918. doi:10.1016/j.neuron.2007.02.013
Hegdé, J, & Van Essen, D. C. (2000). Selectivity for complex shapes in primate visual area V2.
The Journal of Neuroscience: The Official Journal of the Society for Neuroscience,
20(5), RC61.
Hegdé, Jay, & Van Essen, D. C. (2003). Strategies of shape representation in macaque visual
area V2. Visual Neuroscience, 20(3), 313–328.
Hegdé, Jay, & Van Essen, D. C. (2005). Role of primate visual area V4 in the processing of 3-D
shape characteristics defined by disparity. Journal of Neurophysiology, 94(4), 2856–
2866. doi:10.1152/jn.00802.2004
Hegdé, Jay, & Van Essen, D. C. (2006). Temporal dynamics of 2D and 3D shape
representation in macaque visual area V4. Visual Neuroscience, 23(5), 749–763.
doi:10.1017/S0952523806230074
References
234
Hegdé, Jay, & Van Essen, D. C. (2007). A comparative study of shape representation in
macaque visual areas v2 and v4. Cerebral Cortex (New York, N.Y.: 1991), 17(5), 1100–
1116. doi:10.1093/cercor/bhl020
Hein, E., Rolke, B., & Ulrich, R. (2006). Visual attention and temporal discrimination:
Differential effects of automatic and voluntary cueing. Visual Cognition, 13(1), 29–50.
doi:10.1080/13506280500143524
Helmholtz, H. von. (1867). Helmholtz’s treatise on physiological optics. Bristol, England;
Sterling, VA: Thoemmes.
Hendry, S. H., & Reid, R. C. (2000). The koniocellular pathway in primate vision. Annual
Review of Neuroscience, 23, 127–153. doi:10.1146/annurev.neuro.23.1.127
Hernández-González, A., Cavada, C., & Reinoso-Suárez, F. (1994). The lateral geniculate
nucleus projects to the inferior temporal cortex in the macaque monkey.
Neuroreport, 5(18), 2693–2696.
Herrmann, C. S. (2001). Human EEG responses to 1-100 Hz flicker: resonance phenomena in
visual cortex and their potential correlation to cognitive phenomena. Experimental
Brain Research. Experimentelle Hirnforschung. Expérimentation Cérébrale, 137(3-4),
346–353.
Hesselmann, G., Naccache, L., Cohen, L., & Dehaene, S. (2012). Splitting of the P3 component
during dual-task processing in a patient with posterior callosal section. Cortex, (0).
doi:10.1016/j.cortex.2012.03.014
Honey, C., Kirchner, H., & VanRullen, R. (2008). Faces in the cloud: Fourier power spectrum
biases ultrarapid face detection. Journal of Vision, 8(12), 9–9. doi:10.1167/8.12.9
Hopfinger, J. B., Buonocore, M. H., & Mangun, G. R. (2000). The neural mechanisms of top-
down attentional control. Nature Neuroscience, 3(3), 284–291. doi:10.1038/72999
References
235
Howarth, C., Gleeson, P., & Attwell, D. (2012). Updated energy budgets for neural
computation in the neocortex and cerebellum. Journal of Cerebral Blood Flow and
Metabolism: Official Journal of the International Society of Cerebral Blood Flow and
Metabolism. doi:10.1038/jcbfm.2012.35
Huang, J. Y., Wang, C., & Dreher, B. (2007). The effects of reversible inactivation of postero-
temporal visual cortex on neuronal activities in cat’s area 17. Brain Research, 1138,
111–128. doi:10.1016/j.brainres.2006.12.081
Hubel, D. H., & Wiesel, T. N. (1959). Receptive fields of single neurones in the cat’s striate
cortex. The Journal of Physiology, 148, 574–591.
Hubel, D. H., & Wiesel, T. N. (1962). Receptive fields, binocular interaction and functional
architecture in the cat’s visual cortex. The Journal of Physiology, 160, 106–154.
Hubel, D. H., & Wiesel, T. N. (1965). RECEPTIVE FIELDS AND FUNCTIONAL ARCHITECTURE IN
TWO NONSTRIATE VISUAL AREAS (18 AND 19) OF THE CAT. Journal of
Neurophysiology, 28, 229–289.
Hubel, D. H., & Wiesel, T. N. (1968). Receptive fields and functional architecture of monkey
striate cortex. The Journal of Physiology, 195(1), 215–243.
Hupé, J. M., James, A. C., Payne, B. R., Lomber, S. G., Girard, P., & Bullier, J. (1998). Cortical
feedback improves discrimination between figure and background by V1, V2 and V3
neurons. Nature, 394(6695), 784–787. doi:10.1038/29537
James, W. (1890). The principles of psychology. Vol. 1. New York; Toronto; [s. l.]: Dover ;
General Publishing Company ; Constable and Company.
Jiang, Y., & He, S. (2006). Cortical responses to invisible faces: dissociating subsystems for
facial-information processing. Current Biology: CB, 16(20), 2023–2029.
doi:10.1016/j.cub.2006.08.084
References
236
Jones, B. E. (2003). Arousal systems. Frontiers in Bioscience: A Journal and Virtual Library, 8,
s438–451.
Joubert, O. R., Fize, D., Rousselet, G. A., & Fabre-Thorpe, M. (2008). Early Interference of
Context Congruence on Object Processing in Rapid Visual Categorization of Natural
Scenes. Journal of Vision, 8(13). doi:10.1167/8.13.11
Judd, C. H. (1910). Evolution and consciousness. Psychological Review, 17(2), 77–97.
doi:10.1037/h0071801
Kaas, J. H., Huerta, M. F., Weber, J. T., & Harting, J. K. (1978). Patterns of retinal terminations
and laminar organization of the lateral geniculate nucleus of primates. The Journal of
Comparative Neurology, 182(3), 517–553. doi:10.1002/cne.901820308
Kanwisher, N, McDermott, J., & Chun, M. M. (1997). The fusiform face area: a module in
human extrastriate cortex specialized for face perception. The Journal of
Neuroscience: The Official Journal of the Society for Neuroscience, 17(11), 4302–4311.
Kanwisher, N, Woods, R. P., Iacoboni, M., & Mazziotta, J. C. (1997). A Locus in Human
Extrastriate Cortex for Visual Shape Analysis. Journal of Cognitive Neuroscience, 9(1),
133–142. doi:10.1162/jocn.1997.9.1.133
Kastner, S., Pinsk, M. A., De Weerd, P., Desimone, R., & Ungerleider, L. G. (1999). Increased
activity in human visual cortex during directed attention in the absence of visual
stimulation. Neuron, 22(4), 751–761.
Kefalov, V. J. (2012). Rod and cone visual pigments and phototransduction through
pharmacological, genetic, and physiological approaches. The Journal of Biological
Chemistry, 287(3), 1635–1641. doi:10.1074/jbc.R111.303008
References
237
Kennedy, H., & Bullier, J. (1985). A double-labeling investigation of the afferent connectivity
to cortical areas V1 and V2 of the macaque monkey. The Journal of Neuroscience: The
Official Journal of the Society for Neuroscience, 5(10), 2815–2830.
Kentridge, R. W., Heywood, C. A., & Weiskrantz, L. (1999). Attention without awareness in
blindsight. Proceedings. Biological Sciences / The Royal Society, 266(1430), 1805–
1811. doi:10.1098/rspb.1999.0850
Kentridge, R. W., Heywood, C. A., & Weiskrantz, L. (2004). Spatial attention speeds
discrimination without awareness in blindsight. Neuropsychologia, 42(6), 831–835.
doi:10.1016/j.neuropsychologia.2003.11.001
Kentridge, R. W., Nijboer, T. C. W., & Heywood, C. A. (2008). Attended but unseen: visual
attention is not sufficient for visual awareness. Neuropsychologia, 46(3), 864–869.
doi:10.1016/j.neuropsychologia.2007.11.036
Kincade, J. M., Abrams, R. A., Astafiev, S. V., Shulman, G. L., & Corbetta, M. (2005). An event-
related functional magnetic resonance imaging study of voluntary and stimulus-
driven orienting of attention. The Journal of Neuroscience: The Official Journal of the
Society for Neuroscience, 25(18), 4593–4604. doi:10.1523/JNEUROSCI.0236-05.2005
Kirchner, H., & Thorpe, S. J. (2006). Ultra-rapid object detection with saccadic eye
movements: visual processing speed revisited. Vision Research, 46(11), 1762–1776.
doi:10.1016/j.visres.2005.10.002
Kirk, R. (1974). Sentience and Behaviour. Mind, LXXXIII(329), 43–60.
doi:10.1093/mind/LXXXIII.329.43
Kobatake, E., & Tanaka, K. (1994). Neuronal selectivities to complex object features in the
ventral visual pathway of the macaque cerebral cortex. Journal of Neurophysiology,
71(3), 856–867.
References
238
Koch, C, & Ullman, S. (1985). Shifts in selective visual attention: towards the underlying
neural circuitry. Human Neurobiology, 4(4), 219–227.
Koch, C. (2004). The quest for consciousness : a neurobiological approach. Englewood: CO :
Roberts and Company Publishers.
Koch, C, & Tsuchiya, N. (2007). Attention and consciousness: two distinct brain processes.
Trends in Cognitive Sciences, 11(1), 16–22. doi:10.1016/j.tics.2006.10.012
Koivisto, M., Kainulainen, P., & Revonsuo, A. (2009). The relationship between awareness
and attention: Evidence from ERP responses. Neuropsychologia, 47(13), 2891–2899.
doi:10.1016/j.neuropsychologia.2009.06.016
Koivisto, M., Lähteenmäki, M., Sørensen, T. A., Vangkilde, S., Overgaard, M., & Revonsuo, A.
(2008). The earliest electrophysiological correlate of visual awareness? Brain and
Cognition, 66(1), 91–103. doi:10.1016/j.bandc.2007.05.010
Kreiman, G., Koch, C., & Fried, I. (2000). Category-specific visual responses of single neurons
in the human medial temporal lobe. Nature Neuroscience, 3(9), 946–953.
doi:10.1038/78868
Kuffler, S. W. (1953). Discharge patterns and functional organization of mammalian retina.
Journal of Neurophysiology, 16(1), 37–68.
Kustov, A. A., & Robinson, D. L. (1996). Shared neural control of attentional shifts and eye
movements. Nature, 384(6604), 74–77. doi:10.1038/384074a0
Kveraga, K., Boshyan, J., & Bar, M. (2007). Magnocellular projections as the trigger of top-
down facilitation in recognition. The Journal of Neuroscience: The Official Journal of
the Society for Neuroscience, 27(48), 13232–13240. doi:10.1523/JNEUROSCI.3481-
07.2007
References
239
LaBerge, D., & Brown, V. (1989). Theory of attentional operations in shape identification.
Psychological Review, 96(1), 101–124. doi:10.1037/0033-295X.96.1.101
Lachica, E. A., Beck, P. D., & Casagrande, V. A. (1992). Parallel pathways in macaque monkey
striate cortex: anatomically defined columns in layer III. Proceedings of the National
Academy of Sciences of the United States of America, 89(8), 3566–3570.
Lamb, T. D., Arendt, D., & Collin, S. P. (2009). The evolution of phototransduction and eyes.
Philosophical Transactions of the Royal Society B: Biological Sciences, 364(1531),
2791–2793. doi:10.1098/rstb.2009.0106
Lamme, V A F. (2004). Separate neural definitions of visual consciousness and visual
attention; a case for phenomenal awareness. Neural Networks: The Official Journal of
the International Neural Network Society, 17(5-6), 861–872.
doi:10.1016/j.neunet.2004.02.005
Lamme, V. (2000). Neural Mechanisms of Visual Awareness: A Linking Proposition. Brain and
Mind, 1(3), 385–406. doi:10.1023/A:1011569019782
Lamme, Victor A.F. (2003). Why visual attention and awareness are different. Trends in
Cognitive Sciences, 7(1), 12–18.
Lamme, V. A., Supèr, H., & Spekreijse, H. (1998). Feedforward, horizontal, and feedback
processing in the visual cortex. Current Opinion in Neurobiology, 8(4), 529–535.
Laughlin, S. B. (2001). Energy as a constraint on the coding and processing of sensory
information. Current Opinion in Neurobiology, 11(4), 475–480.
Lavenex, P., & Amaral, D. G. (2000). Hippocampal-neocortical interaction: a hierarchy of
associativity. Hippocampus, 10(4), 420–430. doi:10.1002/1098-
1063(2000)10:4<420::AID-HIPO8>3.0.CO;2-5
References
240
Lee, B. B., Martin, P. R., & Grünert, U. (2010). Retinal connectivity and primate vision.
Progress in retinal and eye research, 29(6), 622–639.
doi:10.1016/j.preteyeres.2010.08.004
Lehky, S. R., & Sereno, A. B. (2007). Comparison of shape encoding in primate dorsal and
ventral visual pathways. Journal of Neurophysiology, 97(1), 307–319.
doi:10.1152/jn.00168.2006
Lennie, P. (2003). The cost of cortical computation. Current Biology: CB, 13(6), 493–497.
Leopold, D. A., & Logothetis, N. K. (1996). Activity changes in early visual cortex reflect
monkeys’ percepts during binocular rivalry. Nature, 379(6565), 549–553.
doi:10.1038/379549a0
Leventhal, A. G., Thompson, K. G., Liu, D., Zhou, Y., & Ault, S. J. (1995). Concomitant
sensitivity to orientation, direction, and color of cells in layers 2, 3, and 4 of monkey
striate cortex. The Journal of Neuroscience: The Official Journal of the Society for
Neuroscience, 15(3 Pt 1), 1808–1818.
Levitt, J. B., Kiper, D. C., & Movshon, J. A. (1994). Receptive fields and functional architecture
of macaque V2. Journal of Neurophysiology, 71(6), 2517–2542.
Li, F. F., VanRullen, R., Koch, C., & Perona, P. (2002). Rapid natural scene categorization in
the near absence of attention. Proceedings of the National Academy of Sciences of
the United States of America, 99(14), 9596–9601. doi:10.1073/pnas.092277599
Likova, L. T., & Tyler, C. W. (2008). Occipital network for figure/ground organization.
Experimental Brain Research. Experimentelle Hirnforschung. Expérimentation
Cérébrale, 189(3), 257–267. doi:10.1007/s00221-008-1417-6
References
241
Liu, T., Stevens, S. T., & Carrasco, M. (2007). Comparing the time course and efficacy of
spatial and feature-based attention. Vision Research, 47(1), 108–113.
doi:10.1016/j.visres.2006.09.017
Llinás, R. (2002). I of the vortex : from neurons to self. Cambridge, Mass.: MIT.
Llinás, R. R. (1988). The intrinsic electrophysiological properties of mammalian neurons:
insights into central nervous system function. Science (New York, N.Y.), 242(4886),
1654–1664.
Logothetis, N K. (1998). Single units and conscious vision. Philosophical Transactions of the
Royal Society of London. Series B, Biological Sciences, 353(1377), 1801–1818.
doi:10.1098/rstb.1998.0333
Logothetis, N K, Pauls, J., & Poggio, T. (1995). Shape representation in the inferior temporal
cortex of monkeys. Current Biology: CB, 5(5), 552–563.
Logothetis, N K, & Sheinberg, D. L. (1996). Visual object recognition. Annual Review of
Neuroscience, 19, 577–621. doi:10.1146/annurev.ne.19.030196.003045
Logothetis, Nikos K. (2008). What we can do and what we cannot do with fMRI. Nature,
453(7197), 869–878. doi:10.1038/nature06976
Lomber, S. G., & Payne, B. R. (1996). Removal of Two Halves Restores the Whole: Reversal of
Visual Hemineglect During Bilateral Cortical or Collicular Inactivation in the Cat.
Visual Neuroscience, 13(06), 1143–1156. doi:10.1017/S0952523800007781
Lomber, S. G., Payne, B. R., & Horel, J. A. (1999). The cryoloop: an adaptable reversible
cooling deactivation method for behavioral or electrophysiological assessment of
neural function. Journal of Neuroscience Methods, 86(2), 179–194.
doi:10.1016/S0165-0270(98)00165-4
References
242
Lőrincz, M. L., Kékesi, K. A., Juhász, G., Crunelli, V., & Hughes, S. W. (2009). Temporal
Framing of Thalamic Relay-Mode Firing by Phasic Inhibition during the Alpha Rhythm.
Neuron, 63(5), 683–696. doi:10.1016/j.neuron.2009.08.012
Lu, S., Cai, Y., Shen, M., Zhou, Y., & Han, S. (2012). Alerting and orienting of attention without
visual awareness. Consciousness and Cognition. doi:10.1016/j.concog.2012.03.012
Luck, S. J., Chelazzi, L., Hillyard, S. A., & Desimone, R. (1997). Neural mechanisms of spatial
selective attention in areas V1, V2, and V4 of macaque visual cortex. Journal of
Neurophysiology, 77(1), 24–42.
Lumer, E. D., Edelman, G. M., & Tononi, G. (1997). Neural dynamics in a model of the
thalamocortical system. I. Layers, loops and the emergence of fast synchronous
rhythms. Cerebral Cortex (New York, N.Y.: 1991), 7(3), 207–227.
Lund, J. S. (1973). Organization of neurons in the visual cortex, area 17, of the monkey
(Macaca mulatta). The Journal of Comparative Neurology, 147(4), 455–496.
doi:10.1002/cne.901470404
Lund, J. S. (1988). Anatomical organization of macaque monkey striate visual cortex. Annual
review of neuroscience, 11, 253–288. doi:10.1146/annurev.ne.11.030188.001345
Luppi, P.-H., Gervasoni, D., Verret, L., Goutagny, R., Peyron, C., Salvert, D., Leger, L., et al.
(2006). Paradoxical (REM) sleep genesis: the switch from an aminergic-cholinergic to
a GABAergic-glutamatergic hypothesis. Journal of Physiology, Paris, 100(5-6), 271–
283. doi:10.1016/j.jphysparis.2007.05.006
Mack, A., & Rock, I. (1998). Inattentional blindness. Cambridge, Mass.: MIT Press. Retrieved
from
http://search.ebscohost.com/login.aspx?direct=true&scope=site&db=nlebk&db=nlab
k&AN=1439
References
243
Malach, R., Reppas, J. B., Benson, R. R., Kwong, K. K., Jiang, H., Kennedy, W. A., Ledden, P. J.,
et al. (1995). Object-related activity revealed by functional magnetic resonance
imaging in human occipital cortex. Proceedings of the National Academy of Sciences
of the United States of America, 92(18), 8135–8139.
Marr, D. (1976). Early processing of visual information. Philosophical transactions of the
Royal Society of London. Series B, Biological sciences, 275(942), 483–519.
Martínez-García, F., Puelles, L., Donkelaar, H. J. T., & González, A. (2012). Adaptive function
and brain evolution. Frontiers in Neuroanatomy, 17. doi:10.3389/fnana.2012.00017
Martin-Malivel, J., & Fagot, J. (2001). Cross-modal integration and conceptual categorization
in baboons. Behavioural Brain Research, 122(2), 209–213.
Maturana, H., & Varela, F. J. (1992). The Tree of Knowledge: The Biological Roots of Human
Understanding (3rd Revised ed.). Shambhala Publications Inc.
Maunsell, J. H., Ghose, G. M., Assad, J. A., McAdams, C. J., Boudreau, C. E., & Noerager, B. D.
(1999). Visual response latencies of magnocellular and parvocellular LGN neurons in
macaque monkeys. Visual Neuroscience, 16(1), 1–14.
Maunsell, J. H., & van Essen, D. C. (1983). The connections of the middle temporal visual
area (MT) and their relationship to a cortical hierarchy in the macaque monkey. The
Journal of Neuroscience: The Official Journal of the Society for Neuroscience, 3(12),
2563–2586.
Miller, E. K., Gochin, P. M., & Gross, C. G. (1993). Suppression of visual responses of neurons
in inferior temporal cortex of the awake macaque by addition of a second stimulus.
Brain Research, 616(1-2), 25–29.
References
244
Mishkin, M., & Ungerleider, L. G. (1982). Contribution of striate inputs to the visuospatial
functions of parieto-preoccipital cortex in monkeys. Behavioural Brain Research, 6(1),
57–77. doi:10.1016/0166-4328(82)90081-X
Mishkin, M., Ungerleider, L. G., & Macko, K. A. (1983). Object vision and spatial vision: two
cortical pathways. Trends in Neurosciences, 6, 414–417. doi:10.1016/0166-
2236(83)90190-X
Miyashita, Y., & Hayashi, T. (2000). Neural representation of visual objects: encoding and
top-down activation. Current Opinion in Neurobiology, 10(2), 187–194.
Mole, C. (2008). Attention and Consciousness. Journal of Consciousness Studies, 15(4), 86–
104.
Moran, J., & Desimone, R. (1985). Selective attention gates visual processing in the
extrastriate cortex. Science (New York, N.Y.), 229(4715), 782–784.
Most, S. B., Simons, D. J., Scholl, B. J., Jimenez, R., Clifford, E., & Chabris, C. F. (2001). How
not to be seen: the contribution of similarity and selective ignoring to sustained
inattentional blindness. Psychological science, 12(1), 9–17.
Moutoussis, K., & Zeki, S. (2002). The relationship between cortical activation and perception
investigated with invisible stimuli. Proceedings of the National Academy of Sciences
of the United States of America, 99(14), 9527–9532. doi:10.1073/pnas.142305699
Müller, H. J., & Rabbitt, P. M. (1989). Reflexive and voluntary orienting of visual attention:
time course of activation and resistance to interruption. Journal of Experimental
Psychology. Human Perception and Performance, 15(2), 315–330.
Mumford, D. (1991). On the computational architecture of the neocortex. I. The role of the
thalamo-cortical loop. Biological Cybernetics, 65(2), 135–145.

References
245
Naccache, L., Blandin, E., & Dehaene, S. (2002). Unconscious masked priming depends on
temporal attention. Psychological Science, 13(5), 416–424.
Nakayama, K., & Mackeben, M. (1982). Steady state visual evoked potentials in the alert
primate. Vision Research, 22(10), 1261–1271.
Nakayama, K., & Mackeben, M. (1989). Sustained and transient components of focal visual
attention. Vision Research, 29(11), 1631–1647.
Nasr, S., Liu, N., Devaney, K. J., Yue, X., Rajimehr, R., Ungerleider, L. G., & Tootell, R. B. H.
(2011). Scene-Selective Cortical Regions in Human and Nonhuman Primates. The
Journal of Neuroscience, 31(39), 13771–13785. doi:10.1523/JNEUROSCI.2792-
11.2011
Neggers, S. F. W., Huijbers, W., Vrijlandt, C. M., Vlaskamp, B. N. S., Schutter, D. J. L. G., &
Kenemans, J. L. (2007). TMS pulses on the frontal eye fields break coupling between
visuospatial attention and eye movements. Journal of Neurophysiology, 98(5), 2765–
2778. doi:10.1152/jn.00357.2007
Neisser, U., & Becklen, R. (1975). Selective looking: Attending to visually specified events.
Cognitive Psychology, 7(4), 480–494. doi:10.1016/0010-0285(75)90019-5
Newcombe, F., Ratcliff, G., & Damasio, H. (1987). Dissociable visual and spatial impairments
following right posterior cerebral lesions: clinical, neuropsychological and anatomical
evidence. Neuropsychologia, 25(1B), 149–161.
O’Kusky, J., & Colonnier, M. (1982). A laminar analysis of the number of neurons, glia, and
synapses in the adult cortex (area 17) of adult macaque monkeys. The Journal of
Comparative Neurology, 210(3), 278–290. doi:10.1002/cne.902100307
O’Regan, J. K., & Noë, A. (2001). A sensorimotor account of vision and visual consciousness.
The Behavioral and Brain Sciences, 24(5), 939–973; discussion 973–1031.
References
246
Oliva, A., & Torralba, A. (2006). Chapter 2 Building the gist of a scene: the role of global
image features in recognition. Progress in Brain Research (Vol. 155, pp. 23–36).
Elsevier. Retrieved from
http://linkinghub.elsevier.com/retrieve/pii/S0079612306550022
Orban, G. A. (2008). Higher Order Visual Processing in Macaque Extrastriate Cortex.
Physiological Reviews, 88(1), 59–89. doi:10.1152/physrev.00008.2007
Orban, Guy A., Van Essen, D., & Vanduffel, W. (2004). Comparative mapping of higher visual
areas in monkeys and humans. Trends in Cognitive Sciences, 8(7), 315–324.
doi:10.1016/j.tics.2004.05.009
Overgaard, M. (2004). Confounding Factors in Contrastive Analysis. Synthese, 141(2), 217–
231. doi:10.1023/B:SYNT.0000043019.64052.e0
Palmer, L. A., & Davis, T. L. (1981). Receptive-field structure in cat striate cortex. Journal of
Neurophysiology, 46(2), 260–276.
Palva, S., & Palva, J. M. (2007). New vistas for alpha-frequency band oscillations. Trends in
Neurosciences, 30(4), 150–158. doi:10.1016/j.tins.2007.02.001
Pasley, B. N., Mayes, L. C., & Schultz, R. T. (2004). Subcortical discrimination of unperceived
objects during binocular rivalry. Neuron, 42(1), 163–172.
Pasupathy, A., & Connor, C. E. (1999). Responses to contour features in macaque area V4.
Journal of Neurophysiology, 82(5), 2490–2502.
Penrose, R. (1990). The Emperor’s New Mind: Concerning Computers, Minds and the Laws of
Physics (New ed.). Vintage.
Peterhans, E., & von der Heydt, R. (1993). Functional organization of area V2 in the alert
macaque. The European Journal of Neuroscience, 5(5), 509–524.
References
247
Pinsk, M. A., Arcaro, M., Weiner, K. S., Kalkus, J. F., Inati, S. J., Gross, C. G., & Kastner, S.
(2009). Neural representations of faces and body parts in macaque and human
cortex: a comparative FMRI study. Journal of Neurophysiology, 101(5), 2581–2600.
doi:10.1152/jn.91198.2008
Pollen, D A. (1999). On the neural correlates of visual perception. Cerebral Cortex (New York,
N.Y.: 1991), 9(1), 4–19.
Pollen, Daniel A. (2003). Explicit neural representations, recursive neural networks and
conscious visual perception. Cerebral Cortex (New York, N.Y.: 1991), 13(8), 807–814.
Portilla, J., & Simoncelli, E. P. (2000). A Parametric Texture Model Based on Joint Statistics of
Complex Wavelet Coefficients. Int. J. Comput. Vision, 40(1), 49–70.
doi:10.1023/A:1026553619983
Posner, M I. (1980). Orienting of attention. The Quarterly Journal of Experimental
Psychology, 32(1), 3–25.
Posner, M I. (1994). Attention: the mechanisms of consciousness. Proceedings of the
National Academy of Sciences of the United States of America, 91(16), 7398–7403.
Posner, M I, Snyder, C. R., & Davidson, B. J. (1980). Attention and the detection of signals.
Journal of Experimental Psychology, 109(2), 160–174.
Posner, Michael I. (2012). Attentional networks and consciousness. Frontiers in Psychology,
3, 64. doi:10.3389/fpsyg.2012.00064
Postma, A., Sterken, Y., de Vries, L., & de Haan, E. H. (2000). Spatial localization in patients
with unilateral posterior left or right hemisphere lesions. Experimental Brain
Research. Experimentelle Hirnforschung. Expérimentation Cérébrale, 134(2), 220–
227.
References
248
Price, C. J., & Devlin, J. T. (2003). The myth of the visual word form area. NeuroImage, 19(3),
473–481.
Prinz. (2010). Perceiving the World. Oxford University Press.
Puce, A., Allison, T., Asgari, M., Gore, J. C., & McCarthy, G. (1996). Differential sensitivity of
human visual cortex to faces, letterstrings, and textures: a functional magnetic
resonance imaging study. The Journal of Neuroscience: The Official Journal of the
Society for Neuroscience, 16(16), 5205–5215.
Puce, A., Allison, T., Gore, J. C., & McCarthy, G. (1995). Face-sensitive regions in human
extrastriate cortex studied by functional MRI. Journal of Neurophysiology, 74(3),
1192–1199.
Quiroga, R. Q., Kreiman, G., Koch, C., & Fried, I. (2008). Sparse but not “Grandmother-cell”
coding in the medial temporal lobe. Trends in Cognitive Sciences, 12(3), 87–91.
doi:10.1016/j.tics.2007.12.003
Quiroga, R. Q., Reddy, L., Kreiman, G., Koch, C., & Fried, I. (2005). Invariant visual
representation by single neurons in the human brain. Nature, 435(7045), 1102–1107.
doi:10.1038/nature03687
Rager, G., & Singer, W. (1998). The response of cat visual cortex to flicker stimuli of variable
frequency. The European Journal of Neuroscience, 10(5), 1856–1877.
Reddy, L., Reddy, L., & Koch, C. (2006). Face identification in the near-absence of focal
attention. Vision Research, 46(15), 2336–2343. doi:10.1016/j.visres.2006.01.020
Regan, D. (1966). Some characteristics of average steady-state and transient responses
evoked by modulated light. Electroencephalography and Clinical Neurophysiology,
20(3), 238–248. doi:10.1016/0013-4694(66)90088-5
References
249
Regan, D. (1982). Comparison of transient and steady-state methods. Annals of the New York
Academy of Sciences, 388, 45–71.
Regan, David. (1989). Human Brain Electrophysiology: Evoked Potentials and Evoked
Magnetic Fields in Science and Medicine. Appleton & Lange.
Remington, R. W., Johnston, J. C., & Yantis, S. (1992). Involuntary attentional capture by
abrupt onsets. Perception & Psychophysics, 51(3), 279–290.
Rensink, R. (2005). Change Blindness. McGraw-Hill Yearbook of Science & Technology (pp.
44–46). McGraw-Hill.
Rensink, R. A. (2000). When good observers go bad: Change blindness, inattentional
blindness, and visual experience. Psyche.
Rensink, R. A., O’Regan, J. K., & Clark, J. J. (1997). To See or not to See: The Need for
Attention to Perceive Changes in Scenes. Psychological Science, 8(5), 368–373.
doi:10.1111/j.1467-9280.1997.tb00427.x
Rensink, Ronald A. (2002). Change detection. Annual review of psychology, 53, 245–277.
doi:10.1146/annurev.psych.53.100901.135125
Reynolds, J. H., Chelazzi, L., & Desimone, R. (1999). Competitive mechanisms subserve
attention in macaque areas V2 and V4. The Journal of Neuroscience: The Official
Journal of the Society for Neuroscience, 19(5), 1736–1753.
Reynolds, J. H., & Desimone, R. (1999). The role of neural mechanisms of attention in solving
the binding problem. Neuron, 24(1), 19–29, 111–125.
Rizzolatti, G., & Berti, A. (1990). Neglect as a neural representation deficit. Revue
Neurologique, 146(10), 626–634.
References
250
Rockland, K. S., & Drash, G. W. (1996). Collateralized divergent feedback connections that
target multiple cortical areas. The Journal of Comparative Neurology, 373(4), 529–
548. doi:10.1002/(SICI)1096-9861(19960930)373:4<529::AID-CNE5>3.0.CO;2-3
Rockland, K. S., & Pandya, D. N. (1979). Laminar origins and terminations of cortical
connections of the occipital lobe in the rhesus monkey. Brain Research, 179(1), 3–20.
Rockland, K. S., & Van Hoesen, G. W. (1994). Direct temporal-occipital feedback connections
to striate cortex (V1) in the macaque monkey. Cerebral Cortex (New York, N.Y.: 1991),
4(3), 300–313.
Roelfsema, P. R., Lamme, V. A. F., Spekreijse, H., & Bosch, H. (2002). Figure-ground
segregation in a recurrent network architecture. Journal of Cognitive Neuroscience,
14(4), 525–537. doi:10.1162/08989290260045756
Rolls, E T, & Tovee, M. J. (1995). The responses of single neurons in the temporal visual
cortical areas of the macaque when more than one stimulus is present in the
receptive field. Experimental Brain Research. Experimentelle Hirnforschung.
Expérimentation Cérébrale, 103(3), 409–420.
Rolls, Edmund T, Aggelopoulos, N. C., & Zheng, F. (2003). The receptive fields of inferior
temporal cortex neurons in natural scenes. The Journal of Neuroscience: The Official
Journal of the Society for Neuroscience, 23(1), 339–348.
Rossi, A. F., Pessoa, L., Desimone, R., & Ungerleider, L. G. (2009). The prefrontal cortex and
the executive control of attention. Experimental Brain Research. Experimentelle
Hirnforschung. Expérimentation Cérébrale, 192(3), 489–497. doi:10.1007/s00221-
008-1642-z
References
251
Rousselet, G. A., Fabre-Thorpe, M., & Thorpe, S. J. (2002). Parallel processing in high-level
categorization of natural images. Nature Neuroscience, 5(7), 629–630.
doi:10.1038/nn866
Rousselet, G. A., Macé, M. J.-M., & Fabre-Thorpe, M. (2003). Is it an animal? Is it a human
face? Fast processing in upright and inverted natural scenes. Journal of Vision, 3(6),
440–455. doi:10:1167/3.6.5
Rust, N. C., & Dicarlo, J. J. (2010). Selectivity and tolerance (“invariance”) both increase as
visual information propagates from cortical area V4 to IT. The Journal of
Neuroscience: The Official Journal of the Society for Neuroscience, 30(39), 12978–
12995. doi:10.1523/JNEUROSCI.0179-10.2010
Sadr, J., & Sinha, P. (2004). Object recognition and random image structure evolution.
Cognitive Science, 28, 259–287.
Sagi, D., & Julesz, B. (1986). Enhanced detection in the aperture of focal attention during
simple discrimination tasks. Nature, 321(6071), 693–695. doi:10.1038/321693a0
Saleem, K. S., & Tanaka, K. (1996). Divergent projections from the anterior inferotemporal
area TE to the perirhinal and entorhinal cortices in the macaque monkey. The Journal
of Neuroscience: The Official Journal of the Society for Neuroscience, 16(15), 4757–
4775.
Salin, P. A., & Bullier, J. (1995). Corticocortical connections in the visual system: structure
and function. Physiological Reviews, 75(1), 107–154.
Salsbury, K., & Horel, J. (1983). A cryogenic implant for producing reversible functional brain
lesions. Behavior Research Methods, 15(4), 433–436. doi:10.3758/BF03203678
Sanders, A. F. (1997). A summary of resource theories from a behavioral perspective.
Biological Psychology, 45(1-3), 5–18.
References
252
Sartori, G., & Umiltà, C. (2000). How to Avoid the Fallacies of Cognitive Subtraction in Brain
Imaging. Brain and Language, 74(2), 191–212. doi:10.1006/brln.2000.2334
Sauseng, P., & Klimesch, W. (2008). What does phase information of oscillatory brain activity
tell us about cognitive processes? Neuroscience and Biobehavioral Reviews, 32(5),
1001–1013. doi:10.1016/j.neubiorev.2008.03.014
Schenkman, B. N., & Nilsson, M. E. (2010). Human echolocation: Blind and sighted persons’
ability to detect sounds recorded in the presence of a reflecting object. Perception,
39(4), 483–501.
Schenkman, B. N., & Nilsson, M. E. (2011). Human echolocation: pitch versus loudness
information. Perception, 40(7), 840–852.
Schiller, P. H. (1995). Effect of lesions in visual cortical area V4 on the recognition of
transformed objects. Nature, 376(6538), 342–344. doi:10.1038/376342a0
Schiller, P. H., Finlay, B. L., & Volman, S. F. (1976). Quantitative studies of single-cell
properties in monkey striate cortex. I. Spatiotemporal organization of receptive
fields. Journal of Neurophysiology, 39(6), 1288–1319.
Schiller, P. H., & Lee, K. (1991). The role of the primate extrastriate area V4 in vision. Science
(New York, N.Y.), 251(4998), 1251–1253.
Schmid, A. M. (2008). The processing of feature discontinuities for different cue types in
primary visual cortex. Brain Research, 1238, 59–74.
doi:10.1016/j.brainres.2008.08.029
Schmolesky, M. T., Wang, Y., Hanes, D. P., Thompson, K. G., Leutgeb, S., Schall, J. D., &
Leventhal, A. G. (1998). Signal timing across the macaque visual system. Journal of
Neurophysiology, 79(6), 3272–3278.
References
253
Schmolesky, M. T., Wang, Y., Pu, M., & Leventhal, A. G. (2000). Degradation of stimulus
selectivity of visual cortical cells in senescent rhesus monkeys. Nature neuroscience,
3(4), 384–390. doi:10.1038/73957
Scholl, B. J., & Pylyshyn, Z. W. (1999). Tracking multiple items through occlusion: clues to
visual objecthood. Cognitive Psychology, 38(2), 259–290.
doi:10.1006/cogp.1998.0698
Scholte, H. S., Jolij, J., Fahrenfort, J. J., & Lamme, V. A. F. (2008). Feedforward and recurrent
processing in scene segmentation: electroencephalography and functional magnetic
resonance imaging. Journal of Cognitive Neuroscience, 20(11), 2097–2109.
doi:10.1162/jocn.2008.20142
Schyns, P. G., Gosselin, F., & Smith, M. L. (2009). Information processing algorithms in the
brain. Trends in Cognitive Sciences, 13(1), 20–26. doi:10.1016/j.tics.2008.09.008
Seghier, M. L., & Vuilleumier, P. (2006). Functional neuroimaging findings on the human
perception of illusory contours. Neuroscience and Biobehavioral Reviews, 30(5), 595–
612. doi:10.1016/j.neubiorev.2005.11.002
Sereno, A. B., & Maunsell, J. H. (1998). Shape selectivity in primate lateral intraparietal
cortex. Nature, 395(6701), 500–503. doi:10.1038/26752
Sergent, C., Baillet, S., & Dehaene, S. (2005). Timing of the brain events underlying access to
consciousness during the attentional blink. Nature Neuroscience, 8(10), 1391–1400.
doi:10.1038/nn1549
Shanahan, M. (2010). Embodiment and the inner life : cognition and consciousness in the
space of possible minds. Oxford; New York: Oxford University Press.
References
254
Sherman, S. M., & Guillery, R. W. (1998). On the actions that one nerve cell can have on
another: distinguishing “drivers” from “modulators.” Proceedings of the National
Academy of Sciences of the United States of America, 95(12), 7121–7126.
Shulman, G. L., Remington, R. W., & McLean, J. P. (1979). Moving attention through visual
space. Journal of Experimental Psychology. Human Perception and Performance, 5(3),
522–526.
Shulman, G. L., & Wilson, J. (1987). Spatial frequency and selective attention to local and
global information. Perception, 16(1), 89–101.
Sidtis, J. J., Strother, S. C., Anderson, J. R., & Rottenberg, D. A. (1999). Are Brain Functions
Really Additive? NeuroImage, 9(5), 490–496. doi:10.1006/nimg.1999.0423
Sigala, N. (2004). Visual categorization and the inferior temporal cortex. Behavioural Brain
Research, 149(1), 1–7. doi:10.1016/S0166-4328(03)00224-9
Sigala, Natasha, & Logothetis, N. K. (2002). Visual categorization shapes feature selectivity in
the primate temporal cortex. Nature, 415(6869), 318–320. doi:10.1038/415318a
Simons, D J, & Chabris, C. F. (1999). Gorillas in our midst: sustained inattentional blindness
for dynamic events. Perception, 28(9), 1059–1074.
Simons, D J, Franconeri, S. L., & Reimer, R. L. (2000). Change blindness in the absence of a
visual disruption. Perception, 29(10), 1143–1154.
Simons, Daniel J., & Rensink, R. A. (2003). Induced Failures of Visual Awareness. Journal of
Vision, 3(1). doi:10.1167/3.1.i
Sincich, L. C., Adams, D. L., & Horton, J. C. (2003). Complete flatmounting of the macaque
cerebral cortex. Visual Neuroscience, 20(6), 663–686.
References
255
Sincich, L. C., Park, K. F., Wohlgemuth, M. J., & Horton, J. C. (2004). Bypassing V1: a direct
geniculate input to area MT. Nature Neuroscience, 7(10), 1123–1128.
doi:10.1038/nn1318
Solari, S. V. H., & Stoner, R. (2011). Cognitive consilience: primate non-primary
neuroanatomical circuits underlying cognition. Frontiers in neuroanatomy, 5, 65.
doi:10.3389/fnana.2011.00065
Soltani, A., & Koch, C. (2010). Visual saliency computations: mechanisms, constraints, and
the effect of feedback. The Journal of Neuroscience: The Official Journal of the Society
for Neuroscience, 30(38), 12831–12843. doi:10.1523/JNEUROSCI.1517-10.2010
Spatz, W. B., Tigges, J., & Tigges, M. (1970). Subcortical projections, cortical associations, and
some intrinsic interlaminar connections of the striate cortex in the squirrel monkey
(Saimiri). The Journal of Comparative Neurology, 140(2), 155–174.
doi:10.1002/cne.901400203
Spekreijse, Estevez, & Reitz. (1977). Visual evoked potential and the physiological analysis of
visual process in man. Visual Evoked Potentials in Man: New Developments (pp. 16–
85). Oxford: Clarendon.
Steriade, M., Oakson, G., & Ropert, N. (1982). Firing rates and patterns of midbrain reticular
neurons during steady and transitional states of the sleep-waking cycle. Experimental
Brain Research. Experimentelle Hirnforschung. Expérimentation Cérébrale, 46(1), 37–
51.
Sterzer, P., Haynes, J. D., & Rees, G. (2008). Fine-scale activity patterns in high-level visual
areas encode the category of invisible objects. Journal of Vision, 8(15), 10–10.
doi:10.1167/8.15.10
References
256
Suzuki, W A. (1999). The long and the short of it: memory signals in the medial temporal
lobe. Neuron, 24(2), 295–298.
Suzuki, Wendy A. (1996). The anatomy, physiology and functions of the perirhinal cortex.
Current Opinion in Neurobiology, 6(2), 179–186. doi:10.1016/S0959-4388(96)80071-7
Tallon-Baudry, C., Bertrand, O., Delpuech, C., & Permier, J. (1997). Oscillatory gamma-band
(30-70 Hz) activity induced by a visual search task in humans. The Journal of
Neuroscience: The Official Journal of the Society for Neuroscience, 17(2), 722–734.
Tanaka, K. (1997). Mechanisms of visual object recognition: monkey and human studies.
Current Opinion in Neurobiology, 7(4), 523–529.
Tanaka, K. (1983). Cross-correlation analysis of geniculostriate neuronal relationships in cats.
Journal of Neurophysiology, 49(6), 1303–1318.
Tanaka, Keiji. (1996). Representation of Visual Features of Objects in the Inferotemporal
Cortex. Neural Networks: The Official Journal of the International Neural Network
Society, 9(8), 1459–1475.
Tanaka, Keiji. (2003). Columns for complex visual object features in the inferotemporal
cortex: clustering of cells with similar but slightly different stimulus selectivities.
Cerebral Cortex (New York, N.Y.: 1991), 13(1), 90–99.
Tanaka, M., Lindsley, E., Lausmann, S., & Creutzfeldt, O. D. (1990). Afferent connections of
the prelunate visual association cortex (areas V4 and DP). Anatomy and Embryology,
181(1), 19–30.
Teng, S., Puri, A., & Whitney, D. (2012). Ultrafine spatial acuity of blind expert human
echolocators. Experimental Brain Research. Experimentelle Hirnforschung.
Expérimentation Cérébrale, 216(4), 483–488. doi:10.1007/s00221-011-2951-1
References
257
Thomas, O. M., Cumming, B. G., & Parker, A. J. (2002). A specialization for relative disparity
in V2. Nature Neuroscience, 5(5), 472–478. doi:10.1038/nn837
Thorpe, S., Fize, D., & Marlot, C. (1996). Speed of processing in the human visual system.
Nature, 381(6582), 520–522. doi:10.1038/381520a0
Thorpe, S. J., & Fabre-Thorpe, M. (2001). Neuroscience. Seeking categories in the brain.
Science (New York, N.Y.), 291(5502), 260–263.
Tombu, M., & Tsotsos, J. K. (2008). Attending to orientation results in an inhibitory surround
in orientation space. Perception & Psychophysics, 70(1), 30–35.
Tomycz, N. D., & Friedlander, R. M. (2011). Neuromodulation of the locus coeruleus: a key to
controlling wakefulness. Neurosurgery, 68(2), N14–15.
doi:10.1227/01.neu.0000393589.31014.61
Tong, F, Nakayama, K., Vaughan, J. T., & Kanwisher, N. (1998). Binocular rivalry and visual
awareness in human extrastriate cortex. Neuron, 21(4), 753–759.
Tong, Frank, Meng, M., & Blake, R. (2006). Neural bases of binocular rivalry. Trends in
Cognitive Sciences, 10(11), 502–511. doi:10.1016/j.tics.2006.09.003
Tononi, G, Srinivasan, R., Russell, D. P., & Edelman, G. M. (1998). Investigating neural
correlates of conscious perception by frequency-tagged neuromagnetic responses.
Proceedings of the National Academy of Sciences of the United States of America,
95(6), 3198–3203.
Tononi, Giulio. (2004). An information integration theory of consciousness. BMC
Neuroscience, 5, 42. doi:10.1186/1471-2202-5-42
Tootell, R. B., Dale, A. M., Sereno, M. I., & Malach, R. (1996). New images from human visual
cortex. Trends in Neurosciences, 19(11), 481–489.
References
258
Torralba, A., & Oliva, A. (2003). Statistics of natural image categories. Network (Bristol,
England), 14(3), 391–412.
Treisman, A. (1988). Features and objects: the fourteenth Bartlett memorial lecture. The
Quarterly Journal of Experimental Psychology. A, Human Experimental Psychology,
40(2), 201–237.
Treisman, A., & Sato, S. (1990). Conjunction search revisited. Journal of Experimental
Psychology. Human Perception and Performance, 16(3), 459–478.
Treue, S., & Maunsell, J. H. (1996). Attentional modulation of visual motion processing in
cortical areas MT and MST. Nature, 382(6591), 539–541. doi:10.1038/382539a0
Tse, P. U. (2004). Mapping visual attention with change blindness: new directions for a new
method. Cognitive Science, 28(2), 241–258. doi:10.1016/j.cogsci.2003.12.002
Tsotsos, J K. (1997). Limited capacity of any realizable perceptual system is a sufficient
reason for attentive behavior. Consciousness and Cognition, 6(2-3), 429–436.
doi:10.1006/ccog.1997.0302
Tsotsos, John K., Culhane, S. M., Kei Wai, W. Y., Lai, Y., Davis, N., & Nuflo, F. (1995). Modeling
visual attention via selective tuning. Artificial Intelligence, 78(1-2), 507–545.
doi:10.1016/0004-3702(95)00025-9
Tsunoda, K., Yamane, Y., Nishizaki, M., & Tanifuji, M. (2001). Complex objects are
represented in macaque inferotemporal cortex by the combination of feature
columns. Nature Neuroscience, 4(8), 832–838. doi:10.1038/90547
Ullman, S. (1984). Visual routines. Cognition, 18(1-3), 97–159.
Ullman, Shimon, Vidal-Naquet, M., & Sali, E. (2002). Visual features of intermediate
complexity and their use in classification. Nature Neuroscience. doi:10.1038/nn870
References
259
Ungerleider, L G, & Haxby, J. V. (1994). “What” and “where” in the human brain. Current
Opinion in Neurobiology, 4(2), 157–165.
Ungerleider, Leslie G., & Mishkin, M. (1982). Analysis of visual behavior : (articles first
presented to the NATO advanced study institute on new advances in the analysis of
visual behavior; Waltham - Mass, June 1978). (M. NATO Advanced Study Institute on
New Advances in the Analysis of Visual Behavior (1978 ; Waltham, Ed.). Cambridge -
Mass.& London: MIT Press.
Van Essen, D. C., & Gallant, J. L. (1994). Neural mechanisms of form and motion processing in
the primate visual system. Neuron, 13(1), 1–10.
van Gaal, S., de Lange, F. P., & Cohen, M. X. (2012). The role of consciousness in cognitive
control and decision making. Frontiers in Human Neuroscience, 6.
doi:10.3389/fnhum.2012.00121
Van Horn, S. C., Erişir, A., & Sherman, S. M. (2000). Relative distribution of synapses in the A-
laminae of the lateral geniculate nucleus of the cat. The Journal of Comparative
Neurology, 416(4), 509–520.
VanRullen, R. (2006). On second glance: still no high-level pop-out effect for faces. Vision
Research, 46(18), 3017–3027. doi:10.1016/j.visres.2005.07.009
VanRullen, R., Guyonneau, R., & Thorpe, S. J. (2005). Spike times make sense. Trends in
Neurosciences, 28(1), 1–4. doi:10.1016/j.tins.2004.10.010
VanRullen, R., & Koch, C. (2003). Visual selective behavior can be triggered by a feed-forward
process. Journal of Cognitive Neuroscience, 15(2), 209–217.
doi:10.1162/089892903321208141
VanRullen, R., & Thorpe, S. J. (2002). Surfing a spike wave down the ventral stream. Vision
Research, 42(23), 2593–2615.
References
260
Vecera, S. P., & Farah, M. J. (1994). Does visual attention select objects or locations? Journal
of Experimental Psychology. General, 123(2), 146–160.
Vialatte, François-Benoît, Maurice, M., Dauwels, J., & Cichocki, A. (2010). Steady-state
visually evoked potentials: Focus on essential paradigms and future perspectives.
Progress in Neurobiology, 90(4), 418–438. doi:10.1016/j.pneurobio.2009.11.005
Vialatte, François-Benoit, Maurice, M., Dauwels, J., & Cichocki, A. (2008). Steady state visual
evoked potentials in the delta range (0.5-5 Hz) (pp. 400–407). Presented at the
Proceedings of the 15th international conference on Advances in neuro-information
processing - Volume Part I, Springer-Verlag. Retrieved from
http://dl.acm.org/citation.cfm?id=1813488.1813540
Vidal, J. R., Chaumon, M., O’Regan, J. K., & Tallon-Baudry, C. (2006). Visual Grouping and the
Focusing of Attention Induce Gamma-band Oscillations at Different Frequencies in
Human Magnetoencephalogram Signals. J. Cognitive Neuroscience, 18(11), 1850–
1862. doi:10.1162/jocn.2006.18.11.1850
von der Heydt, R., Peterhans, E., & Baumgartner, G. (1984). Illusory contours and cortical
neuron responses. Science (New York, N.Y.), 224(4654), 1260–1262.
Voogd, J., Schraa-Tam, C. K. L., van der Geest, J. N., & De Zeeuw, C. I. (2010). Visuomotor
Cerebellum in Human and Nonhuman Primates. Cerebellum (London, England).
doi:10.1007/s12311-010-0204-7
Vossel, S., Thiel, C. M., & Fink, G. R. (2006). Cue validity modulates the neural correlates of
covert endogenous orienting of attention in parietal and frontal cortex. NeuroImage,
32(3), 1257–1264. doi:10.1016/j.neuroimage.2006.05.019
References
261
Wang, H. F., Friel, N., Gosselin, F., & Schyns, P. G. (2011). Efficient bubbles for visual
categorization tasks. Vision Research, 51(12), 1318–1323.
doi:10.1016/j.visres.2011.04.007
Wang, X.-J. (2010). Neurophysiological and computational principles of cortical rhythms in
cognition. Physiological Reviews, 90(3), 1195–1268. doi:10.1152/physrev.00035.2008
Ward, L. M. (2011). The thalamic dynamic core theory of conscious experience.
Consciousness and Cognition, 20(2), 464–486. doi:10.1016/j.concog.2011.01.007
Ward, R., & Jackson, S. R. (2002). Visual attention in blindsight: sensitivity in the blind field
increased by targets in the sighted field. Neuroreport, 13(3), 301–304.
Warrington, E. K. (1982). Neuropsychological studies of object recognition. Philosophical
Transactions of the Royal Society of London. Series B, Biological Sciences, 298(1089),
15–33.
Watanabe, M., Cheng, K., Murayama, Y., Ueno, K., Asamizuya, T., Tanaka, K., & Logothetis, N.
(2011). Attention But Not Awareness Modulates the BOLD Signal in the Human V1
During Binocular Suppression. Science, 334(6057), 829–831.
doi:10.1126/science.1203161
Wiesel, T. N., & Hubel, D. H. (1966). Spatial and chromatic interactions in the lateral
geniculate body of the rhesus monkey. Journal of Neurophysiology, 29(6), 1115–
1156.
Wilson, M. E., & Cragg, B. G. (1967). Projections from the lateral geniculate nucleus in the cat
and monkey. Journal of Anatomy, 101(Pt 4), 677–692.
Wolfe, J. M., Cave, K. R., & Franzel, S. L. (1989). Guided search: an alternative to the feature
integration model for visual search. Journal of Experimental Psychology. Human
Perception and Performance, 15(3), 419–433.
References
262
Womelsdorf, T., & Fries, P. (2007). The role of neuronal synchronization in selective
attention. Current Opinion in Neurobiology, 17(2), 154–160.
doi:10.1016/j.conb.2007.02.002
Womelsdorf, T., Schoffelen, J.-M., Oostenveld, R., Singer, W., Desimone, R., Engel, A. K., &
Fries, P. (2007). Modulation of Neuronal Interactions Through Neuronal
Synchronization. Science, 316(5831), 1609–1612. doi:10.1126/science.1139597
Wong-Riley, M. (1978). Reciprocal connections between striate and prestriate cortex in
squirrel monkey as demonstrated by combined peroxidase histochemistry and
autoradiography. Brain Research, 147(1), 159–164.
Wong-Riley, M. T. (1977). Connections between the pulvinar nucleus and the prestriate
cortex in the squirrel monkey as revealed by peroxidase histochemistry and
autoradiography. Brain Research, 134(2), 249–267.
Wright, R. D., & Ward, L. M. (2008). Orienting of attention. Oxford; New York: Oxford
University Press.
Xu, X., Ichida, J. M., Allison, J. D., Boyd, J. D., Bonds, A. B., & Casagrande, V. A. (2001). A
comparison of koniocellular, magnocellular and parvocellular receptive field
properties in the lateral geniculate nucleus of the owl monkey (Aotus trivirgatus). The
Journal of Physiology, 531(Pt 1), 203–218.
Yantis, S., & Jonides, J. (1990). Abrupt visual onsets and selective attention: voluntary versus
automatic allocation. Journal of Experimental Psychology. Human Perception and
Performance, 16(1), 121–134.
Yeshurun, Y., Montagna, B., & Carrasco, M. (2008). On the flexibility of sustained attention
and its effects on a texture segmentation task. Vision Research, 48(1), 80–95.
doi:10.1016/j.visres.2007.10.015
References
263
Yoshida, K., & Benevento, L. A. (1981). The projection from the dorsal lateral geniculate
nucleus of the thalamus to extrastriate visual association cortex in the macaque
monkey. Neuroscience Letters, 22(2), 103–108.
Young, M. P., & Yamane, S. (1992). Sparse population coding of faces in the inferotemporal
cortex. Science (New York, N.Y.), 256(5061), 1327–1331.
Zeki, S. (1995). The motion vision of the blind. NeuroImage, 2(3), 231–235.
doi:10.1006/nimg.1995.1030
Zeki, S. (2003). The disunity of consciousness. Trends in Cognitive Sciences, 7(5), 214–218.
Zeki, S, & Bartels, A. (1999). Toward a theory of visual consciousness. Consciousness and
Cognition, 8(2), 225–259. doi:10.1006/ccog.1999.0390
Zeki, Semir. (2008). The disunity of consciousness. Progress in Brain Research, 168, 11–18.
doi:10.1016/S0079-6123(07)68002-9
Zhan, C. A., & Baker, C. L., Jr. (2008). Critical spatial frequencies for illusory contour
processing in early visual cortex. Cerebral Cortex (New York, N.Y.: 1991), 18(5), 1029–
1041. doi:10.1093/cercor/bhm139
Zhaoping, L. (2005). Border ownership from intracortical interactions in visual area v2.
Neuron, 47(1), 143–153. doi:10.1016/j.neuron.2005.04.005
Zhou, H., Friedman, H. S., & von der Heydt, R. (2000). Coding of border ownership in monkey
visual cortex. The Journal of Neuroscience: The Official Journal of the Society for
Neuroscience, 20(17), 6594–6611.

References
264