horizontal‐to‐vertical spectrum ratio of earthquake ground motion for site characterization
TRANSCRIPT

EARTHQUAKE ENGINEERING AND STRUCTURAL DYNAMICS, VOL. 26, 671—689 (1997)
HORIZONTAL-TO-VERTICAL SPECTRUM RATIO OFEARTHQUAKE GROUND MOTION FOR SITE
CHARACTERIZATION
FUMIO YAMAZAKI1*s AND MEHEDI A. ANSARY2t
1 Institute of Industrial Science, The University of Tokyo, 7-22-1 Roppongi, Minato-ku, Tokyo 106, Japan2 Department of Civil Engineering, Bangladesh University of Engineering and Technology, Dhaka 1000, Bangladesh
SUMMARY
Nakamura’s method, which uses a horizontal-to-vertical Fourier spectrum ratio of microtremor, has become popular todetermine the predominant period and amplification of a site. In this study, this method is extended for earthquakeground motion recordings using new strong motion data recorded by JMA-87-type accelerometers. From the analysis ofthese accelerograms, horizontal-to-vertical Fourier spectrum ratios of a site for different earthquakes are also found to bestable irrespective of magnitude, distance and depth. To establish this fact, attenuation relations of velocity responsespectra for horizontal and vertical components are derived for three damping ratios (0, 2 and 5 per cent) using the JMAdata. Then the horizontal-to-vertical ratios of the velocity response spectra are obtained. The results show that thehorizontal and vertical velocity response spectra are dependent on magnitude, distance and depth, but that their ratiosare almost independent of magnitude, distance and depth. However, since the current data set consists of mostlyintermediate to far field data, this observation should be limited to records of these distance ranges. Introducing stationcoefficients, representing site amplification, to this relation yields the value comparable to the horizontal-to-verticalFourier spectrum ratio at a specific site. The stability of the spectrum ratio is explained by the transfer function betweenthe ground surface and stiff-soil outcrop due to S-wave propagation. These results suggest that site amplificationcharacteristics can be evaluated by one-point two-component surface recordings of earthquake ground motion, ina similar manner as proposed by Nakamura for microtremor. ( 1997 by John Wiley & Sons, Ltd.
Earthquake Engng. Struct. Dyn., 26, 671—689 (1997)
No. of Figures: 10. No. of Tables: 5. No. of References: 18.
KEY WORDS: velocity response spectrum; Fourier spectrum; attenuation relation; horizontal-to-vertical spectrum ratio;site characterization; JMA-87-type accelerometer
INTRODUCTION
In order to evaluate site amplification characteristics during earthquakes, Nakamura1 proposed a method toestimate the horizontal-to-vertical (H/V) Fourier spectrum ratio of microtremor. The method was extensive-ly used in Japan2~4 and in some other countries.5~9
In the last few years, several researchers5,7,9 attempted to apply the Nakamura’s method (H/V ratio) forearthquake ground motion and compared Fourier spectrum ratios for earthquakes and microtremors. Inthose studies, applicability of Nakamura’s technique for the intense body-wave part of earthquake recordswere discussed. Then the amplitude ratios were found to be stable irrespective of magnitude, location and
* Correspondence to: Fumio Yamazaki, Institute of Industrial Science, University of Tokyo, 7-22-1 Roppongi, Minato-ku, Tokyo 106,Japan
s Associate Professort Assistant Professor (former graduate student of University of Tokyo)
CCC 0098—8847/97/070671—19$17·50 Received 1 August 1996( 1997 by John Wiley & Sons, Ltd. Revised 13 November 1996
depth of earthquake events. However, the physical reason for the stability was not provided by these studiesand hence, questions still remain to the applicability of Nakamura’s method to earthquakes. From thesepoints of view, this paper attempts to explain the stability of the H/V ratio of Fourier spectra usingattenuation relations for earthquake ground motion.
There exist a few attenuation models which deal with Fourier spectrum10,11 and relative velocity responsespectrum.12~15 Theoretically, the Fourier amplitude spectrum can be approximated by the relative velocityresponse spectrum with low damping ratio. The same form of attenuation models was used for the both typesof spectrum amplitudes.14 Although Trifunac and Lee’s attenuation relation11 considers a local soil type,local geological conditions (depth of sediments) and directional dependence of amplification, these factors arestill inadequate to evaluate the local site amplification reliably. More recently, Bozorgnia et al.13,15 estimatedattenuation models of relative velocity spectra for specific fault areas and particular soil types. Also in thispaper, attenuation relations for velocity response spectra are used since they have less fluctuation thanFourier spectra do.
As an attenuation model, the one proposed recently by Molas and Yamazaki16,17 using new JMA (JapanMeteorological Agency) data is selected. The model was proposed for acceleration and velocity responsespectra17 as well as for peak ground acceleration and velocity.16 In the model, site amplification wasconsidered by assigning a station coefficient for each recording station. This was made possible since severalearthquakes were recorded at each JMA station.
In this paper, stability of Fourier spectrum ratio (H/V) for different earthquakes is examined using theJMA records. The stability of the spectrum ratio is reconfirmed through the attenuation relations for thevelocity response spectra with low damping ratio. Finally, the reason for the stability of the spectrum ratio isdiscussed using strong motion data from sites whose soil structures are known and the theoretical transferfunctions for S- and P-waves. The aim of this study is to provide a theoretical basis of the use oftwo-component surface recording at a site for site characterization.
EARTHQUAKE RECORDS
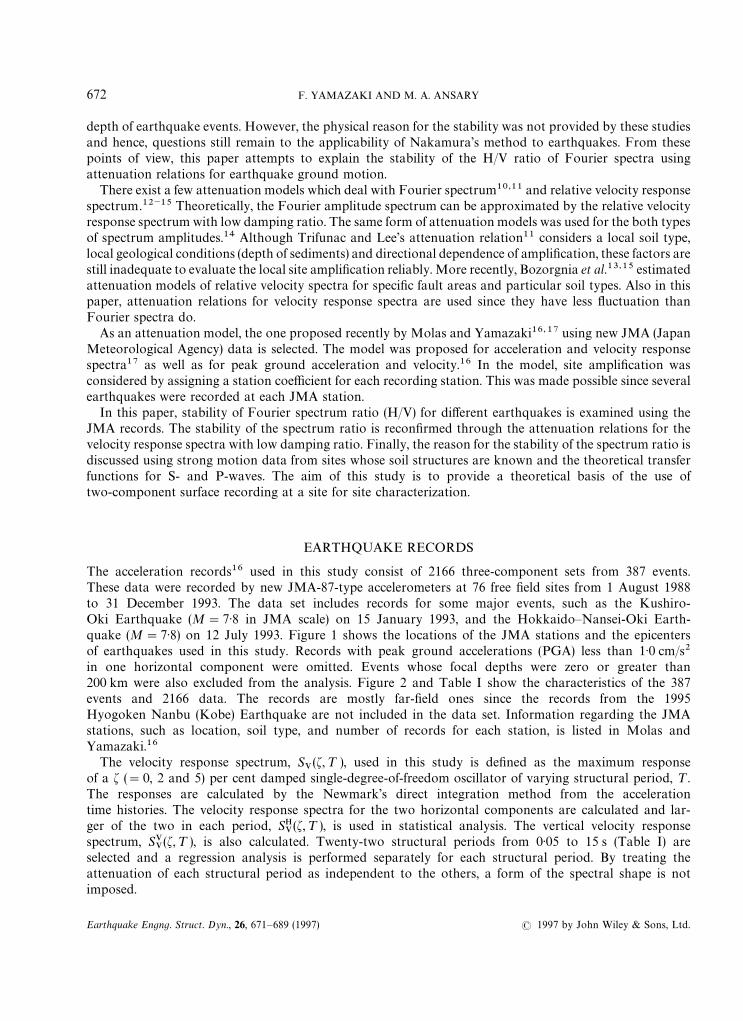
The acceleration records16 used in this study consist of 2166 three-component sets from 387 events.These data were recorded by new JMA-87-type accelerometers at 76 free field sites from 1 August 1988to 31 December 1993. The data set includes records for some major events, such as the Kushiro-Oki Earthquake (M"7·8 in JMA scale) on 15 January 1993, and the Hokkaido—Nansei-Oki Earth-quake (M"7·8) on 12 July 1993. Figure 1 shows the locations of the JMA stations and the epicentersof earthquakes used in this study. Records with peak ground accelerations (PGA) less than 1·0 cm/s2in one horizontal component were omitted. Events whose focal depths were zero or greater than200 km were also excluded from the analysis. Figure 2 and Table I show the characteristics of the 387events and 2166 data. The records are mostly far-field ones since the records from the 1995Hyogoken Nanbu (Kobe) Earthquake are not included in the data set. Information regarding the JMAstations, such as location, soil type, and number of records for each station, is listed in Molas andYamazaki.16
The velocity response spectrum, SV(f,¹ ), used in this study is defined as the maximum response
of a f ("0, 2 and 5) per cent damped single-degree-of-freedom oscillator of varying structural period, ¹.The responses are calculated by the Newmark’s direct integration method from the accelerationtime histories. The velocity response spectra for the two horizontal components are calculated and lar-ger of the two in each period, SH
V(f,¹ ), is used in statistical analysis. The vertical velocity response
spectrum, SVV(f,¹ ), is also calculated. Twenty-two structural periods from 0·05 to 15 s (Table I) are
selected and a regression analysis is performed separately for each structural period. By treating theattenuation of each structural period as independent to the others, a form of the spectral shape is notimposed.
672 F. YAMAZAKI AND M. A. ANSARY
Earthquake Engng. Struct. Dyn., 26, 671—689 (1997) ( 1997 by John Wiley & Sons, Ltd.
Fig
ure
1.Loc
atio
nof
(a)JM
Are
cord
ing
stat
ions
(trian
gles
)an
d(b
)ep
icen
ters
ofea
rthq
uak
es(c
ircl
es)us
edin
this
stud
y(M
olas
and
Yam
azak
i16)
EARTHQUAKE GROUND MOTION FOR SITE CHARACTERIZATION 673
( 1997 by John Wiley & Sons, Ltd. Earthquake Engng. Struct. Dyn., 26, 671—689 (1997)

Figure 2. Distribution of (a) depth, (b) distance, and (c) magnitude and peak ground acceleration of the records used in this study and (d)the histogram of the number of records per station (Molas and Yamazaki16)
STABILITY OF FOURIER SPECTRUM RATIO
The Fourier amplitude ratios of the two horizontal directions of an earthquake record, RNS
(¹ ) and REW
(¹ ),are estimated using the following equation:
RNS
(¹ )"FNS
(¹ )
FUD
(¹ ); R
EW(¹ )"
FEW
(¹ )
FUD
(¹ )(1)
where FNS
(¹ ), FEW
(¹ ) and FUD
(¹ ) are the acceleration Fourier amplitude spectra in the NS-, EW- andUD- directions, respectively.
Among the 76 JMA stations, four stations (Hachinohe, Kushiro, Mito, Tokyo) are selected for demon-stration of the Fourier spectrum ratios. These stations have observed the largest number of recordings.For each station, ten largest accelerograms were selected for the estimation of the (H/V) Fourier spectrumratio.
Figure 3 shows the Fourier spectra of the NS- and UD-components for the four JMA stations. Eachearthquake record used for this study is at least of 20 s length. Although the amplitude of the Fourier spectrafor the different events differ, the shapes of the spectra at the same station show similarity. Figure 3 also
674 F. YAMAZAKI AND M. A. ANSARY
Earthquake Engng. Struct. Dyn., 26, 671—689 (1997) ( 1997 by John Wiley & Sons, Ltd.
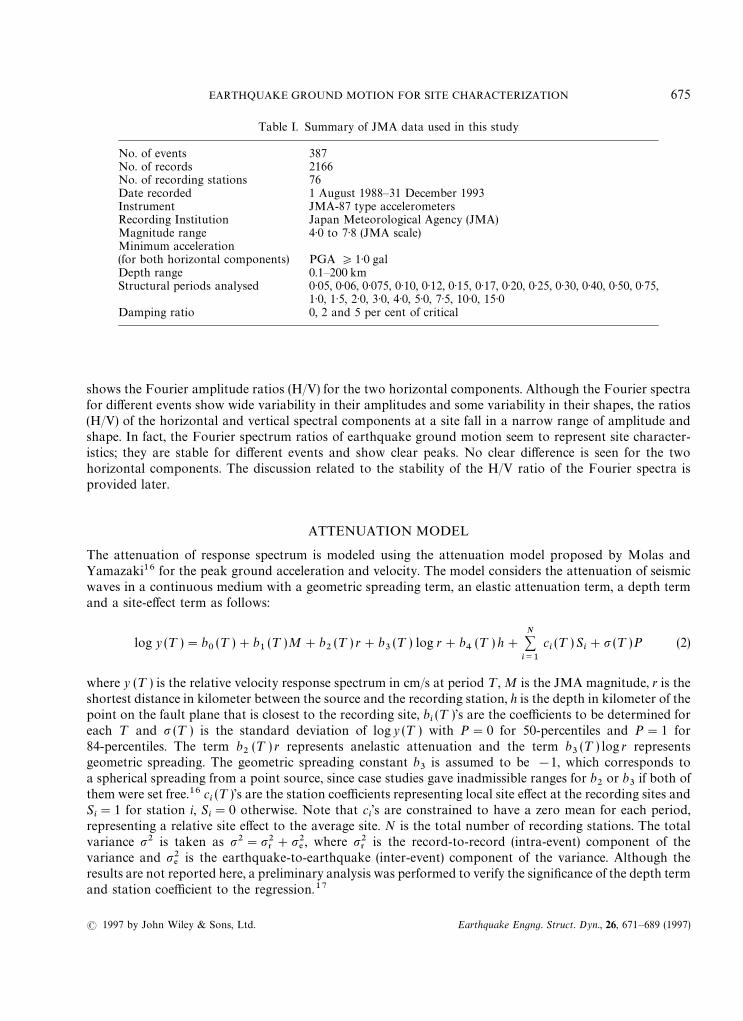
Table I. Summary of JMA data used in this study
No. of events 387No. of records 2166No. of recording stations 76Date recorded 1 August 1988—31 December 1993Instrument JMA-87 type accelerometersRecording Institution Japan Meteorological Agency (JMA)Magnitude range 4·0 to 7·8 (JMA scale)Minimum acceleration(for both horizontal components) PGA *1·0 galDepth range 0.1—200 kmStructural periods analysed 0·05, 0·06, 0·075, 0·10, 0·12, 0·15, 0·17, 0·20, 0·25, 0·30, 0·40, 0·50, 0·75,
1·0, 1·5, 2·0, 3·0, 4·0, 5·0, 7·5, 10·0, 15·0Damping ratio 0, 2 and 5 per cent of critical
shows the Fourier amplitude ratios (H/V) for the two horizontal components. Although the Fourier spectrafor different events show wide variability in their amplitudes and some variability in their shapes, the ratios(H/V) of the horizontal and vertical spectral components at a site fall in a narrow range of amplitude andshape. In fact, the Fourier spectrum ratios of earthquake ground motion seem to represent site character-istics; they are stable for different events and show clear peaks. No clear difference is seen for the twohorizontal components. The discussion related to the stability of the H/V ratio of the Fourier spectra isprovided later.
ATTENUATION MODEL
The attenuation of response spectrum is modeled using the attenuation model proposed by Molas andYamazaki16 for the peak ground acceleration and velocity. The model considers the attenuation of seismicwaves in a continuous medium with a geometric spreading term, an elastic attenuation term, a depth termand a site-effect term as follows:
log y (¹ )"b0(¹ )#b
1(¹ )M#b
2(¹ ) r#b
3(¹ ) log r#b
4(¹ ) h#
N+i/1
ci(¹ ) S
i#p (¹ )P (2)
where y (¹ ) is the relative velocity response spectrum in cm/s at period ¹, M is the JMA magnitude, r is theshortest distance in kilometer between the source and the recording station, h is the depth in kilometer of thepoint on the fault plane that is closest to the recording site, b
i(¹ )’s are the coefficients to be determined for
each ¹ and p (¹ ) is the standard deviation of log y (¹ ) with P"0 for 50-percentiles and P"1 for84-percentiles. The term b
2(¹ ) r represents anelastic attenuation and the term b
3(¹ ) log r represents
geometric spreading. The geometric spreading constant b3
is assumed to be !1, which corresponds toa spherical spreading from a point source, since case studies gave inadmissible ranges for b
2or b
3if both of
them were set free.16 ci(¹ )’s are the station coefficients representing local site effect at the recording sites and
Si"1 for station i, S
i"0 otherwise. Note that c
i’s are constrained to have a zero mean for each period,
representing a relative site effect to the average site. N is the total number of recording stations. The totalvariance p2 is taken as p2"p2
3#p2
%, where p2
3is the record-to-record (intra-event) component of the
variance and p2%
is the earthquake-to-earthquake (inter-event) component of the variance. Although theresults are not reported here, a preliminary analysis was performed to verify the significance of the depth termand station coefficient to the regression.17
EARTHQUAKE GROUND MOTION FOR SITE CHARACTERIZATION 675
( 1997 by John Wiley & Sons, Ltd. Earthquake Engng. Struct. Dyn., 26, 671—689 (1997)
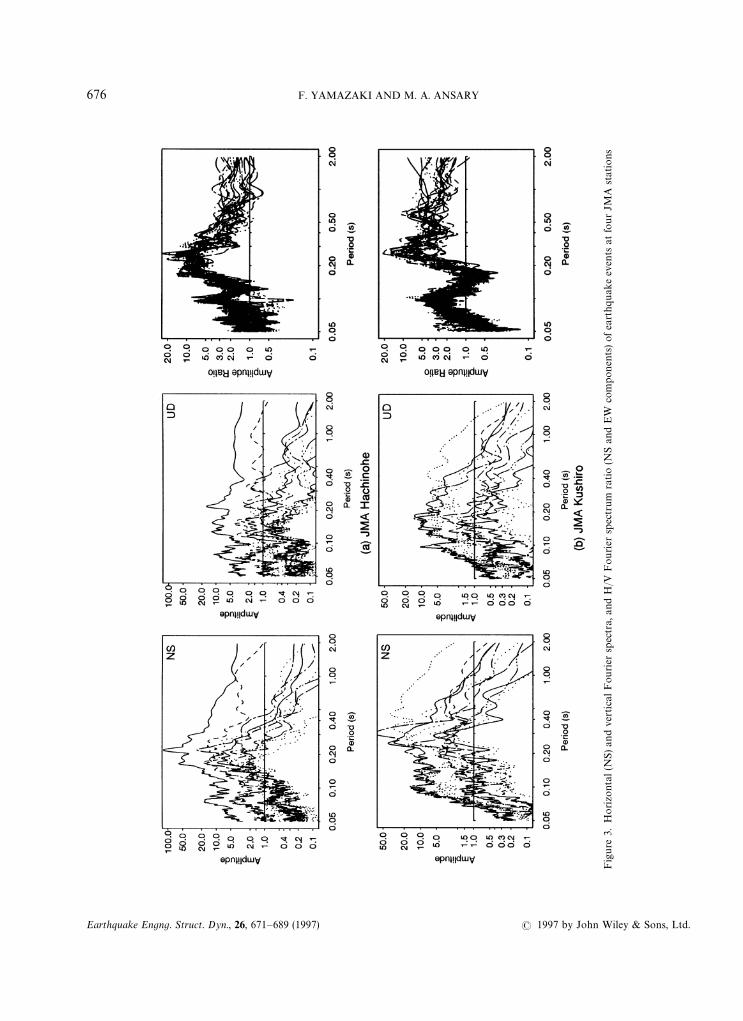
Fig
ure
3.H
orizo
ntal
(NS)an
dve
rtic
alF
ourier
spec
tra,
and
H/V
Fourier
spec
trum
ratio
(NS
and
EW
com
pon
ents
)of
eart
hquak
eev
ents
atfo
ur
JMA
stat
ions
676 F. YAMAZAKI AND M. A. ANSARY
Earthquake Engng. Struct. Dyn., 26, 671—689 (1997) ( 1997 by John Wiley & Sons, Ltd.

Fig
ure
3.(c
ontinu
ed)
EARTHQUAKE GROUND MOTION FOR SITE CHARACTERIZATION 677
( 1997 by John Wiley & Sons, Ltd. Earthquake Engng. Struct. Dyn., 26, 671—689 (1997)

Although r is defined as the shortest distance from the recording site to the plane of the fault rupture,published reports of fault extent are either difficult to find or nonexistent for the events in the data set exceptfor two large earthquakes (the 1993 Kushiro-Oki and the 1993 Hokkaido—Nansei-Oki with both M"7·8).Because most of the records are in the far-field and smaller magnitude, the use of the hypocentral distance ispractical and justified for them.
Since regression analysis is performed for each structural period independently, the index ¹ indicating thefrequency dependence of each variable will be dropped from the equations for simplicity. It is thusunderstood that the regression procedure is performed separately for each structural period.
The attenuation relations of the relative velocity response spectrum with damping ratio f, SV(f,¹ ), for
horizontal and vertical components are used to explain the reason behind the stability of the horizontal-to-vertical Fourier spectrum ratio at each station. The attenuation relations for the two components at stationi are written as follows for the 50 percentile values:
log SHV
(f,¹ )"bH0#bH
1M#bH
2r#bH
3log r#bH
4h#cH
i(3)
log SVV
(f,¹ )"bV0#bV
1M#bV
2r#bV
3log r#bV
4h#cV
i(4)
where the superscript ‘H’ represents the horizontal component and ‘V’ the vertical component.Then the ratio of the two equations yields
logSHV
(f,¹ )
SVV
(f,¹ )"(bH
0!bV
0)#(bH
1!bV
1) M#(bH
2!bV
2) r#(bH
4!bV
4) h#(cH
i!cV
i) (5)
Note that log r term is dropped in equation (5) due to the assumption of bH3"bV
3"!1. In the following
section, variability of SHV(f,¹ ), SV
V(f,¹ ) and SH
V(f,¹ )/SV
V(f,¹ ) will be examined as a function of magnitude,
distance, depth, and recording site.
ANALYSIS OF HORIZONTAL AND VERTICAL VELOCITY RESPONSE SPECTRA
Regression coefficients
Regression analysis is performed for the relative velocity response spectra with three damping ratios (0, 2,5 per cent) using the JMA data with 2166 three-component sets. Figure 4 shows the period-dependency of thefour regression coefficients (b
0, b
1, b
2, b
4) of the horizontal and vertical velocity response spectra with the
three damping ratios. The coefficients for three damping ratios looks quite similar for both horizontal andvertical components. Note that the approximation of acceleration Fourier spectrum by velocity responsespectrum is valid for zero damping ratio. But at zero damping, the response spectrum may fluctuate. Sincethe regression coefficients are close for the three damping ratios, a small damping value (2%) is used in thefollowing analysis. Tables II and III show the regression coefficients of the relative velocity response spectrawith 2 per cent damping for the horizontal and vertical components, respectively.
In Figure 4, the four regression coefficients for the horizontal and vertical components are seen to behavequite similar manner to the period axis. The regression intercept, b
0, for the horizontal component is slightly
higher than that for the vertical component although their trends are very similar. The magnitude coefficient,b1, is almost the same for the two components. The coefficient is nearly constant at periods below 0·1 s, it has
an increasing trend as the structural period increases from 0·1 to 1·5 s and has a decreasing trend as thestructural period increases from 1·5 to 15 s. Similar trends have also been observed by Joyner and Boore.12
The absolute value of the anelastic attenuation rate, b2, decreases as the structural period increase. This
trend is consistent with the observation that high-frequency contents of strong ground motion are attenuatedfaster than low-frequency contents. The depth effect coefficient, b
4, decreases as the structural period
increases. The depth effect becomes almost constant for periods of 1 s and above.
678 F. YAMAZAKI AND M. A. ANSARY
Earthquake Engng. Struct. Dyn., 26, 671—689 (1997) ( 1997 by John Wiley & Sons, Ltd.

Figure 4. Regression coefficients for attenuation relations of SHV
(f,¹ ) and SVV
(f,¹ ) for three damping ratios (0, 2 and 5 per cent)
Spectral shape
An important aspect of response spectra is the spectral shape since this will largely determine theexpected response of a given structure. By taking the regression for several structural periods indepen-dently, it is not necessary to pre-determine the shape of response spectra. Figure 5 compares the spectralshapes for different magnitudes, source-site distances, and source depth. Note that the station coefficient is setto be the mean value (c
i"0) of all the stations in the figure. It can be seen that the spectral amplitude of both
the horizontal and vertical velocity responses depend on magnitude and distance, and to some extent ondepth.
Figures 5(a) and 5(b) show the mean horizontal and vertical velocity response spectra (SV) for a given depth
and distance with changes in magnitude. The structural period where the peak of the response spectra occursincreases as the magnitude increases. Figures 5(d) and 5(e) compare the mean horizontal and vertical S
Vfor
a given magnitude and depth with changes in the shortest distance. Figures 5(g) and 5(h) show the meanhorizontal and vertical S
Vfor a given magnitude and source-site distance with changes in depth. Higher
response can be observed for deeper events. There is a slight shift of the peak to a shorter structural period asthe source depth increases, particularly for the vertical component.
EARTHQUAKE GROUND MOTION FOR SITE CHARACTERIZATION 679
( 1997 by John Wiley & Sons, Ltd. Earthquake Engng. Struct. Dyn., 26, 671—689 (1997)
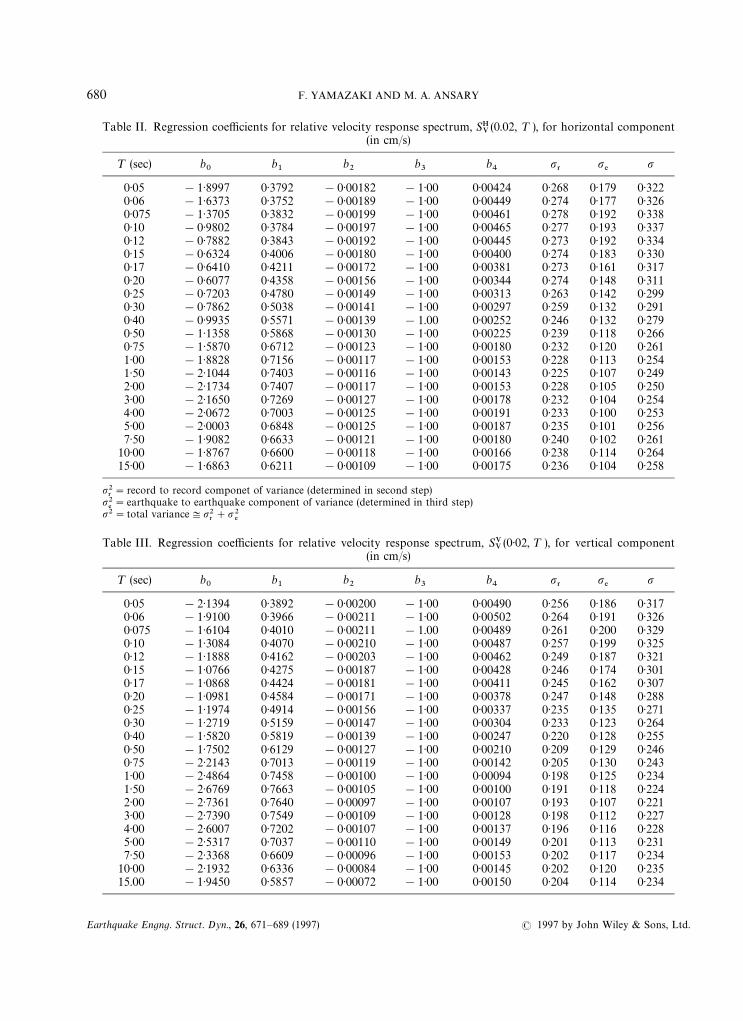
Table II. Regression coefficients for relative velocity response spectrum, SHV(0.02, ¹ ), for horizontal component
(in cm/s)
¹ (sec) b0
b1
b2
b3
b4
p3
p%
p
0·05 !1·8997 0·3792 !0·00182 !1·00 0·00424 0·268 0·179 0·3220·06 !1·6373 0·3752 !0·00189 !1·00 0·00449 0·274 0·177 0·3260·075 !1·3705 0·3832 !0·00199 !1·00 0·00461 0·278 0·192 0·3380·10 !0·9802 0·3784 !0·00197 !1·00 0·00465 0·277 0·193 0·3370·12 !0·7882 0·3843 !0·00192 !1·00 0·00445 0·273 0·192 0·3340·15 !0·6324 0·4006 !0·00180 !1·00 0·00400 0·274 0·183 0·3300·17 !0·6410 0·4211 !0·00172 !1·00 0·00381 0·273 0·161 0·3170·20 !0·6077 0·4358 !0·00156 !1·00 0·00344 0·274 0·148 0·3110·25 !0·7203 0·4780 !0·00149 !1·00 0·00313 0·263 0·142 0·2990·30 !0·7862 0·5038 !0·00141 !1·00 0·00297 0·259 0·132 0·2910·40 !0·9935 0·5571 !0·00139 !1.00 0·00252 0·246 0·132 0·2790·50 !1·1358 0·5868 !0·00130 !1·00 0·00225 0·239 0·118 0·2660·75 !1·5870 0·6712 !0·00123 !1·00 0·00180 0·232 0·120 0·2611·00 !1·8828 0·7156 !0·00117 !1·00 0·00153 0·228 0·113 0·2541·50 !2·1044 0·7403 !0·00116 !1·00 0·00143 0·225 0·107 0·2492·00 !2·1734 0·7407 !0·00117 !1·00 0·00153 0·228 0·105 0·2503·00 !2·1650 0·7269 !0·00127 !1·00 0·00178 0·232 0·104 0·2544·00 !2·0672 0·7003 !0·00125 !1·00 0·00191 0·233 0·100 0·2535·00 !2·0003 0·6848 !0·00125 !1·00 0·00187 0·235 0·101 0·2567·50 !1·9082 0·6633 !0·00121 !1·00 0·00180 0·240 0·102 0·261
10·00 !1·8767 0·6600 !0·00118 !1·00 0·00166 0·238 0·114 0·26415·00 !1·6863 0·6211 !0·00109 !1·00 0·00175 0·236 0·104 0·258
p23"record to record componet of variance (determined in second step)
p2%"earthquake to earthquake component of variance (determined in third step)
p2"total variance:p23#p2
%
Table III. Regression coefficients for relative velocity response spectrum, SVV(0·02, ¹ ), for vertical component
(in cm/s)
¹ (sec) b0
b1
b2
b3
b4
p3
p%
p
0·05 !2·1394 0·3892 !0·00200 !1·00 0·00490 0·256 0·186 0·3170·06 !1·9100 0·3966 !0·00211 !1·00 0·00502 0·264 0·191 0·3260·075 !1·6104 0·4010 !0·00211 !1.00 0·00489 0·261 0·200 0·3290·10 !1·3084 0·4070 !0·00210 !1·00 0·00487 0·257 0·199 0·3250·12 !1·1888 0·4162 !0·00203 !1·00 0·00462 0·249 0·187 0·3210·15 !1·0766 0·4275 !0·00187 !1·00 0·00428 0·246 0·174 0·3010·17 !1·0868 0·4424 !0·00181 !1·00 0·00411 0·245 0·162 0·3070·20 !1·0981 0·4584 !0·00171 !1·00 0·00378 0·247 0·148 0·2880·25 !1·1974 0·4914 !0·00156 !1·00 0·00337 0·235 0·135 0·2710·30 !1·2719 0·5159 !0·00147 !1·00 0·00304 0·233 0·123 0·2640·40 !1·5820 0·5819 !0·00139 !1·00 0·00247 0·220 0·128 0·2550·50 !1·7502 0·6129 !0·00127 !1·00 0·00210 0·209 0·129 0·2460·75 !2·2143 0·7013 !0·00119 !1·00 0·00142 0·205 0·130 0·2431·00 !2·4864 0·7458 !0·00100 !1·00 0·00094 0·198 0·125 0·2341·50 !2·6769 0·7663 !0·00105 !1·00 0·00100 0·191 0·118 0·2242·00 !2·7361 0·7640 !0·00097 !1·00 0·00107 0·193 0·107 0·2213·00 !2·7390 0·7549 !0·00109 !1·00 0·00128 0·198 0·112 0·2274·00 !2·6007 0·7202 !0·00107 !1·00 0·00137 0·196 0·116 0·2285·00 !2·5317 0·7037 !0·00110 !1·00 0·00149 0·201 0·113 0·2317·50 !2·3368 0·6609 !0·00096 !1·00 0·00153 0·202 0·117 0·234
10·00 !2·1932 0·6336 !0·00084 !1·00 0·00145 0·202 0·120 0·23515.00 !1·9450 0·5857 !0·00072 !1·00 0·00150 0·204 0·114 0·234
680 F. YAMAZAKI AND M. A. ANSARY
Earthquake Engng. Struct. Dyn., 26, 671—689 (1997) ( 1997 by John Wiley & Sons, Ltd.
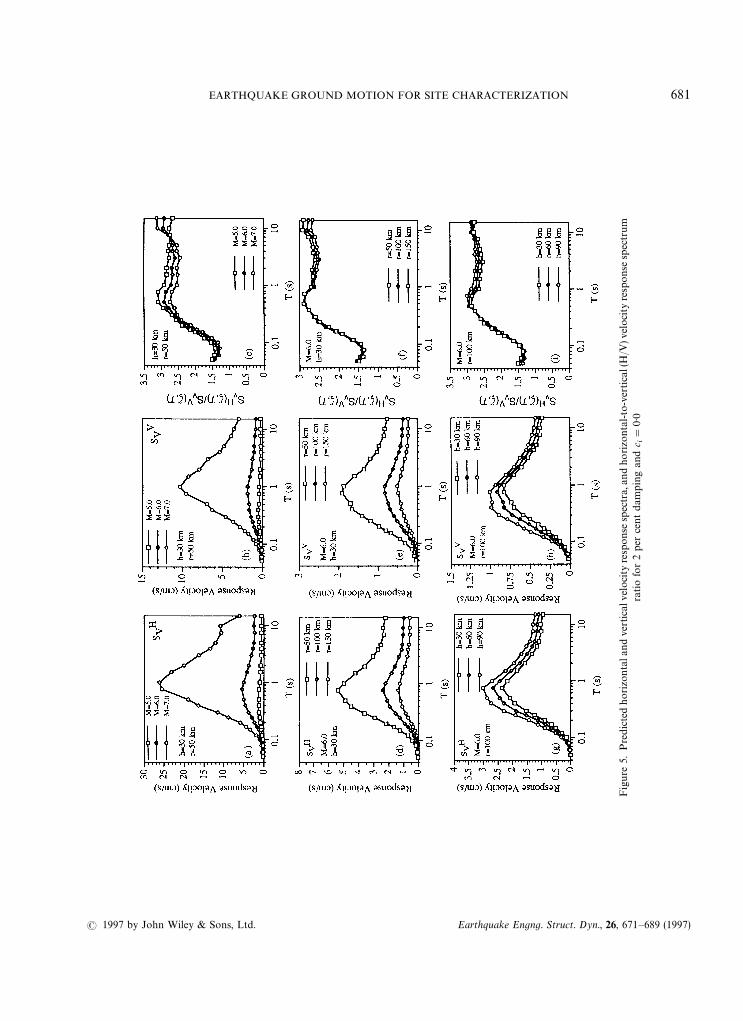
Fig
ure
5.P
redic
ted
hor
izon
tala
nd
vert
ical
velo
city
resp
ons
esp
ectr
a,an
dho
rizo
ntal
-to-
vert
ical
(H/V
)vel
ocity
resp
ons
esp
ectr
um
ratio
for
2per
centdam
pin
gan
dc i"
0·0
EARTHQUAKE GROUND MOTION FOR SITE CHARACTERIZATION 681
( 1997 by John Wiley & Sons, Ltd. Earthquake Engng. Struct. Dyn., 26, 671—689 (1997)

Spectrum ratio
Horizontal-to-vertical velocity response spectral ratios were calculated for different magnitudes, source-site distances, and source depths. Figure 5(c) shows the velocity response spectral ratio for a given depth andshortest distance with changes in magnitude. The ratio is slightly affected by the magnitude, but the overallshape is similar. In the very short-period range (less than 0·1 s), the ratio is almost constant (about 1·5); in theshort-period range (0·1 s to 0·5 s), the ratio increases linearly with period (up to 2·7—3·2); in the intermediate tolong-period range (0·5 s to 7·5 s), the ratio becomes almost constant. In these period ranges, the ratio is largerfor smaller magnitude events but for the long-period range (greater than 7·5 s), the ratio becomes larger forlarger magnitude events. The trend of the spectrum ratio is consistent with the fact that the verticalcomponent has higher frequency contents than those of the horizontal components. Similar observationswere found in previous studies.13
Figure 5(f ) shows the response spectrum ratio for a given magnitude and depth with changes in distance.The trend of variation of the ratio with period is same as Figure 5(c). The effect of variation of distance isalmost negligible. However, this may not be true for near-field recordings, e.g., those in the 1995 Hyogoken-Nanbu (Kobe) Earthquake. Since the current data set consists of mostly intermediate to far field data (Figure2), this observation should be limited to records of these distance ranges. For near-field recordings, furtherresearch on H/V spectrum ratio is necessary. It is also better to be mentioned that the H/V spectrum ratiomay change if the amplitude of ground motion reaches the level to cause soil non-linearity; the horizontalcomponent is affected by reduction of shear rigidity and increase of damping ratio while the verticalcomponent is scarcely affected. The extreme case is the occurrence of liquefaction, in which horizontalmotion is de-amplified while vertical motion is not so much affected, as seen in the vertical array records ofKobe Port Island.18
Figure 5(i) shows the spectrum ratio for a given magnitude and distance with changes in depth. Thevariation of the ratio with different depth is again very small.
In summary, the ratio of horizontal-to-vertical velocity response spectra (H/V) of intermediate to far fieldrecords is a function of period, but almost independent of magnitude, source-site distance and source depth.Hence, in equation (5), only b
0term remains if the site effect is not considered.
Site-specific response spectrum ratio
Figure 6 shows the station coefficient spectrum17 for the four stations. The shapes are different fromstation to station. But, for the same site, the station coefficient spectrum for the vertical component has thesimilar shape with that for the horizontal component. It is also seen from the figure that the periodcorresponding to the peak for the vertical component is shorter than that for the horizontal one. Molas andYamazaki17 inferred that the peak of the station coefficient spectrum for the horizontal response spectrumcorresponds to the predominant period of S-wave propagation. As an extension of this inference, the peak forthe vertical component may indicate the predominant period of P-wave propagation. However, it is difficultto prove this for the JMA stations since detailed geological profiles are not available.
By combining the velocity response spectrum ratio for the mean station (with ci"0·0) and the spectrum of
station coefficients (cHi
and cVi), the site-specific response spectrum ratio can be obtained for each JMA
station. Figure 7 shows sample site-specific velocity response spectrum ratios for the four JMA stationsplotted for a particular distance, depth and magnitudes. The site-specific response spectrum ratios show clearpeaks and the effect of magnitude on the ratios seems almost negligible. Since the effects of distance and depthhave already been shown to be small (see Figure 5) for the current data set, the spectrum ratio is unique to thesite. Thus the H/V response spectrum ratio R
iat a specific site i is approximated as a function of structural
period only as
logRi"log
SHV(f,¹ )
SVV(f,¹ )
+[bH0(¹ )!bV
0(¹ )]#[cH
i(¹ )!cV
i(¹ )] (6)
682 F. YAMAZAKI AND M. A. ANSARY
Earthquake Engng. Struct. Dyn., 26, 671—689 (1997) ( 1997 by John Wiley & Sons, Ltd.

Figure 6. Comparison of station coefficients for attenuation relations of SHV
(0·02,¹ ) and SVV0·02,¹ ) for four JMA stations
Figure 7. Predicted horizontal-to-vertical (H/V) velocity response spectrum ratio with 2 per cent damping for four JMA stations
EARTHQUAKE GROUND MOTION FOR SITE CHARACTERIZATION 683
( 1997 by John Wiley & Sons, Ltd. Earthquake Engng. Struct. Dyn., 26, 671—689 (1997)

where the first term of the right-hand side of equation (6) shows the spectrum ratio on the average site (seeFigures 5(c), 5(f ), 5(i)) and the second term represents the site effect (see Figure 6).
Fourier spectrum ratio vs. response spectrum ratio
In Figure 8, the response spectrum ratio for 2 per cent damping (Figure 7) is compared with the Fourierspectrum ratio (Figure 3) for the four JMA sites. Although slight dependence of the response spectrum ratioon magnitude, depth and distance exists, it may be insignificant for this comparison. In the figure, the meanFourier spectrum ratio is shown together with the mean plus or minus one standard deviation. As expected,the comparison reveals that the predicted velocity response spectral ratio at low damping ratio producessimilar values with the average of the observed Fourier spectrum ratio. Hence, the stability of H/V ratio ofFourier spectra at each site is reconfirmed using the attenuation relations for S
Vand the approximation
between Fourier spectrum and SV.
Proximity of the spectrum ratio and transfer function
Uniqueness of horizontal-to-vertical spectrum ratio (H/V) at each site was shown above. However, theimplication of the H/V ratio has not been explained. To perform this task, earthquake records from twodownhole array sites in the Tokyo metropolitan area are employed. At these sites (Soka and Kodaira),underground structures were surveyed by PS-logging (Tables IV and V). In addition, microtremor observa-tion was recently conducted by the present authors.4
Figure 9 shows the theoretical transfer functions for one-dimensional S-wave and P-wave propagationusing the wave velocities measured by the PS-logging. As shown in the schematic drawing in Figure 9, thetransfer function represents the spectrum ratio between the free surface motion (2E
4) and the base (at the
bottom of soil columns in Tables IV and V) outcrop motion (2E3) for the horizontal or vertical component. In
the figure, the ratio rT"A
H/A
Vof the horizontal transfer function A
H("EH
4/EH
3) and the vertical transfer
function AV("EV
4/EV
3) is also plotted. It is seen that, for Soka, the transfer function ratio is almost same as the
horizontal transfer function because the vertical transfer function is almost constant in the range (0·05—2.0 s).The transfer function ratio for Kodaira is also close to the horizontal transfer function, but its second peak issuppressed because it is close to the first peak of the vertical transfer function. From these plots, theapproximation of the horizontal (S-wave) transfer function by the H/V transfer function ratio seems to bevalid near the first natural frequency of S-wave propagation for ordinary soil conditions.
Although the dominant peak of the H/V ratio may be determined by the site-specific term (cHi!cV
i) for
most cases, the non-site-specific term (bH0!bV
0) also affects the H/V ratio of response spectra (thus Fourier
spectra). This fact is examined by the examples of Soka and Kodaira. For these sites, S- and P-wave velocitiesare known, but station coefficients are unknown. Using the following relationship:
rT"
AH
AV
"
EH4/EH
3EV
4/EV
3
"
(EH4/EV
4)
(EH3/EV
3)+
R463&!#%
R3%&%3%/#%
(7)
the H/V response spectrum ratio R463&!#%
at the surface of a site is approximated by
R463&!#%
+rT
R3%&%3%/#%
(8)
where rT
is the transfer function ratio and R3%&%3%/#%
is the H/V response spectrum ratio for the base outcropmotion. Note that the ‘reference’ point of the transfer function is also outcrop (surface) and its H/V spectrumratio is free from the site effect if the soil column is modeled to the depth of stiff-soil layers. Consideringequation (6), it may be reasonable to assume R
3%&%3%/#%"10 ** (bH
0!bV
0). However, note that bH
0and bV
0are
determined in a manner that the average station coefficient for the JMA sites becomes zero (cHi"cV
i"0) and
thus the reference points of the transfer function for Soka and Kodaira seem to be stiffer than the averageground of the JMA stations.
684 F. YAMAZAKI AND M. A. ANSARY
Earthquake Engng. Struct. Dyn., 26, 671—689 (1997) ( 1997 by John Wiley & Sons, Ltd.

Fig
ure
8.C
ompar
ison
bet
wee
npre
dic
ted
horizo
nta
l-to
-ver
tica
lvel
oci
tyre
spons
esp
ectr
um
ratio
at2%
dam
ping
(sym
bols),
mea
nob
serv
edFou
rier
ampl
itude
ratio
(solid
line)
and
mea
nplu
sor
min
us
one
stan
dar
ddev
iation
(das
hed
lines
)fo
rfo
urJM
Ast
atio
ns
EARTHQUAKE GROUND MOTION FOR SITE CHARACTERIZATION 685
( 1997 by John Wiley & Sons, Ltd. Earthquake Engng. Struct. Dyn., 26, 671—689 (1997)

Table IV. Soil profile of Soka site
Layer P-wave S-wavethickness Density velocity velocity Poisson’s
(m) (t/m)3 (m/s) (m/s) ratio
1.50 1·50 300 100 0·4382·10 1·50 1510 100 0·4982·35 1·70 1510 140 0·4965·75 1·60 1510 110 0·4976·90 1·65 1380 190 0·4905·15 1·65 1380 260 0·4825·00 2·10 1950 490 0·4663·05 1·85 1800 380 0·4773·70 1·90 1800 480 0·412
Table V. Soil profile of Kodaira site
Layer P-wave S-wavethickness Density velocity velocity Poisson’s
(m) (t/m)3 (m/s) (m/s) ratio
1·50 1·50 290 80 0·466·70 1·60 390 180 0·374·80 2·00 950 500 0·313·70 2·00 1710 500 0·455·10 1·85 1710 420 0·472·00 1.85 1710 370 0·483·70 2·00 1710 430 0·475·20 1·80 1500 340 0·478·30 1·80 1500 320 0·485·50 2·00 2040 620 0·45
Figure 10 compares the response spectrum ratio R463&!#%
(dots) estimated by equation (8) and the average ofFourier spectrum ratios (thin solid line) for seven small-amplitude earthquake records for Soka and Kodaira.Although some difference is observed for their amplitudes, their trends are quite similar. The first mode peakfor S-wave is clearly seen for both ratios. Except for the peak at about 0·2 s for the Fourier spectrum ratio atKodaira, good agreement is seen in the shapes of ratios for the both sites. The difference in amplitude can beexplained by the difference of the reference points mentioned above (the estimated R
463&!#%looks larger than
the observed H/V ratio since R3%&%3%/#%
may be overestimated).Due to the similarity of the transfer function ratio and the S-wave transfer function (r
T+A
H, see Figure 9),
the Fourier spectrum ratio can also be estimated by R463&!#%
+AH
10 ** (bH0!bV
0) in the period range around
the first predominant period of S-wave propagation. Since the term 10 ** (bH0!bV
0) is almost constant in
a wide period range (0·5—7·5 s, see Figure 5), the first predominant period of S-wave transfer function (AH,
thick solid line) coincides with that of R463&!#%
as shown in Figure 10. Note that this comparison is just forpeak periods, not for amplitudes.
These observations suggest the theoretical background of proximity of the H/V ratio of Fourier spectra atthe ground surface and the S-wave transfer function between the ground surface and stiff-soil outcrop. Hencethe predominant period of a site can be estimated from two-component earthquake records at the surface ofthe site in approximation.
686 F. YAMAZAKI AND M. A. ANSARY
Earthquake Engng. Struct. Dyn., 26, 671—689 (1997) ( 1997 by John Wiley & Sons, Ltd.

Figure 9. Comparison of transfer functions for horizontal (AH) and vertical (A
V) components and their ratio (r
T) at (a) Soka and (b)
Kodaira downhole arrays
CONCLUSIONS
The amplitude ratio (H/V) of horizontal and vertical Fourier spectra, defined by Nakamura for microtremorat a site, has been extended to earthquake recordings. At four JMA stations, where triaxial accelerometers aredeployed, Fourier spectra were calculated for several earthquake events. Although the amplitudes of both thehorizontal and vertical Fourier spectra varied from event to event, their ratios (H/V) were found to be stablefor different events at each site.
EARTHQUAKE GROUND MOTION FOR SITE CHARACTERIZATION 687
( 1997 by John Wiley & Sons, Ltd. Earthquake Engng. Struct. Dyn., 26, 671—689 (1997)

Figure 10. Comparison between observed H/V Fourier spectrum ratio (thin line), estimated H/V velocity response spectrum ratio byequation (8) (dots), and transfer function (A
H) for horizontal component (bold line) for (a) Soka and (b) Kodaira
In order to explore a physical reason for this observation, attenuation relations of relative velocityresponse spectra for horizontal and vertical components were derived for each structural period using 2166recordings by JMA-87-type accelerometers from 76 JMA stations. The attenuation relations were construc-ted as a function of magnitude, source-site distance, source depth, and station coefficient. As a result ofregression analysis, the magnitude, distance, and depth-dependent terms were found to be close for thehorizontal and vertical components. Hence, if we take the spectrum ratio of the two components, the ratiocan be approximated by only a function of station coefficients, which represent site characteristics for the twocomponents. Through the proximity of Fourier spectra and velocity response spectra with small damping,the stability of the Fourier spectrum ratio (H/V) was confirmed. This observation is limited to intermediate tofar field records, however, because of the data set used in the analysis.
Implication of the H/V spectrum ratio was further investigated using earthquake records from downholearray sites whose underground structures were known. The transfer functions between the ground surfaceand outcrop base were calculated for the S- and P-wave propagation in the vertical direction. Then the ratio
688 F. YAMAZAKI AND M. A. ANSARY
Earthquake Engng. Struct. Dyn., 26, 671—689 (1997) ( 1997 by John Wiley & Sons, Ltd.
of the transfer functions was also calculated. The result showed that the transfer function ratio is close to theS-wave transfer function around the predominant period of the S-wave. The H/V Fourier spectrum ratiofrom earthquake records was then compared with the transfer function ratio multiplied by the non-site-specific term of the H/V response spectrum ratio. Good agreement between them shows the validity for thephysical insight to the H/V spectrum ratio of earthquake ground motion. The similarity between thesite-specific H/V spectrum ratio and the S-wave transfer function was also demonstrated.
These results suggest that site amplification characteristics can be evaluated by one-point two-componentsurface recordings of earthquake ground motion, in a similar manner as proposed by Nakamura formicrotremor.
REFERENCES
1. Y. Nakamura, ‘A method for dynamic characteristics estimation of subsurface using microtremor on the ground surface’, QR R¹RI30, 25—33 (1989).
2. T. Ohmachi, T. Shimizu and K. Konno, ‘Seismic zoning of Yokohama city based on microtremor measurement at jounior highschools’, Proc. 5th int. conf. on seismic zonation, Vol. I, 1995, pp. 873—880.
3. K. Tokimatsu and H. Arai, ‘Estimation of local site conditions in Kushiro city based on array observation of microtremors’, Proc.3rd int. conf. on recent advances in geotechnical earthquake eng. and soil dyn., Vol. II, 1995, pp. 599—602.
4. M. A. Ansary, M. Fuse, F. Yamazaki and T. Katayama, ‘Use of microtremors for the estimation of ground vibration characteristics’,Proc. 3rd int. conf. on recent advances in geotechnical earthquake eng. and soil dyn., Vol. II, 1995, pp. 571—574.
5. J. Lermo and F. J. Chavez-Garcia, ‘Site effect evaluation using spectral ratios with only one station’, Bull. seism. soc. Am. 83,1574—1594 (1993).
6. J. Lermo and F. J. Chavez-Garcia, ‘Are microtremors useful in site response evaluation’, Bull. seism. soc. Am. 84, 1350—1364 (1994).7. E. H. Field and K. H. Jacob, ‘A comparison and test of various site-response estimation techniques, including three that are not
reference-site dependent’, Bull. seism. soc. Am. 85, 1127—1143 (1995).8. C. Lachet and P. Y. Bard, ‘Theoretical investigations on the Nakamura’s technique’, Proc. 3rd int. conf. on recent advances in
geotechnical earthquake eng. and soil dyn., Vol. II, 1995, pp. 671—675.9. N. P. Theodulidis and P. Y. Bard, ‘Horizontal to vertical spectral ratio and geological conditions: an analysis of strong motion data
from Greece and Taiwan (SMART-1)’, Soil dyn. earthquake eng. 14, 177—197 (1995).10. L. Mamula, K. Kudo and E. Shima, ‘Distribution of ground-motion amplification factors as a function of period (3—15 sec), in
Japan’, Bull. earthquake res. inst. 59, 467—500 (1984).11. M. D. Trifunac and V. W. Lee, ‘Empirical models for scaling Fourier amplitude spectra of strong ground acceleration in terms of
earthquake magnitude source to station distance, site intensity and recording site conditions’, Soil dyn. earthquake eng. 8, 110—125(1989).
12. W. B. Joyner and D. M. Boore, ‘Estimation of response spectral values as functions of magnitude, distance and site conditions’, OpenFile Report 82-881, U.S. Geological Survey, 1982.
13. Y. Bozorgnia and M. Niazi, ‘Distance scaling of vertical and horizontal response spectra of the Loma Prieta Earthquake’,Earthquake eng. struct. dyn. 22, 695—707 (1993).
14. V. W. Lee, ‘Scaling PSV from earthquake magnitude, local soil, and geologic depth of sediments’, J. geotech. engg ASCE 119,108—126 (1993).
15. Y. Bozorgnia, M. Niazi and K. W. Campbell, ‘Characteristics of free-field vertical ground motion during the NorthridgeEarthquake’, Earthquake spectra 11, 515—525 (1995).
16. G. L. Molas and F. Yamazaki, ‘Attenuation of earthquake ground motion in Japan including deep focus events’, Bull. seism. soc. Am.85, 1343—1358 (1995a).
17. G. L. Molas and F. Yamazaki, ‘The effect of source depth and local site to the attenuation characteristics of response spectra’, Proc.23rd JSCE earthq. eng. symp. 1995b, pp. 69—72.
18. Y. Iwasaki and M. Tai, ‘Strong motion records at Kobe Port Island’, Special Issue of Soils and Foundations, Japanese GeotechnicalSociety, 1996, pp. 29—40.
.
EARTHQUAKE GROUND MOTION FOR SITE CHARACTERIZATION 689
( 1997 by John Wiley & Sons, Ltd. Earthquake Engng. Struct. Dyn., 26, 671—689 (1997)