homabaycounty government second county integrated
TRANSCRIPT
REPUBLIC OF KENYA
HOMABAYCOUNTY GOVERNMENT
SECOND COUNTY INTEGRATED DEVELOPMENT PLAN 2018-
2022 (DRAFT)
i
VISION
An Industrialized Healthy and Wealthy County
Mission
To build and preserve optimal conditions for accelerated, inclusive and
sustainable development that guarantees safe livelihoods, dignified living
and progressive pathways for all citizens of the county to thrive.
ii
Table of Contents
TABLE OF CONTENTS .............................................................................................................................................. II
LIST OF TABLES ........................................................................................................................................................ IX
LIST OF MAPS/FIGURES .......................................................................................................................................... X
ABBREVIATIONS AND ACRONYMS ...................................................................................................................... XI
GLOSSARY OF COMMONLY USED TERMS ..................................................................................................... XVII
FOREWORD ........................................................................................................................................................... XIX
ACKNOWLEDGEMENT ........................................................................................................................................ XXI
EXECUTIVE SUMMARY ..................................................................................................................................... XXIII
CHAPTER ONE............................................................................................................................................................ 1
COUNTY GENERAL INFORMATION ...................................................................................................................... 1
1.0 COUNTY OVERVIEW ............................................................................................................................................. 1 1.1 POSITION AND SIZE .................................................................................................................................................. 1 1.2 PHYSIOGRAPHIC AND NATURAL CONDITIONS ............................................................................................................... 3
1.2.1 Physical and Topographic Features ........................................................................................................... 3
1.2.2 Ecological Conditions .................................................................................................................................. 4
1.2.3 Climatic Conditions ..................................................................................................................................... 5
1.3 ADMINISTRATIVE AND POLITICAL UNITS ...................................................................................................................... 6 1.3.1 Administrative Sub Divisions ...................................................................................................................... 6
1.3.2 Political Units .............................................................................................................................................. 8
1.4 DEMOGRAPHIC FEATURES ......................................................................................................................................... 8 1.4.1. Population size and composition .............................................................................................................. 9
1.4.2. Population Density and Distribution ........................................................................................................ 9
1.4.3 Population Projection for Special Groups ................................................................................................ 10
1.4.4 Distribution of Persons with Disabilities .................................................................................................. 10
1.4.5 Demographic Dividend ............................................................................................................................. 11
1.5 INFRASTRUCTURE DEVELOPMENT ............................................................................................................................. 14 1.5.1. Road, Rail Network, Ports and Airports, Airstrips and Jetties ............................................................... 14
1.5.2. Information Communication and Technology ........................................................................................ 16
1.5.3. Energy access ........................................................................................................................................... 16
1.5.4 Housing Types ........................................................................................................................................... 17
1.6 LAND AND LAND USE .............................................................................................................................................. 18 1.6.1. Land ownership Categories/ Classification ............................................................................................ 18
1.6.2. Mean land holding size ........................................................................................................................... 19
1.6.3. Percentage of Land with Title Deeds ........................................................................................................ 20
1.6.4. Incidence of Landlessness ....................................................................................................................... 20
1.6.5 Settlement Patterns ................................................................................................................................. 20
1.7 EMPLOYMENT ....................................................................................................................................................... 21 1.7.1 Wage Earners ........................................................................................................................................... 22
1.7.2 Self Employed ........................................................................................................................................... 23
1.7.3 Labour-Force by Sector........................................................................................................................ 23
iii
1.7.4 Unemployment Levels ......................................................................................................................... 23
1.8 IRRIGATION INFRASTRUCTURE AND SCHEMES ............................................................................................................. 23 1.8.1 Irrigation potential ................................................................................................................................... 24
1.8.2 Irrigation schemes .................................................................................................................................... 24
1.9 CROP, LIVESTOCK, FISH PRODUCTION AND VALUE ADDITION ........................................................................................ 24 1.9.1. Main Crops Produced ............................................................................................................................... 24
1.9.2: Acreage under Food and Cash Crops ........................................................................................................ 25
1.9.3 Average Farm Sizes .................................................................................................................................. 26
1.9.4. Main Storage Facilities ............................................................................................................................ 26
1.9.5 Agriculture Extension Training Research and Information Service......................................................... 26
1.9.6. Main Livestock Breeds and Facilities ...................................................................................................... 27
1.9.7. Ranching .................................................................................................................................................. 27
1.9.8 Main Fishing Activities ............................................................................................................................. 27
1.9.9 Apiculture ................................................................................................................................................. 27
1.10 OIL AND OTHER MINERAL RESOURCES..................................................................................................................... 28 1.10.1 Mineral and Oil Potential ....................................................................................................................... 28
1.10.2 On-going Mining and Extraction activities ............................................................................................ 28
1.11 TOURISM AND WILDLIFE ....................................................................................................................................... 28 1.11.1 Main Tourist Attractions and Activities ................................................................................................. 29
1.11.2 Classified/Major Hotels .......................................................................................................................... 29
1.11.3 Main Wildlife .......................................................................................................................................... 29
1.11.4 Wildlife Conservation Areas ................................................................................................................... 29
1.11.5 Total Number of Tourists Visiting Attraction Sites Annually ................................................................ 30
1.12 INDUSTRY AND TRADE .......................................................................................................................................... 30 1.12.1 Markets ................................................................................................................................................... 30
1.12.2 Industrial Parks ....................................................................................................................................... 30
1.12.3 Major Industries ..................................................................................................................................... 30
1.12.4 Types and Number of Businesses ........................................................................................................... 31
1.12.5 Micro Small and Medium Enterprises (MSMEs) .................................................................................... 32
1.13 THE BLUE ECONOMY ............................................................................................................................................ 32 1.13.1 Aquaculture ............................................................................................................................................ 37
1.14. FORESTRY, AGRO FORESTRY AND VALUE ADDITION.................................................................................................. 37 1.14.1. Main Forest Types and Sizes of Forests .................................................................................................. 37
1.14.2. Main Forest Products ............................................................................................................................ 37
1.14.3. Agro Forestry ......................................................................................................................................... 38
1.15 FINANCIAL SERVICES ............................................................................................................................................. 39 1.15.1 Number of banks, Micro finance institutions, mobile money agents and SACCOs with FOSAs ........... 39
1.15.2 Distribution /Coverage of Financial Services by Sub County ................................................................ 40
1.16. ENVIRONMENT AND CLIMATE CHANGE ................................................................................................................... 40 1.16.1. Major Degraded Areas/Hotspots and Major Contributions to Environmental Degradation ............. 41
1.16.2. Environmental Threats ........................................................................................................................... 42
1.16.3. Major Environmental Threats ............................................................................................................... 42
1.16.4 High Spatial and Temporal Variability of Rain ...................................................................................... 44
1.16.5 Change in Water Levels .......................................................................................................................... 44
1.16.6 Solid Waste Management Facilities ...................................................................................................... 44
1.16.7 Managing Climate Change Risk and Impact ........................................................................................... 45
1.17 WATER AND SANITATION ...................................................................................................................................... 46 1.17.1 Water Resources ..................................................................................................................................... 46
iv
1.17.2 Water Supply Schemes ........................................................................................................................... 47
1.17.3 Water Sources and Access ...................................................................................................................... 47
1.17.4 Water and Sanitation Management ...................................................................................................... 47
1.18 HEALTH ACCESS .................................................................................................................................................. 48 1.18.1 Health Access and Nutrition .................................................................................................................... 48
1.18.2 Morbidity ................................................................................................................................................ 49
1.18.3 Immunization Coverage ......................................................................................................................... 52
1.18.4 Maternal Health Care ............................................................................................................................. 52
1.18.5 Access to Family Planning Services/Contraceptive Prevalence ............................................................ 52
1.18.6 HIV/Aids Prevalence Rates and Related Services .................................................................................. 53
1.19 EDUCATION, SKILLS, LITERACY AND INFRASTRUCTURE ................................................................................................ 53 1.19.1 Pre- School Education /Early Childhood Development Education ........................................................ 53
1.19.2 Primary Education .................................................................................................................................. 54
1.19.3 Non-Formal Education............................................................................................................................ 55
1.19.4 Youth polytechnics ................................................................................................................................. 57
1.19.5 Secondary Education .............................................................................................................................. 57
1.19.6 Tertiary Education .................................................................................................................................. 57
1.19.7 Adult and Continuing Education ............................................................................................................ 58
1.19.8 Technical, Vocational Education and Training (TVET) ........................................................................... 58
1.20 SPORTS, CULTURE AND CREATIVE ARTS ................................................................................................................... 58 1.20.1 Museums, Heritage and Cultural Sites .................................................................................................. 58
1.20.2 Talent Academies ................................................................................................................................... 59
1.20.3 Sports Facilities ....................................................................................................................................... 59
1.20.4 Libraires /Information Documentation Centres/ Citizen Service Centres ............................................. 60
1.20.5 Registered Traditional, Herbalists and Medicinemen ........................................................................... 60
1.21 COMMUNITY ORGANIZATIONS/NON-STATE ACTORS ................................................................................................. 60 1.21.1 Cooperative Societies ............................................................................................................................. 61
1.21.2 Public Benefits Organizations (PBOs) .................................................................................................... 61
1.21.3 Development Partners ........................................................................................................................... 61
1.21.4 Youth Empowerment and Social Inclusion ............................................................................................ 62
1.22 SECURITY, LAW AND ORDER .................................................................................................................................. 62 1.22.1 Number of police Stations and Posts by Sub County ............................................................................. 62
1.22.2 Types, Trends and Crime Prone Areas ................................................................................................... 63
1.22.3 Types and Number of Courts .................................................................................................................. 63
1.22.4 Prisons and Probation Services .............................................................................................................. 64
1.22.5 Number of Public Prosecution Offices .................................................................................................... 64
1.22.6 Type of Prosecutions over the Years ...................................................................................................... 65
1.22.7 Community Policing Activities ................................................................................................................ 65
1.22.8 Immigration Facilities ............................................................................................................................. 65
1.23.1 Number of Orphans and Vulnerable children (OVC) ............................................................................. 66
1.23.2 Cases of Street Children .......................................................................................................................... 67
1.23.3 Child Care Facilities and Institutions by Sub County .............................................................................. 67
1.23.4 Social Net Programmes in the County ................................................................................................... 68
CHAPTER TWO ........................................................................................................................................................ 69 LINKAGES WITH VISION 2030 AND OTHER PLANS ................................................................................................... 69 2.0 OVERVIEW ........................................................................................................................................................ 69 2.1 CIDP LINKAGE WITH CONSTITUTION OF KENYA 2010 .................................................................................... 69
v
2.2 CIDP LINKAGE WITH KENYA VISION 2030 ...................................................................................................... 70 2.3CIDP LINKAGE WITH THE BIG FOUR NATIONAL ECONOMIC PLAN.................................................................................... 71 2.4 CIDP LINKAGE WITH COUNTY GOVERNMENT’S MANIFESTO ........................................................................................... 72 2.5CIDP LINKAGE WITH THE LAKE REGION ECONOMIC BLOC BLUE PRINT .............................................................................. 72 2.6 LINKAGE OF CIDP WITH OTHER DEVELOPMENT PLANS .................................................................................................. 73
CHAPTER THREE ..................................................................................................................................................... 78
REVIEW OF THE IMPLEMENTATION OF THE PREVIOUS CIDP .................................................................... 78
3.1 INTRODUCTION ...................................................................................................................................................... 78 3.2 STATUS OF IMPLEMENTATION OF THE CIDP 2013-2017 .............................................................................................. 78
3.2.1 Analysis of the county Revenue Streams (equitable share, grants, own source revenue) ........................ 78
3.2.2: County Expenditure Analysis by Broad Economic Classification and Sector/ Sub-sector ......................... 80
3.3 SUMMARY OF KEY ACHIEVEMENTS VERSUS PLANNED TARGETS FOCUSING ON OUTCOMES ...................................................... 84 3.4 CHALLENGES IN THE IMPLEMENTATION OF THE CIDP 2013-2017................................................................................... 85
3.4.1 Financial Constraints ................................................................................................................................. 85
3.4.2 Human Resource Constraints .................................................................................................................... 85
3.4.3 Technical Challenges ................................................................................................................................. 86
3.4.4 Political Challenges ................................................................................................................................... 86
3.5 LESSONS LEARNT .................................................................................................................................................... 87 3.6 RECOMMENDATIONS .............................................................................................................................................. 87 3.7 ANALYSIS OF CIDP 2013-2017 IMPLEMENTATION BY SECTOR .......................................................................... 88
3.7.1 AGRICULTURE, RURAL AND URBAN DEVELOPMENT SECTOR ................................................................... 88
3.7.2 ENERGY, INFRASTRUCTURE AND ICT SECTOR ........................................................................................... 92
3.7.3 GENERAL ECONOMIC AND COMMERCIAL AFFAIRS SECTOR ..................................................................... 95
3.7.4 HEALTH SERVICES ...................................................................................................................................... 98
3.7.5 EDUCATION SECTOR ..................................................................................................................................... 101 3.7.6 PUBLIC ADMINISTRATION AND INTER/INTRA GOVERNMENT RELATIONS ............................................. 104
3.7.7 SOCIAL PROTECTION, CULTURE RECREATION AND SPORTS SECTOR ...................................................... 107
3.7.8 ENVIRONMENTAL PROTECTION, WATER & NATURAL RESOURCES SECTOR ........................................... 110
CHAPTER FOUR ...................................................................................................................................................... 113
COUNTY DEVELOPMENT PRIORITIES AND STRATEGIES ............................................................................. 113
4.1 INTRODUCTION ........................................................................................................................................... 113 4.2 COUNTY SPATIAL DEVELOPMENT FRAMEWORK .......................................................................................................... 113
4.2.1Overview of the County Spatial Structure ................................................................................................ 114
4.2.2 Spatial Development Framework ....................................................................................................... 114
4.2.3 Natural Resource Assessment ............................................................................................................ 116
4.2.4 Development Priorities and Strategies .................................................................................................... 118
4.3 AGRICULTURE, RURAL AND URBAN DEVELOPMENT ....................................................................................... 119 4.3.2 Sub-sector Priorities, Constraints and Strategies .................................................................................... 119
4.3.3 Agriculture, Livestock, Fisheries & Food Security Priority Programmes .................................................. 123
4.3.4 Flagship project department of Agriculture Livestock and Fisheries ....................................................... 130
4.3.5 Lands, Housing & Urban Development Priority Programmes ................................................................. 131
4.3.6 Cross Sectoral Impact .............................................................................................................................. 133
4.4. ENERGY, INFRASTRUCTURE AND ICT DEVELOPMENT PRIORITIES AND STRATEGIES ...................................... 134 4.4.1 INTRODUCTION ....................................................................................................................................... 134
4.4.2 SECTOR VISION AND MISSION ................................................................................................................. 134
MISSION ........................................................................................................................................................... 134
vi
4.4 .3 Transport and Infrastructure Sub –Sector .............................................................................................. 134
4.4.4 Energy and Mineral Resources Sub-Sector .............................................................................................. 135
4.4.5 Information and Communications Technology Sub-Sector ..................................................................... 137
4.4.6 Development Priorities and Strategies .................................................................................................... 137
4.4.7 Roads, Infrastructure & Public Works Programmes 2018-2022 .............................................................. 139
4.4.8 Energy Programmes 2018-2022 .............................................................................................................. 142
4.4.10Flagship/ Transformative Projects ......................................................................................................... 145
4.5 GENERAL ECONOMICS AND COMMERCIAL AFFAIRS ..................................................................................... 146 4.5.1 INTRODUCTION ....................................................................................................................................... 146
4.5.2 Trade, Industrialization Cooperatives & Enterprise Development Sub Sector ..................................... 146
4.5.3 Tourism Sub-Sector ................................................................................................................................. 150
4.5.4 Cross-sectoral Impacts ........................................................................................................................... 151
4.5.5. Flagship /County Transformative Projects for Trade and Industrialization ........................................ 152
4.6 EDUCATION SECTOR ....................................................................................................................................... 153 4.6.1 Introduction ............................................................................................................................................. 153
4.6.2County Response to the Sector Vision and Mission .................................................................................. 154
4.6.3 Education Programmes 2018-2022 ......................................................................................................... 160
4.7 HEALTH SERVICES ............................................................................................................................................ 164 4.7.1 SUB-SECTOR GOALS................................................................................................................................. 164
4.7.2 Development Needs, Priorities and Strategies ........................................................................................ 164
4.7.3 Health Programmes 2018-2022 .............................................................................................................. 166
4.7.4Cross-sectoral impacts: ............................................................................................................................ 169
4.7.5 Flagship/ Transformative Projects .......................................................................................................... 170
4.8 PUBLIC ADMINISTRATION AND INTER/INTRA-GOVERNMENT RELATIONS ...................................................... 174 4.8.1 INTRODUCTION ....................................................................................................................................... 174
4.8.3 Cross-Sectoral Implementation Considerations and Impacts .................................................................. 181
4.8.4 Flagship/ Transformative Projects .......................................................................................................... 182
4.9 SOCIAL PROTECTION, CULTURE AND RECREATION ......................................................................................... 183 4.9.1 INTRODUCTION ....................................................................................................................................... 183
4.9.2 Development Needs, Priorities and Strategies ........................................................................................ 183
4.9.3 Sector Programmes ................................................................................................................................. 184
4.9.4 Cross-sectoral Implementation Considerations ....................................................................................... 188
4.9.5. Flagship /County Transformative Projects for Social Protection, Culture and Recreation ..................... 189
4.10 ENVIRONMENTAL PROTECTION, WATER AND NATURAL RESOURCES .......................................................... 192 4.10.1 INTRODUCTION ..................................................................................................................................... 192
4.10.2 Development Needs, Priorities and Strategies ...................................................................................... 193
4.10.3 Sector Programmes 2018-2022 ............................................................................................................. 194
4.10.4 Flagship/Transformative Projects ......................................................................................................... 201
CHAPTER FIVE ........................................................................................................................................................ 203
IMPLEMENTATION FRAMEWORK ..................................................................................................................... 203
5.1 INTRODUCTION .................................................................................................................................................... 203 5.2 INSTITUTIONAL FRAMEWORK .................................................................................................................................. 203
5.2.1 County’s Organogram ............................................................................................................................. 203
5.2.2 Stakeholders in the County ...................................................................................................................... 207
5.3 RESOURCE REQUIREMENT BY DEPARTMENTS ............................................................................................................. 207 5.4 RESOURCE MOBILIZATION FRAMEWORK ............................................................................................................... 210 5.5 ESTIMATED RESOURCE GAP AND MEASURES OF ADDRESSING IT ................................................................................ 214
vii
CHAPTER SIX: ......................................................................................................................................................... 216
MONITORING AND EVALUATION FRAMEWORK .......................................................................................... 216
6.1 INTRODUCTION ................................................................................................................................................... 216 6.2 M&E STRUCTURE IN THE COUNTY .......................................................................................................................... 216
6.2.1 Rationale for County M & E Framework ................................................................................................ 216
6.2.2 Data collection, Analysis, and Reporting, Dissemination and citizen engagement mechanisms .. 218
6.3 MONITORING AND EVALUATION OF OUTCOME INDICATORS BY SECTOR ......................................................................... 218 6.3.1 AGRICULTURE, LIVESTOCK, FISHERIES & FOOD SECURITY ............................................................................ 219 6.3.2 LANDS, HOUSING & URBAN DEVELOPMENT ................................................................................................ 225 6.3.4 ROADS &PUBLIC WORKS .............................................................................................................................. 228 6.3.5 ENERGY AND MINING ................................................................................................................................... 230
SUB SECTOR: INFORMATION COMMUNICATION TECHNOLOGY ............................................................. 234
6.3.6 TRADE, INDUSTRY, COOPERATIVES AND ENTERPRISE DEVELOPMENT ........................................................ 235 6.3.7 HEALTH SERVICES ......................................................................................................................................... 240 6.3.8 EDUCATION .................................................................................................................................................. 243 6.3.9 PUBLIC ADMINISTRATION INTER/INTRA GOVERNMENTAL RELATIONS ....................................................... 247 6.3.10 SOCIAL PROTECTION, CULTURE AND RECREATION .................................................................................... 249 6.3.11 ENVIRONMENTAL PROTECTION, WATER AND NATURAL RESOURCES ....................................................... 253
ANNEX 1: PROJECTS DERIVED FROM PROGRAMMES .................................................................................... 257
1. AGRICULTURE, RURAL AND URBAN DEVELOPMENT ......................................................................................... 257 2. LANDS, HOUSING AND PHYSICAL PLANNING ONGOING PROJECTS ................................................................... 261 3. ENERGY& MINING ............................................................................................................................................. 267 4.TRADE, COOPERATIVES, INDUSTRY AND ENTERPRISE DEVELOPMENT .............................................................. 271 5. TOURISM ..................................................................................................................................................... 275 6. EDUCATION ................................................................................................................................................. 279 7. HEALTH SERVICES ........................................................................................................................................ 284 8. WATER AND NATURAL RESOURCES ............................................................................................................. 288 9. PUBLIC ADMINISTRATION AND INTER-GOVERNMENT RELATIONS ............................................................. 345
ANNEX 2: IMPLEMENTATION MATRIX ............................................................................................................. 361
Lands, Housing & Urban Development Priority Programmes .......................................................................... 372
ENERGY, INFRASTRUCTURE AND ICT DEVELOPMENT ........................................................................................... 378 Energy Programmes 2018-2022 ....................................................................................................................... 381
ICT Sub Sector ................................................................................................................................................... 384
GENERAL ECONOMICS AND COMMERCIAL AFFAIRS ............................................................................................. 385 Trade, Industry, Co orporatives & Enterprise Development Programmes 2018-2022 ..................................... 385
Tourism Programmes 2018-2022 ..................................................................................................................... 388
EDUCATION SECTOR ............................................................................................................................................. 389 Education Programmes 2018-2022 .................................................................................................................. 389
HEALTH SERVICES .................................................................................................................................................. 395 Health Programmes 2018-2022 ....................................................................................................................... 395
PUBLIC ADMINISTRATION AND INTER/INTRA-GOVERNMENT RELATIONS ........................................................... 400 County Executive Services Programmes 2018-2022 ......................................................................................... 400
County Assembly Services Programmes 2018-2022 ......................................................................................... 401
Finance, Economic Planning and Service Delivery Programmes 2018-2022.................................................. 402
County Public Service Board ............................................................................................................................. 404
SOCIAL PROTECTION, CULTURE AND RECREATION ............................................................................................... 404
ENVIRONMENTAL PROTECTION, WATER AND NATURAL RESOURCES ................................................... 411
viii
ANNEX 3: LIST OF NATIONAL PROGRAMMES/PROJECTS IN THE COUNTY ............................................ 415
ix
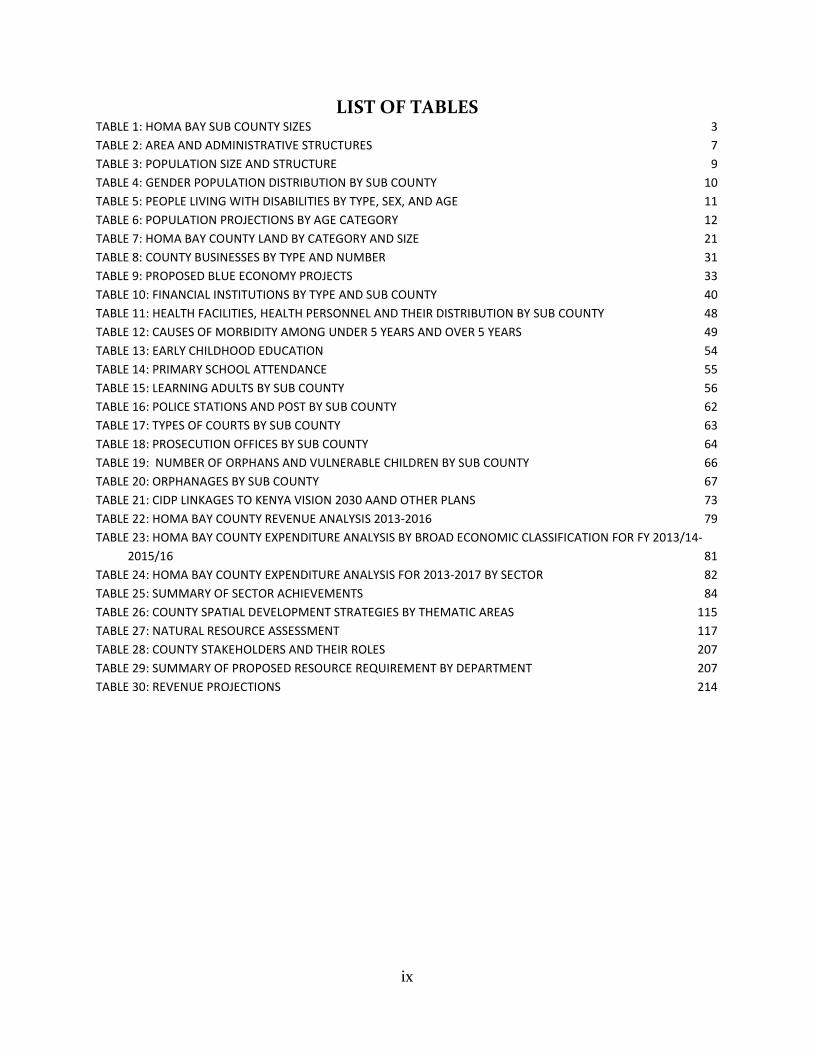
LIST OF TABLES TABLE 1: HOMA BAY SUB COUNTY SIZES 3
TABLE 2: AREA AND ADMINISTRATIVE STRUCTURES 7
TABLE 3: POPULATION SIZE AND STRUCTURE 9
TABLE 4: GENDER POPULATION DISTRIBUTION BY SUB COUNTY 10
TABLE 5: PEOPLE LIVING WITH DISABILITIES BY TYPE, SEX, AND AGE 11
TABLE 6: POPULATION PROJECTIONS BY AGE CATEGORY 12
TABLE 7: HOMA BAY COUNTY LAND BY CATEGORY AND SIZE 21
TABLE 8: COUNTY BUSINESSES BY TYPE AND NUMBER 31
TABLE 9: PROPOSED BLUE ECONOMY PROJECTS 33
TABLE 10: FINANCIAL INSTITUTIONS BY TYPE AND SUB COUNTY 40
TABLE 11: HEALTH FACILITIES, HEALTH PERSONNEL AND THEIR DISTRIBUTION BY SUB COUNTY 48
TABLE 12: CAUSES OF MORBIDITY AMONG UNDER 5 YEARS AND OVER 5 YEARS 49
TABLE 13: EARLY CHILDHOOD EDUCATION 54
TABLE 14: PRIMARY SCHOOL ATTENDANCE 55
TABLE 15: LEARNING ADULTS BY SUB COUNTY 56
TABLE 16: POLICE STATIONS AND POST BY SUB COUNTY 62
TABLE 17: TYPES OF COURTS BY SUB COUNTY 63
TABLE 18: PROSECUTION OFFICES BY SUB COUNTY 64
TABLE 19: NUMBER OF ORPHANS AND VULNERABLE CHILDREN BY SUB COUNTY 66
TABLE 20: ORPHANAGES BY SUB COUNTY 67
TABLE 21: CIDP LINKAGES TO KENYA VISION 2030 AAND OTHER PLANS 73
TABLE 22: HOMA BAY COUNTY REVENUE ANALYSIS 2013-2016 79
TABLE 23: HOMA BAY COUNTY EXPENDITURE ANALYSIS BY BROAD ECONOMIC CLASSIFICATION FOR FY 2013/14-
2015/16 81
TABLE 24: HOMA BAY COUNTY EXPENDITURE ANALYSIS FOR 2013-2017 BY SECTOR 82
TABLE 25: SUMMARY OF SECTOR ACHIEVEMENTS 84
TABLE 26: COUNTY SPATIAL DEVELOPMENT STRATEGIES BY THEMATIC AREAS 115
TABLE 27: NATURAL RESOURCE ASSESSMENT 117
TABLE 28: COUNTY STAKEHOLDERS AND THEIR ROLES 207
TABLE 29: SUMMARY OF PROPOSED RESOURCE REQUIREMENT BY DEPARTMENT 207
TABLE 30: REVENUE PROJECTIONS 214
x
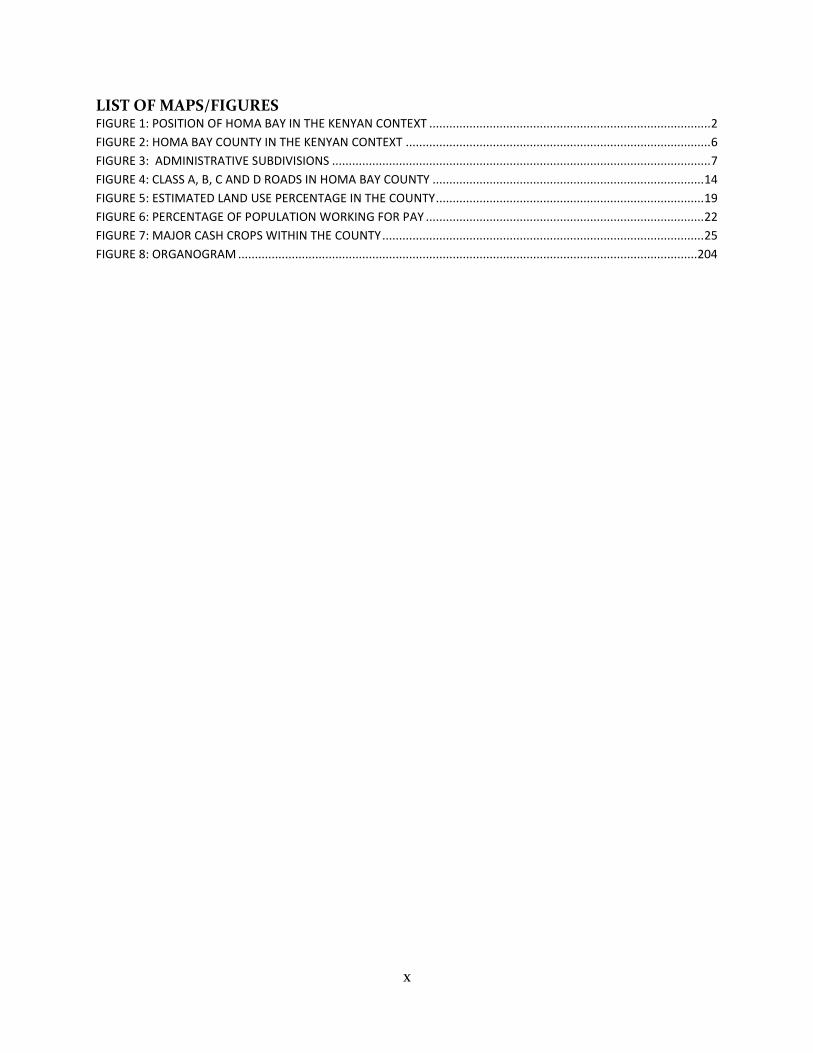
LIST OF MAPS/FIGURES FIGURE 1: POSITION OF HOMA BAY IN THE KENYAN CONTEXT .................................................................................... 2
FIGURE 2: HOMA BAY COUNTY IN THE KENYAN CONTEXT ........................................................................................... 6
FIGURE 3: ADMINISTRATIVE SUBDIVISIONS ................................................................................................................. 7
FIGURE 4: CLASS A, B, C AND D ROADS IN HOMA BAY COUNTY ................................................................................. 14
FIGURE 5: ESTIMATED LAND USE PERCENTAGE IN THE COUNTY ................................................................................ 19
FIGURE 6: PERCENTAGE OF POPULATION WORKING FOR PAY ................................................................................... 22
FIGURE 7: MAJOR CASH CROPS WITHIN THE COUNTY ................................................................................................ 25
FIGURE 8: ORGANOGRAM ......................................................................................................................................... 204
xi
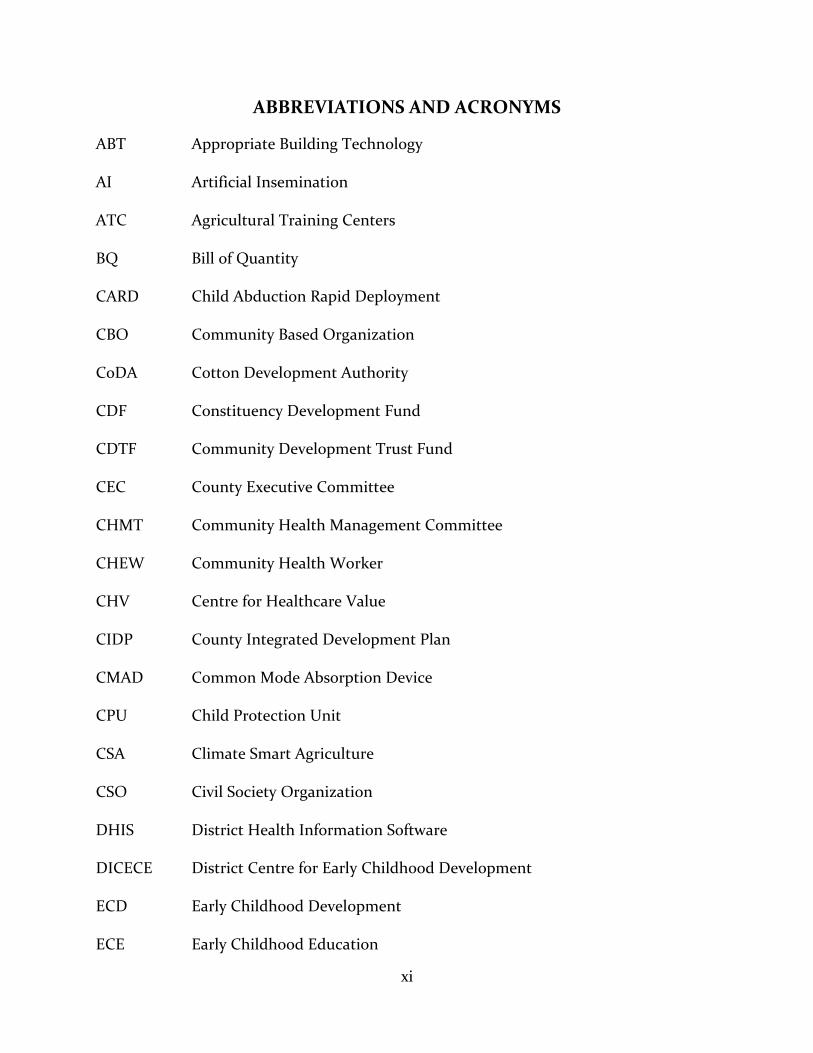
ABBREVIATIONS AND ACRONYMS
ABT Appropriate Building Technology
AI Artificial Insemination
ATC Agricultural Training Centers
BQ Bill of Quantity
CARD Child Abduction Rapid Deployment
CBO Community Based Organization
CoDA Cotton Development Authority
CDF Constituency Development Fund
CDTF Community Development Trust Fund
CEC County Executive Committee
CHMT Community Health Management Committee
CHEW Community Health Worker
CHV Centre for Healthcare Value
CIDP County Integrated Development Plan
CMAD Common Mode Absorption Device
CPU Child Protection Unit
CSA Climate Smart Agriculture
CSO Civil Society Organization
DHIS District Health Information Software
DICECE District Centre for Early Childhood Development
ECD Early Childhood Development
ECE Early Childhood Education
xii
ECOVIC East African Community Organization for Management of Lake Victoria Resources
EGPAF Elizabeth Glassier Pediatric Aids Fund
EIIT Energy, Infrastructure and Information Technology
EMU Efficiency Monitoring Unit
EPZ Export Processing Zone
ERC Energy Regulatory Commission
ESP Economic Stimulus Programme
FACES Family AIDS Care and Education Services
FBO Faith Based Organization
FIC Fully Immunized Children
FMD Foot and Mouth Disease
FOSA Foreign Skills Approval
FY Financial Year
GDC Geothermal Development Company
GDI Gross Domestic Income
GDP Gross Domestic Product
GEBS German Education Boards
GHI Global Horizontal Irradiation
GIS Geographic Information Systems
GNI Gross National Index
GoK Government of Kenya
HBC Home Based Care
xiii
HBCG Homa Bay County Government
HBCT Home Based Care and Testing
HDI Human Development Indicator
HHDs Hybrid Hard Drive
HIV Human Immunodeficiency Virus
HMTs Health Management Technologies
HOMAWASCO Homa Bay Water and Sanitation Company
HR Human Resource
IB Internet Banking
ICIPE International Centre of Insect Physiology and Ecology
ICT Information Communication Technology
ICU Intensive Care Unit
IEBC Independent Electoral and Boundaries Commission
ICRAF International Centre for Research in Agroforestry
IFMIS Integrated Financial Management and Information System
IHRIS Integrated Human Resource Information System
INGOs International Non-GovernmentalOrganizations
KAP Knowledge, Attitude and Practice
KDHS Kenya Demographic Health Survey
KDSP Kenya Devolution Support Programme
KEFRI Kenya Forest Research Institute
KETRACO Kenya Electricity Transmission Company
KEMR Kenya Medical Research Institute
xiv
KFS Kenya Forest Service
KIDDP Kenya Italian Debt for Development Programme
KNBS Kenya National Bureau of Statistics
KPLC Kenya Power and Lighting Company
KWFT Kenya Women Finance Trust
KWS Kenya Wildlife Services
KYEOP Kenya Youth Empowerment Opportunity Project
KYES Kenya Youth Employment Skills
LM Lower Midland
LPDP Literacy Professional Development Project
LSD Large Scale Distribution
LV Land Value
LVEMP Lake Victoria Environmental Management Programme
MCAs Member of County Assembly
MDGs Millennium Development Goals
M&E Monitoring and Evaluation
MoH Ministry of Health
MICS Multiple Indicator Cluster Survey
MSMEs Micro Small Medium Enterprises
MSC Medical Service Cooperation
MTC Medical Training College
MTEF Medium Term Expenditure Framework
MTP Medium Term Plan
xv
MVES Monitoring Verification and Enforcement
NACECE National Centre for Early Childhood Education
NASA National Aeronautics and Space Administration
NCPD National Council for Population and Development
NCPWD National Council for People with Disability
NEMA National Environmental Management Authority
NGO Non-Governmental Organization
NSP National Spatial Plan
NYS National Youth Service
OGRA Oil and Gas Regulatory Authority
OVC Orphans and Vulnerable Children
PBO Public Benefit Organization
PDPs Part Development Plans
PPP Public Private Partnership
PWD Persons with Disability
REA Rural Electrification Authority
RUSLE Revised Universal Soil Lost Equation
SARAM Self-Assessment Rapid Access Management
SCAs Service Centre Agencies
SCHMT Sub-County Health Management Team
SCWECs Sub County Women Empowerment Committees
SDGs Sustainable Development Goals
SDU Strategic Delivery Unit
xvi
SIP Strategic Investment Plan
SMART Self-Monitoring Analysis and Reporting Technology
SW Social Welfare
TTC Teachers Training Institute
TVET Technical Vocational Education Training
UK United Kingdom
UM Upper Midland
UNDP United Nations Development Programme
UNESCO United Nation Educational and Cultural Organization
UN United Nation
UNFPA United Nation Fund for Population Activities
UNICEF United Nations Children‘s Education Fund
US United States
USAID United States Agency for International Development
VIP Volunteers in Partnership
WB Wage Bill
WHO World Health Organization
WIMAX Worldwide Interoperability for Microwave Access
WSPs Water Service Providers
YTCs Youth Training Colleges
xvii
GLOSSARY OF COMMONLY USED TERMS
Baseline: Baseline is an analysis describing the initial state of an indicator before the
start of a project/programme, against which progress can be assessed or comparisons
made.
Programme: A grouping of similar projects and/or services performed by a Ministry or
Department to achieve a specific objective; The Programmes must be mapped to strategic
objectives.
Project: A project is a set of coordinated activities implemented to meet specific
objectives within defined time, cost and performance parameters. Projects aimed at
achieving a common goal form a programme.
Green Economy: The green economy is defined as an economy that aims at reducing
environmental risks and ecological scarcities, and that aims for sustainable development
without degrading the environment.
Indicators: An indicator is a sign of progress /change that result from your project. It
measures a change in a situation or condition and confirms progress towards
achievement of a specific result. It is used to measure a project impact, outcomes,
outputs and inputs that are monitored during project implementation to assess progress
Targets: A target refers to planned level of an indicator achievement
Outcomes: Measures the intermediate results generated relative to the objective of the
intervention. It describes the actual change in conditions/situation as a result of an
intervention output(s) such as changed practices as a result of a programme or project.
Outputs: Immediate result from conducting an activity i.e. goods and services produced
xviii
Performance indicator: A measurement that evaluates the success of an organization or
of a particular activity (such as projects, programs, products and other initiatives) in
which it engages.
Outcome Indicators: This is a specific, observable, and measurable characteristic or
change that will represent achievement of the outcome. Outcome indicators include
quantitative and qualitative measures. Examples: Enrolment rates, transition rates,
mortality rates etc.
Flagship/Transformative projects: These are projects with high impact in terms of
employment creation, increasing county competitiveness, revenue generation etc. They
may be derived from Kenya Vision 2030 or County Transformative Agenda.
Sector: For the purposes of planning, the CIDP sectors shall be based on the following
MTP Sector: Agriculture, Livestock, Rural and Urban Development; Energy,
Infrastructure and ICT; General Economics, Labour and Commercial Affairs; Education;
Public Administration, Inter/intra governmental relations; Social protection, culture and
recreation; and Water and Environmental protection.
xix
FOREWORD
It gives me great pleasure to present the Second County Integrated Development Plan
(CIDP) for Homa Bay County. The adoption of this 2nd CIDP marks a significant step
towards my commitment to leaving behind a legacy that the people of Homa Bay will
remember me with and as an appreciation for my reelection. The 2nd CIDP is anchored on
Kenya's Vision 2030 3rd Medium Term Plan which seeks to transform lives through
advancing socio-economic development through the “Big Four”. It further sets out a standard
and comprehensive approach to county planning and is meant to provide guidance in
service delivery.
This CIDP seeks to create and transform systems, structures and institutions within the
County based on 8 key pillars as envisioned in my reelection manifesto: Trans-formative
Governance, Food Security, Affordable and Quality Healthcare, Industrialization and
Employment Creation, Provision of Clean Potable Water, Infrastructural Growth and
Development, Exploitation of our Natural Resources and Growth of the Tourism
Potential, Provision of Quality Early Childhood Education, Technical and Vocational
Training.
These pillars aim at transforming our county into a new industrializing "middle income
county" by providing a high quality of life to all its citizens by the year 2030" as envisioned
in Kenya's Vision 2030 and support our development agenda towards achieving a broad
range of Sustainable Development Issues.
This second CIDP also paves way for transparent ways of creating an effective
performance framework based on strategy and output. It lays the foundation for
developing a performance monitoring system replete with indicators, targets and
timeframes, which will create an environment for effective management and a high level
of service delivery. This document will form the basis for meaningful engagement with
our citizens, development partners and the private sector as well as facilitate inter-
governmental relations.
xx
In developing this important document my team took into account the views and
contributions from various stakeholders including, different professionals and
professional groups, Members of the County Assembly and development partners.
Various public participation were held in all the eight sub counties within Homa Bay
County. This CIDP is the first step towards actualizing the realization of our dream of
becoming the County of choice.
H.E. Cyprian Otieno Awiti
Governor Homa Bay County Government
xxi
Acknowledgement
Much appreciation is accorded to the Governor, His Excellency Cyprian Awiti and the
Deputy Governor, His Excellency Hamilton Orata for their continued desire,
determination and selflessness towards the growth and prosperity of Homa Bay County.
This vision is illustrated in the Governor's Manifesto, which seeks to make Homa Bay
County a healthy, wealthy and industrialized county.
Further appreciation goes to mycabinet colleagues: Dr. David Okeyo the immediate
former CEC Finance & Economic Planning, Mr. Carilus Ademba, Prof. Richard Muga, Mr.
Dickson Nyawinda, Ms. Beatrice Asyago, Ms. Roselyne Odhiambo, Mr. Juma Aguko, Ms.
Beatrice Ogola and not forgetting former cabinet members: Prof. Tom Ogada, Dr.
Lawrence Oteng’, Mr. Pharesh Ratego, Mr. Naphtally Matta, Ms. Consolata Yambo and
Ms. Dorothy Otieno, for their facilitative and technical advisory roles. I also extend my
appreciation to, the County Secretary, Mr. Isaiah Ogwe and his Deputy, Mr. James
Mokaya, the county Chief of Staff, Mr. Eliud Otieno, the county chief officers: Duncan
Ojiem, Eunice Owino, Jenipher Ndege, Opiata Ogada, Duncan Osodo, Marylyne Agwa,
Chris Agong, Julius Opala and Evance Abeka for their contributions, participation and
dedication in the entire process. The county treasury provided the much-needed financial
support without which the document would not have seen light of day. To this, we owe
our gratitude to Noah Otieno, Mr. Daniel Lieta, Zedekiah Nyamwaga and Polycarp
Odhiambo.
Special gratitude is given to the technical team led by Ruth Aloo that included
departmental heads, directors and economists of various departments who dedicated
time and effort working on the CIDP. These included John Ndege, Richard Bonyo, Willys
Bolo, Dr Gordon Okomo, Ben Onyango, Judith Akinyi, Dr. Kennedy Ongeko, Eliud
Onyango, Charles Obondo, Catherine Arwa, Francis Guma Tabitha Ajwang, Omulama
Martin, Wilfred Awuor, Brian Arwah, Christine Amondi, Kennedy Oyier, Handel
Manasseh, Mr. Kelly Owilla, Ramadhan Mohamed and Suzan Sukiller.
xxii
We acknowledge the significant financial resources and technical support given by the
United Nations Development Program (UNDP), Kenya Devolution Support Program
(KDSP) under the Ministry of Devolution and Planning and the Council of Governors for
their support in ensuring the transition and growth of the County as a whole.
Last but not least, through the citizenry of the county, together with all stakeholders and
well-wishers, we acknowledge that the greater challenge lies in the actualization of
dreams captured in the CIDP which include implementation of the Constitution of Kenya
2010 and achievement of the Kenya Vision 2030.
Hon. Nickolas K'oriko
CEC Member, Finance, Economic Planning and Service Delivery
xxiii
Executive Summary
Homa Bay County Integrated Development Plan (CIDP) 2018-2022, being the second
CIDP for the County, has been prepared by a secretariat consisting of County Executive
Committee members and technical officers drawn from various sub-sectors led by the
County Economic Advisor. The team was guided by the County Integrated Development
Planning Guidelines provided by the Ministry of Devolution and Planning. The guidelines
contained clear and explicit formats and frameworks for collection, collation, validation
and organization of information provided in this CIDP.
In preparing this document, the secretariat made reference to the Homa Bay County’s
Governor’s Manifesto, the first Homa Bay County Integrated Development Plan (CIDP
2013-2017), Homa Bay County Development Profile 2013, Strategic Urban Development
Plan for Homa Bay Municipality 2008-2030, Lake Region Economic Block Blueprint,
report of the MTEF Budget Making Consultations 2018-2022, report of the Third MTP
Consultations 2018-2022, report of the County Budget Consultations 2013-2017, the
resultant approved budgets, reports of the Sectorial Meetings and reports from the Public
feedback through Public Participation for the CIDP. All these documents were prepared
with invaluable inputs from various development stakeholders in the county. The
secretariat also borrowed from the results of the Kenya's 2009 Population and Housing
Census and from relevant publications and other sources. Cognizance was made of the
fact that the CIDP would form the basis on which the County Government of Homa Bay
would institute appropriate measures and develop budgets for the development of Homa
Bay County.
This CIDP conforms with and is informed by the national aspirations and the strategic
direction provided by Kenya Vision 2030. Kenya Vision 2030 is the country’s long-term
development blue print covering the period 2008-2030. It is aimed at making Kenya a
newly industrialized middle-income country providing high quality life for all citizens by
the year 2030.
xxiv
The plan is divided into five chapters. Chapter one deals with the County General
Information which provides the background description of the county. This includes
position and size of the county, administrative and political units, physiological and
natural conditions and settlement patterns. In addition, infrastructure coverage,
community organizations, forestry and agro forestry, tourism wildlife and industry are
also included. The population profiles and projections form part of county general
information.
Chapter two provides the linkages of the Integrated Development Plan with the Kenya
Vision 2030, and the Third Medium Term Plan, Sustainable Development Goals, the
Constitution of Kenya, Lake Region Economic Block, sectoral plans and other plans by
development and implementing partners.
Chapter Three explores the implementation of Previous CIDP 2013-2017. The chapter
elaborates the reports per department on summary of key achievements versus planned
targets focusing on outcomes, recommendations, challenges and lessons learnt while
implementing the previous CIDP.
Chapter four unveils the County Development Priorities and Strategies in the CIDP 2018-
2022 per sector. It discusses spatial development framework, key county development
priorities, strategies and Programmes and Projects as identified by stakeholders in the
county.
Chapter five illustrates the implementation framework of the CIDP 2018-2022.This
chapter demonstrates how these institutions will affect the implementation of the CIDP
2018-2022 they include: The county organogram, development partners, national
government and Public Benefit Organizations and clearly indicate the linkages. Resource
requirement indicates proposed budget for each sector as derived from the sector
programmes while resource mobilization illustrates the strategies which should include:
revenue raising, asset management, financial management, debt management, capital
financing and accountability.
xxv
Chapter six outlines the monitoring and evaluation framework. It elaborates the county
monitoring and evaluation framework as outlined in the County Integrated Monitoring
and Evaluation System (CIMES) guidelines.It contains the CIDP results matrix which
allows implementers and decision-makers alike to assess progress towards county
developmentpriorities.
1
CHAPTER ONE COUNTY GENERAL INFORMATION
1.0 County Overview
This chapter gives a brief overview of the county, situation analysis and resource endowment. The
chapter provides a description of the county in terms of position and size, physiographic and
natural conditions, the administrative and political units as well as demographic features. In
addition, it provides information on infrastructure and access: land and land use; employment;
irrigation infrastructure and schemes; crop, livestock, fish production; oil and other mineral
resources; tourism, and wild life; industry and trade; the blue economy; forestry, agroforestry and
value addition; financial services; environment and climate change; sports, culture and creative
arts; community organizations/ non-state actors; security, law and order; and social protection.
1.1 Position and Size
Homa Bay County in the Kenyan context lies between latitudes 0015 South and 0052 South, and
between longitudes 340 East and 350 East. The County covers an estimated area of 4,267.1 km2
constituting 2,696 km2 of land area and the largest freshwater lake in Africaof surface area 1,227
Km2. The County is located in South Western Kenya along Lake Victoria where it boarders Kisumu
and Siaya counties to the North, Kisii and Nyamira counties to the East, Migori County to the
South and the Republic of Uganda to the West. The county headquarters is located about 420 km
from Nairobi.
2
Source: GoK, 2013
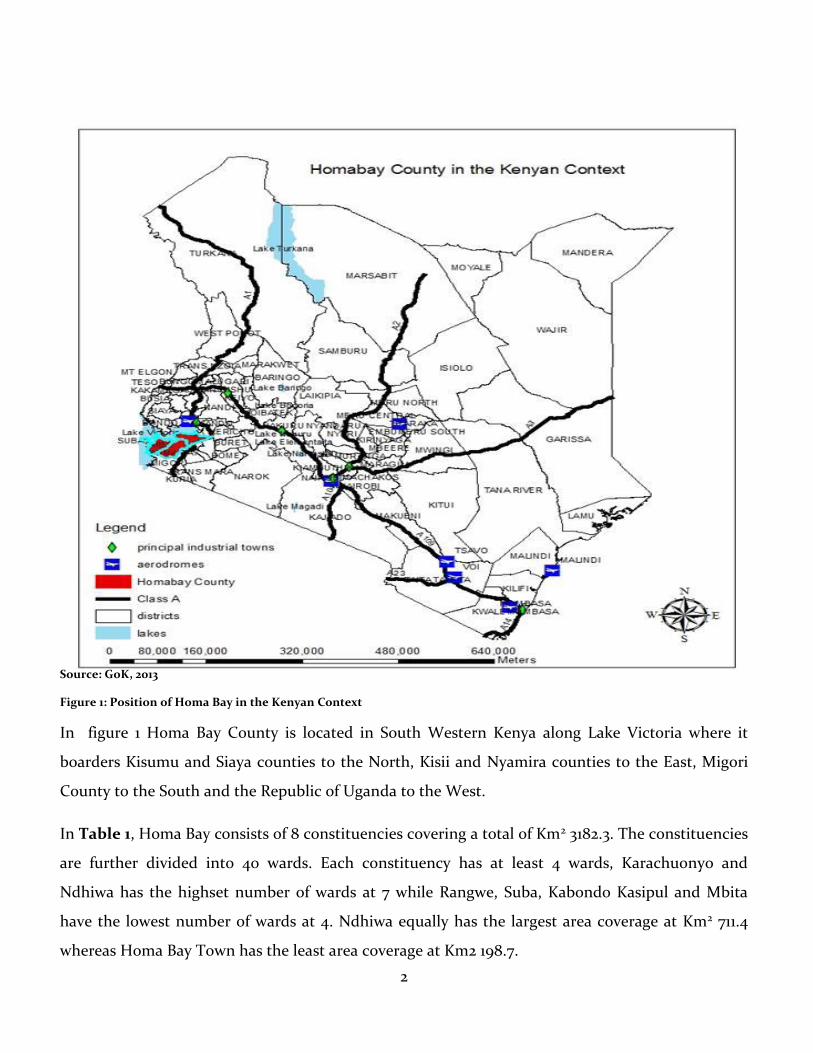
Figure 1: Position of Homa Bay in the Kenyan Context
In figure 1 Homa Bay County is located in South Western Kenya along Lake Victoria where it
boarders Kisumu and Siaya counties to the North, Kisii and Nyamira counties to the East, Migori
County to the South and the Republic of Uganda to the West.
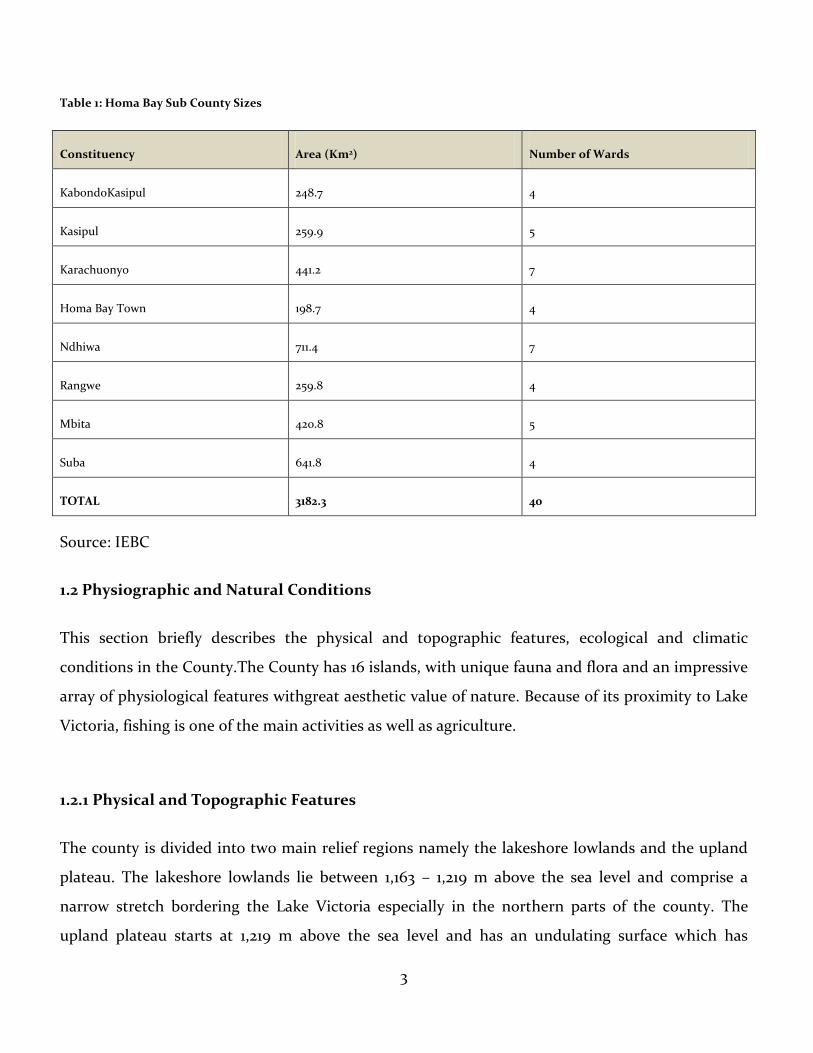
In Table 1, Homa Bay consists of 8 constituencies covering a total of Km2 3182.3. The constituencies
are further divided into 40 wards. Each constituency has at least 4 wards, Karachuonyo and
Ndhiwa has the highset number of wards at 7 while Rangwe, Suba, Kabondo Kasipul and Mbita
have the lowest number of wards at 4. Ndhiwa equally has the largest area coverage at Km2 711.4
whereas Homa Bay Town has the least area coverage at Km2 198.7.
3
Table 1: Homa Bay Sub County Sizes
Source: IEBC
1.2 Physiographic and Natural Conditions
This section briefly describes the physical and topographic features, ecological and climatic
conditions in the County.The County has 16 islands, with unique fauna and flora and an impressive
array of physiological features withgreat aesthetic value of nature. Because of its proximity to Lake
Victoria, fishing is one of the main activities as well as agriculture.
1.2.1 Physical and Topographic Features
The county is divided into two main relief regions namely the lakeshore lowlands and the upland
plateau. The lakeshore lowlands lie between 1,163 – 1,219 m above the sea level and comprise a
narrow stretch bordering the Lake Victoria especially in the northern parts of the county. The
upland plateau starts at 1,219 m above the sea level and has an undulating surface which has
Constituency Area (Km2) Number of Wards
KabondoKasipul 248.7 4
Kasipul 259.9 5
Karachuonyo 441.2 7
Homa Bay Town 198.7 4
Ndhiwa 711.4 7
Rangwe 259.8 4
Mbita 420.8 5
Suba 641.8 4
TOTAL 3182.3 40
4
resulted from erosion of an ancient plain. It is characterized by residual highlands such as Gwassi
and Ngorome hills in Suba, Gembe and Ruri Hills in Mbita, Wire Hills in Kasipul as well as Homa
hills in Karachuonyo. Kodera forest in Kasipul and the Kanyamwa escarpment that runs along the
borders of Ndhiwa and Mbita also form part of the upland plateau. To the west of the county lies
the Lambwe Valley where Ruma National park is located.
The county is dissected by a number of rivers namely Awach Kibuon, AwachTende, Maugo, Kuja,
Rangwe and Riana rivers, most of which originates from Kisii and Nyamira counties. There are also
several seasonal rivers and streams which originate from highlands within the county. The county
has 16 islands, some with unique fauna and flora and an impressive array of physiographic features
with great aesthetic value as well as breath-taking scenery and forested landscape particularly those
around the islands and the coast of Lake Victoria and a peninsula like Sikri of Mbita sub-county.
1.2.2 Ecological Conditions
Agricultural activities in the County vary with the seven Agro-ecological Zones namely:
i) Upper Midland (UM1), coffee-tea-zone which occupies southern parts of Kasipul and
KabondoKasipul sub-counties where tea and coffee are grown.
ii) Upper Midland (UM3), marginal coffee zone covers Gwassi hills of Suba sub-county.
Maize, millet, pineapples, sorghum, sunflower and tomatoes grow well here.
iii) Upper Midland (UM4), sunflower-maize zone covers areas surrounding Gwassi hills of
Suba as well as Ndhiwa and Nyarongi areas of Ndhiwa sub-county. It supports maize,
soya beans and pineapples.
iv) Lower Midland (LM2), marginal sugar zone occupies parts of Ndhiwa, Homa Bay Town,
Rangwe, Kasipul and the north of KabondoKasipul sub-counties. This zone supports
green grams, millet, sorghum, tobacco, sunflower, sugarcane, beans, pineapples, sisal
and groundnuts.
5
v) Lower midland (LM3), cotton zone occupies parts of Homa Bay Town and Rangwe sub-
counties. It is suitable for growing maize, sorghum, cow peas, ground nuts, beans, soya,
sweet potatoes, sunflower, simsim, green grams, rice and vegetables.
vi) Lower Midland (LM4), marginal cotton zone occupies a strip along west of Karachuonyo,
central Mbita and Gwassi areas of Suba sub-county. It supports the growth of cotton.
vii) Lower Midland (LM5), livestock-millet zone occupies S.W. Suba, Rusinga and Mfangano
islands, Lambwe Valley and Gembe and Kasgunga areas of Mbita sub-county. It supports
livestock rearing and millet growing.
1.2.3 Climatic Conditions
Homa Bay County has an inland equatorial type of climate. The climate is however modified by the
effects of altitude and nearness to the lake which makes temperatures lower than in equatorial
climate. There are two rainy seasons namely the long rainy season from March to June and the
short rainy season from August to November. The rainfall received in the long rainy season is 60
per cent reliable and ranges from 250 – 1000 mm while 500 –700 mm is received in the short rainy
season. The county receives an annual rainfall ranging from 700 to 800mm.
6
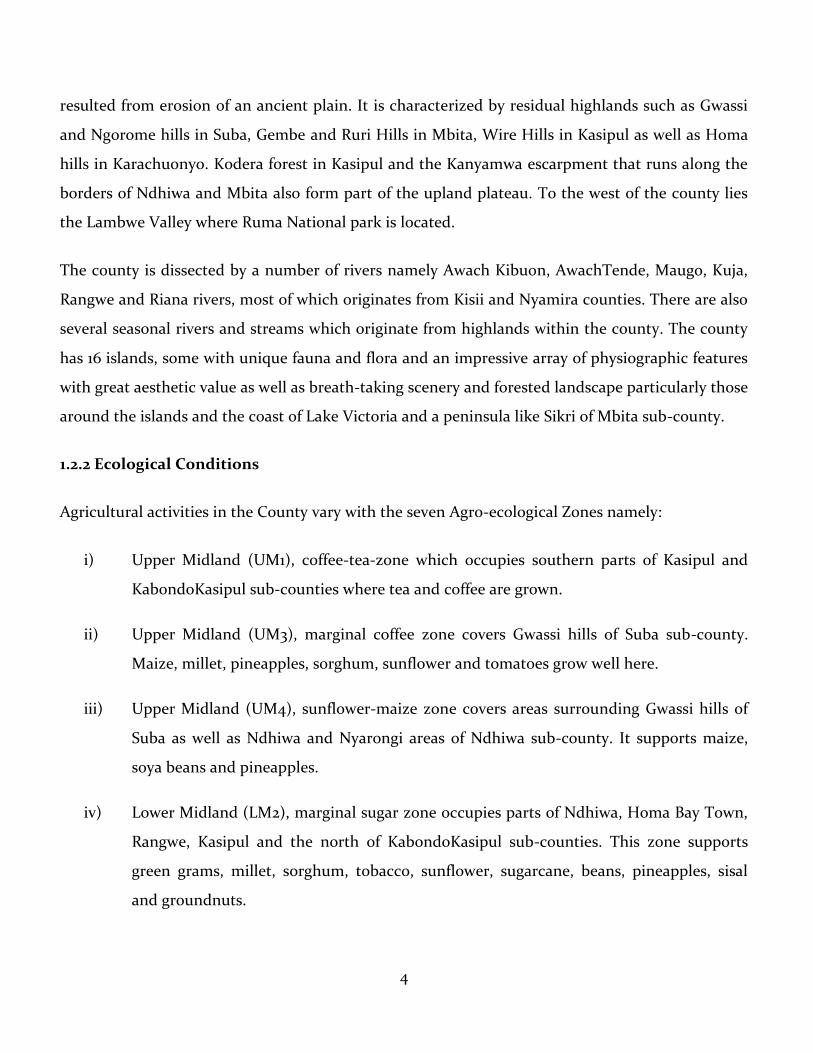
Source: GoK, 2013
Figure 2: Homa Bay County in the Kenyan Context
Figure 2 shows the rainfall distribution pattern in Homa Bay County .Temperatures in the county
ranges from 18.6°C to 17.1°C, with hot months being between December and March. February is
usually the hottest month in the year. The temperatures are however lower in areas bordering Kisii
and Nyamira highlands and higher in areas bordering the lake..
1.3 Administrative and Political Units
The county has eight constituencies/sub counties, 40 wards, 23 divisions, 140 locations and 265 sub
locations as illustrated below.
1.3.1 Administrative Sub Divisions
7
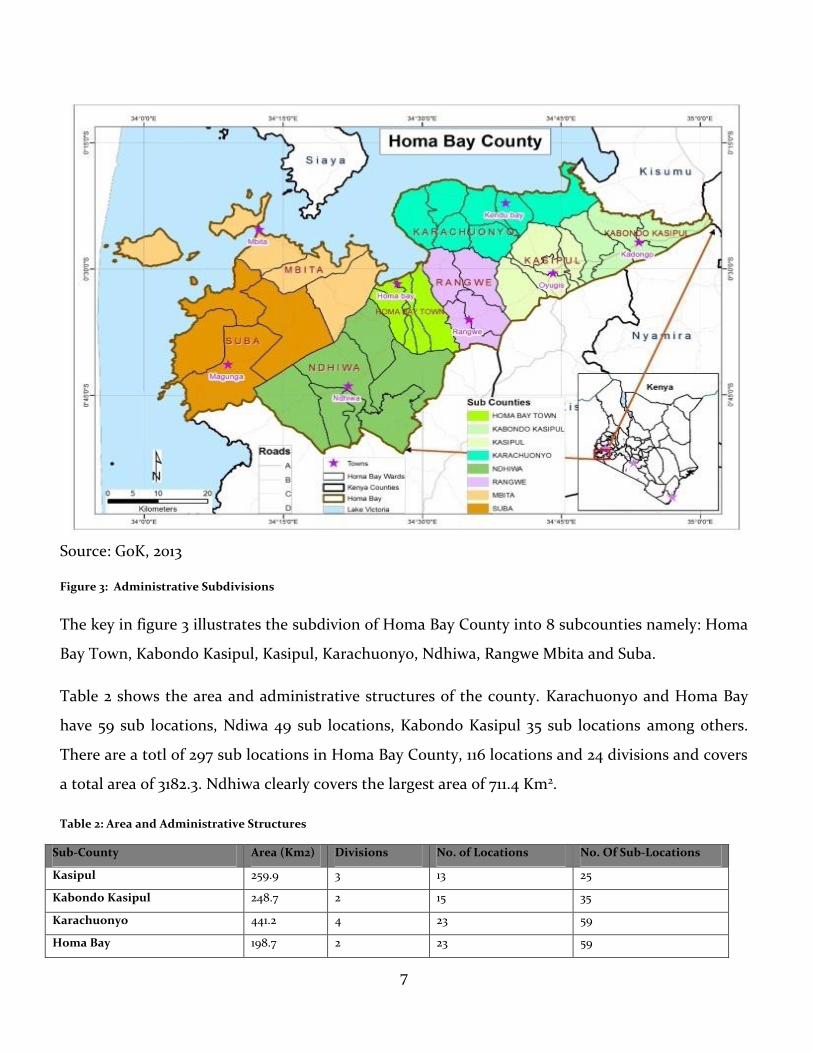
Source: GoK, 2013
Figure 3: Administrative Subdivisions
The key in figure 3 illustrates the subdivion of Homa Bay County into 8 subcounties namely: Homa
Bay Town, Kabondo Kasipul, Kasipul, Karachuonyo, Ndhiwa, Rangwe Mbita and Suba.
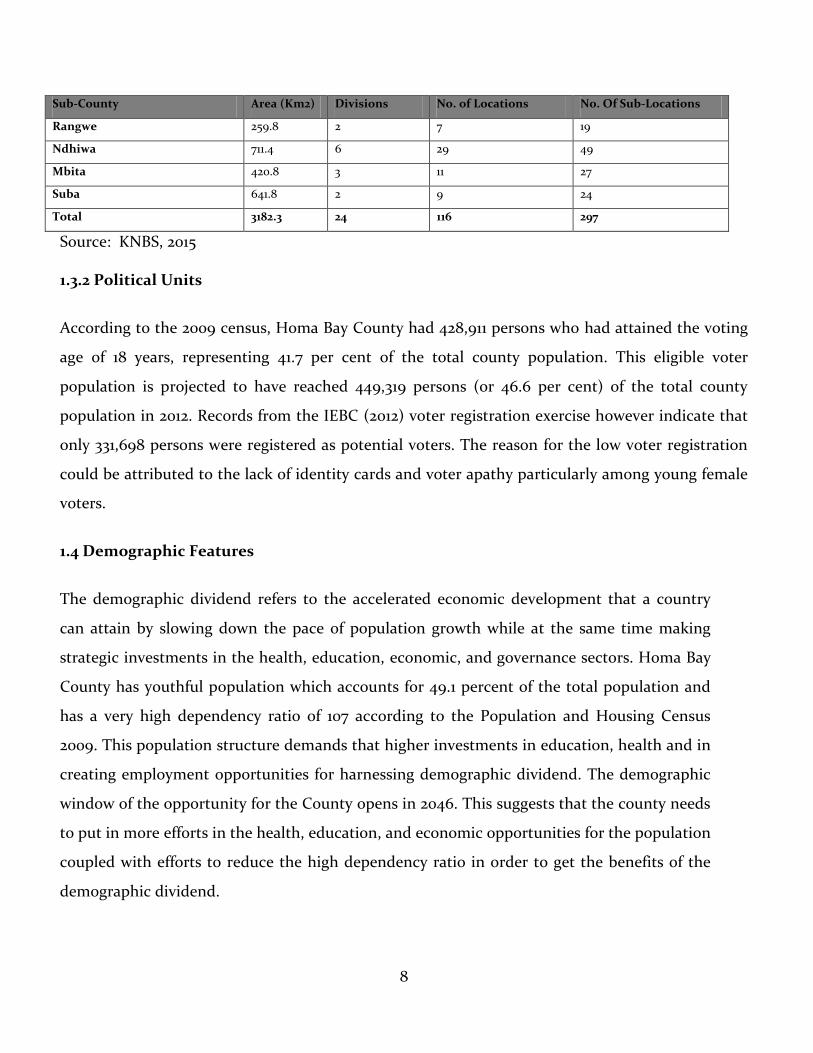
Table 2 shows the area and administrative structures of the county. Karachuonyo and Homa Bay
have 59 sub locations, Ndiwa 49 sub locations, Kabondo Kasipul 35 sub locations among others.
There are a totl of 297 sub locations in Homa Bay County, 116 locations and 24 divisions and covers
a total area of 3182.3. Ndhiwa clearly covers the largest area of 711.4 Km2.
Table 2: Area and Administrative Structures
Sub-County Area (Km2) Divisions No. of Locations No. Of Sub-Locations
Kasipul 259.9 3 13 25
Kabondo Kasipul 248.7 2 15 35
Karachuonyo 441.2 4 23 59
Homa Bay 198.7 2 23 59
8
Sub-County Area (Km2) Divisions No. of Locations No. Of Sub-Locations
Rangwe 259.8 2 7 19
Ndhiwa 711.4 6 29 49
Mbita 420.8 3 11 27
Suba 641.8 2 9 24
Total 3182.3 24 116 297
Source: KNBS, 2015
1.3.2 Political Units
According to the 2009 census, Homa Bay County had 428,911 persons who had attained the voting
age of 18 years, representing 41.7 per cent of the total county population. This eligible voter
population is projected to have reached 449,319 persons (or 46.6 per cent) of the total county
population in 2012. Records from the IEBC (2012) voter registration exercise however indicate that
only 331,698 persons were registered as potential voters. The reason for the low voter registration
could be attributed to the lack of identity cards and voter apathy particularly among young female
voters.
1.4 Demographic Features
The demographic dividend refers to the accelerated economic development that a country
can attain by slowing down the pace of population growth while at the same time making
strategic investments in the health, education, economic, and governance sectors. Homa Bay
County has youthful population which accounts for 49.1 percent of the total population and
has a very high dependency ratio of 107 according to the Population and Housing Census
2009. This population structure demands that higher investments in education, health and in
creating employment opportunities for harnessing demographic dividend. The demographic
window of the opportunity for the County opens in 2046. This suggests that the county needs
to put in more efforts in the health, education, and economic opportunities for the population
coupled with efforts to reduce the high dependency ratio in order to get the benefits of the
demographic dividend.
9
1.4.1. Population size and composition
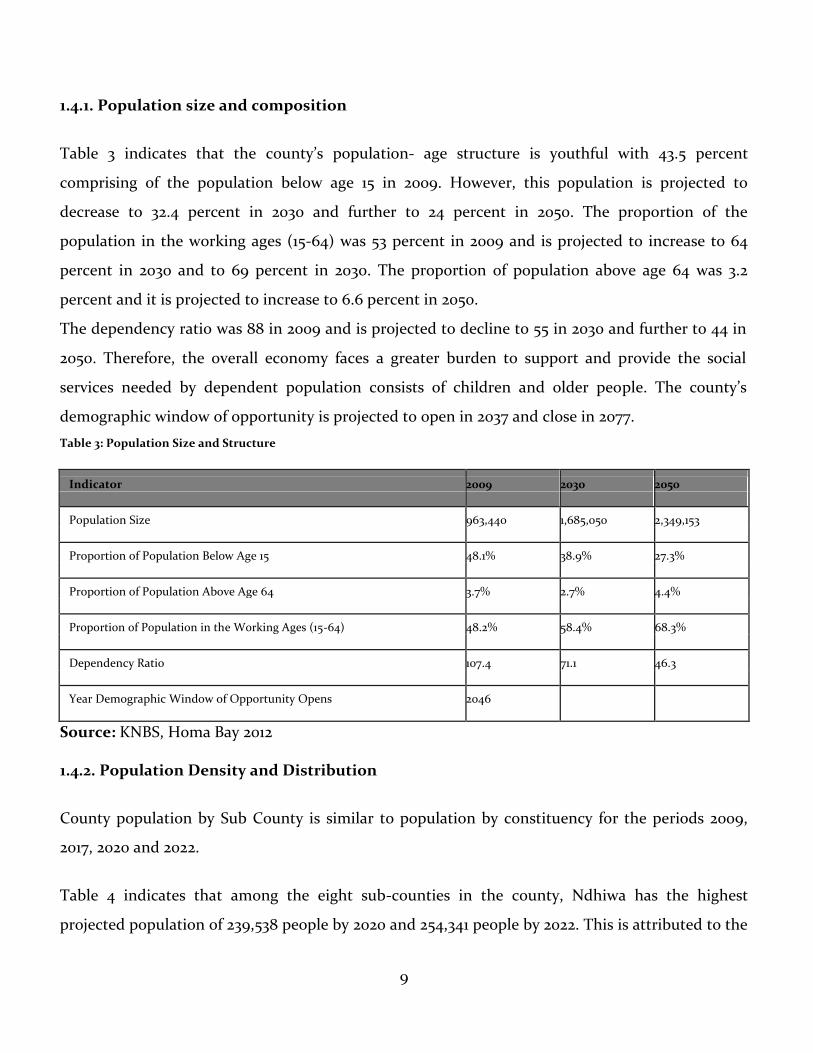
Table 3 indicates that the county’s population- age structure is youthful with 43.5 percent
comprising of the population below age 15 in 2009. However, this population is projected to
decrease to 32.4 percent in 2030 and further to 24 percent in 2050. The proportion of the
population in the working ages (15-64) was 53 percent in 2009 and is projected to increase to 64
percent in 2030 and to 69 percent in 2030. The proportion of population above age 64 was 3.2
percent and it is projected to increase to 6.6 percent in 2050.
The dependency ratio was 88 in 2009 and is projected to decline to 55 in 2030 and further to 44 in
2050. Therefore, the overall economy faces a greater burden to support and provide the social
services needed by dependent population consists of children and older people. The county’s
demographic window of opportunity is projected to open in 2037 and close in 2077.
Table 3: Population Size and Structure
Source: KNBS, Homa Bay 2012
1.4.2. Population Density and Distribution
County population by Sub County is similar to population by constituency for the periods 2009,
2017, 2020 and 2022.
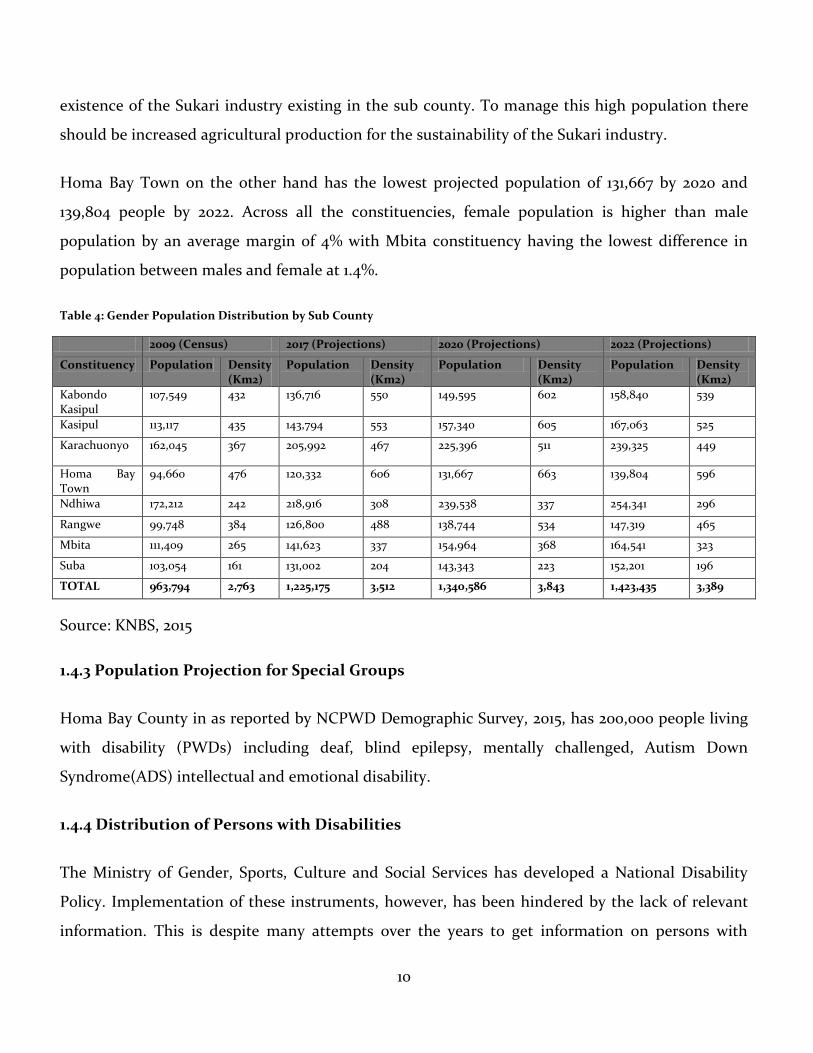
Table 4 indicates that among the eight sub-counties in the county, Ndhiwa has the highest
projected population of 239,538 people by 2020 and 254,341 people by 2022. This is attributed to the
Indicator 2009 2030 2050
Population Size 963,440 1,685,050 2,349,153
Proportion of Population Below Age 15 48.1% 38.9% 27.3%
Proportion of Population Above Age 64 3.7% 2.7% 4.4%
Proportion of Population in the Working Ages (15-64) 48.2% 58.4% 68.3%
Dependency Ratio 107.4 71.1 46.3
Year Demographic Window of Opportunity Opens 2046
10
existence of the Sukari industry existing in the sub county. To manage this high population there
should be increased agricultural production for the sustainability of the Sukari industry.
Homa Bay Town on the other hand has the lowest projected population of 131,667 by 2020 and
139,804 people by 2022. Across all the constituencies, female population is higher than male
population by an average margin of 4% with Mbita constituency having the lowest difference in
population between males and female at 1.4%.
Table 4: Gender Population Distribution by Sub County
2009 (Census) 2017 (Projections) 2020 (Projections) 2022 (Projections)
Constituency Population Density (Km2)
Population Density (Km2)
Population Density (Km2)
Population Density (Km2)
Kabondo Kasipul
107,549 432 136,716 550 149,595 602 158,840 539
Kasipul 113,117 435 143,794 553 157,340 605 167,063 525
Karachuonyo 162,045 367 205,992 467 225,396 511 239,325 449
Homa Bay Town
94,660 476 120,332 606 131,667 663 139,804 596
Ndhiwa 172,212 242 218,916 308 239,538 337 254,341 296
Rangwe 99,748 384 126,800 488 138,744 534 147,319 465
Mbita 111,409 265 141,623 337 154,964 368 164,541 323
Suba 103,054 161 131,002 204 143,343 223 152,201 196
TOTAL 963,794 2,763 1,225,175 3,512 1,340,586 3,843 1,423,435 3,389
Source: KNBS, 2015
1.4.3 Population Projection for Special Groups
Homa Bay County in as reported by NCPWD Demographic Survey, 2015, has 200,000 people living
with disability (PWDs) including deaf, blind epilepsy, mentally challenged, Autism Down
Syndrome(ADS) intellectual and emotional disability.
1.4.4 Distribution of Persons with Disabilities
The Ministry of Gender, Sports, Culture and Social Services has developed a National Disability
Policy. Implementation of these instruments, however, has been hindered by the lack of relevant
information. This is despite many attempts over the years to get information on persons with
11
disabilities. The 2007 Kenya National Survey for Persons with Disabilities (KNSPWD) was
conducted to bridge these data gaps. The survey aimed to estimate the number of PWDs, their
distribution in the country, and their demographic, socio-economic and socio-cultural
characteristics.
People living with disability are also part of the population of Homa Bay County. There are various
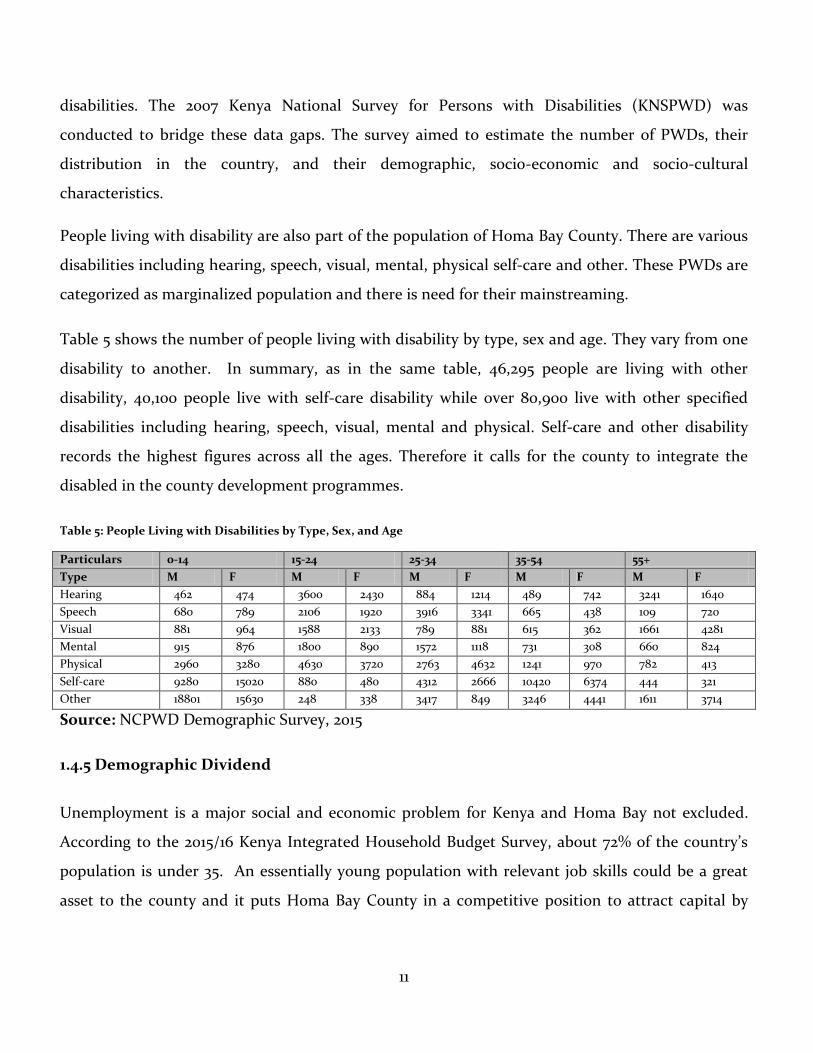
disabilities including hearing, speech, visual, mental, physical self-care and other. These PWDs are
categorized as marginalized population and there is need for their mainstreaming.
Table 5 shows the number of people living with disability by type, sex and age. They vary from one
disability to another. In summary, as in the same table, 46,295 people are living with other
disability, 40,100 people live with self-care disability while over 80,900 live with other specified
disabilities including hearing, speech, visual, mental and physical. Self-care and other disability
records the highest figures across all the ages. Therefore it calls for the county to integrate the
disabled in the county development programmes.
Table 5: People Living with Disabilities by Type, Sex, and Age
Particulars 0-14 15-24 25-34 35-54 55+
Type M F M F M F M F M F
Hearing 462 474 3600 2430 884 1214 489 742 3241 1640
Speech 680 789 2106 1920 3916 3341 665 438 109 720
Visual 881 964 1588 2133 789 881 615 362 1661 4281
Mental 915 876 1800 890 1572 1118 731 308 660 824
Physical 2960 3280 4630 3720 2763 4632 1241 970 782 413
Self-care 9280 15020 880 480 4312 2666 10420 6374 444 321
Other 18801 15630 248 338 3417 849 3246 4441 1611 3714
Source: NCPWD Demographic Survey, 2015
1.4.5 Demographic Dividend
Unemployment is a major social and economic problem for Kenya and Homa Bay not excluded.
According to the 2015/16 Kenya Integrated Household Budget Survey, about 72% of the country’s
population is under 35. An essentially young population with relevant job skills could be a great
asset to the county and it puts Homa Bay County in a competitive position to attract capital by
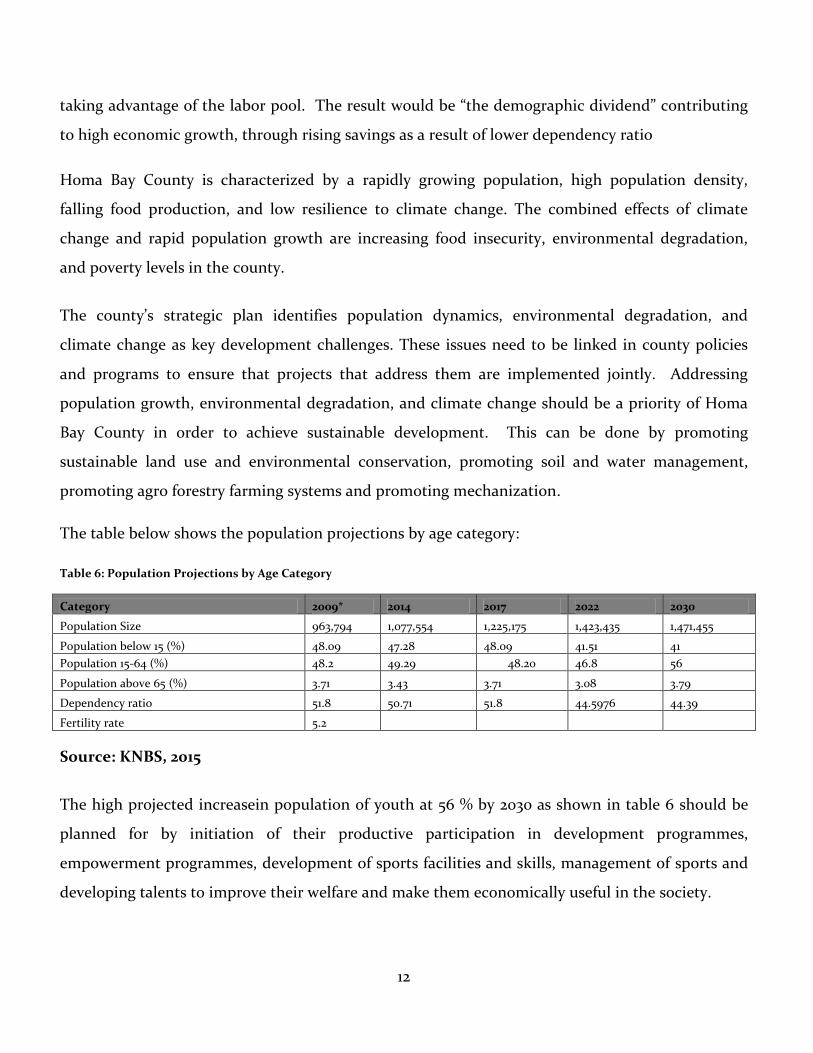
12
taking advantage of the labor pool. The result would be “the demographic dividend” contributing
to high economic growth, through rising savings as a result of lower dependency ratio
Homa Bay County is characterized by a rapidly growing population, high population density,
falling food production, and low resilience to climate change. The combined effects of climate
change and rapid population growth are increasing food insecurity, environmental degradation,
and poverty levels in the county.
The county’s strategic plan identifies population dynamics, environmental degradation, and
climate change as key development challenges. These issues need to be linked in county policies
and programs to ensure that projects that address them are implemented jointly. Addressing
population growth, environmental degradation, and climate change should be a priority of Homa
Bay County in order to achieve sustainable development. This can be done by promoting
sustainable land use and environmental conservation, promoting soil and water management,
promoting agro forestry farming systems and promoting mechanization.
The table below shows the population projections by age category:
Table 6: Population Projections by Age Category
Category 2009* 2014 2017 2022 2030
Population Size 963,794 1,077,554 1,225,175 1,423,435 1,471,455
Population below 15 (%) 48.09 47.28 48.09 41.51 41
Population 15-64 (%) 48.2 49.29 48.20 46.8 56
Population above 65 (%) 3.71 3.43 3.71 3.08 3.79
Dependency ratio 51.8 50.71 51.8 44.5976 44.39
Fertility rate 5.2
Source: KNBS, 2015
The high projected increasein population of youth at 56 % by 2030 as shown in table 6 should be
planned for by initiation of their productive participation in development programmes,
empowerment programmes, development of sports facilities and skills, management of sports and
developing talents to improve their welfare and make them economically useful in the society.
13
Human Development Approach
One of the main objectives under the Kenya‘s economic blue print, Vision 2030, is to provide a high
quality of life for all Kenyans. Various human development indices will be applied to measure the
broad level of social economic wellbeing. These indices use three basic dimensions namely
education, health and income.
The HDI emphasizes that people and their capabilities should be the ultimate criteria for assessing
the development of a country and not economic growth alone since two countries/regions with the
same level of GNI per capita can end up with such different human development outcomes. Homa
Bay County performs below the national average on most socio-economic indicators. The county
scores a 0.46 on the Human Development Index (HDI)—a composite measure of development that
combines indicators of life expectancy, educational attainment and income. This is below the
national average of 0.56. Poverty is prevalent in the county and manifests itself in other socio-
economic outcomes such as poor nutrition, health, and education, as well as a lack of access to
basic services.
The Constitution of Kenya, 2010 in Article 27 recognizes that measures should be put in place to
encourage affirmative action programmes and policies to address past inequalities. Economic and
social rights to all are also recognized in Article 43. These include the right to health care services,
adequate housing, and sanitation, adequate food of acceptable quality, clean and safe water and
appropriate social security to vulnerable groups in the society.
The 6th Kenya Human Development Report, 2009 introduced a new measure for youth
development in Kenya, the Youth Development Index (YDI). The index was at 0.5817 nationally but
also depicted variations across the regions. The index is a composite of education, income and
survivorship (Health) dimensions. Therefore, it is critical to look at youth as a resource and a
potential wealth for a nation. However, a large group of youths are potentially at risk of engaging in
harmful anti-social behaviors, including risky sexual behavior, substance use, and crime. The
constitution requires the government to take steps to ensure the youth can access relevant
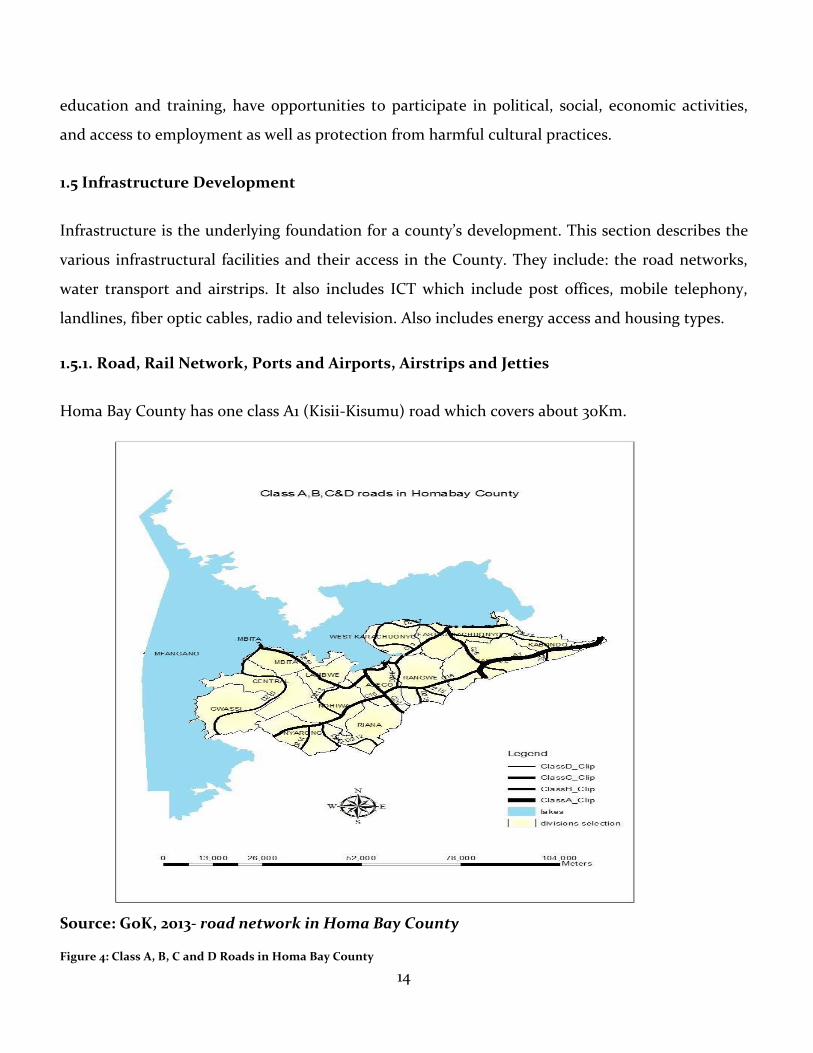
14
education and training, have opportunities to participate in political, social, economic activities,
and access to employment as well as protection from harmful cultural practices.
1.5 Infrastructure Development
Infrastructure is the underlying foundation for a county’s development. This section describes the
various infrastructural facilities and their access in the County. They include: the road networks,
water transport and airstrips. It also includes ICT which include post offices, mobile telephony,
landlines, fiber optic cables, radio and television. Also includes energy access and housing types.
1.5.1. Road, Rail Network, Ports and Airports, Airstrips and Jetties
Homa Bay County has one class A1 (Kisii-Kisumu) road which covers about 30Km.
Source: GoK, 2013- road network in Homa Bay County
Figure 4: Class A, B, C and D Roads in Homa Bay County
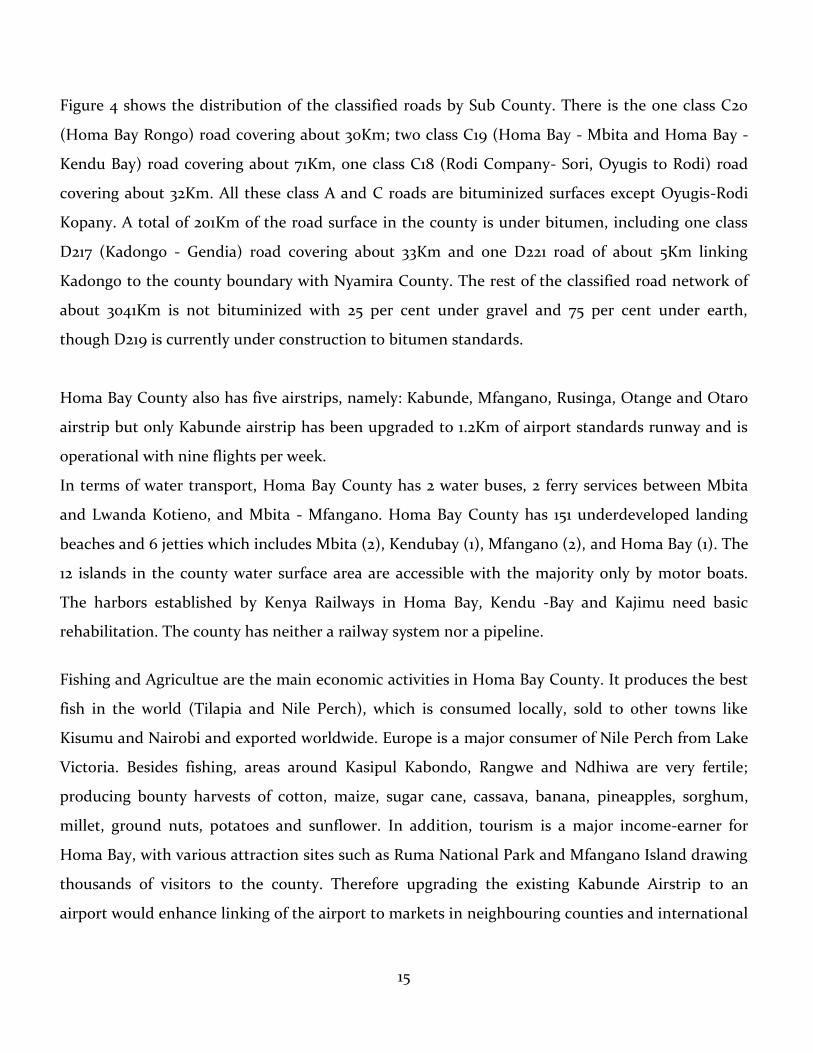
15
Figure 4 shows the distribution of the classified roads by Sub County. There is the one class C20
(Homa Bay Rongo) road covering about 30Km; two class C19 (Homa Bay - Mbita and Homa Bay -
Kendu Bay) road covering about 71Km, one class C18 (Rodi Company- Sori, Oyugis to Rodi) road
covering about 32Km. All these class A and C roads are bituminized surfaces except Oyugis-Rodi
Kopany. A total of 201Km of the road surface in the county is under bitumen, including one class
D217 (Kadongo - Gendia) road covering about 33Km and one D221 road of about 5Km linking
Kadongo to the county boundary with Nyamira County. The rest of the classified road network of
about 3041Km is not bituminized with 25 per cent under gravel and 75 per cent under earth,
though D219 is currently under construction to bitumen standards.
Homa Bay County also has five airstrips, namely: Kabunde, Mfangano, Rusinga, Otange and Otaro
airstrip but only Kabunde airstrip has been upgraded to 1.2Km of airport standards runway and is
operational with nine flights per week.
In terms of water transport, Homa Bay County has 2 water buses, 2 ferry services between Mbita
and Lwanda Kotieno, and Mbita - Mfangano. Homa Bay County has 151 underdeveloped landing
beaches and 6 jetties which includes Mbita (2), Kendubay (1), Mfangano (2), and Homa Bay (1). The
12 islands in the county water surface area are accessible with the majority only by motor boats.
The harbors established by Kenya Railways in Homa Bay, Kendu -Bay and Kajimu need basic
rehabilitation. The county has neither a railway system nor a pipeline.
Fishing and Agricultue are the main economic activities in Homa Bay County. It produces the best
fish in the world (Tilapia and Nile Perch), which is consumed locally, sold to other towns like
Kisumu and Nairobi and exported worldwide. Europe is a major consumer of Nile Perch from Lake
Victoria. Besides fishing, areas around Kasipul Kabondo, Rangwe and Ndhiwa are very fertile;
producing bounty harvests of cotton, maize, sugar cane, cassava, banana, pineapples, sorghum,
millet, ground nuts, potatoes and sunflower. In addition, tourism is a major income-earner for
Homa Bay, with various attraction sites such as Ruma National Park and Mfangano Island drawing
thousands of visitors to the county. Therefore upgrading the existing Kabunde Airstrip to an
airport would enhance linking of the airport to markets in neighbouring counties and international
16
markets and also the rehabilitation of the harbors established by the Kenya Railways would
facilitate these major economic activities in Homa Bay County.
1.5.2. Information Communication and Technology
Homa Bay County has 14 post offices spread across its vast territory to adequately cater for its
population needs. However, with the emergence of mobile phones-based short message services,
increased availability of email facilities, other electronic media and curio services, the use of post
office services has been significantly reduced. The county enjoys mobile phone penetration of
85.6% with all the national telephone operators registering a presence. The use of all landline
services has virtually ended in the county with most connectivity infrastructure vandalized.
Possession of mobile phones is at 54% averagely in the county, while this has significantly
increased for the urban households with 9 in 10 urban households (94 percent) owning a mobile
phone. Huduma Centre was introduced in the county hence bringing services closer and boosting
the economy.
The County Government of Homa Bay has developed a Multi-Sectoral County ICT Road Map to
guide the implementation of ICT in the County; established an ICT and Innovation Hub in Homa
Bay Town; extended the fiber optic cable to the County Headquarters; operationalized County
Website and improved government service delivery processes by networking various offices. There
is need to expand the already existing ICT hubs that had been started by the National Government
and further expand incubation centers in the remaining sub counties
1.5.3. Energy access
Majority of Homa Bay county residents rely heavily on fuel wood (84%) and charcoal (13.4%)
for cooking. Firewood is used more intensively in rural areas while charcoal in urban areas. As
a result, Homa Bay is one of the counties with a negative biomass net balance represented by
an annual deficit of 257,706 cubic meters. The county is not doing well in terms of efficient use
of paraffin for lighting, with 94.6 per cent of households using it for lighting. This scenario is
unsustainable and must be reversed by increasing access to alternative clean energy such as
17
grid electricity, off-grid solar, biomass energy and solar lamps. Energy saving cook stoves or
Jikos will also be promoted to reduce firewood and paraffin consumption in the county
through the program known as “Operation Nyangile out.”
Average annual demand for electric energy in Homa Bay County was 51.1GWh as at the end of
2016 and is expected to increase to 149.31Gwh (low case scenario) or 284.25Gwh (high case
scenario) by the year 2030. This does not compare favorably with power supply, which
originates from Eastern and Central parts of Kenya where most of the power generating plants
are located. Given the expected growth in electric energy demand, the County Government
plans to meet the deficit by facilitating investments in solar, geothermal and biomass power
generation plants, which have significant power generation potential in the County.
Much of the demand is concentrated in urban centers indicating that electricity consumption in
the rural areas is quite low. All urban and most rural trading centers in the county have been
covered with grid power through the rural electrification program. However, only 19% of
households are currently connected and the rest, the majority of whom are found in the rural
areas, are either outside the range of the few existing transformers or cannot afford the cost of
connecting to the main grid. The County Government intends to increase energy access to the
remaining population by having them connected through maximization of existing power
systems network, extending system networks to underserved areas, installing more
transformers in identified settlement sites or subsidizing the cost of connection.
1.5.4 Housing Types
The type of material used for the floor of a building often serve as useful indicator of housing
quality from both health and wealth perspective. The vast majority of housing units in the
county are earth-floored (74.7 per cent), mud-wood walled (65.6 per cent) and iron-roofed (82.3
per cent). According to the 2009 Kenya Population and Housing Census, 11.2 per cent of the
housing in the county was classified as permanent even though this figure is expected to have
experience great improvement over the last three years. 24.4 per cent of the housing in the
county had floors made of cement, 15.1 per cent roofs were grass thatched and 16.5 per cent and
18
5.6 per cent had walls made of cemented materials and corrugated iron sheets respectively. Less
than 1 per cent was tiled either on the roof or on the floor. Appropriate infrastructure for
housing development is still lacking in the county and it would be imperative for government to
step in and help modernize housing in the county through appropriate support mechanisms
such as mortgage guaranteeing, urban regeneration and housing subsidies. Locals have invited a
stronger presence of the national housing corporation to spearhead and support housing
development in the county through public-private partnerships and other modern initiatives.
1.6 Land and Land use
A desktop survey by Cedia Africa/Utawala (2016) revealed that only 11% of the land is used under
cash crops. Most of the land is being used to produce subsistence food crops. The County has the
potential to produce more than it can consume. The mean land holding size in Homa Bay County
stands at 6 acres, meaning majority of farmers fall in the bracket of smallholders. On average, two
acres of these are used for settlement and the balance is used for agricultural and rural
development purpose. The survey further reported key challenges facing land use and hence
agriculture to include drought, lack of access to credit, and outbreak of pests/diseases such as army
worms, inadequate staff at the sub-county, ward and location levels, especially extension staff, high
poverty levels and low soil fertility. 80% of the farmers produce maize and beans as the staple crops
of the county. Main cash crops produced in the county are sugar cane (Ndhiwa), Sun Flower (Suba
North and South) Rice, Pineapple (Rangwe) and Potatoes and Groundnuts (Karachuonyo South,
Karachuonyo East, Rangwe and Ndhiwa). Excellent potential exists for cotton production in Suba
North, Homa Bay Town, Rangwe and Karachuonyo North Sub-Counties.
1.6.1. Land ownership Categories/ Classification
The mean land holding size in Homa Bay County stands at three acres and the land ownership
categories in Homa Bay County varies in different forms depending on the legal entities with full
mandate to own a given land. A considerable portion of land in this county is owned by the
county government while the rest of the available land is owned by the community as communal
land as well as private entities. We also have isolated land – private ownership e.g. freehold land;
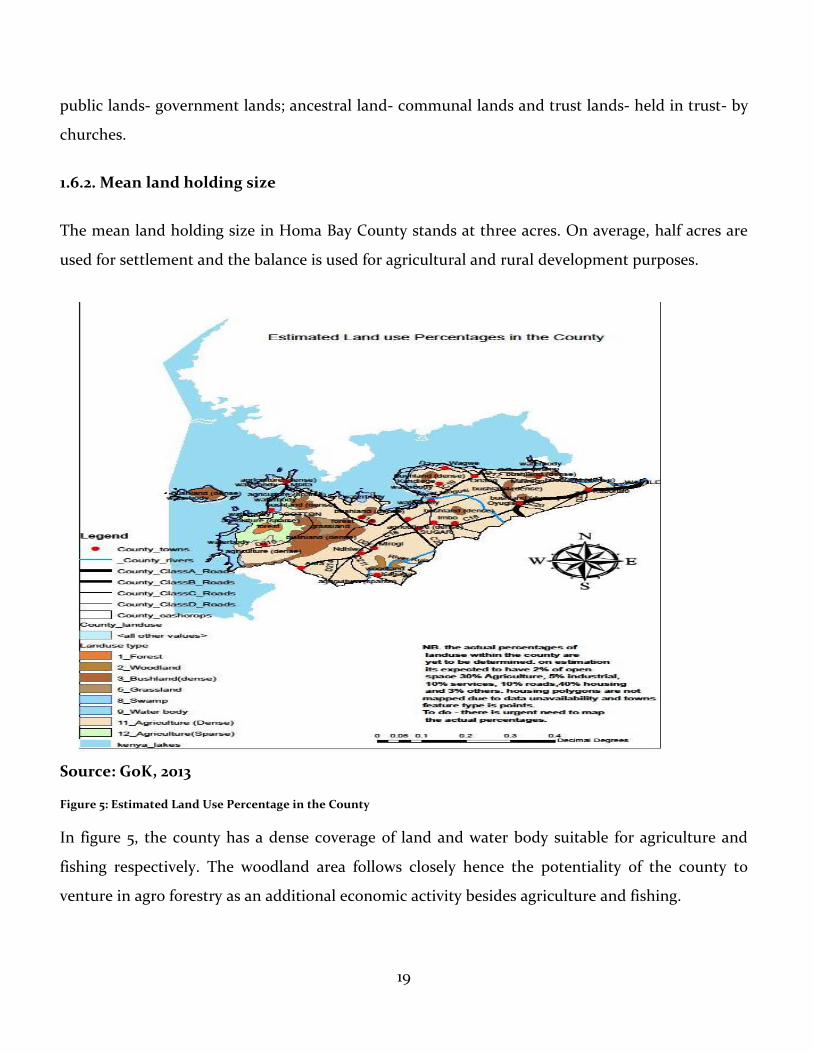
19
public lands- government lands; ancestral land- communal lands and trust lands- held in trust- by
churches.
1.6.2. Mean land holding size
The mean land holding size in Homa Bay County stands at three acres. On average, half acres are
used for settlement and the balance is used for agricultural and rural development purposes.
Source: GoK, 2013
Figure 5: Estimated Land Use Percentage in the County
In figure 5, the county has a dense coverage of land and water body suitable for agriculture and
fishing respectively. The woodland area follows closely hence the potentiality of the county to
venture in agro forestry as an additional economic activity besides agriculture and fishing.
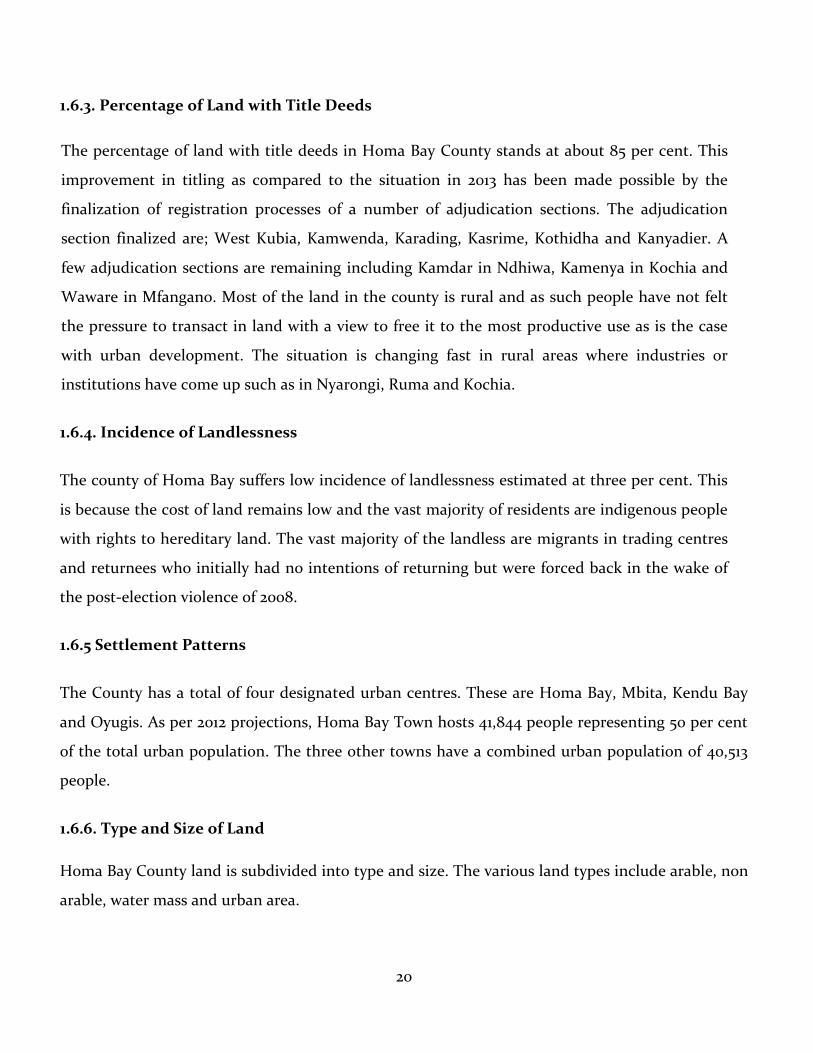
20
1.6.3. Percentage of Land with Title Deeds
The percentage of land with title deeds in Homa Bay County stands at about 85 per cent. This
improvement in titling as compared to the situation in 2013 has been made possible by the
finalization of registration processes of a number of adjudication sections. The adjudication
section finalized are; West Kubia, Kamwenda, Karading, Kasrime, Kothidha and Kanyadier. A
few adjudication sections are remaining including Kamdar in Ndhiwa, Kamenya in Kochia and
Waware in Mfangano. Most of the land in the county is rural and as such people have not felt
the pressure to transact in land with a view to free it to the most productive use as is the case
with urban development. The situation is changing fast in rural areas where industries or
institutions have come up such as in Nyarongi, Ruma and Kochia.
1.6.4. Incidence of Landlessness
The county of Homa Bay suffers low incidence of landlessness estimated at three per cent. This
is because the cost of land remains low and the vast majority of residents are indigenous people
with rights to hereditary land. The vast majority of the landless are migrants in trading centres
and returnees who initially had no intentions of returning but were forced back in the wake of
the post-election violence of 2008.
1.6.5 Settlement Patterns
The County has a total of four designated urban centres. These are Homa Bay, Mbita, Kendu Bay
and Oyugis. As per 2012 projections, Homa Bay Town hosts 41,844 people representing 50 per cent
of the total urban population. The three other towns have a combined urban population of 40,513
people.
1.6.6. Type and Size of Land
Homa Bay County land is subdivided into type and size. The various land types include arable, non
arable, water mass and urban area.
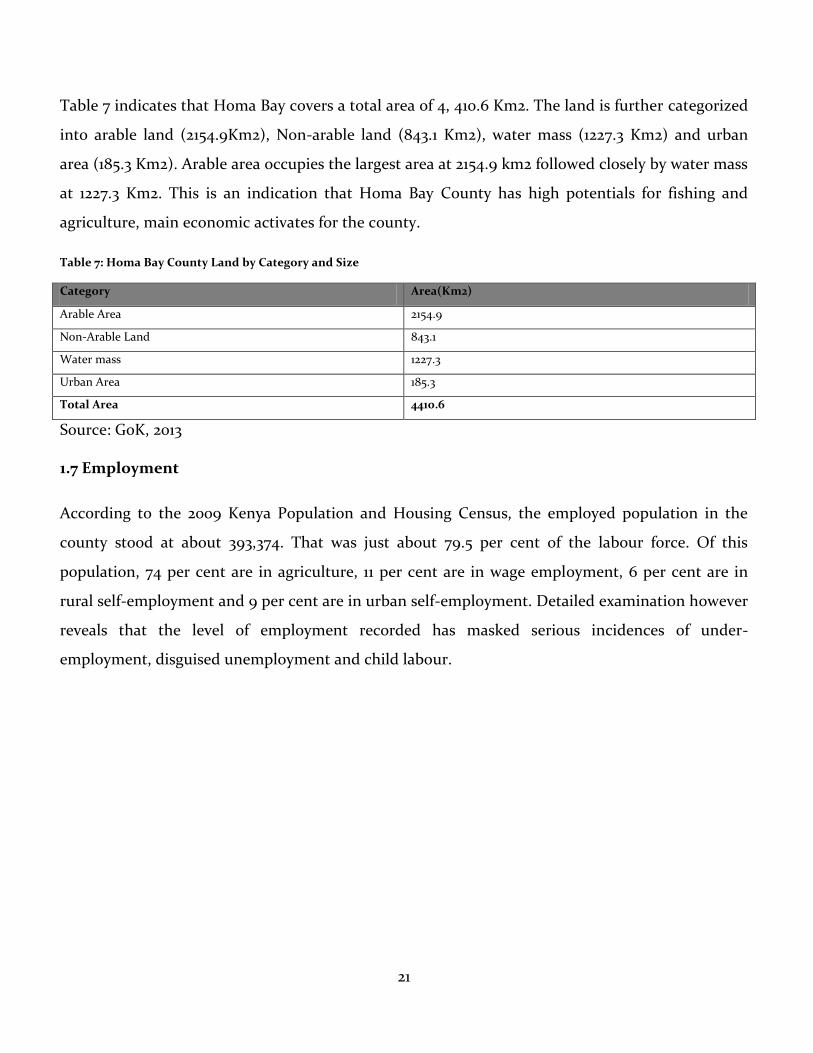
21
Table 7 indicates that Homa Bay covers a total area of 4, 410.6 Km2. The land is further categorized
into arable land (2154.9Km2), Non-arable land (843.1 Km2), water mass (1227.3 Km2) and urban
area (185.3 Km2). Arable area occupies the largest area at 2154.9 km2 followed closely by water mass
at 1227.3 Km2. This is an indication that Homa Bay County has high potentials for fishing and
agriculture, main economic activates for the county.
Table 7: Homa Bay County Land by Category and Size
Category Area(Km2)
Arable Area 2154.9
Non-Arable Land 843.1
Water mass 1227.3
Urban Area 185.3
Total Area 4410.6
Source: GoK, 2013
1.7 Employment
According to the 2009 Kenya Population and Housing Census, the employed population in the
county stood at about 393,374. That was just about 79.5 per cent of the labour force. Of this
population, 74 per cent are in agriculture, 11 per cent are in wage employment, 6 per cent are in
rural self-employment and 9 per cent are in urban self-employment. Detailed examination however
reveals that the level of employment recorded has masked serious incidences of under-
employment, disguised unemployment and child labour.
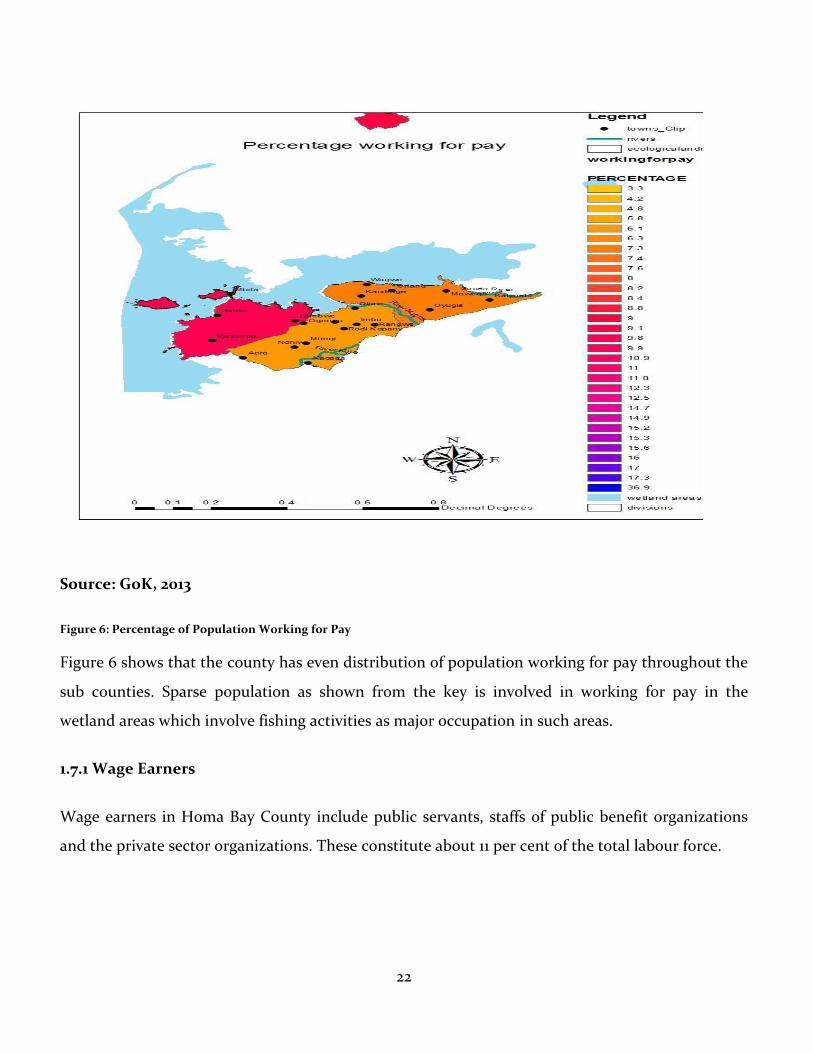
22
Source: GoK, 2013
Figure 6: Percentage of Population Working for Pay
Figure 6 shows that the county has even distribution of population working for pay throughout the
sub counties. Sparse population as shown from the key is involved in working for pay in the
wetland areas which involve fishing activities as major occupation in such areas.
1.7.1 Wage Earners
Wage earners in Homa Bay County include public servants, staffs of public benefit organizations
and the private sector organizations. These constitute about 11 per cent of the total labour force.
23
1.7.2 Self Employed
The rural self-employed in the county stand at around six per cent whereas the urban self-
employed stand at nine per cent. In total just about seven per cent of the total labour force are self-
employed. The majorities of these individuals are in retail trade, cottage industries and value-added
agriculture and excludes those in traditional subsistence agriculture.
1.7.3 Labour-Force by Sector
The county‘s labour force is projected to stand at 494,757 persons, comprising 48 per cent of the
total projected population by 2012. This category consists of persons between the ages of 15 and 64
who are now deemed fit enough to work. Of this population, those who are unemployed and are
actively seeking work are estimated to be 43,742 as at 2012. Persons numbering about 57,642 are
projected to be economically inactive and are therefore not likely to be actively seeking
employment.
1.7.4 Unemployment Levels
Without including that part of the labour force that is still engaged in some learning activity, it is
estimated that 73 per cent of the county‘s population are either unemployed or under employed as
at 2012. About 74 per cent of these underemployed are involved in some form of subsistence
agriculture or disguised unemployment. The hard core unemployed, however, stand at about 20.5
per cent. These are individuals who are seeking work but cannot find anything to do to sustain
themselves and their families.
1.8 Irrigation Infrastructure and Schemes
Only 13.3% of land with irrigation potential in the county is being exploited which sums up to
8,996 hectares of land. Of the land being used for crop farming, 104,467 hectares are dedicated to
food crop farming, 12,227 hectares for cash crops while 6,000 hectares are used for horticulture.
24
1.8.1 Irrigation potential
While the County’s potential for irrigated agriculture is 8,966 hectares (GoK, 2013) only 13.3% of
land is under irrigation, despite the County’s huge potential to irrigate as it borders the largest
freshwater lake in Africa, Lake Victoria. Irrigation is important to maintain a continuous
production. However, rainfall in Homa Bay is low and unreliable; the County receives an annual
rainfall ranging from 700 to 800 mm. Major horticultural crop grown under irrigation include
kales, tomatoes, onions, capsicum and watermelon.
1.8.2 Irrigation schemes
Homa Bay has two large irrigation schemes namely Kimira and Oluch irrigation schemes located in
Rachuonyo North and Homa Bay Town Sub-counties respectively. Both areas are classified as semi-
arid and at the time of the establishment of the irrigation schemes, farmers residing here faced
frequent crop failures resulting in food insecurity. There are also smaller irrigation schemes along
areas bordering Lake Victoria and along the inland water bodies.
1.9 Crop, Livestock, Fish Production and Value addition
This section gives the main crops produced in the County, acreage under food and cash crop, main
storage facility, livestock breeds and number of ranches available in the County.
1.9.1. Main Crops Produced
The main food crops produced in the county are maize, beans, green grams, sorghum, finger millet,
kales, cassava, sweet potatoes and cow peas. The vast majority (80%) of the farmers produce maize
and beans. This is because maize and beans are considered the staple food of the county. Cassava
and sweet potatoes are the main county’s insurance crops due to their resilience to adverse weather
conditions. The main cash crops produced in the county are Sugar cane (Ndhiwa), Sunflower
(Suba), Pineapples (Rangwe) and potatoes (Karachuonyo South and Karachuonyo East) and
groundnuts (Homa Bay town, Rangwe, Ndhiwa, Karachuonyo South and North). There exists huge
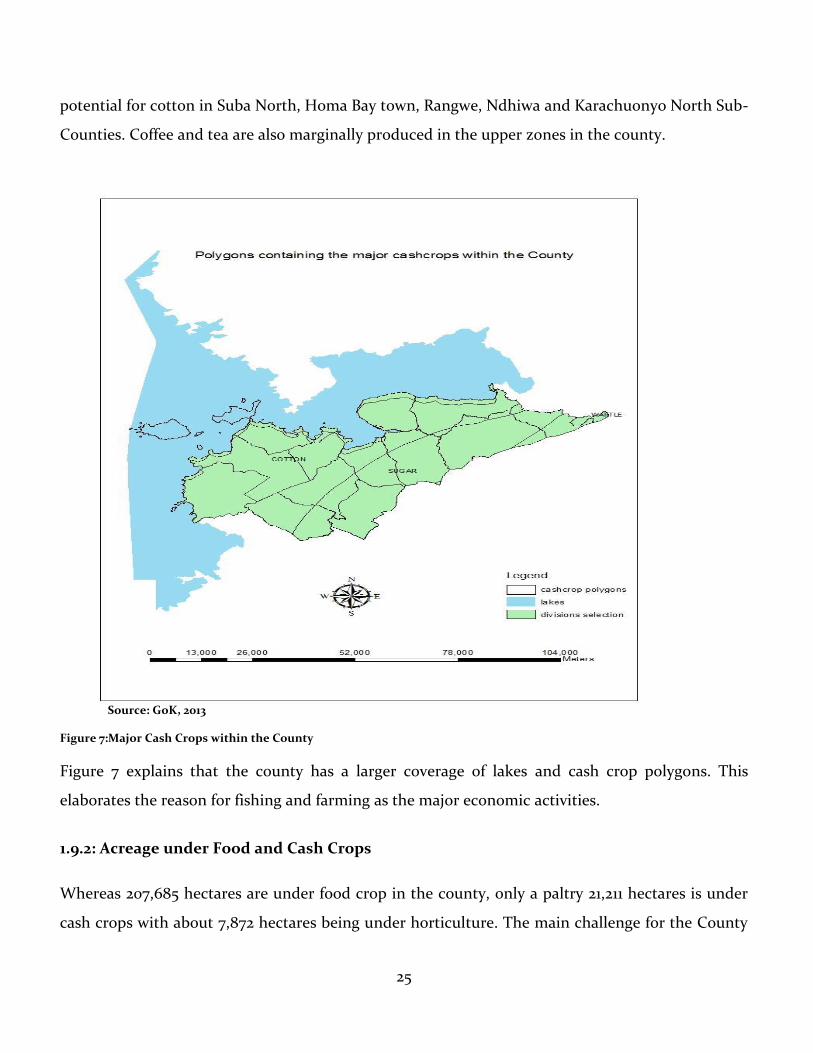
25
potential for cotton in Suba North, Homa Bay town, Rangwe, Ndhiwa and Karachuonyo North Sub-
Counties. Coffee and tea are also marginally produced in the upper zones in the county.
Source: GoK, 2013
Figure 7:Major Cash Crops within the County
Figure 7 explains that the county has a larger coverage of lakes and cash crop polygons. This
elaborates the reason for fishing and farming as the major economic activities.
1.9.2: Acreage under Food and Cash Crops
Whereas 207,685 hectares are under food crop in the county, only a paltry 21,211 hectares is under
cash crops with about 7,872 hectares being under horticulture. The main challenge for the County
26
government will be to increase yield per acre for crops especially those considered staple foods and
high value cash crops in the county.
1.9.3 Average Farm Sizes
The average farm size for small scale farmers is four acres while that of large scale farmers is 10
acres. The large-scale farmers are found mainly in less densely populated areas of Ndhiwa, Suba
and Mbita sub-counties where large stocks of livestock are kept. The main crops grown in large
scale farms are maize, sorghum, beans and agro-forests. Small holdings are prominent in densely
populated areas of Homa Bay Town, Rangwe, Kasipul and Kabondo Kasipul where the main crops
grown are maize, beans, pineapples, ground nuts and potatoes.
1.9.4. Main Storage Facilities
The main storage facilities in the county comprise cribs (75% and gunny bags (24%). Only a paltry
1% of the population appeared to use metal silos. The Catholic Diocese of Homa Bay assists farmers
to get metal silos of various capacities. Use of hermetic bags is gaining popularity with farmers
because they don’t require application of pesticide dust.
1.9.5 Agriculture Extension Training Research and Information Service
Agriculture extension service is provided majorly by the County Department of Livestock,
Fisheries, Agriculture and Food Security and to a small extent by the private sector. The county
gets research services from Kenya Agriculture and Livestock Research Organization (KALRO)
Opapo Sugar Research Station, ICIPE Mbita, Kenya Marine and Fisheries Research institute
(KEMFRI) based in Kisumu and Kenya Agriculture and Livestock Research Organization Kisii.
There has been an Agricultural Training Center that has since been converted into Tom Mboya
University College. Self Help Africa through an NGO called Rheal Solution has established cassava
multiplication sites in most of the sub counties. International Sweet Potato Center (CIP) has also
established sweet potato multiplication sites in Rangwe, Kasipul and Kabondo Kasipul sub
counties.
27
1.9.6. Main Livestock Breeds and Facilities
The main livestock breeds reared in Homa Bay county are: the east African zebu for meat, milk and
draught power, meat and dairy goats, indigenous poultry, indigenous sheep and to some lesser
extent dairy animals and few exotic poultry, donkeys, a few pigs, ducks and geese. Emerging
livestock including quails and ostrich keeping is yet to be introduced in the county and has great
potential. Livestock keeping is practiced in all parts of the County. Livestock production facilities
in the county include: livestock auction yards in major livestock markets of Nyangweso, Rodi,
Kipasi, Mbita, Sindo, Pala and Magunga, Oyugis, Ringa, Oriang and 2 slaughter houses one in
Homa Bay and the other in Oyugis.
1.9.7. Ranching
There exists no known form of ranching in Homa Bay County. Ranching is not viable in the county
due to the land subdivision into small unsustainable units. Ranching requires large tracks of land
which does not exist as single units in Homa Bay.
1.9.8 Main Fishing Activities
Two main commercial fish species in the County includes Nile perch (L. Niloticus) which accounts
for 37,000 Metric tons annually and dagaa (R. Argentae) accounting for 34,000 metric tons
annually. Production of Tilapia which is a local delicacy is still low and it is sourced through
capture fisheries and fish farming. The fisher folk in the County are organized into Beach
Management Units (BMUs) and the County has a total of 133 Beach Management Units (BMUs)
which are distributed in 141 fish landing sites where active fishing activities are undertaken. Homa
Bay County has a relatively long lake shore with less polluted inshore waters bordering Uganda.
The County produces approximately 50% of the total fish production in Kenya’s Lake Victoria.
1.9.9 Apiculture
Bee-keeping is practiced to a reasonable extent in Homa Bay County. A good percentage of farmers
practice modern bee-keeping for honey production in Mbita (Kombe) and Kwethumbe in Gwasii
28
and at Oyugis. The honey is semi refined at house hold level and marketed at farm gate (areas
where apiculture is practised and areas of potential).
1.10 Oil and other Mineral Resources
1.10.1 Mineral and Oil Potential
The geological structure of Homa Bay county favours the existence of minerals; Homa Bay has
similar geological characteristics as Migori County where exploration has taken place and minerals
such as gold, zinc among other minerals have been found. Investment will have to be made in
exploring for these precious metals. Some potential also exists around the hot springs near Homa
Hills where traces of precious minerals such as soda ash, iron ore and limestone have been noted.
There is a prospect for oil exploration in Kobala and Lambwe.
1.10.2 On-going Mining and Extraction activities
Currently, Homa Bay County has no known economic deposits of precious minerals save for iron
ore around the Homa Hills, Kendu Bay and Oyugis (God Nyango) and, limestone around Homa
Hills;; gold in Rangwe, Kendu Bay and Oyugis. Artisanal gold mining is going on in some sites and,
a Canadian company is prospecting for gold in those sites. Prospecting for Gold continues in areas
of Ndhiwa bordering Nyatike and so far one license has been given in respect.
Soda ash around the hot spring in Homa hills, niobium and phosphates in Homa hills, Ruri hills,
Ngodhe and Gwassi. Building stones, sand, clay soil and salt are also found in Karachuonyo,
Rangwe, Ndhiwa and Mbita. These are mined using artisanal methods but plans are underway to
streamline production and marketing of these materials. The two quarry sites in Sindo and
Karachuonyo – Kanyipir are a good source of revenue for the county. Sand harvesting is also
common along most rivers and a few beaches especially around Kochia and Sindo.
1.11 Tourism and Wildlife
Homa Bay County sits in a prominent position to be a lead destination in the Western Tourism
Circuit and is home to Ruma National Park which is the only park where unique and rare species
29
like the roan antelope can be found. The county also hosts events and sites of mythical interest like
the Tom Mboya Mausoleum, the Mfangano Rock Art, Oyugis Bird Sanctuary, Homa Hills Hot
Spring and SimbiNyaima. There are over 18 islands such as Rusinga and Mfangano, peninsulas and
bays some with unique fauna and flora and an impressive array of physical features with great
aesthetic value. There is need to improve these tourism sites to bring in revenue to the county. It
also boasts of breath-taking scenery and forested landscape leading to and around the Lake
Victoria coast line, especially within Mbita and Suba, such as is the case with the Sikri peninsula.
There are also opportunities for sports and cultural tourism especially as relates to the way of life of
the Luo and the Abasuba whose traditional boat racing and artifacts continue to attract a lot of
local and international tourists.
1.11.1 Main Tourist Attractions and Activities
Homa Bay County is home to tourist attractions of the lake region that has been categorized as
Nature and Wildlife, Culture, Heritage and Community-Based Tourism, Agro-tourism, Eco-tourism
etc. Some of the major tourism attraction sites include Ruma National Park and Homa Hills. The
county local residents are usually involved in cultural events that boost tourism.
1.11.2 Classified/Major Hotels
Homa Bay County has 91% and 9% of unclassified and classified hotels respectively. This is
according to the last National Hotel Classification exercise that was carried out in 2003.
1.11.3 Main Wildlife
The main wildlife found in the county of Homa Bay include Topi antelope, hyenas, Roan antelopes,
giraffes, buffaloes, hippopotamus, crocodiles and various species of snakes. Lately, zebra and
rhinoceros have been introduced to Ruma National Park.
1.11.4 Wildlife Conservation Areas
Ruma National Park is the main gazetted and protected wildlife conservation area managed by the
Kenya Wildlife Society. Other conservation areas that are not protected includes lakes shores, river
30
banks, hill tops and forests with inhabitants like hippopotamus, monkeys, leopards and antelopes.
These hill tops could serve as potential tourist attraction sites for the county.
1.11.5 Total Number of Tourists Visiting Attraction Sites Annually
According to KNBS 2015, Ruma National Park recorded 3,313 local tourists/residents and 444
nonresident tourists in the year 2014.
1.12 Industry and Trade
Trade and indstry is extensively done through the department of trade, industry, investment and
enterprise development in Homa Bay County. The trade and industrial processes in the county are
markets, industrial parks, major industries and varied businesses.
1.12.1 Markets
Homa Bay County currently has 103 active major markets generating revenue in the 8 sub counties.
Some of the markets and trading Centre’s lack vital services such as proper sheds, parking space,
public space, water and sanitation facilities, and proper solid waste management among others.
These markets generate a bigger portion of the local revenues thus there is need to develop them.
1.12.2 Industrial Parks
Homa Bay County has no industrial park. However, efforts have been made that have culminated
to the signing of MoU with EPZA on the same. 100Ha of land for industrial park and 10Ha for waste
management has been acquired for the same at Kakdhimu
1.12.3 Major Industries
Homa Bay County has a limited presence of industries being home only to two fish processing
industries in Homa Bay Town and Mbita Point, one sugar processing industry in Ndhiwa, an ice
plant in Mbita Point that processes and packages drinking water and, an integrated industry in
Kwethumbe (Suba) that processes forest products. The cotton processing ginnery in Homa Bay had
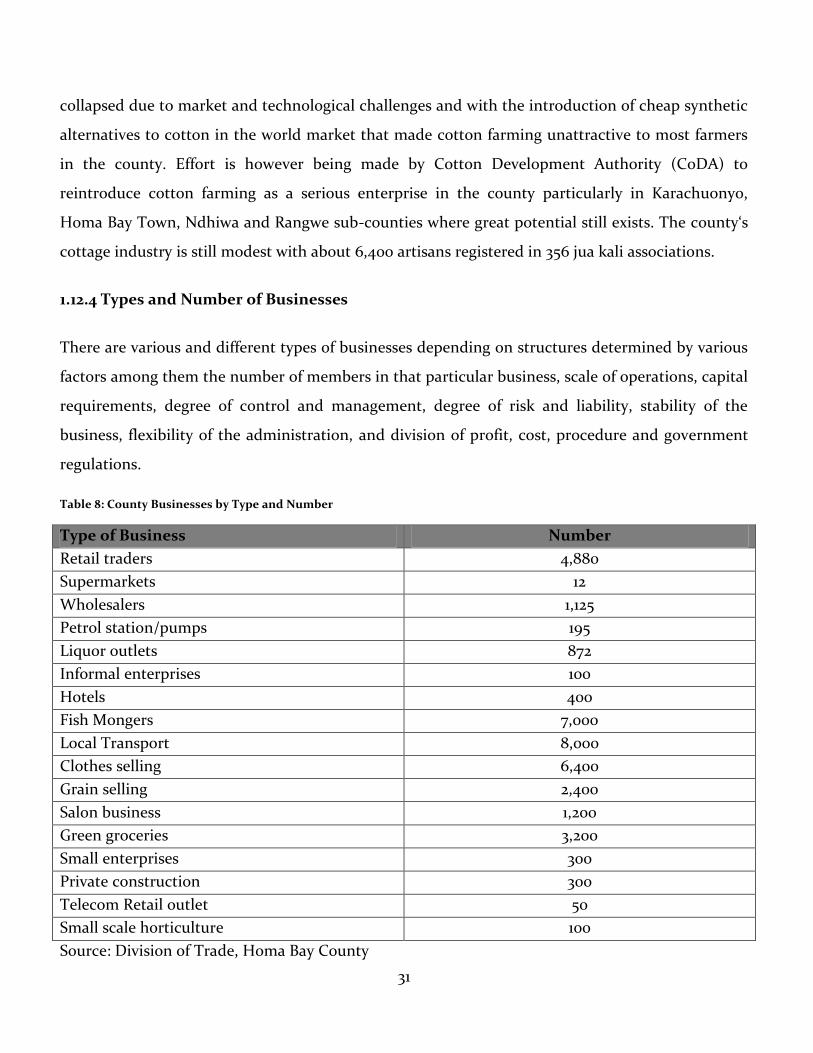
31
collapsed due to market and technological challenges and with the introduction of cheap synthetic
alternatives to cotton in the world market that made cotton farming unattractive to most farmers
in the county. Effort is however being made by Cotton Development Authority (CoDA) to
reintroduce cotton farming as a serious enterprise in the county particularly in Karachuonyo,
Homa Bay Town, Ndhiwa and Rangwe sub-counties where great potential still exists. The county‘s
cottage industry is still modest with about 6,400 artisans registered in 356 jua kali associations.
1.12.4 Types and Number of Businesses
There are various and different types of businesses depending on structures determined by various
factors among them the number of members in that particular business, scale of operations, capital
requirements, degree of control and management, degree of risk and liability, stability of the
business, flexibility of the administration, and division of profit, cost, procedure and government
regulations.
Table 8: County Businesses by Type and Number
Type of Business Number
Retail traders 4,880
Supermarkets 12
Wholesalers 1,125
Petrol station/pumps 195
Liquor outlets 872
Informal enterprises 100
Hotels 400
Fish Mongers 7,000
Local Transport 8,000
Clothes selling 6,400
Grain selling 2,400
Salon business 1,200
Green groceries 3,200
Small enterprises 300
Private construction 300
Telecom Retail outlet 50
Small scale horticulture 100
Source: Division of Trade, Homa Bay County
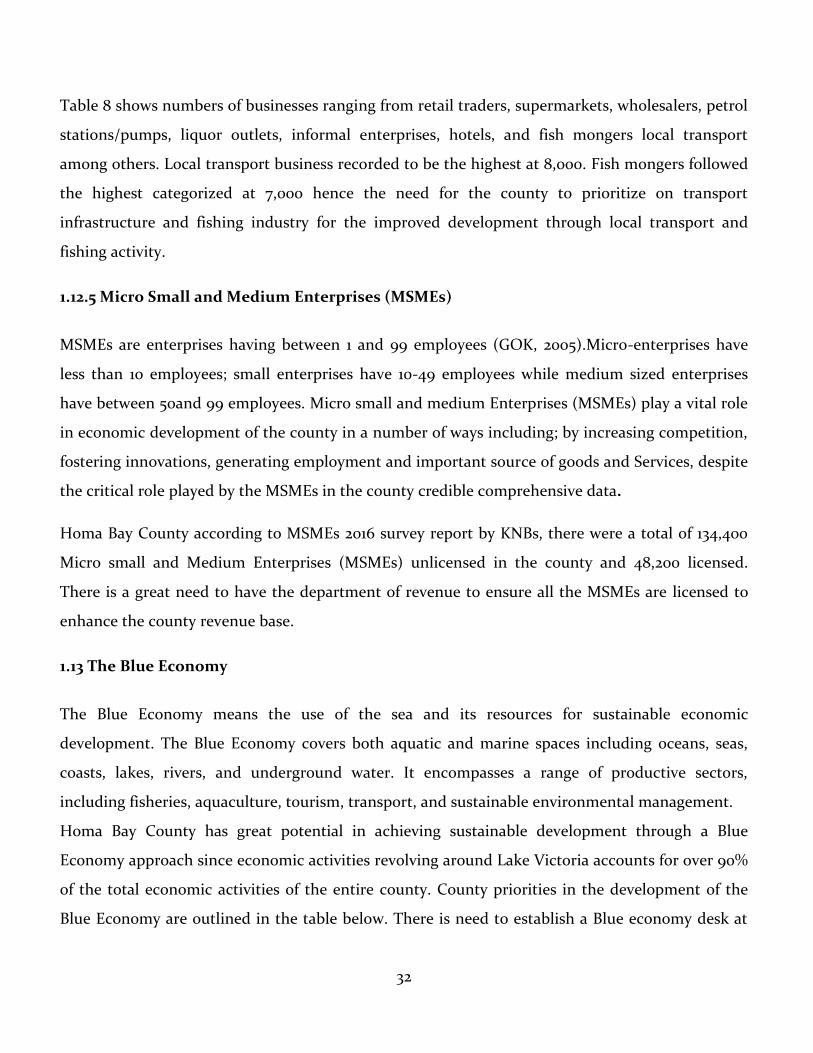
32
Table 8 shows numbers of businesses ranging from retail traders, supermarkets, wholesalers, petrol
stations/pumps, liquor outlets, informal enterprises, hotels, and fish mongers local transport
among others. Local transport business recorded to be the highest at 8,000. Fish mongers followed
the highest categorized at 7,000 hence the need for the county to prioritize on transport
infrastructure and fishing industry for the improved development through local transport and
fishing activity.
1.12.5 Micro Small and Medium Enterprises (MSMEs)
MSMEs are enterprises having between 1 and 99 employees (GOK, 2005).Micro-enterprises have
less than 10 employees; small enterprises have 10-49 employees while medium sized enterprises
have between 50and 99 employees. Micro small and medium Enterprises (MSMEs) play a vital role
in economic development of the county in a number of ways including; by increasing competition,
fostering innovations, generating employment and important source of goods and Services, despite
the critical role played by the MSMEs in the county credible comprehensive data.
Homa Bay County according to MSMEs 2016 survey report by KNBs, there were a total of 134,400
Micro small and Medium Enterprises (MSMEs) unlicensed in the county and 48,200 licensed.
There is a great need to have the department of revenue to ensure all the MSMEs are licensed to
enhance the county revenue base.
1.13 The Blue Economy
The Blue Economy means the use of the sea and its resources for sustainable economic
development. The Blue Economy covers both aquatic and marine spaces including oceans, seas,
coasts, lakes, rivers, and underground water. It encompasses a range of productive sectors,
including fisheries, aquaculture, tourism, transport, and sustainable environmental management.
Homa Bay County has great potential in achieving sustainable development through a Blue
Economy approach since economic activities revolving around Lake Victoria accounts for over 90%
of the total economic activities of the entire county. County priorities in the development of the
Blue Economy are outlined in the table below. There is need to establish a Blue economy desk at
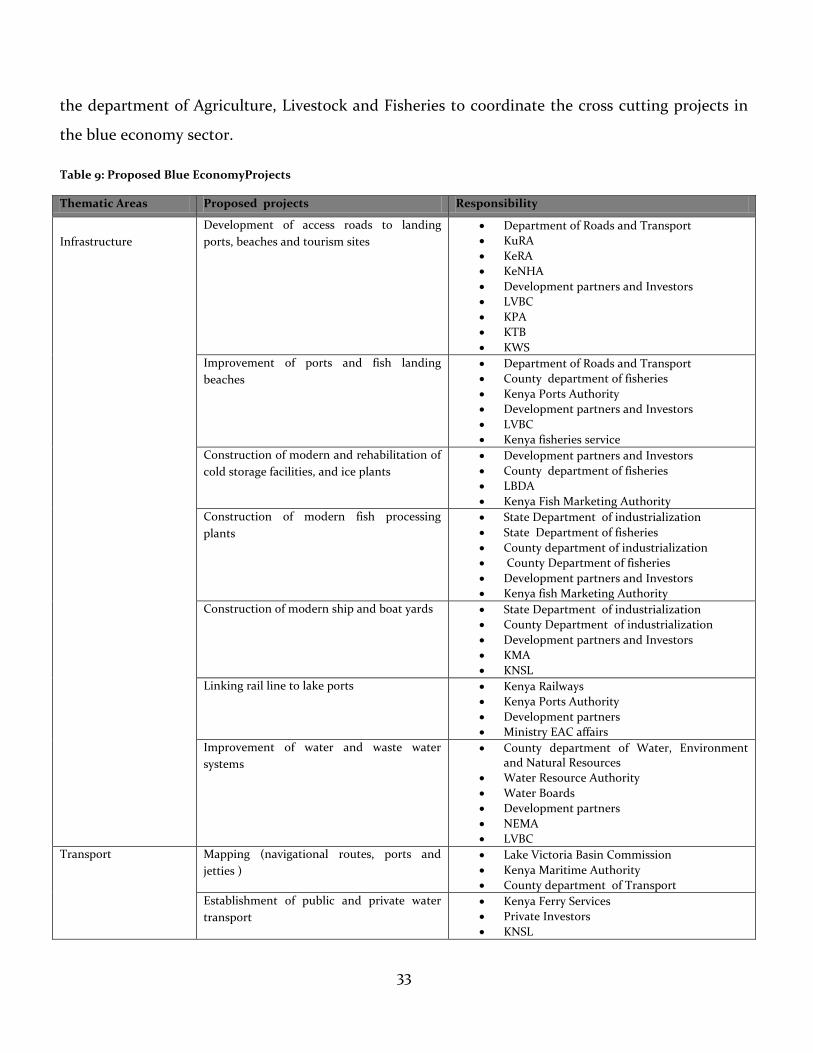
33
the department of Agriculture, Livestock and Fisheries to coordinate the cross cutting projects in
the blue economy sector.
Table 9: Proposed Blue EconomyProjects
Thematic Areas Proposed projects Responsibility
Infrastructure
Development of access roads to landing
ports, beaches and tourism sites
Department of Roads and Transport
KuRA
KeRA
KeNHA
Development partners and Investors
LVBC
KPA
KTB
KWS
Improvement of ports and fish landing
beaches
Department of Roads and Transport
County department of fisheries
Kenya Ports Authority
Development partners and Investors
LVBC
Kenya fisheries service
Construction of modern and rehabilitation of
cold storage facilities, and ice plants
Development partners and Investors
County department of fisheries
LBDA
Kenya Fish Marketing Authority
Construction of modern fish processing
plants
State Department of industrialization
State Department of fisheries
County department of industrialization
County Department of fisheries
Development partners and Investors
Kenya fish Marketing Authority
Construction of modern ship and boat yards State Department of industrialization
County Department of industrialization
Development partners and Investors
KMA
KNSL
Linking rail line to lake ports
Kenya Railways
Kenya Ports Authority
Development partners
Ministry EAC affairs
Improvement of water and waste water
systems
County department of Water, Environment and Natural Resources
Water Resource Authority
Water Boards
Development partners
NEMA
LVBC
Transport Mapping (navigational routes, ports and
jetties )
Lake Victoria Basin Commission
Kenya Maritime Authority
County department of Transport
Establishment of public and private water
transport
Kenya Ferry Services
Private Investors
KNSL
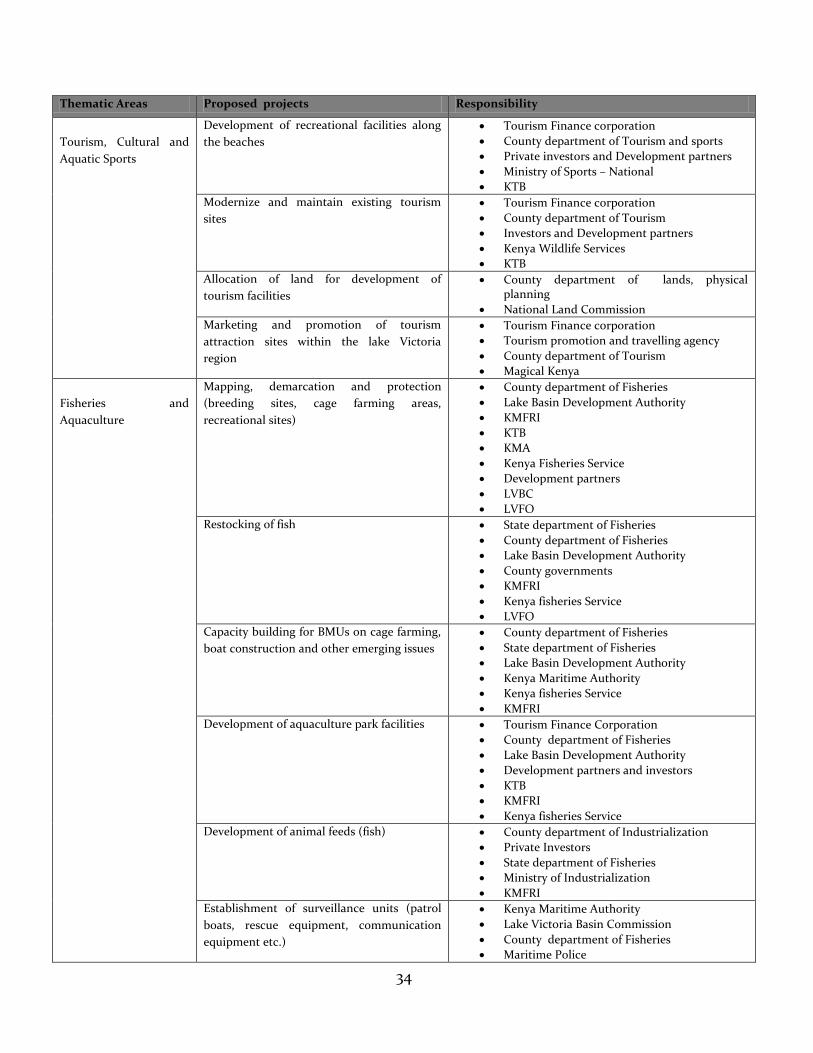
34
Thematic Areas Proposed projects Responsibility
Tourism, Cultural and
Aquatic Sports
Development of recreational facilities along
the beaches
Tourism Finance corporation
County department of Tourism and sports
Private investors and Development partners
Ministry of Sports – National
KTB
Modernize and maintain existing tourism
sites
Tourism Finance corporation
County department of Tourism
Investors and Development partners
Kenya Wildlife Services
KTB
Allocation of land for development of
tourism facilities
County department of lands, physical planning
National Land Commission
Marketing and promotion of tourism
attraction sites within the lake Victoria
region
Tourism Finance corporation
Tourism promotion and travelling agency
County department of Tourism
Magical Kenya
Fisheries and
Aquaculture
Mapping, demarcation and protection
(breeding sites, cage farming areas,
recreational sites)
County department of Fisheries
Lake Basin Development Authority
KMFRI
KTB
KMA
Kenya Fisheries Service
Development partners
LVBC
LVFO
Restocking of fish State department of Fisheries
County department of Fisheries
Lake Basin Development Authority
County governments
KMFRI
Kenya fisheries Service
LVFO
Capacity building for BMUs on cage farming,
boat construction and other emerging issues
County department of Fisheries
State department of Fisheries
Lake Basin Development Authority
Kenya Maritime Authority
Kenya fisheries Service
KMFRI
Development of aquaculture park facilities Tourism Finance Corporation
County department of Fisheries
Lake Basin Development Authority
Development partners and investors
KTB
KMFRI
Kenya fisheries Service
Development of animal feeds (fish) County department of Industrialization
Private Investors
State department of Fisheries
Ministry of Industrialization
KMFRI
Establishment of surveillance units (patrol
boats, rescue equipment, communication
equipment etc.)
Kenya Maritime Authority
Lake Victoria Basin Commission
County department of Fisheries
Maritime Police
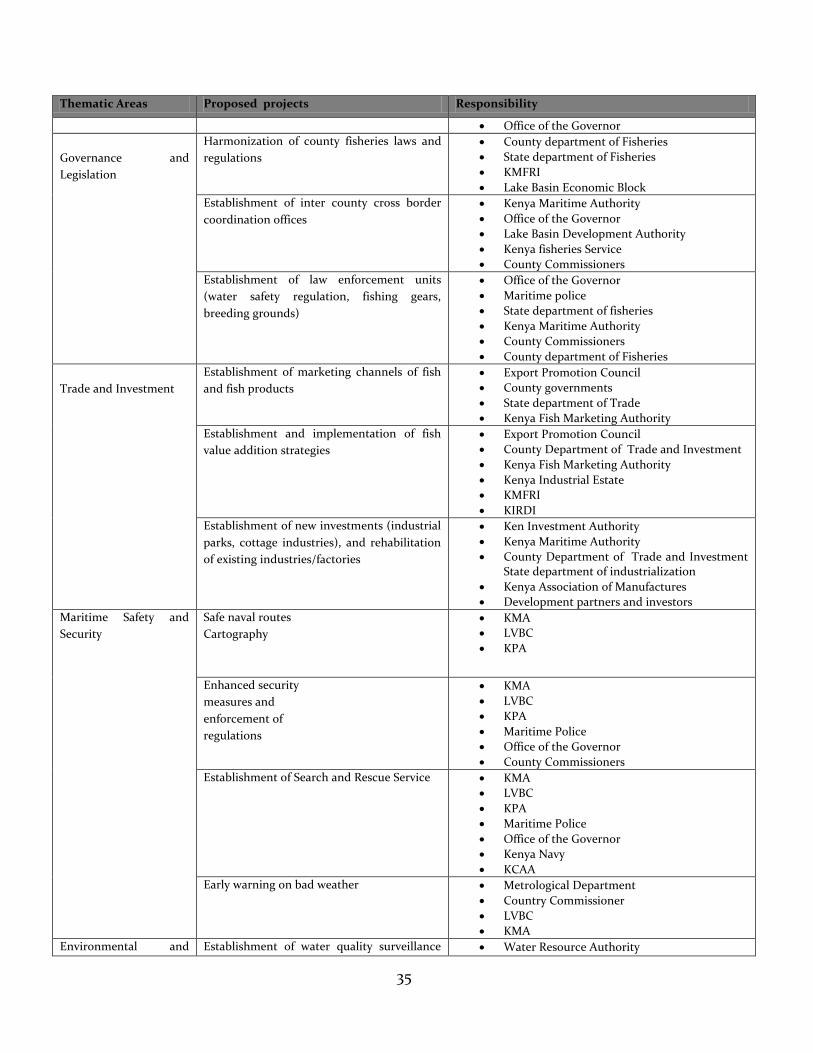
35
Thematic Areas Proposed projects Responsibility
Office of the Governor
Governance and
Legislation
Harmonization of county fisheries laws and
regulations
County department of Fisheries
State department of Fisheries
KMFRI
Lake Basin Economic Block
Establishment of inter county cross border
coordination offices
Kenya Maritime Authority
Office of the Governor
Lake Basin Development Authority
Kenya fisheries Service
County Commissioners
Establishment of law enforcement units
(water safety regulation, fishing gears,
breeding grounds)
Office of the Governor
Maritime police
State department of fisheries
Kenya Maritime Authority
County Commissioners
County department of Fisheries
Trade and Investment
Establishment of marketing channels of fish
and fish products
Export Promotion Council
County governments
State department of Trade
Kenya Fish Marketing Authority
Establishment and implementation of fish
value addition strategies
Export Promotion Council
County Department of Trade and Investment
Kenya Fish Marketing Authority
Kenya Industrial Estate
KMFRI
KIRDI
Establishment of new investments (industrial
parks, cottage industries), and rehabilitation
of existing industries/factories
Ken Investment Authority
Kenya Maritime Authority
County Department of Trade and Investment State department of industrialization
Kenya Association of Manufactures
Development partners and investors
Maritime Safety and
Security
Safe naval routes
Cartography
KMA
LVBC
KPA
Enhanced security
measures and
enforcement of
regulations
KMA
LVBC
KPA
Maritime Police
Office of the Governor
County Commissioners
Establishment of Search and Rescue Service KMA
LVBC
KPA
Maritime Police
Office of the Governor
Kenya Navy
KCAA
Early warning on bad weather Metrological Department
Country Commissioner
LVBC
KMA
Environmental and Establishment of water quality surveillance Water Resource Authority
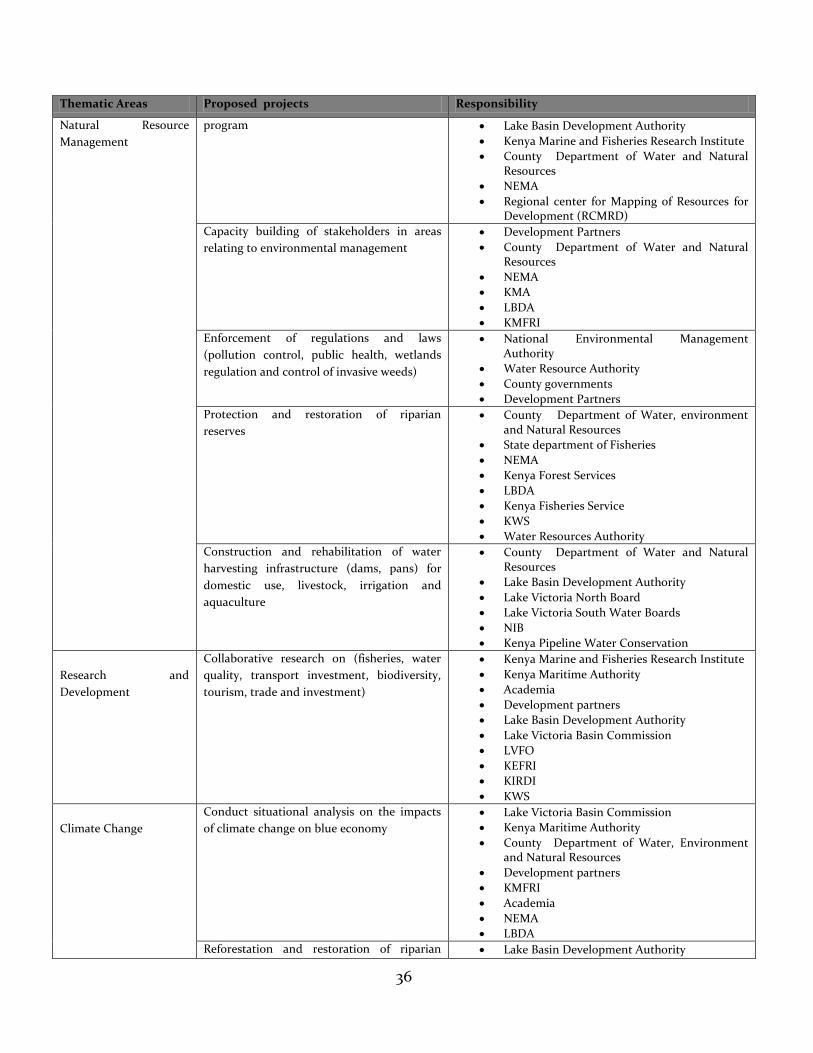
36
Thematic Areas Proposed projects Responsibility
Natural Resource
Management
program Lake Basin Development Authority
Kenya Marine and Fisheries Research Institute
County Department of Water and Natural Resources
NEMA
Regional center for Mapping of Resources for Development (RCMRD)
Capacity building of stakeholders in areas
relating to environmental management
Development Partners
County Department of Water and Natural Resources
NEMA
KMA
LBDA
KMFRI
Enforcement of regulations and laws
(pollution control, public health, wetlands
regulation and control of invasive weeds)
National Environmental Management Authority
Water Resource Authority
County governments
Development Partners
Protection and restoration of riparian
reserves
County Department of Water, environment and Natural Resources
State department of Fisheries
NEMA
Kenya Forest Services
LBDA
Kenya Fisheries Service
KWS
Water Resources Authority
Construction and rehabilitation of water
harvesting infrastructure (dams, pans) for
domestic use, livestock, irrigation and
aquaculture
County Department of Water and Natural Resources
Lake Basin Development Authority
Lake Victoria North Board
Lake Victoria South Water Boards
NIB
Kenya Pipeline Water Conservation
Research and
Development
Collaborative research on (fisheries, water
quality, transport investment, biodiversity,
tourism, trade and investment)
Kenya Marine and Fisheries Research Institute
Kenya Maritime Authority
Academia
Development partners
Lake Basin Development Authority
Lake Victoria Basin Commission
LVFO
KEFRI
KIRDI
KWS
Climate Change
Conduct situational analysis on the impacts
of climate change on blue economy
Lake Victoria Basin Commission
Kenya Maritime Authority
County Department of Water, Environment and Natural Resources
Development partners
KMFRI
Academia
NEMA
LBDA
Reforestation and restoration of riparian Lake Basin Development Authority
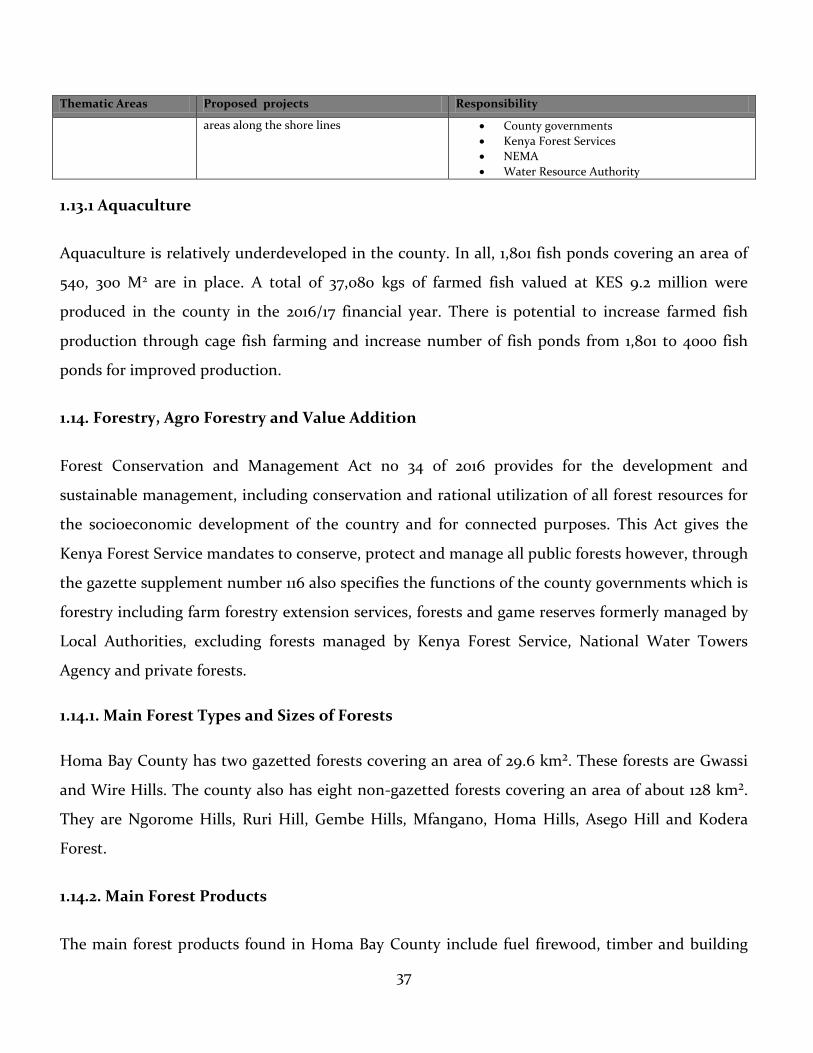
37
Thematic Areas Proposed projects Responsibility
areas along the shore lines County governments
Kenya Forest Services
NEMA
Water Resource Authority
1.13.1 Aquaculture
Aquaculture is relatively underdeveloped in the county. In all, 1,801 fish ponds covering an area of
540, 300 M2 are in place. A total of 37,080 kgs of farmed fish valued at KES 9.2 million were
produced in the county in the 2016/17 financial year. There is potential to increase farmed fish
production through cage fish farming and increase number of fish ponds from 1,801 to 4000 fish
ponds for improved production.
1.14. Forestry, Agro Forestry and Value Addition
Forest Conservation and Management Act no 34 of 2016 provides for the development and
sustainable management, including conservation and rational utilization of all forest resources for
the socioeconomic development of the country and for connected purposes. This Act gives the
Kenya Forest Service mandates to conserve, protect and manage all public forests however, through
the gazette supplement number 116 also specifies the functions of the county governments which is
forestry including farm forestry extension services, forests and game reserves formerly managed by
Local Authorities, excluding forests managed by Kenya Forest Service, National Water Towers
Agency and private forests.
1.14.1. Main Forest Types and Sizes of Forests
Homa Bay County has two gazetted forests covering an area of 29.6 km². These forests are Gwassi
and Wire Hills. The county also has eight non-gazetted forests covering an area of about 128 km².
They are Ngorome Hills, Ruri Hill, Gembe Hills, Mfangano, Homa Hills, Asego Hill and Kodera
Forest.
1.14.2. Main Forest Products
The main forest products found in Homa Bay County include fuel firewood, timber and building
38
poles. Presently, commercial timber conversion is being undertaken in Kwethumbe by Green
Forest Social Investment using modern and efficient technology to produce charcoal and other
related products.
1.14.3. Agro Forestry
This is a land use management system in which tree shrubs are grown around or among crops or
pastureland. It combines shrubs and trees in agricultural and forestry technologies to create more
diverse, productive, profitable, healthy, ecologically sound, and sustainable land-use system. Trees
are an essential part of diversified farm production, providing both subsistence products and
incomes while contributing to soil fertility, watershed protection, microclimate, carbon
sequestration and soil and water conservation. Products such as fuel wood or fodder from trees,
shrubs or grass contribute significantly to the economies of the households.
Agro forestry serves diverse purposes in the county including: (i) generation of income
throughfarm forest, that is,it had been noted that there is a direct proportionality between the
benefits for farmers and adoption of forestry enterprises; (ii) protection of water catchment areas
through the collaboration of the Zonal Forestry Management offices in Homa Bay County and the
Ministry of Environment and non-state partners on rehabilitation and conservation of designated
forestry areas.
Alternative livelihood activities and conservation measures are being explored with a view to
protect wetlands and water catchment areas; (iii) Prevention of Soil Erosion through the
collaboration of Kenya Forest Services (KFS) and other departments as Agriculture, Culture and
Sports, Water and Environment ostensibly creating awareness for farmers to embrace modern
farming techniques to guarantee maximum return per unit area, farmers sensitized to practice
sustainable farming, planting of selected tree species like Gravellea Robusta, avocado and other
fruit trees promote soil compactness and fertility and NEMA putting in place various policies to
control soil erosion; and among others the improvement of soil fertility using fertilizer trees
through collaboration of Kenya Forest Society with the civil society organizations and the
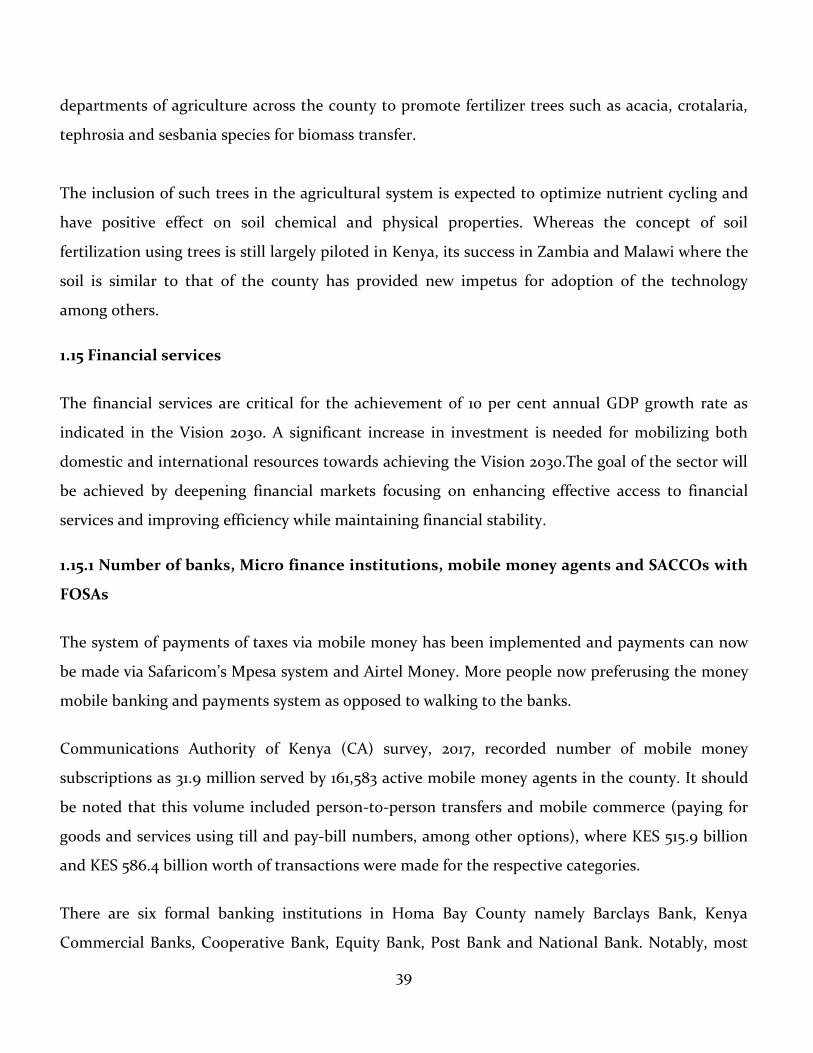
39
departments of agriculture across the county to promote fertilizer trees such as acacia, crotalaria,
tephrosia and sesbania species for biomass transfer.
The inclusion of such trees in the agricultural system is expected to optimize nutrient cycling and
have positive effect on soil chemical and physical properties. Whereas the concept of soil
fertilization using trees is still largely piloted in Kenya, its success in Zambia and Malawi where the
soil is similar to that of the county has provided new impetus for adoption of the technology
among others.
1.15 Financial services
The financial services are critical for the achievement of 10 per cent annual GDP growth rate as
indicated in the Vision 2030. A significant increase in investment is needed for mobilizing both
domestic and international resources towards achieving the Vision 2030.The goal of the sector will
be achieved by deepening financial markets focusing on enhancing effective access to financial
services and improving efficiency while maintaining financial stability.
1.15.1 Number of banks, Micro finance institutions, mobile money agents and SACCOs with
FOSAs
The system of payments of taxes via mobile money has been implemented and payments can now
be made via Safaricom’s Mpesa system and Airtel Money. More people now preferusing the money
mobile banking and payments system as opposed to walking to the banks.
Communications Authority of Kenya (CA) survey, 2017, recorded number of mobile money
subscriptions as 31.9 million served by 161,583 active mobile money agents in the county. It should
be noted that this volume included person-to-person transfers and mobile commerce (paying for
goods and services using till and pay-bill numbers, among other options), where KES 515.9 billion
and KES 586.4 billion worth of transactions were made for the respective categories.
There are six formal banking institutions in Homa Bay County namely Barclays Bank, Kenya
Commercial Banks, Cooperative Bank, Equity Bank, Post Bank and National Bank. Notably, most
40
co-operatives are SACCO’s providing their members with convenient and secure means for saving
money and obtaining credit at affordable interest rates.
1.15.2 Distribution /Coverage of Financial Services by Sub County
Homa Bay Town is well served by major banks. Other trading centres are largely served by 8
Microfinance Institutions, Community Financial Services Associations, 139 SACCOS, 25 village
table banking, about 40 banking agents established presently, MPESA, and mobile money.
Table 10: Financial Institutions by Type and Sub County
Sub County Type of Financial Institutions
Banks SACCOs Insurance Microfinance Total
Kasipul 4 30 6 1 41
Karachuonyo 0 40 0 1 41
HomaBay 6 24 8 4 42
Ndhiwa 1 6 1 1 9
Mbita 4 1 0 1 6
Suba 0 8 0 0 8
Rangwe 0 15 0 0 15
KabondoKasipul 0 15 0 0 15
Total 15 139 15 8 177
Source: Division of Trade, Homa Bay County
Table 10 indicates that there are No. 177 financial institutions all over the county. Homa Bay Town
recorded the greatest No. 42 of financial institutions then Kasipul and Karachuonyo at 41. SACCO's
are far much many all over the county (139), almost three quarters of all the financial institutions.
Microfinance institutions record the least No. 8, Suba, Rangwe and Kabondo Kasipul lacking most
of the financial institutions. This therefore calls for capacity building and sensitization programmes
in these sub counties on the importance of having membership in registered financial institutions.
1.16. Environment and Climate Change
Conserving natural resources is a basic requirement for ensuring local populations is not vulnerable
to climate change risks and impacts. It is also important for improving the quality of life for
41
communities. Therefore, changing how essential resources are managed and how energy needs are
met is a priority for the County of Homa Bay. Urgent action must be taken to halt global warming
and reduce climate change risks while encouraging sustainable development.
1.16.1. Major Degraded Areas/Hotspots and Major Contributions to Environmental
Degradation
The Lake Victoria Basin continues to face major ecological challenges that have caused
considerable hardship for the population depending on it for their livelihoods and have also
reduced the biodiversity of the lake’s flora and fauna. According to ICRAF (2000), more than 80%
of the population in the basin is engaged in agricultural production. Deforestation coupled with
bad agricultural practices has persistently exacerbated the problem of land degradation in the basin
and sedimentation in the lake. As a result, land degradation in prime agricultural areas within the
catchments has been attributed to food productivity losses. By fusing geospatial techniques and
empirical soil erosion modeling techniques mainly the Revised Universal Soil Loss Equation
(RUSLE) Model that looked at five key soil erosion control parameters: vegetation cover, rainfall
erosivity, slope factor, soil erodibility and population density, the major land degradation hot spots
were defined by the very high class as well as overall spatial variability of land degradation
severities in the basin’s context. The finding from analysis of results revealed that majority of the
basin is experiencing moderate soil erosion but this is shifting towards high. Major erosion
hotspots in Homa Bay County were found to be Kendu Bay and the south-western parts of Homa
Bay including areas around Nyandiwa and Sindo.
The study revealed that the lead contributing factor to soil erosion in the basin and around the
identified hotspots was soil erodibility component followed by rainfall erosivity, vegetation
cover management, population density and finally the slope factor. High rainfall intensity and
depth in the hotspots areas was also a major factor to soil erosion. The other contributing
factors were found to be unsustainable agricultural practice in the basin which continually
disturbed vegetation cover exposing the top soils to erosion agents. In all, deforestation is the
main contributor to the environmental degradation, resulting to reduction in vegetation cover
that has left the land bare and vulnerable to soil erosion, low rainfall and flash floods.
42
The loss of vegetation has been mainly accredited to human activities such as bush clearing for
farming and settlement activities, firewood and charcoal production. Alternative cause of
environmental degradation has been poor disposal of solid waste materials such as plastics, nylon
papers, packaging tins, food remains and fecal matter. These have collaborated to increase
prevalence of water borne diseases, disease vectors such as mosquitoes, and clogging of natural
water ways and drainage facilities. Lake Victoria being the main source of water in the county has
suffered severe pollution as a result of environmental degradation what with flash floods and
domestic uses which have led to huge deposits of pollutants in the Lake.
1.16.2. Environmental Threats
Environmental degradation has resulted to major threats such as loss of productivity of land
leading to poor crop yields and food insecurity, emergence of diseases such as cholera
outbreaks, and flooding. It has also steered to increased indisposition as of pollution of both air
and water bases. The prevalence of poverty has increased with the loss of biological stability and
threats from floods, drought and pollution.
1.16.3. Major Environmental Threats
According to Global Risk Reports of 2018, inappropriate human activities coupled with natural
processes, climate change and change in rainfall patterns will continue to pose risks and aggravate
environmental challenges facing humans. Climate change will increase the frequency and intensity
of natural events like droughts, wildfires, heat waves and rainstorms in Homa Bay. This could
disrupt food production and cause famines. Biodiversity loss due to species extinction is also
considered a risk not just for the environment but also the global economy. In fact, intensive
agriculture, unsustainable fishing, wildlife poaching, habitat degradation and destruction, acid
rain, and climate change will continue to threaten thousands of species. Equally, air, water, and
land pollution have been identified as prominent risks and this has been an unwelcome byproduct
of industrial development and poor management of waste.
According to World Wide Fund, water scarcity is one of the major environmental threats. In Homa
Bay, the shortage is largely the result of prolonged drought and rising temperatures combined with
43
increasing populations. Lake Victoria is polluted and many rivers are drying up and this impacts
not just people but also vegetation and wildlife. A growing world population will also be an obvious
threat to the environment as consumers place more demands on the earth's natural resources as
more land, which is finite, is required to produce renewable resources from farming, grazing,
fishing, and forests goods.
Clearing of forests will often lead to loss not just of biomass and plant species, but also of habitats
of animals, as forests are home to 80% of animals. Deforestation is also a driver of climate change
as trees that normally absorb carbon dioxide are no longer there. When a region loses its
biodiversity, it becomes more vulnerable to other environmental elements. Continued
deforestation will ultimately disrupt the natural balance of ecological systems in Homa Bay
wherever trees are harvested as even food production is impacted due to drought and erosion is
directly linked to the loss of forests.
Soil degradation is also considered an environmental threat in Homa Bay. It results due to soil
erosion, soil compaction and application of agricultural chemicals. Erosion of soil can happen due
to wind or water, when the protective cover of forests and other vegetation is removed, and the top
soil is lost. Soil compaction occurs due to over-grazing and destruction of the soil structure due to
heavy tillage that is a characteristic part of industrial agriculture.
When soil degradation happens, soil loses its fertility and porosity, when the topsoil rich in
minerals necessary to nourish plants, trees, and crops for their growth and survival, is lost and soils
become compacted. Again, soils are also less capable of supporting the beneficial micro-flora
necessary for mineral cycling. Even compaction and loss of soil decreases the ability of the land to
absorb and hold rainfall, which can cause soil drought and a decrease in recharge of groundwater
reservoirs and rivers, affecting the hydrology of an area. Equally, the soil removed is deposited as
sediments downstream, excessive quantities of which can be polluting and harmful to fish and
other aquatic life.
44
1.16.4 High Spatial and Temporal Variability of Rain
Climate models have predicted that the addition of heat-trapping gases in the atmosphere will shift
precipitation in two main ways. The shift will be in strengthening of existing precipitation and
evaporation patterns. This means wet areas will get more wet and dry areas will get drier. The
shifting weather patterns will make water supply increasingly unpredictable with long-season crops
suffering short seasons of the rain and short-season crops suffering from long rain seasons.
Ultimately, poor spatial distribution of the rain could result in drying of small dams and water
pans, high siltation of the water pans and small dams and greater food insecurity if the County’s
bread baskets are affected.
1.16.5 Change in Water Levels
Different climate models for the Great Lakes region predict that lake levels will decline over the
next century. Many of those models however predict increases in precipitation around Lake
Victoria. While precipitation trends are unclear, evaporation rather than precipitation is the
primary driver of lake level change, as warmer air and water temperatures and a shorter duration of
ice cover favor increased rates of evaporation. However, a recent study done by the North Carolina
State University’s Department of Marine, Earth and Atmosphere Sciences in the US now reveals
that East Africa is on the verge of facing a climate shift. Lake Victoria is expected to replenish its
waters at an almost unprecedented rate, which will result in its rise. This may result in destruction
of property.
Climate change projections indicate that the County of Homa Bay should expect an increase in
rainfall along Lake Victoria. There is this dichotomy that the current decrease in rainfall is going to
stop and an increase will be experienced. The expected rise in water levels have important
implications for economic development especially in climate sensitive sectors including power
generation, road network general construction and businesses along the Lake.
1.16.6 Solid Waste Management Facilities
Waste management remains a major concern in Homa Bay County what with emerging need for
sustainable development in the Lake Victoria basin. Most of the solid wastes in the county remain
45
uncollected. Resultant effects include spread of infectious diseases, blocked sewers, litter in the
streets and pollution of Lake Victoria through crude dumping of waste. With both direct and
indirect linkages to economic development, waste materials represent wasted money, in terms of
the original cost of the materials, the disposal and in its potential value as a recyclable and reusable
resource.
However, going forward, the County Government is focused on improving solid waste management
through an integrated approach that includes recycling and composting programmes; storage
facilities; collection Systems; transportation of waste from collection points to designated disposal
points; responsible waste disposal; proper handling of special/hazardous waste; environmental
educational awareness; capacity building of stakeholders; Public Private Partnerships (PPP); new
legislative framework; resource mobilization and enhanced organizational set –up. Each of the 8
sub-county headquarters and all the other major urban centers such as Sindo, RodiKopany, Kosele
and Pala will have designated disposal points. Waste management in the four county towns of
Homa Bay, Mbita, Oyugis and Kendu Bay has been contracted out with great effect on service
delivery.
1.16.7 Managing Climate Change Risk and Impact
As part of tackling climate change, the County is focused on adaptation planning to reduce
vulnerabilities to risk and impacts. First, the county is promoting the use of raw materials from
sustainable sources including using production techniques that that use renewable energy. Second,
the county is encouraging transition to organic/conservation agriculture, protection of food prom
loss/waste and diets shifts to foods produced using green technology. Third, the county is
encouraging use of recycled and biodegradable materials including using water purified from waste
water. Fourth, the county is focused on ensuring energy efficiency in public transportation, public
services and domestic use through education, training and awareness creation; creation of energy
efficiency centers (hubs) and funding of demonstration projects. Fifth, the county is intent on
promoting non-motorized transport modes such as cycling and walking including through
programs such bike shares and development of pedestrian streets. Sixth, the county is intent on
developing green building guides and applying the same to public buildings. Seventh, the county
46
will invest massively in the planting of trees and development of green infrastructure including
urban parks/gardens, green ways/belts and forests.
Effort will be doubled to protect water sources and resources. Water resource management will be
integrated to address all aspects including access, safety, harvesting, storage, distribution and waste
treatment. Land use will be integrated in planning for water systems and communities will be
engaged in land use planning. Priority budgets will be generated and innovative financing
approaches created to encourage conservation and discourage environmental degradation.
1.17 Water and Sanitation
Save for Lake Victoria and other known natural sources such as rivers and springs, the county of
HomaBay has several water facilities spread over 211 sub-locations. These facilities include
boreholes, water pans and water wells/springs. Whereas development partners such as World
Vision have made great sides in development and rehabilitation of water facilities, many areas
still remain water-deficient particularly in Karachuonyo, Rangwe, Suba South and Homa Bay
Town.
In each of the four county towns, rehabilitation of both the old and new intakes is on-going,
and new pumps are being installed, resulting in a doubling of urban water production.
Immediate works to reduce leaks and rehabilitate the treatment works at the reservoirs will
help to reduce unaccounted-for-water from 65% to the present level of 41%. Additional works
will include the laying of many kilometers of PVC pipeline, installation of 100 tipping bins and
10 waste transfer stations, construction of 80 VIP latrines in selected schools and public areas
and a number of water kiosks in low income settlements.
1.17.1 Water Resources
The major water resources in Homa Bay County includes rivers AwachKibwon, AwachTende,
Maugo, Kuja, Rangwe, Riana, Sondu-Miriu and Lake Victoria. Other sources include 71 shallow
wells, 43 protected springs, 78 unprotected springs, 383 water pans, 119 boreholes and rainwater
catchment in 8,553 households.
47
1.17.2 Water Supply Schemes
The only known water supply schemes that are operational with frequent breakdowns are those in
major urban centres such as Homa Bay, Mbita, Kendu Bay and Oyugis. Whereas some investments
have been made to deliver water to the other urban centres, the schemes have not been
successfully completed. Areas with gravitational capacities are also being explored for investment
such as in Suba, Rachuonyo South and Rachuonyo East.
1.17.3 Water Sources and Access
The average distance to the nearest water point stands at five km. This means majority of the
residents have to lose more than 30 minutes to reach water points and queue for the service.
1.17.4 Water and Sanitation Management
Homa Bay County recognizes that sustainable management of water resources and access to safe
water and sanitation are essential for unlocking its economic growth and productivity as well as
providing significant leverage for existing investments in health and education. It also recognizes
that managing the natural environment e.g. forests, soils and wetlands influence water availability
and water quality. This means strengthening the resilience of watersheds and complementing
investments in physical infrastructure and institutional and regulatory arrangements for water
access, use and disaster preparedness.
More than 80 per cent of polluted wastewater resulting from human activities ends up in rivers or
Lake Victoria. Floods still account for many deaths and up to a fifth of the population still live in
river basins where the use of water exceeds minimum recharge levels. Today, in many urban
centres, ground water is being used at a faster rate than can be replenished. As part of measures to
improve management of water and sanitation facilities, water associations have been formed and
Homa Bay Water and Sanitation Company have been mandated to manage water supplies in the
County. However, many areas of the county are characterised by low levels of access to water and
sanitation, especially the urban slums and in rural areas. Majority of urban areas are also
characterized by poor service quality in the form of intermittent water supply.
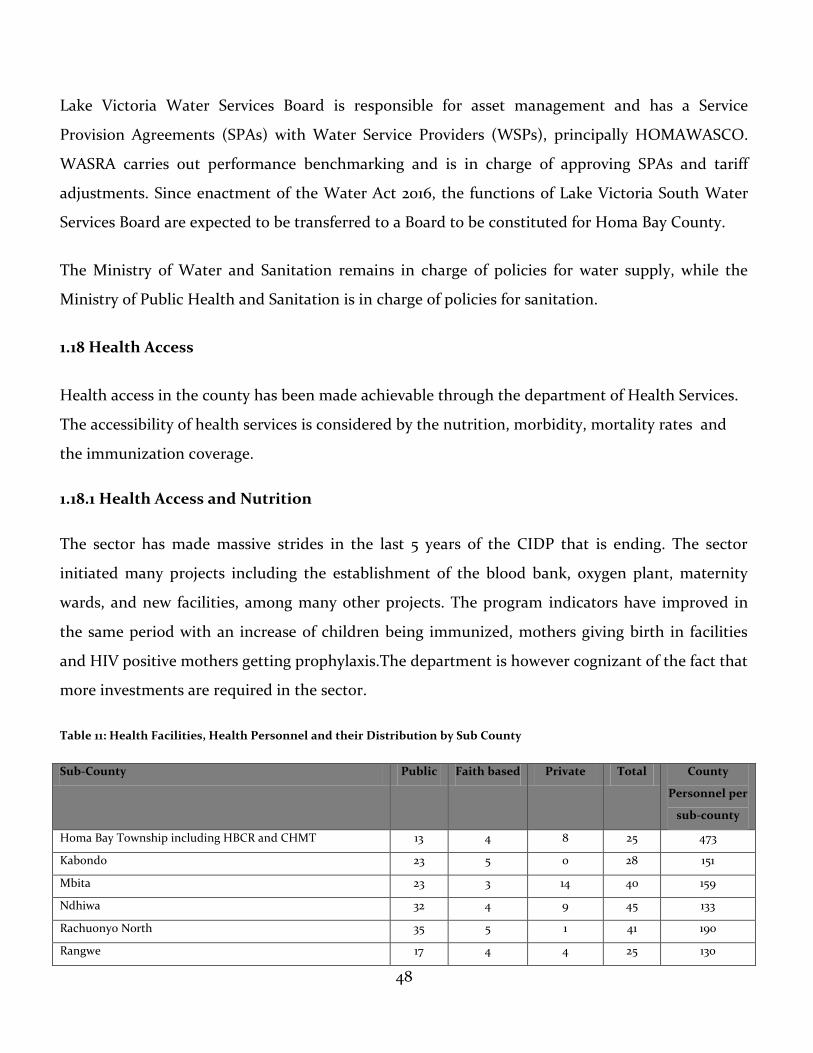
48
Lake Victoria Water Services Board is responsible for asset management and has a Service
Provision Agreements (SPAs) with Water Service Providers (WSPs), principally HOMAWASCO.
WASRA carries out performance benchmarking and is in charge of approving SPAs and tariff
adjustments. Since enactment of the Water Act 2016, the functions of Lake Victoria South Water
Services Board are expected to be transferred to a Board to be constituted for Homa Bay County.
The Ministry of Water and Sanitation remains in charge of policies for water supply, while the
Ministry of Public Health and Sanitation is in charge of policies for sanitation.
1.18 Health Access
Health access in the county has been made achievable through the department of Health Services.
The accessibility of health services is considered by the nutrition, morbidity, mortality rates and
the immunization coverage.
1.18.1 Health Access and Nutrition
The sector has made massive strides in the last 5 years of the CIDP that is ending. The sector
initiated many projects including the establishment of the blood bank, oxygen plant, maternity
wards, and new facilities, among many other projects. The program indicators have improved in
the same period with an increase of children being immunized, mothers giving birth in facilities
and HIV positive mothers getting prophylaxis.The department is however cognizant of the fact that
more investments are required in the sector.
Table 11: Health Facilities, Health Personnel and their Distribution by Sub County
Sub-County Public Faith based Private Total County
Personnel per
sub-county
Homa Bay Township including HBCR and CHMT 13 4 8 25 473
Kabondo 23 5 0 28 151
Mbita 23 3 14 40 159
Ndhiwa 32 4 9 45 133
Rachuonyo North 35 5 1 41 190
Rangwe 17 4 4 25 130
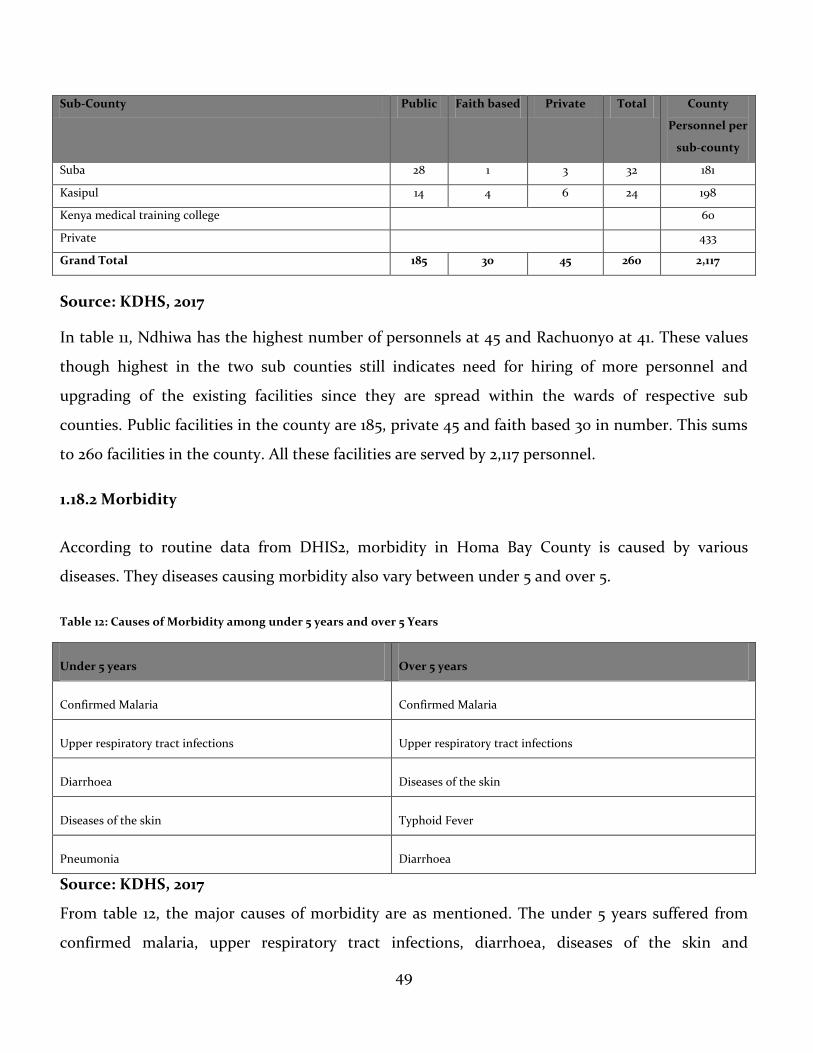
49
Sub-County Public Faith based Private Total County
Personnel per
sub-county
Suba 28 1 3 32 181
Kasipul 14 4 6 24 198
Kenya medical training college 60
Private 433
Grand Total 185 30 45 260 2,117
Source: KDHS, 2017
In table 11, Ndhiwa has the highest number of personnels at 45 and Rachuonyo at 41. These values
though highest in the two sub counties still indicates need for hiring of more personnel and
upgrading of the existing facilities since they are spread within the wards of respective sub
counties. Public facilities in the county are 185, private 45 and faith based 30 in number. This sums
to 260 facilities in the county. All these facilities are served by 2,117 personnel.
1.18.2 Morbidity
According to routine data from DHIS2, morbidity in Homa Bay County is caused by various
diseases. They diseases causing morbidity also vary between under 5 and over 5.
Table 12: Causes of Morbidity among under 5 years and over 5 Years
Under 5 years Over 5 years
Confirmed Malaria Confirmed Malaria
Upper respiratory tract infections Upper respiratory tract infections
Diarrhoea Diseases of the skin
Diseases of the skin Typhoid Fever
Pneumonia Diarrhoea
Source: KDHS, 2017
From table 12, the major causes of morbidity are as mentioned. The under 5 years suffered from
confirmed malaria, upper respiratory tract infections, diarrhoea, diseases of the skin and
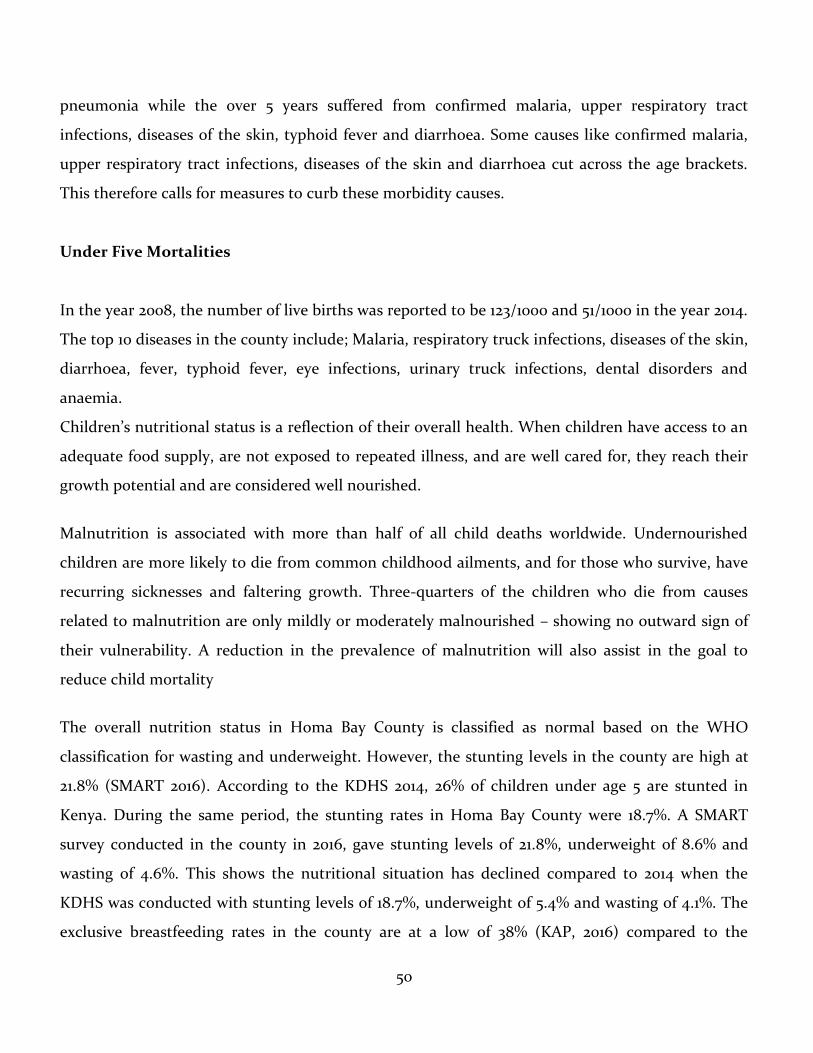
50
pneumonia while the over 5 years suffered from confirmed malaria, upper respiratory tract
infections, diseases of the skin, typhoid fever and diarrhoea. Some causes like confirmed malaria,
upper respiratory tract infections, diseases of the skin and diarrhoea cut across the age brackets.
This therefore calls for measures to curb these morbidity causes.
Under Five Mortalities
In the year 2008, the number of live births was reported to be 123/1000 and 51/1000 in the year 2014.
The top 10 diseases in the county include; Malaria, respiratory truck infections, diseases of the skin,
diarrhoea, fever, typhoid fever, eye infections, urinary truck infections, dental disorders and
anaemia.
Children’s nutritional status is a reflection of their overall health. When children have access to an
adequate food supply, are not exposed to repeated illness, and are well cared for, they reach their
growth potential and are considered well nourished.
Malnutrition is associated with more than half of all child deaths worldwide. Undernourished
children are more likely to die from common childhood ailments, and for those who survive, have
recurring sicknesses and faltering growth. Three-quarters of the children who die from causes
related to malnutrition are only mildly or moderately malnourished – showing no outward sign of
their vulnerability. A reduction in the prevalence of malnutrition will also assist in the goal to
reduce child mortality
The overall nutrition status in Homa Bay County is classified as normal based on the WHO
classification for wasting and underweight. However, the stunting levels in the county are high at
21.8% (SMART 2016). According to the KDHS 2014, 26% of children under age 5 are stunted in
Kenya. During the same period, the stunting rates in Homa Bay County were 18.7%. A SMART
survey conducted in the county in 2016, gave stunting levels of 21.8%, underweight of 8.6% and
wasting of 4.6%. This shows the nutritional situation has declined compared to 2014 when the
KDHS was conducted with stunting levels of 18.7%, underweight of 5.4% and wasting of 4.1%. The
exclusive breastfeeding rates in the county are at a low of 38% (KAP, 2016) compared to the
51
national average of 61% (KDHS, 2014). In the KDHS 2014 county rates for breastfeeding were not
provided hence it is not possible to tell the trend on this indicator. Early initiation of breastfeeding
among newborns was reported to be at 67% according to the KAP Survey conducted in 2016. This is
below the national target of 90%. Some of the reasons cited for the low rates are presence of TBAs,
belief that women have to clean themselves first before initiation of breastfeeding and some myths
and misconceptions among community members.
Vitamin A Supplementation and De-worming coverage are low and below the national targets of
80% with only 43.8% of children 12 to 59 months supplemented with vitamin A and 7.1% dewormed
(SMART, 2016). There are efforts to improve on these indicators and so far, integration of nutrition
services in the ECDEcenters is ongoing to ensure that all ECDE children are reached with these two
services on a regular basis.
The minimum dietary diversity was quite low in the county with an estimate of 32.6% (KAP, 2016).
The most frequently consumed food group in Homa County was grains, roots and tubers (78.9%)
followed by the consumption of vitamin A rich fruits and vegetables, which was recorded as 45.2%
at the county level. On the flip side, consumption of eggs, legumes and nuts was found to be quite
low at 11.4% and 23.0% respectively. The consumption of eggs was quite low, and this was
attributed to a “myth” that if a child eats eggs, then, there is likelihood that the child will become
“dumb” or will be “stammering” once the child starts talking. The other barriers towards optimal
meal diversification were inaccessibility and non-availability of various food items in the markets
such as beans, and when available they tend to be quite expensive.
Tackling of malnutrition requires a multi-Sectoral approach hence the need to team up with other
line departments in the county to effectively tackle the burden. The county has established a
nutrition multi-sector forum that comprises of key line departments of Agriculture, Water,
Education and Social protection. However, the forum is at its initial stages and needs strengthening
in the next CIDP 2018-2022 implementation phase. Currently a platform has been established
between the health department and education department to enhance service delivery in ECDE
centers. This will ensure consistent engagement of the two departments ensuring that all ECDE
children are reached regularly with nutrition interventions. Despite the many interventions put in
52
place gaps still exist in the nutrition sector that include acute staff shortage, inadequate
equipment, inconsistent commodities supply and inadequate funding for nutrition work.
1.18.3 Immunization Coverage
The performance of Fully Immunized Children (FIC) in 2014/15 from routine DHIS2 data is
consistent with the KDHS 2014 findings, which put the performance of the county at 64.4%.There
is need to improve on the immunization coverage to enhance child health expectancy and
eliminate polio in the county.
1.18.4 Maternal Health Care
Maternal mortality rate is a key indicator of a health status of a population. Moreover, levels and
trends in overall adult mortality have important implications for health and social programs
especially with regard to the population impact of HIV epidemic, other infectious diseases and
non-communicable diseases. Over the period of the last CIDP the County together with the
partners has made significant investment in the health care system including building new facilities
and maternity wards. According to a UNFPA(2014) report on Counties with highest burden of
maternal mortality, Homa Bay has a mortality rate of 583 per 100,000 live births, which is higher
than the national average of 362 per 100,000 live births.
Currently the county has 8 comprehensive emergency obstetric and neo-natal care (CEMONC) and
25 basic emergency obstetric and neo-natal care (BEMONC) facilities to respond to obstetric and
neo-natal emergencies. According to DHIS2017, the skilled care delivery was at 53% from 61% in
2016 due to continuous industrial action of the Health care workers
1.18.5 Access to Family Planning Services/Contraceptive Prevalence
According to KDHS 2014, the contraceptive prevalence rate is 46.7%, which is less than the national
average of 58%. Further, routine data from the DHIS2 data estimates that 50.3% of women of
reproductive age are receiving family planning by September 2017.
53
1.18.6 HIV/Aids Prevalence Rates and Related Services
HIV prevalence in Homa Bay is nearly 4.5 times higher than the national prevalence at 26.0%
(Kenya HIV Estimates 2015). The HIV prevalence among women in the County is higher (27.8%)
than that of men (24.0%), indicating that women are more vulnerable to HIV infection than men in
the County (HIV County Profiles 2016). The county therefore should provide more sensitization or
awareness programmesto prevant the prevalence that affects the productive population especially
the youths.
1.19 Education, Skills, Literacy and Infrastructure
Literacy is the ability to read for knowledge, write coherently and think critically about the written
word. It involves, at all levels, the ability to use and communicate in a diverse range of
technologies. Education on the other hand is the activity involved in the acquisition of knowledge
and skills both formally or informally hence makingit very critical for economic development. This
section gives information on facilities and enrolment, teacher to pupil/student ratios, transition
rates, completion rates and retention rates for both pre-school education, primary education and
secondary education.
1.19.1 Pre- School Education /Early Childhood Development Education
Attendance to pre-school education in an organized learning or child education program is
important for the readiness of children to school. It is well recognized that a period of rapid brain
development occursin the first 3-4 years of life, and the quality of home care is a major determinant
of the child’s developmentduring this period. In this context, adult activities with children,
presence of books at home, for the child,and the conditions of care are important indicators of
quality of child care. A World Fit for Children goalis that “children should be physically healthy,
mentally alert, emotionally secure, socially competent andready to learn”.
Activities that support early learning and development included the involvement of adultswith
children in the following activities like reading books, looking at picture books, telling stories,
singingsongs, taking children outside the home, compound or yard, playing with children, and
spending timewith children naming, counting, or drawing things.
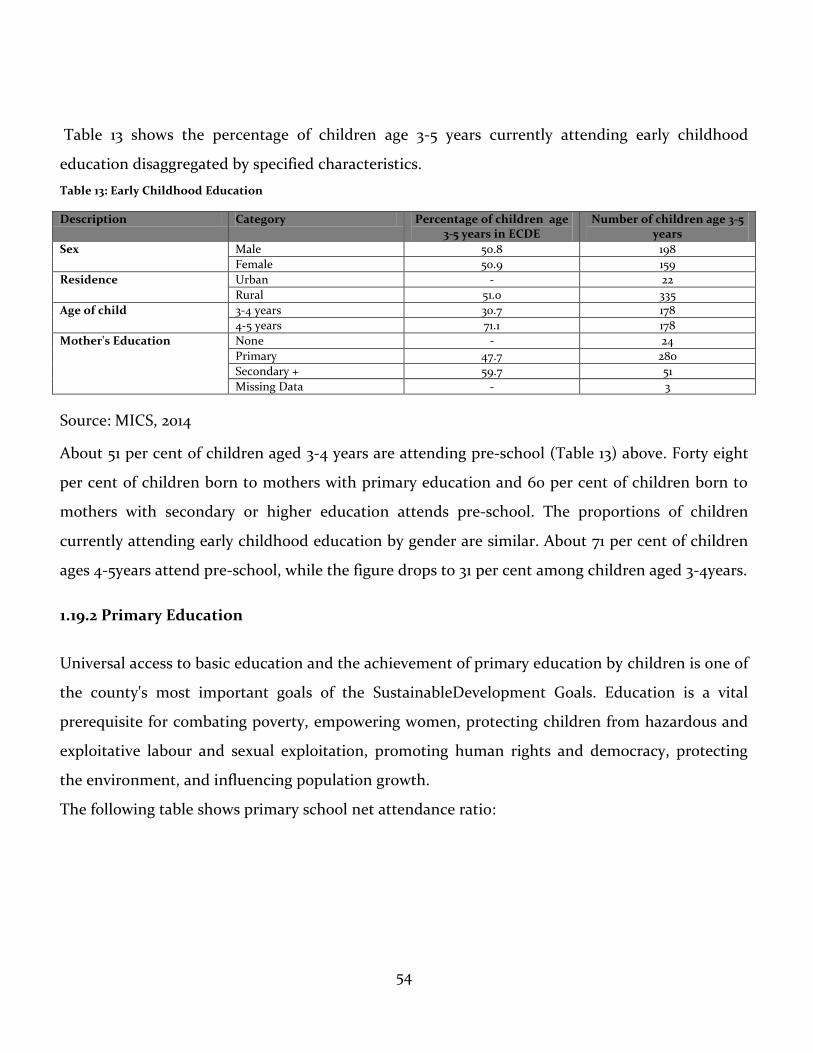
54
Table 13 shows the percentage of children age 3-5 years currently attending early childhood
education disaggregated by specified characteristics.
Table 13: Early Childhood Education
Description Category Percentage of children age 3-5 years in ECDE
Number of children age 3-5 years
Sex Male 50.8 198
Female 50.9 159
Residence Urban - 22
Rural 51.0 335
Age of child 3-4 years 30.7 178
4-5 years 71.1 178
Mother's Education None - 24
Primary 47.7 280
Secondary + 59.7 51
Missing Data - 3
Source: MICS, 2014
About 51 per cent of children aged 3-4 years are attending pre-school (Table 13) above. Forty eight
per cent of children born to mothers with primary education and 60 per cent of children born to
mothers with secondary or higher education attends pre-school. The proportions of children
currently attending early childhood education by gender are similar. About 71 per cent of children
ages 4-5years attend pre-school, while the figure drops to 31 per cent among children aged 3-4years.
1.19.2 Primary Education
Universal access to basic education and the achievement of primary education by children is one of
the county's most important goals of the SustainableDevelopment Goals. Education is a vital
prerequisite for combating poverty, empowering women, protecting children from hazardous and
exploitative labour and sexual exploitation, promoting human rights and democracy, protecting
the environment, and influencing population growth.
The following table shows primary school net attendance ratio:
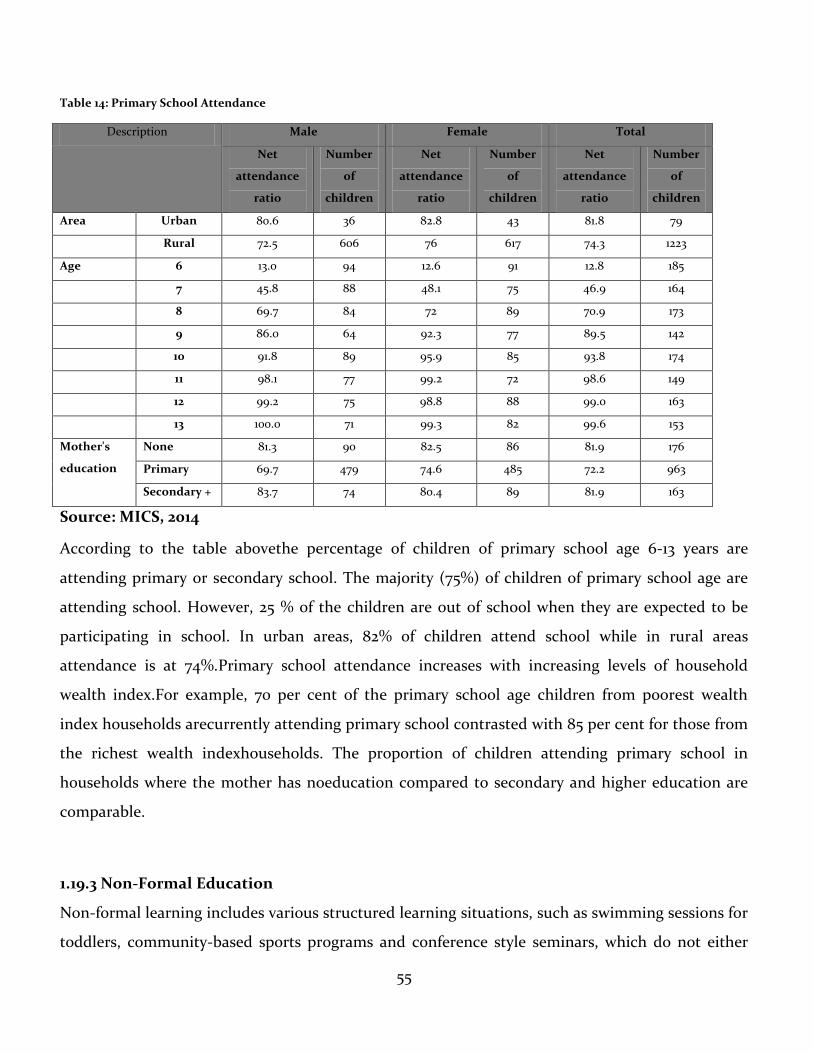
55
Table 14: Primary School Attendance
Description Male Female Total
Net
attendance
ratio
Number
of
children
Net
attendance
ratio
Number
of
children
Net
attendance
ratio
Number
of
children
Area Urban 80.6 36 82.8 43 81.8 79
Rural 72.5 606 76 617 74.3 1223
Age 6 13.0 94 12.6 91 12.8 185
7 45.8 88 48.1 75 46.9 164
8 69.7 84 72 89 70.9 173
9 86.0 64 92.3 77 89.5 142
10 91.8 89 95.9 85 93.8 174
11 98.1 77 99.2 72 98.6 149
12 99.2 75 98.8 88 99.0 163
13 100.0 71 99.3 82 99.6 153
Mother's
education
None 81.3 90 82.5 86 81.9 176
Primary 69.7 479 74.6 485 72.2 963
Secondary + 83.7 74 80.4 89 81.9 163
Source: MICS, 2014
According to the table abovethe percentage of children of primary school age 6-13 years are
attending primary or secondary school. The majority (75%) of children of primary school age are
attending school. However, 25 % of the children are out of school when they are expected to be
participating in school. In urban areas, 82% of children attend school while in rural areas
attendance is at 74%.Primary school attendance increases with increasing levels of household
wealth index.For example, 70 per cent of the primary school age children from poorest wealth
index households arecurrently attending primary school contrasted with 85 per cent for those from
the richest wealth indexhouseholds. The proportion of children attending primary school in
households where the mother has noeducation compared to secondary and higher education are
comparable.
1.19.3 Non-Formal Education
Non-formal learning includes various structured learning situations, such as swimming sessions for
toddlers, community-based sports programs and conference style seminars, which do not either
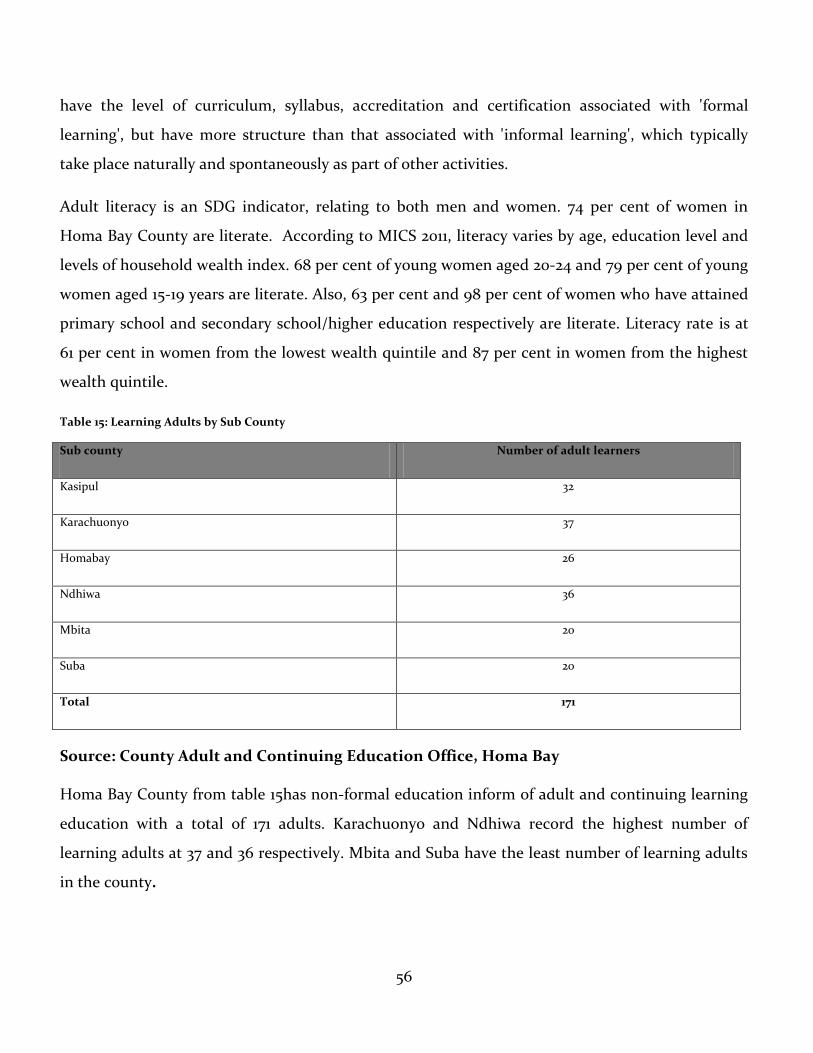
56
have the level of curriculum, syllabus, accreditation and certification associated with 'formal
learning', but have more structure than that associated with 'informal learning', which typically
take place naturally and spontaneously as part of other activities.
Adult literacy is an SDG indicator, relating to both men and women. 74 per cent of women in
Homa Bay County are literate. According to MICS 2011, literacy varies by age, education level and
levels of household wealth index. 68 per cent of young women aged 20-24 and 79 per cent of young
women aged 15-19 years are literate. Also, 63 per cent and 98 per cent of women who have attained
primary school and secondary school/higher education respectively are literate. Literacy rate is at
61 per cent in women from the lowest wealth quintile and 87 per cent in women from the highest
wealth quintile.
Table 15: Learning Adults by Sub County
Sub county Number of adult learners
Kasipul 32
Karachuonyo 37
Homabay 26
Ndhiwa 36
Mbita 20
Suba 20
Total 171
Source: County Adult and Continuing Education Office, Homa Bay
Homa Bay County from table 15has non-formal education inform of adult and continuing learning
education with a total of 171 adults. Karachuonyo and Ndhiwa record the highest number of
learning adults at 37 and 36 respectively. Mbita and Suba have the least number of learning adults
in the county.
57
1.19.4 Youth polytechnics
The county has in the most current Cedia Utawala Survey Report, 2014, 50 Youth Polytechnics with
a total enrolment of 2,970 students. The number of Youth Polytechnics in Homa Bay increased
from 24 in the year 2013 to 26 in the year 2016. There is a need to establish more youth polytechnics
to cater for the growing youth population.
1.19.5 Secondary Education
According to MICS report 2011, the average net attendance ratio at secondary school is 18.2 per cent
21.3 per cent for boys and girls respectively. This means that less than a quarter of children of the
secondary school-going age are in school on a typical day. There are over 180 secondary schools in
the county catering for the secondary education needs of a total 96,131 eligible children however
only the 63,400 children between the ages of thirteen and seventeen are accommodated. This
represents an average enrolment of 66 per cent of the children eligible for secondary school
education. With an estimated staff establishment of 1,224 it can be projected that the teacher pupil
ratio will jump from 1:49 currently to 1:79 once a gross enrolment rate of 100 per cent is achieved.
To achieve the national target of 100 per cent gross enrolment and a teacher pupil ratio of 1:40,
measures must be in place to hire additional teachers for the existing secondary schools in the
county. With 42.8 per cent of the married having got married at between 15 and 17 years and with
over 56 per cent of the children who attend school being involved in some form of child labour, it is
imperative that challenges of child marriages and child labour are addressed as a matter of priority.
1.19.6 Tertiary Education
The county of Homa Bay according to the study has 2 public technical training institutions:
Mawego, Wanyama and one public Teacher Training College at Asumbi. There are6 private
accredited Teacher Training Colleges: Nyandiwa, Nyabola, GEBS, St. Francis, Mbita ECD, Joy ECD
and, one private accredited commercial college in Homa Bay (Yolifa Institute). There are also two
University Branches in the county: Tom Mboya University College and University of Nairobi and
Homa Bay Extra-Mural Centre. With poverty rates of Homa Bay at 48.4 (KNBS), most of the
students who complete secondary are not able to proceed to tertiary institutions. The low
58
transition to post-secondary institutions must be addressed first by building tertiary institutions
within the reach of the populations in each sub-county and then support in terms of tuition,
transport and accommodation given to students from those households of poor wealth quintiles.
1.19.7 Adult and Continuing Education
Literacy rates in the County are quite low. Given the general apathy towards adult education, the
County should seek ways of attracting more adults to continuing education in order to improve
literacy among the general population. As a way of doing this and of increasing the number of
existing designated adult education centres, new adult education units could be started at
minimum cost within existing public institutions such as primary schools, secondary schools,
vocational and technical institutions.
1.19.8 Technical, Vocational Education and Training (TVET)
There is only one Technical Training Institute (TVET) in Homa Bay County known as Mawego TTI
in Karachuonyo Sub County according to the most current Utawala, 2014 Survey Report.
1.20 Sports, Culture and Creative Arts
The County Government of Homa Bay has entered into negotiation with the National Government
to support the development of Homa Bay County Stadium at a cost of Kshs. 1.5 billion. The focus of
this current CIDP (2018 – 2022) will be on the development of Homa Bay County Stadium as a
Regional Sports Stadium, development of 8 Sub-County Stadia, Development of an ultra-modern
Sports Gymnasia and establishment of Homa Bay County Sports Fund to promote sports activities
in the County.
1.20.1 Museums, Heritage and Cultural Sites
Homa Bay County is a home to several heritages and cultural sites. Prominent among these are:
Lake SimbiNyaima, Ruma National Park, Tom Mboya Mausolem, Rusinga Cultural Festival, Gor
Mahia Shrine in Ndhiwa, among many others. In the previous term of (2013 – 2017), The County
Government of Homa Bay face lifted and refurbished Tom Mboya Mausoleum in Rusinga, Oyugis
59
Birds Sanctuary in Kasipul, purchased land around the GorMahia Shrine and earmarked it for the
development of GorMahia Sports and Cultural Complex through PPP and mapped all other cultural
sites across the county for conservation and protection.
Focus in the current CIDP (2018 – 2022) will be on the development of Homa Bay Stadium to an
ultra-modern sports complex with the support of the National Government, development of
GorMahia Shrine as a Tourist Attraction Site complete with a Cultural Artefacts Exhibition Centers,
a Sports Complex and Conference Facility, in partnership with the KWS, initiate the Roan Antelope
Conservation Campaign and promote Eco-Tourism Investment in and around Ruma National Park
to boost both local and international tourism at the Park and to promote linkage between Research
Institutions and the Homa Bay County Government for the purpose of further development of our
unique heritages and cultural sites.
1.20.2 Talent Academies
Currently Homa Bay County has no talent academies but there is dire need for the same to nurture
the various talents among the youth in the County.
1.20.3 Sports Facilities
Homa Bay County has one stadium, Homa Bay County stadium, which is in poor state of repair.
However, the County Government has already initiated a negotiation with the National
Government of Kenya to support the development of Homa Bay County Stadium to an
International Olympic Standard Stadium at a cost of Kshs. 1.5 billion. The County Government
will, in the next five years, also focus on developing at least one sports ground in each of the 40
wards and one stadium in each of the 8 sub-counties. Besides, the County Government, following
up on the CIDP (2013 – 2017), will also focus on developing one ultra-modern sports gymnasia and
establishing of Homa Bay County Sports Fund to support the development of youth sports talents
and participation of County Sports Teams (Football, Volleyball, Handball, Tennis, Hockey,
Athletics) in county, inter-county, national and international tournaments.
60
1.20.4 Libraires /Information Documentation Centres/ Citizen Service Centres
Through the National Government’s Ministry of National Treasury and Planning, Homa Bay
County has benefitted from the Huduma Center Initiative. This is now providing a one-stop
government services to citizens. To help improve public service delivery further, the County
Government has also established ICT Innovation Hub at Homa Bay Town with plans to expand the
same in all other 7 sub-counties being prioritized in the current CIDP (2018 – 2022). It is however
worth noting that Homa Bay County currently has no public library. To this end, the current CIDP
(2018 – 2022) has prioritized the construction to completion of a County Library in Homa Bay
Town with land for the proposed development having been secured by the County Government
through the Department of Education and ICT. Whereas, the county has also extended fibre optic
cables to the County Headquarters and pioneered revenue automation in selected sub-counties,
there is need to expand internet connectivity across the county as a precursor to enhancing citizen
service delivery, accountability and transparency and information documentation processes.
1.20.5 Registered Traditional, Herbalists and Medicinemen
Homa Bay County has a number of traditional herbalists and medicine men. However, data on
their actual number, type of services provided and their location among other data has never been
collected, analysed and documented. There is a need to initiate census across the county to identify
and register all traditional herbalists and medicine men in the county. This will be followed by a
policy formulation process to control and monitor their activities among other interventions aimed
at managing this group of traditional ‘doctors’.
1.21 Community Organizations/Non-State Actors
The County Government of Homa Bay places premium significance on the role played by
community-based organizations and public benefits organization in furtherance of our community
development agenda. To this end, the County Government has established a donor-round table
consultative forum especially at the Department of Health to coordinate their activities and ensure
value-for-money based investment approach in the Health Sector. There is however an urgent need
to extend this kind of partnership coordination arrangement to cover all sectors. Further, the
61
County Government takes into cognizance the need to enhance participation of the non-state
actors in county’s development planning and development programs financing. In this regard, the
Office of the Governor will convene a bi-annual donor roundtable meeting to monitor the CIDP
(2018 – 2022) implementation, document challenges and determine appropriate options for
ensuring targets are met and outcomes realized.
1.21.1 Cooperative Societies
According to the Division of Cooperatives Information, 2017, Homa Bay County has142 active and
106 dormant registered cooperativesocietiestotaling to248. 56,877 members are registered in the
existing248 cooperative societies. The members contribute a turnover of Kshs. 833,320,903through
investment capital of Kshs. 512,247 and membership deposit of Kshs. 345,734,832.
1.21.2 Public Benefits Organizations (PBOs)
Homa Bay County has 15 active international PBOs and 23 local PBOs running various programmes
and projects mostly in health and HIV/AIDS, education, water resources development and
irrigation, human rights and environment protection, community empowerment and livelihood
support. The major PBOs include World Vision, Medicines Sans Frontiers, Plan International, Care,
International Medical Corps, German Agro-Action, Catholic Relief Services, FACES, YOFAK, CARD,
Nagasaki University, Elizabeth Glazier Pediatric AIDS Foundation, Med 25, OGRA Foundation, C-
MAD and Heifer International among others. Mbita and Homa Bay towns are host to most of the
programmesdue to their relative high prevalence to poverty and HIV/AIDS. Both towns have
remained the towns of choice to set up work stations for these PBOs because of availability of good
roads, connectivity to electricity, secure office accommodation and conferencing facilities.
1.21.3 Development Partners
Homa Bay County has partnered with both National and International development partners such
as World Vision, UNICEF, UNDP, EPZ, KeMRI, WHO, EGPAF, WB. Partnerships have been
majorly in areas of Health, Documentation, Education, Water and Sanitation, industrialization,
devolution and Governance.
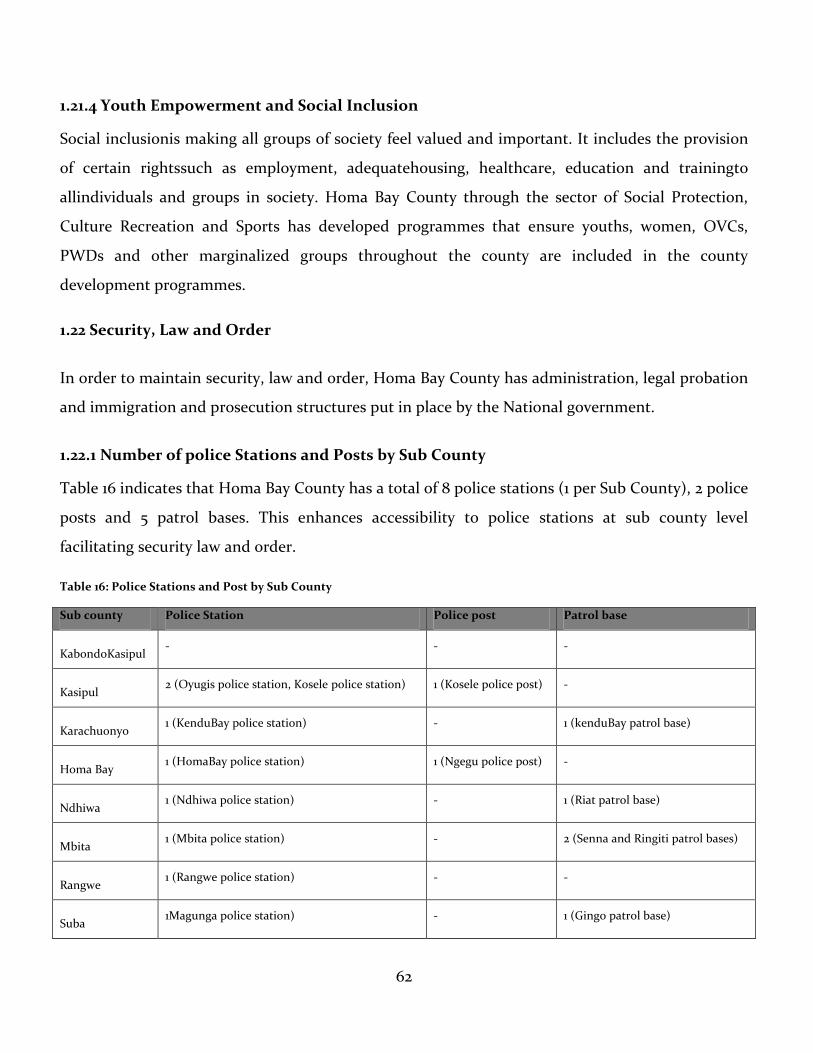
62
1.21.4 Youth Empowerment and Social Inclusion
Social inclusionis making all groups of society feel valued and important. It includes the provision
of certain rightssuch as employment, adequatehousing, healthcare, education and trainingto
allindividuals and groups in society. Homa Bay County through the sector of Social Protection,
Culture Recreation and Sports has developed programmes that ensure youths, women, OVCs,
PWDs and other marginalized groups throughout the county are included in the county
development programmes.
1.22 Security, Law and Order
In order to maintain security, law and order, Homa Bay County has administration, legal probation
and immigration and prosecution structures put in place by the National government.
1.22.1 Number of police Stations and Posts by Sub County
Table 16 indicates that Homa Bay County has a total of 8 police stations (1 per Sub County), 2 police
posts and 5 patrol bases. This enhances accessibility to police stations at sub county level
facilitating security law and order.
Table 16: Police Stations and Post by Sub County
Sub county Police Station Police post Patrol base
KabondoKasipul - - -
Kasipul 2 (Oyugis police station, Kosele police station) 1 (Kosele police post) -
Karachuonyo 1 (KenduBay police station) - 1 (kenduBay patrol base)
Homa Bay 1 (HomaBay police station) 1 (Ngegu police post) -
Ndhiwa 1 (Ndhiwa police station) - 1 (Riat patrol base)
Mbita 1 (Mbita police station) - 2 (Senna and Ringiti patrol bases)
Rangwe 1 (Rangwe police station) - -
Suba 1Magunga police station) - 1 (Gingo patrol base)
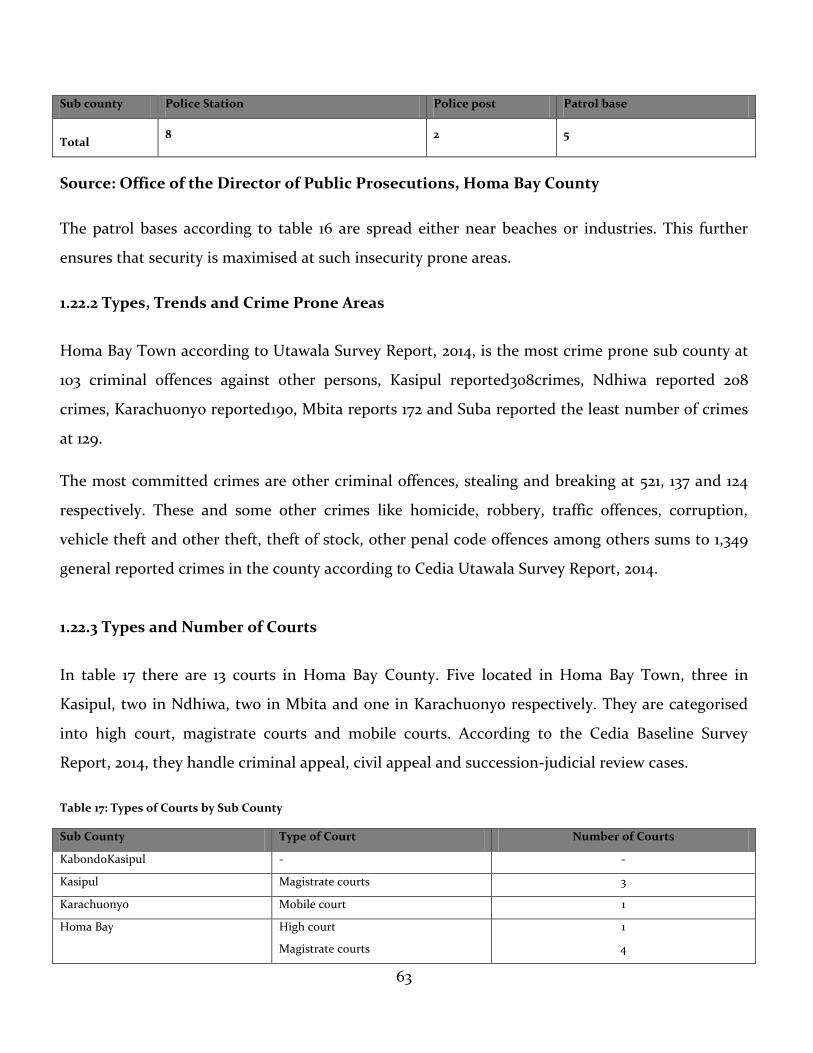
63
Sub county Police Station Police post Patrol base
Total 8 2 5
Source: Office of the Director of Public Prosecutions, Homa Bay County
The patrol bases according to table 16 are spread either near beaches or industries. This further
ensures that security is maximised at such insecurity prone areas.
1.22.2 Types, Trends and Crime Prone Areas
Homa Bay Town according to Utawala Survey Report, 2014, is the most crime prone sub county at
103 criminal offences against other persons, Kasipul reported308crimes, Ndhiwa reported 208
crimes, Karachuonyo reported190, Mbita reports 172 and Suba reported the least number of crimes
at 129.
The most committed crimes are other criminal offences, stealing and breaking at 521, 137 and 124
respectively. These and some other crimes like homicide, robbery, traffic offences, corruption,
vehicle theft and other theft, theft of stock, other penal code offences among others sums to 1,349
general reported crimes in the county according to Cedia Utawala Survey Report, 2014.
1.22.3 Types and Number of Courts
In table 17 there are 13 courts in Homa Bay County. Five located in Homa Bay Town, three in
Kasipul, two in Ndhiwa, two in Mbita and one in Karachuonyo respectively. They are categorised
into high court, magistrate courts and mobile courts. According to the Cedia Baseline Survey
Report, 2014, they handle criminal appeal, civil appeal and succession-judicial review cases.
Table 17: Types of Courts by Sub County
Sub County Type of Court Number of Courts
KabondoKasipul - -
Kasipul Magistrate courts 3
Karachuonyo Mobile court 1
Homa Bay High court
Magistrate courts
1
4
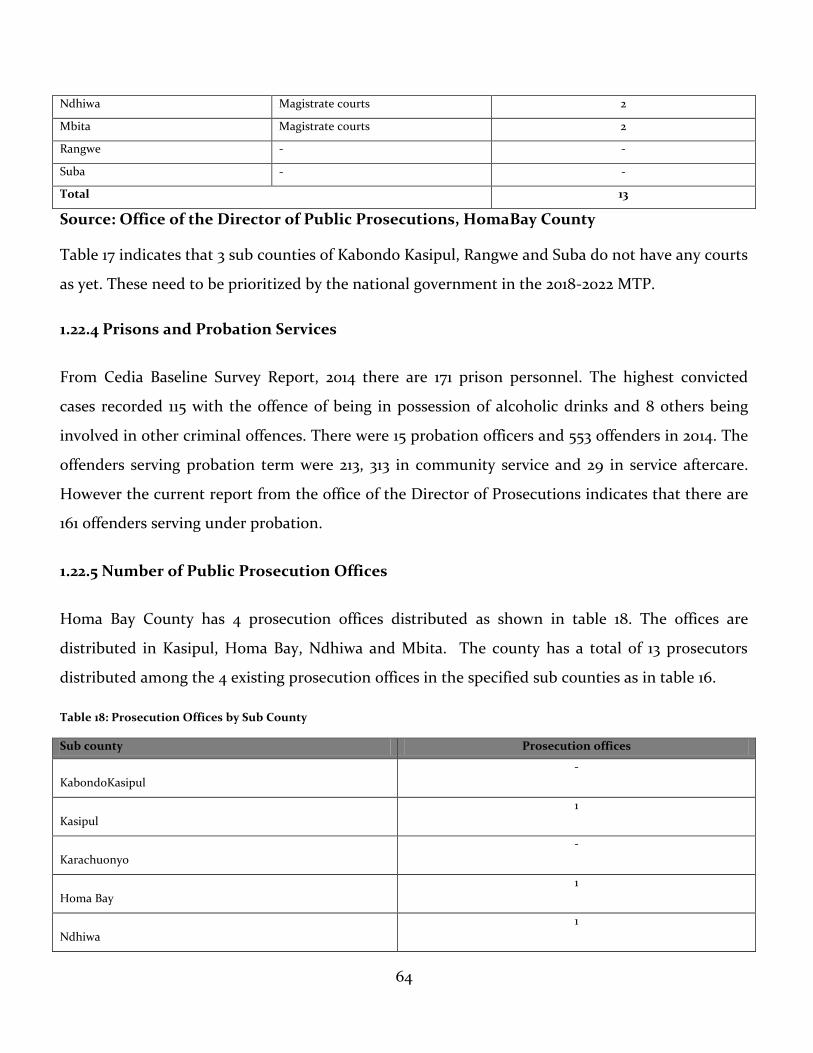
64
Ndhiwa Magistrate courts 2
Mbita Magistrate courts 2
Rangwe - -
Suba - -
Total 13
Source: Office of the Director of Public Prosecutions, HomaBay County
Table 17 indicates that 3 sub counties of Kabondo Kasipul, Rangwe and Suba do not have any courts
as yet. These need to be prioritized by the national government in the 2018-2022 MTP.
1.22.4 Prisons and Probation Services
From Cedia Baseline Survey Report, 2014 there are 171 prison personnel. The highest convicted
cases recorded 115 with the offence of being in possession of alcoholic drinks and 8 others being
involved in other criminal offences. There were 15 probation officers and 553 offenders in 2014. The
offenders serving probation term were 213, 313 in community service and 29 in service aftercare.
However the current report from the office of the Director of Prosecutions indicates that there are
161 offenders serving under probation.
1.22.5 Number of Public Prosecution Offices
Homa Bay County has 4 prosecution offices distributed as shown in table 18. The offices are
distributed in Kasipul, Homa Bay, Ndhiwa and Mbita. The county has a total of 13 prosecutors
distributed among the 4 existing prosecution offices in the specified sub counties as in table 16.
Table 18: Prosecution Offices by Sub County
Sub county Prosecution offices
KabondoKasipul
-
Kasipul
1
Karachuonyo
-
Homa Bay
1
Ndhiwa
1
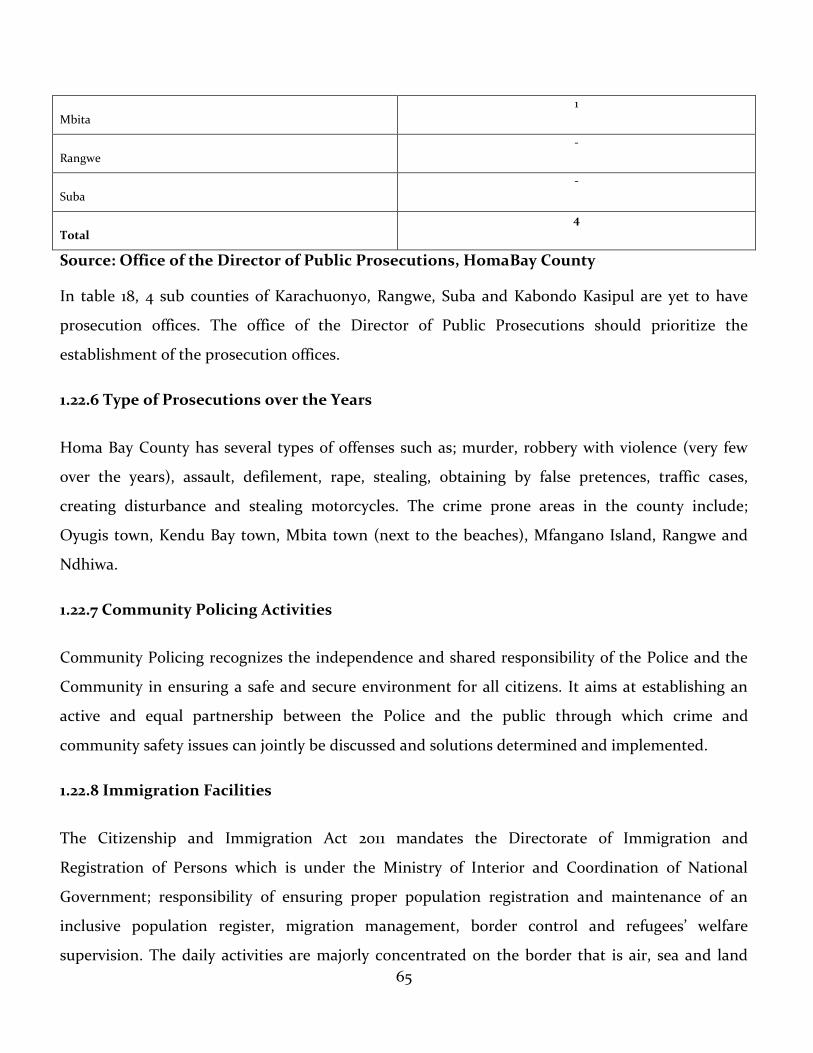
65
Mbita
1
Rangwe
-
Suba
-
Total
4
Source: Office of the Director of Public Prosecutions, HomaBay County
In table 18, 4 sub counties of Karachuonyo, Rangwe, Suba and Kabondo Kasipul are yet to have
prosecution offices. The office of the Director of Public Prosecutions should prioritize the
establishment of the prosecution offices.
1.22.6 Type of Prosecutions over the Years
Homa Bay County has several types of offenses such as; murder, robbery with violence (very few
over the years), assault, defilement, rape, stealing, obtaining by false pretences, traffic cases,
creating disturbance and stealing motorcycles. The crime prone areas in the county include;
Oyugis town, Kendu Bay town, Mbita town (next to the beaches), Mfangano Island, Rangwe and
Ndhiwa.
1.22.7 Community Policing Activities
Community Policing recognizes the independence and shared responsibility of the Police and the
Community in ensuring a safe and secure environment for all citizens. It aims at establishing an
active and equal partnership between the Police and the public through which crime and
community safety issues can jointly be discussed and solutions determined and implemented.
1.22.8 Immigration Facilities
The Citizenship and Immigration Act 2011 mandates the Directorate of Immigration and
Registration of Persons which is under the Ministry of Interior and Coordination of National
Government; responsibility of ensuring proper population registration and maintenance of an
inclusive population register, migration management, border control and refugees’ welfare
supervision. The daily activities are majorly concentrated on the border that is air, sea and land
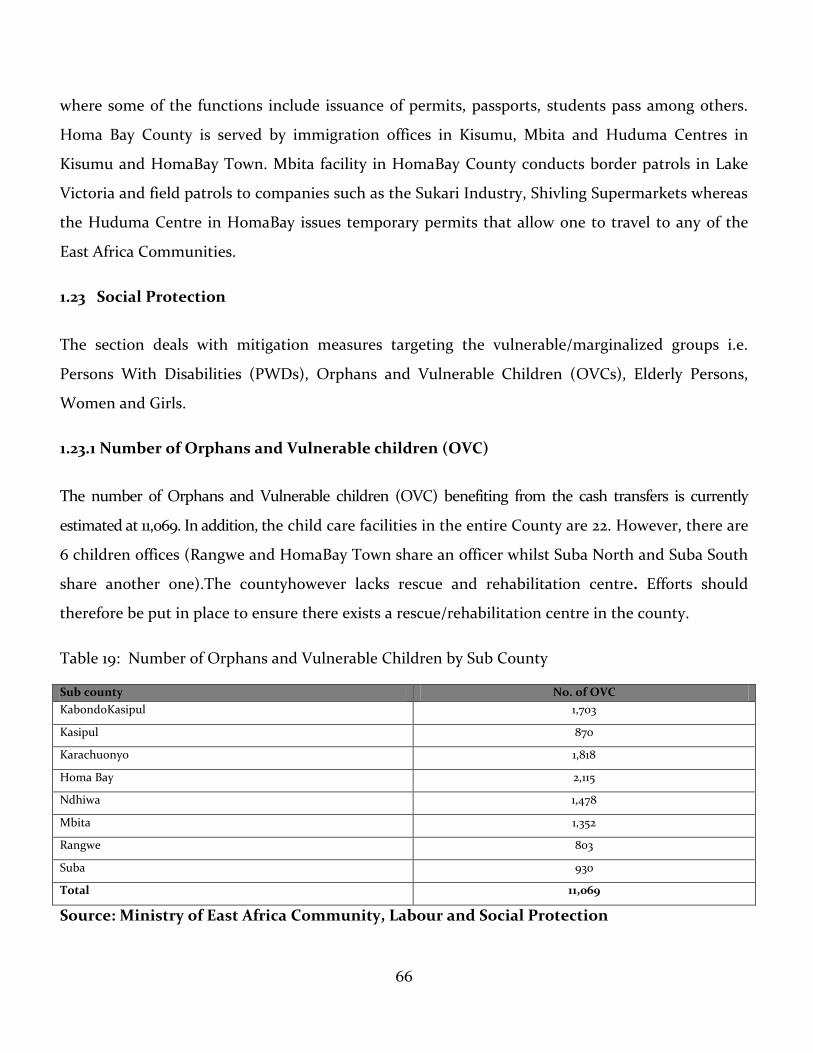
66
where some of the functions include issuance of permits, passports, students pass among others.
Homa Bay County is served by immigration offices in Kisumu, Mbita and Huduma Centres in
Kisumu and HomaBay Town. Mbita facility in HomaBay County conducts border patrols in Lake
Victoria and field patrols to companies such as the Sukari Industry, Shivling Supermarkets whereas
the Huduma Centre in HomaBay issues temporary permits that allow one to travel to any of the
East Africa Communities.
1.23 Social Protection
The section deals with mitigation measures targeting the vulnerable/marginalized groups i.e.
Persons With Disabilities (PWDs), Orphans and Vulnerable Children (OVCs), Elderly Persons,
Women and Girls.
1.23.1 Number of Orphans and Vulnerable children (OVC)
The number of Orphans and Vulnerable children (OVC) benefiting from the cash transfers is currently
estimated at 11,069. In addition, the child care facilities in the entire County are 22. However, there are
6 children offices (Rangwe and HomaBay Town share an officer whilst Suba North and Suba South
share another one).The countyhowever lacks rescue and rehabilitation centre. Efforts should
therefore be put in place to ensure there exists a rescue/rehabilitation centre in the county.
Table 19: Number of Orphans and Vulnerable Children by Sub County
Sub county No. of OVC
KabondoKasipul 1,703
Kasipul 870
Karachuonyo 1,818
Homa Bay 2,115
Ndhiwa 1,478
Mbita 1,352
Rangwe 803
Suba 930
Total 11,069
Source: Ministry of East Africa Community, Labour and Social Protection
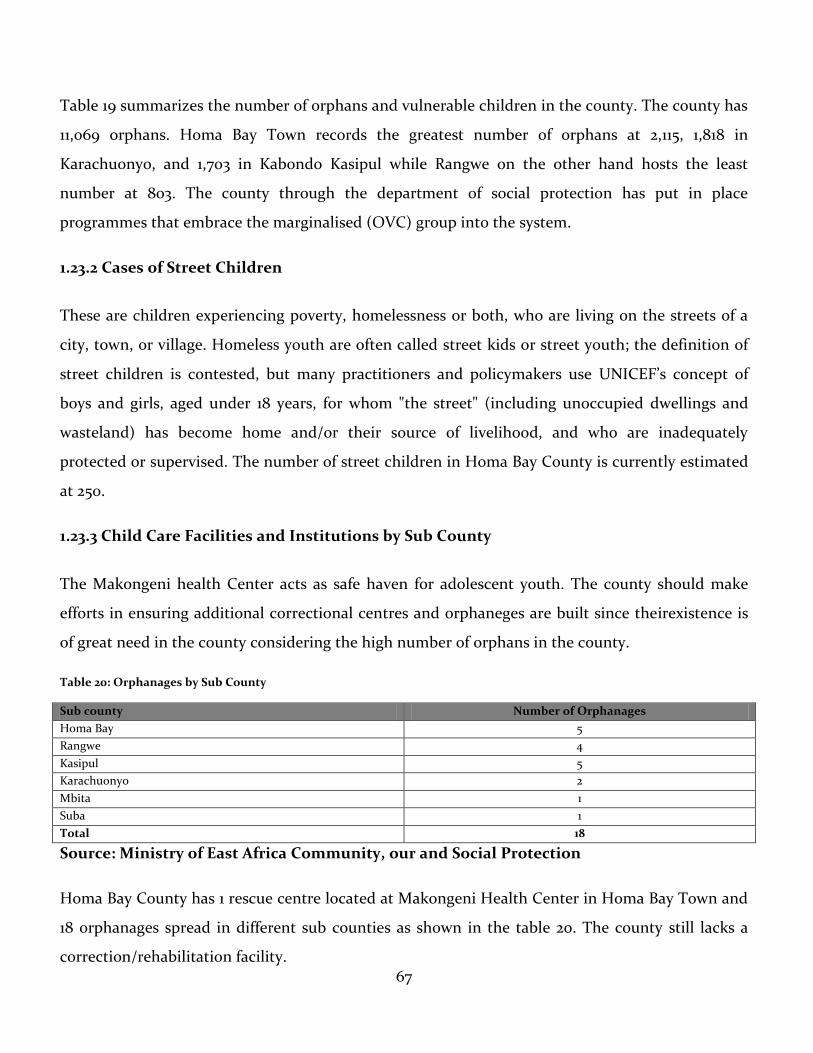
67
Table 19 summarizes the number of orphans and vulnerable children in the county. The county has
11,069 orphans. Homa Bay Town records the greatest number of orphans at 2,115, 1,818 in
Karachuonyo, and 1,703 in Kabondo Kasipul while Rangwe on the other hand hosts the least
number at 803. The county through the department of social protection has put in place
programmes that embrace the marginalised (OVC) group into the system.
1.23.2 Cases of Street Children
These are children experiencing poverty, homelessness or both, who are living on the streets of a
city, town, or village. Homeless youth are often called street kids or street youth; the definition of
street children is contested, but many practitioners and policymakers use UNICEF’s concept of
boys and girls, aged under 18 years, for whom "the street" (including unoccupied dwellings and
wasteland) has become home and/or their source of livelihood, and who are inadequately
protected or supervised. The number of street children in Homa Bay County is currently estimated
at 250.
1.23.3 Child Care Facilities and Institutions by Sub County
The Makongeni health Center acts as safe haven for adolescent youth. The county should make
efforts in ensuring additional correctional centres and orphaneges are built since theirexistence is
of great need in the county considering the high number of orphans in the county.
Table 20: Orphanages by Sub County
Sub county Number of Orphanages
Homa Bay 5
Rangwe 4
Kasipul 5
Karachuonyo 2
Mbita 1
Suba 1
Total 18
Source: Ministry of East Africa Community, our and Social Protection
Homa Bay County has 1 rescue centre located at Makongeni Health Center in Homa Bay Town and
18 orphanages spread in different sub counties as shown in the table 20. The county still lacks a
correction/rehabilitation facility.
68
1.23.4 Social Net Programmes in the County
This has dominantly the mandate of national government. However, the national government has
made effort in rolling out to all sub-counties since the FY 2013/2014. The total beneficiaries
nationally from 2013 to 2017 were 132,000 with a total disbursement over the same period of Kshs.
59.7 billion. The Inua Jamii target for registration 2017/2018 is 540,000. Homa Bay County target is
over 10,000 and the county has achieved slightly over 5,900 potential beneficiaries to date.
69
CHAPTER TWO
LINKAGES WITH VISION 2030 AND OTHER PLANS
2.0 Overview
This chapter provides the linkages of the Homa Bay Integrated Development Plan with the Kenya
Vision 2030, and the Third Medium Term Plan, Sustainable Development Goals, the Constitution
of Kenya, Lake Region Economic Block, Sectoral plans and other plans by development and
implementing partners. Above all, all development programmes and development activities will be
tailored to meet cross cutting issues such as gender, food security, disaster risk management,
climate-change adaptation threshold among others.
2.1 CIDP Linkage with Constitution of Kenya 2010
The Constitution of Kenya, 2010 prescribes national values and principles of governance which
include sharing and devolution of power. It creates a two-tier government: a national government
and 47 county governments.
The Fourth Schedule delineates the functions of the national and county governments. A total of 14
functions have been devolved to the counties. The main ones include: county planning and
development; agriculture; county health services; control of air pollution, noise pollution, other
public nuisances and outdoor advertising; cultural activities, public entertainment and public
amenities; county roads and transport; animal control and welfare; trade development and
regulation; pre-primary education and village polytechnics; specific national government policies
on natural resources and environmental conservation; county public works and services;
firefighting services and disaster management; control of drugs and pornography. Emphasis is also
made for the counties to ensure participatory development and capacities are developed at all
community levels.
The county governments are required to prepare the County Integrated Development Plans to
enable prioritization of socio-economic development issues at the local level. This is mandatory
70
before the funding of county projects and programmes. The CIDP is anchored on the county
functions as provided in the fourth schedule of the Constitution.
2.2 CIDP Linkage with Kenya Vision 2030
Sessional Paper Number 10 of 2012 on Kenya Vision 2030 is the National Policy Economic Blueprint
that entrenches Kenya Vision 2030 as the long-term development strategy for Kenya. The Kenya
Vision 2030 aims to transform Kenya into a modern, globally competitive, middle income country
providing a high quality of life to all its citizens. Kenya Vision 2030 is a product of highly
participatory, consultative and inclusive stakeholder’s process conducted throughout the country
and in all sectors of the economy.
The Vision is anchored on three key pillars: economic; social; and political. The Economic Pillar
aims to achieve an average Gross Domestic Product (GDP) growth rate of 10 percent per annum
and sustain the same till 2030 in order to generate more resources to reinvigorate the economy to
meet its envisaged goals and aspirations. The key sectors in this pillar include: tourism, agriculture
and livestock, manufacturing, wholesale and retail trade, Business Process Outsourcing (BPO) and
financial services. A seventh sector, oil and mineral resources, has now been added taking
cognizance of the recent developments.
The Social Pillar seeks to build a just and cohesive society with social equity in a clean and secure
environment. The main sectors under this pillar include education and training, health, water and
irrigation, environment, housing and urbanization, gender, sports, youth and culture. The Political
Pillar aims at realizing a democratic political system founded on issue-based politics that respect
the rule of law and protects the fundamental rights and freedoms of every individual in the Kenyan
society.
The three pillars are anchored on a number of foundations, which serve as enablers that create an
environment that is geared towards the realization of Vision 2030. These include: macroeconomic
stability; continuity in governance reforms; enhanced equity and wealth creation opportunities for
the poor; infrastructure; energy; Science, Technology and Innovation; Land Reforms; Human

71
Resource Development; Security and Public-Sector Reforms. An additional enabler, national values
and ethics, has been included following the passing of the Constitution of Kenya 2010.
2.3CIDP linkage with the Big Four National Economic Plan
"The Big four" plan for Kenya, is a print out of what the government plans to achieve for the next
five years arising from the development needs of the people of Kenya. The government recognizes
the fact that a jobless Kenyan is a desperate Kenyan; a hungry Kenyan is a negative Kenyan; a sick
Kenyan is a weak Kenyan; and a homeless Kenyan is a person without hope.
Simply put, the Big Four are food security, affordable housing, manufacturing and affordable
healthcare for all. "The Big Four are expected to create jobs, which will enable our people to meet
their basic needs that will transform their lives to a new status of greater comfort and wellbeing.
Under manufacturing, the government will focus on boosting four manufacturing sub sectors
namely the Blue Economy, Agro-Processing, Leather and Textiles. The fishing industry is expected
to grow seven fold and a ready market of leather products will be guaranteed from government
departments notably the armed forces and other agencies. Further, our tea, coffee, meat, fruits and
vegetables will be processed locally to obtain more value from our produce, and create more jobs
and wealth for Kenyans. The government will also make arrangements with expatriates in
manufacturing to ensure Kenyans receive proper training and safeguard protection of intellectual
property rights.
The government targets to ensure that half a million Kenyans will be able to own affordable and
decent homes by 2022 by reducing mortgage and construction costs. Universal health care will be
realized by policy and administrative reforms in the medical sector. The government will enforce
collaboration between National Hospital Insurance Fund (NHIF) and private medical insurance
providers so as to ensure wider coverage. On food security all idle arable land will be put to use
where the Ministry of Agriculture and Irrigation will publish terms which commercial farmers can
lease agricultural land owned by the government.
By implementing the programs and policies under the Economic Transformation Agenda (Big Four
Pillars), the County Government of Homa Bay in close partnership with the National Government
72
and Development Partners will strengthen the resilience of Homa Bay County’s economy and lay
down a solid foundation for the County’s industrialization, wealth creation and health
improvement of our citizens as envisaged in the County’s Vision Statement.
2.4 CIDP Linkage with County Government’s Manifesto
The County Government’s manifesto is anchored on eight main pillars that will ensure guarantee
to the transformation of the people of Homa Bay County. The pillars under which this CIDP 2018-
2022 will implement its programmes and projects are: Trans-formative governance; making Homa
Bay County food secure and eradicating extreme poverty; provision of affordable quality health
care; provision of quality Early ChildhoodEducation, Technical and Vocational Training;
industrialization and employment creation; increase the supply of clean water at household level;
infrastructural growth and development and exploitation of our natural resources and growth of
the tourism potential.
2.5CIDP Linkage with the Lake Region Economic Bloc Blue Print
Lake Region is one of the most densely populated regions of Kenya with over 10 million people
which constitute about 25% of the population in Kenya. The joint development initiative arose
from the understanding that strategic connections between counties with shared interests seated
in a desire for mutual benefit can be an effective and intelligent means of increasing the possibility
of creating notable development impact across several counties. The Economic Blueprint presents
the socioeconomic aspirations of 13 counties in the Lake Basin Region and seeks to boldly secure
and shape the region’s destiny. This Economic Blueprint is designed to guide development efforts
by leveraging existing assets, addressing constraints and defining key steps that leaders and
citizens of the region can take to transform the shared vision of prosperity into reality.
The counties that constitute the Lake Region in this blueprint are Bungoma, Busia, Homa Bay,
Kakamega, Kisii, Kisumu, Migori, Nyamira, Siaya, Bomet, Trans Nzoia, Kericho and Vihiga. They
not only have similar ecological zones and natural resources, they have analogous cultural histories
that date back to historical migrations and trading routes. Thus, a partnership between the
counties is both essential and timely and creates a practical framework through which county
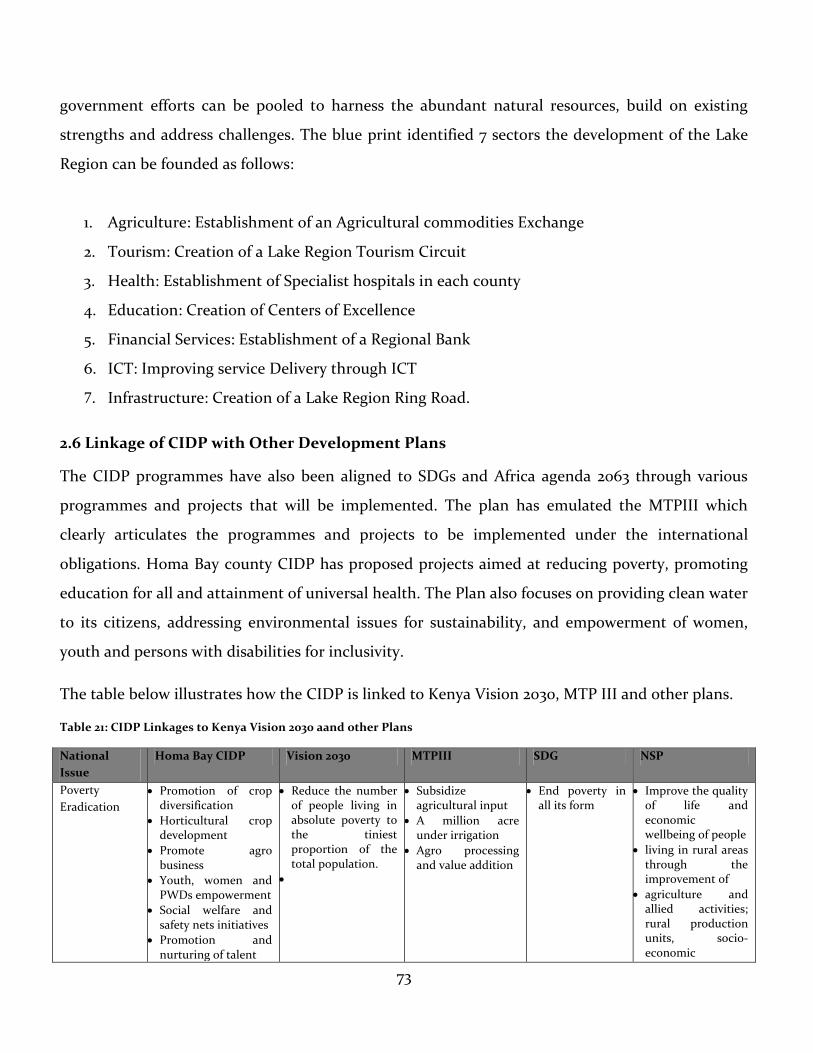
73
government efforts can be pooled to harness the abundant natural resources, build on existing
strengths and address challenges. The blue print identified 7 sectors the development of the Lake
Region can be founded as follows:
1. Agriculture: Establishment of an Agricultural commodities Exchange
2. Tourism: Creation of a Lake Region Tourism Circuit
3. Health: Establishment of Specialist hospitals in each county
4. Education: Creation of Centers of Excellence
5. Financial Services: Establishment of a Regional Bank
6. ICT: Improving service Delivery through ICT
7. Infrastructure: Creation of a Lake Region Ring Road.
2.6 Linkage of CIDP with Other Development Plans
The CIDP programmes have also been aligned to SDGs and Africa agenda 2063 through various
programmes and projects that will be implemented. The plan has emulated the MTPIII which
clearly articulates the programmes and projects to be implemented under the international
obligations. Homa Bay county CIDP has proposed projects aimed at reducing poverty, promoting
education for all and attainment of universal health. The Plan also focuses on providing clean water
to its citizens, addressing environmental issues for sustainability, and empowerment of women,
youth and persons with disabilities for inclusivity.
The table below illustrates how the CIDP is linked to Kenya Vision 2030, MTP III and other plans.
Table 21: CIDP Linkages to Kenya Vision 2030 aand other Plans
National
Issue
Homa Bay CIDP Vision 2030 MTPIII SDG NSP
Poverty
Eradication
Promotion of crop diversification
Horticultural crop development
Promote agro business
Youth, women and PWDs empowerment
Social welfare and safety nets initiatives
Promotion and nurturing of talent
Reduce the number of people living in absolute poverty to the tiniest proportion of the total population.
Subsidize agricultural input
A million acre under irrigation
Agro processing and value addition
End poverty in all its form
Improve the quality of life and economic wellbeing of people
living in rural areas through the improvement of
agriculture and allied activities; rural production units, socio-economic
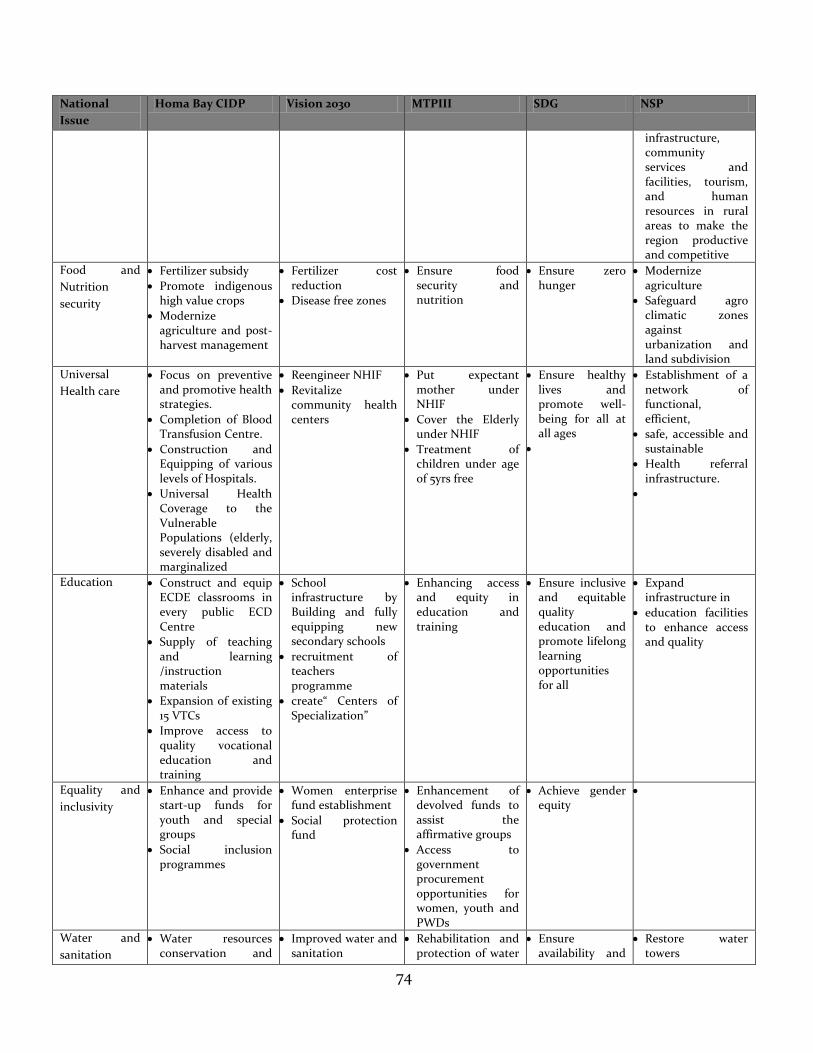
74
National
Issue
Homa Bay CIDP Vision 2030 MTPIII SDG NSP
infrastructure, community services and facilities, tourism, and human resources in rural areas to make the region productive and competitive
Food and
Nutrition
security
Fertilizer subsidy
Promote indigenous high value crops
Modernize agriculture and post-harvest management
Fertilizer cost reduction
Disease free zones
Ensure food security and nutrition
Ensure zero hunger
Modernize agriculture
Safeguard agro climatic zones against urbanization and land subdivision
Universal
Health care
Focus on preventive and promotive health strategies.
Completion of Blood Transfusion Centre.
Construction and Equipping of various levels of Hospitals.
Universal Health Coverage to the Vulnerable Populations (elderly, severely disabled and marginalized
Reengineer NHIF
Revitalize community health centers
Put expectant mother under NHIF
Cover the Elderly under NHIF
Treatment of children under age of 5yrs free
Ensure healthy lives and promote well-being for all at all ages
Establishment of a network of functional, efficient,
safe, accessible and sustainable
Health referral infrastructure.
Education Construct and equip ECDE classrooms in every public ECD Centre
Supply of teaching and learning /instruction materials
Expansion of existing 15 VTCs
Improve access to quality vocational education and training
School infrastructure by Building and fully equipping new secondary schools
recruitment of teachers programme
create“ Centers of Specialization”
Enhancing access and equity in education and training
Ensure inclusive and equitable quality education and promote lifelong learning opportunities for all
Expand infrastructure in
education facilities to enhance access and quality
Equality and
inclusivity
Enhance and provide start-up funds for youth and special groups
Social inclusion programmes
Women enterprise fund establishment
Social protection fund
Enhancement of devolved funds to assist the affirmative groups
Access to government procurement opportunities for women, youth and PWDs
Achieve gender equity
Water and
sanitation
Water resources conservation and
Improved water and sanitation
Rehabilitation and protection of water
Ensure availability and
Restore water towers
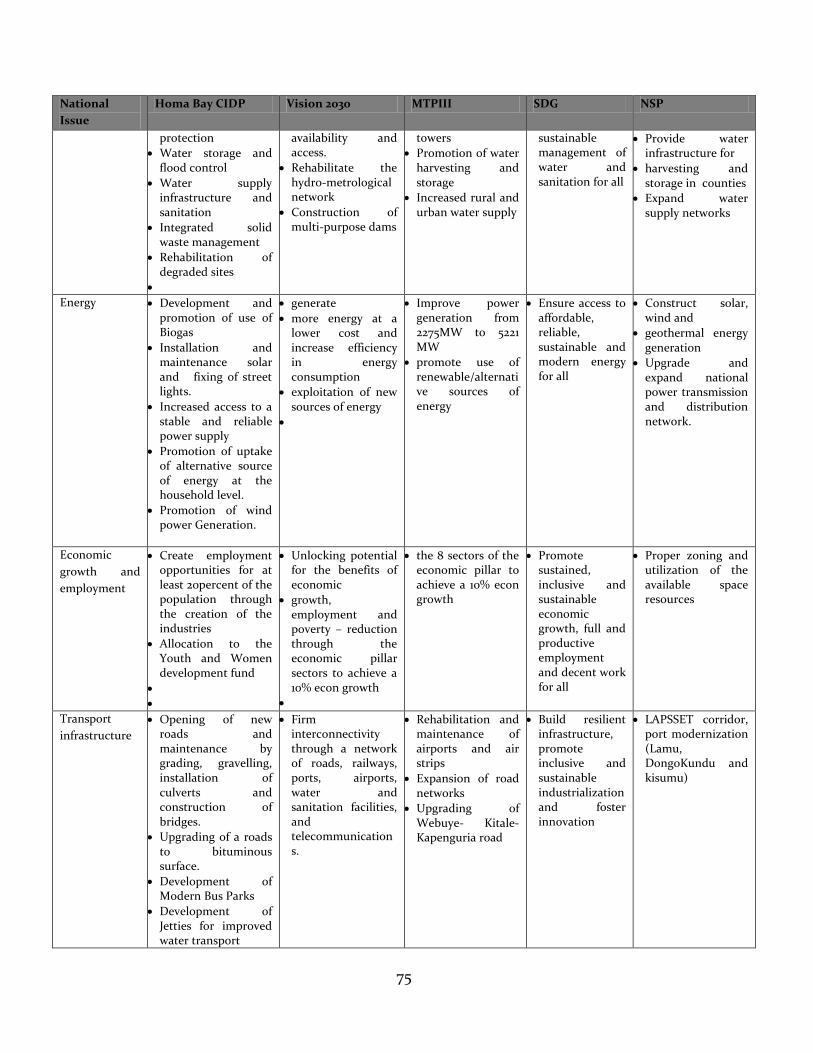
75
National
Issue
Homa Bay CIDP Vision 2030 MTPIII SDG NSP
protection
Water storage and flood control
Water supply infrastructure and sanitation
Integrated solid waste management
Rehabilitation of degraded sites
availability and access.
Rehabilitate the hydro-metrological network
Construction of multi-purpose dams
towers
Promotion of water harvesting and storage
Increased rural and urban water supply
sustainable management of water and sanitation for all
Provide water infrastructure for
harvesting and storage in counties
Expand water supply networks
Energy Development and promotion of use of Biogas
Installation and maintenance solar and fixing of street lights.
Increased access to a stable and reliable power supply
Promotion of uptake of alternative source of energy at the household level.
Promotion of wind power Generation.
generate
more energy at a lower cost and increase efficiency in energy consumption
exploitation of new sources of energy
Improve power generation from 2275MW to 5221 MW
promote use of renewable/alternative sources of energy
Ensure access to affordable, reliable, sustainable and modern energy for all
Construct solar, wind and
geothermal energy generation
Upgrade and expand national power transmission and distribution network.
Economic
growth and
employment
Create employment opportunities for at least 20percent of the population through the creation of the industries
Allocation to the Youth and Women development fund
Unlocking potential for the benefits of economic
growth, employment and poverty – reduction through the economic pillar sectors to achieve a 10% econ growth
the 8 sectors of the economic pillar to achieve a 10% econ growth
Promote sustained, inclusive and sustainable economic growth, full and productive employment and decent work for all
Proper zoning and utilization of the available space resources
Transport
infrastructure
Opening of new roads and maintenance by grading, gravelling, installation of culverts and construction of bridges.
Upgrading of a roads to bituminous surface.
Development of Modern Bus Parks
Development of Jetties for improved water transport
Firm interconnectivity through a network of roads, railways, ports, airports, water and sanitation facilities, and telecommunications.
Rehabilitation and maintenance of airports and air strips
Expansion of road networks
Upgrading of Webuye- Kitale-Kapenguria road
Build resilient infrastructure, promote inclusive and sustainable industrialization and foster innovation
LAPSSET corridor, port modernization (Lamu, DongoKundu and kisumu)
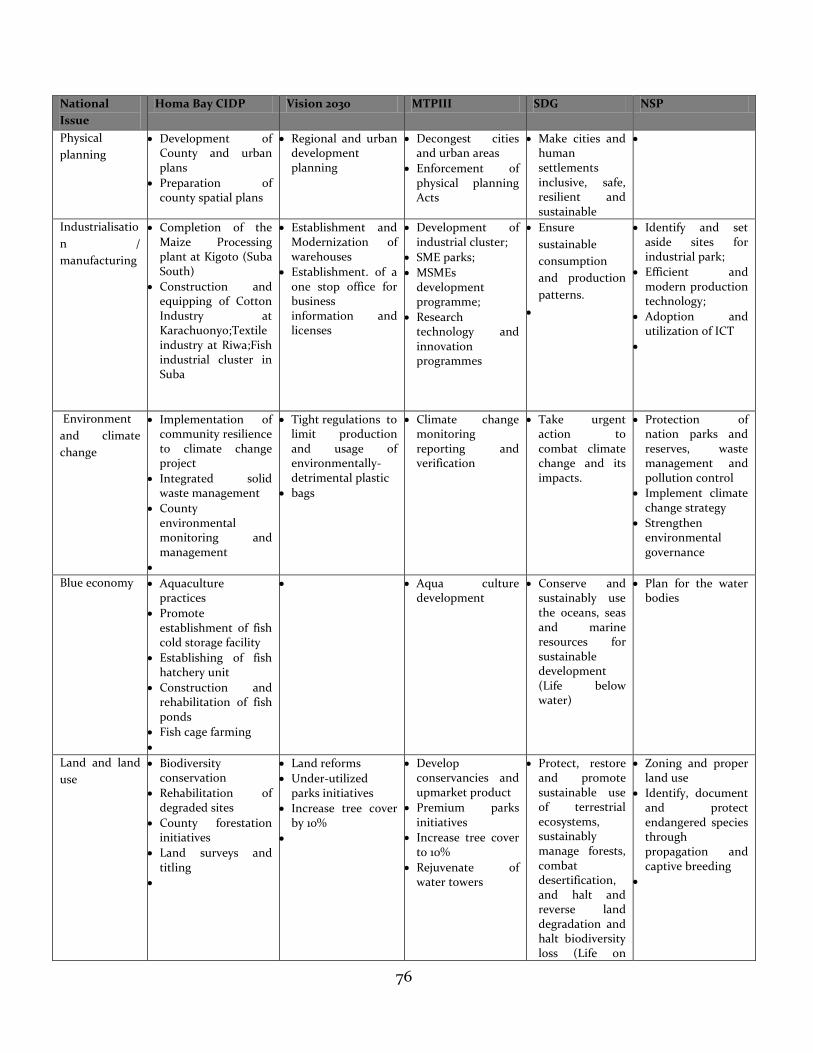
76
National
Issue
Homa Bay CIDP Vision 2030 MTPIII SDG NSP
Physical
planning
Development of County and urban plans
Preparation of county spatial plans
Regional and urban development planning
Decongest cities and urban areas
Enforcement of physical planning Acts
Make cities and human settlements inclusive, safe, resilient and sustainable
Industrialisatio
n /
manufacturing
Completion of the Maize Processing plant at Kigoto (Suba South)
Construction and equipping of Cotton Industry at Karachuonyo;Textile industry at Riwa;Fish industrial cluster in Suba
Establishment and Modernization of warehouses
Establishment. of a one stop office for business information and licenses
Development of industrial cluster;
SME parks;
MSMEs development programme;
Research technology and innovation programmes
Ensure
sustainable
consumption
and production
patterns.
Identify and set aside sites for industrial park;
Efficient and modern production technology;
Adoption and utilization of ICT
Environment
and climate
change
Implementation of community resilience to climate change project
Integrated solid waste management
County environmental monitoring and management
Tight regulations to limit production and usage of environmentally-detrimental plastic
bags
Climate change monitoring reporting and verification
Take urgent action to combat climate change and its impacts.
Protection of nation parks and reserves, waste management and pollution control
Implement climate change strategy
Strengthen environmental governance
Blue economy Aquaculture practices
Promote establishment of fish cold storage facility
Establishing of fish hatchery unit
Construction and rehabilitation of fish ponds
Fish cage farming
Aqua culture development
Conserve and sustainably use the oceans, seas and marine resources for sustainable development (Life below water)
Plan for the water bodies
Land and land
use
Biodiversity conservation
Rehabilitation of degraded sites
County forestation initiatives
Land surveys and titling
Land reforms
Under-utilized parks initiatives
Increase tree cover by 10%
Develop conservancies and upmarket product
Premium parks initiatives
Increase tree cover to 10%
Rejuvenate of water towers
Protect, restore and promote sustainable use of terrestrial ecosystems, sustainably manage forests, combat desertification, and halt and reverse land degradation and halt biodiversity loss (Life on
Zoning and proper land use
Identify, document and protect endangered species through propagation and captive breeding
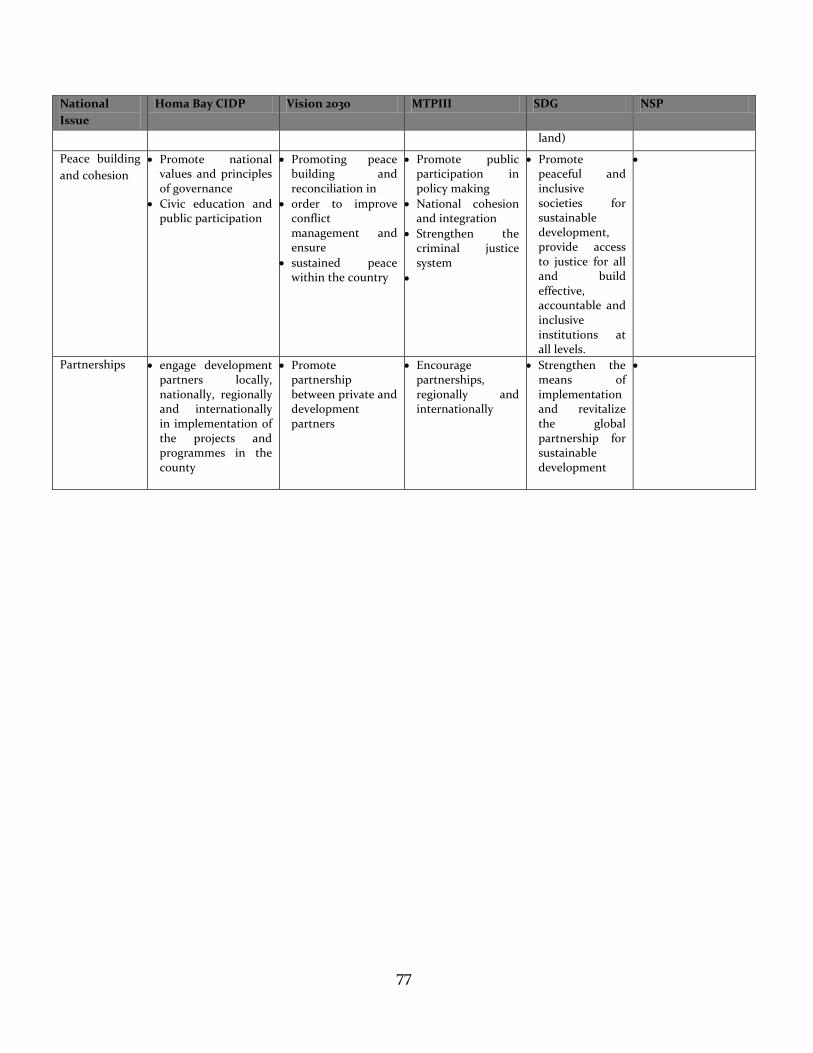
77
National
Issue
Homa Bay CIDP Vision 2030 MTPIII SDG NSP
land)
Peace building
and cohesion
Promote national values and principles of governance
Civic education and public participation
Promoting peace building and reconciliation in
order to improve conflict management and ensure
sustained peace within the country
Promote public participation in policy making
National cohesion and integration
Strengthen the criminal justice system
Promote peaceful and inclusive societies for sustainable development, provide access to justice for all and build effective, accountable and inclusive institutions at all levels.
Partnerships engage development partners locally, nationally, regionally and internationally in implementation of the projects and programmes in the county
Promote partnership between private and development partners
Encourage partnerships, regionally and internationally
Strengthen the means of implementation and revitalize the global partnership for sustainable development
78
CHAPTER THREE
REVIEW OF THE IMPLEMENTATION OF THE PREVIOUS CIDP
3.1 Introduction
The end term review of CIDP 2013-2017 presented achievements made against planned results and
assessed significant developments made during the five years of the CIDP 2013-2017 implementation.
This aimed at supporting the County administration in realizing the long-term county development
goals aligned to priority areas in the Kenya Vision 2030 and the Sustainable Development Goals
(SDGs), particularly “spurring and sustaining higher economic growth and reducing poverty” hence
providing progressive pathways in ensuring safe livelihoods and dignified living.
3.2 Status of Implementation of the CIDP 2013-2017
3.2.1 Analysis of the county Revenue Streams (equitable share, grants, own source revenue)
The combined county government budget approved by the County Assembly for FY 2013/2014, FY
2014/15, FY 2015/16 and FY 2016/17 amounts to Kshs. 22,742,308,866. The actual expenditure for the
period amounts to Kshs. 21,991,975,694, providing a variance of Kshs. 750,333,172.Table 22
providessynopsis of County Revenue analysis for FY 2013/14-2016/17.
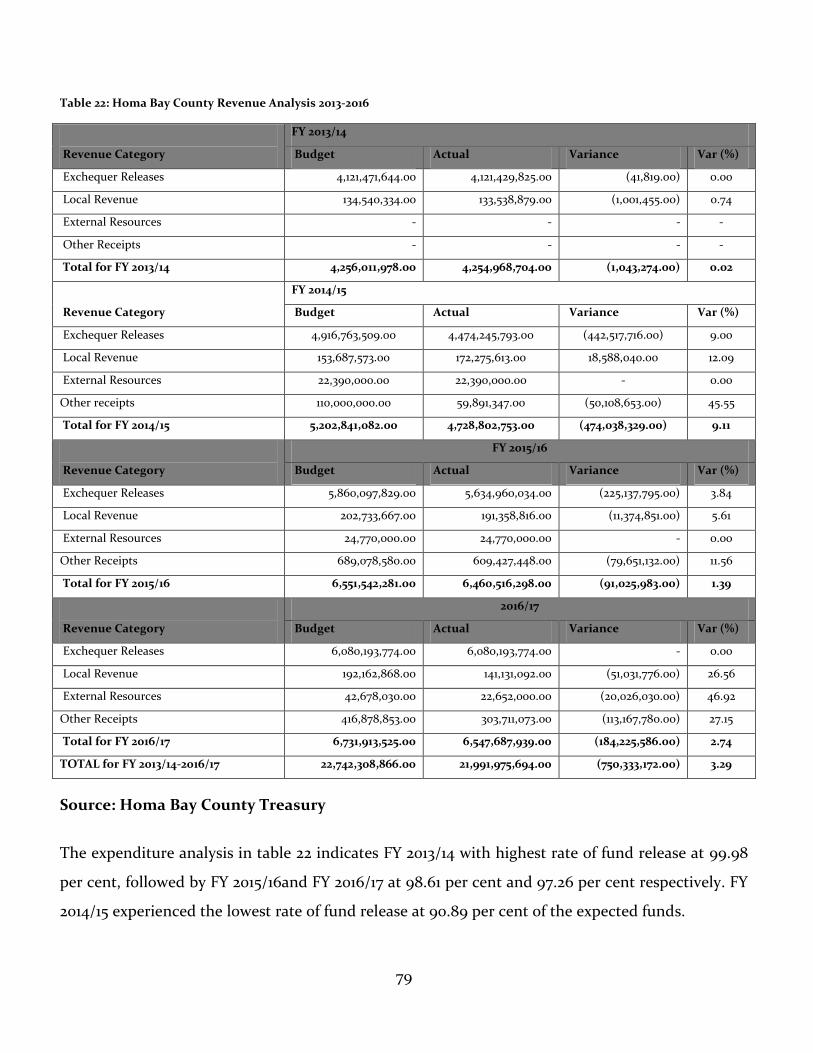
79
Table 22: Homa Bay County Revenue Analysis 2013-2016
Revenue Category
FY 2013/14
Budget Actual Variance Var (%)
Exchequer Releases 4,121,471,644.00 4,121,429,825.00 (41,819.00) 0.00
Local Revenue 134,540,334.00 133,538,879.00 (1,001,455.00) 0.74
External Resources - - - -
Other Receipts - - - -
Total for FY 2013/14 4,256,011,978.00 4,254,968,704.00 (1,043,274.00) 0.02
Revenue Category
FY 2014/15
Budget Actual Variance Var (%)
Exchequer Releases 4,916,763,509.00 4,474,245,793.00 (442,517,716.00) 9.00
Local Revenue 153,687,573.00 172,275,613.00 18,588,040.00 12.09
External Resources 22,390,000.00 22,390,000.00 - 0.00
Other receipts 110,000,000.00 59,891,347.00 (50,108,653.00) 45.55
Total for FY 2014/15 5,202,841,082.00 4,728,802,753.00 (474,038,329.00) 9.11
Revenue Category
FY 2015/16
Budget Actual Variance Var (%)
Exchequer Releases 5,860,097,829.00 5,634,960,034.00 (225,137,795.00) 3.84
Local Revenue 202,733,667.00 191,358,816.00 (11,374,851.00) 5.61
External Resources 24,770,000.00 24,770,000.00 - 0.00
Other Receipts 689,078,580.00 609,427,448.00 (79,651,132.00) 11.56
Total for FY 2015/16 6,551,542,281.00 6,460,516,298.00 (91,025,983.00) 1.39
Revenue Category
2016/17
Budget Actual Variance Var (%)
Exchequer Releases 6,080,193,774.00 6,080,193,774.00 - 0.00
Local Revenue 192,162,868.00 141,131,092.00 (51,031,776.00) 26.56
External Resources 42,678,030.00 22,652,000.00 (20,026,030.00) 46.92
Other Receipts 416,878,853.00 303,711,073.00 (113,167,780.00) 27.15
Total for FY 2016/17 6,731,913,525.00 6,547,687,939.00 (184,225,586.00) 2.74
TOTAL for FY 2013/14-2016/17 22,742,308,866.00 21,991,975,694.00 (750,333,172.00) 3.29
Source: Homa Bay County Treasury
The expenditure analysis in table 22 indicates FY 2013/14 with highest rate of fund release at 99.98
per cent, followed by FY 2015/16and FY 2016/17 at 98.61 per cent and 97.26 per cent respectively. FY
2014/15 experienced the lowest rate of fund release at 90.89 per cent of the expected funds.
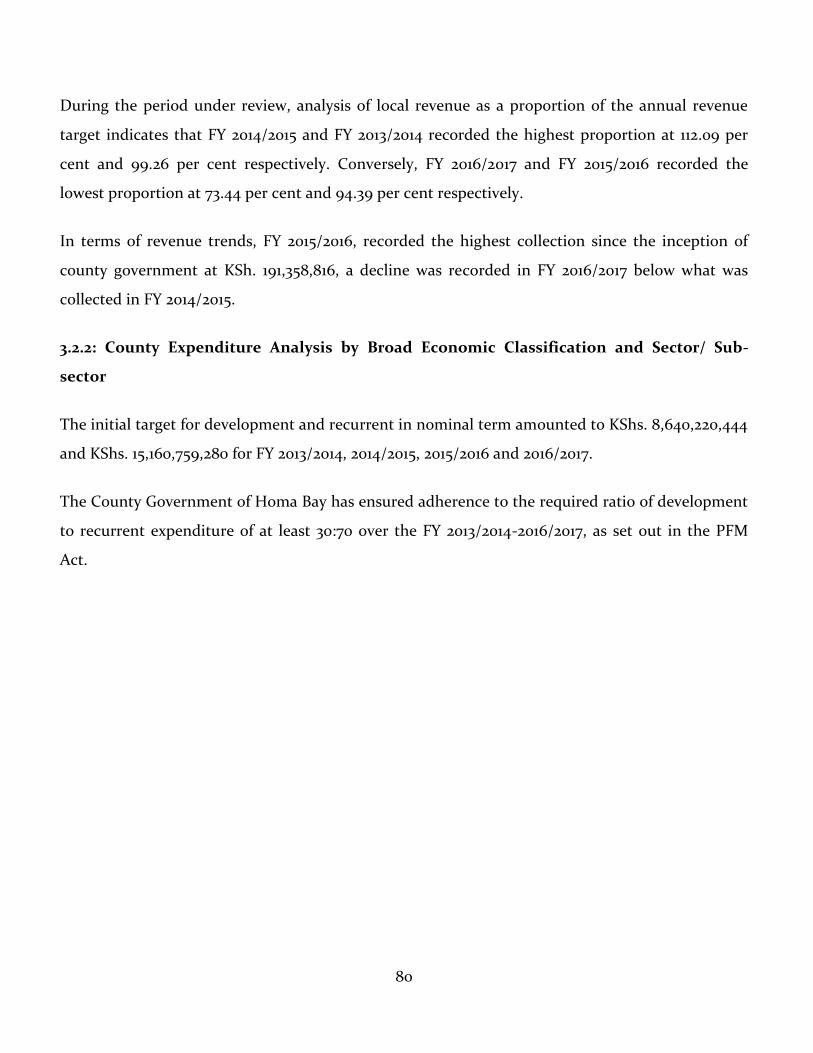
80
During the period under review, analysis of local revenue as a proportion of the annual revenue
target indicates that FY 2014/2015 and FY 2013/2014 recorded the highest proportion at 112.09 per
cent and 99.26 per cent respectively. Conversely, FY 2016/2017 and FY 2015/2016 recorded the
lowest proportion at 73.44 per cent and 94.39 per cent respectively.
In terms of revenue trends, FY 2015/2016, recorded the highest collection since the inception of
county government at KSh. 191,358,816, a decline was recorded in FY 2016/2017 below what was
collected in FY 2014/2015.
3.2.2: County Expenditure Analysis by Broad Economic Classification and Sector/ Sub-
sector
The initial target for development and recurrent in nominal term amounted to KShs. 8,640,220,444
and KShs. 15,160,759,280 for FY 2013/2014, 2014/2015, 2015/2016 and 2016/2017.
The County Government of Homa Bay has ensured adherence to the required ratio of development
to recurrent expenditure of at least 30:70 over the FY 2013/2014-2016/2017, as set out in the PFM
Act.
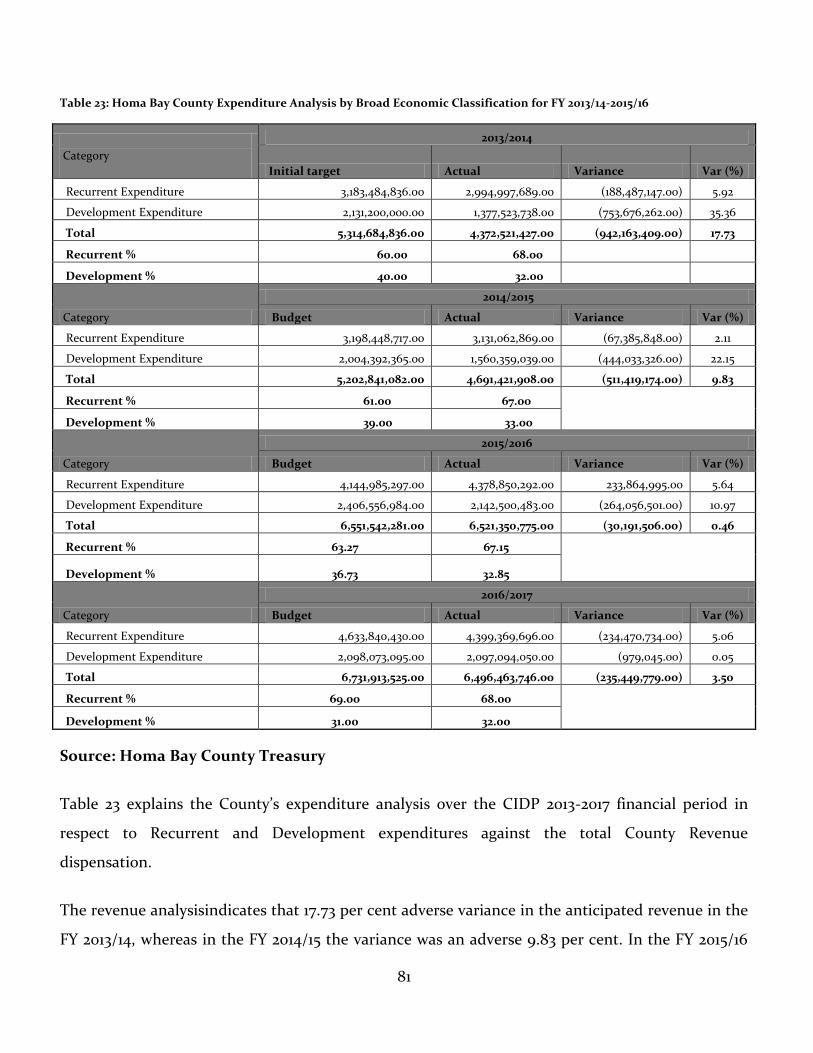
81
Table 23: Homa Bay County Expenditure Analysis by Broad Economic Classification for FY 2013/14-2015/16
Category
2013/2014
Initial target Actual Variance Var (%)
Recurrent Expenditure 3,183,484,836.00 2,994,997,689.00 (188,487,147.00) 5.92
Development Expenditure 2,131,200,000.00 1,377,523,738.00 (753,676,262.00) 35.36
Total 5,314,684,836.00 4,372,521,427.00 (942,163,409.00) 17.73
Recurrent % 60.00 68.00 Development % 40.00 32.00
Category
2014/2015
Budget Actual Variance Var (%)
Recurrent Expenditure 3,198,448,717.00 3,131,062,869.00 (67,385,848.00) 2.11
Development Expenditure 2,004,392,365.00 1,560,359,039.00 (444,033,326.00) 22.15
Total 5,202,841,082.00 4,691,421,908.00 (511,419,174.00) 9.83
Recurrent % 61.00 67.00 Development % 39.00 33.00
Category
2015/2016
Budget Actual Variance Var (%)
Recurrent Expenditure 4,144,985,297.00 4,378,850,292.00 233,864,995.00 5.64
Development Expenditure 2,406,556,984.00 2,142,500,483.00 (264,056,501.00) 10.97
Total 6,551,542,281.00 6,521,350,775.00 (30,191,506.00) 0.46
Recurrent % 63.27 67.15 Development % 36.73 32.85
Category
2016/2017
Budget Actual Variance Var (%)
Recurrent Expenditure 4,633,840,430.00 4,399,369,696.00 (234,470,734.00) 5.06
Development Expenditure 2,098,073,095.00 2,097,094,050.00 (979,045.00) 0.05
Total 6,731,913,525.00 6,496,463,746.00 (235,449,779.00) 3.50
Recurrent % 69.00 68.00 Development % 31.00 32.00
Source: Homa Bay County Treasury
Table 23 explains the County’s expenditure analysis over the CIDP 2013-2017 financial period in
respect to Recurrent and Development expenditures against the total County Revenue
dispensation.
The revenue analysisindicates that 17.73 per cent adverse variance in the anticipated revenue in the
FY 2013/14, whereas in the FY 2014/15 the variance was an adverse 9.83 per cent. In the FY 2015/16
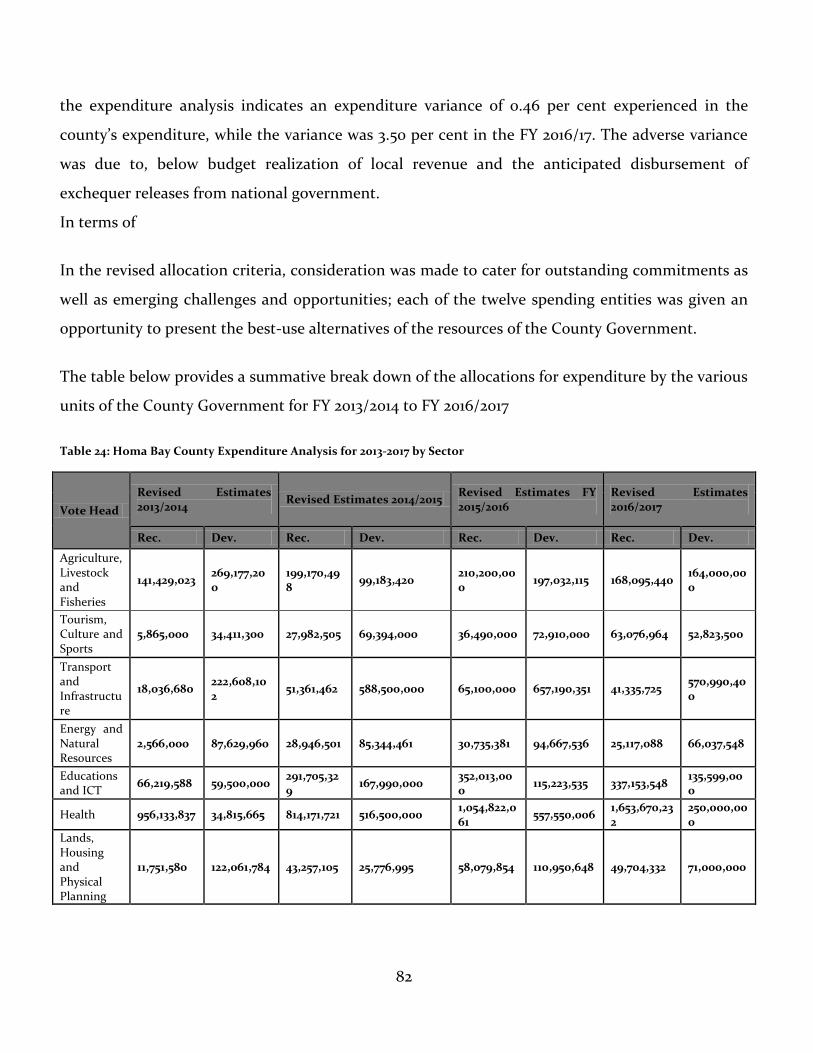
82
the expenditure analysis indicates an expenditure variance of 0.46 per cent experienced in the
county’s expenditure, while the variance was 3.50 per cent in the FY 2016/17. The adverse variance
was due to, below budget realization of local revenue and the anticipated disbursement of
exchequer releases from national government.
In terms of
In the revised allocation criteria, consideration was made to cater for outstanding commitments as
well as emerging challenges and opportunities; each of the twelve spending entities was given an
opportunity to present the best-use alternatives of the resources of the County Government.
The table below provides a summative break down of the allocations for expenditure by the various
units of the County Government for FY 2013/2014 to FY 2016/2017
Table 24: Homa Bay County Expenditure Analysis for 2013-2017 by Sector
Vote Head
Revised Estimates 2013/2014
Revised Estimates 2014/2015 Revised Estimates FY 2015/2016
Revised Estimates 2016/2017
Rec. Dev. Rec. Dev. Rec. Dev. Rec. Dev.
Agriculture, Livestock and Fisheries
141,429,023 269,177,200
199,170,498
99,183,420 210,200,000
197,032,115 168,095,440 164,000,000
Tourism, Culture and Sports
5,865,000 34,411,300 27,982,505 69,394,000 36,490,000 72,910,000 63,076,964 52,823,500
Transport and Infrastructure
18,036,680 222,608,102
51,361,462 588,500,000 65,100,000 657,190,351 41,335,725 570,990,400
Energy and Natural Resources
2,566,000 87,629,960 28,946,501 85,344,461 30,735,381 94,667,536 25,117,088 66,037,548
Educations and ICT
66,219,588 59,500,000 291,705,329
167,990,000 352,013,000
115,223,535 337,153,548 135,599,000
Health 956,133,837 34,815,665 814,171,721 516,500,000 1,054,822,061
557,550,006 1,653,670,232
250,000,000
Lands, Housing and Physical Planning
11,751,580 122,061,784 43,257,105 25,776,995 58,079,854 110,950,648 49,704,332 71,000,000
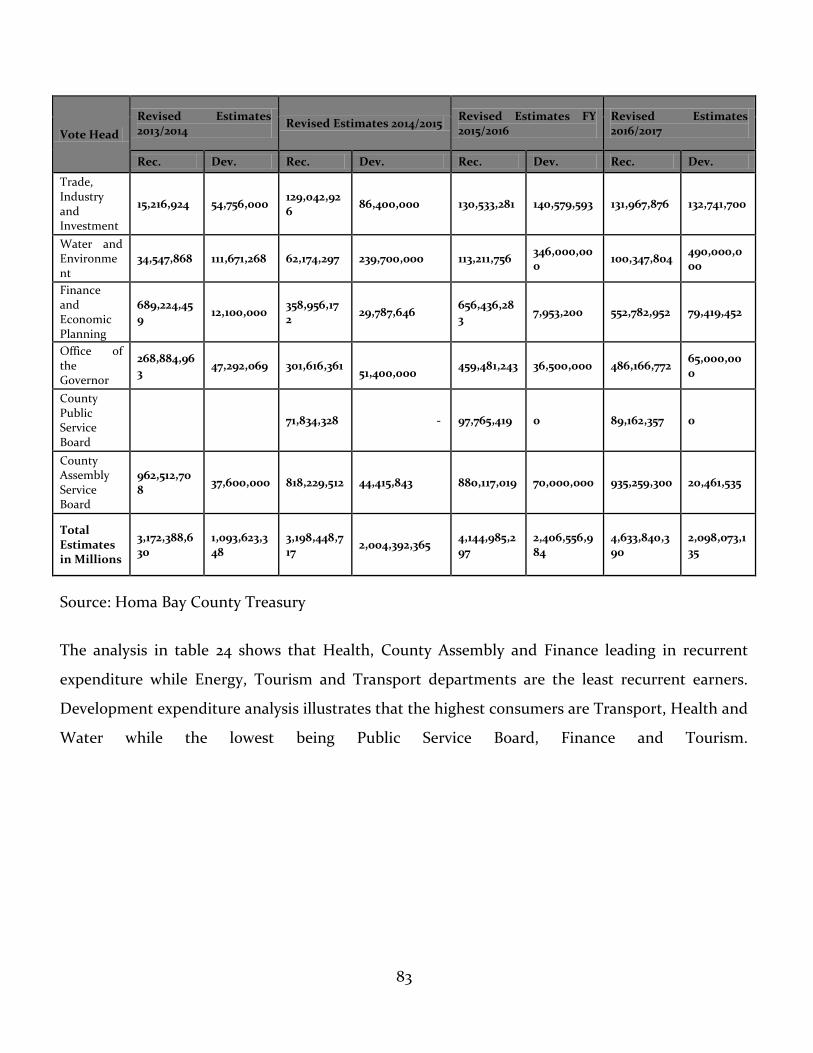
83
Vote Head
Revised Estimates 2013/2014
Revised Estimates 2014/2015 Revised Estimates FY 2015/2016
Revised Estimates 2016/2017
Rec. Dev. Rec. Dev. Rec. Dev. Rec. Dev.
Trade, Industry and Investment
15,216,924 54,756,000 129,042,926
86,400,000 130,533,281 140,579,593 131,967,876 132,741,700
Water and Environment
34,547,868 111,671,268 62,174,297 239,700,000 113,211,756 346,000,000
100,347,804 490,000,000
Finance and Economic Planning
689,224,459
12,100,000 358,956,172
29,787,646 656,436,283
7,953,200 552,782,952 79,419,452
Office of the Governor
268,884,963
47,292,069 301,616,361 51,400,000
459,481,243 36,500,000 486,166,772 65,000,000
County Public Service Board
71,834,328 - 97,765,419 0 89,162,357 0
County Assembly Service Board
962,512,708
37,600,000 818,229,512 44,415,843 880,117,019 70,000,000 935,259,300 20,461,535
Total Estimates in Millions
3,172,388,630
1,093,623,348
3,198,448,717
2,004,392,365 4,144,985,297
2,406,556,984
4,633,840,390
2,098,073,135
Source: Homa Bay County Treasury
The analysis in table 24 shows that Health, County Assembly and Finance leading in recurrent
expenditure while Energy, Tourism and Transport departments are the least recurrent earners.
Development expenditure analysis illustrates that the highest consumers are Transport, Health and
Water while the lowest being Public Service Board, Finance and Tourism.
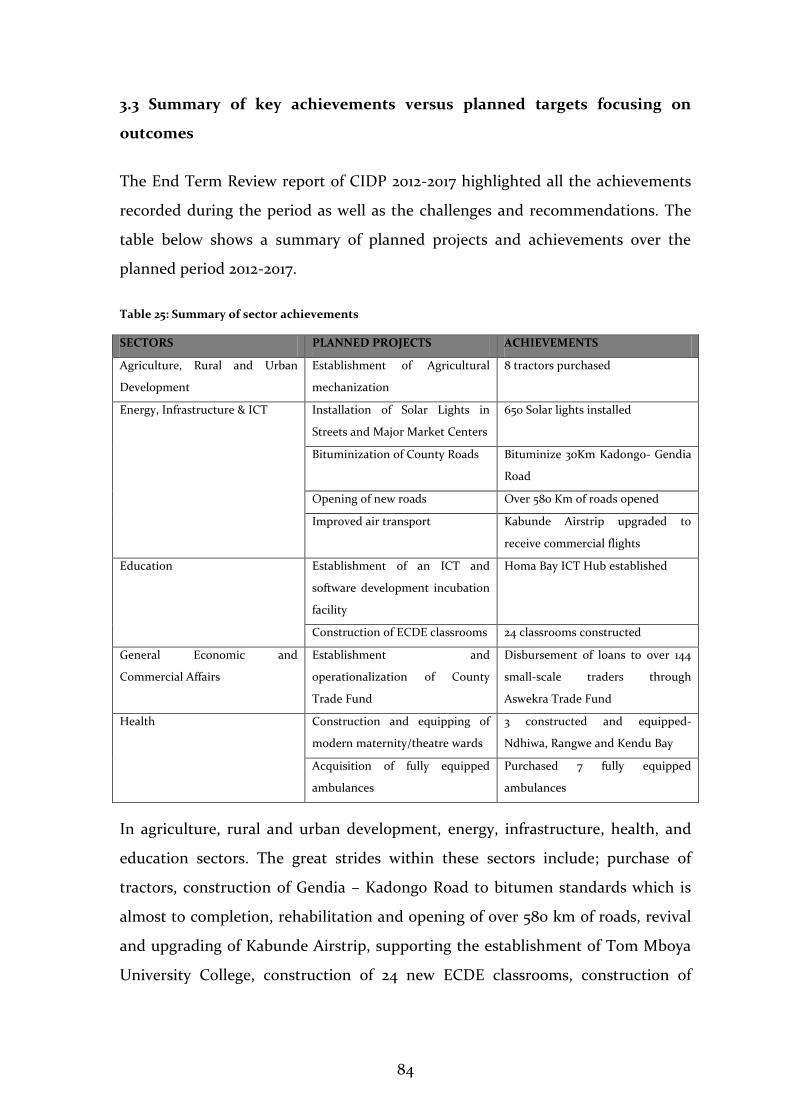
84
3.3 Summary of key achievements versus planned targets focusing on
outcomes
The End Term Review report of CIDP 2012-2017 highlighted all the achievements
recorded during the period as well as the challenges and recommendations. The
table below shows a summary of planned projects and achievements over the
planned period 2012-2017.
Table 25: Summary of sector achievements
SECTORS PLANNED PROJECTS ACHIEVEMENTS
Agriculture, Rural and Urban
Development
Establishment of Agricultural
mechanization
8 tractors purchased
Energy, Infrastructure & ICT Installation of Solar Lights in
Streets and Major Market Centers
650 Solar lights installed
Bituminization of County Roads Bituminize 30Km Kadongo- Gendia
Road
Opening of new roads Over 580 Km of roads opened
Improved air transport Kabunde Airstrip upgraded to
receive commercial flights
Education Establishment of an ICT and
software development incubation
facility
Homa Bay ICT Hub established
Construction of ECDE classrooms 24 classrooms constructed
General Economic and
Commercial Affairs
Establishment and
operationalization of County
Trade Fund
Disbursement of loans to over 144
small-scale traders through
Aswekra Trade Fund
Health Construction and equipping of
modern maternity/theatre wards
3 constructed and equipped-
Ndhiwa, Rangwe and Kendu Bay
Acquisition of fully equipped
ambulances
Purchased 7 fully equipped
ambulances
In agriculture, rural and urban development, energy, infrastructure, health, and
education sectors. The great strides within these sectors include; purchase of
tractors, construction of Gendia – Kadongo Road to bitumen standards which is
almost to completion, rehabilitation and opening of over 580 km of roads, revival
and upgrading of Kabunde Airstrip, supporting the establishment of Tom Mboya
University College, construction of 24 new ECDE classrooms, construction of
85
modern maternity wards at Ndhiwa, Kendu and Rangwe Level 4 Hospitals and
installation of 650 market lights in all the 40 wards.
In terms of increased access to market opportunities, the county government has
trained and provided loans to over 144 small-scale traders through the Aswekra
Trade Fund administered by the Department of Trade, Industrialization,
Investment and Cooperatives Development. Trading has also been stimulated and
income poverty addressed among over 2,000 vulnerable women and youths who
have benefited from 1,014 assorted Economic Stimulus Program (ESP) equipment
donations including water pumps, car washing machines, welding machines,
brick-making machines and salon equipment which were acquired and distributed
to them.
3.4 Challenges in the implementation of the CIDP 2013-2017.
There are various major setbacks that have slackened the implementation of
County Integrated Development Plan (CIDP, 2013-2017) hence making it difficult
to realize all the set targets within the planned framework. Some of the most
urgent challenges to be looked at included:
3.4.1 Financial Constraints
Delayed and irregular disbursement of funds from national government; Lack of
clear guidelines on funding mechanisms for sector programs; High wage bill; non-
performing revenue generation streams and weak resource of mobilization
strategies.
3.4.2 Human Resource Constraints
During the implementation of the first CIDP, human resource related challenges
included: understaffing in key technical departments; lack of performance
contract between the supervisors and lower cadre staff; limited requisite skills
among some county employees; no succession plans; lack of harmonized pay
structure and limited opportunities for refresher courses.
86
3.4.3 Technical Challenges
Technical and operational constraints during the period under review were:
Inadequate asset maintenance plan; lack of spatial development plans; poor
operational coordination among departments; unreliable IFMIS; inefficient
monitoring, evaluation and reporting structures and systems; limited involvement
of all stakeholders and technical staff in project formulation, costing,
implementation as well as reporting; limited financial and project management
skills among various implementers.
3.4.4 Political Challenges
Political challenges during the period under review included: inadequate enabling
policy and legislative framework to fully support CIDPimplementation as well as
regulations to operationalize existing actsand ineffective public participation and
competing interest by political players in prioritizing and distributing
development projects across the county.
Some challenges however emerged as cross-cutting issues and these include:
High poverty levels and incidences across the county, partly contributed by
high rate of youth unemployment and low agricultural productivity as well
as limited trade and enterprise development;
High prevalence of HIV/AIDS with Homa Bay County leading country-wide
with HIV prevalence of 26.9%;
Gender inequality;
Environmental degradation and climate change, and;
Inadequate use of ICT and disaster management.
These are the challenges that if progress is to be made across all the sectoral
development plans and within the next planned time frame under review, and
then there is need to take key note in addressing them.
87
3.5 Lessons Learnt
For Homa Bay County to realize its optimal set targets as previously envisioned,
the sectors have embarked on solving the challenges experienced during the first
term of CIDP, 2013 – 2017 implementation. The major lessons learnt and noted
include:
For effective implementation of the CIDP, focus should be put on planning
and implementing key flagship projects and programmes that are within
the county mandate and have high impact to the community;
Going forward, and in accordance of the need to fulfill the vision of the
Kenya Constitution 2010 on separation of powers, roles, responsibilities
while promoting inter-governmental relations, it is expected that the
current CIDP will focus on key priority projects in line with the aspirations
of the citizens of Homa Bay County. Key sectors will include: Water,
Health, Infrastructure, Agriculture and Education.
There is need to strengthen and operationalize County Monitoring and
Evaluation structure and system;
Need to enact requisite policies, laws and regulations to enhance service
delivery;
3.6 Recommendations
For effective implementation and transformations envisioned for the County, the
crucial interventions that need to be prioritized include:
The county government should seek collaboration with the Kenya National
Bureau of Statistic to provide updated statistics relevant to the county’s
development planning. This will help to firm-up M&E Framework to have a
track able outputs, outcome and impact level indicators and related
baselines and targets for future planned projects;
The sectors should focus on key major flagship projects and programmes
with high impact to the community and the County at large. Bloated and
88
ambitious projects should thus be avoided instead high priority list of very
significant development projects with direct, sustainable and replicable
impacts on the citizens will be given priority in the CIDP, 2018 – 2022.
Improve civic education and efficient public participation to ensure
effective and meaningful citizen involvement in project selection, project
development, implementation, monitoring, evaluation and reporting;
Develop a Resource Mobilization Strategy that takes into account major
sources of revenue, exchequer funds, donor funds and investors’ portfolios;
There is urgent need to recruit additional staff to fill in the key vacant
positions, especially in the departments where prioritized flagship projects
are to be domiciled and provide regular training for the low cadre staff to
enhance efficiency in service provision.
The County Government of Homa Bay should incorporate and register a
private investment and development company to be known as “Homa Bay
County Investment and Development Corporation”.
3.7 ANALYSIS OF CIDP 2013-2017 IMPLEMENTATION BY SECTOR
This section analyses the implementation of the first CIDP 2013-2017 in all the 13
spending entities.
3.7.1 AGRICULTURE, RURAL AND URBAN DEVELOPMENT SECTOR
Over the review period, overall output and food security has been improved
thereby reducing food prices and dependency on food imports through
implementation of pro-poor interventions that saw many smallholders rip good
yields.
Under Livestock development, poultry production and income from poultry
farming has more than doubled since 320 chicken incubators were distributed to
women and youth enterprise groups across the county and construction of
slaughter house in Homa Bay.
89
Farm productivity and area under cultivation have increased significantly with
farmers having been supported to acquire certified seeds, distribution of
subsidized fertilizer from the National Government through the National Cereals
and Produce Board and acquisition of 8 tractors (1 per sub-county) to speed up
agricultural mechanization and minimize the cost of land preparations. Already
more than 13,000 acres of farm land have been ploughed under this mechanization
scheme. The county government also managed to construct 20 water harvesting
structures.
Under Fisheries, farmed fish production has expanded significantly since 160 fish
ponds were constructed and stocked as part of strategy to promote fish farming
and ease pressure on Lake Victoria. Improvement of fish landing sites, and
promotion of farmed fish production which have improved compliance with good
food handling practices and increased farmers income.
Under Lands, Housing, Urban and Physical Planning Development, the sub-sector
rolled out the preparation of the county spatial plan as well as set up a land bank
for various investment projects in all the 8 sub-counties including for the County
Headquarter, Gor Mahia Stadium, Animal Feeds and Sweet Potato Processing
Plants. It also managed to successfully complete urban development plans for
Homa Bay and Rangwe Towns; develop an inventory of and fenced 5 No. public
parcels of land across the county including Oriang Estate, County Headquarters
and Kabondo parcels; survey and demarcate markets in various parts of the
county; facilitate adjudication processes leading to accelerated titling of untitled
lands; and resurveying and parcellation of KakeloKamroth leading to 1,700 title
deeds being issued.
3.7.1.1 Challenges
Despite the progress made in the sector of Livestock, Fisheries, Agriculture and
Food security, Lands, Housing and Physical Planning, the following challenges
hampered the implementation of the projects:
90
Inadequate and late release of funds for the implementation of the sectoral
activities.
Weak monitoring surveillance and control (MCS) of lake fisheries activities
Inadequate/poor irrigation infrastructure
High poverty levels, high cost of production, pests and diseases resulting
into poor food security
Lack of legal framework to regulate housing functions in the county
Under-investment in lower and middle cost housing by both the public and
private sector
Inadequate human resource capacity due to low staffing levels and lack of
staff trainings.
Inadequate public-private partnerships due to lack of a comprehensive PPP
framework
Lack of guidelines to harmonize leasing of government offices and
residential accommodation leading to wasted space
Low adoption of technologies arising from high cost of production inputs.
Inadequate facilitation to extension service delivery.
Erratic weather patterns.
3.7.1.2 Lessons Learnt
These are some of the lessons learnt during the implementation of the various
activities in the sector:
Drought tolerant crop varieties are important in mitigating adverse effects
of drought and should be promoted to contribute to food security in the
county.
There is need for routine surveillance of pests and diseases e.g. through
use of pheromone traps.
Water hyacinth prohibits fishing in most fishing landing sites within the
gulf and it also alters the status of the lakeshores thereby hindering fish
breeding of some fish species.
91
There is need for the sector to strengthen its capacity for surveillance and
control of illegal fishing
Prices of fish farming inputs and fishing gears are high and unaffordable to
most farmers/fishermen.
Provision of farm inputs has the potential of increasing agricultural
productivity and enhancing food security.
Collaboration with other development partners e.g. JICA leads to faster
implementation of project activities.
3.7.1.3 Recommendations
The following are some recommendations to enable the implementation of the
various planned activities for the sector:
Increasing market access through establishment of information boards and
desks, announcing of market prices through radio and lobbying for opening
and grading of roads leading to agricultural corridors; promote sustainable
land use and environmental conservation;
Intensifying provision and improving availability of subsidized inputs and
technologies for greater productivity in agriculture;
The County needs to pursue the National strategy of introducing Climate
Smart Agriculture to improve on the already existing County drought strategy
on crop farming;
Fast track the use of already purchased water hyacinth machine procured by
the National government and continue training BMUs on rearing water
hyacinth weevils to help in eradication of the weed;
Development of policies, plans and legislation on land use for proper land
management and developing and publishing of a county master plan for
housing and urban development;
There is need for the sector to strengthen its capacity for surveillance and
control of illegal fishing and;
Land adjudication, titling and title management should be strengthened to
make the land owners optimize the use of their lands.
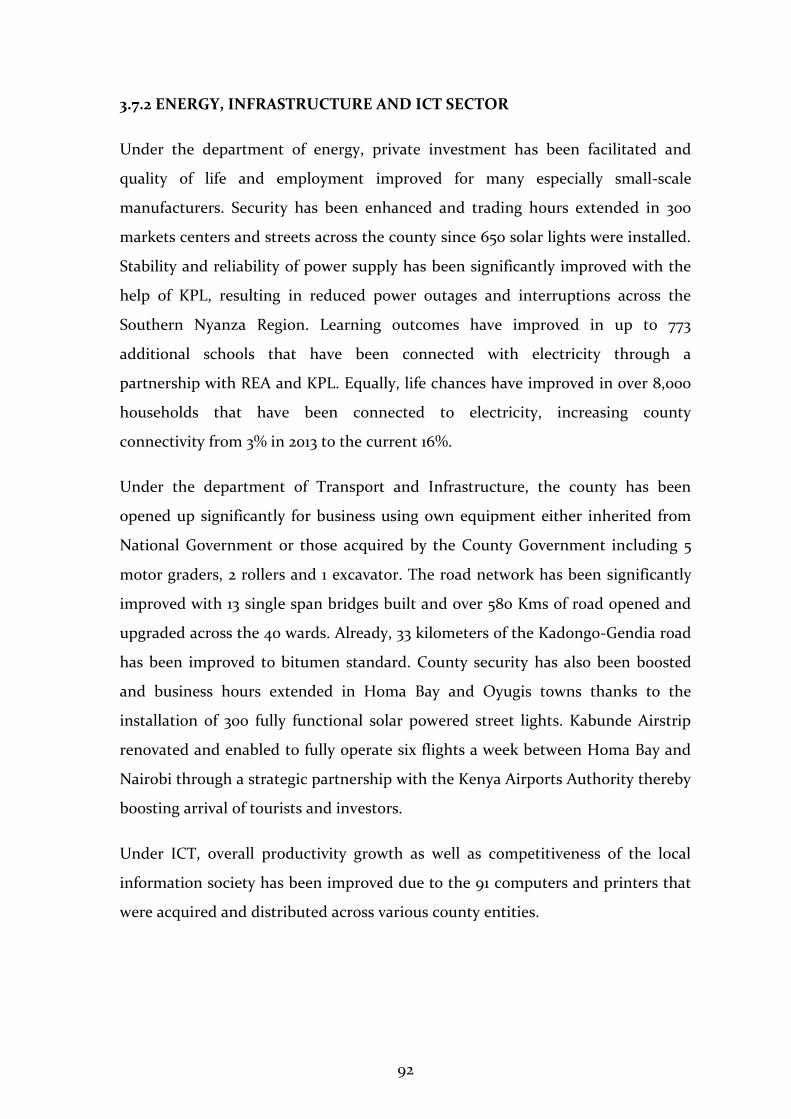
92
3.7.2 ENERGY, INFRASTRUCTURE AND ICT SECTOR
Under the department of energy, private investment has been facilitated and
quality of life and employment improved for many especially small-scale
manufacturers. Security has been enhanced and trading hours extended in 300
markets centers and streets across the county since 650 solar lights were installed.
Stability and reliability of power supply has been significantly improved with the
help of KPL, resulting in reduced power outages and interruptions across the
Southern Nyanza Region. Learning outcomes have improved in up to 773
additional schools that have been connected with electricity through a
partnership with REA and KPL. Equally, life chances have improved in over 8,000
households that have been connected to electricity, increasing county
connectivity from 3% in 2013 to the current 16%.
Under the department of Transport and Infrastructure, the county has been
opened up significantly for business using own equipment either inherited from
National Government or those acquired by the County Government including 5
motor graders, 2 rollers and 1 excavator. The road network has been significantly
improved with 13 single span bridges built and over 580 Kms of road opened and
upgraded across the 40 wards. Already, 33 kilometers of the Kadongo-Gendia road
has been improved to bitumen standard. County security has also been boosted
and business hours extended in Homa Bay and Oyugis towns thanks to the
installation of 300 fully functional solar powered street lights. Kabunde Airstrip
renovated and enabled to fully operate six flights a week between Homa Bay and
Nairobi through a strategic partnership with the Kenya Airports Authority thereby
boosting arrival of tourists and investors.
Under ICT, overall productivity growth as well as competitiveness of the local
information society has been improved due to the 91 computers and printers that
were acquired and distributed across various county entities.
93
3.7.2.1 Challenges
.
The main challenges faced during implementation of the 2013 – 2017 CIDP
included:
Very low budget allocation which constrained the department’s ability to
effectively leverage funding from the national government institutions in
the energy sector such as KPLC, REA, GDC, etc. These institutions often
required matching funds in order to expand and extend some of their
projects such as installation of new transformers, electricity connection,
street lighting, etc. to areas desired by the County. This also hindered the
establishment of a framework for collection of data that can be availed to
potential investors interested in projects of power generation and mineral
exploitation;
The department was seriously under established, with no technical
personnel to undertake critical responsibilities in the energy and mining
sector respectively hence much of the technical was undertaken by hired
consultants;
The cost of power connection is too high given the high level of poverty in
the region. Much as they would like to have power, most people cannot
afford to pay for power connections or purchase a solar lamp;
There exists inadequacy of resources to invest in electricity generation,
transmission, distribution lines and associated infrastructure;
Existence of weak legal, regulatory, policy and institutional frameworks for
energy resources exploration, development and exploitation;
Emergence of Vandalism of streetlights, guard rails and road signs;
Territorial conflicts in distinction between the national roads and county
roads are yet to be made hence creating conflict between the national and
county governments;
Dynamics in road classification creating confusion between the national
and county governments responsibilities;
94
Inadequate policies, legislations, standards and guidelines to mainstream
ICT usage in the county;
Inadequate funding to operationalize newly created institutions and
implementation of key priority/flagship projects, and promotion of
Research in ICT for development and;
Inadequate policies and legislations supporting sectoral development.
3.7.2.2 Lessons Learnt
These are some of the lessons learnt during the implementation of the various
activities in the sector:
Energy is one of the concurrent functions under schedule four of the
constitution. However, the budget process both at the National and
County Government levels does not appreciate the role which the county
should play. The bulk of the budget is allocated to the national energy
institutions yet the same institutions expect the County Government to
allocate matching funds in order to participate in collaboration efforts
between the two levels of government;
Homa Bay County is richly endowed with several mineral resources.
However, no resources have been allocated towards the collection of data
which can be presented to potential investors who have shown interest in
exploration and exploitation of the minerals;
Centre for Research and ICT hub is a requirement to enhance
connectivity across the sectors;
An integrated infrastructure master plan for the department needs to be
developed
Policies and regulations are necessary for the performance of the sector;
Contractual/tender awards processes should be fastened and;
Emergency Fund should be established to cushion unforeseen
circumstances.
3.7.2.3 Recommendations
95
The following are some recommendations to enable the implementation of the
various planned activities for the sector:
There is need to recognize the role of the county government in the energy
sector and allocate funds in the budget which can be used to influence
programs of the national government institutions towards the county’s
priorities;
The County budget process should support the establishment of a
comprehensive data collection and maintenance framework which can be
used to facilitate investor decisions in the energy and mining sectors;
The department of energy and mining should be strengthened by
establishing key technical positions to effectively support its operations and
service delivery.
Fast tracking negotiations with the National Government to classify and
identify the county government roads;
Timely legislation and policies should be put in place to support the
sectorial development;
Sensitization of the general public against vandalism of street lights, guard
rails and road signs and prosecution of the culprits;
The transport and infrastructure sub sector should be provided with
adequate resources as they implement key programs;
Due to the large capital requirement to implement sector projects, a public
private partnership framework should be developed to synergize the
departmental budget and;
Provision of special resources for maintenance/rehabilitation and
development of key transport infrastructure.
3.7.3 GENERAL ECONOMIC AND COMMERCIAL AFFAIRS SECTOR
Under Trade, Industry, Cooperatives and Enterprise Development sub sector the
knowledge base and capacity of small businesses has been expanded with over
96
2179 small-scale traders having been trained and provided with loans. The sub
sestor has establisheed an upgrade of upto 56 small markets and 1 modern market;
relocated market business community of Oyugis Market to Masogo open market;
upgraded, fenced, constructed toilets and relocated market community of
Nyakwere market for the construction of the modern market; developed relevant
Homa Bay County Trade Fund and Alcoholic drink control Acts; facilitated the
formation of 25 new cooperatives and revamped 20 dormant cooperative society;
disbursed revolving funds to 7 active cooperative societies and Inspected 35
societies; carried out 12 feasibility studies on value chain.
In addition, it has established joint venture pilot project with Homa Bay SG for
potato processing plant which supplies potato puree to our major Supermarkets in
Kenya; Commenced construction of animal feeds Factory, in Homa-Bay town west
ward , Arujo (60% complete); Procured equipment for animal feeds and cotton
ginning machines; established maize processing plant (construction is at 40% and
machineries have been supplied) and Initiated construction of a cassava
processing plant and Multi fruit processing plant both in Rangwe sub County. The
department initiated the Homa Bay County Industrial park at Riwa in
collaboration with EPZA and was able to procure a small cotton ginning machine;
the department convened the first Homa Bay International Investment
Conference in which 30 Investment MOUs were signed; developed The Homa-Bay
County Investment blue print. In addition, the Department was able to procure
and issue 1,076 No given youths and women. Varied economic stimulus project
equipment, which included; water pumps; car washing machines; welding
machines; brick-making machines; and salon equipment to 1200 beneficiaries
from identified women and youth groups were distributed to youth and women
groups.
Challenges
The main challenges faced during implementation of the 2013 – 2017 CIDP
included:
97
Existence of weak legal regulatory policy and institutional frameworks for
cooperative societies;
There has been a generally high upfront investment costs in establishing
factories;
Inadequate baseline survey and statistical data on existing business entities;
Timely implementation of projects has been affected by long and slow
procurement procedures;
There has existed low appreciation of SME as an alternative to wage
employment and;
Inadequate infrastructure to support business development and unreliable
and high cost of power pose a major challenge to investment and industrial
development.
3.7.3.1 Lessons Learnt
These are some of the lessons learnt during the implementation of the various
activities in the sector:
Capital intensive projects need Public Private Partnership frameworks;
Successful implementation of plans involves planning for few projects that
can be implemented to completion within the planned period and;
Inadequate skills and basic financial knowledge among small and medium
entrepreneurs, hampers growth of businesses.
3.7.3.2 Recommendations
The following are some recommendations to enable the implementation of the
various planned activities for the sector;
98
Engage in Public Private Partnership frameworks and focus on creating
investment opportunities rather than establishing government own
businesses;
Fast track enactment of Homa Bay County Cooperative Society Act and other
relevant legislations and policies for the Sub Sector;
Carry out a business survey to generate baseline indicators for planning
purposes;
Increase resource allocation for the Sub Sector to at least 8% of the County
budget;
Support small and medium entrepreneurs to scale up their business by
providing financial training and affordable loans;
Need to create and strengthen relevant institutional frameworks to ensure
implementation of Strategic Investment Policy;
The energy sector should provide for cheap and reliable power;
Increase allocation for the Sub Sector to at least 2% of the County budget;
Fast track enactment of relevant legislations and policies;
Need for the County to enhance investor mobilization and;
During the planning process, there is need to develop baseline indicators.
3.7.4 HEALTH SERVICES
The sector had various key notable achievements during the period 2013-18
including procurement of drugs and non-pharmaceuticals for all gazetted health
facilities(260); recruitment of 711 additional health personnel; construction of
modern maternity wards in Ndhiwa, Rangwe and Kendu Bay sub county hospitals;
renovation of part of County referral hospital, establishment of 1 satellite MTCs in
Oyugis; implementation of the Community Health Strategy, recruitment of 2147
99
CHWs in the process; procurement of digitized medical equipment including
renal and dialysis machines, x-rays, CT scan and ultra-sound machines;
construction of 5 staff houses, construction of 4 general wards, purchase of 7 fully
equipped ambulances in collaboration with partners; purchase of 2 hospital
generators and establishment of 14 WASH facilities in the county. The sector
established green energy (solar energy) in 11 facilities with the support of partners.
3.7.4.1 Challenges
These are the some of the challenges experienced during the programme
implementation in this sector:
Trends in health outcomes that undermine the health system responsible
including communicable diseases on HIV/AIDS prevalence rate, the co-
infection of HIV/AIDS and TB coupled with the emergence of drugs resistant
strains of TB pose serious problem to the sector;
There is inadequate budgetary provision for the procurement and distribution
of strategic commodities of the public health importance from the exchequer,
of which cause of financial capacity to operationalize the proposed new
structure at the county;
Access to ARVs and the adherence by the patients causes challenges that need
to be addressed;
Weakness in resource allocation and use of weak linkage between policy
making, planning and budgeting process and little relationship between
budget as formulated and budget executed;
Knowledge gaps amongst health workers, ageing, and unequal distribution of
health work force in different parts of the county and wards;
The management of pension which is still a national function and transitioning
to the county Pension. This has affected the transfer of services between two
levels of government;
Inadequate and skewed distribution of available infrastructure within the
sector institutions with a strong bias towards the urban areas and;
100
Inadequate collaboration with other line departments in health activities
implementation.
3.7.4.2 Lessons Learnt
The following are some of the lessons learnt during the implementation of the
projects for the sector:
It is possible to develop a county health team spirit through a collective,
inclusive, participatory process of institutional and organizational restricting
of the management of the health services;
A situation analysis enables the sector to acknowledge their strengths and
weakness with evidence-based documentation that will be used to measure
progress;
The bottom approach needs to be complemented by top-down support and
guidance from the county for functional integration to be successful and;
Collaboration and integration of activities with other sectors like Education,
Water and Roads is key to achievement of health targets.
3.7.4.3 Recommendations
The sector suggested the following recommendation to help improve in the sector
implementation of the programmes:
There is need to continue channeling more resources to communicable
diseases as they still account for the highest proportion of the diseases burden
in the county;
Strengthen the coordination and partnership for maternal health, child,
neonatal and adolescences related interventions, especially between the
national and county levels as well as with other partners to achieve efficiency
in use of resources;
The county needs to strengthen health system for control and management for
non-communicable diseases and injuries by giving more focus to health
101
prevention and promotion related interventions to reduce the cost of care of
these conditions and ensure sustainability;
The sector should address establishment of e-health hubs, flagship projects in
the next CIDP since it holds a huge potential in spurring growth in the county;
The sector should continue exploring and identifying innovative ways of
increasing health infrastructure and equipment of the health facilities to
ensure that there is equity in accessing services especially areas that hitherto
not well served;
Health sector should continue with measures that are addressing challenges of
skewed distribution of skilled health workers across the county through
appropriate human resource policies and strategies including issues related to
promotion;
The issue of high pending bills should be focused on by ensuring timely
allocation and strict adherence to the procurement rules;
There is need to strengthen leadership and structures in the sector to meet the
ever-emerging requirements brought by devolution and;
There is need to strengthen collaboration with other line departments such as
education, agriculture, social protection and water since they play a key role in
the nutritional status of the population.
3.7.5 EDUCATION SECTOR
During the period under review the department of Education and ICT flagship was
on Human Resource establishment and soft skill development. The ECDE section,
was able to develop a clear structure: ECDE Director and ECDE Deputy Director,
Quality Assurance officers, 40 supervisors and 8 ECDE sub-county directors. The
county has also employed on contract 1,319 ECDE teachers. The teachers havebeen
deployed at least one in the 876 ECDE centres in the county. The county supplied
teaching learning materials to all public ECDE learning centres, worth 5 million.
This has enabled the number of ECD pupils to increase from 20,000 in 2013 to
86,859 by the end of 2017, a percentage increase 0f 400%. Under wash programme
the county was able to partner with Vestagaard and Replenished International to
102
supply 2,020 water purifiers to 424 ECDE schools, enabling over 40,000 ECDE
pupils to access clean drinking water, hence reducing water-borne diseases. The
department was able to lobby with community and partners to introduce feeding
programme in some schools. On infrastructure, the county was able to complete
217 ECDE classes, 24 done by the county government, while 193 done by our
development partners (Education Effect, Plan International, World Vision,
Safaricom, Action Aid, Child Fund and SOS). Nine model ECDE centres, One built
at Arunda by UNICEFand Child Fund , the other 8 by Education Effect.
On Vocational Education and Training, the county government managed to
recruit 139 VTC instructors to its 26 vocational Training Centers.Developed a
structure comprising of director, deputy director, 8 sub-county directors,
institution managers and instructors. Supplied tools and equipment to 3
Vocational Training Centers namely; Waondo, Nyagwethe and Mfangano in
partnership with Kenya Italian Development Programme(KIDDP); supplied tools
and equipment to Homa Bay and Oriwo VTCs in partnership with Ministry of
Education Science and Technology; supplied tools and equipment to Oriwo,
Jwelu, Sibuor and Omiro VTCs in partnership with StichtingGered Gereedschap
from Netherlands. The county supplied tools and equipment worth 1.5 million. On
capacity building for our instructors, KIDDP sponsored instructors for various
courses at KTTC; Capyei, sponsored instructors on competency teaching and
British Council sponsored on social enterprise development. On infrastructure,
the county was able to build one hostel at Sero, one workshop at Kotora, two at
Rangi, four door toilet at Homa Bay VTC. Our partners KIDDP, constructed two
hostels at Nyagwethe worth 17 million and twin workshop, power house, toilets
and fencing at Mfangano VTC at a cost of 18 million. Franco (Italian Partner) also
sponsored septic tank at Nyagwethe
Under ICT the county was able to establish and equip two innovation hubs at
Homa Bay and Mbita sub-counties.Connected office of the Governor with
networking structured cabling (LAN); developed county website; developed
County ICT Road mapand supported revenue automation in the department of
Finance. The department partnered with ICT authority to stall the fiber optic
103
under County Connectivity (CCP) Programme and received 30 computers. Overall
productivity growth as well as competitiveness of the local information society has
been improved due to the 91 computers and printers that were acquired and
distributed across various county entities. The department was also able to
procure a digital printer worth 4.5 million.
Challenges
The sector however experienced challenges as mentioned below:
Inadequate sector funding to enable effective delivery of its mandate and
implementation of the County Integrated Development Plan 2013-2017 projects
and programmes;
With the increasing wage bill, the confirmation of the ECDE teachers
becomes a challenge;
The inexistence of policy that directs the recruitment guidelines for the
VTCs trainees;
Instructors’ motivation and inadequacy has hindered the quality of learning
coupled with undecided instructors ‘confirmation/promotion;
HIV&AIDS has led to costly mitigation and adaptation strategies which has
affected the sector’s operations and;
Although there have been major improvements in infrastructure, road
network remains a major challenge as far as accessibility of schools is concerned.
Inadequate policies, legislations, standards and guidelines to mainstream
ICT usage in the county;
Inadequate funding to operationalize newly created institutions and
implementation of key priority/flagship projects, and promotion of Research in
ICT for development and;
Lessons Learnt
The following are some of the lessons learnt during the implementation of the
projects for the sector:
Mobility is the main obstacle in supervision despite the availability of
capacity and skills to do the work by the officers in charge;
104
There is need to have indoor and outdoor play equipment and teaching
learning materials;
There is a shortage of infrastructure i.e. if not a workshop then a hostel
hence no wholesome training for the pupils and trainees;
Centre for Research and ICT hub is a requirement to enhance connectivity
across the sectors.
Recommendations
The sector suggested the following recommendation to help improve in the sector
implementation of the programmes:
There should be a linkage with partners to ensure there exist civic
education and community sensitization regarding the VTC establishment and the
enrolment rates;
County should confirm those on contract ECDE teachers and VTCs
Instructors and recruit more due to understaffing.
There is need to create an ERP database that links all sectors.
Policies that direct the recruitment guidelines for the VTCs trainees should
be formulated;
Timely legislation and policies should be put in place to support the
sectorial development.
3.7.6 PUBLIC ADMINISTRATION AND INTER/INTRA GOVERNMENT
RELATIONS
The sub sector of Finance, has improved the public management of county
financial resources; established the necessary framework for sustained economic
growth of the county; established adoption the Integrated Financial Management
System (IFMIS) complete with all modules such as e-procurement for efficient
tracking of financial transactions; and established the housing of all the financial
operations of the County Government at the County Treasury.
The Planning, Budgeting and Service Delivery sub sector prepared the requisite
county strategic and development plan together with the estimates of revenue and
expenditure for all the years; enhanced office accommodation for the county
105
planning function through renovation of the County Planning Unit; improved
transport for senior officers with 21No. motor vehicles procured for CEC members
and Chief Officers; and established a regional bank to improve financial access
and spur further economic development in the Lake Basin Region.
The County Executive Services has put in place the framework for the
operationalization of all government functions; improved office accommodation
through renovation, re-roofing, extension, furnishing and equipping with all the
relevant systems of the Old Municipal Building housing the Governor’s Office;
enhanced security of county assets in the compound through building of the
perimeter wall and providing a guard house and a stand-by generator; enhanced
office accommodation at the field administration level through construction of 4
new sub-county offices and renovation of 3 old sub-county offices; enhanced
government reception through renovation of residences of the Governor and the
Deputy Governor and offices installed with various ICT and security equipment.
Overall, service delivery has been improved significantly since all the relevant
offices were created, housed and filled with able personnel including 10 CEC
members; 10 Chief Officers; 7 members of the County Public Service Board, 8 Sub-
County Administrators and 39 Ward Administrators. The above implemented
projects have led to coordinated efforts and smooth implementation of county
projects and programmes.
Through County Assembly all the 18priority bills have been enacted; oversight and
legislation put in place fully; all developed regulations have provided a legal
framework for respective county functions operationalization, relevant offices
have been established, accommodated and operationalized with 74 staff recruited
at the head-quarter and 120 staff placed at the wards; the main assembly hall and
all its offices constructed; conference and committee rooms modernized and
equipped; all systems including for water and sewerage, ICT as wells burglar-proof
windows and doors, and a high perimeter fencing complete with modern parking
lot have been put in place.
106
3.7.6.1 Challenges
The sector however experienced challenges as mentioned below:
Weak resource mobilization frameworks and revenue leakages has hindered
the sectoral performance;
Inadequate funding for public participation and the general limited funding
from the exchequer has reduced the performance of the sector;
There has been inadequate staffing in various offices i.e. Legal office, Planning
office, Public Service Board, HR, ICT, County Secretary;
Non-implementation of performance contracts;
Inadequate capacity for legal drafting and policy analysis and the inexistence
of laws and curriculum for civic education;
High expectations from the general citizenry;
Inadequate and delayed funding;
Inadequate office space;
Bureaucracies in development and implementation of the ten Human resource
policies as per the constitution;
Lack of job descriptions for majority of county staffs and;
Lack of modernized data and records management system
3.7.6.2 Lessons Learnt
The following are some of the lessons learnt during the implementation of the
projects for the sector:
There should frequent review of the CIDP (Mid-term review), tracking of
implementation;
Appraisal of projects should be adopted to ensure mobilization of resources;
The planning units are supposed to be enhanced and strengthened;
Funding should be done per the budget i.e. there is need to comply with the
budget and;
107
There is need to create the Efficiency Monitoring Unit (EMU)/ Results
Monitoring Unit.
3.7.6.3 Recommendations
The following are some of the lessons learnt during the implementation of the
projects for the sector:
Reviewing and improving resource mobilization structures, processes and
materials;
Strengthening tracking of results and coordination of projects being
implemented and engaging the executive at critical planning, monitoring and
evaluation points;
Establishing a framework and a working infrastructure for information,
coordination, civic education and public participation;
Improving capacity in economic data collection, analysis, presentation and
dissemination together with capacity building on research, audits, legislation
and reporting;
Enhancing funding for public participation and devolved units; County, Sub-
county and Ward office and establishing the Village units and town
administrators as is in the constitution;
Strengthening capacity for project monitoring and reporting and encouraging
action on findings of evaluations;
Establish/enhance the human resource, strengthen performance contract and
recruit legal drafters and policy analysts and;
Establishing platforms for collaboration with civil society and other
development partners.
3.7.7 SOCIAL PROTECTION, CULTURE RECREATION AND SPORTS SECTOR
The department of Sports and Culture has mapped the county cultural tourism by
facilitating Kochia Kagan dancers, councils of elders and other troupes for cultural
exchanges to several places (Washing DC for the Smithsonian festival), Suba and
Luo cultural festivals and the annual cultural festival at Rusinga.
108
Local sports talents have developed and exposed through facilitation of county
leagues for football (men & women), volleyball (men & women), net ball and the
10-a-side rugby tournaments to popularize the sport and tap local talents as is
gymnastic sports (Tae Kwon Do). County representatives in karate and
Paralympics have also posted good results in international competitions; over 40
community playgrounds have been upgraded across all the 40 wards; the Homa
Bay County Stadium is being upgraded with the ablution block, changing rooms
and fencing almost complete; the County has at large improved the livelihood of
the disadvantaged members of the society; increased the participation of youths in
development activities; and nurtured already identified talents.
The county social protection policy has been developed and approved by the
Assembly to guide all measures of alleviating suffering for vulnerable households.
It is expected therefore that cash transfers and other social benefits to older
persons and members of other vulnerable groups will begin to flow effectively in
the Financial Year 2018/19.
3.7.7.1 Challenges
The sector was faced with several risk factors which hampered successful
achievement of set objectives including:
Inadequate funding of the programmes;
Poor infrastructure, unreliable and high cost of energy, the influx of sub-
standard, counterfeits and contra-band goods, the low access to credit facilities
and financial services, high interest rates and insufficient long-term financing,
multiple trade regulations; and low level of awareness on
opportunities/benefits;
Some of the constraints and challenges faced included inadequate personnel,
inadequate funding, unavailability of means of transport, lack of basic office
equipment and too many unemployed youths and vulnerable groups and;
109
Other challenges included disjoint between head department and other
stakeholders, lack of project implementation follow-ups, lack of commitments
to the planned projects, focusing on several programmes, inadequate ward
staff to ensure ward project implementation and untimely disbursement of
funds.
3.7.7.2 Lessons Learnt
Though the sector made some progress in implementing the projects, there were
some lessons learnt:
Planning should be brought to basic standards with prioritizing the most
crucial projects;
There should be a work plan in place to avoid planning for numerous/over
ambitious projects rather focus on big achievable projects;
All stakeholders to be involved in all stages of development;
Civic education should be intensified together with staff assessment/training
and capacity building;
There should be timely disbursement of funds and;
Policy development is a key requirement in enabling most of the non-
achieved national functions is successful at county levels.
3.7.7.3 Recommendations
The following recommendations were made to enable the continuous
implementation of the set programmes:
Efforts should be made to promote gender equality and empower women to
achieve SDG goal number 5.
The county should offer capacity building and trainings to both the youth and
women and organize workshops;
Skills should be imparted on the youth both for formal and informal/self-
employment and a continuous sensitization for youth on youth related issues;
110
There should be availability of the youth fund, need for the identification of
all functional youth groups and provide a budget for the YTCs;
The women to be mobilized and trained on group dynamics;
Continuous availing of loans from the Women Enterprises Fund and other
financial support from other financial institutions like the Kenya Women
Finance trust, KWFT;
There should be a system of consistent follow-up of project implementation;
Assessment need should be done to allow identification of the projects
needed by the youth and women to avoid projects that would not
benefit/contribute economically and;
There should be a merger between county administration data with the
departmental data to avoid isolation.
3.7.8 ENVIRONMENTAL PROTECTION, WATER & NATURAL RESOURCES
SECTOR
Water and Sanitation has had initiatives to provide clean and secure environment,
reduce prevalence of waterborne diseases and improve access to water hence
enhanced productivity;85 new boreholes have been sunk and 45 equipped, 18
additional water pans rehabilitated, 20 springs protected to reduce water wastage
and improve safety of water available to local households, 4 water suppliedunder
Public Private Partnership consequently increasing the number of households
with access to clean water from 68,884 to 75,772representing 10 per cent
improvement and a 3 Km average household distance to water points.
As part of a campaign to step up environmental conservation and improve forest
cover, over 50,000 seedlings were distributed and planted across the county
especially around the known water towers. Tree planting and re-afforestation
initiatives were prioritized as part of natural resource management as is the
modernization of urban sewerage systems especially the Homa Bay Sewerage and
Water Supply supported through a strategic partnership with the World Bank and
LVEMP II.
111
3.7.8.1 Challenges
The sector was faced with several risk factors which hampered successful
achievement of set objectives including:
Inadequate working tools and equipment i.e. laptops, survey equipment,
software etc.;
Weak legal framework for implementation i.e. environment policy, forestry
policy, water policy;
Conflicting mandates with other departments/ministries e.g. irrigation and
drainage, greening and protection of recreational sites and free spaces;
Pollution of water sources due to farming activities, ignorance, and
encroachment of the water sources and the rise of informal settlements;
Increased volumes of non-revenue water due to vandalism and dilapidated
infrastructure and poor management of existing water supplies;
Improper solid waste management in various urban and rural centers e.g. no
designated waste disposal sites, mushrooming of dumping sites, informal
settlements;
Inadequate budget and delayed remittances for the department;
Non-functional water sources;
Breakdown of rural water supplies due to lack of funds for proper operations
and maintenance and;
Lack of monitoring systems on breakdowns.
3.7.8.2 Lessons Learnt
Though the sector made some various progresses in implementing the projects,
these were some of the lesson learnt:
Marking of water piped areas for future projects;
Share information in Multi-sectoral inception meeting;
Need to carry out a comprehensive needs Assessment and supervision before
implementing any project plan especially in the rural areas and islands and;
112
Need to clearly state and have an agreement with Individuals who house
government pumps and boreholes to ensure that the public is able to access
the water.
3.7.8.3 Recommendation
The following recommendations were made to enable the continuous
implementation of the set programmes:
Fast track on land easement for all government projects in private property;
Procurement of modern working tools and equipment;
Staff capacity building, employment and promotion of staff;
Adopting green energy (use of solar power) to help curb high electricity costs;
Awareness creation on reforestation and afforestation;
Awareness creation, design of settlements and provision of social amenities i.e.
sewerage systems and ablution blocks;
Enhance security systems for water projects;
Introduce automated billing software to help curb the increasing value of non-
revenue water;
Adopt an integrated solid waste management system;
Enforcement of department’s framework and policy and the completion of the
policy development;
Decentralization of the procurement system to the departments;
Establish a rural water supply monitoring system to help in reduction of
breakdowns;
Develop proper rural investment plans;
Establish a monitoring and maintenance fund for rural water supplies and;
Set up a data management system for the department.
113
CHAPTER FOUR
COUNTY DEVELOPMENT PRIORITIES AND STRATEGIES
4.1 INTRODUCTION
This chapter discusses the county spatial development framework, key county
development priorities, strategies and Programmes and Projects as identified by
stakeholders in the county, that will be financed and implemented by the County
Government of Homa Bay during the plan period 2018-2022 under the Medium
Term Expenditure Framework (MTEF) budgeting system. The resources are
appropriated under the (MTEF) budget Framework by the ten County
departments, County Public Service Board (CPSB) and the County Assembly (CA)
which have been grouped into various sector working groups.
This section also discusses mechanisms for mainstreaming cross cutting issues
such as climate change, environmental degradation, HIV AIDS, Disaster Risk
Reduction (DRR) among others. It further outlines the cross sectoral
implementation considerations with a focus on measures to enhance synergies or
mitigate adverse cross sector impacts.
The County has ten sectors namely;Roads, Transport and Public Works, Health
Services; Agriculture, Livestock, Fisheries and Food Security, Water, Environment
and Natural Resources; Lands, Housing, Urban Development and Physical
Planning; Tourism, Culture, Sports, Culture, and Social Services; Finance and
Economic Planning; Trade, Industrialization, Cooperatives and Enterprise
Development; Energy and Mining, Education and ICT.
4.2 County Spatial Development Framework
The spatial plan provides a linkage between economic planning, budgeting and
spatial planning which has been identified as the major cause of
underdevelopment in the county despite massive investments over the years. The
county spatial Plan will provide the needed overall integrated spatial framework
114
for coordinating the various development efforts by different agencies so as to
have sustainable development within the county.
Objectives of county spatial planning include:
i. To identify the spatial distribution of the resources within the
County, their level of utilization and potential;
ii. To assess the existing infrastructure, their current conditions,
capacity and projected demand;
iii. To identify fragile ecosystems and suggest intervention measures for
their protection and conservation;
iv. To investigate human settlement trends and propose an appropriate
hierarchy or urban centers that will spur rural development;
v. To assess capacity of the existing institutions and organizations thus
suggest strategies to enhance their performance;
vi. To suggest an integrated spatial framework that will guide the
sustainable utilization of the regional resource and bring services
closer to the people;
vii. To Spur rural-urban inter-linkages and hasten economic growth and
development and suggest priority areas for intervention.
4.2.1Overview of the County Spatial Structure
The section highlights the county’s spatial structure in respect to, agriculture,
population settlement patterns, political and administrative units, land use and
settlement patterns, land use management, infrastructure network, natural
resources potential, industrialization location and potential, education
institutions and health facilities and Tourism.
4.2.2 Spatial Development Framework
This section describes the spatial framework within which county development
projects and programmes will be realized. Moreover, it sets development priorities
of the county and coordinates implementation of these priorities amongst
different sectors. This section further carries out an assessment of natural
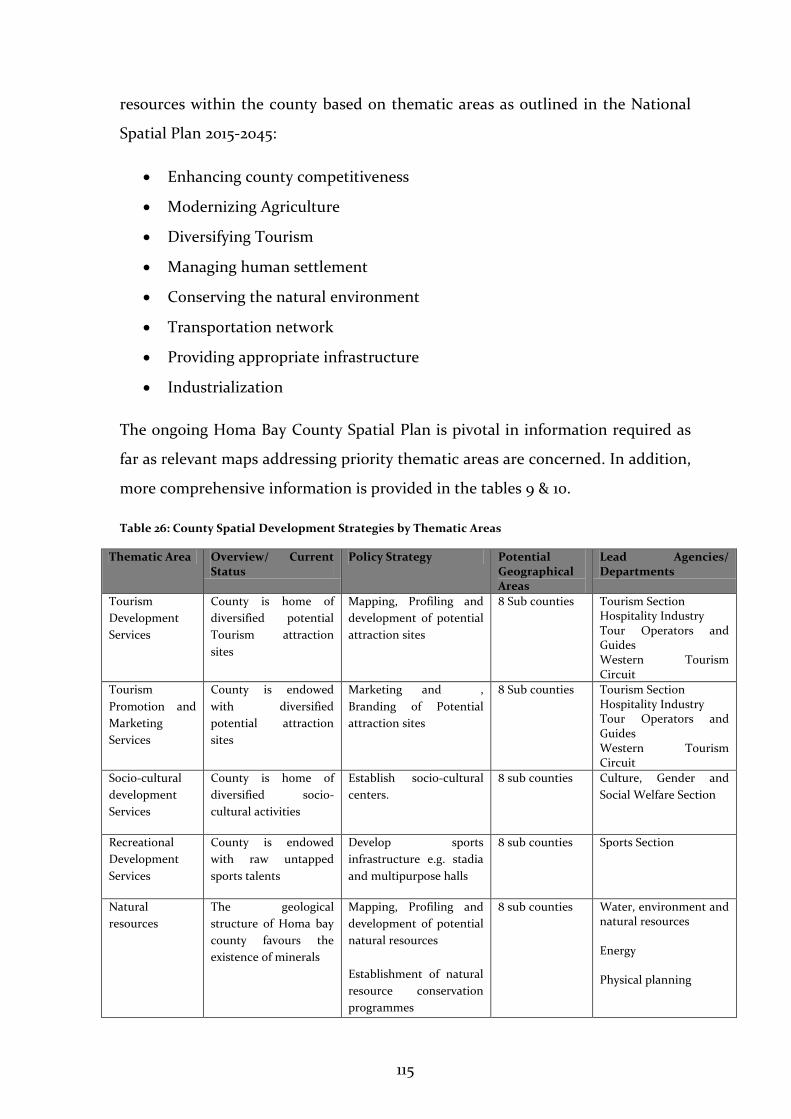
115
resources within the county based on thematic areas as outlined in the National
Spatial Plan 2015-2045:
Enhancing county competitiveness
Modernizing Agriculture
Diversifying Tourism
Managing human settlement
Conserving the natural environment
Transportation network
Providing appropriate infrastructure
Industrialization
The ongoing Homa Bay County Spatial Plan is pivotal in information required as
far as relevant maps addressing priority thematic areas are concerned. In addition,
more comprehensive information is provided in the tables 9 & 10.
Table 26: County Spatial Development Strategies by Thematic Areas
Thematic Area Overview/ Current Status
Policy Strategy Potential Geographical Areas
Lead Agencies/ Departments
Tourism
Development
Services
County is home of
diversified potential
Tourism attraction
sites
Mapping, Profiling and
development of potential
attraction sites
8 Sub counties
Tourism Section Hospitality Industry Tour Operators and Guides Western Tourism Circuit
Tourism
Promotion and
Marketing
Services
County is endowed
with diversified
potential attraction
sites
Marketing and ,
Branding of Potential
attraction sites
8 Sub counties Tourism Section Hospitality Industry Tour Operators and Guides Western Tourism Circuit
Socio-cultural
development
Services
County is home of
diversified socio-
cultural activities
Establish socio-cultural
centers.
8 sub counties
Culture, Gender and
Social Welfare Section
Recreational
Development
Services
County is endowed
with raw untapped
sports talents
Develop sports
infrastructure e.g. stadia
and multipurpose halls
8 sub counties Sports Section
Natural
resources
The geological
structure of Homa bay
county favours the
existence of minerals
Mapping, Profiling and
development of potential
natural resources
Establishment of natural
resource conservation
programmes
8 sub counties Water, environment and natural resources Energy Physical planning
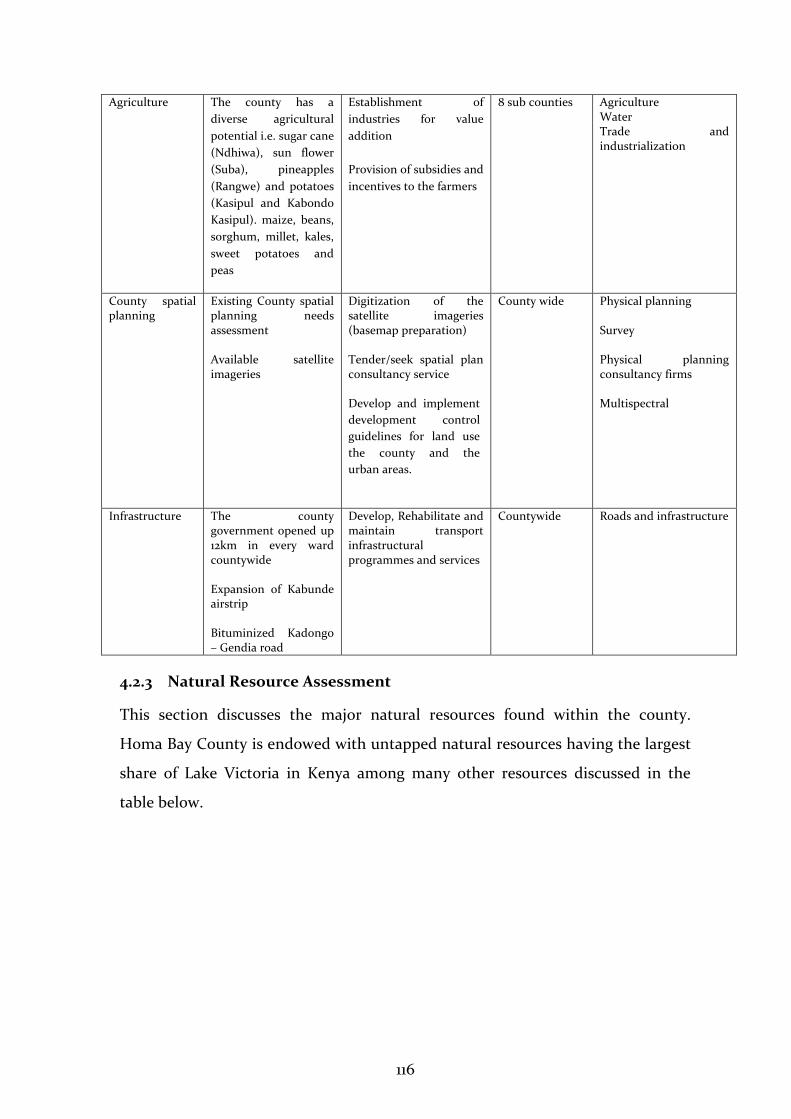
116
Agriculture The county has a
diverse agricultural
potential i.e. sugar cane
(Ndhiwa), sun flower
(Suba), pineapples
(Rangwe) and potatoes
(Kasipul and Kabondo
Kasipul). maize, beans,
sorghum, millet, kales,
sweet potatoes and
peas
Establishment of
industries for value
addition
Provision of subsidies and
incentives to the farmers
8 sub counties Agriculture Water Trade and industrialization
County spatial planning
Existing County spatial planning needs assessment Available satellite imageries
Digitization of the satellite imageries (basemap preparation) Tender/seek spatial plan consultancy service Develop and implement
development control
guidelines for land use
the county and the
urban areas.
County wide Physical planning Survey Physical planning consultancy firms Multispectral
Infrastructure The county government opened up 12km in every ward countywide Expansion of Kabunde airstrip Bituminized Kadongo – Gendia road
Develop, Rehabilitate and maintain transport infrastructural programmes and services
Countywide Roads and infrastructure
4.2.3 Natural Resource Assessment
This section discusses the major natural resources found within the county.
Homa Bay County is endowed with untapped natural resources having the largest
share of Lake Victoria in Kenya among many other resources discussed in the
table below.
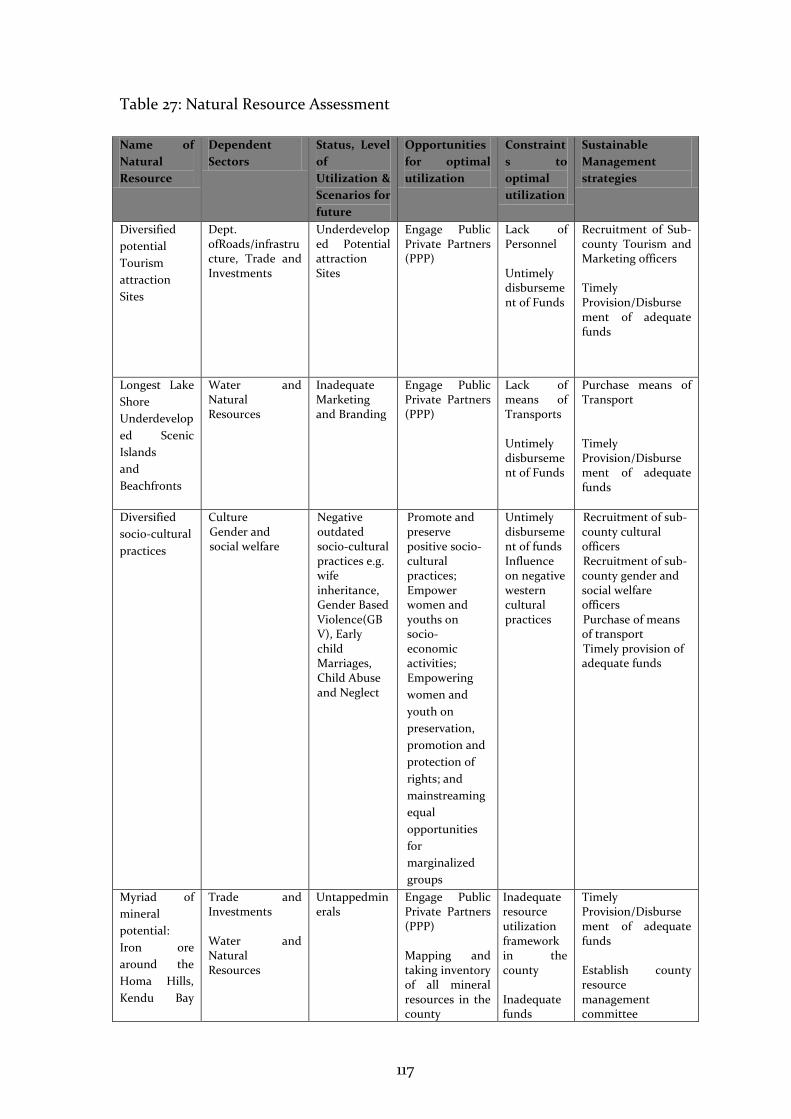
117
Table 27: Natural Resource Assessment
Name of
Natural
Resource
Dependent
Sectors
Status, Level
of
Utilization &
Scenarios for
future
Opportunities
for optimal
utilization
Constraint
s to
optimal
utilization
Sustainable
Management
strategies
Diversified
potential
Tourism
attraction
Sites
Dept. ofRoads/infrastructure, Trade and Investments
Underdeveloped Potential attraction Sites
Engage Public Private Partners (PPP)
Lack of Personnel Untimely disbursement of Funds
Recruitment of Sub-county Tourism and Marketing officers Timely Provision/Disbursement of adequate funds
Longest Lake
Shore
Underdevelop
ed Scenic
Islands
and
Beachfronts
Water and Natural Resources
Inadequate Marketing and Branding
Engage Public Private Partners (PPP)
Lack of means of Transports Untimely disbursement of Funds
Purchase means of Transport Timely Provision/Disbursement of adequate funds
Diversified
socio-cultural
practices
Culture Gender and social welfare
Negative outdated socio-cultural practices e.g. wife inheritance, Gender Based Violence(GBV), Early child Marriages, Child Abuse and Neglect
Promote and preserve positive socio-cultural practices; Empower women and youths on socio- economic activities; Empowering
women and
youth on
preservation,
promotion and
protection of
rights; and
mainstreaming
equal
opportunities
for
marginalized
groups
Untimely disbursement of funds Influence on negative western cultural practices
Recruitment of sub-county cultural officers Recruitment of sub-county gender and social welfare officers Purchase of means of transport Timely provision of adequate funds
Myriad of
mineral
potential:
Iron ore
around the
Homa Hills,
Kendu Bay
Trade and Investments Water and Natural Resources
Untappedminerals
Engage Public Private Partners (PPP) Mapping and taking inventory of all mineral resources in the county
Inadequate resource utilization framework in the county Inadequate funds
Timely Provision/Disbursement of adequate funds Establish county resource management committee
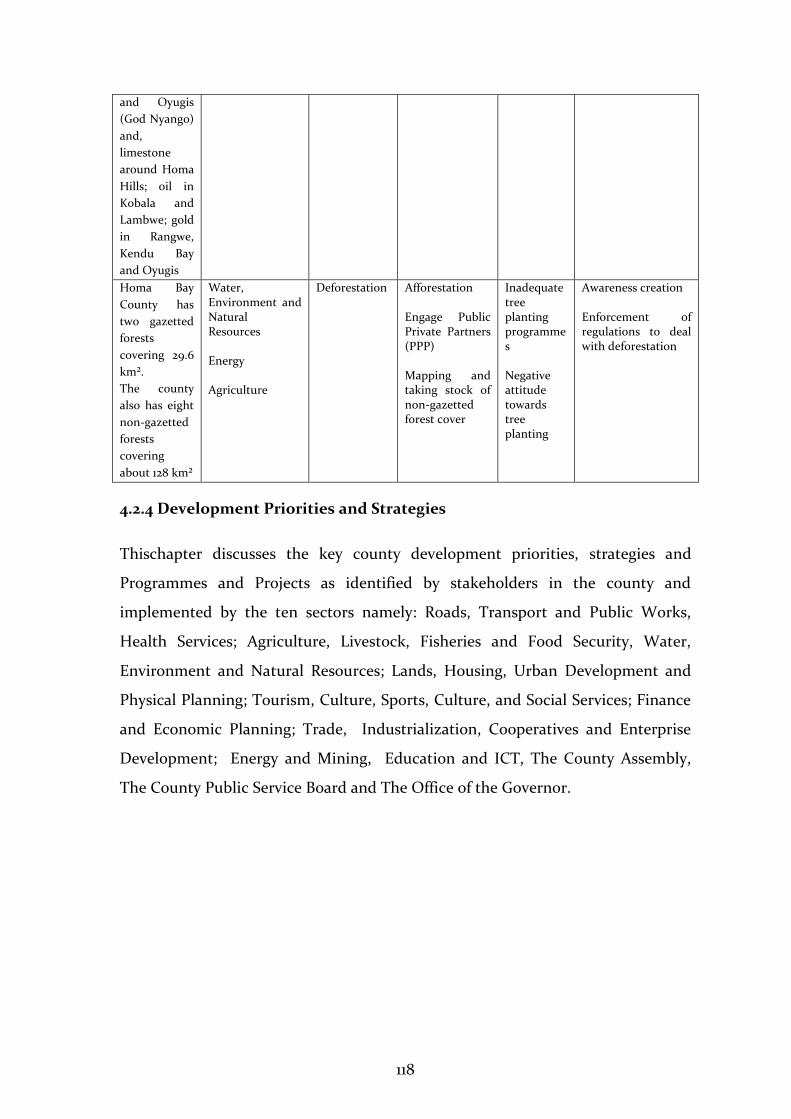
118
and Oyugis
(God Nyango)
and,
limestone
around Homa
Hills; oil in
Kobala and
Lambwe; gold
in Rangwe,
Kendu Bay
and Oyugis
Homa Bay
County has
two gazetted
forests
covering 29.6
km².
The county
also has eight
non-gazetted
forests
covering
about 128 km²
Water, Environment and Natural Resources Energy Agriculture
Deforestation
Afforestation
Engage Public Private Partners (PPP) Mapping and taking stock of non-gazetted forest cover
Inadequate tree planting programmes Negative attitude towards tree planting
Awareness creation Enforcement of regulations to deal with deforestation
4.2.4 Development Priorities and Strategies
Thischapter discusses the key county development priorities, strategies and
Programmes and Projects as identified by stakeholders in the county and
implemented by the ten sectors namely: Roads, Transport and Public Works,
Health Services; Agriculture, Livestock, Fisheries and Food Security, Water,
Environment and Natural Resources; Lands, Housing, Urban Development and
Physical Planning; Tourism, Culture, Sports, Culture, and Social Services; Finance
and Economic Planning; Trade, Industrialization, Cooperatives and Enterprise
Development; Energy and Mining, Education and ICT, The County Assembly,
The County Public Service Board and The Office of the Governor.
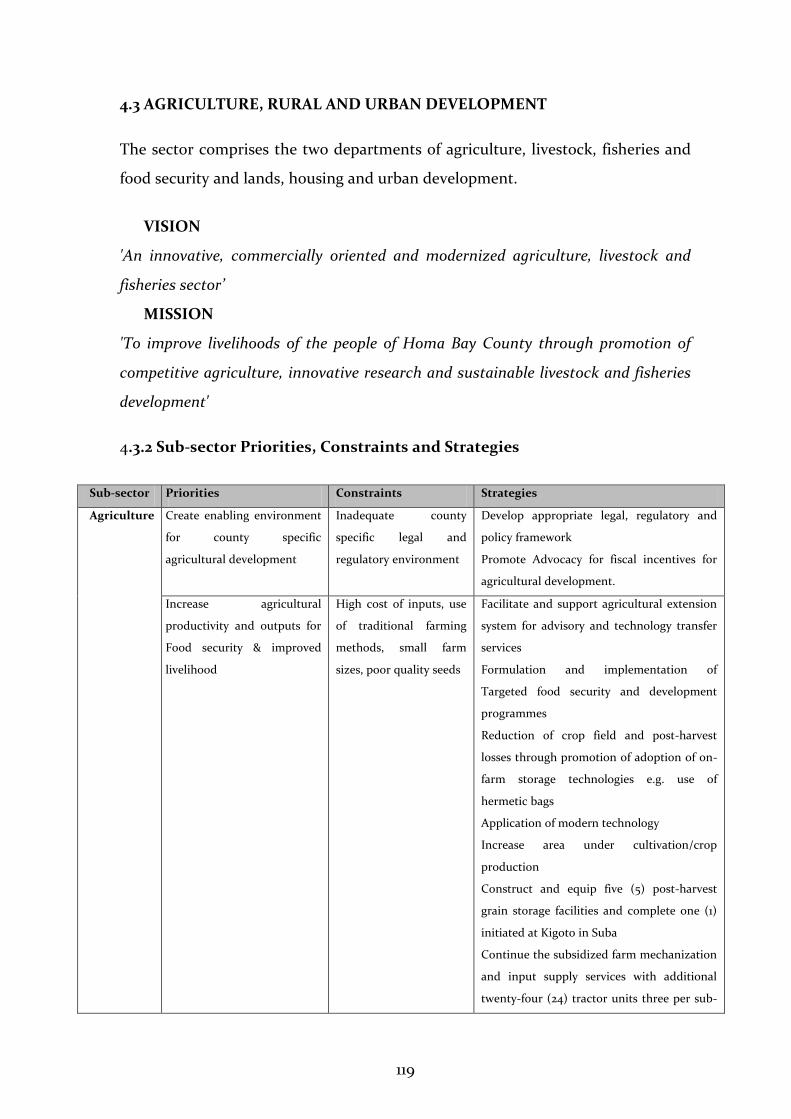
119
4.3 AGRICULTURE, RURAL AND URBAN DEVELOPMENT
The sector comprises the two departments of agriculture, livestock, fisheries and
food security and lands, housing and urban development.
VISION
'An innovative, commercially oriented and modernized agriculture, livestock and
fisheries sector’
MISSION
'To improve livelihoods of the people of Homa Bay County through promotion of
competitive agriculture, innovative research and sustainable livestock and fisheries
development'
4.3.2 Sub-sector Priorities, Constraints and Strategies
Sub-sector Priorities Constraints Strategies
Agriculture
Create enabling environment
for county specific
agricultural development
Inadequate county
specific legal and
regulatory environment
Develop appropriate legal, regulatory and
policy framework
Promote Advocacy for fiscal incentives for
agricultural development.
Increase agricultural
productivity and outputs for
Food security & improved
livelihood
High cost of inputs, use
of traditional farming
methods, small farm
sizes, poor quality seeds
Facilitate and support agricultural extension
system for advisory and technology transfer
services
Formulation and implementation of
Targeted food security and development
programmes
Reduction of crop field and post-harvest
losses through promotion of adoption of on-
farm storage technologies e.g. use of
hermetic bags
Application of modern technology
Increase area under cultivation/crop
production
Construct and equip five (5) post-harvest
grain storage facilities and complete one (1)
initiated at Kigoto in Suba
Continue the subsidized farm mechanization
and input supply services with additional
twenty-four (24) tractor units three per sub-
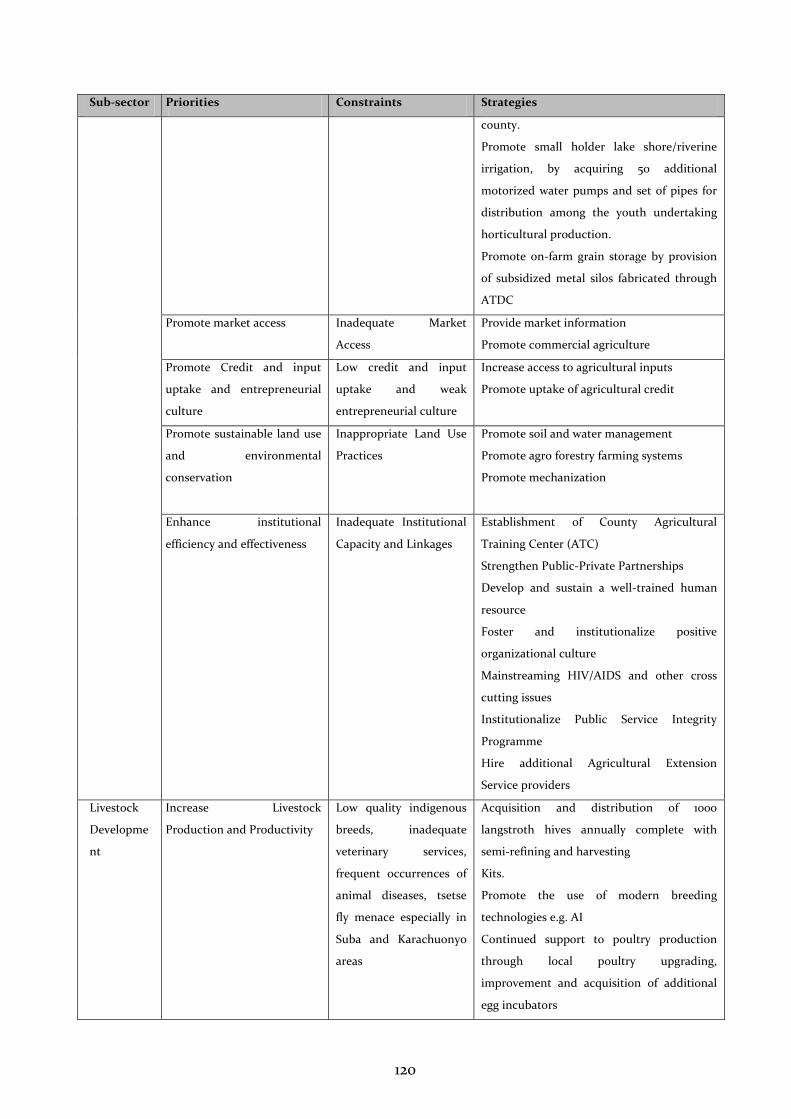
120
Sub-sector Priorities Constraints Strategies
county.
Promote small holder lake shore/riverine
irrigation, by acquiring 50 additional
motorized water pumps and set of pipes for
distribution among the youth undertaking
horticultural production.
Promote on-farm grain storage by provision
of subsidized metal silos fabricated through
ATDC
Promote market access Inadequate Market
Access
Provide market information
Promote commercial agriculture
Promote Credit and input
uptake and entrepreneurial
culture
Low credit and input
uptake and weak
entrepreneurial culture
Increase access to agricultural inputs
Promote uptake of agricultural credit
Promote sustainable land use
and environmental
conservation
Inappropriate Land Use
Practices
Promote soil and water management
Promote agro forestry farming systems
Promote mechanization
Enhance institutional
efficiency and effectiveness
Inadequate Institutional
Capacity and Linkages
Establishment of County Agricultural
Training Center (ATC)
Strengthen Public-Private Partnerships
Develop and sustain a well-trained human
resource
Foster and institutionalize positive
organizational culture
Mainstreaming HIV/AIDS and other cross
cutting issues
Institutionalize Public Service Integrity
Programme
Hire additional Agricultural Extension
Service providers
Livestock
Developme
nt
Increase Livestock
Production and Productivity
Low quality indigenous
breeds, inadequate
veterinary services,
frequent occurrences of
animal diseases, tsetse
fly menace especially in
Suba and Karachuonyo
areas
Acquisition and distribution of 1000
langstroth hives annually complete with
semi-refining and harvesting
Kits.
Promote the use of modern breeding
technologies e.g. AI
Continued support to poultry production
through local poultry upgrading,
improvement and acquisition of additional
egg incubators
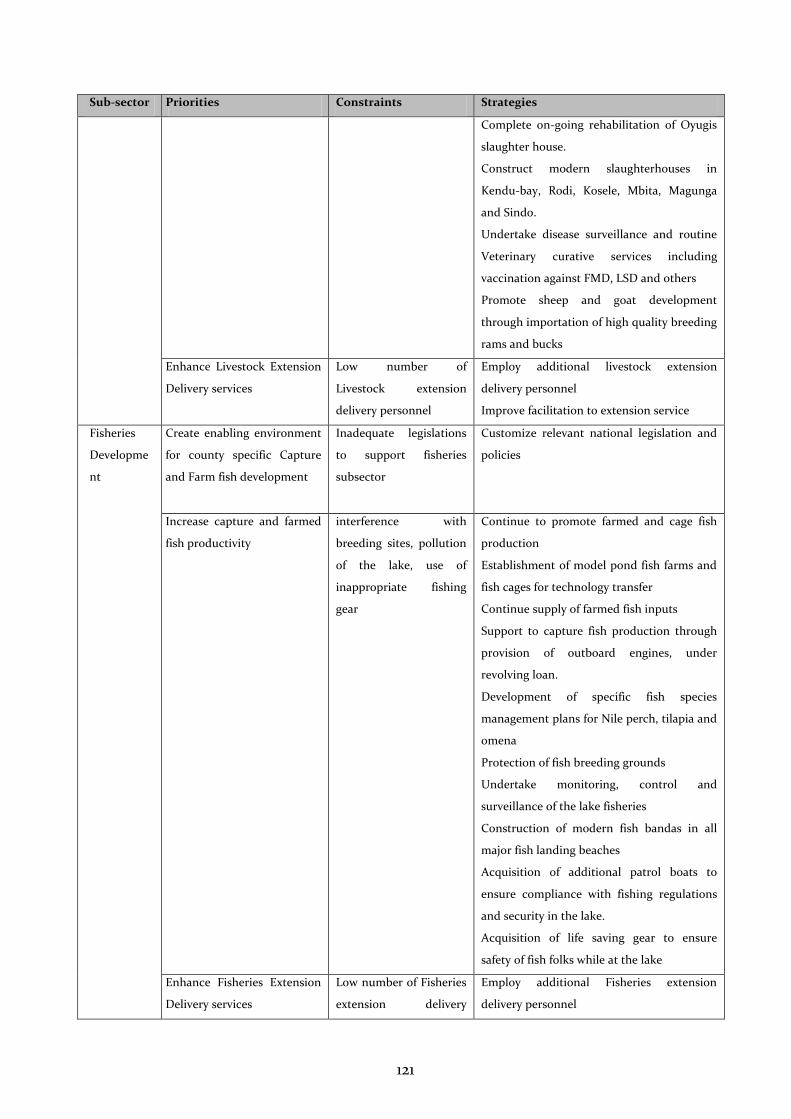
121
Sub-sector Priorities Constraints Strategies
Complete on-going rehabilitation of Oyugis
slaughter house.
Construct modern slaughterhouses in
Kendu-bay, Rodi, Kosele, Mbita, Magunga
and Sindo.
Undertake disease surveillance and routine
Veterinary curative services including
vaccination against FMD, LSD and others
Promote sheep and goat development
through importation of high quality breeding
rams and bucks
Enhance Livestock Extension
Delivery services
Low number of
Livestock extension
delivery personnel
Employ additional livestock extension
delivery personnel
Improve facilitation to extension service
Fisheries
Developme
nt
Create enabling environment
for county specific Capture
and Farm fish development
Inadequate legislations
to support fisheries
subsector
Customize relevant national legislation and
policies
Increase capture and farmed
fish productivity
interference with
breeding sites, pollution
of the lake, use of
inappropriate fishing
gear
Continue to promote farmed and cage fish
production
Establishment of model pond fish farms and
fish cages for technology transfer
Continue supply of farmed fish inputs
Support to capture fish production through
provision of outboard engines, under
revolving loan.
Development of specific fish species
management plans for Nile perch, tilapia and
omena
Protection of fish breeding grounds
Undertake monitoring, control and
surveillance of the lake fisheries
Construction of modern fish bandas in all
major fish landing beaches
Acquisition of additional patrol boats to
ensure compliance with fishing regulations
and security in the lake.
Acquisition of life saving gear to ensure
safety of fish folks while at the lake
Enhance Fisheries Extension
Delivery services
Low number of Fisheries
extension delivery
Employ additional Fisheries extension
delivery personnel
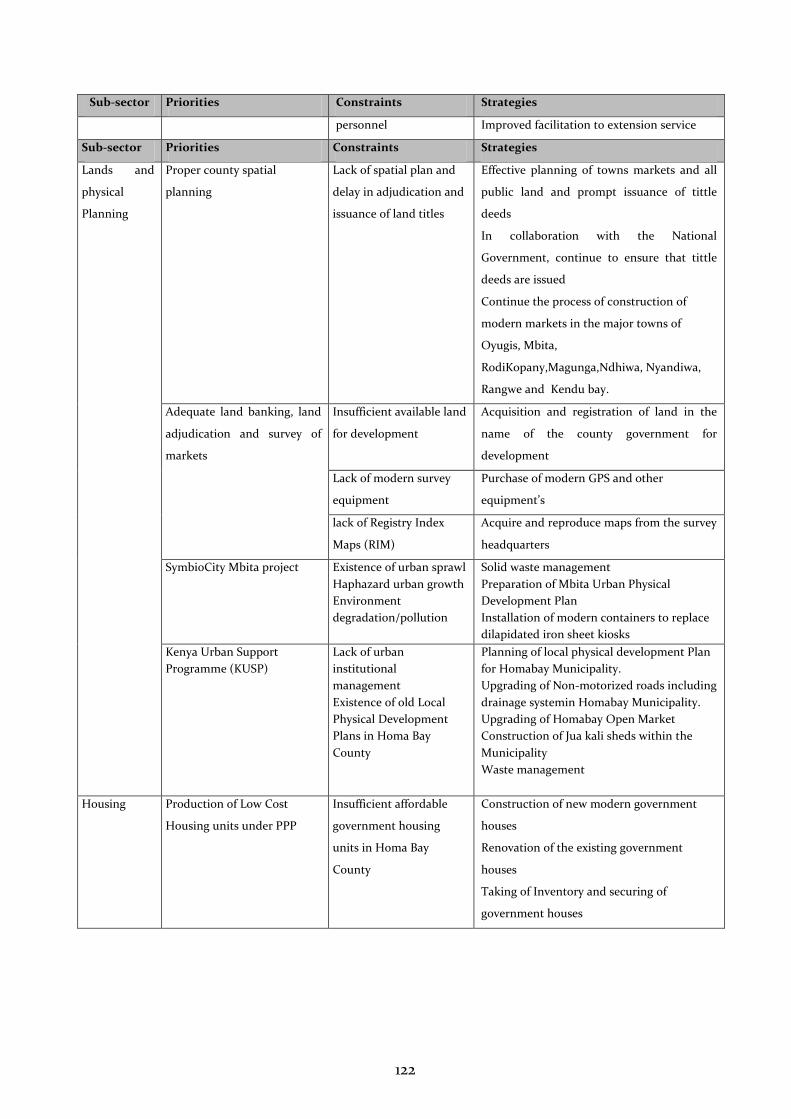
122
Sub-sector Priorities Constraints Strategies
personnel Improved facilitation to extension service
Sub-sector Priorities Constraints Strategies
Lands and
physical
Planning
Proper county spatial
planning
Lack of spatial plan and
delay in adjudication and
issuance of land titles
Effective planning of towns markets and all
public land and prompt issuance of tittle
deeds
In collaboration with the National
Government, continue to ensure that tittle
deeds are issued
Continue the process of construction of
modern markets in the major towns of
Oyugis, Mbita,
RodiKopany,Magunga,Ndhiwa, Nyandiwa,
Rangwe and Kendu bay.
Adequate land banking, land
adjudication and survey of
markets
Insufficient available land
for development
Acquisition and registration of land in the
name of the county government for
development
Lack of modern survey
equipment
Purchase of modern GPS and other
equipment’s
lack of Registry Index
Maps (RIM)
Acquire and reproduce maps from the survey
headquarters
SymbioCity Mbita project Existence of urban sprawl
Haphazard urban growth
Environment
degradation/pollution
Solid waste management
Preparation of Mbita Urban Physical
Development Plan
Installation of modern containers to replace
dilapidated iron sheet kiosks
Kenya Urban Support
Programme (KUSP)
Lack of urban
institutional
management
Existence of old Local
Physical Development
Plans in Homa Bay
County
Planning of local physical development Plan
for Homabay Municipality.
Upgrading of Non-motorized roads including
drainage systemin Homabay Municipality.
Upgrading of Homabay Open Market
Construction of Jua kali sheds within the
Municipality
Waste management
Housing Production of Low Cost
Housing units under PPP
Insufficient affordable
government housing
units in Homa Bay
County
Construction of new modern government
houses
Renovation of the existing government
houses
Taking of Inventory and securing of
government houses
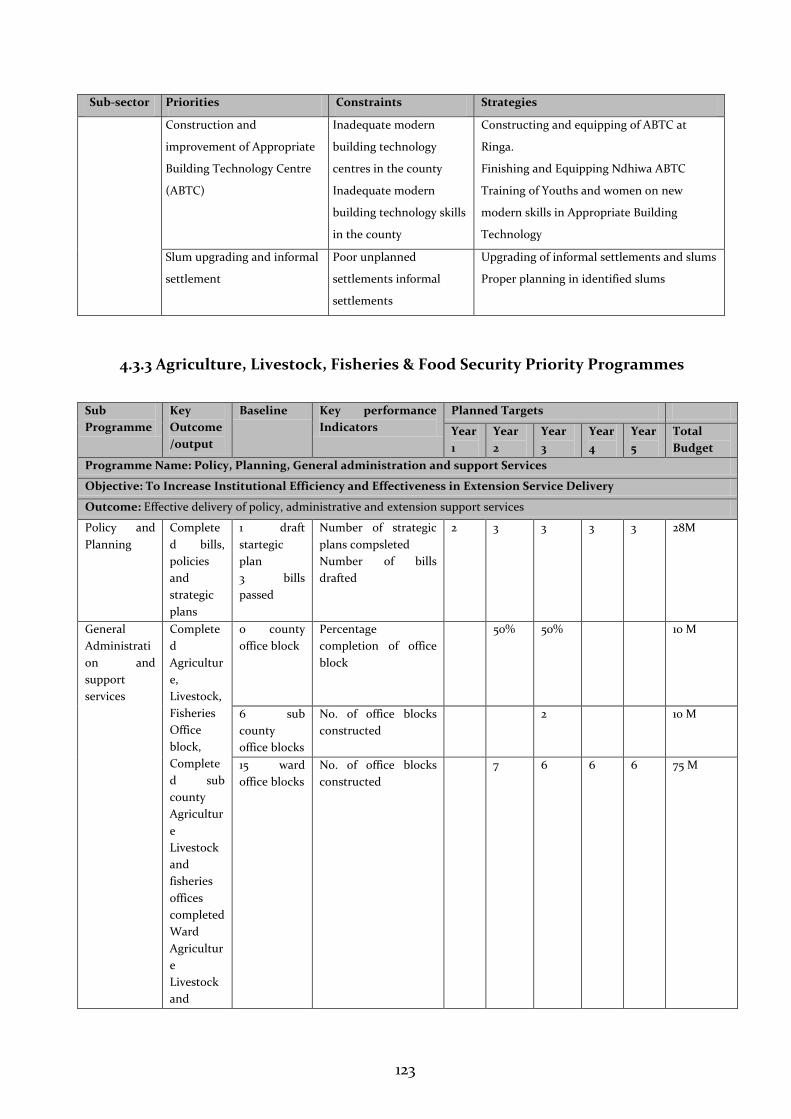
123
Sub-sector Priorities Constraints Strategies
Construction and
improvement of Appropriate
Building Technology Centre
(ABTC)
Inadequate modern
building technology
centres in the county
Inadequate modern
building technology skills
in the county
Constructing and equipping of ABTC at
Ringa.
Finishing and Equipping Ndhiwa ABTC
Training of Youths and women on new
modern skills in Appropriate Building
Technology
Slum upgrading and informal
settlement
Poor unplanned
settlements informal
settlements
Upgrading of informal settlements and slums
Proper planning in identified slums
4.3.3 Agriculture, Livestock, Fisheries & Food Security Priority Programmes
Sub
Programme
Key
Outcome
/output
Baseline Key performance
Indicators
Planned Targets
Year
1
Year
2
Year
3
Year
4
Year
5
Total
Budget
Programme Name: Policy, Planning, General administration and support Services
Objective: To Increase Institutional Efficiency and Effectiveness in Extension Service Delivery
Outcome: Effective delivery of policy, administrative and extension support services
Policy and
Planning
Complete
d bills,
policies
and
strategic
plans
1 draft
startegic
plan
3 bills
passed
Number of strategic
plans compsleted
Number of bills
drafted
2 3 3 3 3 28M
General
Administrati
on and
support
services
Complete
d
Agricultur
e,
Livestock,
Fisheries
Office
block,
Complete
d sub
county
Agricultur
e
Livestock
and
fisheries
offices
completed
Ward
Agricultur
e
Livestock
and
0 county
office block
Percentage
completion of office
block
50% 50% 10 M
6 sub
county
office blocks
No. of office blocks
constructed
2 10 M
15 ward
office blocks
No. of office blocks
constructed
7 6 6 6 75 M
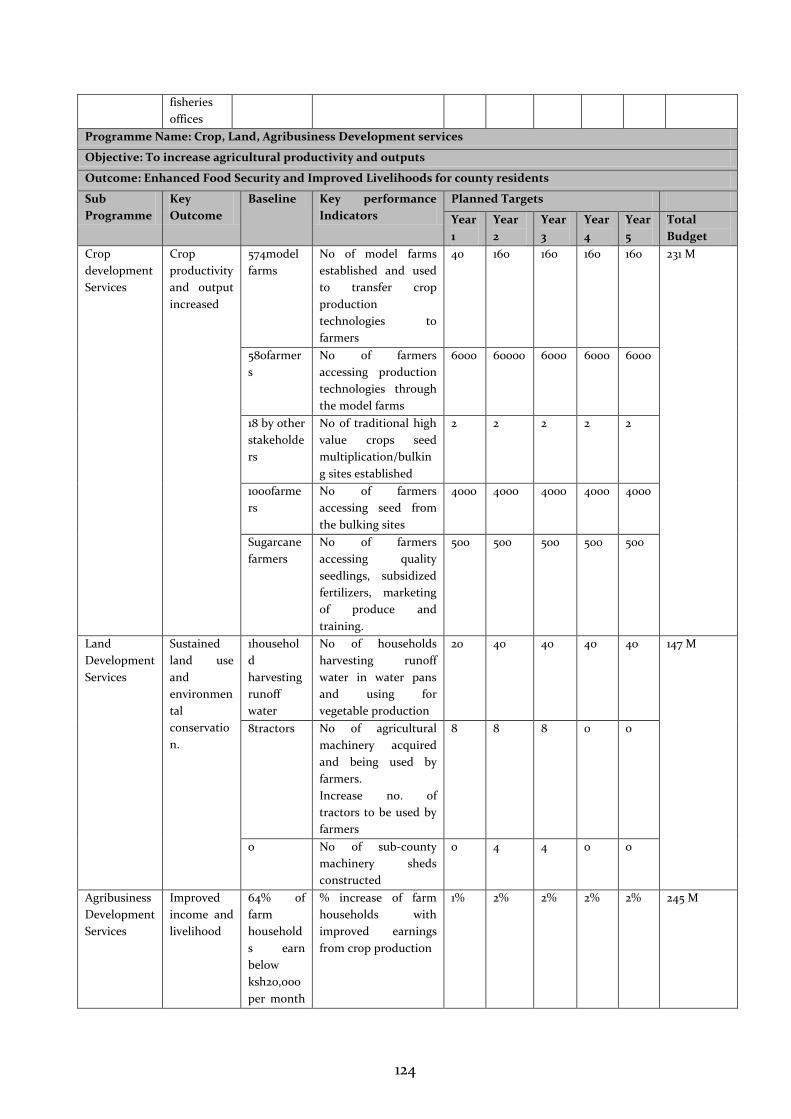
124
fisheries
offices
Programme Name: Crop, Land, Agribusiness Development services
Objective: To increase agricultural productivity and outputs
Outcome: Enhanced Food Security and Improved Livelihoods for county residents
Sub
Programme
Key
Outcome
Baseline Key performance
Indicators
Planned Targets
Year
1
Year
2
Year
3
Year
4
Year
5
Total
Budget
Crop
development
Services
Crop
productivity
and output
increased
574model
farms
No of model farms
established and used
to transfer crop
production
technologies to
farmers
40 160 160 160 160 231 M
580farmer
s
No of farmers
accessing production
technologies through
the model farms
6000 60000 6000 6000 6000
18 by other
stakeholde
rs
No of traditional high
value crops seed
multiplication/bulkin
g sites established
2 2 2 2 2
1000farme
rs
No of farmers
accessing seed from
the bulking sites
4000 4000 4000 4000 4000
Sugarcane
farmers
No of farmers
accessing quality
seedlings, subsidized
fertilizers, marketing
of produce and
training.
500 500 500 500 500
Land
Development
Services
Sustained
land use
and
environmen
tal
conservatio
n.
1househol
d
harvesting
runoff
water
No of households
harvesting runoff
water in water pans
and using for
vegetable production
20 40 40 40 40 147 M
8tractors No of agricultural
machinery acquired
and being used by
farmers.
Increase no. of
tractors to be used by
farmers
8 8 8 0 0
0 No of sub-county
machinery sheds
constructed
0 4 4 0 0
Agribusiness
Development
Services
Improved
income and
livelihood
64% of
farm
household
s earn
below
ksh20,000
per month
% increase of farm
households with
improved earnings
from crop production
1%
2% 2% 2% 2% 245 M
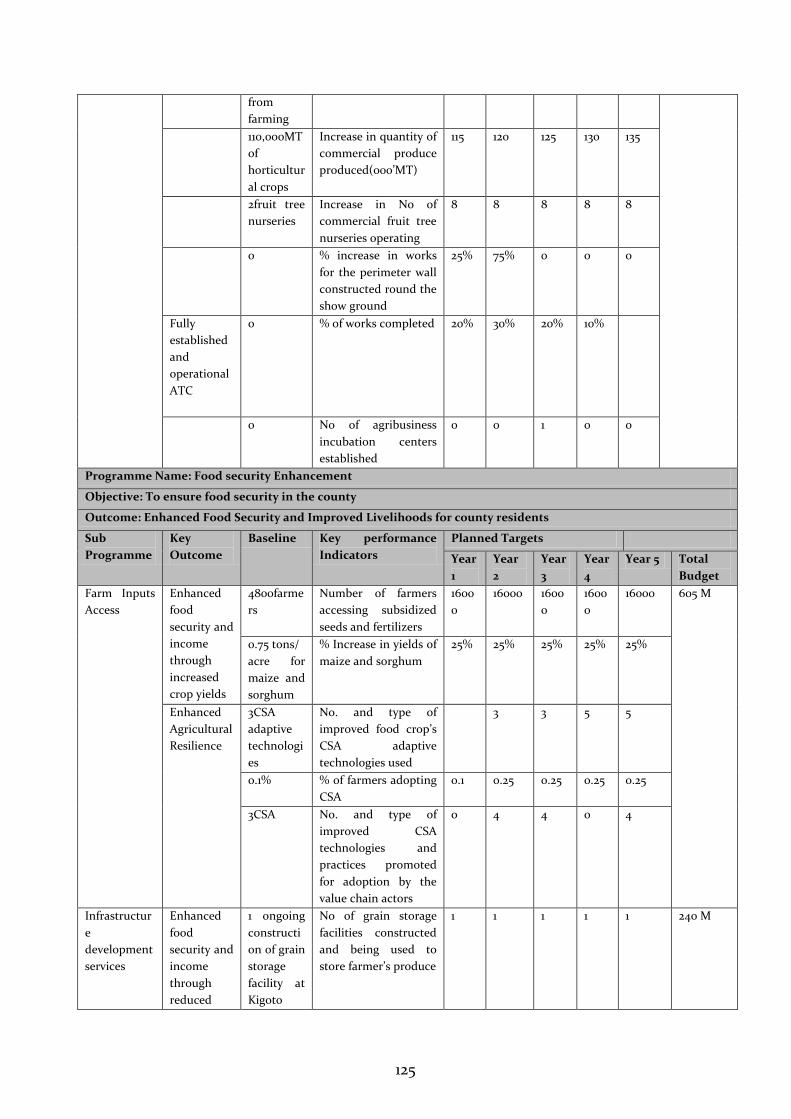
125
from
farming
110,000MT
of
horticultur
al crops
Increase in quantity of
commercial produce
produced(000’MT)
115 120 125 130 135
2fruit tree
nurseries
Increase in No of
commercial fruit tree
nurseries operating
8 8 8 8 8
0 % increase in works
for the perimeter wall
constructed round the
show ground
25% 75% 0 0 0
Fully
established
and
operational
ATC
0 % of works completed
20%
30% 20% 10%
0 No of agribusiness
incubation centers
established
0 0 1 0 0
Programme Name: Food security Enhancement
Objective: To ensure food security in the county
Outcome: Enhanced Food Security and Improved Livelihoods for county residents
Sub
Programme
Key
Outcome
Baseline Key performance
Indicators
Planned Targets
Year
1
Year
2
Year
3
Year
4
Year 5 Total
Budget
Farm Inputs
Access
Enhanced
food
security and
income
through
increased
crop yields
4800farme
rs
Number of farmers
accessing subsidized
seeds and fertilizers
1600
0
16000 1600
0
1600
0
16000 605 M
0.75 tons/
acre for
maize and
sorghum
% Increase in yields of
maize and sorghum
25%
25%
25%
25%
25%
Enhanced
Agricultural
Resilience
3CSA
adaptive
technologi
es
No. and type of
improved food crop’s
CSA adaptive
technologies used
3 3 5 5
0.1% % of farmers adopting
CSA
0.1 0.25 0.25 0.25 0.25
3CSA No. and type of
improved CSA
technologies and
practices promoted
for adoption by the
value chain actors
0 4 4 0 4
Infrastructur
e
development
services
Enhanced
food
security and
income
through
reduced
1 ongoing
constructi
on of grain
storage
facility at
Kigoto
No of grain storage
facilities constructed
and being used to
store farmer’s produce
1 1 1 1 1 240 M
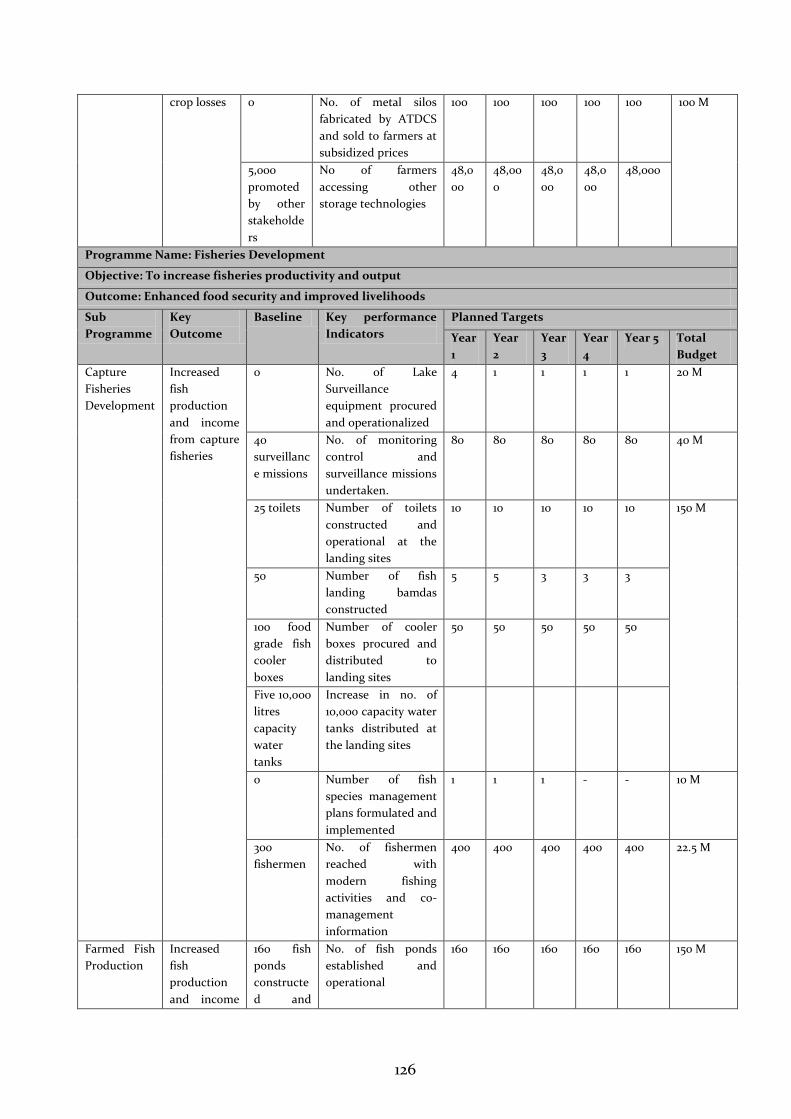
126
crop losses 0 No. of metal silos
fabricated by ATDCS
and sold to farmers at
subsidized prices
100 100 100 100 100 100 M
5,000
promoted
by other
stakeholde
rs
No of farmers
accessing other
storage technologies
48,0
00
48,00
0
48,0
00
48,0
00
48,000
Programme Name: Fisheries Development
Objective: To increase fisheries productivity and output
Outcome: Enhanced food security and improved livelihoods
Sub
Programme
Key
Outcome
Baseline Key performance
Indicators
Planned Targets
Year
1
Year
2
Year
3
Year
4
Year 5 Total
Budget
Capture
Fisheries
Development
Increased
fish
production
and income
from capture
fisheries
0 No. of Lake
Surveillance
equipment procured
and operationalized
4 1 1 1 1 20 M
40
surveillanc
e missions
No. of monitoring
control and
surveillance missions
undertaken.
80 80 80 80 80 40 M
25 toilets
Number of toilets
constructed and
operational at the
landing sites
10 10 10 10 10 150 M
50 Number of fish
landing bamdas
constructed
5 5 3 3 3
100 food
grade fish
cooler
boxes
Number of cooler
boxes procured and
distributed to
landing sites
50 50 50 50 50
Five 10,000
litres
capacity
water
tanks
Increase in no. of
10,000 capacity water
tanks distributed at
the landing sites
0 Number of fish
species management
plans formulated and
implemented
1 1 1 - - 10 M
300
fishermen
No. of fishermen
reached with
modern fishing
activities and co-
management
information
400 400 400 400 400 22.5 M
Farmed Fish
Production
Increased
fish
production
and income
160 fish
ponds
constructe
d and
No. of fish ponds
established and
operational
160 160 160 160 160 150 M
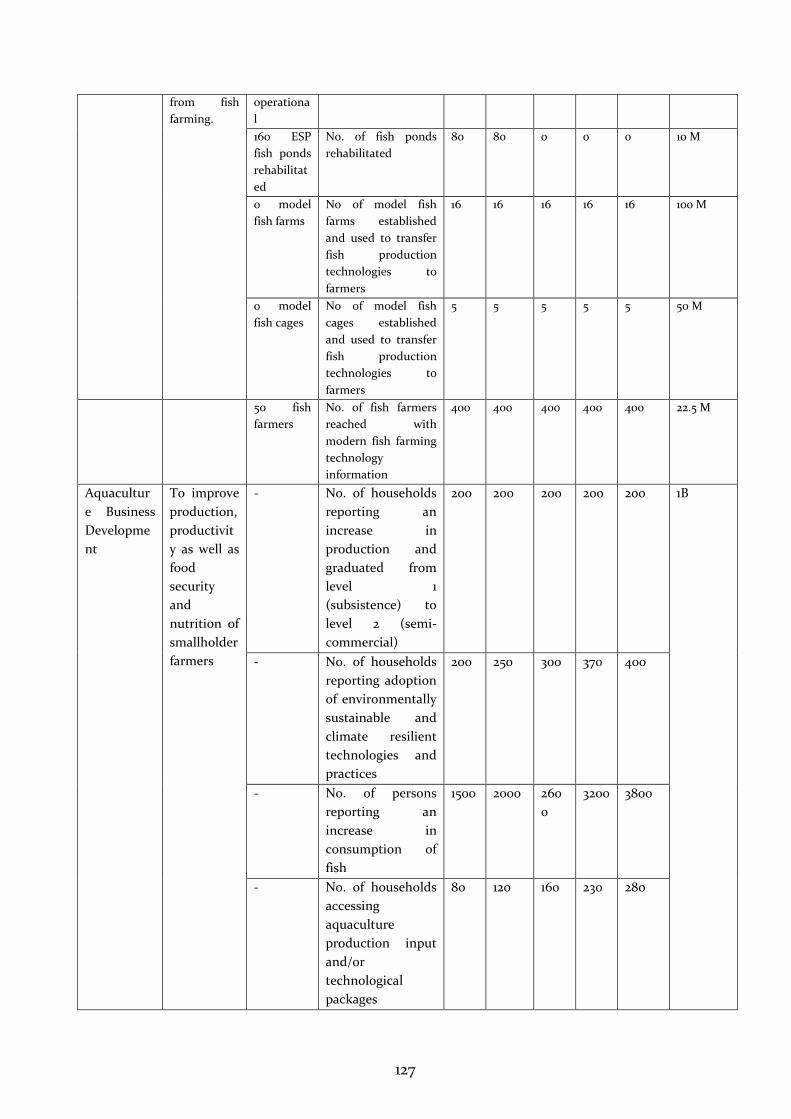
127
from fish
farming.
operationa
l
160 ESP
fish ponds
rehabilitat
ed
No. of fish ponds
rehabilitated
80 80 0 0 0 10 M
0 model
fish farms
No of model fish
farms established
and used to transfer
fish production
technologies to
farmers
16 16 16 16 16 100 M
0 model
fish cages
No of model fish
cages established
and used to transfer
fish production
technologies to
farmers
5 5 5 5 5 50 M
50 fish
farmers
No. of fish farmers
reached with
modern fish farming
technology
information
400 400 400 400 400 22.5 M
Aquacultur
e Business
Developme
nt
To improve
production,
productivit
y as well as
food
security
and
nutrition of
smallholder
farmers
- No. of households
reporting an
increase in
production and
graduated from
level 1
(subsistence) to
level 2 (semi-
commercial)
200 200 200 200 200 1B
- No. of households
reporting adoption
of environmentally
sustainable and
climate resilient
technologies and
practices
200 250 300 370 400
- No. of persons
reporting an
increase in
consumption of
fish
1500 2000 260
0
3200 3800
- No. of households
accessing
aquaculture
production input
and/or
technological
packages
80 120 160 230 280
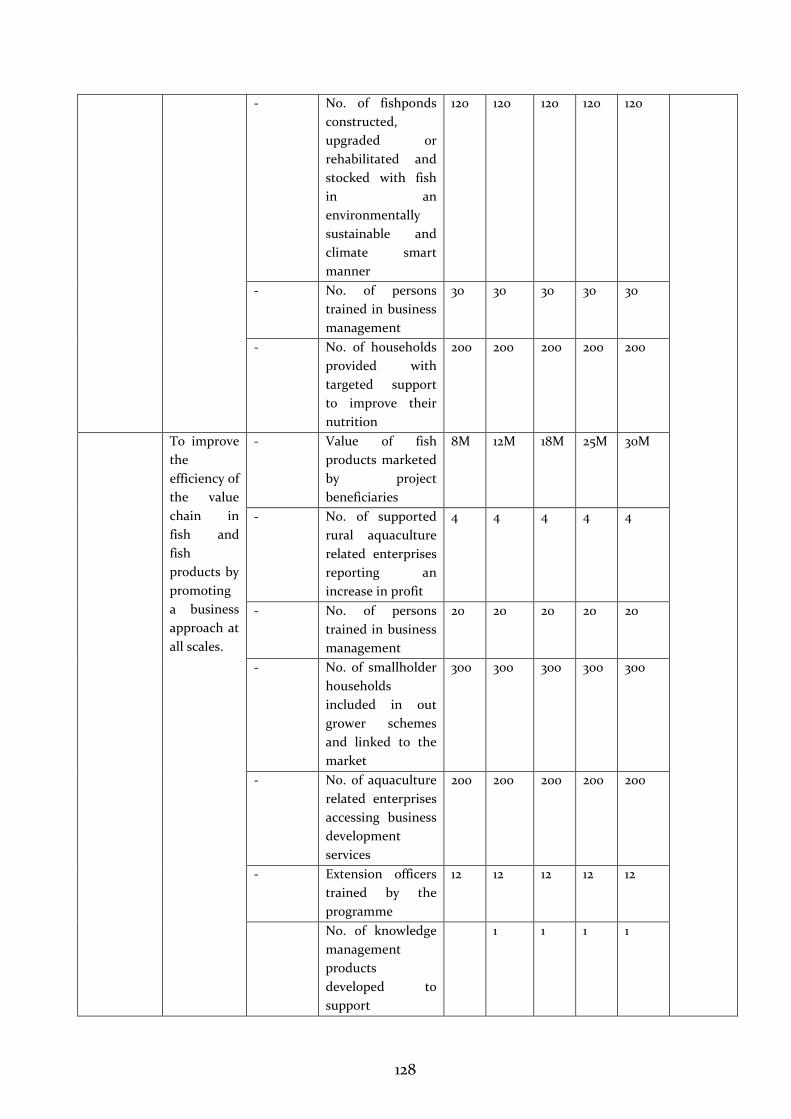
128
- No. of fishponds
constructed,
upgraded or
rehabilitated and
stocked with fish
in an
environmentally
sustainable and
climate smart
manner
120 120 120 120 120
- No. of persons
trained in business
management
30 30 30 30 30
- No. of households
provided with
targeted support
to improve their
nutrition
200 200 200 200 200
To improve
the
efficiency of
the value
chain in
fish and
fish
products by
promoting
a business
approach at
all scales.
- Value of fish
products marketed
by project
beneficiaries
8M 12M 18M 25M 30M
- No. of supported
rural aquaculture
related enterprises
reporting an
increase in profit
4 4 4 4 4
- No. of persons
trained in business
management
20 20 20 20 20
- No. of smallholder
households
included in out
grower schemes
and linked to the
market
300 300 300 300 300
- No. of aquaculture
related enterprises
accessing business
development
services
200 200 200 200 200
- Extension officers
trained by the
programme
12 12 12 12 12
No. of knowledge
management
products
developed to
support
1 1 1 1
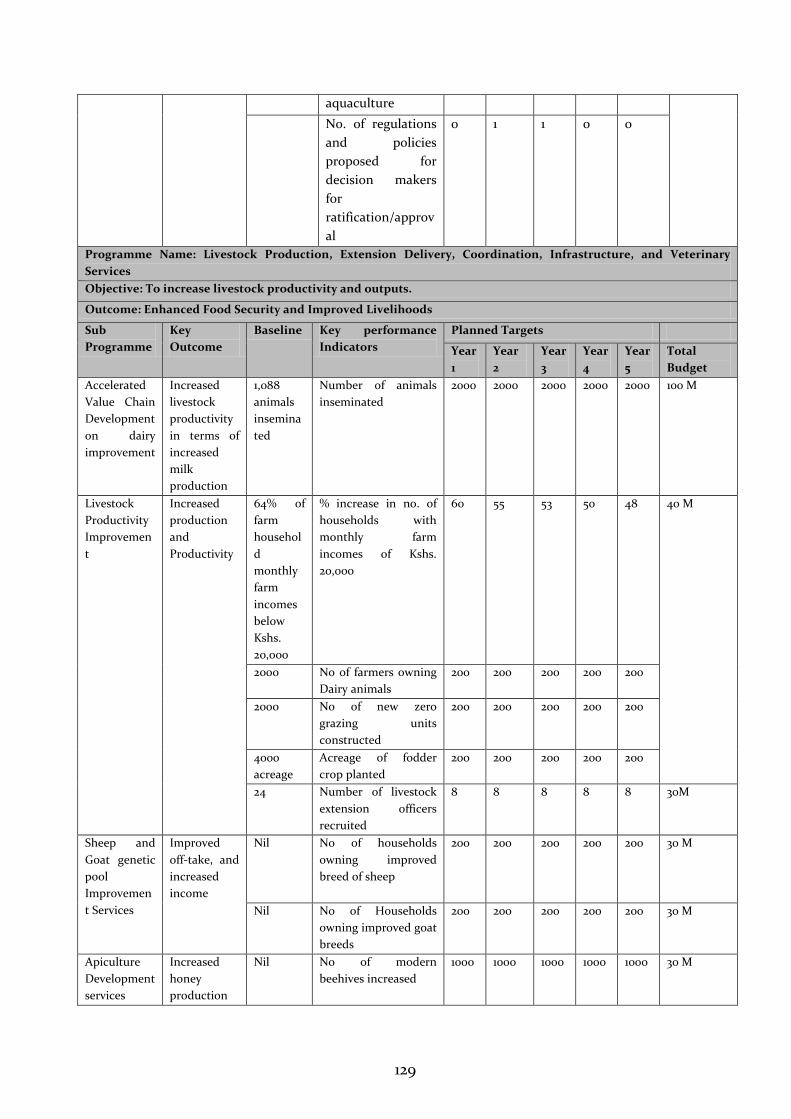
129
aquaculture
No. of regulations
and policies
proposed for
decision makers
for
ratification/approv
al
0 1 1 0 0
Programme Name: Livestock Production, Extension Delivery, Coordination, Infrastructure, and Veterinary
Services
Objective: To increase livestock productivity and outputs.
Outcome: Enhanced Food Security and Improved Livelihoods
Sub
Programme
Key
Outcome
Baseline Key performance
Indicators
Planned Targets
Year
1
Year
2
Year
3
Year
4
Year
5
Total
Budget
Accelerated
Value Chain
Development
on dairy
improvement
Increased
livestock
productivity
in terms of
increased
milk
production
1,088
animals
insemina
ted
Number of animals
inseminated
2000 2000 2000 2000 2000 100 M
Livestock
Productivity
Improvemen
t
Increased
production
and
Productivity
64% of
farm
househol
d
monthly
farm
incomes
below
Kshs.
20,000
% increase in no. of
households with
monthly farm
incomes of Kshs.
20,000
60 55 53 50 48 40 M
2000 No of farmers owning
Dairy animals
200 200 200 200 200
2000 No of new zero
grazing units
constructed
200 200 200 200 200
4000
acreage
Acreage of fodder
crop planted
200 200 200 200 200
24 Number of livestock
extension officers
recruited
8 8 8 8 8 30M
Sheep and
Goat genetic
pool
Improvemen
t Services
Improved
off-take, and
increased
income
Nil No of households
owning improved
breed of sheep
200 200 200 200 200 30 M
Nil No of Households
owning improved goat
breeds
200 200 200 200 200 30 M
Apiculture
Development
services
Increased
honey
production
Nil No of modern
beehives increased
1000 1000 1000 1000 1000 30 M
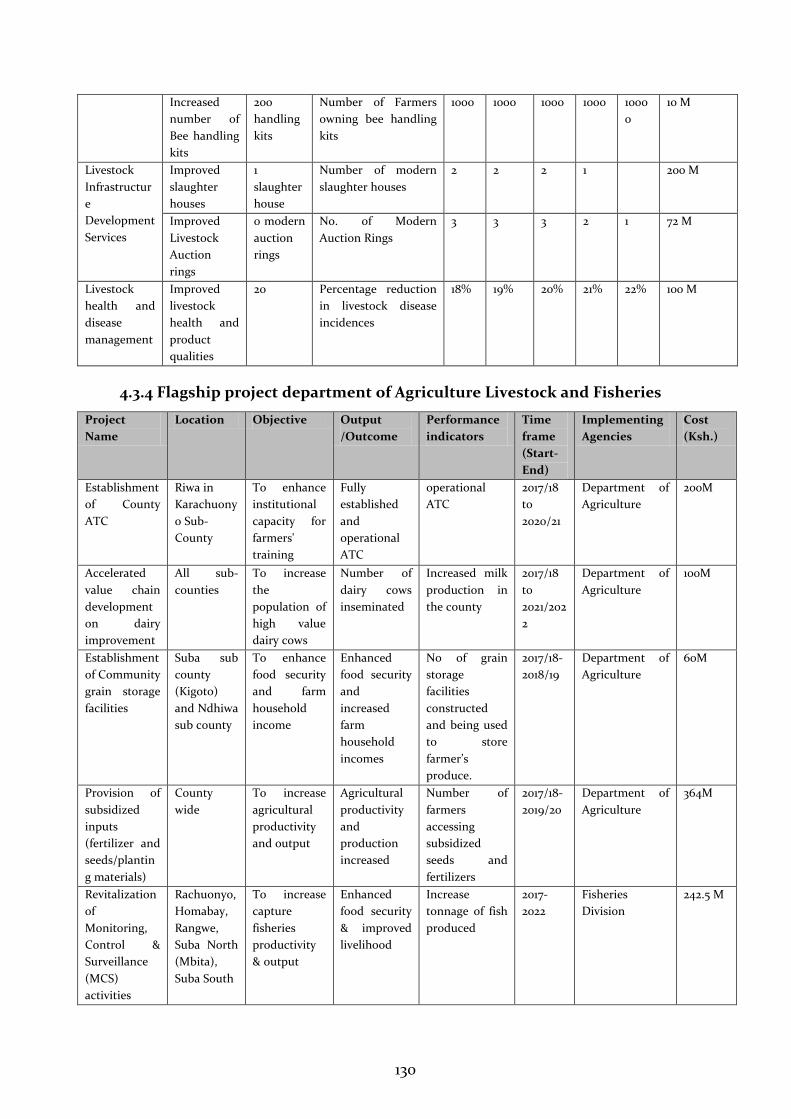
130
4.3.4 Flagship project department of Agriculture Livestock and Fisheries
Project
Name
Location Objective Output
/Outcome
Performance
indicators
Time
frame
(Start-
End)
Implementing
Agencies
Cost
(Ksh.)
Establishment
of County
ATC
Riwa in
Karachuony
o Sub-
County
To enhance
institutional
capacity for
farmers'
training
Fully
established
and
operational
ATC
operational
ATC
2017/18
to
2020/21
Department of
Agriculture
200M
Accelerated
value chain
development
on dairy
improvement
All sub-
counties
To increase
the
population of
high value
dairy cows
Number of
dairy cows
inseminated
Increased milk
production in
the county
2017/18
to
2021/202
2
Department of
Agriculture
100M
Establishment
of Community
grain storage
facilities
Suba sub
county
(Kigoto)
and Ndhiwa
sub county
To enhance
food security
and farm
household
income
Enhanced
food security
and
increased
farm
household
incomes
No of grain
storage
facilities
constructed
and being used
to store
farmer’s
produce.
2017/18-
2018/19
Department of
Agriculture
60M
Provision of
subsidized
inputs
(fertilizer and
seeds/plantin
g materials)
County
wide
To increase
agricultural
productivity
and output
Agricultural
productivity
and
production
increased
Number of
farmers
accessing
subsidized
seeds and
fertilizers
2017/18-
2019/20
Department of
Agriculture
364M
Revitalization
of
Monitoring,
Control &
Surveillance
(MCS)
activities
Rachuonyo,
Homabay,
Rangwe,
Suba North
(Mbita),
Suba South
To increase
capture
fisheries
productivity
& output
Enhanced
food security
& improved
livelihood
Increase
tonnage of fish
produced
2017-
2022
Fisheries
Division
242.5 M
Increased
number of
Bee handling
kits
200
handling
kits
Number of Farmers
owning bee handling
kits
1000 1000 1000 1000 1000
0
10 M
Livestock
Infrastructur
e
Development
Services
Improved
slaughter
houses
1
slaughter
house
Number of modern
slaughter houses
2 2 2 1 200 M
Improved
Livestock
Auction
rings
0 modern
auction
rings
No. of Modern
Auction Rings
3 3 3 2 1 72 M
Livestock
health and
disease
management
Improved
livestock
health and
product
qualities
20 Percentage reduction
in livestock disease
incidences
18% 19% 20% 21% 22% 100 M
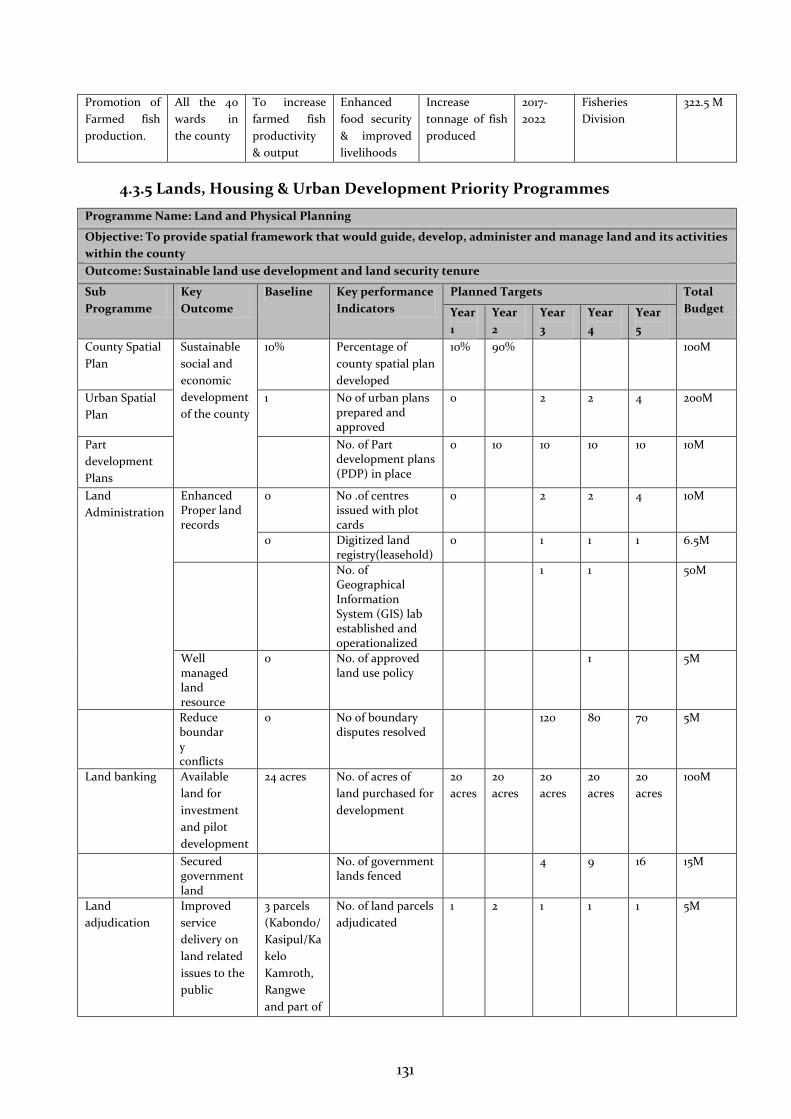
131
Promotion of
Farmed fish
production.
All the 40
wards in
the county
To increase
farmed fish
productivity
& output
Enhanced
food security
& improved
livelihoods
Increase
tonnage of fish
produced
2017-
2022
Fisheries
Division
322.5 M
4.3.5 Lands, Housing & Urban Development Priority Programmes
Programme Name: Land and Physical Planning
Objective: To provide spatial framework that would guide, develop, administer and manage land and its activities
within the county
Outcome: Sustainable land use development and land security tenure
Sub
Programme
Key
Outcome
Baseline Key performance
Indicators
Planned Targets Total
Budget Year
1
Year
2
Year
3
Year
4
Year
5
County Spatial
Plan
Sustainable
social and
economic
development
of the county
10% Percentage of
county spatial plan
developed
10% 90% 100M
Urban Spatial
Plan
1 No of urban plans prepared and approved
0 2 2 4 200M
Part
development
Plans
No. of Part development plans (PDP) in place
0 10 10 10 10 10M
Land
Administration
Enhanced Proper land records
0 No .of centres issued with plot cards
0 2 2 4 10M
0 Digitized land registry(leasehold)
0 1 1 1 6.5M
No. of Geographical Information System (GIS) lab established and operationalized
1 1 50M
Well managed land resource
0 No. of approved land use policy
1 5M
Reduce boundary conflicts
0 No of boundary disputes resolved
120 80 70 5M
Land banking Available
land for
investment
and pilot
development
24 acres No. of acres of
land purchased for
development
20
acres
20
acres
20
acres
20
acres
20
acres
100M
Secured government land
No. of government lands fenced
4 9 16 15M
Land
adjudication
Improved
service
delivery on
land related
issues to the
public
3 parcels
(Kabondo/
Kasipul/Ka
kelo
Kamroth,
Rangwe
and part of
No. of land parcels
adjudicated
1 2 1 1 1 5M
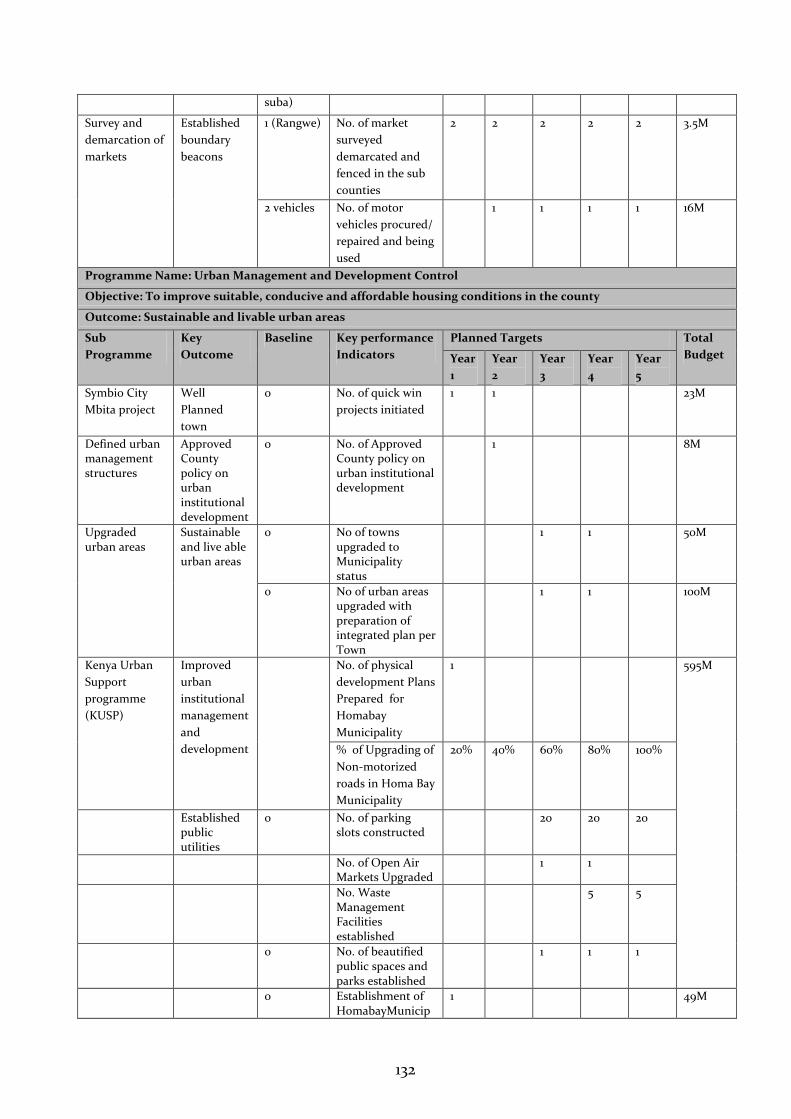
132
suba)
Survey and
demarcation of
markets
Established
boundary
beacons
1 (Rangwe) No. of market
surveyed
demarcated and
fenced in the sub
counties
2 2 2 2 2 3.5M
2 vehicles No. of motor
vehicles procured/
repaired and being
used
1 1 1 1 16M
Programme Name: Urban Management and Development Control
Objective: To improve suitable, conducive and affordable housing conditions in the county
Outcome: Sustainable and livable urban areas
Sub
Programme
Key
Outcome
Baseline Key performance
Indicators
Planned Targets Total
Budget Year
1
Year
2
Year
3
Year
4
Year
5
Symbio City
Mbita project
Well
Planned
town
0 No. of quick win
projects initiated
1 1 23M
Defined urban management structures
Approved County policy on urban institutional development
0 No. of Approved County policy on urban institutional development
1 8M
Upgraded urban areas
Sustainable and live able urban areas
0 No of towns upgraded to Municipality status
1 1 50M
0 No of urban areas upgraded with preparation of integrated plan per Town
1 1 100M
Kenya Urban
Support
programme
(KUSP)
Improved
urban
institutional
management
and
development
No. of physical
development Plans
Prepared for
Homabay
Municipality
1 595M
% of Upgrading of
Non-motorized
roads in Homa Bay
Municipality
20% 40% 60% 80% 100%
Established public utilities
0 No. of parking slots constructed
20 20 20
No. of Open Air Markets Upgraded
1 1
No. Waste Management Facilities established
5 5
0 No. of beautified public spaces and parks established
1 1 1
0 Establishment of HomabayMunicip
1 49M
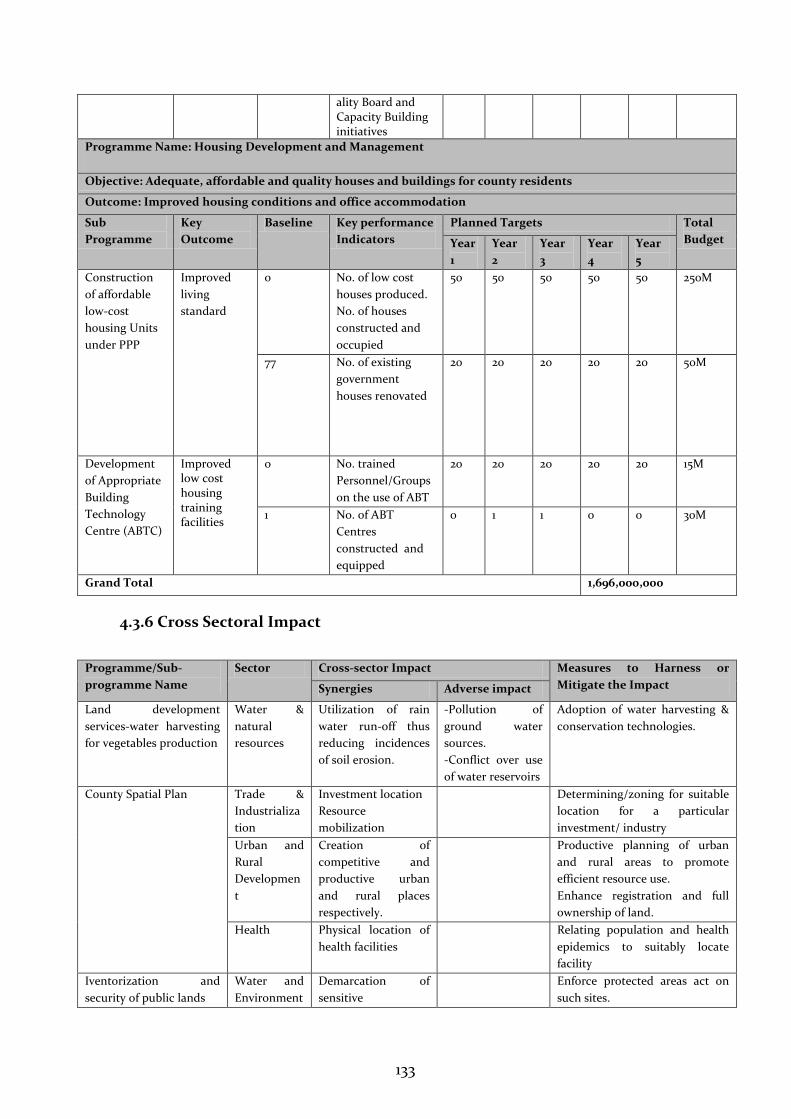
133
ality Board and Capacity Building initiatives
Programme Name: Housing Development and Management
Objective: Adequate, affordable and quality houses and buildings for county residents
Outcome: Improved housing conditions and office accommodation
Sub
Programme
Key
Outcome
Baseline Key performance
Indicators
Planned Targets Total
Budget Year
1
Year
2
Year
3
Year
4
Year
5
Construction
of affordable
low-cost
housing Units
under PPP
Improved
living
standard
0 No. of low cost
houses produced.
No. of houses
constructed and
occupied
50 50 50 50 50 250M
77 No. of existing
government
houses renovated
20 20
20 20 20 50M
Development
of Appropriate
Building
Technology
Centre (ABTC)
Improved low cost housing training facilities
0 No. trained
Personnel/Groups
on the use of ABT
20 20 20 20 20 15M
1 No. of ABT
Centres
constructed and
equipped
0 1 1 0 0 30M
Grand Total 1,696,000,000
4.3.6 Cross Sectoral Impact
Programme/Sub-
programme Name
Sector Cross-sector Impact Measures to Harness or
Mitigate the Impact Synergies Adverse impact
Land development
services-water harvesting
for vegetables production
Water &
natural
resources
Utilization of rain
water run-off thus
reducing incidences
of soil erosion.
-Pollution of
ground water
sources.
-Conflict over use
of water reservoirs
Adoption of water harvesting &
conservation technologies.
County Spatial Plan Trade &
Industrializa
tion
Investment location
Resource
mobilization
Determining/zoning for suitable
location for a particular
investment/ industry
Urban and
Rural
Developmen
t
Creation of
competitive and
productive urban
and rural places
respectively.
Productive planning of urban
and rural areas to promote
efficient resource use.
Enhance registration and full
ownership of land.
Health Physical location of
health facilities
Relating population and health
epidemics to suitably locate
facility
Iventorization and
security of public lands
Water and
Environment
Demarcation of
sensitive
Enforce protected areas act on
such sites.
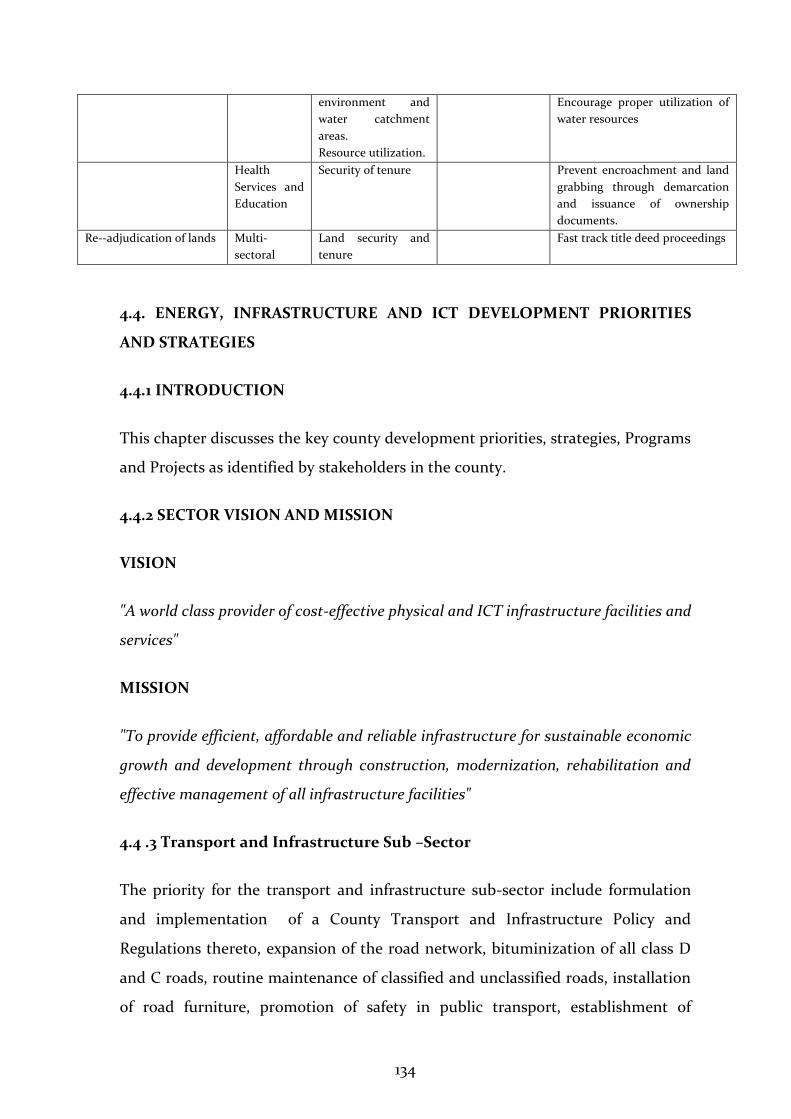
134
environment and
water catchment
areas.
Resource utilization.
Encourage proper utilization of
water resources
Health
Services and
Education
Security of tenure Prevent encroachment and land
grabbing through demarcation
and issuance of ownership
documents.
Re--adjudication of lands Multi-
sectoral
Land security and
tenure
Fast track title deed proceedings
4.4. ENERGY, INFRASTRUCTURE AND ICT DEVELOPMENT PRIORITIES
AND STRATEGIES
4.4.1 INTRODUCTION
This chapter discusses the key county development priorities, strategies, Programs
and Projects as identified by stakeholders in the county.
4.4.2 SECTOR VISION AND MISSION
VISION
"A world class provider of cost-effective physical and ICT infrastructure facilities and
services"
MISSION
"To provide efficient, affordable and reliable infrastructure for sustainable economic
growth and development through construction, modernization, rehabilitation and
effective management of all infrastructure facilities"
4.4 .3 Transport and Infrastructure Sub –Sector
The priority for the transport and infrastructure sub-sector include formulation
and implementation of a County Transport and Infrastructure Policy and
Regulations thereto, expansion of the road network, bituminization of all class D
and C roads, routine maintenance of classified and unclassified roads, installation
of road furniture, promotion of safety in public transport, establishment of
135
footbridges and culverts, modernization and expansion of airstrips and lake ports
and, establishment of a Roads Construction and Maintenance Agency.
The projects captured in the CIDP and sector plans include:
Opening, grading and gravelling of new roads and gravelling of the opened
roads.
Development of the Master Plan for Transport and Infrastructure
Bituminization of class C&D roads
Opening and improvement of all access roads.
Training of Boda Boda Riders to promote safety in the public transportation.
Installation of road furniture and construction of Single Span bridges
Improved safety to Road users, water and air transport facilities.
Developing policies and legislation to support the sectorial development
4.4.4 Energy and Mineral Resources Sub-Sector
VISION
"‘a wealthy county sustainably leveraging its mineral resources and able to meet its
energy needs for socio-economic development".
MISSION
"‘To spur social and economic development through sustainable use of mineral and
energy resources"
Demand for energy in Homa Bay County will vary from a low of 149.31Gwh to a
high of 284.25Gwh by the year 2030. This coupled with the rate of economic
growth in Homa Bay County and the changing lifestyles of the population will
greatly overstretch the capacity of existing power supply system in both the
present and future periods. The County Government will continue to work with
KPLC and other energy institutions to upgrade some of the 33/11kV substations
and facilitate investment in power generation plants within the county. Upgrading
136
will involve changes in transformation capacity of various substations and
installation of capacitors to boost the delivery of reactive power.
The county has good potential for:
1. Solar- annual average Global Horizontal Irradiation (GHI) values for the
county is 2280.4kwh/m2 –
2. Biomass – Various forms of Biomass capacity for energy production
include:
a. Hyacinth within the Homa Bay County alone could provide more
than 2.7million cubic meters of biogas (equivalent to 16.13GWh) per
day.
b. Sugar manufacturing waste from Ndhiwa Sugar Factory and other
facilities have a potential of increasing cogeneration capacity to
30MW.
c. Production of Briquettes from sugar Bagasse can be tapped across
three sub counties, i.e. Ndhiwa, Homa Bay and Mbita Sub counties.
3. Geothermal power generation - Studies by GDC indicate that Homa Hills
geothermal prospect has reservoir geothermometric temperatures ranging
from 1600C to 2350C, thus the estimated potential of Homa hills
geothermal is projected to be about 165MWe.
Hydropower has very minimal potential at a micro-level while wind speeds are
below magnitudes that could be considered favorable for commercial exploitation.
Further studies are needed to establish the exact hydropower potential given that
gauging stations have not been installed along all rivers within the county. At the
same time, meteorological stations should be installed to provide the necessary
ground trothing of wind speeds before ruling out the potential for wind power in
the county.
Priority for the energy and mineral resources sub-sector captured in CIDP for the
2018 – 2022 consideration will include but not limited to:
Expanding access to energy through rural electrification and last mile
connectivity, GBOPA, system maximization and installation of
transformers, installation of solar backup at public facilities, promotion of
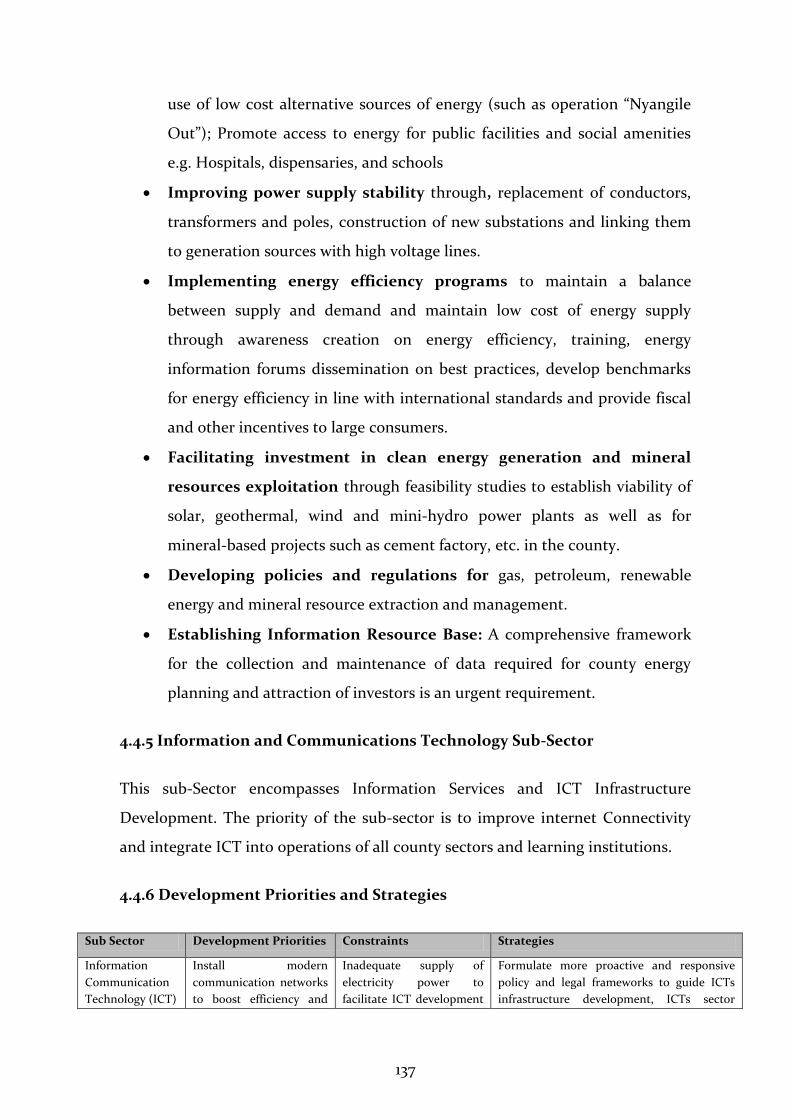
137
use of low cost alternative sources of energy (such as operation “Nyangile
Out”); Promote access to energy for public facilities and social amenities
e.g. Hospitals, dispensaries, and schools
Improving power supply stability through, replacement of conductors,
transformers and poles, construction of new substations and linking them
to generation sources with high voltage lines.
Implementing energy efficiency programs to maintain a balance
between supply and demand and maintain low cost of energy supply
through awareness creation on energy efficiency, training, energy
information forums dissemination on best practices, develop benchmarks
for energy efficiency in line with international standards and provide fiscal
and other incentives to large consumers.
Facilitating investment in clean energy generation and mineral
resources exploitation through feasibility studies to establish viability of
solar, geothermal, wind and mini-hydro power plants as well as for
mineral-based projects such as cement factory, etc. in the county.
Developing policies and regulations for gas, petroleum, renewable
energy and mineral resource extraction and management.
Establishing Information Resource Base: A comprehensive framework
for the collection and maintenance of data required for county energy
planning and attraction of investors is an urgent requirement.
4.4.5 Information and Communications Technology Sub-Sector
This sub-Sector encompasses Information Services and ICT Infrastructure
Development. The priority of the sub-sector is to improve internet Connectivity
and integrate ICT into operations of all county sectors and learning institutions.
4.4.6 Development Priorities and Strategies
Sub Sector Development Priorities Constraints Strategies
Information
Communication
Technology (ICT)
Install modern
communication networks
to boost efficiency and
Inadequate supply of
electricity power to
facilitate ICT development
Formulate more proactive and responsive
policy and legal frameworks to guide ICTs
infrastructure development, ICTs sector
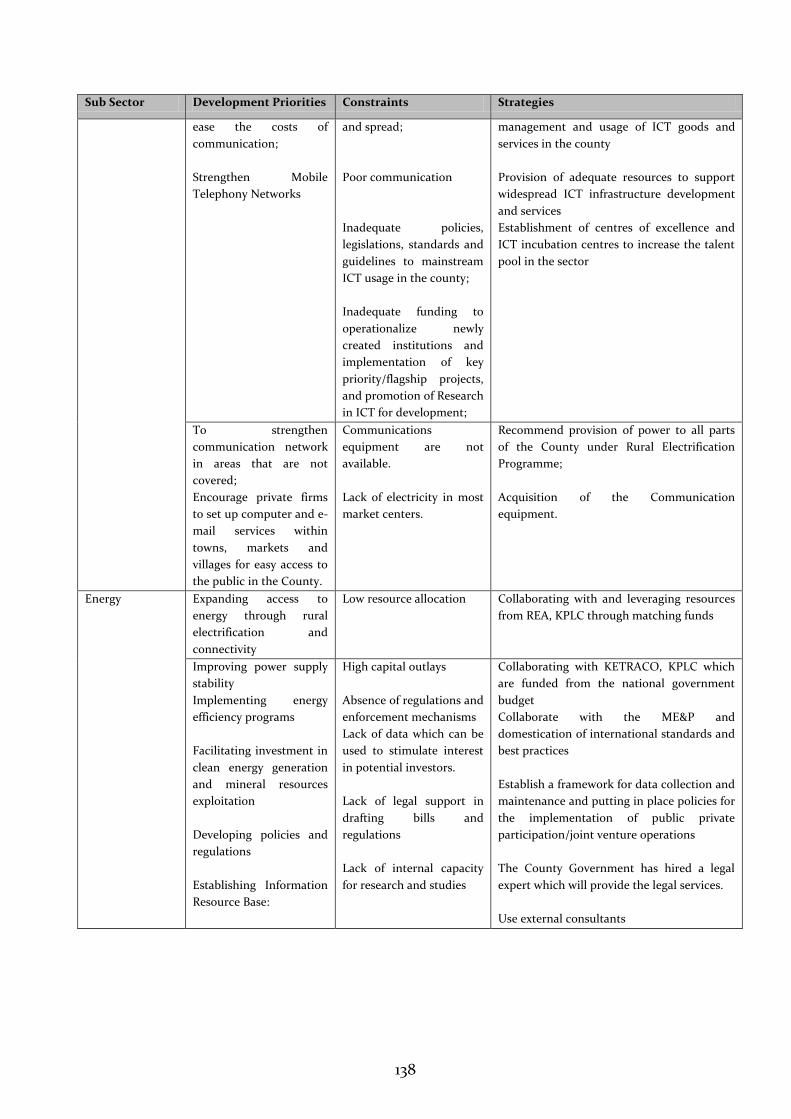
138
Sub Sector Development Priorities Constraints Strategies
ease the costs of
communication;
Strengthen Mobile
Telephony Networks
and spread;
Poor communication
Inadequate policies,
legislations, standards and
guidelines to mainstream
ICT usage in the county;
Inadequate funding to
operationalize newly
created institutions and
implementation of key
priority/flagship projects,
and promotion of Research
in ICT for development;
management and usage of ICT goods and
services in the county
Provision of adequate resources to support
widespread ICT infrastructure development
and services
Establishment of centres of excellence and
ICT incubation centres to increase the talent
pool in the sector
To strengthen
communication network
in areas that are not
covered;
Encourage private firms
to set up computer and e-
mail services within
towns, markets and
villages for easy access to
the public in the County.
Communications
equipment are not
available.
Lack of electricity in most
market centers.
Recommend provision of power to all parts
of the County under Rural Electrification
Programme;
Acquisition of the Communication
equipment.
Energy
Expanding access to
energy through rural
electrification and
connectivity
Low resource allocation Collaborating with and leveraging resources
from REA, KPLC through matching funds
Improving power supply
stability
Implementing energy
efficiency programs
Facilitating investment in
clean energy generation
and mineral resources
exploitation
Developing policies and
regulations
Establishing Information
Resource Base:
High capital outlays
Absence of regulations and
enforcement mechanisms
Lack of data which can be
used to stimulate interest
in potential investors.
Lack of legal support in
drafting bills and
regulations
Lack of internal capacity
for research and studies
Collaborating with KETRACO, KPLC which
are funded from the national government
budget
Collaborate with the ME&P and
domestication of international standards and
best practices
Establish a framework for data collection and
maintenance and putting in place policies for
the implementation of public private
participation/joint venture operations
The County Government has hired a legal
expert which will provide the legal services.
Use external consultants
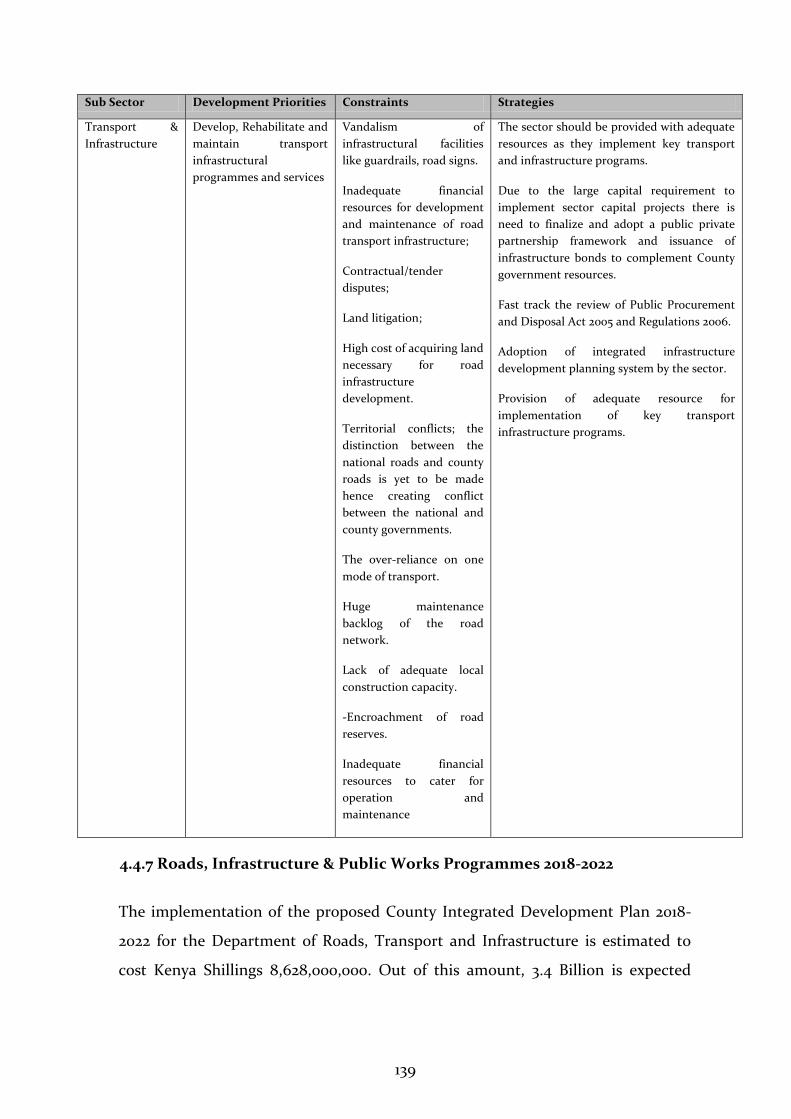
139
Sub Sector Development Priorities Constraints Strategies
Transport &
Infrastructure
Develop, Rehabilitate and
maintain transport
infrastructural
programmes and services
Vandalism of
infrastructural facilities
like guardrails, road signs.
Inadequate financial
resources for development
and maintenance of road
transport infrastructure;
Contractual/tender
disputes;
Land litigation;
High cost of acquiring land
necessary for road
infrastructure
development.
Territorial conflicts; the
distinction between the
national roads and county
roads is yet to be made
hence creating conflict
between the national and
county governments.
The over-reliance on one
mode of transport.
Huge maintenance
backlog of the road
network.
Lack of adequate local
construction capacity.
-Encroachment of road
reserves.
Inadequate financial
resources to cater for
operation and
maintenance
The sector should be provided with adequate
resources as they implement key transport
and infrastructure programs.
Due to the large capital requirement to
implement sector capital projects there is
need to finalize and adopt a public private
partnership framework and issuance of
infrastructure bonds to complement County
government resources.
Fast track the review of Public Procurement
and Disposal Act 2005 and Regulations 2006.
Adoption of integrated infrastructure
development planning system by the sector.
Provision of adequate resource for
implementation of key transport
infrastructure programs.
4.4.7 Roads, Infrastructure & Public Works Programmes 2018-2022
The implementation of the proposed County Integrated Development Plan 2018-
2022 for the Department of Roads, Transport and Infrastructure is estimated to
cost Kenya Shillings 8,628,000,000. Out of this amount, 3.4 Billion is expected
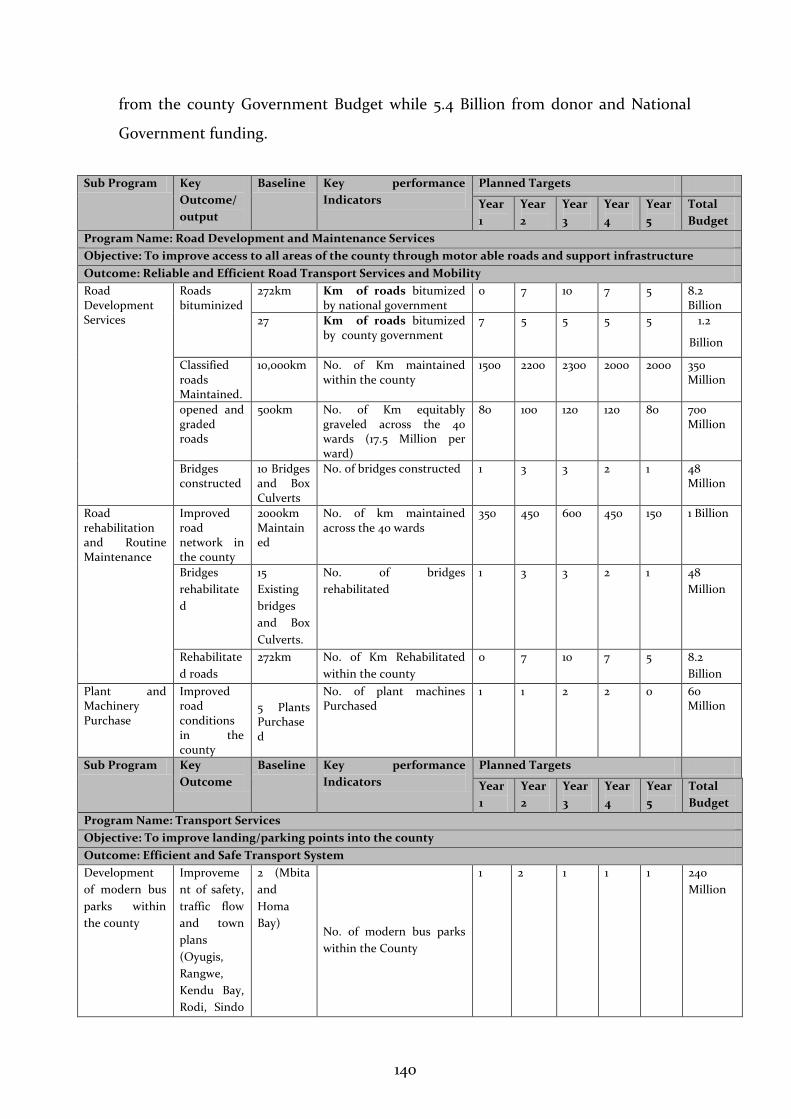
140
from the county Government Budget while 5.4 Billion from donor and National
Government funding.
Sub Program Key
Outcome/
output
Baseline Key performance
Indicators
Planned Targets
Year
1
Year
2
Year
3
Year
4
Year
5
Total
Budget
Program Name: Road Development and Maintenance Services
Objective: To improve access to all areas of the county through motor able roads and support infrastructure
Outcome: Reliable and Efficient Road Transport Services and Mobility
Road Development Services
Roads bituminized
272km Km of roads bitumized by national government
0 7 10 7 5 8.2 Billion
27 Km of roads bitumized by county government
7 5 5 5 5 1.2
Billion
Classified roads Maintained.
10,000km No. of Km maintained within the county
1500 2200 2300 2000 2000 350 Million
opened and graded roads
500km No. of Km equitably graveled across the 40 wards (17.5 Million per ward)
80 100 120 120 80 700 Million
Bridges constructed
10 Bridges and Box Culverts
No. of bridges constructed 1 3 3 2 1 48 Million
Road rehabilitation and Routine Maintenance
Improved road network in the county
2000km Maintained
No. of km maintained across the 40 wards
350 450 600 450 150 1 Billion
Bridges
rehabilitate
d
15
Existing
bridges
and Box
Culverts.
No. of bridges
rehabilitated
1 3 3 2 1 48
Million
Rehabilitate
d roads
272km No. of Km Rehabilitated
within the county
0 7 10 7 5 8.2
Billion
Plant and Machinery Purchase
Improved road conditions in the county
5 Plants Purchased
No. of plant machines Purchased
1 1 2 2 0 60 Million
Sub Program Key
Outcome
Baseline Key performance
Indicators
Planned Targets
Year
1
Year
2
Year
3
Year
4
Year
5
Total
Budget
Program Name: Transport Services
Objective: To improve landing/parking points into the county
Outcome: Efficient and Safe Transport System
Development
of modern bus
parks within
the county
Improveme
nt of safety,
traffic flow
and town
plans
(Oyugis,
Rangwe,
Kendu Bay,
Rodi, Sindo
2 (Mbita
and
Homa
Bay) No. of modern bus parks
within the County
1 2 1 1 1 240
Million
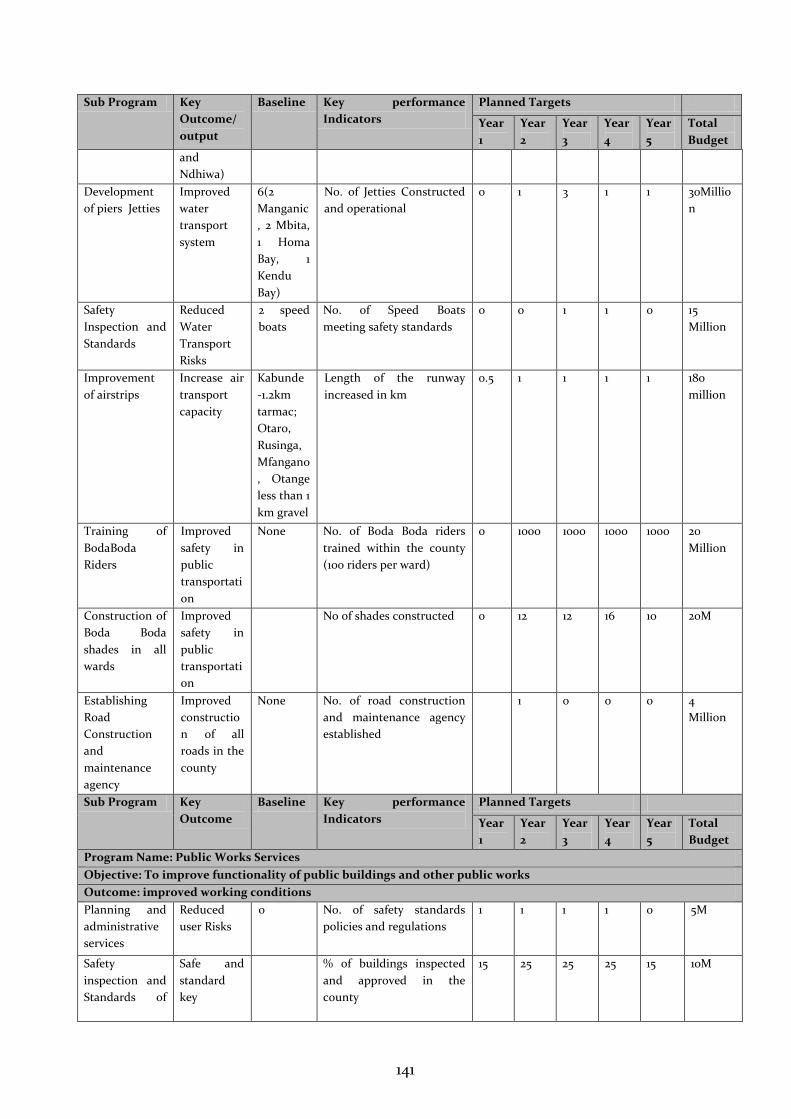
141
Sub Program Key
Outcome/
output
Baseline Key performance
Indicators
Planned Targets
Year
1
Year
2
Year
3
Year
4
Year
5
Total
Budget
and
Ndhiwa)
Development
of piers Jetties
Improved
water
transport
system
6(2
Manganic
, 2 Mbita,
1 Homa
Bay, 1
Kendu
Bay)
No. of Jetties Constructed
and operational
0 1 3 1 1 30Millio
n
Safety
Inspection and
Standards
Reduced
Water
Transport
Risks
2 speed
boats
No. of Speed Boats
meeting safety standards
0 0 1 1 0 15
Million
Improvement
of airstrips
Increase air
transport
capacity
Kabunde
-1.2km
tarmac;
Otaro,
Rusinga,
Mfangano
, Otange
less than 1
km gravel
Length of the runway
increased in km
0.5 1 1 1 1 180
million
Training of
BodaBoda
Riders
Improved
safety in
public
transportati
on
None No. of Boda Boda riders
trained within the county
(100 riders per ward)
0 1000 1000 1000 1000 20
Million
Construction of
Boda Boda
shades in all
wards
Improved
safety in
public
transportati
on
No of shades constructed 0 12 12 16 10 20M
Establishing
Road
Construction
and
maintenance
agency
Improved
constructio
n of all
roads in the
county
None No. of road construction
and maintenance agency
established
1 0 0 0 4
Million
Sub Program Key
Outcome
Baseline Key performance
Indicators
Planned Targets
Year
1
Year
2
Year
3
Year
4
Year
5
Total
Budget
Program Name: Public Works Services
Objective: To improve functionality of public buildings and other public works
Outcome: improved working conditions
Planning and
administrative
services
Reduced
user Risks
0 No. of safety standards
policies and regulations
1
1
1
1
0
5M
Safety
inspection and
Standards of
Safe and
standard
key
% of buildings inspected
and approved in the
county
15 25 25 25 15 10M
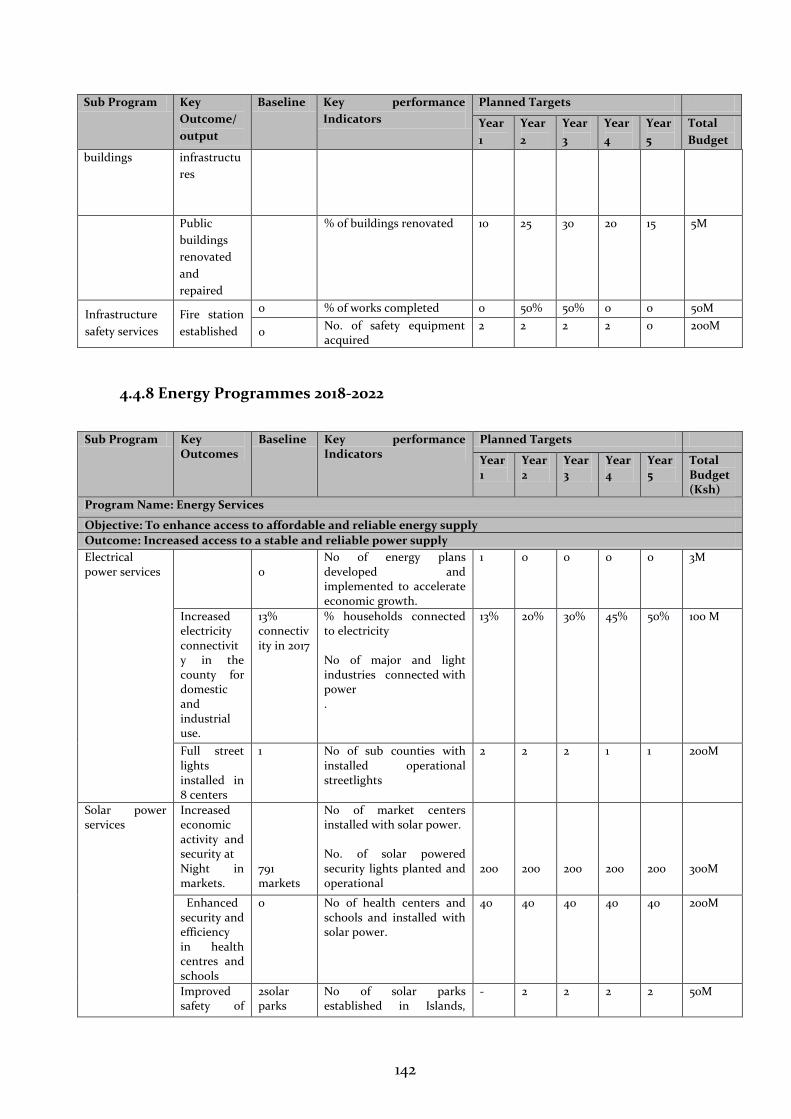
142
Sub Program Key
Outcome/
output
Baseline Key performance
Indicators
Planned Targets
Year
1
Year
2
Year
3
Year
4
Year
5
Total
Budget
buildings infrastructu
res
Public
buildings
renovated
and
repaired
% of buildings renovated 10 25 30 20 15 5M
Infrastructure
safety services
Fire station
established
0 % of works completed 0 50% 50% 0 0 50M
0 No. of safety equipment acquired
2 2 2 2 0 200M
4.4.8 Energy Programmes 2018-2022
Sub Program Key Outcomes
Baseline Key performance Indicators
Planned Targets
Year 1
Year 2
Year 3
Year 4
Year 5
Total Budget (Ksh)
Program Name: Energy Services
Objective: To enhance access to affordable and reliable energy supply
Outcome: Increased access to a stable and reliable power supply
Electrical power services
0
No of energy plans developed and implemented to accelerate economic growth.
1 0 0 0 0 3M
Increased electricity connectivity in the county for domestic and industrial use.
13% connectivity in 2017
% households connected to electricity No of major and light industries connected with power .
13% 20% 30% 45% 50% 100 M
Full street lights installed in 8 centers
1 No of sub counties with installed operational streetlights
2 2 2 1 1 200M
Solar power services
Increased economic activity and security at Night in markets.
791 markets
No of market centers installed with solar power. No. of solar powered security lights planted and operational
200
200
200
200
200
300M
Enhanced security and efficiency in health centres and schools
0 No of health centers and schools and installed with solar power.
40 40 40 40 40 200M
Improved safety of
2solar parks
No of solar parks established in Islands,
- 2 2 2 2 50M
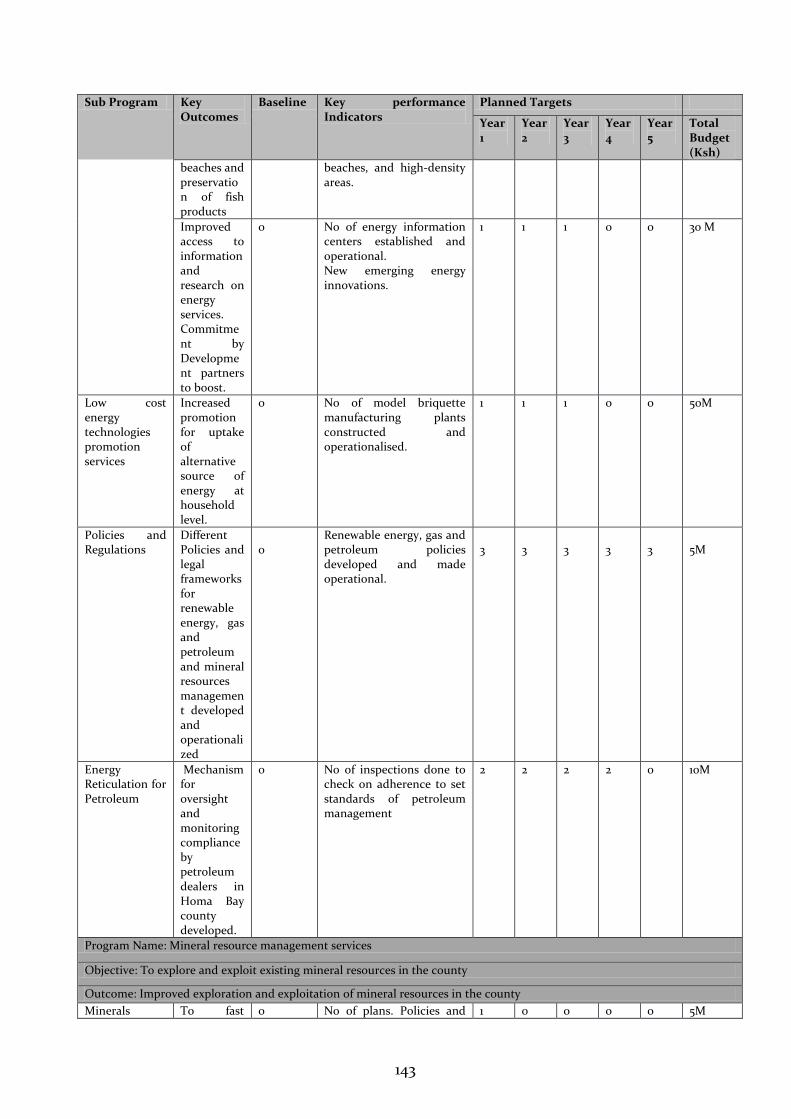
143
Sub Program Key Outcomes
Baseline Key performance Indicators
Planned Targets
Year 1
Year 2
Year 3
Year 4
Year 5
Total Budget (Ksh)
beaches and preservation of fish products
beaches, and high-density areas.
Improved access to information and research on energy services. Commitment by Development partners to boost.
0 No of energy information centers established and operational. New emerging energy innovations.
1 1 1 0 0 30 M
Low cost energy technologies promotion services
Increased promotion for uptake of alternative source of energy at household level.
0 No of model briquette manufacturing plants constructed and operationalised.
1 1 1 0 0 50M
Policies and Regulations
Different Policies and legal frameworks for renewable energy, gas and petroleum and mineral resources management developed and operationalized
0
Renewable energy, gas and petroleum policies developed and made operational.
3
3
3
3
3
5M
Energy Reticulation for Petroleum
Mechanism for oversight and monitoring compliance by petroleum dealers in Homa Bay county developed.
0 No of inspections done to check on adherence to set standards of petroleum management
2 2 2 2 0 10M
Program Name: Mineral resource management services
Objective: To explore and exploit existing mineral resources in the county
Outcome: Improved exploration and exploitation of mineral resources in the county
Minerals To fast 0 No of plans. Policies and 1 0 0 0 0 5M
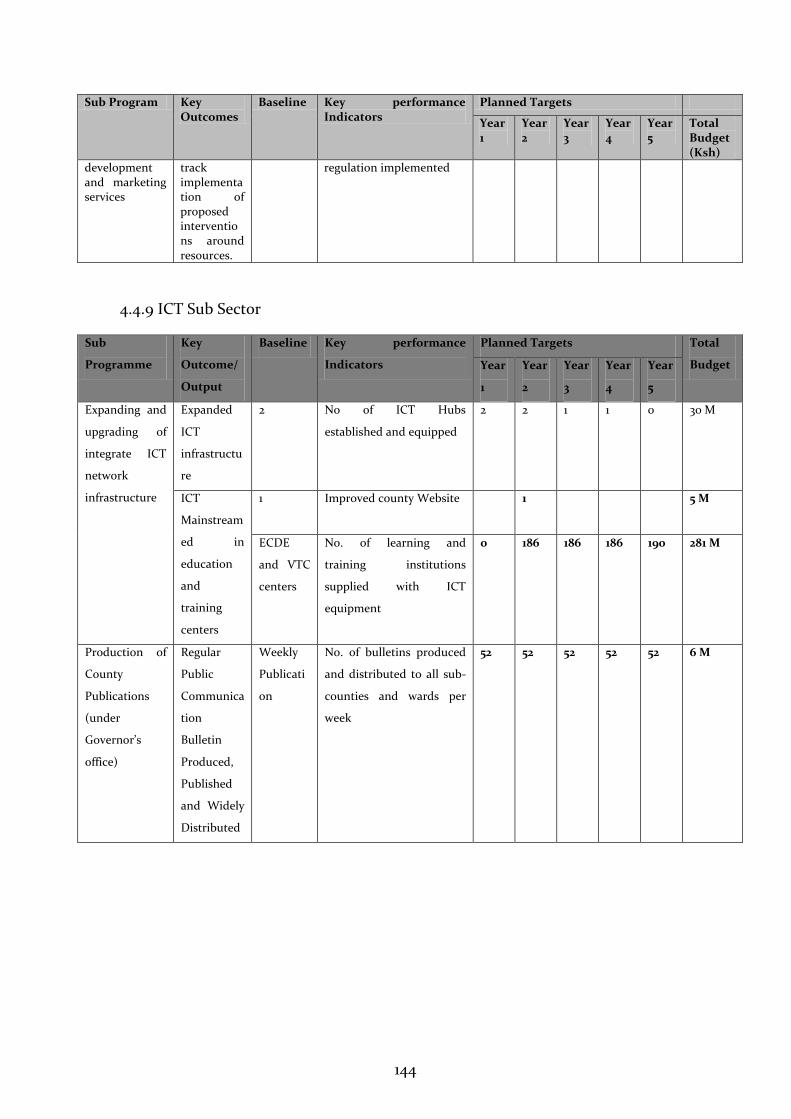
144
Sub Program Key Outcomes
Baseline Key performance Indicators
Planned Targets
Year 1
Year 2
Year 3
Year 4
Year 5
Total Budget (Ksh)
development and marketing services
track implementation of proposed interventions around resources.
regulation implemented
4.4.9 ICT Sub Sector
Sub
Programme
Key
Outcome/
Output
Baseline Key performance
Indicators
Planned Targets Total
Budget Year
1
Year
2
Year
3
Year
4
Year
5
Expanding and
upgrading of
integrate ICT
network
infrastructure
Expanded
ICT
infrastructu
re
2 No of ICT Hubs
established and equipped
2 2 1 1 0 30 M
ICT
Mainstream
ed in
education
and
training
centers
1 Improved county Website
1 5 M
ECDE
and VTC
centers
No. of learning and
training institutions
supplied with ICT
equipment
0 186 186 186 190 281 M
Production of
County
Publications
(under
Governor’s
office)
Regular
Public
Communica
tion
Bulletin
Produced,
Published
and Widely
Distributed
Weekly
Publicati
on
No. of bulletins produced
and distributed to all sub-
counties and wards per
week
52 52 52 52 52 6 M
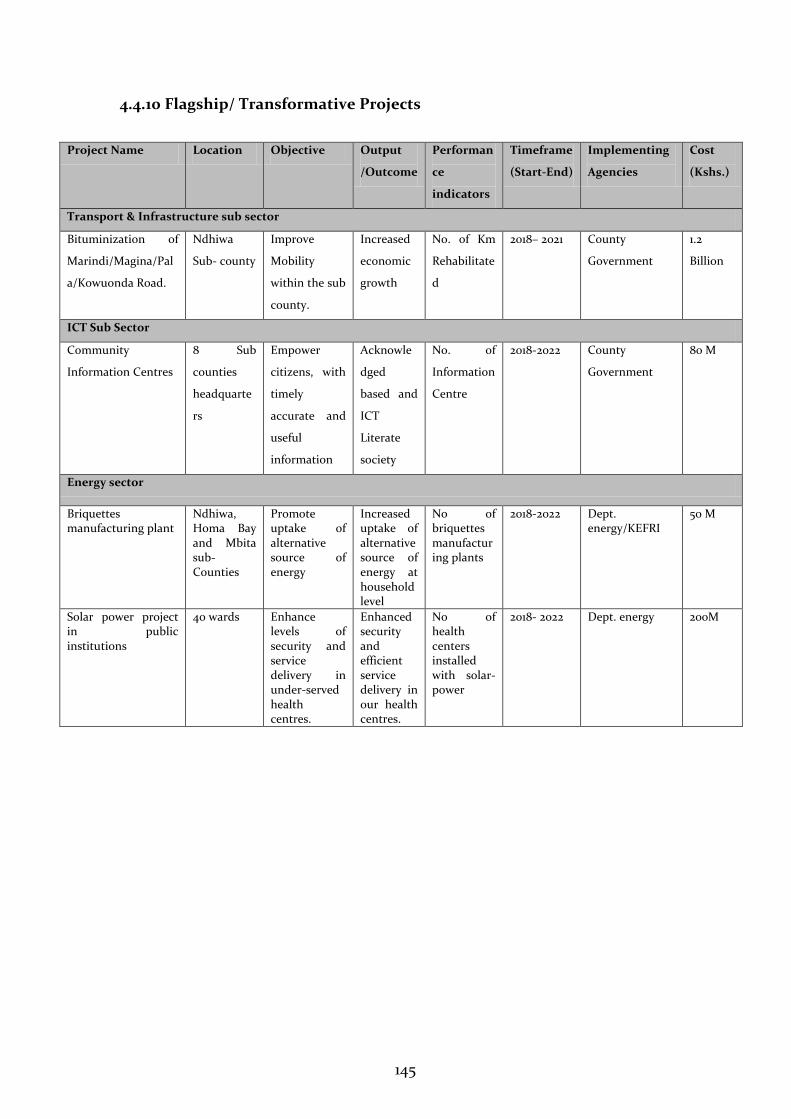
145
4.4.10 Flagship/ Transformative Projects
Project Name Location Objective Output
/Outcome
Performan
ce
indicators
Timeframe
(Start-End)
Implementing
Agencies
Cost
(Kshs.)
Transport & Infrastructure sub sector
Bituminization of
Marindi/Magina/Pal
a/Kowuonda Road.
Ndhiwa
Sub- county
Improve
Mobility
within the sub
county.
Increased
economic
growth
No. of Km
Rehabilitate
d
2018– 2021 County
Government
1.2
Billion
ICT Sub Sector
Community
Information Centres
8 Sub
counties
headquarte
rs
Empower
citizens, with
timely
accurate and
useful
information
Acknowle
dged
based and
ICT
Literate
society
No. of
Information
Centre
2018-2022 County
Government
80 M
Energy sector
Briquettes manufacturing plant
Ndhiwa, Homa Bay and Mbita sub-Counties
Promote uptake of alternative source of energy
Increased uptake of alternative source of energy at household level
No of briquettes manufacturing plants
2018-2022 Dept. energy/KEFRI
50 M
Solar power project in public institutions
40 wards Enhance levels of security and service delivery in under-served health centres.
Enhanced security and efficient service delivery in our health centres.
No of health centers installed with solar-power
2018- 2022 Dept. energy 200M
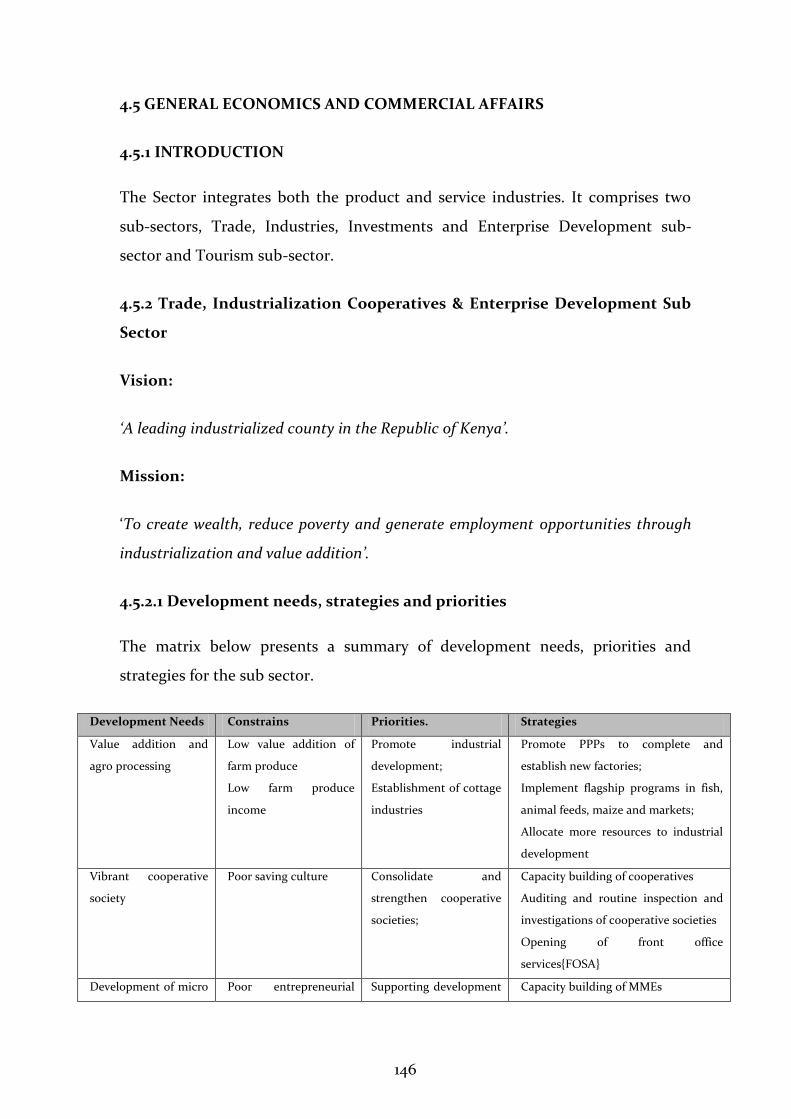
146
4.5 GENERAL ECONOMICS AND COMMERCIAL AFFAIRS
4.5.1 INTRODUCTION
The Sector integrates both the product and service industries. It comprises two
sub-sectors, Trade, Industries, Investments and Enterprise Development sub-
sector and Tourism sub-sector.
4.5.2 Trade, Industrialization Cooperatives & Enterprise Development Sub
Sector
Vision:
‘A leading industrialized county in the Republic of Kenya’.
Mission:
‘To create wealth, reduce poverty and generate employment opportunities through
industrialization and value addition’.
4.5.2.1 Development needs, strategies and priorities
The matrix below presents a summary of development needs, priorities and
strategies for the sub sector.
Development Needs Constrains Priorities. Strategies
Value addition and
agro processing
Low value addition of
farm produce
Low farm produce
income
Promote industrial
development;
Establishment of cottage
industries
Promote PPPs to complete and
establish new factories;
Implement flagship programs in fish,
animal feeds, maize and markets;
Allocate more resources to industrial
development
Vibrant cooperative
society
Poor saving culture
Consolidate and
strengthen cooperative
societies;
Capacity building of cooperatives
Auditing and routine inspection and
investigations of cooperative societies
Opening of front office
services{FOSA}
Development of micro Poor entrepreneurial Supporting development Capacity building of MMEs
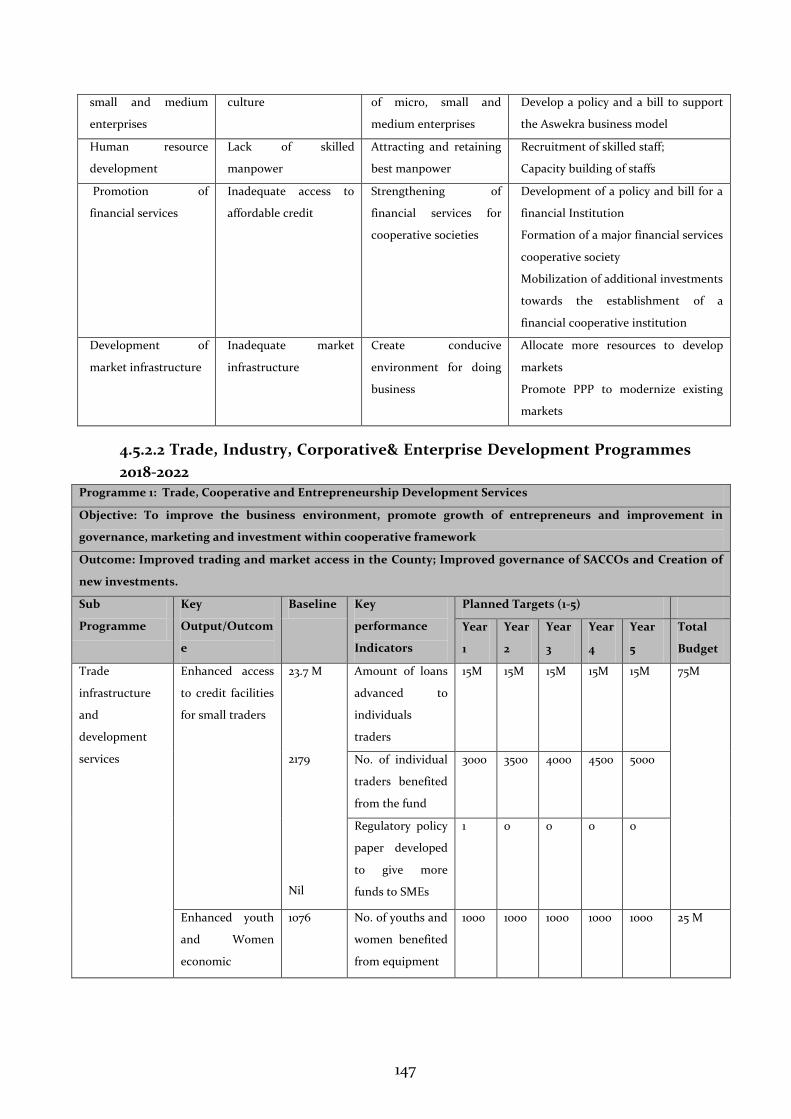
147
small and medium
enterprises
culture of micro, small and
medium enterprises
Develop a policy and a bill to support
the Aswekra business model
Human resource
development
Lack of skilled
manpower
Attracting and retaining
best manpower
Recruitment of skilled staff;
Capacity building of staffs
Promotion of
financial services
Inadequate access to
affordable credit
Strengthening of
financial services for
cooperative societies
Development of a policy and bill for a
financial Institution
Formation of a major financial services
cooperative society
Mobilization of additional investments
towards the establishment of a
financial cooperative institution
Development of
market infrastructure
Inadequate market
infrastructure
Create conducive
environment for doing
business
Allocate more resources to develop
markets
Promote PPP to modernize existing
markets
4.5.2.2 Trade, Industry, Corporative& Enterprise Development Programmes
2018-2022 Programme 1: Trade, Cooperative and Entrepreneurship Development Services
Objective: To improve the business environment, promote growth of entrepreneurs and improvement in
governance, marketing and investment within cooperative framework
Outcome: Improved trading and market access in the County; Improved governance of SACCOs and Creation of
new investments.
Sub
Programme
Key
Output/Outcom
e
Baseline Key
performance
Indicators
Planned Targets (1-5)
Year
1
Year
2
Year
3
Year
4
Year
5
Total
Budget
Trade
infrastructure
and
development
services
Enhanced access
to credit facilities
for small traders
23.7 M
2179
Nil
Amount of loans
advanced to
individuals
traders
15M
15M
15M 15M 15M
75M
No. of individual
traders benefited
from the fund
3000 3500 4000 4500 5000
Regulatory policy
paper developed
to give more
funds to SMEs
1 0 0 0 0
Enhanced youth
and Women
economic
1076
No. of youths and
women benefited
from equipment
1000 1000 1000 1000 1000 25 M
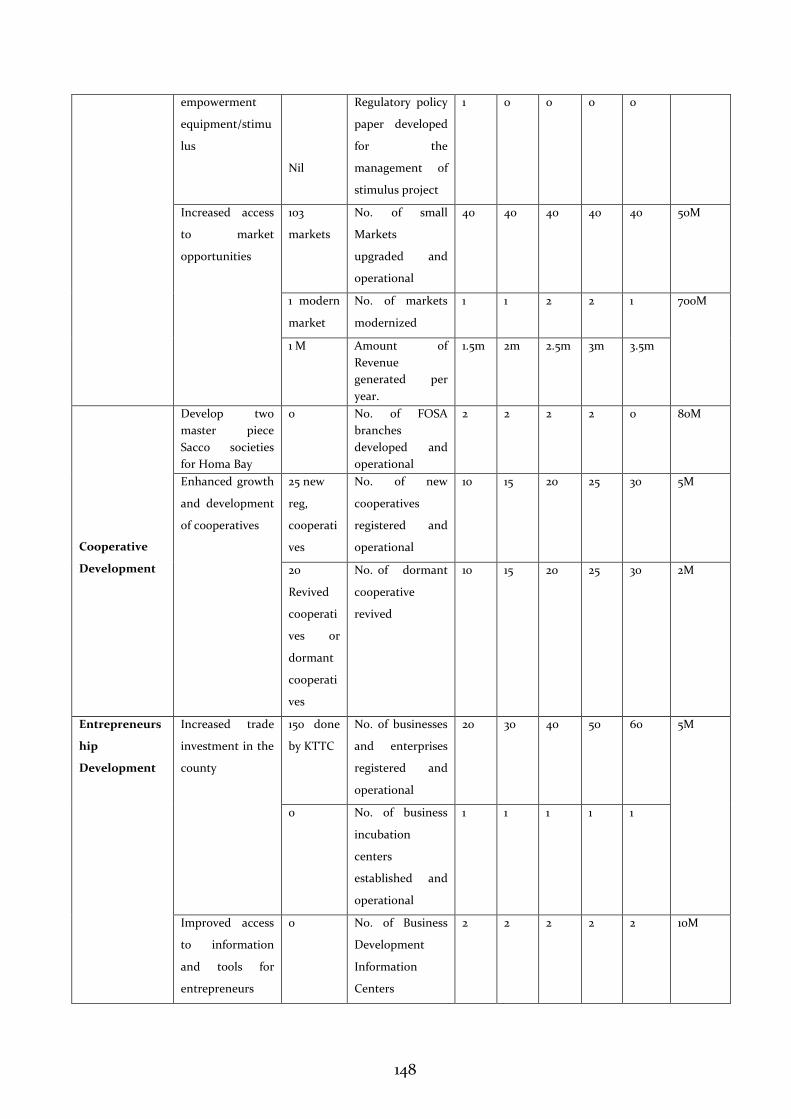
148
empowerment
equipment/stimu
lus
Nil
Regulatory policy
paper developed
for the
management of
stimulus project
1 0 0 0 0
Increased access
to market
opportunities
103
markets
No. of small
Markets
upgraded and
operational
40 40 40 40 40 50M
1 modern
market
No. of markets
modernized
1 1 2 2 1 700M
1 M Amount of
Revenue
generated per
year.
1.5m 2m 2.5m 3m 3.5m
Cooperative
Development
Develop two
master piece
Sacco societies
for Homa Bay
0 No. of FOSA
branches
developed and
operational
2 2 2 2 0 80M
Enhanced growth
and development
of cooperatives
25 new
reg,
cooperati
ves
No. of new
cooperatives
registered and
operational
10 15 20 25 30 5M
20
Revived
cooperati
ves or
dormant
cooperati
ves
No. of dormant
cooperative
revived
10 15 20 25 30 2M
Entrepreneurs
hip
Development
Increased trade
investment in the
county
150 done
by KTTC
No. of businesses
and enterprises
registered and
operational
20 30 40 50 60 5M
0 No. of business
incubation
centers
established and
operational
1 1 1 1 1
Improved access
to information
and tools for
entrepreneurs
0 No. of Business
Development
Information
Centers
2 2 2 2 2 10M
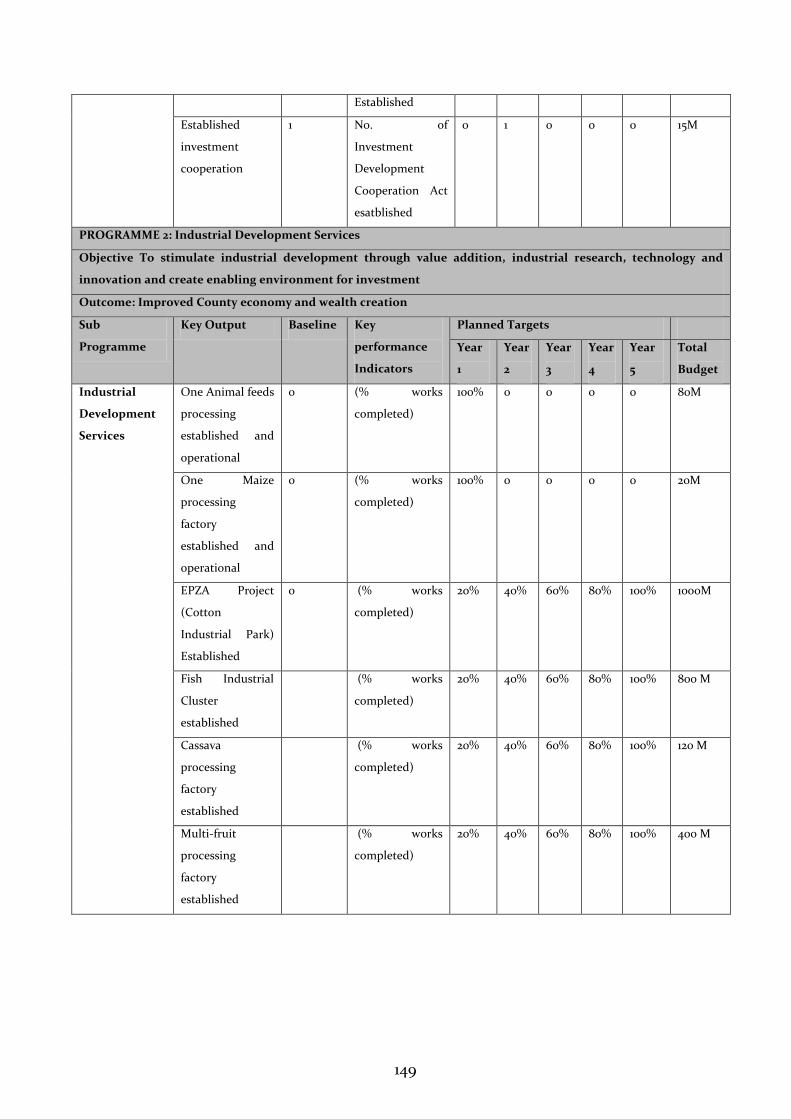
149
Established
Established
investment
cooperation
1 No. of
Investment
Development
Cooperation Act
esatblished
0 1 0 0 0 15M
PROGRAMME 2: Industrial Development Services
Objective To stimulate industrial development through value addition, industrial research, technology and
innovation and create enabling environment for investment
Outcome: Improved County economy and wealth creation
Sub
Programme
Key Output Baseline Key
performance
Indicators
Planned Targets
Year
1
Year
2
Year
3
Year
4
Year
5
Total
Budget
Industrial
Development
Services
One Animal feeds
processing
established and
operational
0 (% works
completed)
100% 0 0 0 0 80M
One Maize
processing
factory
established and
operational
0 (% works
completed)
100% 0 0 0 0 20M
EPZA Project
(Cotton
Industrial Park)
Established
0 (% works
completed)
20% 40% 60% 80% 100% 1000M
Fish Industrial
Cluster
established
(% works
completed)
20% 40% 60% 80% 100% 800 M
Cassava
processing
factory
established
(% works
completed)
20% 40% 60% 80% 100% 120 M
Multi-fruit
processing
factory
established
(% works
completed)
20% 40% 60% 80% 100% 400 M
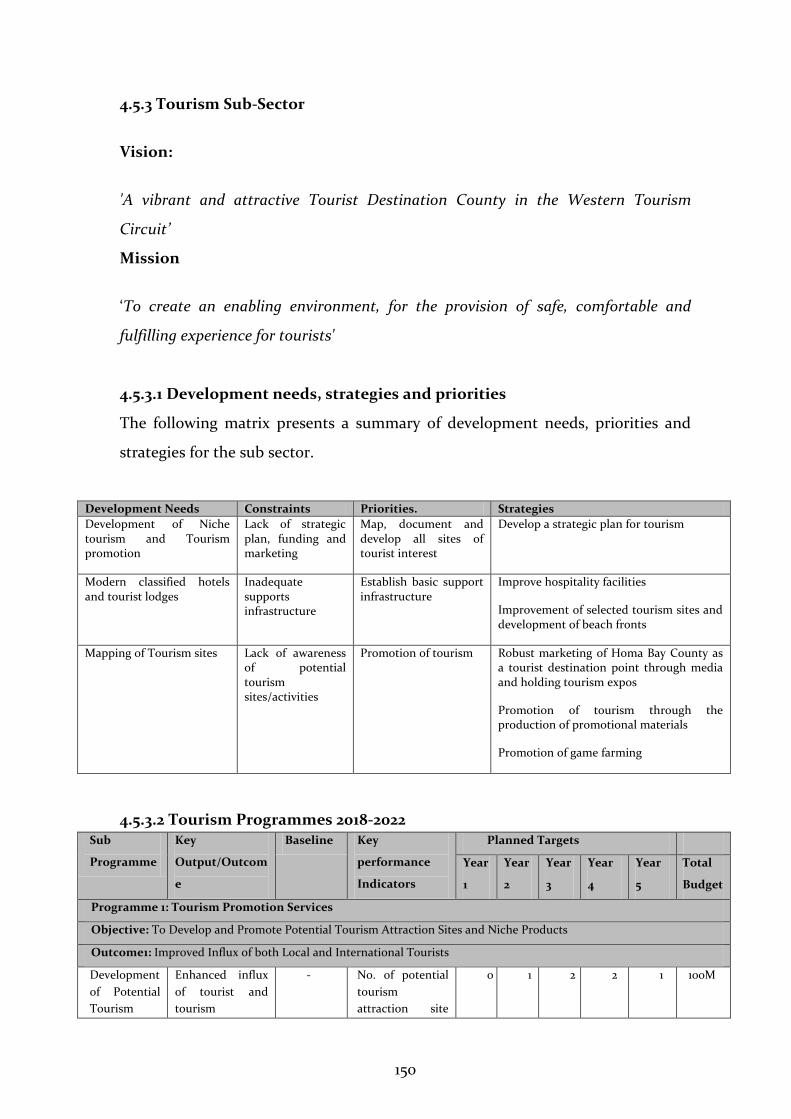
150
4.5.3 Tourism Sub-Sector
Vision:
'A vibrant and attractive Tourist Destination County in the Western Tourism
Circuit’
Mission
‘To create an enabling environment, for the provision of safe, comfortable and
fulfilling experience for tourists'
4.5.3.1 Development needs, strategies and priorities
The following matrix presents a summary of development needs, priorities and
strategies for the sub sector.
Development Needs Constraints Priorities. Strategies
Development of Niche tourism and Tourism promotion
Lack of strategic plan, funding and marketing
Map, document and develop all sites of tourist interest
Develop a strategic plan for tourism
Modern classified hotels and tourist lodges
Inadequate supports infrastructure
Establish basic support infrastructure
Improve hospitality facilities
Improvement of selected tourism sites and development of beach fronts
Mapping of Tourism sites Lack of awareness of potential tourism sites/activities
Promotion of tourism Robust marketing of Homa Bay County as a tourist destination point through media and holding tourism expos
Promotion of tourism through the production of promotional materials
Promotion of game farming
4.5.3.2 Tourism Programmes 2018-2022 Sub
Programme
Key
Output/Outcom
e
Baseline Key
performance
Indicators
Planned Targets
Year
1
Year
2
Year
3
Year
4
Year
5
Total
Budget
Programme 1: Tourism Promotion Services
Objective: To Develop and Promote Potential Tourism Attraction Sites and Niche Products
Outcome1: Improved Influx of both Local and International Tourists
Development
of Potential
Tourism
Enhanced influx
of tourist and
tourism
- No. of potential
tourism
attraction site
0 1 2 2 1 100M
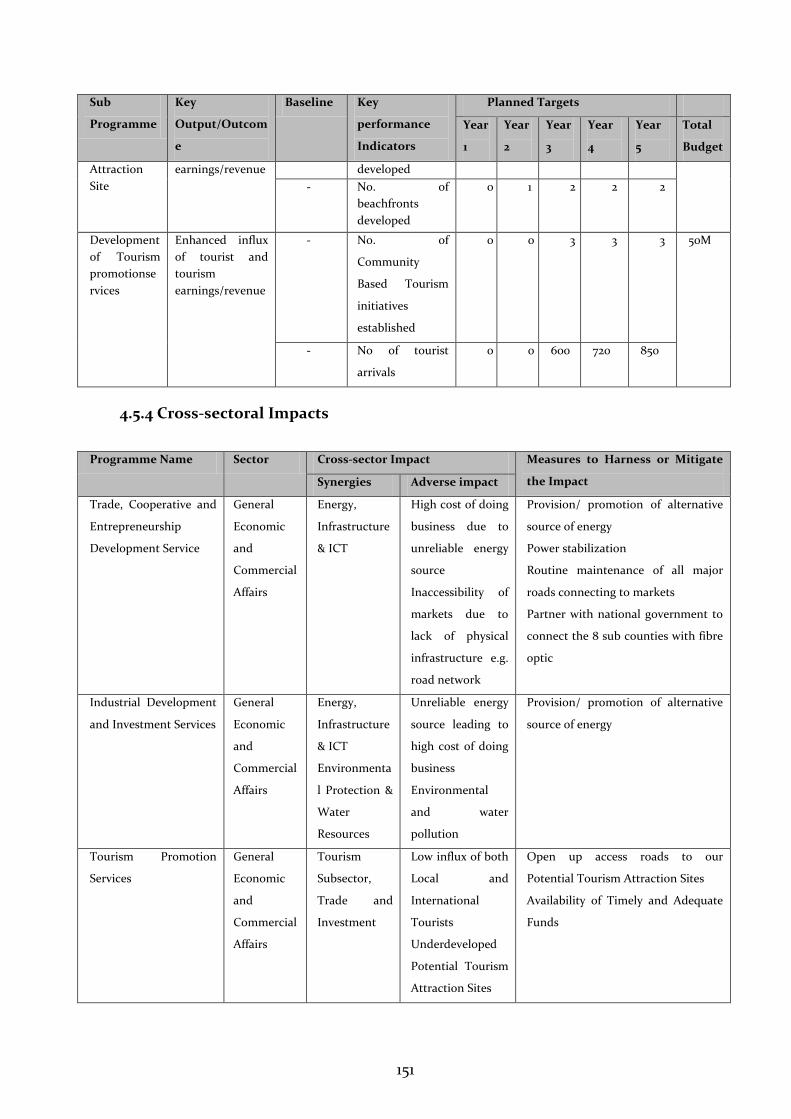
151
Sub
Programme
Key
Output/Outcom
e
Baseline Key
performance
Indicators
Planned Targets
Year
1
Year
2
Year
3
Year
4
Year
5
Total
Budget
Attraction
Site
earnings/revenue developed
- No. of
beachfronts
developed
0 1 2 2 2
Development
of Tourism
promotionse
rvices
Enhanced influx
of tourist and
tourism
earnings/revenue
- No. of
Community
Based Tourism
initiatives
established
0 0 3 3 3 50M
- No of tourist
arrivals
0 0 600 720 850
4.5.4 Cross-sectoral Impacts
Programme Name Sector Cross-sector Impact Measures to Harness or Mitigate
the Impact Synergies Adverse impact
Trade, Cooperative and
Entrepreneurship
Development Service
General
Economic
and
Commercial
Affairs
Energy,
Infrastructure
& ICT
High cost of doing
business due to
unreliable energy
source
Inaccessibility of
markets due to
lack of physical
infrastructure e.g.
road network
Provision/ promotion of alternative
source of energy
Power stabilization
Routine maintenance of all major
roads connecting to markets
Partner with national government to
connect the 8 sub counties with fibre
optic
Industrial Development
and Investment Services
General
Economic
and
Commercial
Affairs
Energy,
Infrastructure
& ICT
Environmenta
l Protection &
Water
Resources
Unreliable energy
source leading to
high cost of doing
business
Environmental
and water
pollution
Provision/ promotion of alternative
source of energy
Tourism Promotion
Services
General
Economic
and
Commercial
Affairs
Tourism
Subsector,
Trade and
Investment
Low influx of both
Local and
International
Tourists
Underdeveloped
Potential Tourism
Attraction Sites
Open up access roads to our
Potential Tourism Attraction Sites
Availability of Timely and Adequate
Funds
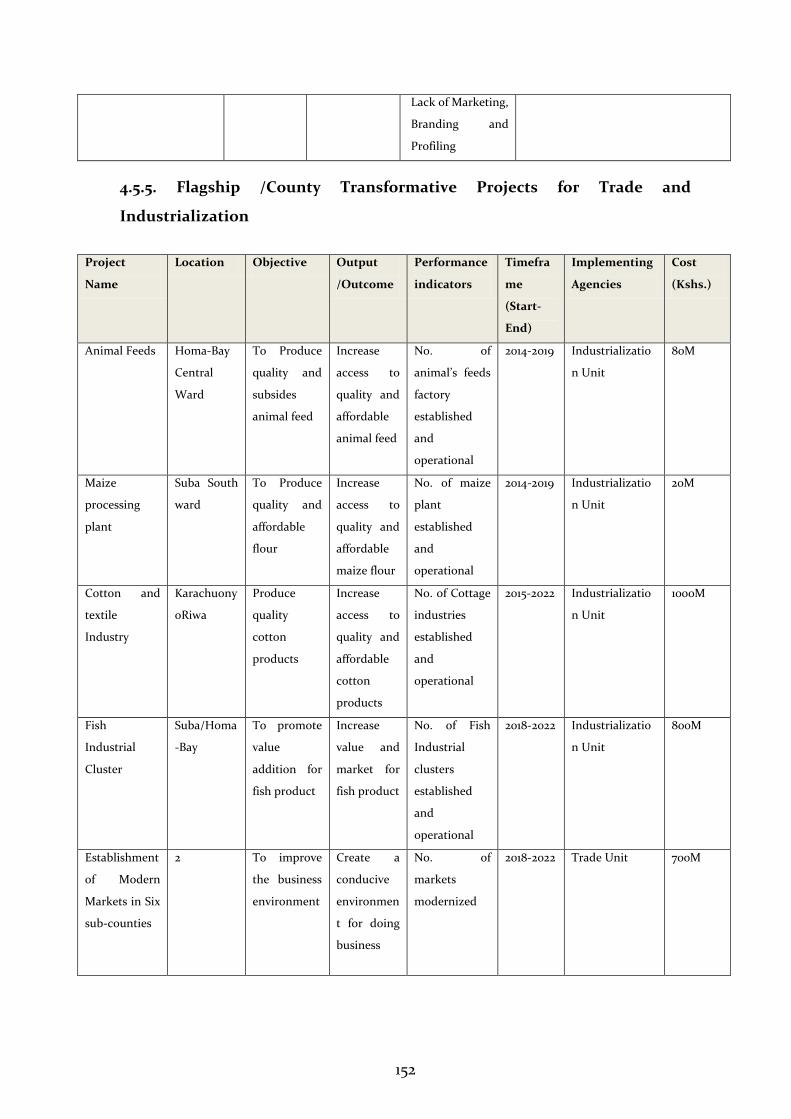
152
Lack of Marketing,
Branding and
Profiling
4.5.5. Flagship /County Transformative Projects for Trade and
Industrialization
Project
Name
Location Objective Output
/Outcome
Performance
indicators
Timefra
me
(Start-
End)
Implementing
Agencies
Cost
(Kshs.)
Animal Feeds Homa-Bay
Central
Ward
To Produce
quality and
subsides
animal feed
Increase
access to
quality and
affordable
animal feed
No. of
animal’s feeds
factory
established
and
operational
2014-2019 Industrializatio
n Unit
80M
Maize
processing
plant
Suba South
ward
To Produce
quality and
affordable
flour
Increase
access to
quality and
affordable
maize flour
No. of maize
plant
established
and
operational
2014-2019 Industrializatio
n Unit
20M
Cotton and
textile
Industry
Karachuony
oRiwa
Produce
quality
cotton
products
Increase
access to
quality and
affordable
cotton
products
No. of Cottage
industries
established
and
operational
2015-2022 Industrializatio
n Unit
1000M
Fish
Industrial
Cluster
Suba/Homa
-Bay
To promote
value
addition for
fish product
Increase
value and
market for
fish product
No. of Fish
Industrial
clusters
established
and
operational
2018-2022 Industrializatio
n Unit
800M
Establishment
of Modern
Markets in Six
sub-counties
2 To improve
the business
environment
Create a
conducive
environmen
t for doing
business
No. of
markets
modernized
2018-2022 Trade Unit 700M
153
4.6 EDUCATION SECTOR
4.6.1 Introduction
The education sector comprises of Early Childhood Development Education,
Vocational Education and Training and ICT Sub-sectors. The Department of
Education and ICT derives its mandate from the Constitution of Kenya 2010.
Other key legal and policy frameworks that guide the programs and activities of
the Department of Education and ICT include the following:
(a) County Government (Amendment) Act, 2016
(b) Basic Education Act, 2013
(c) Technical Vocational Education and Training (TVET) Act, 2013
(d) Teachers Service Commission Act, 2015
(e) Children’s Act, 2001; and
(f) National Employment Authority Act, 2011.
(g) Kenya Communication Act of 1998,
(h) Kenya Information and Communications (Amendment) Act, 2013
(i) Media Council Act, 2013
(j) National ICT Master Plan
(k) Homa Bay County ICT Roadmap
The Vision
"A globally competitive education, training, research and innovation for sustainable
development'
The Mission
"To provide, promote and coordinate equality education and training, integration of
science, technology and innovation in sustainable socio-economic development
process."
154
4.6.2 County Response to the Sector Vision and Mission
The education sector plays a vital role in the provision of general policy guidelines
and coordination of education matters in the county. The sector has the
responsibility of developing the quality and the relevance of teaching and learning
in educational institutions. It also monitors and coordinates the implementation
of various investment programmes under Kenya Education Sector Support
Programme (KESSP), promotes and enhances prudent resource utilization and
management in all learning institutions; and promotes and enhances teacher
management.
The sector is also charged with supervisory responsibility of ensuring that every
child receives education as a basic right and hence contribution is made to
reduction of literacy levels in the county.
The sector further plays the role of upgrading the quality of the human resource in
the county by ensuring everyone is trained to undertake some task of
development. The county has various initiatives to achieve the sector mission and
vision, such as construction of model ECDE classrooms in primary schools and
vocational training centres as well as centres of excellence. The county will strive
to improve the teaching and learning environment in all educational institutions
by investing in construction and equipping of ECDE centers and Vocational
Training Centers as well as establishing of more ECDE centers and VTCs in the
county.
CIDP 2018 – 2022 Priority Programs
Digital Learning and ICT Enabled Education Sector Management Program
The ICT Integration in Primary Education and Vocational Training Centers
(Digital Literacy project) is one of the key flagship Programmes highlighted in the
National ICT Master Plan. The main aim of the project in Homa Bay County will
be aligning integration of ICT into teaching and learning pupils in pre-primary
and trainees in the Vocational Training Centers.
155
The components of this program will in the next five years include:
Establishment of ICT Labs in all the 26 VTCs and 8 ECDE Centers of
Excellence;
Improvement of ICT infrastructure at the Sub-County Headquarters to
facilitate the implementation of e-Government Program,
Development of digital content for use by teachers and instructors to
impart digital literacy among pupils and trainees;
Facilitate capacity building of the teachers and instructors with ICT Skills
and
Procurement of ICT devices for the ECDE Centers, VTCs and Sub-County
Headquarters.
Early Childhood Development and Education Improvement Program
Early Childhood Development and Education Improvement Program
The National and County Government, through the Council of Governors
Technical Committee on Education, Gender, Youth, Children, Sports, Culture and
Social Services Committee and guided by the Sessional Paper No. 1 of 2005, is
already implementing measures that seek to improve the performance of the Early
Childhood Development and Education Sub-Sector. These measures include but
not limited to: (a) establishing guidelines and standards for the management,
supervision and curriculum development for ECDE; (c) mobilizing communities
and parents through awareness creation and demand raising by parents to ensure
no child does not attend school; and (d) enhancing the capacities of Early
Childhood Development Education Supervisors and Inspectors to ensure quality
of ECDE programs.
The focus of the Sector during the CIDP (2018 -2022) implementation period will
thus be anchored on the National Government ECDE Policy Framework and
aligned to the SDG Goal#4 on Quality Education which requires that everyone
should have opportunity to study, learn and fulfill their full potential by
promoting inclusive and equitable quality education and opportunities for all
children in Homa Bay County.
156
In line with the targets set by the SDG Goal #4 and priorities of the Kenya Vision
2030, the Department of Education and ICT shall in the next five years, strive to:
(a) Establish and operationalize 16 no. Model ECDE Centers of Excellence in
Homa Bay County
(b) Construct 160 no. new ECDE Classrooms to increase access to quality early
childhood development education;
(c) Introduce Mobile ECDE Centers to promote education of the children of
the Fishing Nomads and other nomadic communities along Lake Victoria
Beaches of Homa Bay.
(d) In partnership with the Private sector players and development partners,
establish 8Child Daycare Centers (1 per sub-county) to provide quality care
to children whose parents are either in employment or in trade and
business and require quality child care services while they are away.
(e) Expand ECDE School Feeding Program to cover all ECDE Centers in Homa
Bay where kids access balanced diet while in school for enhanced quality of
health, growth and development of the child.
(f) Provide 12,000 students with bursaries of Kshs. 5,250 per year for five years
(g) Provide full scholarships for 2 bright but needy students per ward in 40
wards at a cost of Kshs. 100,000 per student per year for 4 years of
secondary school education.
(h) Ensure that all girls and boys enroll in and complete full cycle of complete
free, equitable and quality ECDE leading to relevant and effective learning
outcomes;
(i) Ensure that all girls and boys have access to quality early childhood
development, care, support and pre-primary education so that they are well
prepared for primary education;
(j) Recruit and remunerate adequate ECDE Teachers, Supervisors and
Inspectors to deliver, monitor and evaluate ECDE quality service delivery in
Homa bay County.
(k) In collaboration with our development partners and the national
government, ensure availability of adequate, appropriate and conducive
157
learning facilities including ECDE Classes, Play Grounds, Crèches and Play
Kits.
(l) Improve access to water in all ECDE Centers through improved water
harvesting, storage and treatment.
(m) Promote hand washing by introducing and promoting the use of
Mass Hand Washing Devise in all ECDE Centers, Vocational Training
Centers and Primary Schools in Homa Bay County.
(n) In partnership with strategic development partners, ensure that all learners
acquire knowledge, skills and competencies early enough needed to
promote climate change risk reduction, disaster risk reduction, HIV
prevention, sustainable development, human rights and gender equality.
Vocational Education and Training Improvement Program
The TVET sector in Kenya has experienced moderate growth over the last 40
years. The sector continues to produce the needed middle level human resource
for the growth and development of the national economy. The Kenya vision 2030
and its subsequent MTEFs has placed premium demands on TVET as the leading
engine that the economy must essentially upon to produce adequate levels of
skilled and competent middle level manpower needed to drive the economy
towards the attainment of the Vision 2030.
The Constitution of Kenya 2010 has also created demands that require the
technical and vocational education and training sector to develop policies and
strategies to facilitate faster economic growth reduce youth unemployment and
vulnerability and improve youth self-reliance.
The vision of Homa Bay County that has heavily been coined from the Kenya
Vision 2030 focuses on making Homa Bay County an industrialized, wealth and
health county by 2030. In addition, the BIG 4 presidential vision for the next five
years targets manufacturing and skilled labour. These can only be realized by a
more strengthened, vibrant and efficient vocational education and training sub-
sector.
In line with the pursuit of the realization of the development priorities in the First
County Integrated Development Plan (CIDP, 2013 -2017) which outlined the
158
following core priority investment and development programming areas –
Infrastructure improvement, Subsidized vocational education and training
program, expansion of Centers of Excellence in Vocational Training and
Education, Construction of Model Twin Workshops in each of the County’s 26
Vocational Training Centers, Upgrading of VTCs under KIDDP, working closely
with other partners like Mwendo CAPyei. Up scaling of constituency-based and
county bursary schemes, the CIDP (2018 – 2022) shall seek to pursue priority
programs aligned to the following vocational education and training focal areas:
1. In collaboration with all our development partners-
a. Promote capacity buildings including the development of the requisite
County Vocational Education and Training Policy;
b. Develop Homa Bay County Vocational Education and Training Bill;
c. Enhance TVET Human Capital Development,
d. Enhance Pedagogical and Didactical Skills;
e. Develop Quality Standards and Assurance Policies and Procedures for
Improvement Training Assessment and Inspection;
f. Develop Sustainable TVET Financing Mechanisms for Quality Training
Service Delivery;
g. Develop ICT Infrastructure through establishment of ICT Labs in selected
15 VTCs; and
h. Promote strategic partnerships and linkages for enhanced resource
mobilization, knowledge generation and sharing of best practices.
2. Strengthen partnerships between industry and TVET institutions to
provide a good platform for ensuring relevance and quality of training as well as
curriculum design and development.
3. Increase access, equity, relevance, quality and partnerships with industry,
enterprise, community, research, innovation and development institutions,
organization and programs such the World Bank Funded Kenya Youth
Employment and Opportunities Project (KYEOP), Youth Empowerment Project
supported by the World Bank and USAID Funded Kenya Youth Employment and
Skills (K-YES) Program
159
4. Strengthen governance and management of the VTCs in Homa Bay County
through establishment of Boards of Management, Institutional Capacity
Strengthening and Development for effective governance and management and
support to institutional strategic planning and strategy implementation in line
with the CIDP (2018 – 2022)
5. Ensure availability of adequate and appropriately skilled and experienced
training instructors; training facilities; training machines, equipment, tools and
teaching/training learning aids and materials/supplies;
6. Promote the use of ICT as a Management and Governance Tool,
Teaching/Learning/Training Aid and Resource and Research and Innovation tool
within the VTCs.
7. Provide trainees with relevant skills for industrial, entrepreneurship and
economic development by promoting relevant vocational programs and courses in
all the County VTCs while promoting effective industrial attachments for all
trainees.
8. Establish 8 No. County Vocational Training Centers of Excellence that are
fully equipped and adequately staffed to offer training programs that are relevant
to the County’s development priorities and national development goals and
priorities; and
9. Construct a total of 16 No by 150 capacity student hostels in all the 8 no.
County Vocational Training Centers of Excellence;
10. Establish 8 No. Home Craft Centers to offer craft training programs to
women and men at the village level. Where a Home Craft Center exist, the County
Government of Homa Bay will consider rehabilitation, face-lifting and equipping
the same.
11. Construct 1 no. County Public Library with audio-visual rooms, study halls
for adults and children, special reference sections, an archive and public
auditorium.
12. Achieve Gross Enrolment Rate of 30 – 45% in all the County VTCs by end of
2022.
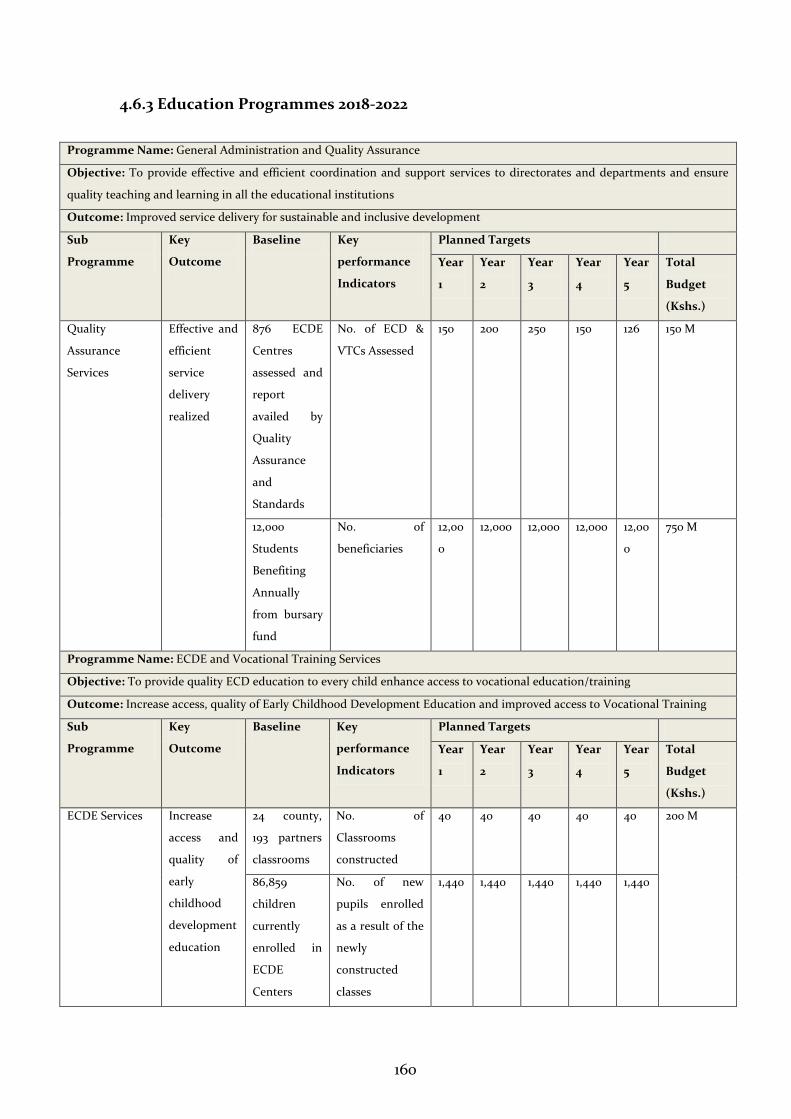
160
4.6.3 Education Programmes 2018-2022
Programme Name: General Administration and Quality Assurance
Objective: To provide effective and efficient coordination and support services to directorates and departments and ensure
quality teaching and learning in all the educational institutions
Outcome: Improved service delivery for sustainable and inclusive development
Sub
Programme
Key
Outcome
Baseline Key
performance
Indicators
Planned Targets
Year
1
Year
2
Year
3
Year
4
Year
5
Total
Budget
(Kshs.)
Quality
Assurance
Services
Effective and
efficient
service
delivery
realized
876 ECDE
Centres
assessed and
report
availed by
Quality
Assurance
and
Standards
No. of ECD &
VTCs Assessed
150 200 250 150 126 150 M
12,000
Students
Benefiting
Annually
from bursary
fund
No. of
beneficiaries
12,00
0
12,000 12,000 12,000 12,00
0
750 M
Programme Name: ECDE and Vocational Training Services
Objective: To provide quality ECD education to every child enhance access to vocational education/training
Outcome: Increase access, quality of Early Childhood Development Education and improved access to Vocational Training
Sub
Programme
Key
Outcome
Baseline Key
performance
Indicators
Planned Targets
Year
1
Year
2
Year
3
Year
4
Year
5
Total
Budget
(Kshs.)
ECDE Services Increase
access and
quality of
early
childhood
development
education
24 county,
193 partners
classrooms
No. of
Classrooms
constructed
40 40 40 40 40 200 M
86,859
children
currently
enrolled in
ECDE
Centers
No. of new
pupils enrolled
as a result of the
newly
constructed
classes
1,440 1,440 1,440 1,440 1,440
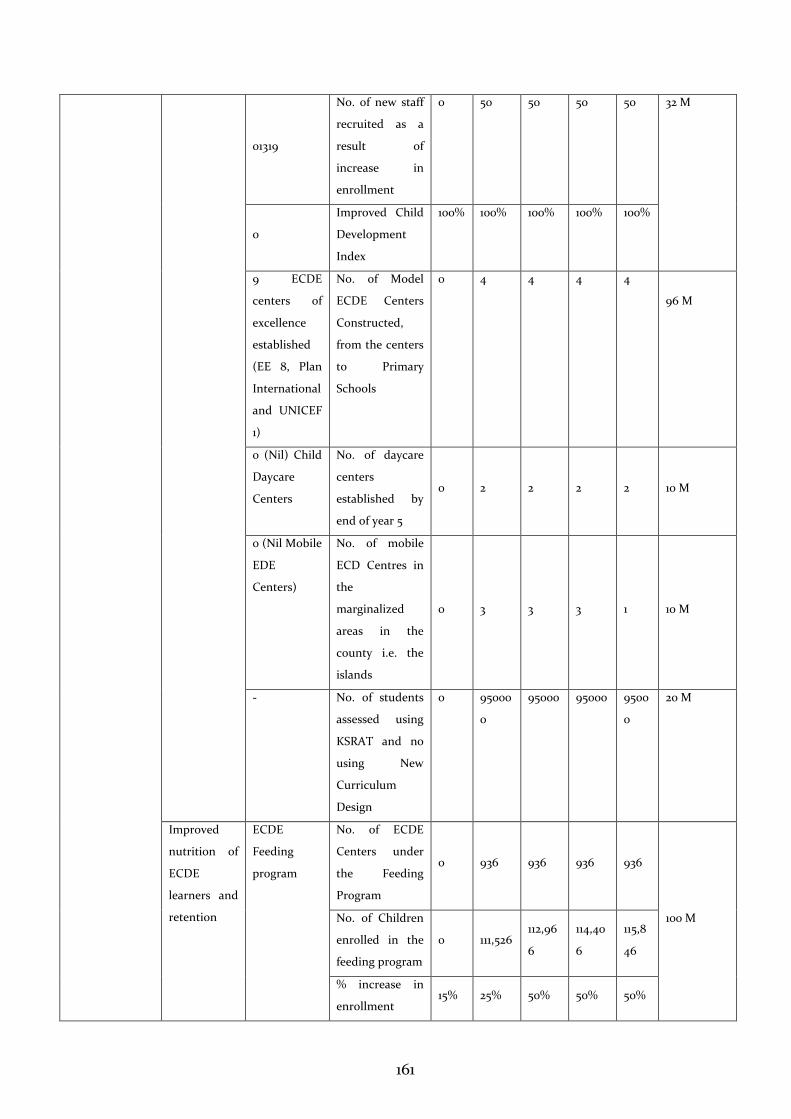
161
01319
No. of new staff
recruited as a
result of
increase in
enrollment
0 50 50 50 50 32 M
0
Improved Child
Development
Index
100% 100% 100% 100% 100%
9 ECDE
centers of
excellence
established
(EE 8, Plan
International
and UNICEF
1)
No. of Model
ECDE Centers
Constructed,
from the centers
to Primary
Schools
0 4 4 4 4
96 M
0 (Nil) Child
Daycare
Centers
No. of daycare
centers
established by
end of year 5
0 2 2 2 2 10 M
0 (Nil Mobile
EDE
Centers)
No. of mobile
ECD Centres in
the
marginalized
areas in the
county i.e. the
islands
0 3 3 3 1 10 M
- No. of students
assessed using
KSRAT and no
using New
Curriculum
Design
0 95000
0
95000 95000 9500
0
20 M
Improved
nutrition of
ECDE
learners and
retention
ECDE
Feeding
program
No. of ECDE
Centers under
the Feeding
Program
0 936 936 936 936
100 M No. of Children
enrolled in the
feeding program
0 111,526 112,96
6
114,40
6
115,8
46
% increase in
enrollment 15% 25% 50% 50% 50%
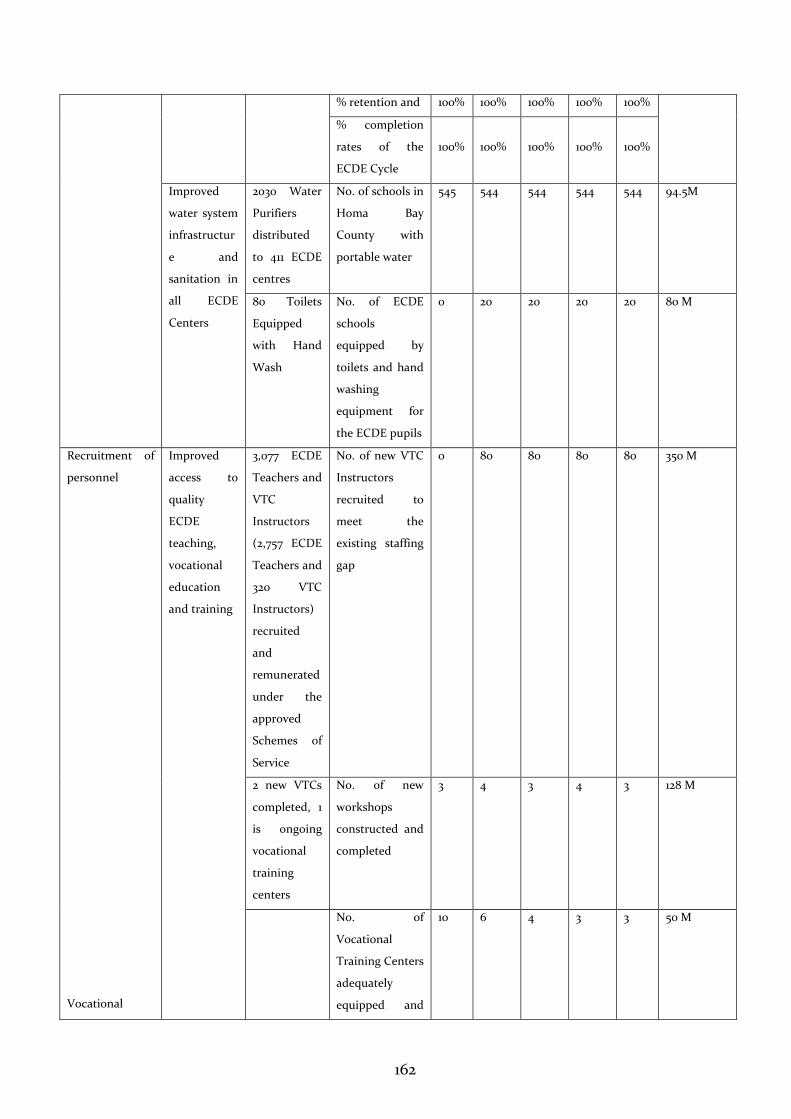
162
% retention and 100% 100% 100% 100% 100%
% completion
rates of the
ECDE Cycle
100% 100% 100% 100% 100%
Improved
water system
infrastructur
e and
sanitation in
all ECDE
Centers
2030 Water
Purifiers
distributed
to 411 ECDE
centres
No. of schools in
Homa Bay
County with
portable water
545 544 544 544 544 94.5M
80 Toilets
Equipped
with Hand
Wash
No. of ECDE
schools
equipped by
toilets and hand
washing
equipment for
the ECDE pupils
0 20 20 20 20 80 M
Recruitment of
personnel
Vocational
Improved
access to
quality
ECDE
teaching,
vocational
education
and training
3,077 ECDE
Teachers and
VTC
Instructors
(2,757 ECDE
Teachers and
320 VTC
Instructors)
recruited
and
remunerated
under the
approved
Schemes of
Service
No. of new VTC
Instructors
recruited to
meet the
existing staffing
gap
0 80 80 80 80 350 M
2 new VTCs
completed, 1
is ongoing
vocational
training
centers
No. of new
workshops
constructed and
completed
3 4 3 4 3 128 M
No. of
Vocational
Training Centers
adequately
equipped and
10 6 4 3 3 50 M
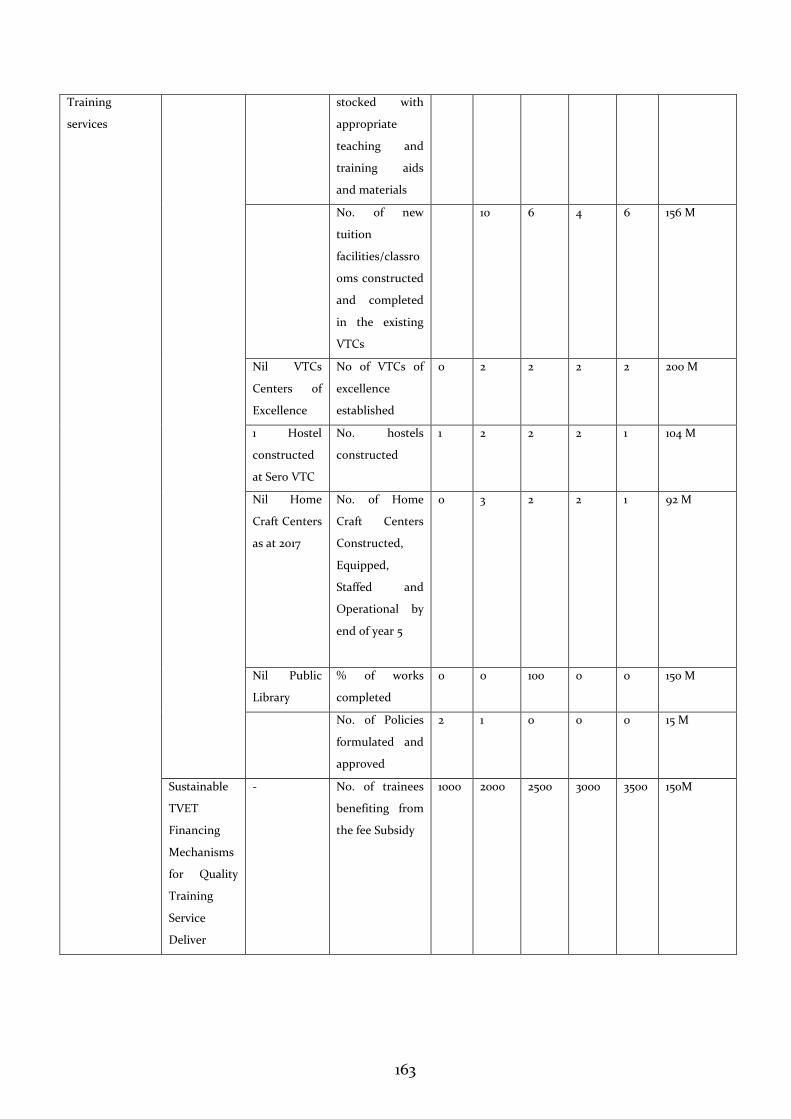
163
Training
services
stocked with
appropriate
teaching and
training aids
and materials
No. of new
tuition
facilities/classro
oms constructed
and completed
in the existing
VTCs
10 6 4 6 156 M
Nil VTCs
Centers of
Excellence
No of VTCs of
excellence
established
0 2 2 2 2 200 M
1 Hostel
constructed
at Sero VTC
No. hostels
constructed
1 2 2 2 1 104 M
Nil Home
Craft Centers
as at 2017
No. of Home
Craft Centers
Constructed,
Equipped,
Staffed and
Operational by
end of year 5
0 3 2 2 1 92 M
Nil Public
Library
% of works
completed
0 0 100 0 0 150 M
No. of Policies
formulated and
approved
2
1
0
0
0
15 M
Sustainable
TVET
Financing
Mechanisms
for Quality
Training
Service
Deliver
- No. of trainees
benefiting from
the fee Subsidy
1000 2000 2500 3000 3500 150M
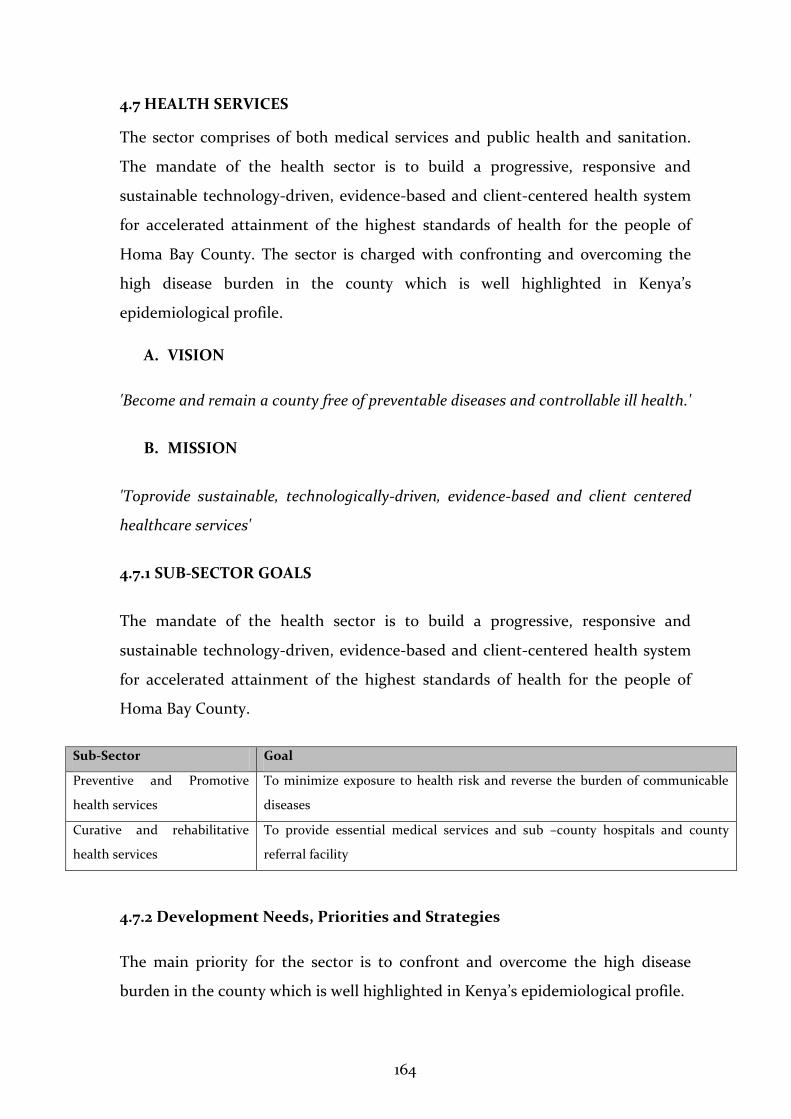
164
4.7 HEALTH SERVICES
The sector comprises of both medical services and public health and sanitation.
The mandate of the health sector is to build a progressive, responsive and
sustainable technology-driven, evidence-based and client-centered health system
for accelerated attainment of the highest standards of health for the people of
Homa Bay County. The sector is charged with confronting and overcoming the
high disease burden in the county which is well highlighted in Kenya’s
epidemiological profile.
A. VISION
'Become and remain a county free of preventable diseases and controllable ill health.'
B. MISSION
'Toprovide sustainable, technologically-driven, evidence-based and client centered
healthcare services'
4.7.1 SUB-SECTOR GOALS
The mandate of the health sector is to build a progressive, responsive and
sustainable technology-driven, evidence-based and client-centered health system
for accelerated attainment of the highest standards of health for the people of
Homa Bay County.
Sub-Sector Goal
Preventive and Promotive
health services
To minimize exposure to health risk and reverse the burden of communicable
diseases
Curative and rehabilitative
health services
To provide essential medical services and sub –county hospitals and county
referral facility
4.7.2 Development Needs, Priorities and Strategies
The main priority for the sector is to confront and overcome the high disease
burden in the county which is well highlighted in Kenya’s epidemiological profile.
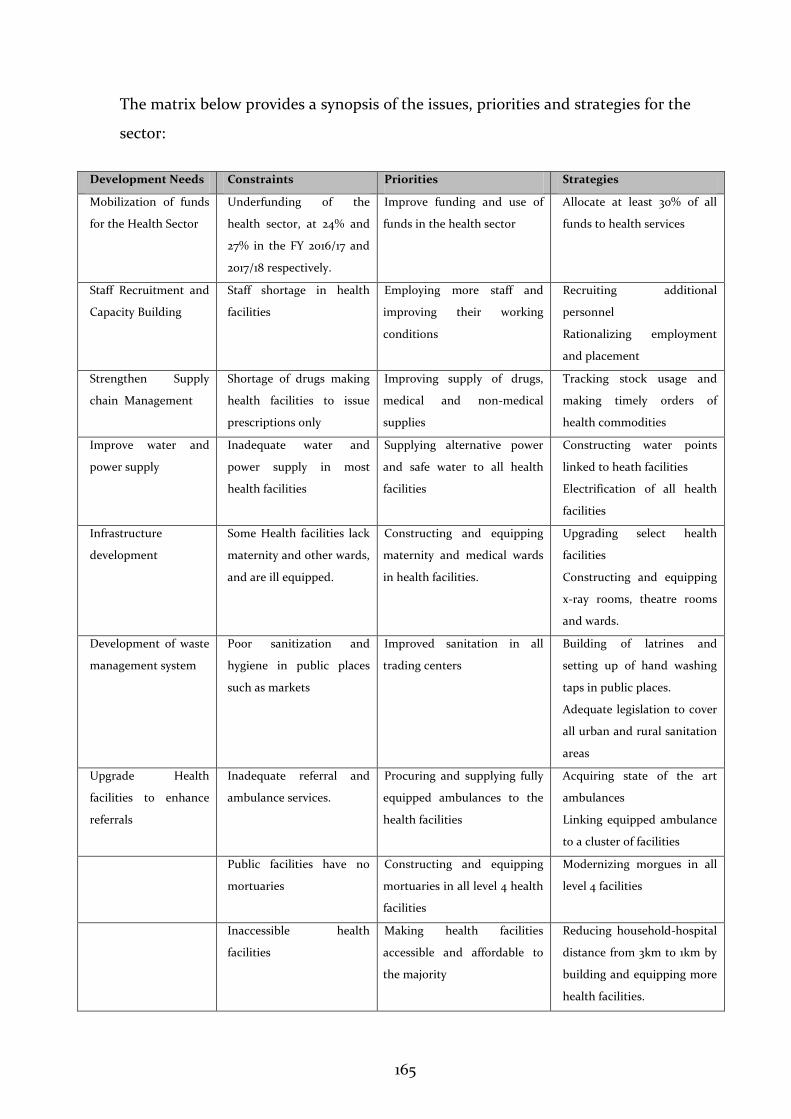
165
The matrix below provides a synopsis of the issues, priorities and strategies for the
sector:
Development Needs Constraints Priorities Strategies
Mobilization of funds
for the Health Sector
Underfunding of the
health sector, at 24% and
27% in the FY 2016/17 and
2017/18 respectively.
Improve funding and use of
funds in the health sector
Allocate at least 30% of all
funds to health services
Staff Recruitment and
Capacity Building
Staff shortage in health
facilities
Employing more staff and
improving their working
conditions
Recruiting additional
personnel
Rationalizing employment
and placement
Strengthen Supply
chain Management
Shortage of drugs making
health facilities to issue
prescriptions only
Improving supply of drugs,
medical and non-medical
supplies
Tracking stock usage and
making timely orders of
health commodities
Improve water and
power supply
Inadequate water and
power supply in most
health facilities
Supplying alternative power
and safe water to all health
facilities
Constructing water points
linked to heath facilities
Electrification of all health
facilities
Infrastructure
development
Some Health facilities lack
maternity and other wards,
and are ill equipped.
Constructing and equipping
maternity and medical wards
in health facilities.
Upgrading select health
facilities
Constructing and equipping
x-ray rooms, theatre rooms
and wards.
Development of waste
management system
Poor sanitization and
hygiene in public places
such as markets
Improved sanitation in all
trading centers
Building of latrines and
setting up of hand washing
taps in public places.
Adequate legislation to cover
all urban and rural sanitation
areas
Upgrade Health
facilities to enhance
referrals
Inadequate referral and
ambulance services.
Procuring and supplying fully
equipped ambulances to the
health facilities
Acquiring state of the art
ambulances
Linking equipped ambulance
to a cluster of facilities
Public facilities have no
mortuaries
Constructing and equipping
mortuaries in all level 4 health
facilities
Modernizing morgues in all
level 4 facilities
Inaccessible health
facilities
Making health facilities
accessible and affordable to
the majority
Reducing household-hospital
distance from 3km to 1km by
building and equipping more
health facilities.
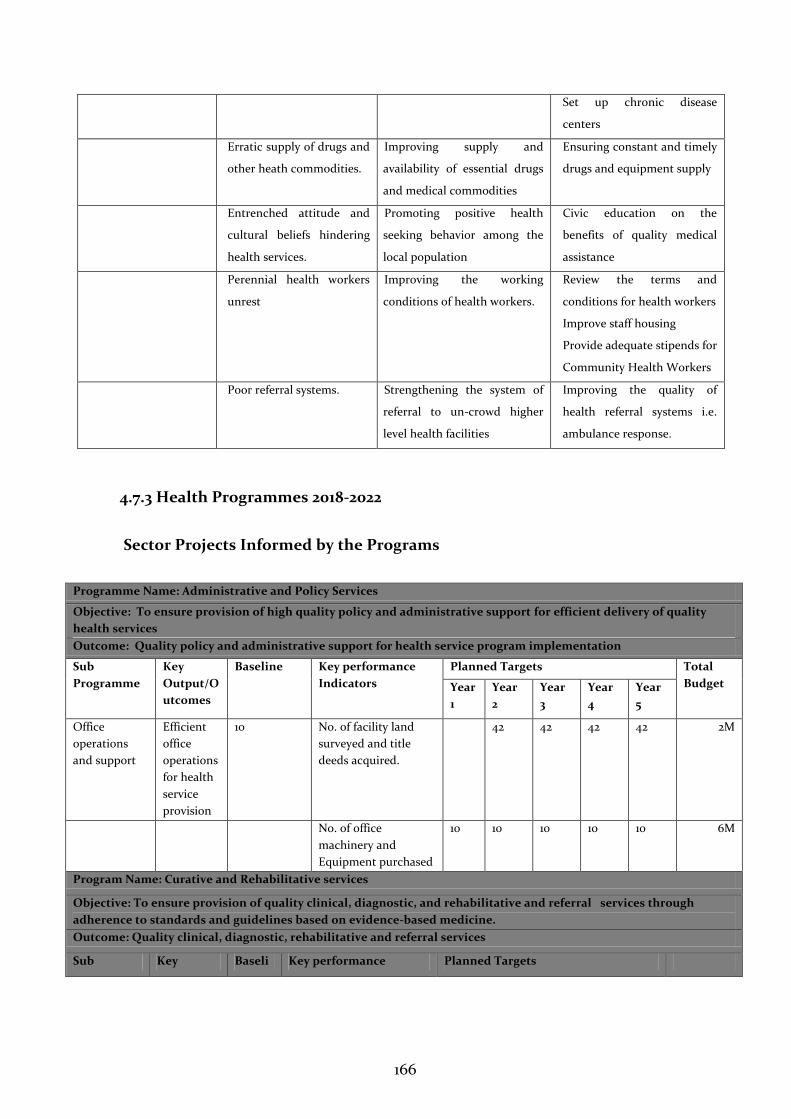
166
Set up chronic disease
centers
Erratic supply of drugs and
other heath commodities.
Improving supply and
availability of essential drugs
and medical commodities
Ensuring constant and timely
drugs and equipment supply
Entrenched attitude and
cultural beliefs hindering
health services.
Promoting positive health
seeking behavior among the
local population
Civic education on the
benefits of quality medical
assistance
Perennial health workers
unrest
Improving the working
conditions of health workers.
Review the terms and
conditions for health workers
Improve staff housing
Provide adequate stipends for
Community Health Workers
Poor referral systems. Strengthening the system of
referral to un-crowd higher
level health facilities
Improving the quality of
health referral systems i.e.
ambulance response.
4.7.3 Health Programmes 2018-2022
Sector Projects Informed by the Programs
Programme Name: Administrative and Policy Services
Objective: To ensure provision of high quality policy and administrative support for efficient delivery of quality
health services
Outcome: Quality policy and administrative support for health service program implementation
Sub
Programme
Key
Output/O
utcomes
Baseline
Key performance
Indicators
Planned Targets Total
Budget Year
1
Year
2
Year
3
Year
4
Year
5
Office
operations
and support
Efficient
office
operations
for health
service
provision
10 No. of facility land
surveyed and title
deeds acquired.
42 42 42 42 2M
No. of office
machinery and
Equipment purchased
10 10 10 10 10 6M
Program Name: Curative and Rehabilitative services
Objective: To ensure provision of quality clinical, diagnostic, and rehabilitative and referral services through
adherence to standards and guidelines based on evidence-based medicine.
Outcome: Quality clinical, diagnostic, rehabilitative and referral services
Sub Key Baseli Key performance Planned Targets
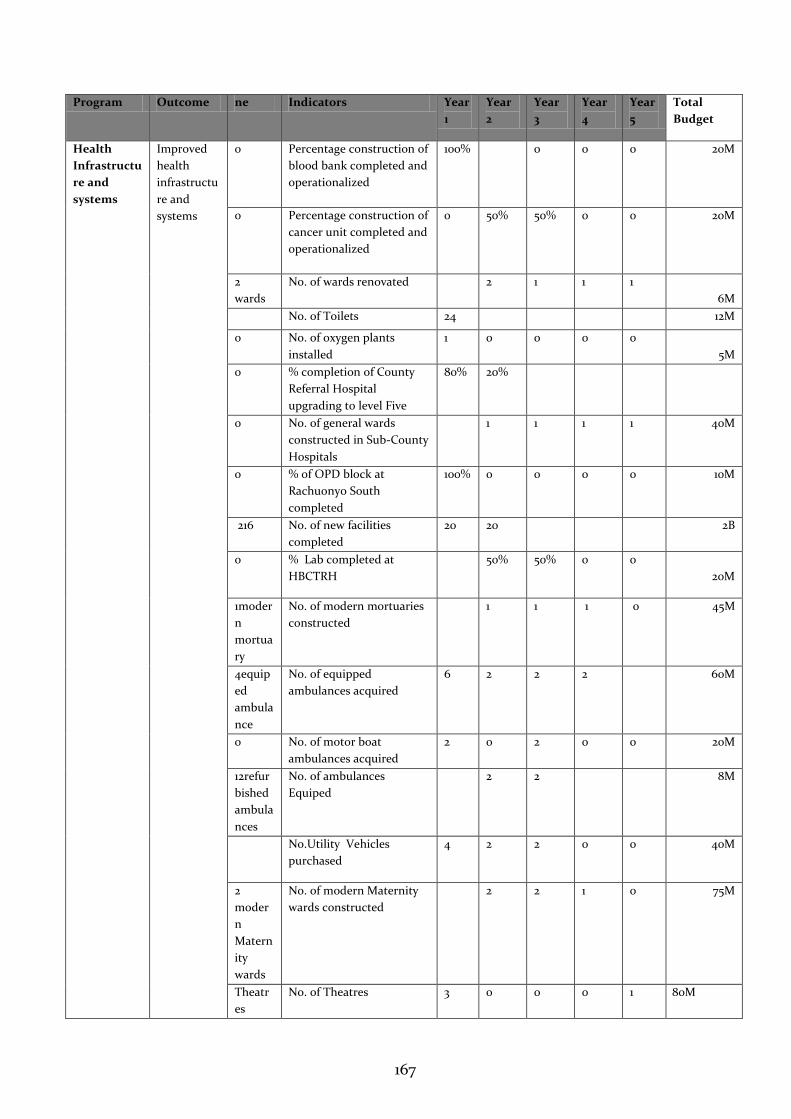
167
Program Outcome ne Indicators Year
1
Year
2
Year
3
Year
4
Year
5
Total
Budget
Health
Infrastructu
re and
systems
Improved
health
infrastructu
re and
systems
0 Percentage construction of
blood bank completed and
operationalized
100% 0 0 0 20M
0 Percentage construction of
cancer unit completed and
operationalized
0 50% 50% 0 0 20M
2
wards
No. of wards renovated 2 1 1 1
6M
No. of Toilets 24 12M
0 No. of oxygen plants
installed
1 0 0 0 0
5M
0 % completion of County
Referral Hospital
upgrading to level Five
80% 20%
0 No. of general wards
constructed in Sub-County
Hospitals
1 1 1 1 40M
0 % of OPD block at
Rachuonyo South
completed
100% 0 0 0 0 10M
216 No. of new facilities
completed
20 20 2B
0 % Lab completed at
HBCTRH
50% 50% 0 0
20M
1moder
n
mortua
ry
No. of modern mortuaries
constructed
1 1 1 0 45M
4equip
ed
ambula
nce
No. of equipped
ambulances acquired
6 2 2 2 60M
0 No. of motor boat
ambulances acquired
2 0 2 0 0 20M
12refur
bished
ambula
nces
No. of ambulances
Equiped
2 2 8M
No.Utility Vehicles
purchased
4 2 2 0 0 40M
2
moder
n
Matern
ity
wards
No. of modern Maternity
wards constructed
2 2 1 0 75M
Theatr
es
No. of Theatres 3 0 0 0 1 80M
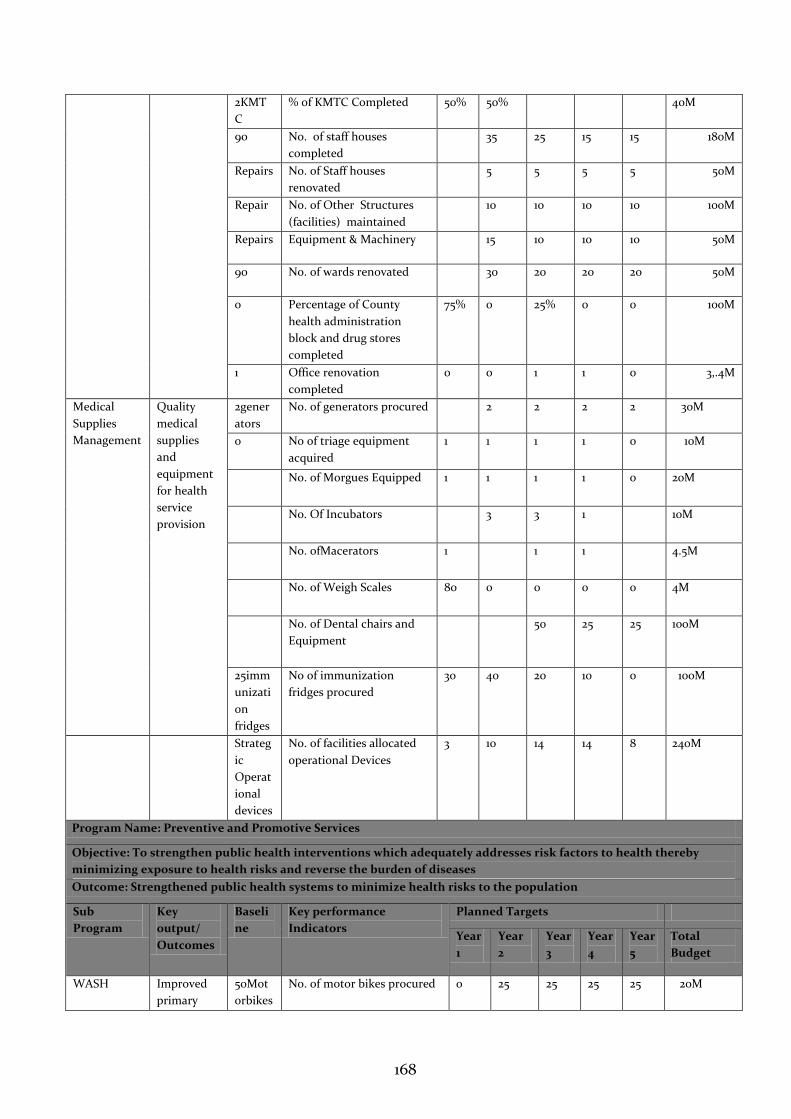
168
2KMT
C
% of KMTC Completed 50% 50% 40M
90 No. of staff houses
completed
35 25 15 15 180M
Repairs No. of Staff houses
renovated
5 5 5 5 50M
Repair No. of Other Structures
(facilities) maintained
10 10 10 10 100M
Repairs Equipment & Machinery 15 10 10 10 50M
90 No. of wards renovated 30 20 20 20 50M
0 Percentage of County
health administration
block and drug stores
completed
75% 0 25% 0 0 100M
1 Office renovation
completed
0 0 1 1 0 3,.4M
Medical
Supplies
Management
Quality
medical
supplies
and
equipment
for health
service
provision
2gener
ators
No. of generators procured 2 2 2 2 30M
0 No of triage equipment
acquired
1 1 1 1 0 10M
No. of Morgues Equipped 1 1 1 1 0 20M
N0. Of Incubators 3 3 1 10M
No. ofMacerators 1 1 1 4.5M
No. of Weigh Scales 80 0 0 0 0 4M
No. of Dental chairs and
Equipment
50 25 25 100M
25imm
unizati
on
fridges
No of immunization
fridges procured
30 40 20 10 0 100M
Strateg
ic
Operat
ional
devices
No. of facilities allocated
operational Devices
3 10 14 14 8 240M
Program Name: Preventive and Promotive Services
Objective: To strengthen public health interventions which adequately addresses risk factors to health thereby
minimizing exposure to health risks and reverse the burden of diseases
Outcome: Strengthened public health systems to minimize health risks to the population
Sub
Program
Key
output/
Outcomes
Baseli
ne
Key performance
Indicators
Planned Targets
Year
1
Year
2
Year
3
Year
4
Year
5
Total
Budget
WASH Improved
primary
50Mot
orbikes
No. of motor bikes procured 0 25 25 25 25 20M
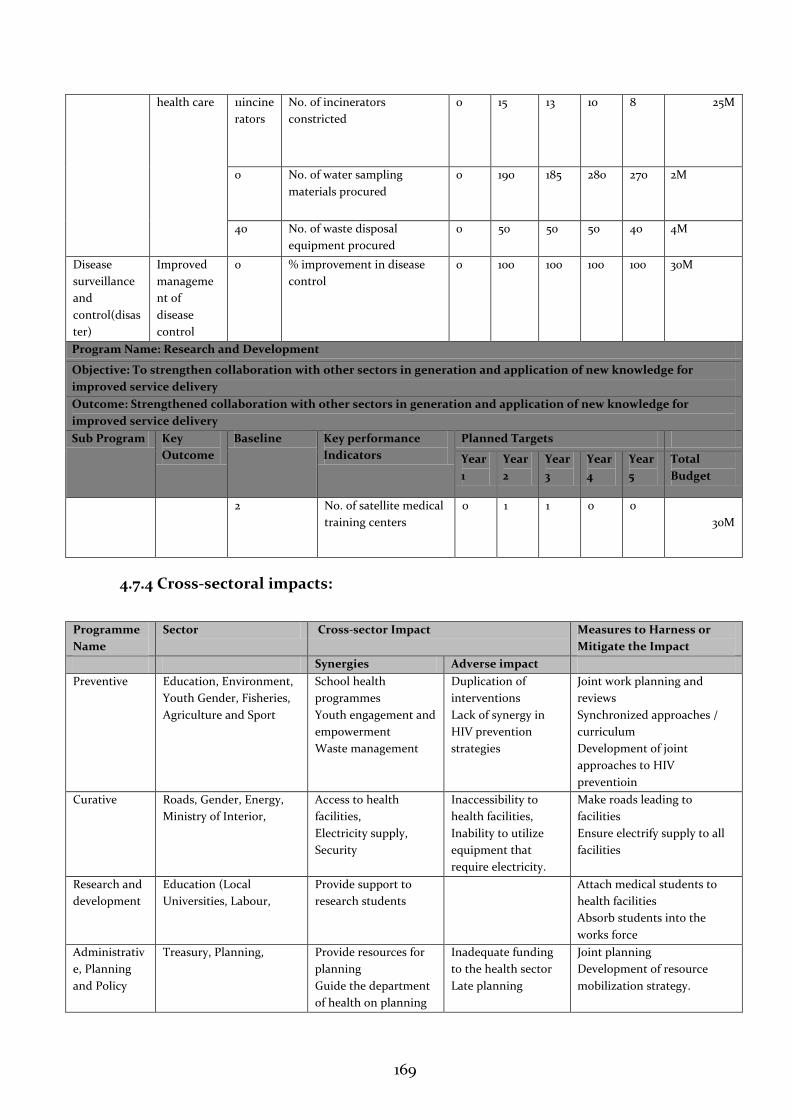
169
health care
11incine
rators
No. of incinerators
constricted
0 15 13 10 8 25M
0 No. of water sampling
materials procured
0 190 185 280 270 2M
40 No. of waste disposal
equipment procured
0 50 50 50 40 4M
Disease
surveillance
and
control(disas
ter)
Improved
manageme
nt of
disease
control
0 % improvement in disease
control
0 100 100 100 100 30M
Program Name: Research and Development
Objective: To strengthen collaboration with other sectors in generation and application of new knowledge for
improved service delivery
Outcome: Strengthened collaboration with other sectors in generation and application of new knowledge for
improved service delivery
Sub Program Key
Outcome
Baseline Key performance
Indicators
Planned Targets
Year
1
Year
2
Year
3
Year
4
Year
5
Total
Budget
2 No. of satellite medical
training centers
0 1 1 0 0
30M
4.7.4 Cross-sectoral impacts:
Programme
Name
Sector Cross-sector Impact Measures to Harness or
Mitigate the Impact
Synergies Adverse impact
Preventive Education, Environment,
Youth Gender, Fisheries,
Agriculture and Sport
School health
programmes
Youth engagement and
empowerment
Waste management
Duplication of
interventions
Lack of synergy in
HIV prevention
strategies
Joint work planning and
reviews
Synchronized approaches /
curriculum
Development of joint
approaches to HIV
preventioin
Curative
Roads, Gender, Energy,
Ministry of Interior,
Access to health
facilities,
Electricity supply,
Security
Inaccessibility to
health facilities,
Inability to utilize
equipment that
require electricity.
Make roads leading to
facilities
Ensure electrify supply to all
facilities
Research and
development
Education (Local
Universities, Labour,
Provide support to
research students
Attach medical students to
health facilities
Absorb students into the
works force
Administrativ
e, Planning
and Policy
Treasury, Planning, Provide resources for
planning
Guide the department
of health on planning
Inadequate funding
to the health sector
Late planning
Joint planning
Development of resource
mobilization strategy.
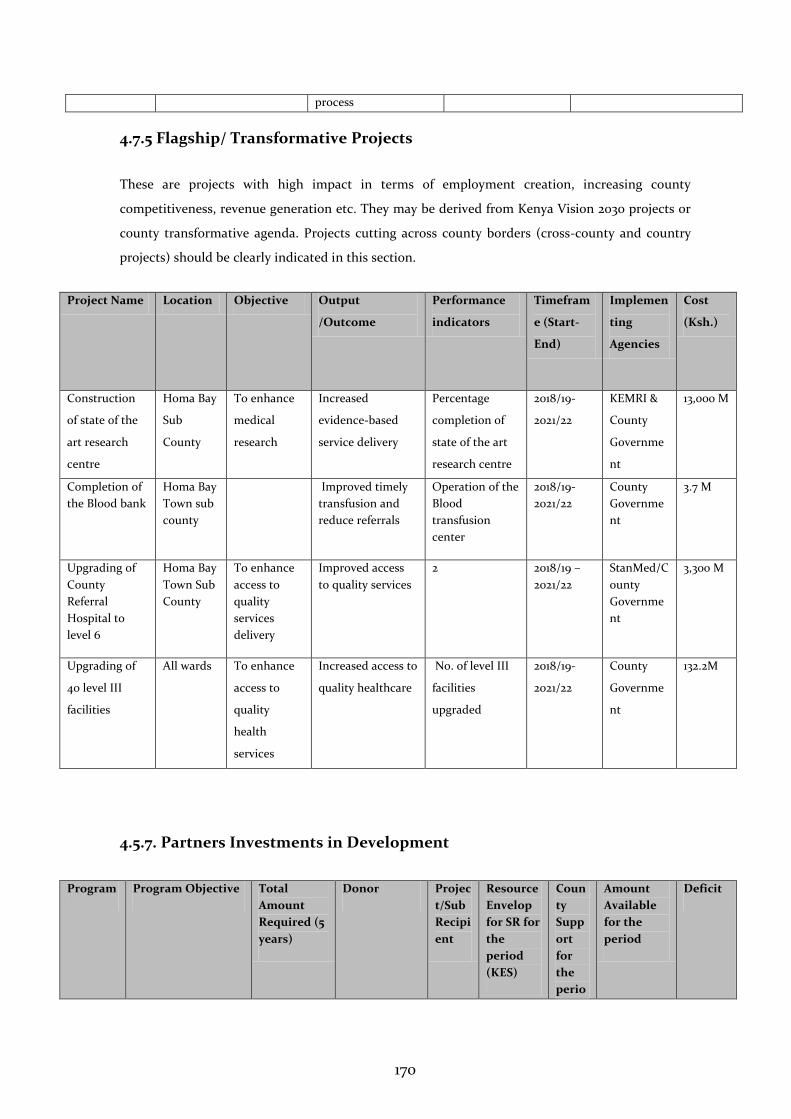
170
process
4.7.5 Flagship/ Transformative Projects
These are projects with high impact in terms of employment creation, increasing county
competitiveness, revenue generation etc. They may be derived from Kenya Vision 2030 projects or
county transformative agenda. Projects cutting across county borders (cross-county and country
projects) should be clearly indicated in this section.
Project Name Location Objective Output
/Outcome
Performance
indicators
Timefram
e (Start-
End)
Implemen
ting
Agencies
Cost
(Ksh.)
Construction
of state of the
art research
centre
Homa Bay
Sub
County
To enhance
medical
research
Increased
evidence-based
service delivery
Percentage
completion of
state of the art
research centre
2018/19-
2021/22
KEMRI &
County
Governme
nt
13,000 M
Completion of
the Blood bank
Homa Bay
Town sub
county
Improved timely
transfusion and
reduce referrals
Operation of the
Blood
transfusion
center
2018/19-
2021/22
County
Governme
nt
3.7 M
Upgrading of
County
Referral
Hospital to
level 6
Homa Bay
Town Sub
County
To enhance
access to
quality
services
delivery
Improved access
to quality services
2 2018/19 –
2021/22
StanMed/C
ounty
Governme
nt
3,300 M
Upgrading of
40 level III
facilities
All wards To enhance
access to
quality
health
services
Increased access to
quality healthcare
No. of level III
facilities
upgraded
2018/19-
2021/22
County
Governme
nt
132.2M
4.5.7. Partners Investments in Development
Program Program Objective Total
Amount
Required (5
years)
Donor Projec
t/Sub
Recipi
ent
Resource
Envelop
for SR for
the
period
(KES)
Coun
ty
Supp
ort
for
the
perio
Amount
Available
for the
period
Deficit
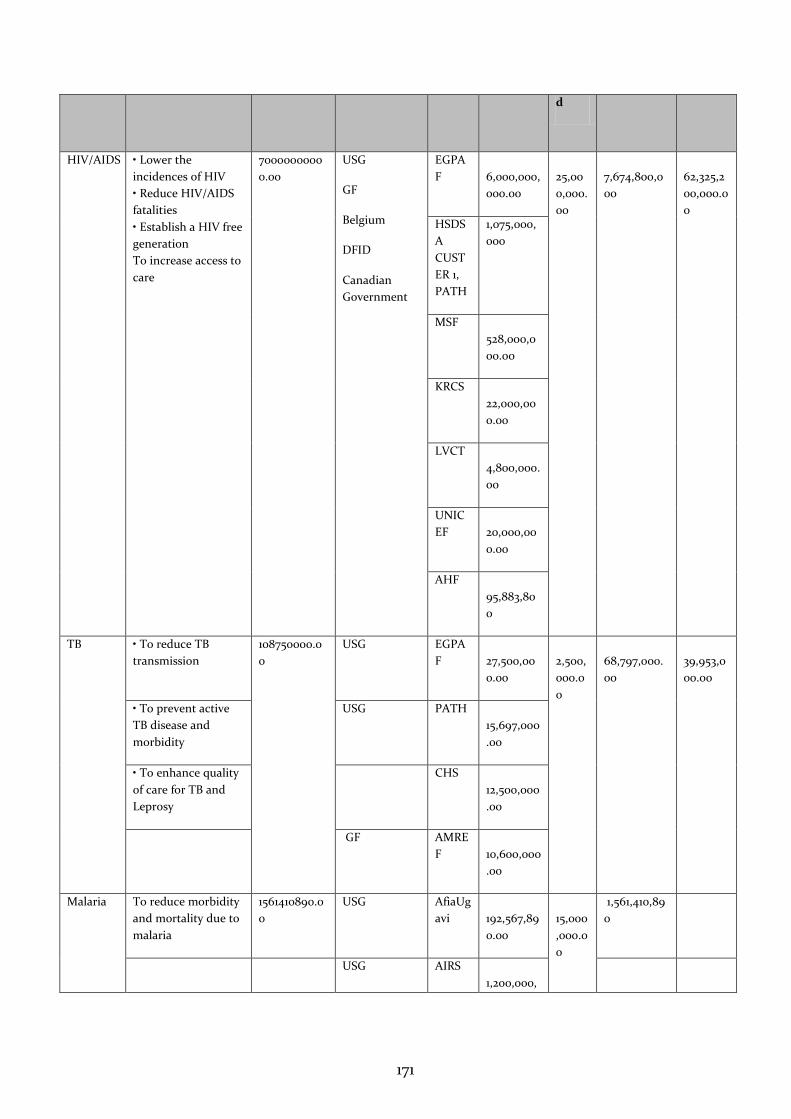
171
d
HIV/AIDS • Lower the
incidences of HIV
• Reduce HIV/AIDS
fatalities
• Establish a HIV free
generation
To increase access to
care
7000000000
0.00
USG
GF
Belgium
DFID
Canadian
Government
EGPA
F
6,000,000,
000.00
25,00
0,000.
00
7,674,800,0
00
62,325,2
00,000.0
0 HSDS
A
CUST
ER 1,
PATH
1,075,000,
000
MSF
528,000,0
00.00
KRCS
22,000,00
0.00
LVCT
4,800,000.
00
UNIC
EF
20,000,00
0.00
AHF
95,883,80
0
TB • To reduce TB
transmission
108750000.0
0
USG EGPA
F
27,500,00
0.00
2,500,
000.0
0
68,797,000.
00
39,953,0
00.00
• To prevent active
TB disease and
morbidity
USG PATH
15,697,000
.00
• To enhance quality
of care for TB and
Leprosy
CHS
12,500,000
.00
GF AMRE
F
10,600,000
.00
Malaria To reduce morbidity
and mortality due to
malaria
1561410890.0
0
USG AfiaUg
avi
192,567,89
0.00
15,000
,000.0
0
1,561,410,89
0
USG AIRS
1,200,000,
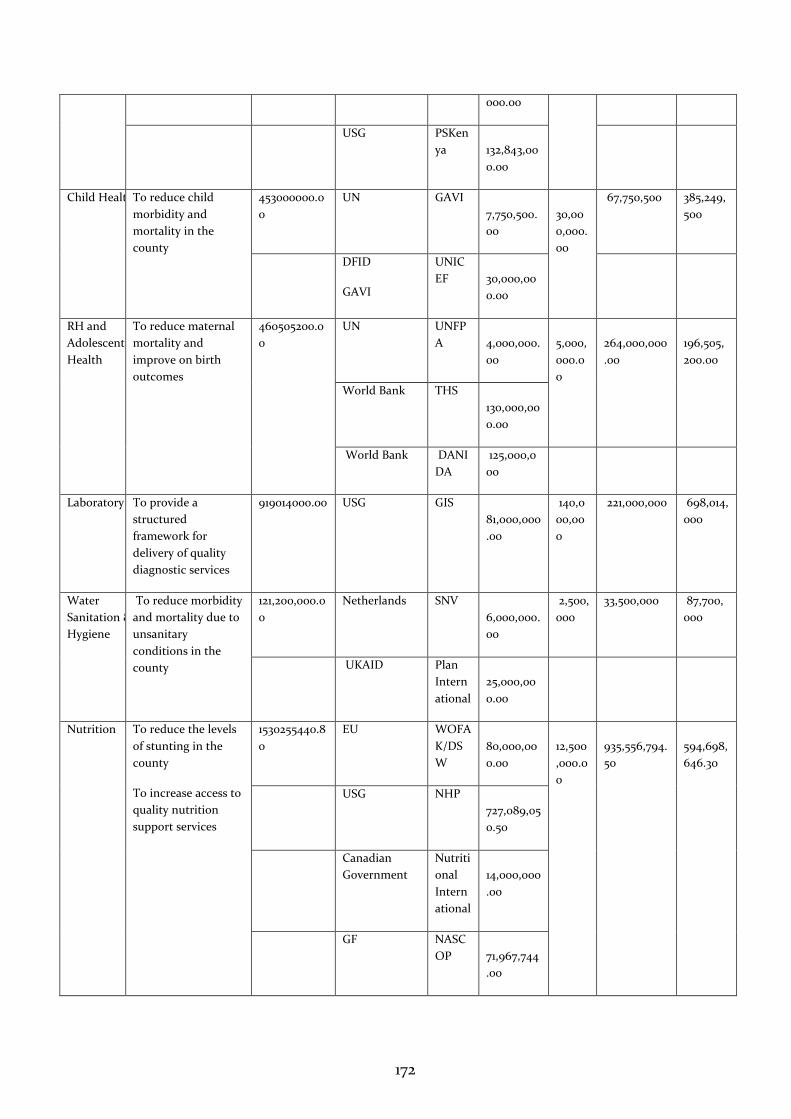
172
000.00
USG PSKen
ya
132,843,00
0.00
Child Health To reduce child
morbidity and
mortality in the
county
453000000.0
0
UN GAVI
7,750,500.
00
30,00
0,000.
00
67,750,500 385,249,
500
DFID
GAVI
UNIC
EF
30,000,00
0.00
RH and
Adolescent
Health
To reduce maternal
mortality and
improve on birth
outcomes
460505200.0
0
UN UNFP
A
4,000,000.
00
5,000,
000.0
0
264,000,000
.00
196,505,
200.00
World Bank THS
130,000,00
0.00
World Bank DANI
DA
125,000,0
00
Laboratory To provide a
structured
framework for
delivery of quality
diagnostic services
919014000.00 USG GIS
81,000,000
.00
140,0
00,00
0
221,000,000 698,014,
000
Water
Sanitation &
Hygiene
To reduce morbidity
and mortality due to
unsanitary
conditions in the
county
121,200,000.0
0
Netherlands SNV
6,000,000.
00
2,500,
000
33,500,000 87,700,
000
UKAID Plan
Intern
ational
25,000,00
0.00
Nutrition
To reduce the levels
of stunting in the
county
To increase access to
quality nutrition
support services
1530255440.8
0
EU WOFA
K/DS
W
80,000,00
0.00
12,500
,000.0
0
935,556,794.
50
594,698,
646.30
USG NHP
727,089,05
0.50
Canadian
Government
Nutriti
onal
Intern
ational
14,000,000
.00
GF NASC
OP
71,967,744
.00
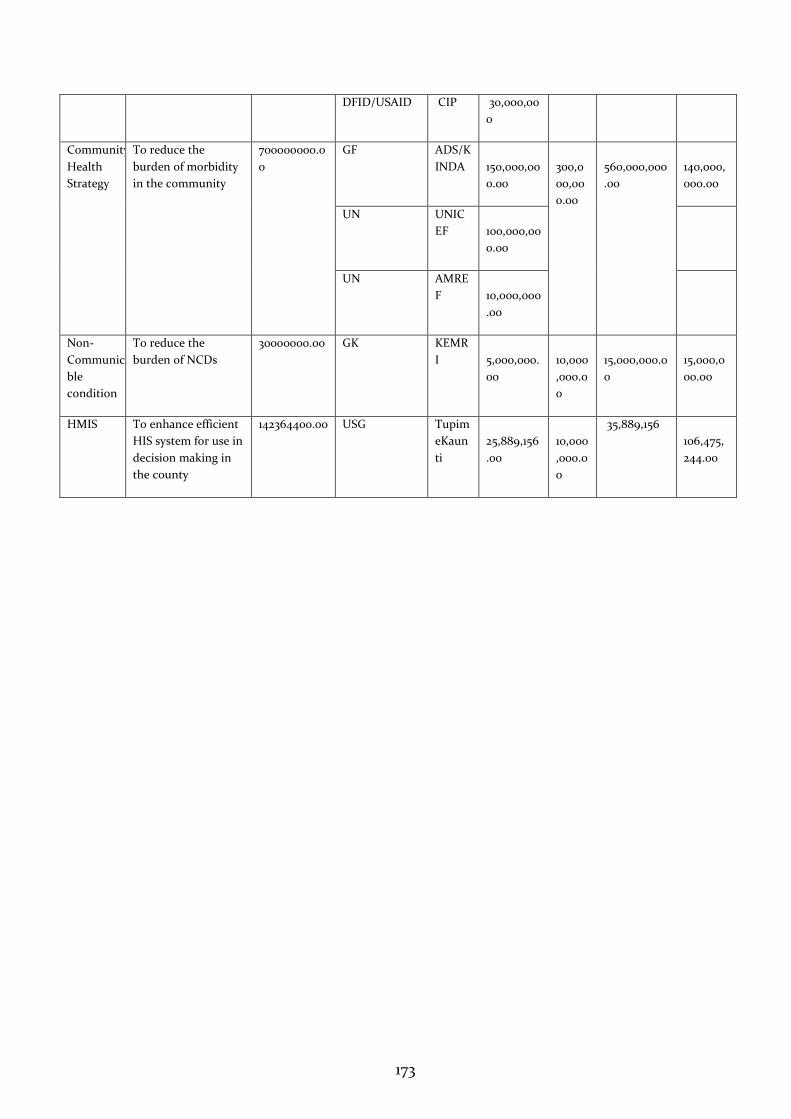
173
DFID/USAID CIP 30,000,00
0
Community
Health
Strategy
To reduce the
burden of morbidity
in the community
700000000.0
0
GF ADS/K
INDA
150,000,00
0.00
300,0
00,00
0.00
560,000,000
.00
140,000,
000.00
UN UNIC
EF
100,000,00
0.00
UN AMRE
F
10,000,000
.00
Non-
Communica
ble
condition
To reduce the
burden of NCDs
30000000.00 GK KEMR
I
5,000,000.
00
10,000
,000.0
0
15,000,000.0
0
15,000,0
00.00
HMIS To enhance efficient
HIS system for use in
decision making in
the county
142364400.00 USG Tupim
eKaun
ti
25,889,156
.00
10,000
,000.0
0
35,889,156
106,475,
244.00
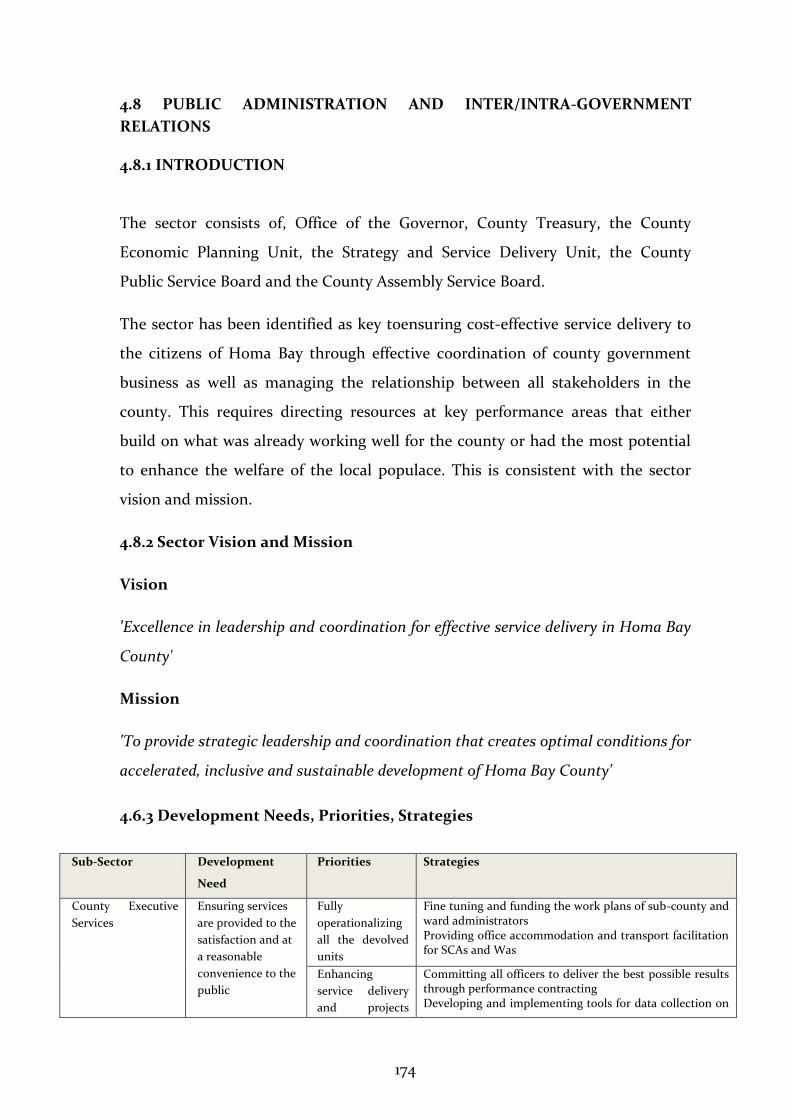
174
4.8 PUBLIC ADMINISTRATION AND INTER/INTRA-GOVERNMENT
RELATIONS
4.8.1 INTRODUCTION
The sector consists of, Office of the Governor, County Treasury, the County
Economic Planning Unit, the Strategy and Service Delivery Unit, the County
Public Service Board and the County Assembly Service Board.
The sector has been identified as key toensuring cost-effective service delivery to
the citizens of Homa Bay through effective coordination of county government
business as well as managing the relationship between all stakeholders in the
county. This requires directing resources at key performance areas that either
build on what was already working well for the county or had the most potential
to enhance the welfare of the local populace. This is consistent with the sector
vision and mission.
4.8.2 Sector Vision and Mission
Vision
'Excellence in leadership and coordination for effective service delivery in Homa Bay
County'
Mission
'To provide strategic leadership and coordination that creates optimal conditions for
accelerated, inclusive and sustainable development of Homa Bay County'
4.6.3 Development Needs, Priorities, Strategies
Sub-Sector Development
Need
Priorities Strategies
County Executive
Services
Ensuring services
are provided to the
satisfaction and at
a reasonable
convenience to the
public
Fully
operationalizing
all the devolved
units
Fine tuning and funding the work plans of sub-county and ward administrators Providing office accommodation and transport facilitation for SCAs and Was
Enhancing
service delivery
and projects
Committing all officers to deliver the best possible results through performance contracting Developing and implementing tools for data collection on
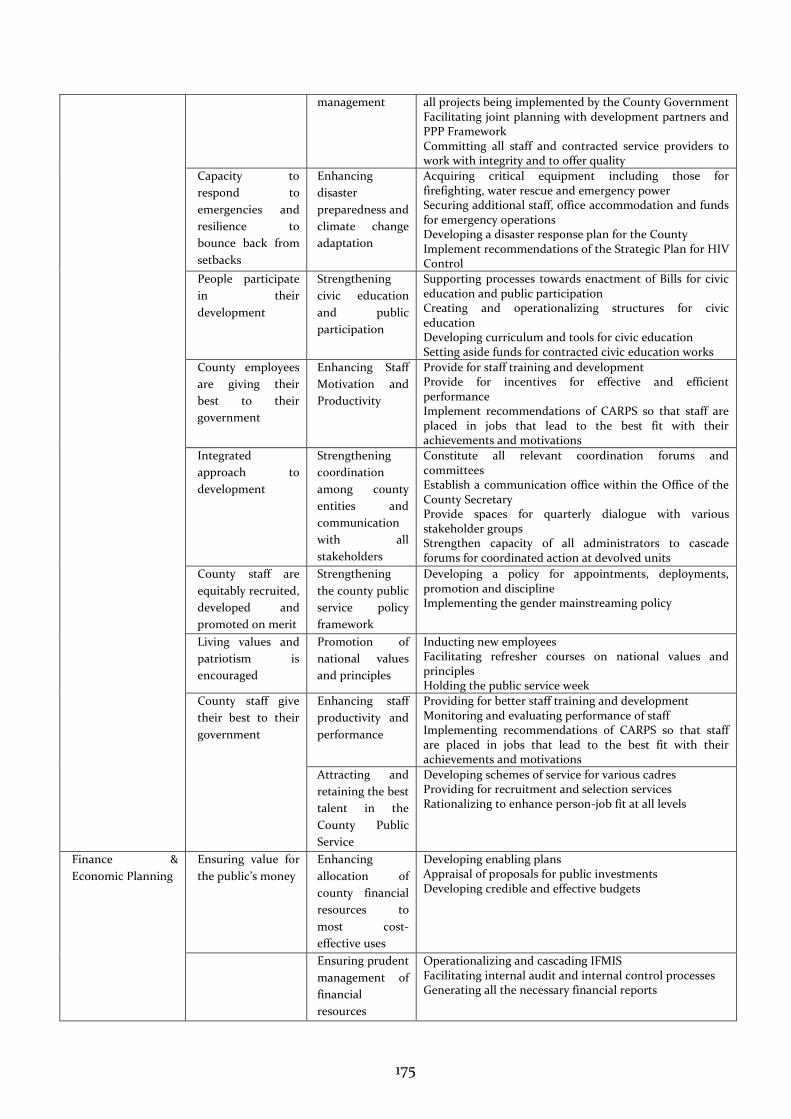
175
management all projects being implemented by the County Government Facilitating joint planning with development partners and PPP Framework Committing all staff and contracted service providers to work with integrity and to offer quality
Capacity to
respond to
emergencies and
resilience to
bounce back from
setbacks
Enhancing
disaster
preparedness and
climate change
adaptation
Acquiring critical equipment including those for firefighting, water rescue and emergency power Securing additional staff, office accommodation and funds for emergency operations Developing a disaster response plan for the County Implement recommendations of the Strategic Plan for HIV Control
People participate
in their
development
Strengthening
civic education
and public
participation
Supporting processes towards enactment of Bills for civic education and public participation Creating and operationalizing structures for civic education Developing curriculum and tools for civic education Setting aside funds for contracted civic education works
County employees
are giving their
best to their
government
Enhancing Staff
Motivation and
Productivity
Provide for staff training and development Provide for incentives for effective and efficient performance Implement recommendations of CARPS so that staff are placed in jobs that lead to the best fit with their achievements and motivations
Integrated
approach to
development
Strengthening
coordination
among county
entities and
communication
with all
stakeholders
Constitute all relevant coordination forums and committees Establish a communication office within the Office of the County Secretary Provide spaces for quarterly dialogue with various stakeholder groups Strengthen capacity of all administrators to cascade forums for coordinated action at devolved units
County staff are
equitably recruited,
developed and
promoted on merit
Strengthening
the county public
service policy
framework
Developing a policy for appointments, deployments, promotion and discipline Implementing the gender mainstreaming policy
Living values and
patriotism is
encouraged
Promotion of
national values
and principles
Inducting new employees Facilitating refresher courses on national values and principles Holding the public service week
County staff give
their best to their
government
Enhancing staff
productivity and
performance
Providing for better staff training and development Monitoring and evaluating performance of staff Implementing recommendations of CARPS so that staff are placed in jobs that lead to the best fit with their achievements and motivations
Attracting and
retaining the best
talent in the
County Public
Service
Developing schemes of service for various cadres Providing for recruitment and selection services Rationalizing to enhance person-job fit at all levels
Finance &
Economic Planning
Ensuring value for
the public’s money
Enhancing
allocation of
county financial
resources to
most cost-
effective uses
Developing enabling plans Appraisal of proposals for public investments Developing credible and effective budgets
Ensuring prudent
management of
financial
resources
Operationalizing and cascading IFMIS Facilitating internal audit and internal control processes Generating all the necessary financial reports
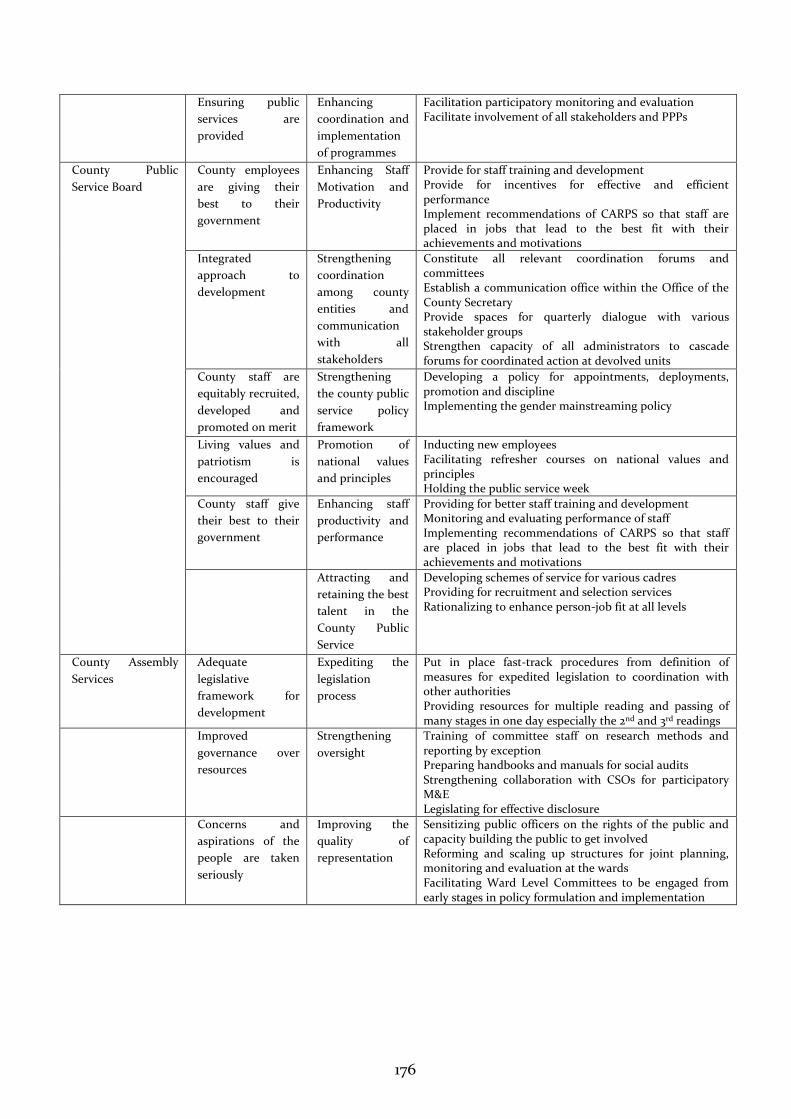
176
Ensuring public
services are
provided
Enhancing
coordination and
implementation
of programmes
Facilitation participatory monitoring and evaluation Facilitate involvement of all stakeholders and PPPs
County Public
Service Board
County employees
are giving their
best to their
government
Enhancing Staff
Motivation and
Productivity
Provide for staff training and development Provide for incentives for effective and efficient performance Implement recommendations of CARPS so that staff are placed in jobs that lead to the best fit with their achievements and motivations
Integrated
approach to
development
Strengthening
coordination
among county
entities and
communication
with all
stakeholders
Constitute all relevant coordination forums and committees Establish a communication office within the Office of the County Secretary Provide spaces for quarterly dialogue with various stakeholder groups Strengthen capacity of all administrators to cascade forums for coordinated action at devolved units
County staff are
equitably recruited,
developed and
promoted on merit
Strengthening
the county public
service policy
framework
Developing a policy for appointments, deployments, promotion and discipline Implementing the gender mainstreaming policy
Living values and
patriotism is
encouraged
Promotion of
national values
and principles
Inducting new employees Facilitating refresher courses on national values and principles Holding the public service week
County staff give
their best to their
government
Enhancing staff
productivity and
performance
Providing for better staff training and development Monitoring and evaluating performance of staff Implementing recommendations of CARPS so that staff are placed in jobs that lead to the best fit with their achievements and motivations
Attracting and
retaining the best
talent in the
County Public
Service
Developing schemes of service for various cadres Providing for recruitment and selection services Rationalizing to enhance person-job fit at all levels
County Assembly
Services
Adequate
legislative
framework for
development
Expediting the
legislation
process
Put in place fast-track procedures from definition of measures for expedited legislation to coordination with other authorities Providing resources for multiple reading and passing of many stages in one day especially the 2nd and 3rd readings
Improved
governance over
resources
Strengthening
oversight
Training of committee staff on research methods and reporting by exception Preparing handbooks and manuals for social audits Strengthening collaboration with CSOs for participatory M&E Legislating for effective disclosure
Concerns and
aspirations of the
people are taken
seriously
Improving the
quality of
representation
Sensitizing public officers on the rights of the public and capacity building the public to get involved Reforming and scaling up structures for joint planning, monitoring and evaluation at the wards Facilitating Ward Level Committees to be engaged from early stages in policy formulation and implementation
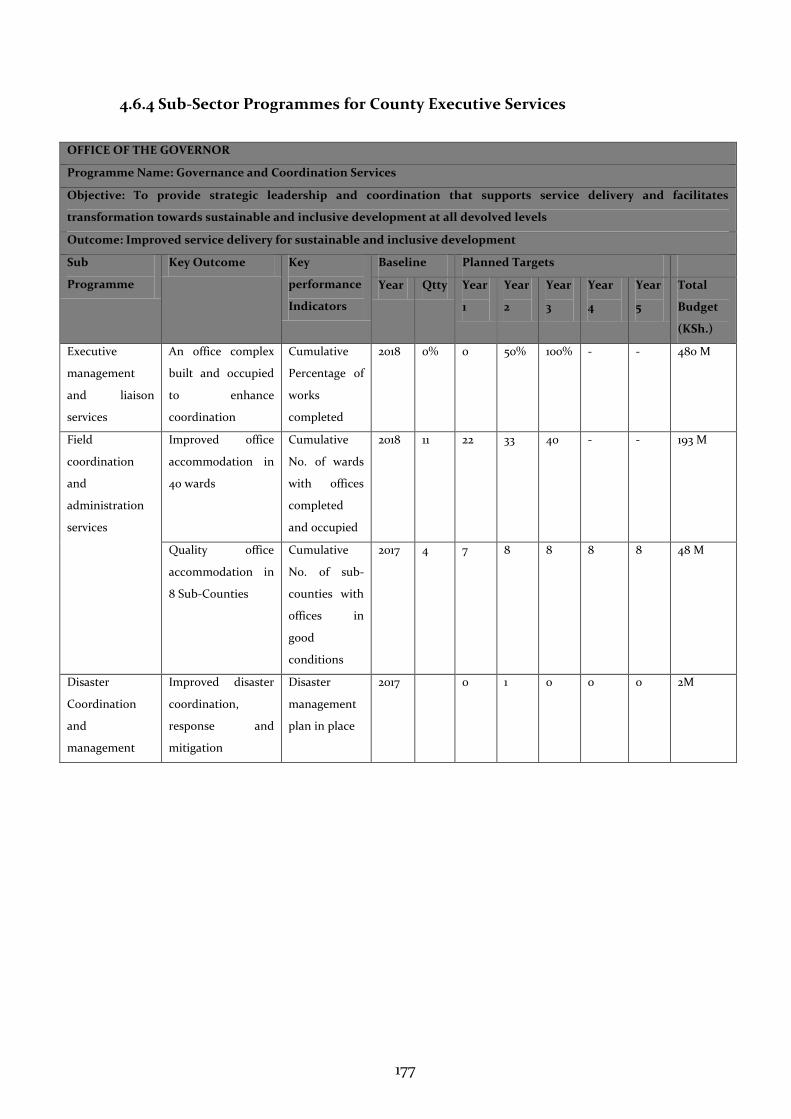
177
4.6.4 Sub-Sector Programmes for County Executive Services
OFFICE OF THE GOVERNOR
Programme Name: Governance and Coordination Services
Objective: To provide strategic leadership and coordination that supports service delivery and facilitates
transformation towards sustainable and inclusive development at all devolved levels
Outcome: Improved service delivery for sustainable and inclusive development
Sub
Programme
Key Outcome Key
performance
Indicators
Baseline Planned Targets
Year Qtty Year
1
Year
2
Year
3
Year
4
Year
5
Total
Budget
(KSh.)
Executive
management
and liaison
services
An office complex
built and occupied
to enhance
coordination
Cumulative
Percentage of
works
completed
2018 0% 0 50% 100% - - 480 M
Field
coordination
and
administration
services
Improved office
accommodation in
40 wards
Cumulative
No. of wards
with offices
completed
and occupied
2018 11 22 33 40 - - 193 M
Quality office
accommodation in
8 Sub-Counties
Cumulative
No. of sub-
counties with
offices in
good
conditions
2017 4 7 8 8 8 8 48 M
Disaster
Coordination
and
management
Improved disaster
coordination,
response and
mitigation
Disaster
management
plan in place
2017 0 1 0 0 0 2M
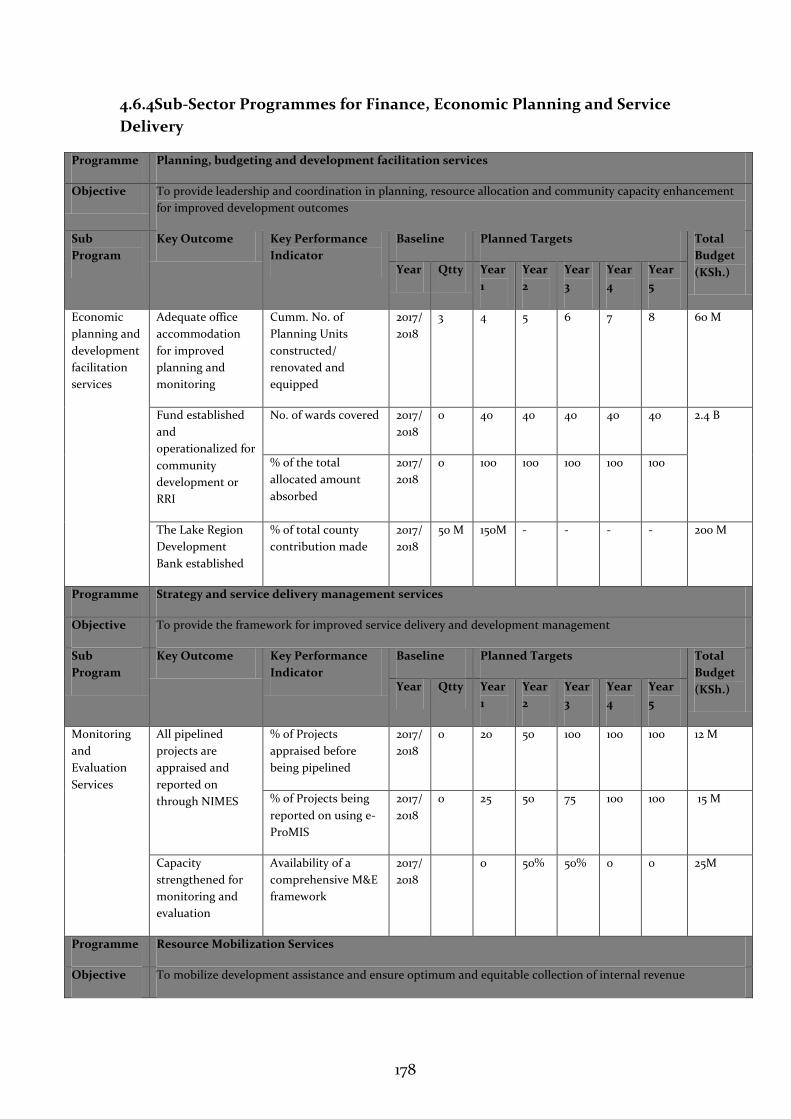
178
4.6.4Sub-Sector Programmes for Finance, Economic Planning and Service
Delivery
Programme Planning, budgeting and development facilitation services
Objective To provide leadership and coordination in planning, resource allocation and community capacity enhancement
for improved development outcomes
Sub
Program
Key Outcome Key Performance
Indicator
Baseline Planned Targets Total
Budget
(KSh.) Year Qtty Year
1
Year
2
Year
3
Year
4
Year
5
Economic
planning and
development
facilitation
services
Adequate office
accommodation
for improved
planning and
monitoring
Cumm. No. of
Planning Units
constructed/
renovated and
equipped
2017/
2018
3 4 5 6 7 8 60 M
Fund established
and
operationalized for
community
development or
RRI
N0. of wards covered 2017/
2018
0 40 40 40 40 40 2.4 B
% of the total
allocated amount
absorbed
2017/
2018
0 100 100 100 100 100
The Lake Region
Development
Bank established
% of total county
contribution made
2017/
2018
50 M 150M - - - - 200 M
Programme Strategy and service delivery management services
Objective To provide the framework for improved service delivery and development management
Sub
Program
Key Outcome Key Performance
Indicator
Baseline Planned Targets Total
Budget
(KSh.) Year Qtty Year
1
Year
2
Year
3
Year
4
Year
5
Monitoring
and
Evaluation
Services
All pipelined
projects are
appraised and
reported on
through NIMES
% of Projects
appraised before
being pipelined
2017/
2018
0 20 50 100 100 100 12 M
% of Projects being
reported on using e-
ProMIS
2017/
2018
0 25 50 75 100 100 15 M
Capacity
strengthened for
monitoring and
evaluation
Availability of a
comprehensive M&E
framework
2017/
2018
0 50% 50% 0 0 25M
Programme Resource Mobilization Services
Objective To mobilize development assistance and ensure optimum and equitable collection of internal revenue
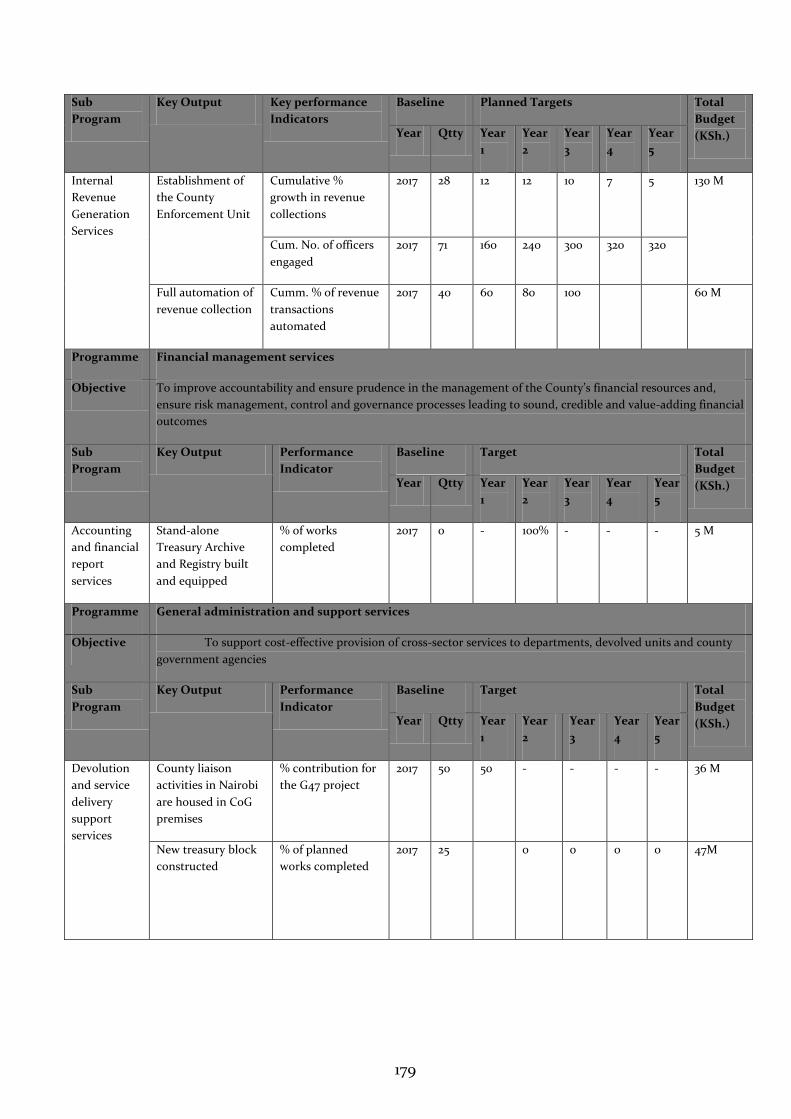
179
Sub
Program
Key Output Key performance
Indicators
Baseline Planned Targets Total
Budget
(KSh.) Year Qtty Year
1
Year
2
Year
3
Year
4
Year
5
Internal
Revenue
Generation
Services
Establishment of
the County
Enforcement Unit
Cumulative %
growth in revenue
collections
2017 28 12 12 10 7 5 130 M
Cum. No. of officers
engaged
2017 71 160 240 300 320 320
Full automation of
revenue collection
Cumm. % of revenue
transactions
automated
2017 40 60 80 100 60 M
Programme Financial management services
Objective To improve accountability and ensure prudence in the management of the County’s financial resources and,
ensure risk management, control and governance processes leading to sound, credible and value-adding financial
outcomes
Sub
Program
Key Output Performance
Indicator
Baseline Target Total
Budget
(KSh.) Year Qtty Year
1
Year
2
Year
3
Year
4
Year
5
Accounting
and financial
report
services
Stand-alone
Treasury Archive
and Registry built
and equipped
% of works
completed
2017 0 - 100% - - - 5 M
Programme General administration and support services
Objective To support cost-effective provision of cross-sector services to departments, devolved units and county
government agencies
Sub
Program
Key Output Performance
Indicator
Baseline Target Total
Budget
(KSh.) Year Qtty Year
1
Year
2
Year
3
Year
4
Year
5
Devolution
and service
delivery
support
services
County liaison
activities in Nairobi
are housed in CoG
premises
% contribution for
the G47 project
2017 50 50 - - - - 36 M
New treasury block
constructed
% of planned
works completed
2017 25 3
7
5
5
3
0 0 0 0 47M
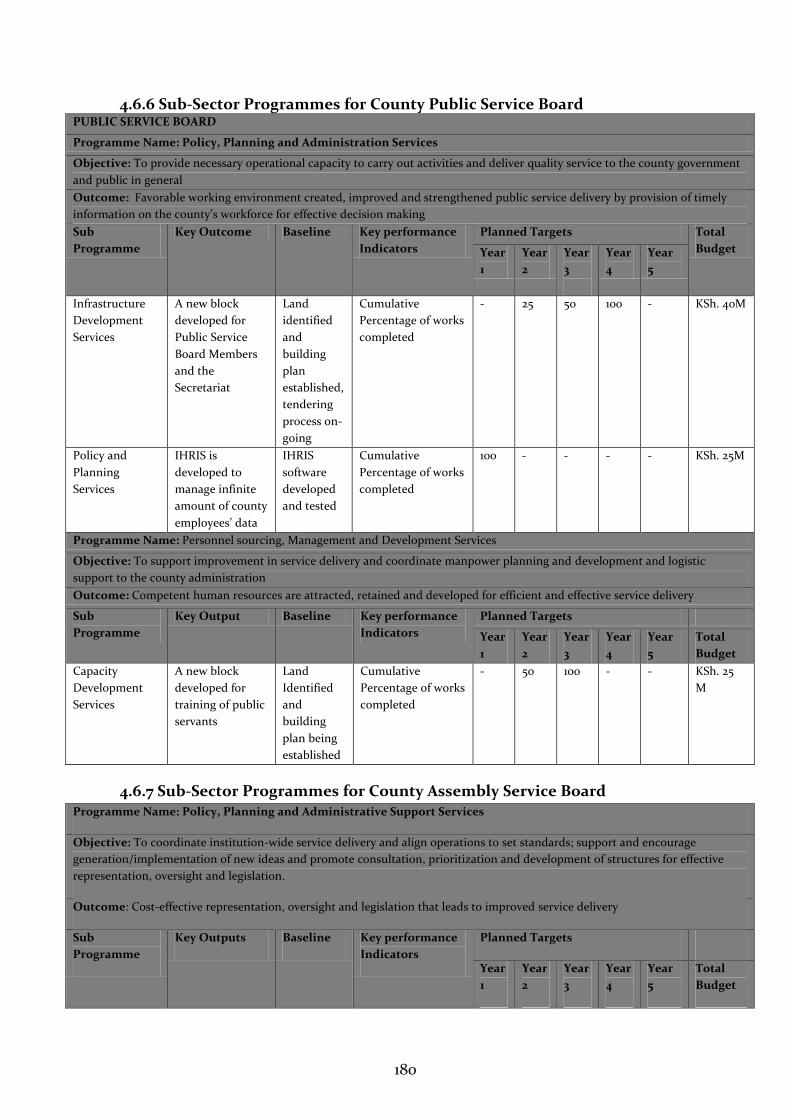
180
4.6.6 Sub-Sector Programmes for County Public Service Board PUBLIC SERVICE BOARD
Programme Name: Policy, Planning and Administration Services
Objective: To provide necessary operational capacity to carry out activities and deliver quality service to the county government
and public in general
Outcome: Favorable working environment created, improved and strengthened public service delivery by provision of timely
information on the county’s workforce for effective decision making
Sub
Programme
Key Outcome Baseline Key performance
Indicators
Planned Targets Total
Budget Year
1
Year
2
Year
3
Year
4
Year
5
Infrastructure
Development
Services
A new block
developed for
Public Service
Board Members
and the
Secretariat
Land
identified
and
building
plan
established,
tendering
process on-
going
Cumulative
Percentage of works
completed
- 25 50 100 - KSh. 40M
Policy and
Planning
Services
IHRIS is
developed to
manage infinite
amount of county
employees’ data
IHRIS
software
developed
and tested
Cumulative
Percentage of works
completed
100 -
- - - KSh. 25M
Programme Name: Personnel sourcing, Management and Development Services
Objective: To support improvement in service delivery and coordinate manpower planning and development and logistic
support to the county administration
Outcome: Competent human resources are attracted, retained and developed for efficient and effective service delivery
Sub
Programme
Key Output Baseline Key performance
Indicators
Planned Targets
Year
1
Year
2
Year
3
Year
4
Year
5
Total
Budget
Capacity
Development
Services
A new block
developed for
training of public
servants
Land
Identified
and
building
plan being
established
Cumulative
Percentage of works
completed
- 50 100 - - KSh. 25
M
4.6.7 Sub-Sector Programmes for County Assembly Service Board Programme Name: Policy, Planning and Administrative Support Services
Objective: To coordinate institution-wide service delivery and align operations to set standards; support and encourage
generation/implementation of new ideas and promote consultation, prioritization and development of structures for effective
representation, oversight and legislation.
Outcome: Cost-effective representation, oversight and legislation that leads to improved service delivery
Sub
Programme
Key Outputs Baseline Key performance
Indicators
Planned Targets
Year
1
Year
2
Year
3
Year
4
Year
5
Total
Budget
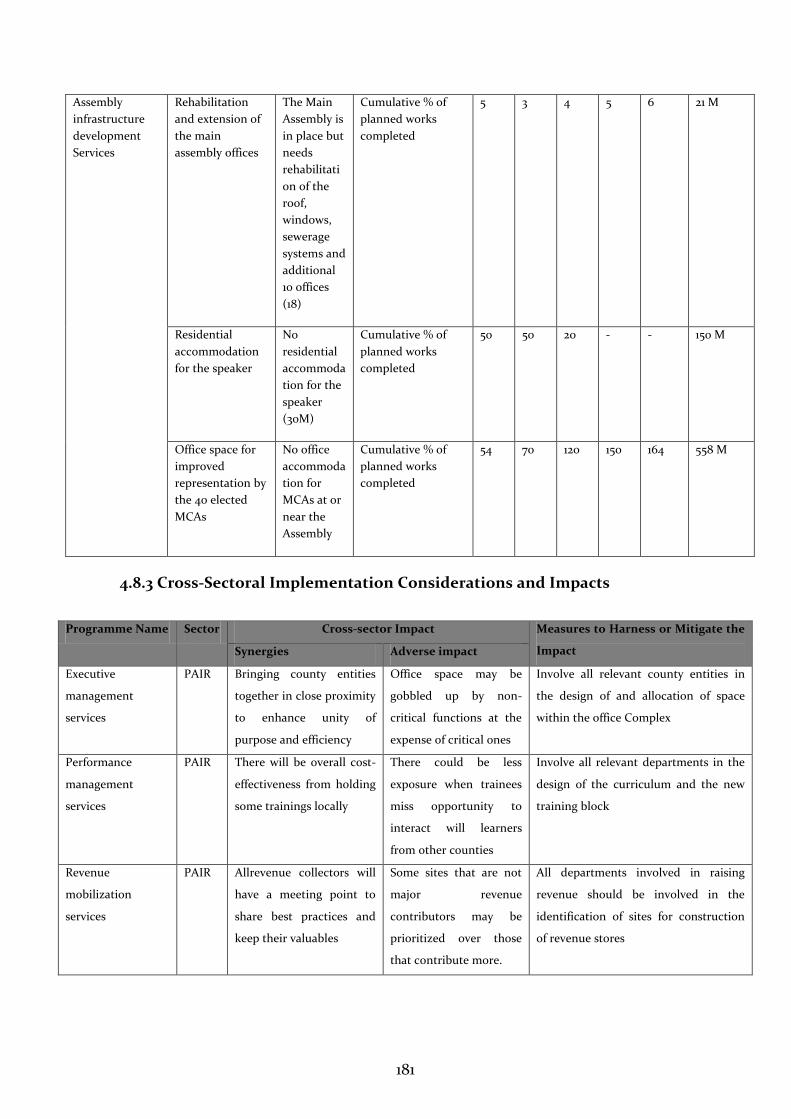
181
Assembly
infrastructure
development
Services
Rehabilitation
and extension of
the main
assembly offices
The Main
Assembly is
in place but
needs
rehabilitati
on of the
roof,
windows,
sewerage
systems and
additional
10 offices
(18)
Cumulative % of
planned works
completed
5 3 4 5 6 21 M
Residential
accommodation
for the speaker
No
residential
accommoda
tion for the
speaker
(30M)
Cumulative % of
planned works
completed
50 50 20 - - 150 M
Office space for
improved
representation by
the 40 elected
MCAs
No office
accommoda
tion for
MCAs at or
near the
Assembly
Cumulative % of
planned works
completed
54 70 120 150 164 558 M
4.8.3 Cross-Sectoral Implementation Considerations and Impacts
Programme Name Sector Cross-sector Impact Measures to Harness or Mitigate the
Impact Synergies Adverse impact
Executive
management
services
PAIR Bringing county entities
together in close proximity
to enhance unity of
purpose and efficiency
Office space may be
gobbled up by non-
critical functions at the
expense of critical ones
Involve all relevant county entities in
the design of and allocation of space
within the office Complex
Performance
management
services
PAIR There will be overall cost-
effectiveness from holding
some trainings locally
There could be less
exposure when trainees
miss opportunity to
interact will learners
from other counties
Involve all relevant departments in the
design of the curriculum and the new
training block
Revenue
mobilization
services
PAIR Allrevenue collectors will
have a meeting point to
share best practices and
keep their valuables
Some sites that are not
major revenue
contributors may be
prioritized over those
that contribute more.
All departments involved in raising
revenue should be involved in the
identification of sites for construction
of revenue stores
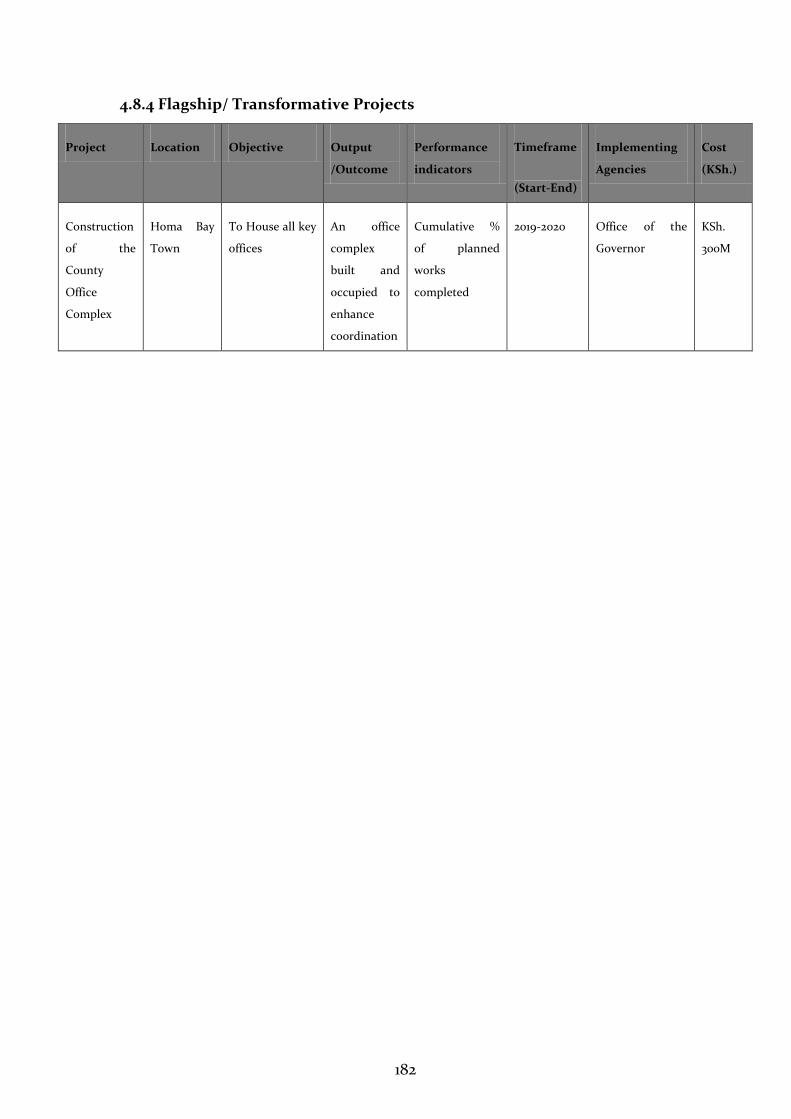
182
4.8.4 Flagship/ Transformative Projects
Project Location Objective Output
/Outcome
Performance
indicators
Timeframe
(Start-End)
Implementing
Agencies
Cost
(KSh.)
Construction
of the
County
Office
Complex
Homa Bay
Town
To House all key
offices
An office
complex
built and
occupied to
enhance
coordination
Cumulative %
of planned
works
completed
2019-2020 Office of the
Governor
KSh.
300M
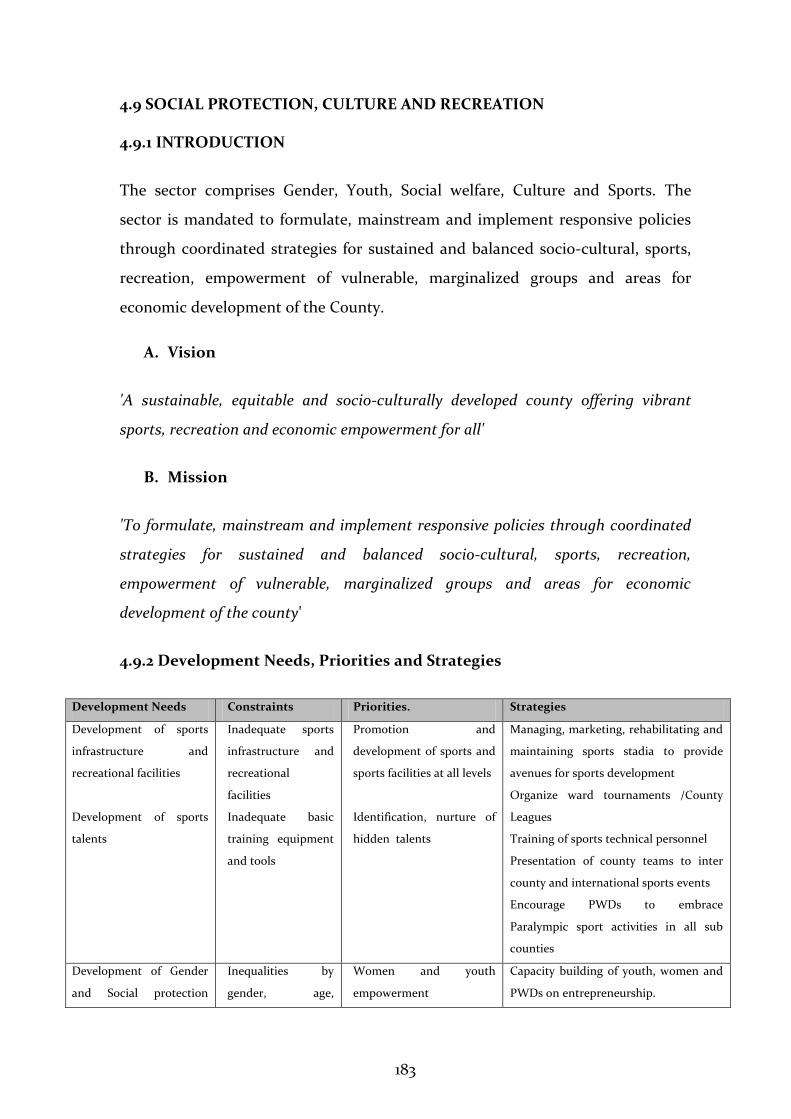
183
4.9 SOCIAL PROTECTION, CULTURE AND RECREATION
4.9.1 INTRODUCTION
The sector comprises Gender, Youth, Social welfare, Culture and Sports. The
sector is mandated to formulate, mainstream and implement responsive policies
through coordinated strategies for sustained and balanced socio-cultural, sports,
recreation, empowerment of vulnerable, marginalized groups and areas for
economic development of the County.
A. Vision
'A sustainable, equitable and socio-culturally developed county offering vibrant
sports, recreation and economic empowerment for all'
B. Mission
'To formulate, mainstream and implement responsive policies through coordinated
strategies for sustained and balanced socio-cultural, sports, recreation,
empowerment of vulnerable, marginalized groups and areas for economic
development of the county'
4.9.2 Development Needs, Priorities and Strategies
Development Needs Constraints Priorities. Strategies
Development of sports
infrastructure and
recreational facilities
Development of sports
talents
Inadequate sports
infrastructure and
recreational
facilities
Inadequate basic
training equipment
and tools
Promotion and
development of sports and
sports facilities at all levels
Identification, nurture of
hidden talents
Managing, marketing, rehabilitating and
maintaining sports stadia to provide
avenues for sports development
Organize ward tournaments /County
Leagues
Training of sports technical personnel
Presentation of county teams to inter
county and international sports events
Encourage PWDs to embrace
Paralympic sport activities in all sub
counties
Development of Gender
and Social protection
Inequalities by
gender, age,
Women and youth
empowerment
Capacity building of youth, women and
PWDs on entrepreneurship.
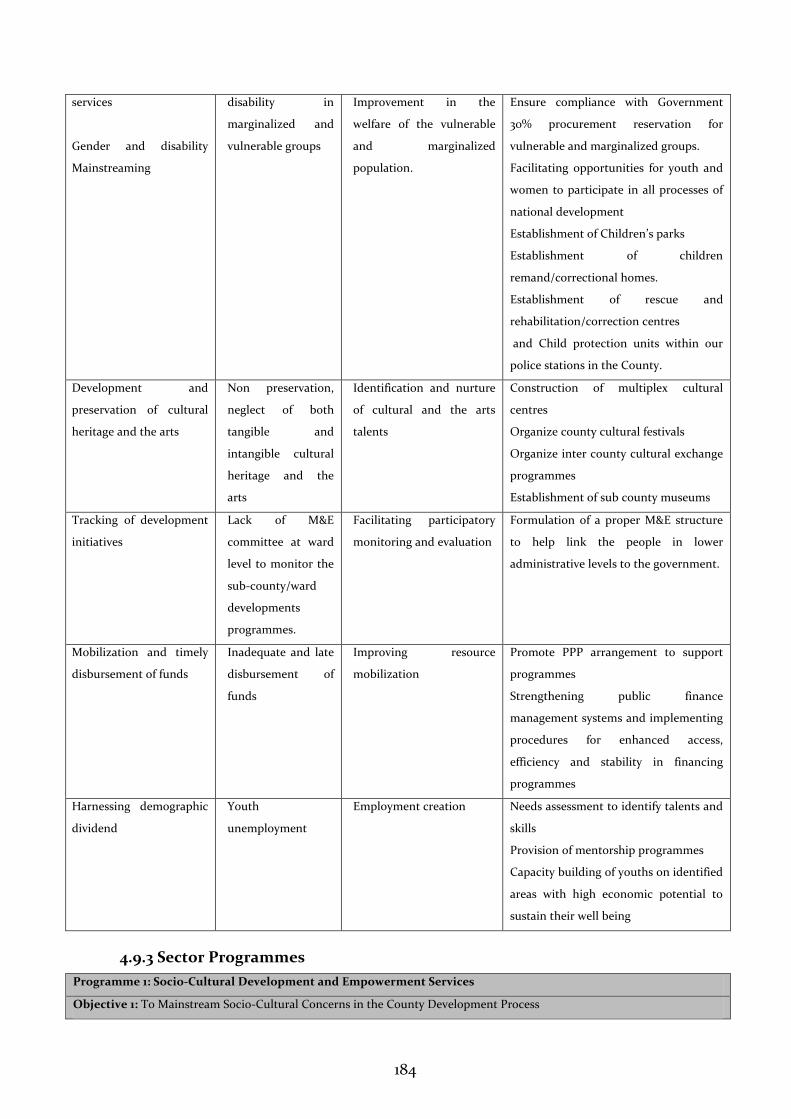
184
services
Gender and disability
Mainstreaming
disability in
marginalized and
vulnerable groups
Improvement in the
welfare of the vulnerable
and marginalized
population.
Ensure compliance with Government
30% procurement reservation for
vulnerable and marginalized groups.
Facilitating opportunities for youth and
women to participate in all processes of
national development
Establishment of Children’s parks
Establishment of children
remand/correctional homes.
Establishment of rescue and
rehabilitation/correction centres
and Child protection units within our
police stations in the County.
Development and
preservation of cultural
heritage and the arts
Non preservation,
neglect of both
tangible and
intangible cultural
heritage and the
arts
Identification and nurture
of cultural and the arts
talents
Construction of multiplex cultural
centres
Organize county cultural festivals
Organize inter county cultural exchange
programmes
Establishment of sub county museums
Tracking of development
initiatives
Lack of M&E
committee at ward
level to monitor the
sub-county/ward
developments
programmes.
Facilitating participatory
monitoring and evaluation
Formulation of a proper M&E structure
to help link the people in lower
administrative levels to the government.
Mobilization and timely
disbursement of funds
Inadequate and late
disbursement of
funds
Improving resource
mobilization
Promote PPP arrangement to support
programmes
Strengthening public finance
management systems and implementing
procedures for enhanced access,
efficiency and stability in financing
programmes
Harnessing demographic
dividend
Youth
unemployment
Employment creation Needs assessment to identify talents and
skills
Provision of mentorship programmes
Capacity building of youths on identified
areas with high economic potential to
sustain their well being
4.9.3 Sector Programmes
Programme 1: Socio-Cultural Development and Empowerment Services
Objective 1: To Mainstream Socio-Cultural Concerns in the County Development Process
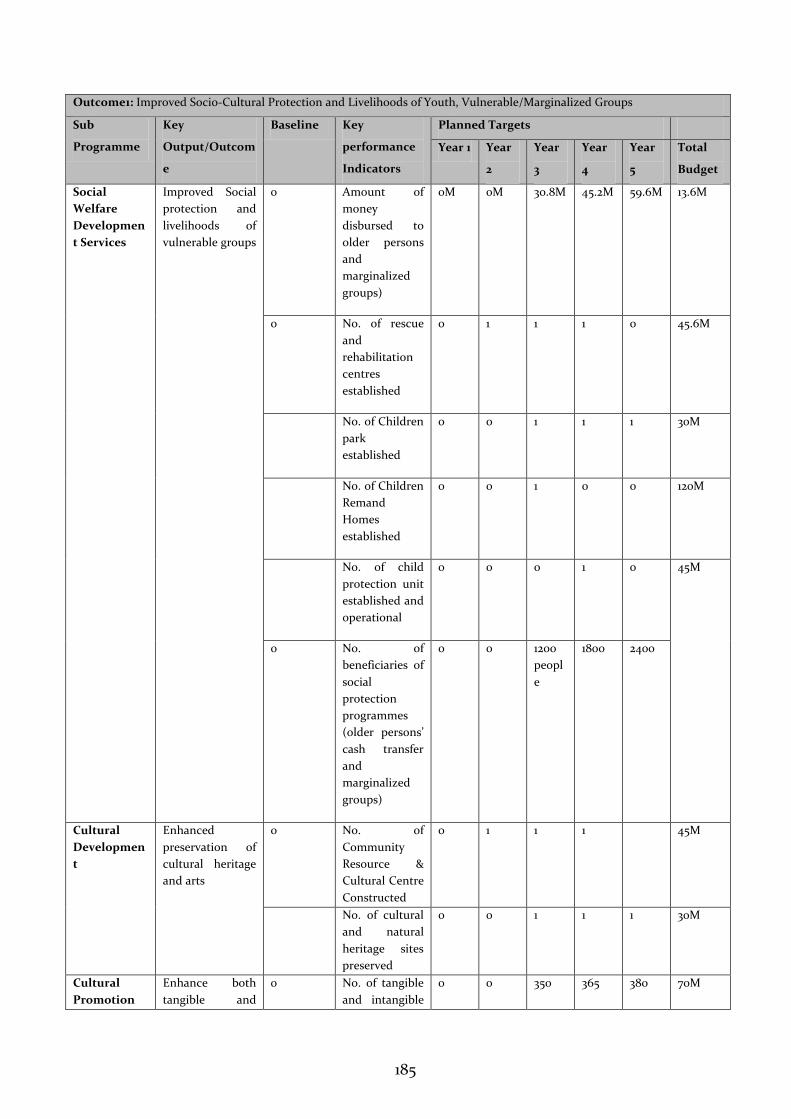
185
Outcome1: Improved Socio-Cultural Protection and Livelihoods of Youth, Vulnerable/Marginalized Groups
Sub
Programme
Key
Output/Outcom
e
Baseline Key
performance
Indicators
Planned Targets
Year 1 Year
2
Year
3
Year
4
Year
5
Total
Budget
Social
Welfare
Developmen
t Services
Improved Social
protection and
livelihoods of
vulnerable groups
0 Amount of
money
disbursed to
older persons
and
marginalized
groups)
0M 0M 30.8M 45.2M 59.6M 13.6M
0 No. of rescue
and
rehabilitation
centres
established
0 1 1 1 0 45.6M
No. of Children
park
established
0 0 1 1 1 30M
No. of Children
Remand
Homes
established
0 0 1 0 0 120M
No. of child
protection unit
established and
operational
0 0 0 1 0 45M
0 No. of
beneficiaries of
social
protection
programmes
(older persons’
cash transfer
and
marginalized
groups)
0 0 1200
peopl
e
1800 2400
Cultural
Developmen
t
Enhanced
preservation of
cultural heritage
and arts
0 No. of
Community
Resource &
Cultural Centre
Constructed
0 1 1 1 45M
No. of cultural
and natural
heritage sites
preserved
0 0 1 1 1 30M
Cultural
Promotion
Enhance both
tangible and
0 No. of tangible
and intangible
0 0 350 365 380 70M
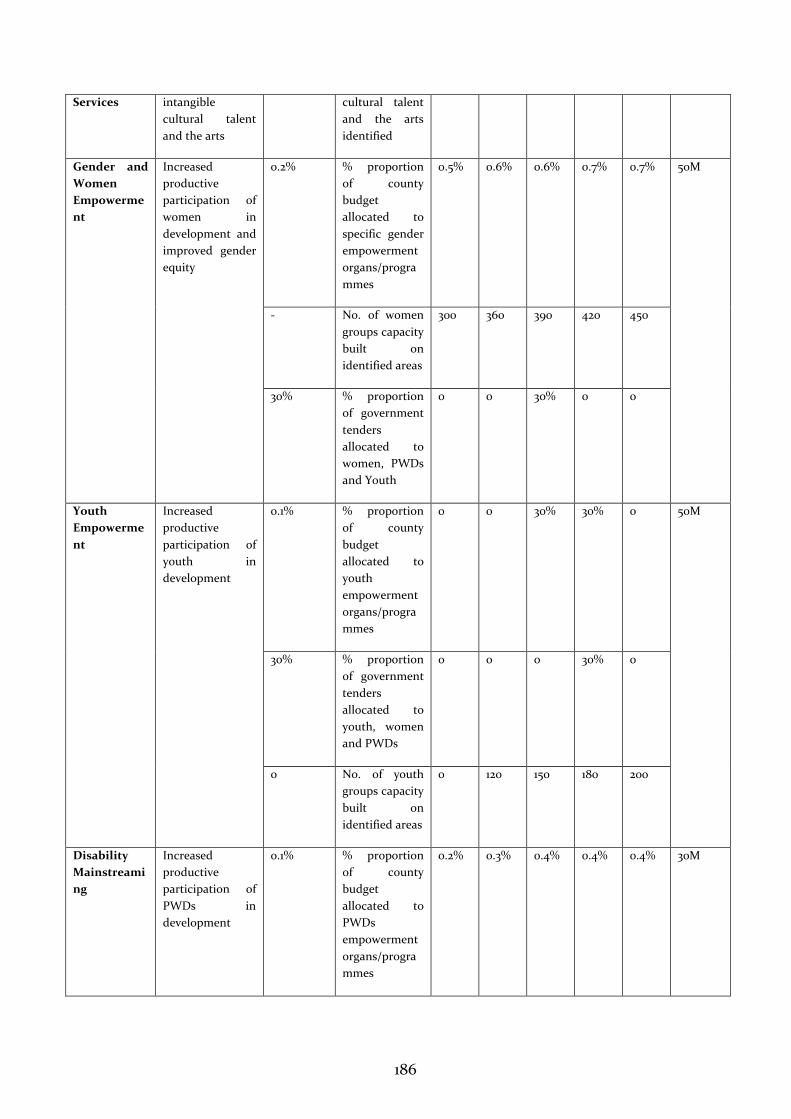
186
Services intangible
cultural talent
and the arts
cultural talent
and the arts
identified
Gender and
Women
Empowerme
nt
Increased
productive
participation of
women in
development and
improved gender
equity
0.2% % proportion
of county
budget
allocated to
specific gender
empowerment
organs/progra
mmes
0.5% 0.6% 0.6% 0.7% 0.7% 50M
- No. of women
groups capacity
built on
identified areas
300 360 390 420 450
30% % proportion
of government
tenders
allocated to
women, PWDs
and Youth
0 0 30% 0 0
Youth
Empowerme
nt
Increased
productive
participation of
youth in
development
0.1% % proportion
of county
budget
allocated to
youth
empowerment
organs/progra
mmes
0 0 30% 30% 0 50M
30% % proportion
of government
tenders
allocated to
youth, women
and PWDs
0 0 0 30% 0
0 No. of youth
groups capacity
built on
identified areas
0 120 150 180 200
Disability
Mainstreami
ng
Increased
productive
participation of
PWDs in
development
0.1% % proportion
of county
budget
allocated to
PWDs
empowerment
organs/progra
mmes
0.2% 0.3% 0.4% 0.4% 0.4% 30M
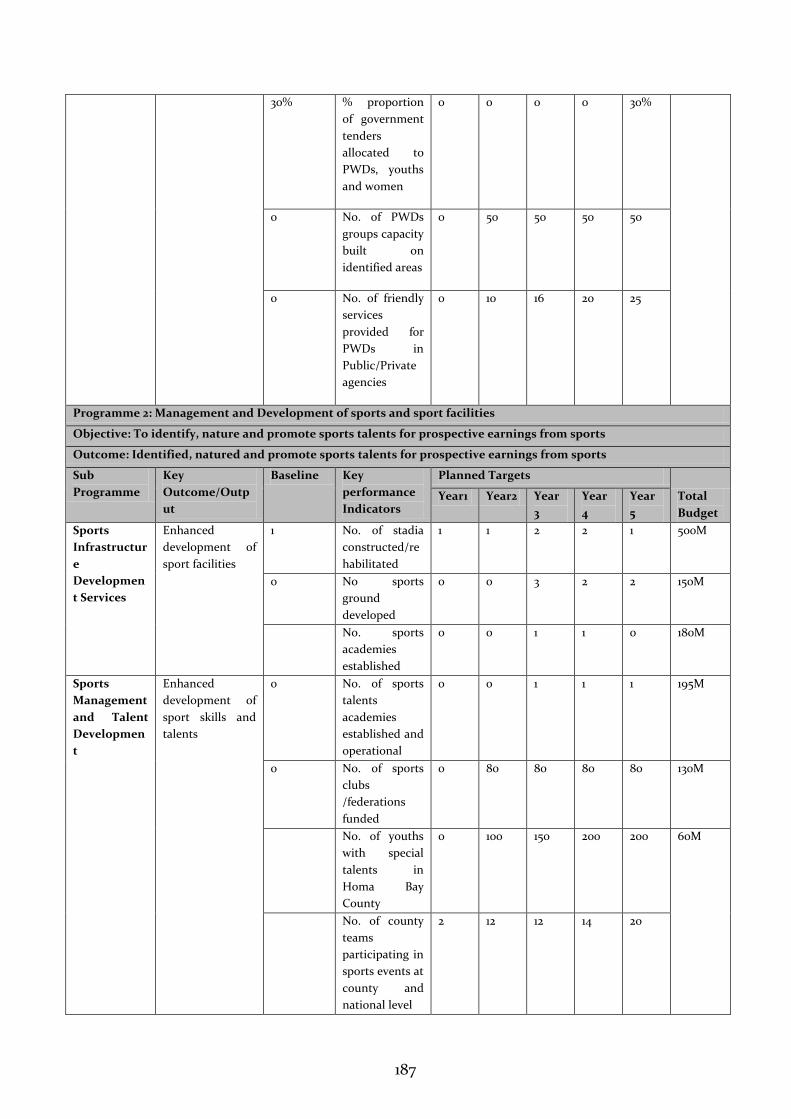
187
30% % proportion
of government
tenders
allocated to
PWDs, youths
and women
0 0 0 0 30%
0 No. of PWDs
groups capacity
built on
identified areas
0 50 50 50 50
0 No. of friendly
services
provided for
PWDs in
Public/Private
agencies
0 10 16 20 25
Programme 2: Management and Development of sports and sport facilities
Objective: To identify, nature and promote sports talents for prospective earnings from sports
Outcome: Identified, natured and promote sports talents for prospective earnings from sports
Sub
Programme
Key
Outcome/Outp
ut
Baseline Key
performance
Indicators
Planned Targets
Total
Budget
Year1 Year2 Year
3
Year
4
Year
5
Sports
Infrastructur
e
Developmen
t Services
Enhanced
development of
sport facilities
1 No. of stadia
constructed/re
habilitated
1 1 2 2 1 500M
0 No sports
ground
developed
0 0 3 2 2 150M
No. sports
academies
established
0 0 1 1 0 180M
Sports
Management
and Talent
Developmen
t
Enhanced
development of
sport skills and
talents
0 No. of sports
talents
academies
established and
operational
0 0 1 1 1 195M
0 No. of sports
clubs
/federations
funded
0 80 80 80 80 130M
No. of youths
with special
talents in
Homa Bay
County
0 100 150 200 200 60M
No. of county
teams
participating in
sports events at
county and
national level
2 12 12 14 20
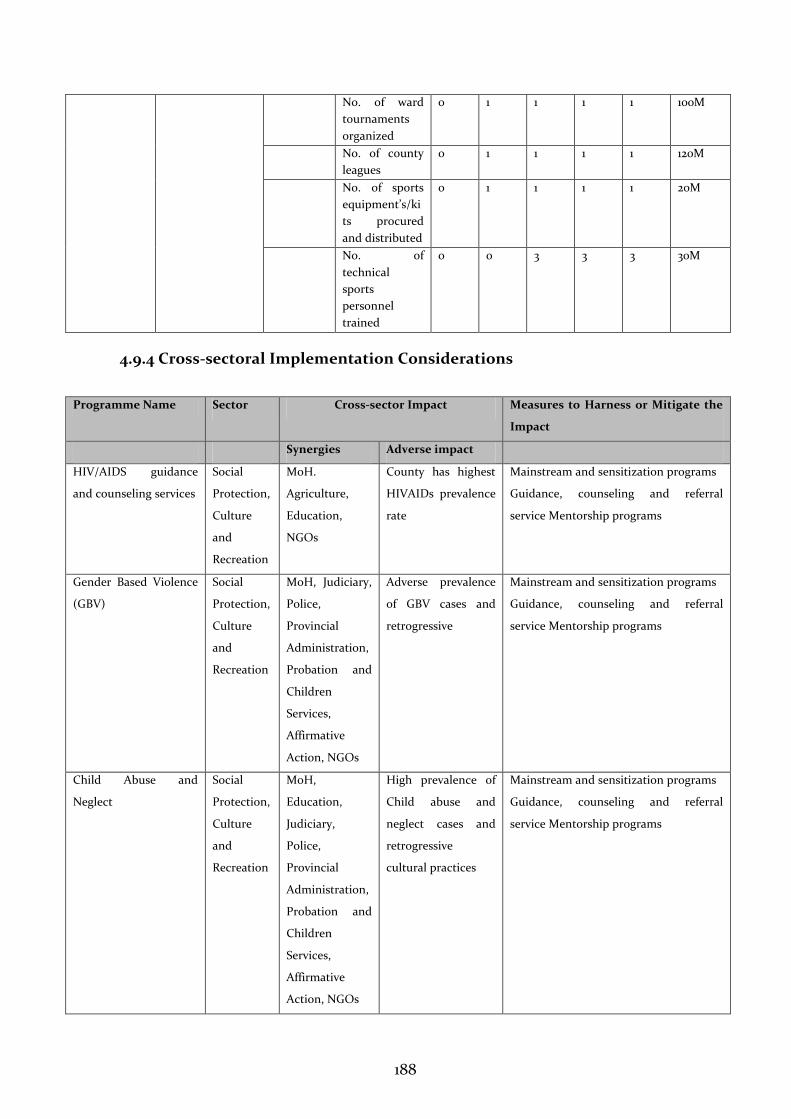
188
No. of ward
tournaments
organized
0 1 1 1 1 100M
No. of county
leagues
0 1 1 1 1 120M
No. of sports
equipment’s/ki
ts procured
and distributed
0 1 1 1 1 20M
No. of
technical
sports
personnel
trained
0 0 3 3 3 30M
4.9.4 Cross-sectoral Implementation Considerations
Programme Name Sector Cross-sector Impact Measures to Harness or Mitigate the
Impact
Synergies Adverse impact
HIV/AIDS guidance
and counseling services
Social
Protection,
Culture
and
Recreation
MoH.
Agriculture,
Education,
NGOs
County has highest
HIVAIDs prevalence
rate
Mainstream and sensitization programs
Guidance, counseling and referral
service Mentorship programs
Gender Based Violence
(GBV)
Social
Protection,
Culture
and
Recreation
MoH, Judiciary,
Police,
Provincial
Administration,
Probation and
Children
Services,
Affirmative
Action, NGOs
Adverse prevalence
of GBV cases and
retrogressive
Mainstream and sensitization programs
Guidance, counseling and referral
service Mentorship programs
Child Abuse and
Neglect
Social
Protection,
Culture
and
Recreation
MoH,
Education,
Judiciary,
Police,
Provincial
Administration,
Probation and
Children
Services,
Affirmative
Action, NGOs
High prevalence of
Child abuse and
neglect cases and
retrogressive
cultural practices
Mainstream and sensitization programs
Guidance, counseling and referral
service Mentorship programs
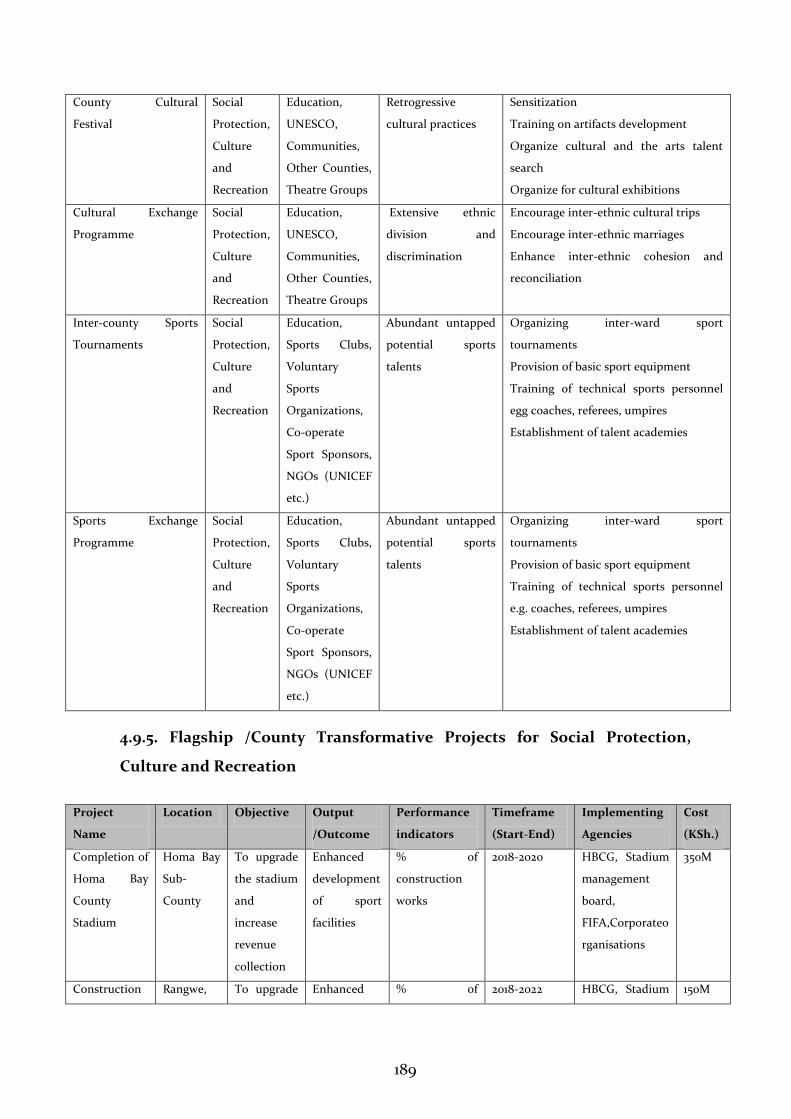
189
County Cultural
Festival
Social
Protection,
Culture
and
Recreation
Education,
UNESCO,
Communities,
Other Counties,
Theatre Groups
Retrogressive
cultural practices
Sensitization
Training on artifacts development
Organize cultural and the arts talent
search
Organize for cultural exhibitions
Cultural Exchange
Programme
Social
Protection,
Culture
and
Recreation
Education,
UNESCO,
Communities,
Other Counties,
Theatre Groups
Extensive ethnic
division and
discrimination
Encourage inter-ethnic cultural trips
Encourage inter-ethnic marriages
Enhance inter-ethnic cohesion and
reconciliation
Inter-county Sports
Tournaments
Social
Protection,
Culture
and
Recreation
Education,
Sports Clubs,
Voluntary
Sports
Organizations,
Co-operate
Sport Sponsors,
NGOs (UNICEF
etc.)
Abundant untapped
potential sports
talents
Organizing inter-ward sport
tournaments
Provision of basic sport equipment
Training of technical sports personnel
egg coaches, referees, umpires
Establishment of talent academies
Sports Exchange
Programme
Social
Protection,
Culture
and
Recreation
Education,
Sports Clubs,
Voluntary
Sports
Organizations,
Co-operate
Sport Sponsors,
NGOs (UNICEF
etc.)
Abundant untapped
potential sports
talents
Organizing inter-ward sport
tournaments
Provision of basic sport equipment
Training of technical sports personnel
e.g. coaches, referees, umpires
Establishment of talent academies
4.9.5. Flagship /County Transformative Projects for Social Protection,
Culture and Recreation
Project
Name
Location Objective Output
/Outcome
Performance
indicators
Timeframe
(Start-End)
Implementing
Agencies
Cost
(KSh.)
Completion of
Homa Bay
County
Stadium
Homa Bay
Sub-
County
To upgrade
the stadium
and
increase
revenue
collection
Enhanced
development
of sport
facilities
% of
construction
works
2018-2020 HBCG, Stadium
management
board,
FIFA,Corporateo
rganisations
350M
Construction Rangwe, To upgrade Enhanced % of 2018-2022 HBCG, Stadium 150M
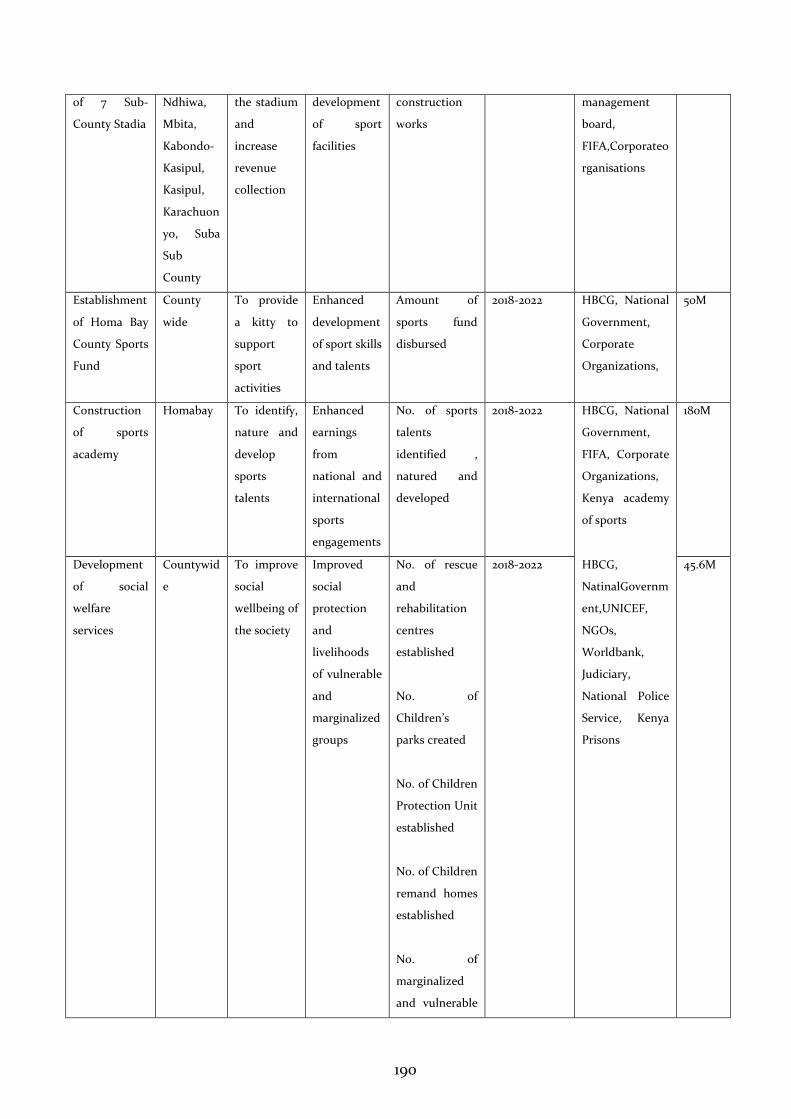
190
of 7 Sub-
County Stadia
Ndhiwa,
Mbita,
Kabondo-
Kasipul,
Kasipul,
Karachuon
yo, Suba
Sub
County
the stadium
and
increase
revenue
collection
development
of sport
facilities
construction
works
management
board,
FIFA,Corporateo
rganisations
Establishment
of Homa Bay
County Sports
Fund
County
wide
To provide
a kitty to
support
sport
activities
Enhanced
development
of sport skills
and talents
Amount of
sports fund
disbursed
2018-2022 HBCG, National
Government,
Corporate
Organizations,
50M
Construction
of sports
academy
Homabay To identify,
nature and
develop
sports
talents
Enhanced
earnings
from
national and
international
sports
engagements
No. of sports
talents
identified ,
natured and
developed
2018-2022 HBCG, National
Government,
FIFA, Corporate
Organizations,
Kenya academy
of sports
180M
Development
of social
welfare
services
Countywid
e
To improve
social
wellbeing of
the society
Improved
social
protection
and
livelihoods
of vulnerable
and
marginalized
groups
No. of rescue
and
rehabilitation
centres
established
No. of
Children’s
parks created
No. of Children
Protection Unit
established
No. of Children
remand homes
established
No. of
marginalized
and vulnerable
2018-2022 HBCG,
NatinalGovernm
ent,UNICEF,
NGOs,
Worldbank,
Judiciary,
National Police
Service, Kenya
Prisons
45.6M
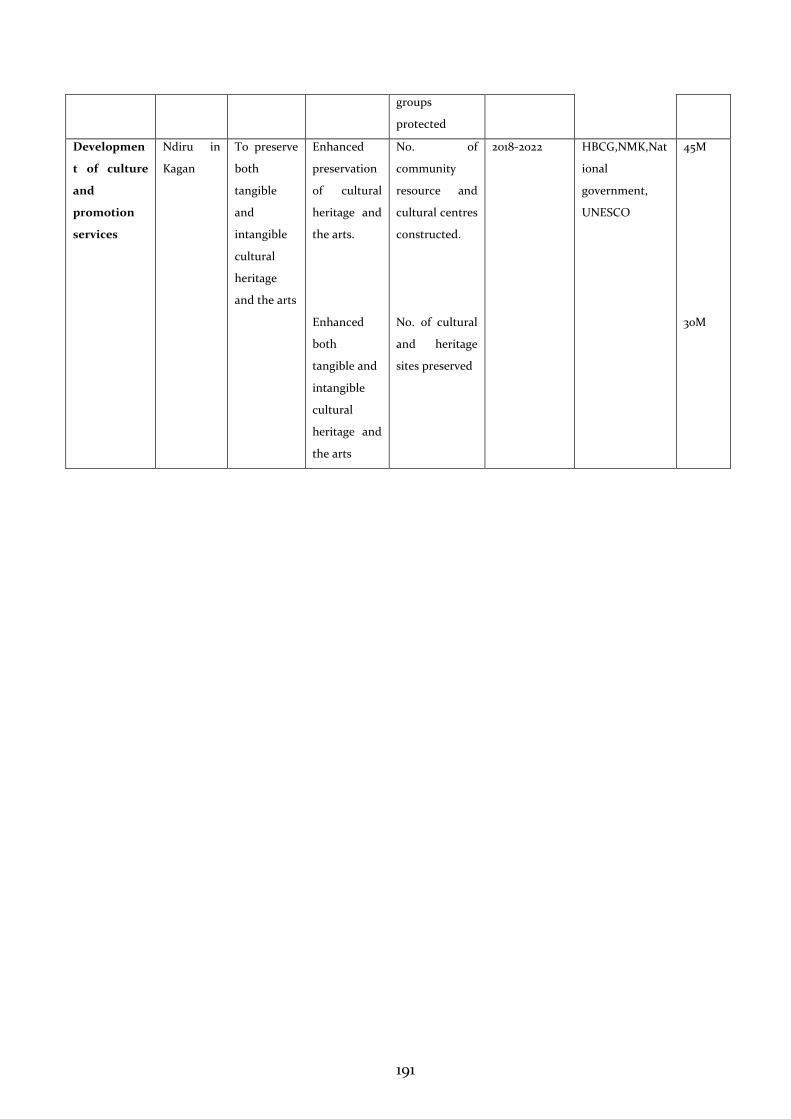
191
groups
protected
Developmen
t of culture
and
promotion
services
Ndiru in
Kagan
To preserve
both
tangible
and
intangible
cultural
heritage
and the arts
Enhanced
preservation
of cultural
heritage and
the arts.
Enhanced
both
tangible and
intangible
cultural
heritage and
the arts
No. of
community
resource and
cultural centres
constructed.
No. of cultural
and heritage
sites preserved
2018-2022 HBCG,NMK,Nat
ional
government,
UNESCO
45M
30M
192
4.10 ENVIRONMENTAL PROTECTION, WATER AND NATURAL RESOURCES
4.10.1 INTRODUCTION
The priority for water and environment sub-sector include capacity building of
communities on sustainable management of environment, water and sanitation
resources, enforcement of regulations and standards, harnessing underground and
surface water capabilities using modern technologies, and improving development
and maintenance of environment, water and sanitation resources.
A. VISION
"A clean, healthy environment with safe, reliable and equitable water with well-
defined irrigation systems"
B. MISSION
"To promote, conserve and protect environment and improve access to safe water
for domestic, industrial and irrigation purposes for sustainable county
development".
C. SUB-SECTOR OBJECTIVES
The specific objectives are to:
Enhance sustainable management of environment, water, irrigation and
natural resources;
Ensure access to water and natural resources for socio-economic development;
Enhance capacity building for environment, water and natural resources
management;
Increase utilization of land through irrigation, drainage and land reclamation;
Protect and reclaim the environment in order to establish a durable and
sustainable system of development and resilience to climate change.
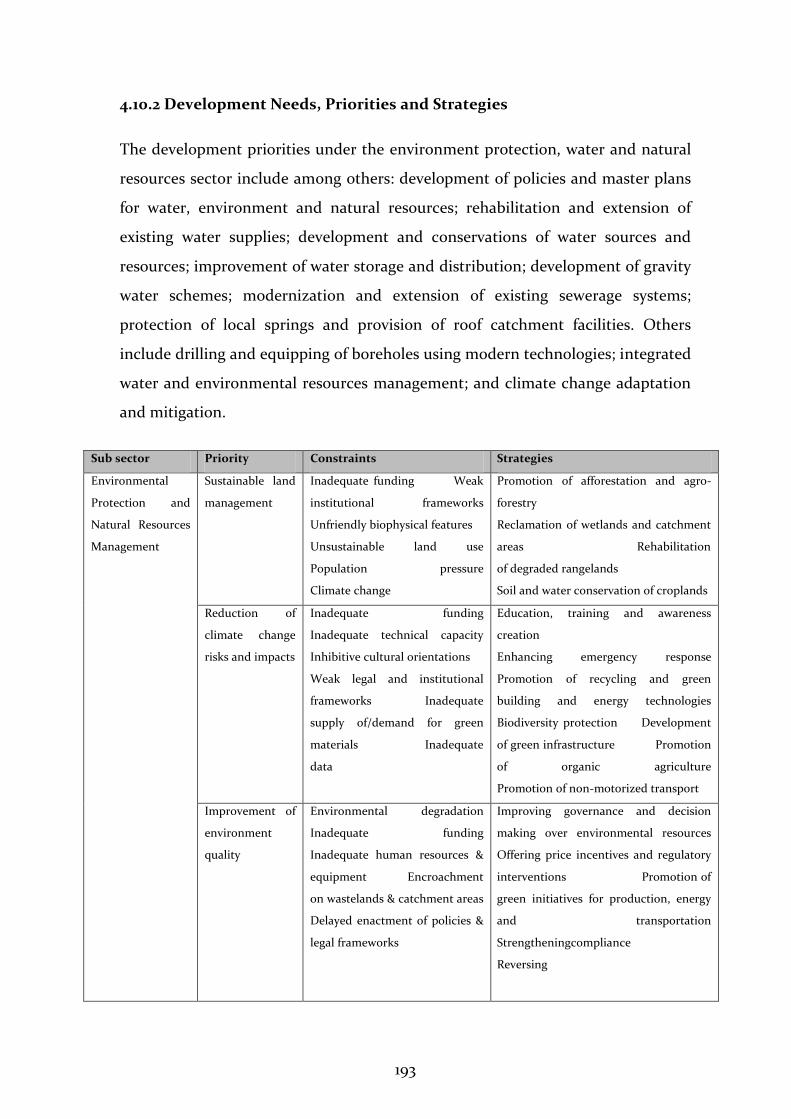
193
4.10.2 Development Needs, Priorities and Strategies
The development priorities under the environment protection, water and natural
resources sector include among others: development of policies and master plans
for water, environment and natural resources; rehabilitation and extension of
existing water supplies; development and conservations of water sources and
resources; improvement of water storage and distribution; development of gravity
water schemes; modernization and extension of existing sewerage systems;
protection of local springs and provision of roof catchment facilities. Others
include drilling and equipping of boreholes using modern technologies; integrated
water and environmental resources management; and climate change adaptation
and mitigation.
Sub sector Priority Constraints Strategies
Environmental
Protection and
Natural Resources
Management
Sustainable land
management
Inadequate funding Weak
institutional frameworks
Unfriendly biophysical features
Unsustainable land use
Population pressure
Climate change
Promotion of afforestation and agro-
forestry
Reclamation of wetlands and catchment
areas Rehabilitation
of degraded rangelands
Soil and water conservation of croplands
Reduction of
climate change
risks and impacts
Inadequate funding
Inadequate technical capacity
Inhibitive cultural orientations
Weak legal and institutional
frameworks Inadequate
supply of/demand for green
materials Inadequate
data
Education, training and awareness
creation
Enhancing emergency response
Promotion of recycling and green
building and energy technologies
Biodiversity protection Development
of green infrastructure Promotion
of organic agriculture
Promotion of non-motorized transport
Improvement of
environment
quality
Environmental degradation
Inadequate funding
Inadequate human resources &
equipment Encroachment
on wastelands & catchment areas
Delayed enactment of policies &
legal frameworks
Improving governance and decision
making over environmental resources
Offering price incentives and regulatory
interventions Promotion of
green initiatives for production, energy
and transportation
Strengtheningcompliance
Reversing
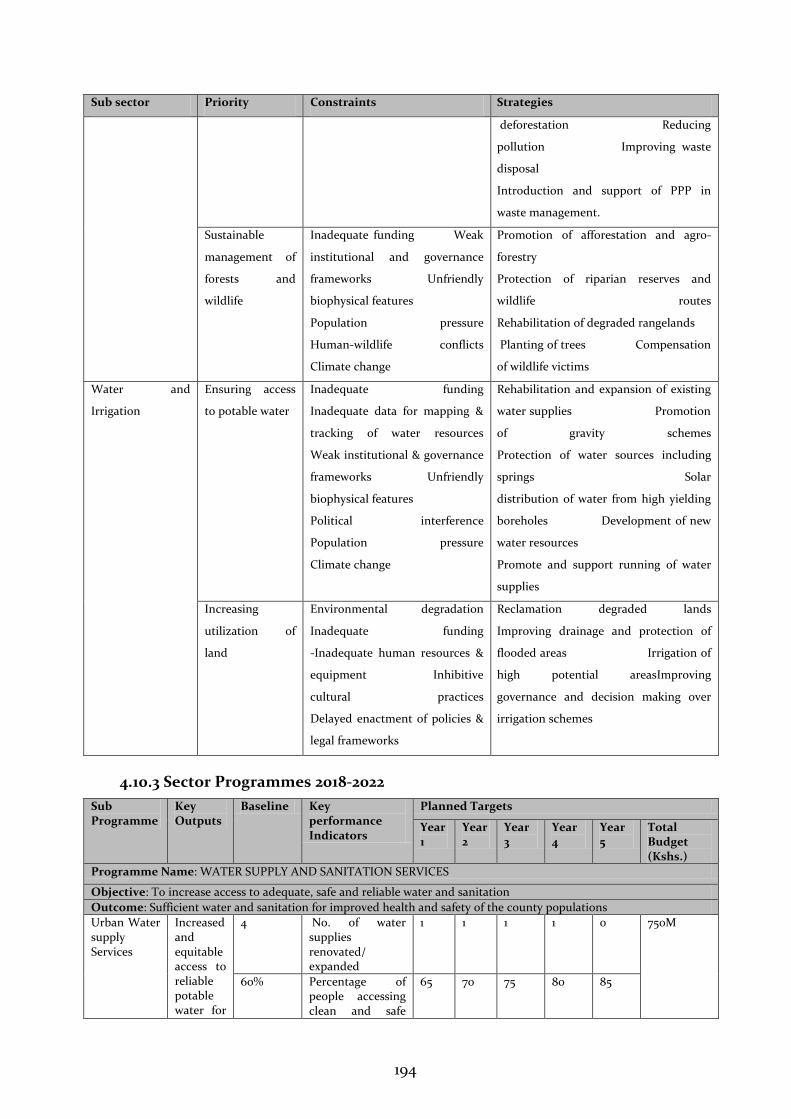
194
Sub sector Priority Constraints Strategies
deforestation Reducing
pollution Improving waste
disposal
Introduction and support of PPP in
waste management.
Sustainable
management of
forests and
wildlife
Inadequate funding Weak
institutional and governance
frameworks Unfriendly
biophysical features
Population pressure
Human-wildlife conflicts
Climate change
Promotion of afforestation and agro-
forestry
Protection of riparian reserves and
wildlife routes
Rehabilitation of degraded rangelands
Planting of trees Compensation
of wildlife victims
Water and
Irrigation
Ensuring access
to potable water
Inadequate funding
Inadequate data for mapping &
tracking of water resources
Weak institutional & governance
frameworks Unfriendly
biophysical features
Political interference
Population pressure
Climate change
Rehabilitation and expansion of existing
water supplies Promotion
of gravity schemes
Protection of water sources including
springs Solar
distribution of water from high yielding
boreholes Development of new
water resources
Promote and support running of water
supplies
Increasing
utilization of
land
Environmental degradation
Inadequate funding
-Inadequate human resources &
equipment Inhibitive
cultural practices
Delayed enactment of policies &
legal frameworks
Reclamation degraded lands
Improving drainage and protection of
flooded areas Irrigation of
high potential areasImproving
governance and decision making over
irrigation schemes
4.10.3 Sector Programmes 2018-2022
Sub Programme
Key Outputs
Baseline Key performance Indicators
Planned Targets
Year 1
Year 2
Year 3
Year 4
Year 5
Total Budget (Kshs.)
Programme Name: WATER SUPPLY AND SANITATION SERVICES
Objective: To increase access to adequate, safe and reliable water and sanitation
Outcome: Sufficient water and sanitation for improved health and safety of the county populations
Urban Water supply Services
Increased and equitable access to reliable potable water for
4 No. of water supplies renovated/ expanded
1 1 1 1 0 750M
60% Percentage of people accessing clean and safe
65 70 75 80 85
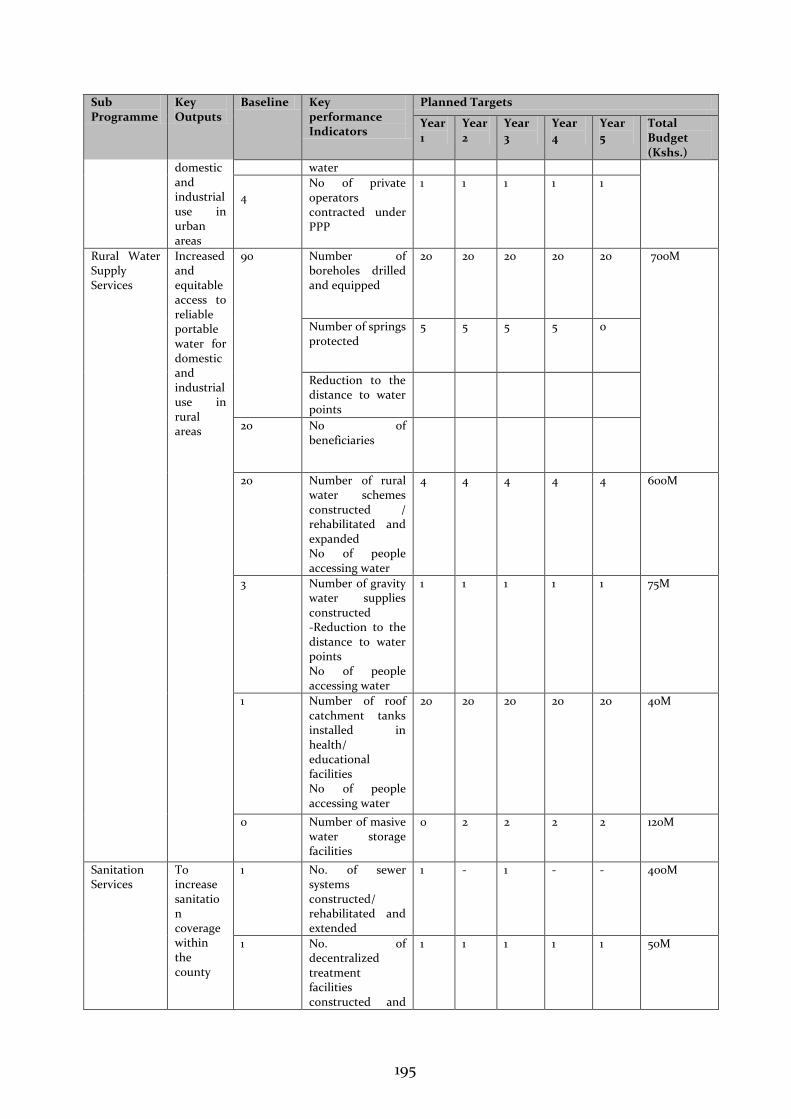
195
Sub Programme
Key Outputs
Baseline Key performance Indicators
Planned Targets
Year 1
Year 2
Year 3
Year 4
Year 5
Total Budget (Kshs.)
domestic and industrial use in urban areas
water
4
No of private operators contracted under PPP
1 1 1 1 1
Rural Water Supply Services
Increased and equitable access to reliable portable water for domestic and industrial use in rural areas
90 Number of boreholes drilled and equipped
20 20 20 20 20 700M
Number of springs protected
5 5 5 5 0
Reduction to the distance to water points
20 No of beneficiaries
20 Number of rural water schemes constructed / rehabilitated and expanded No of people accessing water
4 4 4 4 4 600M
3 Number of gravity water supplies constructed -Reduction to the distance to water points No of people accessing water
1 1 1 1 1 75M
1 Number of roof catchment tanks installed in health/ educational facilities No of people accessing water
20 20 20 20 20 40M
0 Number of masive water storage facilities
0 2 2 2 2 120M
Sanitation Services
To increase sanitation coverage within the county
1 No. of sewer systems constructed/ rehabilitated and extended
1 - 1 - - 400M
1 No. of decentralized treatment facilities constructed and
1 1 1 1 1 50M
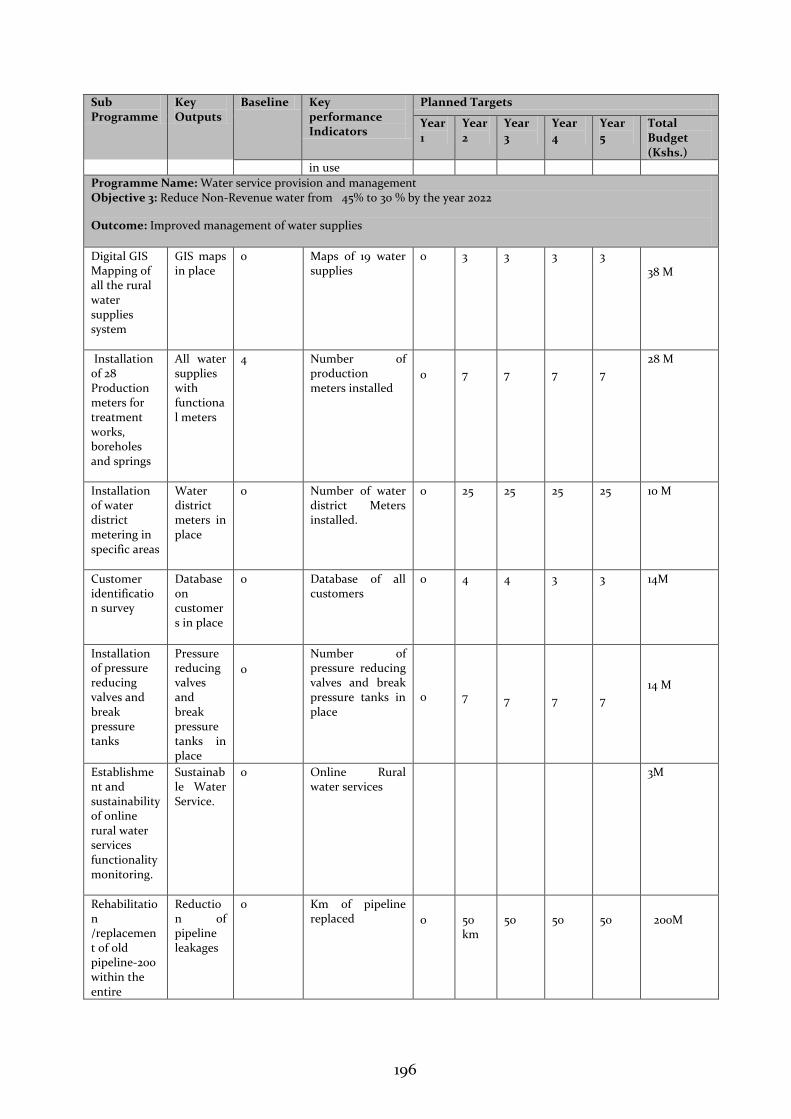
196
Sub Programme
Key Outputs
Baseline Key performance Indicators
Planned Targets
Year 1
Year 2
Year 3
Year 4
Year 5
Total Budget (Kshs.)
in use
Programme Name: Water service provision and management Objective 3: Reduce Non-Revenue water from 45% to 30 % by the year 2022
Outcome: Improved management of water supplies
Digital GIS Mapping of all the rural water supplies system
GIS maps in place
0 Maps of 19 water supplies
0 3 3 3 3
38 M
Installation of 28 Production meters for treatment works, boreholes and springs
All water supplies with functional meters
4 Number of production meters installed
0
7
7
7
7
28 M
Installation of water district metering in specific areas
Water district meters in place
0 Number of water district Meters installed.
0 25 25 25 25 10 M
Customer identification survey
Database on customers in place
0 Database of all customers
0 4 4 3 3 14M
Installation of pressure reducing valves and break pressure tanks
Pressure reducing valves and break pressure tanks in place
0
Number of pressure reducing valves and break pressure tanks in place
0
7
7
7
7
14 M
Establishment and sustainability of online rural water services functionality monitoring.
Sustainable Water Service.
0 Online Rural water services
3M
Rehabilitation /replacement of old pipeline-200 within the entire
Reduction of pipeline leakages
0 Km of pipeline replaced
0
50 km
50
50
50
200M
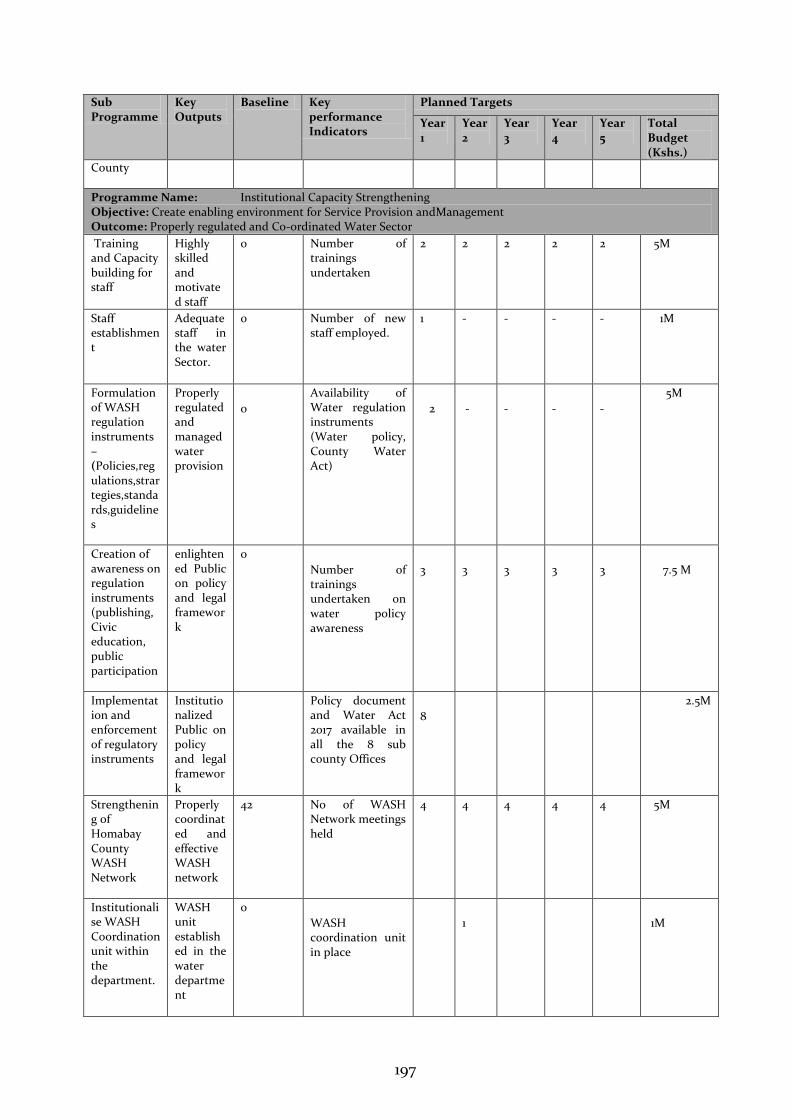
197
Sub Programme
Key Outputs
Baseline Key performance Indicators
Planned Targets
Year 1
Year 2
Year 3
Year 4
Year 5
Total Budget (Kshs.)
County
Programme Name: Institutional Capacity Strengthening Objective: Create enabling environment for Service Provision andManagement Outcome: Properly regulated and Co-ordinated Water Sector
Training and Capacity building for staff
Highly skilled and motivated staff
0 Number of trainings undertaken
2 2 2 2 2 5M
Staff establishment
Adequate staff in the water Sector.
0 Number of new staff employed.
1 - - - - 1M
Formulation of WASH regulation instruments –(Policies,regulations,strartegies,standards,guidelines
Properly regulated and managed water provision
0
Availability of Water regulation instruments (Water policy, County Water Act)
2
-
-
-
-
5M
Creation of awareness on regulation instruments (publishing, Civic education, public participation
enlightened Public on policy and legal framework
0
Number of trainings undertaken on water policy awareness
3
3
3
3
3
7.5 M
Implementation and enforcement of regulatory instruments
Institutionalized Public on policy and legal framework
Policy document and Water Act 2017 available in all the 8 sub county Offices
8
2.5M
Strengthening of Homabay County WASH Network
Properly coordinated and effective WASH network
42 No of WASH Network meetings held
4
4
4
4 4 5M
Institutionalise WASH Coordination unit within the department.
WASH unit established in the water department
0
WASH coordination unit in place
1
1M
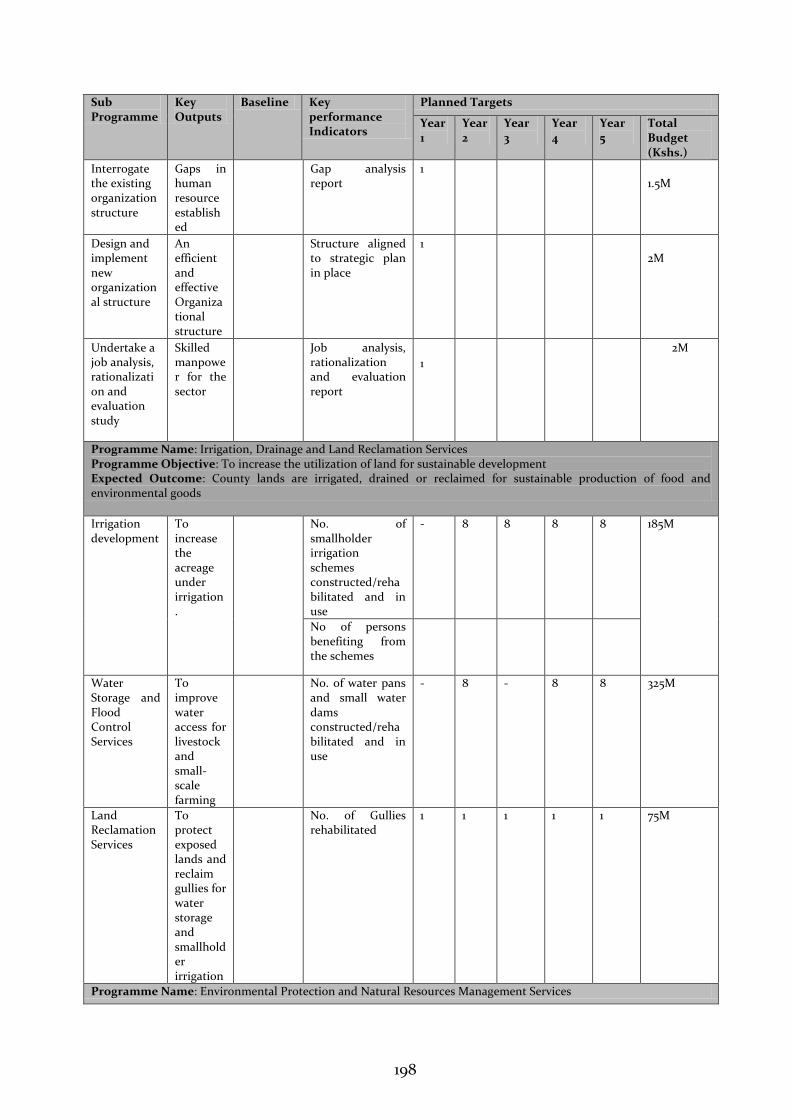
198
Sub Programme
Key Outputs
Baseline Key performance Indicators
Planned Targets
Year 1
Year 2
Year 3
Year 4
Year 5
Total Budget (Kshs.)
Interrogate the existing organization structure
Gaps in human resource established
Gap analysis report
1 1.5M
Design and implement new organizational structure
An efficient and effective Organizational structure
Structure aligned to strategic plan in place
1 2M
Undertake a job analysis, rationalization and evaluation study
Skilled manpower for the sector
Job analysis, rationalization and evaluation report
1
2M
Programme Name: Irrigation, Drainage and Land Reclamation Services Programme Objective: To increase the utilization of land for sustainable development Expected Outcome: County lands are irrigated, drained or reclaimed for sustainable production of food and environmental goods
Irrigation development
To increase the acreage under irrigation.
No. of smallholder irrigation schemes constructed/rehabilitated and in use
- 8 8 8 8 185M
No of persons benefiting from the schemes
Water Storage and Flood Control Services
To improve water access for livestock and small-scale farming
No. of water pans and small water dams constructed/rehabilitated and in use
- 8 - 8 8 325M
Land Reclamation Services
To protect exposed lands and reclaim gullies for water storage and smallholder irrigation
No. of Gullies rehabilitated
1 1 1 1 1 75M
Programme Name: Environmental Protection and Natural Resources Management Services
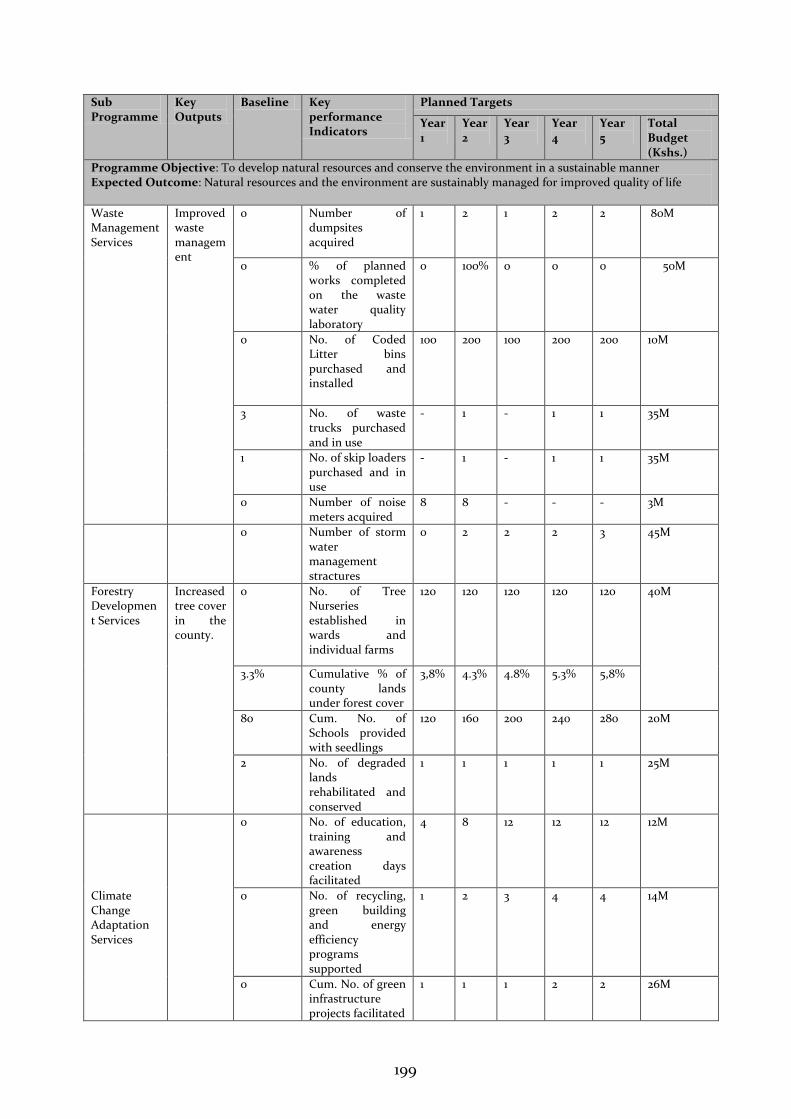
199
Sub Programme
Key Outputs
Baseline Key performance Indicators
Planned Targets
Year 1
Year 2
Year 3
Year 4
Year 5
Total Budget (Kshs.)
Programme Objective: To develop natural resources and conserve the environment in a sustainable manner Expected Outcome: Natural resources and the environment are sustainably managed for improved quality of life
Waste Management Services
Improved waste management
0 Number of dumpsites acquired
1
2 1 2 2
80M
0 % of planned works completed on the waste water quality laboratory
0 100% 0 0 0 50M
0 No. of Coded Litter bins purchased and installed
100
200
100
200
200
10M
3 No. of waste trucks purchased and in use
- 1 - 1 1 35M
1 No. of skip loaders purchased and in use
- 1 - 1 1 35M
0 Number of noise meters acquired
8 8 - - - 3M
0 Number of storm water management stractures
0 2 2 2 3 45M
Forestry Development Services
Increased tree cover in the county.
0 No. of Tree Nurseries established in wards and individual farms
120 120 120 120 120 40M
3.3%
Cumulative % of county lands under forest cover
3,8%
4.3%
4.8%
5.3%
5,8%
80
Cum. No. of Schools provided with seedlings
120
160
200
240
280
20M
2 No. of degraded lands rehabilitated and conserved
1 1 1 1 1 25M
Climate Change Adaptation Services
0 No. of education, training and awareness creation days facilitated
4 8 12 12 12 12M
0 No. of recycling, green building and energy efficiency programs supported
1 2 3 4 4 14M
0 Cum. No. of green infrastructure projects facilitated
1 1 1 2 2 26M
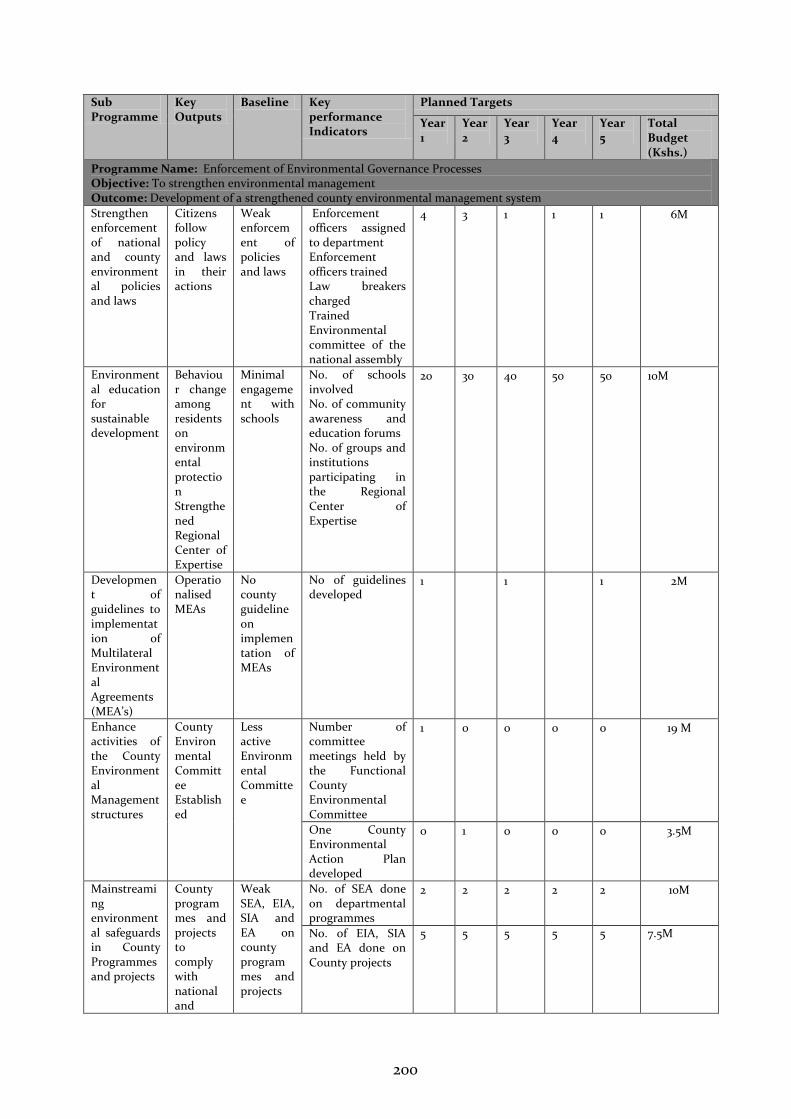
200
Sub Programme
Key Outputs
Baseline Key performance Indicators
Planned Targets
Year 1
Year 2
Year 3
Year 4
Year 5
Total Budget (Kshs.)
Programme Name: Enforcement of Environmental Governance Processes Objective: To strengthen environmental management Outcome: Development of a strengthened county environmental management system
Strengthen enforcement of national and county environmental policies and laws
Citizens follow policy and laws in their actions
Weak enforcement of policies and laws
Enforcement officers assigned to department Enforcement officers trained Law breakers charged Trained Environmental committee of the national assembly
4 3 1 1 1 6M
Environmental education for sustainable development
Behaviour change among residents on environmental protection Strengthened Regional Center of Expertise
Minimal engagement with schools
No. of schools involved No. of community awareness and education forums No. of groups and institutions participating in the Regional Center of Expertise
20 30 40 50 50 10M
Development of guidelines to implementation of Multilateral Environmental Agreements (MEA’s)
Operationalised MEAs
No county guideline on implementation of MEAs
No of guidelines developed
1 1 1 2M
Enhance activities of the County Environmental Management structures
County Environmental Committee Established
Less active Environmental Committee
Number of committee meetings held by the Functional County Environmental Committee
1 0 0 0 0 19 M
One County Environmental Action Plan developed
0 1 0 0 0 3.5M
Mainstreaming environmental safeguards in County Programmes and projects
County programmes and projects to comply with national and
Weak SEA, EIA, SIA and EA on county programmes and projects
No. of SEA done on departmental programmes
2 2 2 2 2 10M
No. of EIA, SIA and EA done on County projects
5 5 5 5 5 7.5M
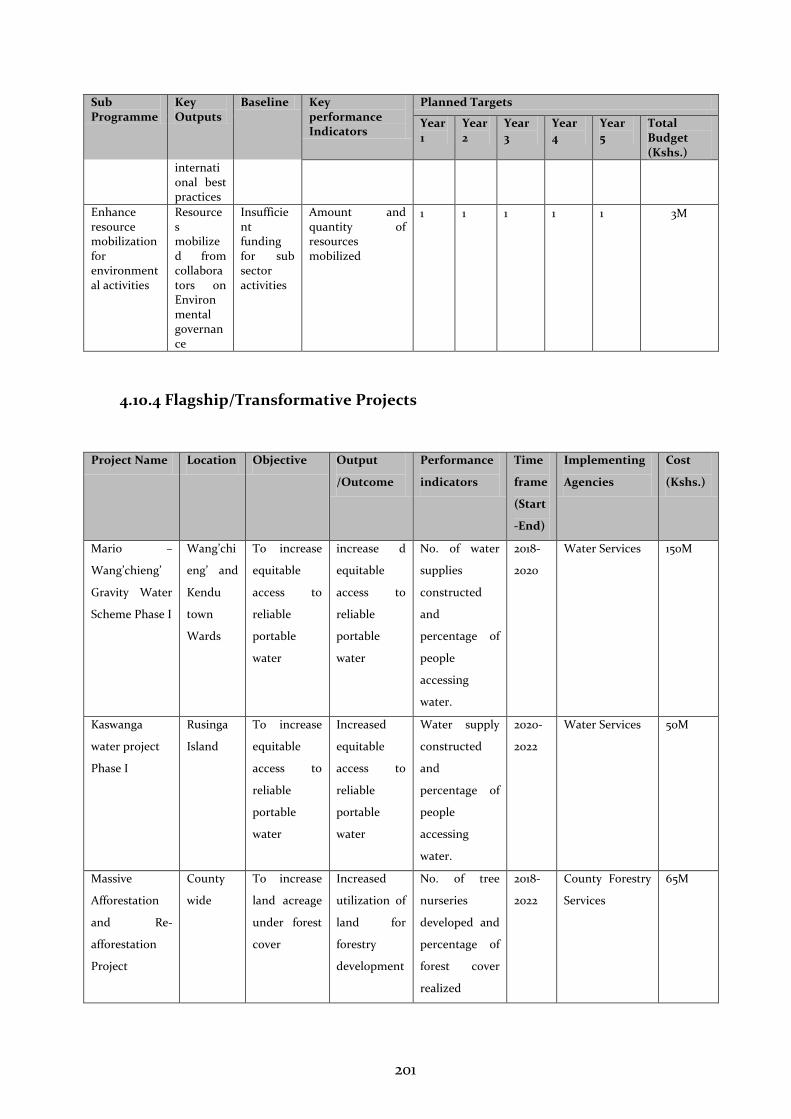
201
Sub Programme
Key Outputs
Baseline Key performance Indicators
Planned Targets
Year 1
Year 2
Year 3
Year 4
Year 5
Total Budget (Kshs.)
international best practices
Enhance resource mobilization for environmental activities
Resources mobilized from collaborators on Environmental governance
Insufficient funding for sub sector activities
Amount and quantity of resources mobilized
1 1 1 1 1 3M
4.10.4 Flagship/Transformative Projects
Project Name Location Objective Output
/Outcome
Performance
indicators
Time
frame
(Start
-End)
Implementing
Agencies
Cost
(Kshs.)
Mario –
Wang’chieng’
Gravity Water
Scheme Phase I
Wang’chi
eng’ and
Kendu
town
Wards
To increase
equitable
access to
reliable
portable
water
increase d
equitable
access to
reliable
portable
water
No. of water
supplies
constructed
and
percentage of
people
accessing
water.
2018-
2020
Water Services 150M
Kaswanga
water project
Phase I
Rusinga
Island
To increase
equitable
access to
reliable
portable
water
Increased
equitable
access to
reliable
portable
water
Water supply
constructed
and
percentage of
people
accessing
water.
2020-
2022
Water Services 50M
Massive
Afforestation
and Re-
afforestation
Project
County
wide
To increase
land acreage
under forest
cover
Increased
utilization of
land for
forestry
development
No. of tree
nurseries
developed and
percentage of
forest cover
realized
2018-
2022
County Forestry
Services
65M
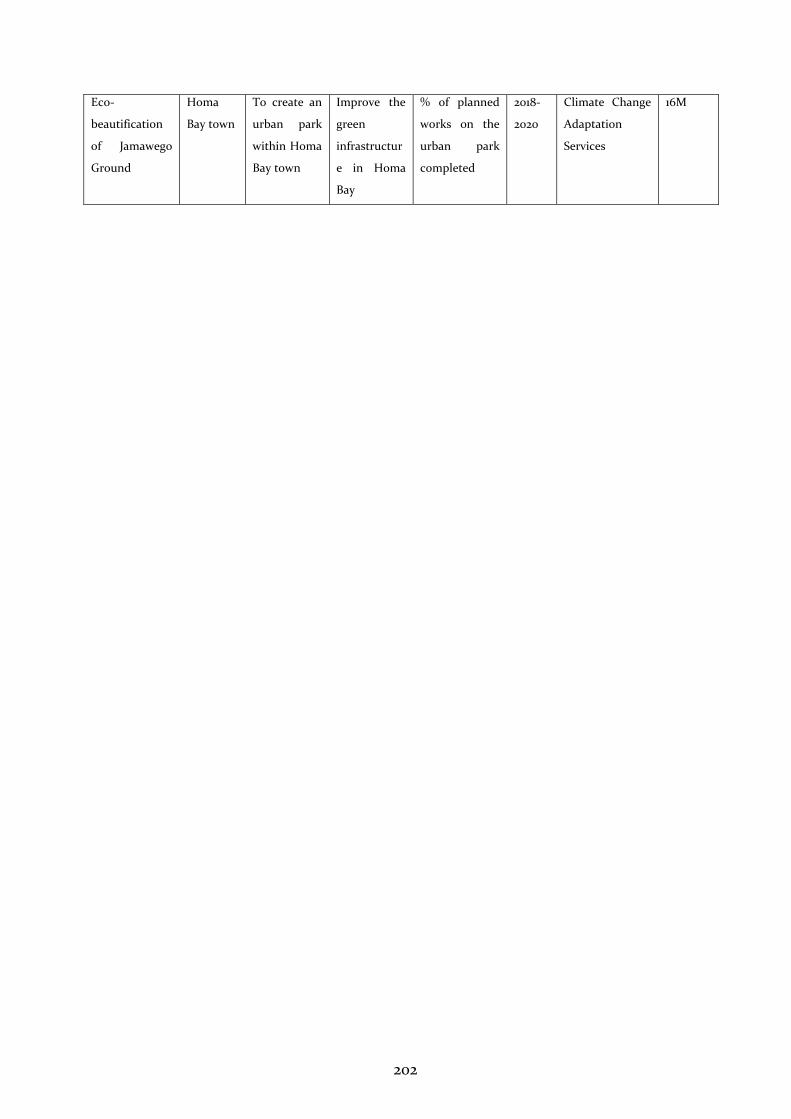
202
Eco-
beautification
of Jamawego
Ground
Homa
Bay town
To create an
urban park
within Homa
Bay town
Improve the
green
infrastructur
e in Homa
Bay
% of planned
works on the
urban park
completed
2018-
2020
Climate Change
Adaptation
Services
16M
203
CHAPTER FIVE
IMPLEMENTATION FRAMEWORK
5.1 Introduction
This chapter provides the implementation framework that includes institutional
framework responsible for the implementation and actualization of the plan,
resource mobilization, resource gaps and measures to address the gaps.
5.2 Institutional Framework
The institutional framework for implementation of County Government
functionsis anchored on organizational set up as stipulated in the County
Governments Act, 2012.
The success of Homa Bay County Development Plan rests on the collaboration
between groups and individuals across the public, private, and the county
assembly in Homa Bay County. Coalition of public sector decisions and
intergovernmental collaboration will play a significant role in implementation.
The plan will be implemented in line with Vision 2030 medium-term plan.
Implementation of the plans will incorporate joint planning and stakeholder
involvement, networking and sharing lessons learned to ensure that multiple
views, needs and concerns in resolving priority county issues at different levels are
taken into account and negotiated.
5.2.1 County’s Organogram
The organogram has two distinct institutions namely; the Executive headed by
H.E. the Governor and deputised by H.E. the Deputy Governor; the County
Executive Committee Members who heads various Sectors of the County
Government and the Legislature comprising the County Assembly Speaker,
Deputy Speaker, and the County Assembly Service Board. Each of these tiers has
organisational structures that support their operations. This framework provides a
link with the National Government for the purpose of implementing this plan.
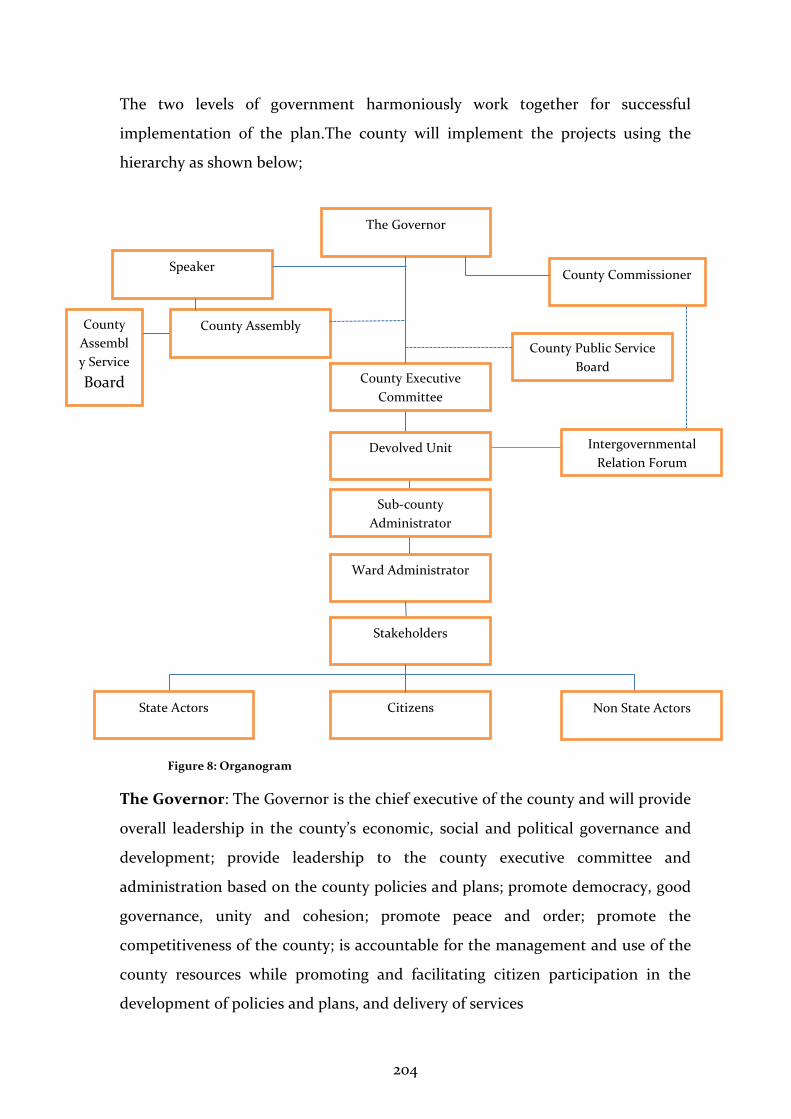
204
The two levels of government harmoniously work together for successful
implementation of the plan.The county will implement the projects using the
hierarchy as shown below;
Figure 8: Organogram
The Governor: The Governor is the chief executive of the county and will provide
overall leadership in the county’s economic, social and political governance and
development; provide leadership to the county executive committee and
administration based on the county policies and plans; promote democracy, good
governance, unity and cohesion; promote peace and order; promote the
competitiveness of the county; is accountable for the management and use of the
county resources while promoting and facilitating citizen participation in the
development of policies and plans, and delivery of services
The Governor
County Commissioner Speaker
County Public Service
Board
County Assembly County
Assembl
y Service
Board County Executive
Committee
Devolved Unit
Sub-county
Administrator
Ward Administrator
Intergovernmental
Relation Forum
Stakeholders
State Actors Non State Actors Citizens
205
County Commissioner: The County Commissioner, Deputy County
Commissioners, Assistant County Commissioners, Chiefs and the Assistant Chiefs
will be important in the implementation of the CIDP. These are officers appointed
and deployed by the national government and are responsible for the public
administration in the County. The County Commissioner is the chair of County
Security and Intelligence Committee whose responsibility will be to ensure that
security prevails. Security is vital for development initiatives especially given that
the CIDP has adopted the Public Private Partnerships whose sustainability is
sensitive to security. He/she is also a member of County Community Policing
Authority in which the Governor chairs and where recommendations on proper
security measures are done. The County Commissioner also co-chairs the County
Development Committee (CDC) which constitutes all development actors in the
County and whose main mandate will be to guide County development in all
sectors.
County Assembly: The County Assembly is the legislative arm of the County
government. It is composed of the Members of County Assembly (MCAs) both
elected and nominated, the Speaker and the Clerk as an ex Official. County
Assembly performs: vetting and approving nominees for appointment to County
public offices; approving the budget and expenditure of the County government in
accordance with Article 207 of the Constitution, and the legislation contemplated
in Article 220 (2) of the Constitution, guided by Articles 201 and 203 of the
Constitution; approving the borrowing by the County government in accordance
with Article 212 of the Constitution; approving County development planning; and
performing any other role as may be set out under the constitution or legislation.
County Assembly Service Board: The board is responsible for providing services
and facilities to ensure the efficient and effective functioning of the county
assembly; constituting offices in the county assembly service and appointing and
supervising office holders; preparing annual estimates of expenditure of the
county assembly service and submitting them to the county assembly for
approval, and exercising budgetary control over the service; undertaking, singly or
206
jointly with other relevant organizations, programmes to promote the ideals of
county democracy; and performing other functions necessary for the well-being of
the members and staff of the county assembly; or prescribed by national
legislation.
County Security Committee: It plays an important role of ensuring that the
county is safe for achievement of the proposed projects and programs.
County Public Service Board: It is charged with the responsibility of recruiting
and ensuring performance of the county personnel who will be responsible for the
implementation of the plan.
County Executive Committee Members: The County Executive Committee is
comprised of 10 executive members appointed by the Governor and approved by
the County Assembly. Each County Executive Committee member is responsible
for the respective departments. The Executive Committee will be responsible for
supervising the administration and delivery of services in all decentralized units
and agencies in the county. The committee will also perform any other functions
conferred on it by the constitution or national legislation; carry out any function
incidental to any of the assigned functions
Devolved County Level Units: Include all departments with devolved functions,
cities and municipalities, as they will all be involved in the implementation. The
units, from the county level to the village level, where applicable are responsible
for policy implementation, guidance, service provision and enforcement of rules
and regulations. The units are also responsible for prioritizing in their operational
areas.
Stakeholders: Are responsible for prioritizing county programmes and projects
while ensuring sustainability and ownership. They also provide finances, materials
and services for programmes and projects.
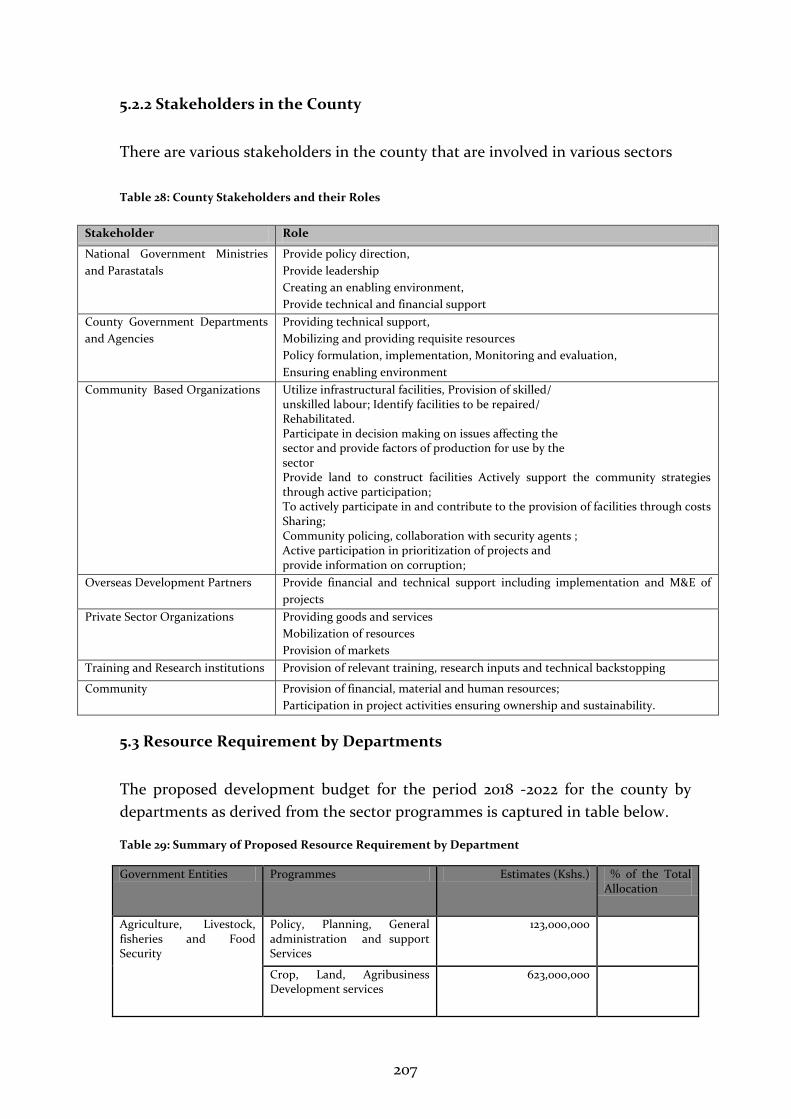
207
5.2.2 Stakeholders in the County
There are various stakeholders in the county that are involved in various sectors
Table 28: County Stakeholders and their Roles
Stakeholder Role
National Government Ministries
and Parastatals
Provide policy direction,
Provide leadership
Creating an enabling environment,
Provide technical and financial support
County Government Departments
and Agencies
Providing technical support,
Mobilizing and providing requisite resources
Policy formulation, implementation, Monitoring and evaluation,
Ensuring enabling environment
Community Based Organizations Utilize infrastructural facilities, Provision of skilled/ unskilled labour; Identify facilities to be repaired/ Rehabilitated. Participate in decision making on issues affecting the sector and provide factors of production for use by the sector Provide land to construct facilities Actively support the community strategies through active participation; To actively participate in and contribute to the provision of facilities through costs Sharing; Community policing, collaboration with security agents ; Active participation in prioritization of projects and provide information on corruption;
Overseas Development Partners Provide financial and technical support including implementation and M&E of
projects
Private Sector Organizations Providing goods and services
Mobilization of resources
Provision of markets
Training and Research institutions Provision of relevant training, research inputs and technical backstopping
Community Provision of financial, material and human resources;
Participation in project activities ensuring ownership and sustainability.
5.3 Resource Requirement by Departments
The proposed development budget for the period 2018 -2022 for the county by
departments as derived from the sector programmes is captured in table below.
Table 29: Summary of Proposed Resource Requirement by Department
Government Entities Programmes Estimates (Kshs.) % of the Total Allocation
Agriculture, Livestock, fisheries and Food Security
Policy, Planning, General administration and support Services
123,000,000
Crop, Land, Agribusiness Development services
623,000,000
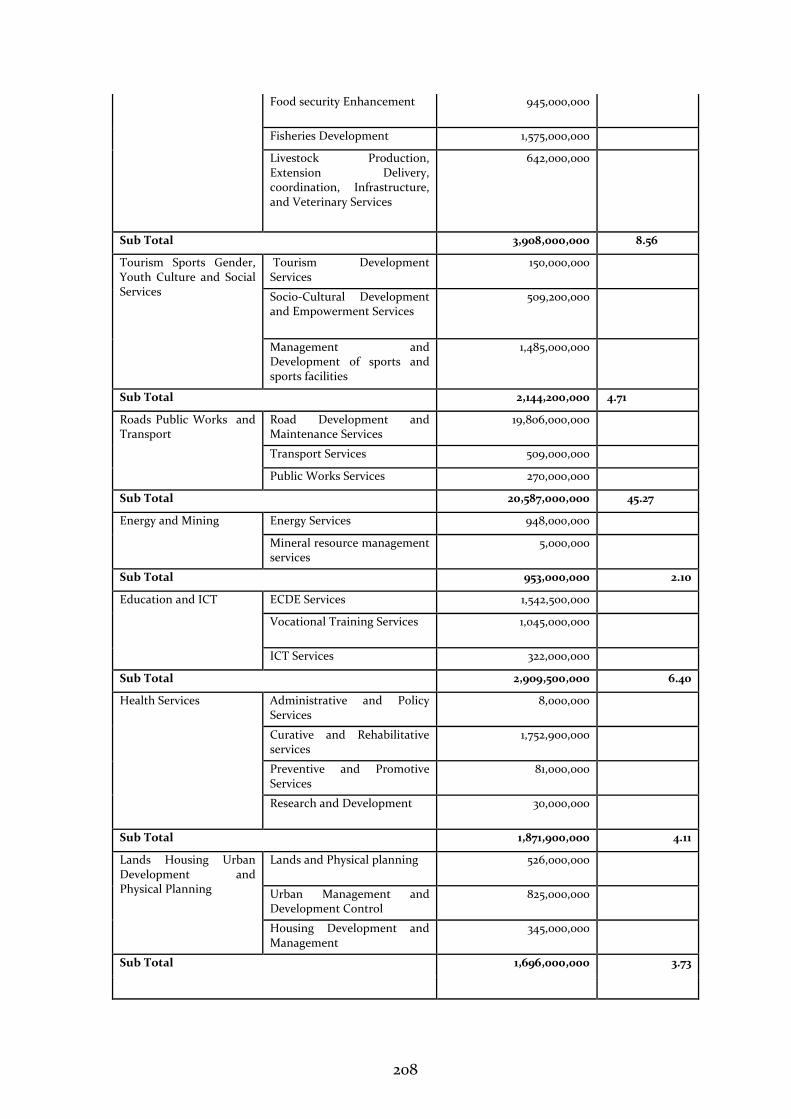
208
Food security Enhancement 945,000,000
Fisheries Development 1,575,000,000
Livestock Production, Extension Delivery, coordination, Infrastructure, and Veterinary Services
642,000,000
Sub Total 3,908,000,000 8.56
Tourism Sports Gender, Youth Culture and Social Services
Tourism Development Services
150,000,000
Socio-Cultural Development and Empowerment Services
509,200,000
Management and Development of sports and sports facilities
1,485,000,000
Sub Total 2,144,200,000 4.71
Roads Public Works and Transport
Road Development and Maintenance Services
19,806,000,000
Transport Services 509,000,000
Public Works Services 270,000,000
Sub Total 20,587,000,000 45.27
Energy and Mining Energy Services 948,000,000
Mineral resource management services
5,000,000
Sub Total 953,000,000 2.10
Education and ICT ECDE Services 1,542,500,000
Vocational Training Services 1,045,000,000
ICT Services 322,000,000
Sub Total 2,909,500,000 6.40
Health Services Administrative and Policy Services
8,000,000
Curative and Rehabilitative services
1,752,900,000
Preventive and Promotive Services
81,000,000
Research and Development 30,000,000
Sub Total 1,871,900,000 4.11
Lands Housing Urban Development and Physical Planning
Lands and Physical planning 526,000,000
Urban Management and Development Control
825,000,000
Housing Development and Management
345,000,000
Sub Total 1,696,000,000 3.73
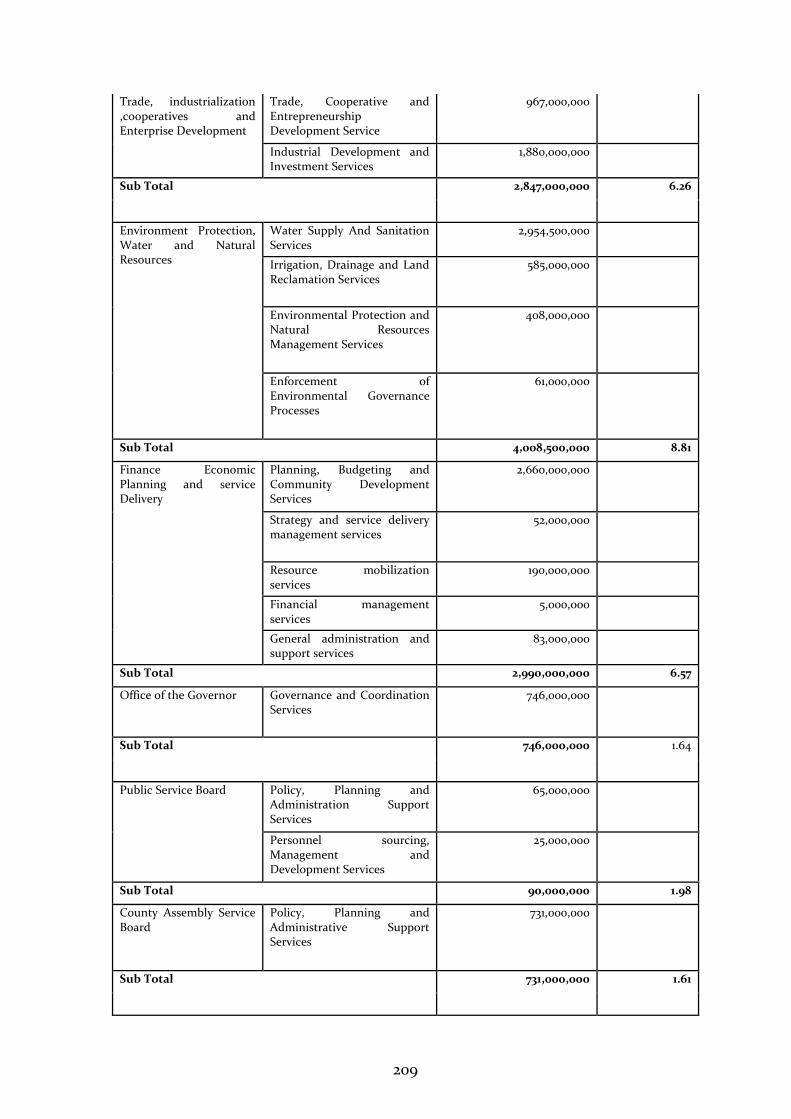
209
Trade, industrialization ,cooperatives and Enterprise Development
Trade, Cooperative and Entrepreneurship Development Service
967,000,000
Industrial Development and Investment Services
1,880,000,000
Sub Total 2,847,000,000 6.26
Environment Protection, Water and Natural Resources
Water Supply And Sanitation Services
2,954,500,000
Irrigation, Drainage and Land Reclamation Services
585,000,000
Environmental Protection and Natural Resources Management Services
408,000,000
Enforcement of Environmental Governance Processes
61,000,000
Sub Total 4,008,500,000 8.81
Finance Economic Planning and service Delivery
Planning, Budgeting and Community Development Services
2,660,000,000
Strategy and service delivery management services
52,000,000
Resource mobilization services
190,000,000
Financial management services
5,000,000
General administration and support services
83,000,000
Sub Total 2,990,000,000 6.57
Office of the Governor Governance and Coordination Services
746,000,000
Sub Total 746,000,000 1.64
Public Service Board Policy, Planning and Administration Support Services
65,000,000
Personnel sourcing, Management and Development Services
25,000,000
Sub Total 90,000,000 1.98
County Assembly Service Board
Policy, Planning and Administrative Support Services
731,000,000
Sub Total 731,000,000 1.61
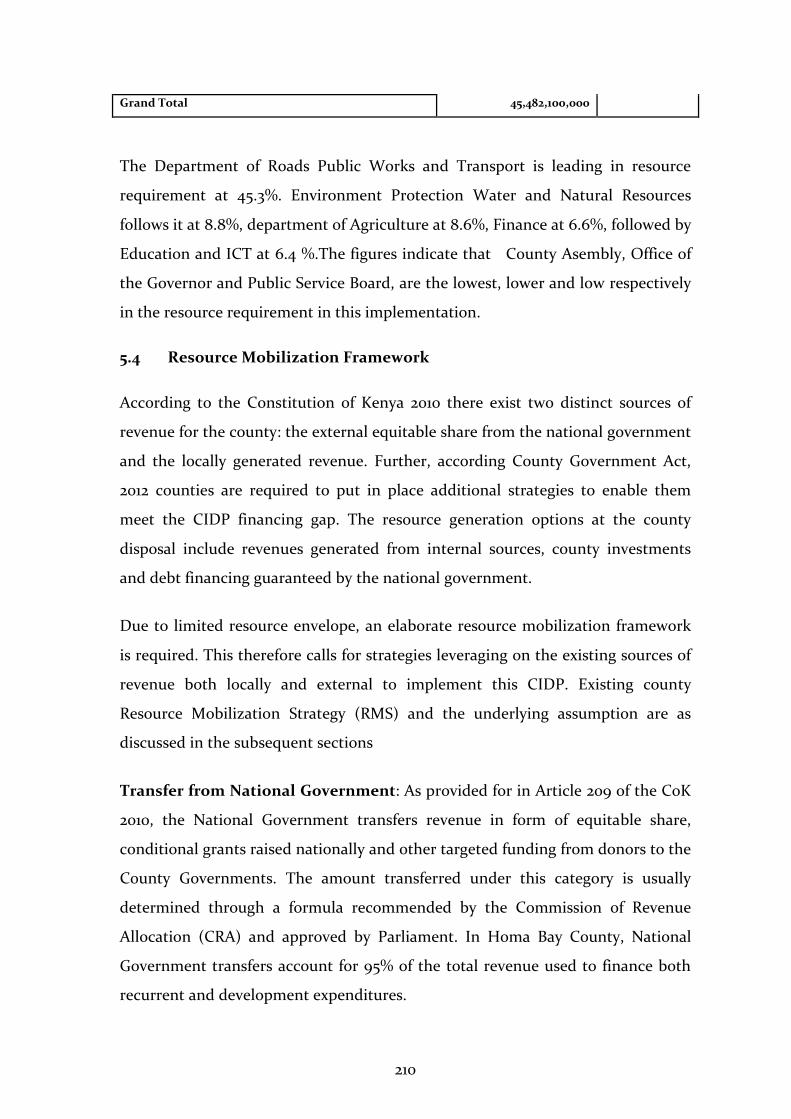
210
Grand Total 45,482,100,000
The Department of Roads Public Works and Transport is leading in resource
requirement at 45.3%. Environment Protection Water and Natural Resources
follows it at 8.8%, department of Agriculture at 8.6%, Finance at 6.6%, followed by
Education and ICT at 6.4 %.The figures indicate that County Asembly, Office of
the Governor and Public Service Board, are the lowest, lower and low respectively
in the resource requirement in this implementation.
5.4 Resource Mobilization Framework
According to the Constitution of Kenya 2010 there exist two distinct sources of
revenue for the county: the external equitable share from the national government
and the locally generated revenue. Further, according County Government Act,
2012 counties are required to put in place additional strategies to enable them
meet the CIDP financing gap. The resource generation options at the county
disposal include revenues generated from internal sources, county investments
and debt financing guaranteed by the national government.
Due to limited resource envelope, an elaborate resource mobilization framework
is required. This therefore calls for strategies leveraging on the existing sources of
revenue both locally and external to implement this CIDP. Existing county
Resource Mobilization Strategy (RMS) and the underlying assumption are as
discussed in the subsequent sections
Transfer from National Government: As provided for in Article 209 of the CoK
2010, the National Government transfers revenue in form of equitable share,
conditional grants raised nationally and other targeted funding from donors to the
County Governments. The amount transferred under this category is usually
determined through a formula recommended by the Commission of Revenue
Allocation (CRA) and approved by Parliament. In Homa Bay County, National
Government transfers account for 95% of the total revenue used to finance both
recurrent and development expenditures.
211
Prudent Asset Management: The County will ensure proper inventory
management systems are put in place. This will entail surveys and regular update
on the asset inventory database in accordance with safety and operational
manuals for management and use of asset. The County asset management
committee will guide and advice on all sustainable utilization of the available
assets. Public Private Partnerships will be sought on capital intensive and risky
assets to reduce the related burden of risks on the County Government. Besides,
the county will leverage on both current and capital assets such as material stocks,
work in progress, and cash at bank, debtors, real estates, Plant and equipment to
generate resources for CIDP implementation.
Automation of the Revenue Collection Processes: To minimize on loss of
revenue, the County Government embarked on automating its revenue collection
processes. In this implementation period, the county will seek to complete and
attain 100% automation especially on payment and monitoring systems for levies
collected on rates on property, entertainment taxes, and charges for its services
Expanding Own-Source Revenue Generation Mechanisms: The internal
measures include; taxes, fees, fines, rates, accruals, Appropriations in Aid (AIA)
Fees: The County will enhance collection of fees on services, goods and works
done. This will be through continued automation of the revenue collection
especially on Levies which will be collected on business licenses, parking services,
refuse collection, entertainment joints, use of public grounds/stadia, access to
certain information and approval of physical plans. Incentives will also be given to
encourage investments in ventures that attract higher rates such as the
investment in the Central Business Districts (CBD), industrial zones and high cost
residential estate zones. The incentives will include provision essential services
such as electricity, road network, drainage and sewerage
Fines: Non-compliance on the existing County laws, rules and regulations
especially on urban areas, towns and municipalities attracts fines from offenders.
They comprise of fines imposed for nonpayment of rates, wrong parking, causing
212
public nuisances, breaking County laws, rules and regulations. To ensure this,
mechanisms will be put in place to increase surveillance for offenders and
appropriate actions taken against them
Rates: To increase revenue collection under property rates, the county will give
waivers to attract ratable land owners to pay the accrued rates. The valuation roll
will be adopted and updated continuously to maximize on the collection of rates
Cess: The County shall improve the collection of Cess taxes for movement of
goods. This particular strategy has the potential of generating additional revenue
for implementing the proposed priority programmes and projects.
Disposal of government property: The County will utilize funds from sale of
official property, assets and investments. Income from auctioning of serviceable
and un-serviceable items and other authorized measures will be appropriately
invested back to develop the systems for increased generation
Annual events: Targeted revenue generation events will be scheduled including;
peace walks, marathons, bicycle rides, exhibitions and agricultural shows shall be
used to generate revenue for county operations.
Formulation of relevant policies and laws: The County will focus on
formulation of relevant policies, laws and regulations to enhance both generation
and effective utilization existing resources. Special Investment Taxes (SIT) will be
used as an incentive to attract private investments to periphery areas of the
County by charging little or no taxes for setting up premises, plant and equipment
on areas designated by the County Government. Besides, this will also create an
enabling business environment for trade and economic integration increasing the
county revenue resource base.
Mainstreaming resource mobilization across the county departments:
County departments provide the basic units for revenue streams. Homa Bay
County has since been utilizing these departments to collect revenues from levies,
rates, fees, charges or any other source as authorized by law. Being platforms for
213
revenue collection and having mapped out all the revenue streams falling under
each department, the county will continue building the capacity and providing the
necessary support to the departmental heads to expand and fully exploit their
respective revenue generation potentials
Foreign Direct Investments (FDI): The County will seek to improve the
business environment to attract Foreign Investments into the county. Having held
a successful investor conference in the previous implementation period, the
county will seek to leverage on gains by providing enabling infrastructure,
entering into beneficial Public-Private Partnerships (PPPs) and developing MOUs
on targeted transformative investments in the county.
International Civil Society Organizations: The County Government will seek
support from International civil society groups such as Action Aid, World Vision,
DANIDA, Mission International, AMPHAT, Save the Children, Care International
among others in funding the proposed development programmes and projects.
This will be achieved by building close working relationships. Beside, interactive
forums for information sharing and generating feedback on development
aspirations as well as related conditions for partnerships will be developed.
United Nations Agencies:Homa BayCounty will also explore ways and
possibilities of partnering with any United Nations Agency as part of its resource
mobilization strategy. The envisaged agencies include Food and Agriculture
Organization (FAO), the World Bank (WB), International Fund for Agricultural
Development(IFAD), United Nations Development Programme (UNDP), United
Nations Population Fund (UNFPA), World Food Programme (WFP), World
Health Organization, (WHO), UNICEF, UN Women among others. This will be
done within the confines of the United Nations Development Assistance
Framework (UNDAF) that guides collaborative response of the UN system to
Kenya’s priority development needs while maintaining individual agency
mandates
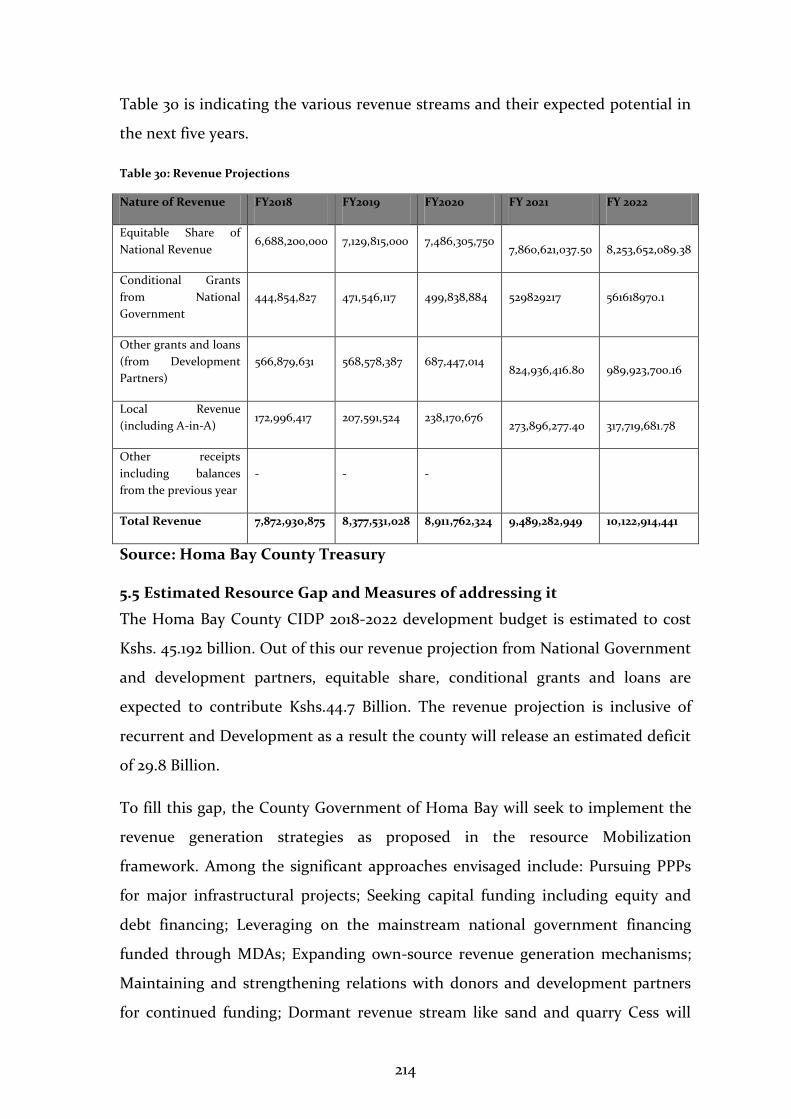
214
Table 30 is indicating the various revenue streams and their expected potential in
the next five years.
Table 30: Revenue Projections
Nature of Revenue FY2018 FY2019 FY2020 FY 2021 FY 2022
Equitable Share of
National Revenue 6,688,200,000 7,129,815,000 7,486,305,750
7,860,621,037.50
8,253,652,089.38
Conditional Grants
from National
Government
444,854,827 471,546,117 499,838,884 529829217 561618970.1
Other grants and loans
(from Development
Partners)
566,879,631 568,578,387 687,447,014
824,936,416.80
989,923,700.16
Local Revenue
(including A-in-A) 172,996,417 207,591,524 238,170,676
273,896,277.40
317,719,681.78
Other receipts
including balances
from the previous year
- - -
Total Revenue 7,872,930,875 8,377,531,028 8,911,762,324 9,489,282,949 10,122,914,441
Source: Homa Bay County Treasury
5.5 Estimated Resource Gap and Measures of addressing it
The Homa Bay County CIDP 2018-2022 development budget is estimated to cost
Kshs. 45.192 billion. Out of this our revenue projection from National Government
and development partners, equitable share, conditional grants and loans are
expected to contribute Kshs.44.7 Billion. The revenue projection is inclusive of
recurrent and Development as a result the county will release an estimated deficit
of 29.8 Billion.
To fill this gap, the County Government of Homa Bay will seek to implement the
revenue generation strategies as proposed in the resource Mobilization
framework. Among the significant approaches envisaged include: Pursuing PPPs
for major infrastructural projects; Seeking capital funding including equity and
debt financing; Leveraging on the mainstream national government financing
funded through MDAs; Expanding own-source revenue generation mechanisms;
Maintaining and strengthening relations with donors and development partners
for continued funding; Dormant revenue stream like sand and quarry Cess will
215
rejuvenated; Undertake public awareness programmes to reduce delays and
resistance in payment of taxes; Construct trailer parks to enhance payment of
parking fees.
The county will leverage on the contributions from development partners
through:
Mapping of development partners/donors ;Maintaining and strengthening
relationships with the development Partners and donors; Continued search for
additional funding streams with new partners; Seeking alternative funding
including grants and donations; Attracting and utilizing Charity Organizations/
Foundations; Embracing the Corporate Social Responsibility initiatives in the
county; and Leveraging support from Civil Society Organizations through signing
MOUs.
216
CHAPTER SIX:
Monitoring and Evaluation Framework
6.1 Introduction
During the implementation process, a robust county M&E system is important to
enable county governments to assess whether the CIDP priority results and
projects are on or off track and take corrective actions when performance is below
planned targets. Monitoring and evaluation is anchored in the CIDP through an
M&E chapter that outlines the broad workings of the County Integrated M&E
System, and the CIDP Results Matrix which contains an overview of the CIDP
performance indicators and their targets.
This chapter discusses the county monitoring and evaluation framework as
outlined in the County Integrated Monitoring and Evaluation System (CIMES)
Guidelines. The outline of the section contains the following:
6.2 M&E Structure in the County
6.2.1 Rationale for County M & E Framework
It verifies whether the activities of each County’s priority projects or programmes
are happening according to planning timelines and targets presented in the
efficient manner.
Disseminating M&E results can raise awareness of a county’s programme and
projects among the general public and help build positive perceptions about the
county’s leadership; and this may lead to increased resource allocation towards
the well performing counties.
The system will also supply the county with regular flow of information
throughout the course of CIDP programme implementation in order to make it
possible to detect changes in status and utilisation of resources allocated to CIDP
priority areas.
217
The M &E system defines relationships among inputs, activities, outputs,
outcomes and impacts
6.2.1.1 County M & E legal framework
The legal mechanism spelt out in the constitution of Kenya, have necessitated the
development of monitoring and evaluation systems for county Government. To
ensure greater transparency and accountability, the constitution of Kenya 2010
requires that government to use M&E mechanism as an integral part of developing
and executing government policies, programmes and projects and in resource
allocation and management at the two levels of governments.
The County government Act gives the County government the responsibility of
preparing CIDP that must include a monitoring and evaluation section. Section
108(1) states “There shall be a five year plan CIDP for each county which shall have
(a)clear goals and objectives (b)an implementation plan with clear outcomes(c)
provisions for monitoring and evaluation; (d)and clear reporting mechanism.”
Under section 47 of the county government Act, 2012, the County Executive
Committee is expected to design a performance system which will evaluate
performance of the county public service in relation to the implementation of
county policies, projects and programmes
6.2.1.2 County M & E institutional framework
Monitoring and evaluation towards the achievement of the policies, projects and
programmes as outlined in the CIDP will be undertaken through the County
Integrated Monitoring and Evaluation System (CIMES).
The CIMES shall be linked to the county performance management system which
is involved in strategic planning, work planning, target-setting, tracking
performance and reporting. The data to be used as inputs in CIMES targets and
indicators are expected to come from surveys and administrative data collected
and analyzed by directorate of M&E /planning unit, other county sectors and
agencies working within the county.
218
The analyzed CIMES results will demonstrate whether the resources spent on
implementing CIDP investment programmes are leading to the intended
outcomes, impacts and benefits for the county citizenry.
6.2.2 Data collection, Analysis, and Reporting, Dissemination and citizen
engagement mechanisms
Data will be collected using surveys, case studies, interviews, observations, group
assessment, questionnaires, expert/peer reviews, testimonials, photographs,
videotapes, diaries/journal logs, document reviews and analysis.
Data collected will be analysed using any of the following techniques; descriptive
statistics, statistical significance, factor analysis, regression analysis, discriminant
factor, content analysis, Epi info and In ViVo
A strong feedback mechanism will be created that will regularly provide county
with good quality and timely monitoring and evaluation information regarding
implementation progress of development projects/programmes.
Quarterly M&E reports will be produced plus the annual progress reports
indicating the status of implementation of all development projects, service
delivery and budget performances of all sectors. The reports will be disseminated
to the public through forums.
Therefore, priority will be given to the county monitoring and evaluation units
with regard to sufficient budgetary allocation in order to allow for effective and
efficient delivery of M & E reports
6.3 Monitoring and Evaluation of outcome Indicators by sector
Outcome indicators will be used to measure the quantity and quality of the results
achieved through the provision of services, an outcome indicator will answer the
question: “How will we know success when we see it?” The emphasis is on result-
based monitoring and evaluation system.
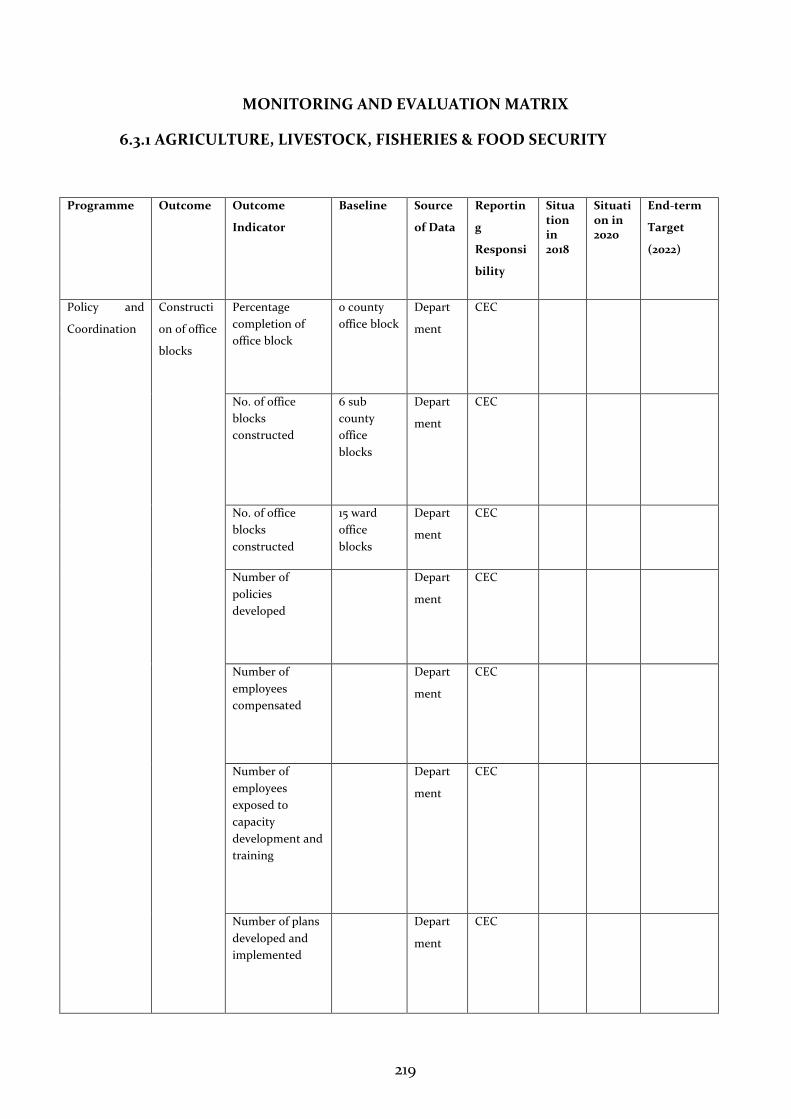
219
MONITORING AND EVALUATION MATRIX
6.3.1 AGRICULTURE, LIVESTOCK, FISHERIES & FOOD SECURITY
Programme Outcome Outcome
Indicator
Baseline Source
of Data
Reportin
g
Responsi
bility
Situation in 2018
Situation in 2020
End-term
Target
(2022)
Policy and
Coordination
Constructi
on of office
blocks
Percentage
completion of
office block
0 county
office block
Depart
ment
CEC
No. of office
blocks
constructed
6 sub
county
office
blocks
Depart
ment
CEC
No. of office
blocks
constructed
15 ward
office
blocks
Depart
ment
CEC
Number of
policies
developed
Depart
ment
CEC
Number of
employees
compensated
Depart
ment
CEC
Number of
employees
exposed to
capacity
development and
training
Depart
ment
CEC
Number of plans
developed and
implemented
Depart
ment
CEC
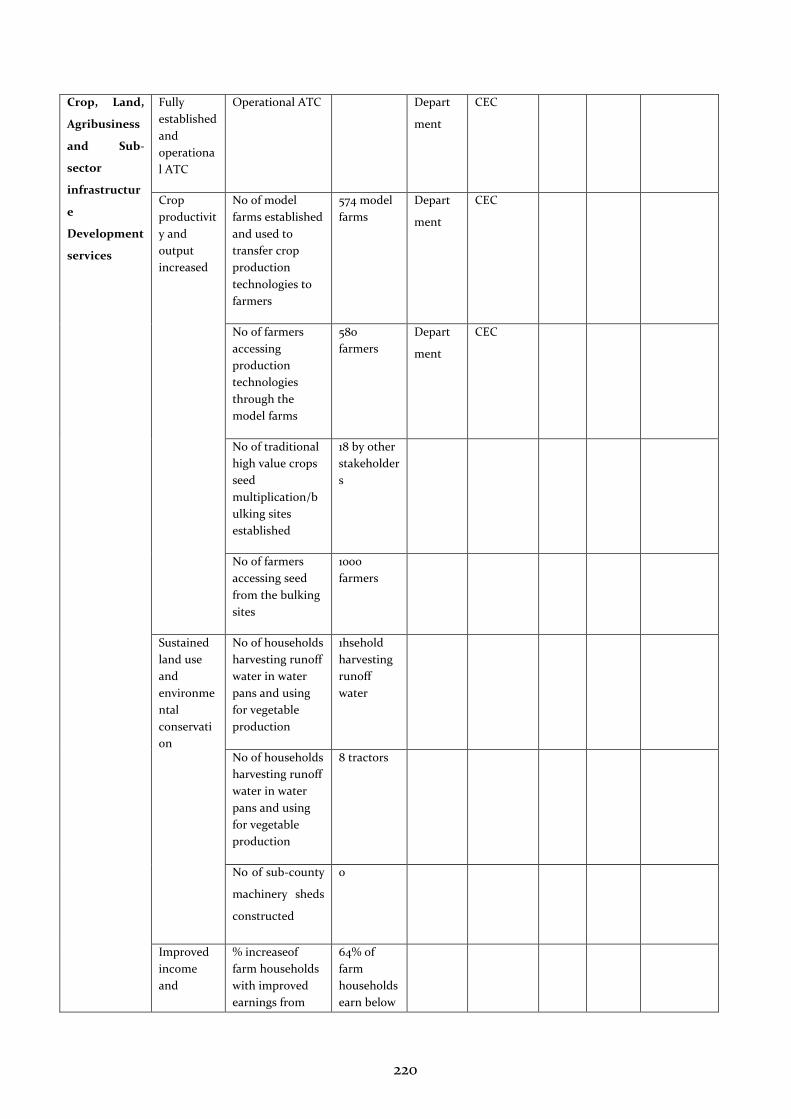
220
Crop, Land,
Agribusiness
and Sub-
sector
infrastructur
e
Development
services
Fully
established
and
operationa
l ATC
Operational ATC
Depart
ment
CEC
Crop
productivit
y and
output
increased
No of model
farms established
and used to
transfer crop
production
technologies to
farmers
574 model
farms
Depart
ment
CEC
No of farmers
accessing
production
technologies
through the
model farms
580
farmers
Depart
ment
CEC
No of traditional
high value crops
seed
multiplication/b
ulking sites
established
18 by other
stakeholder
s
No of farmers
accessing seed
from the bulking
sites
1000
farmers
Sustained
land use
and
environme
ntal
conservati
on
No of households
harvesting runoff
water in water
pans and using
for vegetable
production
1hsehold
harvesting
runoff
water
No of households
harvesting runoff
water in water
pans and using
for vegetable
production
8 tractors
No of sub-county
machinery sheds
constructed
0
Improved
income
and
% increaseof
farm households
with improved
earnings from
64% of
farm
households
earn below
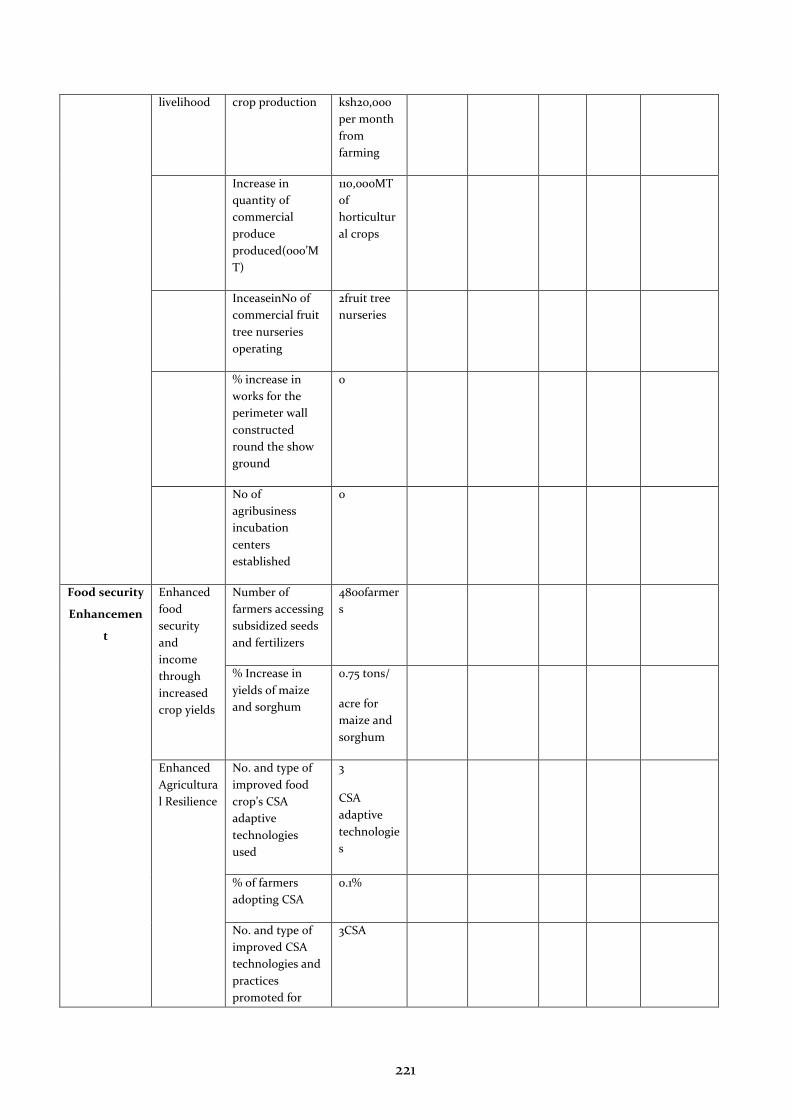
221
livelihood crop production ksh20,000
per month
from
farming
Increase in
quantity of
commercial
produce
produced(000’M
T)
110,000MT
of
horticultur
al crops
InceaseinNo of
commercial fruit
tree nurseries
operating
2fruit tree
nurseries
% increase in
works for the
perimeter wall
constructed
round the show
ground
0
No of
agribusiness
incubation
centers
established
0
Food security
Enhancemen
t
Enhanced
food
security
and
income
through
increased
crop yields
Number of
farmers accessing
subsidized seeds
and fertilizers
4800farmer
s
% Increase in
yields of maize
and sorghum
0.75 tons/
acre for
maize and
sorghum
Enhanced
Agricultura
l Resilience
No. and type of
improved food
crop’s CSA
adaptive
technologies
used
3
CSA
adaptive
technologie
s
% of farmers
adopting CSA
0.1%
No. and type of
improved CSA
technologies and
practices
promoted for
3CSA
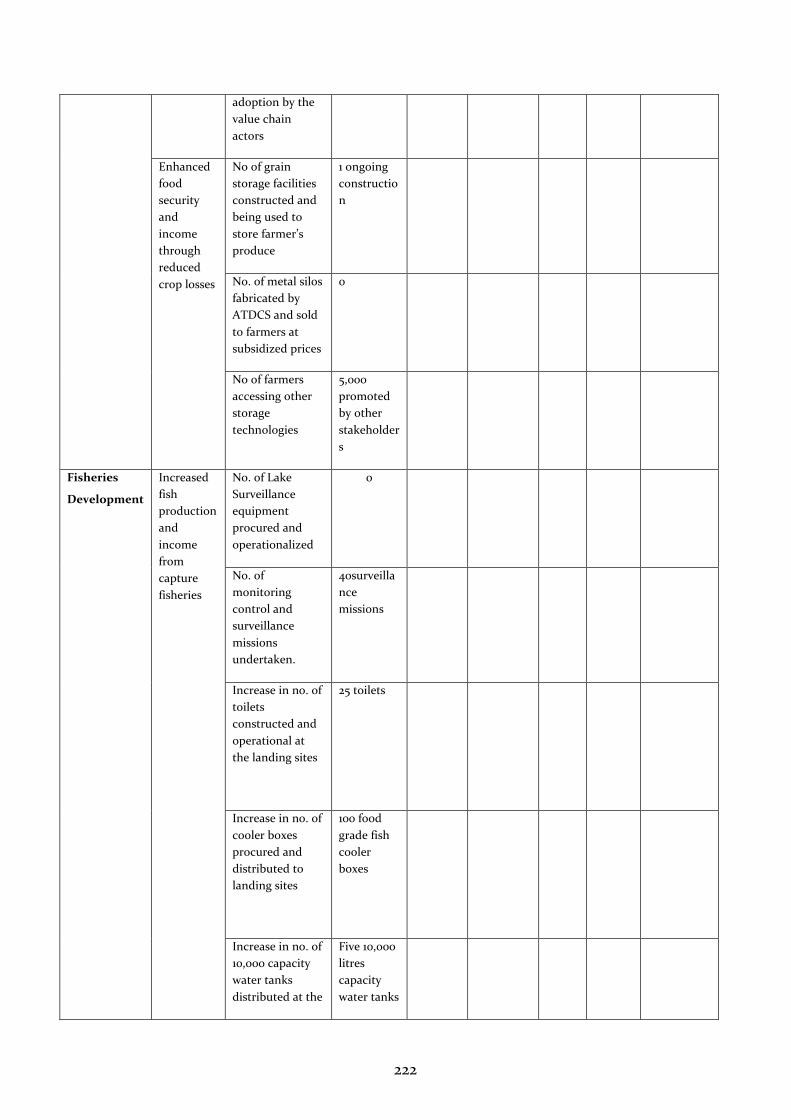
222
adoption by the
value chain
actors
Enhanced
food
security
and
income
through
reduced
crop losses
No of grain
storage facilities
constructed and
being used to
store farmer’s
produce
1 ongoing
constructio
n
No. of metal silos
fabricated by
ATDCS and sold
to farmers at
subsidized prices
0
No of farmers
accessing other
storage
technologies
5,000
promoted
by other
stakeholder
s
Fisheries
Development
Increased
fish
production
and
income
from
capture
fisheries
No. of Lake
Surveillance
equipment
procured and
operationalized
0
No. of
monitoring
control and
surveillance
missions
undertaken.
40surveilla
nce
missions
Increase in no. of
toilets
constructed and
operational at
the landing sites
25 toilets
Increase in no. of
cooler boxes
procured and
distributed to
landing sites
100 food
grade fish
cooler
boxes
Increase in no. of
10,000 capacity
water tanks
distributed at the
Five 10,000
litres
capacity
water tanks
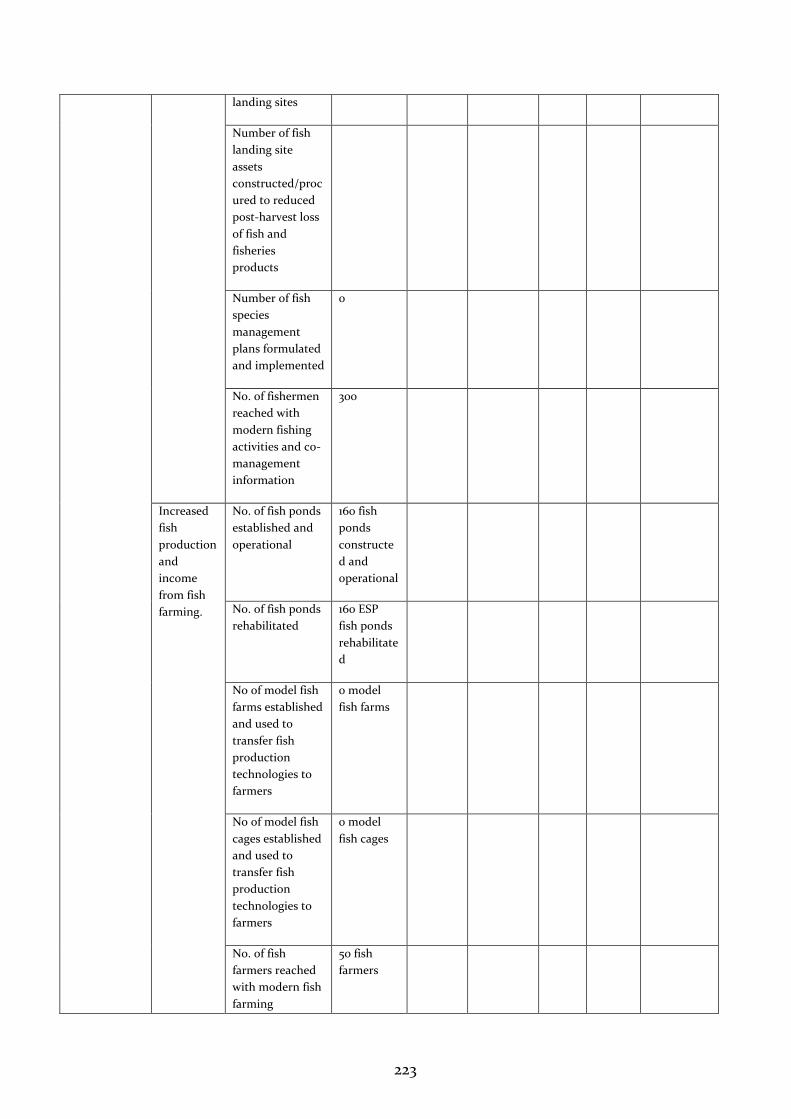
223
landing sites
Number of fish
landing site
assets
constructed/proc
ured to reduced
post-harvest loss
of fish and
fisheries
products
Number of fish
species
management
plans formulated
and implemented
0
No. of fishermen
reached with
modern fishing
activities and co-
management
information
300
Increased
fish
production
and
income
from fish
farming.
No. of fish ponds
established and
operational
160 fish
ponds
constructe
d and
operational
No. of fish ponds
rehabilitated
160 ESP
fish ponds
rehabilitate
d
No of model fish
farms established
and used to
transfer fish
production
technologies to
farmers
0 model
fish farms
No of model fish
cages established
and used to
transfer fish
production
technologies to
farmers
0 model
fish cages
No. of fish
farmers reached
with modern fish
farming
50 fish
farmers
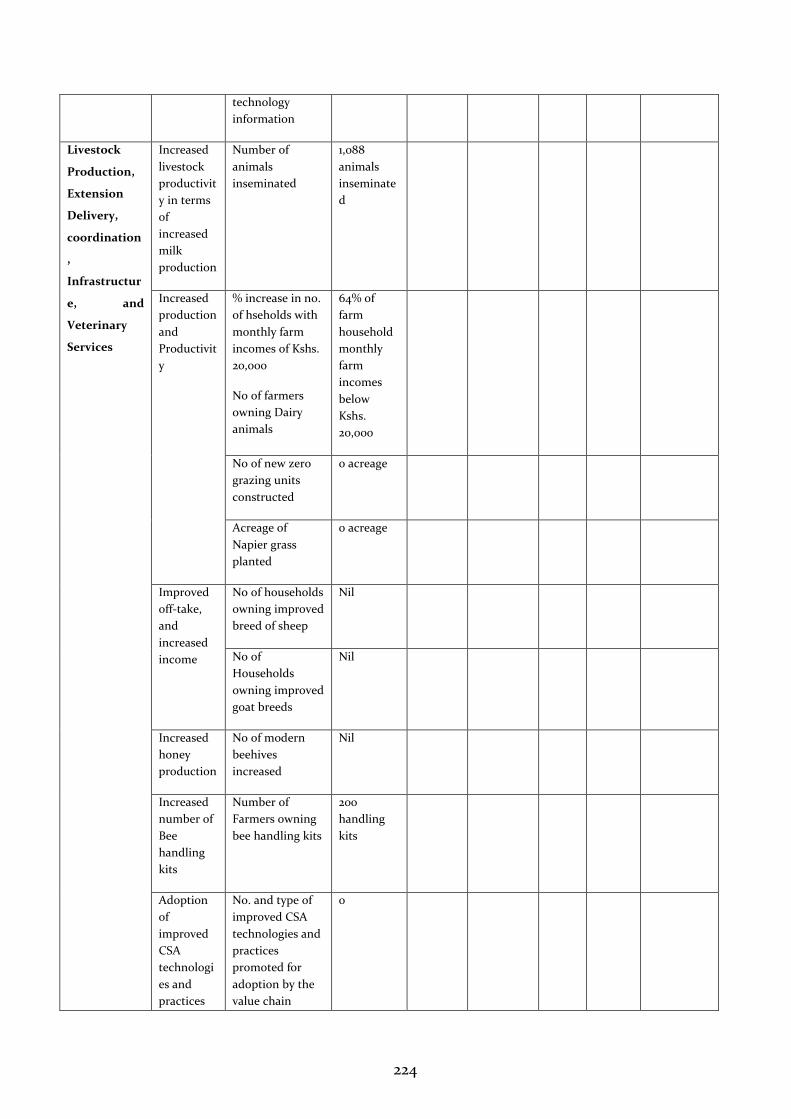
224
technology
information
Livestock
Production,
Extension
Delivery,
coordination
,
Infrastructur
e, and
Veterinary
Services
Increased
livestock
productivit
y in terms
of
increased
milk
production
Number of
animals
inseminated
1,088
animals
inseminate
d
Increased
production
and
Productivit
y
% increase in no.
of hseholds with
monthly farm
incomes of Kshs.
20,000
No of farmers
owning Dairy
animals
64% of
farm
household
monthly
farm
incomes
below
Kshs.
20,000
No of new zero
grazing units
constructed
0 acreage
Acreage of
Napier grass
planted
0 acreage
Improved
off-take,
and
increased
income
No of households
owning improved
breed of sheep
Nil
No of
Households
owning improved
goat breeds
Nil
Increased
honey
production
No of modern
beehives
increased
Nil
Increased
number of
Bee
handling
kits
Number of
Farmers owning
bee handling kits
200
handling
kits
Adoption
of
improved
CSA
technologi
es and
practices
No. and type of
improved CSA
technologies and
practices
promoted for
adoption by the
value chain
0
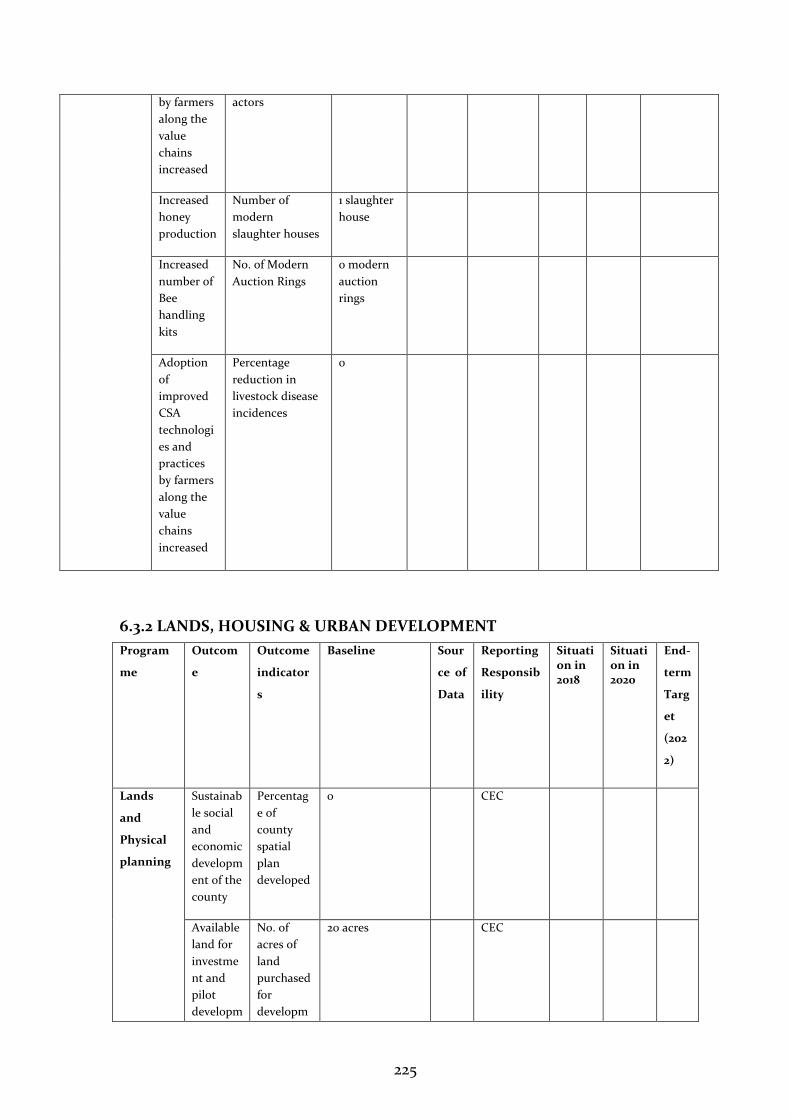
225
by farmers
along the
value
chains
increased
actors
Increased
honey
production
Number of
modern
slaughter houses
1 slaughter
house
Increased
number of
Bee
handling
kits
No. of Modern
Auction Rings
0 modern
auction
rings
Adoption
of
improved
CSA
technologi
es and
practices
by farmers
along the
value
chains
increased
Percentage
reduction in
livestock disease
incidences
0
6.3.2 LANDS, HOUSING & URBAN DEVELOPMENT
Program
me
Outcom
e
Outcome
indicator
s
Baseline Sour
ce of
Data
Reporting
Responsib
ility
Situation in 2018
Situation in 2020
End-
term
Targ
et
(202
2)
Lands
and
Physical
planning
Sustainab
le social
and
economic
developm
ent of the
county
Percentag
e of
county
spatial
plan
developed
0 CEC
Available
land for
investme
nt and
pilot
developm
No. of
acres of
land
purchased
for
developm
20 acres CEC
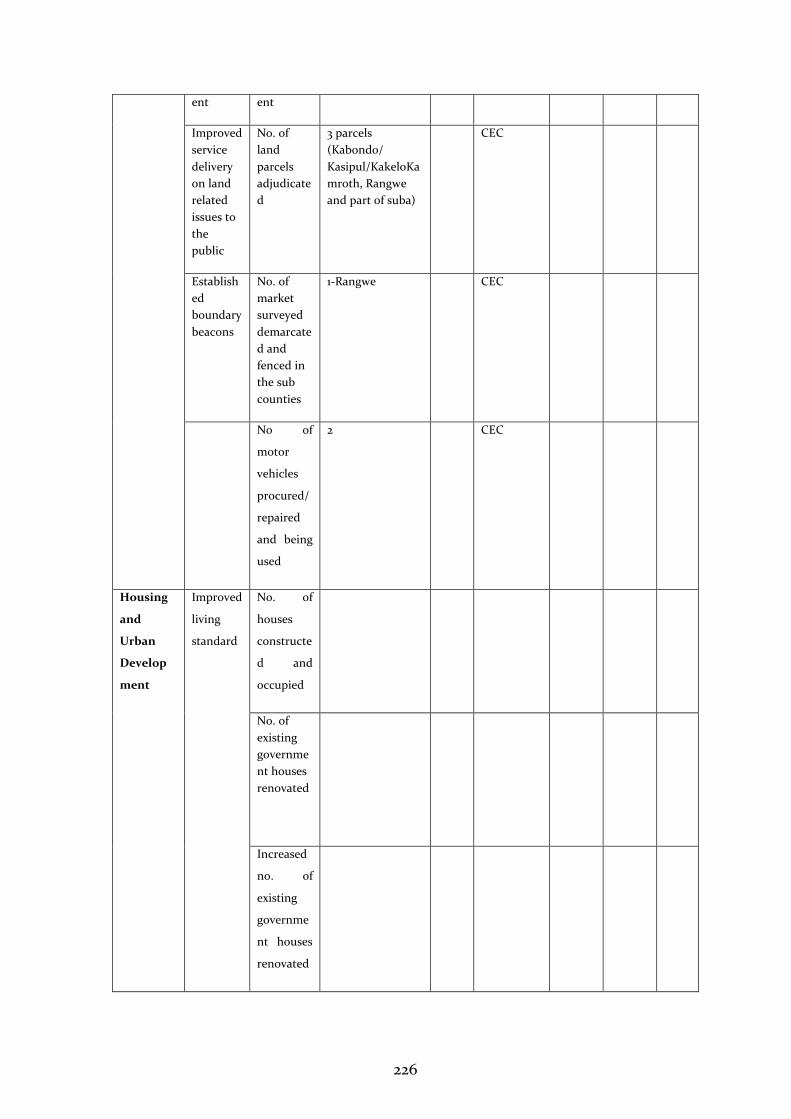
226
ent ent
Improved
service
delivery
on land
related
issues to
the
public
No. of
land
parcels
adjudicate
d
3 parcels
(Kabondo/
Kasipul/KakeloKa
mroth, Rangwe
and part of suba)
CEC
Establish
ed
boundary
beacons
No. of
market
surveyed
demarcate
d and
fenced in
the sub
counties
1-Rangwe CEC
No of
motor
vehicles
procured/
repaired
and being
used
2 CEC
Housing
and
Urban
Develop
ment
Improved
living
standard
No. of
houses
constructe
d and
occupied
No. of
existing
governme
nt houses
renovated
Increased
no. of
existing
governme
nt houses
renovated
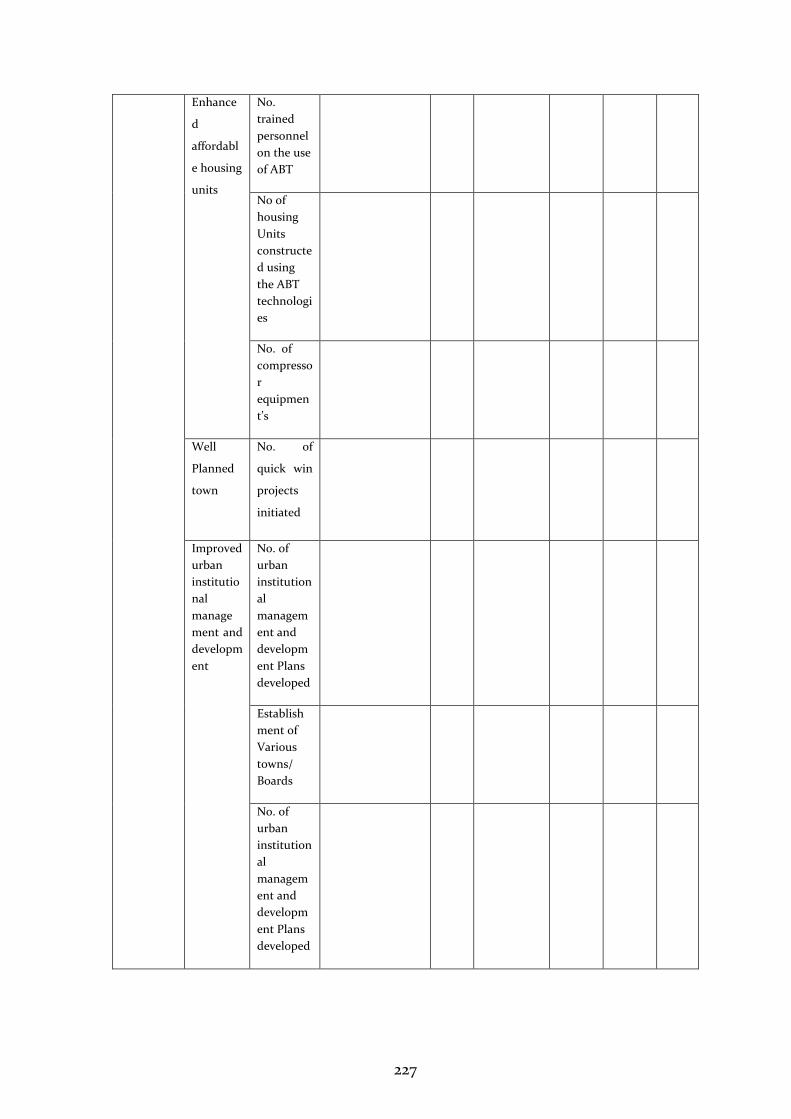
227
Enhance
d
affordabl
e housing
units
No.
trained
personnel
on the use
of ABT
No of
housing
Units
constructe
d using
the ABT
technologi
es
No. of
compresso
r
equipmen
t’s
Well
Planned
town
No. of
quick win
projects
initiated
Improved
urban
institutio
nal
manage
ment and
developm
ent
No. of
urban
institution
al
managem
ent and
developm
ent Plans
developed
Establish
ment of
Various
towns/
Boards
No. of
urban
institution
al
managem
ent and
developm
ent Plans
developed
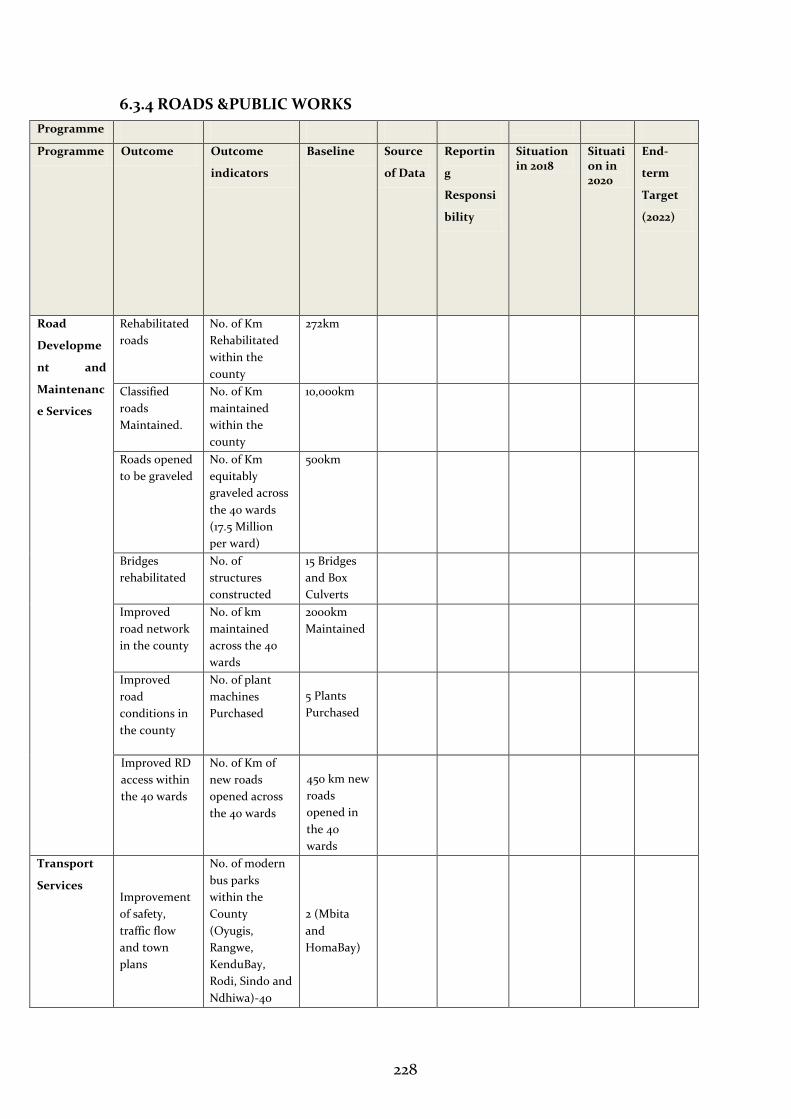
228
6.3.4 ROADS &PUBLIC WORKS
Programme
Programme Outcome Outcome
indicators
Baseline Source
of Data
Reportin
g
Responsi
bility
Situation in 2018
Situation in 2020
End-
term
Target
(2022)
Road
Developme
nt and
Maintenanc
e Services
Rehabilitated
roads
No. of Km
Rehabilitated
within the
county
272km
Classified
roads
Maintained.
No. of Km
maintained
within the
county
10,000km
Roads opened
to be graveled
No. of Km
equitably
graveled across
the 40 wards
(17.5 Million
per ward)
500km
Bridges
rehabilitated
No. of
structures
constructed
15 Bridges
and Box
Culverts
Improved
road network
in the county
No. of km
maintained
across the 40
wards
2000km
Maintained
Improved
road
conditions in
the county
No. of plant
machines
Purchased
5 Plants
Purchased
Improved RD
access within
the 40 wards
No. of Km of
new roads
opened across
the 40 wards
450 km new
roads
opened in
the 40
wards
Transport
Services Improvement
of safety,
traffic flow
and town
plans
No. of modern
bus parks
within the
County
(Oyugis,
Rangwe,
KenduBay,
Rodi, Sindo and
Ndhiwa)-40
2 (Mbita
and
HomaBay)
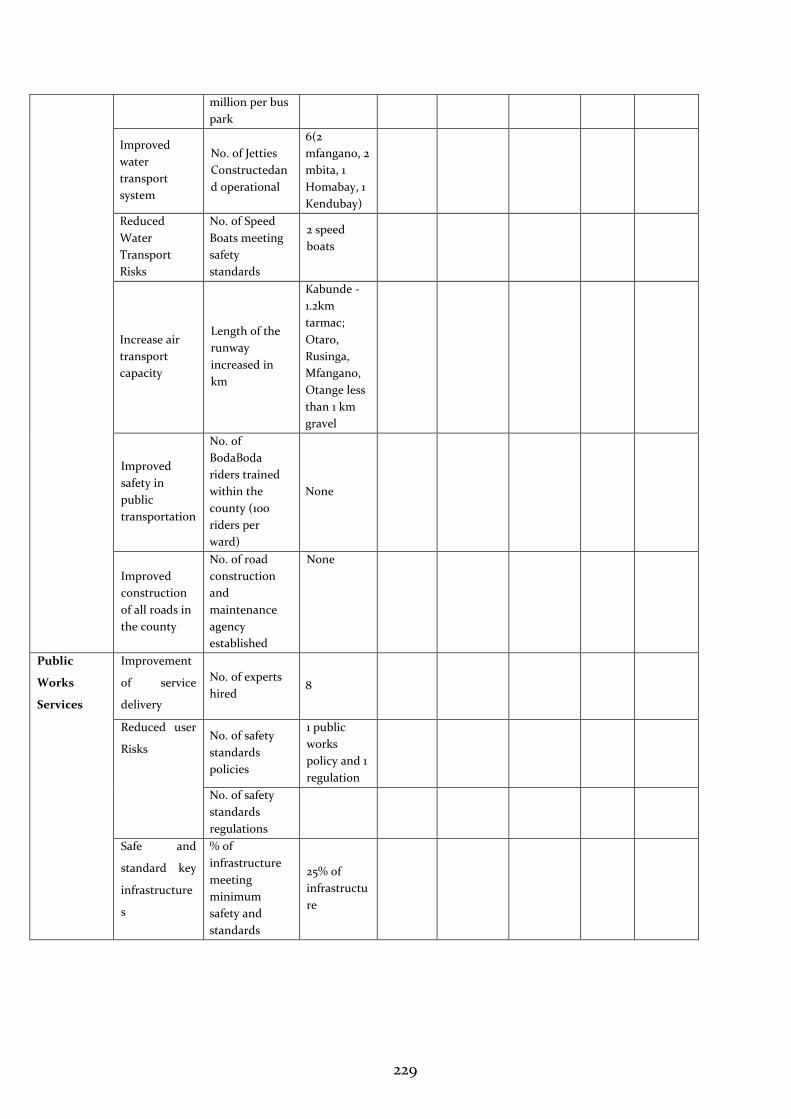
229
million per bus
park
Improved
water
transport
system
No. of Jetties
Constructedan
d operational
6(2
mfangano, 2
mbita, 1
Homabay, 1
Kendubay)
Reduced
Water
Transport
Risks
No. of Speed
Boats meeting
safety
standards
2 speed
boats
Increase air
transport
capacity
Length of the
runway
increased in
km
Kabunde -
1.2km
tarmac;
Otaro,
Rusinga,
Mfangano,
Otange less
than 1 km
gravel
Improved
safety in
public
transportation
No. of
BodaBoda
riders trained
within the
county (100
riders per
ward)
None
Improved
construction
of all roads in
the county
No. of road
construction
and
maintenance
agency
established
None
Public
Works
Services
Improvement
of service
delivery
No. of experts
hired 8
Reduced user
Risks No. of safety
standards
policies
1 public
works
policy and 1
regulation
No. of safety
standards
regulations
Safe and
standard key
infrastructure
s
% of
infrastructure
meeting
minimum
safety and
standards
25% of
infrastructu
re
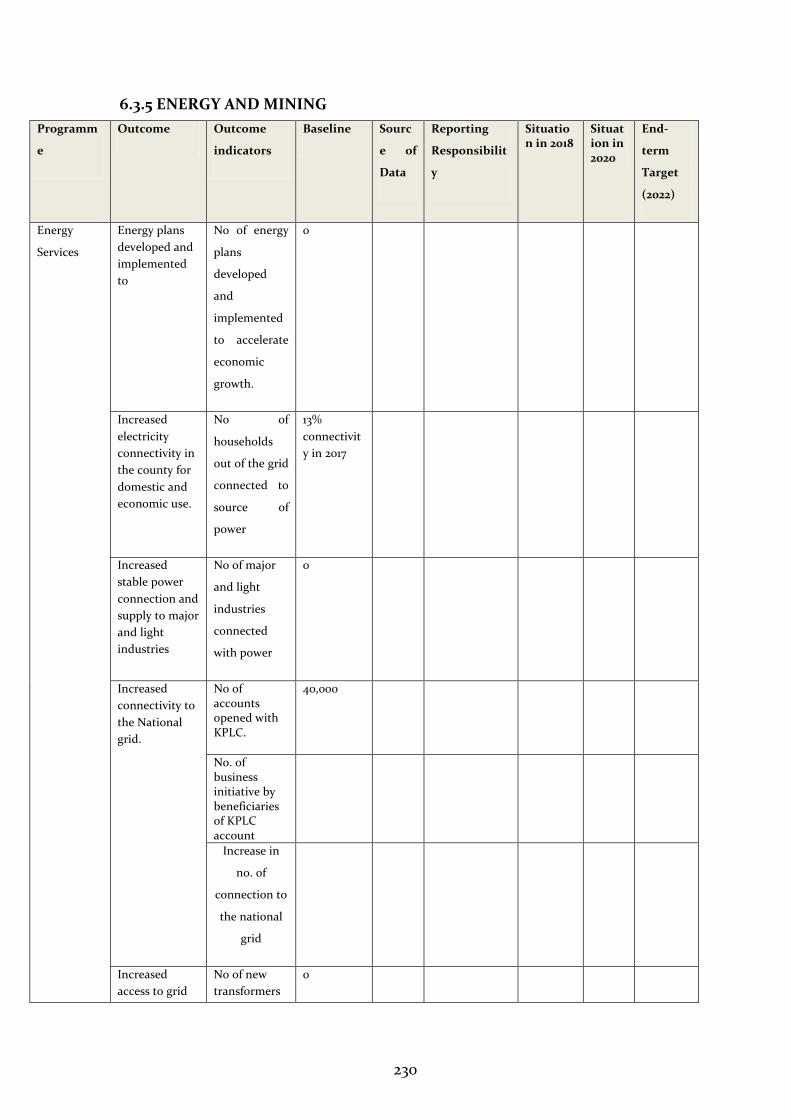
230
6.3.5 ENERGY AND MINING
Programm
e
Outcome Outcome
indicators
Baseline Sourc
e of
Data
Reporting
Responsibilit
y
Situation in 2018
Situation in 2020
End-
term
Target
(2022)
Energy
Services
Energy plans
developed and
implemented
to
No of energy
plans
developed
and
implemented
to accelerate
economic
growth.
0
Increased
electricity
connectivity in
the county for
domestic and
economic use.
No of
households
out of the grid
connected to
source of
power
13%
connectivit
y in 2017
Increased
stable power
connection and
supply to major
and light
industries
No of major
and light
industries
connected
with power
0
Increased
connectivity to
the National
grid.
No of accounts opened with KPLC.
40,000
No. of business initiative by beneficiaries of KPLC account
Increase in
no. of
connection to
the national
grid
Increased
access to grid
No of new
transformers
0
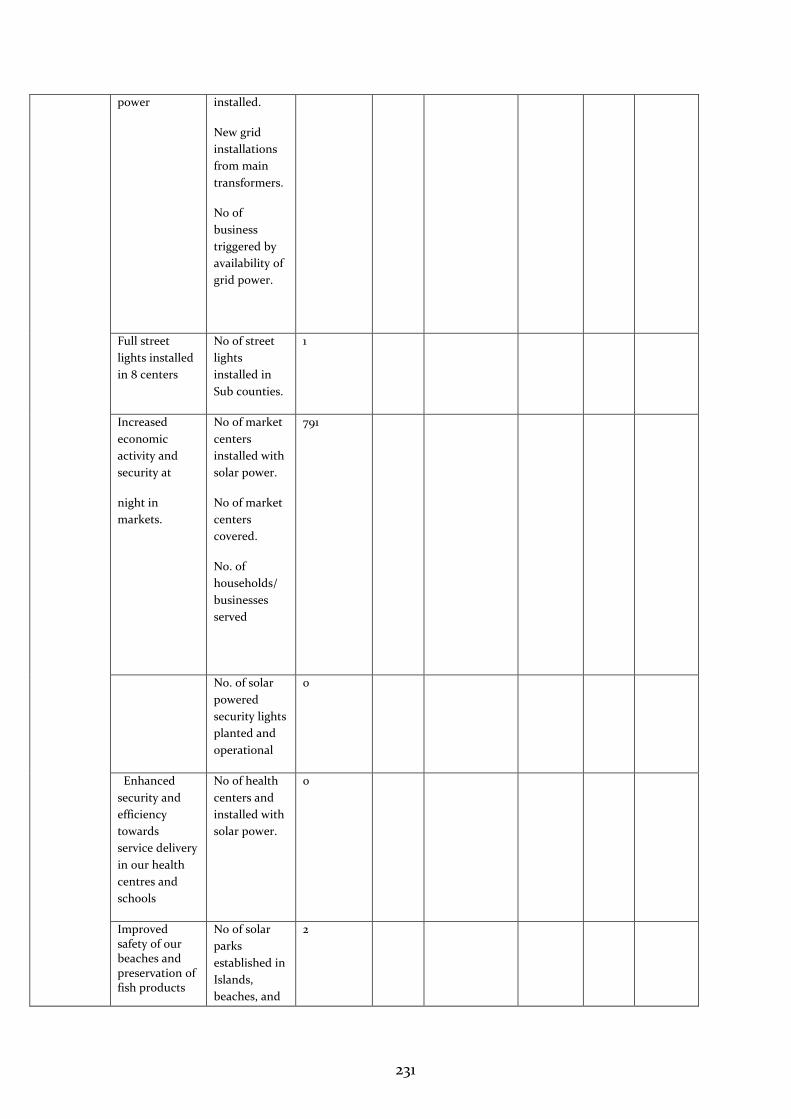
231
power installed.
New grid
installations
from main
transformers.
No of
business
triggered by
availability of
grid power.
Full street
lights installed
in 8 centers
No of street
lights
installed in
Sub counties.
1
Increased
economic
activity and
security at
night in
markets.
No of market
centers
installed with
solar power.
No of market
centers
covered.
No. of
households/
businesses
served
791
No. of solar
powered
security lights
planted and
operational
0
Enhanced
security and
efficiency
towards
service delivery
in our health
centres and
schools
No of health
centers and
installed with
solar power.
0
Improved safety of our beaches and preservation of fish products
No of solar
parks
established in
Islands,
beaches, and
2
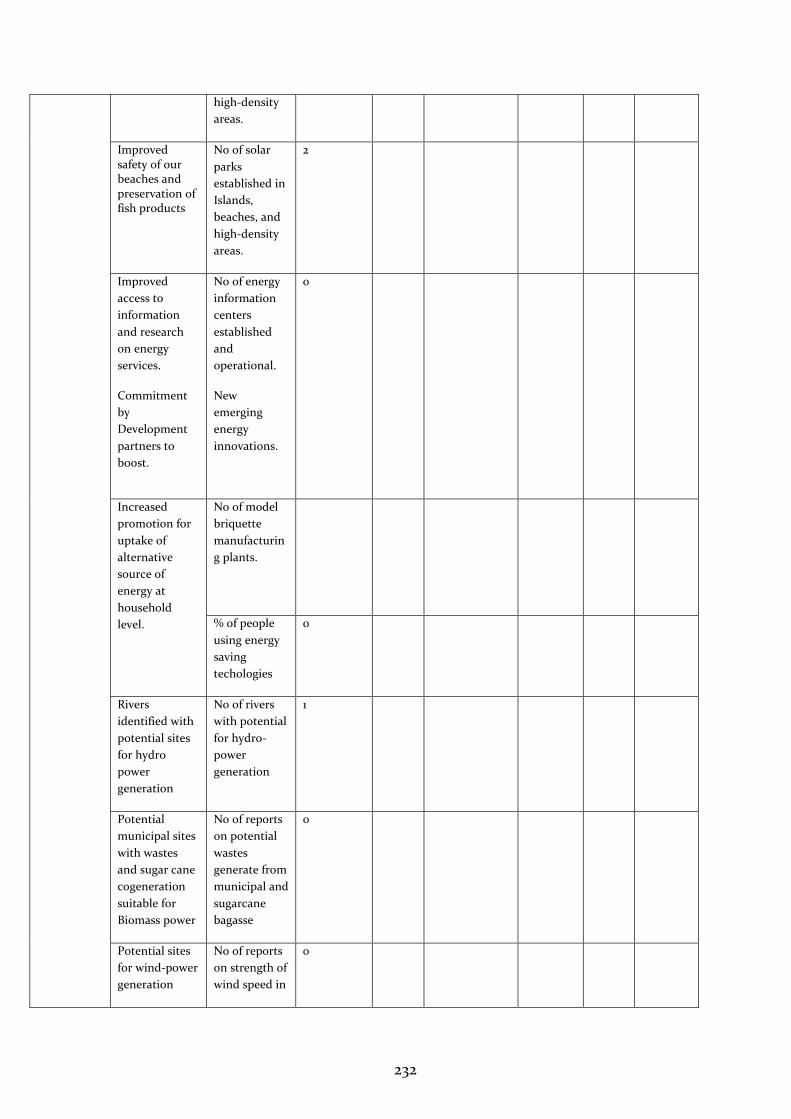
232
high-density
areas.
Improved safety of our beaches and preservation of fish products
No of solar
parks
established in
Islands,
beaches, and
high-density
areas.
2
Improved
access to
information
and research
on energy
services.
Commitment
by
Development
partners to
boost.
No of energy
information
centers
established
and
operational.
New
emerging
energy
innovations.
0
Increased
promotion for
uptake of
alternative
source of
energy at
household
level.
No of model
briquette
manufacturin
g plants.
% of people
using energy
saving
techologies
0
Rivers
identified with
potential sites
for hydro
power
generation
No of rivers
with potential
for hydro-
power
generation
1
Potential
municipal sites
with wastes
and sugar cane
cogeneration
suitable for
Biomass power
No of reports
on potential
wastes
generate from
municipal and
sugarcane
bagasse
0
Potential sites
for wind-power
generation
No of reports
on strength of
wind speed in
0
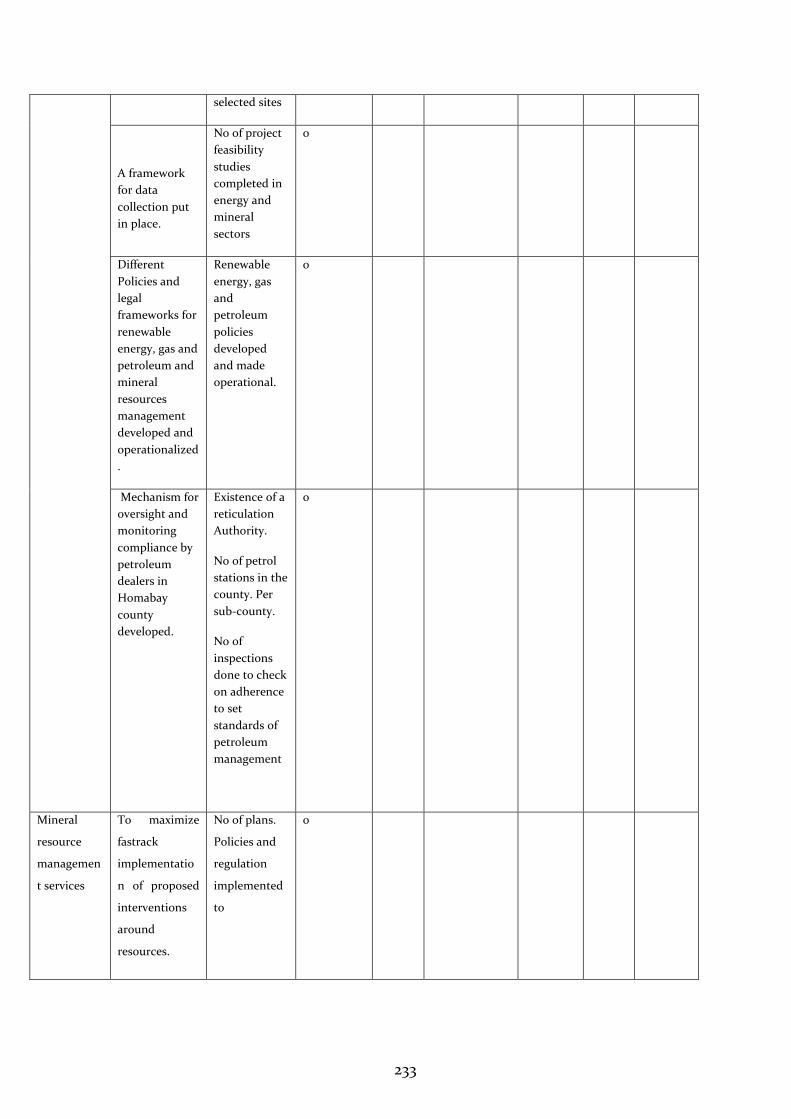
233
selected sites
A framework
for data
collection put
in place.
No of project
feasibility
studies
completed in
energy and
mineral
sectors
0
Different
Policies and
legal
frameworks for
renewable
energy, gas and
petroleum and
mineral
resources
management
developed and
operationalized
.
Renewable
energy, gas
and
petroleum
policies
developed
and made
operational.
0
Mechanism for
oversight and
monitoring
compliance by
petroleum
dealers in
Homabay
county
developed.
Existence of a
reticulation
Authority.
No of petrol
stations in the
county. Per
sub-county.
No of
inspections
done to check
on adherence
to set
standards of
petroleum
management
0
Mineral
resource
managemen
t services
To maximize
fastrack
implementatio
n of proposed
interventions
around
resources.
No of plans.
Policies and
regulation
implemented
to
0
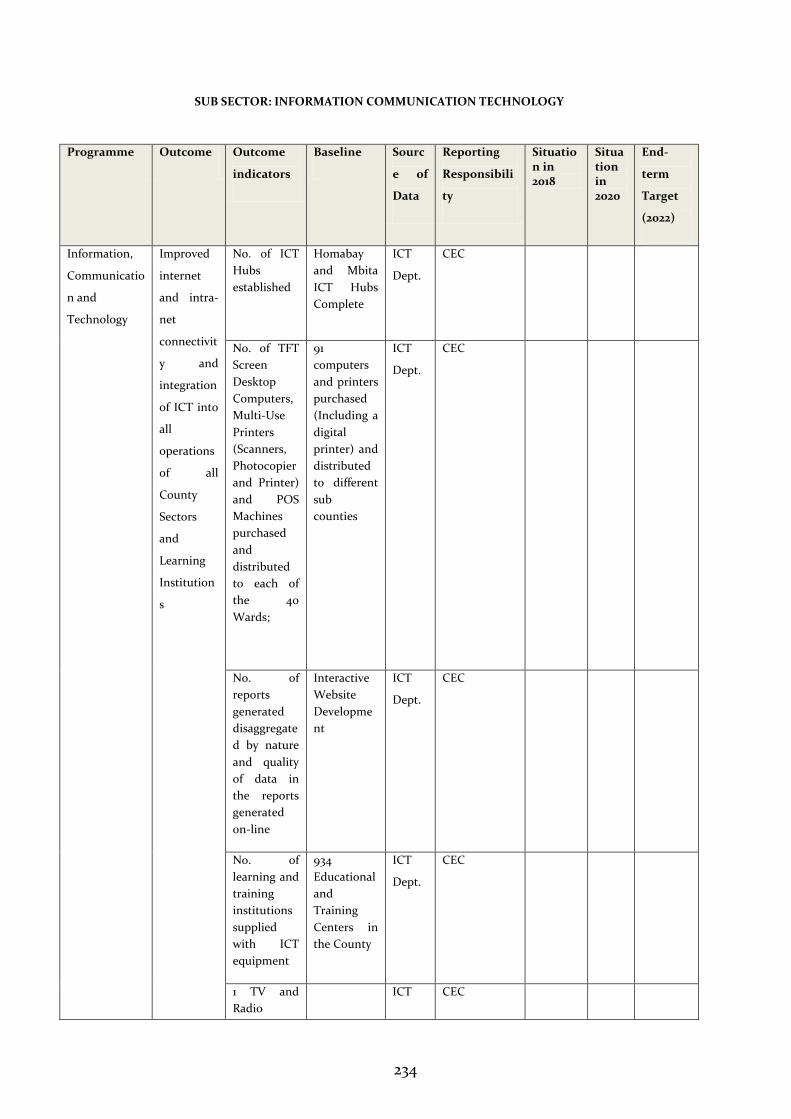
234
SUB SECTOR: INFORMATION COMMUNICATION TECHNOLOGY
Programme Outcome Outcome
indicators
Baseline Sourc
e of
Data
Reporting
Responsibili
ty
Situation in 2018
Situation in 2020
End-
term
Target
(2022)
Information,
Communicatio
n and
Technology
Improved
internet
and intra-
net
connectivit
y and
integration
of ICT into
all
operations
of all
County
Sectors
and
Learning
Institution
s
No. of ICT
Hubs
established
Homabay
and Mbita
ICT Hubs
Complete
ICT
Dept.
CEC
No. of TFT
Screen
Desktop
Computers,
Multi-Use
Printers
(Scanners,
Photocopier
and Printer)
and POS
Machines
purchased
and
distributed
to each of
the 40
Wards;
91
computers
and printers
purchased
(Including a
digital
printer) and
distributed
to different
sub
counties
ICT
Dept.
CEC
No. of
reports
generated
disaggregate
d by nature
and quality
of data in
the reports
generated
on-line
Interactive
Website
Developme
nt
ICT
Dept.
CEC
No. of
learning and
training
institutions
supplied
with ICT
equipment
934
Educational
and
Training
Centers in
the County
ICT
Dept.
CEC
1 TV and
Radio
ICT CEC
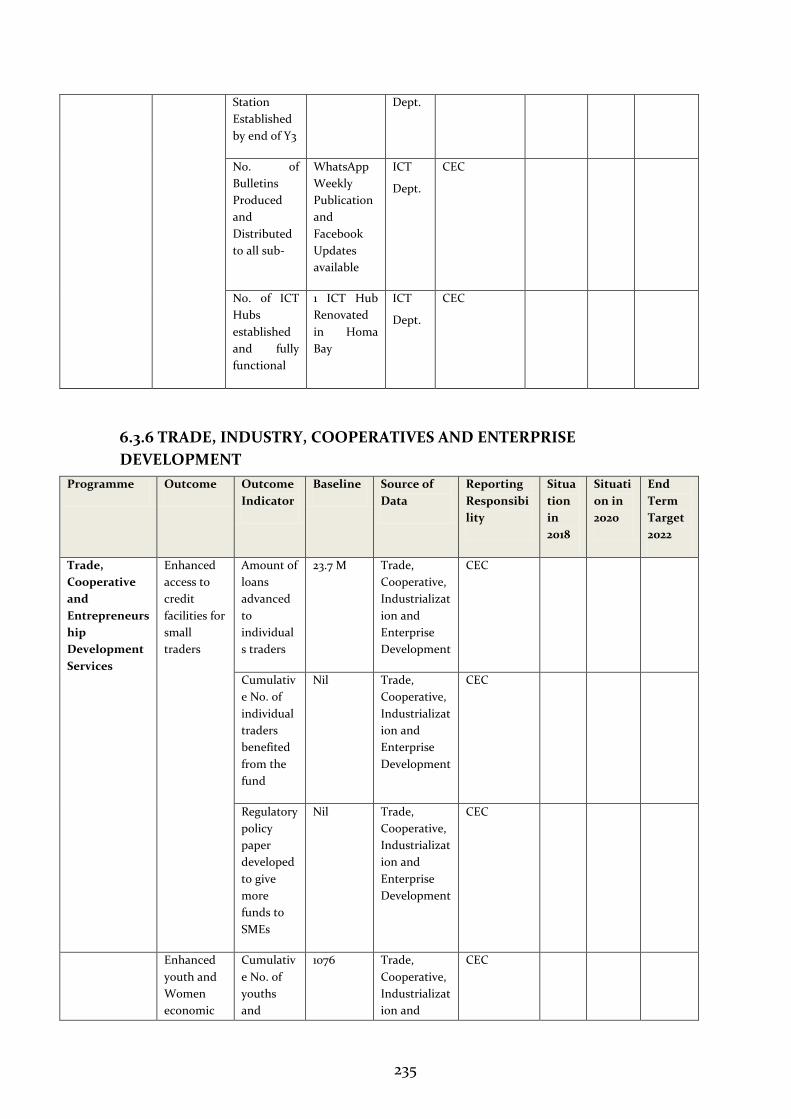
235
Station
Established
by end of Y3
Dept.
No. of
Bulletins
Produced
and
Distributed
to all sub-
Weekly
Publication
and
Updates
available
ICT
Dept.
CEC
No. of ICT
Hubs
established
and fully
functional
1 ICT Hub
Renovated
in Homa
Bay
ICT
Dept.
CEC
6.3.6 TRADE, INDUSTRY, COOPERATIVES AND ENTERPRISE
DEVELOPMENT
Programme Outcome Outcome
Indicator
Baseline Source of
Data
Reporting
Responsibi
lity
Situa
tion
in
2018
Situati
on in
2020
End
Term
Target
2022
Trade,
Cooperative
and
Entrepreneurs
hip
Development
Services
Enhanced
access to
credit
facilities for
small
traders
Amount of
loans
advanced
to
individual
s traders
23.7 M Trade,
Cooperative,
Industrializat
ion and
Enterprise
Development
CEC
Cumulativ
e No. of
individual
traders
benefited
from the
fund
Nil Trade,
Cooperative,
Industrializat
ion and
Enterprise
Development
CEC
Regulatory
policy
paper
developed
to give
more
funds to
SMEs
Nil Trade,
Cooperative,
Industrializat
ion and
Enterprise
Development
CEC
Enhanced
youth and
Women
economic
Cumulativ
e No. of
youths
and
1076 Trade,
Cooperative,
Industrializat
ion and
CEC
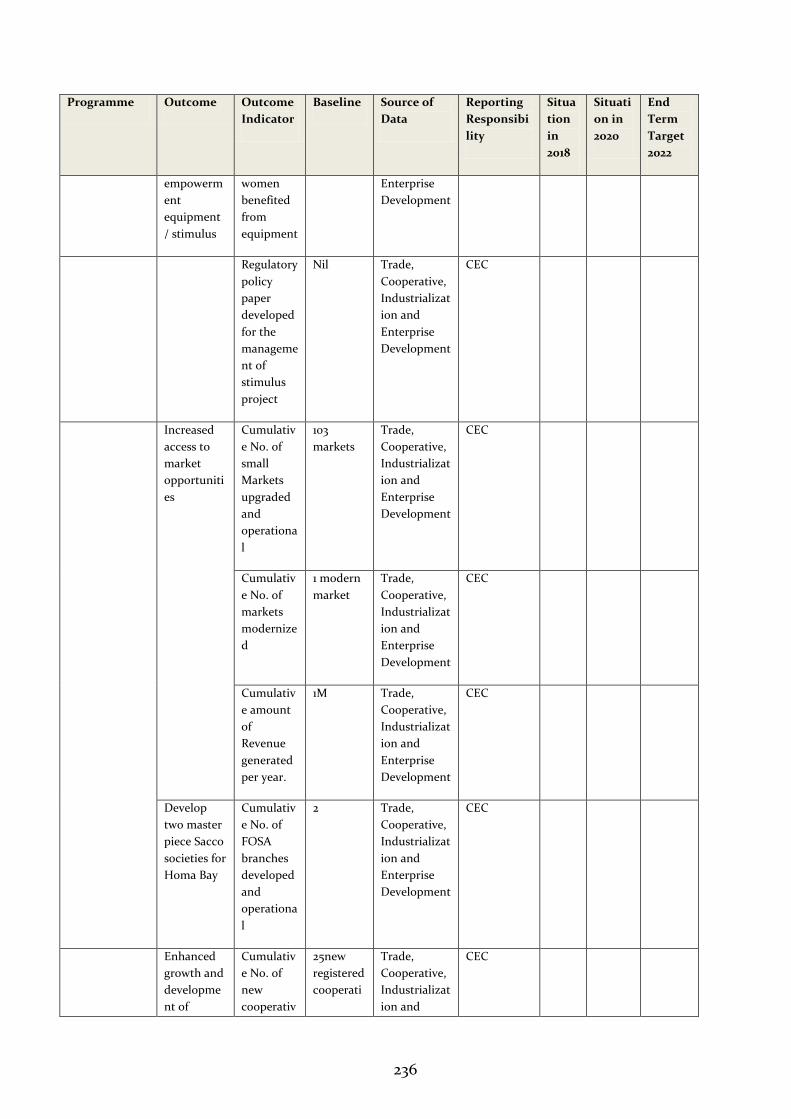
236
Programme Outcome Outcome
Indicator
Baseline Source of
Data
Reporting
Responsibi
lity
Situa
tion
in
2018
Situati
on in
2020
End
Term
Target
2022
empowerm
ent
equipment
/ stimulus
women
benefited
from
equipment
Enterprise
Development
Regulatory
policy
paper
developed
for the
manageme
nt of
stimulus
project
Nil Trade,
Cooperative,
Industrializat
ion and
Enterprise
Development
CEC
Increased
access to
market
opportuniti
es
Cumulativ
e No. of
small
Markets
upgraded
and
operationa
l
103
markets
Trade,
Cooperative,
Industrializat
ion and
Enterprise
Development
CEC
Cumulativ
e No. of
markets
modernize
d
1 modern
market
Trade,
Cooperative,
Industrializat
ion and
Enterprise
Development
CEC
Cumulativ
e amount
of
Revenue
generated
per year.
1M Trade,
Cooperative,
Industrializat
ion and
Enterprise
Development
CEC
Develop
two master
piece Sacco
societies for
Homa Bay
Cumulativ
e No. of
FOSA
branches
developed
and
operationa
l
2 Trade,
Cooperative,
Industrializat
ion and
Enterprise
Development
CEC
Enhanced
growth and
developme
nt of
Cumulativ
e No. of
new
cooperativ
25new
registered
cooperati
Trade,
Cooperative,
Industrializat
ion and
CEC
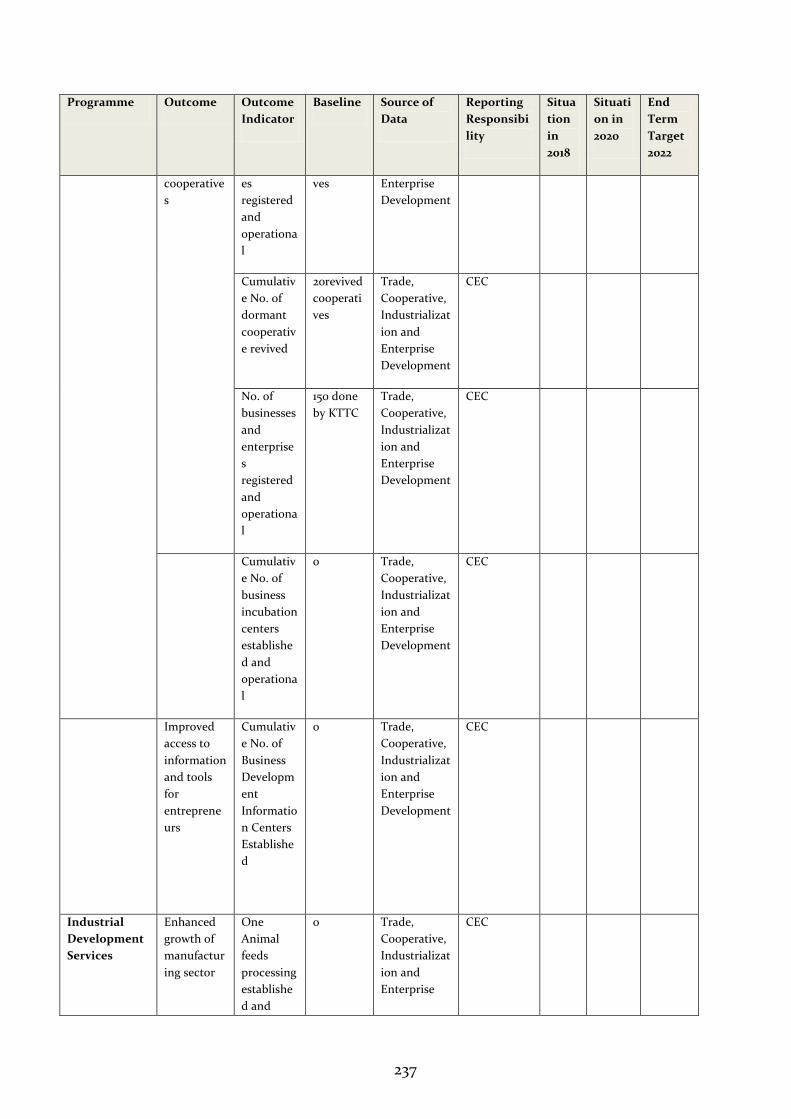
237
Programme Outcome Outcome
Indicator
Baseline Source of
Data
Reporting
Responsibi
lity
Situa
tion
in
2018
Situati
on in
2020
End
Term
Target
2022
cooperative
s
es
registered
and
operationa
l
ves Enterprise
Development
Cumulativ
e No. of
dormant
cooperativ
e revived
20revived
cooperati
ves
Trade,
Cooperative,
Industrializat
ion and
Enterprise
Development
CEC
No. of
businesses
and
enterprise
s
registered
and
operationa
l
150 done
by KTTC
Trade,
Cooperative,
Industrializat
ion and
Enterprise
Development
CEC
Cumulativ
e No. of
business
incubation
centers
establishe
d and
operationa
l
0 Trade,
Cooperative,
Industrializat
ion and
Enterprise
Development
CEC
Improved
access to
information
and tools
for
entreprene
urs
Cumulativ
e No. of
Business
Developm
ent
Informatio
n Centers
Establishe
d
0 Trade,
Cooperative,
Industrializat
ion and
Enterprise
Development
CEC
Industrial
Development
Services
Enhanced
growth of
manufactur
ing sector
One
Animal
feeds
processing
establishe
d and
0 Trade,
Cooperative,
Industrializat
ion and
Enterprise
CEC
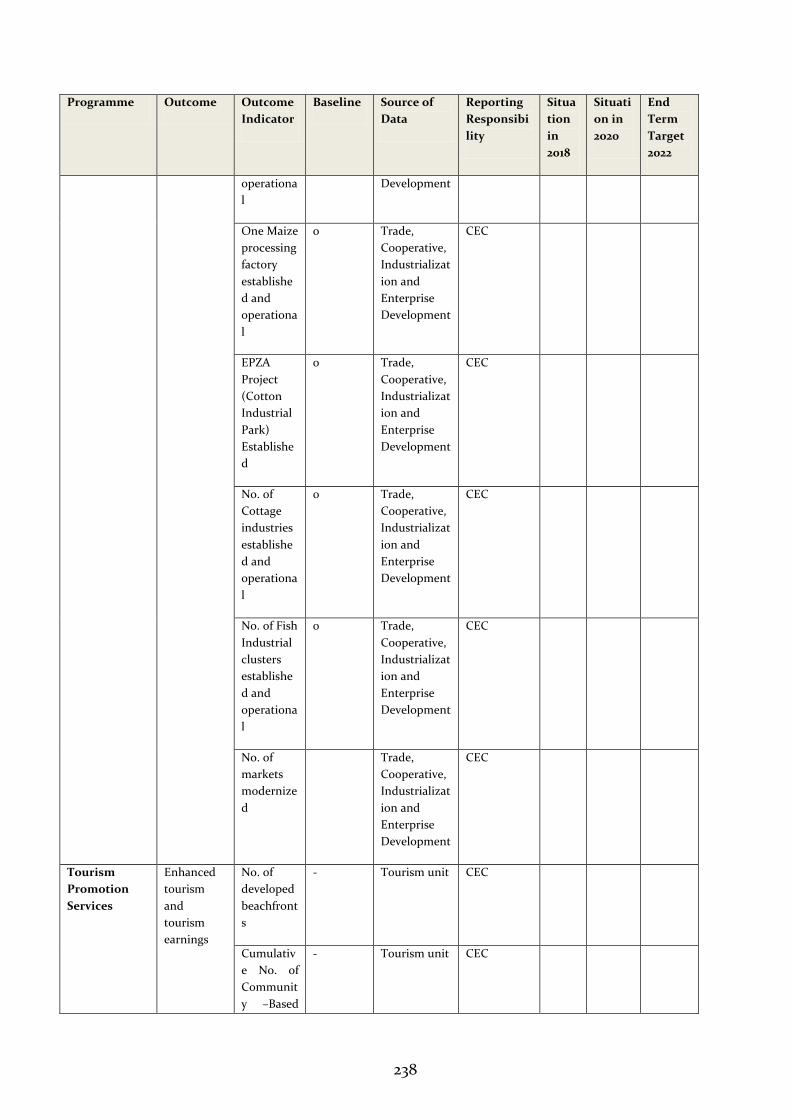
238
Programme Outcome Outcome
Indicator
Baseline Source of
Data
Reporting
Responsibi
lity
Situa
tion
in
2018
Situati
on in
2020
End
Term
Target
2022
operationa
l
Development
One Maize
processing
factory
establishe
d and
operationa
l
0 Trade,
Cooperative,
Industrializat
ion and
Enterprise
Development
CEC
EPZA
Project
(Cotton
Industrial
Park)
Establishe
d
0 Trade,
Cooperative,
Industrializat
ion and
Enterprise
Development
CEC
No. of
Cottage
industries
establishe
d and
operationa
l
0 Trade,
Cooperative,
Industrializat
ion and
Enterprise
Development
CEC
No. of Fish
Industrial
clusters
establishe
d and
operationa
l
0 Trade,
Cooperative,
Industrializat
ion and
Enterprise
Development
CEC
No. of
markets
modernize
d
Trade,
Cooperative,
Industrializat
ion and
Enterprise
Development
CEC
Tourism
Promotion
Services
Enhanced
tourism
and
tourism
earnings
No. of
developed
beachfront
s
- Tourism unit CEC
Cumulativ
e No. of
Communit
y –Based
- Tourism unit CEC
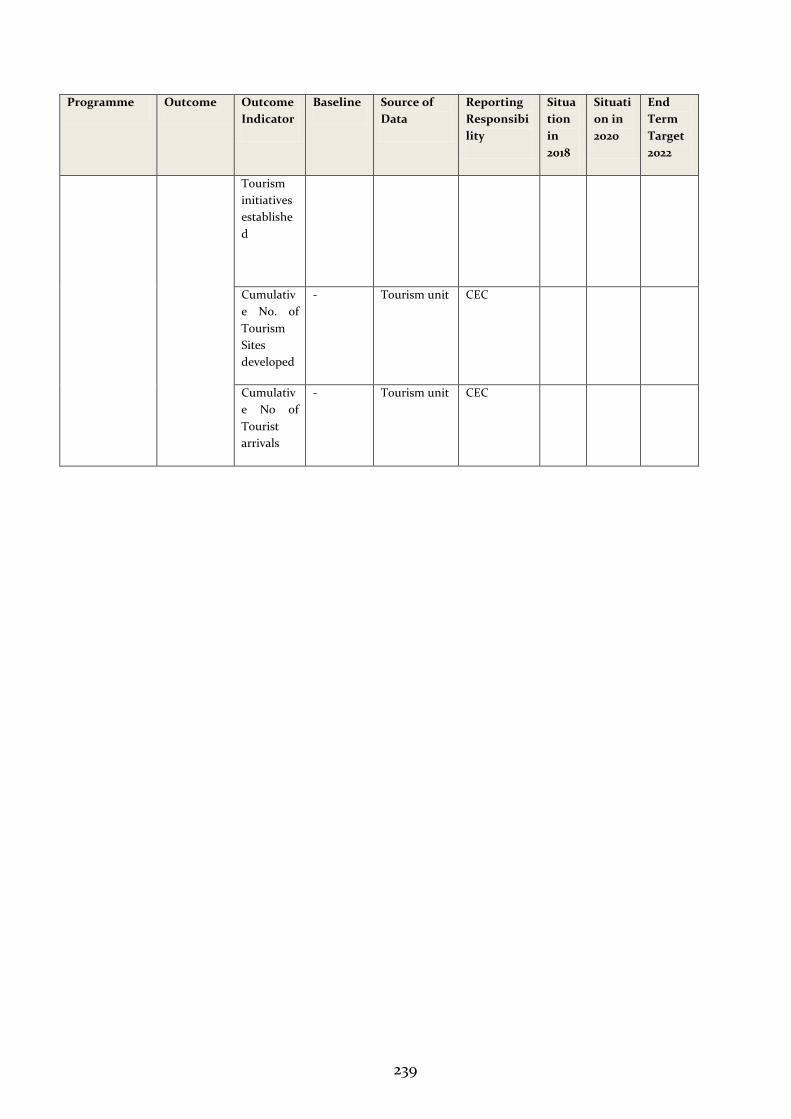
239
Programme Outcome Outcome
Indicator
Baseline Source of
Data
Reporting
Responsibi
lity
Situa
tion
in
2018
Situati
on in
2020
End
Term
Target
2022
Tourism
initiatives
establishe
d
Cumulativ
e No. of
Tourism
Sites
developed
- Tourism unit CEC
Cumulativ
e No of
Tourist
arrivals
- Tourism unit CEC
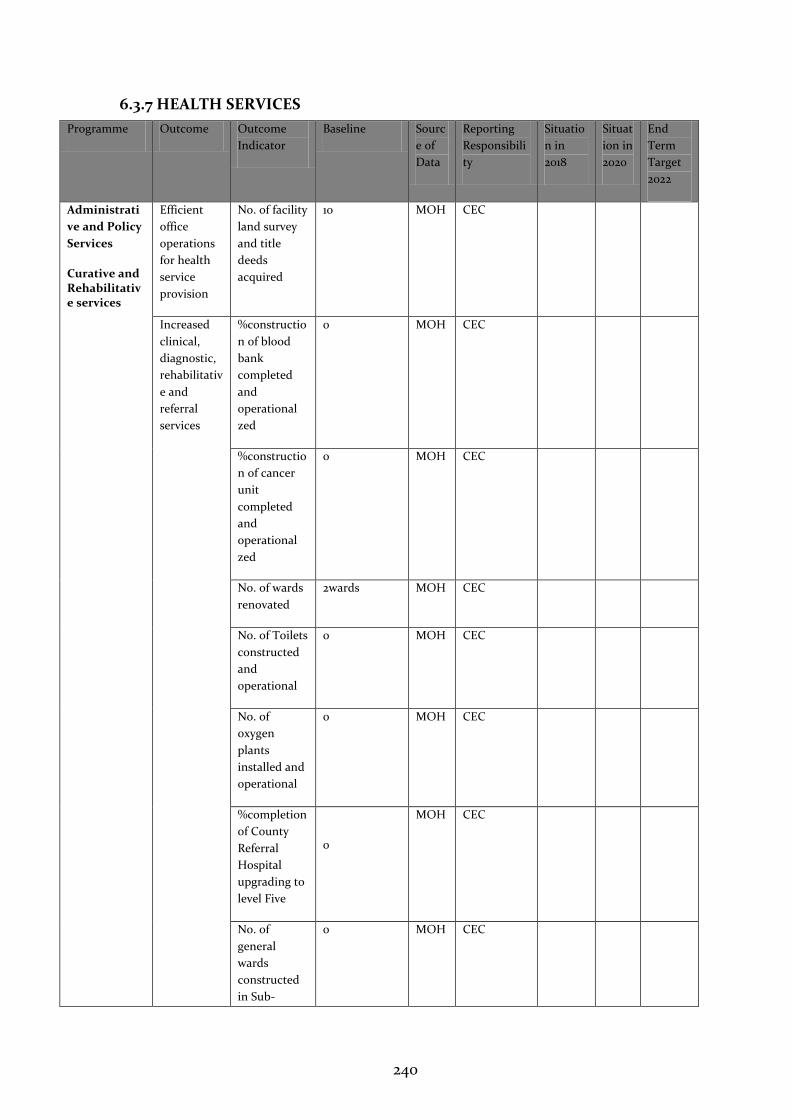
240
6.3.7 HEALTH SERVICES
Programme Outcome Outcome
Indicator
Baseline Sourc
e of
Data
Reporting
Responsibili
ty
Situatio
n in
2018
Situat
ion in
2020
End
Term
Target
2022
Administrati
ve and Policy
Services
Curative and Rehabilitative services
Efficient
office
operations
for health
service
provision
No. of facility
land survey
and title
deeds
acquired
10 MOH CEC
Increased
clinical,
diagnostic,
rehabilitativ
e and
referral
services
%constructio
n of blood
bank
completed
and
operational
zed
0 MOH CEC
%constructio
n of cancer
unit
completed
and
operational
zed
0 MOH CEC
No. of wards
renovated
2wards MOH CEC
No. of Toilets
constructed
and
operational
0 MOH CEC
No. of
oxygen
plants
installed and
operational
0 MOH CEC
%completion
of County
Referral
Hospital
upgrading to
level Five
0
MOH CEC
No. of
general
wards
constructed
in Sub-
0 MOH CEC
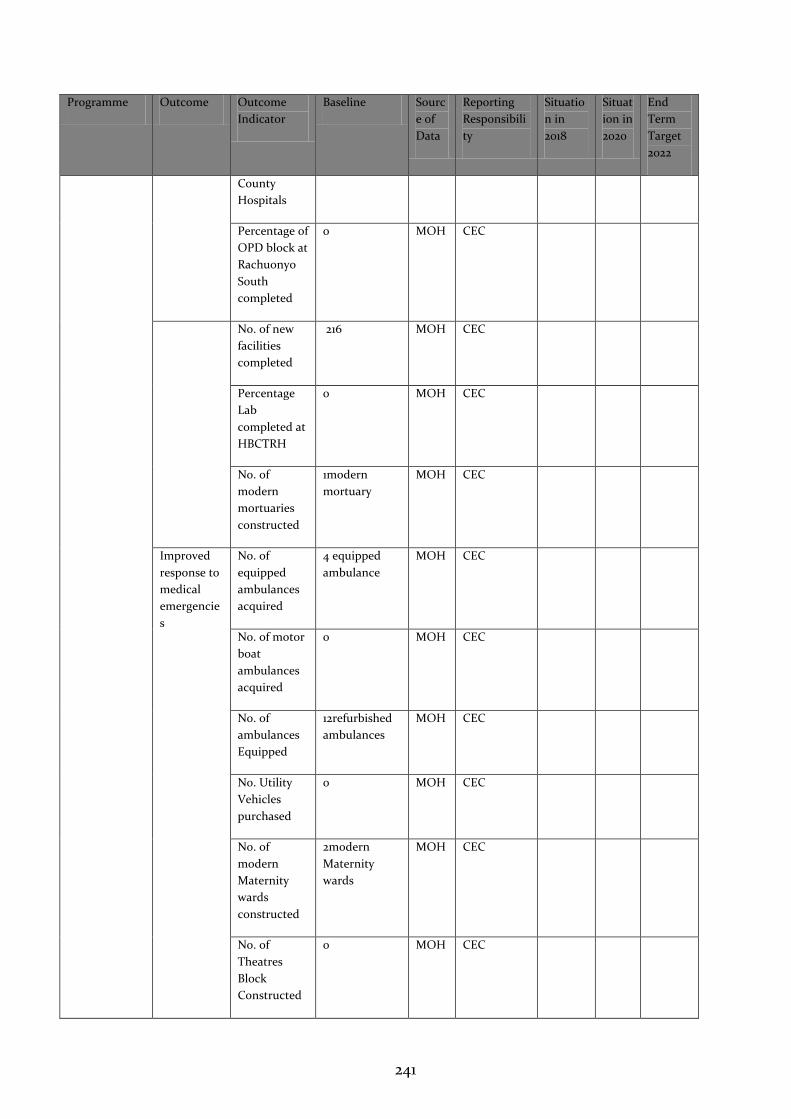
241
Programme Outcome Outcome
Indicator
Baseline Sourc
e of
Data
Reporting
Responsibili
ty
Situatio
n in
2018
Situat
ion in
2020
End
Term
Target
2022
County
Hospitals
Percentage of
OPD block at
Rachuonyo
South
completed
0 MOH CEC
No. of new
facilities
completed
216 MOH CEC
Percentage
Lab
completed at
HBCTRH
0 MOH CEC
No. of
modern
mortuaries
constructed
1modern
mortuary
MOH CEC
Improved
response to
medical
emergencie
s
No. of
equipped
ambulances
acquired
4 equipped
ambulance
MOH CEC
No. of motor
boat
ambulances
acquired
0 MOH CEC
No. of
ambulances
Equipped
12refurbished
ambulances
MOH CEC
No. Utility
Vehicles
purchased
0 MOH CEC
No. of
modern
Maternity
wards
constructed
2modern
Maternity
wards
MOH CEC
No. of
Theatres
Block
Constructed
0 MOH CEC
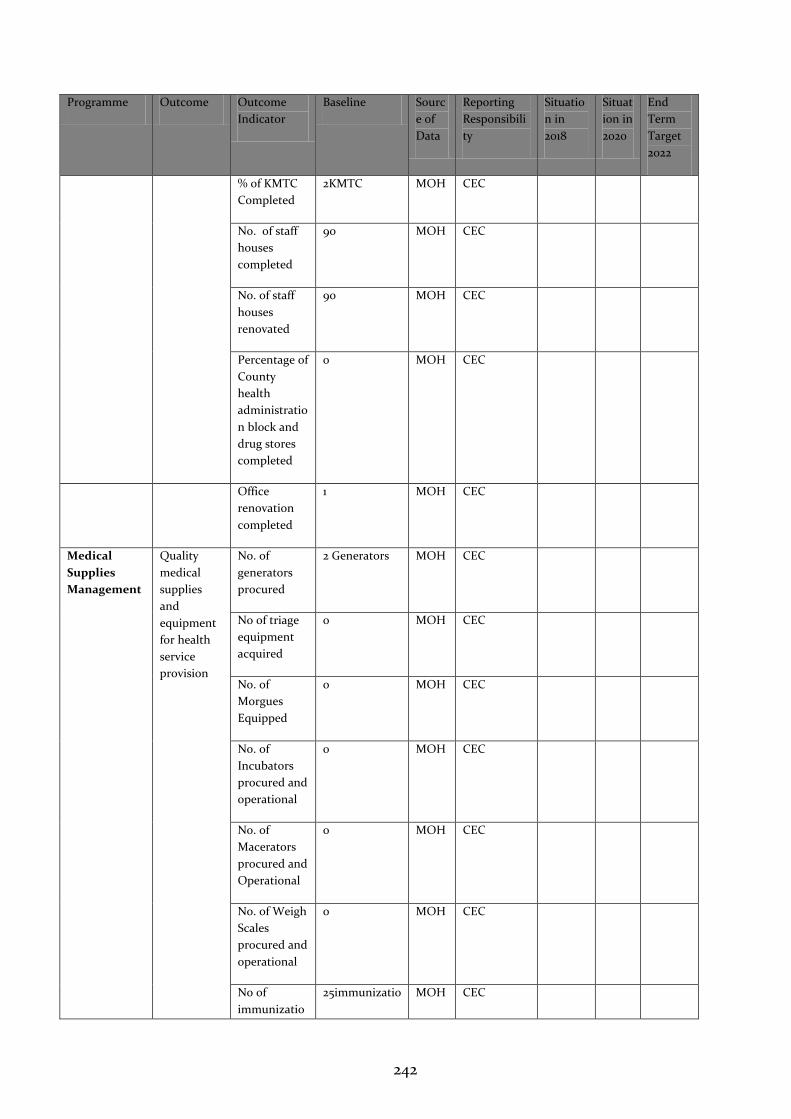
242
Programme Outcome Outcome
Indicator
Baseline Sourc
e of
Data
Reporting
Responsibili
ty
Situatio
n in
2018
Situat
ion in
2020
End
Term
Target
2022
% of KMTC
Completed
2KMTC MOH CEC
No. of staff
houses
completed
90 MOH CEC
No. of staff
houses
renovated
90 MOH CEC
Percentage of
County
health
administratio
n block and
drug stores
completed
0 MOH CEC
Office
renovation
completed
1 MOH CEC
Medical
Supplies
Management
Quality
medical
supplies
and
equipment
for health
service
provision
No. of
generators
procured
2 Generators MOH CEC
No of triage
equipment
acquired
0 MOH CEC
No. of
Morgues
Equipped
0 MOH CEC
No. of
Incubators
procured and
operational
0 MOH CEC
No. of
Macerators
procured and
Operational
0 MOH CEC
No. of Weigh
Scales
procured and
operational
0 MOH CEC
No of
immunizatio
25immunizatio MOH CEC
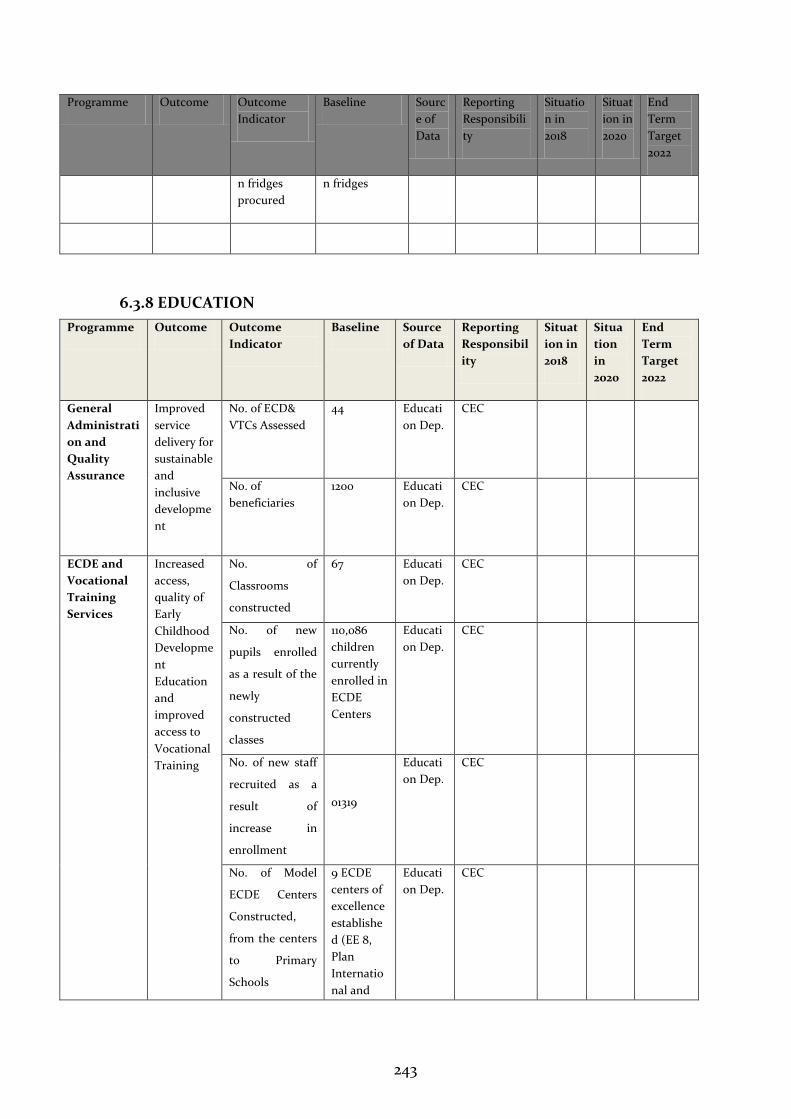
243
Programme Outcome Outcome
Indicator
Baseline Sourc
e of
Data
Reporting
Responsibili
ty
Situatio
n in
2018
Situat
ion in
2020
End
Term
Target
2022
n fridges
procured
n fridges
6.3.8 EDUCATION
Programme Outcome Outcome
Indicator
Baseline Source
of Data
Reporting
Responsibil
ity
Situat
ion in
2018
Situa
tion
in
2020
End
Term
Target
2022
General
Administrati
on and
Quality
Assurance
Improved
service
delivery for
sustainable
and
inclusive
developme
nt
No. of ECD&
VTCs Assessed
44 Educati
on Dep.
CEC
No. of
beneficiaries
1200 Educati
on Dep.
CEC
ECDE and
Vocational
Training
Services
Increased
access,
quality of
Early
Childhood
Developme
nt
Education
and
improved
access to
Vocational
Training
No. of
Classrooms
constructed
67
Educati
on Dep.
CEC
No. of new
pupils enrolled
as a result of the
newly
constructed
classes
110,086
children
currently
enrolled in
ECDE
Centers
Educati
on Dep.
CEC
No. of new staff
recruited as a
result of
increase in
enrollment
01319
Educati
on Dep.
CEC
No. of Model
ECDE Centers
Constructed,
from the centers
to Primary
Schools
9 ECDE
centers of
excellence
establishe
d (EE 8,
Plan
Internatio
nal and
Educati
on Dep.
CEC
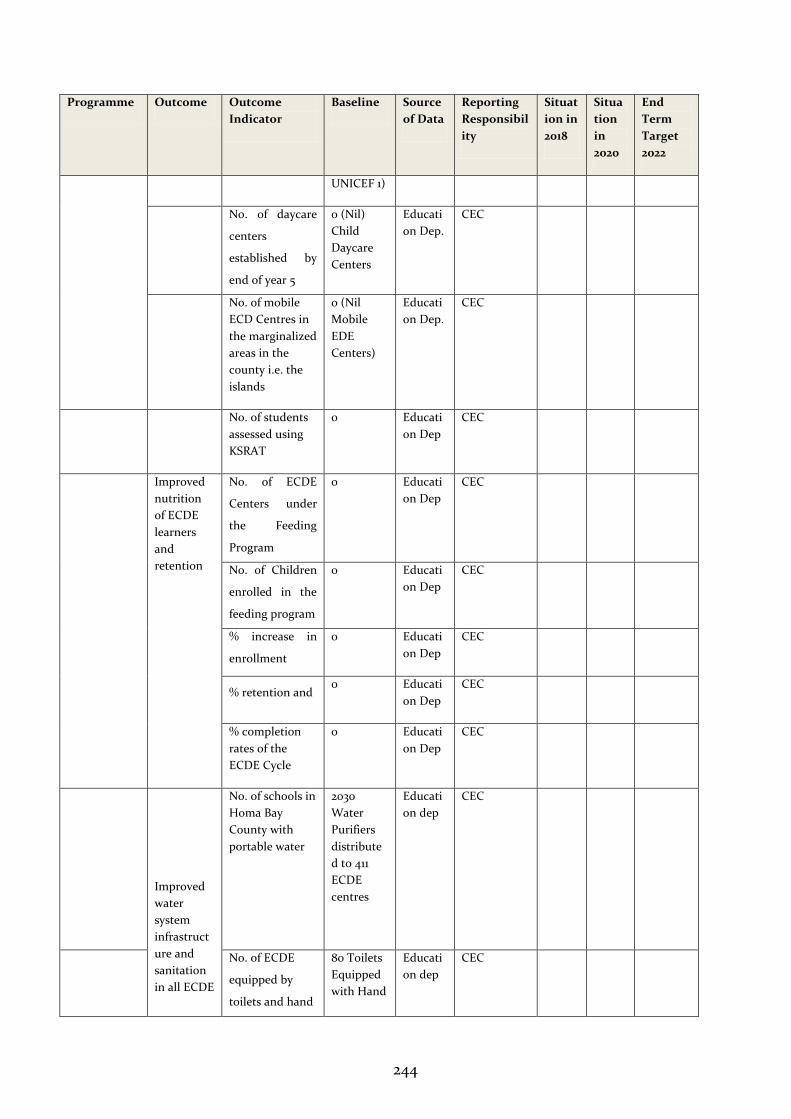
244
Programme Outcome Outcome
Indicator
Baseline Source
of Data
Reporting
Responsibil
ity
Situat
ion in
2018
Situa
tion
in
2020
End
Term
Target
2022
UNICEF 1)
No. of daycare
centers
established by
end of year 5
0 (Nil)
Child
Daycare
Centers
Educati
on Dep.
CEC
No. of mobile
ECD Centres in
the marginalized
areas in the
county i.e. the
islands
0 (Nil
Mobile
EDE
Centers)
Educati
on Dep.
CEC
No. of students
assessed using
KSRAT
0 Educati
on Dep
CEC
Improved
nutrition
of ECDE
learners
and
retention
No. of ECDE
Centers under
the Feeding
Program
0 Educati
on Dep
CEC
No. of Children
enrolled in the
feeding program
0 Educati
on Dep
CEC
% increase in
enrollment
0 Educati
on Dep
CEC
% retention and 0 Educati
on Dep
CEC
% completion
rates of the
ECDE Cycle
0 Educati
on Dep
CEC
Improved
water
system
infrastruct
ure and
sanitation
in all ECDE
No. of schools in
Homa Bay
County with
portable water
2030
Water
Purifiers
distribute
d to 411
ECDE
centres
Educati
on dep
CEC
No. of ECDE
equipped by
toilets and hand
80 Toilets
Equipped
with Hand
Educati
on dep
CEC
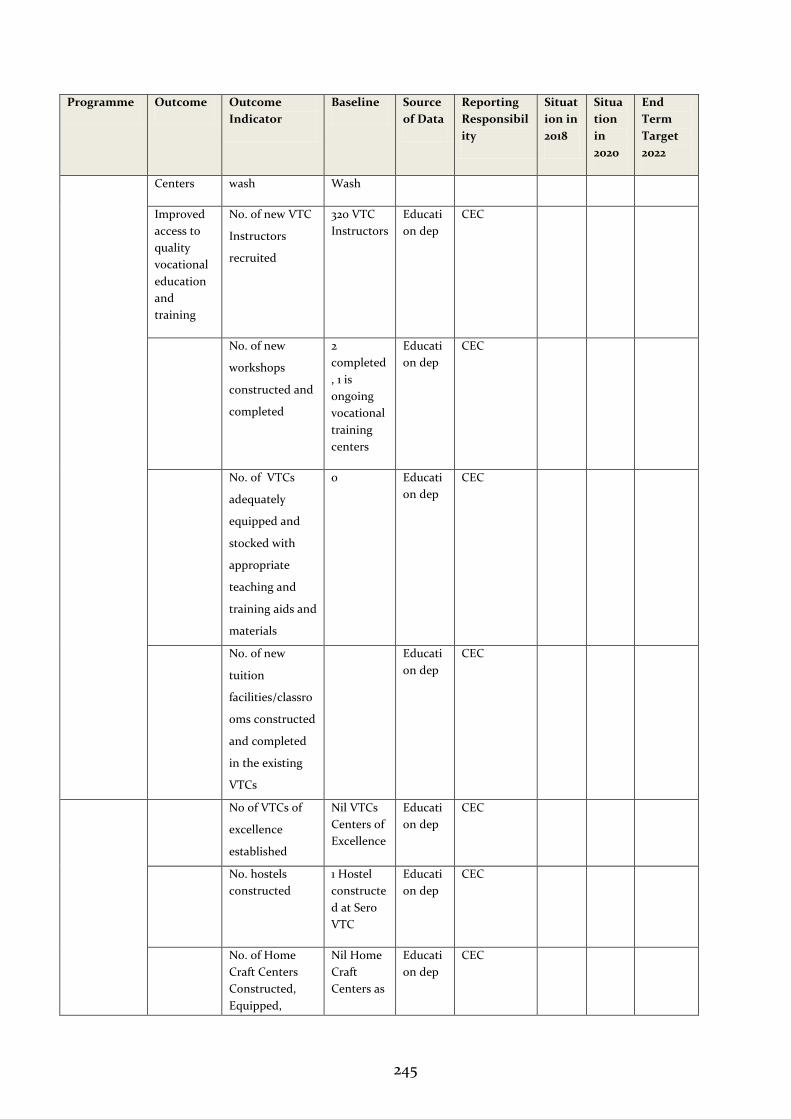
245
Programme Outcome Outcome
Indicator
Baseline Source
of Data
Reporting
Responsibil
ity
Situat
ion in
2018
Situa
tion
in
2020
End
Term
Target
2022
Centers wash Wash
Improved
access to
quality
vocational
education
and
training
No. of new VTC
Instructors
recruited
320 VTC
Instructors
Educati
on dep
CEC
No. of new
workshops
constructed and
completed
2
completed
, 1 is
ongoing
vocational
training
centers
Educati
on dep
CEC
No. of VTCs
adequately
equipped and
stocked with
appropriate
teaching and
training aids and
materials
0 Educati
on dep
CEC
No. of new
tuition
facilities/classro
oms constructed
and completed
in the existing
VTCs
Educati
on dep
CEC
No of VTCs of
excellence
established
Nil VTCs
Centers of
Excellence
Educati
on dep
CEC
No. hostels
constructed
1 Hostel
constructe
d at Sero
VTC
Educati
on dep
CEC
No. of Home
Craft Centers
Constructed,
Equipped,
Nil Home
Craft
Centers as
Educati
on dep
CEC
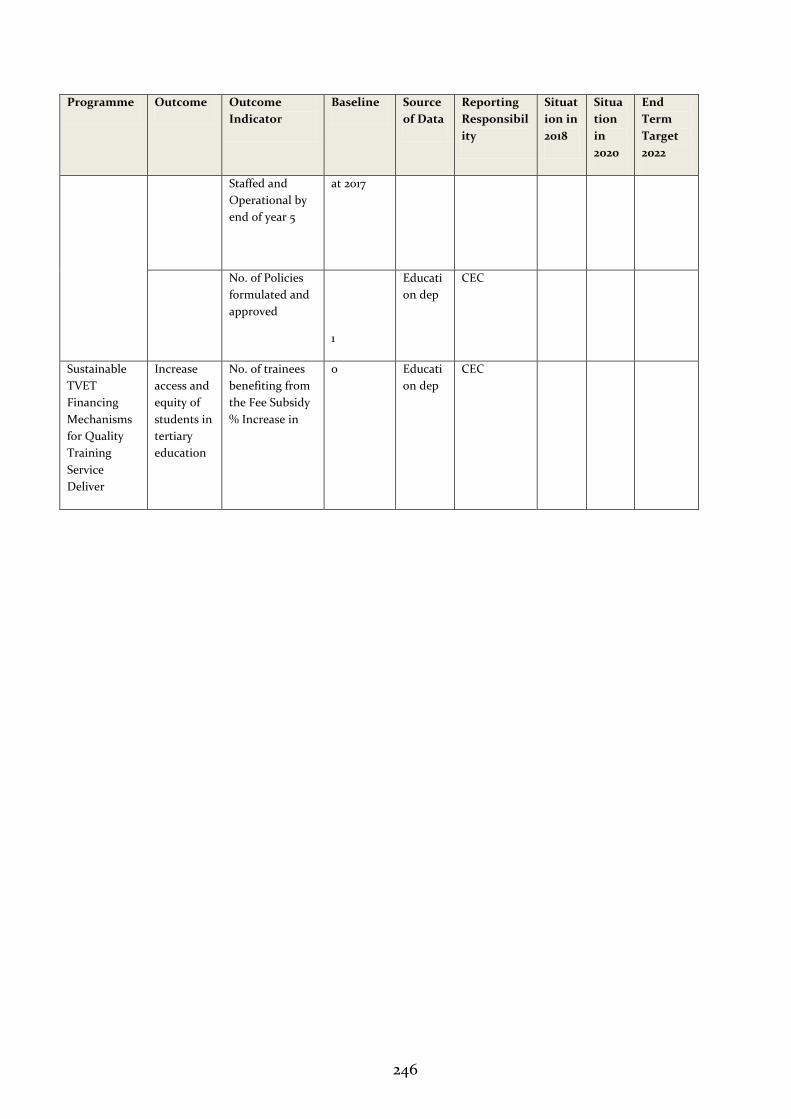
246
Programme Outcome Outcome
Indicator
Baseline Source
of Data
Reporting
Responsibil
ity
Situat
ion in
2018
Situa
tion
in
2020
End
Term
Target
2022
Staffed and
Operational by
end of year 5
at 2017
No. of Policies
formulated and
approved
1
Educati
on dep
CEC
Sustainable
TVET
Financing
Mechanisms
for Quality
Training
Service
Deliver
Increase
access and
equity of
students in
tertiary
education
No. of trainees
benefiting from
the Fee Subsidy
% Increase in
0 Educati
on dep
CEC
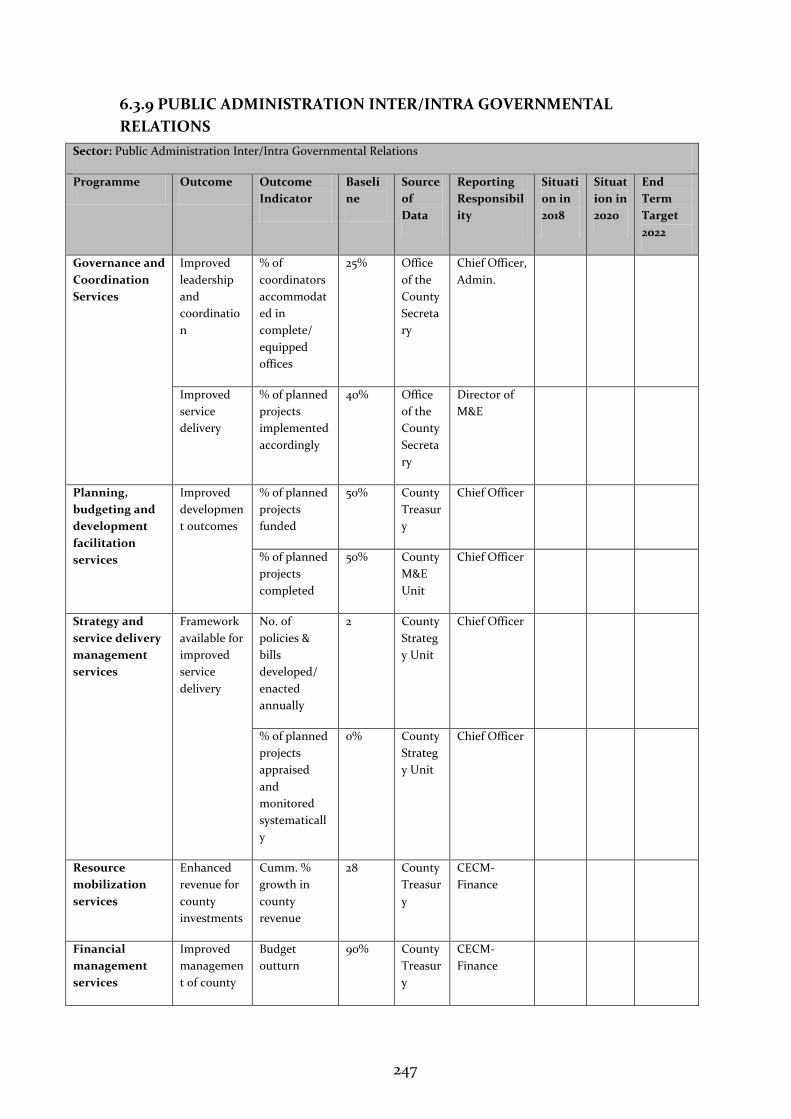
247
6.3.9 PUBLIC ADMINISTRATION INTER/INTRA GOVERNMENTAL
RELATIONS
Sector: Public Administration Inter/Intra Governmental Relations
Programme Outcome Outcome
Indicator
Baseli
ne
Source
of
Data
Reporting
Responsibil
ity
Situati
on in
2018
Situat
ion in
2020
End
Term
Target
2022
Governance and
Coordination
Services
Improved
leadership
and
coordinatio
n
% of
coordinators
accommodat
ed in
complete/
equipped
offices
25% Office
of the
County
Secreta
ry
Chief Officer,
Admin.
Improved
service
delivery
% of planned
projects
implemented
accordingly
40% Office
of the
County
Secreta
ry
Director of
M&E
Planning,
budgeting and
development
facilitation
services
Improved
developmen
t outcomes
% of planned
projects
funded
50% County
Treasur
y
Chief Officer
% of planned
projects
completed
50% County
M&E
Unit
Chief Officer
Strategy and
service delivery
management
services
Framework
available for
improved
service
delivery
No. of
policies &
bills
developed/
enacted
annually
2 County
Strateg
y Unit
Chief Officer
% of planned
projects
appraised
and
monitored
systematicall
y
0% County
Strateg
y Unit
Chief Officer
Resource
mobilization
services
Enhanced
revenue for
county
investments
Cumm. %
growth in
county
revenue
28 County
Treasur
y
CECM-
Finance
Financial
management
services
Improved
managemen
t of county
Budget
outturn
90% County
Treasur
y
CECM-
Finance
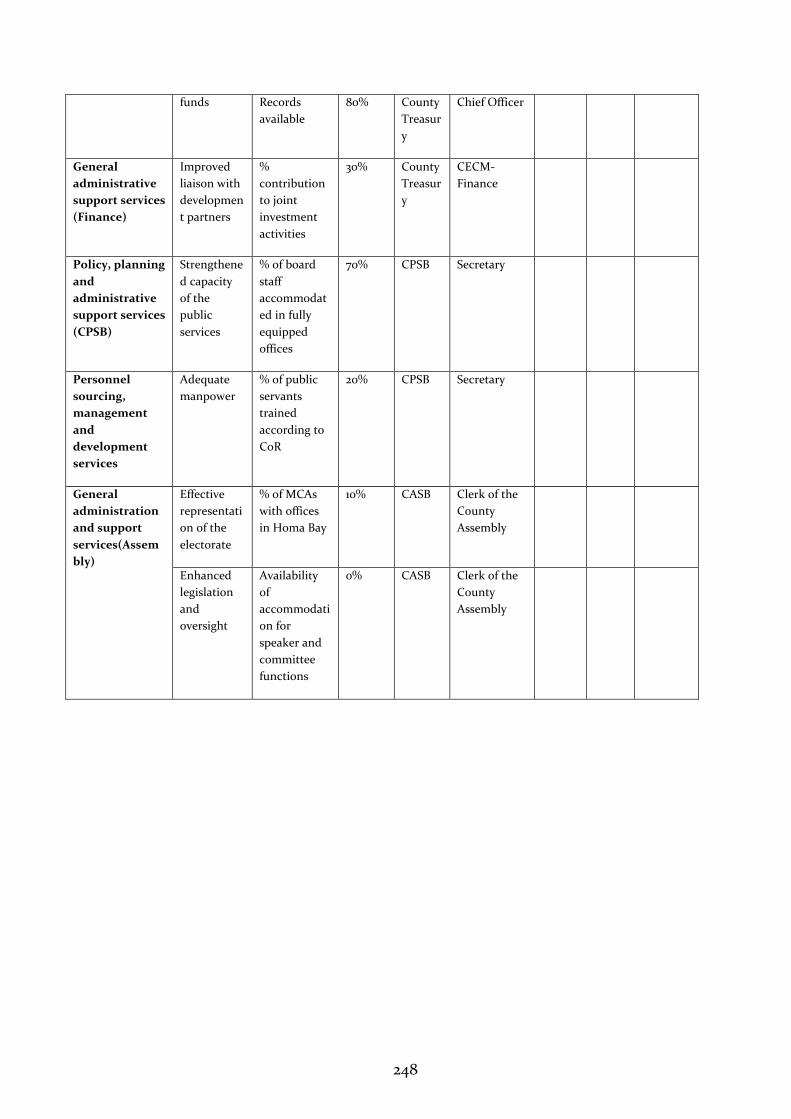
248
funds Records
available
80% County
Treasur
y
Chief Officer
General
administrative
support services
(Finance)
Improved
liaison with
developmen
t partners
%
contribution
to joint
investment
activities
30% County
Treasur
y
CECM-
Finance
Policy, planning
and
administrative
support services
(CPSB)
Strengthene
d capacity
of the
public
services
% of board
staff
accommodat
ed in fully
equipped
offices
70% CPSB Secretary
Personnel
sourcing,
management
and
development
services
Adequate
manpower
% of public
servants
trained
according to
CoR
20% CPSB Secretary
General
administration
and support
services(Assem
bly)
Effective
representati
on of the
electorate
% of MCAs
with offices
in Homa Bay
10% CASB Clerk of the
County
Assembly
Enhanced
legislation
and
oversight
Availability
of
accommodati
on for
speaker and
committee
functions
0% CASB Clerk of the
County
Assembly
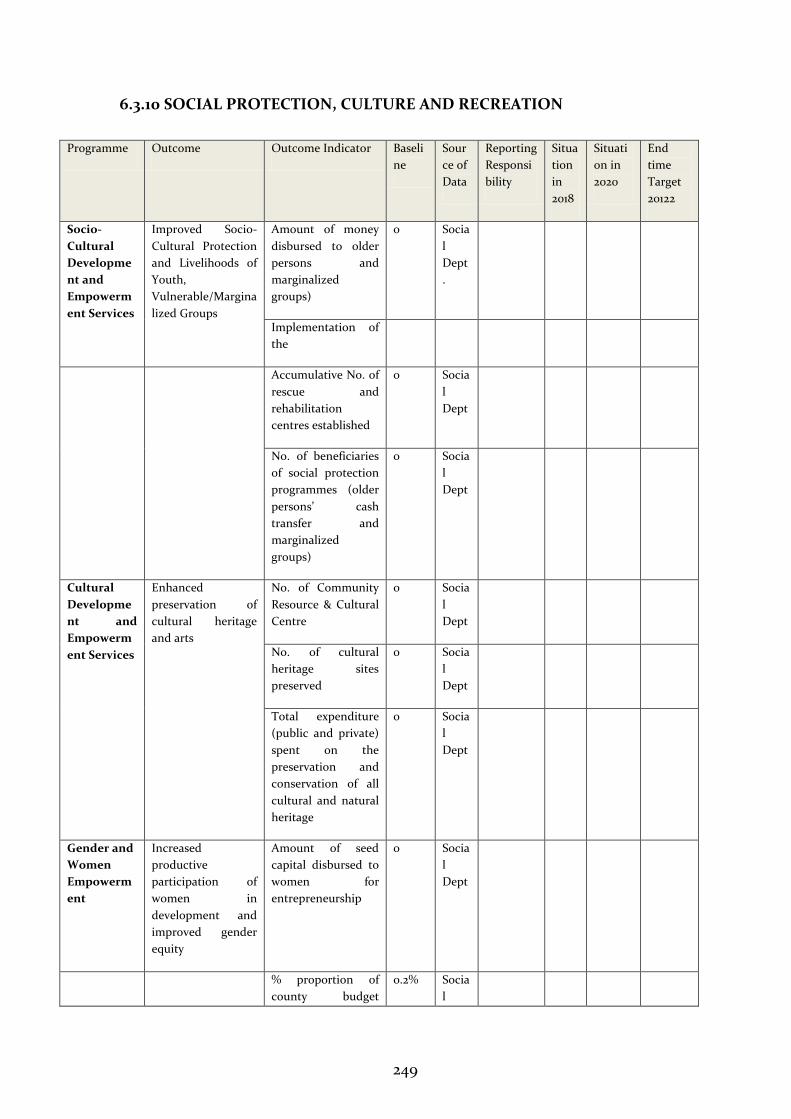
249
6.3.10 SOCIAL PROTECTION, CULTURE AND RECREATION
Programme Outcome Outcome Indicator Baseli
ne
Sour
ce of
Data
Reporting
Responsi
bility
Situa
tion
in
2018
Situati
on in
2020
End
time
Target
20122
Socio-
Cultural
Developme
nt and
Empowerm
ent Services
Improved Socio-
Cultural Protection
and Livelihoods of
Youth,
Vulnerable/Margina
lized Groups
Amount of money
disbursed to older
persons and
marginalized
groups)
0 Socia
l
Dept
.
Implementation of
the
Accumulative No. of
rescue and
rehabilitation
centres established
0 Socia
l
Dept
No. of beneficiaries
of social protection
programmes (older
persons’ cash
transfer and
marginalized
groups)
0 Socia
l
Dept
Cultural
Developme
nt and
Empowerm
ent Services
Enhanced
preservation of
cultural heritage
and arts
No. of Community
Resource & Cultural
Centre
0 Socia
l
Dept
No. of cultural
heritage sites
preserved
0 Socia
l
Dept
Total expenditure
(public and private)
spent on the
preservation and
conservation of all
cultural and natural
heritage
0 Socia
l
Dept
Gender and
Women
Empowerm
ent
Increased
productive
participation of
women in
development and
improved gender
equity
Amount of seed
capital disbursed to
women for
entrepreneurship
0 Socia
l
Dept
% proportion of
county budget
0.2% Socia
l
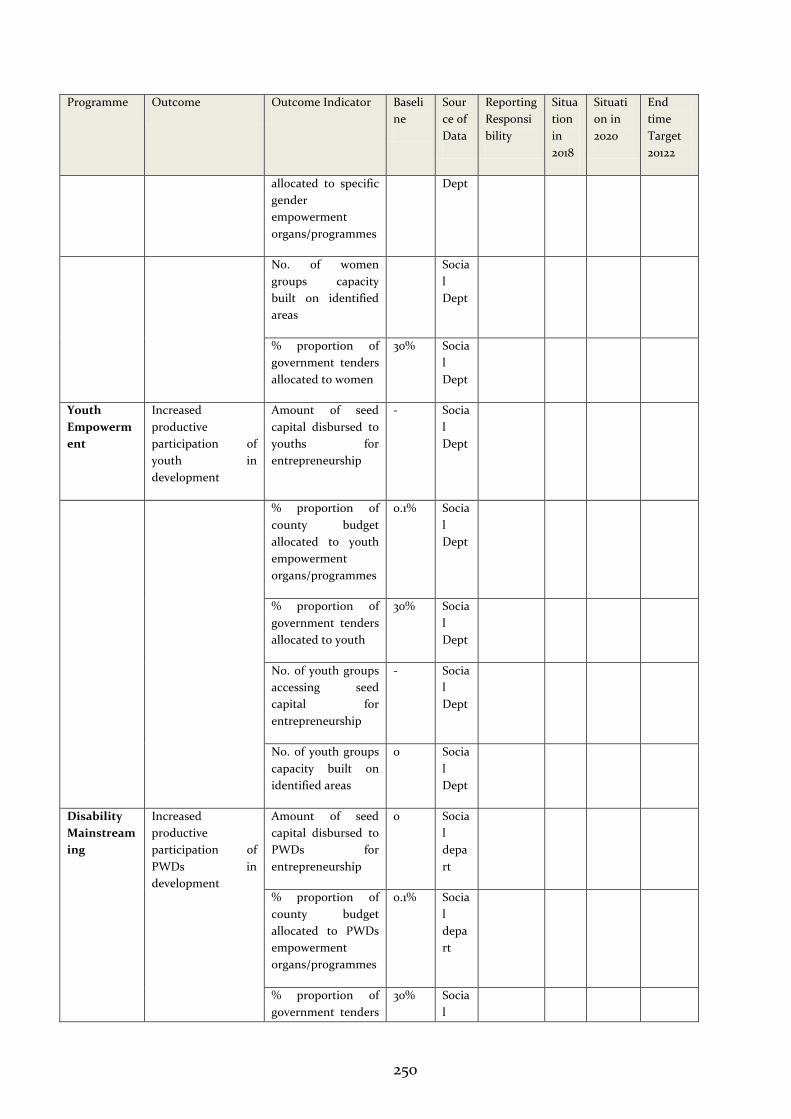
250
Programme Outcome Outcome Indicator Baseli
ne
Sour
ce of
Data
Reporting
Responsi
bility
Situa
tion
in
2018
Situati
on in
2020
End
time
Target
20122
allocated to specific
gender
empowerment
organs/programmes
Dept
No. of women
groups capacity
built on identified
areas
Socia
l
Dept
% proportion of
government tenders
allocated to women
30% Socia
l
Dept
Youth
Empowerm
ent
Increased
productive
participation of
youth in
development
Amount of seed
capital disbursed to
youths for
entrepreneurship
- Socia
l
Dept
% proportion of
county budget
allocated to youth
empowerment
organs/programmes
0.1% Socia
l
Dept
% proportion of
government tenders
allocated to youth
30% Socia
l
Dept
No. of youth groups
accessing seed
capital for
entrepreneurship
- Socia
l
Dept
No. of youth groups
capacity built on
identified areas
0 Socia
l
Dept
Disability
Mainstream
ing
Increased
productive
participation of
PWDs in
development
Amount of seed
capital disbursed to
PWDs for
entrepreneurship
0 Socia
l
depa
rt
% proportion of
county budget
allocated to PWDs
empowerment
organs/programmes
0.1% Socia
l
depa
rt
% proportion of
government tenders
30% Socia
l
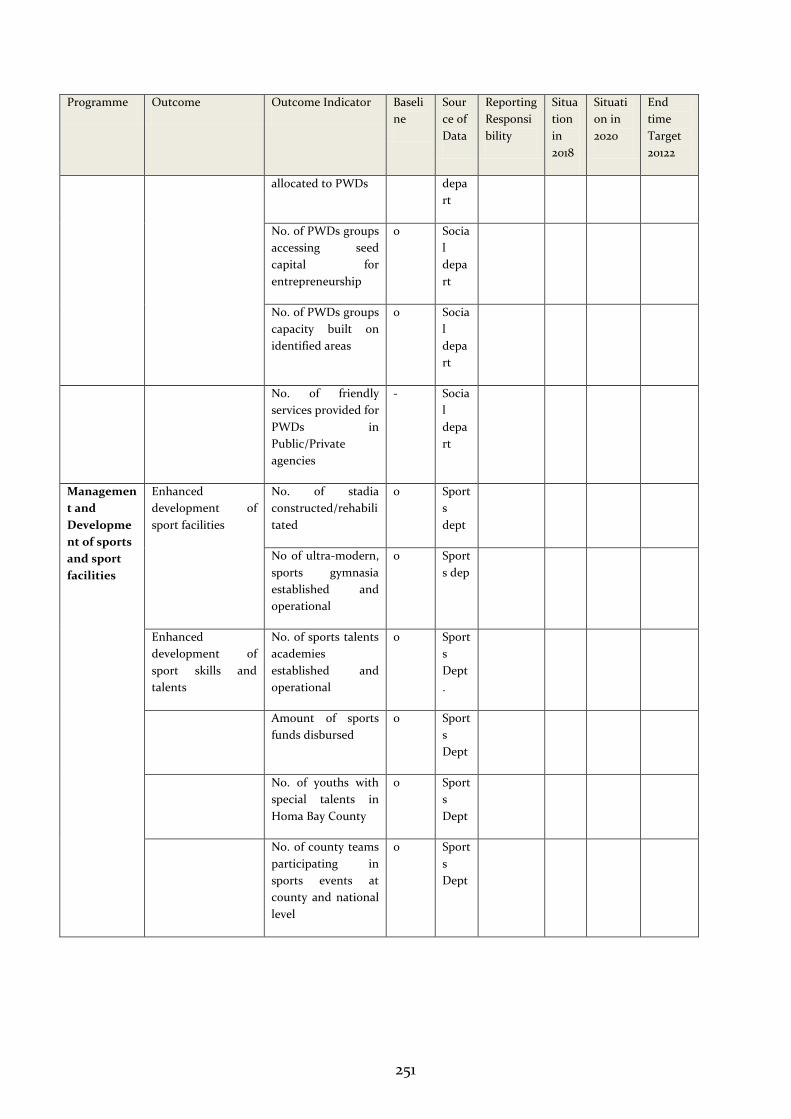
251
Programme Outcome Outcome Indicator Baseli
ne
Sour
ce of
Data
Reporting
Responsi
bility
Situa
tion
in
2018
Situati
on in
2020
End
time
Target
20122
allocated to PWDs depa
rt
No. of PWDs groups
accessing seed
capital for
entrepreneurship
0 Socia
l
depa
rt
No. of PWDs groups
capacity built on
identified areas
0 Socia
l
depa
rt
No. of friendly
services provided for
PWDs in
Public/Private
agencies
- Socia
l
depa
rt
Managemen
t and
Developme
nt of sports
and sport
facilities
Enhanced
development of
sport facilities
No. of stadia
constructed/rehabili
tated
0 Sport
s
dept
No of ultra-modern,
sports gymnasia
established and
operational
0 Sport
s dep
Enhanced
development of
sport skills and
talents
No. of sports talents
academies
established and
operational
0 Sport
s
Dept
.
Amount of sports
funds disbursed
0 Sport
s
Dept
No. of youths with
special talents in
Homa Bay County
0 Sport
s
Dept
No. of county teams
participating in
sports events at
county and national
level
0 Sport
s
Dept

252
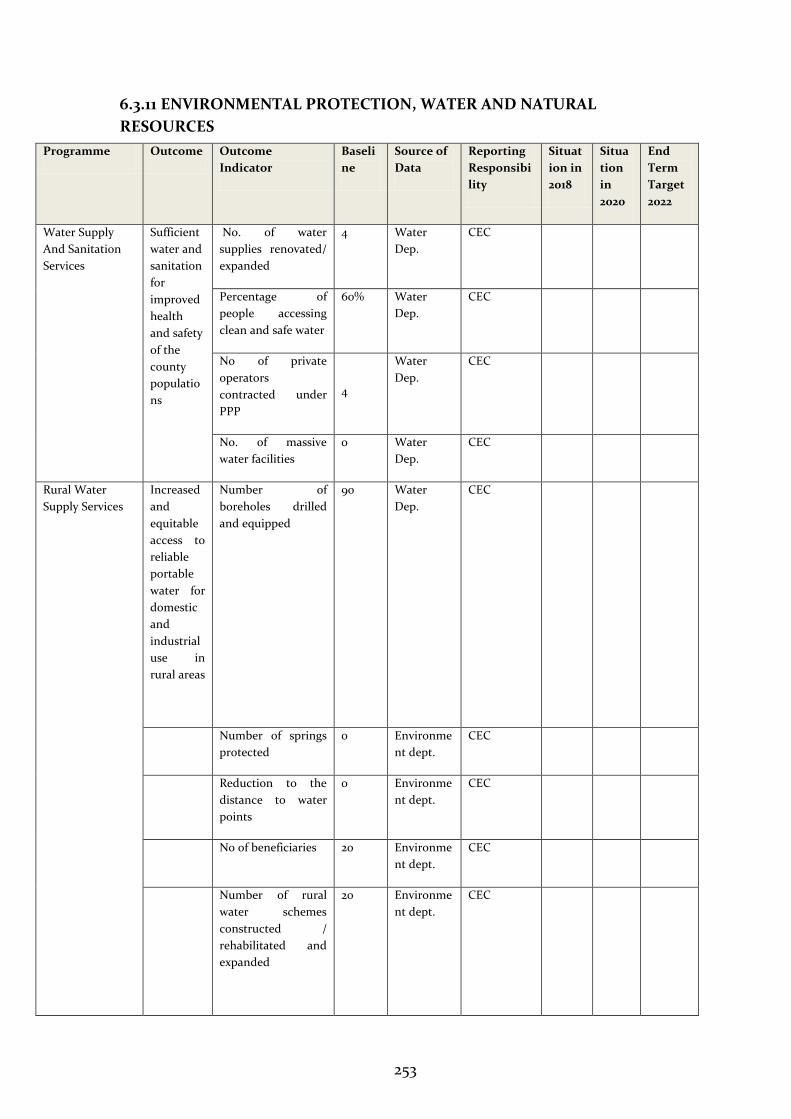
253
6.3.11 ENVIRONMENTAL PROTECTION, WATER AND NATURAL
RESOURCES
Programme Outcome Outcome
Indicator
Baseli
ne
Source of
Data
Reporting
Responsibi
lity
Situat
ion in
2018
Situa
tion
in
2020
End
Term
Target
2022
Water Supply
And Sanitation
Services
Sufficient
water and
sanitation
for
improved
health
and safety
of the
county
populatio
ns
No. of water
supplies renovated/
expanded
4 Water
Dep.
CEC
Percentage of
people accessing
clean and safe water
60% Water
Dep.
CEC
No of private
operators
contracted under
PPP
4
Water
Dep.
CEC
No. of massive
water facilities
0 Water
Dep.
CEC
Rural Water
Supply Services
Increased
and
equitable
access to
reliable
portable
water for
domestic
and
industrial
use in
rural areas
Number of
boreholes drilled
and equipped
90 Water
Dep.
CEC
Number of springs
protected
0 Environme
nt dept.
CEC
Reduction to the
distance to water
points
0 Environme
nt dept.
CEC
No of beneficiaries 20 Environme
nt dept.
CEC
Number of rural
water schemes
constructed /
rehabilitated and
expanded
20 Environme
nt dept.
CEC
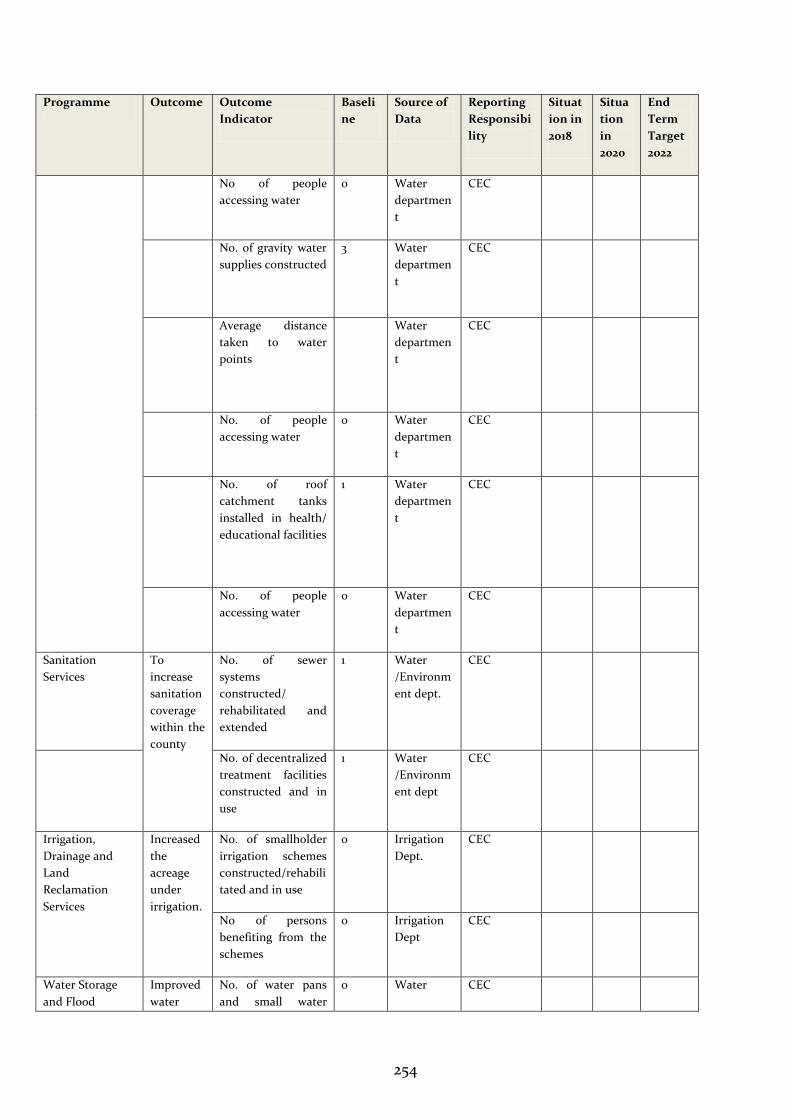
254
Programme Outcome Outcome
Indicator
Baseli
ne
Source of
Data
Reporting
Responsibi
lity
Situat
ion in
2018
Situa
tion
in
2020
End
Term
Target
2022
No of people
accessing water
0 Water
departmen
t
CEC
No. of gravity water
supplies constructed
3 Water
departmen
t
CEC
Average distance
taken to water
points
Water
departmen
t
CEC
No. of people
accessing water
0 Water
departmen
t
CEC
No. of roof
catchment tanks
installed in health/
educational facilities
1 Water
departmen
t
CEC
No. of people
accessing water
0 Water
departmen
t
CEC
Sanitation
Services
To
increase
sanitation
coverage
within the
county
No. of sewer
systems
constructed/
rehabilitated and
extended
1 Water
/Environm
ent dept.
CEC
No. of decentralized
treatment facilities
constructed and in
use
1 Water
/Environm
ent dept
CEC
Irrigation,
Drainage and
Land
Reclamation
Services
Increased
the
acreage
under
irrigation.
No. of smallholder
irrigation schemes
constructed/rehabili
tated and in use
0 Irrigation
Dept.
CEC
No of persons
benefiting from the
schemes
0 Irrigation
Dept
CEC
Water Storage
and Flood
Improved
water
No. of water pans
and small water
0 Water CEC
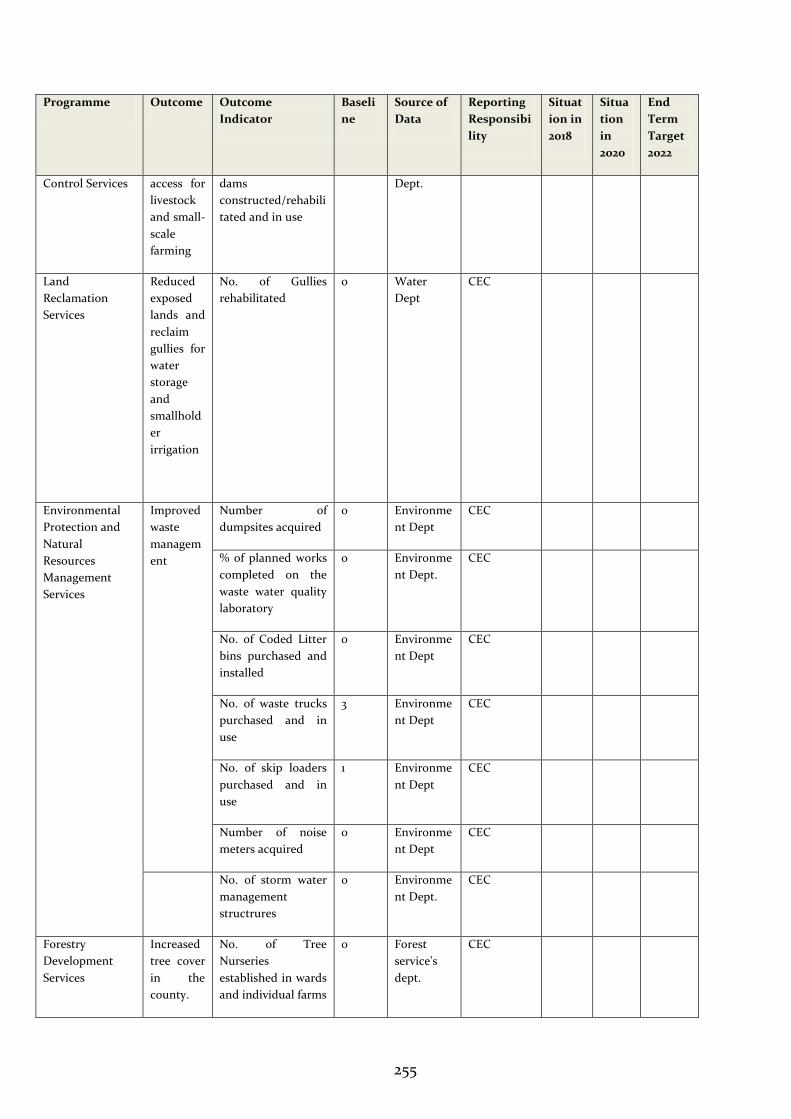
255
Programme Outcome Outcome
Indicator
Baseli
ne
Source of
Data
Reporting
Responsibi
lity
Situat
ion in
2018
Situa
tion
in
2020
End
Term
Target
2022
Control Services access for
livestock
and small-
scale
farming
dams
constructed/rehabili
tated and in use
Dept.
Land
Reclamation
Services
Reduced
exposed
lands and
reclaim
gullies for
water
storage
and
smallhold
er
irrigation
No. of Gullies
rehabilitated
0 Water
Dept
CEC
Environmental
Protection and
Natural
Resources
Management
Services
Improved
waste
managem
ent
Number of
dumpsites acquired
0 Environme
nt Dept
CEC
% of planned works
completed on the
waste water quality
laboratory
0 Environme
nt Dept.
CEC
No. of Coded Litter
bins purchased and
installed
0 Environme
nt Dept
CEC
No. of waste trucks
purchased and in
use
3 Environme
nt Dept
CEC
No. of skip loaders
purchased and in
use
1 Environme
nt Dept
CEC
Number of noise
meters acquired
0 Environme
nt Dept
CEC
No. of storm water
management
structrures
0 Environme
nt Dept.
CEC
Forestry
Development
Services
Increased
tree cover
in the
county.
No. of Tree
Nurseries
established in wards
and individual farms
0 Forest
service's
dept.
CEC
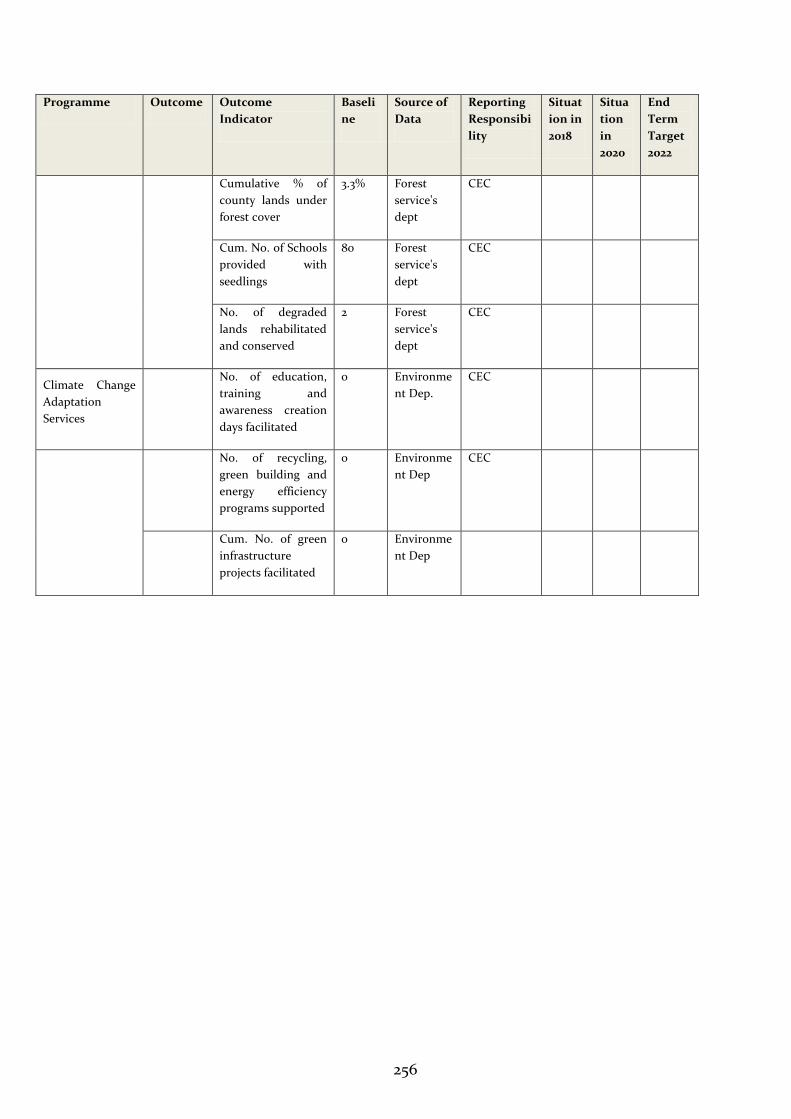
256
Programme Outcome Outcome
Indicator
Baseli
ne
Source of
Data
Reporting
Responsibi
lity
Situat
ion in
2018
Situa
tion
in
2020
End
Term
Target
2022
Cumulative % of
county lands under
forest cover
3.3%
Forest
service's
dept
CEC
Cum. No. of Schools
provided with
seedlings
80
Forest
service's
dept
CEC
No. of degraded
lands rehabilitated
and conserved
2 Forest
service's
dept
CEC
Climate Change
Adaptation
Services
No. of education,
training and
awareness creation
days facilitated
0 Environme
nt Dep.
CEC
No. of recycling,
green building and
energy efficiency
programs supported
0 Environme
nt Dep
CEC
Cum. No. of green
infrastructure
projects facilitated
0 Environme
nt Dep
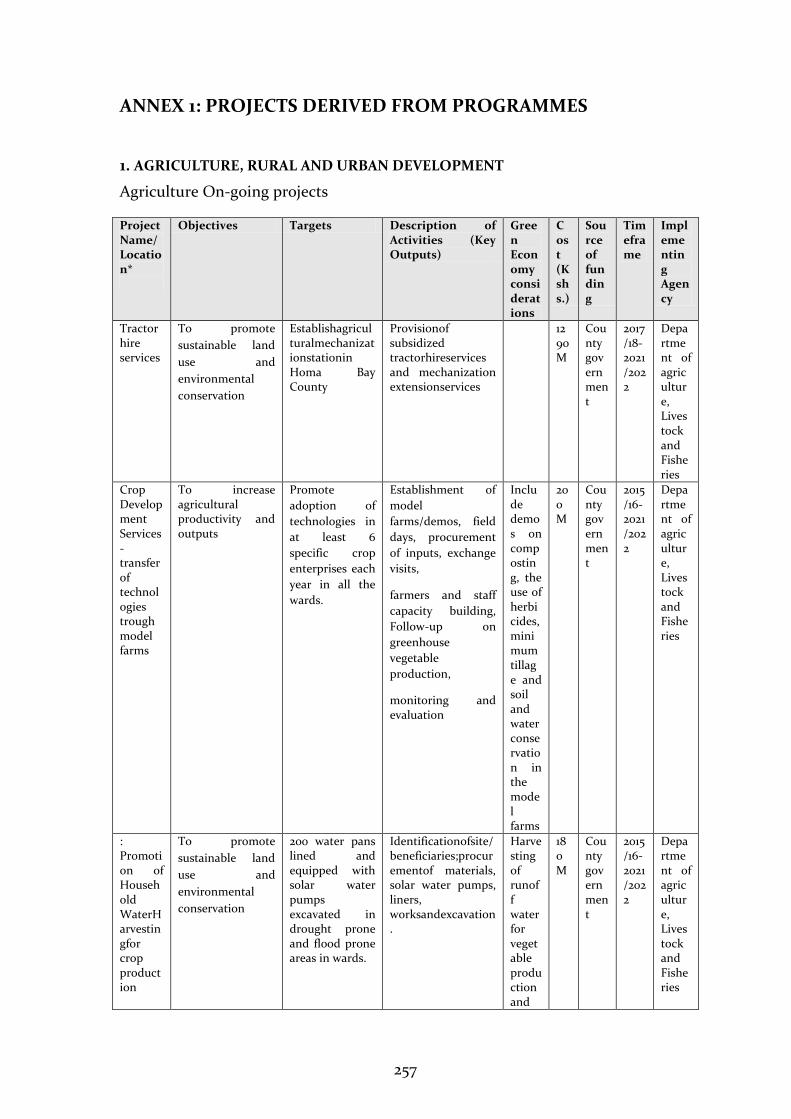
257
ANNEX 1: PROJECTS DERIVED FROM PROGRAMMES
1. AGRICULTURE, RURAL AND URBAN DEVELOPMENT
Agriculture On-going projects
Project Name/ Location*
Objectives Targets Description of Activities (Key Outputs)
Green Economy considerations
Cost (Kshs.)
Source of funding
Timeframe
Implementing Agency
Tractor hire services
To promote
sustainable land
use and
environmental
conservation
Establishagriculturalmechanizationstationin Homa Bay County
Provisionof subsidized tractorhireservices and mechanization extensionservices
1290M
County government
2017/18-2021/2022
Department of agriculture, Livestock and Fisheries
Crop Development Services-transfer of technologies trough model farms
To increase agricultural productivity and outputs
Promote
adoption of
technologies in
at least 6
specific crop
enterprises each
year in all the
wards.
Establishment of
model
farms/demos, field
days, procurement
of inputs, exchange
visits,
farmers and staff
capacity building,
Follow-up on
greenhouse
vegetable
production,
monitoring and evaluation
Include demos on composting, the use of herbicides, minimum tillage and soil and water conservation in the model farms
200M
County government
2015/16-2021/2022
Department of agriculture, Livestock and Fisheries
: Promotion of Household WaterHarvestingfor crop production
To promote
sustainable land
use and
environmental
conservation
200 water pans lined and equipped with solar water pumps excavated in drought prone and flood prone areas in wards.
Identificationofsite/beneficiaries;procurementof materials, solar water pumps, liners, worksandexcavation.
Harvesting of runoff water for vegetable production and
180M
County government
2015/16-2021/2022
Department of agriculture, Livestock and Fisheries
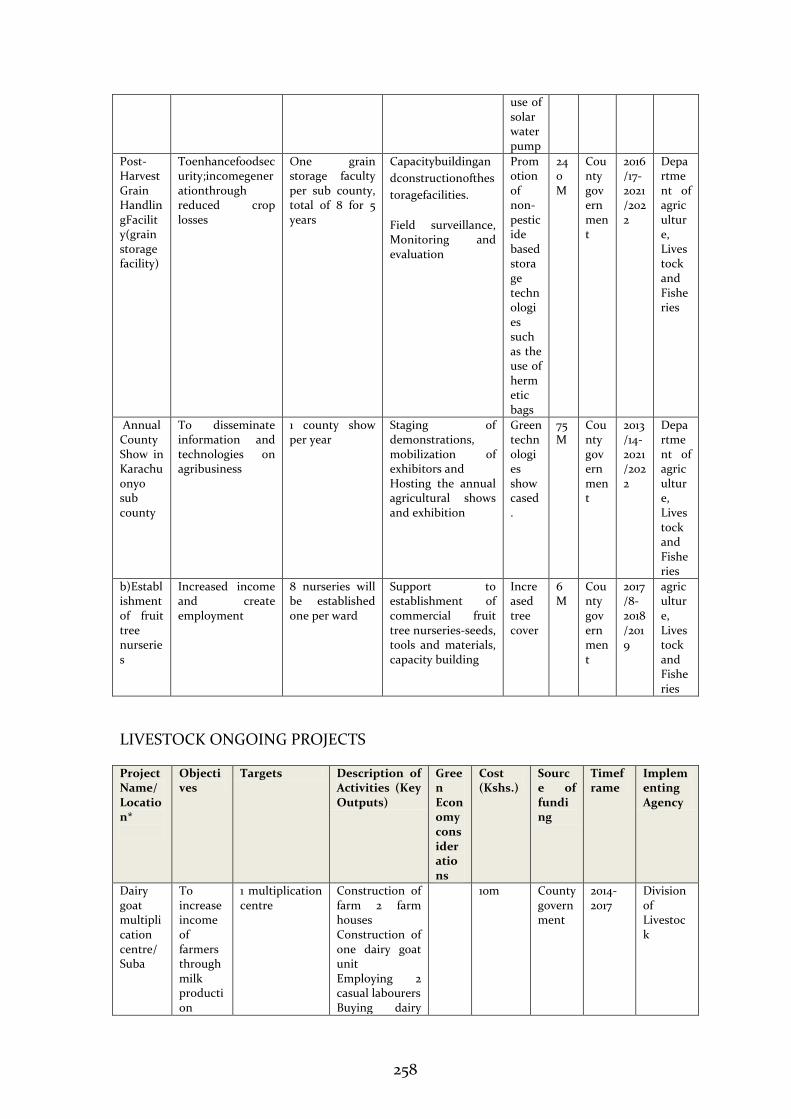
258
use of solar water pump
Post-Harvest Grain HandlingFacility(grain storage facility)
Toenhancefoodsecurity;incomegenerationthrough reduced crop losses
One grain storage faculty per sub county, total of 8 for 5 years
Capacitybuildingan
dconstructionofthes
toragefacilities.
Field surveillance, Monitoring and evaluation
Promotion of non-pesticide based storage technologies such as the use of hermetic bags
240M
County government
2016/17-2021/2022
Department of agriculture, Livestock and Fisheries
Annual County Show in Karachuonyo sub county
To disseminate information and technologies on agribusiness
1 county show per year
Staging of demonstrations, mobilization of exhibitors and Hosting the annual agricultural shows and exhibition
Green technologies showcased.
75M
County government
2013/14-2021/2022
Department of agriculture, Livestock and Fisheries
b)Establishment of fruit tree nurseries
Increased income and create employment
8 nurseries will be established one per ward
Support to establishment of commercial fruit tree nurseries-seeds, tools and materials, capacity building
Increased tree cover
6M
County government
2017/8-2018/2019
agriculture, Livestock and Fisheries
LIVESTOCK ONGOING PROJECTS
Project Name/ Location*
Objectives
Targets Description of Activities (Key Outputs)
Green Economy considerations
Cost (Kshs.)
Source of funding
Timeframe
Implementing Agency
Dairy goat multiplication centre/ Suba
To increase income of farmers through milk production
1 multiplication centre
Construction of farm 2 farm houses Construction of one dairy goat unit Employing 2 casual labourers Buying dairy
10m County government
2014-2017
Division of Livestock
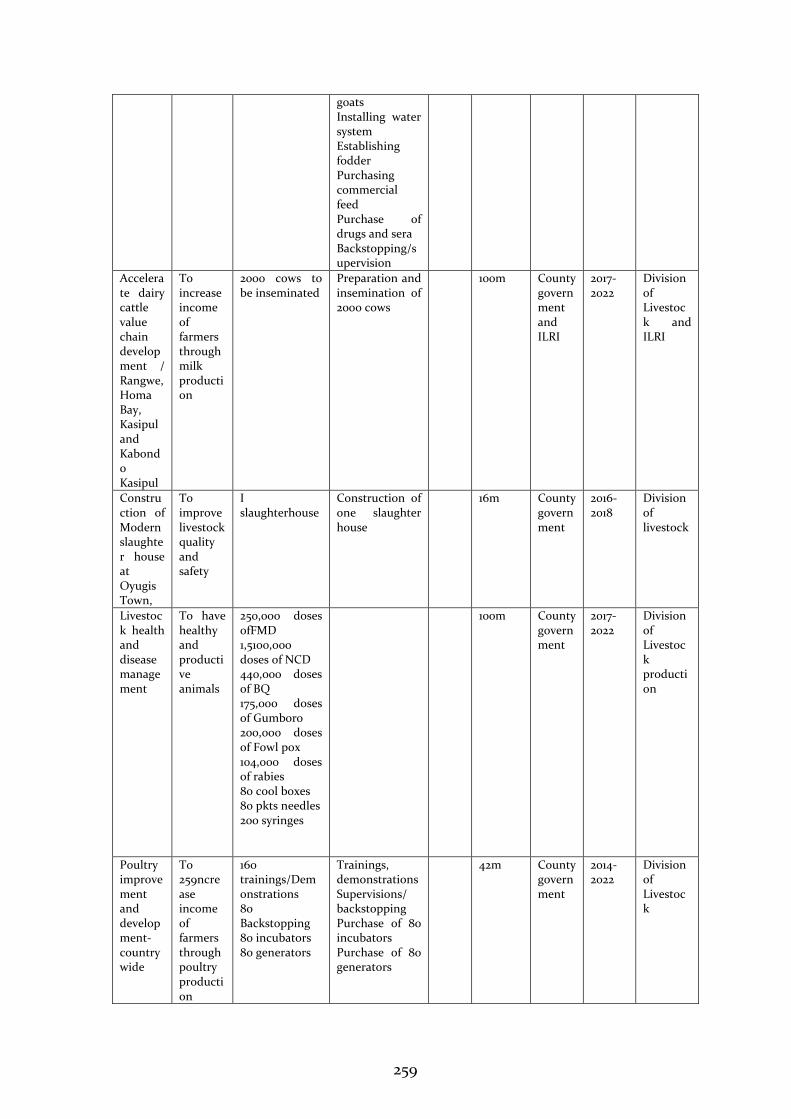
259
goats Installing water system Establishing fodder Purchasing commercial feed Purchase of drugs and sera Backstopping/supervision
Accelerate dairy cattle value chain development / Rangwe, Homa Bay, Kasipul and Kabondo Kasipul
To increase income of farmers through milk production
2000 cows to be inseminated
Preparation and insemination of 2000 cows
100m County government and ILRI
2017-2022
Division of Livestock and ILRI
Construction of Modern slaughter house at Oyugis Town,
To improve livestock quality and safety
I slaughterhouse
Construction of one slaughter house
16m County government
2016-2018
Division of livestock
Livestock health and disease management
To have healthy and productive animals
250,000 doses ofFMD 1,5100,000 doses of NCD 440,000 doses of BQ 175,000 doses of Gumboro 200,000 doses of Fowl pox 104,000 doses of rabies 80 cool boxes 80 pkts needles 200 syringes
100m County government
2017- 2022
Division of Livestock production
Poultry improvement and development- countrywide
To 259ncrease income of farmers through poultry production
160 trainings/Demonstrations 80 Backstopping 80 incubators 80 generators
Trainings, demonstrations Supervisions/ backstopping Purchase of 80 incubators Purchase of 80 generators
42m County government
2014-2022
Division of Livestock
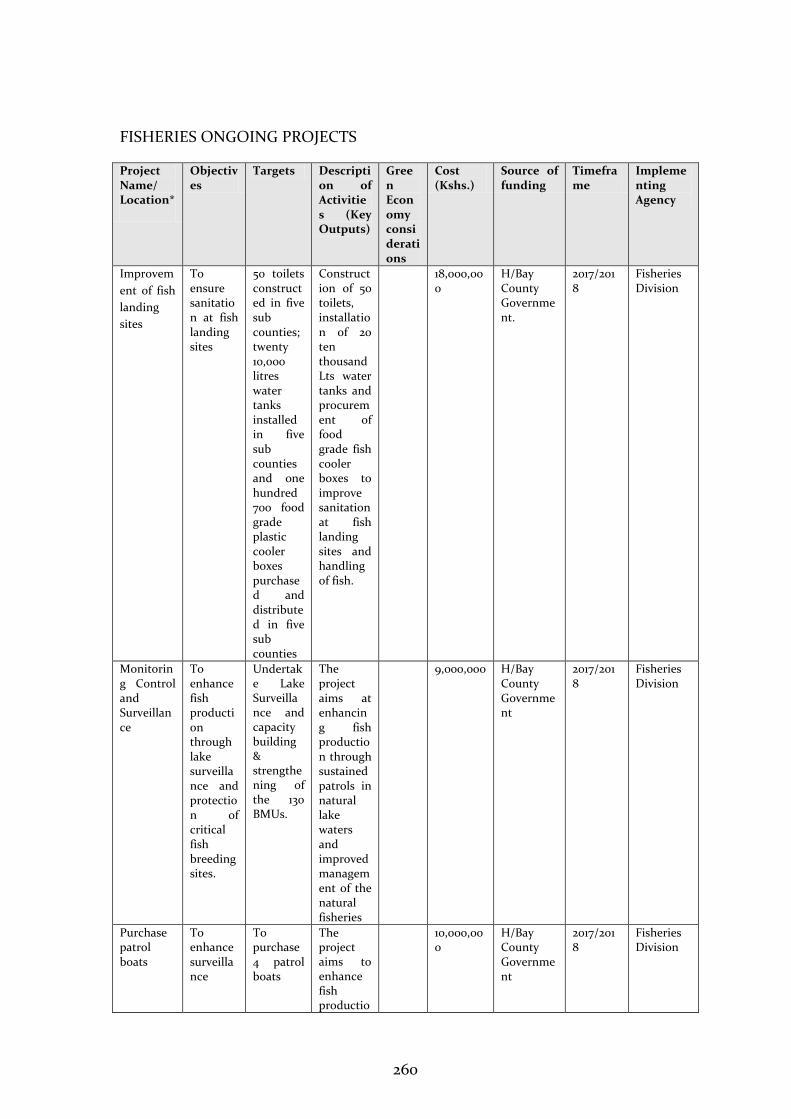
260
FISHERIES ONGOING PROJECTS
Project Name/ Location*
Objectives
Targets Description of Activities (Key Outputs)
Green Economy considerations
Cost (Kshs.)
Source of funding
Timeframe
Implementing Agency
Improvem
ent of fish
landing
sites
To ensure sanitation at fish landing sites
50 toilets constructed in five sub counties; twenty 10,000 litres water tanks installed in five sub counties and one hundred 700 food grade plastic cooler boxes purchased and distributed in five sub counties
Construction of 50 toilets, installation of 20 ten thousand Lts water tanks and procurement of food grade fish cooler boxes to improve sanitation at fish landing sites and handling of fish.
18,000,000
H/Bay County Government.
2017/2018
Fisheries Division
Monitoring Control and Surveillance
To enhance fish production through lake surveillance and protection of critical fish breeding sites.
Undertake Lake Surveillance and capacity building & strengthening of the 130 BMUs.
The project aims at enhancing fish production through sustained patrols in natural lake waters and improved management of the natural fisheries
9,000,000 H/Bay County Government
2017/2018
Fisheries Division
Purchase patrol boats
To enhance surveillance
To purchase 4 patrol boats
The project aims to enhance fish productio
10,000,000
H/Bay County Government
2017/2018
Fisheries Division
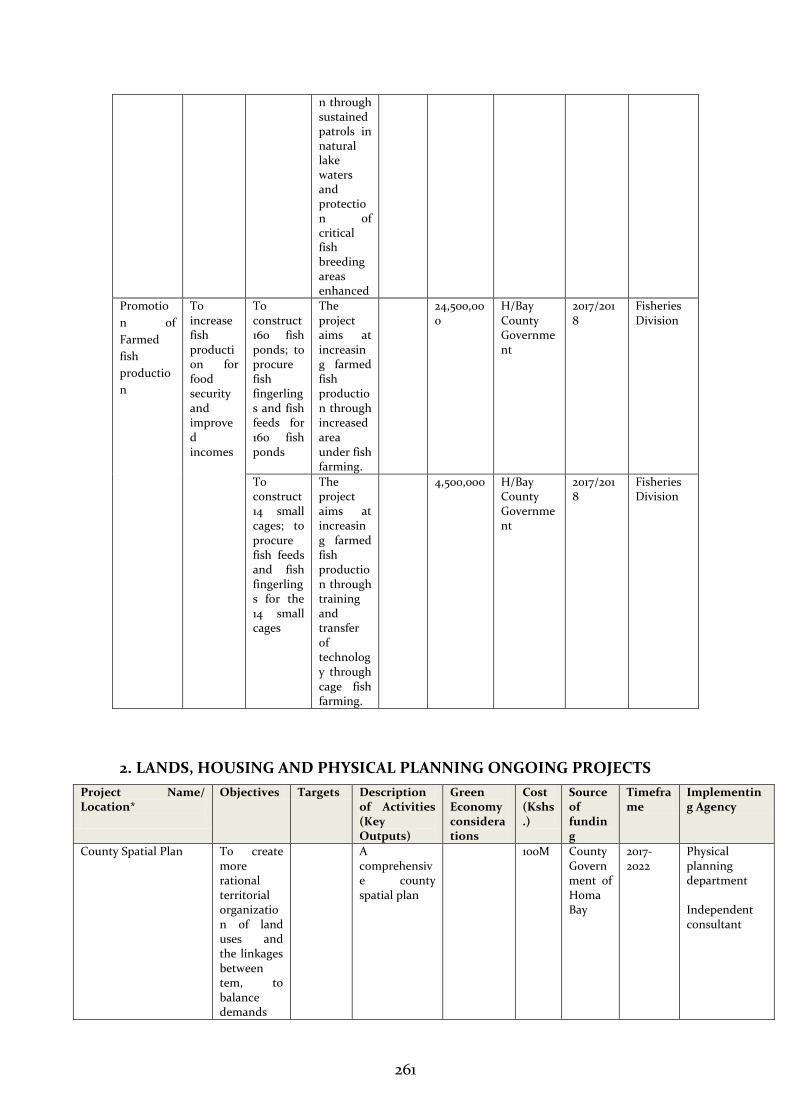
261
n through sustained patrols in natural lake waters and protection of critical fish breeding areas enhanced
Promotio
n of
Farmed
fish
productio
n
To increase fish production for food security and improved incomes
To construct 160 fish ponds; to procure fish fingerlings and fish feeds for 160 fish ponds
The project aims at increasing farmed fish production through increased area under fish farming.
24,500,000
H/Bay County Government
2017/2018
Fisheries Division
To construct 14 small cages; to procure fish feeds and fish fingerlings for the 14 small cages
The project aims at increasing farmed fish production through training and transfer of technology through cage fish farming.
4,500,000 H/Bay County Government
2017/2018
Fisheries Division
2. LANDS, HOUSING AND PHYSICAL PLANNING ONGOING PROJECTS
Project Name/ Location*
Objectives Targets Description of Activities (Key Outputs)
Green Economy considerations
Cost (Kshs.)
Source of funding
Timeframe
Implementing Agency
County Spatial Plan To create more rational territorial organization of land uses and the linkages between tem, to balance demands
A comprehensive county spatial plan
100M County Government of Homa Bay
2017-2022
Physical planning department Independent consultant
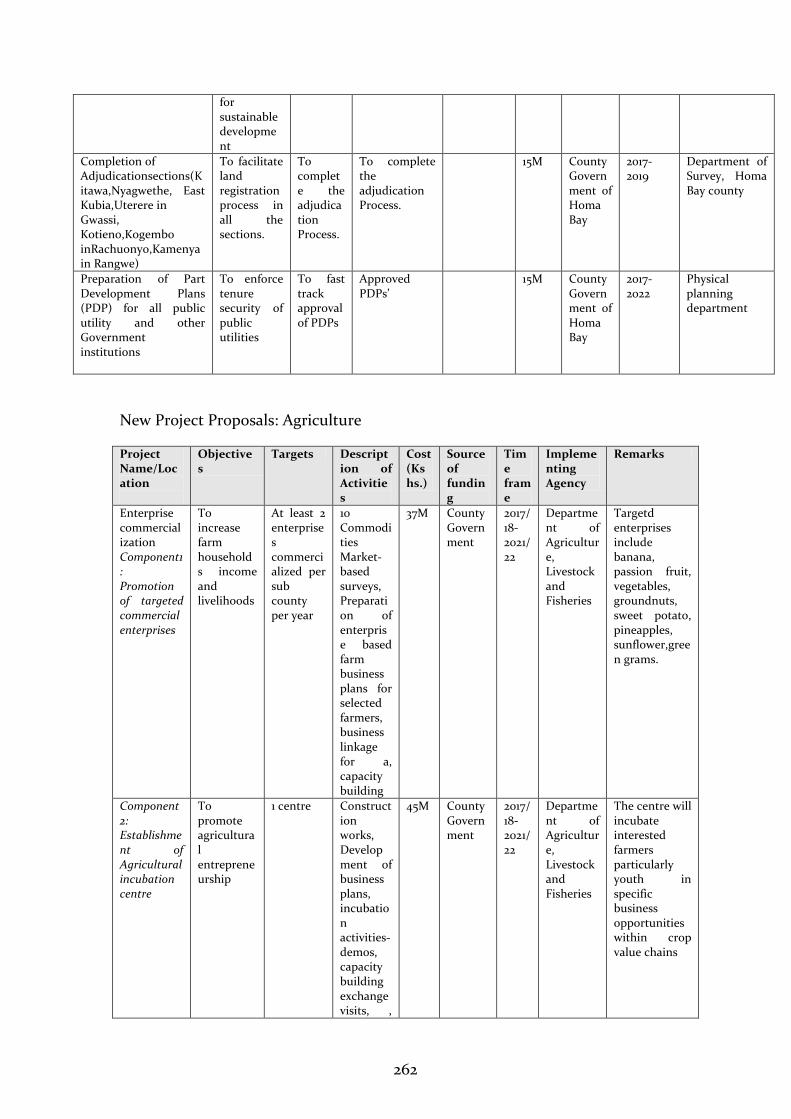
262
for sustainable development
Completion of Adjudicationsections(Kitawa,Nyagwethe, East Kubia,Uterere in Gwassi, Kotieno,Kogembo inRachuonyo,Kamenya in Rangwe)
To facilitate land registration process in all the sections.
To complete the adjudication Process.
To complete the adjudication Process.
15M County Government of Homa Bay
2017-2019
Department of Survey, Homa Bay county
Preparation of Part Development Plans (PDP) for all public utility and other Government institutions
To enforce tenure security of public utilities
To fast track approval of PDPs
Approved PDPs’
15M County Government of Homa Bay
2017-2022
Physical planning department
New Project Proposals: Agriculture
Project Name/Location
Objectives
Targets Description of Activities
Cost (Kshs.)
Source of funding
Time frame
Implementing Agency
Remarks
Enterprise commercialization Component1: Promotion of targeted commercial enterprises
To increase farm households income and livelihoods
At least 2 enterprises commercialized per sub county per year
10 Commodities Market-based surveys, Preparation of enterprise based farm business plans for selected farmers, business linkage for a, capacity building
37M County Government
2017/18-2021/22
Department of Agriculture, Livestock and Fisheries
Targetd enterprises include banana, passion fruit, vegetables, groundnuts, sweet potato, pineapples, sunflower,green grams.
Component2: Establishment of Agricultural incubation centre
To promote agricultural entrepreneurship
1 centre Construction works, Development of business plans, incubation activities-demos, capacity building exchange visits, ,
45M County Government
2017/18-2021/22
Department of Agriculture, Livestock and Fisheries
The centre will incubate interested farmers particularly youth in specific business opportunities within crop value chains
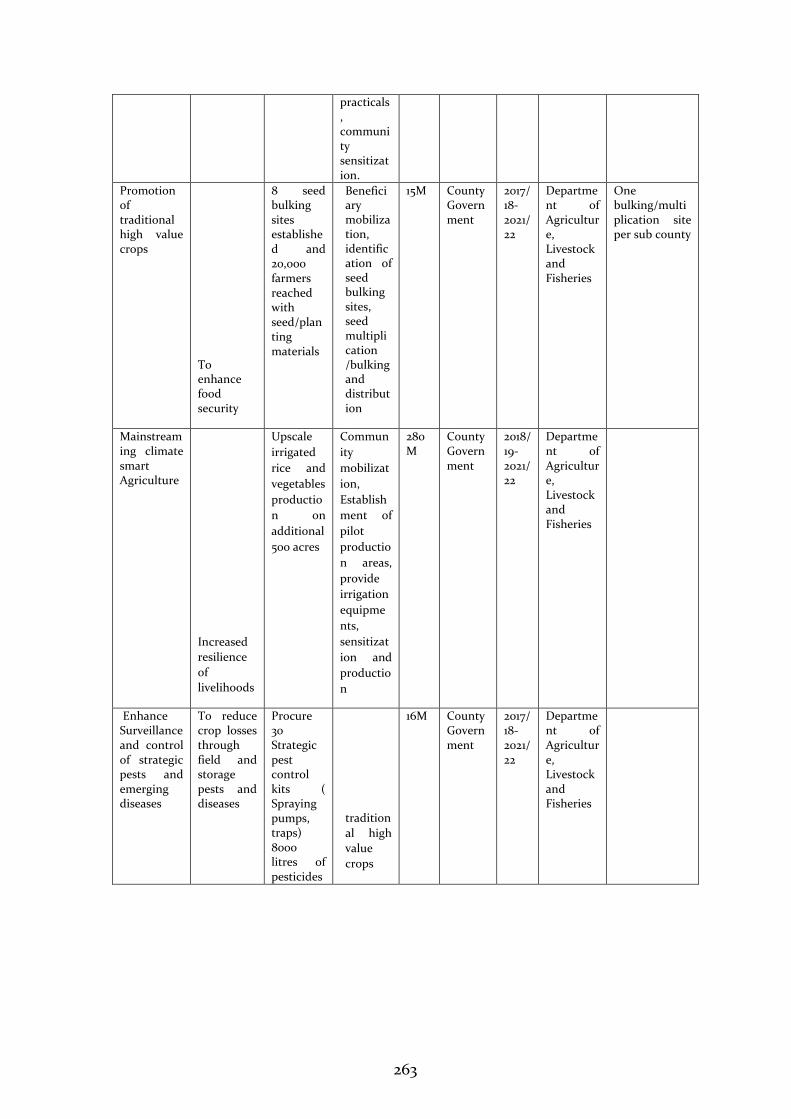
263
practicals, community sensitization.
Promotion of traditional high value crops
To enhance food security
8 seed bulking sites established and 20,000 farmers reached with seed/planting materials
Beneficiary mobilization, identification of seed bulking sites, seed multiplication /bulking and distribution
15M County Government
2017/18-2021/22
Department of Agriculture, Livestock and Fisheries
One bulking/multiplication site per sub county
Mainstreaming climate smart Agriculture
Increased
resilience
of
livelihoods
Upscale
irrigated
rice and
vegetables
productio
n on
additional
500 acres
Commun
ity
mobilizat
ion,
Establish
ment of
pilot
productio
n areas,
provide
irrigation
equipme
nts,
sensitizat
ion and
productio
n
280 M
County Government
2018/19-2021/22
Department of Agriculture, Livestock and Fisheries
Enhance Surveillance and control of strategic pests and emerging diseases
To reduce crop losses through field and storage pests and diseases
Procure 30 Strategic pest control kits ( Spraying pumps, traps) 8000 litres of pesticides
tradition
al high
value
crops
16M County Government
2017/18-2021/22
Department of Agriculture, Livestock and Fisheries
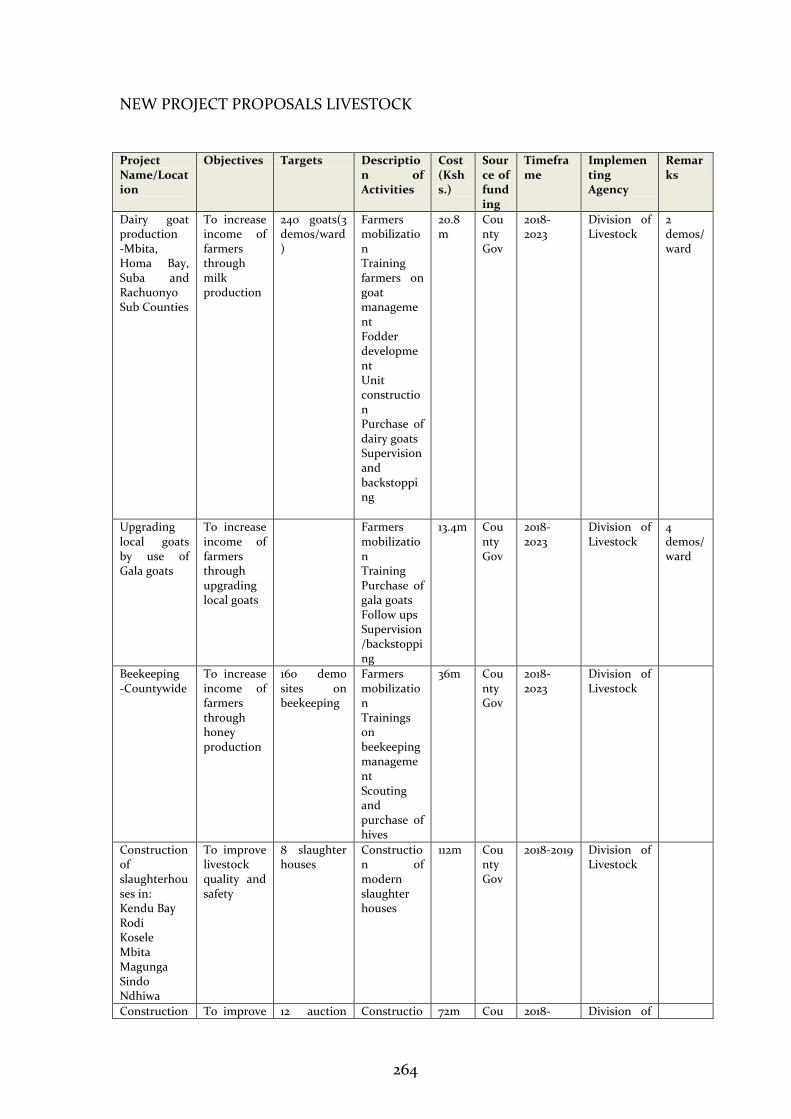
264
NEW PROJECT PROPOSALS LIVESTOCK
Project Name/Location
Objectives Targets Description of Activities
Cost (Kshs.)
Source of funding
Timeframe
Implementing Agency
Remarks
Dairy goat production -Mbita, Homa Bay, Suba and Rachuonyo Sub Counties
To increase income of farmers through milk production
240 goats(3 demos/ward)
Farmers mobilization Training farmers on goat management Fodder development Unit construction Purchase of dairy goats Supervision and backstopping
20.8m
County Gov
2018-2023
Division of Livestock
2 demos/ward
Upgrading local goats by use of Gala goats
To increase income of farmers through upgrading local goats
Farmers mobilization Training Purchase of gala goats Follow ups Supervision/backstopping
13.4m County Gov
2018-2023
Division of Livestock
4 demos/ward
Beekeeping -Countywide
To increase income of farmers through honey production
160 demo sites on beekeeping
Farmers mobilization Trainings on beekeeping management Scouting and purchase of hives
36m County Gov
2018-2023
Division of Livestock
Construction of slaughterhouses in: Kendu Bay Rodi Kosele Mbita Magunga Sindo Ndhiwa
To improve livestock quality and safety
8 slaughter houses
Construction of modern slaughter houses
112m County Gov
2018-2019 Division of Livestock
Construction To improve 12 auction Constructio 72m Cou 2018- Division of
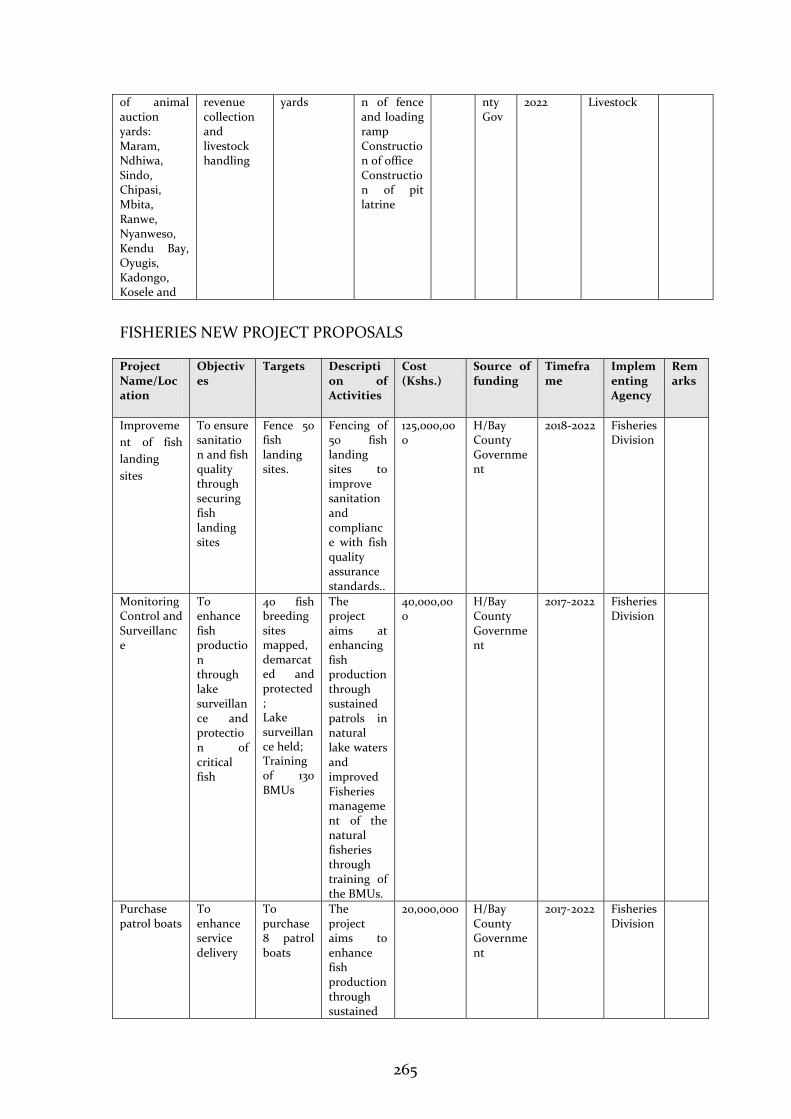
265
of animal auction yards: Maram, Ndhiwa, Sindo, Chipasi, Mbita, Ranwe, Nyanweso, Kendu Bay, Oyugis, Kadongo, Kosele and
revenue collection and livestock handling
yards n of fence and loading ramp Construction of office Construction of pit latrine
nty Gov
2022 Livestock
FISHERIES NEW PROJECT PROPOSALS
Project Name/Location
Objectives
Targets Description of Activities
Cost (Kshs.)
Source of funding
Timeframe
Implementing Agency
Remarks
Improveme
nt of fish
landing
sites
To ensure sanitation and fish quality through securing fish landing sites
Fence 50 fish landing sites.
Fencing of 50 fish landing sites to improve sanitation and compliance with fish quality assurance standards..
125,000,000
H/Bay County Government
2018-2022 Fisheries Division
Monitoring Control and Surveillance
To enhance fish production through lake surveillance and protection of critical fish
40 fish breeding sites mapped, demarcated and protected; Lake surveillance held; Training of 130 BMUs
The project aims at enhancing fish production through sustained patrols in natural lake waters and improved Fisheries management of the natural fisheries through training of the BMUs.
40,000,000
H/Bay County Government
2017-2022 Fisheries Division
Purchase patrol boats
To enhance service delivery
To purchase 8 patrol boats
The project aims to enhance fish production through sustained
20,000,000 H/Bay County Government
2017-2022 Fisheries Division
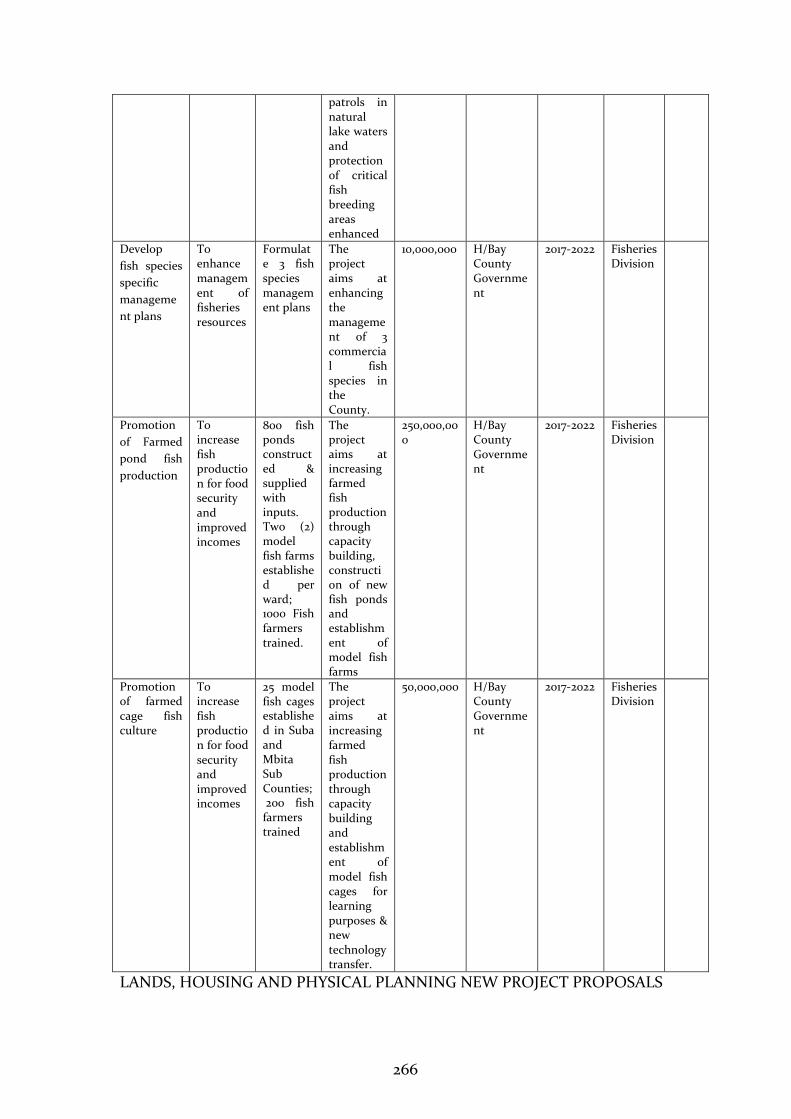
266
patrols in natural lake waters and protection of critical fish breeding areas enhanced
Develop
fish species
specific
manageme
nt plans
To enhance management of fisheries resources
Formulate 3 fish species management plans
The project aims at enhancing the management of 3 commercial fish species in the County.
10,000,000 H/Bay County Government
2017-2022 Fisheries Division
Promotion
of Farmed
pond fish
production
To increase fish production for food security and improved incomes
800 fish ponds constructed & supplied with inputs. Two (2) model fish farms established per ward; 1000 Fish farmers trained.
The project aims at increasing farmed fish production through capacity building, construction of new fish ponds and establishment of model fish farms
250,000,000
H/Bay County Government
2017-2022 Fisheries Division
Promotion of farmed cage fish culture
To increase fish production for food security and improved incomes
25 model fish cages established in Suba and Mbita Sub Counties; 200 fish farmers trained
The project aims at increasing farmed fish production through capacity building and establishment of model fish cages for learning purposes & new technology transfer.
50,000,000 H/Bay County Government
2017-2022 Fisheries Division
LANDS, HOUSING AND PHYSICAL PLANNING NEW PROJECT PROPOSALS
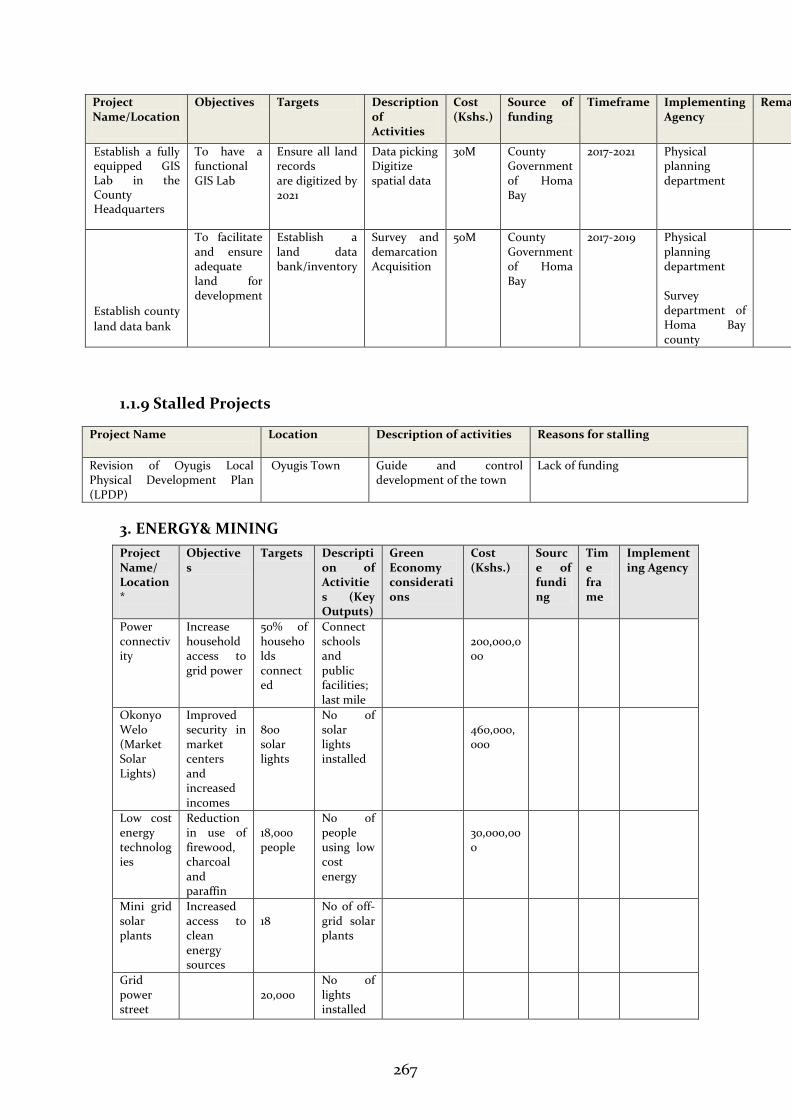
267
Project Name/Location
Objectives Targets Description of Activities
Cost (Kshs.)
Source of funding
Timeframe Implementing Agency
Remarks
Establish a fully equipped GIS Lab in the County Headquarters
To have a functional GIS Lab
Ensure all land records are digitized by 2021
Data picking Digitize spatial data
30M County Government of Homa Bay
2017-2021 Physical planning department
Establish county
land data bank
To facilitate and ensure adequate land for development
Establish a land data bank/inventory
Survey and demarcation Acquisition
50M County Government of Homa Bay
2017-2019 Physical planning department Survey department of Homa Bay county
1.1.9 Stalled Projects
Project Name
Location Description of activities Reasons for stalling
Revision of Oyugis Local Physical Development Plan (LPDP)
Oyugis Town Guide and control development of the town
Lack of funding
3. ENERGY& MINING
Project Name/ Location*
Objectives
Targets Description of Activities (Key Outputs)
Green Economy considerations
Cost (Kshs.)
Source of funding
Time frame
Implementing Agency
Power connectivity
Increase household access to grid power
50% of households connected
Connect schools and public facilities; last mile
200,000,000
Okonyo Welo (Market Solar Lights)
Improved security in market centers and increased incomes
800 solar lights
No of solar lights installed
460,000,000
Low cost energy technologies
Reduction in use of firewood, charcoal and paraffin
18,000 people
No of people using low cost energy
30,000,000
Mini grid solar plants
Increased access to clean energy sources
18
No of off-grid solar plants
Grid power street
20,000
No of lights installed
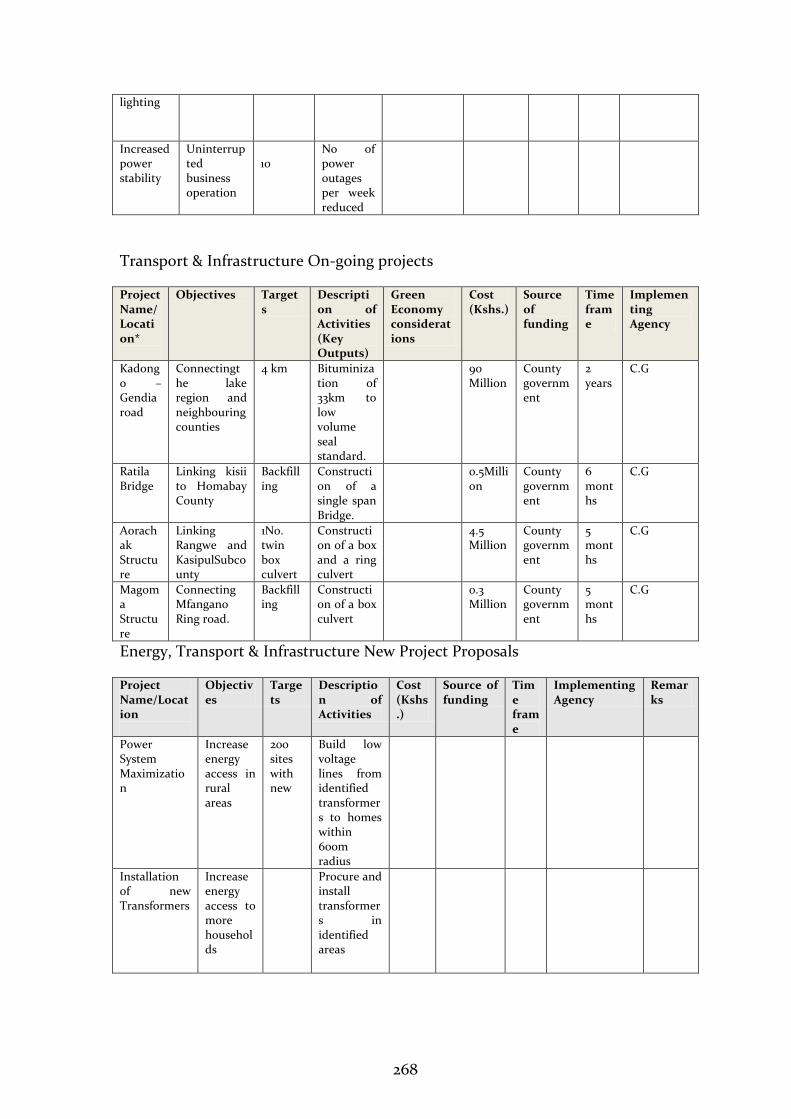
268
lighting
Increased power stability
Uninterrupted business operation
10
No of power outages per week reduced
Transport & Infrastructure On-going projects
Project Name/ Location*
Objectives Targets
Description of Activities (Key Outputs)
Green Economy considerations
Cost (Kshs.)
Source of funding
Time frame
Implementing Agency
Kadongo – Gendia road
Connectingthe lake region and neighbouring counties
4 km Bituminization of 33km to low volume seal standard.
90 Million
County government
2 years
C.G
Ratila Bridge
Linking kisii to Homabay County
Backfilling
Construction of a single span Bridge.
0.5Million
County government
6 months
C.G
Aorachak Structure
Linking Rangwe and KasipulSubcounty
1No. twin box culvert
Construction of a box and a ring culvert
4.5 Million
County government
5 months
C.G
Magoma Structure
Connecting Mfangano Ring road.
Backfilling
Construction of a box culvert
0.3 Million
County government
5 months
C.G
Energy, Transport & Infrastructure New Project Proposals
Project Name/Location
Objectives
Targets
Description of Activities
Cost (Kshs.)
Source of funding
Time frame
Implementing Agency
Remarks
Power System Maximization
Increase energy access in rural areas
200 sites with new
Build low voltage lines from identified transformers to homes within 600m radius
Installation of new Transformers
Increase energy access to more households
Procure and install transformers in identified areas
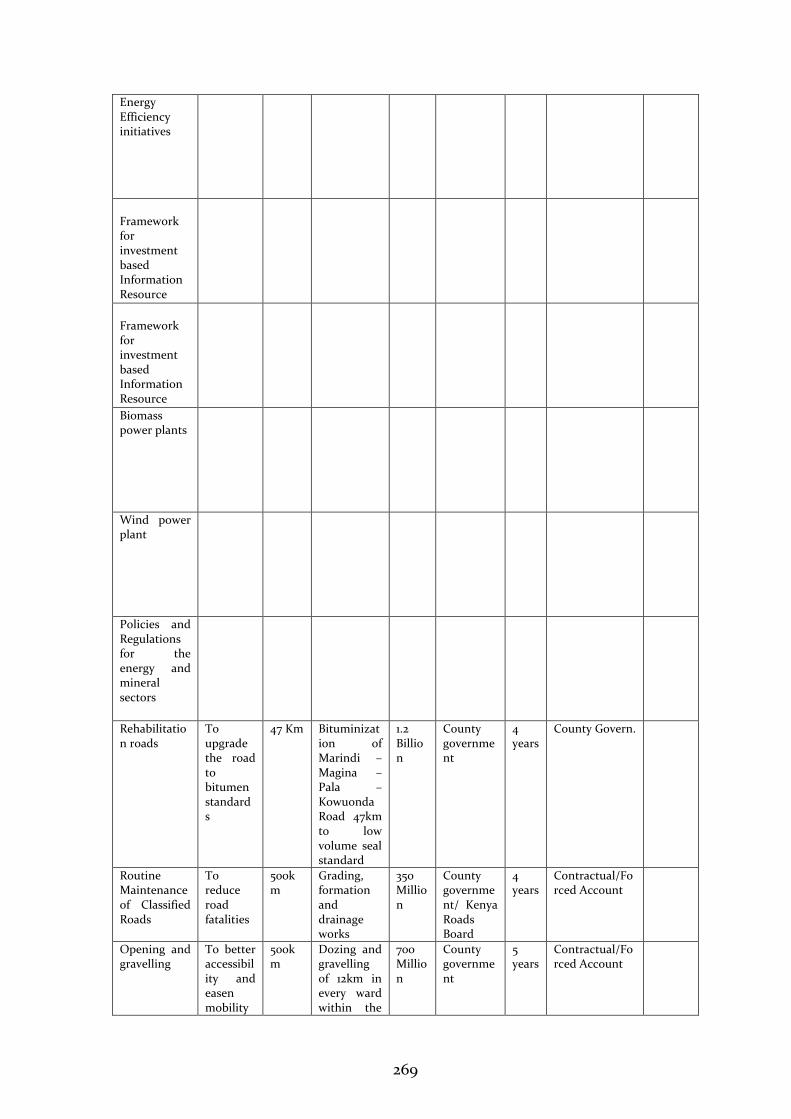
269
Energy Efficiency initiatives
Framework for investment based Information Resource
Framework for investment based Information Resource
Biomass power plants
Wind power plant
Policies and Regulations for the energy and mineral sectors
Rehabilitation roads
To upgrade the road to bitumen standards
47 Km Bituminization of Marindi – Magina – Pala – Kowuonda Road 47km to low volume seal standard
1.2 Billion
County government
4 years
County Govern.
Routine Maintenance of Classified Roads
To reduce road fatalities
500km
Grading, formation and drainage works
350 Million
County government/ Kenya Roads Board
4 years
Contractual/Forced Account
Opening and gravelling
To better accessibility and easen mobility
500km
Dozing and gravelling of 12km in every ward within the
700 Million
County government
5 years
Contractual/Forced Account
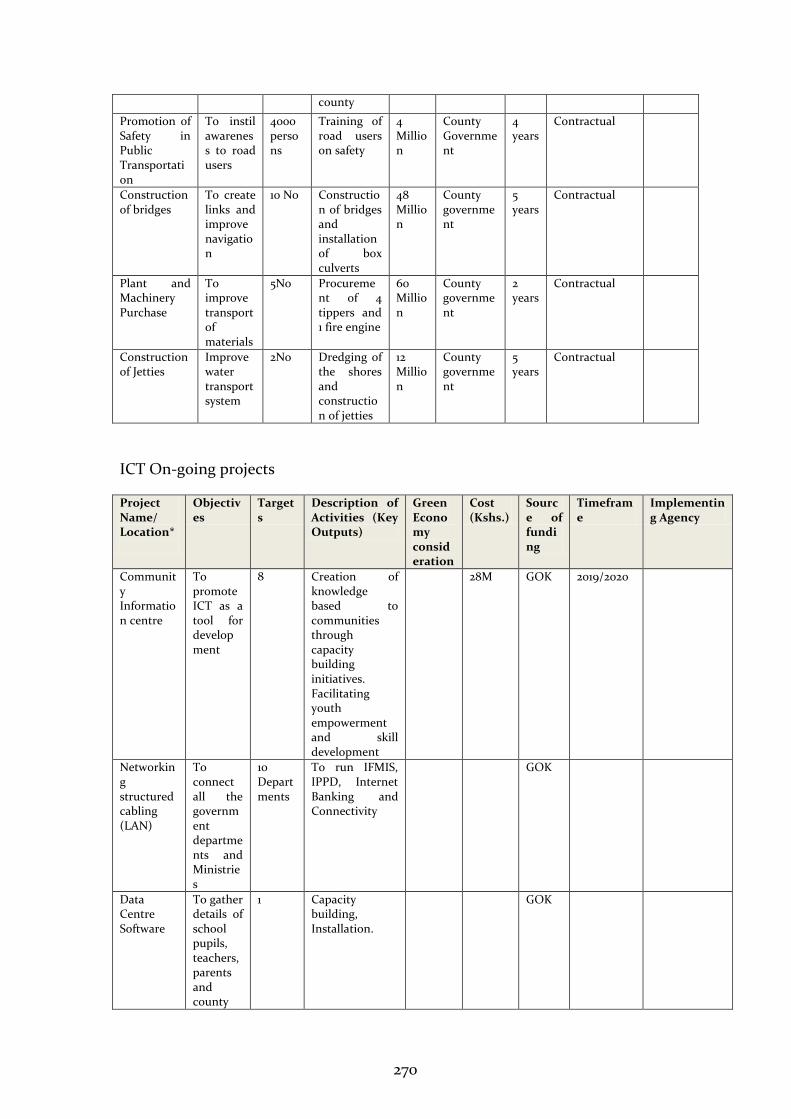
270
county
Promotion of Safety in Public Transportation
To instil awareness to road users
4000 persons
Training of road users on safety
4 Million
County Government
4 years
Contractual
Construction of bridges
To create links and improve navigation
10 No Construction of bridges and installation of box culverts
48 Million
County government
5 years
Contractual
Plant and Machinery Purchase
To improve transport of materials
5No Procurement of 4 tippers and 1 fire engine
60 Million
County government
2 years
Contractual
Construction of Jetties
Improve water transport system
2No Dredging of the shores and construction of jetties
12 Million
County government
5 years
Contractual
ICT On-going projects
Project Name/ Location*
Objectives
Targets
Description of Activities (Key Outputs)
Green Economy consideration
Cost (Kshs.)
Source of funding
Timeframe
Implementing Agency
Community Information centre
To promote ICT as a tool for development
8
Creation of knowledge based to communities through capacity building initiatives. Facilitating youth empowerment and skill development
28M GOK
2019/2020
Networking structured cabling (LAN)
To connect all the government departments and Ministries
10 Departments
To run IFMIS, IPPD, Internet Banking and Connectivity
GOK
Data Centre Software
To gather details of school pupils, teachers, parents and county
1 Capacity building, Installation.
GOK
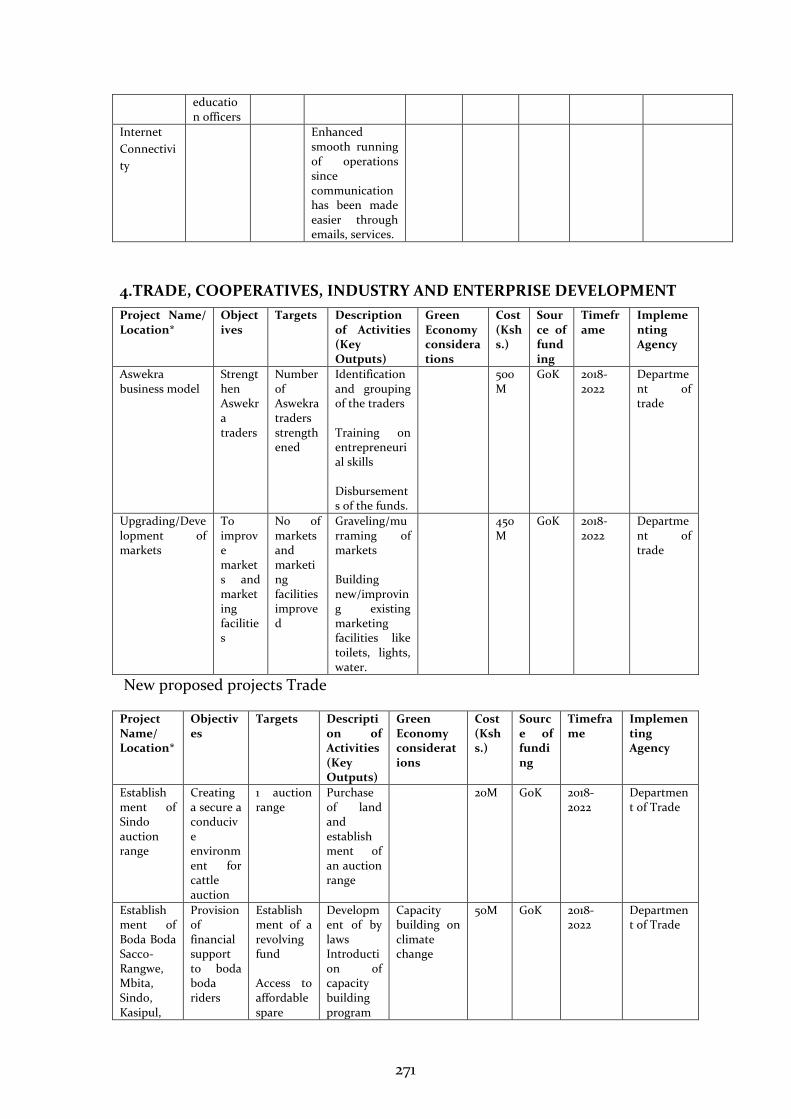
271
education officers
Internet
Connectivi
ty
Enhanced smooth running of operations since communication has been made easier through emails, services.
4.TRADE, COOPERATIVES, INDUSTRY AND ENTERPRISE DEVELOPMENT
Project Name/ Location*
Objectives
Targets Description of Activities (Key Outputs)
Green Economy considerations
Cost (Kshs.)
Source of funding
Timeframe
Implementing Agency
Aswekra business model
Strengthen Aswekra traders
Number of Aswekra traders strengthened
Identification and grouping of the traders Training on entrepreneurial skills Disbursements of the funds.
500M
GoK 2018-2022
Department of trade
Upgrading/Development of markets
To improve markets and marketing facilities
No of markets and marketing facilities improved
Graveling/murraming of markets Building new/improving existing marketing facilities like toilets, lights, water.
450M
GoK 2018-2022
Department of trade
New proposed projects Trade
Project Name/ Location*
Objectives
Targets Description of Activities (Key Outputs)
Green Economy considerations
Cost (Kshs.)
Source of funding
Timeframe
Implementing Agency
Establishment of Sindo auction range
Creating a secure a conducive environment for cattle auction
1 auction range
Purchase of land and establishment of an auction range
20M GoK 2018-2022
Department of Trade
Establishment of Boda Boda Sacco- Rangwe, Mbita, Sindo, Kasipul,
Provision of financial support to boda boda riders
Establishment of a revolving fund Access to affordable spare
Development of by laws Introduction of capacity building program
Capacity building on climate change
50M GoK 2018-2022
Department of Trade
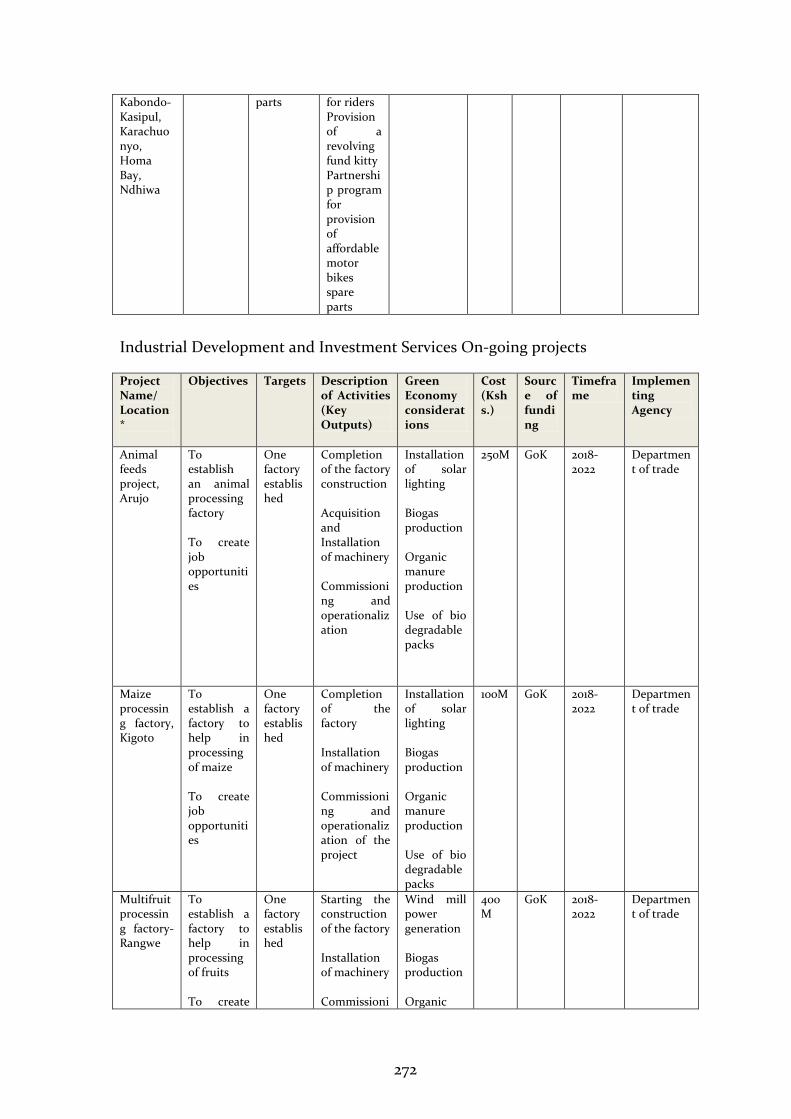
272
Kabondo-Kasipul, Karachuonyo, Homa Bay, Ndhiwa
parts for riders Provision of a revolving fund kitty Partnership program for provision of affordable motor bikes spare parts
Industrial Development and Investment Services On-going projects
Project Name/ Location*
Objectives Targets Description of Activities (Key Outputs)
Green Economy considerations
Cost (Kshs.)
Source of funding
Timeframe
Implementing Agency
Animal feeds project, Arujo
To establish an animal processing factory To create job opportunities
One factory established
Completion of the factory construction Acquisition and Installation of machinery Commissioning and operationalization
Installation of solar lighting Biogas production Organic manure production Use of bio degradable packs
250M GoK 2018-2o22
Department of trade
Maize processing factory, Kigoto
To establish a factory to help in processing of maize To create job opportunities
One factory established
Completion of the factory Installation of machinery Commissioning and operationalization of the project
Installation of solar lighting Biogas production Organic manure production Use of bio degradable packs
100M GoK 2018-2022
Department of trade
Multifruit processing factory- Rangwe
To establish a factory to help in processing of fruits To create
One factory established
Starting the construction of the factory Installation of machinery Commissioni
Wind mill power generation Biogas production Organic
400M
GoK 2018-2022
Department of trade
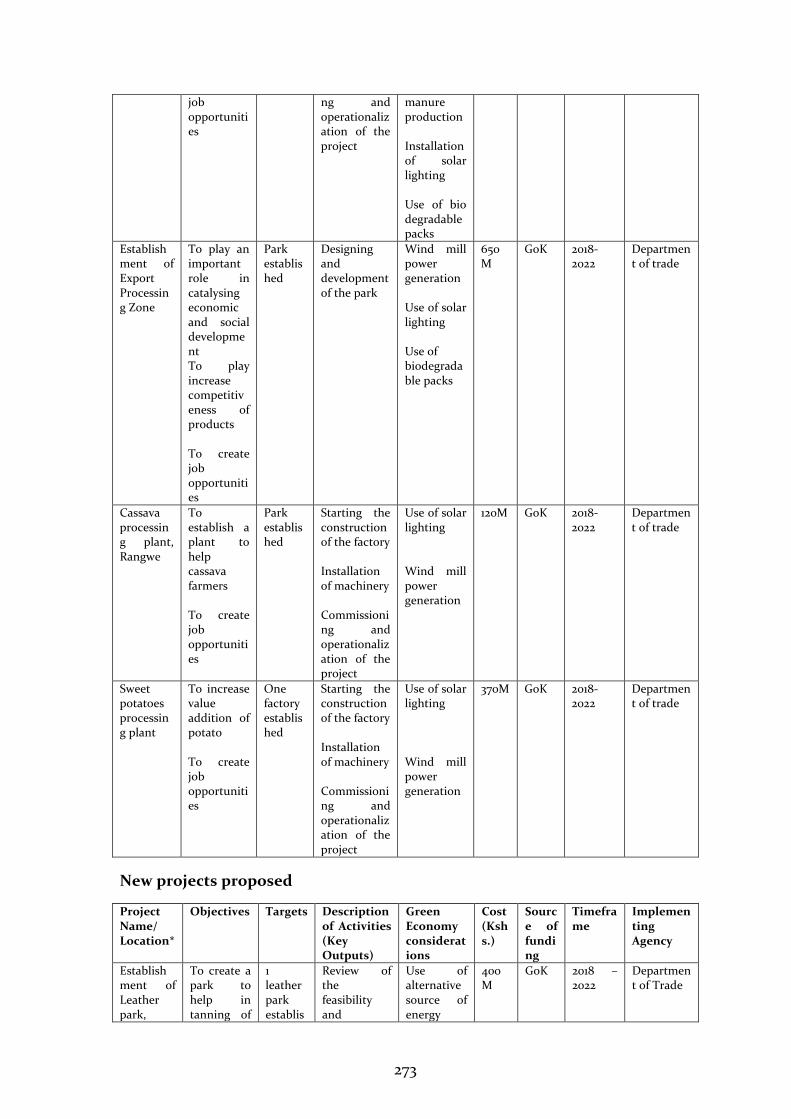
273
job opportunities
ng and operationalization of the project
manure production Installation of solar lighting Use of bio degradable packs
Establishment of Export Processing Zone
To play an important role in catalysing economic and social development To play increase competitiveness of products To create job opportunities
Park established
Designing and development of the park
Wind mill power generation Use of solar lighting Use of biodegradable packs
650M
GoK 2018-2022
Department of trade
Cassava processing plant, Rangwe
To establish a plant to help cassava farmers To create job opportunities
Park established
Starting the construction of the factory Installation of machinery Commissioning and operationalization of the project
Use of solar lighting Wind mill power generation
120M GoK 2018-2022
Department of trade
Sweet potatoes processing plant
To increase value addition of potato To create job opportunities
One factory established
Starting the construction of the factory Installation of machinery Commissioning and operationalization of the project
Use of solar lighting Wind mill power generation
370M GoK 2018-2022
Department of trade
New projects proposed
Project Name/ Location*
Objectives Targets Description of Activities (Key Outputs)
Green Economy considerations
Cost (Kshs.)
Source of funding
Timeframe
Implementing Agency
Establishment of Leather park,
To create a park to help in tanning of
1 leather park establis
Review of the feasibility and
Use of alternative source of energy
400M
GoK 2018 – 2022
Department of Trade
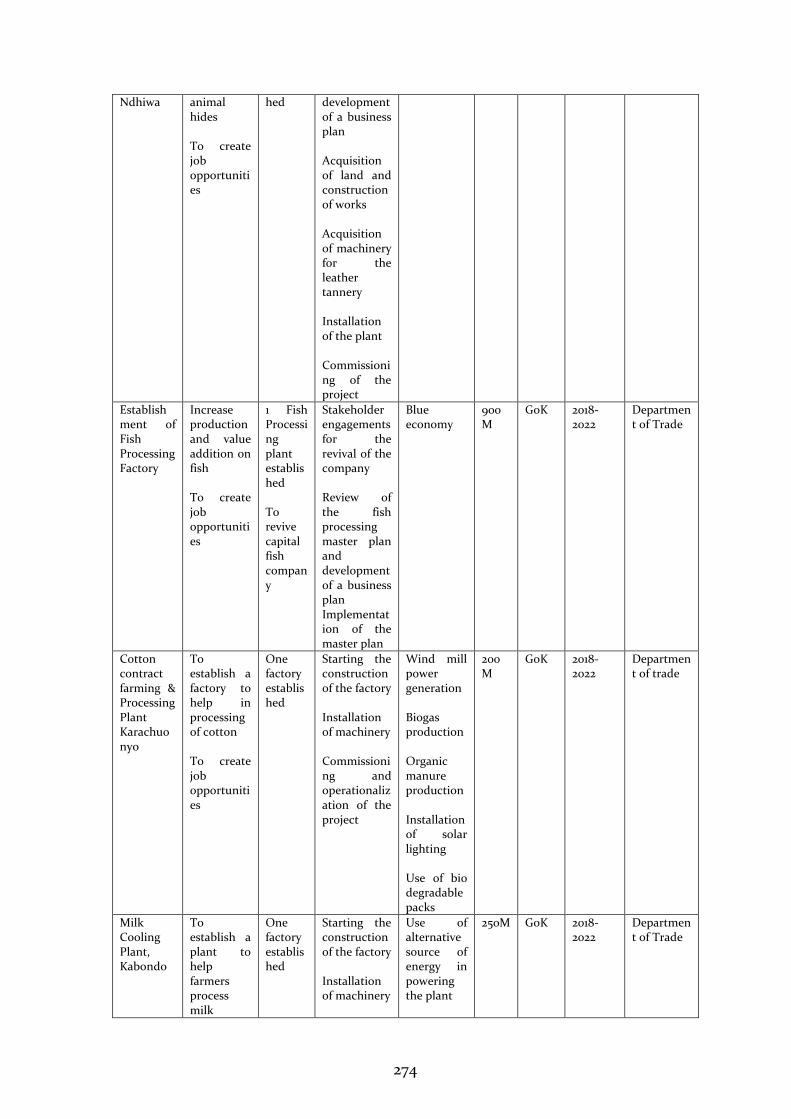
274
Ndhiwa animal hides To create job opportunities
hed development of a business plan Acquisition of land and construction of works Acquisition of machinery for the leather tannery Installation of the plant Commissioning of the project
Establishment of Fish Processing Factory
Increase production and value addition on fish To create job opportunities
1 Fish Processing plant established To revive capital fish company
Stakeholder engagements for the revival of the company Review of the fish processing master plan and development of a business plan Implementation of the master plan
Blue economy
900M
GoK 2018-2022
Department of Trade
Cotton contract farming & Processing Plant Karachuonyo
To establish a factory to help in processing of cotton To create job opportunities
One factory established
Starting the construction of the factory Installation of machinery Commissioning and operationalization of the project
Wind mill power generation Biogas production Organic manure production Installation of solar lighting Use of bio degradable packs
200M
GoK 2018-2022
Department of trade
Milk Cooling Plant, Kabondo
To establish a plant to help farmers process milk
One factory established
Starting the construction of the factory Installation of machinery
Use of alternative source of energy in powering the plant
250M GoK 2018-2022
Department of Trade
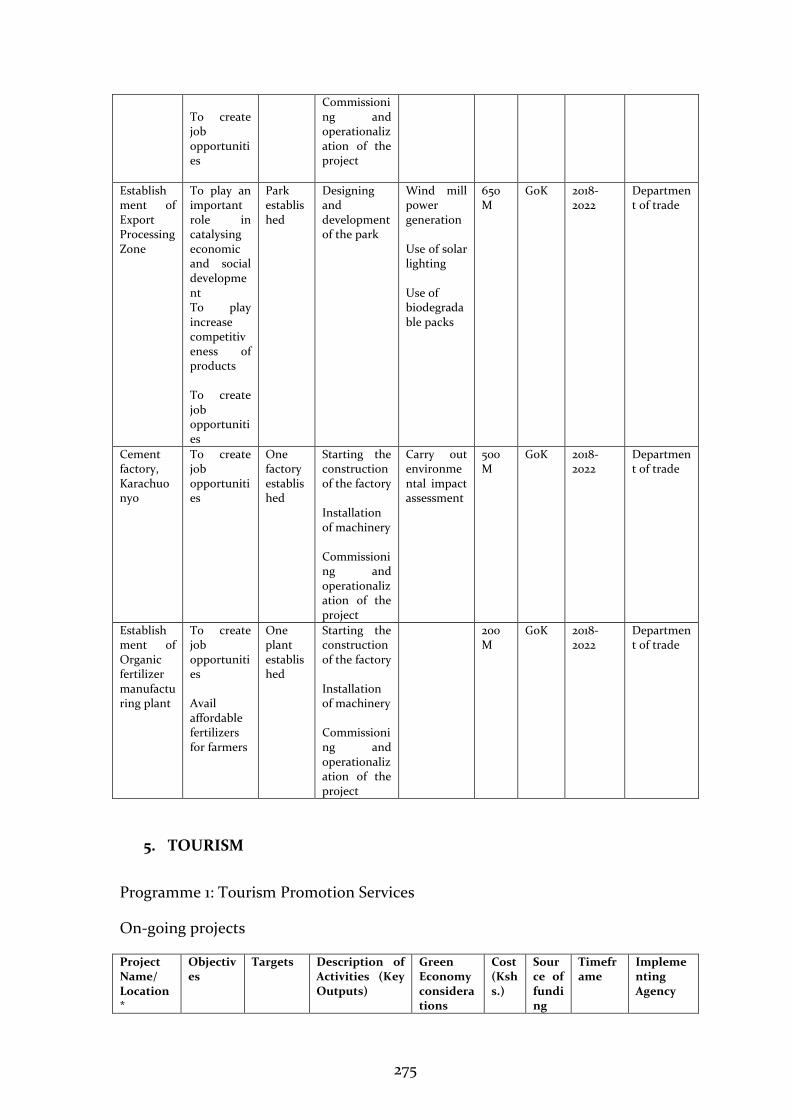
275
To create job opportunities
Commissioning and operationalization of the project
Establishment of Export Processing Zone
To play an important role in catalysing economic and social development To play increase competitiveness of products To create job opportunities
Park established
Designing and development of the park
Wind mill power generation Use of solar lighting Use of biodegradable packs
650M
GoK 2018-2022
Department of trade
Cement factory, Karachuonyo
To create job opportunities
One factory established
Starting the construction of the factory Installation of machinery Commissioning and operationalization of the project
Carry out environmental impact assessment
500M
GoK 2018-2022
Department of trade
Establishment of Organic fertilizer manufacturing plant
To create job opportunities Avail affordable fertilizers for farmers
One plant established
Starting the construction of the factory Installation of machinery Commissioning and operationalization of the project
200M
GoK 2018-2022
Department of trade
5. TOURISM
Programme 1: Tourism Promotion Services
On-going projects
Project Name/ Location*
Objectives
Targets Description of Activities (Key Outputs)
Green Economy considerations
Cost (Kshs.)
Source of funding
Timeframe
Implementing Agency
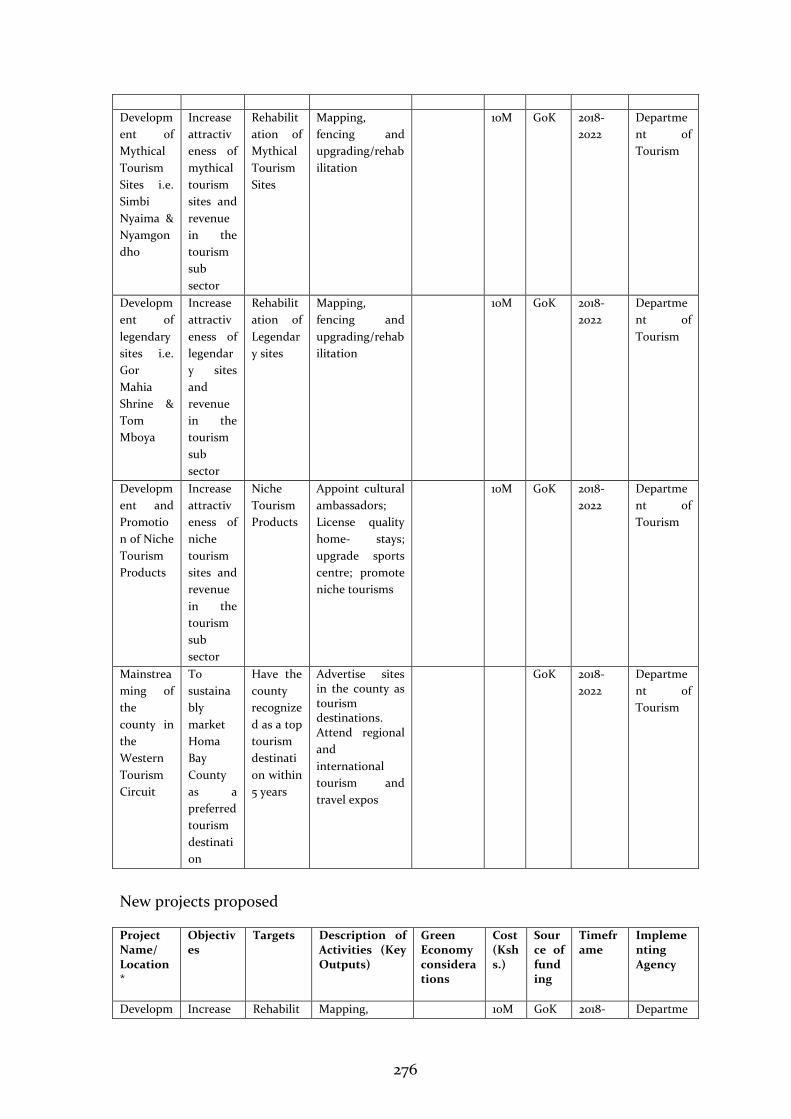
276
Developm
ent of
Mythical
Tourism
Sites i.e.
Simbi
Nyaima &
Nyamgon
dho
Increase
attractiv
eness of
mythical
tourism
sites and
revenue
in the
tourism
sub
sector
Rehabilit
ation of
Mythical
Tourism
Sites
Mapping,
fencing and
upgrading/rehab
ilitation
10M GoK 2018-
2022
Departme
nt of
Tourism
Developm
ent of
legendary
sites i.e.
Gor
Mahia
Shrine &
Tom
Mboya
Increase
attractiv
eness of
legendar
y sites
and
revenue
in the
tourism
sub
sector
Rehabilit
ation of
Legendar
y sites
Mapping,
fencing and
upgrading/rehab
ilitation
10M GoK 2018-
2022
Departme
nt of
Tourism
Developm
ent and
Promotio
n of Niche
Tourism
Products
Increase
attractiv
eness of
niche
tourism
sites and
revenue
in the
tourism
sub
sector
Niche
Tourism
Products
Appoint cultural
ambassadors;
License quality
home- stays;
upgrade sports
centre; promote
niche tourisms
10M GoK 2018-
2022
Departme
nt of
Tourism
Mainstrea
ming of
the
county in
the
Western
Tourism
Circuit
To
sustaina
bly
market
Homa
Bay
County
as a
preferred
tourism
destinati
on
Have the
county
recognize
d as a top
tourism
destinati
on within
5 years
Advertise sites in the county as tourism destinations. Attend regional
and
international
tourism and
travel expos
GoK 2018-
2022
Departme
nt of
Tourism
New projects proposed
Project Name/ Location*
Objectives
Targets Description of Activities (Key Outputs)
Green Economy considerations
Cost (Kshs.)
Source of funding
Timeframe
Implementing Agency
Developm Increase Rehabilit Mapping, 10M GoK 2018- Departme
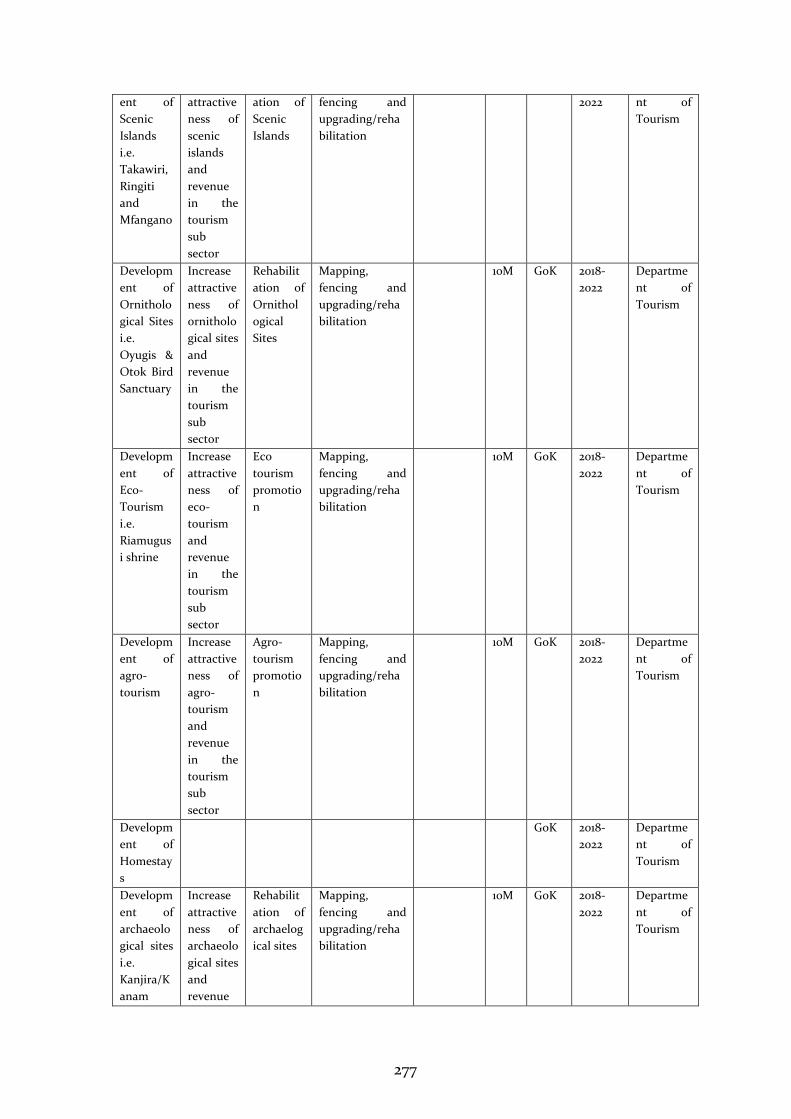
277
ent of
Scenic
Islands
i.e.
Takawiri,
Ringiti
and
Mfangano
attractive
ness of
scenic
islands
and
revenue
in the
tourism
sub
sector
ation of
Scenic
Islands
fencing and
upgrading/reha
bilitation
2022 nt of
Tourism
Developm
ent of
Ornitholo
gical Sites
i.e.
Oyugis &
Otok Bird
Sanctuary
Increase
attractive
ness of
ornitholo
gical sites
and
revenue
in the
tourism
sub
sector
Rehabilit
ation of
Ornithol
ogical
Sites
Mapping,
fencing and
upgrading/reha
bilitation
10M GoK 2018-
2022
Departme
nt of
Tourism
Developm
ent of
Eco-
Tourism
i.e.
Riamugus
i shrine
Increase
attractive
ness of
eco-
tourism
and
revenue
in the
tourism
sub
sector
Eco
tourism
promotio
n
Mapping,
fencing and
upgrading/reha
bilitation
10M GoK 2018-
2022
Departme
nt of
Tourism
Developm
ent of
agro-
tourism
Increase
attractive
ness of
agro-
tourism
and
revenue
in the
tourism
sub
sector
Agro-
tourism
promotio
n
Mapping,
fencing and
upgrading/reha
bilitation
10M GoK 2018-
2022
Departme
nt of
Tourism
Developm
ent of
Homestay
s
GoK 2018-
2022
Departme
nt of
Tourism
Developm
ent of
archaeolo
gical sites
i.e.
Kanjira/K
anam
Increase
attractive
ness of
archaeolo
gical sites
and
revenue
Rehabilit
ation of
archaelog
ical sites
Mapping,
fencing and
upgrading/reha
bilitation
10M GoK 2018-
2022
Departme
nt of
Tourism
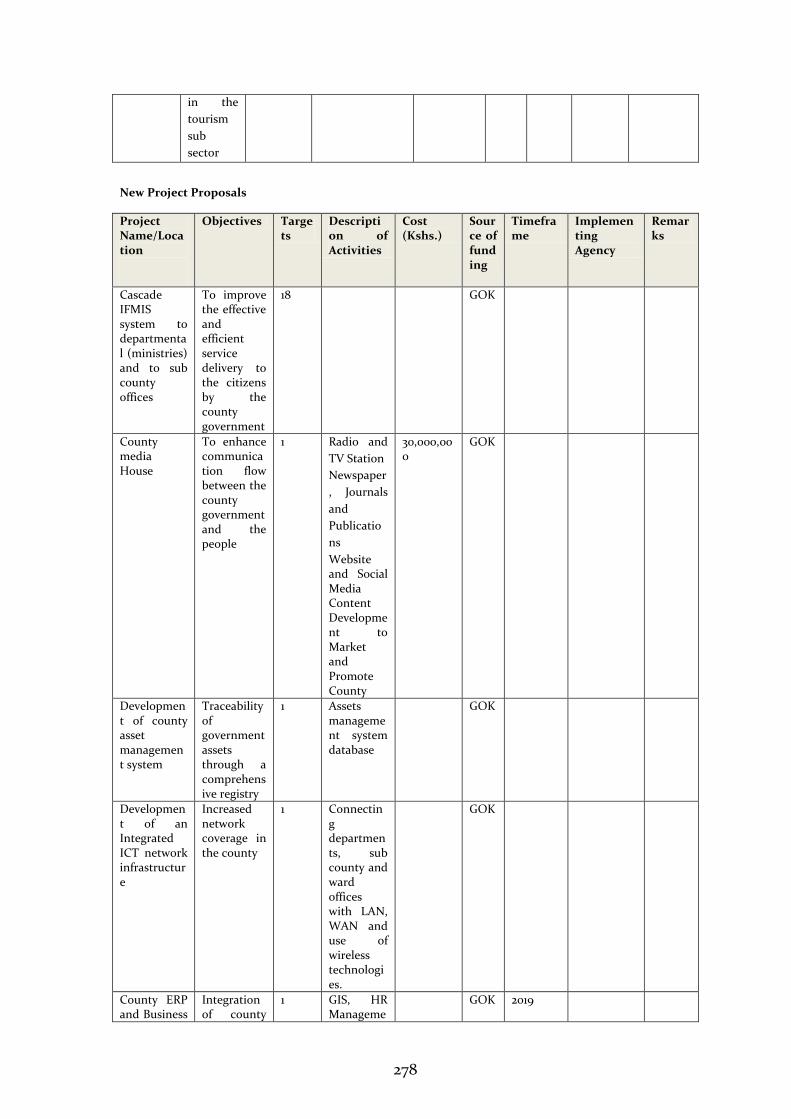
278
in the
tourism
sub
sector
New Project Proposals
Project Name/Location
Objectives Targets
Description of Activities
Cost (Kshs.)
Source of funding
Timeframe
Implementing Agency
Remarks
Cascade IFMIS system to departmental (ministries) and to sub county offices
To improve the effective and efficient service delivery to the citizens by the county government
18 GOK
County media House
To enhance communication flow between the county government and the people
1 Radio and
TV Station
Newspaper
, Journals
and
Publicatio
ns
Website and Social Media Content Development to Market and Promote County
30,000,000
GOK
Development of county asset management system
Traceability of government assets through a comprehensive registry
1 Assets management system database
GOK
Development of an Integrated ICT network infrastructure
Increased network coverage in the county
1 Connecting departments, sub county and ward offices with LAN, WAN and use of wireless technologies.
GOK
County ERP and Business
Integration of county
1 GIS, HR Manageme
GOK 2019
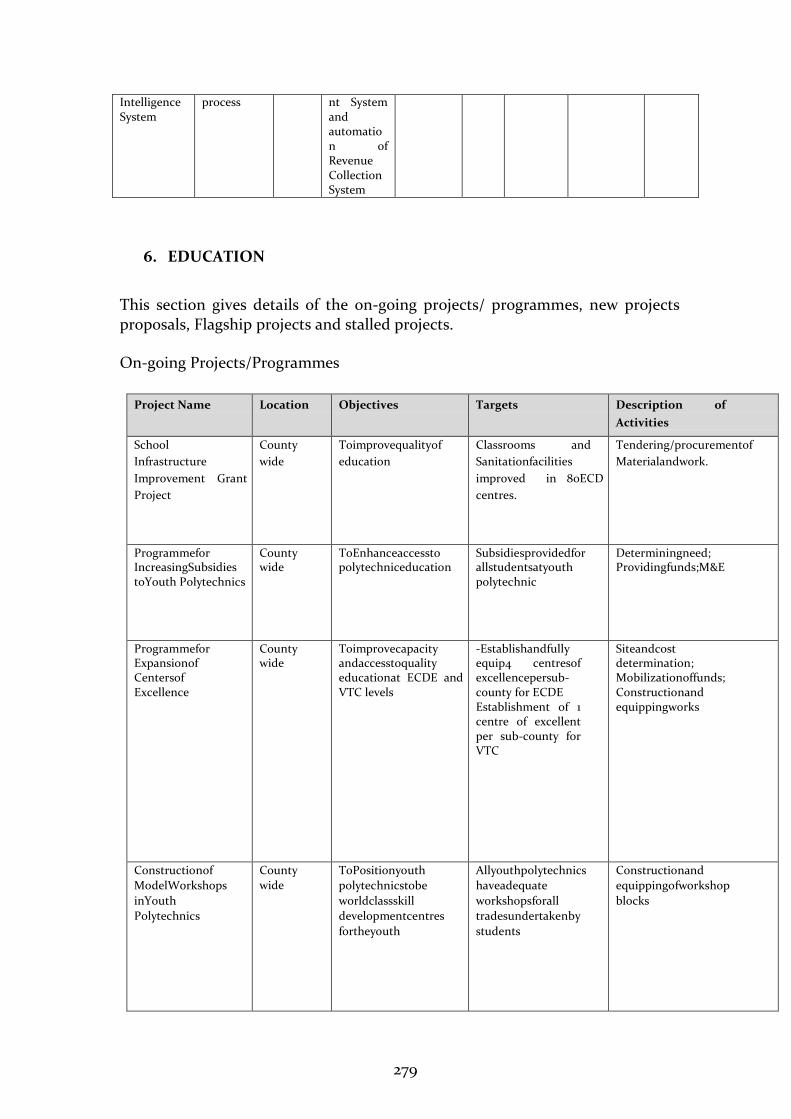
279
Intelligence System
process nt System and automation of Revenue Collection System
6. EDUCATION This section gives details of the on-going projects/ programmes, new projects proposals, Flagship projects and stalled projects. On-going Projects/Programmes
Project Name Location Objectives Targets Description of
Activities
School
Infrastructure
Improvement Grant
Project
County
wide
Toimprovequalityof
education
Classrooms and
Sanitationfacilities
improved in 80ECD
centres.
Tendering/procurementof
Materialandwork.
Programmefor IncreasingSubsidies toYouth Polytechnics
County wide
ToEnhanceaccessto polytechniceducation
Subsidiesprovidedfor allstudentsatyouth polytechnic
Determiningneed; Providingfunds;M&E
Programmefor Expansionof Centersof Excellence
County wide
Toimprovecapacity andaccesstoquality educationat ECDE and VTC levels
-Establishandfully equip4 centresof excellencepersub- county for ECDE Establishment of 1 centre of excellent per sub-county for VTC
Siteandcost determination; Mobilizationoffunds; Constructionand equippingworks
Constructionof
ModelWorkshops
inYouth
Polytechnics
County
wide
ToPositionyouth
polytechnicstobe
worldclassskill
developmentcentres
fortheyouth
Allyouthpolytechnics
haveadequate
workshopsforall
tradesundertakenby
students
Constructionand
equippingofworkshop
blocks
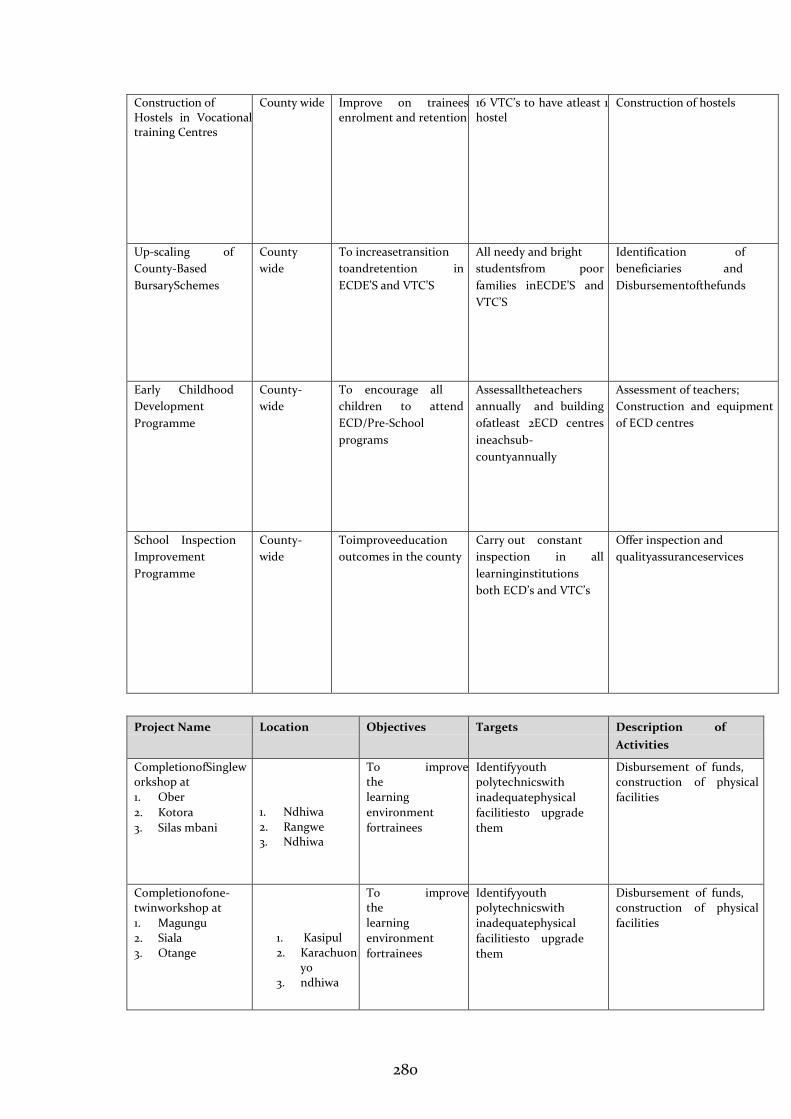
280
Construction of Hostels in Vocational training Centres
County wide Improve on trainees enrolment and retention
16 VTC’s to have atleast 1 hostel
Construction of hostels
Up-scaling of
County-Based
BursarySchemes
County
wide
To increasetransition
toandretention in
ECDE’S and VTC’S
All needy and bright
studentsfrom poor
families inECDE’S and
VTC’S
Identification of
beneficiaries and
Disbursementofthefunds
Early Childhood
Development
Programme
County-
wide
To encourage all
children to attend
ECD/Pre-School
programs
Assessalltheteachers
annually and building
ofatleast 2ECD centres
ineachsub-
countyannually
Assessment of teachers;
Construction and equipment
of ECD centres
School Inspection
Improvement
Programme
County-
wide
Toimproveeducation
outcomes in the county
Carry out constant
inspection in all
learninginstitutions
both ECD’s and VTC’s
Offer inspection and
qualityassuranceservices
Project Name Location Objectives Targets Description of
Activities
CompletionofSingleworkshop at
1. Ober
2. Kotora
3. Silas mbani
1. Ndhiwa
2. Rangwe 3. Ndhiwa
To improve the
learning
environment
fortrainees
Identifyyouth
polytechnicswith
inadequatephysical
facilitiesto upgrade
them
Disbursement of funds,
construction of physical
facilities
Completionofone-
twinworkshop at
1. Magungu
2. Siala
3. Otange
1. Kasipul
2. Karachuonyo
3. ndhiwa
To improve the
learning
environment
fortrainees
Identifyyouth
polytechnicswith
inadequatephysical
facilitiesto upgrade
them
Disbursement of funds,
construction of physical
facilities
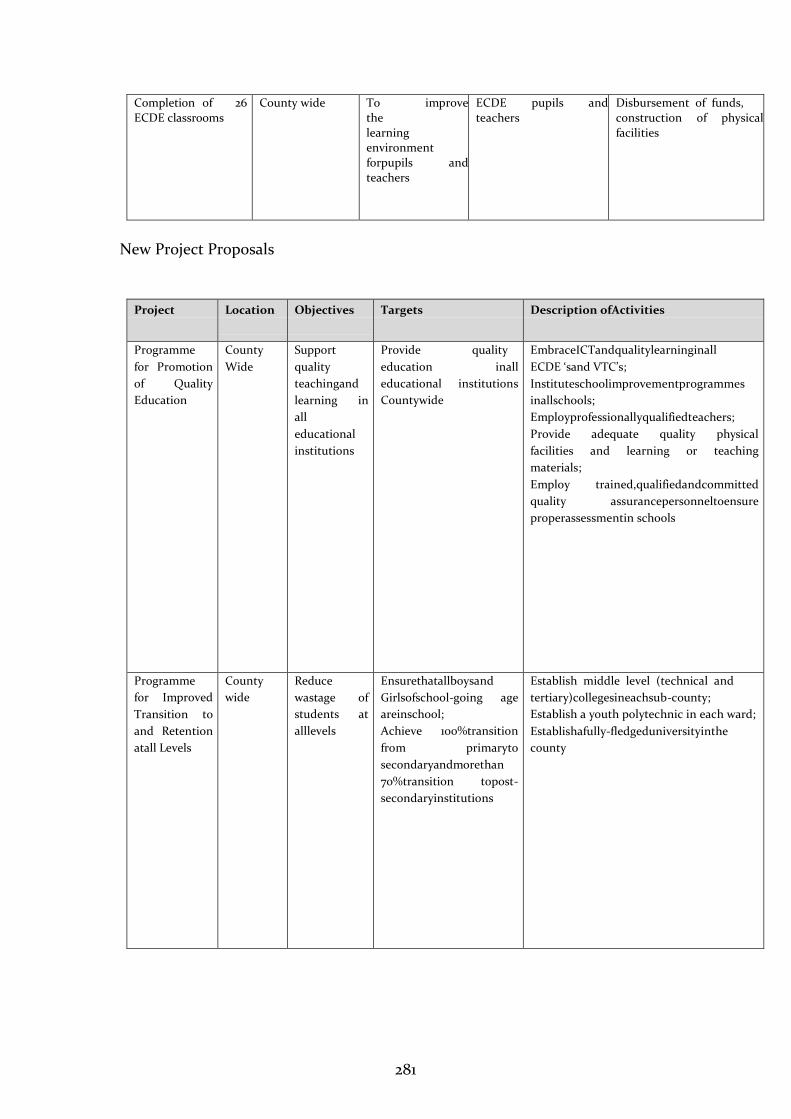
281
Completion of 26
ECDE classrooms
County wide To improve
the
learning environment
forpupils and
teachers
ECDE pupils and
teachers
Disbursement of funds,
construction of physical
facilities
New Project Proposals
Project Location
Objectives
Targets Description ofActivities
Programme
for Promotion
of Quality
Education
County
Wide
Support
quality
teachingand
learning in
all
educational
institutions
Provide quality
education inall
educational institutions
Countywide
EmbraceICTandqualitylearninginall
ECDE ‘sand VTC’s;
Instituteschoolimprovementprogrammes
inallschools;
Employprofessionallyqualifiedteachers;
Provide adequate quality physical
facilities and learning or teaching
materials;
Employ trained,qualifiedandcommitted
quality assurancepersonneltoensure
properassessmentin schools
Programme
for Improved
Transition to
and Retention
atall Levels
County
wide
Reduce
wastage of
students at
alllevels
Ensurethatallboysand
Girlsofschool-going age
areinschool;
Achieve 100%transition
from primaryto
secondaryandmorethan
70%transition topost-
secondaryinstitutions
Establish middle level (technical and
tertiary)collegesineachsub-county;
Establish a youth polytechnic in each ward;
Establishafully-fledgeduniversityinthe
county
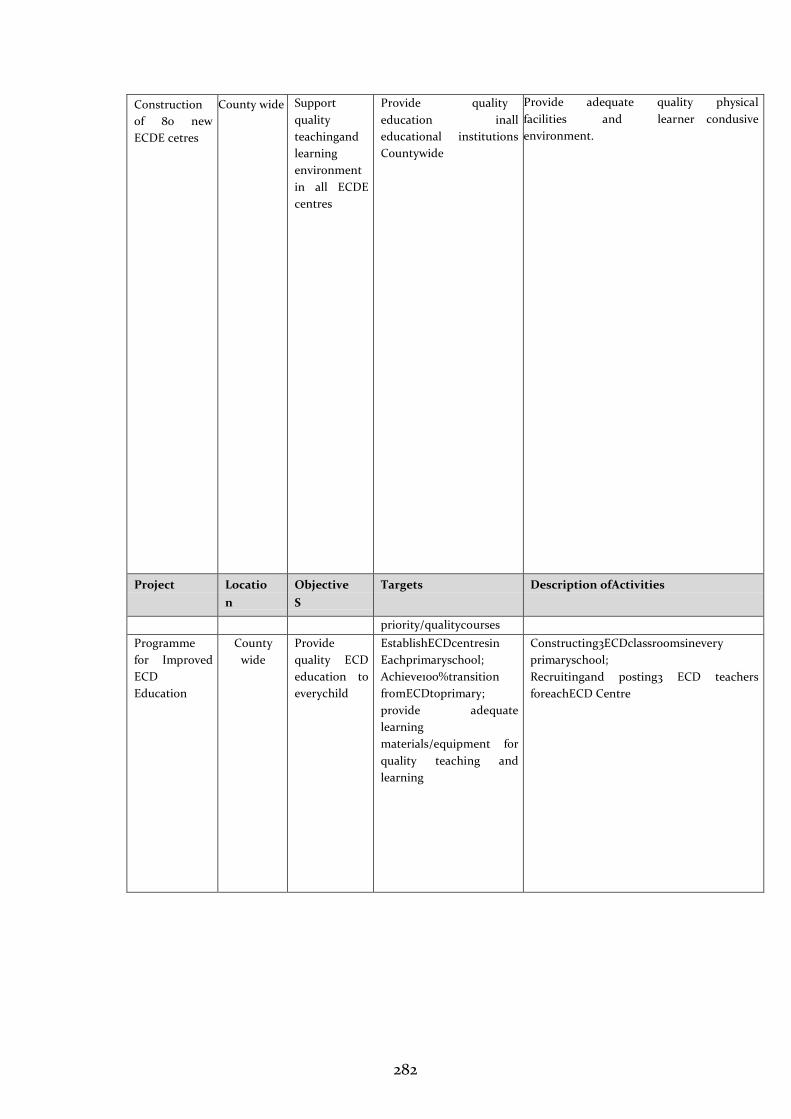
282
Construction
of 80 new
ECDE cetres
County wide Support
quality
teachingand
learning
environment
in all ECDE
centres
Provide quality
education inall
educational institutions
Countywide
Provide adequate quality physical
facilities and learner condusive
environment.
Project Locatio
n
Objective
S
Targets Description ofActivities
priority/qualitycourses
Programme
for Improved
ECD
Education
County
wide
Provide
quality ECD
education to
everychild
EstablishECDcentresin
Eachprimaryschool;
Achieve100%transition
fromECDtoprimary;
provide adequate
learning
materials/equipment for
quality teaching and
learning
Constructing3ECDclassroomsinevery
primaryschool;
Recruitingand posting3 ECD teachers
foreachECD Centre
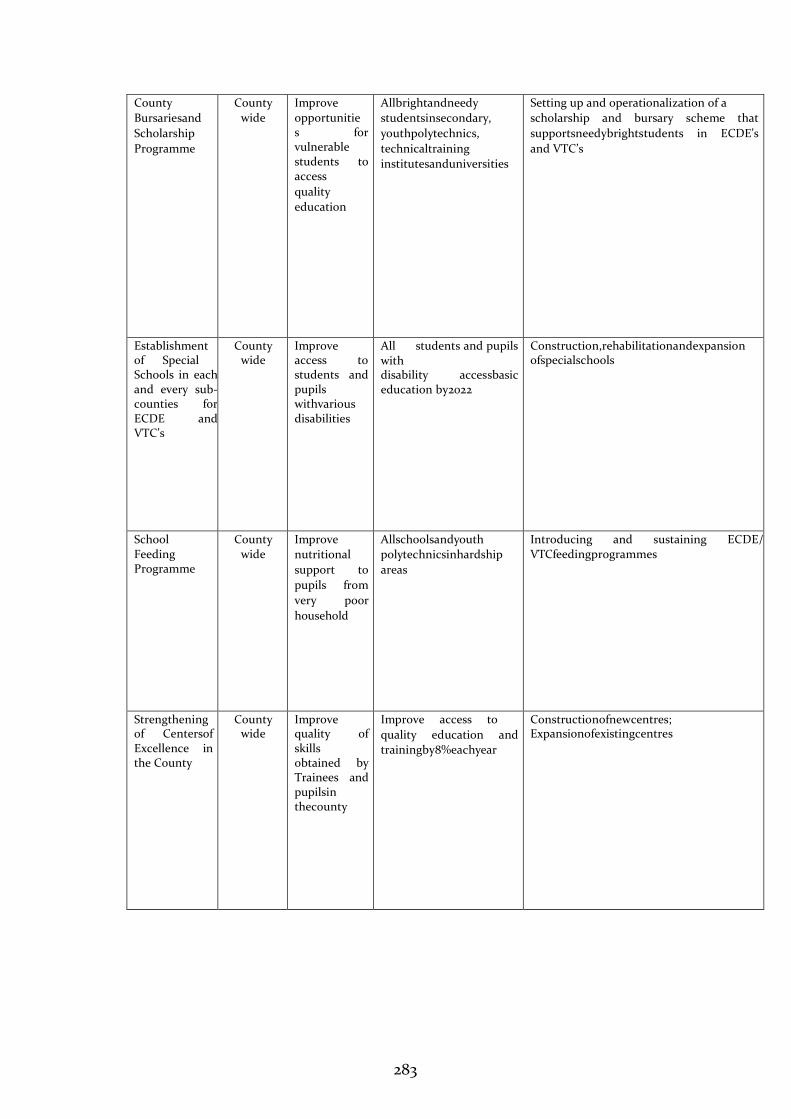
283
County
Bursariesand
Scholarship
Programme
County
wide
Improve
opportunitie s for vulnerable students to access
quality
education
Allbrightandneedy
studentsinsecondary,
youthpolytechnics,
technicaltraining
institutesanduniversities
Setting up and operationalization of a
scholarship and bursary scheme that
supportsneedybrightstudents in ECDE’s
and VTC’s
Establishment of Special Schools in each and every sub-counties for ECDE and VTC’s
County wide
Improve access to students and pupils withvarious disabilities
All students and pupils with disability accessbasic education by2022
Construction,rehabilitationandexpansion ofspecialschools
School Feeding Programme
County wide
Improve
nutritional
support to
pupils from
very poor
household
Allschoolsandyouth
polytechnicsinhardship
areas
Introducing and sustaining ECDE/ VTCfeedingprogrammes
Strengthening of Centersof Excellence in the County
County wide
Improve quality of skills obtained by Trainees and pupilsin thecounty
Improve access to
quality education and
trainingby8%eachyear
Constructionofnewcentres; Expansionofexistingcentres
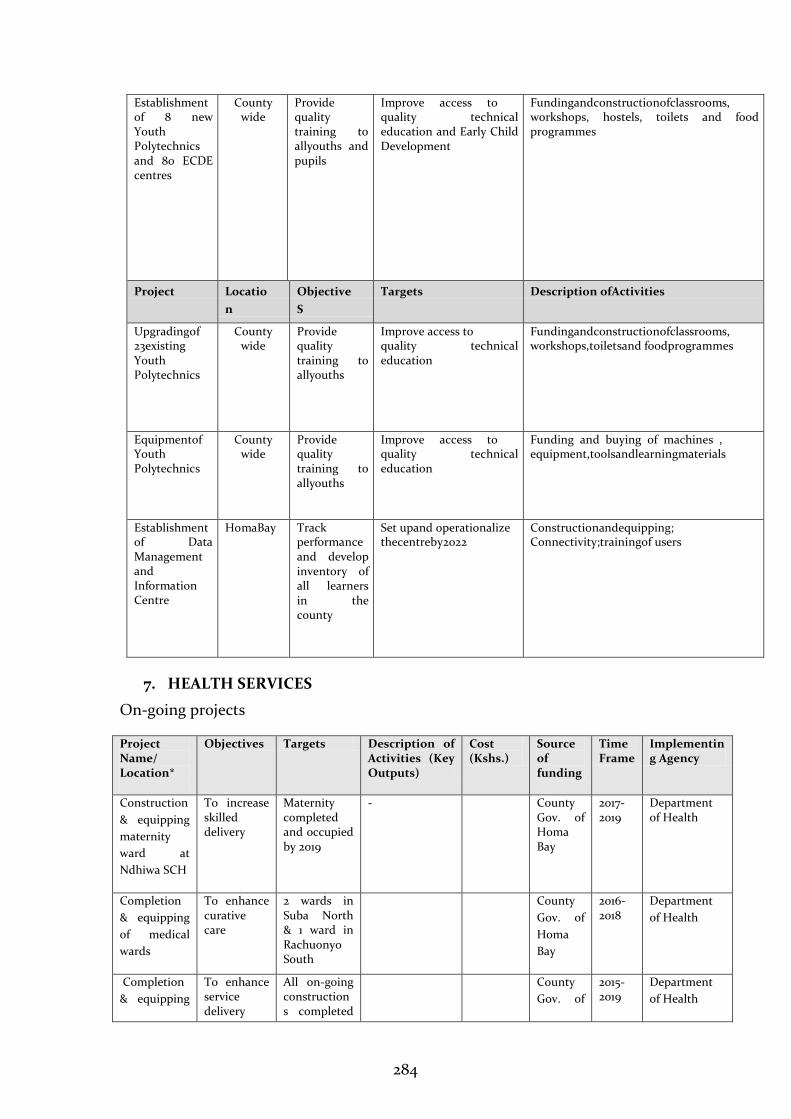
284
Establishment of 8 new Youth Polytechnics and 80 ECDE centres
County wide
Provide quality training to allyouths and pupils
Improve access to quality technical education and Early Child Development
Fundingandconstructionofclassrooms, workshops, hostels, toilets and food programmes
Project Locatio
n
Objective
S
Targets Description ofActivities
Upgradingof 23existing Youth Polytechnics
County wide
Provide quality training to allyouths
Improve access to quality technical education
Fundingandconstructionofclassrooms, workshops,toiletsand foodprogrammes
Equipmentof Youth Polytechnics
County wide
Provide quality training to allyouths
Improve access to quality technical education
Funding and buying of machines , equipment,toolsandlearningmaterials
Establishment of Data Management and Information Centre
HomaBay Track performance and develop inventory of all learners in the county
Set upand operationalize thecentreby2022
Constructionandequipping; Connectivity;trainingof users
7. HEALTH SERVICES
On-going projects
Project Name/ Location*
Objectives Targets Description of Activities (Key Outputs)
Cost (Kshs.)
Source of funding
Time Frame
Implementing Agency
Construction
& equipping
maternity
ward at
Ndhiwa SCH
To increase skilled delivery
Maternity completed and occupied by 2019
- County Gov. of Homa Bay
2017-2019
Department of Health
Completion
& equipping
of medical
wards
To enhance curative care
2 wards in Suba North & 1 ward in Rachuonyo South
County
Gov. of
Homa
Bay
2016-2018
Department
of Health
Completion
& equipping
To enhance service delivery
All on-going constructions completed
County
Gov. of
2015-2019
Department
of Health
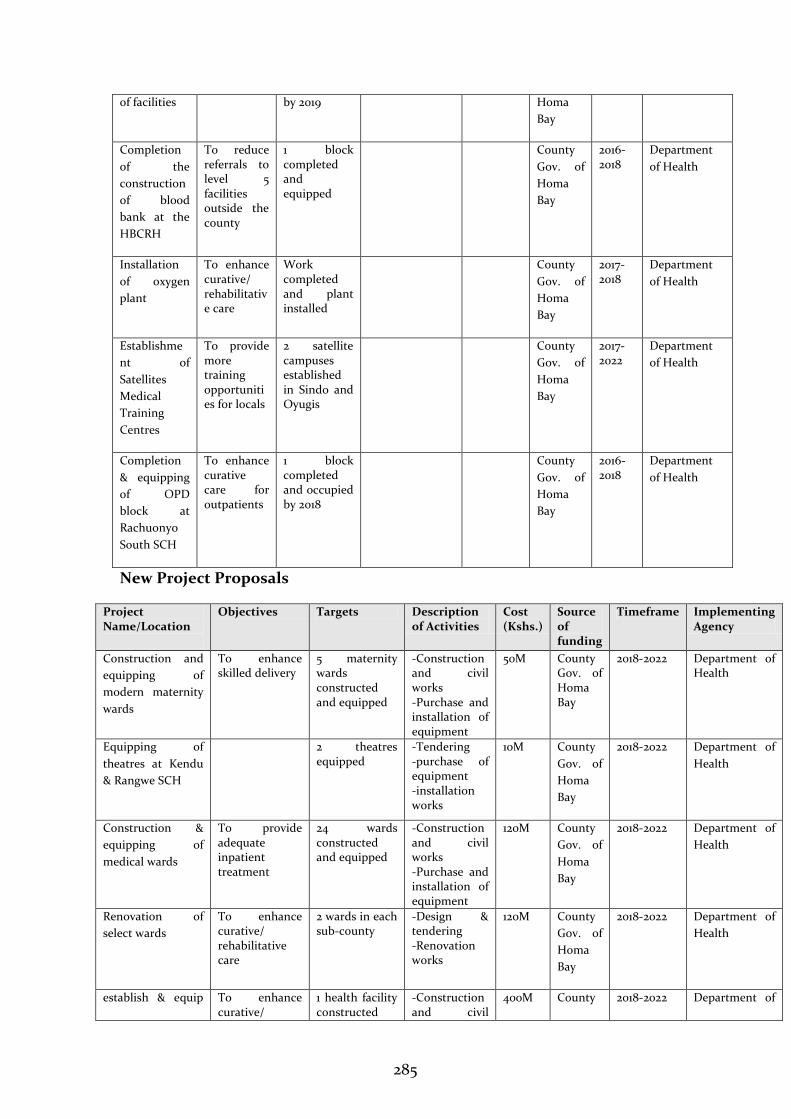
285
of facilities
by 2019 Homa
Bay
Completion
of the
construction
of blood
bank at the
HBCRH
To reduce referrals to level 5 facilities outside the county
1 block completed and equipped
County
Gov. of
Homa
Bay
2016-2018
Department
of Health
Installation
of oxygen
plant
To enhance curative/ rehabilitative care
Work completed and plant installed
County
Gov. of
Homa
Bay
2017-2018
Department
of Health
Establishme
nt of
Satellites
Medical
Training
Centres
To provide more training opportunities for locals
2 satellite campuses established in Sindo and Oyugis
County
Gov. of
Homa
Bay
2017-2022
Department
of Health
Completion
& equipping
of OPD
block at
Rachuonyo
South SCH
To enhance curative care for outpatients
1 block completed and occupied by 2018
County
Gov. of
Homa
Bay
2016-2018
Department
of Health
New Project Proposals
Project Name/Location
Objectives Targets Description of Activities
Cost (Kshs.)
Source of funding
Timeframe Implementing Agency
Construction and
equipping of
modern maternity
wards
To enhance skilled delivery
5 maternity wards constructed and equipped
-Construction and civil works -Purchase and installation of equipment
50M County Gov. of Homa Bay
2018-2022 Department of Health
Equipping of
theatres at Kendu
& Rangwe SCH
2 theatres equipped
-Tendering -purchase of equipment -installation works
10M County
Gov. of
Homa
Bay
2018-2022 Department of
Health
Construction &
equipping of
medical wards
To provide adequate inpatient treatment
24 wards constructed and equipped
-Construction and civil works -Purchase and installation of equipment
120M County
Gov. of
Homa
Bay
2018-2022 Department of
Health
Renovation of
select wards
To enhance curative/ rehabilitative care
2 wards in each sub-county
-Design & tendering -Renovation works
120M County
Gov. of
Homa
Bay
2018-2022 Department of
Health
establish & equip To enhance curative/
1 health facility constructed
-Construction and civil
400M County 2018-2022 Department of
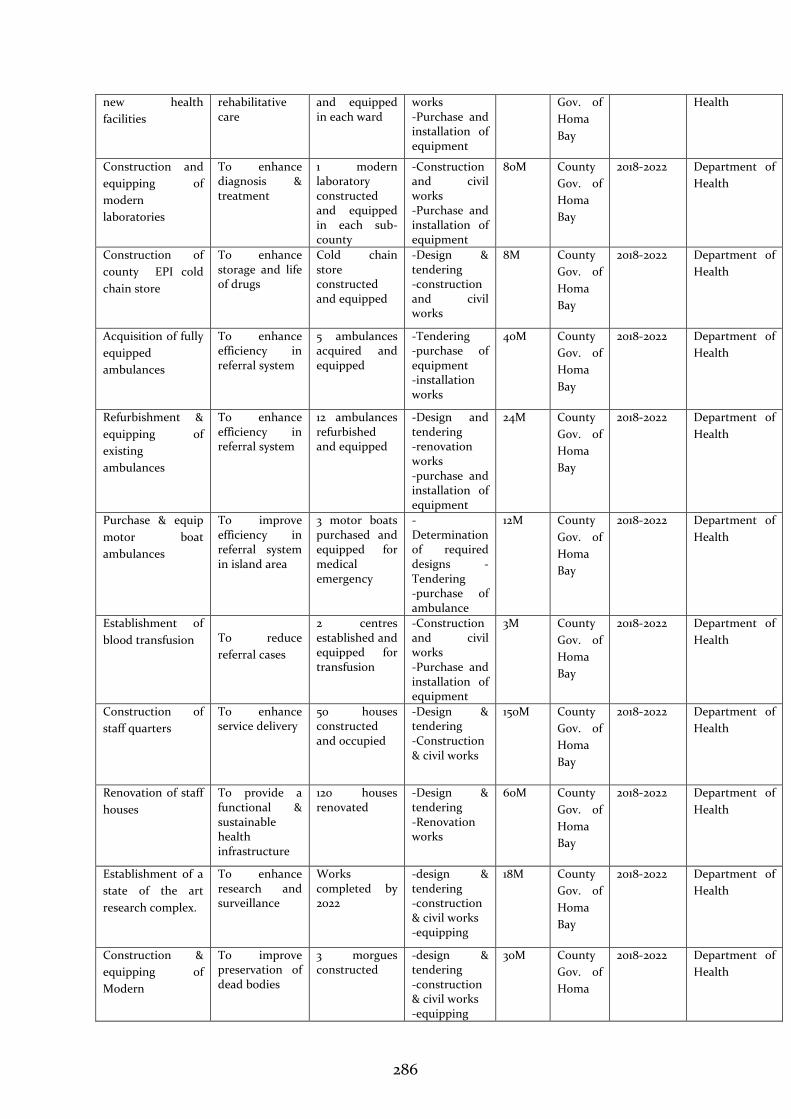
286
new health
facilities
rehabilitative care
and equipped in each ward
works -Purchase and installation of equipment
Gov. of
Homa
Bay
Health
Construction and
equipping of
modern
laboratories
To enhance diagnosis & treatment
1 modern laboratory constructed and equipped in each sub-county
-Construction and civil works -Purchase and installation of equipment
80M County
Gov. of
Homa
Bay
2018-2022 Department of
Health
Construction of
county EPI cold
chain store
To enhance storage and life of drugs
Cold chain store constructed and equipped
-Design & tendering -construction and civil works
8M County
Gov. of
Homa
Bay
2018-2022 Department of
Health
Acquisition of fully
equipped
ambulances
To enhance efficiency in referral system
5 ambulances acquired and equipped
-Tendering -purchase of equipment -installation works
40M County
Gov. of
Homa
Bay
2018-2022 Department of
Health
Refurbishment &
equipping of
existing
ambulances
To enhance efficiency in referral system
12 ambulances refurbished and equipped
-Design and tendering -renovation works -purchase and installation of equipment
24M County
Gov. of
Homa
Bay
2018-2022 Department of
Health
Purchase & equip
motor boat
ambulances
To improve efficiency in referral system in island area
3 motor boats purchased and equipped for medical emergency
-Determination of required designs -Tendering -purchase of ambulance
12M County
Gov. of
Homa
Bay
2018-2022 Department of
Health
Establishment of
blood transfusion
To reduce
referral cases
2 centres established and equipped for transfusion
-Construction and civil works -Purchase and installation of equipment
3M County
Gov. of
Homa
Bay
2018-2022 Department of
Health
Construction of
staff quarters
To enhance service delivery
50 houses constructed and occupied
-Design & tendering -Construction & civil works
150M County
Gov. of
Homa
Bay
2018-2022 Department of
Health
Renovation of staff
houses
To provide a functional & sustainable health infrastructure
120 houses renovated
-Design & tendering -Renovation works
60M County
Gov. of
Homa
Bay
2018-2022 Department of
Health
Establishment of a
state of the art
research complex.
To enhance research and surveillance
Works completed by 2022
-design & tendering -construction & civil works -equipping
18M County
Gov. of
Homa
Bay
2018-2022 Department of
Health
Construction &
equipping of
Modern
To improve preservation of dead bodies
3 morgues constructed
-design & tendering -construction & civil works -equipping
30M County
Gov. of
Homa
2018-2022 Department of
Health
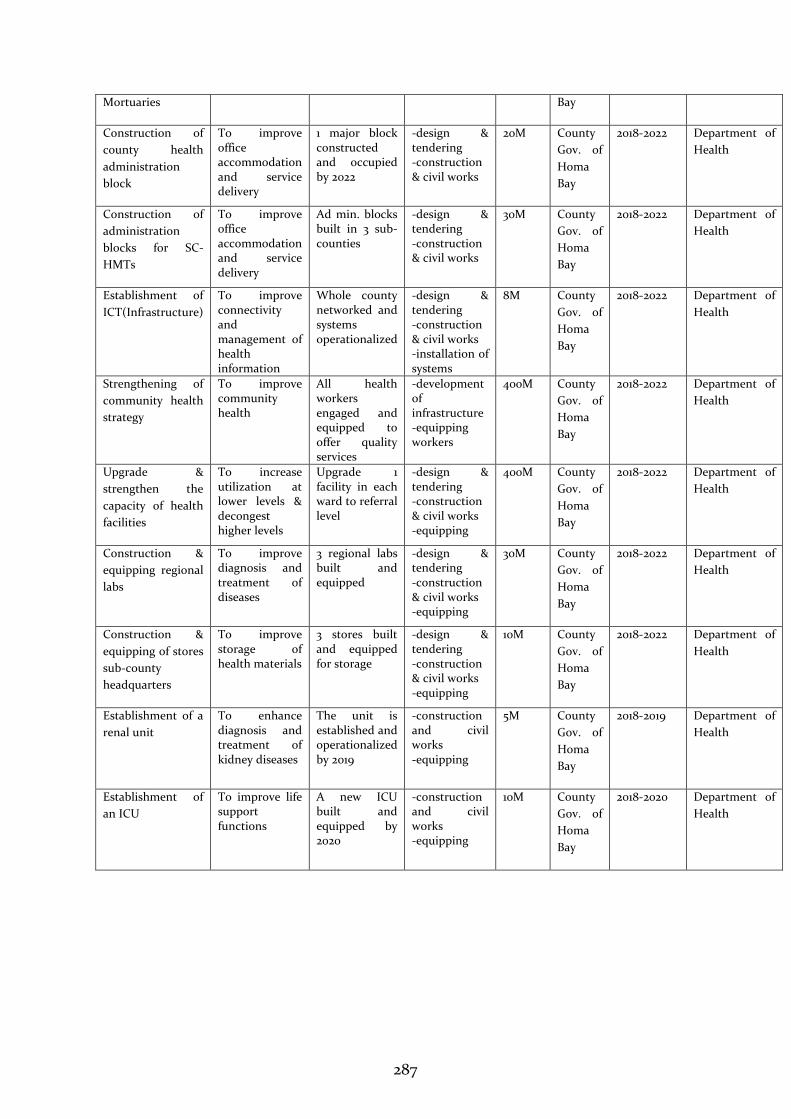
287
Mortuaries Bay
Construction of
county health
administration
block
To improve office accommodation and service delivery
1 major block constructed and occupied by 2022
-design & tendering -construction & civil works
20M County
Gov. of
Homa
Bay
2018-2022 Department of
Health
Construction of
administration
blocks for SC-
HMTs
To improve office accommodation and service delivery
Ad min. blocks built in 3 sub-counties
-design & tendering -construction & civil works
30M County
Gov. of
Homa
Bay
2018-2022 Department of
Health
Establishment of
ICT(Infrastructure)
To improve connectivity and management of health information
Whole county networked and systems operationalized
-design & tendering -construction & civil works -installation of systems
8M County
Gov. of
Homa
Bay
2018-2022 Department of
Health
Strengthening of
community health
strategy
To improve community health
All health workers engaged and equipped to offer quality services
-development of infrastructure -equipping workers
400M County
Gov. of
Homa
Bay
2018-2022 Department of
Health
Upgrade &
strengthen the
capacity of health
facilities
To increase utilization at lower levels & decongest higher levels
Upgrade 1 facility in each ward to referral level
-design & tendering -construction & civil works -equipping
400M County
Gov. of
Homa
Bay
2018-2022 Department of
Health
Construction &
equipping regional
labs
To improve diagnosis and treatment of diseases
3 regional labs built and equipped
-design & tendering -construction & civil works -equipping
30M County
Gov. of
Homa
Bay
2018-2022 Department of
Health
Construction &
equipping of stores
sub-county
headquarters
To improve storage of health materials
3 stores built and equipped for storage
-design & tendering -construction & civil works -equipping
10M
County
Gov. of
Homa
Bay
2018-2022 Department of
Health
Establishment of a
renal unit
To enhance diagnosis and treatment of kidney diseases
The unit is established and operationalized by 2019
-construction and civil works -equipping
5M County
Gov. of
Homa
Bay
2018-2019 Department of
Health
Establishment of
an ICU
To improve life support functions
A new ICU built and equipped by 2020
-construction and civil works -equipping
10M County
Gov. of
Homa
Bay
2018-2020 Department of
Health
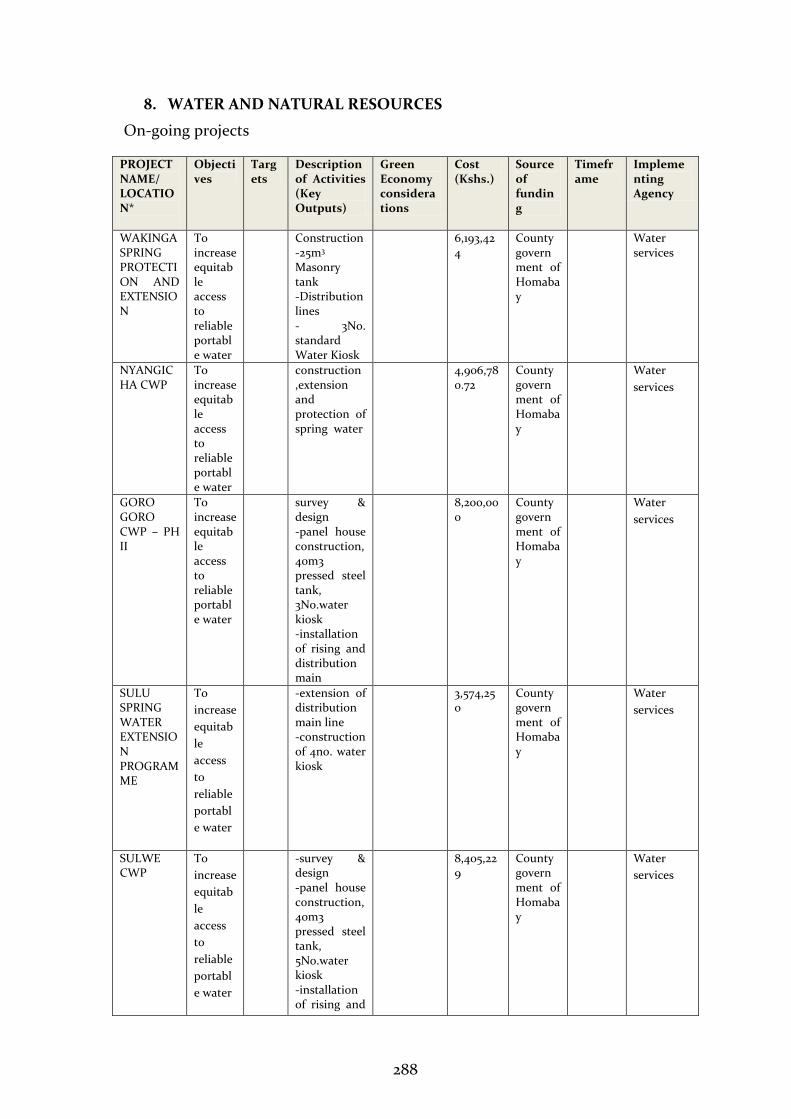
288
8. WATER AND NATURAL RESOURCES
On-going projects
PROJECT NAME/ LOCATION*
Objectives
Targets
Description of Activities (Key Outputs)
Green Economy considerations
Cost (Kshs.)
Source of funding
Timeframe
Implementing Agency
WAKINGA SPRING PROTECTION AND EXTENSION
To increase equitable access to reliable portable water
Construction -25m3 Masonry tank -Distribution lines - 3No. standard Water Kiosk
6,193,424
County government of Homabay
Water services
NYANGICHA CWP
To increase equitable access to reliable portable water
construction ,extension and protection of spring water
4,906,780.72
County government of Homabay
Water
services
GORO GORO CWP – PH II
To increase equitable access to reliable portable water
survey & design -panel house construction,40m3 pressed steel tank, 3No.water kiosk -installation of rising and distribution main
8,200,000
County government of Homabay
Water
services
SULU SPRING WATER EXTENSION PROGRAMME
To
increase
equitab
le
access
to
reliable
portabl
e water
-extension of distribution main line -construction of 4no. water kiosk
3,574,250
County government of Homabay
Water
services
SULWE CWP
To
increase
equitab
le
access
to
reliable
portabl
e water
-survey & design -panel house construction, 40m3 pressed steel tank, 5No.water kiosk -installation of rising and
8,405,229
County government of Homabay
Water
services
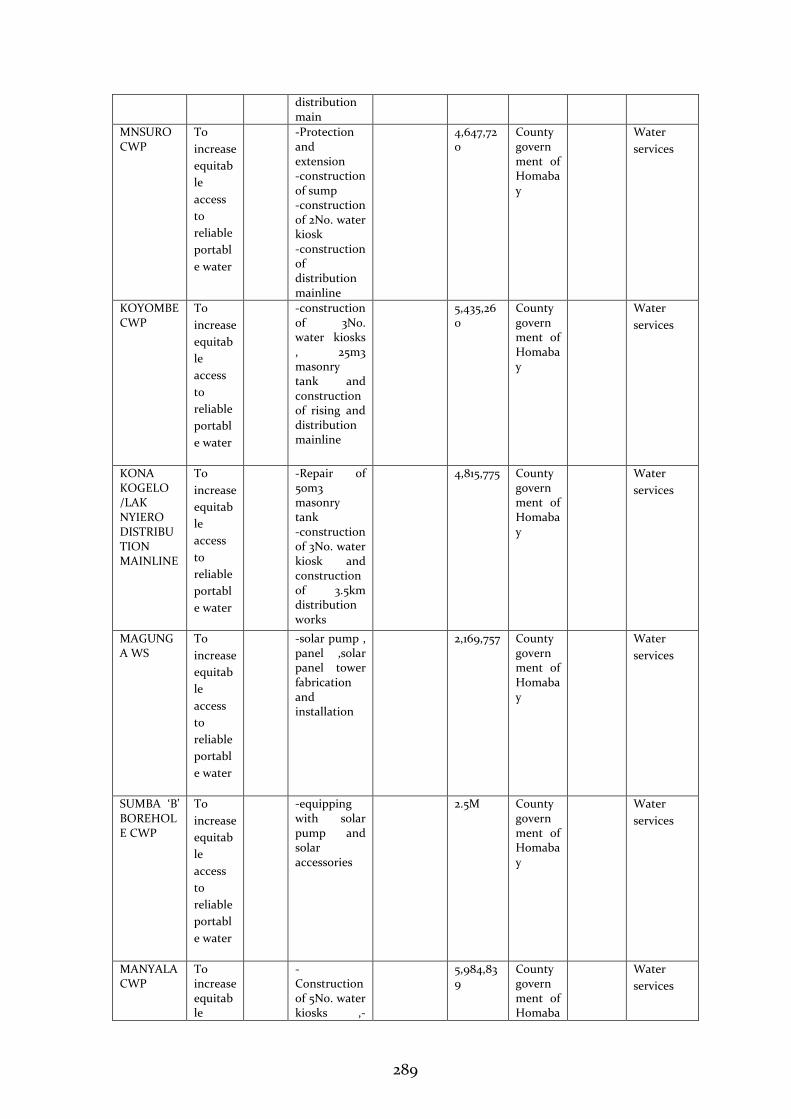
289
distribution main
MNSURO CWP
To
increase
equitab
le
access
to
reliable
portabl
e water
-Protection and extension -construction of sump -construction of 2No. water kiosk -construction of distribution mainline
4,647,720
County government of Homabay
Water
services
KOYOMBE CWP
To
increase
equitab
le
access
to
reliable
portabl
e water
-construction of 3No. water kiosks , 25m3 masonry tank and construction of rising and distribution mainline
5,435,260
County government of Homabay
Water
services
KONA KOGELO /LAK NYIERO DISTRIBUTION MAINLINE
To
increase
equitab
le
access
to
reliable
portabl
e water
-Repair of 50m3 masonry tank -construction of 3No. water kiosk and construction of 3.5km distribution works
4,815,775 County government of Homabay
Water
services
MAGUNGA WS
To
increase
equitab
le
access
to
reliable
portabl
e water
-solar pump , panel ,solar panel tower fabrication and installation
2,169,757 County government of Homabay
Water
services
SUMBA ‘B’ BOREHOLE CWP
To
increase
equitab
le
access
to
reliable
portabl
e water
-equipping with solar pump and solar accessories
2.5M County government of Homabay
Water
services
MANYALA CWP
To increase equitable
- Construction of 5No. water kiosks ,-
5,984,839
County government of Homaba
Water
services
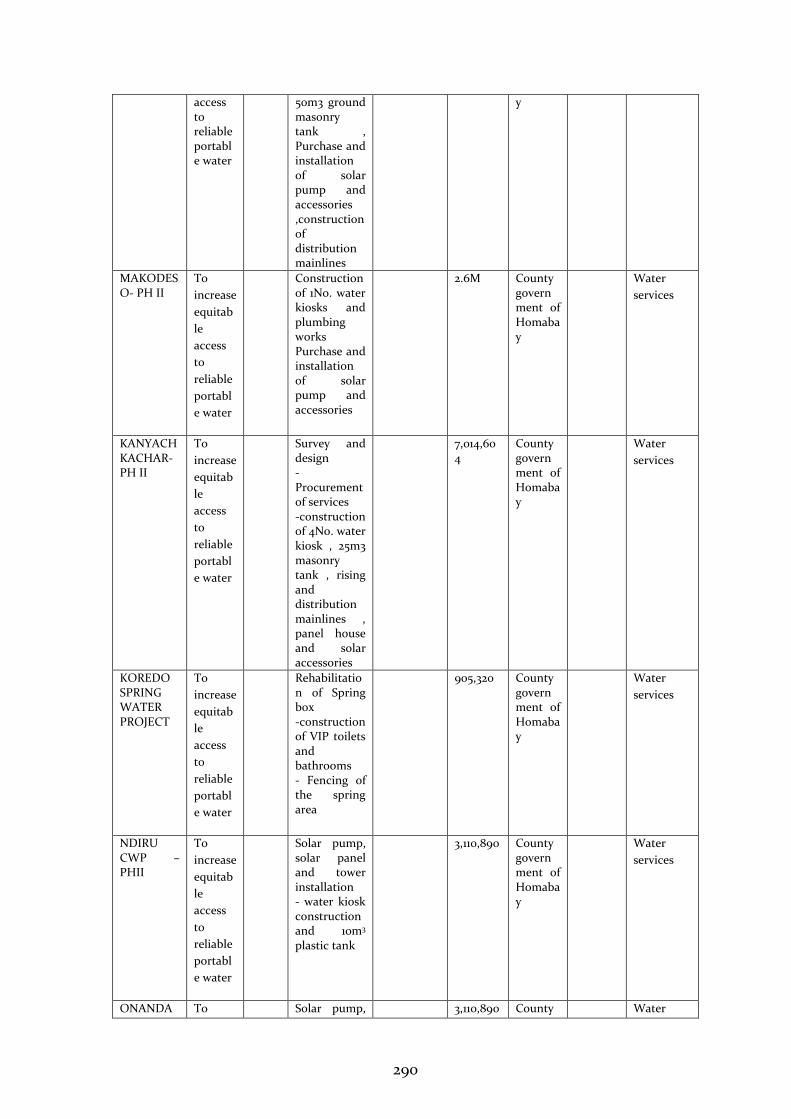
290
access to reliable portable water
50m3 ground masonry tank , Purchase and installation of solar pump and accessories ,construction of distribution mainlines
y
MAKODESO- PH II
To
increase
equitab
le
access
to
reliable
portabl
e water
Construction of 1No. water kiosks and plumbing works Purchase and installation of solar pump and accessories
2.6M County government of Homabay
Water
services
KANYACH KACHAR-PH II
To
increase
equitab
le
access
to
reliable
portabl
e water
Survey and design -Procurement of services -construction of 4No. water kiosk , 25m3 masonry tank , rising and distribution mainlines , panel house and solar accessories
7,014,604
County government of Homabay
Water
services
KOREDO SPRING WATER PROJECT
To
increase
equitab
le
access
to
reliable
portabl
e water
Rehabilitation of Spring box -construction of VIP toilets and bathrooms - Fencing of the spring area
905,320 County government of Homabay
Water
services
NDIRU CWP – PHII
To
increase
equitab
le
access
to
reliable
portabl
e water
Solar pump, solar panel and tower installation - water kiosk construction and 10m3 plastic tank
3,110,890 County government of Homabay
Water
services
ONANDA To Solar pump, 3,110,890 County Water
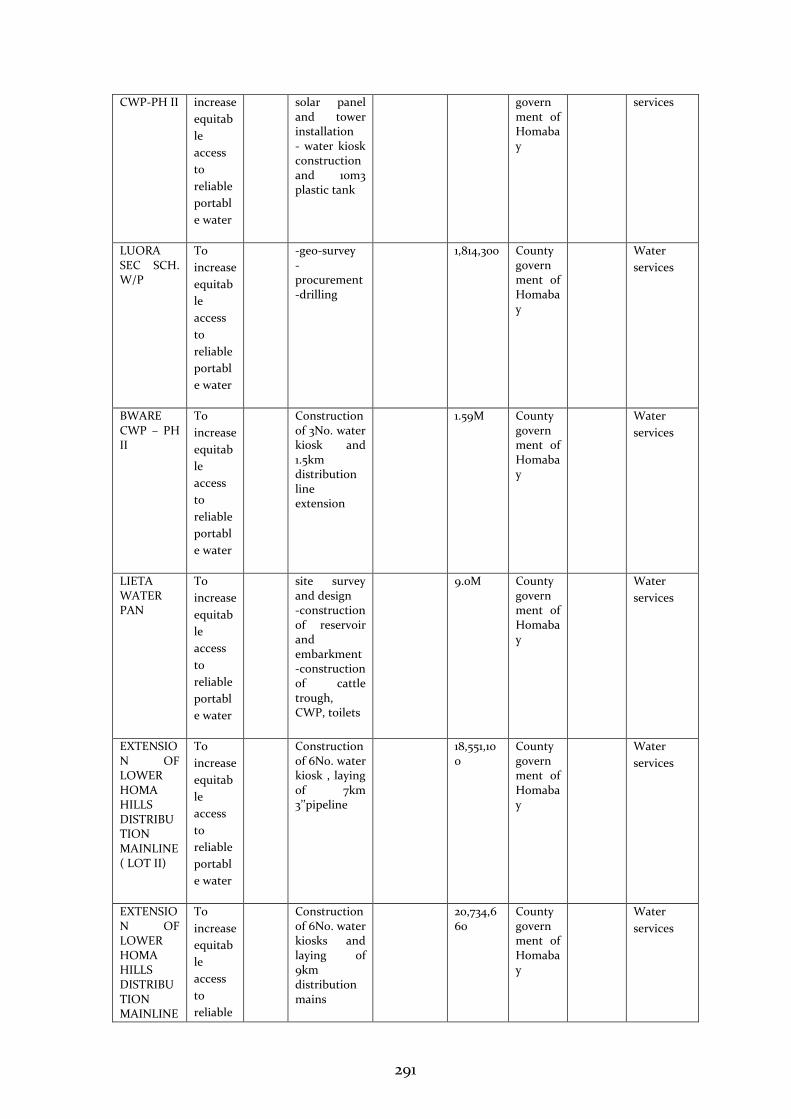
291
CWP-PH II increase
equitab
le
access
to
reliable
portabl
e water
solar panel and tower installation - water kiosk construction and 10m3 plastic tank
government of Homabay
services
LUORA SEC SCH. W/P
To
increase
equitab
le
access
to
reliable
portabl
e water
-geo-survey -procurement -drilling
1,814,300 County government of Homabay
Water
services
BWARE CWP – PH II
To
increase
equitab
le
access
to
reliable
portabl
e water
Construction of 3No. water kiosk and 1.5km distribution line extension
1.59M County government of Homabay
Water
services
LIETA WATER PAN
To
increase
equitab
le
access
to
reliable
portabl
e water
site survey and design -construction of reservoir and embarkment -construction of cattle trough, CWP, toilets
9.0M County government of Homabay
Water
services
EXTENSION OF LOWER HOMA HILLS DISTRIBUTION MAINLINE ( LOT II)
To
increase
equitab
le
access
to
reliable
portabl
e water
Construction of 6No. water kiosk , laying of 7km 3’’pipeline
18,551,100
County government of Homabay
Water
services
EXTENSION OF LOWER HOMA HILLS DISTRIBUTION MAINLINE
To
increase
equitab
le
access
to
reliable
Construction of 6No. water kiosks and laying of 9km distribution mains
20,734,660
County government of Homabay
Water
services
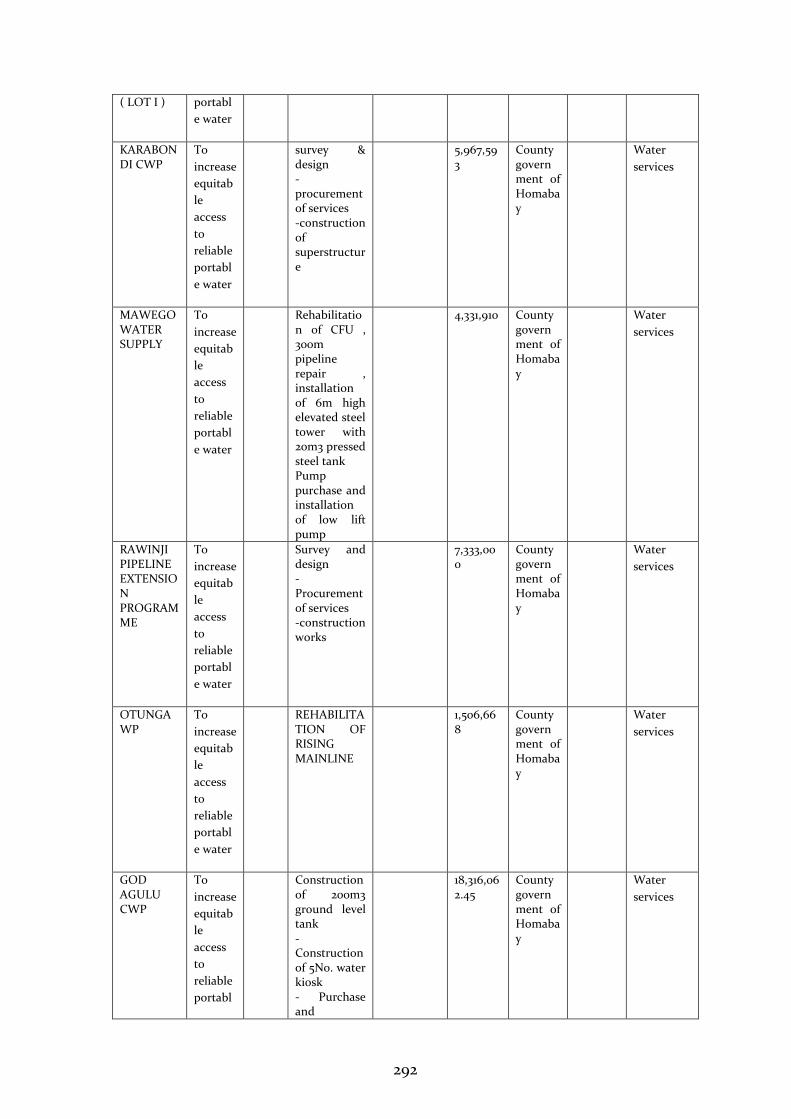
292
( LOT I ) portabl
e water
KARABONDI CWP
To
increase
equitab
le
access
to
reliable
portabl
e water
survey & design - procurement of services -construction of superstructure
5,967,593
County government of Homabay
Water
services
MAWEGO WATER SUPPLY
To
increase
equitab
le
access
to
reliable
portabl
e water
Rehabilitation of CFU , 300m pipeline repair , installation of 6m high elevated steel tower with 20m3 pressed steel tank Pump purchase and installation of low lift pump
4,331,910 County government of Homabay
Water
services
RAWINJI PIPELINE EXTENSION PROGRAMME
To
increase
equitab
le
access
to
reliable
portabl
e water
Survey and design -Procurement of services -construction works
7,333,000
County government of Homabay
Water
services
OTUNGA WP
To
increase
equitab
le
access
to
reliable
portabl
e water
REHABILITATION OF RISING MAINLINE
1,506,668
County government of Homabay
Water
services
GOD AGULU CWP
To
increase
equitab
le
access
to
reliable
portabl
Construction of 200m3 ground level tank - Construction of 5No. water kiosk - Purchase and
18,316,062.45
County government of Homabay
Water
services
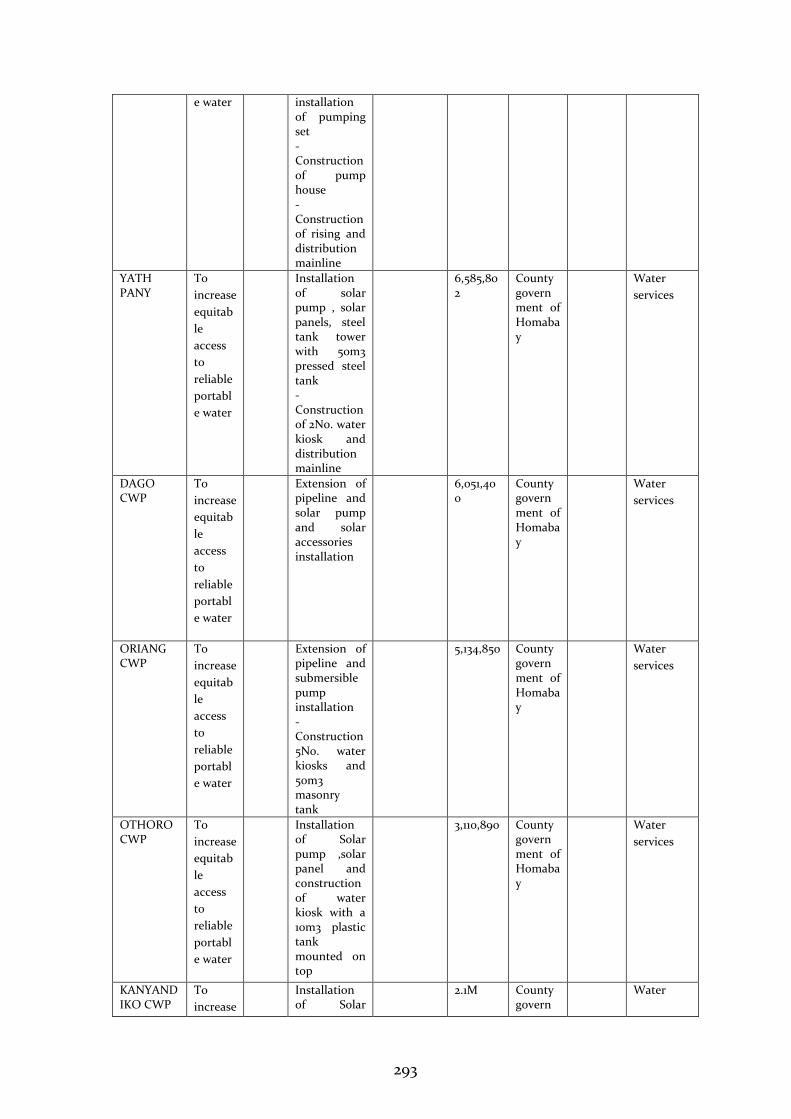
293
e water installation of pumping set - Construction of pump house -Construction of rising and distribution mainline
YATH PANY
To
increase
equitab
le
access
to
reliable
portabl
e water
Installation of solar pump , solar panels, steel tank tower with 50m3 pressed steel tank - Construction of 2No. water kiosk and distribution mainline
6,585,802
County government of Homabay
Water
services
DAGO CWP
To
increase
equitab
le
access
to
reliable
portabl
e water
Extension of pipeline and solar pump and solar accessories installation
6,051,400
County government of Homabay
Water
services
ORIANG CWP
To
increase
equitab
le
access
to
reliable
portabl
e water
Extension of pipeline and submersible pump installation -Construction 5No. water kiosks and 50m3 masonry tank
5,134,850 County government of Homabay
Water
services
OTHORO CWP
To
increase
equitab
le
access
to
reliable
portabl
e water
Installation of Solar pump ,solar panel and construction of water kiosk with a 10m3 plastic tank mounted on top
3,110,890 County government of Homabay
Water
services
KANYANDIKO CWP
To
increase
Installation of Solar
2.1M County govern
Water
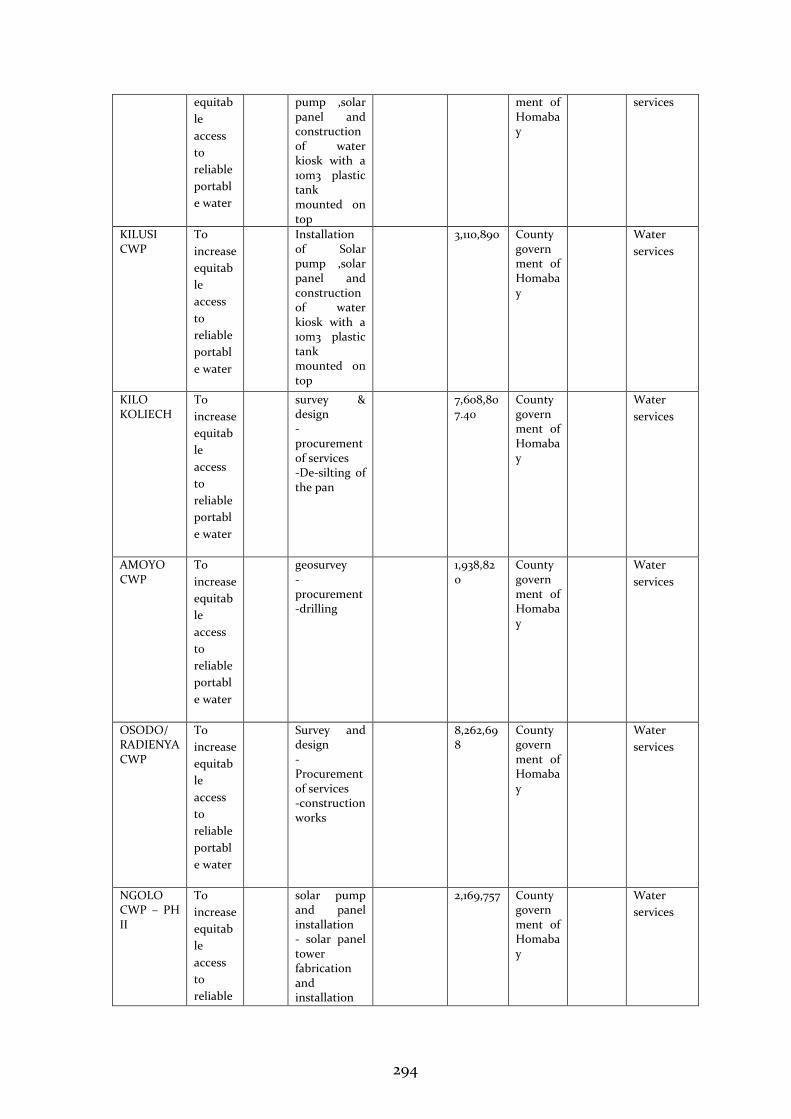
294
equitab
le
access
to
reliable
portabl
e water
pump ,solar panel and construction of water kiosk with a 10m3 plastic tank mounted on top
ment of Homabay
services
KILUSI CWP
To
increase
equitab
le
access
to
reliable
portabl
e water
Installation of Solar pump ,solar panel and construction of water kiosk with a 10m3 plastic tank mounted on top
3,110,890 County government of Homabay
Water
services
KILO KOLIECH
To
increase
equitab
le
access
to
reliable
portabl
e water
survey & design - procurement of services -De-silting of the pan
7,608,807.40
County government of Homabay
Water
services
AMOYO CWP
To
increase
equitab
le
access
to
reliable
portabl
e water
geosurvey -procurement -drilling
1,938,820
County government of Homabay
Water
services
OSODO/ RADIENYA CWP
To
increase
equitab
le
access
to
reliable
portabl
e water
Survey and design -Procurement of services -construction works
8,262,698
County government of Homabay
Water
services
NGOLO CWP – PH II
To
increase
equitab
le
access
to
reliable
solar pump and panel installation - solar panel tower fabrication and installation
2,169,757 County government of Homabay
Water
services
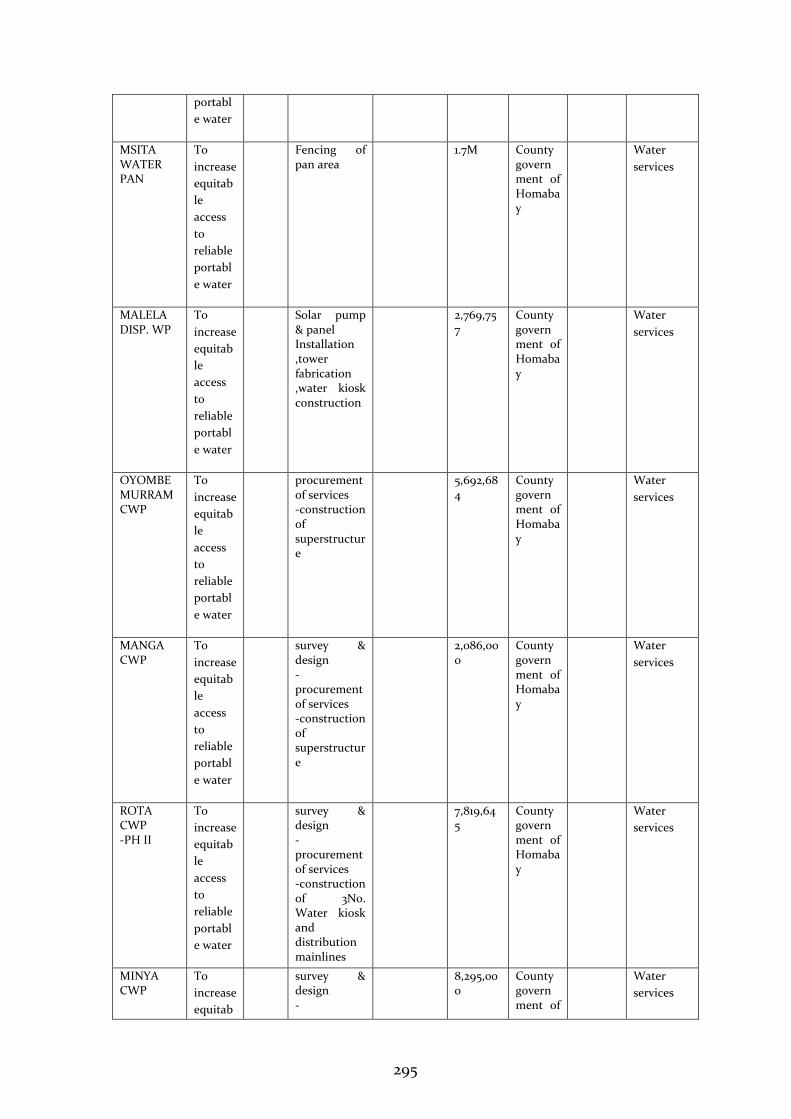
295
portabl
e water
MSITA WATER PAN
To
increase
equitab
le
access
to
reliable
portabl
e water
Fencing of pan area
1.7M County government of Homabay
Water
services
MALELA DISP. WP
To
increase
equitab
le
access
to
reliable
portabl
e water
Solar pump & panel Installation ,tower fabrication ,water kiosk construction
2,769,757
County government of Homabay
Water
services
OYOMBE MURRAM CWP
To
increase
equitab
le
access
to
reliable
portabl
e water
procurement of services -construction of superstructure
5,692,684
County government of Homabay
Water
services
MANGA CWP
To
increase
equitab
le
access
to
reliable
portabl
e water
survey & design - procurement of services -construction of superstructure
2,086,000
County government of Homabay
Water
services
ROTA CWP -PH II
To
increase
equitab
le
access
to
reliable
portabl
e water
survey & design - procurement of services -construction of 3No. Water kiosk and distribution mainlines
7,819,645
County government of Homabay
Water
services
MINYA CWP
To
increase
equitab
survey & design -
8,295,000
County government of
Water
services
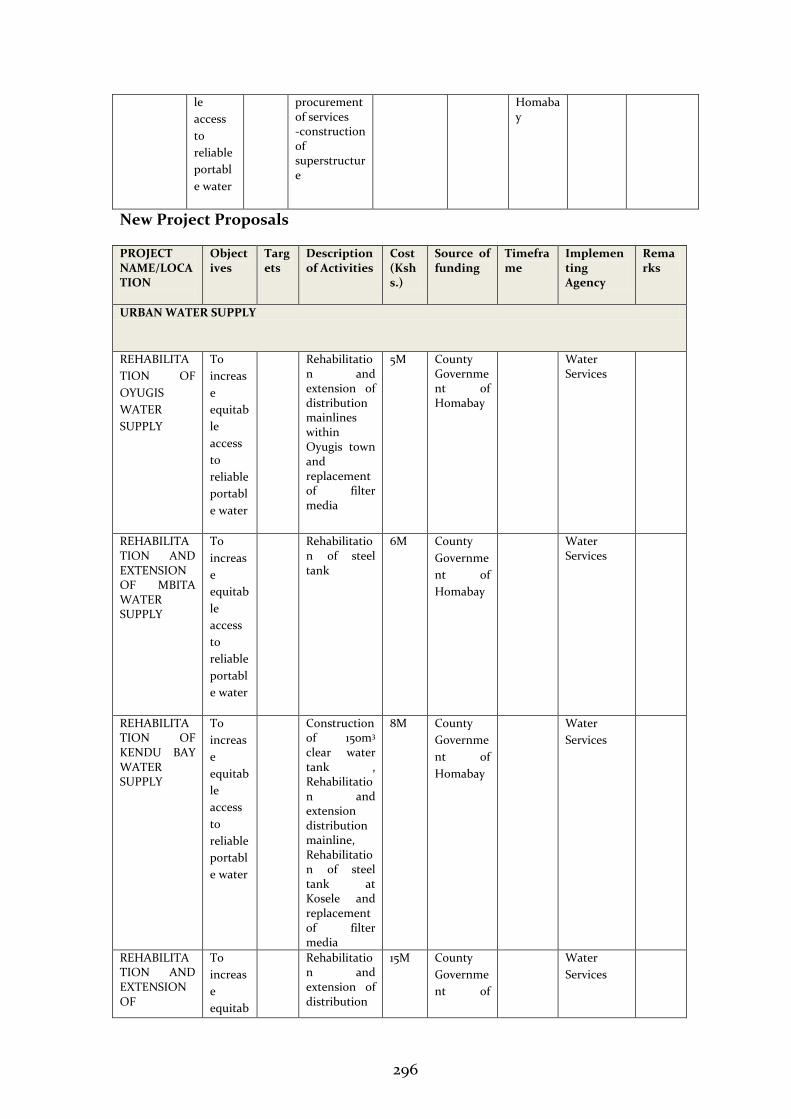
296
le
access
to
reliable
portabl
e water
procurement of services -construction of superstructure
Homabay
New Project Proposals
PROJECT NAME/LOCATION
Objectives
Targets
Description of Activities
Cost (Kshs.)
Source of funding
Timeframe
Implementing Agency
Remarks
URBAN WATER SUPPLY
REHABILITA
TION OF
OYUGIS
WATER
SUPPLY
To
increas
e
equitab
le
access
to
reliable
portabl
e water
Rehabilitation and extension of distribution mainlines within Oyugis town and replacement of filter media
5M County Government of Homabay
Water Services
REHABILITATION AND EXTENSION OF MBITA WATER SUPPLY
To
increas
e
equitab
le
access
to
reliable
portabl
e water
Rehabilitation of steel tank
6M County
Governme
nt of
Homabay
Water Services
REHABILITATION OF KENDU BAY WATER SUPPLY
To
increas
e
equitab
le
access
to
reliable
portabl
e water
Construction of 150m3 clear water tank , Rehabilitation and extension distribution mainline, Rehabilitation of steel tank at Kosele and replacement of filter media
8M County
Governme
nt of
Homabay
Water
Services
REHABILITATION AND EXTENSION OF
To
increas
e
equitab
Rehabilitation and extension of distribution
15M County
Governme
nt of
Water
Services
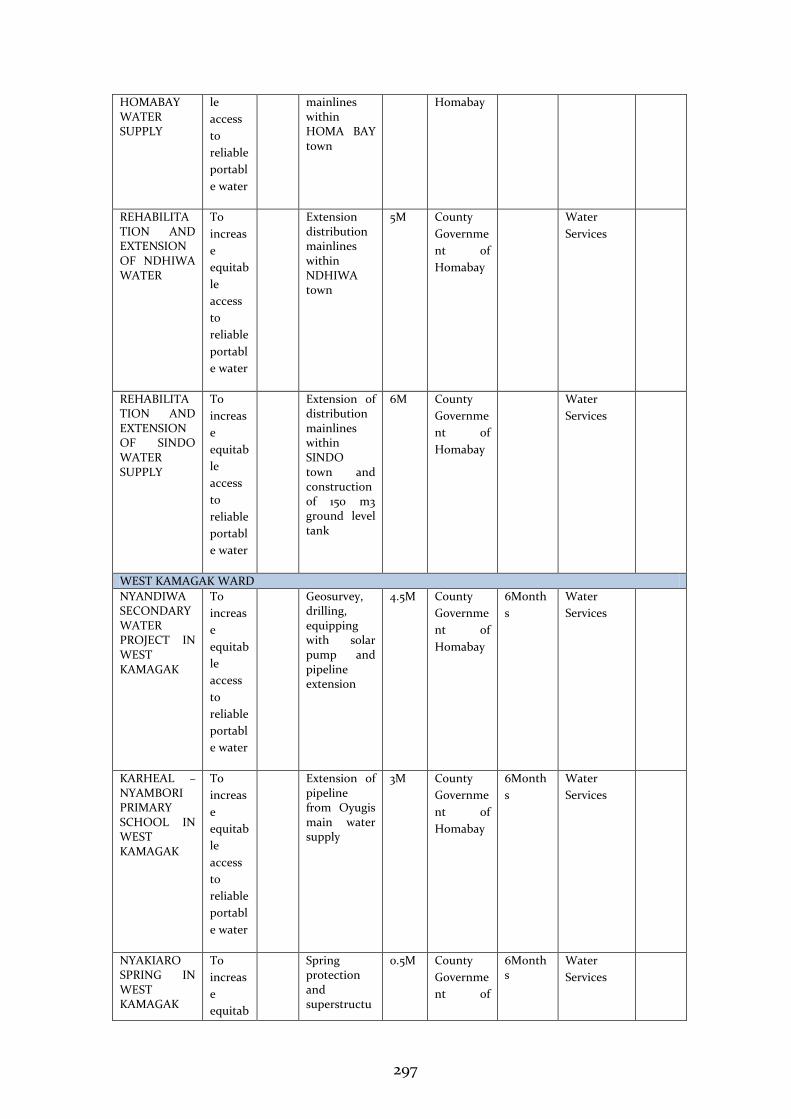
297
HOMABAY WATER SUPPLY
le
access
to
reliable
portabl
e water
mainlines within HOMA BAY town
Homabay
REHABILITATION AND EXTENSION OF NDHIWA WATER
To
increas
e
equitab
le
access
to
reliable
portabl
e water
Extension distribution mainlines within NDHIWA town
5M County
Governme
nt of
Homabay
Water
Services
REHABILITATION AND EXTENSION OF SINDO WATER SUPPLY
To
increas
e
equitab
le
access
to
reliable
portabl
e water
Extension of distribution mainlines within SINDO town and construction of 150 m3 ground level tank
6M County
Governme
nt of
Homabay
Water
Services
WEST KAMAGAK WARD
NYANDIWA SECONDARY WATER PROJECT IN WEST KAMAGAK
To
increas
e
equitab
le
access
to
reliable
portabl
e water
Geosurvey, drilling, equipping with solar pump and pipeline extension
4.5M County
Governme
nt of
Homabay
6Month
s
Water
Services
KARHEAL – NYAMBORI PRIMARY SCHOOL IN WEST KAMAGAK
To
increas
e
equitab
le
access
to
reliable
portabl
e water
Extension of pipeline from Oyugis main water supply
3M County
Governme
nt of
Homabay
6Month
s
Water
Services
NYAKIARO SPRING IN WEST KAMAGAK
To
increas
e
equitab
Spring protection and superstructu
0.5M County
Governme
nt of
6Months
Water
Services
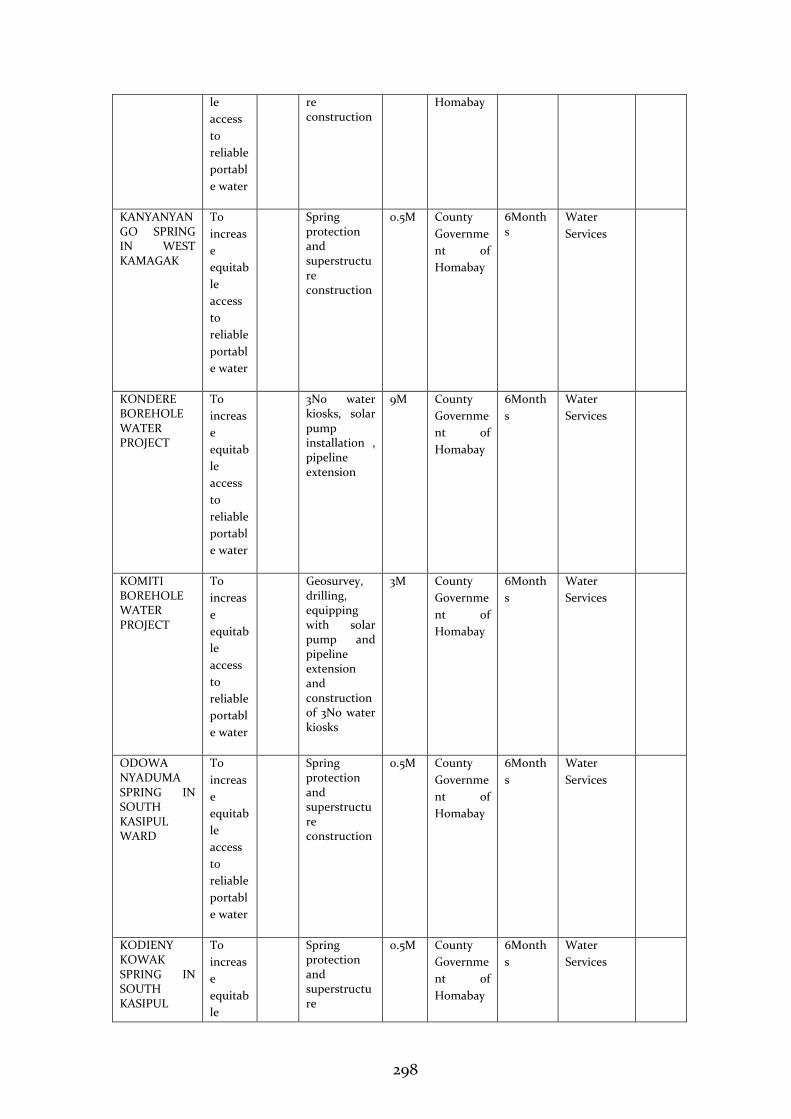
298
le
access
to
reliable
portabl
e water
re construction
Homabay
KANYANYANGO SPRING IN WEST KAMAGAK
To
increas
e
equitab
le
access
to
reliable
portabl
e water
Spring protection and superstructure construction
0.5M County
Governme
nt of
Homabay
6Months
Water
Services
KONDERE BOREHOLE WATER PROJECT
To
increas
e
equitab
le
access
to
reliable
portabl
e water
3No water kiosks, solar pump installation , pipeline extension
9M County
Governme
nt of
Homabay
6Month
s
Water
Services
KOMITI BOREHOLE WATER PROJECT
To
increas
e
equitab
le
access
to
reliable
portabl
e water
Geosurvey, drilling, equipping with solar pump and pipeline extension and construction of 3No water kiosks
3M County
Governme
nt of
Homabay
6Month
s
Water
Services
ODOWA NYADUMA SPRING IN SOUTH KASIPUL WARD
To
increas
e
equitab
le
access
to
reliable
portabl
e water
Spring protection and superstructure construction
0.5M County
Governme
nt of
Homabay
6Month
s
Water
Services
KODIENY KOWAK SPRING IN SOUTH KASIPUL
To
increas
e
equitab
le
Spring protection and superstructure
0.5M County
Governme
nt of
Homabay
6Month
s
Water
Services
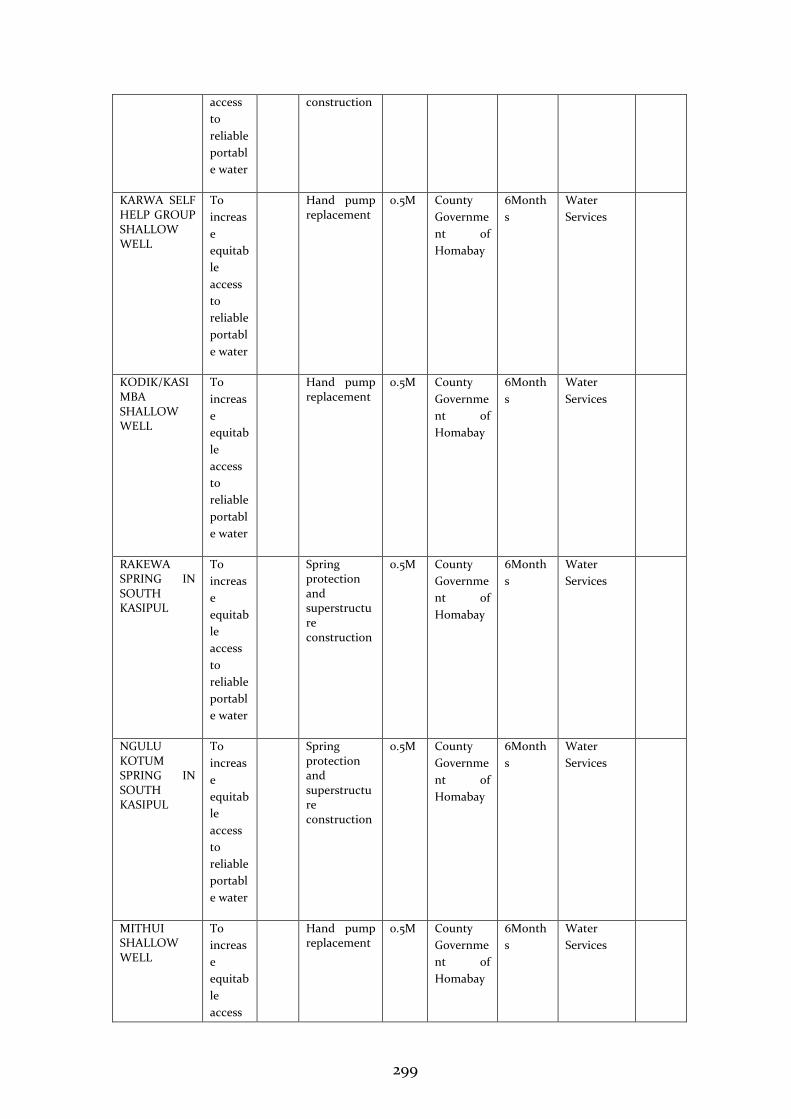
299
access
to
reliable
portabl
e water
construction
KARWA SELF HELP GROUP SHALLOW WELL
To
increas
e
equitab
le
access
to
reliable
portabl
e water
Hand pump replacement
0.5M County
Governme
nt of
Homabay
6Month
s
Water
Services
KODIK/KASIMBA SHALLOW WELL
To
increas
e
equitab
le
access
to
reliable
portabl
e water
Hand pump replacement
0.5M County
Governme
nt of
Homabay
6Month
s
Water
Services
RAKEWA SPRING IN SOUTH KASIPUL
To
increas
e
equitab
le
access
to
reliable
portabl
e water
Spring protection and superstructure construction
0.5M County
Governme
nt of
Homabay
6Month
s
Water
Services
NGULU KOTUM SPRING IN SOUTH KASIPUL
To
increas
e
equitab
le
access
to
reliable
portabl
e water
Spring protection and superstructure construction
0.5M County
Governme
nt of
Homabay
6Month
s
Water
Services
MITHUI SHALLOW WELL
To
increas
e
equitab
le
access
Hand pump replacement
0.5M County
Governme
nt of
Homabay
6Month
s
Water
Services
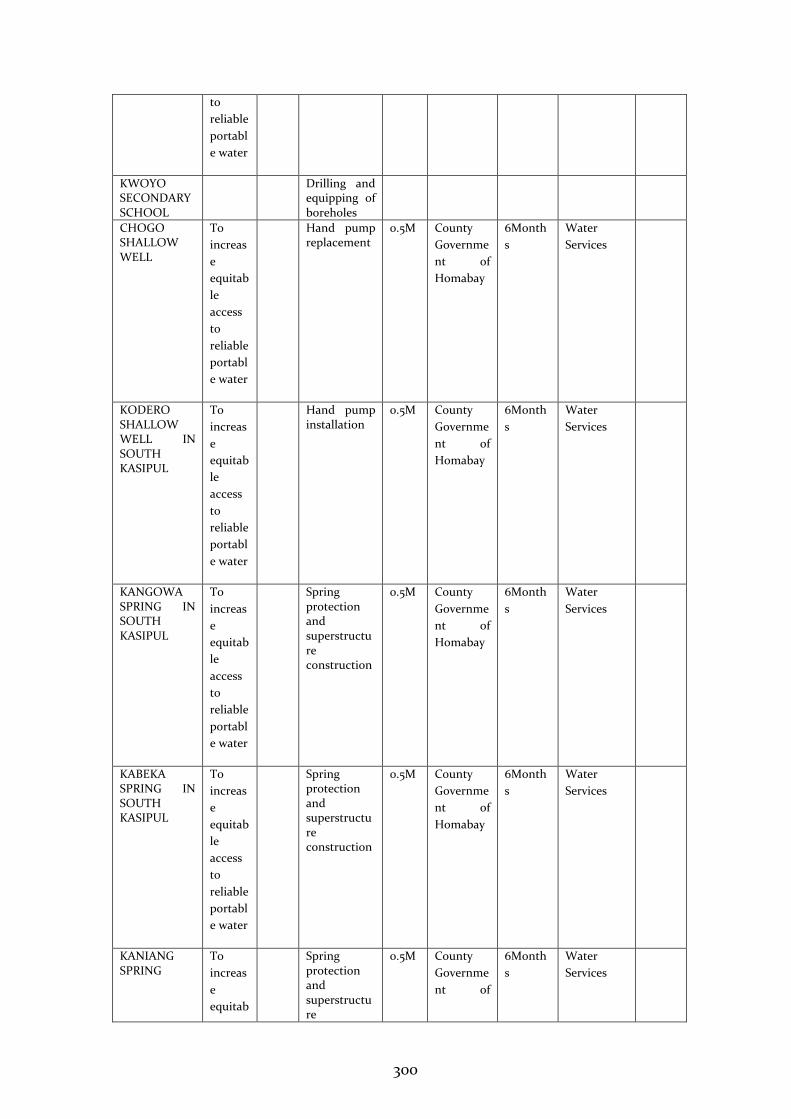
300
to
reliable
portabl
e water
KWOYO SECONDARY SCHOOL
Drilling and equipping of boreholes
CHOGO SHALLOW WELL
To
increas
e
equitab
le
access
to
reliable
portabl
e water
Hand pump replacement
0.5M County
Governme
nt of
Homabay
6Month
s
Water
Services
KODERO SHALLOW WELL IN SOUTH KASIPUL
To
increas
e
equitab
le
access
to
reliable
portabl
e water
Hand pump installation
0.5M County
Governme
nt of
Homabay
6Month
s
Water
Services
KANGOWA SPRING IN SOUTH KASIPUL
To
increas
e
equitab
le
access
to
reliable
portabl
e water
Spring protection and superstructure construction
0.5M County
Governme
nt of
Homabay
6Month
s
Water
Services
KABEKA SPRING IN SOUTH KASIPUL
To
increas
e
equitab
le
access
to
reliable
portabl
e water
Spring protection and superstructure construction
0.5M County
Governme
nt of
Homabay
6Month
s
Water
Services
KANIANG SPRING
To
increas
e
equitab
Spring protection and superstructure
0.5M County
Governme
nt of
6Month
s
Water
Services
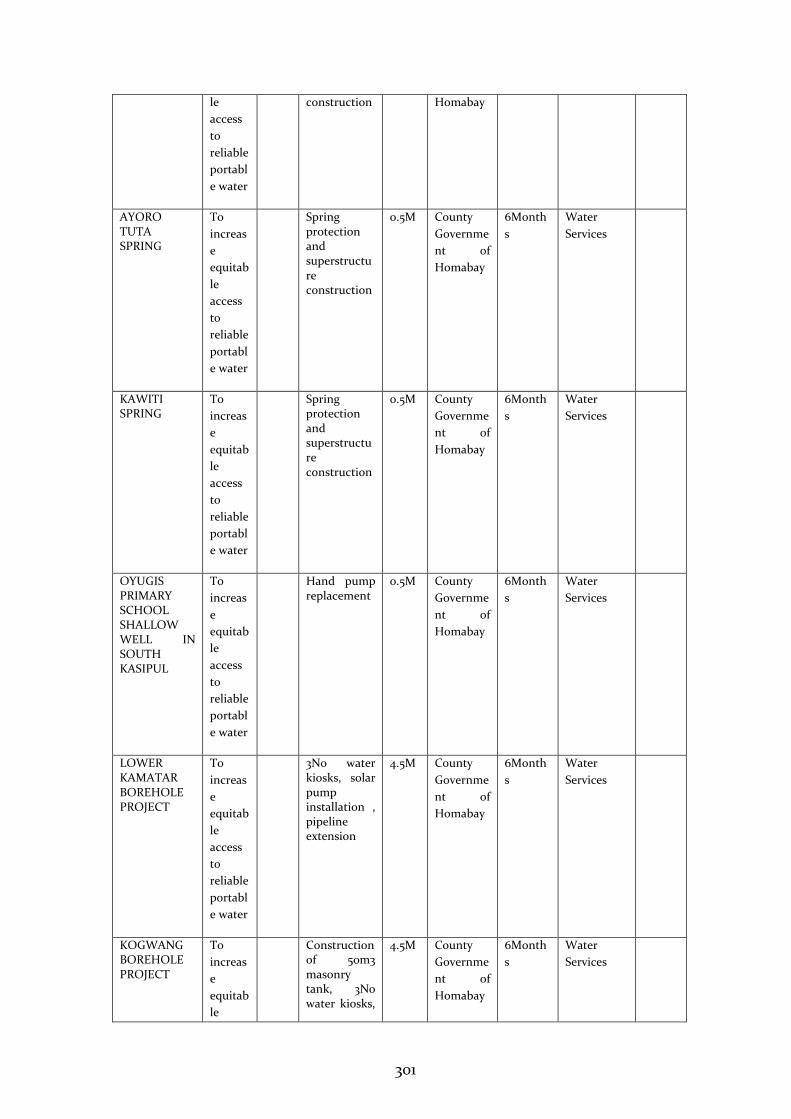
301
le
access
to
reliable
portabl
e water
construction Homabay
AYORO TUTA SPRING
To
increas
e
equitab
le
access
to
reliable
portabl
e water
Spring protection and superstructure construction
0.5M County
Governme
nt of
Homabay
6Month
s
Water
Services
KAWITI SPRING
To
increas
e
equitab
le
access
to
reliable
portabl
e water
Spring protection and superstructure construction
0.5M County
Governme
nt of
Homabay
6Month
s
Water
Services
OYUGIS PRIMARY SCHOOL SHALLOW WELL IN SOUTH KASIPUL
To
increas
e
equitab
le
access
to
reliable
portabl
e water
Hand pump replacement
0.5M County
Governme
nt of
Homabay
6Month
s
Water
Services
LOWER KAMATAR BOREHOLE PROJECT
To
increas
e
equitab
le
access
to
reliable
portabl
e water
3No water kiosks, solar pump installation , pipeline extension
4.5M County
Governme
nt of
Homabay
6Month
s
Water
Services
KOGWANG BOREHOLE PROJECT
To
increas
e
equitab
le
Construction of 50m3 masonry tank, 3No water kiosks,
4.5M County
Governme
nt of
Homabay
6Month
s
Water
Services
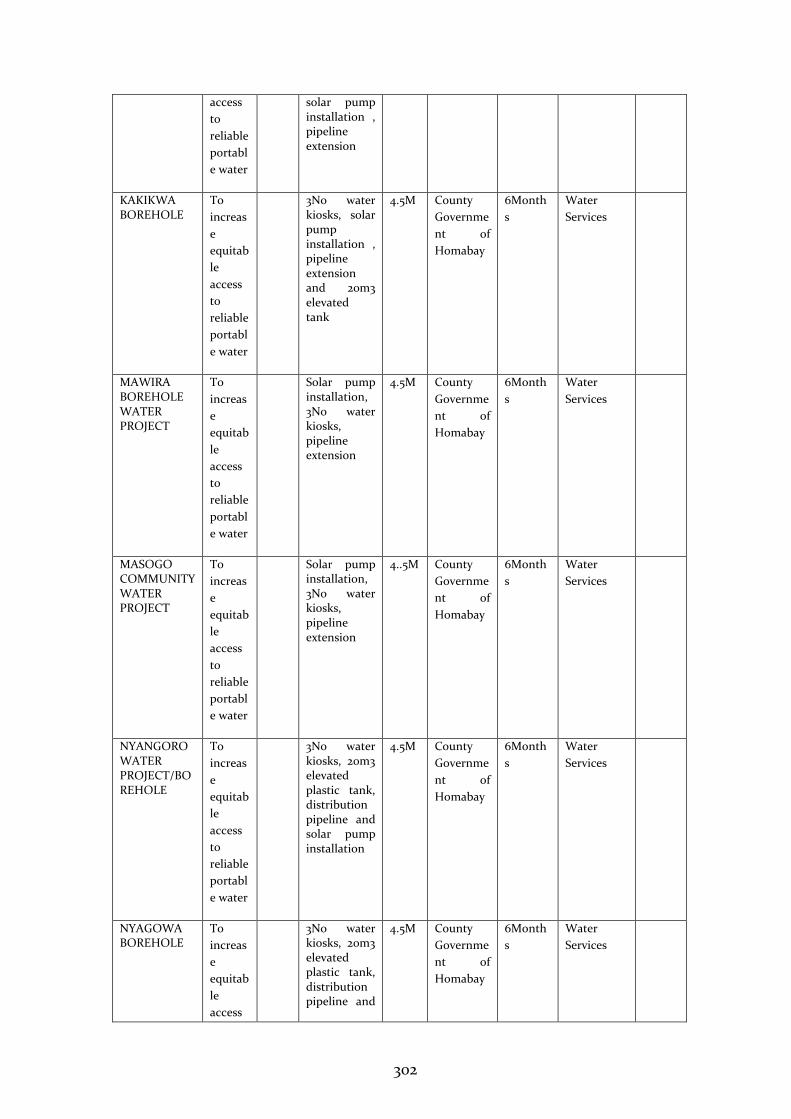
302
access
to
reliable
portabl
e water
solar pump installation , pipeline extension
KAKIKWA BOREHOLE
To
increas
e
equitab
le
access
to
reliable
portabl
e water
3No water kiosks, solar pump installation , pipeline extension and 20m3 elevated tank
4.5M County
Governme
nt of
Homabay
6Month
s
Water
Services
MAWIRA BOREHOLE WATER PROJECT
To
increas
e
equitab
le
access
to
reliable
portabl
e water
Solar pump installation, 3No water kiosks, pipeline extension
4.5M County
Governme
nt of
Homabay
6Month
s
Water
Services
MASOGO COMMUNITY WATER PROJECT
To
increas
e
equitab
le
access
to
reliable
portabl
e water
Solar pump installation, 3No water kiosks, pipeline extension
4..5M County
Governme
nt of
Homabay
6Month
s
Water
Services
NYANGORO WATER PROJECT/BOREHOLE
To
increas
e
equitab
le
access
to
reliable
portabl
e water
3No water kiosks, 20m3 elevated plastic tank, distribution pipeline and solar pump installation
4.5M County
Governme
nt of
Homabay
6Month
s
Water
Services
NYAGOWA BOREHOLE
To
increas
e
equitab
le
access
3No water kiosks, 20m3 elevated plastic tank, distribution pipeline and
4.5M County
Governme
nt of
Homabay
6Month
s
Water
Services
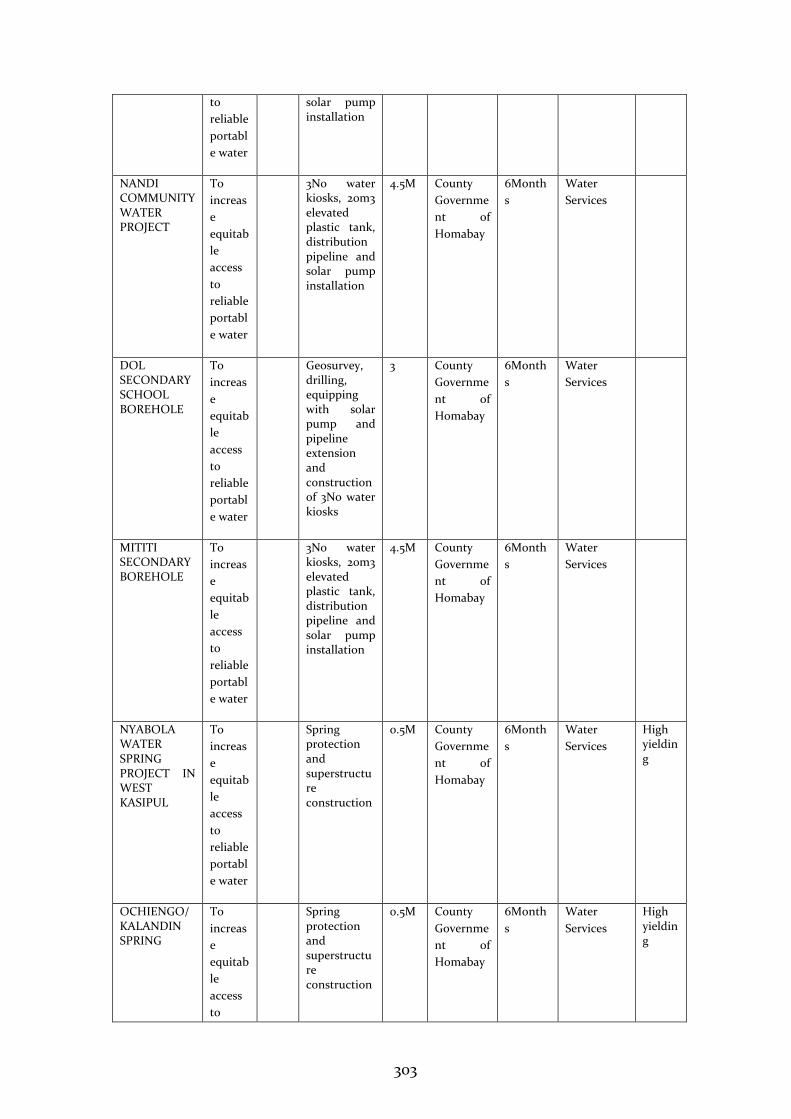
303
to
reliable
portabl
e water
solar pump installation
NANDI COMMUNITY WATER PROJECT
To
increas
e
equitab
le
access
to
reliable
portabl
e water
3No water kiosks, 20m3 elevated plastic tank, distribution pipeline and solar pump installation
4.5M County
Governme
nt of
Homabay
6Month
s
Water
Services
DOL SECONDARY SCHOOL BOREHOLE
To
increas
e
equitab
le
access
to
reliable
portabl
e water
Geosurvey, drilling, equipping with solar pump and pipeline extension and construction of 3No water kiosks
3 County
Governme
nt of
Homabay
6Month
s
Water
Services
MITITI SECONDARY BOREHOLE
To
increas
e
equitab
le
access
to
reliable
portabl
e water
3No water kiosks, 20m3 elevated plastic tank, distribution pipeline and solar pump installation
4.5M County
Governme
nt of
Homabay
6Month
s
Water
Services
NYABOLA WATER SPRING PROJECT IN WEST KASIPUL
To
increas
e
equitab
le
access
to
reliable
portabl
e water
Spring protection and superstructure construction
0.5M County
Governme
nt of
Homabay
6Month
s
Water
Services
High yielding
OCHIENGO/KALANDIN SPRING
To
increas
e
equitab
le
access
to
Spring protection and superstructure construction
0.5M County
Governme
nt of
Homabay
6Month
s
Water
Services
High yielding
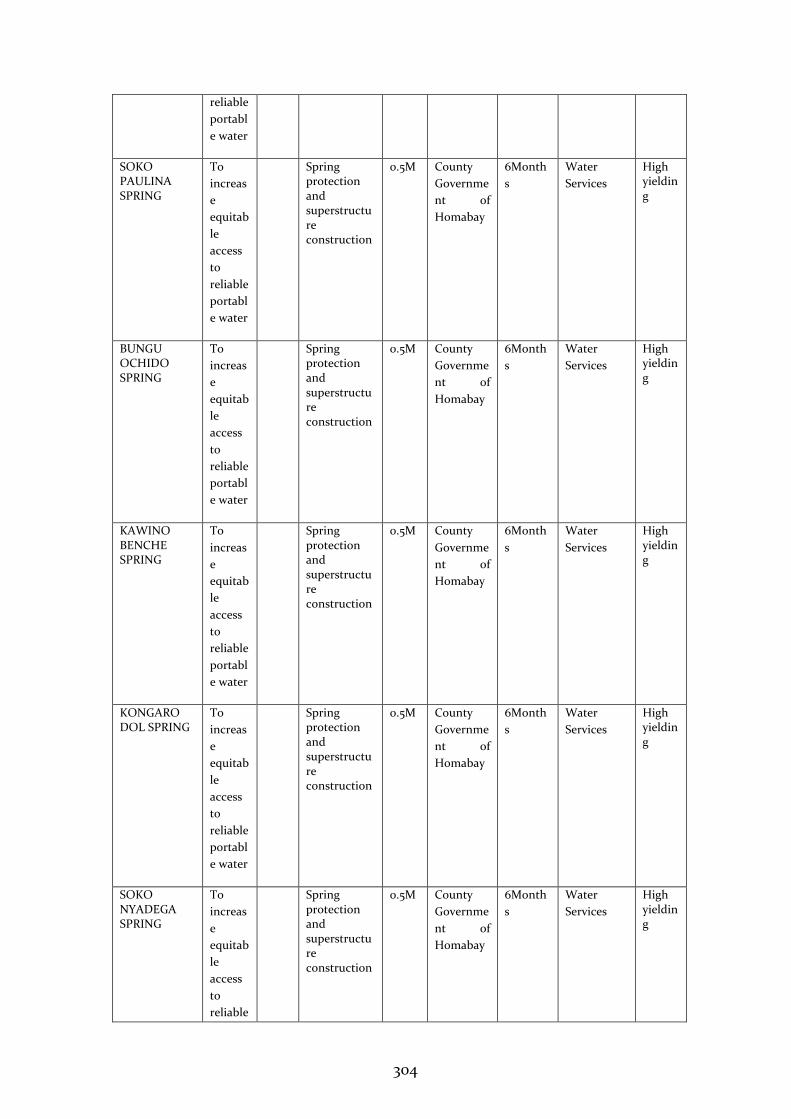
304
reliable
portabl
e water
SOKO PAULINA SPRING
To
increas
e
equitab
le
access
to
reliable
portabl
e water
Spring protection and superstructure construction
0.5M County
Governme
nt of
Homabay
6Month
s
Water
Services
High yielding
BUNGU OCHIDO SPRING
To
increas
e
equitab
le
access
to
reliable
portabl
e water
Spring protection and superstructure construction
0.5M County
Governme
nt of
Homabay
6Month
s
Water
Services
High yielding
KAWINO BENCHE SPRING
To
increas
e
equitab
le
access
to
reliable
portabl
e water
Spring protection and superstructure construction
0.5M County
Governme
nt of
Homabay
6Month
s
Water
Services
High yielding
KONGARO DOL SPRING
To
increas
e
equitab
le
access
to
reliable
portabl
e water
Spring protection and superstructure construction
0.5M County
Governme
nt of
Homabay
6Month
s
Water
Services
High yielding
SOKO NYADEGA SPRING
To
increas
e
equitab
le
access
to
reliable
Spring protection and superstructure construction
0.5M County
Governme
nt of
Homabay
6Month
s
Water
Services
High yielding
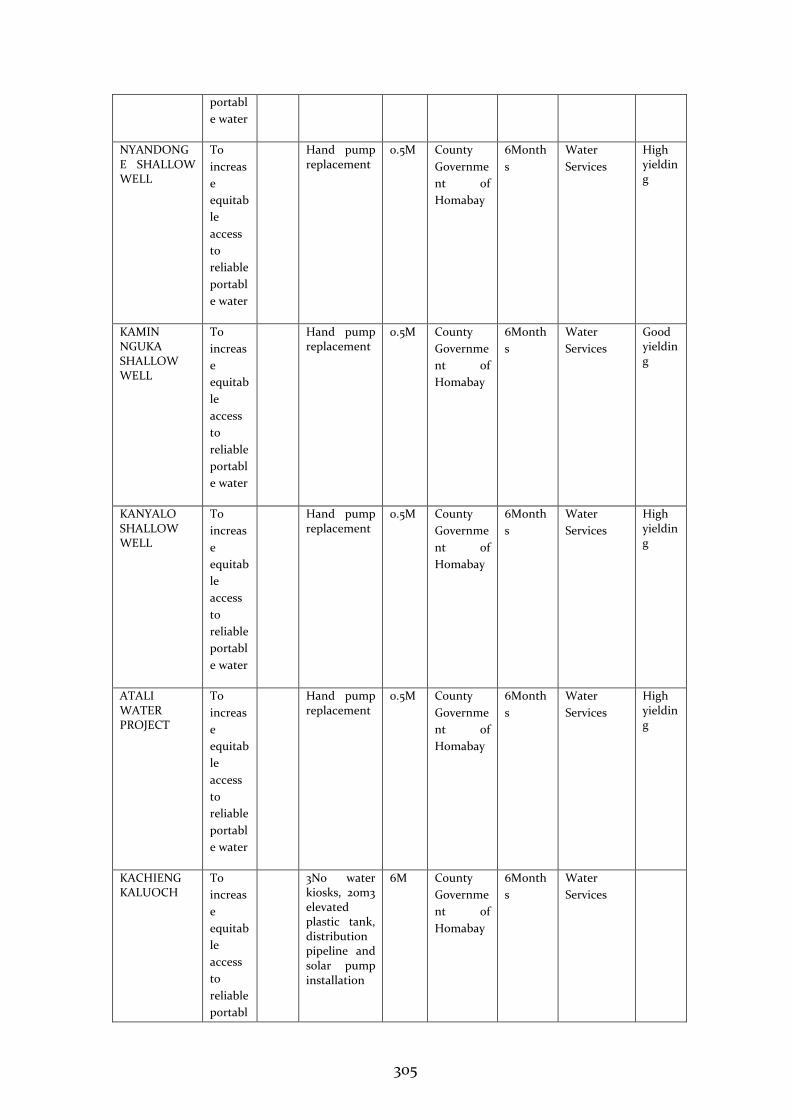
305
portabl
e water
NYANDONGE SHALLOW WELL
To
increas
e
equitab
le
access
to
reliable
portabl
e water
Hand pump replacement
0.5M County
Governme
nt of
Homabay
6Month
s
Water
Services
High yielding
KAMIN NGUKA SHALLOW WELL
To
increas
e
equitab
le
access
to
reliable
portabl
e water
Hand pump replacement
0.5M County
Governme
nt of
Homabay
6Month
s
Water
Services
Good yielding
KANYALO SHALLOW WELL
To
increas
e
equitab
le
access
to
reliable
portabl
e water
Hand pump replacement
0.5M County
Governme
nt of
Homabay
6Month
s
Water
Services
High yielding
ATALI WATER PROJECT
To
increas
e
equitab
le
access
to
reliable
portabl
e water
Hand pump replacement
0.5M County
Governme
nt of
Homabay
6Month
s
Water
Services
High yielding
KACHIENG KALUOCH
To
increas
e
equitab
le
access
to
reliable
portabl
3No water kiosks, 20m3 elevated plastic tank, distribution pipeline and solar pump installation
6M County
Governme
nt of
Homabay
6Month
s
Water
Services
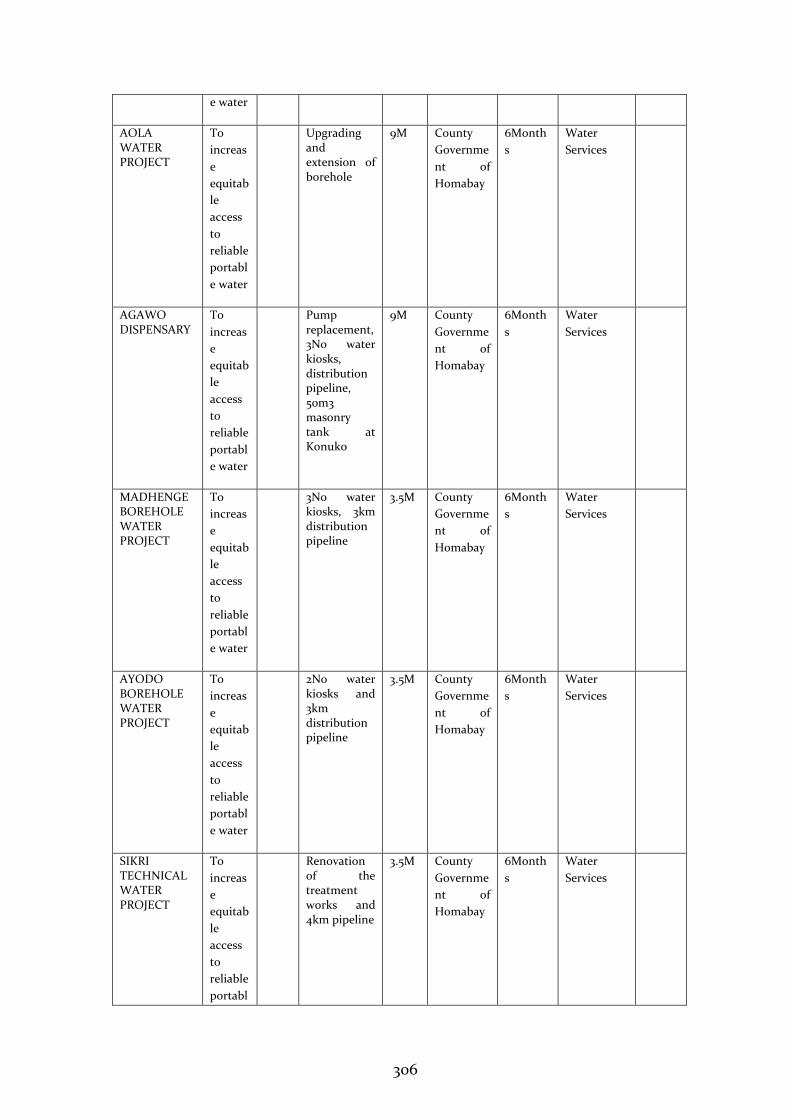
306
e water
AOLA WATER PROJECT
To
increas
e
equitab
le
access
to
reliable
portabl
e water
Upgrading and extension of borehole
9M County
Governme
nt of
Homabay
6Month
s
Water
Services
AGAWO DISPENSARY
To
increas
e
equitab
le
access
to
reliable
portabl
e water
Pump replacement, 3No water kiosks, distribution pipeline, 50m3 masonry tank at Konuko
9M County
Governme
nt of
Homabay
6Month
s
Water
Services
MADHENGE BOREHOLE WATER PROJECT
To
increas
e
equitab
le
access
to
reliable
portabl
e water
3No water kiosks, 3km distribution pipeline
3.5M County
Governme
nt of
Homabay
6Month
s
Water
Services
AYODO BOREHOLE WATER PROJECT
To
increas
e
equitab
le
access
to
reliable
portabl
e water
2No water kiosks and 3km distribution pipeline
3.5M County
Governme
nt of
Homabay
6Month
s
Water
Services
SIKRI TECHNICAL WATER PROJECT
To
increas
e
equitab
le
access
to
reliable
portabl
Renovation of the treatment works and 4km pipeline
3.5M County
Governme
nt of
Homabay
6Month
s
Water
Services
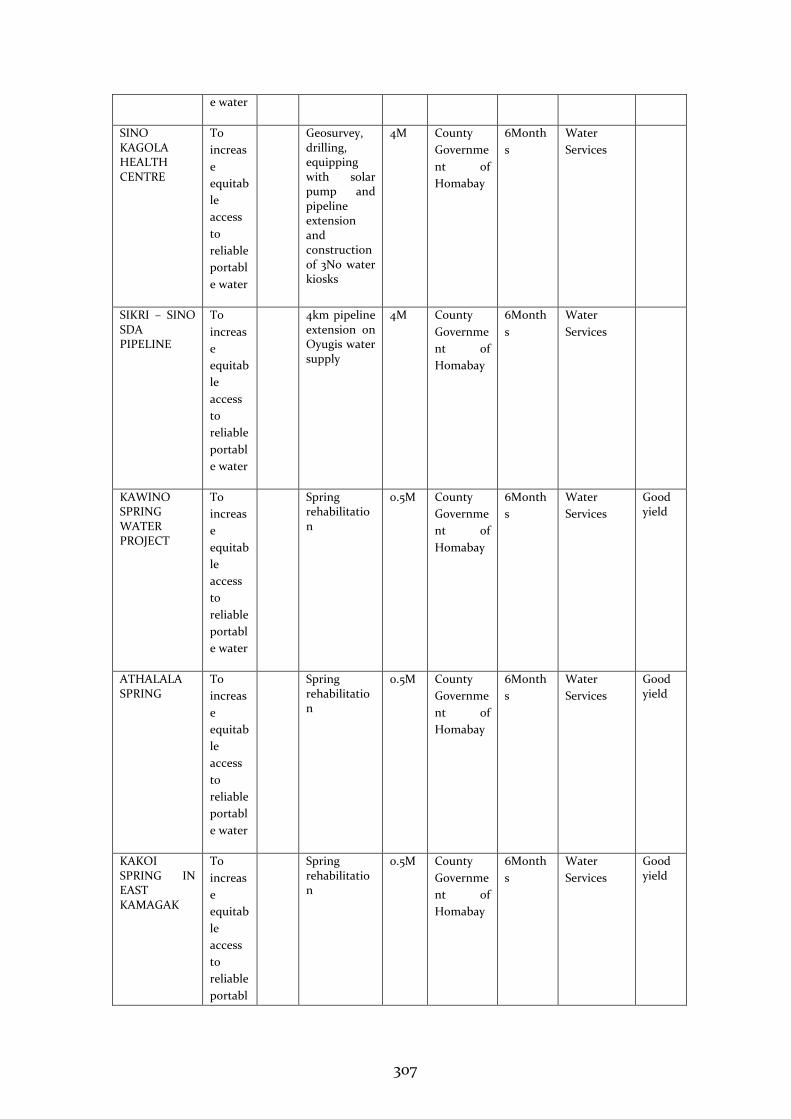
307
e water
SINO KAGOLA HEALTH CENTRE
To
increas
e
equitab
le
access
to
reliable
portabl
e water
Geosurvey, drilling, equipping with solar pump and pipeline extension and construction of 3No water kiosks
4M County
Governme
nt of
Homabay
6Month
s
Water
Services
SIKRI – SINO SDA PIPELINE
To
increas
e
equitab
le
access
to
reliable
portabl
e water
4km pipeline extension on Oyugis water supply
4M County
Governme
nt of
Homabay
6Month
s
Water
Services
KAWINO SPRING WATER PROJECT
To
increas
e
equitab
le
access
to
reliable
portabl
e water
Spring rehabilitation
0.5M County
Governme
nt of
Homabay
6Month
s
Water
Services
Good yield
ATHALALA SPRING
To
increas
e
equitab
le
access
to
reliable
portabl
e water
Spring rehabilitation
0.5M County
Governme
nt of
Homabay
6Month
s
Water
Services
Good yield
KAKOI SPRING IN EAST KAMAGAK
To
increas
e
equitab
le
access
to
reliable
portabl
Spring rehabilitation
0.5M County
Governme
nt of
Homabay
6Month
s
Water
Services
Good yield
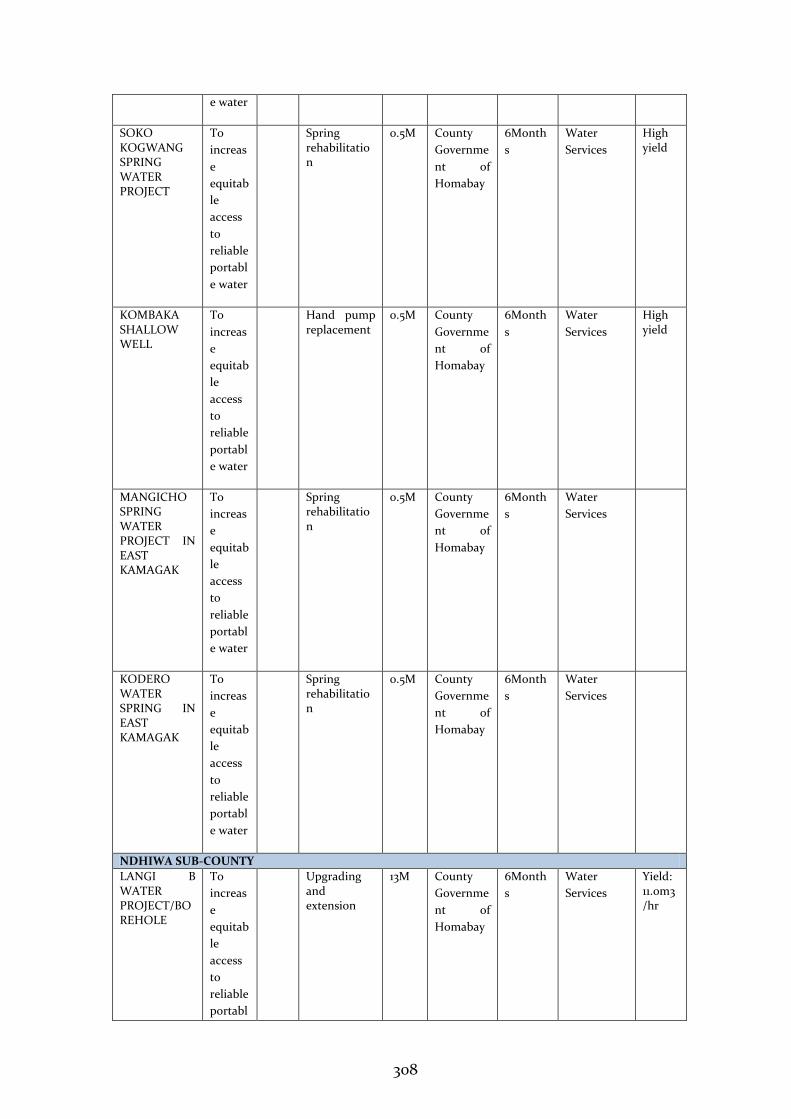
308
e water
SOKO KOGWANG SPRING WATER PROJECT
To
increas
e
equitab
le
access
to
reliable
portabl
e water
Spring rehabilitation
0.5M County
Governme
nt of
Homabay
6Month
s
Water
Services
High yield
KOMBAKA SHALLOW WELL
To
increas
e
equitab
le
access
to
reliable
portabl
e water
Hand pump replacement
0.5M County
Governme
nt of
Homabay
6Month
s
Water
Services
High yield
MANGICHO SPRING WATER PROJECT IN EAST KAMAGAK
To
increas
e
equitab
le
access
to
reliable
portabl
e water
Spring rehabilitation
0.5M County
Governme
nt of
Homabay
6Month
s
Water
Services
KODERO WATER SPRING IN EAST KAMAGAK
To
increas
e
equitab
le
access
to
reliable
portabl
e water
Spring rehabilitation
0.5M County
Governme
nt of
Homabay
6Month
s
Water
Services
NDHIWA SUB-COUNTY
LANGI B WATER PROJECT/BOREHOLE
To
increas
e
equitab
le
access
to
reliable
portabl
Upgrading and extension
13M County
Governme
nt of
Homabay
6Month
s
Water
Services
Yield: 11.0m3/hr
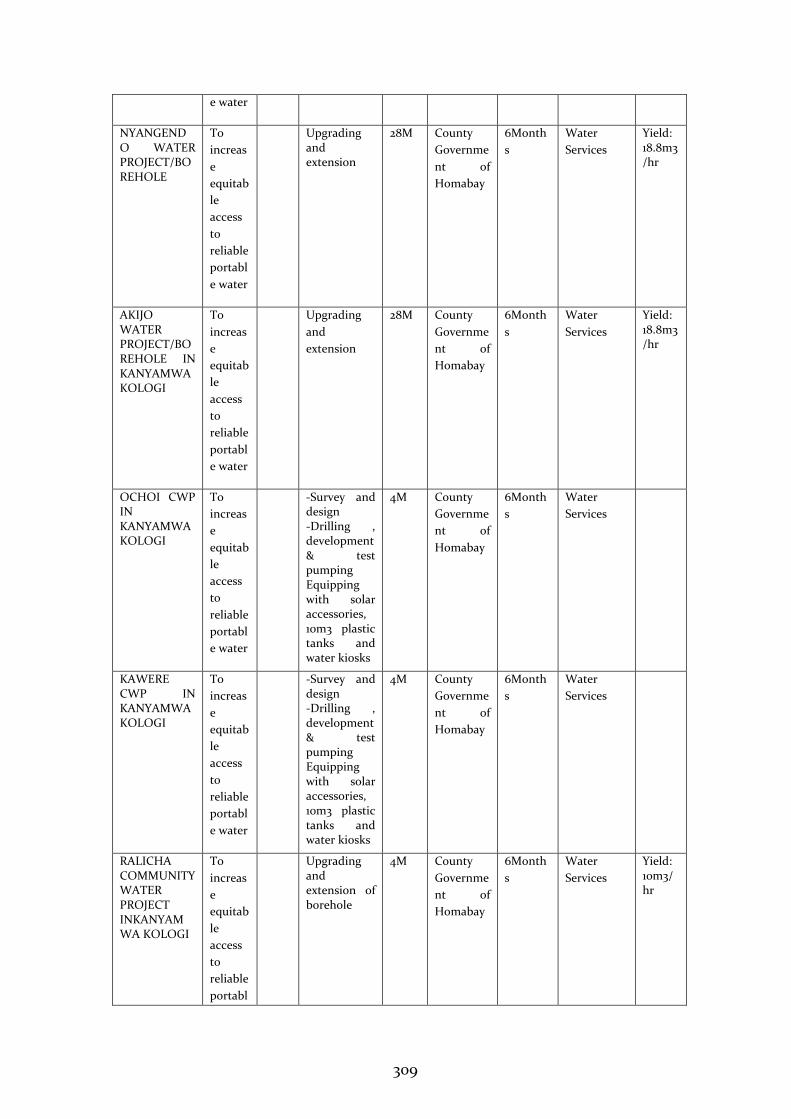
309
e water
NYANGENDO WATER PROJECT/BOREHOLE
To
increas
e
equitab
le
access
to
reliable
portabl
e water
Upgrading and extension
28M County
Governme
nt of
Homabay
6Month
s
Water
Services
Yield: 18.8m3/hr
AKIJO WATER PROJECT/BOREHOLE IN KANYAMWA KOLOGI
To
increas
e
equitab
le
access
to
reliable
portabl
e water
Upgrading
and
extension
28M County
Governme
nt of
Homabay
6Month
s
Water
Services
Yield: 18.8m3/hr
OCHOI CWP IN KANYAMWA KOLOGI
To
increas
e
equitab
le
access
to
reliable
portabl
e water
-Survey and design -Drilling , development & test pumping Equipping with solar accessories, 10m3 plastic tanks and water kiosks
4M County
Governme
nt of
Homabay
6Month
s
Water
Services
KAWERE CWP IN KANYAMWA KOLOGI
To
increas
e
equitab
le
access
to
reliable
portabl
e water
-Survey and design -Drilling , development & test pumping Equipping with solar accessories, 10m3 plastic tanks and water kiosks
4M County
Governme
nt of
Homabay
6Month
s
Water
Services
RALICHA COMMUNITY WATER PROJECT INKANYAMWA KOLOGI
To
increas
e
equitab
le
access
to
reliable
portabl
Upgrading and extension of borehole
4M County
Governme
nt of
Homabay
6Month
s
Water
Services
Yield: 10m3/hr
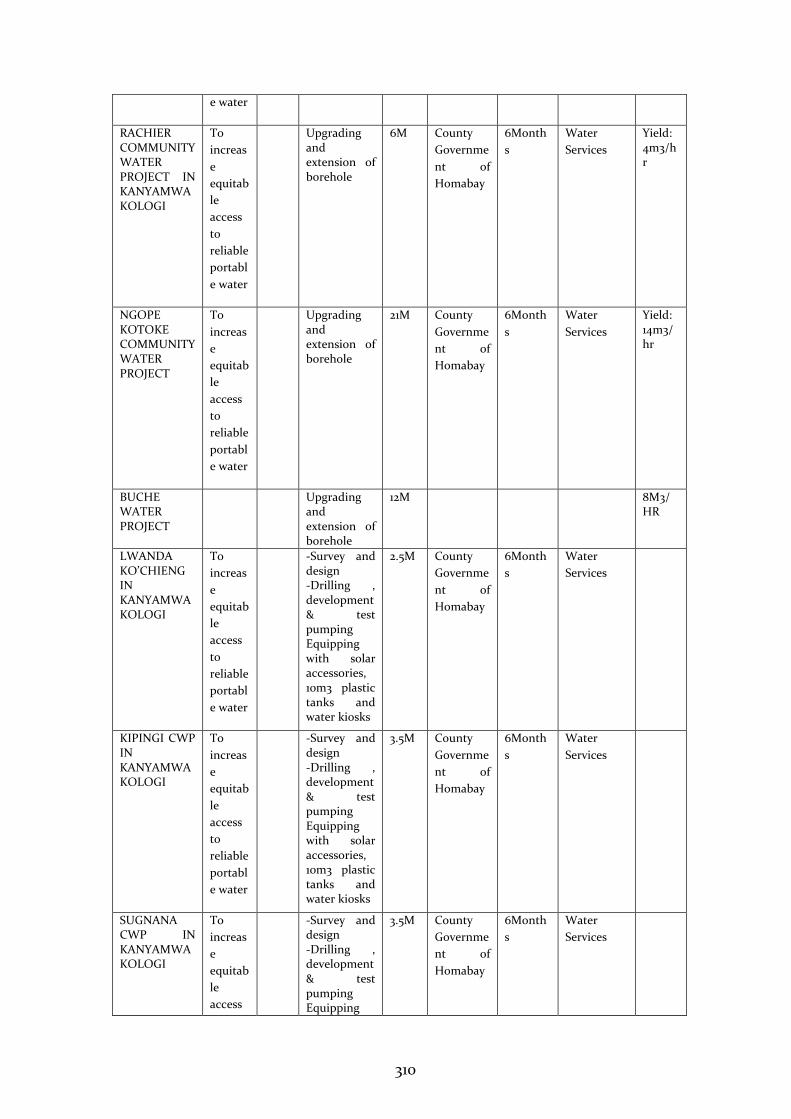
310
e water
RACHIER COMMUNITY WATER PROJECT IN KANYAMWA KOLOGI
To
increas
e
equitab
le
access
to
reliable
portabl
e water
Upgrading and extension of borehole
6M County
Governme
nt of
Homabay
6Month
s
Water
Services
Yield: 4m3/hr
NGOPE KOTOKE COMMUNITY WATER PROJECT
To
increas
e
equitab
le
access
to
reliable
portabl
e water
Upgrading and extension of borehole
21M County
Governme
nt of
Homabay
6Month
s
Water
Services
Yield: 14m3/hr
BUCHE WATER PROJECT
Upgrading and extension of borehole
12M 8M3/HR
LWANDA KO’CHIENG IN KANYAMWA KOLOGI
To
increas
e
equitab
le
access
to
reliable
portabl
e water
-Survey and design -Drilling , development & test pumping Equipping with solar accessories, 10m3 plastic tanks and water kiosks
2.5M County
Governme
nt of
Homabay
6Month
s
Water
Services
KIPINGI CWP IN KANYAMWA KOLOGI
To
increas
e
equitab
le
access
to
reliable
portabl
e water
-Survey and design -Drilling , development & test pumping Equipping with solar accessories, 10m3 plastic tanks and water kiosks
3.5M County
Governme
nt of
Homabay
6Month
s
Water
Services
SUGNANA CWP IN KANYAMWA KOLOGI
To
increas
e
equitab
le
access
-Survey and design -Drilling , development & test pumping Equipping
3.5M County
Governme
nt of
Homabay
6Month
s
Water
Services
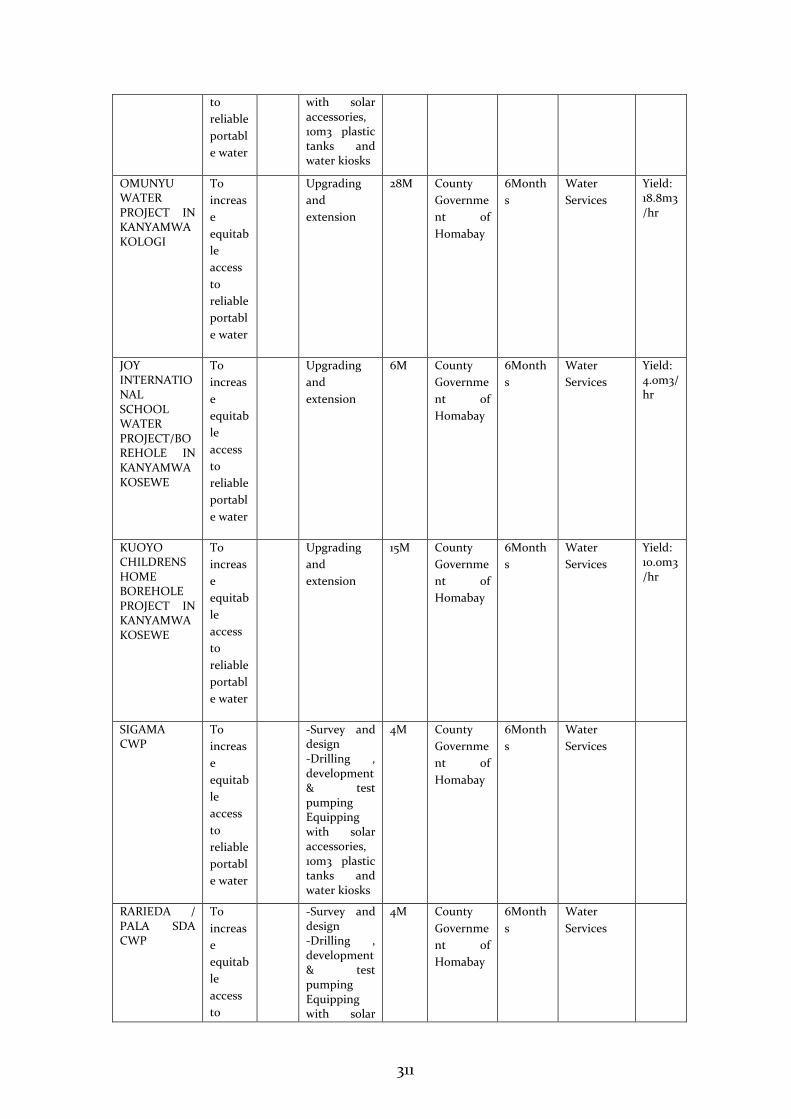
311
to
reliable
portabl
e water
with solar accessories, 10m3 plastic tanks and water kiosks
OMUNYU WATER PROJECT IN KANYAMWA KOLOGI
To
increas
e
equitab
le
access
to
reliable
portabl
e water
Upgrading
and
extension
28M County
Governme
nt of
Homabay
6Month
s
Water
Services
Yield: 18.8m3/hr
JOY INTERNATIONAL SCHOOL WATER PROJECT/BOREHOLE IN KANYAMWA KOSEWE
To
increas
e
equitab
le
access
to
reliable
portabl
e water
Upgrading
and
extension
6M County
Governme
nt of
Homabay
6Month
s
Water
Services
Yield: 4.0m3/hr
KUOYO CHILDRENS HOME BOREHOLE PROJECT IN KANYAMWA KOSEWE
To
increas
e
equitab
le
access
to
reliable
portabl
e water
Upgrading
and
extension
15M County
Governme
nt of
Homabay
6Month
s
Water
Services
Yield: 10.0m3/hr
SIGAMA CWP
To
increas
e
equitab
le
access
to
reliable
portabl
e water
-Survey and design -Drilling , development & test pumping Equipping with solar accessories, 10m3 plastic tanks and water kiosks
4M County
Governme
nt of
Homabay
6Month
s
Water
Services
RARIEDA / PALA SDA CWP
To
increas
e
equitab
le
access
to
-Survey and design -Drilling , development & test pumping Equipping with solar
4M County
Governme
nt of
Homabay
6Month
s
Water
Services
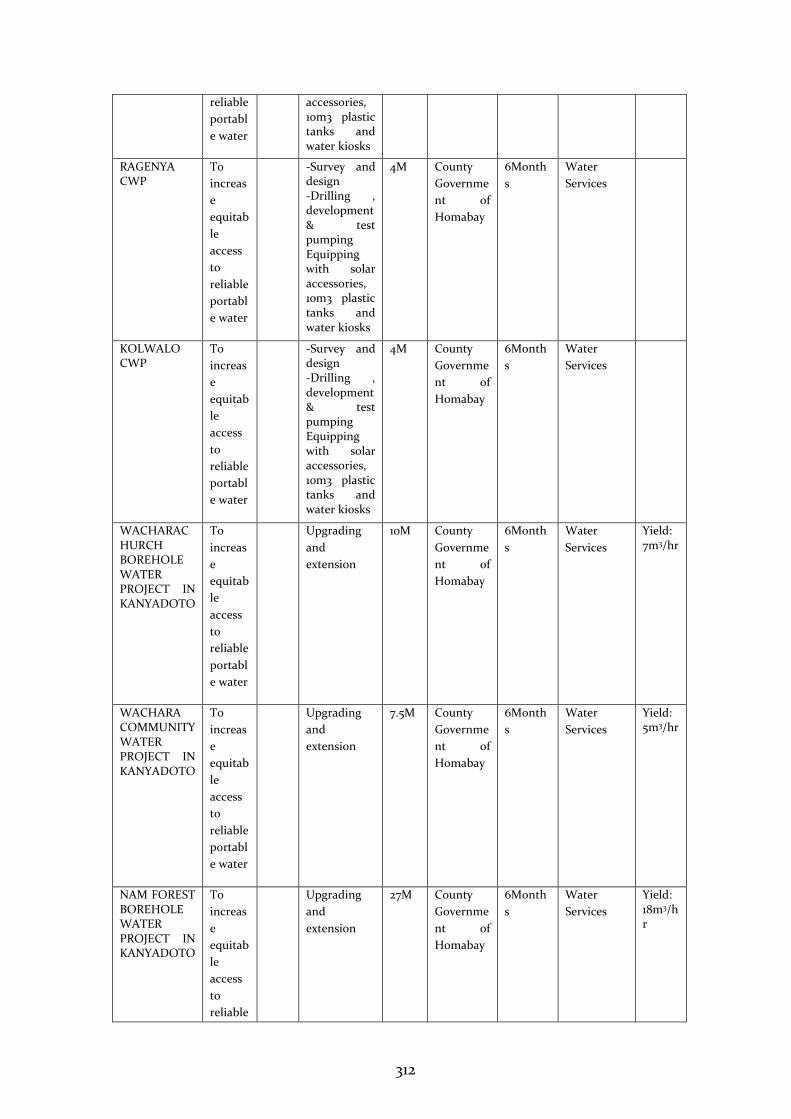
312
reliable
portabl
e water
accessories, 10m3 plastic tanks and water kiosks
RAGENYA CWP
To
increas
e
equitab
le
access
to
reliable
portabl
e water
-Survey and design -Drilling , development & test pumping Equipping with solar accessories, 10m3 plastic tanks and water kiosks
4M County
Governme
nt of
Homabay
6Month
s
Water
Services
KOLWALO CWP
To
increas
e
equitab
le
access
to
reliable
portabl
e water
-Survey and design -Drilling , development & test pumping Equipping with solar accessories, 10m3 plastic tanks and water kiosks
4M County
Governme
nt of
Homabay
6Month
s
Water
Services
WACHARACHURCH BOREHOLE WATER PROJECT IN KANYADOTO
To
increas
e
equitab
le
access
to
reliable
portabl
e water
Upgrading
and
extension
10M County
Governme
nt of
Homabay
6Month
s
Water
Services
Yield: 7m3/hr
WACHARA COMMUNITY WATER PROJECT IN KANYADOTO
To
increas
e
equitab
le
access
to
reliable
portabl
e water
Upgrading
and
extension
7.5M County
Governme
nt of
Homabay
6Month
s
Water
Services
Yield: 5m3/hr
NAM FOREST BOREHOLE WATER PROJECT IN KANYADOTO
To
increas
e
equitab
le
access
to
reliable
Upgrading
and
extension
27M County
Governme
nt of
Homabay
6Month
s
Water
Services
Yield: 18m3/hr
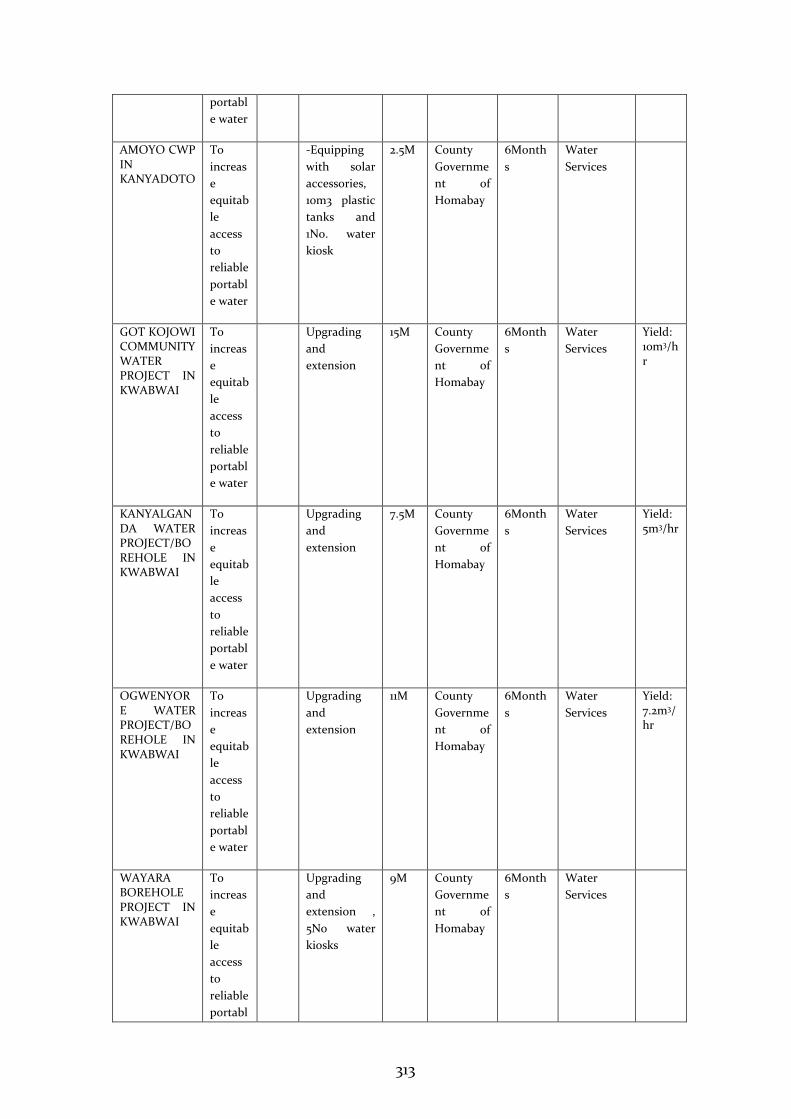
313
portabl
e water
AMOYO CWP IN KANYADOTO
To
increas
e
equitab
le
access
to
reliable
portabl
e water
-Equipping
with solar
accessories,
10m3 plastic
tanks and
1No. water
kiosk
2.5M County
Governme
nt of
Homabay
6Month
s
Water
Services
GOT KOJOWI COMMUNITY WATER PROJECT IN KWABWAI
To
increas
e
equitab
le
access
to
reliable
portabl
e water
Upgrading
and
extension
15M County
Governme
nt of
Homabay
6Month
s
Water
Services
Yield: 10m3/hr
KANYALGANDA WATER PROJECT/BOREHOLE IN KWABWAI
To
increas
e
equitab
le
access
to
reliable
portabl
e water
Upgrading
and
extension
7.5M County
Governme
nt of
Homabay
6Month
s
Water
Services
Yield: 5m3/hr
OGWENYORE WATER PROJECT/BOREHOLE IN KWABWAI
To
increas
e
equitab
le
access
to
reliable
portabl
e water
Upgrading
and
extension
11M County
Governme
nt of
Homabay
6Month
s
Water
Services
Yield: 7.2m3/hr
WAYARA BOREHOLE PROJECT IN KWABWAI
To
increas
e
equitab
le
access
to
reliable
portabl
Upgrading
and
extension ,
5No water
kiosks
9M County
Governme
nt of
Homabay
6Month
s
Water
Services
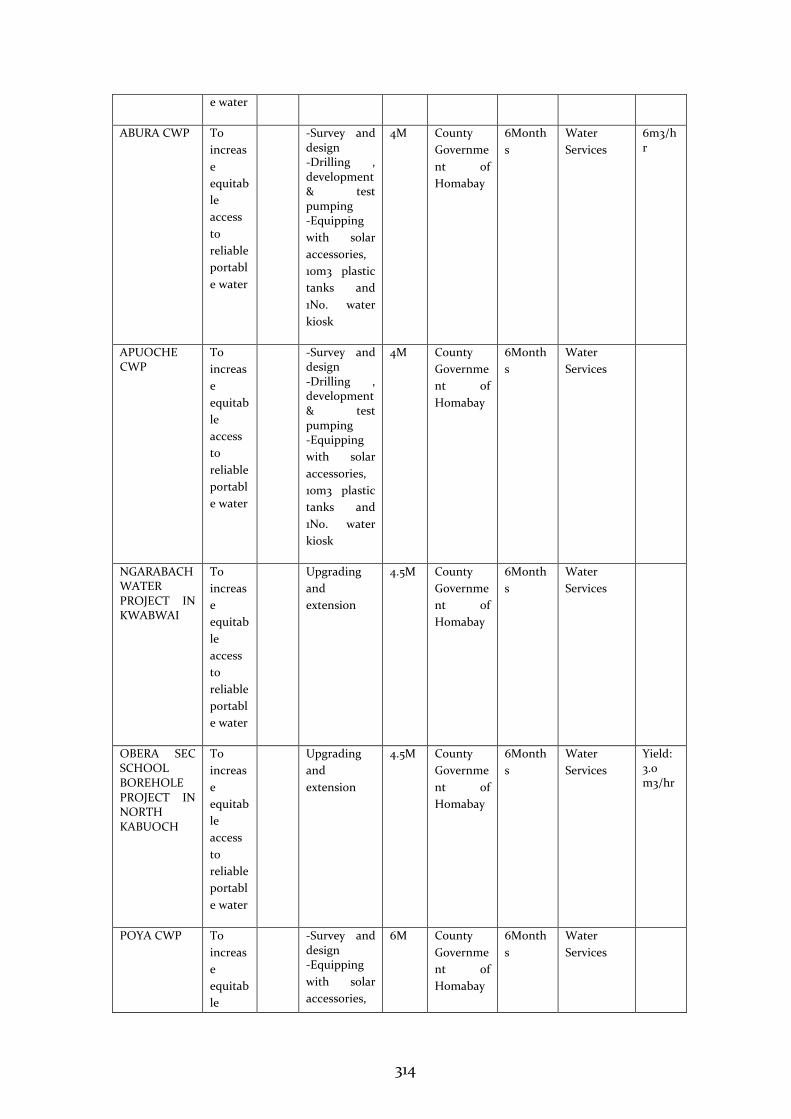
314
e water
ABURA CWP To
increas
e
equitab
le
access
to
reliable
portabl
e water
-Survey and design -Drilling , development & test pumping -Equipping
with solar
accessories,
10m3 plastic
tanks and
1No. water
kiosk
4M County
Governme
nt of
Homabay
6Month
s
Water
Services
6m3/hr
APUOCHE CWP
To
increas
e
equitab
le
access
to
reliable
portabl
e water
-Survey and design -Drilling , development & test pumping -Equipping
with solar
accessories,
10m3 plastic
tanks and
1No. water
kiosk
4M County
Governme
nt of
Homabay
6Month
s
Water
Services
NGARABACH WATER PROJECT IN KWABWAI
To
increas
e
equitab
le
access
to
reliable
portabl
e water
Upgrading
and
extension
4.5M County
Governme
nt of
Homabay
6Month
s
Water
Services
OBERA SEC SCHOOL BOREHOLE PROJECT IN NORTH KABUOCH
To
increas
e
equitab
le
access
to
reliable
portabl
e water
Upgrading
and
extension
4.5M County
Governme
nt of
Homabay
6Month
s
Water
Services
Yield: 3.0 m3/hr
POYA CWP To
increas
e
equitab
le
-Survey and design -Equipping
with solar
accessories,
6M County
Governme
nt of
Homabay
6Month
s
Water
Services
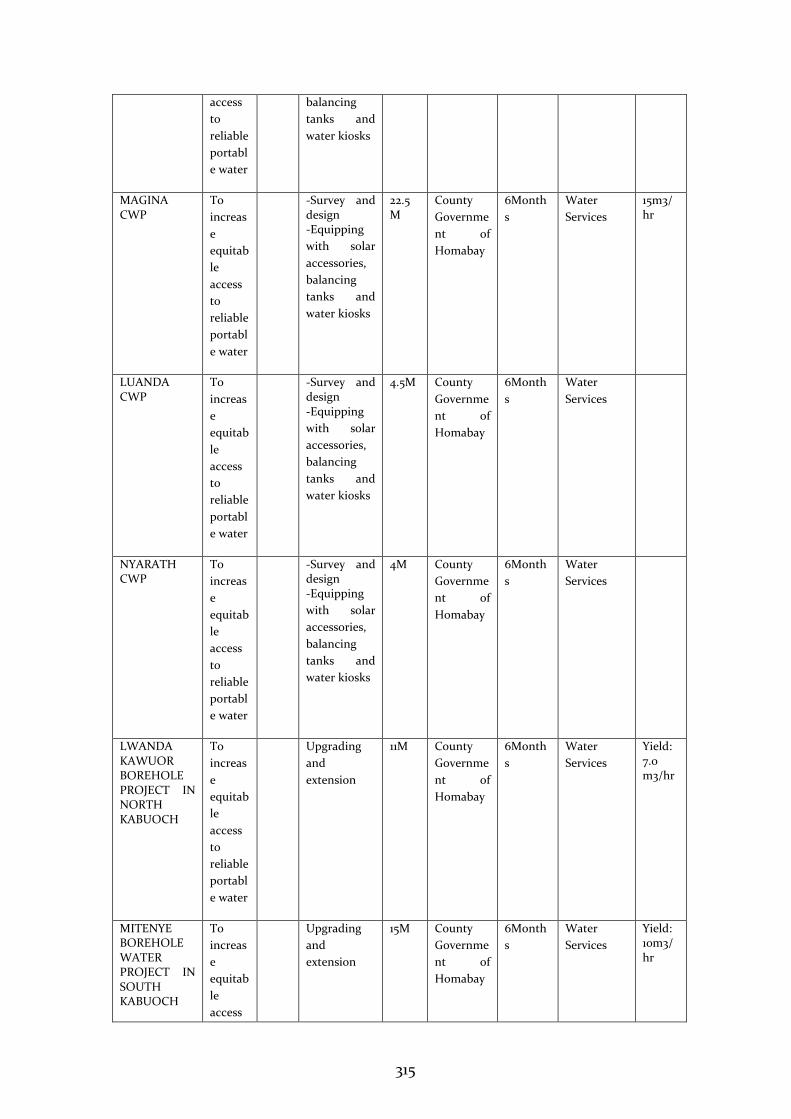
315
access
to
reliable
portabl
e water
balancing
tanks and
water kiosks
MAGINA CWP
To
increas
e
equitab
le
access
to
reliable
portabl
e water
-Survey and design -Equipping
with solar
accessories,
balancing
tanks and
water kiosks
22.5M
County
Governme
nt of
Homabay
6Month
s
Water
Services
15m3/hr
LUANDA CWP
To
increas
e
equitab
le
access
to
reliable
portabl
e water
-Survey and design -Equipping
with solar
accessories,
balancing
tanks and
water kiosks
4.5M County
Governme
nt of
Homabay
6Month
s
Water
Services
NYARATH CWP
To
increas
e
equitab
le
access
to
reliable
portabl
e water
-Survey and design -Equipping
with solar
accessories,
balancing
tanks and
water kiosks
4M County
Governme
nt of
Homabay
6Month
s
Water
Services
LWANDA KAWUOR BOREHOLE PROJECT IN NORTH KABUOCH
To
increas
e
equitab
le
access
to
reliable
portabl
e water
Upgrading
and
extension
11M County
Governme
nt of
Homabay
6Month
s
Water
Services
Yield: 7.0 m3/hr
MITENYE BOREHOLE WATER PROJECT IN SOUTH KABUOCH
To
increas
e
equitab
le
access
Upgrading
and
extension
15M County
Governme
nt of
Homabay
6Month
s
Water
Services
Yield: 10m3/hr
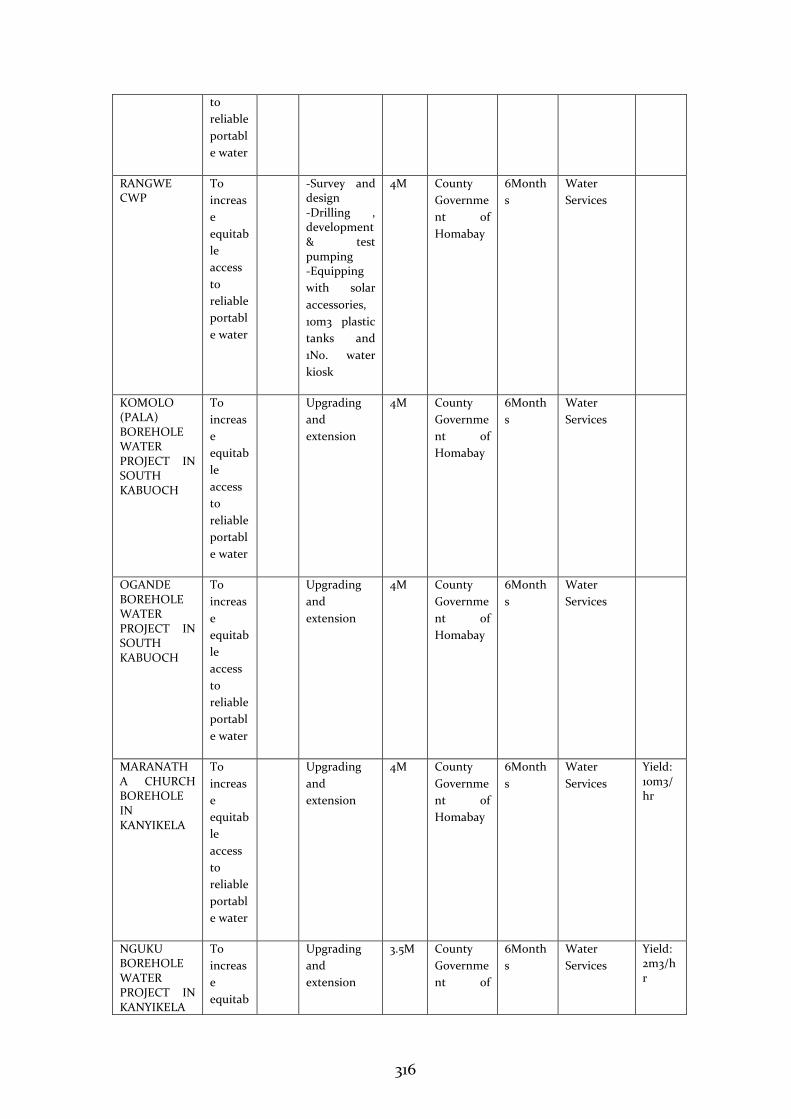
316
to
reliable
portabl
e water
RANGWE CWP
To
increas
e
equitab
le
access
to
reliable
portabl
e water
-Survey and design -Drilling , development & test pumping -Equipping
with solar
accessories,
10m3 plastic
tanks and
1No. water
kiosk
4M County
Governme
nt of
Homabay
6Month
s
Water
Services
KOMOLO (PALA) BOREHOLE WATER PROJECT IN SOUTH KABUOCH
To
increas
e
equitab
le
access
to
reliable
portabl
e water
Upgrading
and
extension
4M County
Governme
nt of
Homabay
6Month
s
Water
Services
OGANDE BOREHOLE WATER PROJECT IN SOUTH KABUOCH
To
increas
e
equitab
le
access
to
reliable
portabl
e water
Upgrading
and
extension
4M County
Governme
nt of
Homabay
6Month
s
Water
Services
MARANATHA CHURCH BOREHOLE IN KANYIKELA
To
increas
e
equitab
le
access
to
reliable
portabl
e water
Upgrading
and
extension
4M County
Governme
nt of
Homabay
6Month
s
Water
Services
Yield: 10m3/hr
NGUKU BOREHOLE WATER PROJECT IN KANYIKELA
To
increas
e
equitab
Upgrading
and
extension
3.5M County
Governme
nt of
6Month
s
Water
Services
Yield: 2m3/hr
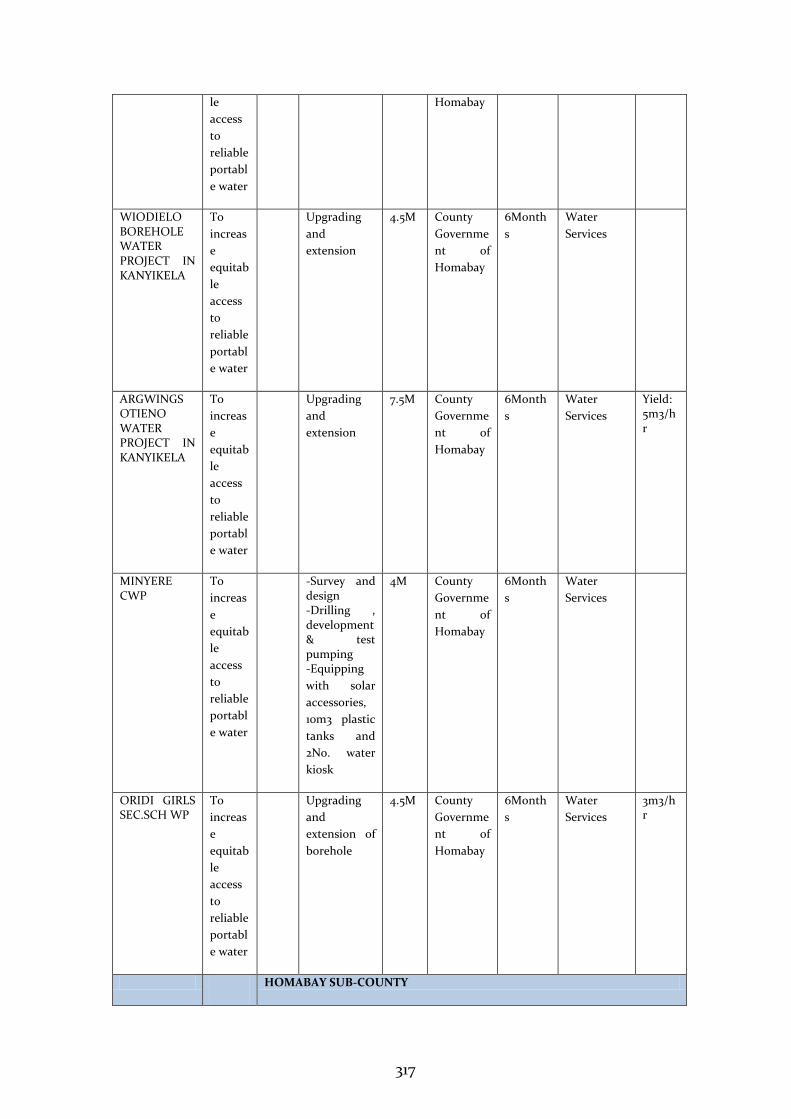
317
le
access
to
reliable
portabl
e water
Homabay
WIODIELO BOREHOLE WATER PROJECT IN KANYIKELA
To
increas
e
equitab
le
access
to
reliable
portabl
e water
Upgrading
and
extension
4.5M County
Governme
nt of
Homabay
6Month
s
Water
Services
ARGWINGS OTIENO WATER PROJECT IN KANYIKELA
To
increas
e
equitab
le
access
to
reliable
portabl
e water
Upgrading
and
extension
7.5M County
Governme
nt of
Homabay
6Month
s
Water
Services
Yield: 5m3/hr
MINYERE CWP
To
increas
e
equitab
le
access
to
reliable
portabl
e water
-Survey and design -Drilling , development & test pumping -Equipping
with solar
accessories,
10m3 plastic
tanks and
2No. water
kiosk
4M County
Governme
nt of
Homabay
6Month
s
Water
Services
ORIDI GIRLS SEC.SCH WP
To
increas
e
equitab
le
access
to
reliable
portabl
e water
Upgrading
and
extension of
borehole
4.5M County
Governme
nt of
Homabay
6Month
s
Water
Services
3m3/hr
HOMABAY SUB-COUNTY
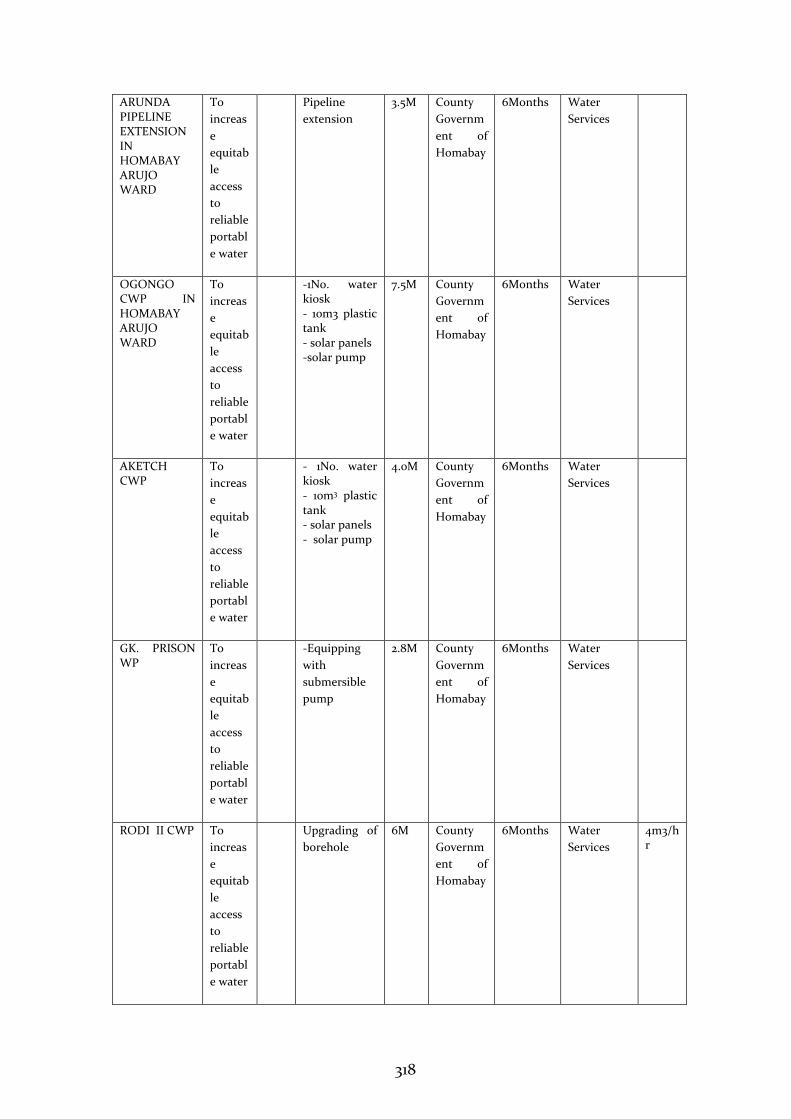
318
ARUNDA PIPELINE EXTENSION IN HOMABAY ARUJO WARD
To
increas
e
equitab
le
access
to
reliable
portabl
e water
Pipeline
extension
3.5M County
Governm
ent of
Homabay
6Months Water
Services
OGONGO CWP IN HOMABAY ARUJO WARD
To
increas
e
equitab
le
access
to
reliable
portabl
e water
-1No. water kiosk - 10m3 plastic tank - solar panels -solar pump
7.5M County
Governm
ent of
Homabay
6Months Water
Services
AKETCH CWP
To
increas
e
equitab
le
access
to
reliable
portabl
e water
- 1No. water kiosk - 10m3 plastic tank - solar panels - solar pump
4.0M County
Governm
ent of
Homabay
6Months Water
Services
GK. PRISON WP
To
increas
e
equitab
le
access
to
reliable
portabl
e water
-Equipping
with
submersible
pump
2.8M
County
Governm
ent of
Homabay
6Months Water
Services
RODI II CWP To
increas
e
equitab
le
access
to
reliable
portabl
e water
Upgrading of
borehole
6M County
Governm
ent of
Homabay
6Months Water
Services
4m3/hr
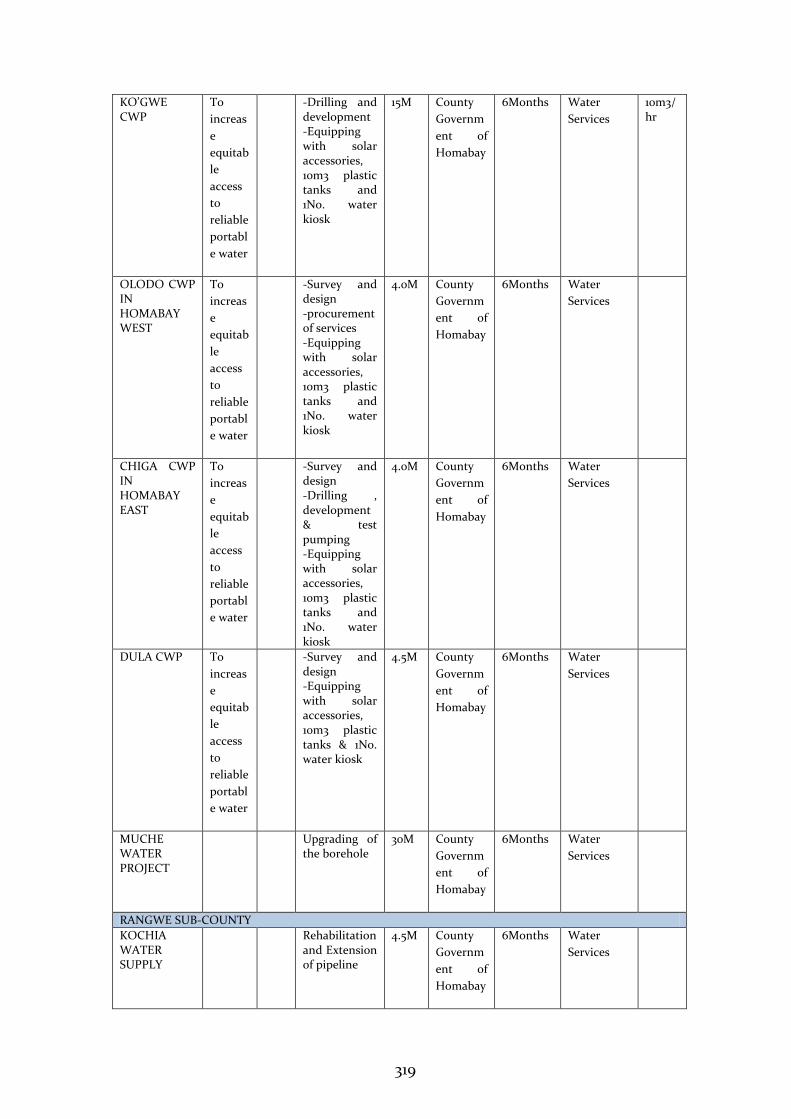
319
KO’GWE CWP
To
increas
e
equitab
le
access
to
reliable
portabl
e water
-Drilling and development -Equipping with solar accessories, 10m3 plastic tanks and 1No. water kiosk
15M County
Governm
ent of
Homabay
6Months Water
Services
10m3/hr
OLODO CWP IN HOMABAY WEST
To
increas
e
equitab
le
access
to
reliable
portabl
e water
-Survey and design -procurement of services -Equipping with solar accessories, 10m3 plastic tanks and 1No. water kiosk
4.0M County
Governm
ent of
Homabay
6Months Water
Services
CHIGA CWP IN HOMABAY EAST
To
increas
e
equitab
le
access
to
reliable
portabl
e water
-Survey and design -Drilling , development & test pumping -Equipping with solar accessories, 10m3 plastic tanks and 1No. water kiosk
4.0M County
Governm
ent of
Homabay
6Months Water
Services
DULA CWP To
increas
e
equitab
le
access
to
reliable
portabl
e water
-Survey and design -Equipping with solar accessories, 10m3 plastic tanks & 1No. water kiosk
4.5M County
Governm
ent of
Homabay
6Months Water
Services
MUCHE WATER PROJECT
Upgrading of the borehole
30M County
Governm
ent of
Homabay
6Months Water
Services
RANGWE SUB-COUNTY
KOCHIA WATER SUPPLY
Rehabilitation and Extension of pipeline
4.5M County
Governm
ent of
Homabay
6Months Water
Services
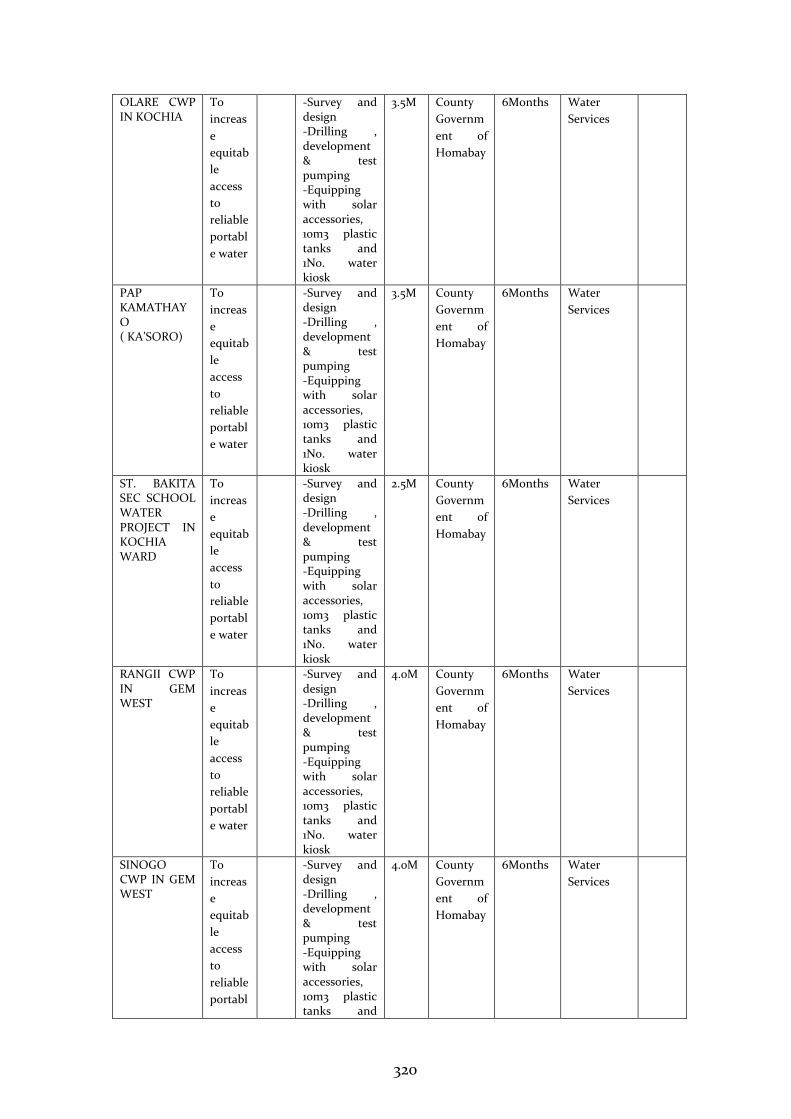
320
OLARE CWP IN KOCHIA
To
increas
e
equitab
le
access
to
reliable
portabl
e water
-Survey and design -Drilling , development & test pumping -Equipping with solar accessories, 10m3 plastic tanks and 1No. water kiosk
3.5M County
Governm
ent of
Homabay
6Months Water
Services
PAP KAMATHAYO ( KA’SORO)
To
increas
e
equitab
le
access
to
reliable
portabl
e water
-Survey and design -Drilling , development & test pumping -Equipping with solar accessories, 10m3 plastic tanks and 1No. water kiosk
3.5M County
Governm
ent of
Homabay
6Months Water
Services
ST. BAKITA SEC SCHOOL WATER PROJECT IN KOCHIA WARD
To
increas
e
equitab
le
access
to
reliable
portabl
e water
-Survey and design -Drilling , development & test pumping -Equipping with solar accessories, 10m3 plastic tanks and 1No. water kiosk
2.5M County
Governm
ent of
Homabay
6Months Water
Services
RANGII CWP IN GEM WEST
To
increas
e
equitab
le
access
to
reliable
portabl
e water
-Survey and design -Drilling , development & test pumping -Equipping with solar accessories, 10m3 plastic tanks and 1No. water kiosk
4.0M County
Governm
ent of
Homabay
6Months Water
Services
SINOGO CWP IN GEM WEST
To
increas
e
equitab
le
access
to
reliable
portabl
-Survey and design -Drilling , development & test pumping -Equipping with solar accessories, 10m3 plastic tanks and
4.0M County
Governm
ent of
Homabay
6Months Water
Services
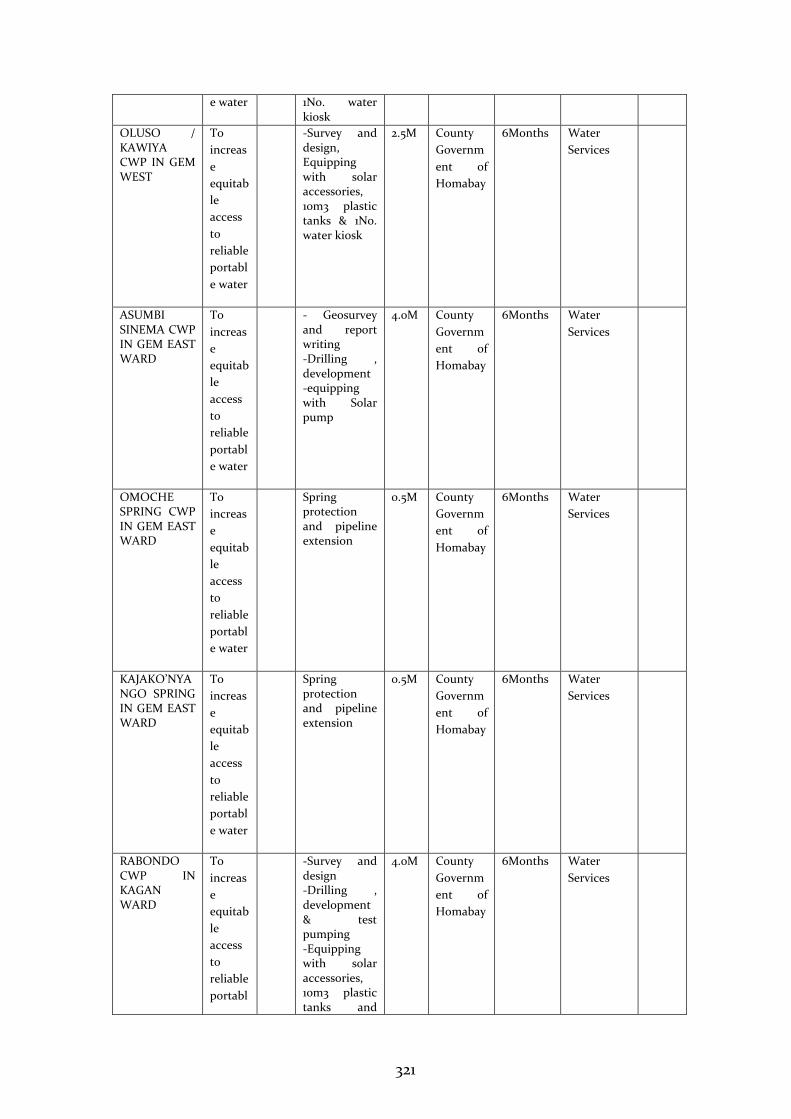
321
e water 1No. water kiosk
OLUSO / KAWIYA CWP IN GEM WEST
To
increas
e
equitab
le
access
to
reliable
portabl
e water
-Survey and design, Equipping with solar accessories, 10m3 plastic tanks & 1No. water kiosk
2.5M County
Governm
ent of
Homabay
6Months Water
Services
ASUMBI SINEMA CWP IN GEM EAST WARD
To
increas
e
equitab
le
access
to
reliable
portabl
e water
- Geosurvey and report writing -Drilling , development -equipping with Solar pump
4.0M County
Governm
ent of
Homabay
6Months Water
Services
OMOCHE SPRING CWP IN GEM EAST WARD
To
increas
e
equitab
le
access
to
reliable
portabl
e water
Spring protection and pipeline extension
0.5M County
Governm
ent of
Homabay
6Months Water
Services
KAJAKO’NYANGO SPRING IN GEM EAST WARD
To
increas
e
equitab
le
access
to
reliable
portabl
e water
Spring protection and pipeline extension
0.5M County
Governm
ent of
Homabay
6Months Water
Services
RABONDO CWP IN KAGAN WARD
To
increas
e
equitab
le
access
to
reliable
portabl
-Survey and design -Drilling , development & test pumping -Equipping with solar accessories, 10m3 plastic tanks and
4.0M County
Governm
ent of
Homabay
6Months Water
Services
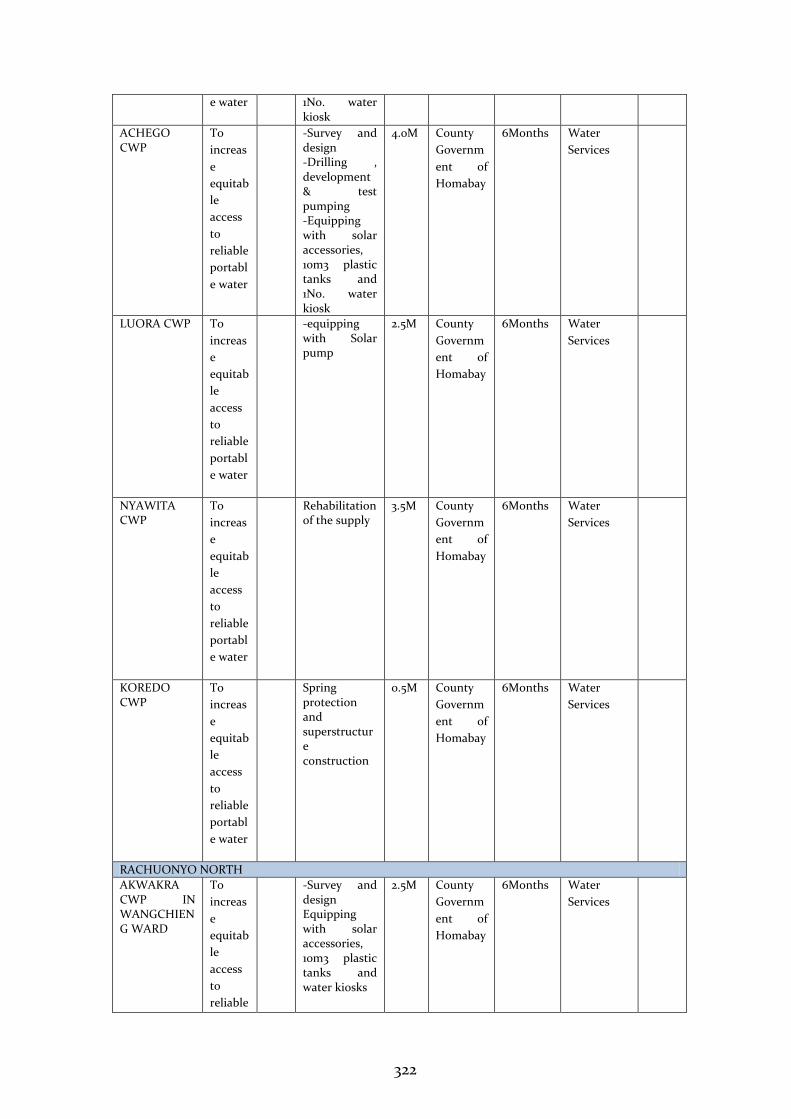
322
e water 1No. water kiosk
ACHEGO CWP
To
increas
e
equitab
le
access
to
reliable
portabl
e water
-Survey and design -Drilling , development & test pumping -Equipping with solar accessories, 10m3 plastic tanks and 1No. water kiosk
4.0M County
Governm
ent of
Homabay
6Months Water
Services
LUORA CWP To
increas
e
equitab
le
access
to
reliable
portabl
e water
-equipping with Solar pump
2.5M County
Governm
ent of
Homabay
6Months Water
Services
NYAWITA CWP
To
increas
e
equitab
le
access
to
reliable
portabl
e water
Rehabilitation of the supply
3.5M County
Governm
ent of
Homabay
6Months Water
Services
KOREDO CWP
To
increas
e
equitab
le
access
to
reliable
portabl
e water
Spring protection and superstructure construction
0.5M County
Governm
ent of
Homabay
6Months Water
Services
RACHUONYO NORTH
AKWAKRA CWP IN WANGCHIENG WARD
To
increas
e
equitab
le
access
to
reliable
-Survey and design Equipping with solar accessories, 10m3 plastic tanks and water kiosks
2.5M County
Governm
ent of
Homabay
6Months Water
Services
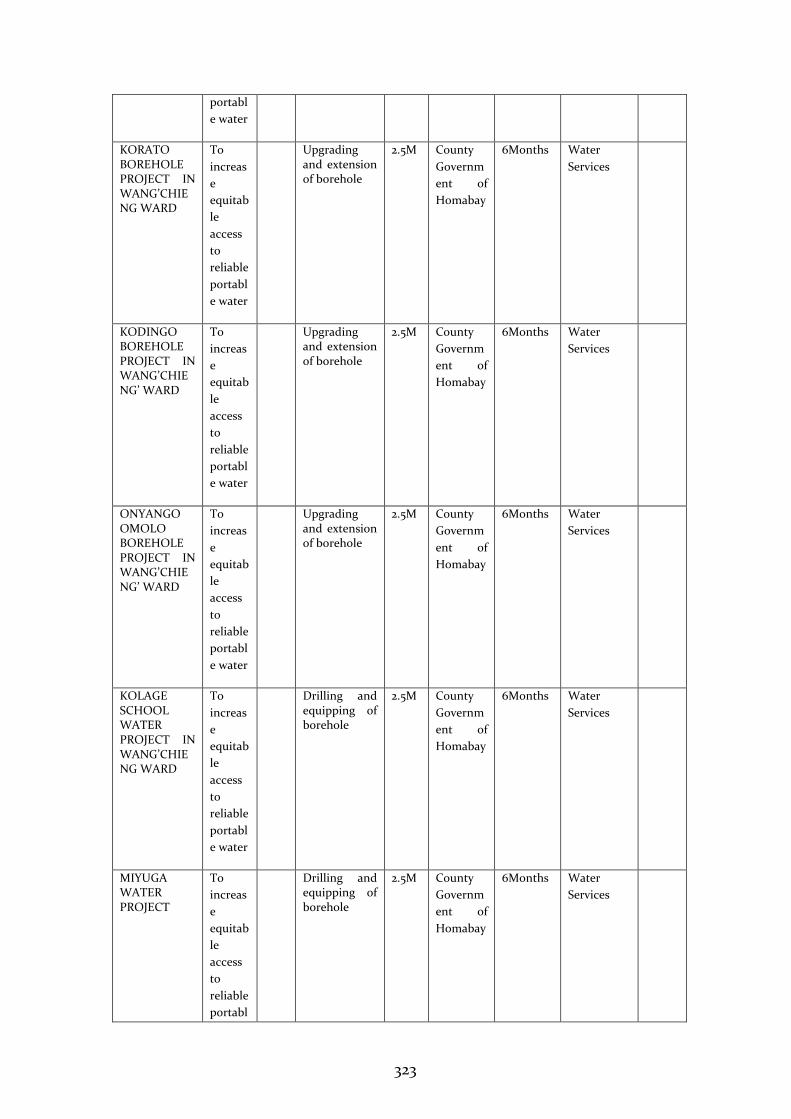
323
portabl
e water
KORATO BOREHOLE PROJECT IN WANG’CHIENG WARD
To
increas
e
equitab
le
access
to
reliable
portabl
e water
Upgrading and extension of borehole
2.5M County
Governm
ent of
Homabay
6Months Water
Services
KODINGO BOREHOLE PROJECT IN WANG’CHIENG’ WARD
To
increas
e
equitab
le
access
to
reliable
portabl
e water
Upgrading and extension of borehole
2.5M County
Governm
ent of
Homabay
6Months Water
Services
ONYANGO OMOLO BOREHOLE PROJECT IN WANG’CHIENG’ WARD
To
increas
e
equitab
le
access
to
reliable
portabl
e water
Upgrading and extension of borehole
2.5M County
Governm
ent of
Homabay
6Months Water
Services
KOLAGE SCHOOL WATER PROJECT IN WANG’CHIENG WARD
To
increas
e
equitab
le
access
to
reliable
portabl
e water
Drilling and equipping of borehole
2.5M County
Governm
ent of
Homabay
6Months Water
Services
MIYUGA WATER PROJECT
To
increas
e
equitab
le
access
to
reliable
portabl
Drilling and equipping of borehole
2.5M County
Governm
ent of
Homabay
6Months Water
Services
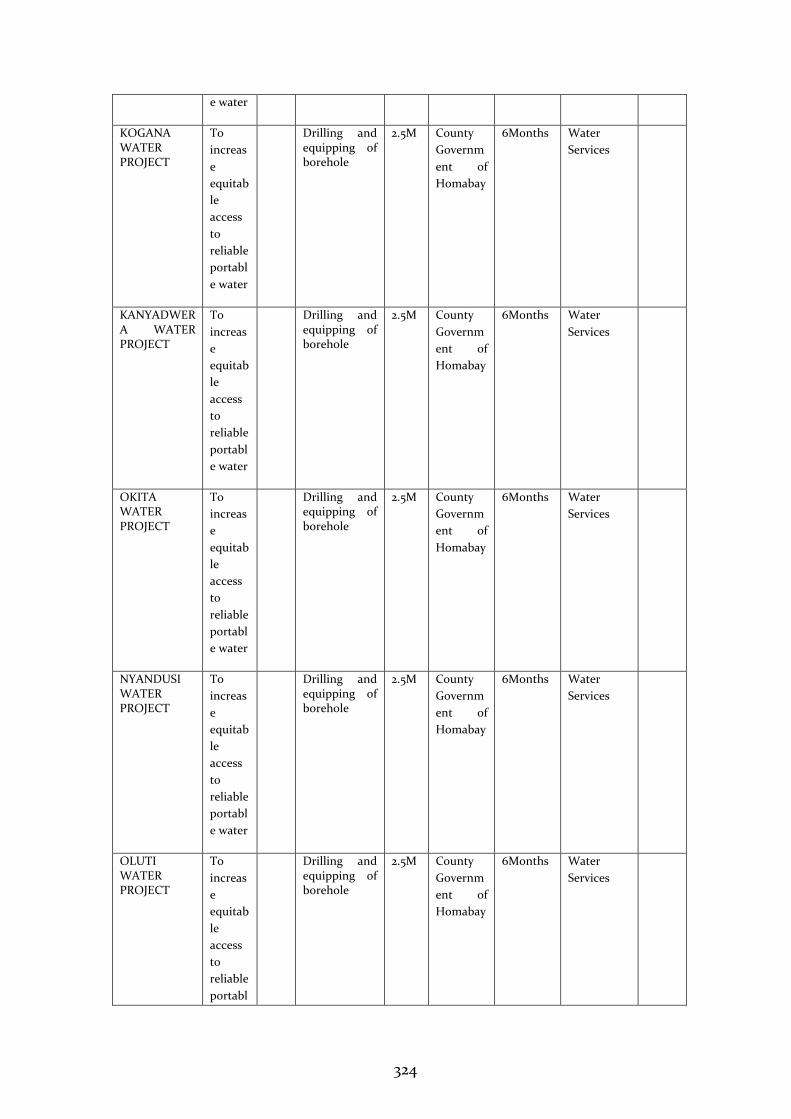
324
e water
KOGANA WATER PROJECT
To
increas
e
equitab
le
access
to
reliable
portabl
e water
Drilling and equipping of borehole
2.5M County
Governm
ent of
Homabay
6Months Water
Services
KANYADWERA WATER PROJECT
To
increas
e
equitab
le
access
to
reliable
portabl
e water
Drilling and equipping of borehole
2.5M County
Governm
ent of
Homabay
6Months Water
Services
OKITA WATER PROJECT
To
increas
e
equitab
le
access
to
reliable
portabl
e water
Drilling and equipping of borehole
2.5M County
Governm
ent of
Homabay
6Months Water
Services
NYANDUSI WATER PROJECT
To
increas
e
equitab
le
access
to
reliable
portabl
e water
Drilling and equipping of borehole
2.5M County
Governm
ent of
Homabay
6Months Water
Services
OLUTI WATER PROJECT
To
increas
e
equitab
le
access
to
reliable
portabl
Drilling and equipping of borehole
2.5M County
Governm
ent of
Homabay
6Months Water
Services
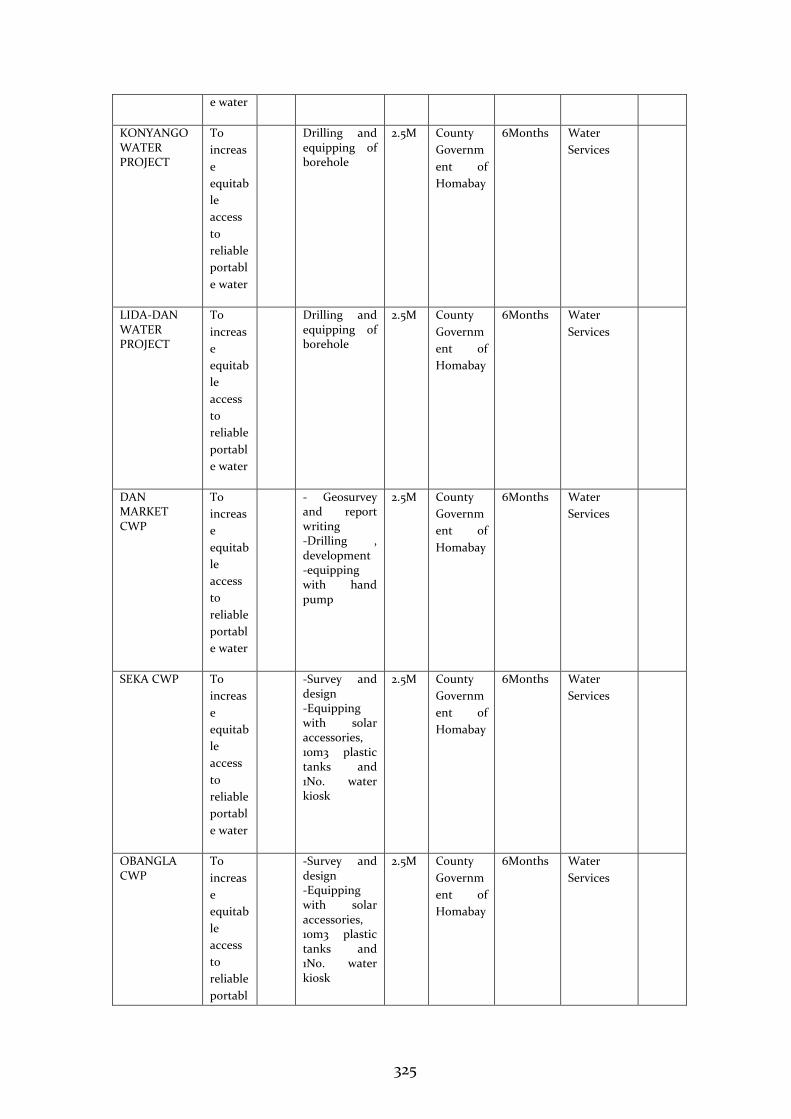
325
e water
KONYANGO WATER PROJECT
To
increas
e
equitab
le
access
to
reliable
portabl
e water
Drilling and equipping of borehole
2.5M County
Governm
ent of
Homabay
6Months Water
Services
LIDA-DAN WATER PROJECT
To
increas
e
equitab
le
access
to
reliable
portabl
e water
Drilling and equipping of borehole
2.5M County
Governm
ent of
Homabay
6Months Water
Services
DAN MARKET CWP
To
increas
e
equitab
le
access
to
reliable
portabl
e water
- Geosurvey and report writing -Drilling , development -equipping with hand pump
2.5M County
Governm
ent of
Homabay
6Months Water
Services
SEKA CWP To
increas
e
equitab
le
access
to
reliable
portabl
e water
-Survey and design -Equipping with solar accessories, 10m3 plastic tanks and 1No. water kiosk
2.5M County
Governm
ent of
Homabay
6Months Water
Services
OBANGLA CWP
To
increas
e
equitab
le
access
to
reliable
portabl
-Survey and design -Equipping with solar accessories, 10m3 plastic tanks and 1No. water kiosk
2.5M County
Governm
ent of
Homabay
6Months Water
Services
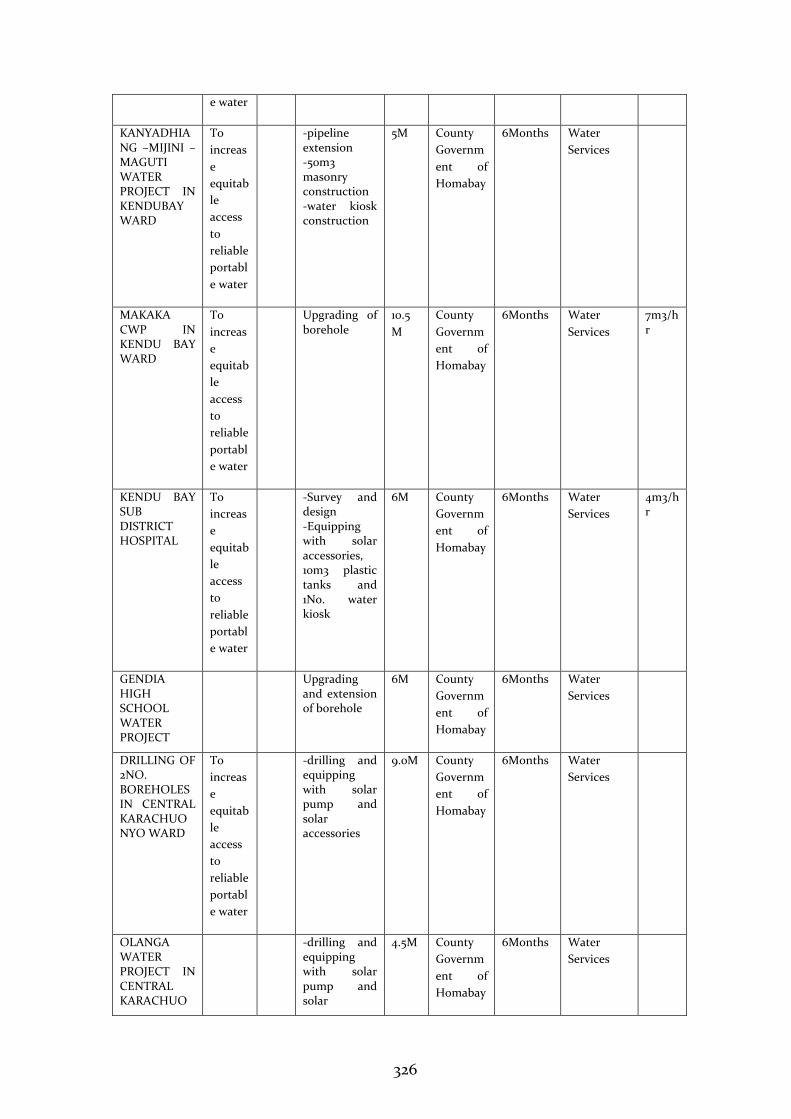
326
e water
KANYADHIANG –MIJINI –MAGUTI WATER PROJECT IN KENDUBAY WARD
To
increas
e
equitab
le
access
to
reliable
portabl
e water
-pipeline extension -50m3 masonry construction -water kiosk construction
5M County
Governm
ent of
Homabay
6Months Water
Services
MAKAKA CWP IN KENDU BAY WARD
To
increas
e
equitab
le
access
to
reliable
portabl
e water
Upgrading of borehole
10.5
M
County
Governm
ent of
Homabay
6Months Water
Services
7m3/hr
KENDU BAY SUB DISTRICT HOSPITAL
To
increas
e
equitab
le
access
to
reliable
portabl
e water
-Survey and design -Equipping with solar accessories, 10m3 plastic tanks and 1No. water kiosk
6M County
Governm
ent of
Homabay
6Months Water
Services
4m3/hr
GENDIA HIGH SCHOOL WATER PROJECT
Upgrading and extension of borehole
6M County
Governm
ent of
Homabay
6Months Water
Services
DRILLING OF 2NO. BOREHOLES IN CENTRAL KARACHUONYO WARD
To
increas
e
equitab
le
access
to
reliable
portabl
e water
-drilling and equipping with solar pump and solar accessories
9.0M County
Governm
ent of
Homabay
6Months Water
Services
OLANGA WATER PROJECT IN CENTRAL KARACHUO
-drilling and equipping with solar pump and solar
4.5M County
Governm
ent of
Homabay
6Months Water
Services
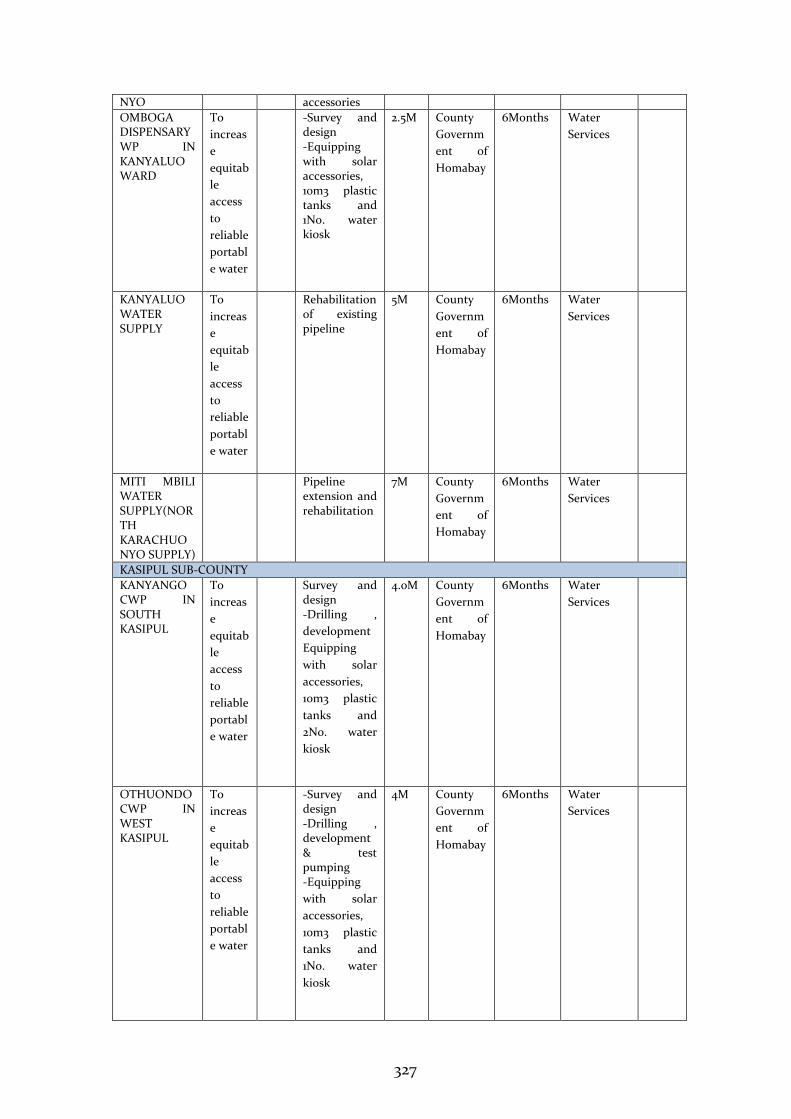
327
NYO accessories
OMBOGA DISPENSARY WP IN KANYALUO WARD
To
increas
e
equitab
le
access
to
reliable
portabl
e water
-Survey and design -Equipping with solar accessories, 10m3 plastic tanks and 1No. water kiosk
2.5M County
Governm
ent of
Homabay
6Months Water
Services
KANYALUO WATER SUPPLY
To
increas
e
equitab
le
access
to
reliable
portabl
e water
Rehabilitation of existing pipeline
5M County
Governm
ent of
Homabay
6Months Water
Services
MITI MBILI WATER SUPPLY(NORTH KARACHUONYO SUPPLY)
Pipeline extension and rehabilitation
7M County
Governm
ent of
Homabay
6Months Water
Services
KASIPUL SUB-COUNTY
KANYANGO CWP IN SOUTH KASIPUL
To
increas
e
equitab
le
access
to
reliable
portabl
e water
Survey and design -Drilling ,
development
Equipping
with solar
accessories,
10m3 plastic
tanks and
2No. water
kiosk
4.0M County
Governm
ent of
Homabay
6Months Water
Services
OTHUONDO CWP IN WEST KASIPUL
To
increas
e
equitab
le
access
to
reliable
portabl
e water
-Survey and design -Drilling , development & test pumping -Equipping
with solar
accessories,
10m3 plastic
tanks and
1No. water
kiosk
4M County
Governm
ent of
Homabay
6Months Water
Services
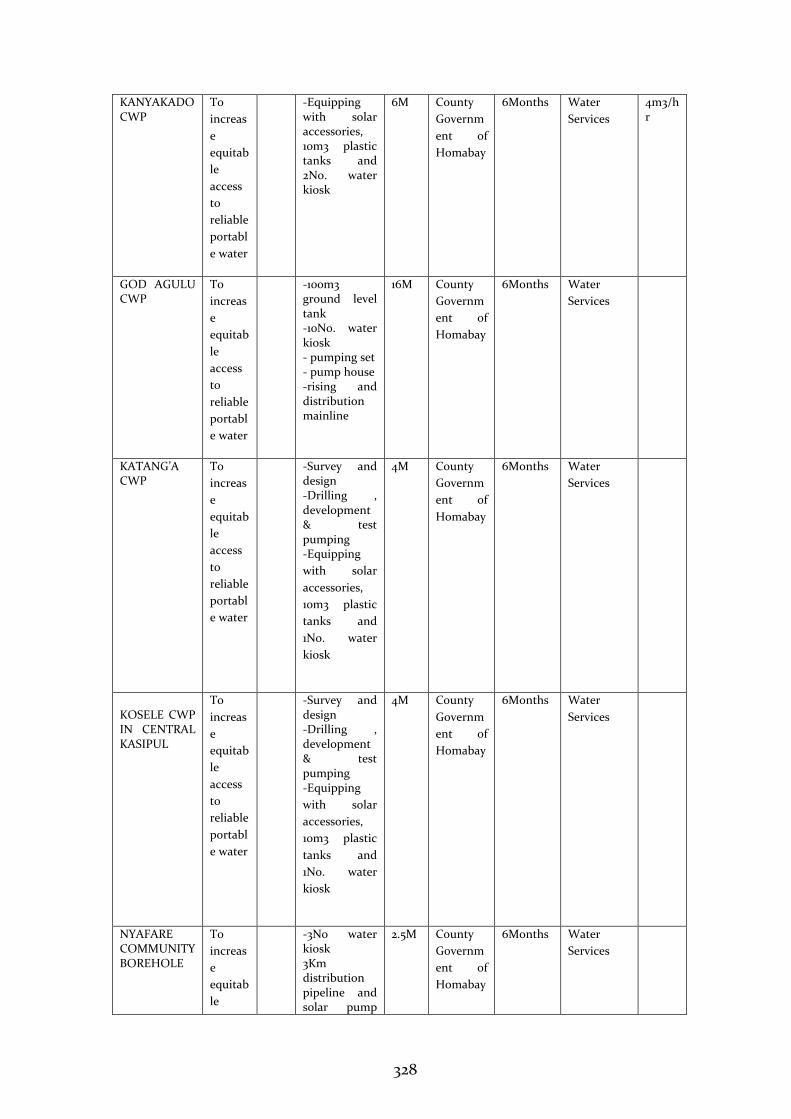
328
KANYAKADO CWP
To
increas
e
equitab
le
access
to
reliable
portabl
e water
-Equipping with solar accessories, 10m3 plastic tanks and 2No. water kiosk
6M County
Governm
ent of
Homabay
6Months Water
Services
4m3/hr
GOD AGULU CWP
To
increas
e
equitab
le
access
to
reliable
portabl
e water
-100m3 ground level tank -10No. water kiosk - pumping set - pump house -rising and distribution mainline
16M County
Governm
ent of
Homabay
6Months Water
Services
KATANG’A CWP
To
increas
e
equitab
le
access
to
reliable
portabl
e water
-Survey and design -Drilling , development & test pumping -Equipping
with solar
accessories,
10m3 plastic
tanks and
1No. water
kiosk
4M County
Governm
ent of
Homabay
6Months Water
Services
KOSELE CWP IN CENTRAL KASIPUL
To
increas
e
equitab
le
access
to
reliable
portabl
e water
-Survey and design -Drilling , development & test pumping -Equipping
with solar
accessories,
10m3 plastic
tanks and
1No. water
kiosk
4M County
Governm
ent of
Homabay
6Months Water
Services
NYAFARE COMMUNITY BOREHOLE
To
increas
e
equitab
le
-3No water kiosk 3Km distribution pipeline and solar pump
2.5M County
Governm
ent of
Homabay
6Months Water
Services
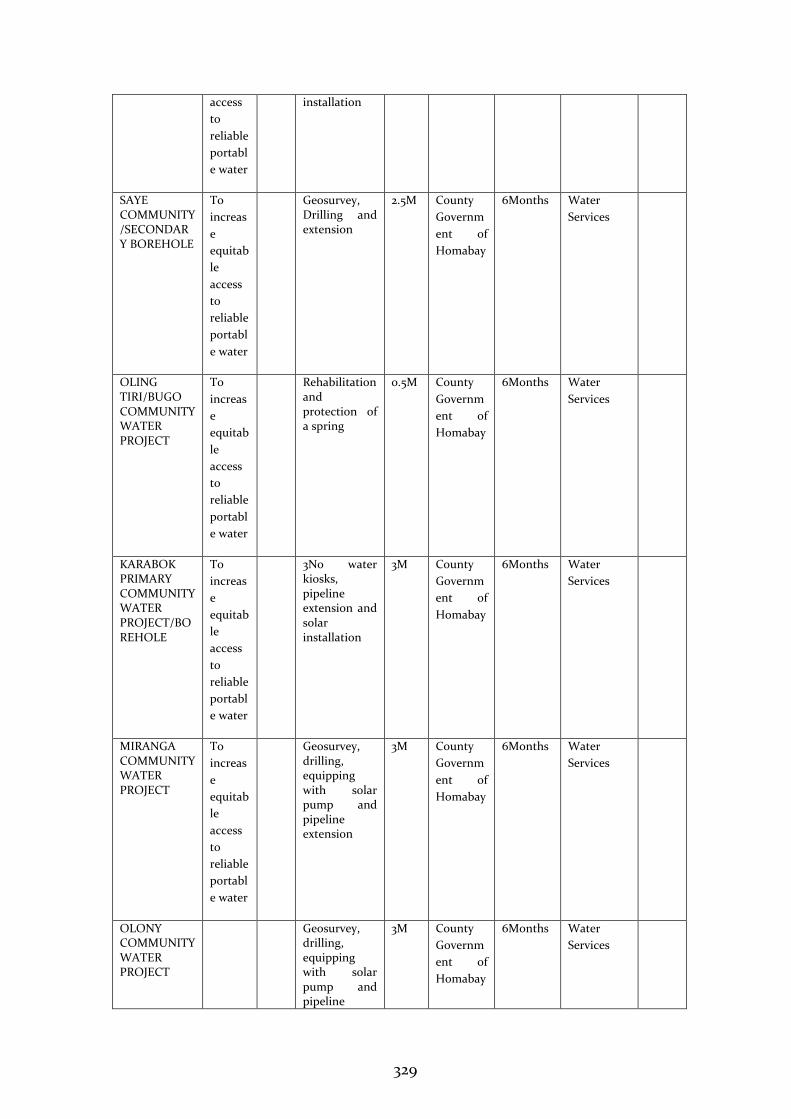
329
access
to
reliable
portabl
e water
installation
SAYE COMMUNITY/SECONDARY BOREHOLE
To
increas
e
equitab
le
access
to
reliable
portabl
e water
Geosurvey, Drilling and extension
2.5M County
Governm
ent of
Homabay
6Months Water
Services
OLING TIRI/BUGO COMMUNITY WATER PROJECT
To
increas
e
equitab
le
access
to
reliable
portabl
e water
Rehabilitation and protection of a spring
0.5M County
Governm
ent of
Homabay
6Months Water
Services
KARABOK PRIMARY COMMUNITY WATER PROJECT/BOREHOLE
To
increas
e
equitab
le
access
to
reliable
portabl
e water
3No water kiosks, pipeline extension and solar installation
3M County
Governm
ent of
Homabay
6Months Water
Services
MIRANGA COMMUNITY WATER PROJECT
To
increas
e
equitab
le
access
to
reliable
portabl
e water
Geosurvey, drilling, equipping with solar pump and pipeline extension
3M County
Governm
ent of
Homabay
6Months Water
Services
OLONY COMMUNITY WATER PROJECT
Geosurvey, drilling, equipping with solar pump and pipeline
3M County
Governm
ent of
Homabay
6Months Water
Services
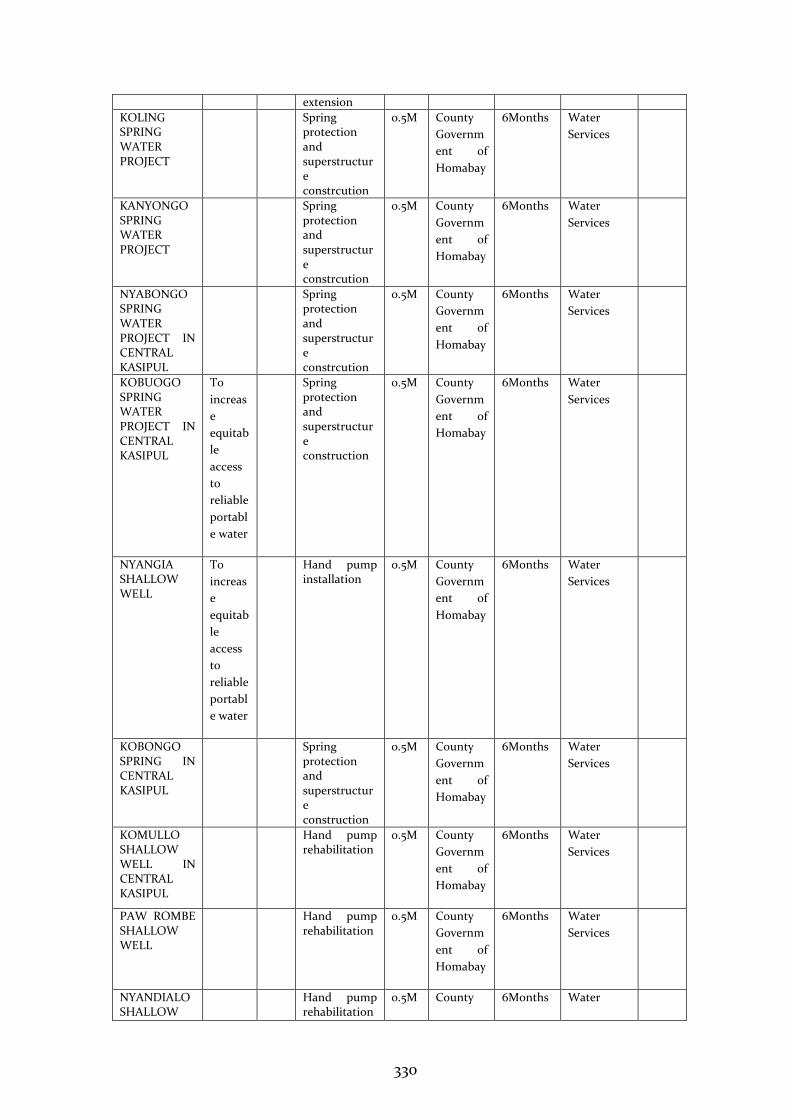
330
extension
KOLING SPRING WATER PROJECT
Spring protection and superstructure constrcution
0.5M County
Governm
ent of
Homabay
6Months Water
Services
KANYONGO SPRING WATER PROJECT
Spring protection and superstructure constrcution
0.5M County
Governm
ent of
Homabay
6Months Water
Services
NYABONGO SPRING WATER PROJECT IN CENTRAL KASIPUL
Spring protection and superstructure constrcution
0.5M County
Governm
ent of
Homabay
6Months Water
Services
KOBUOGO SPRING WATER PROJECT IN CENTRAL KASIPUL
To
increas
e
equitab
le
access
to
reliable
portabl
e water
Spring protection and superstructure construction
0.5M County
Governm
ent of
Homabay
6Months Water
Services
NYANGIA SHALLOW WELL
To
increas
e
equitab
le
access
to
reliable
portabl
e water
Hand pump installation
0.5M County
Governm
ent of
Homabay
6Months Water
Services
KOBONGO SPRING IN CENTRAL KASIPUL
Spring protection and superstructure construction
0.5M County
Governm
ent of
Homabay
6Months Water
Services
KOMULLO SHALLOW WELL IN CENTRAL KASIPUL
Hand pump rehabilitation
0.5M County
Governm
ent of
Homabay
6Months Water
Services
PAW ROMBE SHALLOW WELL
Hand pump rehabilitation
0.5M County
Governm
ent of
Homabay
6Months Water
Services
NYANDIALO SHALLOW
Hand pump rehabilitation
0.5M County 6Months Water
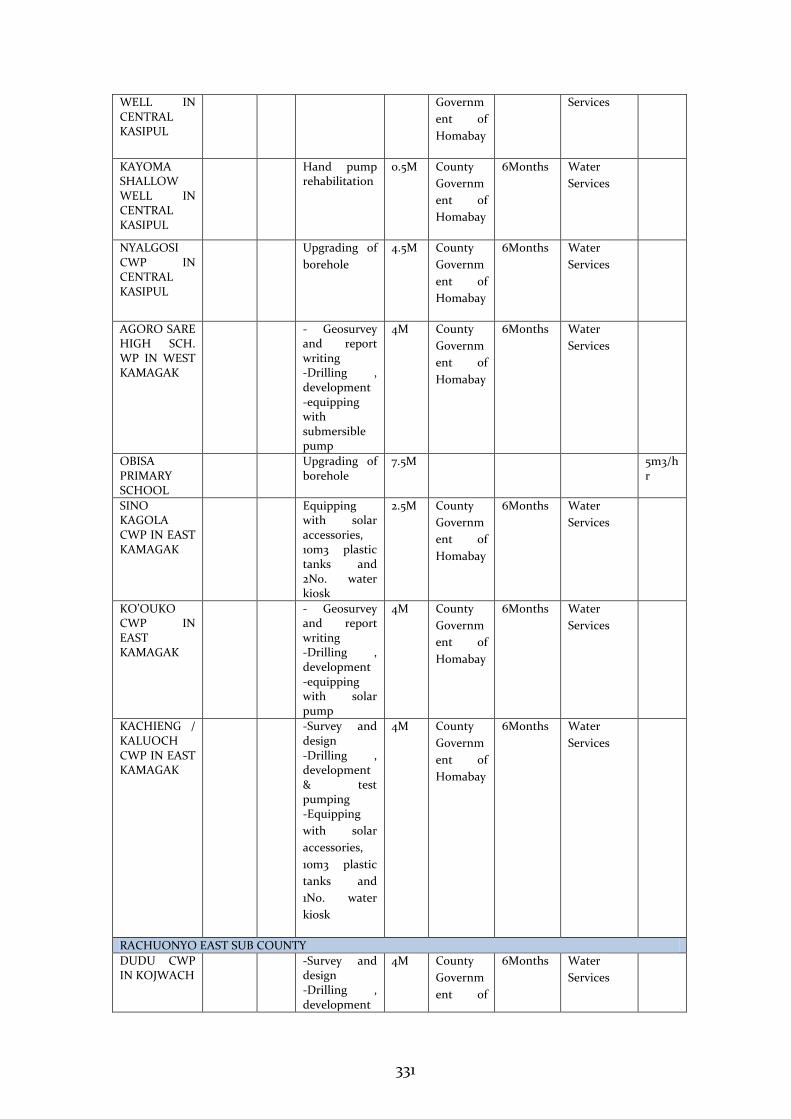
331
WELL IN CENTRAL KASIPUL
Governm
ent of
Homabay
Services
KAYOMA SHALLOW WELL IN CENTRAL KASIPUL
Hand pump rehabilitation
0.5M County
Governm
ent of
Homabay
6Months Water
Services
NYALGOSI CWP IN CENTRAL KASIPUL
Upgrading of
borehole
4.5M County
Governm
ent of
Homabay
6Months Water
Services
AGORO SARE HIGH SCH. WP IN WEST KAMAGAK
- Geosurvey and report writing -Drilling , development -equipping with submersible pump
4M County
Governm
ent of
Homabay
6Months Water
Services
OBISA PRIMARY SCHOOL
Upgrading of borehole
7.5M 5m3/hr
SINO KAGOLA CWP IN EAST KAMAGAK
Equipping with solar accessories, 10m3 plastic tanks and 2No. water kiosk
2.5M County
Governm
ent of
Homabay
6Months Water
Services
KO’OUKO CWP IN EAST KAMAGAK
- Geosurvey and report writing -Drilling , development -equipping with solar pump
4M County
Governm
ent of
Homabay
6Months Water
Services
KACHIENG / KALUOCH CWP IN EAST KAMAGAK
-Survey and design -Drilling , development & test pumping -Equipping
with solar
accessories,
10m3 plastic
tanks and
1No. water
kiosk
4M County
Governm
ent of
Homabay
6Months Water
Services
RACHUONYO EAST SUB COUNTY
DUDU CWP IN KOJWACH
-Survey and design -Drilling , development
4M County
Governm
ent of
6Months Water
Services
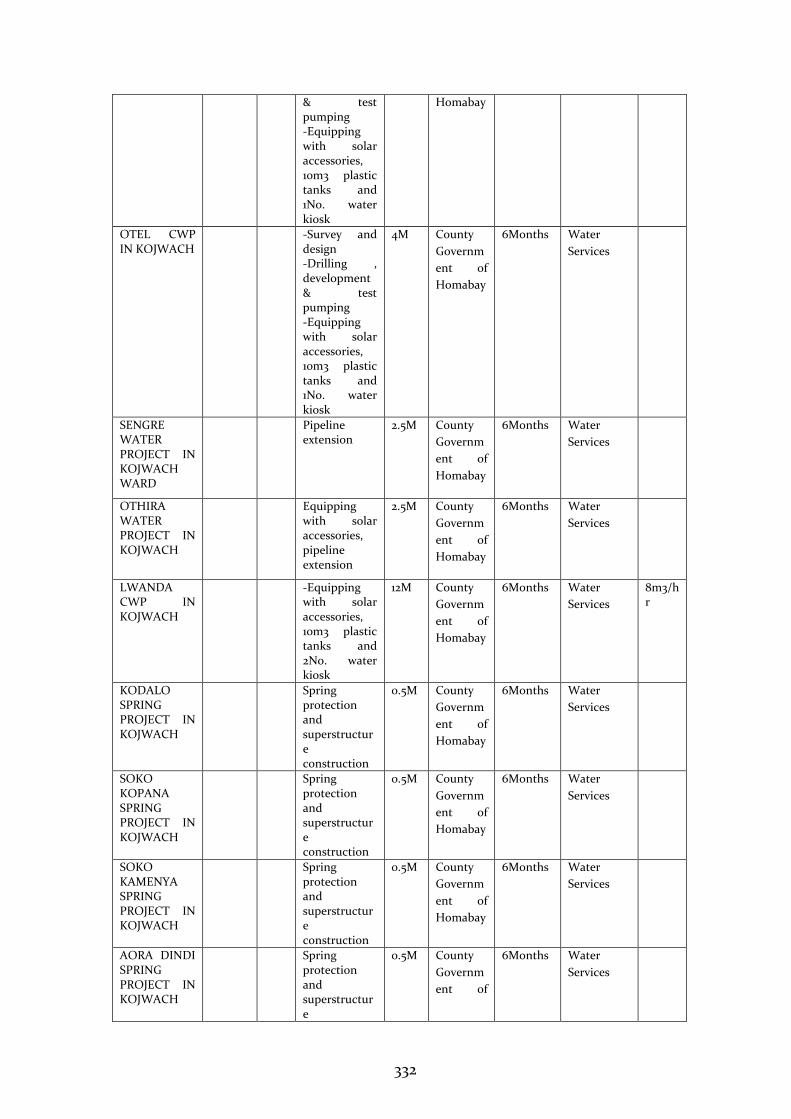
332
& test pumping -Equipping with solar accessories, 10m3 plastic tanks and 1No. water kiosk
Homabay
OTEL CWP IN KOJWACH
-Survey and design -Drilling , development & test pumping -Equipping with solar accessories, 10m3 plastic tanks and 1No. water kiosk
4M County
Governm
ent of
Homabay
6Months Water
Services
SENGRE WATER PROJECT IN KOJWACH WARD
Pipeline extension
2.5M County
Governm
ent of
Homabay
6Months Water
Services
OTHIRA WATER PROJECT IN KOJWACH
Equipping with solar accessories, pipeline extension
2.5M County
Governm
ent of
Homabay
6Months Water
Services
LWANDA CWP IN KOJWACH
-Equipping with solar accessories, 10m3 plastic tanks and 2No. water kiosk
12M County
Governm
ent of
Homabay
6Months Water
Services
8m3/hr
KODALO SPRING PROJECT IN KOJWACH
Spring protection and superstructure construction
0.5M County
Governm
ent of
Homabay
6Months Water
Services
SOKO KOPANA SPRING PROJECT IN KOJWACH
Spring protection and superstructure construction
0.5M County
Governm
ent of
Homabay
6Months Water
Services
SOKO KAMENYA SPRING PROJECT IN KOJWACH
Spring protection and superstructure construction
0.5M County
Governm
ent of
Homabay
6Months Water
Services
AORA DINDI SPRING PROJECT IN KOJWACH
Spring protection and superstructure
0.5M County
Governm
ent of
6Months Water
Services
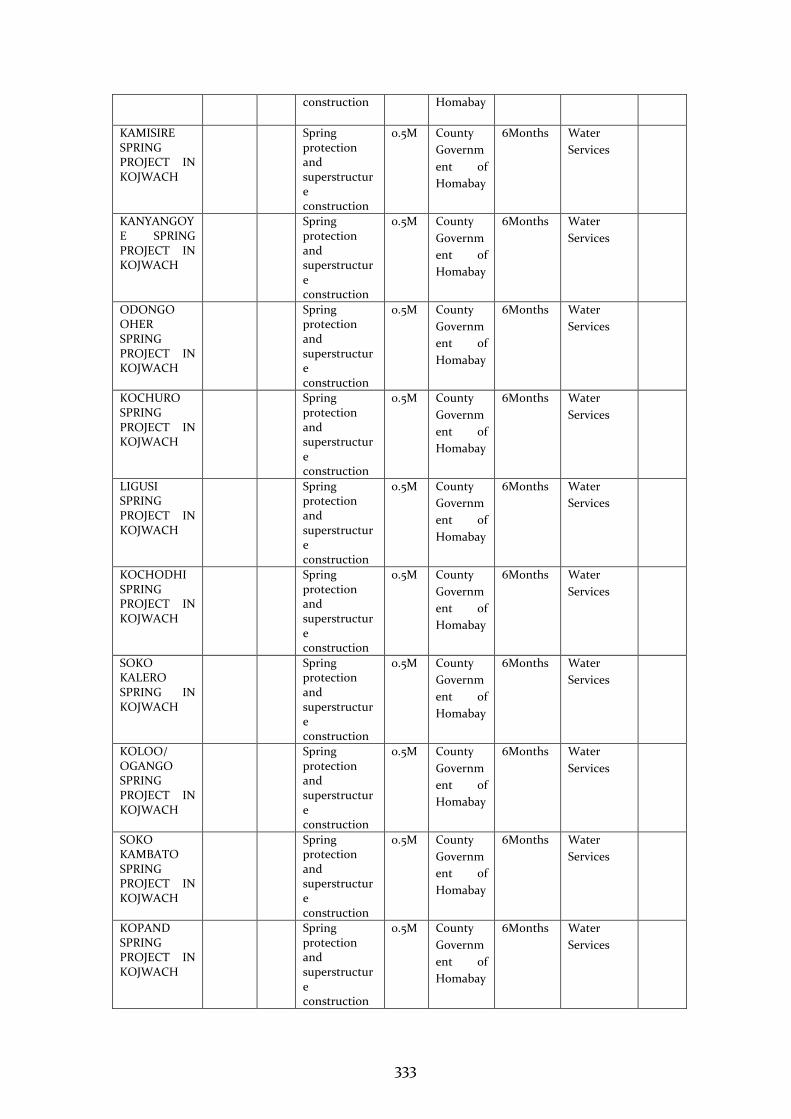
333
construction Homabay
KAMISIRE SPRING PROJECT IN KOJWACH
Spring protection and superstructure construction
0.5M County
Governm
ent of
Homabay
6Months Water
Services
KANYANGOYE SPRING PROJECT IN KOJWACH
Spring protection and superstructure construction
0.5M County
Governm
ent of
Homabay
6Months Water
Services
ODONGO OHER SPRING PROJECT IN KOJWACH
Spring protection and superstructure construction
0.5M County
Governm
ent of
Homabay
6Months Water
Services
KOCHURO SPRING PROJECT IN KOJWACH
Spring protection and superstructure construction
0.5M County
Governm
ent of
Homabay
6Months Water
Services
LIGUSI SPRING PROJECT IN KOJWACH
Spring protection and superstructure construction
0.5M County
Governm
ent of
Homabay
6Months Water
Services
KOCHODHI SPRING PROJECT IN KOJWACH
Spring protection and superstructure construction
0.5M County
Governm
ent of
Homabay
6Months Water
Services
SOKO KALERO SPRING IN KOJWACH
Spring protection and superstructure construction
0.5M County
Governm
ent of
Homabay
6Months Water
Services
KOLOO/ OGANGO SPRING PROJECT IN KOJWACH
Spring protection and superstructure construction
0.5M County
Governm
ent of
Homabay
6Months Water
Services
SOKO KAMBATO SPRING PROJECT IN KOJWACH
Spring protection and superstructure construction
0.5M County
Governm
ent of
Homabay
6Months Water
Services
KOPAND SPRING PROJECT IN KOJWACH
Spring protection and superstructure construction
0.5M County
Governm
ent of
Homabay
6Months Water
Services
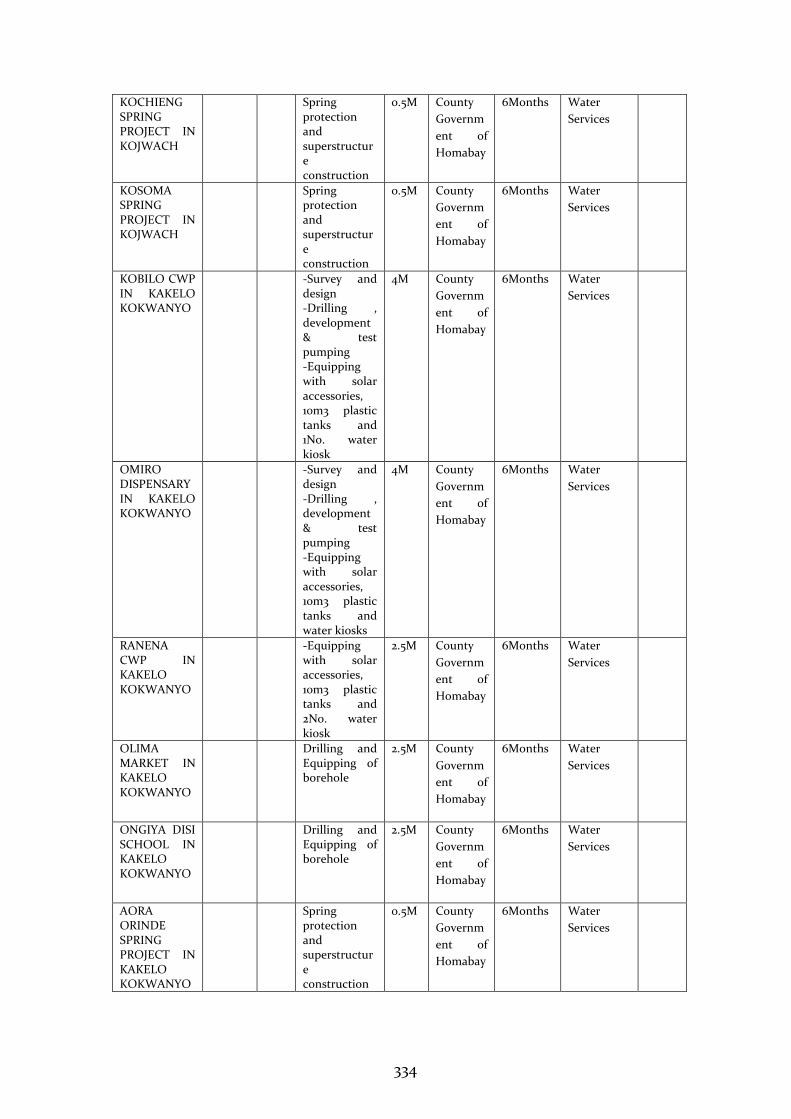
334
KOCHIENG SPRING PROJECT IN KOJWACH
Spring protection and superstructure construction
0.5M County
Governm
ent of
Homabay
6Months Water
Services
KOSOMA SPRING PROJECT IN KOJWACH
Spring protection and superstructure construction
0.5M County
Governm
ent of
Homabay
6Months Water
Services
KOBILO CWP IN KAKELO KOKWANYO
-Survey and design -Drilling , development & test pumping -Equipping with solar accessories, 10m3 plastic tanks and 1No. water kiosk
4M County
Governm
ent of
Homabay
6Months Water
Services
OMIRO DISPENSARY IN KAKELO KOKWANYO
-Survey and design -Drilling , development & test pumping -Equipping with solar accessories, 10m3 plastic tanks and water kiosks
4M County
Governm
ent of
Homabay
6Months Water
Services
RANENA CWP IN KAKELO KOKWANYO
-Equipping with solar accessories, 10m3 plastic tanks and 2No. water kiosk
2.5M County
Governm
ent of
Homabay
6Months Water
Services
OLIMA MARKET IN KAKELO KOKWANYO
Drilling and Equipping of borehole
2.5M County
Governm
ent of
Homabay
6Months Water
Services
ONGIYA DISI SCHOOL IN KAKELO KOKWANYO
Drilling and Equipping of borehole
2.5M County
Governm
ent of
Homabay
6Months Water
Services
AORA ORINDE SPRING PROJECT IN KAKELO KOKWANYO
Spring protection and superstructure construction
0.5M County
Governm
ent of
Homabay
6Months Water
Services
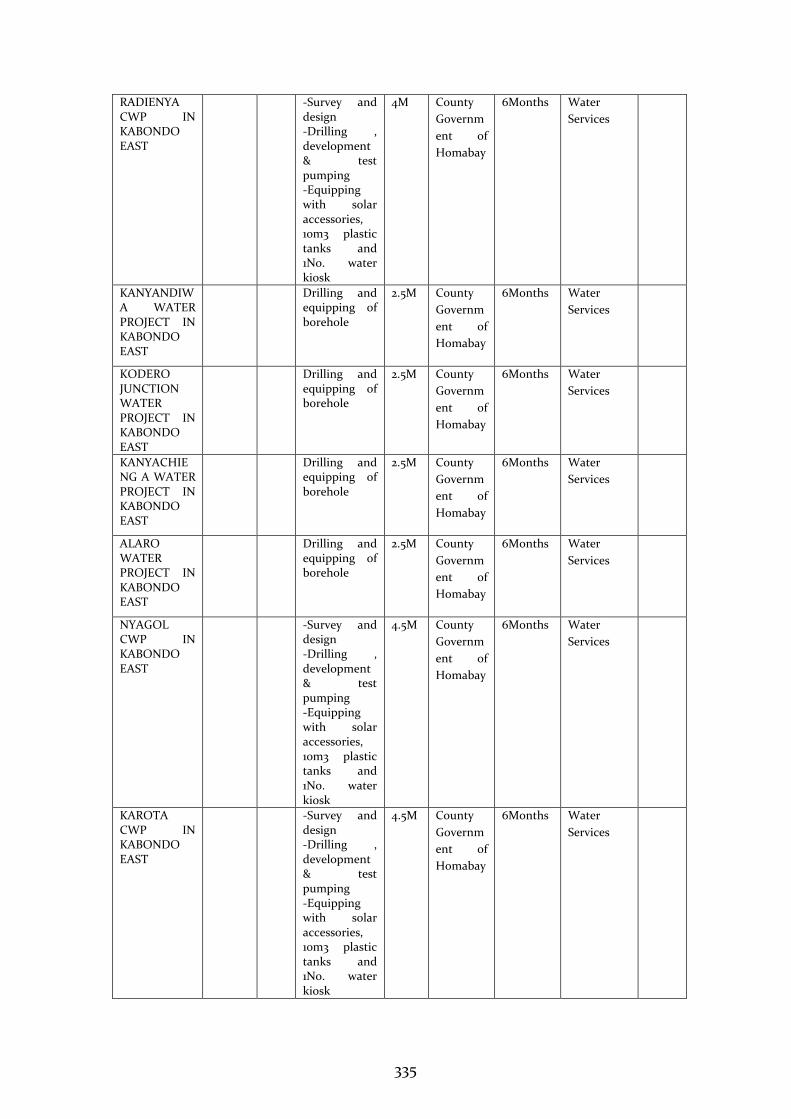
335
RADIENYA CWP IN KABONDO EAST
-Survey and design -Drilling , development & test pumping -Equipping with solar accessories, 10m3 plastic tanks and 1No. water kiosk
4M County
Governm
ent of
Homabay
6Months Water
Services
KANYANDIWA WATER PROJECT IN KABONDO EAST
Drilling and equipping of borehole
2.5M County
Governm
ent of
Homabay
6Months Water
Services
KODERO JUNCTION WATER PROJECT IN KABONDO EAST
Drilling and equipping of borehole
2.5M County
Governm
ent of
Homabay
6Months Water
Services
KANYACHIENG A WATER PROJECT IN KABONDO EAST
Drilling and equipping of borehole
2.5M County
Governm
ent of
Homabay
6Months Water
Services
ALARO WATER PROJECT IN KABONDO EAST
Drilling and equipping of borehole
2.5M County
Governm
ent of
Homabay
6Months Water
Services
NYAGOL CWP IN KABONDO EAST
-Survey and design -Drilling , development & test pumping -Equipping with solar accessories, 10m3 plastic tanks and 1No. water kiosk
4.5M County
Governm
ent of
Homabay
6Months Water
Services
KAROTA CWP IN KABONDO EAST
-Survey and design -Drilling , development & test pumping -Equipping with solar accessories, 10m3 plastic tanks and 1No. water kiosk
4.5M County
Governm
ent of
Homabay
6Months Water
Services
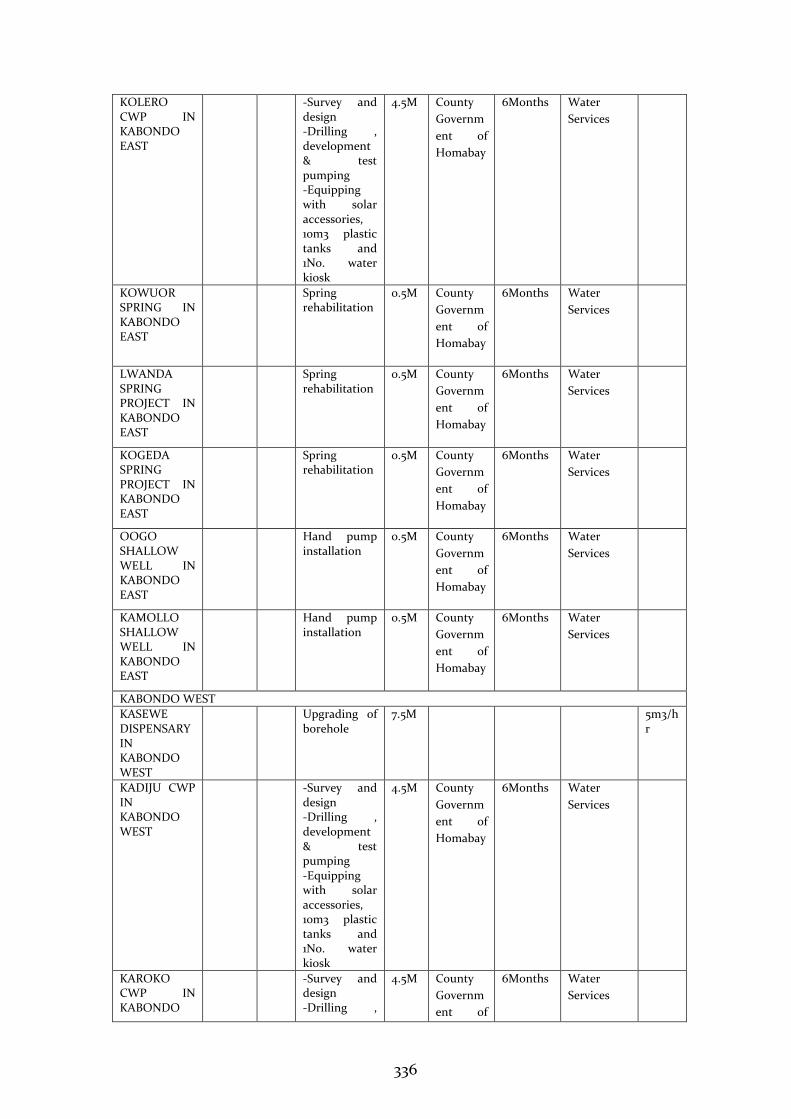
336
KOLERO CWP IN KABONDO EAST
-Survey and design -Drilling , development & test pumping -Equipping with solar accessories, 10m3 plastic tanks and 1No. water kiosk
4.5M County
Governm
ent of
Homabay
6Months Water
Services
KOWUOR SPRING IN KABONDO EAST
Spring rehabilitation
0.5M County
Governm
ent of
Homabay
6Months Water
Services
LWANDA SPRING PROJECT IN KABONDO EAST
Spring rehabilitation
0.5M County
Governm
ent of
Homabay
6Months Water
Services
KOGEDA SPRING PROJECT IN KABONDO EAST
Spring rehabilitation
0.5M County
Governm
ent of
Homabay
6Months Water
Services
OOGO SHALLOW WELL IN KABONDO EAST
Hand pump installation
0.5M County
Governm
ent of
Homabay
6Months Water
Services
KAMOLLO SHALLOW WELL IN KABONDO EAST
Hand pump installation
0.5M County
Governm
ent of
Homabay
6Months Water
Services
KABONDO WEST
KASEWE DISPENSARY IN KABONDO WEST
Upgrading of borehole
7.5M 5m3/hr
KADIJU CWP IN KABONDO WEST
-Survey and design -Drilling , development & test pumping -Equipping with solar accessories, 10m3 plastic tanks and 1No. water kiosk
4.5M County
Governm
ent of
Homabay
6Months Water
Services
KAROKO CWP IN KABONDO
-Survey and design -Drilling ,
4.5M County
Governm
ent of
6Months Water
Services
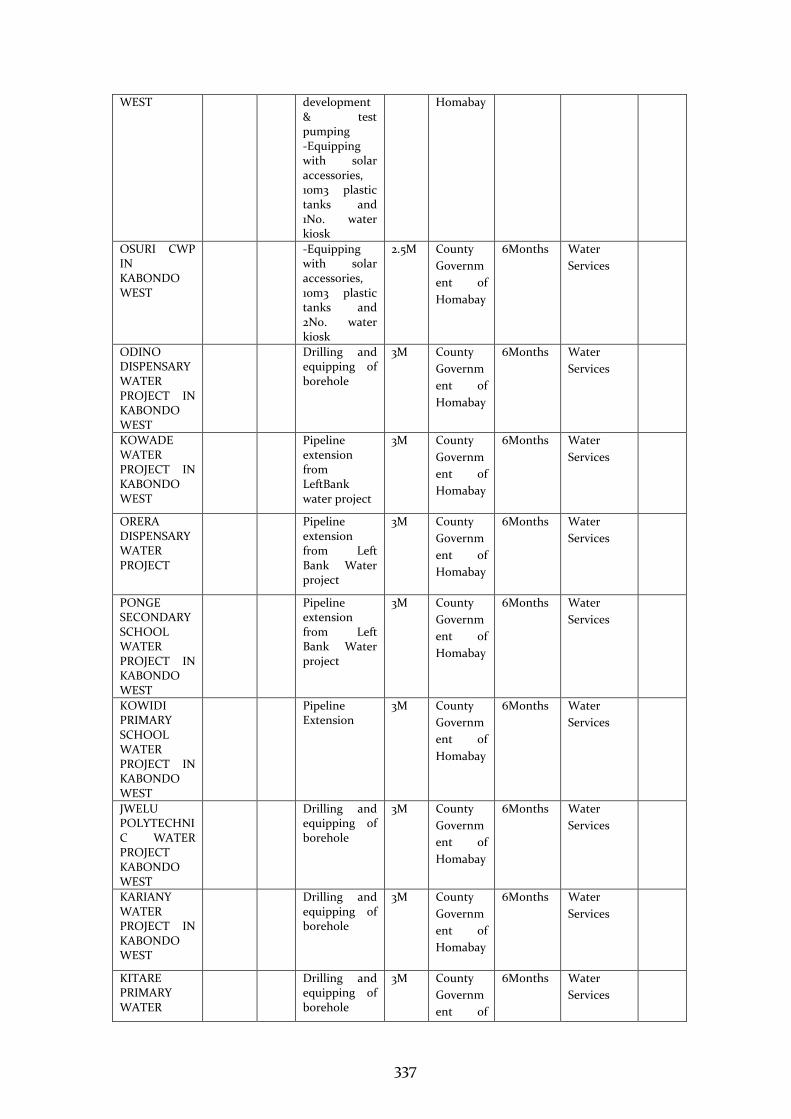
337
WEST development & test pumping -Equipping with solar accessories, 10m3 plastic tanks and 1No. water kiosk
Homabay
OSURI CWP IN KABONDO WEST
-Equipping with solar accessories, 10m3 plastic tanks and 2No. water kiosk
2.5M County
Governm
ent of
Homabay
6Months Water
Services
ODINO DISPENSARY WATER PROJECT IN KABONDO WEST
Drilling and equipping of borehole
3M County
Governm
ent of
Homabay
6Months Water
Services
KOWADE WATER PROJECT IN KABONDO WEST
Pipeline extension from LeftBank water project
3M County
Governm
ent of
Homabay
6Months Water
Services
ORERA DISPENSARY WATER PROJECT
Pipeline extension from Left Bank Water project
3M County
Governm
ent of
Homabay
6Months Water
Services
PONGE SECONDARY SCHOOL WATER PROJECT IN KABONDO WEST
Pipeline extension from Left Bank Water project
3M County
Governm
ent of
Homabay
6Months Water
Services
KOWIDI PRIMARY SCHOOL WATER PROJECT IN KABONDO WEST
Pipeline Extension
3M County
Governm
ent of
Homabay
6Months Water
Services
JWELU POLYTECHNIC WATER PROJECT KABONDO WEST
Drilling and equipping of borehole
3M County
Governm
ent of
Homabay
6Months Water
Services
KARIANY WATER PROJECT IN KABONDO WEST
Drilling and equipping of borehole
3M County
Governm
ent of
Homabay
6Months Water
Services
KITARE PRIMARY WATER
Drilling and equipping of borehole
3M County
Governm
ent of
6Months Water
Services
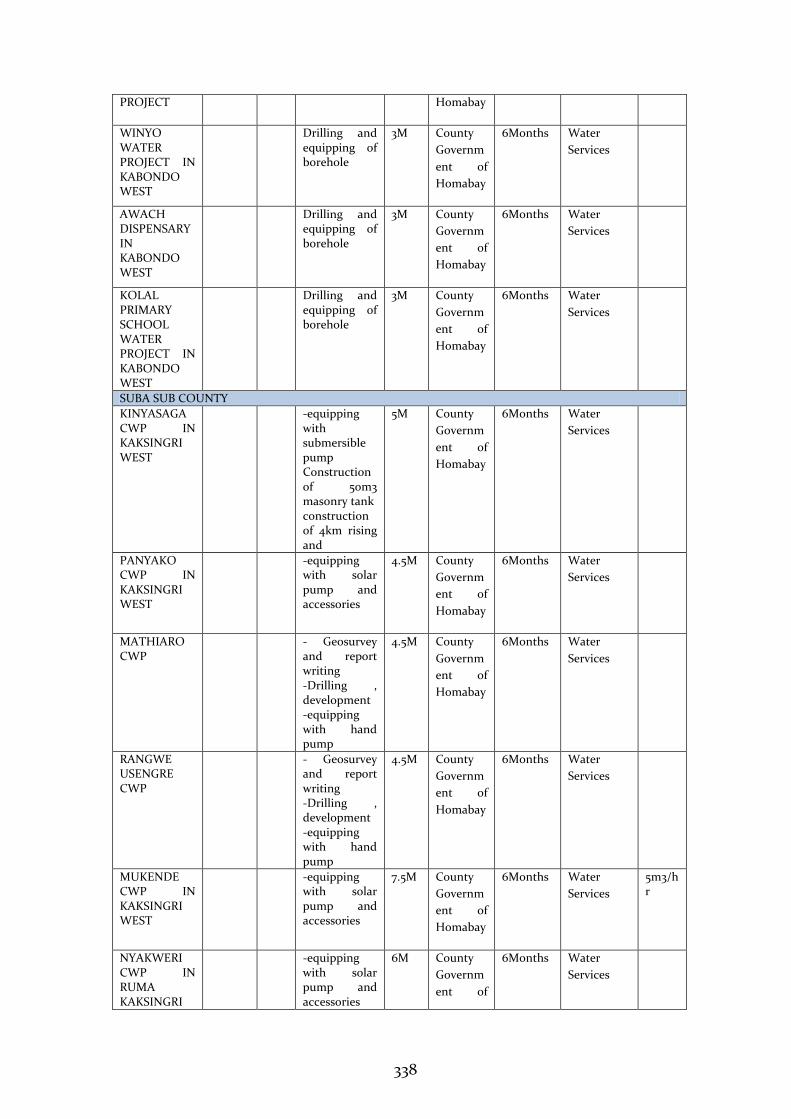
338
PROJECT Homabay
WINYO WATER PROJECT IN KABONDO WEST
Drilling and equipping of borehole
3M County
Governm
ent of
Homabay
6Months Water
Services
AWACH DISPENSARY IN KABONDO WEST
Drilling and equipping of borehole
3M County
Governm
ent of
Homabay
6Months Water
Services
KOLAL PRIMARY SCHOOL WATER PROJECT IN KABONDO WEST
Drilling and equipping of borehole
3M County
Governm
ent of
Homabay
6Months Water
Services
SUBA SUB COUNTY
KINYASAGA CWP IN KAKSINGRI WEST
-equipping with submersible pump Construction of 5om3 masonry tank construction of 4km rising and
5M County
Governm
ent of
Homabay
6Months Water
Services
PANYAKO CWP IN KAKSINGRI WEST
-equipping with solar pump and accessories
4.5M County
Governm
ent of
Homabay
6Months Water
Services
MATHIARO CWP
- Geosurvey and report writing -Drilling , development -equipping with hand pump
4.5M County
Governm
ent of
Homabay
6Months Water
Services
RANGWE USENGRE CWP
- Geosurvey and report writing -Drilling , development -equipping with hand pump
4.5M County
Governm
ent of
Homabay
6Months Water
Services
MUKENDE CWP IN KAKSINGRI WEST
-equipping with solar pump and accessories
7.5M County
Governm
ent of
Homabay
6Months Water
Services
5m3/hr
NYAKWERI CWP IN RUMA KAKSINGRI
-equipping with solar pump and accessories
6M County
Governm
ent of
6Months Water
Services
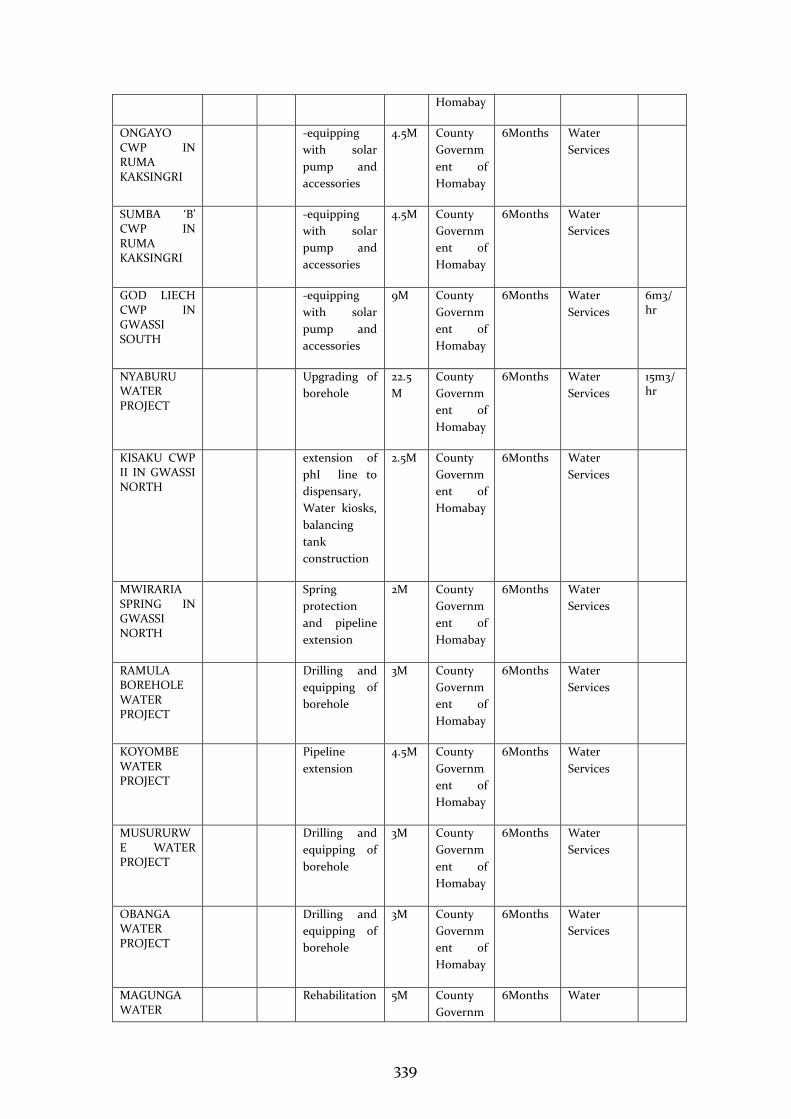
339
Homabay
ONGAYO CWP IN RUMA KAKSINGRI
-equipping
with solar
pump and
accessories
4.5M County
Governm
ent of
Homabay
6Months Water
Services
SUMBA ‘B’ CWP IN RUMA KAKSINGRI
-equipping
with solar
pump and
accessories
4.5M County
Governm
ent of
Homabay
6Months Water
Services
GOD LIECH CWP IN GWASSI SOUTH
-equipping
with solar
pump and
accessories
9M County
Governm
ent of
Homabay
6Months Water
Services
6m3/hr
NYABURU WATER PROJECT
Upgrading of
borehole
22.5
M
County
Governm
ent of
Homabay
6Months Water
Services
15m3/hr
KISAKU CWP II IN GWASSI NORTH
extension of
phI line to
dispensary,
Water kiosks,
balancing
tank
construction
2.5M County
Governm
ent of
Homabay
6Months Water
Services
MWIRARIA SPRING IN GWASSI NORTH
Spring
protection
and pipeline
extension
2M County
Governm
ent of
Homabay
6Months Water
Services
RAMULA BOREHOLE WATER PROJECT
Drilling and
equipping of
borehole
3M County
Governm
ent of
Homabay
6Months Water
Services
KOYOMBE WATER PROJECT
Pipeline
extension
4.5M County
Governm
ent of
Homabay
6Months Water
Services
MUSURURWE WATER PROJECT
Drilling and
equipping of
borehole
3M County
Governm
ent of
Homabay
6Months Water
Services
OBANGA WATER PROJECT
Drilling and
equipping of
borehole
3M County
Governm
ent of
Homabay
6Months Water
Services
MAGUNGA WATER
Rehabilitation 5M County
Governm
6Months Water
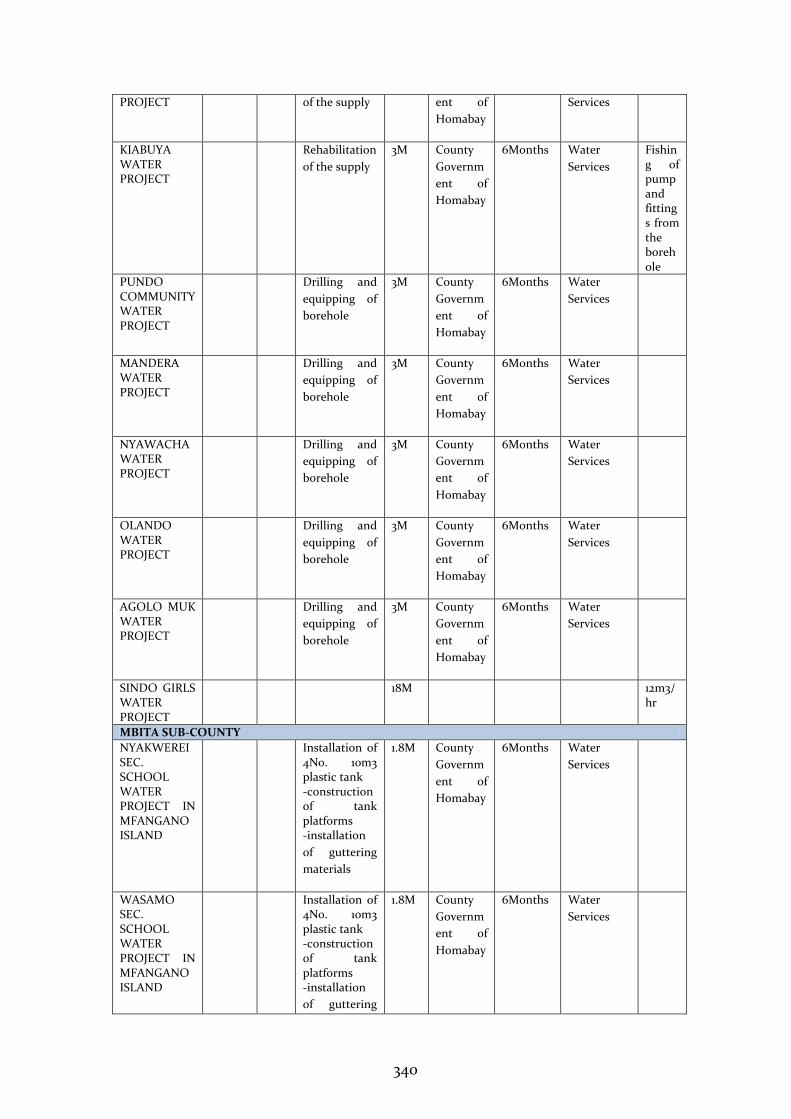
340
PROJECT of the supply ent of
Homabay
Services
KIABUYA WATER PROJECT
Rehabilitation
of the supply
3M County
Governm
ent of
Homabay
6Months Water
Services
Fishing of pump and fittings from the borehole
PUNDO COMMUNITY WATER PROJECT
Drilling and
equipping of
borehole
3M County
Governm
ent of
Homabay
6Months Water
Services
MANDERA WATER PROJECT
Drilling and
equipping of
borehole
3M County
Governm
ent of
Homabay
6Months Water
Services
NYAWACHA WATER PROJECT
Drilling and
equipping of
borehole
3M County
Governm
ent of
Homabay
6Months Water
Services
OLANDO WATER PROJECT
Drilling and
equipping of
borehole
3M County
Governm
ent of
Homabay
6Months Water
Services
AGOLO MUK WATER PROJECT
Drilling and
equipping of
borehole
3M County
Governm
ent of
Homabay
6Months Water
Services
SINDO GIRLS WATER PROJECT
18M 12m3/hr
MBITA SUB-COUNTY
NYAKWEREI SEC. SCHOOL WATER PROJECT IN MFANGANO ISLAND
Installation of 4No. 10m3 plastic tank -construction of tank platforms -installation
of guttering
materials
1.8M County
Governm
ent of
Homabay
6Months Water
Services
WASAMO SEC. SCHOOL WATER PROJECT IN MFANGANO ISLAND
Installation of 4No. 10m3 plastic tank -construction of tank platforms -installation
of guttering
1.8M County
Governm
ent of
Homabay
6Months Water
Services
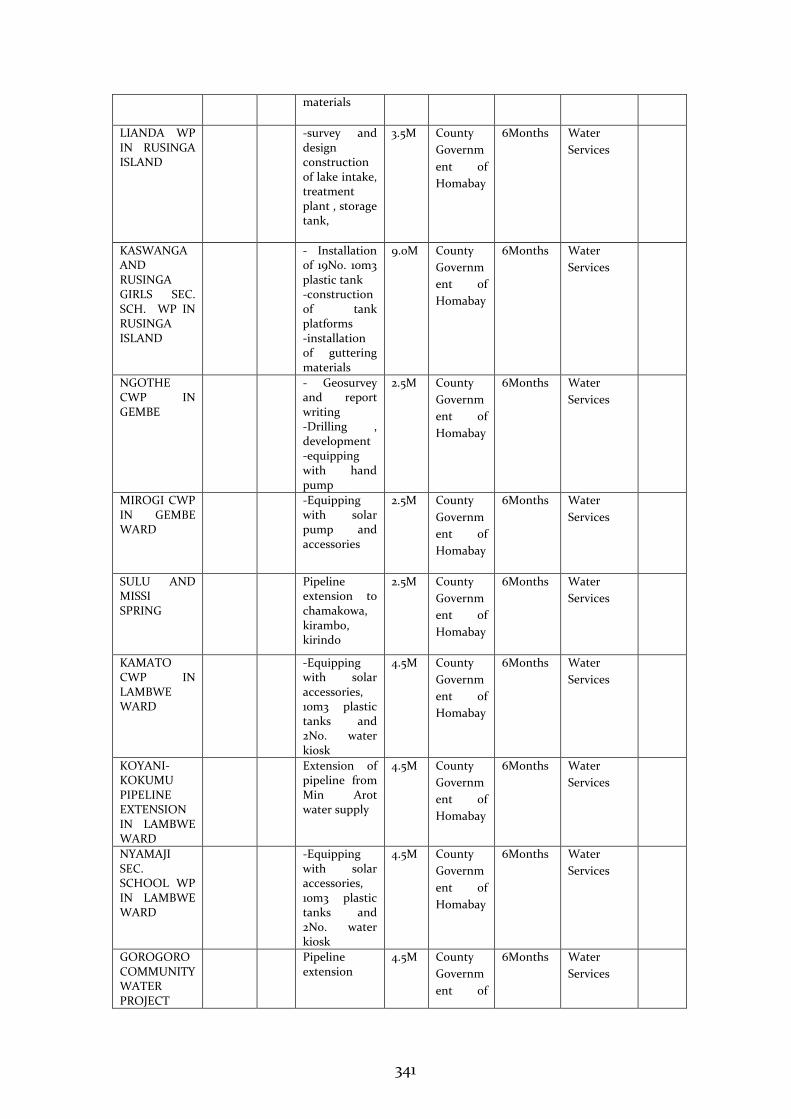
341
materials
LIANDA WP IN RUSINGA ISLAND
-survey and design construction of lake intake, treatment plant , storage tank,
3.5M County
Governm
ent of
Homabay
6Months Water
Services
KASWANGA AND RUSINGA GIRLS SEC. SCH. WP IN RUSINGA ISLAND
- Installation of 19No. 10m3 plastic tank -construction of tank platforms -installation of guttering materials
9.0M County
Governm
ent of
Homabay
6Months Water
Services
NGOTHE CWP IN GEMBE
- Geosurvey and report writing -Drilling , development -equipping with hand pump
2.5M County
Governm
ent of
Homabay
6Months Water
Services
MIROGI CWP IN GEMBE WARD
-Equipping with solar pump and accessories
2.5M County
Governm
ent of
Homabay
6Months Water
Services
SULU AND MISSI SPRING
Pipeline extension to chamakowa, kirambo, kirindo
2.5M County
Governm
ent of
Homabay
6Months Water
Services
KAMATO CWP IN LAMBWE WARD
-Equipping with solar accessories, 10m3 plastic tanks and 2No. water kiosk
4.5M County
Governm
ent of
Homabay
6Months Water
Services
KOYANI-KOKUMU PIPELINE EXTENSION IN LAMBWE WARD
Extension of pipeline from Min Arot water supply
4.5M County
Governm
ent of
Homabay
6Months Water
Services
NYAMAJI SEC. SCHOOL WP IN LAMBWE WARD
-Equipping with solar accessories, 10m3 plastic tanks and 2No. water kiosk
4.5M County
Governm
ent of
Homabay
6Months Water
Services
GOROGORO COMMUNITY WATER PROJECT
Pipeline extension
4.5M County
Governm
ent of
6Months Water
Services
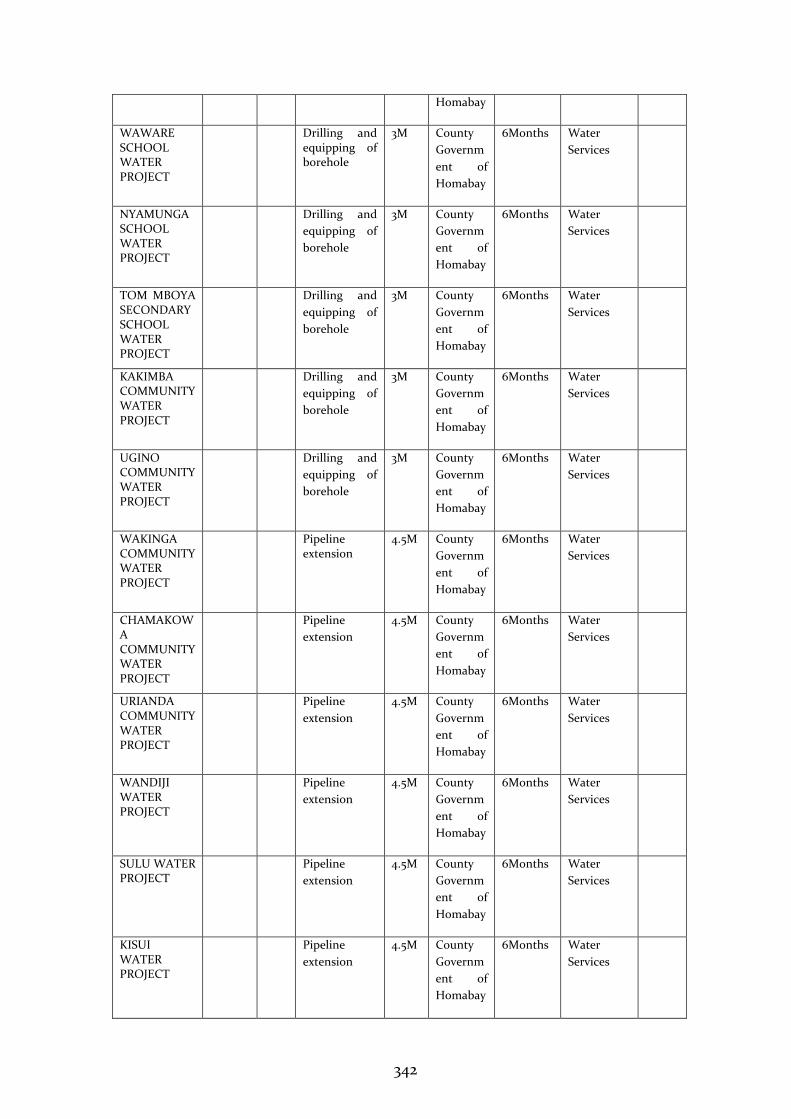
342
Homabay
WAWARE SCHOOL WATER PROJECT
Drilling and equipping of borehole
3M County
Governm
ent of
Homabay
6Months Water
Services
NYAMUNGA SCHOOL WATER PROJECT
Drilling and
equipping of
borehole
3M County
Governm
ent of
Homabay
6Months Water
Services
TOM MBOYA SECONDARY SCHOOL WATER PROJECT
Drilling and
equipping of
borehole
3M County
Governm
ent of
Homabay
6Months Water
Services
KAKIMBA COMMUNITY WATER PROJECT
Drilling and
equipping of
borehole
3M County
Governm
ent of
Homabay
6Months Water
Services
UGINO COMMUNITY WATER PROJECT
Drilling and
equipping of
borehole
3M County
Governm
ent of
Homabay
6Months Water
Services
WAKINGA COMMUNITY WATER PROJECT
Pipeline extension
4.5M County
Governm
ent of
Homabay
6Months Water
Services
CHAMAKOWA COMMUNITY WATER PROJECT
Pipeline
extension
4.5M County
Governm
ent of
Homabay
6Months Water
Services
URIANDA COMMUNITY WATER PROJECT
Pipeline
extension
4.5M County
Governm
ent of
Homabay
6Months Water
Services
WANDIJI WATER PROJECT
Pipeline
extension
4.5M County
Governm
ent of
Homabay
6Months Water
Services
SULU WATER PROJECT
Pipeline
extension
4.5M County
Governm
ent of
Homabay
6Months Water
Services
KISUI WATER PROJECT
Pipeline
extension
4.5M County
Governm
ent of
Homabay
6Months Water
Services
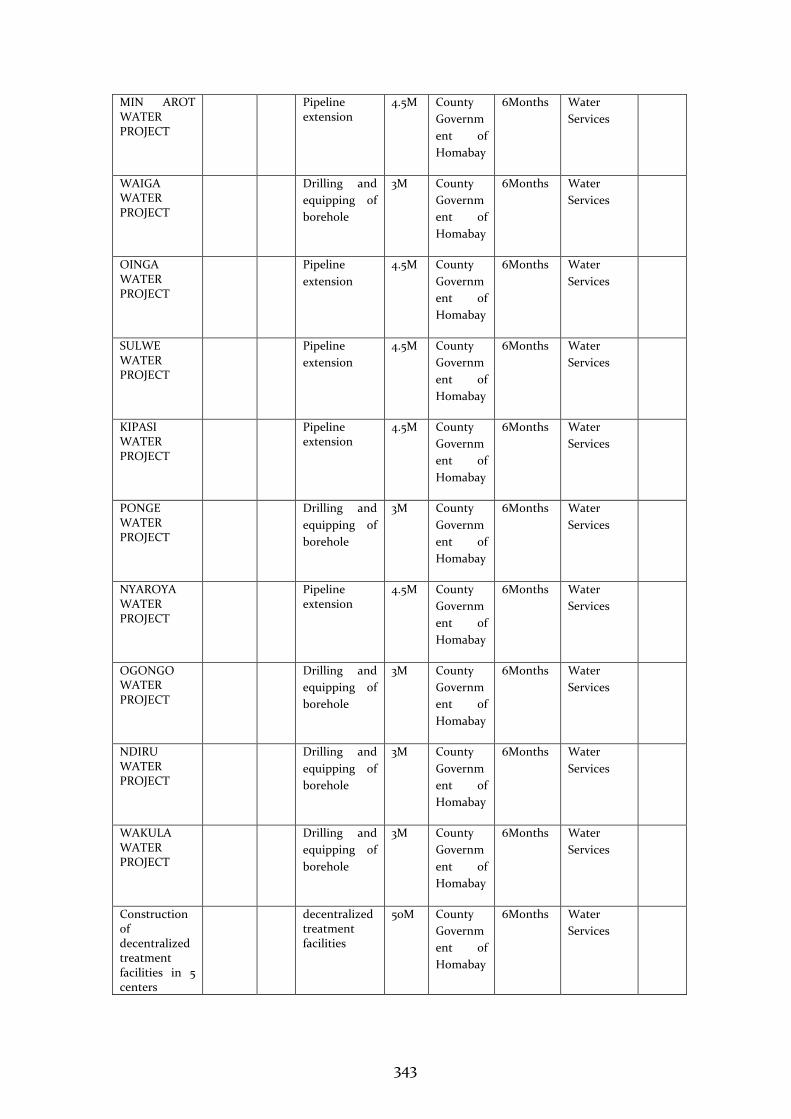
343
MIN AROT WATER PROJECT
Pipeline extension
4.5M County
Governm
ent of
Homabay
6Months Water
Services
WAIGA WATER PROJECT
Drilling and
equipping of
borehole
3M County
Governm
ent of
Homabay
6Months Water
Services
OINGA WATER PROJECT
Pipeline
extension
4.5M County
Governm
ent of
Homabay
6Months Water
Services
SULWE WATER PROJECT
Pipeline
extension
4.5M County
Governm
ent of
Homabay
6Months Water
Services
KIPASI WATER PROJECT
Pipeline extension
4.5M County
Governm
ent of
Homabay
6Months Water
Services
PONGE WATER PROJECT
Drilling and
equipping of
borehole
3M County
Governm
ent of
Homabay
6Months Water
Services
NYAROYA WATER PROJECT
Pipeline extension
4.5M County
Governm
ent of
Homabay
6Months Water
Services
OGONGO WATER PROJECT
Drilling and
equipping of
borehole
3M County
Governm
ent of
Homabay
6Months Water
Services
NDIRU WATER PROJECT
Drilling and
equipping of
borehole
3M County
Governm
ent of
Homabay
6Months Water
Services
WAKULA WATER PROJECT
Drilling and
equipping of
borehole
3M County
Governm
ent of
Homabay
6Months Water
Services
Construction of decentralized treatment facilities in 5 centers
decentralized treatment facilities
50M County
Governm
ent of
Homabay
6Months Water
Services
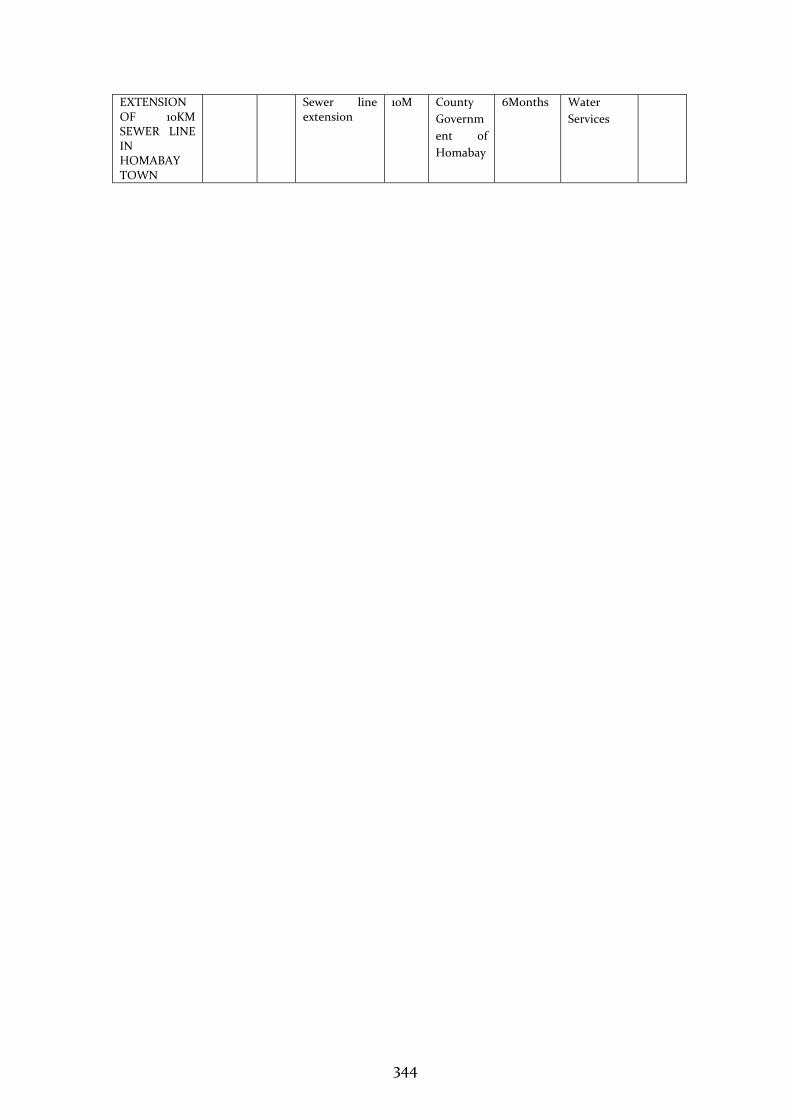
344
EXTENSION OF 10KM SEWER LINE IN HOMABAY TOWN
Sewer line extension
10M County
Governm
ent of
Homabay
6Months Water
Services
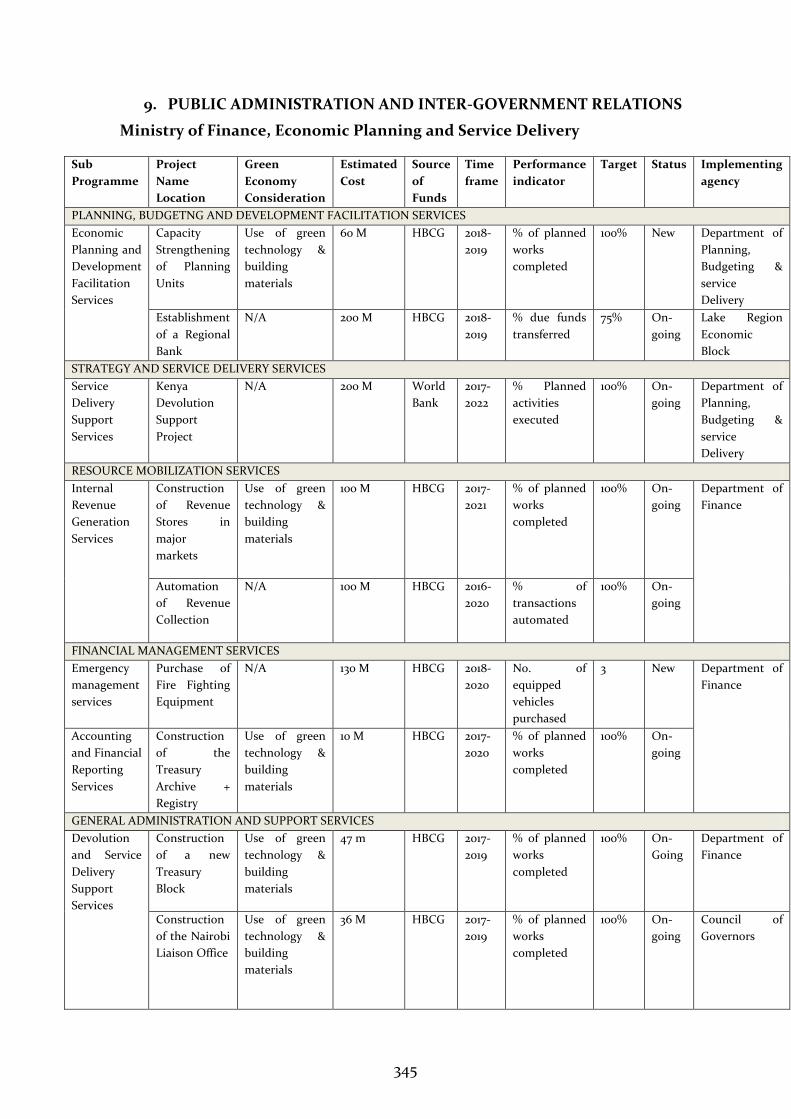
345
9. PUBLIC ADMINISTRATION AND INTER-GOVERNMENT RELATIONS
Ministry of Finance, Economic Planning and Service Delivery
Sub
Programme
Project
Name
Location
Green
Economy
Consideration
Estimated
Cost
Source
of
Funds
Time
frame
Performance
indicator
Target Status Implementing
agency
PLANNING, BUDGETNG AND DEVELOPMENT FACILITATION SERVICES
Economic
Planning and
Development
Facilitation
Services
Capacity
Strengthening
of Planning
Units
Use of green
technology &
building
materials
60 M HBCG 2018-
2019
% of planned
works
completed
100% New Department of
Planning,
Budgeting &
service
Delivery
Establishment
of a Regional
Bank
N/A 200 M HBCG 2018-
2019
% due funds
transferred
75% On-
going
Lake Region
Economic
Block
STRATEGY AND SERVICE DELIVERY SERVICES
Service
Delivery
Support
Services
Kenya
Devolution
Support
Project
N/A 200 M World
Bank
2017-
2022
% Planned
activities
executed
100% On-
going
Department of
Planning,
Budgeting &
service
Delivery
RESOURCE MOBILIZATION SERVICES
Internal
Revenue
Generation
Services
Construction
of Revenue
Stores in
major
markets
Use of green
technology &
building
materials
100 M HBCG 2017-
2021
% of planned
works
completed
100% On-
going
Department of
Finance
Automation
of Revenue
Collection
N/A 100 M HBCG 2016-
2020
% of
transactions
automated
100% On-
going
FINANCIAL MANAGEMENT SERVICES
Emergency
management
services
Purchase of
Fire Fighting
Equipment
N/A 130 M HBCG 2018-
2020
No. of
equipped
vehicles
purchased
3 New Department of
Finance
Accounting
and Financial
Reporting
Services
Construction
of the
Treasury
Archive +
Registry
Use of green
technology &
building
materials
10 M HBCG 2017-
2020
% of planned
works
completed
100% On-
going
GENERAL ADMINISTRATION AND SUPPORT SERVICES
Devolution
and Service
Delivery
Support
Services
Construction
of a new
Treasury
Block
Use of green
technology &
building
materials
47 m HBCG 2017-
2019
% of planned
works
completed
100% On-
Going
Department of
Finance
Construction
of the Nairobi
Liaison Office
Use of green
technology &
building
materials
36 M HBCG 2017-
2019
% of planned
works
completed
100% On-
going
Council of
Governors
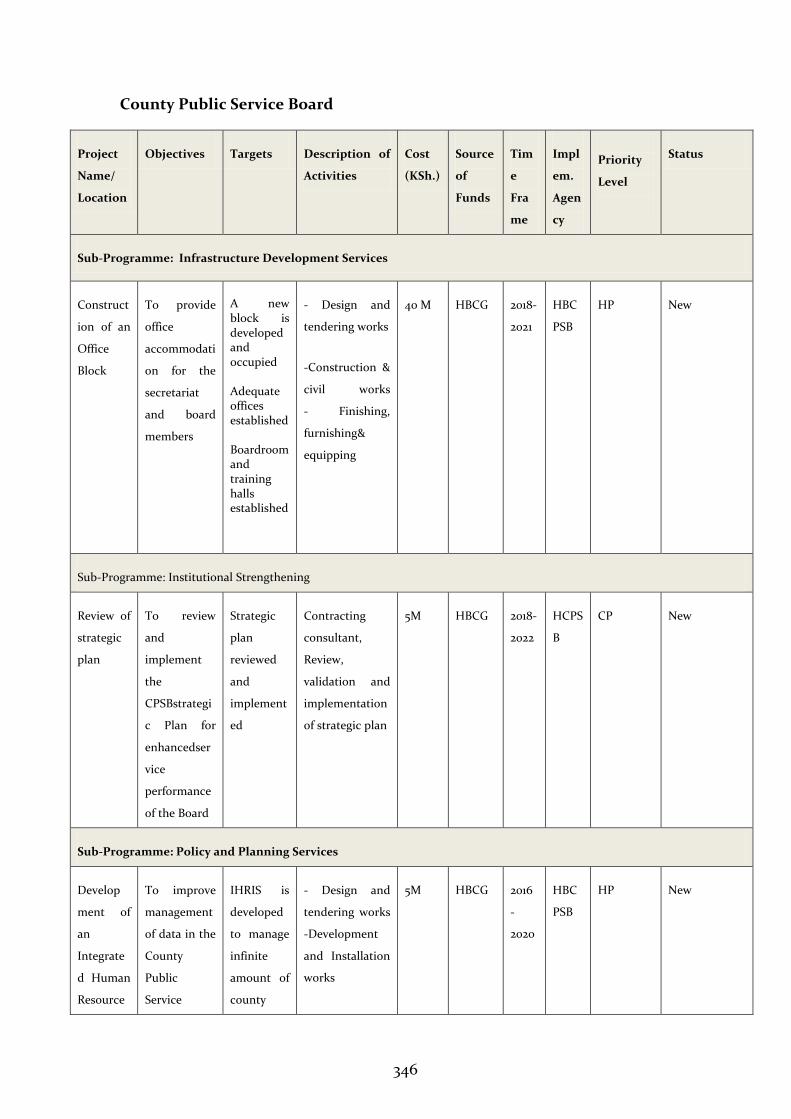
346
County Public Service Board
Project
Name/
Location
Objectives Targets Description of
Activities
Cost
(KSh.)
Source
of
Funds
Tim
e
Fra
me
Impl
em.
Agen
cy
Priority
Level
Status
Sub-Programme: Infrastructure Development Services
Construct
ion of an
Office
Block
To provide
office
accommodati
on for the
secretariat
and board
members
A new block is developed and occupied Adequate offices established Boardroom and training halls established
- Design and
tendering works
-Construction &
civil works
- Finishing,
furnishing&
equipping
40 M HBCG 2018-
2021
HBC
PSB
HP New
Sub-Programme: Institutional Strengthening
Review of
strategic
plan
To review
and
implement
the
CPSBstrategi
c Plan for
enhancedser
vice
performance
of the Board
Strategic
plan
reviewed
and
implement
ed
Contracting
consultant,
Review,
validation and
implementation
of strategic plan
5M HBCG 2018-
2022
HCPS
B
CP New
Sub-Programme: Policy and Planning Services
Develop
ment of
an
Integrate
d Human
Resource
To improve
management
of data in the
County
Public
Service
IHRIS is
developed
to manage
infinite
amount of
county
- Design and
tendering works
-Development
and Installation
works
5M
HBCG
2016
-
2020
HBC
PSB
HP
New
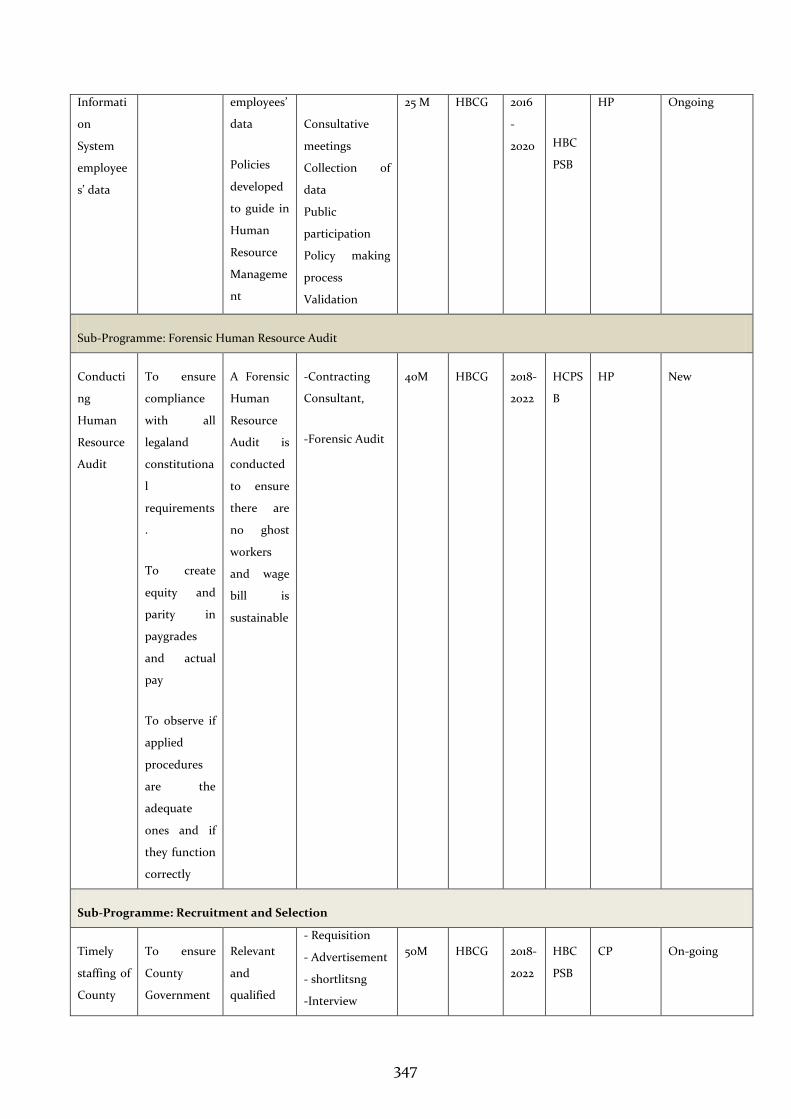
347
Informati
on
System
employee
s’ data
employees’
data
Policies
developed
to guide in
Human
Resource
Manageme
nt
Consultative
meetings
Collection of
data
Public
participation
Policy making
process
Validation
25 M HBCG 2016
-
2020
HBC
PSB
HP Ongoing
Sub-Programme: Forensic Human Resource Audit
Conducti
ng
Human
Resource
Audit
To ensure
compliance
with all
legaland
constitutiona
l
requirements
.
To create
equity and
parity in
paygrades
and actual
pay
To observe if
applied
procedures
are the
adequate
ones and if
they function
correctly
A Forensic
Human
Resource
Audit is
conducted
to ensure
there are
no ghost
workers
and wage
bill is
sustainable
-Contracting
Consultant,
-Forensic Audit
40M HBCG 2018-
2022
HCPS
B
HP New
Sub-Programme: Recruitment and Selection
Timely
staffing of
County
To ensure
County
Government
Relevant
and
qualified
- Requisition
- Advertisement
- shortlitsng
-Interview
50M HBCG 2018-
2022
HBC
PSB
CP On-going
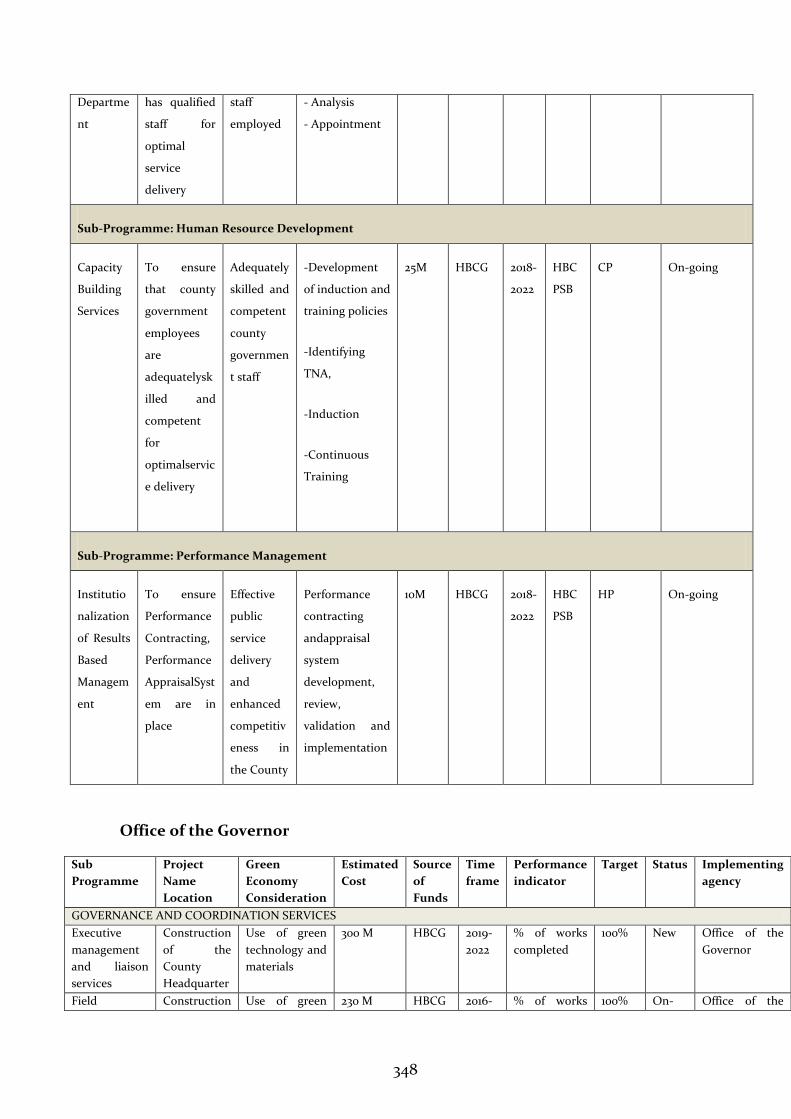
348
Departme
nt
has qualified
staff for
optimal
service
delivery
staff
employed
- Analysis
- Appointment
Sub-Programme: Human Resource Development
Capacity
Building
Services
To ensure
that county
government
employees
are
adequatelysk
illed and
competent
for
optimalservic
e delivery
Adequately
skilled and
competent
county
governmen
t staff
-Development
of induction and
training policies
-Identifying
TNA,
-Induction
-Continuous
Training
25M HBCG 2018-
2022
HBC
PSB
CP On-going
Sub-Programme: Performance Management
Institutio
nalization
of Results
Based
Managem
ent
To ensure
Performance
Contracting,
Performance
AppraisalSyst
em are in
place
Effective
public
service
delivery
and
enhanced
competitiv
eness in
the County
Performance
contracting
andappraisal
system
development,
review,
validation and
implementation
10M HBCG 2018-
2022
HBC
PSB
HP On-going
Office of the Governor
Sub
Programme
Project
Name
Location
Green
Economy
Consideration
Estimated
Cost
Source
of
Funds
Time
frame
Performance
indicator
Target Status Implementing
agency
GOVERNANCE AND COORDINATION SERVICES
Executive
management
and liaison
services
Construction
of the
County
Headquarter
Use of green
technology and
materials
300 M HBCG 2019-
2022
% of works
completed
100% New Office of the
Governor
Field Construction Use of green 230 M HBCG 2016- % of works 100% On- Office of the
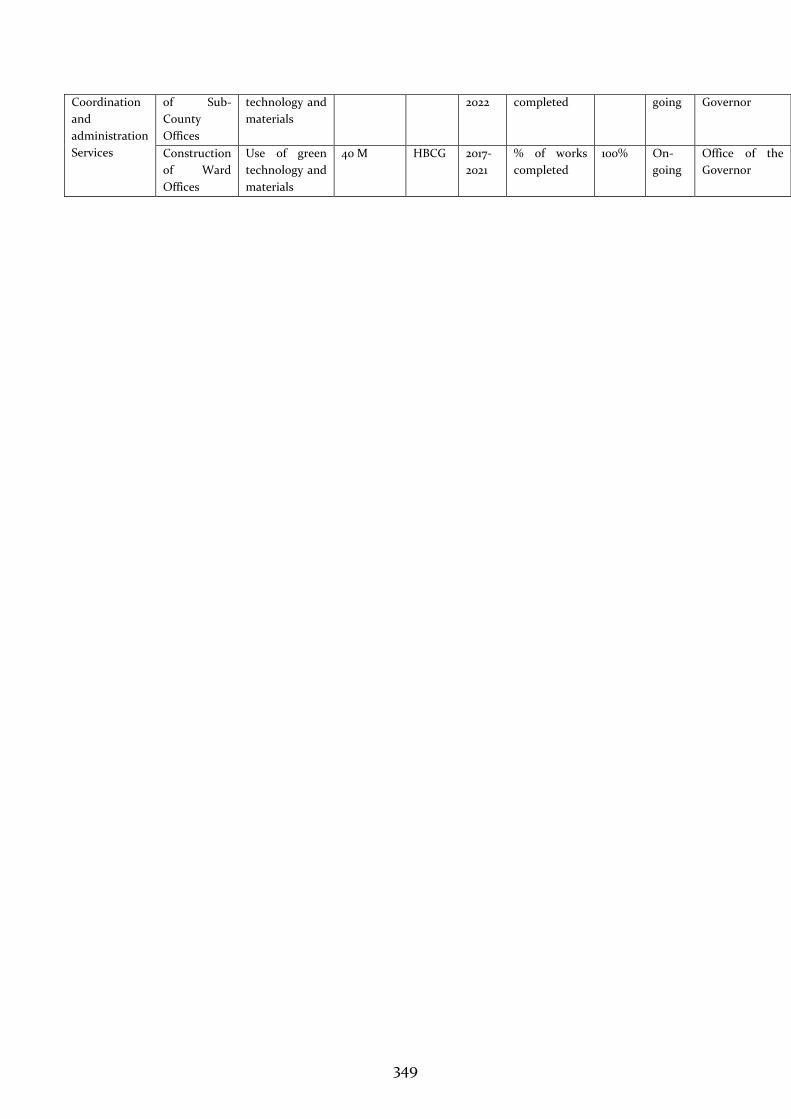
349
Coordination
and
administration
Services
of Sub-
County
Offices
technology and
materials
2022 completed going Governor
Construction
of Ward
Offices
Use of green
technology and
materials
40 M HBCG 2017-
2021
% of works
completed
100% On-
going
Office of the
Governor
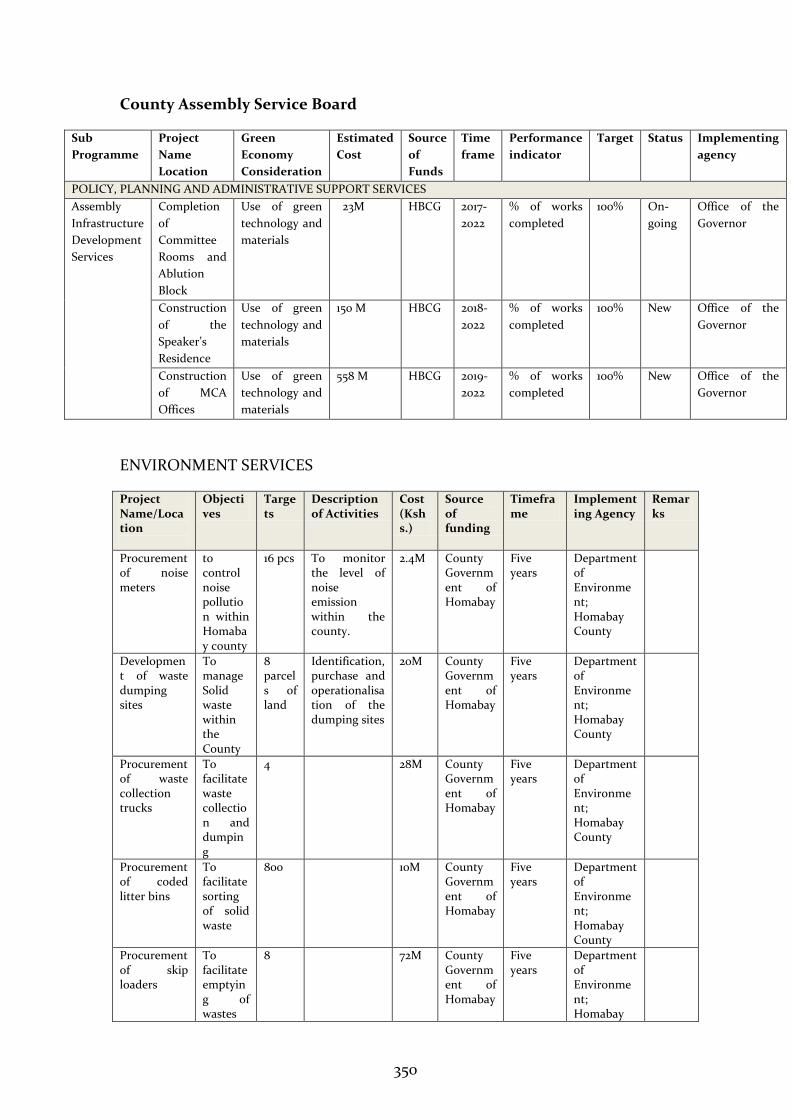
350
County Assembly Service Board
Sub
Programme
Project
Name
Location
Green
Economy
Consideration
Estimated
Cost
Source
of
Funds
Time
frame
Performance
indicator
Target Status Implementing
agency
POLICY, PLANNING AND ADMINISTRATIVE SUPPORT SERVICES
Assembly
Infrastructure
Development
Services
Completion
of
Committee
Rooms and
Ablution
Block
Use of green
technology and
materials
23M HBCG 2017-
2022
% of works
completed
100% On-
going
Office of the
Governor
Construction
of the
Speaker’s
Residence
Use of green
technology and
materials
150 M HBCG 2018-
2022
% of works
completed
100% New Office of the
Governor
Construction
of MCA
Offices
Use of green
technology and
materials
558 M HBCG 2019-
2022
% of works
completed
100% New Office of the
Governor
ENVIRONMENT SERVICES
Project Name/Location
Objectives
Targets
Description of Activities
Cost (Kshs.)
Source of funding
Timeframe
Implementing Agency
Remarks
Procurement of noise meters
to control noise pollution within Homabay county
16 pcs To monitor the level of noise emission within the county.
2.4M County Government of Homabay
Five years
Department of Environment; Homabay County
Development of waste dumping sites
To manage Solid waste within the County
8 parcels of land
Identification, purchase and operationalisation of the dumping sites
20M County Government of Homabay
Five years
Department of Environment; Homabay County
Procurement of waste collection trucks
To facilitate waste collection and dumping
4 28M County Government of Homabay
Five years
Department of Environment; Homabay County
Procurement of coded litter bins
To facilitate sorting of solid waste
800 10M County Government of Homabay
Five years
Department of Environment; Homabay County
Procurement of skip loaders
To facilitate emptying of wastes
8 72M County Government of Homabay
Five years
Department of Environment; Homabay
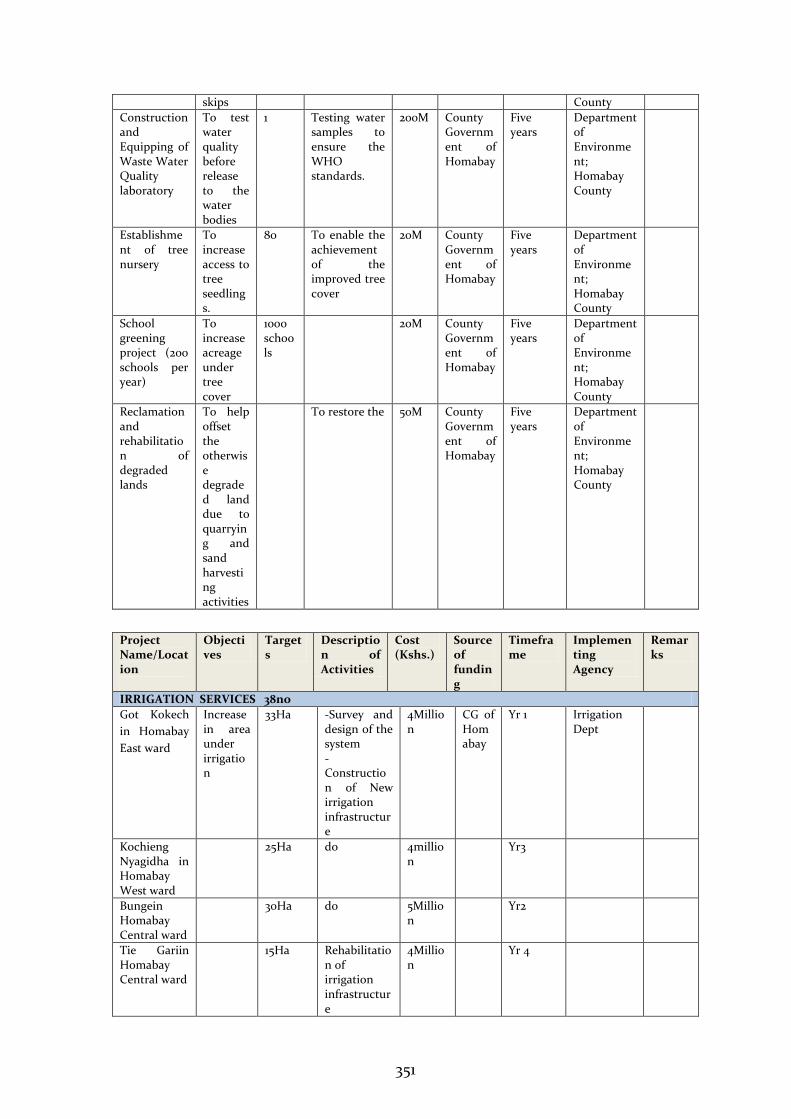
351
skips County
Construction and Equipping of Waste Water Quality laboratory
To test water quality before release to the water bodies
1 Testing water samples to ensure the WHO standards.
200M County Government of Homabay
Five years
Department of Environment; Homabay County
Establishment of tree nursery
To increase access to tree seedlings.
80 To enable the achievement of the improved tree cover
20M County Government of Homabay
Five years
Department of Environment; Homabay County
School greening project (200 schools per year)
To increase acreage under tree cover
1000 schools
20M County Government of Homabay
Five years
Department of Environment; Homabay County
Reclamation and rehabilitation of degraded lands
To help offset the otherwise degraded land due to quarrying and sand harvesting activities
To restore the 50M County Government of Homabay
Five years
Department of Environment; Homabay County
Project Name/Location
Objectives
Targets
Description of Activities
Cost (Kshs.)
Source of funding
Timeframe
Implementing Agency
Remarks
IRRIGATION SERVICES 38no
Got Kokech
in Homabay
East ward
Increase in area under irrigation
33Ha -Survey and design of the system -Construction of New irrigation infrastructure
4Million
CG of Homabay
Yr 1 Irrigation Dept
Kochieng Nyagidha in Homabay West ward
25Ha do 4million
Yr3
Bungein Homabay Central ward
30Ha do 5Million
Yr2
Tie Gariin Homabay Central ward
15Ha Rehabilitation of irrigation infrastructure
4Million
Yr 4
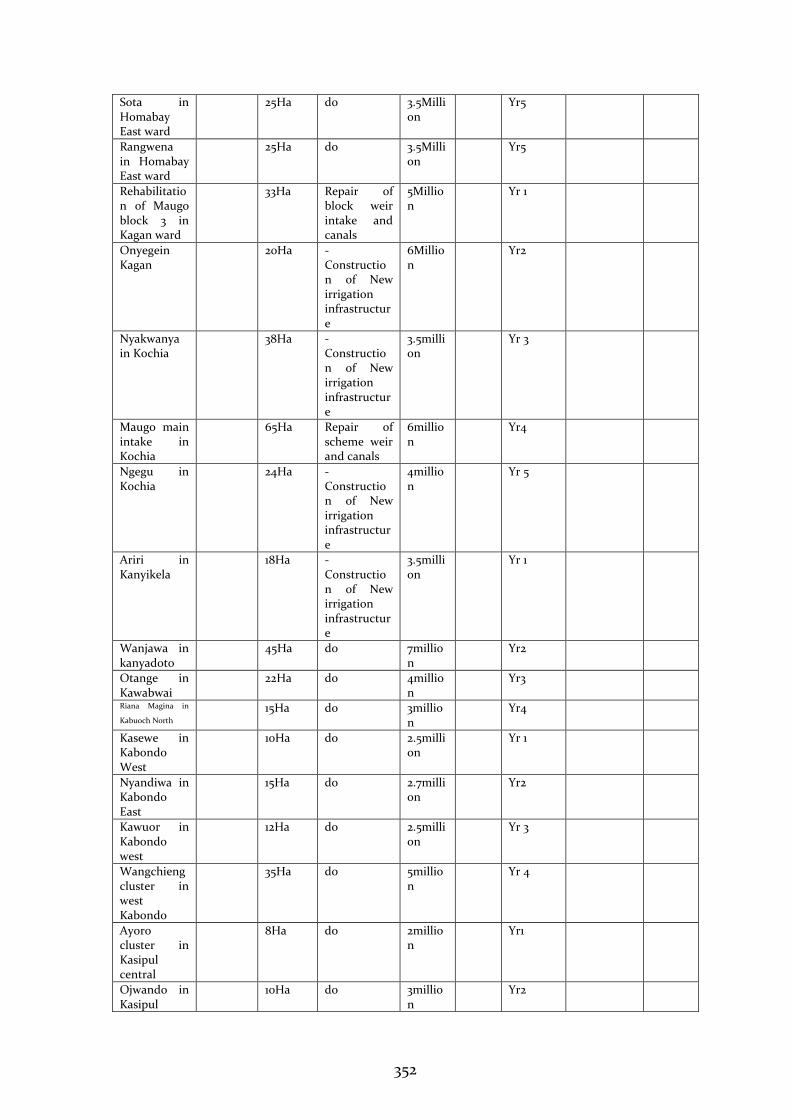
352
Sota in Homabay East ward
25Ha do 3.5Million
Yr5
Rangwena in Homabay East ward
25Ha do 3.5Million
Yr5
Rehabilitation of Maugo block 3 in Kagan ward
33Ha Repair of block weir intake and canals
5Million
Yr 1
Onyegein Kagan
20Ha -Construction of New irrigation infrastructure
6Million
Yr2
Nyakwanya in Kochia
38Ha -Construction of New irrigation infrastructure
3.5million
Yr 3
Maugo main intake in Kochia
65Ha Repair of scheme weir and canals
6million
Yr4
Ngegu in Kochia
24Ha -Construction of New irrigation infrastructure
4million
Yr 5
Ariri in Kanyikela
18Ha -Construction of New irrigation infrastructure
3.5million
Yr 1
Wanjawa in kanyadoto
45Ha do 7million
Yr2
Otange in Kawabwai
22Ha do 4million
Yr3
Riana Magina in
Kabuoch North
15Ha do 3million
Yr4
Kasewe in Kabondo West
10Ha do 2.5million
Yr 1
Nyandiwa in Kabondo East
15Ha do 2.7million
Yr2
Kawuor in Kabondo west
12Ha do 2.5million
Yr 3
Wangchieng cluster in west Kabondo
35Ha do 5million
Yr 4
Ayoro cluster in Kasipul central
8Ha do 2million
Yr1
Ojwando in Kasipul
10Ha do 3million
Yr2
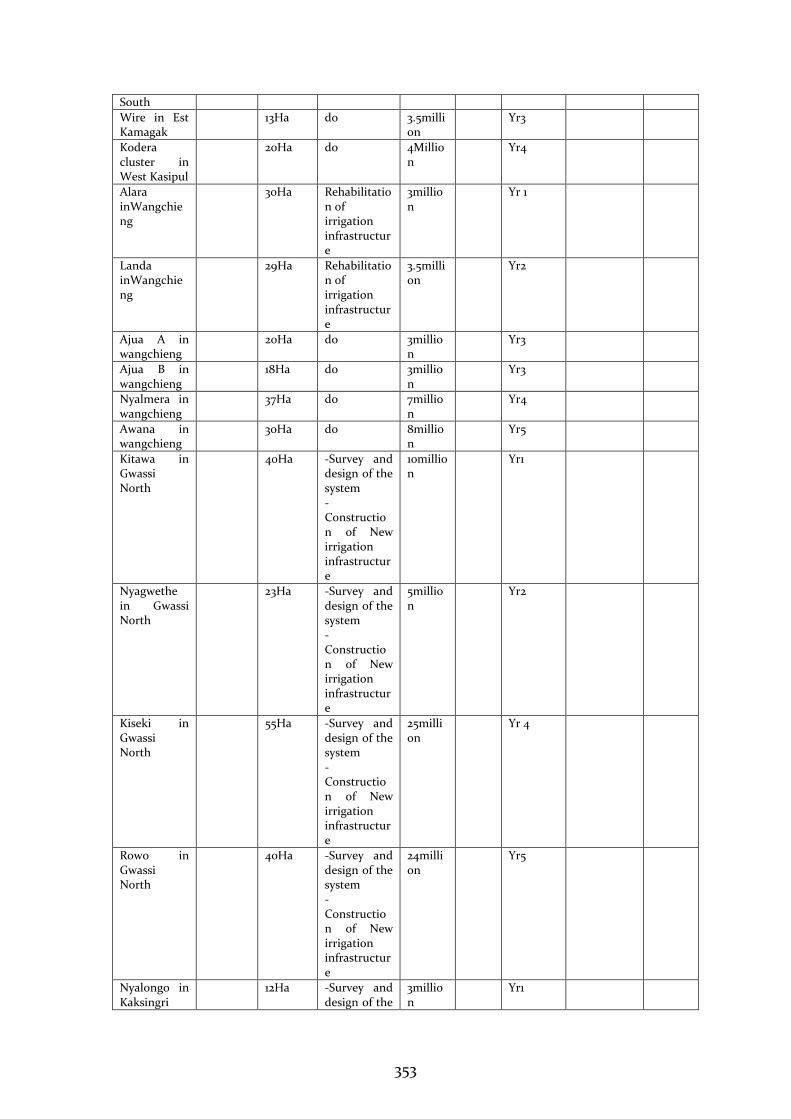
353
South
Wire in Est Kamagak
13Ha do 3.5million
Yr3
Kodera cluster in West Kasipul
20Ha do 4Million
Yr4
Alara inWangchieng
30Ha Rehabilitation of irrigation infrastructure
3million
Yr 1
Landa inWangchieng
29Ha Rehabilitation of irrigation infrastructure
3.5million
Yr2
Ajua A in wangchieng
20Ha do 3million
Yr3
Ajua B in wangchieng
18Ha do 3million
Yr3
Nyalmera in wangchieng
37Ha do 7million
Yr4
Awana in wangchieng
30Ha do 8million
Yr5
Kitawa in Gwassi North
40Ha -Survey and design of the system -Construction of New irrigation infrastructure
10million
Yr1
Nyagwethe in Gwassi North
23Ha -Survey and design of the system -Construction of New irrigation infrastructure
5million
Yr2
Kiseki in Gwassi North
55Ha -Survey and design of the system -Construction of New irrigation infrastructure
25million
Yr 4
Rowo in Gwassi North
40Ha -Survey and design of the system -Construction of New irrigation infrastructure
24million
Yr5
Nyalongo in Kaksingri
12Ha -Survey and design of the
3million
Yr1
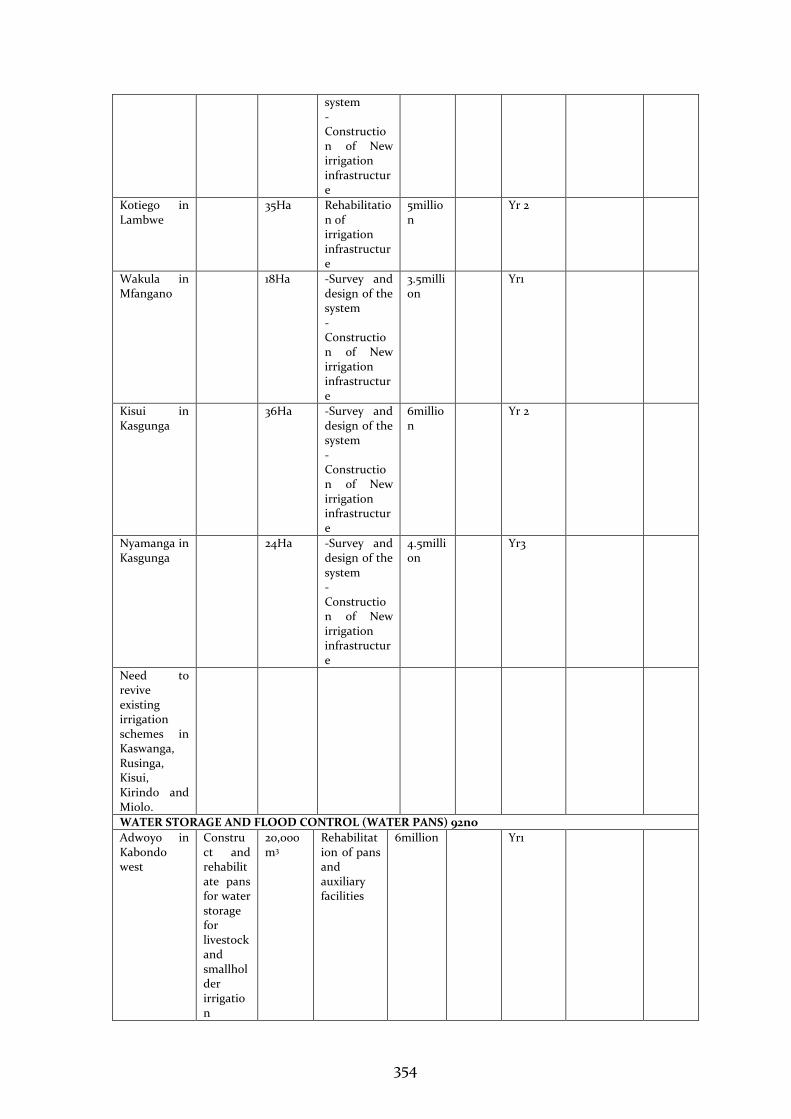
354
system -Construction of New irrigation infrastructure
Kotiego in Lambwe
35Ha Rehabilitation of irrigation infrastructure
5million
Yr 2
Wakula in Mfangano
18Ha -Survey and design of the system -Construction of New irrigation infrastructure
3.5million
Yr1
Kisui in Kasgunga
36Ha -Survey and design of the system -Construction of New irrigation infrastructure
6million
Yr 2
Nyamanga in Kasgunga
24Ha -Survey and design of the system -Construction of New irrigation infrastructure
4.5million
Yr3
Need to revive existing irrigation schemes in Kaswanga, Rusinga, Kisui, Kirindo and Miolo.
WATER STORAGE AND FLOOD CONTROL (WATER PANS) 92no
Adwoyo in Kabondo west
Construct and rehabilitate pans for water storage for livestock and smallholder irrigation
20,000m3
Rehabilitation of pans and auxiliary facilities
6million Yr1
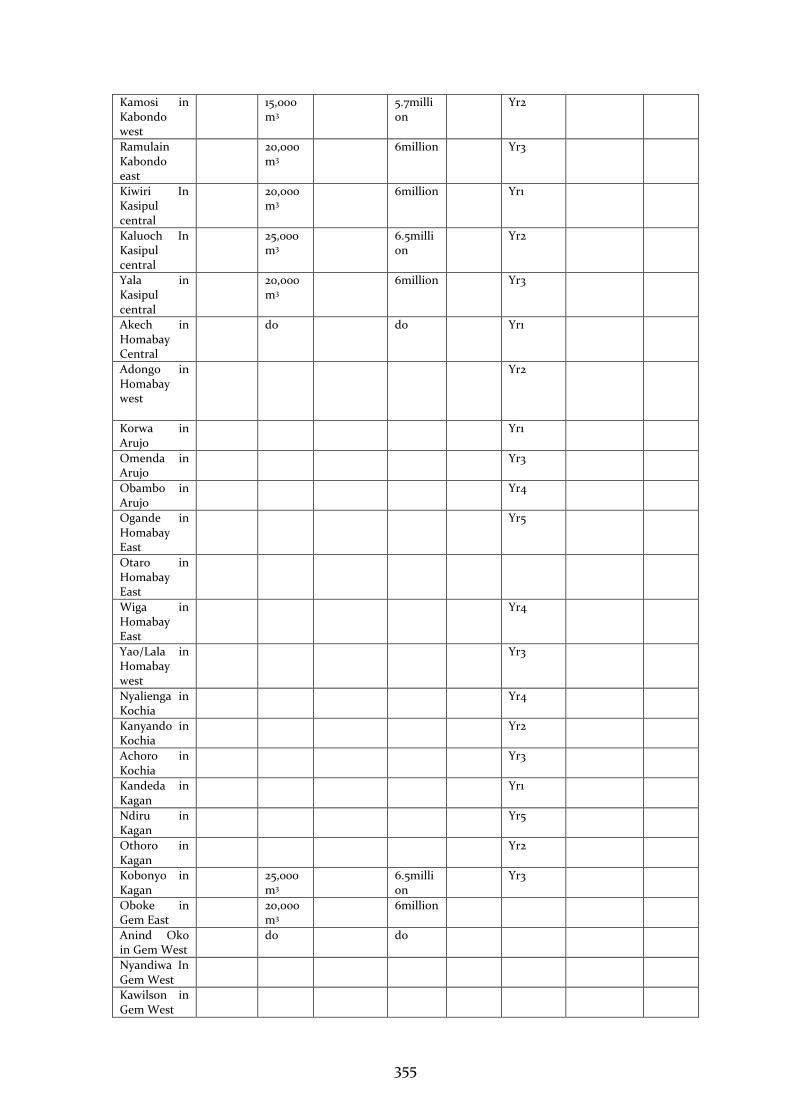
355
Kamosi in Kabondo west
15,000m3
5.7million
Yr2
Ramulain Kabondo east
20,000m3
6million Yr3
Kiwiri In Kasipul central
20,000m3
6million Yr1
Kaluoch In Kasipul central
25,000m3
6.5million
Yr2
Yala in Kasipul central
20,000m3
6million Yr3
Akech in Homabay Central
do do Yr1
Adongo in Homabay west
Yr2
Korwa in Arujo
Yr1
Omenda in Arujo
Yr3
Obambo in Arujo
Yr4
Ogande in Homabay East
Yr5
Otaro in Homabay East
Wiga in Homabay East
Yr4
Yao/Lala in Homabay west
Yr3
Nyalienga in Kochia
Yr4
Kanyando in Kochia
Yr2
Achoro in Kochia
Yr3
Kandeda in Kagan
Yr1
Ndiru in Kagan
Yr5
Othoro in Kagan
Yr2
Kobonyo in Kagan
25,000m3
6.5million
Yr3
Oboke in Gem East
20,000m3
6million
Anind Oko in Gem West
do do
Nyandiwa In Gem West
Kawilson in Gem West
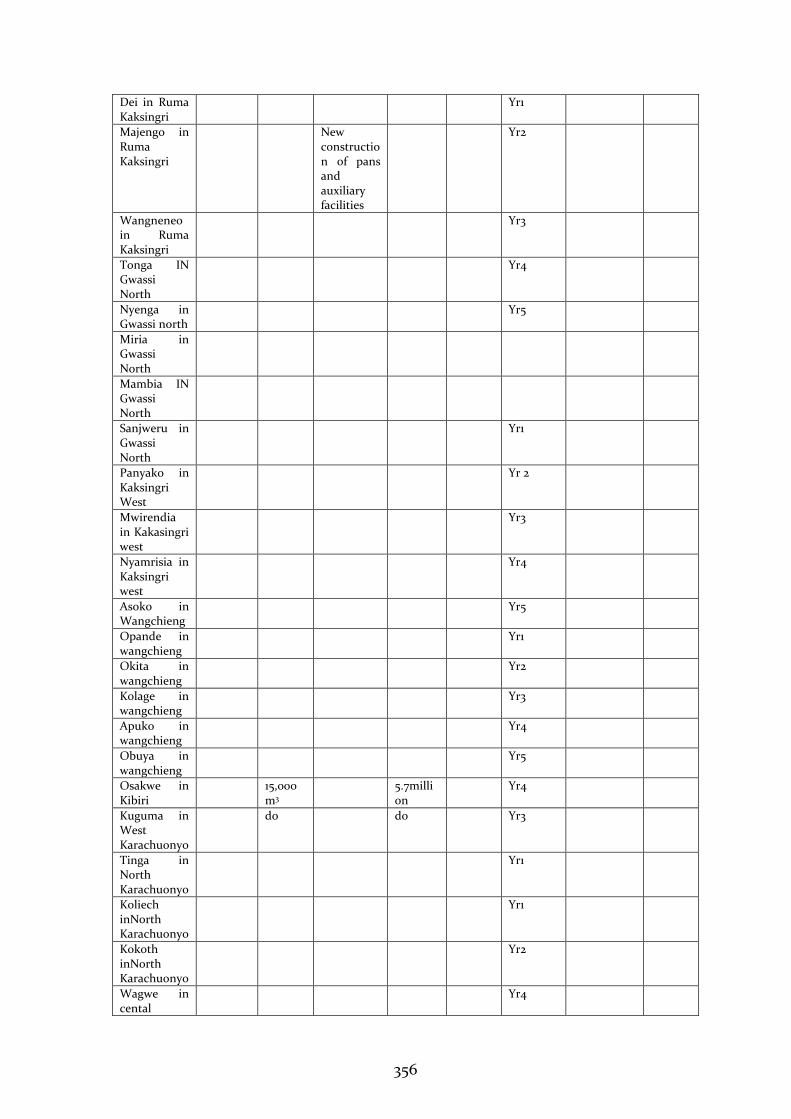
356
Dei in Ruma Kaksingri
Yr1
Majengo in Ruma Kaksingri
New construction of pans and auxiliary facilities
Yr2
Wangneneo in Ruma Kaksingri
Yr3
Tonga IN Gwassi North
Yr4
Nyenga in Gwassi north
Yr5
Miria in Gwassi North
Mambia IN Gwassi North
Sanjweru in Gwassi North
Yr1
Panyako in Kaksingri West
Yr 2
Mwirendia in Kakasingri west
Yr3
Nyamrisia in Kaksingri west
Yr4
Asoko in Wangchieng
Yr5
Opande in wangchieng
Yr1
Okita in wangchieng
Yr2
Kolage in wangchieng
Yr3
Apuko in wangchieng
Yr4
Obuya in wangchieng
Yr5
Osakwe in Kibiri
15,000m3
5.7million
Yr4
Kuguma in West Karachuonyo
do do Yr3
Tinga in North Karachuonyo
Yr1
Koliech inNorth Karachuonyo
Yr1
Kokoth inNorth Karachuonyo
Yr2
Wagwe in cental
Yr4
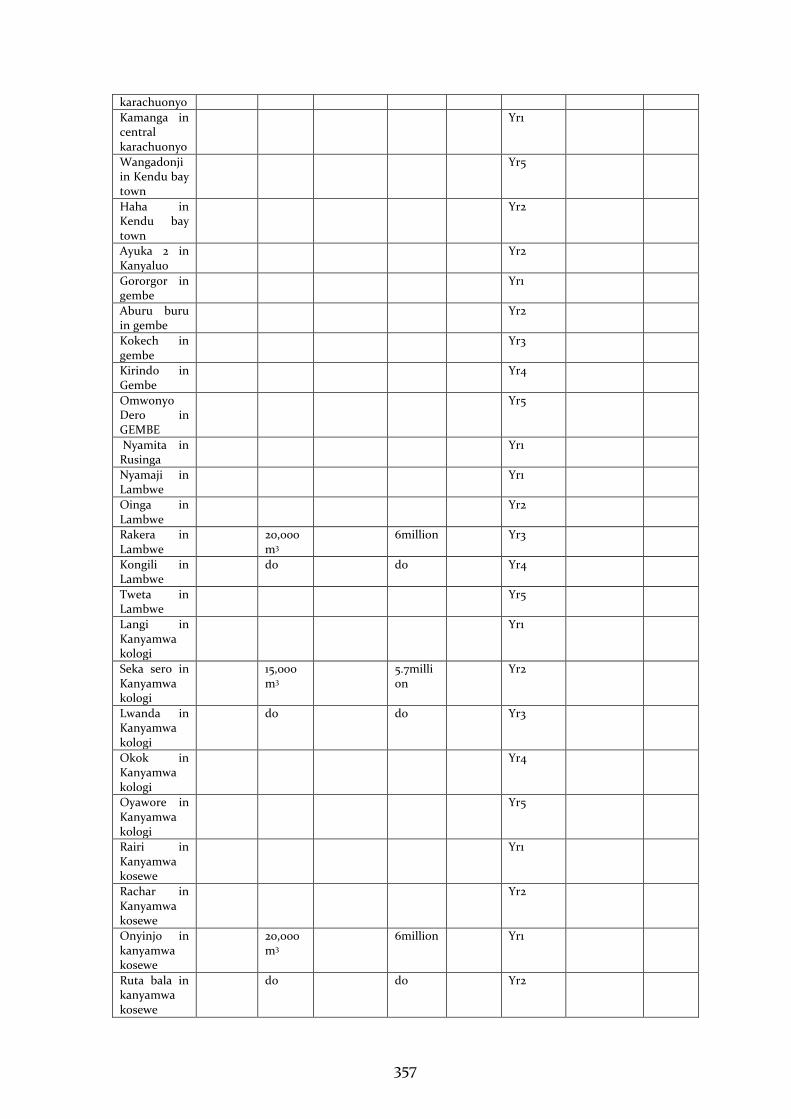
357
karachuonyo
Kamanga in central karachuonyo
Yr1
Wangadonji in Kendu bay town
Yr5
Haha in Kendu bay town
Yr2
Ayuka 2 in Kanyaluo
Yr2
Gororgor in gembe
Yr1
Aburu buru in gembe
Yr2
Kokech in gembe
Yr3
Kirindo in Gembe
Yr4
Omwonyo Dero in GEMBE
Yr5
Nyamita in Rusinga
Yr1
Nyamaji in Lambwe
Yr1
Oinga in Lambwe
Yr2
Rakera in Lambwe
20,000m3
6million Yr3
Kongili in Lambwe
do do Yr4
Tweta in Lambwe
Yr5
Langi in Kanyamwa kologi
Yr1
Seka sero in Kanyamwa kologi
15,000m3
5.7million
Yr2
Lwanda in Kanyamwa kologi
do do Yr3
Okok in Kanyamwa kologi
Yr4
Oyawore in Kanyamwa kologi
Yr5
Rairi in Kanyamwa kosewe
Yr1
Rachar in Kanyamwa kosewe
Yr2
Onyinjo in kanyamwa kosewe
20,000m3
6million Yr1
Ruta bala in kanyamwa kosewe
do do Yr2
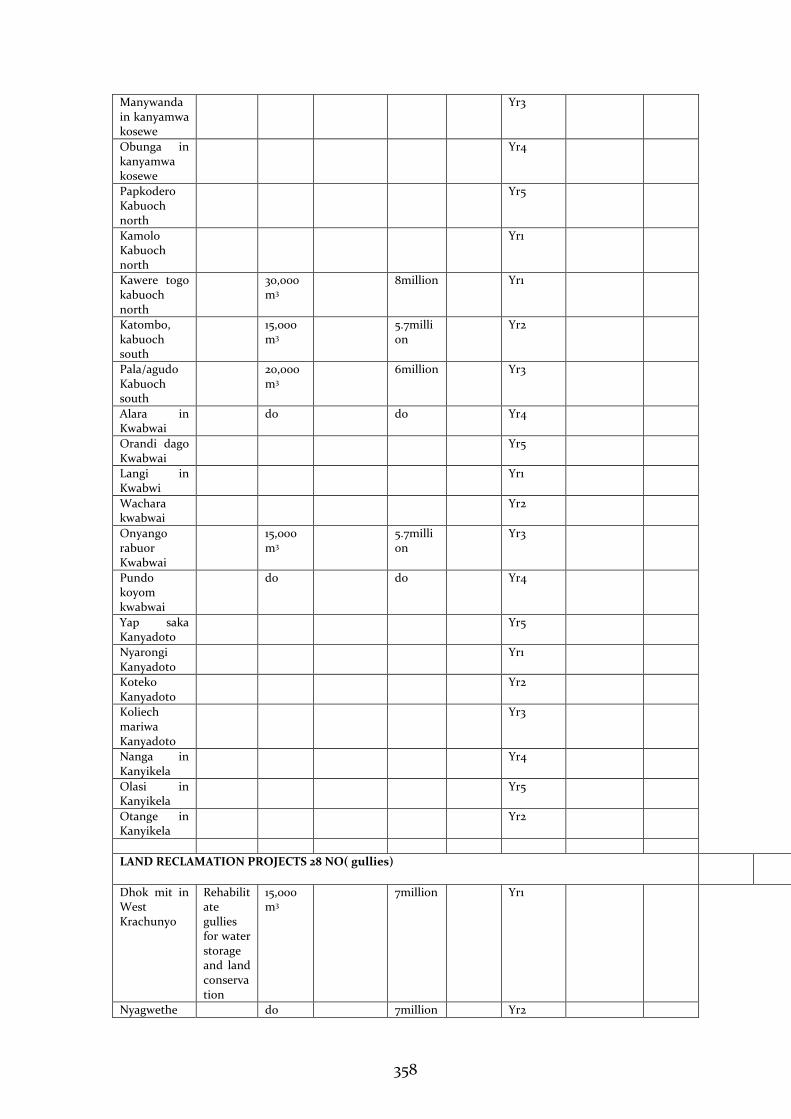
358
Manywanda in kanyamwa kosewe
Yr3
Obunga in kanyamwa kosewe
Yr4
Papkodero Kabuoch north
Yr5
Kamolo Kabuoch north
Yr1
Kawere togo kabuoch north
30,000m3
8million Yr1
Katombo, kabuoch south
15,000m3
5.7million
Yr2
Pala/agudo Kabuoch south
20,000m3
6million Yr3
Alara in Kwabwai
do do Yr4
Orandi dago Kwabwai
Yr5
Langi in Kwabwi
Yr1
Wachara kwabwai
Yr2
Onyango rabuor Kwabwai
15,000m3
5.7million
Yr3
Pundo koyom kwabwai
do do Yr4
Yap saka Kanyadoto
Yr5
Nyarongi Kanyadoto
Yr1
Koteko Kanyadoto
Yr2
Koliech mariwa Kanyadoto
Yr3
Nanga in Kanyikela
Yr4
Olasi in Kanyikela
Yr5
Otange in Kanyikela
Yr2
LAND RECLAMATION PROJECTS 28 NO( gullies) Yr3
Dhok mit in West Krachunyo
Rehabilitate gullies for water storage and land conservation
15,000m3
7million Yr1
Nyagwethe do 7million Yr2
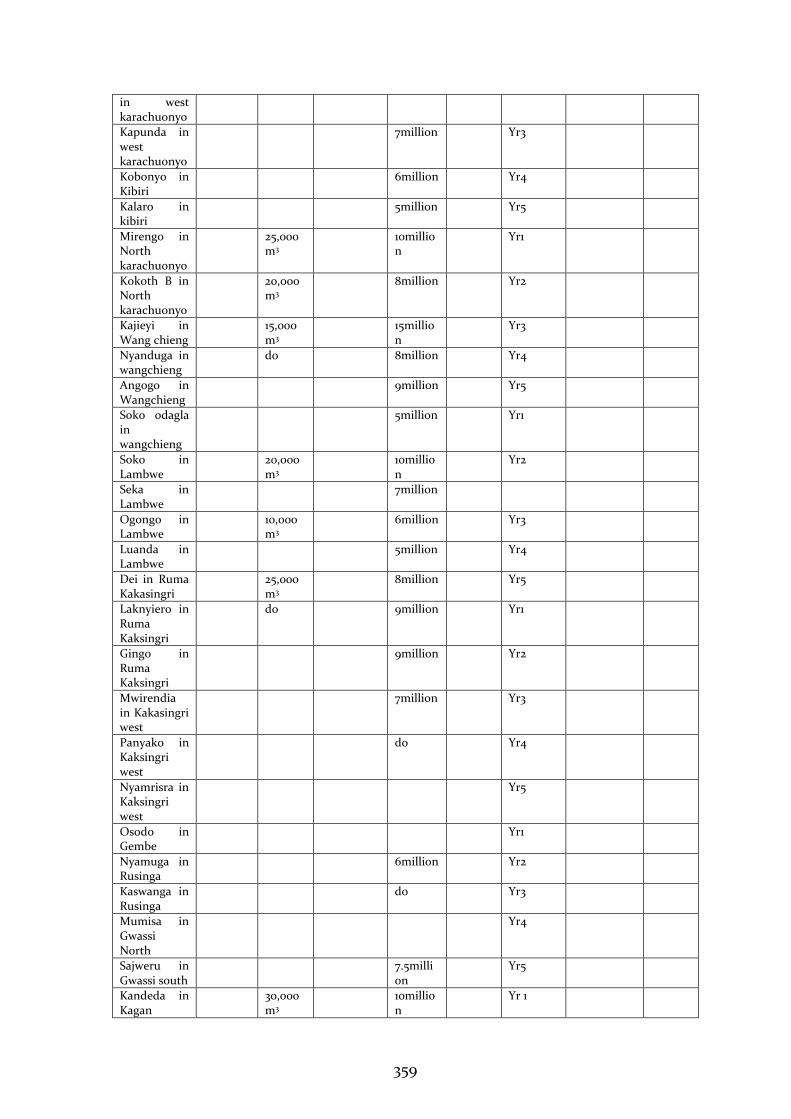
359
in west karachuonyo
Kapunda in west karachuonyo
7million Yr3
Kobonyo in Kibiri
6million Yr4
Kalaro in kibiri
5million Yr5
Mirengo in North karachuonyo
25,000m3
10million
Yr1
Kokoth B in North karachuonyo
20,000m3
8million Yr2
Kajieyi in Wang chieng
15,000m3
15million
Yr3
Nyanduga in wangchieng
do 8million Yr4
Angogo in Wangchieng
9million Yr5
Soko odagla in wangchieng
5million Yr1
Soko in Lambwe
20,000m3
10million
Yr2
Seka in Lambwe
7million
Ogongo in Lambwe
10,000m3
6million Yr3
Luanda in Lambwe
5million Yr4
Dei in Ruma Kakasingri
25,000m3
8million Yr5
Laknyiero in Ruma Kaksingri
do 9million Yr1
Gingo in Ruma Kaksingri
9million Yr2
Mwirendia in Kakasingri west
7million Yr3
Panyako in Kaksingri west
do Yr4
Nyamrisra in Kaksingri west
Yr5
Osodo in Gembe
Yr1
Nyamuga in Rusinga
6million Yr2
Kaswanga in Rusinga
do Yr3
Mumisa in Gwassi North
Yr4
Sajweru in Gwassi south
7.5million
Yr5
Kandeda in Kagan
30,000m3
10million
Yr 1
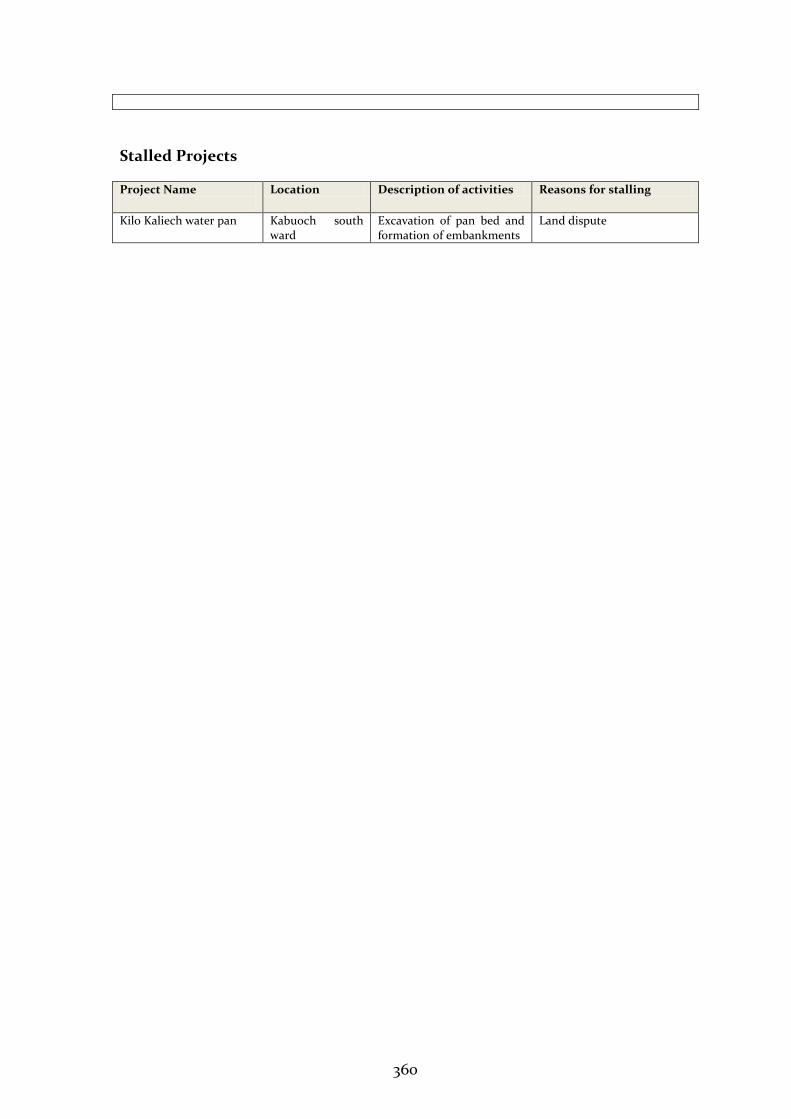
360
Stalled Projects
Project Name
Location Description of activities Reasons for stalling
Kilo Kaliech water pan Kabuoch south ward
Excavation of pan bed and formation of embankments
Land dispute
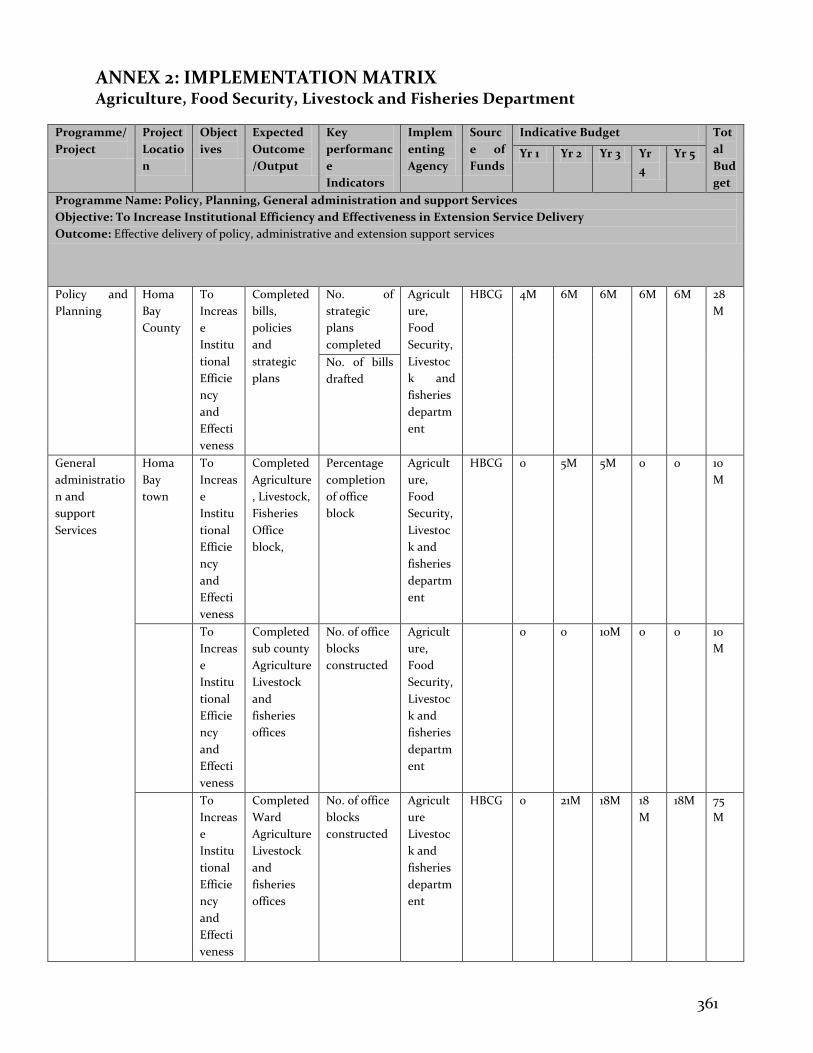
361
ANNEX 2: IMPLEMENTATION MATRIX Agriculture, Food Security, Livestock and Fisheries Department
Programme/
Project
Project
Locatio
n
Object
ives
Expected
Outcome
/Output
Key
performanc
e
Indicators
Implem
enting
Agency
Sourc
e of
Funds
Indicative Budget Tot
al
Bud
get
Yr 1 Yr 2 Yr 3 Yr
4
Yr 5
Programme Name: Policy, Planning, General administration and support Services
Objective: To Increase Institutional Efficiency and Effectiveness in Extension Service Delivery
Outcome: Effective delivery of policy, administrative and extension support services
Policy and
Planning
Homa
Bay
County
To
Increas
e
Institu
tional
Efficie
ncy
and
Effecti
veness
Completed
bills,
policies
and
strategic
plans
No. of
strategic
plans
completed
Agricult
ure,
Food
Security,
Livestoc
k and
fisheries
departm
ent
HBCG 4M 6M 6M 6M 6M 28
M
No. of bills
drafted
General
administratio
n and
support
Services
Homa
Bay
town
To
Increas
e
Institu
tional
Efficie
ncy
and
Effecti
veness
Completed
Agriculture
, Livestock,
Fisheries
Office
block,
Percentage
completion
of office
block
Agricult
ure,
Food
Security,
Livestoc
k and
fisheries
departm
ent
HBCG 0 5M 5M 0 0 10
M
To
Increas
e
Institu
tional
Efficie
ncy
and
Effecti
veness
Completed
sub county
Agriculture
Livestock
and
fisheries
offices
No. of office
blocks
constructed
Agricult
ure,
Food
Security,
Livestoc
k and
fisheries
departm
ent
0 0 10M 0 0 10
M
To
Increas
e
Institu
tional
Efficie
ncy
and
Effecti
veness
Completed
Ward
Agriculture
Livestock
and
fisheries
offices
No. of office
blocks
constructed
Agricult
ure
Livestoc
k and
fisheries
departm
ent
HBCG 0 21M 18M 18
M
18M 75
M
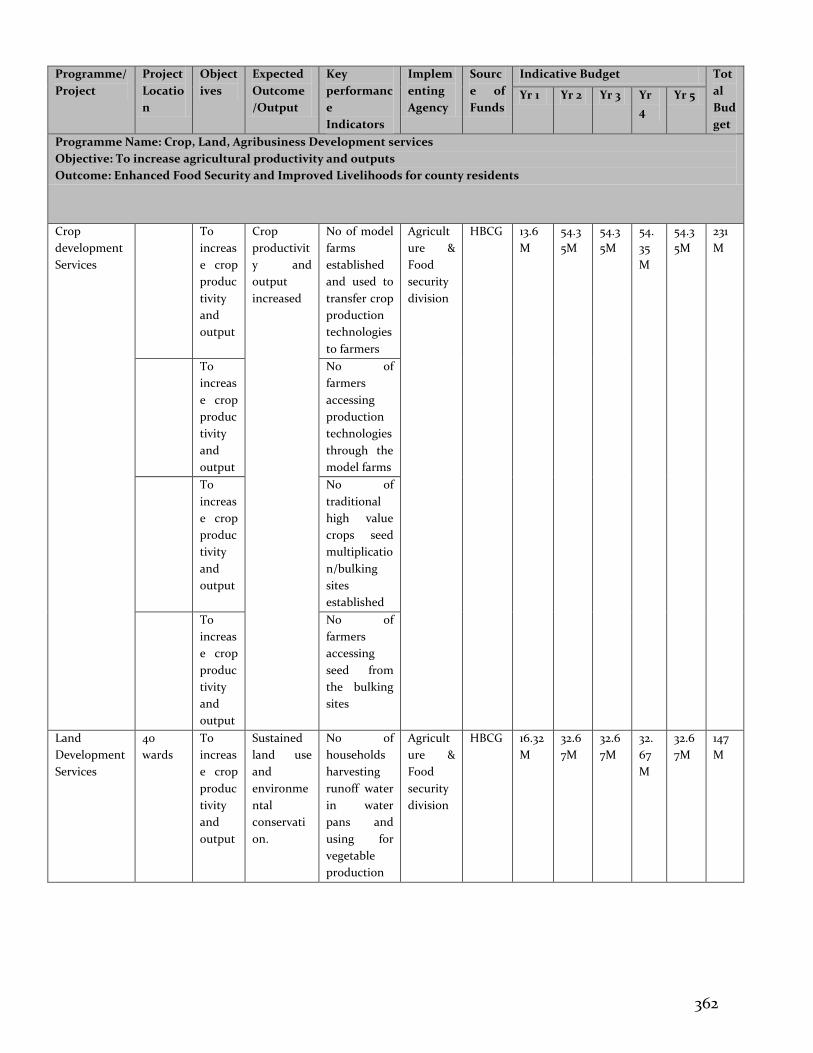
362
Programme/
Project
Project
Locatio
n
Object
ives
Expected
Outcome
/Output
Key
performanc
e
Indicators
Implem
enting
Agency
Sourc
e of
Funds
Indicative Budget Tot
al
Bud
get
Yr 1 Yr 2 Yr 3 Yr
4
Yr 5
Programme Name: Crop, Land, Agribusiness Development services
Objective: To increase agricultural productivity and outputs
Outcome: Enhanced Food Security and Improved Livelihoods for county residents
Crop
development
Services
To
increas
e crop
produc
tivity
and
output
Crop
productivit
y and
output
increased
No of model
farms
established
and used to
transfer crop
production
technologies
to farmers
Agricult
ure &
Food
security
division
HBCG 13.6
M
54.3
5M
54.3
5M
54.
35
M
54.3
5M
231
M
To
increas
e crop
produc
tivity
and
output
No of
farmers
accessing
production
technologies
through the
model farms
To
increas
e crop
produc
tivity
and
output
No of
traditional
high value
crops seed
multiplicatio
n/bulking
sites
established
To
increas
e crop
produc
tivity
and
output
No of
farmers
accessing
seed from
the bulking
sites
Land
Development
Services
40
wards
To
increas
e crop
produc
tivity
and
output
Sustained
land use
and
environme
ntal
conservati
on.
No of
households
harvesting
runoff water
in water
pans and
using for
vegetable
production
Agricult
ure &
Food
security
division
HBCG 16.32
M
32.6
7M
32.6
7M
32.
67
M
32.6
7M
147
M
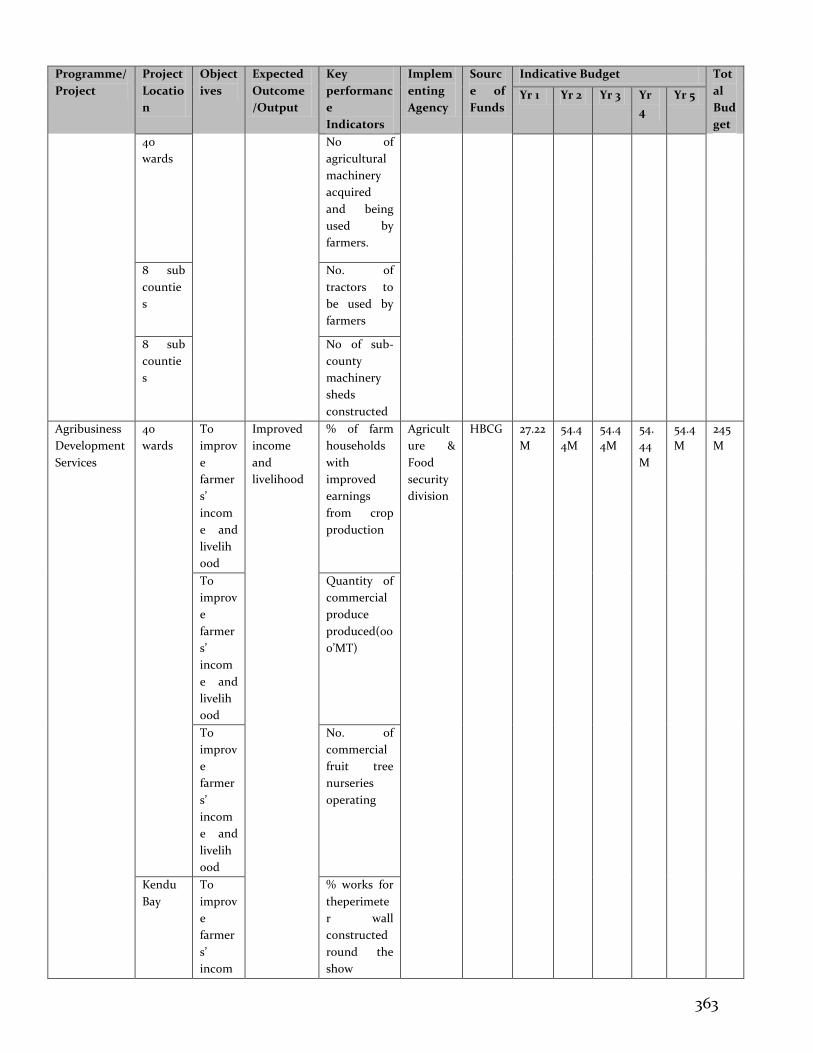
363
Programme/
Project
Project
Locatio
n
Object
ives
Expected
Outcome
/Output
Key
performanc
e
Indicators
Implem
enting
Agency
Sourc
e of
Funds
Indicative Budget Tot
al
Bud
get
Yr 1 Yr 2 Yr 3 Yr
4
Yr 5
40
wards
No of
agricultural
machinery
acquired
and being
used by
farmers.
8 sub
countie
s
No. of
tractors to
be used by
farmers
8 sub
countie
s
No of sub-
county
machinery
sheds
constructed
Agribusiness
Development
Services
40
wards
To
improv
e
farmer
s’
incom
e and
livelih
ood
Improved
income
and
livelihood
% of farm
households
with
improved
earnings
from crop
production
Agricult
ure &
Food
security
division
HBCG 27.22
M
54.4
4M
54.4
4M
54.
44
M
54.4
M
245
M
To
improv
e
farmer
s’
incom
e and
livelih
ood
Quantity of
commercial
produce
produced(00
0’MT)
To
improv
e
farmer
s’
incom
e and
livelih
ood
No. of
commercial
fruit tree
nurseries
operating
Kendu
Bay
To
improv
e
farmer
s’
incom
% works for
theperimete
r wall
constructed
round the
show
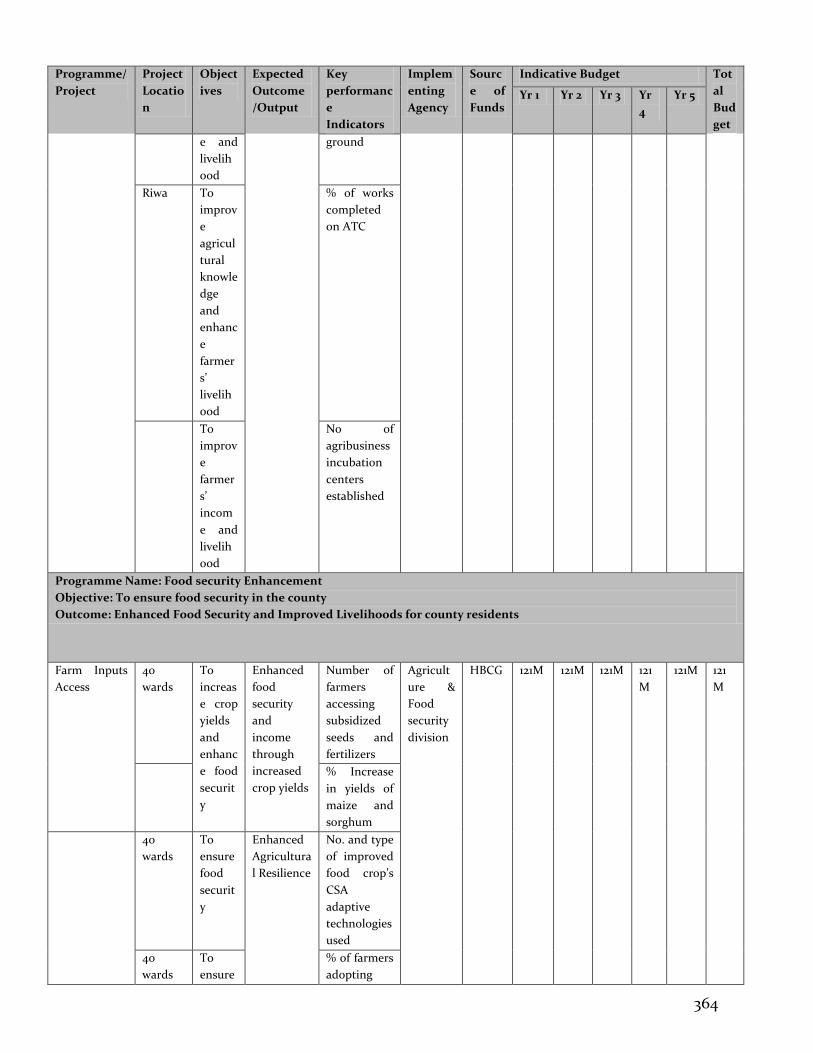
364
Programme/
Project
Project
Locatio
n
Object
ives
Expected
Outcome
/Output
Key
performanc
e
Indicators
Implem
enting
Agency
Sourc
e of
Funds
Indicative Budget Tot
al
Bud
get
Yr 1 Yr 2 Yr 3 Yr
4
Yr 5
e and
livelih
ood
ground
Riwa To
improv
e
agricul
tural
knowle
dge
and
enhanc
e
farmer
s’
livelih
ood
% of works
completed
on ATC
To
improv
e
farmer
s’
incom
e and
livelih
ood
No of
agribusiness
incubation
centers
established
Programme Name: Food security Enhancement
Objective: To ensure food security in the county
Outcome: Enhanced Food Security and Improved Livelihoods for county residents
Farm Inputs
Access
40
wards
To
increas
e crop
yields
and
enhanc
e food
securit
y
Enhanced
food
security
and
income
through
increased
crop yields
Number of
farmers
accessing
subsidized
seeds and
fertilizers
Agricult
ure &
Food
security
division
HBCG 121M
121M 121M
121
M 121M 121
M
% Increase
in yields of
maize and
sorghum
40
wards
To
ensure
food
securit
y
Enhanced
Agricultura
l Resilience
No. and type
of improved
food crop’s
CSA
adaptive
technologies
used
40
wards
To
ensure
% of farmers
adopting
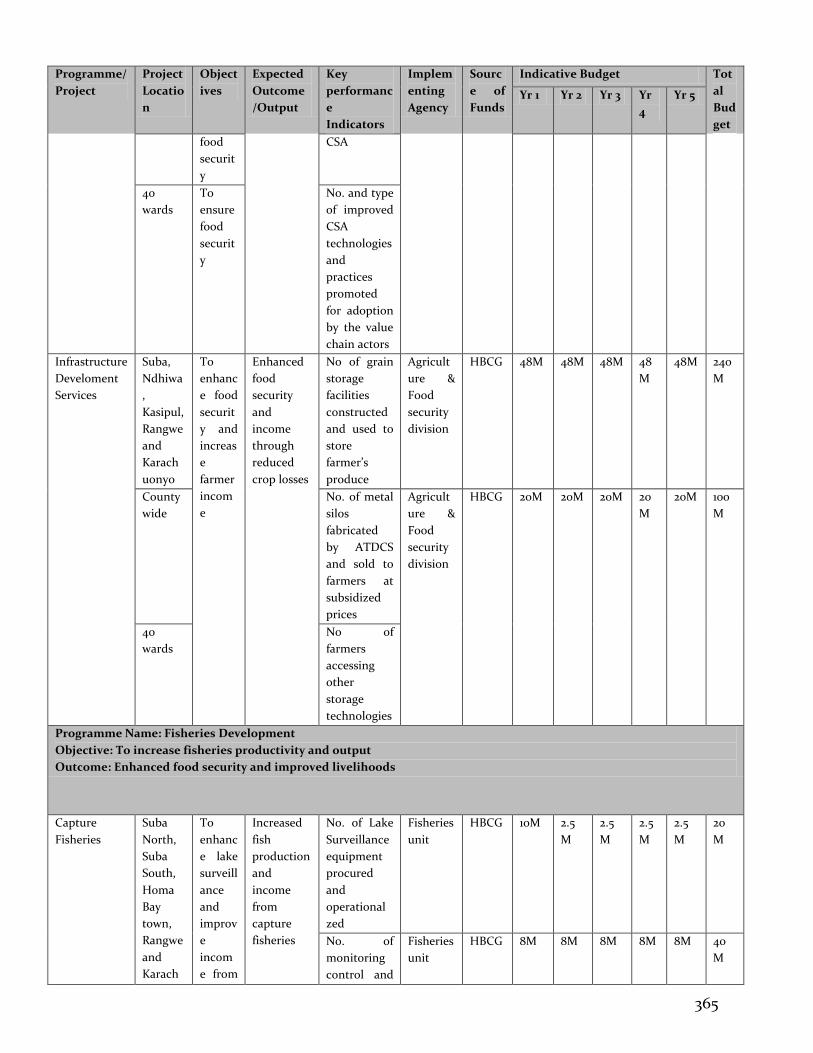
365
Programme/
Project
Project
Locatio
n
Object
ives
Expected
Outcome
/Output
Key
performanc
e
Indicators
Implem
enting
Agency
Sourc
e of
Funds
Indicative Budget Tot
al
Bud
get
Yr 1 Yr 2 Yr 3 Yr
4
Yr 5
food
securit
y
CSA
40
wards
To
ensure
food
securit
y
No. and type
of improved
CSA
technologies
and
practices
promoted
for adoption
by the value
chain actors
Infrastructure
Develoment
Services
Suba,
Ndhiwa
,
Kasipul,
Rangwe
and
Karach
uonyo
To
enhanc
e food
securit
y and
increas
e
farmer
incom
e
Enhanced
food
security
and
income
through
reduced
crop losses
No of grain
storage
facilities
constructed
and used to
store
farmer’s
produce
Agricult
ure &
Food
security
division
HBCG 48M 48M 48M 48
M 48M 240
M
County
wide
No. of metal
silos
fabricated
by ATDCS
and sold to
farmers at
subsidized
prices
Agricult
ure &
Food
security
division
HBCG 20M 20M 20M 20
M
20M 100
M
40
wards
No of
farmers
accessing
other
storage
technologies
Programme Name: Fisheries Development
Objective: To increase fisheries productivity and output
Outcome: Enhanced food security and improved livelihoods
Capture
Fisheries
Suba
North,
Suba
South,
Homa
Bay
town,
Rangwe
and
Karach
To
enhanc
e lake
surveill
ance
and
improv
e
incom
e from
Increased
fish
production
and
income
from
capture
fisheries
No. of Lake
Surveillance
equipment
procured
and
operational
zed
Fisheries
unit HBCG 10M 2.5
M
2.5
M
2.5
M
2.5
M
20
M
No. of
monitoring
control and
Fisheries
unit HBCG 8M 8M 8M 8M 8M 40
M
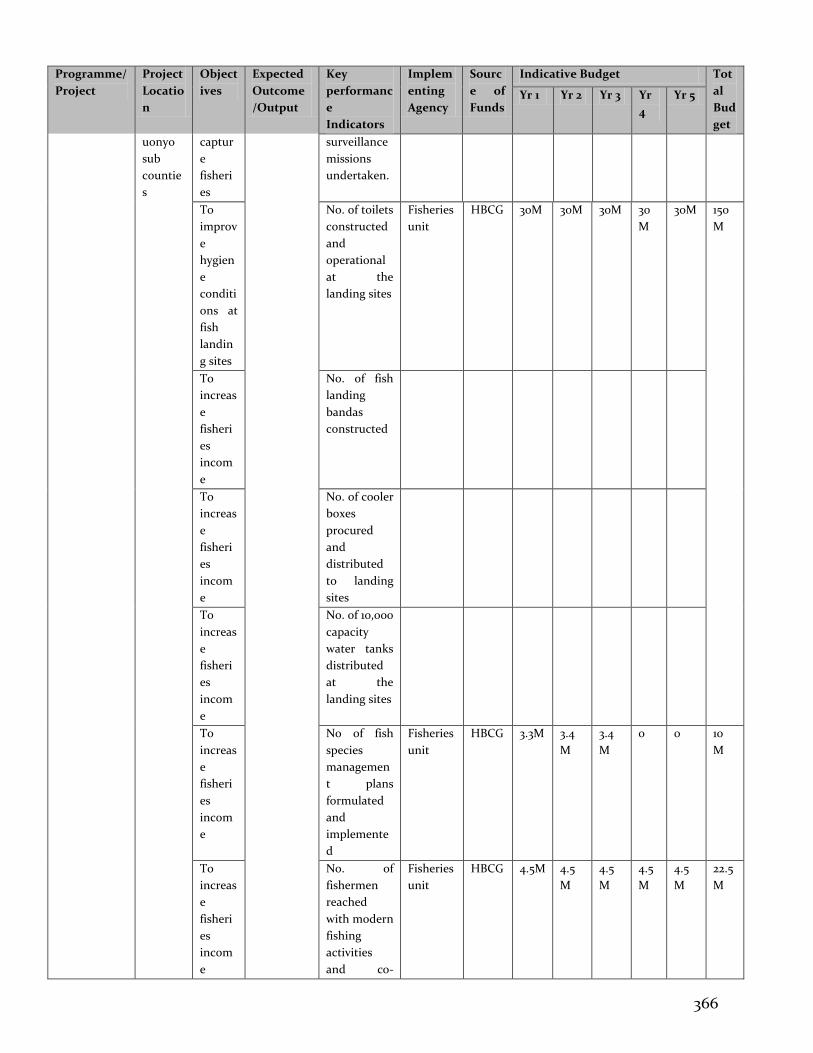
366
Programme/
Project
Project
Locatio
n
Object
ives
Expected
Outcome
/Output
Key
performanc
e
Indicators
Implem
enting
Agency
Sourc
e of
Funds
Indicative Budget Tot
al
Bud
get
Yr 1 Yr 2 Yr 3 Yr
4
Yr 5
uonyo
sub
countie
s
captur
e
fisheri
es
surveillance
missions
undertaken.
To
improv
e
hygien
e
conditi
ons at
fish
landin
g sites
No. of toilets
constructed
and
operational
at the
landing sites
Fisheries
unit HBCG 30M 30M 30M 30
M
30M 150
M
To
increas
e
fisheri
es
incom
e
No. of fish
landing
bandas
constructed
To
increas
e
fisheri
es
incom
e
No. of cooler
boxes
procured
and
distributed
to landing
sites
To
increas
e
fisheri
es
incom
e
No. of 10,000
capacity
water tanks
distributed
at the
landing sites
To
increas
e
fisheri
es
incom
e
No of fish
species
managemen
t plans
formulated
and
implemente
d
Fisheries
unit HBCG 3.3M 3.4
M
3.4
M
0 0 10
M
To
increas
e
fisheri
es
incom
e
No. of
fishermen
reached
with modern
fishing
activities
and co-
Fisheries
unit HBCG 4.5M 4.5
M
4.5
M
4.5
M
4.5
M
22.5
M
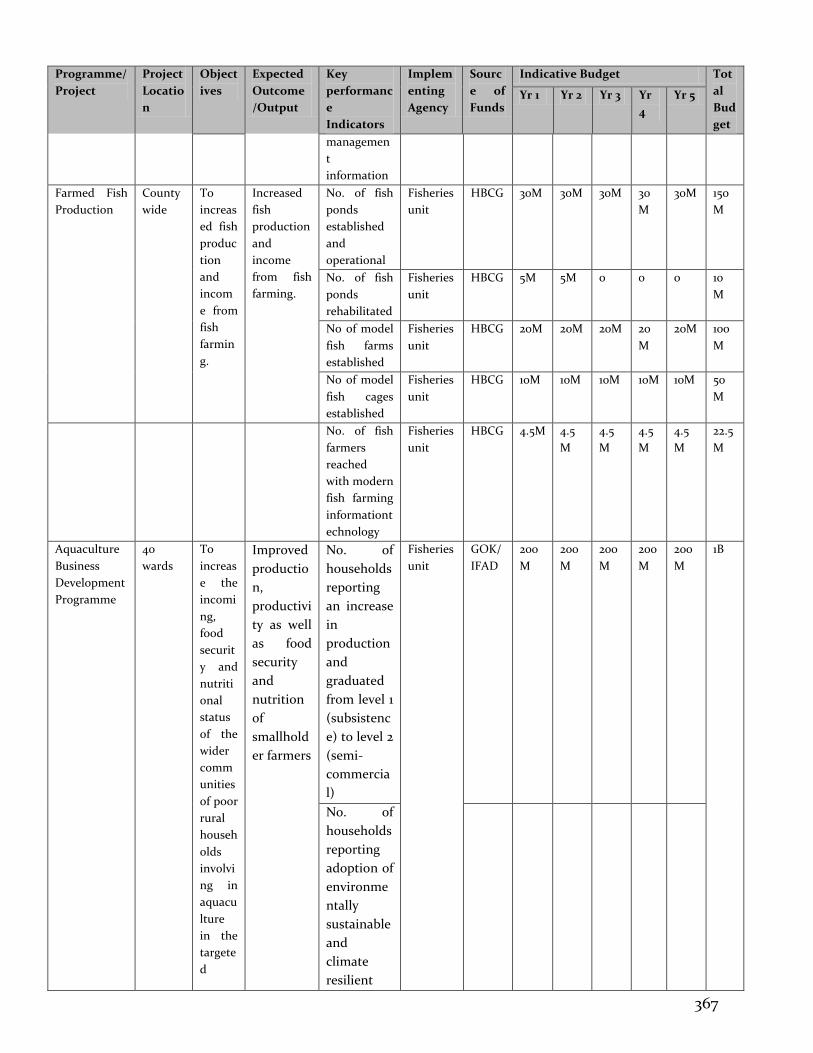
367
Programme/
Project
Project
Locatio
n
Object
ives
Expected
Outcome
/Output
Key
performanc
e
Indicators
Implem
enting
Agency
Sourc
e of
Funds
Indicative Budget Tot
al
Bud
get
Yr 1 Yr 2 Yr 3 Yr
4
Yr 5
managemen
t
information
Farmed Fish
Production
County
wide
To
increas
ed fish
produc
tion
and
incom
e from
fish
farmin
g.
Increased
fish
production
and
income
from fish
farming.
No. of fish
ponds
established
and
operational
Fisheries
unit
HBCG 30M 30M 30M 30
M 30M 150
M
No. of fish
ponds
rehabilitated
Fisheries
unit HBCG 5M 5M 0 0 0 10
M
No of model
fish farms
established
Fisheries
unit HBCG 20M 20M 20M 20
M
20M 100
M
No of model
fish cages
established
Fisheries
unit HBCG 10M 10M 10M 10M 10M 50
M
No. of fish
farmers
reached
with modern
fish farming
informationt
echnology
Fisheries
unit HBCG 4.5M 4.5
M
4.5
M
4.5
M
4.5
M
22.5
M
Aquaculture
Business
Development
Programme
40
wards
To
increas
e the
incomi
ng,
food
securit
y and
nutriti
onal
status
of the
wider
comm
unities
of poor
rural
househ
olds
involvi
ng in
aquacu
lture
in the
targete
d
Improved
productio
n,
productivi
ty as well
as food
security
and
nutrition
of
smallhold
er farmers
No. of
households
reporting
an increase
in
production
and
graduated
from level 1
(subsistenc
e) to level 2
(semi-
commercia
l)
Fisheries
unit
GOK/
IFAD
200
M
200
M 200
M 200
M 200
M 1B
No. of
households
reporting
adoption of
environme
ntally
sustainable
and
climate
resilient
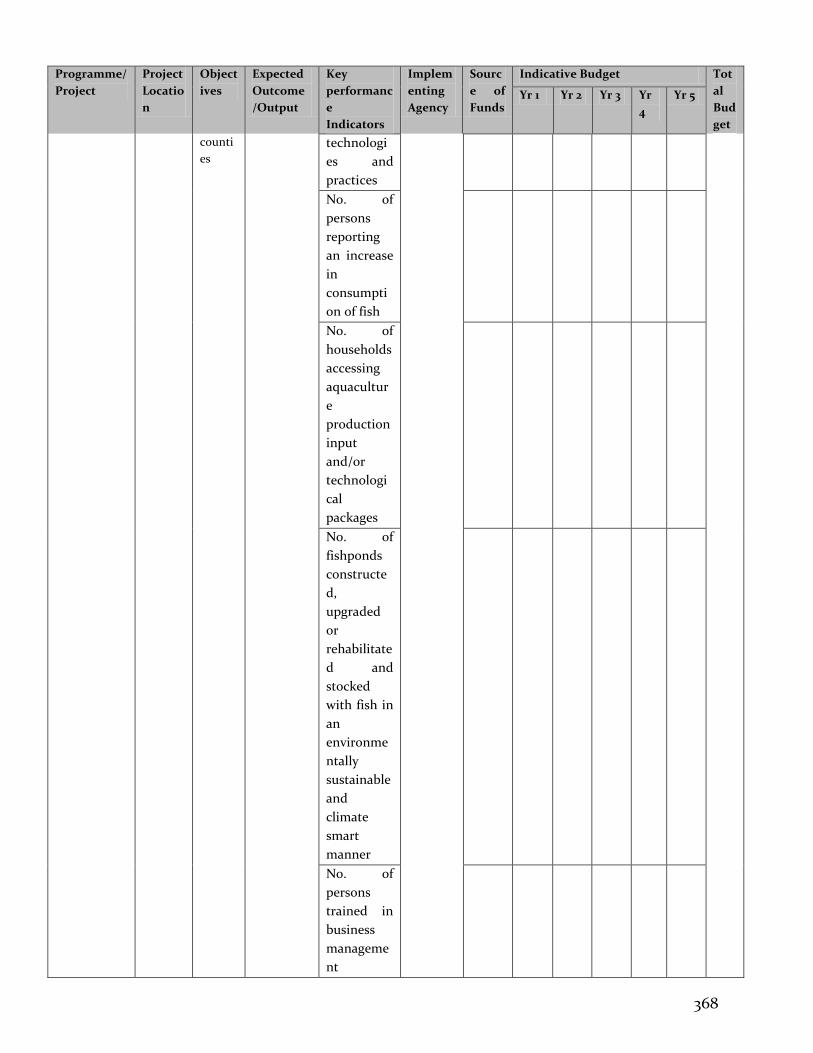
368
Programme/
Project
Project
Locatio
n
Object
ives
Expected
Outcome
/Output
Key
performanc
e
Indicators
Implem
enting
Agency
Sourc
e of
Funds
Indicative Budget Tot
al
Bud
get
Yr 1 Yr 2 Yr 3 Yr
4
Yr 5
counti
es
technologi
es and
practices
No. of
persons
reporting
an increase
in
consumpti
on of fish
No. of
households
accessing
aquacultur
e
production
input
and/or
technologi
cal
packages
No. of
fishponds
constructe
d,
upgraded
or
rehabilitate
d and
stocked
with fish in
an
environme
ntally
sustainable
and
climate
smart
manner
No. of
persons
trained in
business
manageme
nt
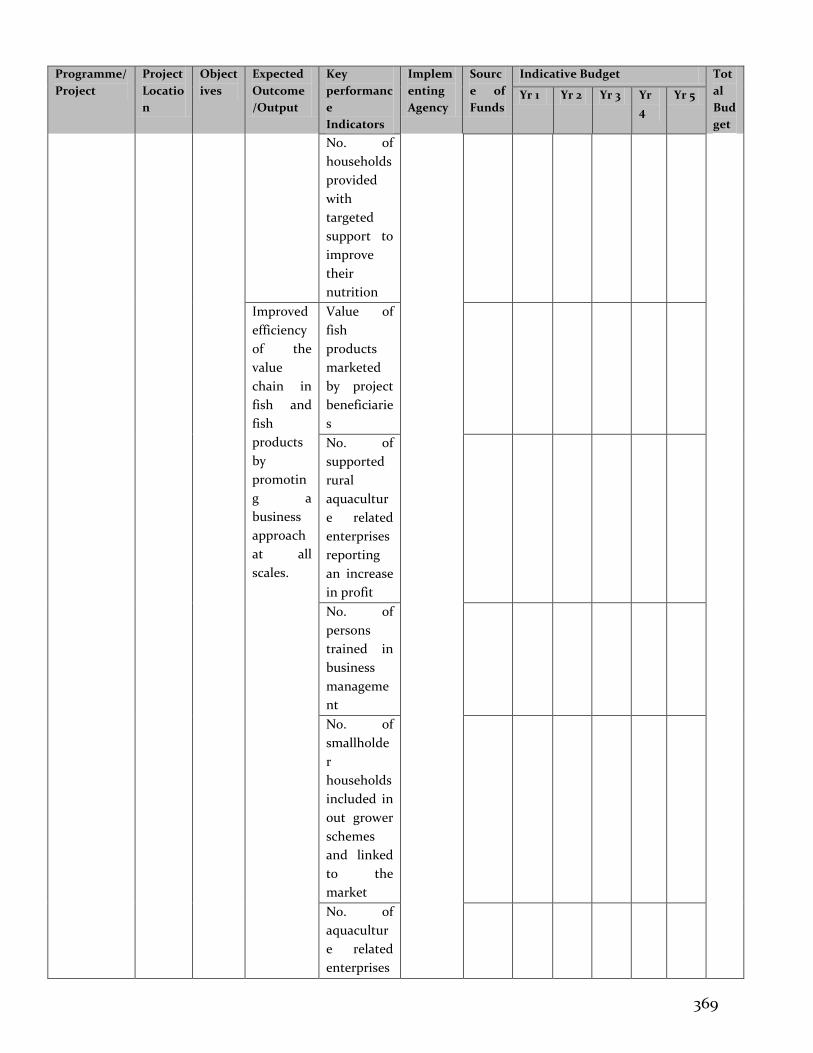
369
Programme/
Project
Project
Locatio
n
Object
ives
Expected
Outcome
/Output
Key
performanc
e
Indicators
Implem
enting
Agency
Sourc
e of
Funds
Indicative Budget Tot
al
Bud
get
Yr 1 Yr 2 Yr 3 Yr
4
Yr 5
No. of
households
provided
with
targeted
support to
improve
their
nutrition
Improved
efficiency
of the
value
chain in
fish and
fish
products
by
promotin
g a
business
approach
at all
scales.
Value of
fish
products
marketed
by project
beneficiarie
s
No. of
supported
rural
aquacultur
e related
enterprises
reporting
an increase
in profit
No. of
persons
trained in
business
manageme
nt
No. of
smallholde
r
households
included in
out grower
schemes
and linked
to the
market
No. of
aquacultur
e related
enterprises
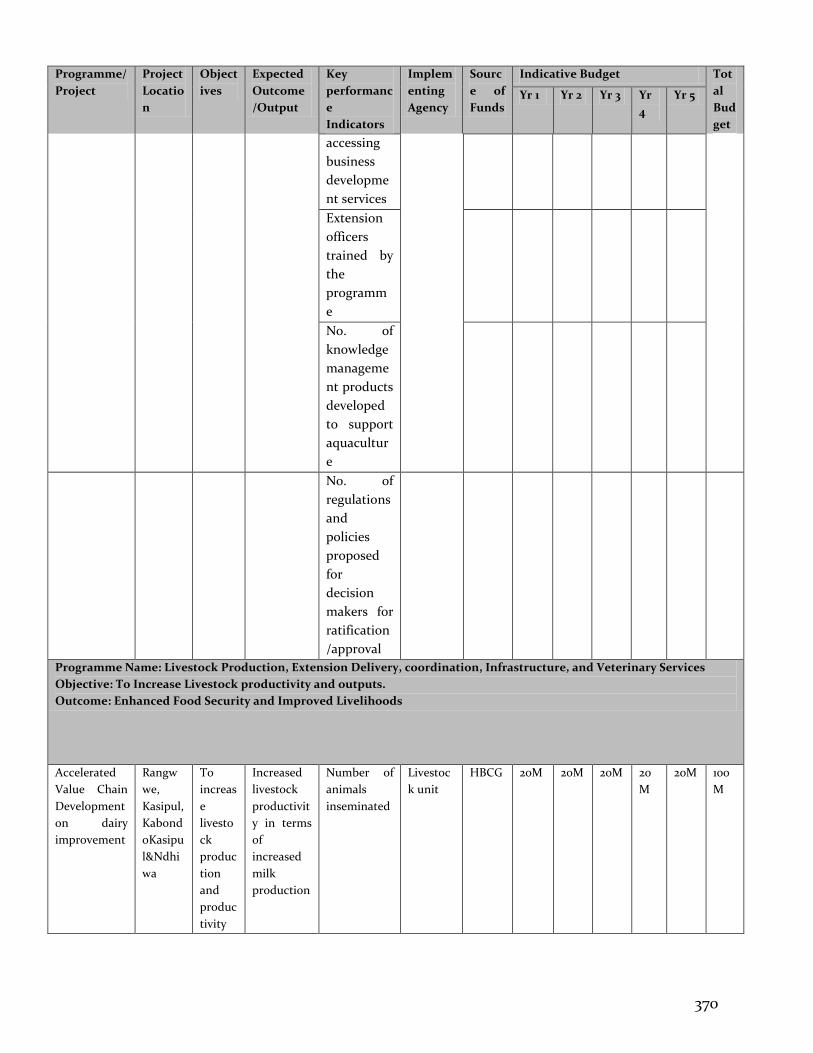
370
Programme/
Project
Project
Locatio
n
Object
ives
Expected
Outcome
/Output
Key
performanc
e
Indicators
Implem
enting
Agency
Sourc
e of
Funds
Indicative Budget Tot
al
Bud
get
Yr 1 Yr 2 Yr 3 Yr
4
Yr 5
accessing
business
developme
nt services
Extension
officers
trained by
the
programm
e
No. of
knowledge
manageme
nt products
developed
to support
aquacultur
e
No. of
regulations
and
policies
proposed
for
decision
makers for
ratification
/approval
Programme Name: Livestock Production, Extension Delivery, coordination, Infrastructure, and Veterinary Services
Objective: To Increase Livestock productivity and outputs.
Outcome: Enhanced Food Security and Improved Livelihoods
Accelerated
Value Chain
Development
on dairy
improvement
Rangw
we,
Kasipul,
Kabond
oKasipu
l&Ndhi
wa
To
increas
e
livesto
ck
produc
tion
and
produc
tivity
Increased
livestock
productivit
y in terms
of
increased
milk
production
Number of
animals
inseminated
Livestoc
k unit
HBCG 20M 20M 20M 20
M
20M 100
M
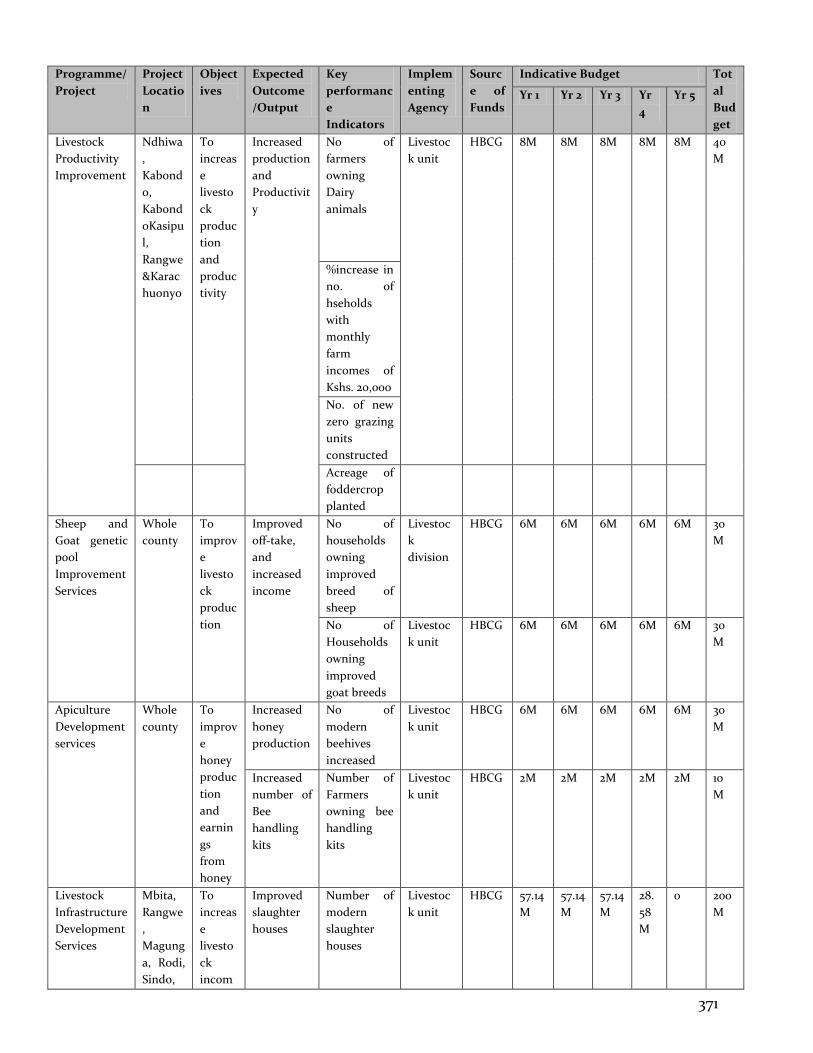
371
Programme/
Project
Project
Locatio
n
Object
ives
Expected
Outcome
/Output
Key
performanc
e
Indicators
Implem
enting
Agency
Sourc
e of
Funds
Indicative Budget Tot
al
Bud
get
Yr 1 Yr 2 Yr 3 Yr
4
Yr 5
Livestock
Productivity
Improvement
Ndhiwa
,
Kabond
o,
Kabond
oKasipu
l,
Rangwe
&Karac
huonyo
To
increas
e
livesto
ck
produc
tion
and
produc
tivity
Increased
production
and
Productivit
y
No of
farmers
owning
Dairy
animals
Livestoc
k unit
HBCG 8M 8M 8M 8M 8M 40
M
%increase in
no. of
hseholds
with
monthly
farm
incomes of
Kshs. 20,000
No. of new
zero grazing
units
constructed
Acreage of
foddercrop
planted
Sheep and
Goat genetic
pool
Improvement
Services
Whole
county
To
improv
e
livesto
ck
produc
tion
Improved
off-take,
and
increased
income
No of
households
owning
improved
breed of
sheep
Livestoc
k
division
HBCG 6M 6M 6M 6M 6M 30
M
No of
Households
owning
improved
goat breeds
Livestoc
k unit
HBCG 6M 6M 6M 6M 6M 30
M
Apiculture
Development
services
Whole
county
To
improv
e
honey
produc
tion
and
earnin
gs
from
honey
Increased
honey
production
No of
modern
beehives
increased
Livestoc
k unit
HBCG 6M 6M 6M 6M 6M 30
M
Increased
number of
Bee
handling
kits
Number of
Farmers
owning bee
handling
kits
Livestoc
k unit
HBCG 2M 2M 2M 2M 2M 10
M
Livestock
Infrastructure
Development
Services
Mbita,
Rangwe
,
Magung
a, Rodi,
Sindo,
To
increas
e
livesto
ck
incom
Improved
slaughter
houses
Number of
modern
slaughter
houses
Livestoc
k unit
HBCG 57.14
M
57.14
M
57.14
M
28.
58
M
0 200
M
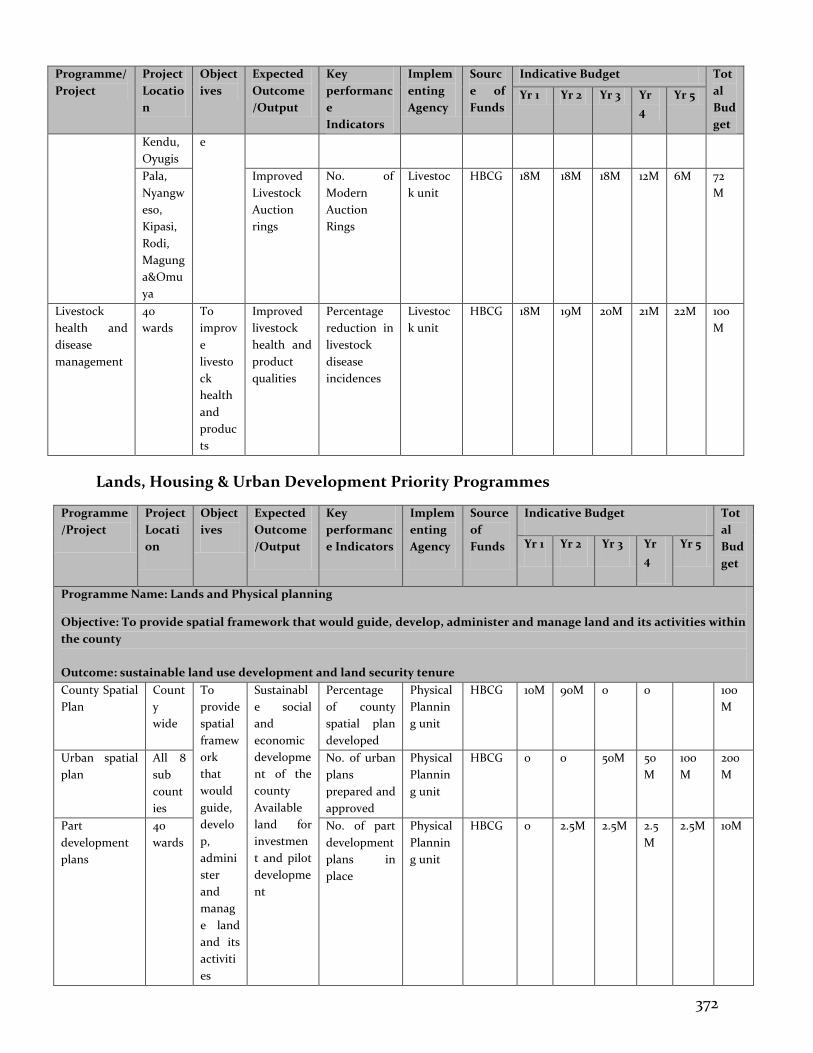
372
Programme/
Project
Project
Locatio
n
Object
ives
Expected
Outcome
/Output
Key
performanc
e
Indicators
Implem
enting
Agency
Sourc
e of
Funds
Indicative Budget Tot
al
Bud
get
Yr 1 Yr 2 Yr 3 Yr
4
Yr 5
Kendu,
Oyugis
e
Pala,
Nyangw
eso,
Kipasi,
Rodi,
Magung
a&Omu
ya
Improved
Livestock
Auction
rings
No. of
Modern
Auction
Rings
Livestoc
k unit
HBCG 18M 18M 18M 12M 6M 72
M
Livestock
health and
disease
management
40
wards
To
improv
e
livesto
ck
health
and
produc
ts
Improved
livestock
health and
product
qualities
Percentage
reduction in
livestock
disease
incidences
Livestoc
k unit
HBCG 18M 19M 20M 21M 22M 100
M
Lands, Housing & Urban Development Priority Programmes
Programme
/Project
Project
Locati
on
Object
ives
Expected
Outcome
/Output
Key
performanc
e Indicators
Implem
enting
Agency
Source
of
Funds
Indicative Budget Tot
al
Bud
get
Yr 1 Yr 2 Yr 3 Yr
4
Yr 5
Programme Name: Lands and Physical planning
Objective: To provide spatial framework that would guide, develop, administer and manage land and its activities within
the county
Outcome: sustainable land use development and land security tenure
County Spatial
Plan
Count
y
wide
To
provide
spatial
framew
ork
that
would
guide,
develo
p,
admini
ster
and
manag
e land
and its
activiti
es
Sustainabl
e social
and
economic
developme
nt of the
county
Available
land for
investmen
t and pilot
developme
nt
Percentage
of county
spatial plan
developed
Physical
Plannin
g unit
HBCG 10M 90M 0 0 100
M
Urban spatial
plan
All 8
sub
count
ies
No. of urban
plans
prepared and
approved
Physical
Plannin
g unit
HBCG 0 0 50M 50
M
100
M
200
M
Part
development
plans
40
wards
No. of part
development
plans in
place
Physical
Plannin
g unit
HBCG 0 2.5M 2.5M 2.5
M
2.5M 10M
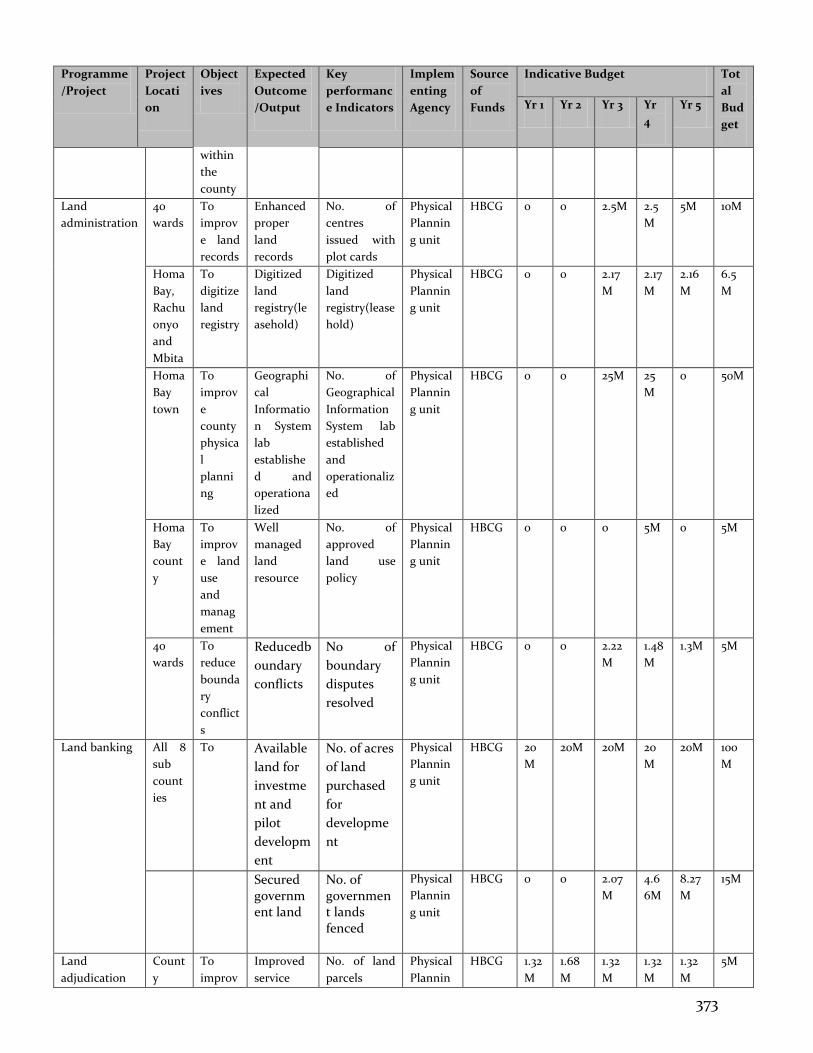
373
Programme
/Project
Project
Locati
on
Object
ives
Expected
Outcome
/Output
Key
performanc
e Indicators
Implem
enting
Agency
Source
of
Funds
Indicative Budget Tot
al
Bud
get
Yr 1 Yr 2 Yr 3 Yr
4
Yr 5
within
the
county
Land
administration
40
wards
To
improv
e land
records
Enhanced
proper
land
records
No. of
centres
issued with
plot cards
Physical
Plannin
g unit
HBCG 0 0 2.5M 2.5
M
5M 10M
Homa
Bay,
Rachu
onyo
and
Mbita
To
digitize
land
registry
Digitized
land
registry(le
asehold)
Digitized
land
registry(lease
hold)
Physical
Plannin
g unit
HBCG 0 0 2.17
M
2.17
M
2.16
M
6.5
M
Homa
Bay
town
To
improv
e
county
physica
l
planni
ng
Geographi
cal
Informatio
n System
lab
establishe
d and
operationa
lized
No. of
Geographical
Information
System lab
established
and
operationaliz
ed
Physical
Plannin
g unit
HBCG 0 0 25M 25
M
0 50M
Homa
Bay
count
y
To
improv
e land
use
and
manag
ement
Well
managed
land
resource
No. of
approved
land use
policy
Physical
Plannin
g unit
HBCG 0 0 0 5M 0 5M
40
wards
To
reduce
bounda
ry
conflict
s
Reducedb
oundary
conflicts
No of
boundary
disputes
resolved
Physical
Plannin
g unit
HBCG 0 0 2.22
M
1.48
M
1.3M 5M
Land banking All 8
sub
count
ies
To Available
land for
investme
nt and
pilot
developm
ent
No. of acres
of land
purchased
for
developme
nt
Physical
Plannin
g unit
HBCG 20
M
20M 20M 20
M
20M 100
M
Secured government land
No. of government lands fenced
Physical
Plannin
g unit
HBCG 0 0 2.07
M
4.6
6M
8.27
M
15M
Land
adjudication
Count
y
To
improv
Improved
service
No. of land
parcels
Physical
Plannin
HBCG 1.32
M
1.68
M
1.32
M
1.32
M
1.32
M
5M
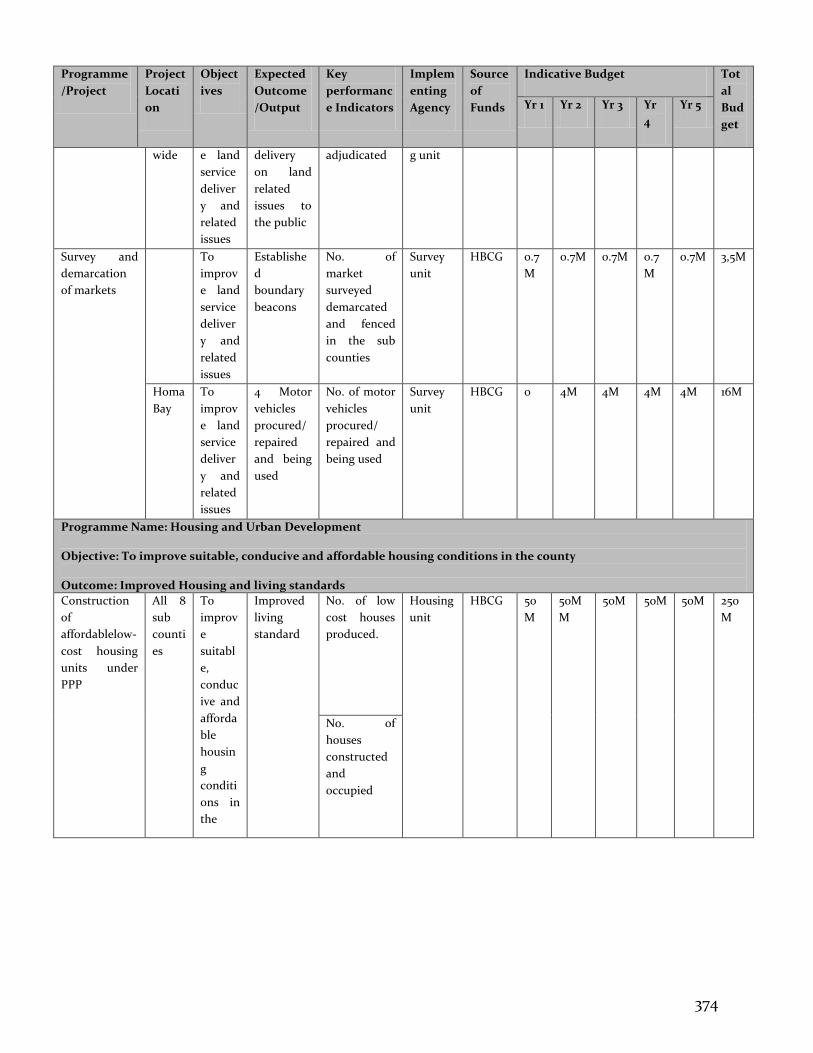
374
Programme
/Project
Project
Locati
on
Object
ives
Expected
Outcome
/Output
Key
performanc
e Indicators
Implem
enting
Agency
Source
of
Funds
Indicative Budget Tot
al
Bud
get
Yr 1 Yr 2 Yr 3 Yr
4
Yr 5
wide e land
service
deliver
y and
related
issues
delivery
on land
related
issues to
the public
adjudicated
g unit
Survey and
demarcation
of markets
To
improv
e land
service
deliver
y and
related
issues
Establishe
d
boundary
beacons
No. of
market
surveyed
demarcated
and fenced
in the sub
counties
Survey
unit
HBCG 0.7
M
0.7M 0.7M 0.7
M
0.7M 3,5M
Homa
Bay
To
improv
e land
service
deliver
y and
related
issues
4 Motor
vehicles
procured/
repaired
and being
used
No. of motor
vehicles
procured/
repaired and
being used
Survey
unit
HBCG 0 4M 4M 4M 4M 16M
Programme Name: Housing and Urban Development Objective: To improve suitable, conducive and affordable housing conditions in the county Outcome: Improved Housing and living standards
Construction
of
affordablelow-
cost housing
units under
PPP
All 8
sub
counti
es
To
improv
e
suitabl
e,
conduc
ive and
afforda
ble
housin
g
conditi
ons in
the
Improved
living
standard
No. of low
cost houses
produced.
Housing
unit
HBCG 50
M
50M
M
50M 50M 50M 250
M
No. of
houses
constructed
and
occupied
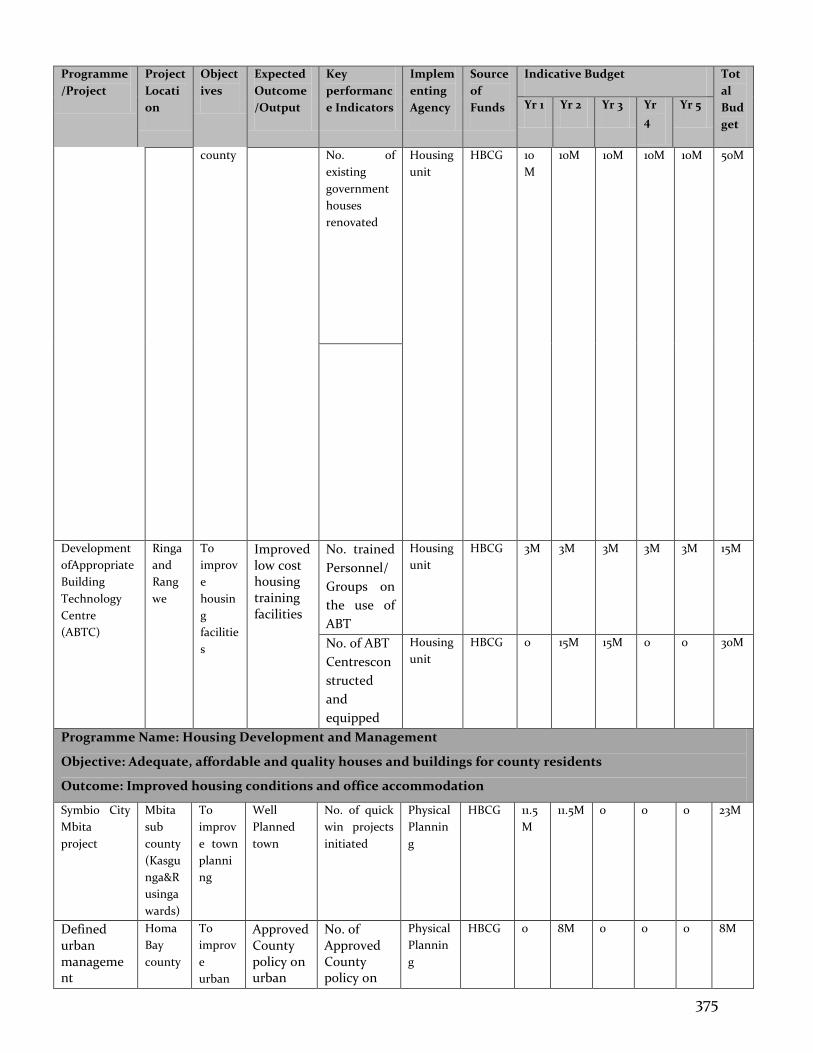
375
Programme
/Project
Project
Locati
on
Object
ives
Expected
Outcome
/Output
Key
performanc
e Indicators
Implem
enting
Agency
Source
of
Funds
Indicative Budget Tot
al
Bud
get
Yr 1 Yr 2 Yr 3 Yr
4
Yr 5
county No. of
existing
government
houses
renovated
Housing
unit
HBCG 10
M
10M 10M 10M 10M 50M
Development
ofAppropriate
Building
Technology
Centre
(ABTC)
Ringa
and
Rang
we
To
improv
e
housin
g
facilitie
s
Improved low cost housing training facilities
No. trained
Personnel/
Groups on
the use of
ABT
Housing
unit
HBCG 3M 3M 3M 3M 3M 15M
No. of ABT
Centrescon
structed
and
equipped
Housing
unit
HBCG 0 15M 15M 0 0 30M
Programme Name: Housing Development and Management
Objective: Adequate, affordable and quality houses and buildings for county residents
Outcome: Improved housing conditions and office accommodation
Symbio City
Mbita
project
Mbita
sub
county
(Kasgu
nga&R
usinga
wards)
To
improv
e town
planni
ng
Well
Planned
town
No. of quick
win projects
initiated
Physical
Plannin
g
HBCG 11.5
M
11.5M 0 0 0 23M
Defined urban management
Homa
Bay
county
To
improv
e
urban
Approved County policy on urban
No. of Approved County policy on
Physical
Plannin
g
HBCG 0 8M 0 0 0 8M
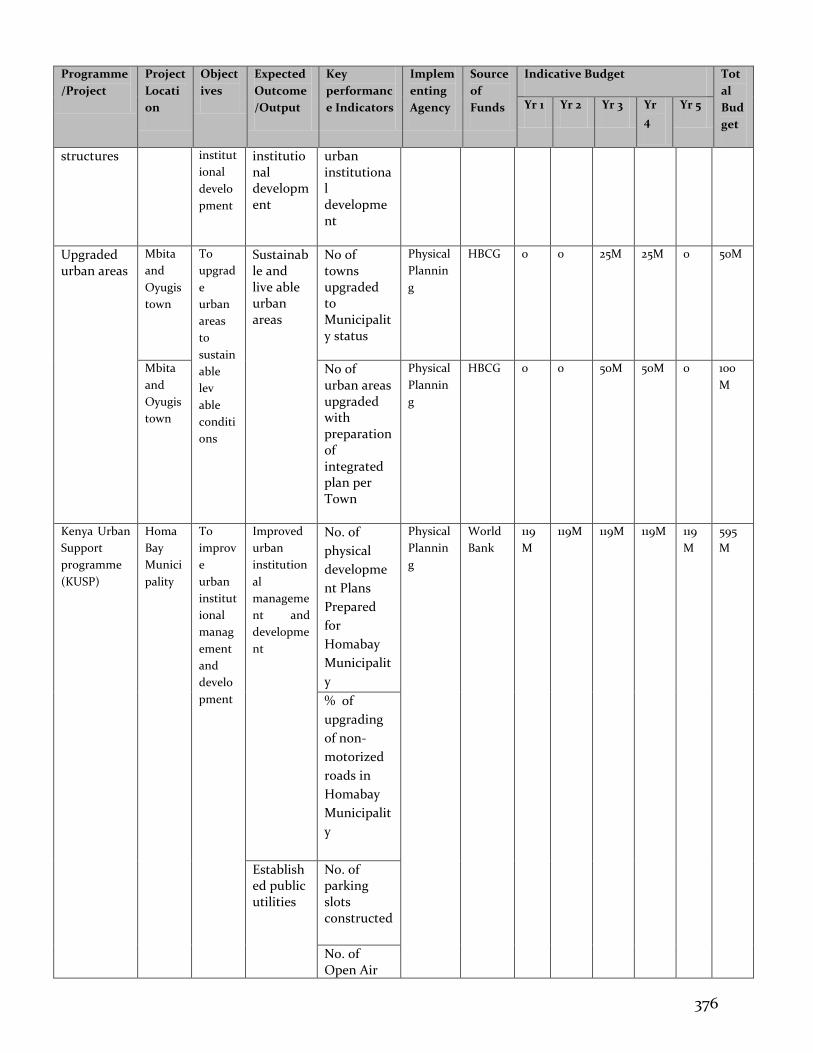
376
Programme
/Project
Project
Locati
on
Object
ives
Expected
Outcome
/Output
Key
performanc
e Indicators
Implem
enting
Agency
Source
of
Funds
Indicative Budget Tot
al
Bud
get
Yr 1 Yr 2 Yr 3 Yr
4
Yr 5
structures
institut
ional
develo
pment
institutional development
urban institutional development
Upgraded urban areas
Mbita
and
Oyugis
town
To
upgrad
e
urban
areas
to
sustain
able
lev
able
conditi
ons
Sustainable and live able urban areas
No of towns upgraded to Municipality status
Physical
Plannin
g
HBCG 0 0 25M 25M 0 50M
Mbita
and
Oyugis
town
No of urban areas upgraded with preparation of integrated plan per Town
Physical
Plannin
g
HBCG 0 0 50M 50M 0 100
M
Kenya Urban
Support
programme
(KUSP)
Homa
Bay
Munici
pality
To
improv
e
urban
institut
ional
manag
ement
and
develo
pment
Improved
urban
institution
al
manageme
nt and
developme
nt
No. of
physical
developme
nt Plans
Prepared
for
Homabay
Municipalit
y
Physical
Plannin
g
World
Bank
119
M
119M 119M 119M 119
M
595
M
% of
upgrading
of non-
motorized
roads in
Homabay
Municipalit
y
Established public utilities
No. of parking slots constructed
No. of Open Air
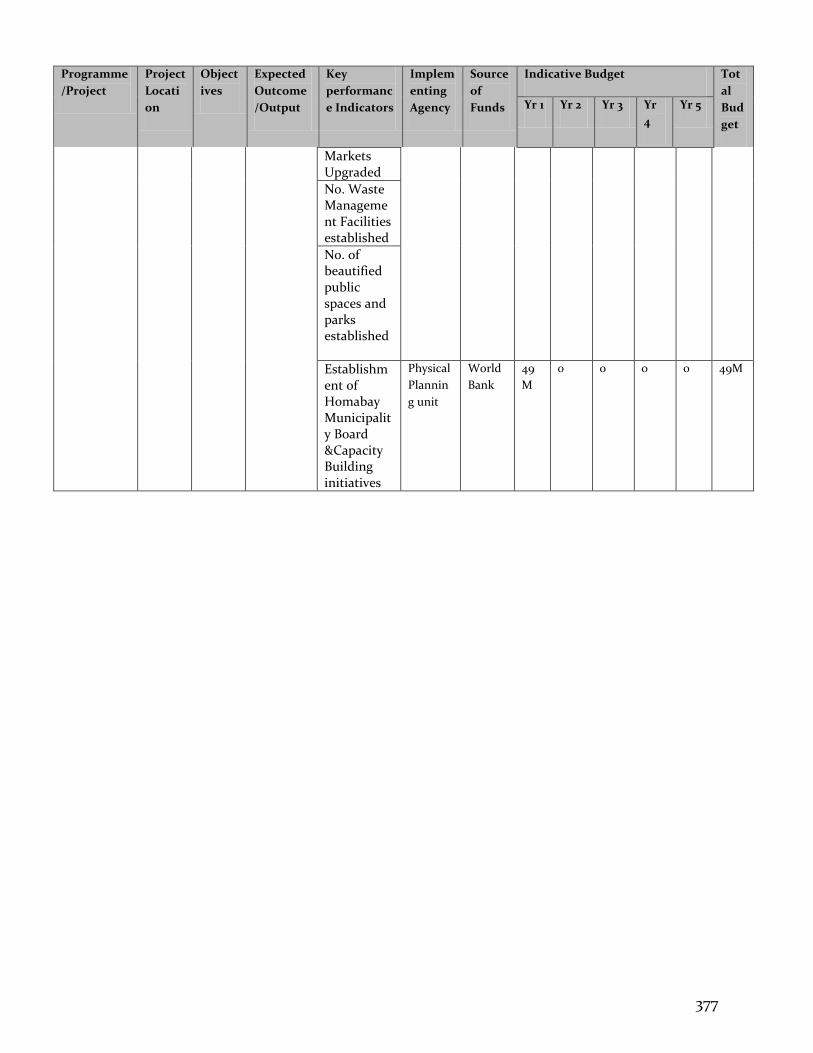
377
Programme
/Project
Project
Locati
on
Object
ives
Expected
Outcome
/Output
Key
performanc
e Indicators
Implem
enting
Agency
Source
of
Funds
Indicative Budget Tot
al
Bud
get
Yr 1 Yr 2 Yr 3 Yr
4
Yr 5
Markets Upgraded
No. Waste Management Facilities established
No. of beautified public spaces and parks established
Establishment of Homabay Municipality Board &Capacity Building initiatives
Physical
Plannin
g unit
World
Bank
49
M
0 0 0 0 49M
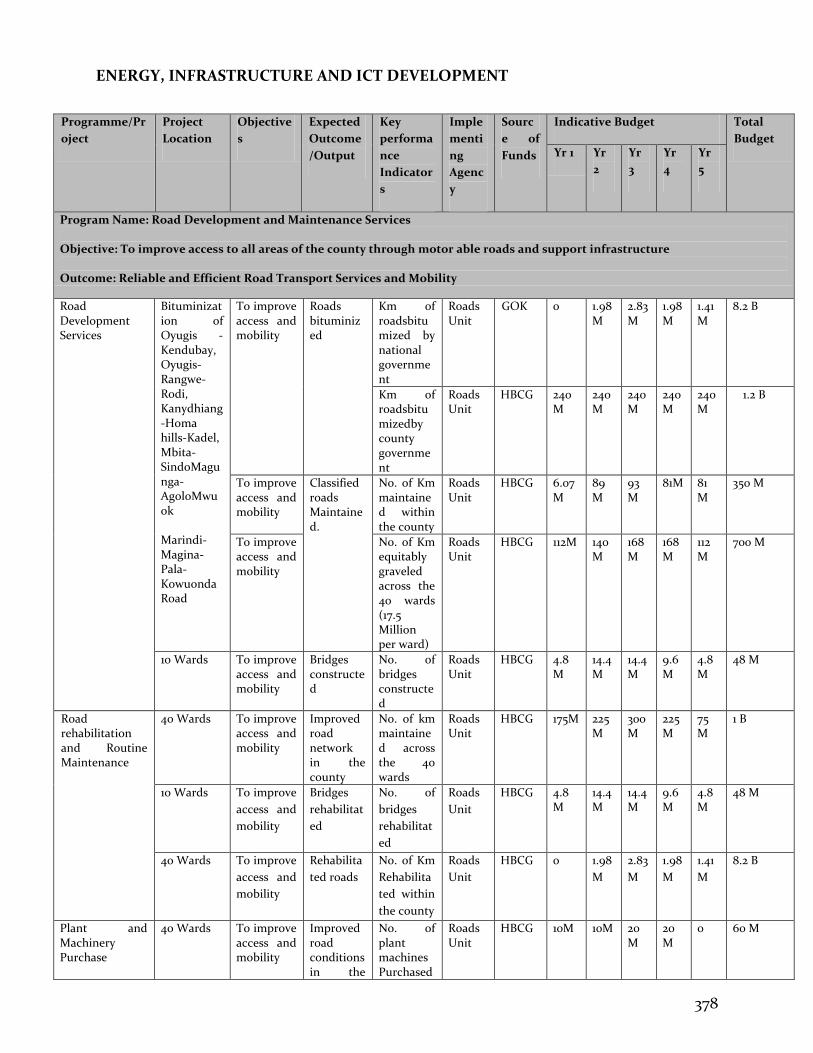
378
ENERGY, INFRASTRUCTURE AND ICT DEVELOPMENT
Programme/Pr
oject
Project
Location
Objective
s
Expected
Outcome
/Output
Key
performa
nce
Indicator
s
Imple
menti
ng
Agenc
y
Sourc
e of
Funds
Indicative Budget Total
Budget Yr 1 Yr
2
Yr
3
Yr
4
Yr
5
Program Name: Road Development and Maintenance Services Objective: To improve access to all areas of the county through motor able roads and support infrastructure Outcome: Reliable and Efficient Road Transport Services and Mobility
Road Development Services
Bituminization of Oyugis -Kendubay, Oyugis- Rangwe- Rodi, Kanydhiang-Homa hills-Kadel, Mbita-SindoMagunga-AgoloMwuok Marindi- Magina- Pala- Kowuonda Road
To improve access and mobility
Roads bituminized
Km of roadsbitumized by national government
Roads Unit
GOK 0 1.98M
2.83M
1.98M
1.41M
8.2 B
Km of roadsbitumizedby county government
Roads Unit
HBCG 240M
240M
240M
240M
240M
1.2 B
To improve access and mobility
Classified roads Maintained.
No. of Km maintained within the county
Roads Unit
HBCG 6.07M
89M
93M
81M 81 M
350 M
To improve access and mobility
No. of Km equitably graveled across the 40 wards (17.5 Million per ward)
Roads Unit
HBCG 112M 140M
168M
168M
112M
700 M
10 Wards To improve access and mobility
Bridges constructed
No. of bridges constructed
Roads Unit
HBCG 4.8M
14.4M
14.4M
9.6M
4.8M
48 M
Road rehabilitation and Routine Maintenance
40 Wards To improve access and mobility
Improved road network in the county
No. of km maintained across the 40 wards
Roads Unit
HBCG 175M 225M
300M
225M
75M
1 B
10 Wards To improve
access and
mobility
Bridges
rehabilitat
ed
No. of
bridges
rehabilitat
ed
Roads
Unit
HBCG 4.8M
14.4M
14.4M
9.6M
4.8M
48 M
40 Wards To improve
access and
mobility
Rehabilita
ted roads
No. of Km
Rehabilita
ted within
the county
Roads
Unit
HBCG 0 1.98
M
2.83
M
1.98
M
1.41
M
8.2 B
Plant and Machinery Purchase
40 Wards To improve access and mobility
Improved road conditions in the
No. of plant machines Purchased
Roads Unit
HBCG 10M 10M 20M
20M
0 60 M
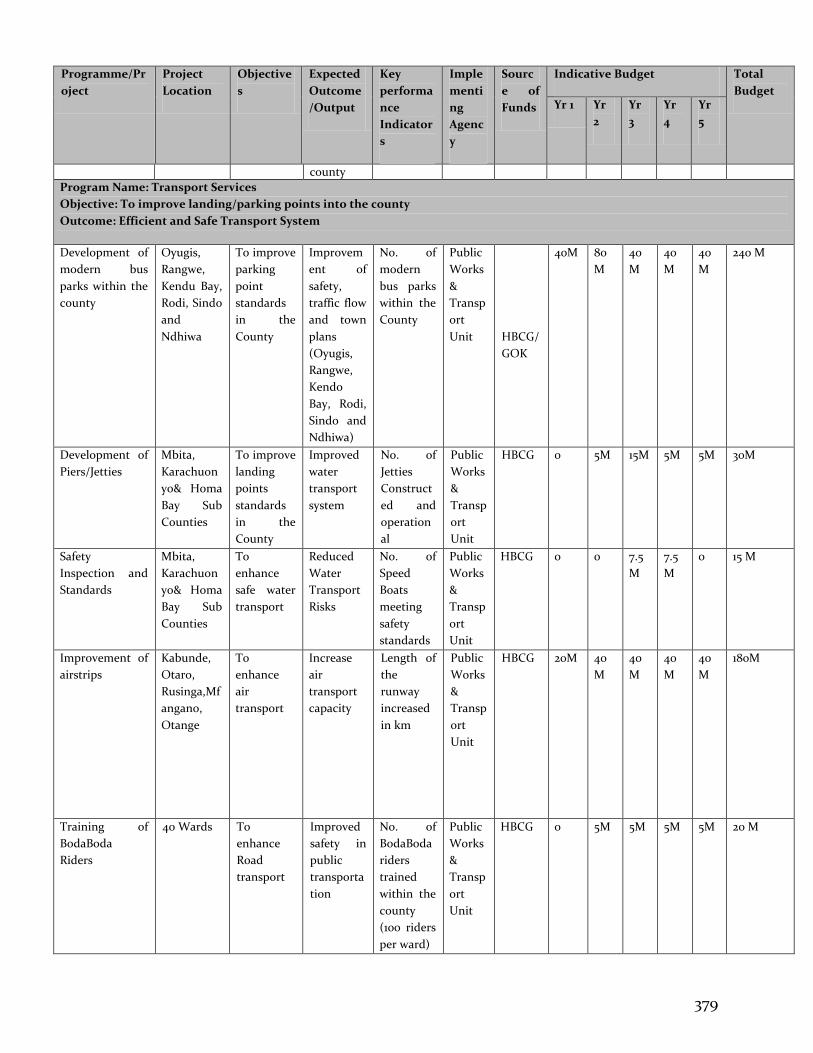
379
Programme/Pr
oject
Project
Location
Objective
s
Expected
Outcome
/Output
Key
performa
nce
Indicator
s
Imple
menti
ng
Agenc
y
Sourc
e of
Funds
Indicative Budget Total
Budget Yr 1 Yr
2
Yr
3
Yr
4
Yr
5
county
Program Name: Transport Services
Objective: To improve landing/parking points into the county
Outcome: Efficient and Safe Transport System
Development of
modern bus
parks within the
county
Oyugis,
Rangwe,
Kendu Bay,
Rodi, Sindo
and
Ndhiwa
To improve
parking
point
standards
in the
County
Improvem
ent of
safety,
traffic flow
and town
plans
(Oyugis,
Rangwe,
Kendo
Bay, Rodi,
Sindo and
Ndhiwa)
No. of
modern
bus parks
within the
County
Public
Works
&
Transp
ort
Unit HBCG/
GOK
40M 80
M
40
M
40
M
40
M
240 M
Development of
Piers/Jetties
Mbita,
Karachuon
yo& Homa
Bay Sub
Counties
To improve
landing
points
standards
in the
County
Improved
water
transport
system
No. of
Jetties
Construct
ed and
operation
al
Public
Works
&
Transp
ort
Unit
HBCG 0 5M 15M 5M 5M 30M
Safety
Inspection and
Standards
Mbita,
Karachuon
yo& Homa
Bay Sub
Counties
To
enhance
safe water
transport
Reduced
Water
Transport
Risks
No. of
Speed
Boats
meeting
safety
standards
Public
Works
&
Transp
ort
Unit
HBCG 0 0 7.5
M
7.5
M
0 15 M
Improvement of
airstrips
Kabunde,
Otaro,
Rusinga,Mf
angano,
Otange
To
enhance
air
transport
Increase
air
transport
capacity
Length of
the
runway
increased
in km
Public
Works
&
Transp
ort
Unit
HBCG 20M 40
M
40
M
40
M
40
M
180M
Training of
BodaBoda
Riders
40 Wards To
enhance
Road
transport
Improved
safety in
public
transporta
tion
No. of
BodaBoda
riders
trained
within the
county
(100 riders
per ward)
Public
Works
&
Transp
ort
Unit
HBCG 0 5M 5M 5M 5M 20 M
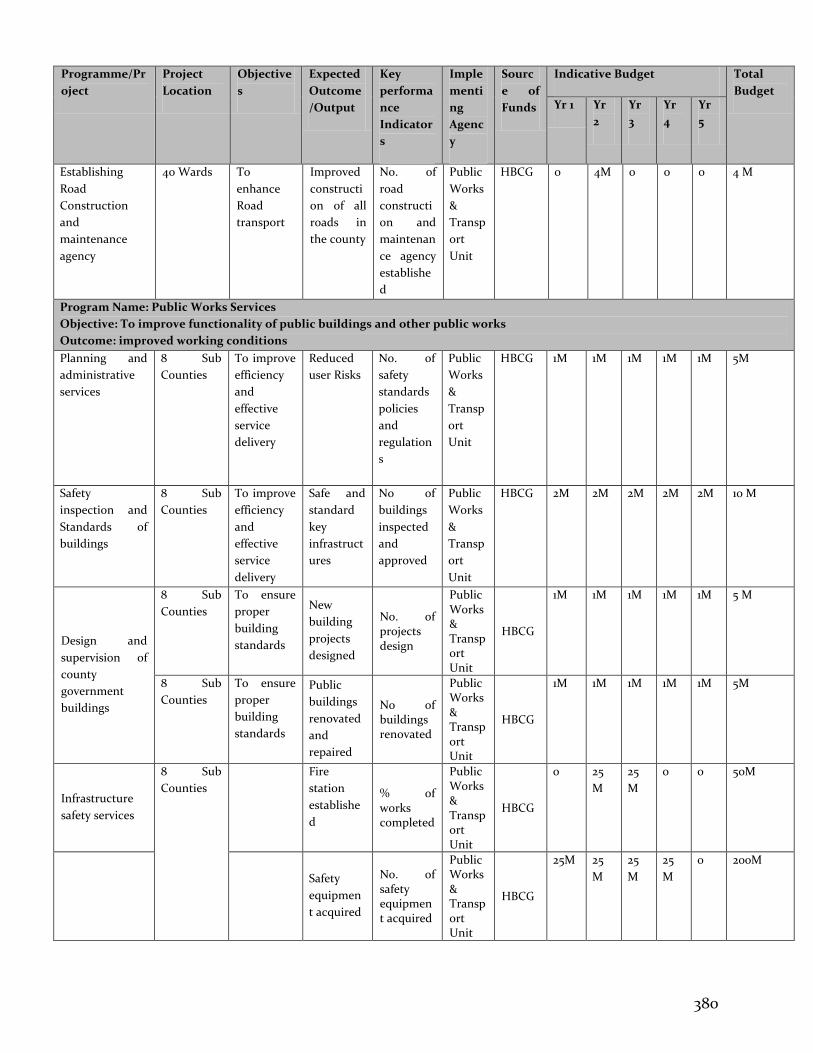
380
Programme/Pr
oject
Project
Location
Objective
s
Expected
Outcome
/Output
Key
performa
nce
Indicator
s
Imple
menti
ng
Agenc
y
Sourc
e of
Funds
Indicative Budget Total
Budget Yr 1 Yr
2
Yr
3
Yr
4
Yr
5
Establishing
Road
Construction
and
maintenance
agency
40 Wards To
enhance
Road
transport
Improved
constructi
on of all
roads in
the county
No. of
road
constructi
on and
maintenan
ce agency
establishe
d
Public
Works
&
Transp
ort
Unit
HBCG 0 4M 0 0 0 4 M
Program Name: Public Works Services
Objective: To improve functionality of public buildings and other public works
Outcome: improved working conditions
Planning and
administrative
services
8 Sub
Counties
To improve
efficiency
and
effective
service
delivery
Reduced
user Risks
No. of
safety
standards
policies
and
regulation
s
Public
Works
&
Transp
ort
Unit
HBCG 1M 1M 1M 1M 1M 5M
Safety
inspection and
Standards of
buildings
8 Sub
Counties
To improve
efficiency
and
effective
service
delivery
Safe and
standard
key
infrastruct
ures
No of
buildings
inspected
and
approved
Public
Works
&
Transp
ort
Unit
HBCG 2M 2M 2M 2M 2M 10 M
Design and
supervision of
county
government
buildings
8 Sub
Counties
To ensure
proper
building
standards
New
building
projects
designed
No. of projects design
Public Works & Transport Unit
HBCG
1M 1M 1M 1M 1M 5 M
8 Sub
Counties
To ensure
proper
building
standards
Public
buildings
renovated
and
repaired
No of buildings renovated
Public Works & Transport Unit
HBCG
1M 1M 1M 1M 1M 5M
Infrastructure
safety services
8 Sub
Counties
Fire
station
establishe
d
% of works completed
Public Works & Transport Unit
HBCG
0 25
M
25
M
0 0 50M
Safety
equipmen
t acquired
No. of safety equipment acquired
Public Works & Transport Unit
HBCG
25M 25
M
25
M
25
M
0 200M
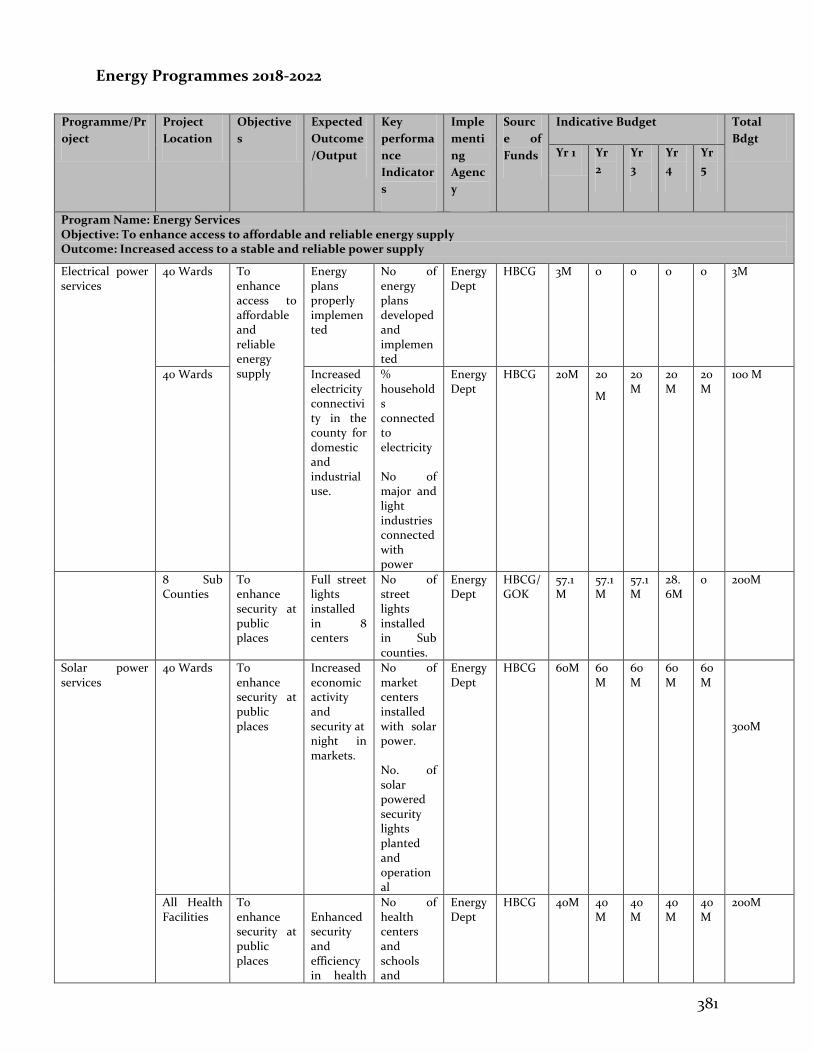
381
Energy Programmes 2018-2022
Programme/Pr
oject
Project
Location
Objective
s
Expected
Outcome
/Output
Key
performa
nce
Indicator
s
Imple
menti
ng
Agenc
y
Sourc
e of
Funds
Indicative Budget Total
Bdgt Yr 1 Yr
2
Yr
3
Yr
4
Yr
5
Program Name: Energy Services Objective: To enhance access to affordable and reliable energy supply Outcome: Increased access to a stable and reliable power supply
Electrical power services
40 Wards To enhance access to affordable and reliable energy supply
Energy plans properly implemented
No of energy plans developed and implemented
Energy Dept
HBCG 3M 0 0 0 0 3M
40 Wards Increased electricity connectivity in the county for domestic and industrial use.
% households connected to electricity No of major and light industries connected with power
Energy Dept
HBCG 20M 20
M
20M
20M
20M
100 M
8 Sub Counties
To enhance security at public places
Full street lights installed in 8 centers
No of street lights installed in Sub counties.
Energy Dept
HBCG/GOK
57.1M
57.1M
57.1M
28.6M
0 200M
Solar power services
40 Wards To enhance security at public places
Increased economic activity and security at night in markets.
No of market centers installed with solar power. No. of solar powered security lights planted and operational
Energy Dept
HBCG 60M 60M
60M
60M
60M
300M
All Health Facilities
To enhance security at public places
Enhanced security and efficiency in health
No of health centers and schools and
Energy Dept
HBCG 40M 40M
40M
40M
40M
200M
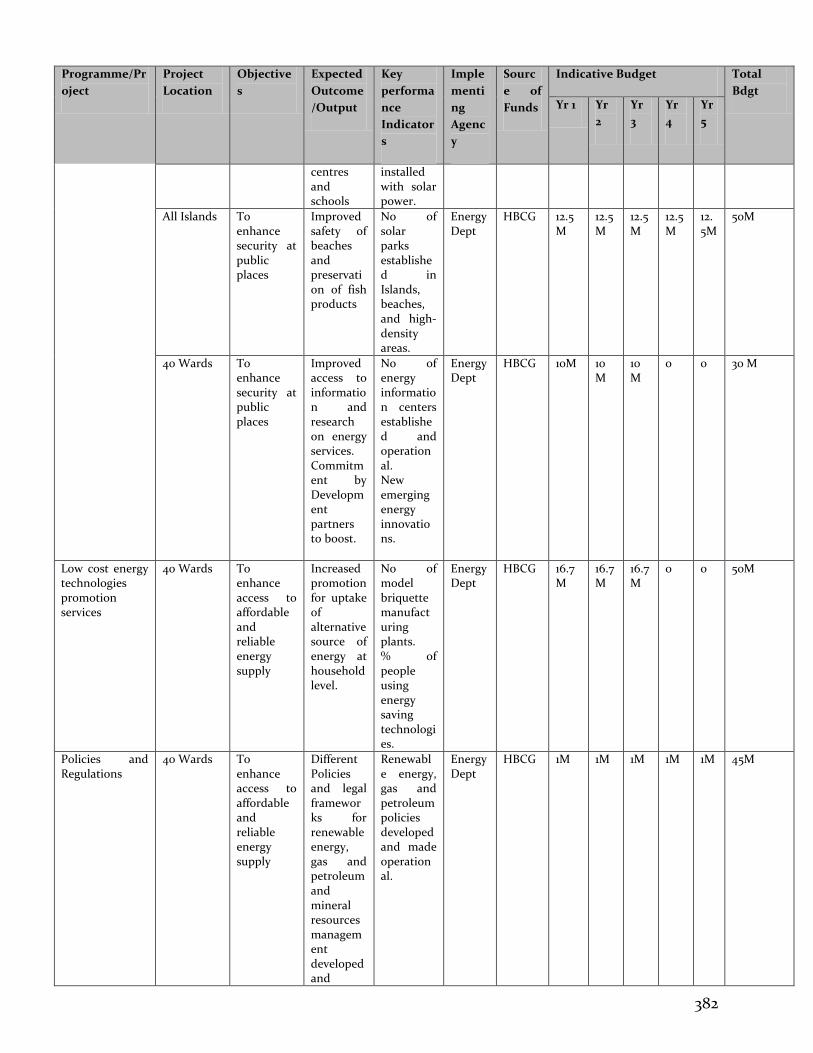
382
Programme/Pr
oject
Project
Location
Objective
s
Expected
Outcome
/Output
Key
performa
nce
Indicator
s
Imple
menti
ng
Agenc
y
Sourc
e of
Funds
Indicative Budget Total
Bdgt Yr 1 Yr
2
Yr
3
Yr
4
Yr
5
centres and schools
installed with solar power.
All Islands To enhance security at public places
Improved safety of beaches and preservation of fish products
No of solar parks established in Islands, beaches, and high-density areas.
Energy Dept
HBCG 12.5M
12.5M
12.5M
12.5M
12.5M
50M
40 Wards To enhance security at public places
Improved access to information and research on energy services. Commitment by Development partners to boost.
No of energy information centers established and operational. New emerging energy innovations.
Energy Dept
HBCG 10M 10M
10M
0 0 30 M
Low cost energy technologies promotion services
40 Wards To enhance access to affordable and reliable energy supply
Increased promotion for uptake of alternative source of energy at household level.
No of model briquette manufacturing plants. % of people using energy saving technologies.
Energy Dept
HBCG 16.7M
16.7M
16.7M
0 0 50M
Policies and Regulations
40 Wards To enhance access to affordable and reliable energy supply
Different Policies and legal frameworks for renewable energy, gas and petroleum and mineral resources management developed and
Renewable energy, gas and petroleum policies developed and made operational.
Energy Dept
HBCG 1M 1M 1M 1M 1M 45M
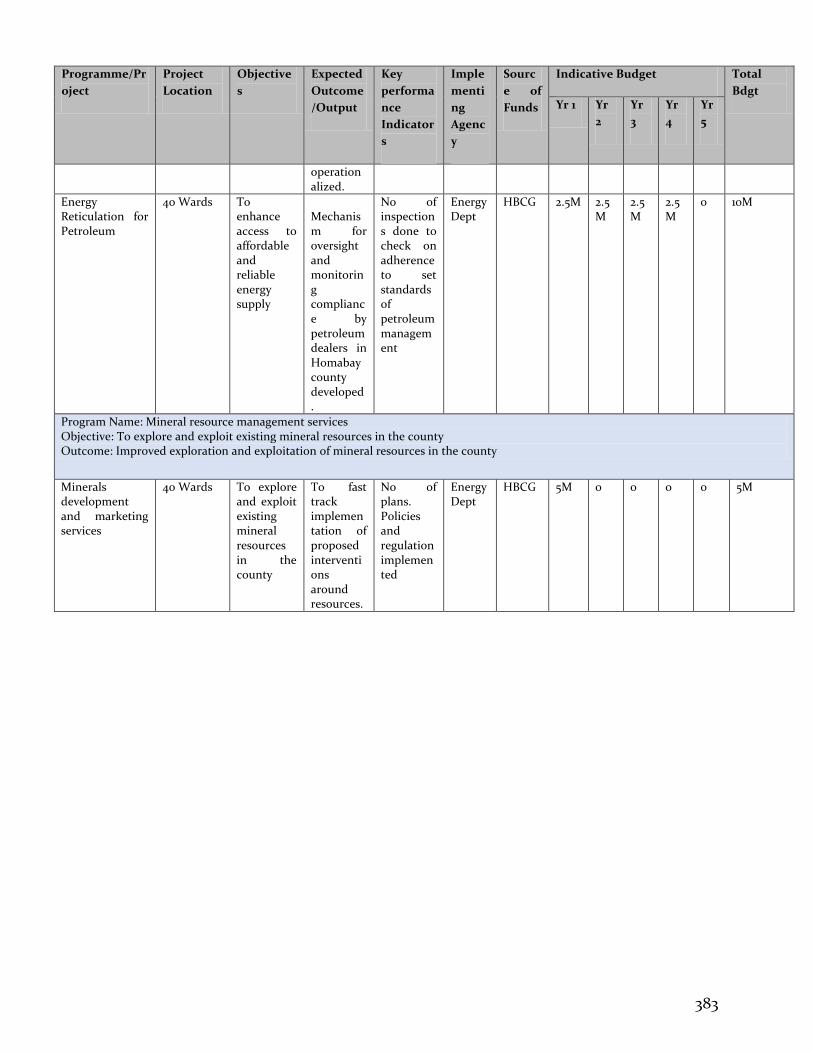
383
Programme/Pr
oject
Project
Location
Objective
s
Expected
Outcome
/Output
Key
performa
nce
Indicator
s
Imple
menti
ng
Agenc
y
Sourc
e of
Funds
Indicative Budget Total
Bdgt Yr 1 Yr
2
Yr
3
Yr
4
Yr
5
operationalized.
Energy Reticulation for Petroleum
40 Wards To enhance access to affordable and reliable energy supply
Mechanism for oversight and monitoring compliance by petroleum dealers in Homabay county developed.
No of inspections done to check on adherence to set standards of petroleum management
Energy Dept
HBCG 2.5M 2.5M
2.5M
2.5M
0 10M
Program Name: Mineral resource management services Objective: To explore and exploit existing mineral resources in the county Outcome: Improved exploration and exploitation of mineral resources in the county
Minerals development and marketing services
40 Wards To explore and exploit existing mineral resources in the county
To fast track implementation of proposed interventions around resources.
No of plans. Policies and regulation implemented
Energy Dept
HBCG 5M 0 0 0 0 5M
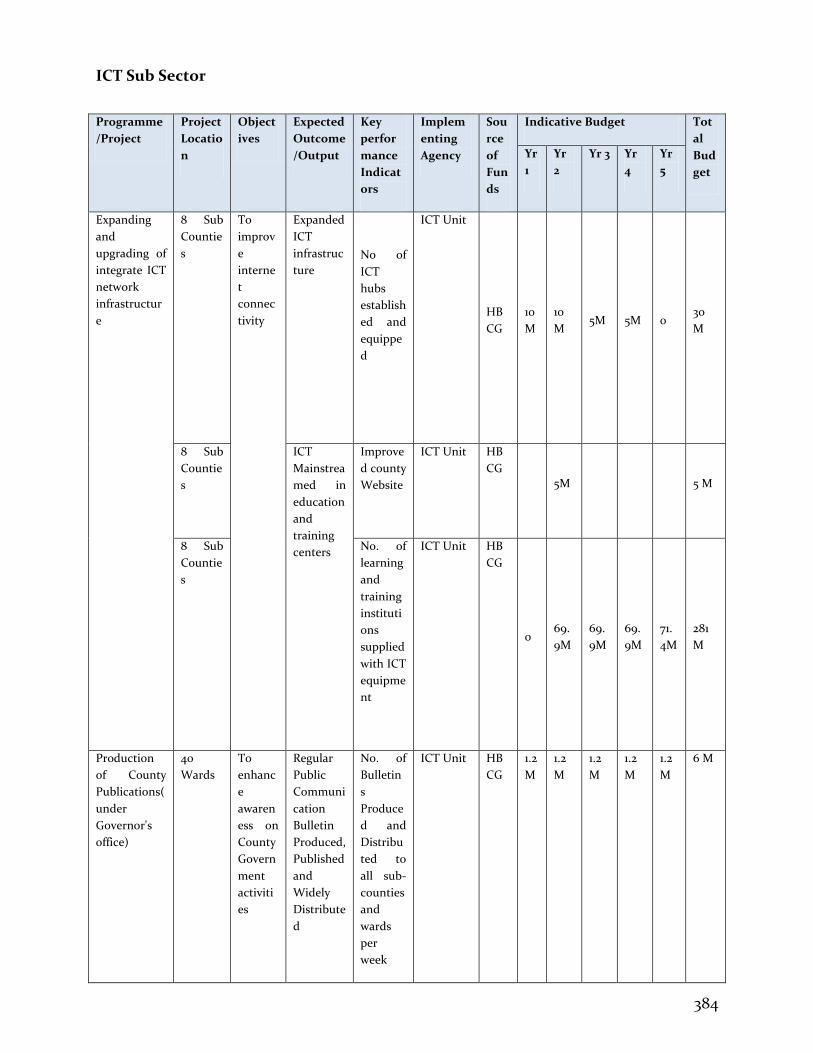
384
ICT Sub Sector
Programme
/Project
Project
Locatio
n
Object
ives
Expected
Outcome
/Output
Key
perfor
mance
Indicat
ors
Implem
enting
Agency
Sou
rce
of
Fun
ds
Indicative Budget Tot
al
Bud
get
Yr
1
Yr
2
Yr 3 Yr
4
Yr
5
Expanding
and
upgrading of
integrate ICT
network
infrastructur
e
8 Sub
Countie
s
To
improv
e
interne
t
connec
tivity
Expanded
ICT
infrastruc
ture
No of
ICT
hubs
establish
ed and
equippe
d
ICT Unit
HB
CG
10
M
10
M 5M 5M 0
30
M
8 Sub
Countie
s
ICT
Mainstrea
med in
education
and
training
centers
Improve
d county
Website
ICT Unit HB
CG
5M 5 M
8 Sub
Countie
s
No. of
learning
and
training
instituti
ons
supplied
with ICT
equipme
nt
ICT Unit HB
CG
0 69.
9M
69.
9M
69.
9M
71.
4M
281
M
Production
of County
Publications(
under
Governor's
office)
40
Wards
To
enhanc
e
awaren
ess on
County
Govern
ment
activiti
es
Regular
Public
Communi
cation
Bulletin
Produced,
Published
and
Widely
Distribute
d
No. of
Bulletin
s
Produce
d and
Distribu
ted to
all sub-
counties
and
wards
per
week
ICT Unit HB
CG
1.2
M
1.2
M
1.2
M
1.2
M
1.2
M
6 M
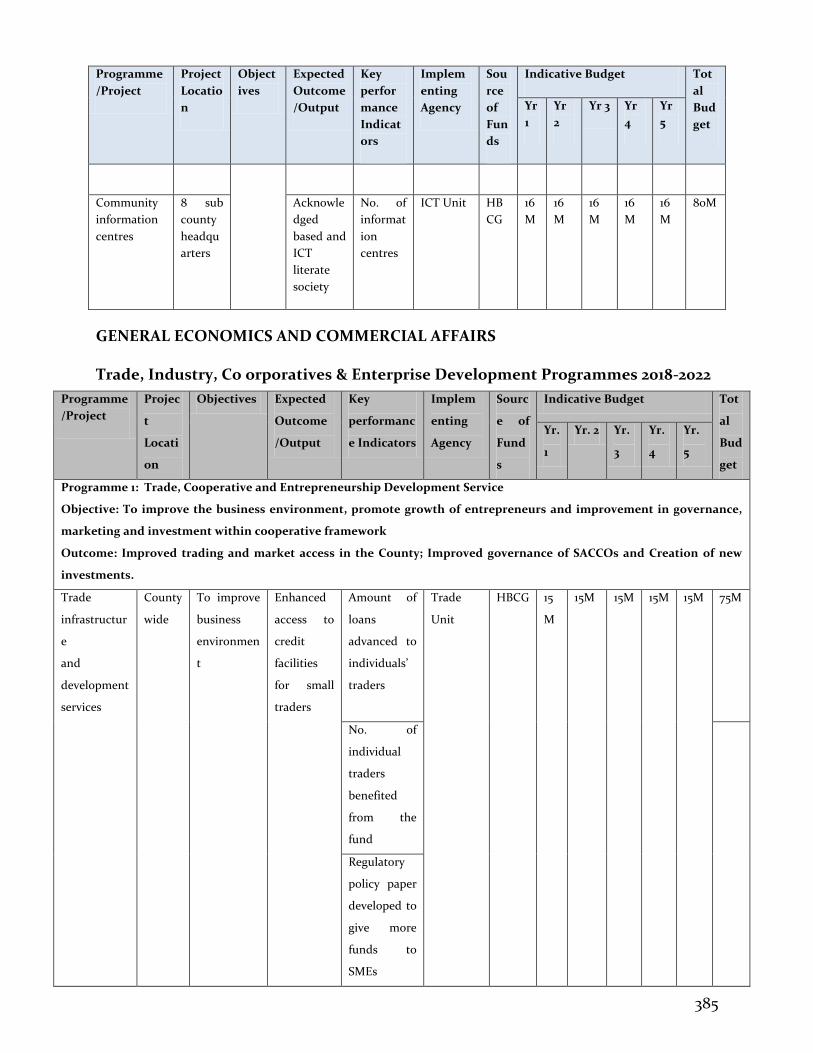
385
Programme
/Project
Project
Locatio
n
Object
ives
Expected
Outcome
/Output
Key
perfor
mance
Indicat
ors
Implem
enting
Agency
Sou
rce
of
Fun
ds
Indicative Budget Tot
al
Bud
get
Yr
1
Yr
2
Yr 3 Yr
4
Yr
5
Community
information
centres
8 sub
county
headqu
arters
Acknowle
dged
based and
ICT
literate
society
No. of
informat
ion
centres
ICT Unit HB
CG
16
M
16
M
16
M
16
M
16
M
80M
GENERAL ECONOMICS AND COMMERCIAL AFFAIRS
Trade, Industry, Co orporatives & Enterprise Development Programmes 2018-2022
Programme
/Project
Projec
t
Locati
on
Objectives Expected
Outcome
/Output
Key
performanc
e Indicators
Implem
enting
Agency
Sourc
e of
Fund
s
Indicative Budget Tot
al
Bud
get
Yr.
1
Yr. 2 Yr.
3
Yr.
4
Yr.
5
Programme 1: Trade, Cooperative and Entrepreneurship Development Service
Objective: To improve the business environment, promote growth of entrepreneurs and improvement in governance,
marketing and investment within cooperative framework
Outcome: Improved trading and market access in the County; Improved governance of SACCOs and Creation of new
investments.
Trade
infrastructur
e
and
development
services
County
wide
To improve
business
environmen
t
Enhanced
access to
credit
facilities
for small
traders
Amount of
loans
advanced to
individuals’
traders
Trade
Unit
HBCG 15
M
15M 15M 15M 15M 75M
No. of
individual
traders
benefited
from the
fund
Regulatory
policy paper
developed to
give more
funds to
SMEs
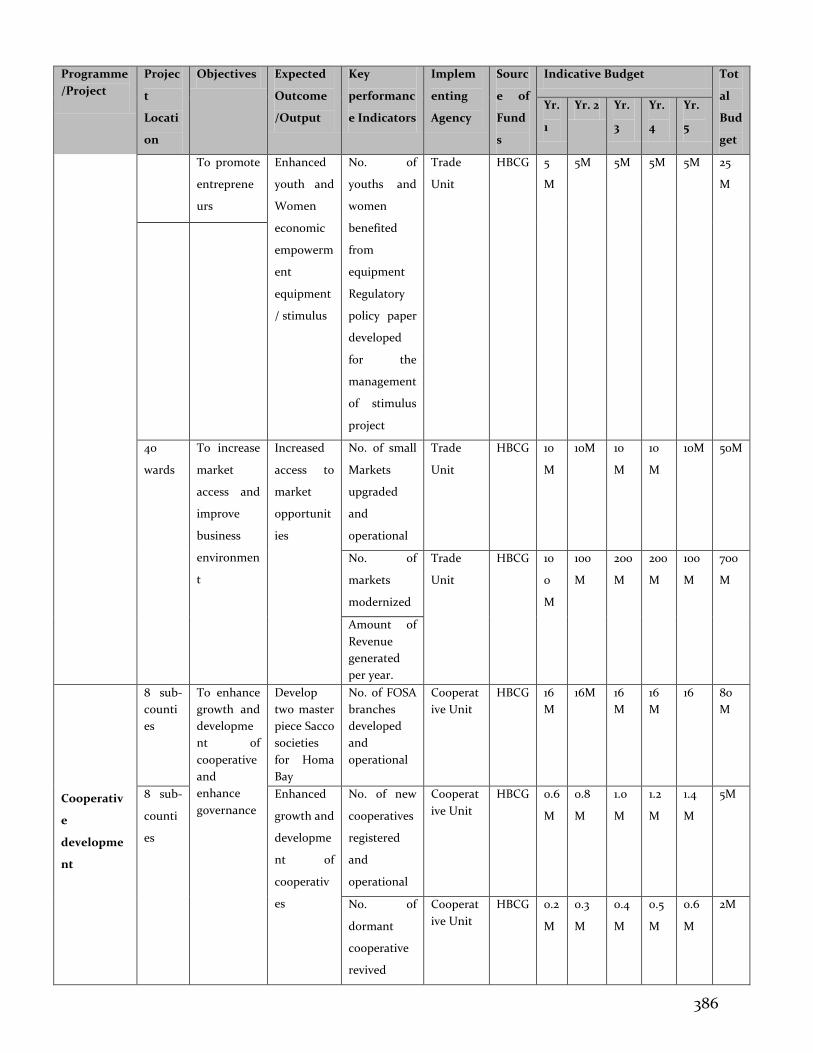
386
Programme
/Project
Projec
t
Locati
on
Objectives Expected
Outcome
/Output
Key
performanc
e Indicators
Implem
enting
Agency
Sourc
e of
Fund
s
Indicative Budget Tot
al
Bud
get
Yr.
1
Yr. 2 Yr.
3
Yr.
4
Yr.
5
To promote
entreprene
urs
Enhanced
youth and
Women
economic
empowerm
ent
equipment
/ stimulus
No. of
youths and
women
benefited
from
equipment
Regulatory
policy paper
developed
for the
management
of stimulus
project
Trade
Unit
HBCG 5
M
5M 5M 5M 5M 25
M
40
wards
To increase
market
access and
improve
business
environmen
t
Increased
access to
market
opportunit
ies
No. of small
Markets
upgraded
and
operational
Trade
Unit
HBCG 10
M
10M 10
M
10
M
10M 50M
No. of
markets
modernized
Trade
Unit
HBCG 10
0
M
100
M
200
M
200
M
100
M
700
M
Amount of
Revenue
generated
per year.
Cooperativ
e
developme
nt
8 sub-
counti
es
To enhance
growth and
developme
nt of
cooperative
and
enhance
governance
Develop
two master
piece Sacco
societies
for Homa
Bay
No. of FOSA
branches
developed
and
operational
Cooperat
ive Unit
HBCG 16
M
16M 16
M
16
M
16 80
M
8 sub-
counti
es
Enhanced
growth and
developme
nt of
cooperativ
es
No. of new
cooperatives
registered
and
operational
Cooperat
ive Unit
HBCG 0.6
M
0.8
M
1.0
M
1.2
M
1.4
M
5M
No. of
dormant
cooperative
revived
Cooperat
ive Unit
HBCG 0.2
M
0.3
M
0.4
M
0.5
M
0.6
M
2M
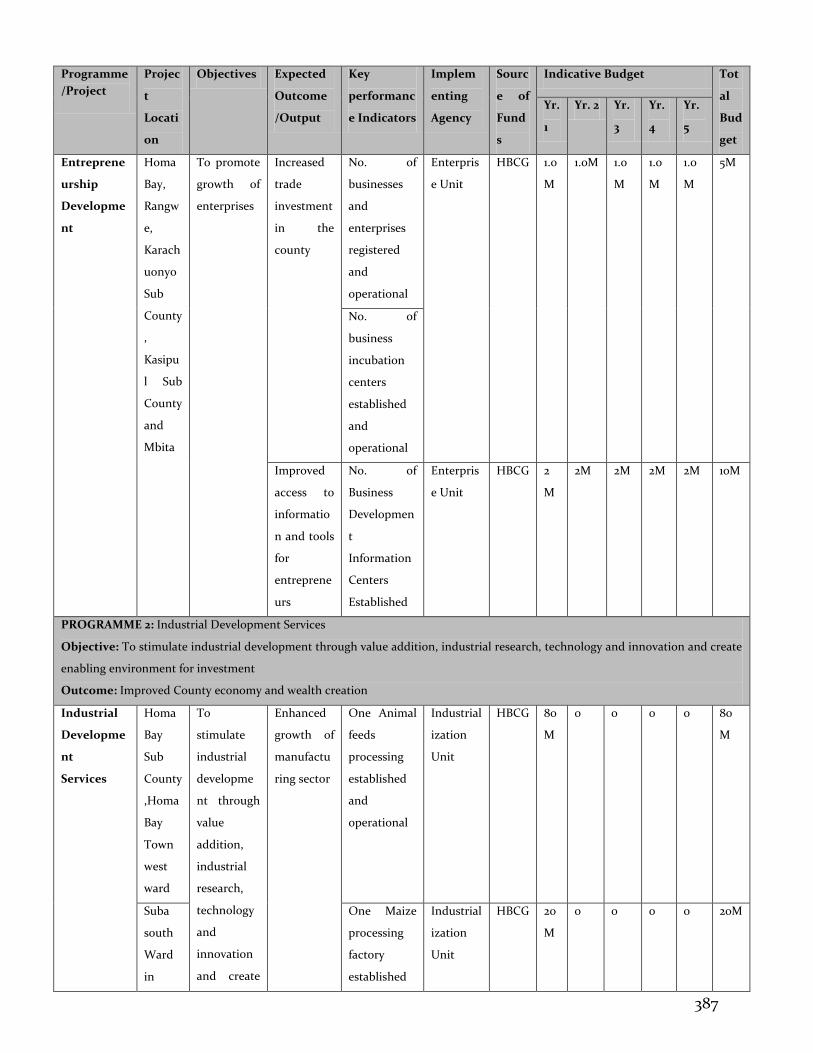
387
Programme
/Project
Projec
t
Locati
on
Objectives Expected
Outcome
/Output
Key
performanc
e Indicators
Implem
enting
Agency
Sourc
e of
Fund
s
Indicative Budget Tot
al
Bud
get
Yr.
1
Yr. 2 Yr.
3
Yr.
4
Yr.
5
Entreprene
urship
Developme
nt
Homa
Bay,
Rangw
e,
Karach
uonyo
Sub
County
,
Kasipu
l Sub
County
and
Mbita
To promote
growth of
enterprises
Increased
trade
investment
in the
county
No. of
businesses
and
enterprises
registered
and
operational
Enterpris
e Unit
HBCG 1.0
M
1.0M 1.0
M
1.0
M
1.0
M
5M
No. of
business
incubation
centers
established
and
operational
Improved
access to
informatio
n and tools
for
entreprene
urs
No. of
Business
Developmen
t
Information
Centers
Established
Enterpris
e Unit
HBCG 2
M
2M 2M 2M 2M 10M
PROGRAMME 2: Industrial Development Services
Objective: To stimulate industrial development through value addition, industrial research, technology and innovation and create
enabling environment for investment
Outcome: Improved County economy and wealth creation
Industrial
Developme
nt
Services
Homa
Bay
Sub
County
,Homa
Bay
Town
west
ward
To
stimulate
industrial
developme
nt through
value
addition,
industrial
research,
technology
and
innovation
and create
Enhanced
growth of
manufactu
ring sector
One Animal
feeds
processing
established
and
operational
Industrial
ization
Unit
HBCG 80
M
0 0 0 0 80
M
Suba
south
Ward
in
One Maize
processing
factory
established
Industrial
ization
Unit
HBCG 20
M
0 0 0 0 20M
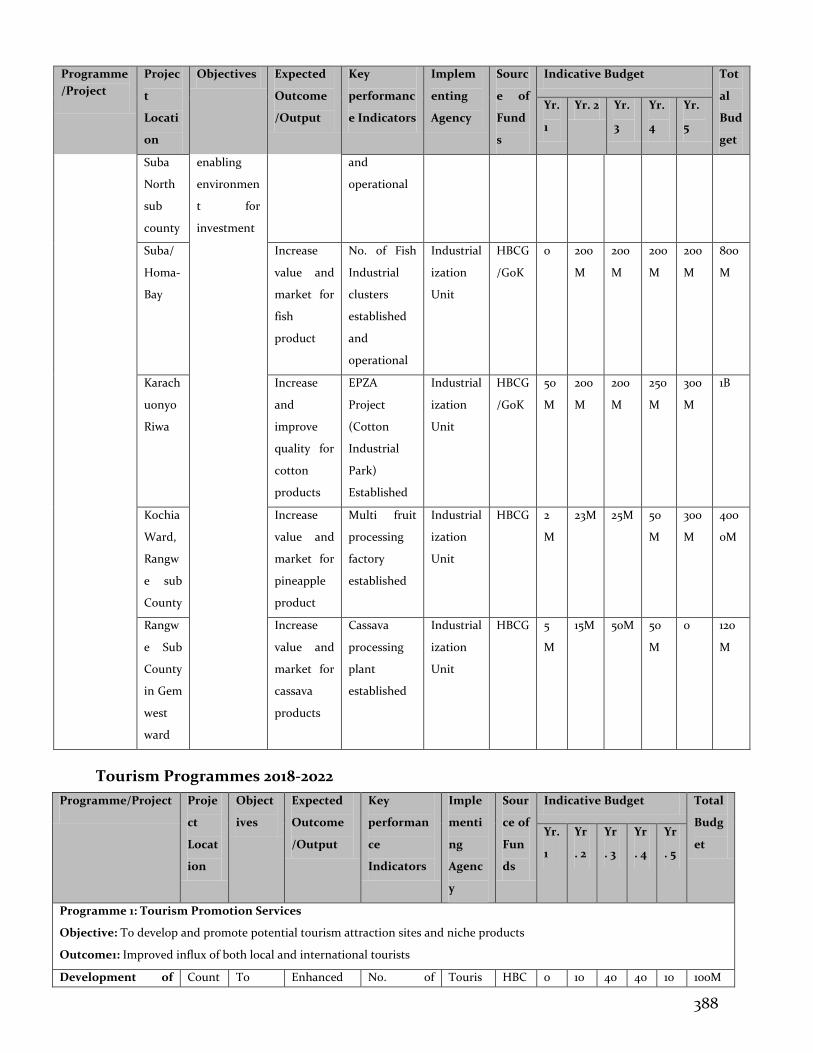
388
Programme
/Project
Projec
t
Locati
on
Objectives Expected
Outcome
/Output
Key
performanc
e Indicators
Implem
enting
Agency
Sourc
e of
Fund
s
Indicative Budget Tot
al
Bud
get
Yr.
1
Yr. 2 Yr.
3
Yr.
4
Yr.
5
Suba
North
sub
county
enabling
environmen
t for
investment
and
operational
Suba/
Homa-
Bay
Increase
value and
market for
fish
product
No. of Fish
Industrial
clusters
established
and
operational
Industrial
ization
Unit
HBCG
/GoK
0 200
M
200
M
200
M
200
M
800
M
Karach
uonyo
Riwa
Increase
and
improve
quality for
cotton
products
EPZA
Project
(Cotton
Industrial
Park)
Established
Industrial
ization
Unit
HBCG
/GoK
50
M
200
M
200
M
250
M
300
M
1B
Kochia
Ward,
Rangw
e sub
County
Increase
value and
market for
pineapple
product
Multi fruit
processing
factory
established
Industrial
ization
Unit
HBCG 2
M
23M 25M 50
M
300
M
400
0M
Rangw
e Sub
County
in Gem
west
ward
Increase
value and
market for
cassava
products
Cassava
processing
plant
established
Industrial
ization
Unit
HBCG 5
M
15M 50M 50
M
0 120
M
Tourism Programmes 2018-2022
Programme/Project Proje
ct
Locat
ion
Object
ives
Expected
Outcome
/Output
Key
performan
ce
Indicators
Imple
menti
ng
Agenc
y
Sour
ce of
Fun
ds
Indicative Budget Total
Budg
et Yr.
1
Yr
. 2
Yr
. 3
Yr
. 4
Yr
. 5
Programme 1: Tourism Promotion Services
Objective: To develop and promote potential tourism attraction sites and niche products
Outcome1: Improved influx of both local and international tourists
Development of Count To Enhanced No. of Touris HBC 0 10 40 40 10 100M
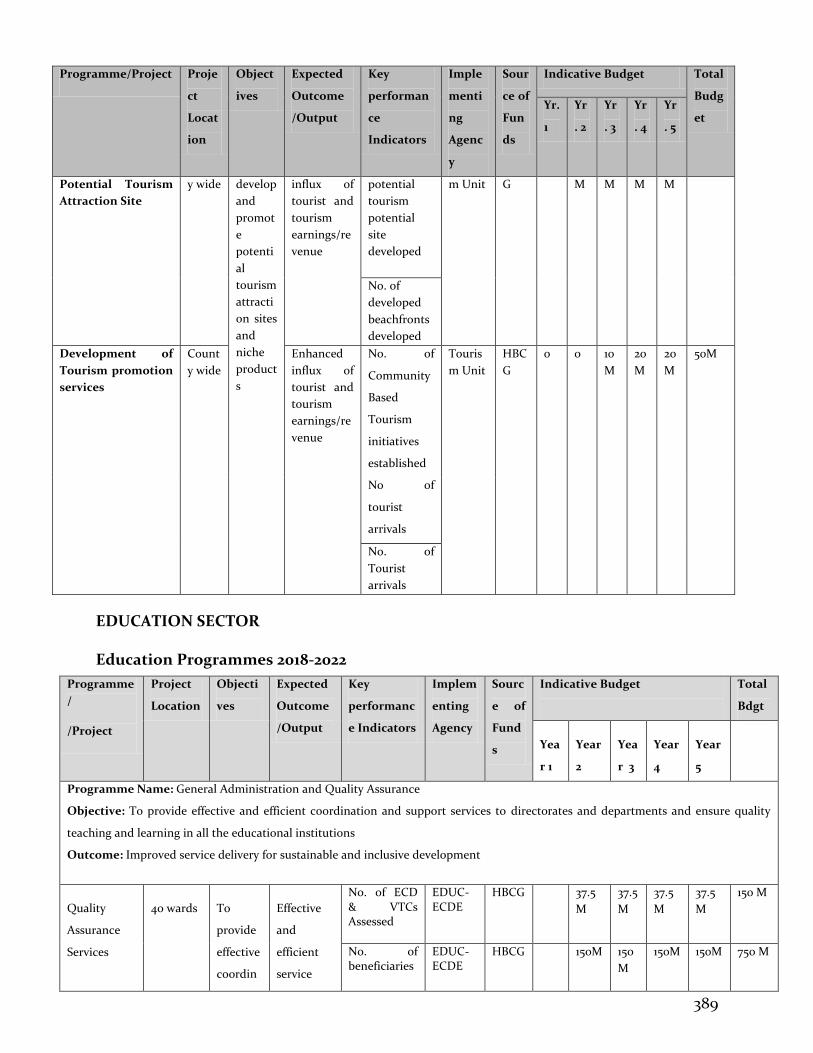
389
Programme/Project Proje
ct
Locat
ion
Object
ives
Expected
Outcome
/Output
Key
performan
ce
Indicators
Imple
menti
ng
Agenc
y
Sour
ce of
Fun
ds
Indicative Budget Total
Budg
et Yr.
1
Yr
. 2
Yr
. 3
Yr
. 4
Yr
. 5
Potential Tourism
Attraction Site
y wide develop
and
promot
e
potenti
al
tourism
attracti
on sites
and
niche
product
s
influx of
tourist and
tourism
earnings/re
venue
potential
tourism
potential
site
developed
m Unit G M M M M
No. of
developed
beachfronts
developed
Development of
Tourism promotion
services
Count
y wide
Enhanced
influx of
tourist and
tourism
earnings/re
venue
No. of
Community
Based
Tourism
initiatives
established
Touris
m Unit
HBC
G 0 0 10
M
20
M
20
M
50M
No of
tourist
arrivals
No. of
Tourist
arrivals
EDUCATION SECTOR
Education Programmes 2018-2022
Programme
/
/Project
Project
Location
Objecti
ves
Expected
Outcome
/Output
Key
performanc
e Indicators
Implem
enting
Agency
Sourc
e of
Fund
s
Indicative Budget
Total
Bdgt
Yea
r 1
Year
2
Yea
r 3
Year
4
Year
5
Programme Name: General Administration and Quality Assurance
Objective: To provide effective and efficient coordination and support services to directorates and departments and ensure quality
teaching and learning in all the educational institutions
Outcome: Improved service delivery for sustainable and inclusive development
Quality
Assurance
Services
40 wards To
provide
effective
coordin
Effective
and
efficient
service
No. of ECD & VTCs Assessed
EDUC-ECDE
HBCG 37.5
M
37.5
M
37.5
M
37.5
M
150 M
No. of beneficiaries
EDUC-ECDE
HBCG 150M 150
M
150M 150M 750 M
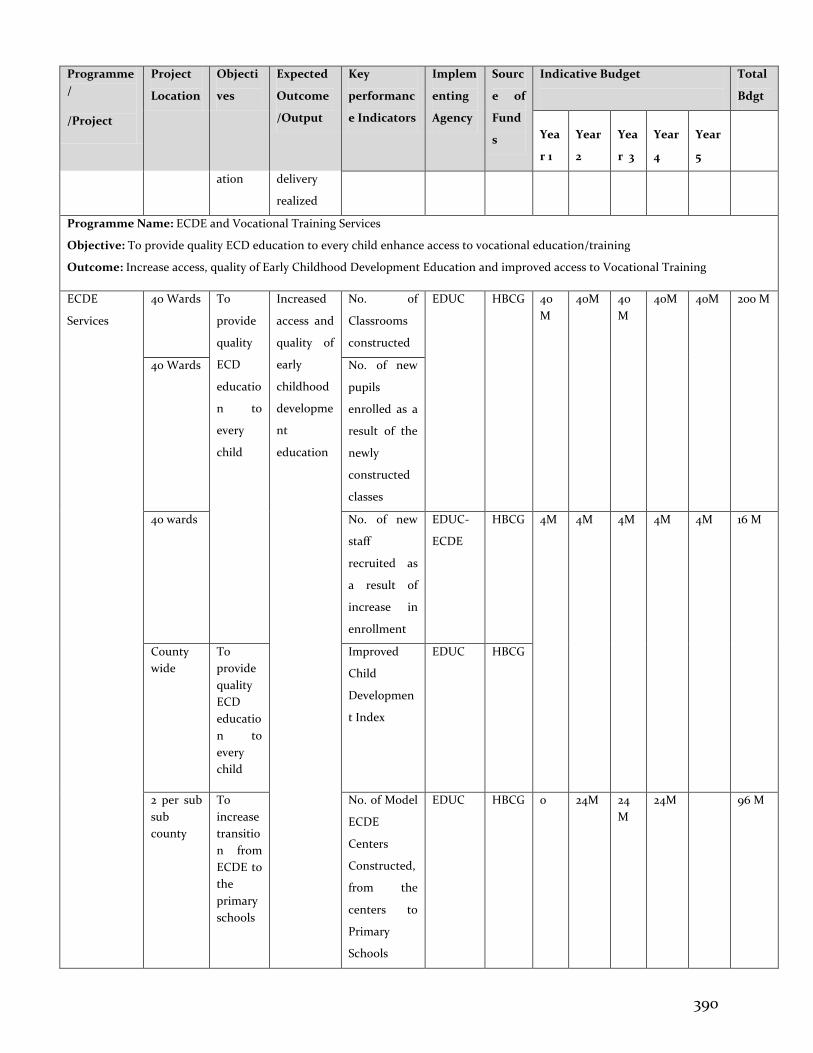
390
Programme
/
/Project
Project
Location
Objecti
ves
Expected
Outcome
/Output
Key
performanc
e Indicators
Implem
enting
Agency
Sourc
e of
Fund
s
Indicative Budget
Total
Bdgt
Yea
r 1
Year
2
Yea
r 3
Year
4
Year
5
ation delivery
realized
Programme Name: ECDE and Vocational Training Services
Objective: To provide quality ECD education to every child enhance access to vocational education/training
Outcome: Increase access, quality of Early Childhood Development Education and improved access to Vocational Training
ECDE
Services
40 Wards To
provide
quality
ECD
educatio
n to
every
child
Increased
access and
quality of
early
childhood
developme
nt
education
No. of
Classrooms
constructed
EDUC HBCG 40
M
40M 40
M
40M 40M 200 M
40 Wards No. of new
pupils
enrolled as a
result of the
newly
constructed
classes
40 wards No. of new
staff
recruited as
a result of
increase in
enrollment
EDUC-
ECDE
HBCG 4M 4M 4M 4M 4M 16 M
County
wide
To
provide
quality
ECD
educatio
n to
every
child
Improved
Child
Developmen
t Index
EDUC HBCG
2 per sub
sub
county
To
increase
transitio
n from
ECDE to
the
primary
schools
No. of Model
ECDE
Centers
Constructed,
from the
centers to
Primary
Schools
EDUC HBCG 0 24M 24
M
24M 96 M
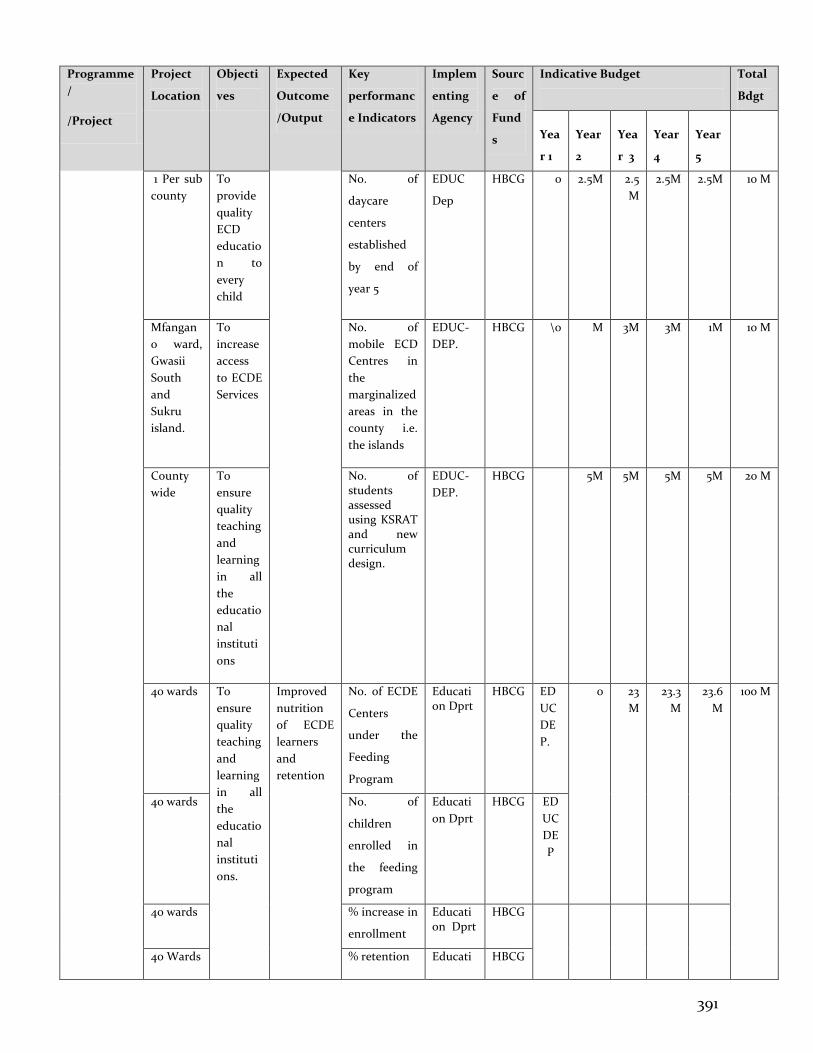
391
Programme
/
/Project
Project
Location
Objecti
ves
Expected
Outcome
/Output
Key
performanc
e Indicators
Implem
enting
Agency
Sourc
e of
Fund
s
Indicative Budget
Total
Bdgt
Yea
r 1
Year
2
Yea
r 3
Year
4
Year
5
1 Per sub
county
To
provide
quality
ECD
educatio
n to
every
child
No. of
daycare
centers
established
by end of
year 5
EDUC
Dep
HBCG 0 2.5M 2.5
M
2.5M 2.5M 10 M
Mfangan
o ward,
Gwasii
South
and
Sukru
island.
To
increase
access
to ECDE
Services
No. of
mobile ECD
Centres in
the
marginalized
areas in the
county i.e.
the islands
EDUC-
DEP.
HBCG \0 M 3M 3M 1M 10 M
County
wide
To
ensure
quality
teaching
and
learning
in all
the
educatio
nal
instituti
ons
No. of students assessed using KSRAT and new curriculum design.
EDUC-
DEP.
HBCG 5M 5M 5M 5M 20 M
40 wards To
ensure
quality
teaching
and
learning
in all
the
educatio
nal
instituti
ons.
Improved
nutrition
of ECDE
learners
and
retention
No. of ECDE
Centers
under the
Feeding
Program
Education Dprt
HBCG ED
UC
DE
P.
0 23
M
23.3
M
23.6
M
100 M
40 wards No. of
children
enrolled in
the feeding
program
Educati
on Dprt
HBCG ED
UC
DE
P
40 wards % increase in
enrollment
Education Dprt
HBCG
40 Wards % retention Educati HBCG
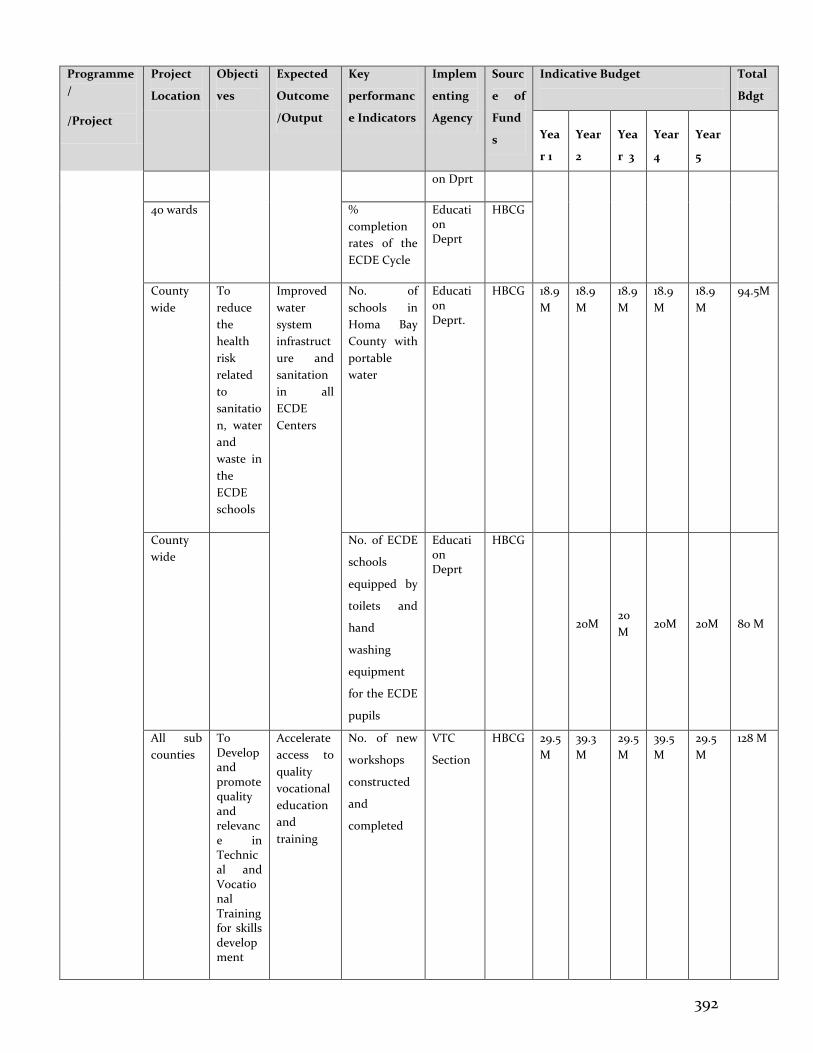
392
Programme
/
/Project
Project
Location
Objecti
ves
Expected
Outcome
/Output
Key
performanc
e Indicators
Implem
enting
Agency
Sourc
e of
Fund
s
Indicative Budget
Total
Bdgt
Yea
r 1
Year
2
Yea
r 3
Year
4
Year
5
on Dprt
40 wards %
completion
rates of the
ECDE Cycle
Education Deprt
HBCG
County
wide
To
reduce
the
health
risk
related
to
sanitatio
n, water
and
waste in
the
ECDE
schools
Improved
water
system
infrastruct
ure and
sanitation
in all
ECDE
Centers
No. of
schools in
Homa Bay
County with
portable
water
Education Deprt.
HBCG 18.9
M
18.9
M
18.9
M
18.9
M
18.9
M
94.5M
County
wide
No. of ECDE
schools
equipped by
toilets and
hand
washing
equipment
for the ECDE
pupils
Education Deprt
HBCG
20M 20
M 20M 20M 80 M
All sub
counties
To Develop and promote quality and relevance in Technical and Vocational Training for skills development
Accelerate
access to
quality
vocational
education
and
training
No. of new
workshops
constructed
and
completed
VTC
Section
HBCG 29.5
M
39.3
M
29.5
M
39.5
M
29.5
M
128 M
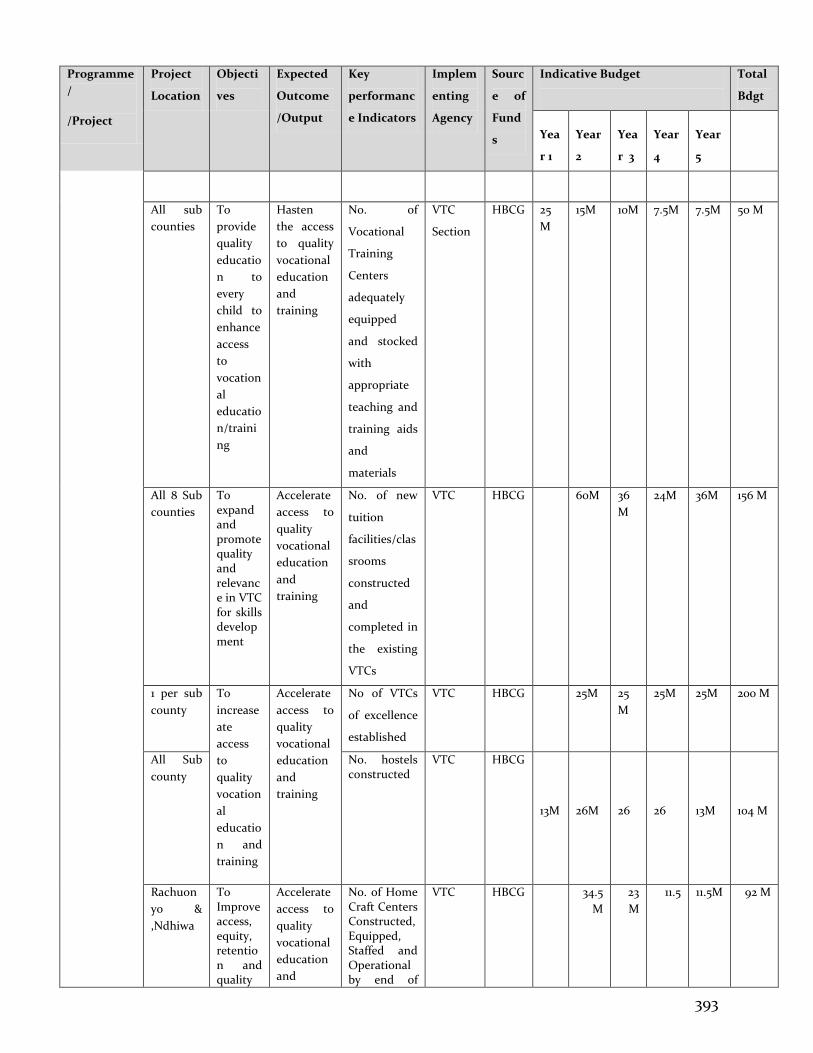
393
Programme
/
/Project
Project
Location
Objecti
ves
Expected
Outcome
/Output
Key
performanc
e Indicators
Implem
enting
Agency
Sourc
e of
Fund
s
Indicative Budget
Total
Bdgt
Yea
r 1
Year
2
Yea
r 3
Year
4
Year
5
All sub
counties
To
provide
quality
educatio
n to
every
child to
enhance
access
to
vocation
al
educatio
n/traini
ng
Hasten
the access
to quality
vocational
education
and
training
No. of
Vocational
Training
Centers
adequately
equipped
and stocked
with
appropriate
teaching and
training aids
and
materials
VTC
Section
HBCG 25
M
15M 10M 7.5M 7.5M 50 M
All 8 Sub
counties
To expand and promote quality and relevance in VTC for skills development
Accelerate
access to
quality
vocational
education
and
training
No. of new
tuition
facilities/clas
srooms
constructed
and
completed in
the existing
VTCs
VTC HBCG
60M 36
M
24M 36M 156 M
1 per sub
county
To
increase
ate
access
to
quality
vocation
al
educatio
n and
training
Accelerate
access to
quality
vocational
education
and
training
No of VTCs
of excellence
established
VTC HBCG 25M 25
M
25M 25M 200 M
All Sub
county
No. hostels constructed
VTC HBCG
13M 26M 26 26 13M 104 M
Rachuon
yo &
,Ndhiwa
To Improve access, equity, retention and quality
Accelerate
access to
quality
vocational
education
and
No. of Home Craft Centers Constructed, Equipped, Staffed and Operational by end of
VTC HBCG
34.5
M
23
M
11.5 11.5M 92 M
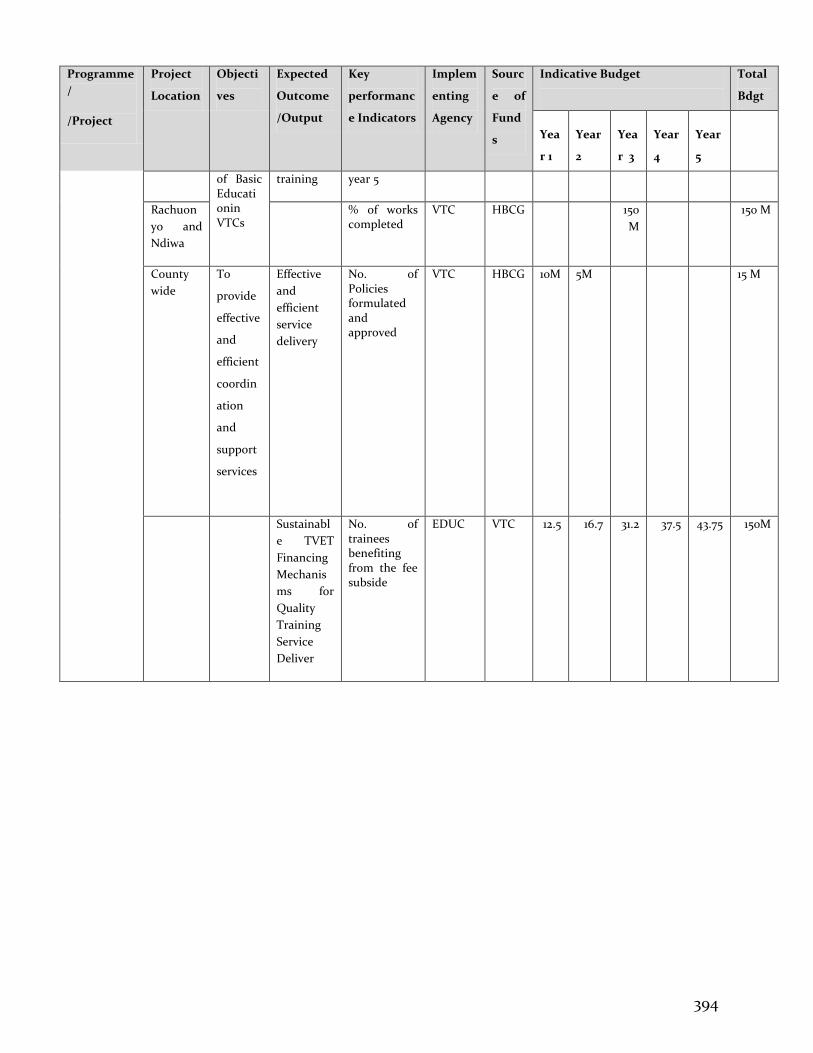
394
Programme
/
/Project
Project
Location
Objecti
ves
Expected
Outcome
/Output
Key
performanc
e Indicators
Implem
enting
Agency
Sourc
e of
Fund
s
Indicative Budget
Total
Bdgt
Yea
r 1
Year
2
Yea
r 3
Year
4
Year
5
of Basic Educationin VTCs
training year 5
Rachuon
yo and
Ndiwa
% of works completed
VTC HBCG
150
M
150 M
County
wide
To
provide
effective
and
efficient
coordin
ation
and
support
services
Effective
and
efficient
service
delivery
No. of Policies formulated and approved
VTC HBCG 10M 5M 15 M
Sustainabl
e TVET
Financing
Mechanis
ms for
Quality
Training
Service
Deliver
No. of trainees benefiting from the fee subside
EDUC VTC 12.5 16.7 31.2 37.5 43.75 150M
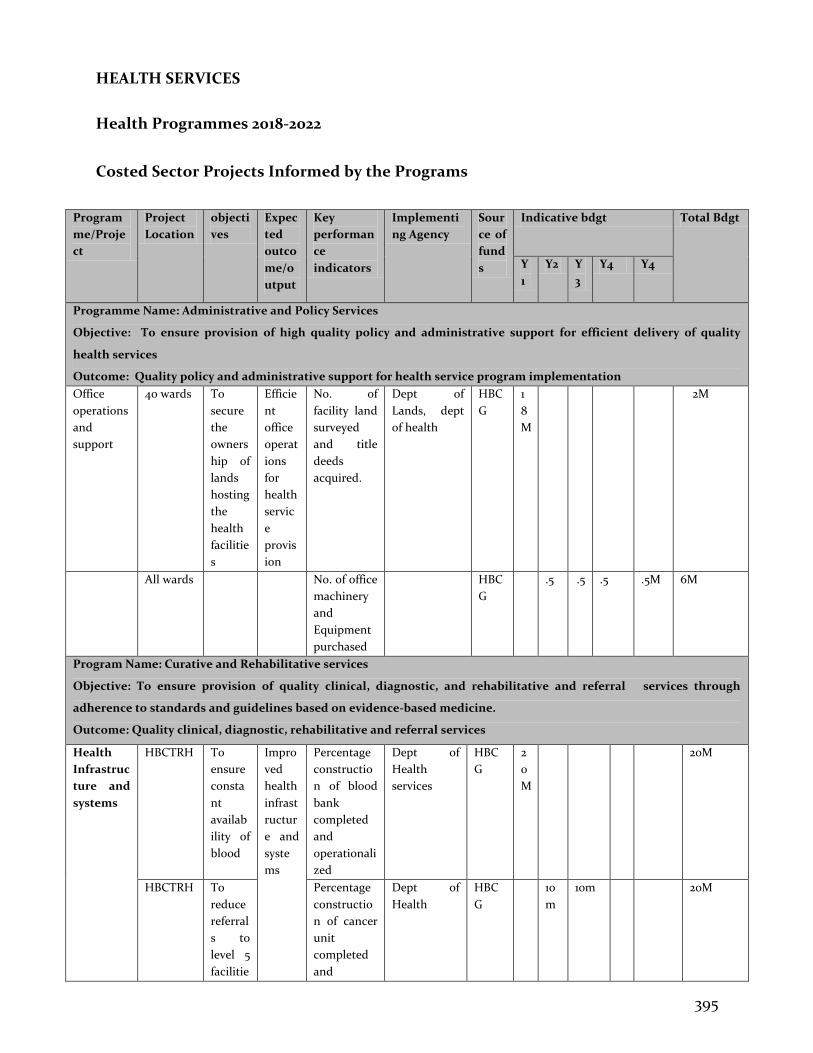
395
HEALTH SERVICES
Health Programmes 2018-2022
Costed Sector Projects Informed by the Programs
Program
me/Proje
ct
Project
Location
objecti
ves
Expec
ted
outco
me/o
utput
Key
performan
ce
indicators
Implementi
ng Agency
Sour
ce of
fund
s
Indicative bdgt Total Bdgt
Y
1
Y2 Y
3
Y4 Y4
Programme Name: Administrative and Policy Services
Objective: To ensure provision of high quality policy and administrative support for efficient delivery of quality
health services
Outcome: Quality policy and administrative support for health service program implementation
Office
operations
and
support
40 wards To
secure
the
owners
hip of
lands
hosting
the
health
facilitie
s
Efficie
nt
office
operat
ions
for
health
servic
e
provis
ion
No. of
facility land
surveyed
and title
deeds
acquired.
Dept of
Lands, dept
of health
HBC
G
1
8
M
2M
All wards No. of office
machinery
and
Equipment
purchased
HBC
G
.5 .5 .5 .5M 6M
Program Name: Curative and Rehabilitative services
Objective: To ensure provision of quality clinical, diagnostic, and rehabilitative and referral services through
adherence to standards and guidelines based on evidence-based medicine.
Outcome: Quality clinical, diagnostic, rehabilitative and referral services
Health
Infrastruc
ture and
systems
HBCTRH To
ensure
consta
nt
availab
ility of
blood
Impro
ved
health
infrast
ructur
e and
syste
ms
Percentage
constructio
n of blood
bank
completed
and
operationali
zed
Dept of
Health
services
HBC
G
2
0
M
20M
HBCTRH To
reduce
referral
s to
level 5
facilitie
Percentage
constructio
n of cancer
unit
completed
and
Dept of
Health
HBC
G
10
m
10m 20M
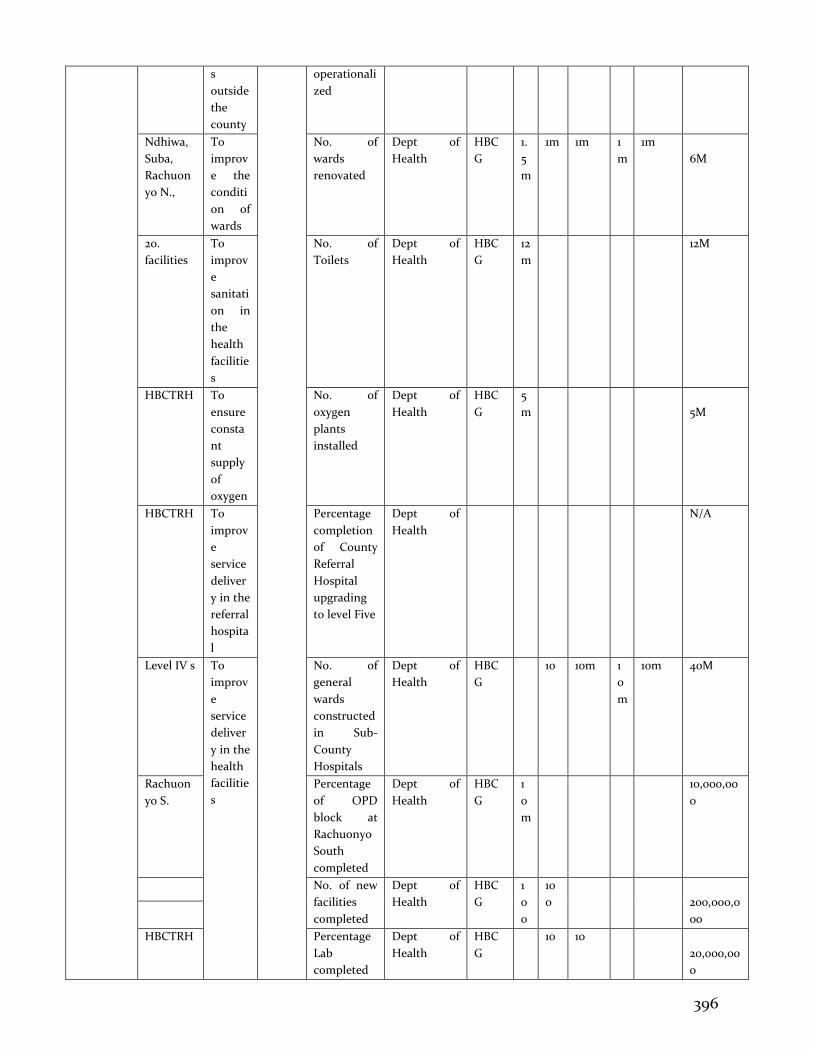
396
s
outside
the
county
operationali
zed
Ndhiwa,
Suba,
Rachuon
yo N.,
To
improv
e the
conditi
on of
wards
No. of
wards
renovated
Dept of
Health
HBC
G
1.
5
m
1m 1m 1
m
1m
6M
20.
facilities
To
improv
e
sanitati
on in
the
health
facilitie
s
No. of
Toilets
Dept of
Health
HBC
G
12
m
12M
HBCTRH To
ensure
consta
nt
supply
of
oxygen
No. of
oxygen
plants
installed
Dept of
Health
HBC
G
5
m
5M
HBCTRH To
improv
e
service
deliver
y in the
referral
hospita
l
Percentage
completion
of County
Referral
Hospital
upgrading
to level Five
Dept of
Health
N/A
Level IV s To
improv
e
service
deliver
y in the
health
facilitie
s
No. of
general
wards
constructed
in Sub-
County
Hospitals
Dept of
Health
HBC
G
10 10m 1
0
m
10m 40M
Rachuon
yo S.
Percentage
of OPD
block at
Rachuonyo
South
completed
Dept of
Health
HBC
G
1
0
m
10,000,00
0
No. of new
facilities
completed
Dept of
Health
HBC
G
1
0
0
10
0
200,000,0
00
HBCTRH Percentage
Lab
completed
Dept of
Health
HBC
G
10 10
20,000,00
0
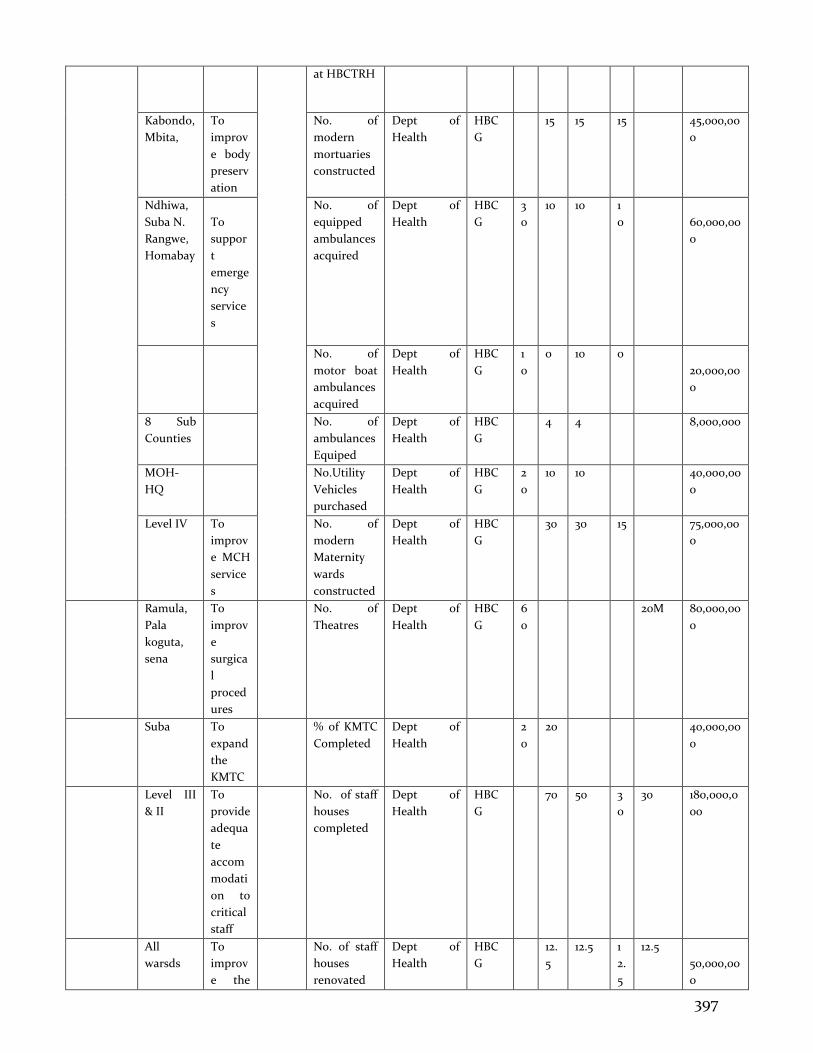
397
at HBCTRH
Kabondo,
Mbita,
To
improv
e body
preserv
ation
No. of
modern
mortuaries
constructed
Dept of
Health
HBC
G
15 15 15 45,000,00
0
Ndhiwa,
Suba N.
Rangwe,
Homabay
To
suppor
t
emerge
ncy
service
s
No. of
equipped
ambulances
acquired
Dept of
Health
HBC
G
3
0
10 10 1
0
60,000,00
0
No. of
motor boat
ambulances
acquired
Dept of
Health
HBC
G
1
0
0 10 0
20,000,00
0
8 Sub
Counties
No. of
ambulances
Equiped
Dept of
Health
HBC
G
4 4 8,000,000
MOH-
HQ
No.Utility
Vehicles
purchased
Dept of
Health
HBC
G
2
0
10 10 40,ooo,oo
o
Level IV To
improv
e MCH
service
s
No. of
modern
Maternity
wards
constructed
Dept of
Health
HBC
G
30 30 15 75,000,00
0
Ramula,
Pala
koguta,
sena
To
improv
e
surgica
l
proced
ures
No. of
Theatres
Dept of
Health
HBC
G
6
0
20M 80,000,00
0
Suba To
expand
the
KMTC
% of KMTC
Completed
Dept of
Health
2
0
20 40,000,00
0
Level III
& II
To
provide
adequa
te
accom
modati
on to
critical
staff
No. of staff
houses
completed
Dept of
Health
HBC
G
70 50 3
0
30 180,000,0
00
All
warsds
To
improv
e the
No. of staff
houses
renovated
Dept of
Health
HBC
G
12.
5
12.5 1
2.
5
12.5
50,000,00
0
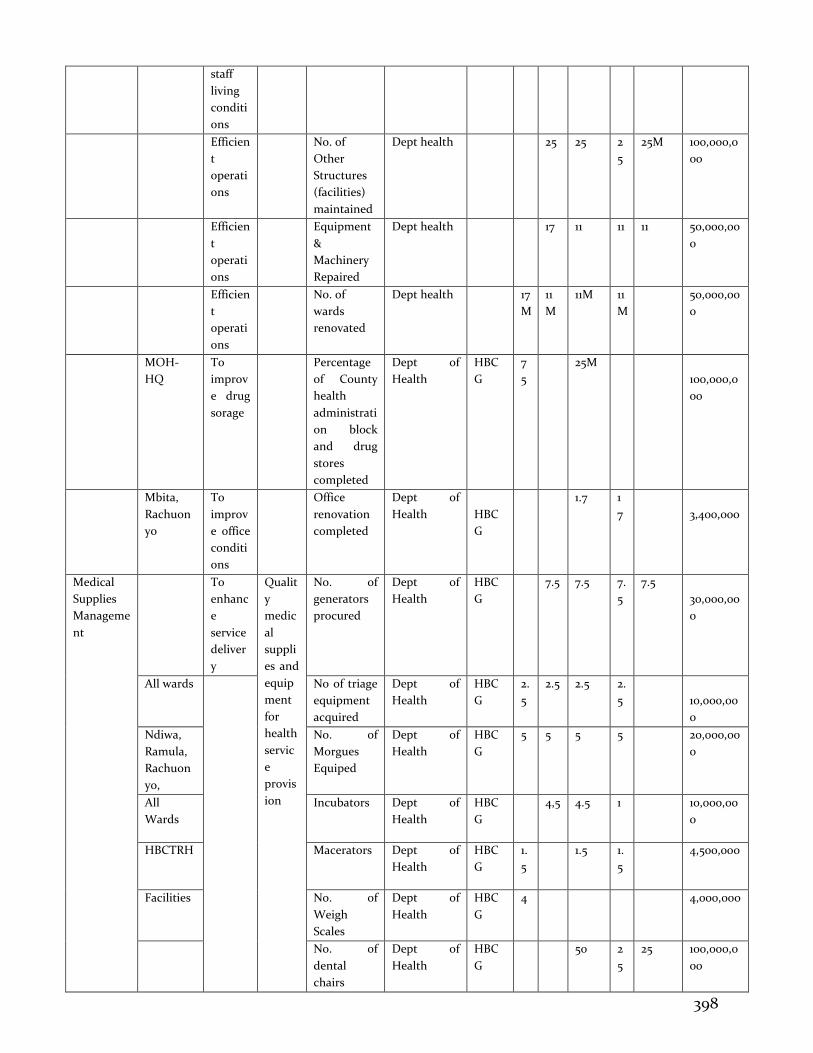
398
staff
living
conditi
ons
Efficien
t
operati
ons
No. of
Other
Structures
(facilities)
maintained
Dept health 25 25 2
5
25M 100,000,0
00
Efficien
t
operati
ons
Equipment
&
Machinery
Repaired
Dept health 17 11 11 11 50,000,00
0
Efficien
t
operati
ons
No. of
wards
renovated
Dept health 17
M
11
M
11M 11
M
50,000,00
0
MOH-
HQ
To
improv
e drug
sorage
Percentage
of County
health
administrati
on block
and drug
stores
completed
Dept of
Health
HBC
G
7
5
25M
100,000,0
00
Mbita,
Rachuon
yo
To
improv
e office
conditi
ons
Office
renovation
completed
Dept of
Health
HBC
G
1.7 1
7
3,400,000
Medical
Supplies
Manageme
nt
To
enhanc
e
service
deliver
y
Qualit
y
medic
al
suppli
es and
equip
ment
for
health
servic
e
provis
ion
No. of
generators
procured
Dept of
Health
HBC
G
7.5 7.5 7.
5
7.5
30,000,00
0
All wards No of triage
equipment
acquired
Dept of
Health
HBC
G
2.
5
2.5 2.5 2.
5
10,000,00
0
Ndiwa,
Ramula,
Rachuon
yo,
No. of
Morgues
Equiped
Dept of
Health
HBC
G
5 5 5 5 20,000,00
0
All
Wards
Incubators Dept of
Health
HBC
G
4,5 4.5 1 10,000,00
0
HBCTRH Macerators Dept of
Health
HBC
G
1.
5
1.5 1.
5
4,500,000
Facilities No. of
Weigh
Scales
Dept of
Health
HBC
G
4 4,000,000
No. of
dental
chairs
Dept of
Health
HBC
G
50 2
5
25 100,000,0
00
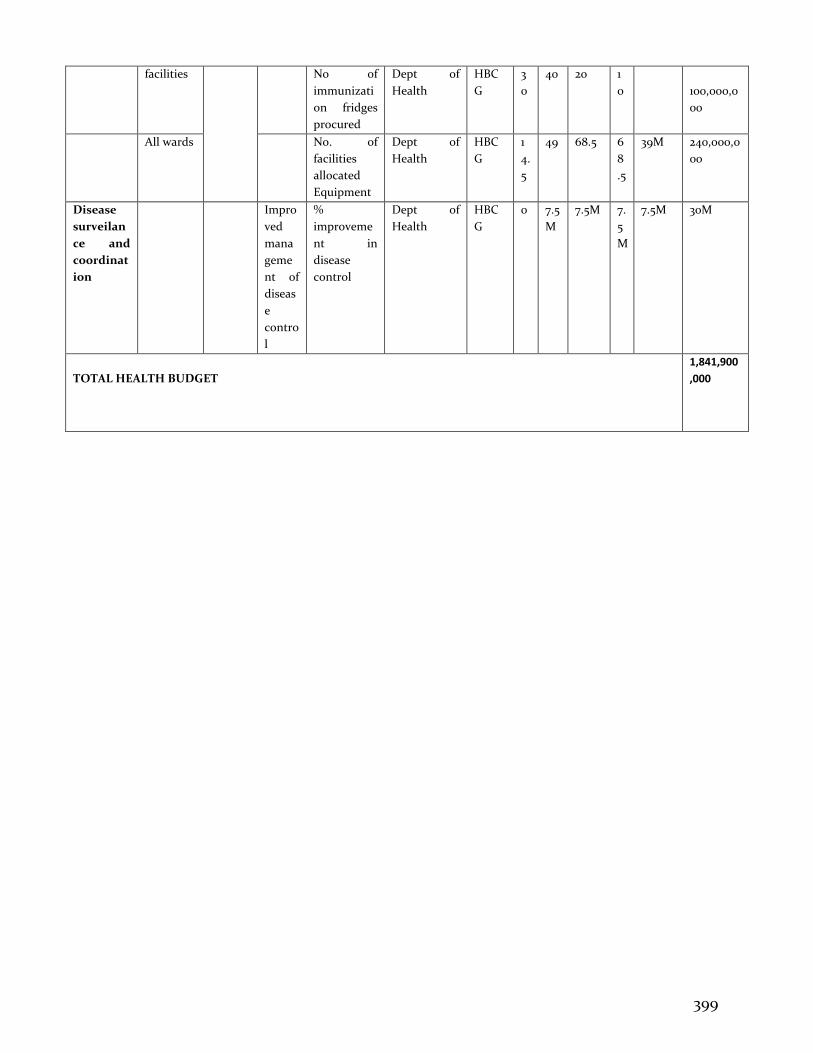
399
facilities No of
immunizati
on fridges
procured
Dept of
Health
HBC
G
3
0
40 20 1
0
100,000,0
00
All wards No. of
facilities
allocated
Equipment
Dept of
Health
HBC
G
1
4.
5
49 68.5 6
8
.5
39M 240,000,0
00
Disease
surveilan
ce and
coordinat
ion
Impro
ved
mana
geme
nt of
diseas
e
contro
l
%
improveme
nt in
disease
control
Dept of
Health
HBC
G
0 7.5
M
7.5M 7.
5
M
7.5M 30M
TOTAL HEALTH BUDGET
1,841,900
,000
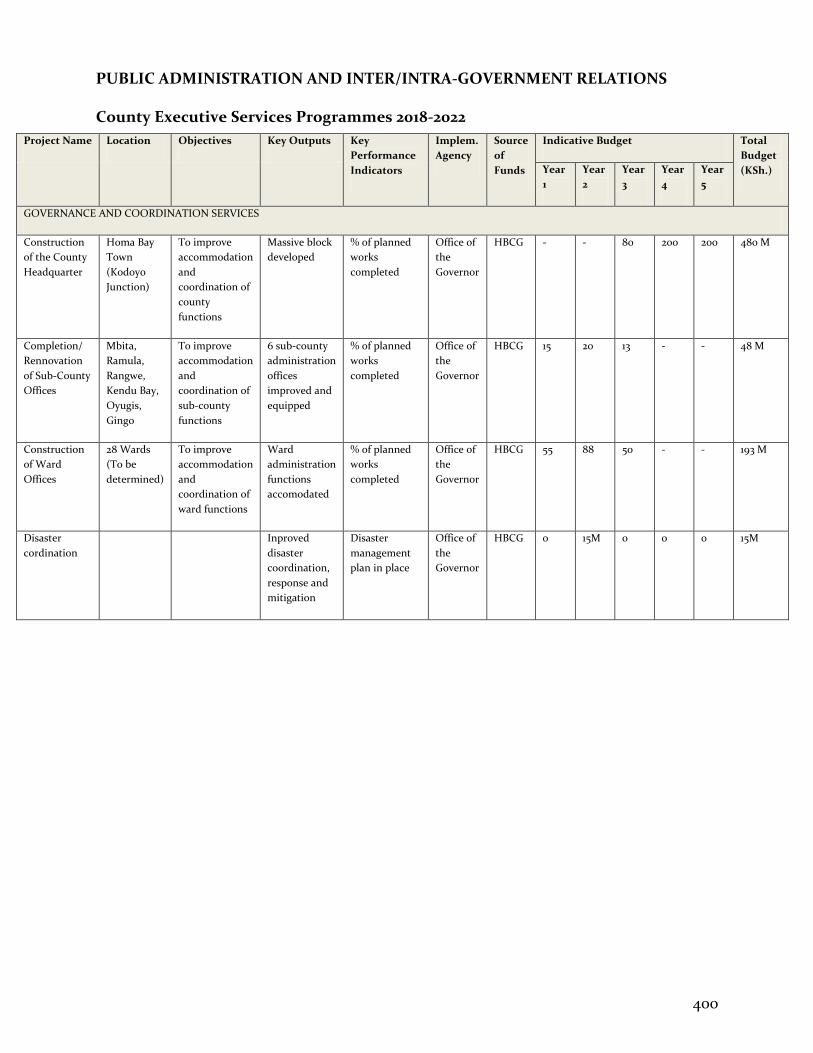
400
PUBLIC ADMINISTRATION AND INTER/INTRA-GOVERNMENT RELATIONS
County Executive Services Programmes 2018-2022
Project Name Location Objectives Key Outputs Key
Performance
Indicators
Implem.
Agency
Source
of
Funds
Indicative Budget Total
Budget
(KSh.) Year
1
Year
2
Year
3
Year
4
Year
5
GOVERNANCE AND COORDINATION SERVICES
Construction
of the County
Headquarter
Homa Bay
Town
(Kodoyo
Junction)
To improve
accommodation
and
coordination of
county
functions
Massive block
developed
% of planned
works
completed
Office of
the
Governor
HBCG - - 80 200 200 480 M
Completion/
Rennovation
of Sub-County
Offices
Mbita,
Ramula,
Rangwe,
Kendu Bay,
Oyugis,
Gingo
To improve
accommodation
and
coordination of
sub-county
functions
6 sub-county
administration
offices
improved and
equipped
% of planned
works
completed
Office of
the
Governor
HBCG 15 20 13 - - 48 M
Construction
of Ward
Offices
28 Wards
(To be
determined)
To improve
accommodation
and
coordination of
ward functions
Ward
administration
functions
accomodated
% of planned
works
completed
Office of
the
Governor
HBCG 55 88 50 - - 193 M
Disaster
cordination
Inproved
disaster
coordination,
response and
mitigation
Disaster
management
plan in place
Office of
the
Governor
HBCG 0 15M 0 0 0 15M
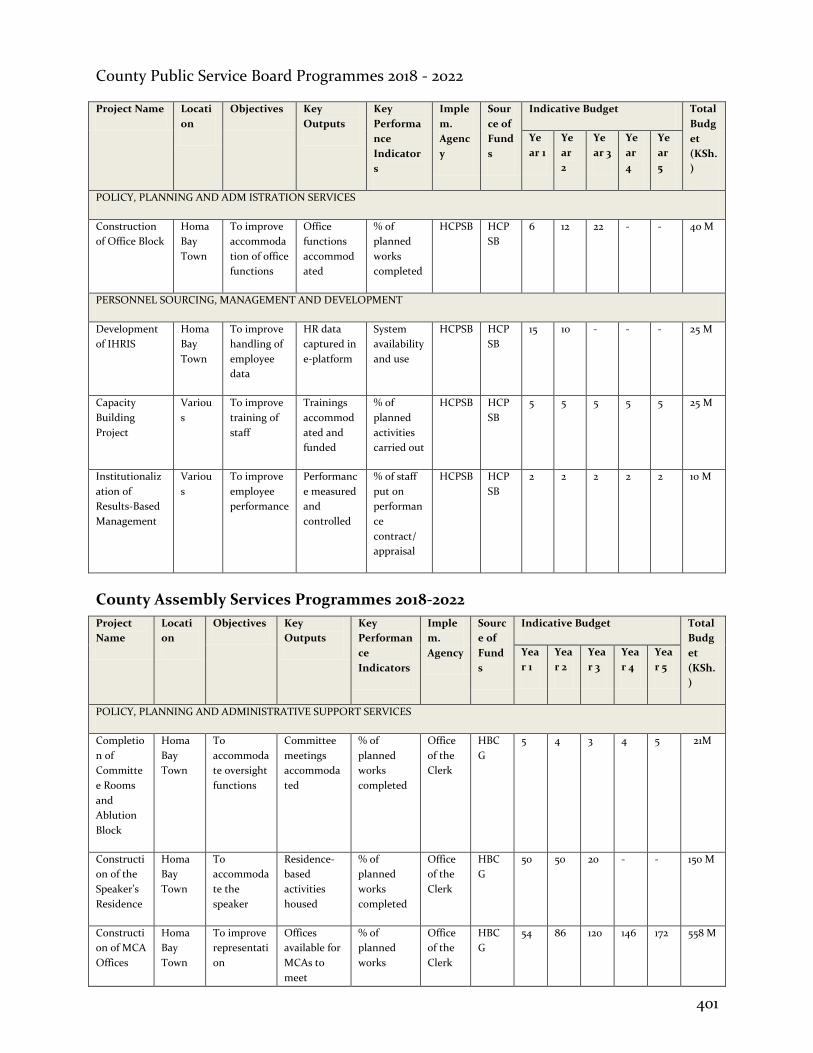
401
County Public Service Board Programmes 2018 - 2022
Project Name Locati
on
Objectives Key
Outputs
Key
Performa
nce
Indicator
s
Imple
m.
Agenc
y
Sour
ce of
Fund
s
Indicative Budget Total
Budg
et
(KSh.
)
Ye
ar 1
Ye
ar
2
Ye
ar 3
Ye
ar
4
Ye
ar
5
POLICY, PLANNING AND ADM ISTRATION SERVICES
Construction
of Office Block
Homa
Bay
Town
To improve
accommoda
tion of office
functions
Office
functions
accommod
ated
% of
planned
works
completed
HCPSB HCP
SB
6 12 22 - - 40 M
PERSONNEL SOURCING, MANAGEMENT AND DEVELOPMENT
Development
of IHRIS
Homa
Bay
Town
To improve
handling of
employee
data
HR data
captured in
e-platform
System
availability
and use
HCPSB HCP
SB
15 10 - - - 25 M
Capacity
Building
Project
Variou
s
To improve
training of
staff
Trainings
accommod
ated and
funded
% of
planned
activities
carried out
HCPSB HCP
SB
5 5 5 5 5 25 M
Institutionaliz
ation of
Results-Based
Management
Variou
s
To improve
employee
performance
Performanc
e measured
and
controlled
% of staff
put on
performan
ce
contract/
appraisal
HCPSB HCP
SB
2 2 2 2 2 10 M
County Assembly Services Programmes 2018-2022
Project
Name
Locati
on
Objectives Key
Outputs
Key
Performan
ce
Indicators
Imple
m.
Agency
Sourc
e of
Fund
s
Indicative Budget Total
Budg
et
(KSh.
)
Yea
r 1
Yea
r 2
Yea
r 3
Yea
r 4
Yea
r 5
POLICY, PLANNING AND ADMINISTRATIVE SUPPORT SERVICES
Completio
n of
Committe
e Rooms
and
Ablution
Block
Homa
Bay
Town
To
accommoda
te oversight
functions
Committee
meetings
accommoda
ted
% of
planned
works
completed
Office
of the
Clerk
HBC
G
5 4 3 4 5 21M
Constructi
on of the
Speaker’s
Residence
Homa
Bay
Town
To
accommoda
te the
speaker
Residence-
based
activities
housed
% of
planned
works
completed
Office
of the
Clerk
HBC
G
50 50 20 - - 150 M
Constructi
on of MCA
Offices
Homa
Bay
Town
To improve
representati
on
Offices
available for
MCAs to
meet
% of
planned
works
Office
of the
Clerk
HBC
G
54 86 120 146 172 558 M
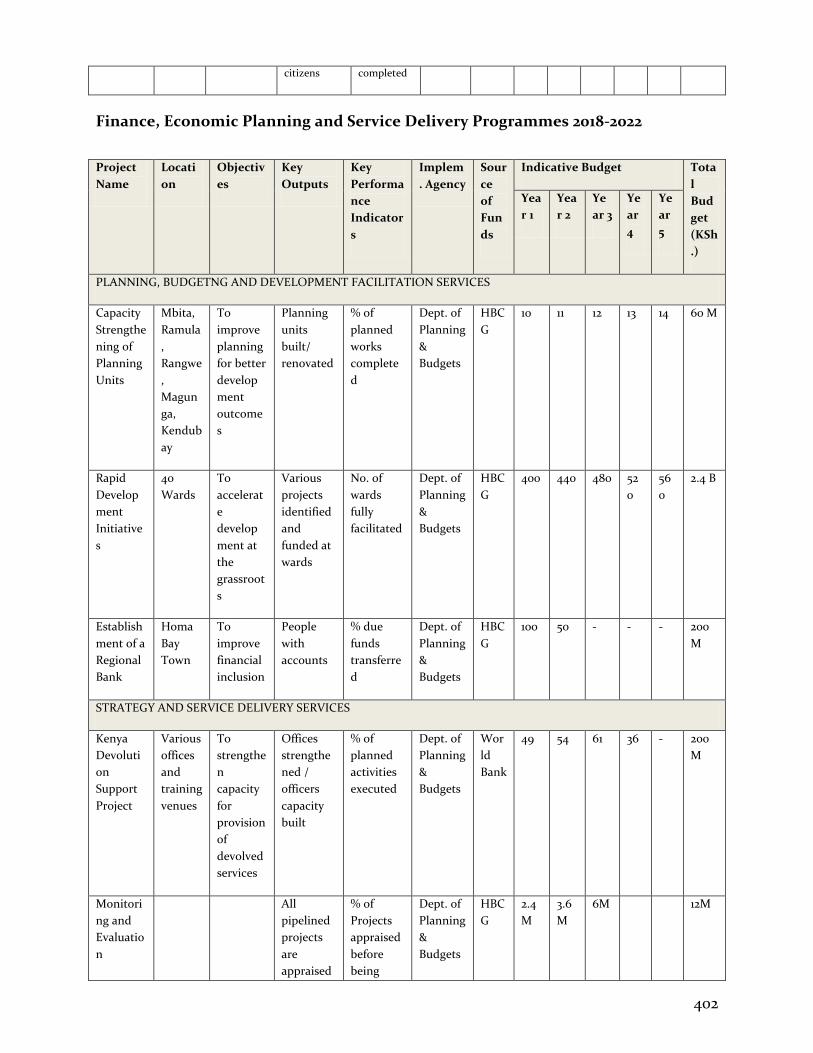
402
citizens completed
Finance, Economic Planning and Service Delivery Programmes 2018-2022
Project
Name
Locati
on
Objectiv
es
Key
Outputs
Key
Performa
nce
Indicator
s
Implem
. Agency
Sour
ce
of
Fun
ds
Indicative Budget Tota
l
Bud
get
(KSh
.)
Yea
r 1
Yea
r 2
Ye
ar 3
Ye
ar
4
Ye
ar
5
PLANNING, BUDGETNG AND DEVELOPMENT FACILITATION SERVICES
Capacity
Strengthe
ning of
Planning
Units
Mbita,
Ramula
,
Rangwe
,
Magun
ga,
Kendub
ay
To
improve
planning
for better
develop
ment
outcome
s
Planning
units
built/
renovated
% of
planned
works
complete
d
Dept. of
Planning
&
Budgets
HBC
G
10 11 12 13 14 60 M
Rapid
Develop
ment
Initiative
s
40
Wards
To
accelerat
e
develop
ment at
the
grassroot
s
Various
projects
identified
and
funded at
wards
No. of
wards
fully
facilitated
Dept. of
Planning
&
Budgets
HBC
G
400 440 480 52
0
56
0
2.4 B
Establish
ment of a
Regional
Bank
Homa
Bay
Town
To
improve
financial
inclusion
People
with
accounts
% due
funds
transferre
d
Dept. of
Planning
&
Budgets
HBC
G
100 50 - - - 200
M
STRATEGY AND SERVICE DELIVERY SERVICES
Kenya
Devoluti
on
Support
Project
Various
offices
and
training
venues
To
strengthe
n
capacity
for
provision
of
devolved
services
Offices
strengthe
ned /
officers
capacity
built
% of
planned
activities
executed
Dept. of
Planning
&
Budgets
Wor
ld
Bank
49 54 61 36 - 200
M
Monitori
ng and
Evaluatio
n
All
pipelined
projects
are
appraised
% of
Projects
appraised
before
being
Dept. of
Planning
&
Budgets
HBC
G
2.4
M
3.6
M
6M 12M
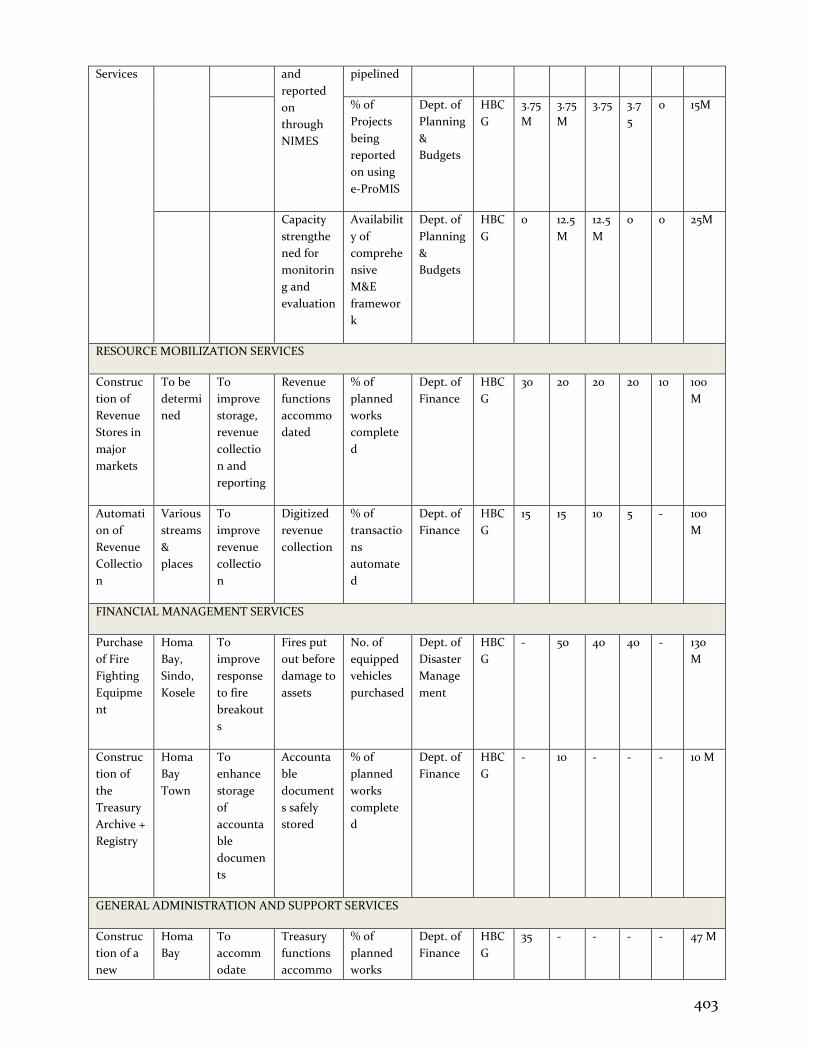
403
Services and
reported
on
through
NIMES
pipelined
% of
Projects
being
reported
on using
e-ProMIS
Dept. of
Planning
&
Budgets
HBC
G
3.75
M
3.75
M
3.75 3.7
5
0 15M
Capacity
strengthe
ned for
monitorin
g and
evaluation
Availabilit
y of
comprehe
nsive
M&E
framewor
k
Dept. of
Planning
&
Budgets
HBC
G
0 12.5
M
12.5
M
0 0 25M
RESOURCE MOBILIZATION SERVICES
Construc
tion of
Revenue
Stores in
major
markets
To be
determi
ned
To
improve
storage,
revenue
collectio
n and
reporting
Revenue
functions
accommo
dated
% of
planned
works
complete
d
Dept. of
Finance
HBC
G
30 20 20 20 10 100
M
Automati
on of
Revenue
Collectio
n
Various
streams
&
places
To
improve
revenue
collectio
n
Digitized
revenue
collection
% of
transactio
ns
automate
d
Dept. of
Finance
HBC
G
15 15 10 5 - 100
M
FINANCIAL MANAGEMENT SERVICES
Purchase
of Fire
Fighting
Equipme
nt
Homa
Bay,
Sindo,
Kosele
To
improve
response
to fire
breakout
s
Fires put
out before
damage to
assets
No. of
equipped
vehicles
purchased
Dept. of
Disaster
Manage
ment
HBC
G
- 50 40 40 - 130
M
Construc
tion of
the
Treasury
Archive +
Registry
Homa
Bay
Town
To
enhance
storage
of
accounta
ble
documen
ts
Accounta
ble
document
s safely
stored
% of
planned
works
complete
d
Dept. of
Finance
HBC
G
- 10 - - - 10 M
GENERAL ADMINISTRATION AND SUPPORT SERVICES
Construc
tion of a
new
Homa
Bay
To
accomm
odate
Treasury
functions
accommo
% of
planned
works
Dept. of
Finance
HBC
G
35 - - - - 47 M
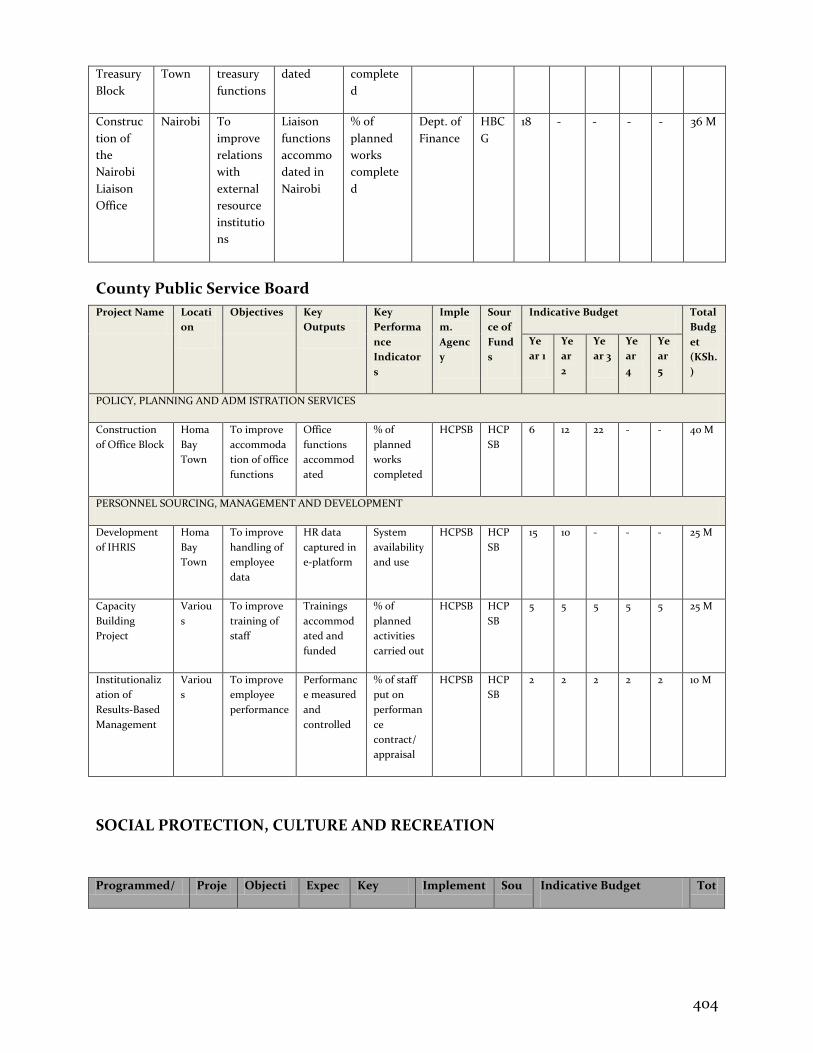
404
Treasury
Block
Town treasury
functions
dated complete
d
Construc
tion of
the
Nairobi
Liaison
Office
Nairobi To
improve
relations
with
external
resource
institutio
ns
Liaison
functions
accommo
dated in
Nairobi
% of
planned
works
complete
d
Dept. of
Finance
HBC
G
18 - - - - 36 M
County Public Service Board
Project Name Locati
on
Objectives Key
Outputs
Key
Performa
nce
Indicator
s
Imple
m.
Agenc
y
Sour
ce of
Fund
s
Indicative Budget Total
Budg
et
(KSh.
)
Ye
ar 1
Ye
ar
2
Ye
ar 3
Ye
ar
4
Ye
ar
5
POLICY, PLANNING AND ADM ISTRATION SERVICES
Construction
of Office Block
Homa
Bay
Town
To improve
accommoda
tion of office
functions
Office
functions
accommod
ated
% of
planned
works
completed
HCPSB HCP
SB
6 12 22 - - 40 M
PERSONNEL SOURCING, MANAGEMENT AND DEVELOPMENT
Development
of IHRIS
Homa
Bay
Town
To improve
handling of
employee
data
HR data
captured in
e-platform
System
availability
and use
HCPSB HCP
SB
15 10 - - - 25 M
Capacity
Building
Project
Variou
s
To improve
training of
staff
Trainings
accommod
ated and
funded
% of
planned
activities
carried out
HCPSB HCP
SB
5 5 5 5 5 25 M
Institutionaliz
ation of
Results-Based
Management
Variou
s
To improve
employee
performance
Performanc
e measured
and
controlled
% of staff
put on
performan
ce
contract/
appraisal
HCPSB HCP
SB
2 2 2 2 2 10 M
SOCIAL PROTECTION, CULTURE AND RECREATION
Programmed/ Proje Objecti Expec Key Implement Sou Indicative Budget Tot
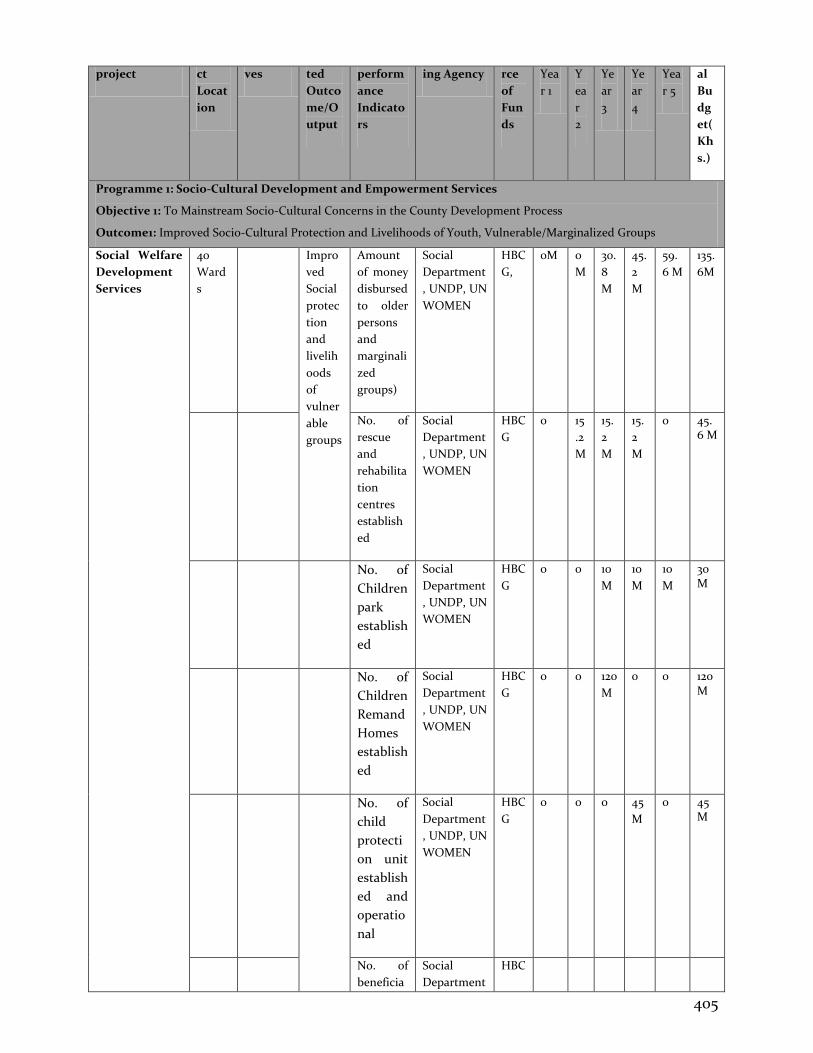
405
project ct
Locat
ion
ves ted
Outco
me/O
utput
perform
ance
Indicato
rs
ing Agency rce
of
Fun
ds
Yea
r 1
Y
ea
r
2
Ye
ar
3
Ye
ar
4
Yea
r 5
al
Bu
dg
et(
Kh
s.)
Programme 1: Socio-Cultural Development and Empowerment Services
Objective 1: To Mainstream Socio-Cultural Concerns in the County Development Process
Outcome1: Improved Socio-Cultural Protection and Livelihoods of Youth, Vulnerable/Marginalized Groups
Social Welfare
Development
Services
40
Ward
s
Impro
ved
Social
protec
tion
and
livelih
oods
of
vulner
able
groups
Amount
of money
disbursed
to older
persons
and
marginali
zed
groups)
Social
Department
, UNDP, UN
WOMEN
HBC
G,
0M 0
M
30.
8
M
45.
2
M
59.
6 M
135.
6M
No. of
rescue
and
rehabilita
tion
centres
establish
ed
Social
Department
, UNDP, UN
WOMEN
HBC
G
0 15
.2
M
15.
2
M
15.
2
M
0 45.6 M
No. of
Children
park
establish
ed
Social
Department
, UNDP, UN
WOMEN
HBC
G
0 0 10
M
10
M
10
M
30 M
No. of
Children
Remand
Homes
establish
ed
Social
Department
, UNDP, UN
WOMEN
HBC
G
0 0 120
M
0 0 120 M
No. of
child
protecti
on unit
establish
ed and
operatio
nal
Social
Department
, UNDP, UN
WOMEN
HBC
G
0 0 0 45
M
0 45M
No. of
beneficia
Social
Department
HBC
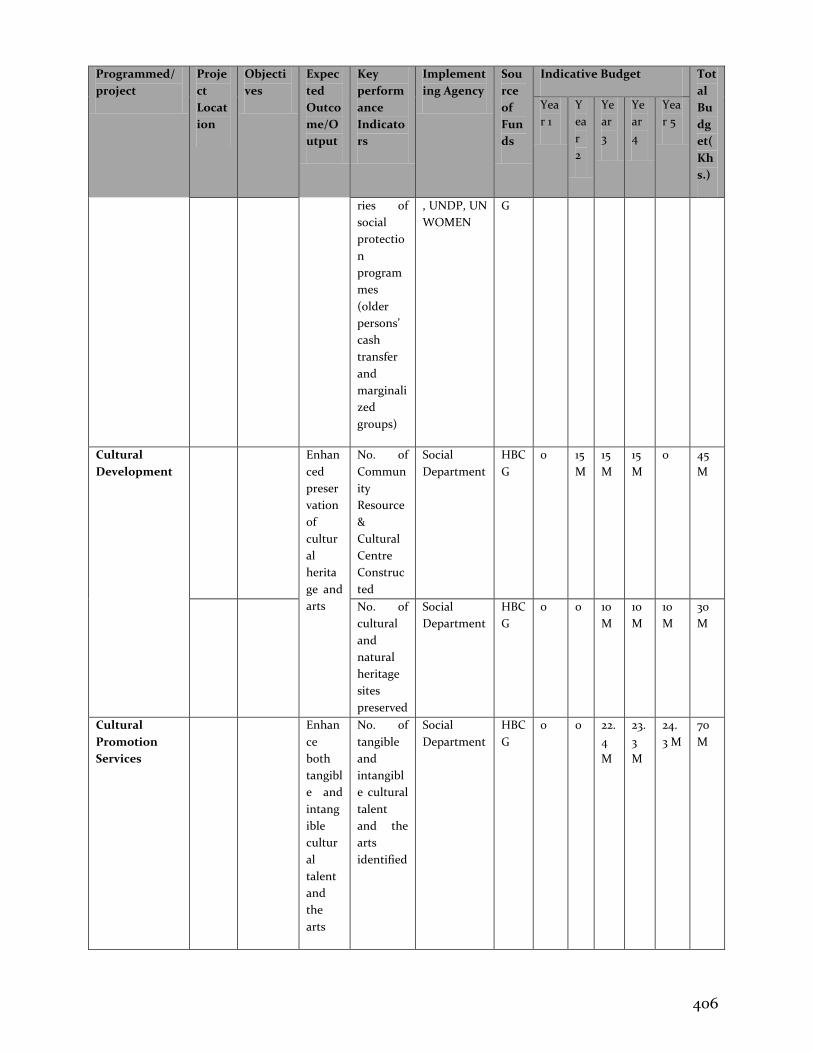
406
Programmed/
project
Proje
ct
Locat
ion
Objecti
ves
Expec
ted
Outco
me/O
utput
Key
perform
ance
Indicato
rs
Implement
ing Agency
Sou
rce
of
Fun
ds
Indicative Budget Tot
al
Bu
dg
et(
Kh
s.)
Yea
r 1
Y
ea
r
2
Ye
ar
3
Ye
ar
4
Yea
r 5
ries of
social
protectio
n
program
mes
(older
persons’
cash
transfer
and
marginali
zed
groups)
, UNDP, UN
WOMEN
G
Cultural
Development
Enhan
ced
preser
vation
of
cultur
al
herita
ge and
arts
No. of
Commun
ity
Resource
&
Cultural
Centre
Construc
ted
Social
Department
HBC
G
0 15
M
15
M
15
M
0 45
M
No. of
cultural
and
natural
heritage
sites
preserved
Social
Department
HBC
G
0 0 10
M
10
M
10
M
30
M
Cultural
Promotion
Services
Enhan
ce
both
tangibl
e and
intang
ible
cultur
al
talent
and
the
arts
No. of
tangible
and
intangibl
e cultural
talent
and the
arts
identified
Social
Department
HBC
G
0 0 22.
4
M
23.
3
M
24.
3 M
70
M
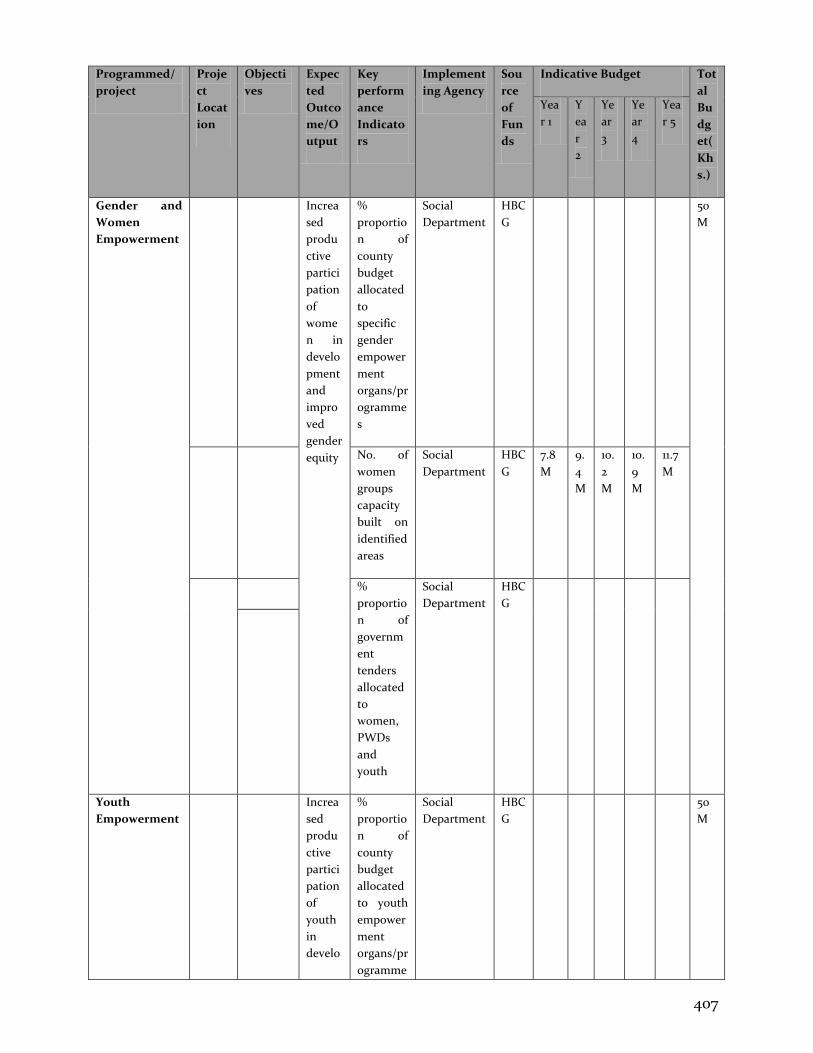
407
Programmed/
project
Proje
ct
Locat
ion
Objecti
ves
Expec
ted
Outco
me/O
utput
Key
perform
ance
Indicato
rs
Implement
ing Agency
Sou
rce
of
Fun
ds
Indicative Budget Tot
al
Bu
dg
et(
Kh
s.)
Yea
r 1
Y
ea
r
2
Ye
ar
3
Ye
ar
4
Yea
r 5
Gender and
Women
Empowerment
Increa
sed
produ
ctive
partici
pation
of
wome
n in
develo
pment
and
impro
ved
gender
equity
%
proportio
n of
county
budget
allocated
to
specific
gender
empower
ment
organs/pr
ogramme
s
Social
Department
HBC
G
50
M
No. of
women
groups
capacity
built on
identified
areas
Social
Department
HBC
G
7.8
M
9.
4
M
10.
2
M
10.
9
M
11.7
M
%
proportio
n of
governm
ent
tenders
allocated
to
women,
PWDs
and
youth
Social
Department
HBC
G
Youth
Empowerment
Increa
sed
produ
ctive
partici
pation
of
youth
in
develo
%
proportio
n of
county
budget
allocated
to youth
empower
ment
organs/pr
ogramme
Social
Department
HBC
G
50
M
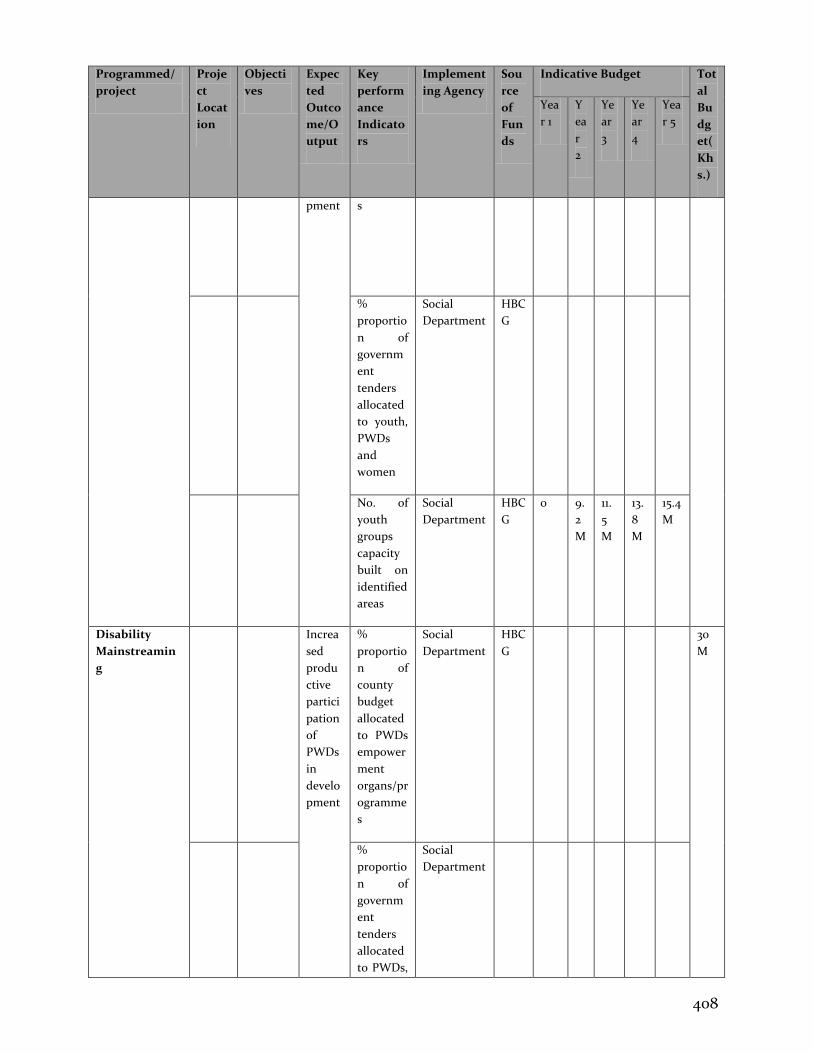
408
Programmed/
project
Proje
ct
Locat
ion
Objecti
ves
Expec
ted
Outco
me/O
utput
Key
perform
ance
Indicato
rs
Implement
ing Agency
Sou
rce
of
Fun
ds
Indicative Budget Tot
al
Bu
dg
et(
Kh
s.)
Yea
r 1
Y
ea
r
2
Ye
ar
3
Ye
ar
4
Yea
r 5
pment s
%
proportio
n of
governm
ent
tenders
allocated
to youth,
PWDs
and
women
Social
Department
HBC
G
No. of
youth
groups
capacity
built on
identified
areas
Social
Department
HBC
G
0 9.
2
M
11.
5
M
13.
8
M
15.4
M
Disability
Mainstreamin
g
Increa
sed
produ
ctive
partici
pation
of
PWDs
in
develo
pment
%
proportio
n of
county
budget
allocated
to PWDs
empower
ment
organs/pr
ogramme
s
Social
Department
HBC
G
30
M
%
proportio
n of
governm
ent
tenders
allocated
to PWDs,
Social
Department
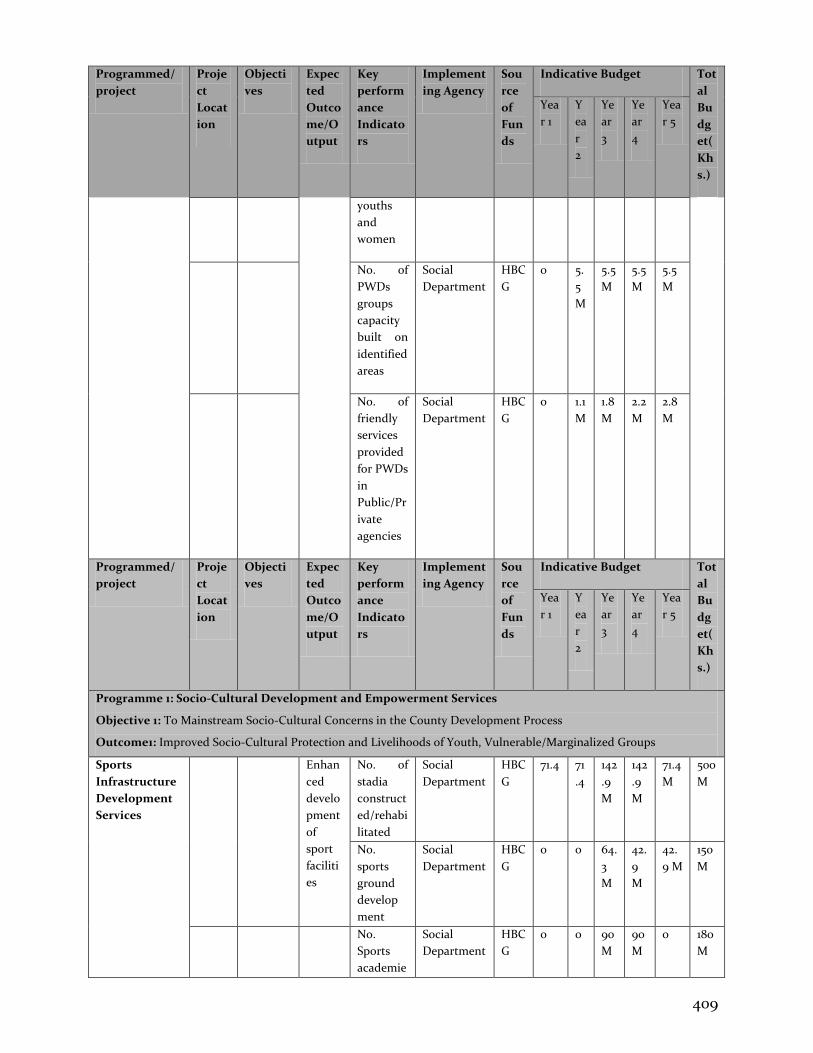
409
Programmed/
project
Proje
ct
Locat
ion
Objecti
ves
Expec
ted
Outco
me/O
utput
Key
perform
ance
Indicato
rs
Implement
ing Agency
Sou
rce
of
Fun
ds
Indicative Budget Tot
al
Bu
dg
et(
Kh
s.)
Yea
r 1
Y
ea
r
2
Ye
ar
3
Ye
ar
4
Yea
r 5
youths
and
women
No. of
PWDs
groups
capacity
built on
identified
areas
Social
Department
HBC
G
0 5.
5
M
5.5
M
5.5
M
5.5
M
No. of
friendly
services
provided
for PWDs
in
Public/Pr
ivate
agencies
Social
Department
HBC
G
0 1.1
M
1.8
M
2.2
M
2.8
M
Programmed/
project
Proje
ct
Locat
ion
Objecti
ves
Expec
ted
Outco
me/O
utput
Key
perform
ance
Indicato
rs
Implement
ing Agency
Sou
rce
of
Fun
ds
Indicative Budget Tot
al
Bu
dg
et(
Kh
s.)
Yea
r 1
Y
ea
r
2
Ye
ar
3
Ye
ar
4
Yea
r 5
Programme 1: Socio-Cultural Development and Empowerment Services
Objective 1: To Mainstream Socio-Cultural Concerns in the County Development Process
Outcome1: Improved Socio-Cultural Protection and Livelihoods of Youth, Vulnerable/Marginalized Groups
Sports
Infrastructure
Development
Services
Enhan
ced
develo
pment
of
sport
faciliti
es
No. of
stadia
construct
ed/rehabi
litated
Social
Department
HBC
G
71.4 71
.4
142
.9
M
142
.9
M
71.4
M
500
M
No.
sports
ground
develop
ment
Social
Department
HBC
G
0 0 64.
3
M
42.
9
M
42.
9 M
150
M
No.
Sports
academie
Social
Department
HBC
G
0 0 90
M
90
M
0 180
M
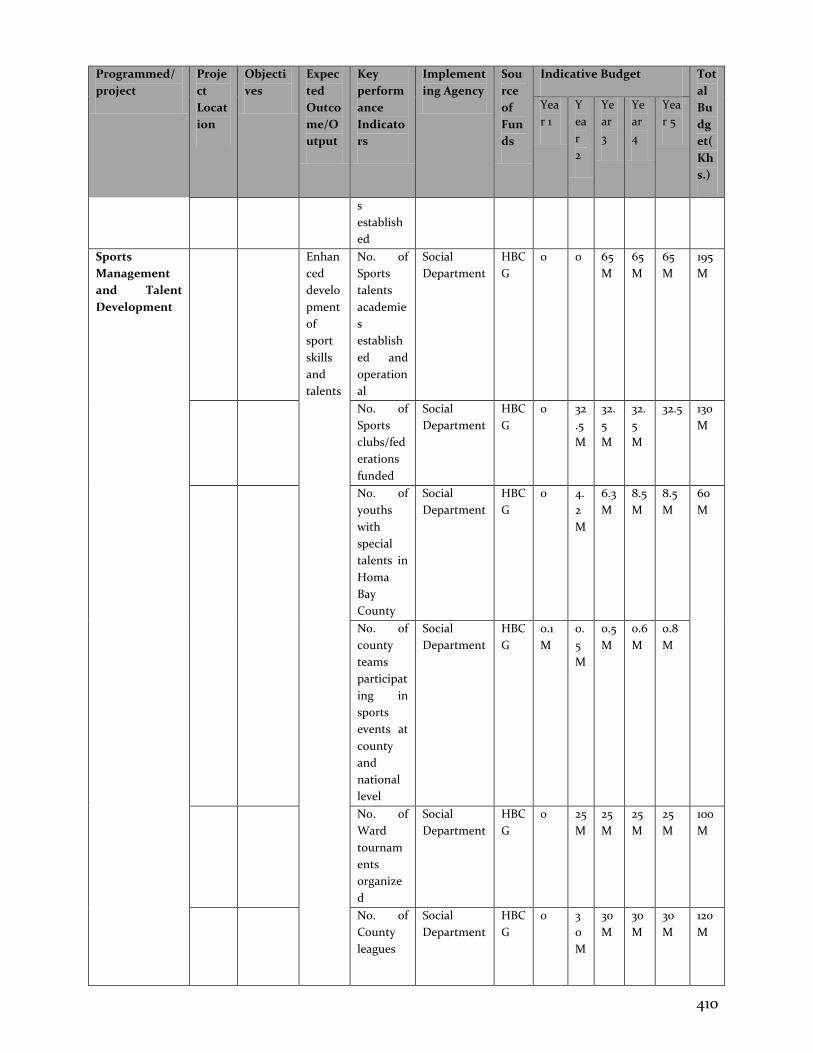
410
Programmed/
project
Proje
ct
Locat
ion
Objecti
ves
Expec
ted
Outco
me/O
utput
Key
perform
ance
Indicato
rs
Implement
ing Agency
Sou
rce
of
Fun
ds
Indicative Budget Tot
al
Bu
dg
et(
Kh
s.)
Yea
r 1
Y
ea
r
2
Ye
ar
3
Ye
ar
4
Yea
r 5
s
establish
ed
Sports
Management
and Talent
Development
Enhan
ced
develo
pment
of
sport
skills
and
talents
No. of
Sports
talents
academie
s
establish
ed and
operation
al
Social
Department
HBC
G
0 0 65
M
65
M
65
M
195
M
No. of
Sports
clubs/fed
erations
funded
Social
Department
HBC
G
0 32
.5
M
32.
5
M
32.
5
M
32.5 130
M
No. of
youths
with
special
talents in
Homa
Bay
County
Social
Department
HBC
G
0 4.
2
M
6.3
M
8.5
M
8.5
M
60
M
No. of
county
teams
participat
ing in
sports
events at
county
and
national
level
Social
Department
HBC
G
0.1
M
0.
5
M
0.5
M
0.6
M
0.8
M
No. of
Ward
tournam
ents
organize
d
Social
Department
HBC
G
0 25
M
25
M
25
M
25
M
100
M
No. of
County
leagues
Social
Department
HBC
G
0 3
0
M
30
M
30
M
30
M
120
M
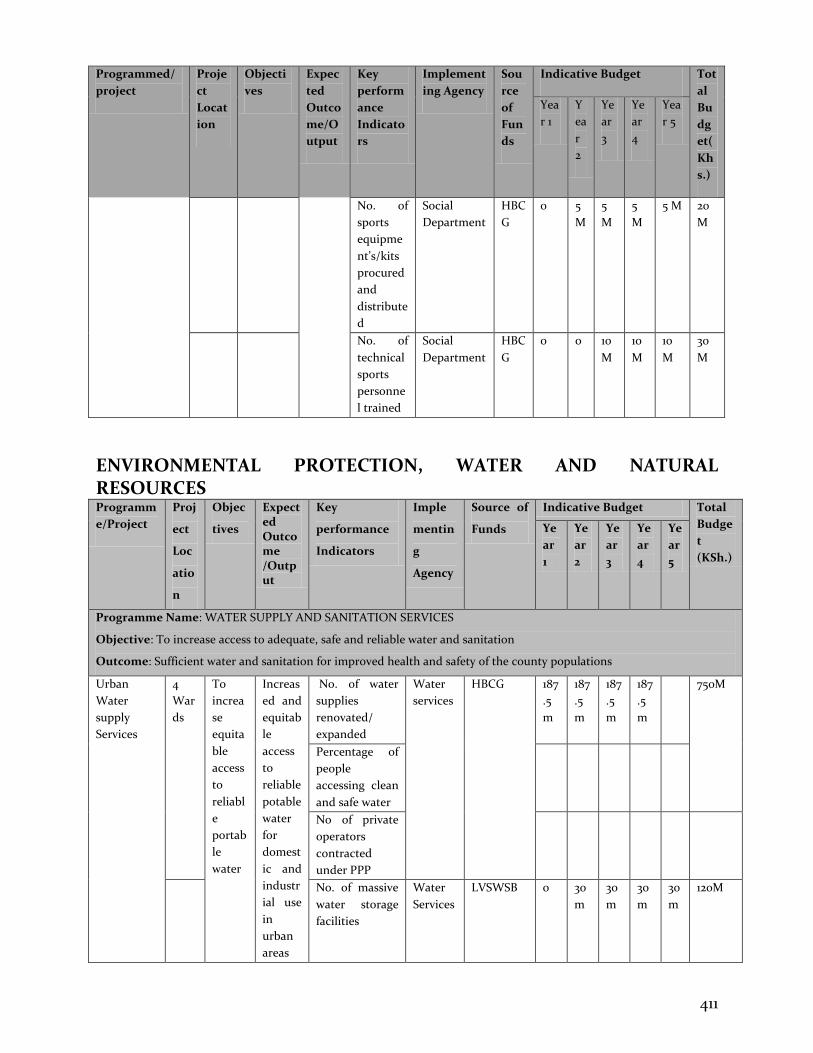
411
Programmed/
project
Proje
ct
Locat
ion
Objecti
ves
Expec
ted
Outco
me/O
utput
Key
perform
ance
Indicato
rs
Implement
ing Agency
Sou
rce
of
Fun
ds
Indicative Budget Tot
al
Bu
dg
et(
Kh
s.)
Yea
r 1
Y
ea
r
2
Ye
ar
3
Ye
ar
4
Yea
r 5
No. of
sports
equipme
nt’s/kits
procured
and
distribute
d
Social
Department
HBC
G
0 5
M
5
M
5
M
5 M 20
M
No. of
technical
sports
personne
l trained
Social
Department
HBC
G
0 0 10
M
10
M
10
M
30
M
ENVIRONMENTAL PROTECTION, WATER AND NATURAL RESOURCES Programm
e/Project
Proj
ect
Loc
atio
n
Objec
tives
Expected Outcome /Output
Key
performance
Indicators
Imple
mentin
g
Agency
Source of
Funds
Indicative Budget Total
Budge
t
(KSh.)
Ye
ar
1
Ye
ar
2
Ye
ar
3
Ye
ar
4
Ye
ar
5
Programme Name: WATER SUPPLY AND SANITATION SERVICES
Objective: To increase access to adequate, safe and reliable water and sanitation
Outcome: Sufficient water and sanitation for improved health and safety of the county populations
Urban
Water
supply
Services
4
War
ds
To
increa
se
equita
ble
access
to
reliabl
e
portab
le
water
Increas
ed and
equitab
le
access
to
reliable
potable
water
for
domest
ic and
industr
ial use
in
urban
areas
No. of water
supplies
renovated/
expanded
Water
services
HBCG 187
.5
m
187
.5
m
187
.5
m
187
.5
m
750M
Percentage of
people
accessing clean
and safe water
No of private
operators
contracted
under PPP
No. of massive
water storage
facilities
Water
Services
LVSWSB 0 30
m
30
m 30
m 30
m 120M
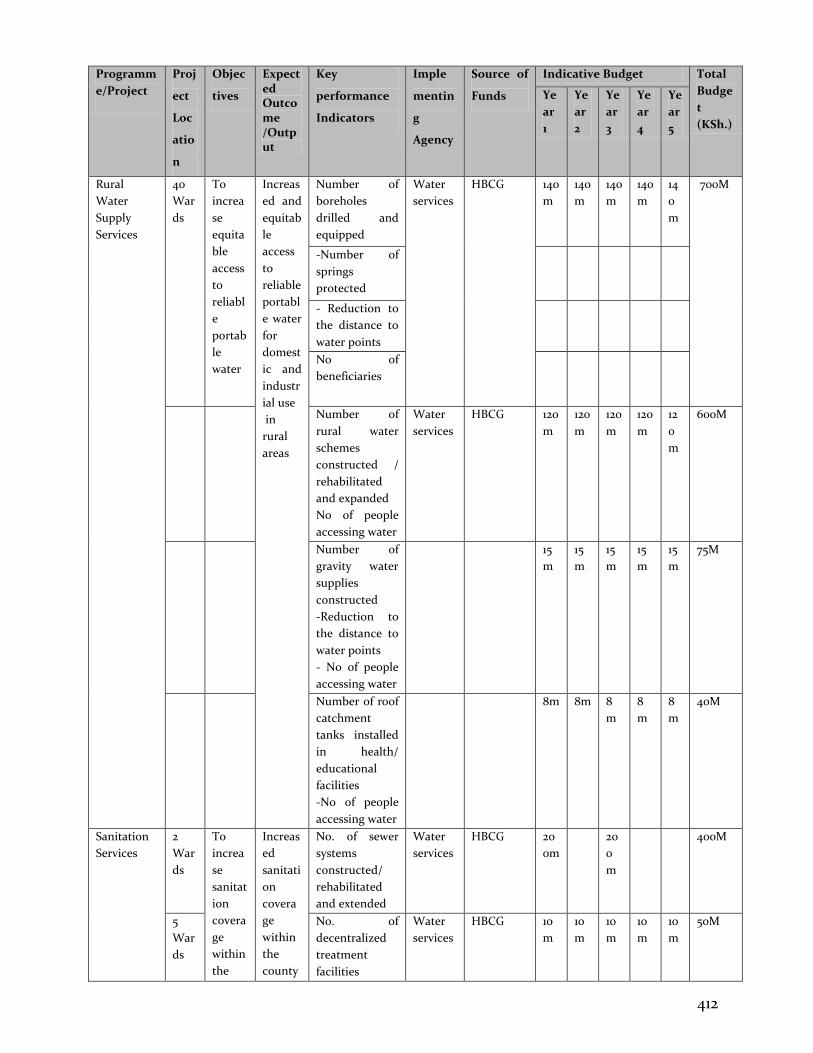
412
Programm
e/Project
Proj
ect
Loc
atio
n
Objec
tives
Expected Outcome /Output
Key
performance
Indicators
Imple
mentin
g
Agency
Source of
Funds
Indicative Budget Total
Budge
t
(KSh.)
Ye
ar
1
Ye
ar
2
Ye
ar
3
Ye
ar
4
Ye
ar
5
Rural
Water
Supply
Services
40
War
ds
To
increa
se
equita
ble
access
to
reliabl
e
portab
le
water
Increas
ed and
equitab
le
access
to
reliable
portabl
e water
for
domest
ic and
industr
ial use
in
rural
areas
Number of
boreholes
drilled and
equipped
Water
services
HBCG 140
m
140
m
140
m
140
m
14
0
m
700M
-Number of
springs
protected
- Reduction to
the distance to
water points
No of
beneficiaries
Number of
rural water
schemes
constructed /
rehabilitated
and expanded
No of people
accessing water
Water
services
HBCG 120
m
120
m
120
m
120
m
12
0
m
600M
Number of
gravity water
supplies
constructed
-Reduction to
the distance to
water points
- No of people
accessing water
15
m
15
m
15
m
15
m
15
m
75M
Number of roof
catchment
tanks installed
in health/
educational
facilities
-No of people
accessing water
8m 8m 8
m
8
m
8
m
40M
Sanitation
Services
2
War
ds
To
increa
se
sanitat
ion
covera
ge
within
the
Increas
ed
sanitati
on
covera
ge
within
the
county
No. of sewer
systems
constructed/
rehabilitated
and extended
Water
services
HBCG 20
0m
20
0
m
400M
5
War
ds
No. of
decentralized
treatment
facilities
Water
services
HBCG 10
m
10
m
10
m
10
m
10
m
50M
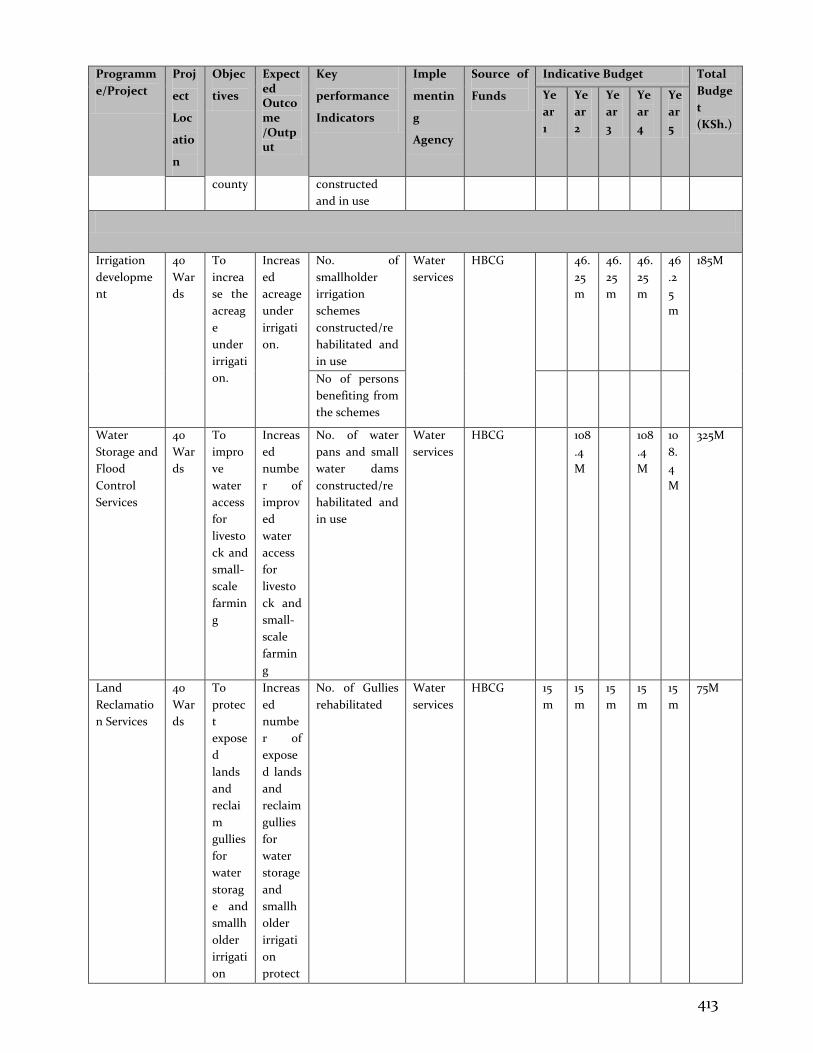
413
Programm
e/Project
Proj
ect
Loc
atio
n
Objec
tives
Expected Outcome /Output
Key
performance
Indicators
Imple
mentin
g
Agency
Source of
Funds
Indicative Budget Total
Budge
t
(KSh.)
Ye
ar
1
Ye
ar
2
Ye
ar
3
Ye
ar
4
Ye
ar
5
county constructed
and in use
Irrigation
developme
nt
40
War
ds
To
increa
se the
acreag
e
under
irrigati
on.
Increas
ed
acreage
under
irrigati
on.
No. of
smallholder
irrigation
schemes
constructed/re
habilitated and
in use
Water
services
HBCG 46.
25
m
46.
25
m
46.
25
m
46
.2
5
m
185M
No of persons
benefiting from
the schemes
Water
Storage and
Flood
Control
Services
40
War
ds
To
impro
ve
water
access
for
livesto
ck and
small-
scale
farmin
g
Increas
ed
numbe
r of
improv
ed
water
access
for
livesto
ck and
small-
scale
farmin
g
No. of water
pans and small
water dams
constructed/re
habilitated and
in use
Water
services
HBCG 108
.4
M
108
.4
M
10
8.
4
M
325M
Land
Reclamatio
n Services
40
War
ds
To
protec
t
expose
d
lands
and
reclai
m
gullies
for
water
storag
e and
smallh
older
irrigati
on
Increas
ed
numbe
r of
expose
d lands
and
reclaim
gullies
for
water
storage
and
smallh
older
irrigati
on
protect
No. of Gullies
rehabilitated
Water
services
HBCG 15
m
15
m
15
m
15
m
15
m
75M
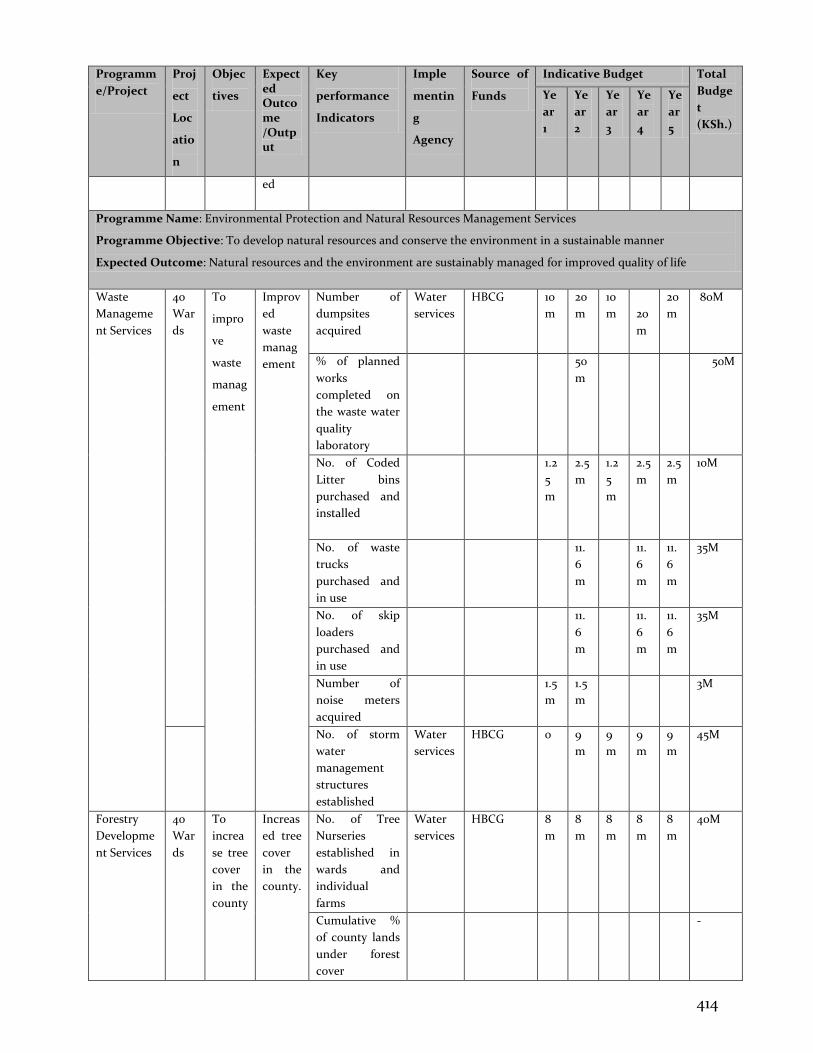
414
Programm
e/Project
Proj
ect
Loc
atio
n
Objec
tives
Expected Outcome /Output
Key
performance
Indicators
Imple
mentin
g
Agency
Source of
Funds
Indicative Budget Total
Budge
t
(KSh.)
Ye
ar
1
Ye
ar
2
Ye
ar
3
Ye
ar
4
Ye
ar
5
ed
Programme Name: Environmental Protection and Natural Resources Management Services
Programme Objective: To develop natural resources and conserve the environment in a sustainable manner
Expected Outcome: Natural resources and the environment are sustainably managed for improved quality of life
Waste
Manageme
nt Services
40
War
ds
To
impro
ve
waste
manag
ement
Improv
ed
waste
manag
ement
Number of
dumpsites
acquired
Water
services
HBCG 10
m
20
m
10
m
20
m
20
m
80M
% of planned
works
completed on
the waste water
quality
laboratory
50
m
50M
No. of Coded
Litter bins
purchased and
installed
1.2
5
m
2.5
m
1.2
5
m
2.5
m
2.5
m
10M
No. of waste
trucks
purchased and
in use
11.
6
m
11.
6
m
11.
6
m
35M
No. of skip
loaders
purchased and
in use
11.
6
m
11.
6
m
11.
6
m
35M
Number of
noise meters
acquired
1.5
m
1.5
m
3M
No. of storm
water
management
structures
established
Water
services
HBCG 0 9
m
9
m 9
m 9
m 45M
Forestry
Developme
nt Services
40
War
ds
To
increa
se tree
cover
in the
county
Increas
ed tree
cover
in the
county.
No. of Tree
Nurseries
established in
wards and
individual
farms
Water
services
HBCG 8
m
8
m
8
m
8
m
8
m
40M
Cumulative %
of county lands
under forest
cover
-
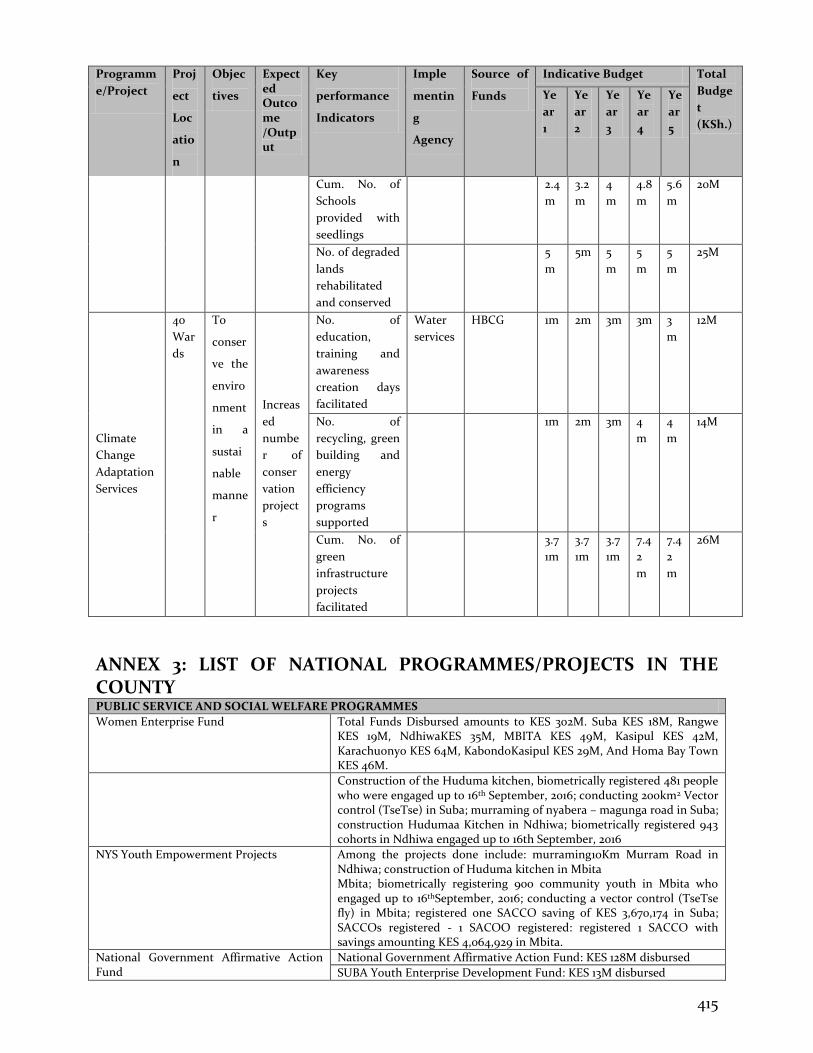
415
Programm
e/Project
Proj
ect
Loc
atio
n
Objec
tives
Expected Outcome /Output
Key
performance
Indicators
Imple
mentin
g
Agency
Source of
Funds
Indicative Budget Total
Budge
t
(KSh.)
Ye
ar
1
Ye
ar
2
Ye
ar
3
Ye
ar
4
Ye
ar
5
Cum. No. of
Schools
provided with
seedlings
2.4
m
3.2
m
4
m
4.8
m
5.6
m
20M
No. of degraded
lands
rehabilitated
and conserved
5
m
5m 5
m
5
m
5
m
25M
Climate
Change
Adaptation
Services
40
War
ds
To
conser
ve the
enviro
nment
in a
sustai
nable
manne
r
Increas
ed
numbe
r of
conser
vation
project
s
No. of
education,
training and
awareness
creation days
facilitated
Water
services
HBCG 1m 2m 3m 3m 3
m
12M
No. of
recycling, green
building and
energy
efficiency
programs
supported
1m 2m 3m 4
m
4
m
14M
Cum. No. of
green
infrastructure
projects
facilitated
3.7
1m
3.7
1m
3.7
1m
7.4
2
m
7.4
2
m
26M
ANNEX 3: LIST OF NATIONAL PROGRAMMES/PROJECTS IN THE COUNTY PUBLIC SERVICE AND SOCIAL WELFARE PROGRAMMES
Women Enterprise Fund Total Funds Disbursed amounts to KES 302M. Suba KES 18M, Rangwe KES 19M, NdhiwaKES 35M, MBITA KES 49M, Kasipul KES 42M, Karachuonyo KES 64M, KabondoKasipul KES 29M, And Homa Bay Town KES 46M.
Construction of the Huduma kitchen, biometrically registered 481 people who were engaged up to 16th September, 2016; conducting 200km2 Vector control (TseTse) in Suba; murraming of nyabera – magunga road in Suba; construction Hudumaa Kitchen in Ndhiwa; biometrically registered 943 cohorts in Ndhiwa engaged up to 16th September, 2016
NYS Youth Empowerment Projects Among the projects done include: murraming10Km Murram Road in Ndhiwa; construction of Huduma kitchen in Mbita Mbita; biometrically registering 900 community youth in Mbita who engaged up to 16thSeptember, 2016; conducting a vector control (TseTse fly) in Mbita; registered one SACCO saving of KES 3,670,174 in Suba; SACCOs registered - 1 SACOO registered: registered 1 SACCO with savings amounting KES 4,064,929 in Mbita.
National Government Affirmative Action Fund
National Government Affirmative Action Fund: KES 128M disbursed
SUBA Youth Enterprise Development Fund: KES 13M disbursed
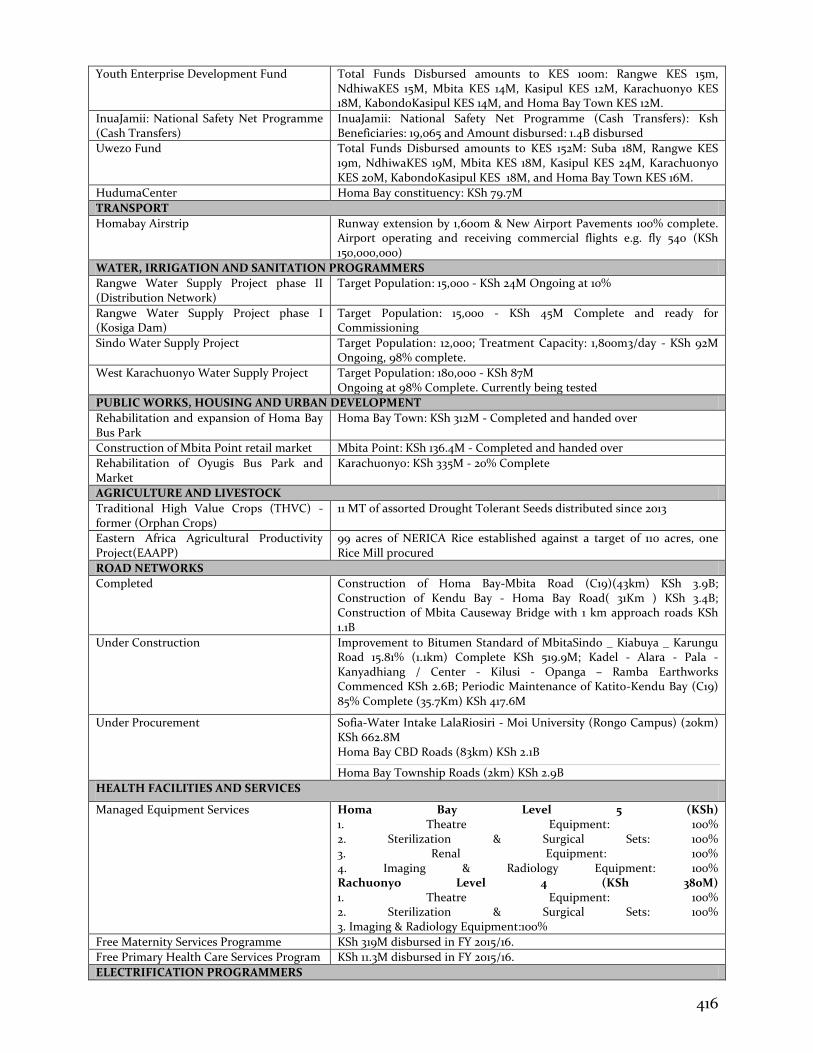
416
Youth Enterprise Development Fund Total Funds Disbursed amounts to KES 100m: Rangwe KES 15m, NdhiwaKES 15M, Mbita KES 14M, Kasipul KES 12M, Karachuonyo KES 18M, KabondoKasipul KES 14M, and Homa Bay Town KES 12M.
InuaJamii: National Safety Net Programme (Cash Transfers)
InuaJamii: National Safety Net Programme (Cash Transfers): Ksh Beneficiaries: 19,065 and Amount disbursed: 1.4B disbursed
Uwezo Fund Total Funds Disbursed amounts to KES 152M: Suba 18M, Rangwe KES 19m, NdhiwaKES 19M, Mbita KES 18M, Kasipul KES 24M, Karachuonyo KES 20M, KabondoKasipul KES 18M, and Homa Bay Town KES 16M.
HudumaCenter Homa Bay constituency: KSh 79.7M
TRANSPORT
Homabay Airstrip Runway extension by 1,600m & New Airport Pavements 100% complete. Airport operating and receiving commercial flights e.g. fly 540 (KSh 150,000,000)
WATER, IRRIGATION AND SANITATION PROGRAMMERS
Rangwe Water Supply Project phase II (Distribution Network)
Target Population: 15,000 - KSh 24M Ongoing at 10%
Rangwe Water Supply Project phase I (Kosiga Dam)
Target Population: 15,000 - KSh 45M Complete and ready for Commissioning
Sindo Water Supply Project Target Population: 12,000; Treatment Capacity: 1,800m3/day - KSh 92M Ongoing, 98% complete.
West Karachuonyo Water Supply Project Target Population: 180,000 - KSh 87M Ongoing at 98% Complete. Currently being tested
PUBLIC WORKS, HOUSING AND URBAN DEVELOPMENT
Rehabilitation and expansion of Homa Bay Bus Park
Homa Bay Town: KSh 312M - Completed and handed over
Construction of Mbita Point retail market Mbita Point: KSh 136.4M - Completed and handed over
Rehabilitation of Oyugis Bus Park and Market
Karachuonyo: KSh 335M - 20% Complete
AGRICULTURE AND LIVESTOCK
Traditional High Value Crops (THVC) - former (Orphan Crops)
11 MT of assorted Drought Tolerant Seeds distributed since 2013
Eastern Africa Agricultural Productivity Project(EAAPP)
99 acres of NERICA Rice established against a target of 110 acres, one Rice Mill procured
ROAD NETWORKS
Completed
Construction of Homa Bay-Mbita Road (C19)(43km) KSh 3.9B; Construction of Kendu Bay - Homa Bay Road( 31Km ) KSh 3.4B; Construction of Mbita Causeway Bridge with 1 km approach roads KSh 1.1B
Under Construction Improvement to Bitumen Standard of MbitaSindo _ Kiabuya _ Karungu Road 15.81% (1.1km) Complete KSh 519.9M; Kadel - Alara - Pala - Kanyadhiang / Center - Kilusi - Opanga – Ramba Earthworks Commenced KSh 2.6B; Periodic Maintenance of Katito-Kendu Bay (C19) 85% Complete (35.7Km) KSh 417.6M
Under Procurement Sofia-Water Intake LalaRiosiri - Moi University (Rongo Campus) (20km) KSh 662.8M Homa Bay CBD Roads (83km) KSh 2.1B
Homa Bay Township Roads (2km) KSh 2.9B
HEALTH FACILITIES AND SERVICES
Managed Equipment Services Homa Bay Level 5 (KSh) 1. Theatre Equipment: 100% 2. Sterilization & Surgical Sets: 100% 3. Renal Equipment: 100% 4. Imaging & Radiology Equipment: 100% Rachuonyo Level 4 (KSh 380M) 1. Theatre Equipment: 100% 2. Sterilization & Surgical Sets: 100% 3. Imaging & Radiology Equipment:100%
Free Maternity Services Programme KSh 319M disbursed in FY 2015/16.
Free Primary Health Care Services Program KSh 11.3M disbursed in FY 2015/16.
ELECTRIFICATION PROGRAMMERS
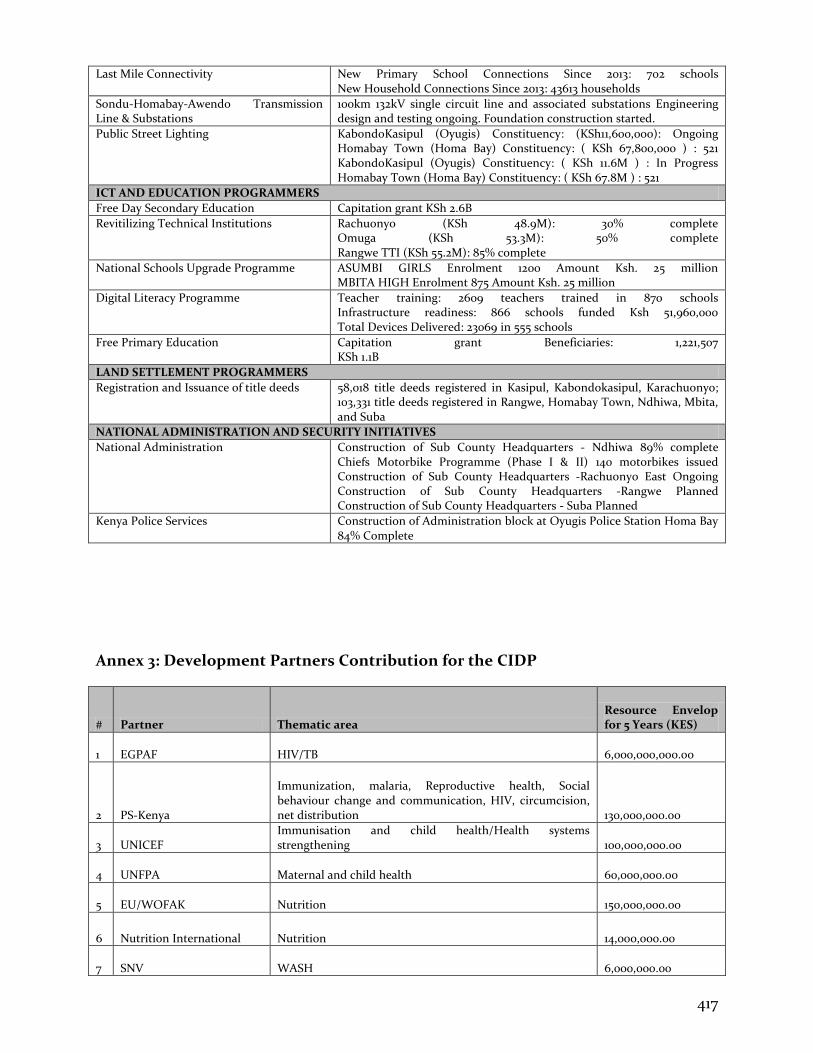
417
Last Mile Connectivity New Primary School Connections Since 2013: 702 schools New Household Connections Since 2013: 43613 households
Sondu-Homabay-Awendo Transmission Line & Substations
100km 132kV single circuit line and associated substations Engineering design and testing ongoing. Foundation construction started.
Public Street Lighting KabondoKasipul (Oyugis) Constituency: (KSh11,600,000): Ongoing Homabay Town (Homa Bay) Constituency: ( KSh 67,800,000 ) : 521 KabondoKasipul (Oyugis) Constituency: ( KSh 11.6M ) : In Progress Homabay Town (Homa Bay) Constituency: ( KSh 67.8M ) : 521
ICT AND EDUCATION PROGRAMMERS
Free Day Secondary Education Capitation grant KSh 2.6B
Revitilizing Technical Institutions Rachuonyo (KSh 48.9M): 30% complete Omuga (KSh 53.3M): 50% complete Rangwe TTI (KSh 55.2M): 85% complete
National Schools Upgrade Programme ASUMBI GIRLS Enrolment 1200 Amount Ksh. 25 million MBITA HIGH Enrolment 875 Amount Ksh. 25 million
Digital Literacy Programme Teacher training: 2609 teachers trained in 870 schools Infrastructure readiness: 866 schools funded Ksh 51,960,000 Total Devices Delivered: 23069 in 555 schools
Free Primary Education Capitation grant Beneficiaries: 1,221,507 KSh 1.1B
LAND SETTLEMENT PROGRAMMERS
Registration and Issuance of title deeds 58,018 title deeds registered in Kasipul, Kabondokasipul, Karachuonyo; 103,331 title deeds registered in Rangwe, Homabay Town, Ndhiwa, Mbita, and Suba
NATIONAL ADMINISTRATION AND SECURITY INITIATIVES
National Administration Construction of Sub County Headquarters - Ndhiwa 89% complete Chiefs Motorbike Programme (Phase I & II) 140 motorbikes issued Construction of Sub County Headquarters -Rachuonyo East Ongoing Construction of Sub County Headquarters -Rangwe Planned Construction of Sub County Headquarters - Suba Planned
Kenya Police Services Construction of Administration block at Oyugis Police Station Homa Bay 84% Complete
Annex 3: Development Partners Contribution for the CIDP
# Partner Thematic area Resource Envelop for 5 Years (KES)
1 EGPAF HIV/TB 6,000,000,000.00
2 PS-Kenya
Immunization, malaria, Reproductive health, Social behaviour change and communication, HIV, circumcision, net distribution
130,000,000.00
3 UNICEF Immunisation and child health/Health systems strengthening
100,000,000.00
4 UNFPA Maternal and child health 60,000,000.00
5 EU/WOFAK Nutrition 150,000,000.00
6 Nutrition International Nutrition 14,000,000.00
7 SNV WASH 6,000,000.00
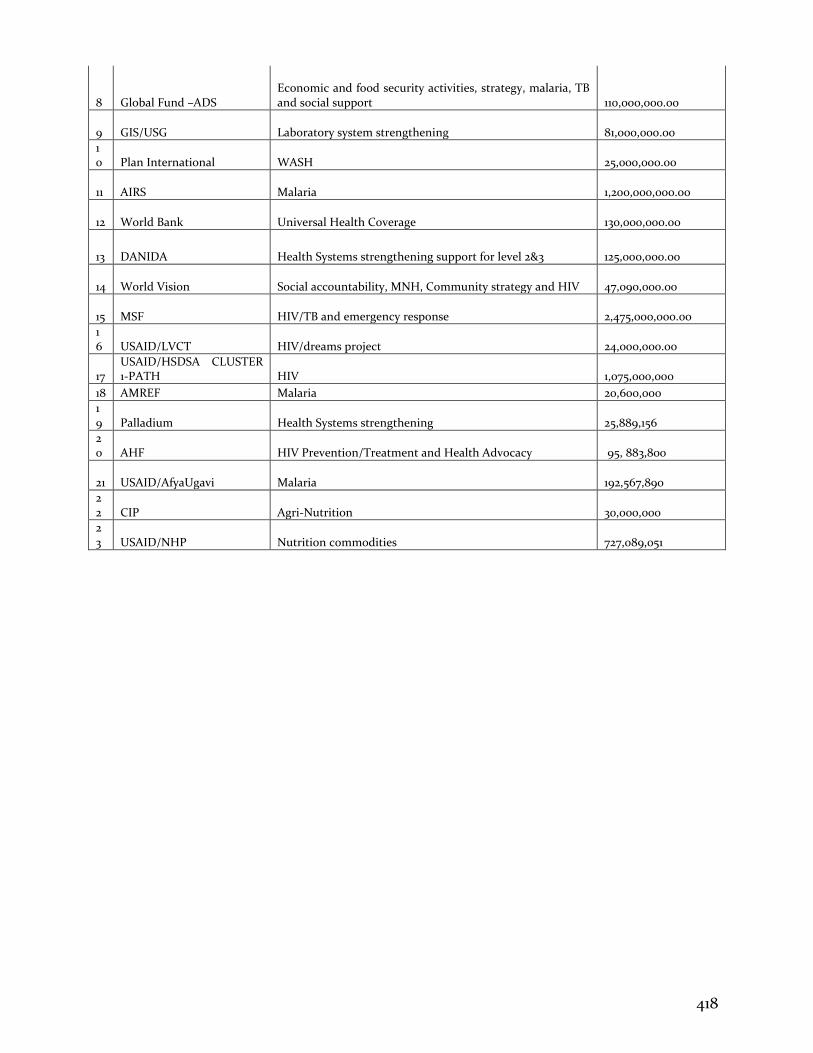
418
8 Global Fund –ADS Economic and food security activities, strategy, malaria, TB and social support
110,000,000.00
9 GIS/USG Laboratory system strengthening 81,000,000.00
10 Plan International WASH
25,000,000.00
11 AIRS Malaria 1,200,000,000.00
12 World Bank Universal Health Coverage 130,000,000.00
13 DANIDA Health Systems strengthening support for level 2&3 125,000,000.00
14 World Vision Social accountability, MNH, Community strategy and HIV 47,090,000.00
15 MSF HIV/TB and emergency response 2,475,000,000.00
16 USAID/LVCT HIV/dreams project
24,000,000.00
17 USAID/HSDSA CLUSTER 1-PATH HIV 1,075,000,000
18 AMREF Malaria 20,600,000
19 Palladium Health Systems strengthening 25,889,156
20 AHF HIV Prevention/Treatment and Health Advocacy 95, 883,800
21 USAID/AfyaUgavi Malaria 192,567,890
22 CIP Agri-Nutrition 30,000,000
23 USAID/NHP Nutrition commodities 727,089,051