customer satisfaction baseline survey report for kilifi county government ministry of health
TRANSCRIPT
CUSTOMER SATISFACTION BASELINE SURVEY REPORT FOR KILIFI COUNTY
GOVERNMENT MINISTRY OF HEALTH
KIMTUX ENTERPRISES LIMITED,
BOX 16669 MOMBASA Contact: 072 713 4649/0725247351
CUSTOMER SATISFACTION BASELINE SURVEY
REPORT
(Ministry of Health of Kilifi County)
Commissioned by the Kilifi County Government
Kilifi Office
April 2016
Lead Consultant:
Kimali Jean,
Lead Researcher:
Martin Otundo,
TOTAL SOLUTIONS

1
TABLE OF CONTENTS 1
LIST OF TABLES AND CHARTS 2
ACKNOWLEDGEMENTS 3
ACRONYMS AND ABBREVIATIONS 4
EXECUTIVE SUMMARY 5
1.0 INTRODUCTION 7
1.1 Overview of the Kilifi County Ministry of Health 7
1.1.1 Health Access 8
1.1.2 Morbidity 8
1.1.3 Nutrition Status 8
1.1.4 Immunization Coverage 9
1.1.5 Access to Family Services /Contraceptive Prevalence 9
1.1.6 Satisfaction of Millennium Development Goal 4: Reduce Child Mortality 9
1.1.7 Satisfaction of Millennium Development Goal 5: Improve Maternal Health 9
1.2 Background of Customer Satisfaction in Kenya and Kilifi county 9
1.3 Objectives of the Customer Satisfaction Survey 10
1.3.1 Customer Care and Monitoring 10
1.3.2 Survey Objectives 11
2.0: METHODOLOGY 11
2.1 Research Design 11
2.2 Target Population 11
2.3 Sample Size 11
2.4 Data Collection Instruments and Procedure 12
2.4.1 Desk review 12
2.4.2 Field Survey 12
2.4.3 Research Framework 13
2.4.4 Field Administration 13
2
2.4.5 Data Specification and collection 13
2.5 Data Analysis 13
2.6 Limitations of the Study 14
3.0: BASELINE FINDINGS AND ANALYSIS 15
3.1 Response Rate 15
3.2 Basic Information of the Respondents. 15
3.2 General Responses about Customer Satisfaction and their Discussions 16
3.2.1 Patient Registry Section 16
3.2.2 Triage Section 18
3.2.3 Examination Section (Doctor/Physician) 19
3.2.4 Laboratory Section 20
3.2.5 X-ray Section 22
3.2.6 Pharmacy Section 23
3.2.7 Cash Payment Office/Section 24
3.2.8 Rating Customer Satisfaction on a Likert Scale 25
3.2.9 Recommendations by the Patients about the Health Facilities 26
4: 0 CONCLUSIONS AND RECOMMENDATIONS 27
4.1 Conclusions 27
4.2 Recommendations 28
References 29
Appendices 30
Appendix 1: SURVEY QUESTIONNAIRE 30
LIST OF TABLES AND CHARTS
3
TABLES
Table 3.1: Patients Information 15
Table 3.2: Time Spent at the Patient Registry Section 17
3.2.2 Triage Section 18
Table 3.4 Time taken at Examination (Doctor/Physician) Section 19
Table 3.5 Time taken at Laboratory Section 21
Table 3.6 Time taken at X-ray Section 22
Table 3.7 Time taken at Pharmacy Section 23
Table 3.8 Time taken at Cash Payment Section 24
Table 3.9: Rating Customer Satisfaction 26
ACKNOWLEDGEMENTS
4
On behalf of Kimtux Enterprise, we would like to convey sincere thanks and gratitude to
everyone who contributed to the successful completion of this Kilifi county Ministry of
Health baseline survey. This includes the co-partner heads (Mr. E. Mugabe and Mr. Kimali)
for the endless support given. The work of our lead researcher and data analyst (Mr. M.
Otundo) is indeed appreciated earnestly.
Sincere gratitude goes to the management and staff of Kilifi county Ministry of Health who
did give out this work. We also extend our deepest appreciation to the supervisors and
enumerators, staff and county ministry management; we note with gratitude their
contributions towards this study.
We would also like to thank the development partners for their support in this effort of
enhancing sustainable livelihoods in this region. Their financial, technical and material
support is greatly appreciated.
Finally, we would like to thank all community members who participated at various levels of
the study for their cooperation during the survey. We reiterate that the findings have been
handled as confidential and were only used for purposes of statistical compilation of this
report.
Lead Consultants
Kimali Jean 0721246744
Martin Otundo 0721246744
ACRONYMS AND ABBREVIATIONS

5
ASAL: Arid and Semi Arid Lands
SPSS: Statistical Program for Social Scientists
NGOs: Non-Governmental Organizations
UTI: Urinal Track Infection
WHO: World Health Organization
EXECUTIVE SUMMARY

6
The customer satisfaction baseline survey was conducted in Kilifi County’s ministry of
health in the month of April 2016 to inform stakeholders on the performance of the ministry
and predict the future trends of performance as stipulated in the county governments’ act of
employees’ evaluation. This study focused on one category of customers’ and this included
the services delivery in terms of times spent at the various sections of the health services
providers.
The Kilifi county Ministry of Health on average has done better in providing its services to
its patients. This is indicated by an overall rating which got an average support of 66.6% on a
scale. The patients rate the payment section and the doctor’s section as some of the areas that
are on average doing well as opposed to the previous times. The better services have been
attributed to issues like, better work environment provided by the county government e.g
improving on general infrastructure by building and lighting various
dispensaries/hospitals/health centres, hiring more personnel, procuring more medicine,
medical equipment and many more.
Due to its better services than it was previously, a greater percentage of the respondents
argued that they can recommend their close people for services in the health centres. From
the field report, 66% of the respondents argued that they could recommend their close
people to the various facilities while the remaining 34% argued that they could recommend
their family people or friends to these health facilities.
The research recommended that: The county hospitals should adopt modern systems of
keeping records at the registry points so that the information about the patients can
automatically be generated and avoid the long queues and manual checking of the records of
the patients; The county government should come up with equipped laboratories with
various equipment of testing various diseases. The x-rays also should be extended to other
points in the county as opposed to two major hospitals. This shall help in reducing the
congestions and times wasted in scrambling for the services; and; The county government
should increase the variety of drugs in its store so that the poor people of Kilifi can be saved
of the trouble of being sent to various points to buy medicine while they are already drained
with life demanding need food and water. The government should callable with other bodies
like donors to get more medicine for its people. ‘Finally the government should better the
health infrastructure, increase the number of employees and increase the coverage of
dispensaries and health centres across the county. This shall help reduce congestion and
eliminate the challenges of wasted time and services delivery.
1.0 INTRODUCTION

7
1.1 Overview of the Kilifi County Ministry of Health
Kenya took a great leap in adapting the new Constitution in August 2010. With the new
Constitution comes an expansive Bill that created the county governments under devolution.
With the 47 counties created, there are at least 11 ministries with each county that are aimed
at steering and driving Kenya to the middle level economy by 2030. Among the most
strategic ministry is the ministry of health that deals with one on one with the lives of the
citizens. County Background report of Kilifi shows that, Kilifi County is one of the six coastal
counties. It borders Kwale County to the South West, Taita Taveta to the West, Tana River to
the North, Mombasa to the South and the Indian Ocean to the East. Kilifi covers an area of
approximately 12,609.7 square kilometres.
It had an estimated population of 1,109,735 as per the National Census of 2009. With an
annual population growth rate of 2.9% assuming constant rates of fertility and mortality, the
population is estimated to rise to 1,399,509 by the year 2017. The male to female ratio is
about 1:1 with 52.1% female, Male 47.9%. Women of reproductive age comprises of 23.2% of
the population. A significant proportion of the population is composed of <15 years (47.5%)
with the youth making up 19.4%, the age group 25-59 years making up 28% and the elderly
comprise 5% of the population. Children under one year make up 3.6% and those less than 5
years 17.3% of the population. The life expectancy of the county is 56 years, (KDSP 2005/10).
It comprises of seven sub-counties namely; Malindi, Magarini, Ganze, Rabai, Kaloleni, Kilifi
South and Kilifi North. County’s Vision is to be a leading, prosperous and secure county for
high quality life while it’s Mission is to provide an enabling environment and participatory
resource management for efficient and effective service delivery for all. Core Values include:
i. The rule of law, democracy and participation of the people. ii. Human dignity, equity,
social justice, inclusiveness, equality, human rights, nondiscrimination and protection of the
marginalized. iii. Good governance, integrity, transparency and accountability; and, iv.
Sustainable development.
The county has four main livelihoods zones including Marginal Mixed Farming (MMF)
comprising 44 percent of the population, cash cropping/dairy (22 percent), Mixed Farming
(11 percent) and ranching (two percent). Other livelihood zones include fishing and
mangrove (three percent), formal employment (14 percent) and forest/tourism and casual
labour (two percent each). The county is served with a relatively above score roads network;
with major road networks being the Malindi-Mombasa Highway that links the county to
Tana Delta and Lamu counties, The Mombasa-Nairobi highway that links the county to
Mombasa and other up country counties while the Kaloleni Mariakani road makes
accessibility to interior parts of the county from the main Nairobi –Mombasa highway.
The ministry of health is a very important organ of this county. According to the information
available in the recently launched website by the county government in its strategic paper of
2013/2017, the ministry information can be well understood as outlined below:

8
1.1.1 Health Access
The county has nine level 4 public hospitals, 20 level 3 public health Centres, 197 level 2
public dispensaries, one mission hospital, two private hospitals, one armed forces hospital,
five private nursing homes and 107 private clinics. The bed capacity in hospitals is 498, in
health Centres is 30 and in nursing homes is 16. The doctor/patient ratio is 1:42,625, clinical
officer/patient ratio is 1:30,194 while the nurse/patient ratio is 1:3,396. Malindi, Kilifi and
Mariakani sub-county hospitals are the only referral hospitals in the county. Kilifi sub-
county hospital hosts KEMRI that is involved in various health research activities. The
inpatient bed capacity in health facilities in the county is 508 beds.
1.1.2 Morbidity
The average morbidity rates in the county are 12.9 percent with females having higher
morbidity rates at 15.4 percent as compared with men at 9.9 percent. The most common
causes of morbidity in the county are malaria/fever, lower respiratory infections, stomach
ache, diarrhea and flu.
1.1.3 Nutrition Status
The population under five years was estimated to be 210,916 as at 2012 and is projected to
reach 231,413 in 2015 and 254,032 in 2017 in the county. Stunting and wasting in children less
than five years is quite high in the county with 48.8 percent of the children being stunted.
The stunting could be linked to the poor infant and young child feeding practices. The
county needs to strengthen projects and programmes that are aimed at reducing this trend.
There is need to increase nutrition services as well as to increase coverage and manage
children who are malnourished. There is need to establish community units where they
haven’t been established in the county as this will increase case referrals for malnourished
children.
1.1.4 Immunization Coverage
The national immunization coverage is 77 per cent compared to that of the county which is
78.7 per cent. This shows a slight margin between county and national figures but advocacy
and mobilization of community members is required to improve the rates.
1.1.5 Access to Family Services /Contraceptive Prevalence
The county has been experiencing rapid population growth at 3.05 percent due to high
fertility, improved child survival and influx of people from outside the county to
government planned settlement schemes and other private schemes hence increasing the
demand for health services. The contraceptive prevalence rate is low at 37.3 percent thus
implying a low utilization of family planning services. This is further exhibited by relatively
low Anti-Natal Clinics attendance by pregnant women at 50.5 percent.
1.1.6 Satisfaction of Millennium Development Goal 4: Reduce Child Mortality

9
The county’s target under this goal is to reduce under- five mortality rate by two thirds by
2015. The infant mortality rate in the county is 71 per 1,000 live births while Under-five
mortality rate is 87 per 1,000 live births. Immunization coverage against measles is 85
percent. Drugs for prevention of mother to child transmission of HIV are available in almost
all Government health facilities in the county. Despite the efforts put by the government and
stakeholders in this sector the county is still below the national status. Increased efforts in
health campaigns & awareness, equipping and staffing of health facilities are some of the
strategies that can be adopted if this target is to be met by 2015.
1.1.7 Satisfaction of Millennium Development Goal 5: Improve Maternal Health
The county’s target under this goal is to reduce by three quarter the maternal mortality rate.
Proportion of births attended by skilled personnel is at 30 percent while maternal mortality
rate is 488 per 100,000live births and antenatal care coverage of 22 percent as per the as at
2012. The county has contraceptive prevalence rate of 34% and a family planning uptake of
39.86 percent. The proportion of births attended to by skilled personnel is 43.8 percent,
maternal mortality rate of 488 per 100,000 live births and contraceptive use of 45.5 percent as
per the national status. The progress towards achievement of this MDG targets is low
compared to the national status and this is a result of cultural believes & religious practices,
high incidences of poverty levels, in accessibility of health facilities, poor infrastructure,
inadequate health personnel among other factors.
It is essential that such ministry survey is able to measure its achievements and provide
information about its successes and failures ensuring consistent, accurate and meaningful
data. It is in this context that Kimtux in collaboration with Kilifi county government’s
ministry of health conducted this baseline survey.
1.2 Background of Customer Satisfaction in Kenya and Kilifi county
European Commission Report of 2015 shows that, customer satisfaction is a term frequently
used in marketing. While it's often abbreviated as CSAT, it is more correct to abbreviate it as
CSat. It is a measure of how products and services supplied by a company meet or surpass
customer expectation. Customer satisfaction is defined as "the number of customers, or
percentage of total customers, whose reported experience with a firm, its products, or its
services (ratings) exceeds specified satisfaction goals." In a survey of nearly 200 senior
marketing managers, 71 percent responded that they found a customer satisfaction metric
very useful in managing and monitoring their businesses.
It is seen as a key performance indicator within business and is often part of a Balanced
Scorecard. In a competitive marketplace where businesses compete for customers, customer
satisfaction is seen as a key differentiator and increasingly has become a key element of
business strategy. "Within organizations, customer satisfaction ratings can have powerful
effects. They focus employees on the importance of fulfilling customers' expectations.
Furthermore, when these ratings dip, they warn of problems that can affect sales and
profitability. These metrics quantify an important dynamic. When a brand has loyal

10
customers, it gains positive word-of-mouth marketing, which is both free and highly
effective."
Therefore, it is essential for businesses to effectively manage customer satisfaction. To be able
do this, firms need reliable and representative measures of satisfaction. "In researching
satisfaction, firms generally ask customers whether their product or service has met or
exceeded expectations. Thus, expectations are a key factor behind satisfaction. When
customers have high expectations and the reality falls short, they will be disappointed and
will likely rate their experience as less than satisfying. The Kilifi County ministry of health is
committed to satisfying their customers’ needs and this is why such a survey was conducted.
1.3 Objectives of the Customer Satisfaction Survey
1.3.1 Customer Care and Monitoring
The importance of a customer to an organization while generally accepted by management
and staff is sometimes not fully incorporated in the budgets, planning, organizational
structure, corporate strategies and other aspects of the organization that would help
actualize the concept and thereby emphasize the importance of placing customer needs at
the core of corporate objectives.
There is need to:
Develop an overall understanding of who the customer is to the organization
Highlight the importance and methods of determining customer needs
Determine the customer satisfaction levels as determined by the time taken in
services delivery.
Determine the general perception about the county health services with regards to
service delivery.
Propose appropriate action plan for addressing the emerging issues for
recommendations and suggestions for interventions and for further improvement.
Facilitate quality provision of services to patients and to develop sets of ideas and
principles to revitalize the hospitals in Kilifi County in order to create positive /
conducive customer relations.
Instill positive attitudes and beliefs towards their customers and other stakeholders,
and realization of the broad spectrum of the "corporate customer" and his ever-
growing needs and wants.
In understanding the customer segments of the Ministry, the consultant tried to understand
and appreciate who the customer is (children, male, and female), the time of service as
scored against the expectations of the customers, the customers’ views towards the
employees and the proposed future adjustments for better results for the ministry. Generally,
in trying to unravel customer satisfaction, the consultant aimed at determining customer
satisfaction levels, weaknesses and strengths in the services provided to the customers and
identify any gaps and areas requiring improvement.
11
1.3.2 Survey Objectives
The survey aimed at coming up with recommendations which are backed by findings in the
field and within the Ministry, which were to enable the Ministry to:
Strengthen its capacity to plan and implement a customer satisfaction strategy
Enable it to set up a coordination mechanism that prioritizes customer satisfaction
Provides the necessary expertise that ensures the attainment of high standards in the
area of customer satisfaction.
2.0: METHODOLOGY
This section discusses the methodology that was employed in the research process. It details
the research design, the population to be studied, the nature of data to be collected and data
analysis technique used.
2.1 Research Design
The research was executed broadly along the lines of the set objectives. Descriptive research
design, using summary statistics was adopted that showed the different levels of satisfaction
with different issues as percentages. The study generally examined every issue in terms of
whether the different kinds of the Ministry’s customers were satisfied or not and if so the
degree of satisfaction of lack thereof was then asked as a follow up. This method was able to
isolate services that are doing well and those which need to be looked into by the Ministry.
The survey depended on the literature provided by the Ministry, which helped in
developing survey instruments.
2.2 Target Population
The target population for this survey was the patients who visited the various public health
providence facilities (the hospitals, dispensaries and health centres) in a continuous running
one week schedule. The total target population was therefore 11,815 customers in a week
running; also averaged as 1680 customers/clients per day. The population came from the
patients served by the various health facilities in the 7 sub-counties (21 health facilities).
2.3 Sample Size
The total number of questionnaires developed that were sent out was 323 daily in the various
hospitals. This was calculated by use of Yamane formula of 1970
According to Mugenda and Mugenda (2003), when a population is less than 10,000 for social
researches, a desired sample of 10% can be adopted. However, this has to be more than 30
respondents for better data analysis. For this study, the sample was given by the formula
below.

12
n = N
1 + N (e) 2
n = Desired sample size when population is less than 10,000.
e= sampling error
N = Population size
At 95% confidence level, the sampling error is 0.05. Therefore the desired sample was:
N= 1680 = 323
1 + 1680(0.05)2
Given that the target population was heterogeneous due to the nature of the factors related
to the medical facilities in the Kilifi County, stratified sampling was used to allow full
participation of the patients/respondents.
2.4 Data Collection Instruments and Procedure
The study used the following methods to collect data:
2.4.1 Desk review
Relevant secondary material, which included among other documentation in the Ministry of
health, background documents and the Ministry’s service charter were reviewed before
embarking on the fieldwork. The website of the Ministry of health that was recently
launched was also visited to elicit valuable information. Various documents like the county
health strategy papers were also reviewed for more information. This review was meant to
get a proper understanding of the Ministry.
2.4.2 Field Survey
A field survey covering clients of the Ministry was conducted. The survey employed a
questionnaire distribution’s criteria- for customers seeking medical attention from different
hospitals/dispensaries/health units in Kilifi. The survey tools were administered to a
representative sample of clients with the aim of getting representative ideas on selected
survey themes. The questionnaires were presented by 50 research assistants who tirelessly
worked in the health providence facilities in the county for over two weeks composed of
continuous schedule of Monday to Friday. The reason behind the extended time in the field
was to allow the research assistants run a continuous questionnaires administration to the
various patients from the various health facilities.
It is worth noting that this was done because the survey aimed at getting detailed
information form the clients/customers/patients without raising suspicion among the
employees. If such suspicion was allowed to come into play, the employees could influence
the results or be biased in the services providence; influencing the outcome of the survey.

13
2.4.3 Research Framework
The sample of clients was drawn based on the areas served by the various health facilities as
provided by Ministry of Health of Kilifi County. The sample was stratified according to sub
counties that included areas under Ganze Sub County, Kaloleni Sub County, Kilifi North,
Kilifi South, Malindi Sub County, and Magarini Sub County. Patients/customers were
subjected to exit survey using random sampling technique at points of exit in the Ministry of
Health’s health providers countywide. In cases where the respondents were not able to read
and write, the research assistants helped them to fill the questionnaires and in cases where
the patient was the child, the guardian or the parent was allowed to give information on
their behalf.
2.4.4 Field Administration
To administer the questionnaires research assistants were recruited and trained in data
collection techniques. The research assistants were also picked from the local community
(Mijikenda) for easy translation of the information when required. In this regard, the
Principal researchers went through the questionnaire and discussed each question in great
detail to avoid any misinterpretation. The questionnaires were pre-tested in various health
centres in the neighbouring Mombasa county health services providers of Mlaleo, Makadara;
Likoni and Changamwe, and necessary adjustments were then made before commencement
of the survey.
2.4.5 Data Specification and collection
The study used a customized survey data collection instrument, (Individual (patient)
customer satisfaction questionnaire). The individual customer satisfaction questionnaire was
used to collect information from customers seeking medical services from the various
medical facilities in the county. The instruments were pre-tested using the test retest method
among 40 respondents from the 4 mentioned medical facilities in Mombasa county and
adjusted as appropriate.
2.5 Data Analysis
The study used SPSS version 20.2 package to analyze the quantitative data generated
through the questionnaires. The data generated was then used to establish association
between study variables.
2.6 Limitations of the Study
In some of the hospitals like those in the rural areas in Kaloleni, patients were not
ready to give information since they thought it was to be used against them.

14
However, the suspicion was eliminated by explaining to them that the research
aimed at getting information that could allow them get better services.
Some of the respondents did not seem to understand the questions and made no
effort to ask for assistance in filling the questionnaire hence ending up not
participating in the study.
The survey was more of an investigation research that needed a lot of privacy more
specifically from the medics so that they could not influence their working rates. This
in a way limited the explanations of the research assistants in their continuous visits
to the health facilities. However, this was solved by letting the hospital heads
understand that a basic work environment study was going on as detailed in the
questionnaire that was given to keep the medics busy.
3.0: BASELINE FINDINGS AND ANALYSIS
This section presents the findings from the field; it analyzed the data and interprets it by use
of frequency tables, graphs and central tendencies measures.

15
3.1 Response Rate A total number of questionnaires distributed each day were 323. This was done for 5 days and in each day; those valid questionnaires were sorted and accepted for the study. The average then was computed. After the calculations, a total of 250 questionnaires were fit for the study. Therefore the response rate was 77.4%. This high response rate was linked to the fact that the research assistants were very committed and understood the dynamics of the local community. 3.2 Basic Information of the Respondents. The major information that was sought from the clients touched on their nature of
relationship with the county ministry and how long they have been clients and this is
indicated by the table below:
Table 3.1: Patients Information
The baseline survey results indicated that, the female gender dominated the hospitals,
followed by the male and finally the children. This was represented by 60%, 30% and 10%
respectively. The dominance of the female gender in the hospitals can be explained well by
the World Health Organisation (2015) that shows; in Africa, women and children are more
prone to diseases like malaria, measles, family injuries and lifestyle diseases like
Personal detail Tag Frequency Percentage
Gender
Male 75
30%
Female Children Total
150
25
250
60%
10% 100%
Age brackets
0-10 Years
11 – 20 Years
21 – 30 Years
31 – 40 Years
41 – 50 Years
51 –60 Years
Above 60 Years
25
38
38
50
75
12
12
10%
15% 15% 20% 30% 5% 5%
Total 250 100%
Average Total 250 100%

16
malnutrition, blood pressure, breast/cervical cancer, fistula ,obesity and many more due to
family chores. Also, from the survey, it is indicative of the role played by women in taking
care of the children and aged in the community.
Interestingly, ages between 41 – 50 years and 31 – 40 years dominated the survey with 30%
and 20% respectively. This can be explained by the GOK (2014) in its survey report that
shows, a great percentage of the people seeking medical help from the public facilities are
those in the mid late 30’s and early 50’s. These brackets are composed of almost old parents
who did not benefit very much by accessing better education, securing formal jobs, investing
for their health, have not had children who have secured better jobs to take care of their bills
and many more.
However, the trend has changed with ages between 0-10 years who are 10%, 11 – 20 years
who are 15%, and 21 – 30 years who are 15% because they have not on strong cases visited
the public hospitals regularly. This is a true trend in the country whereby people between
the ages of 20’s and 30’s have either some formal employment and with the information era,
they feel that better medical services are provided at the private hospital or they can buy
drugs across the pharmaceutical shops. 0-10 Years is composed of children who seem not to
be very pronounced due to the fact that most of the parents prefer taking their kids to private
hospital. Finally a reduction in the ages between 51 –60 years and above 60 years as
represented by 5%, could be explained by the fact most of the aged in Kilifi county are poor
(World Bank, 2014), are discriminated by the public (Unite For Sight, 2015) and many more.
3.2 General Responses about Customer Satisfaction and their Discussions
A number of questions were asked in the questionnaire that comprised of both open
ended and closed ended questions. The questions were asked in relation to the time
taken to be served in various sections that were classified into: a) Patient Registry
Section, b) Triage Section, c) Examination (Doctor/Physician), d) Laboratory, e)
X-ray, f) Pharmacy, and, e) Cash Payment Office.
3.2.1 Patient Registry Section
The survey sought to establish the time taken for patients to be served in the
Patient Registry section. This is the first section where the patients visit
immediately in the hospital. The questions included the specific time brackets
spent, the expected time and some reason for the time spent at the section.
The response on the time taken for contact with the medical centre staff is as
indicated in the table 3.2 below:
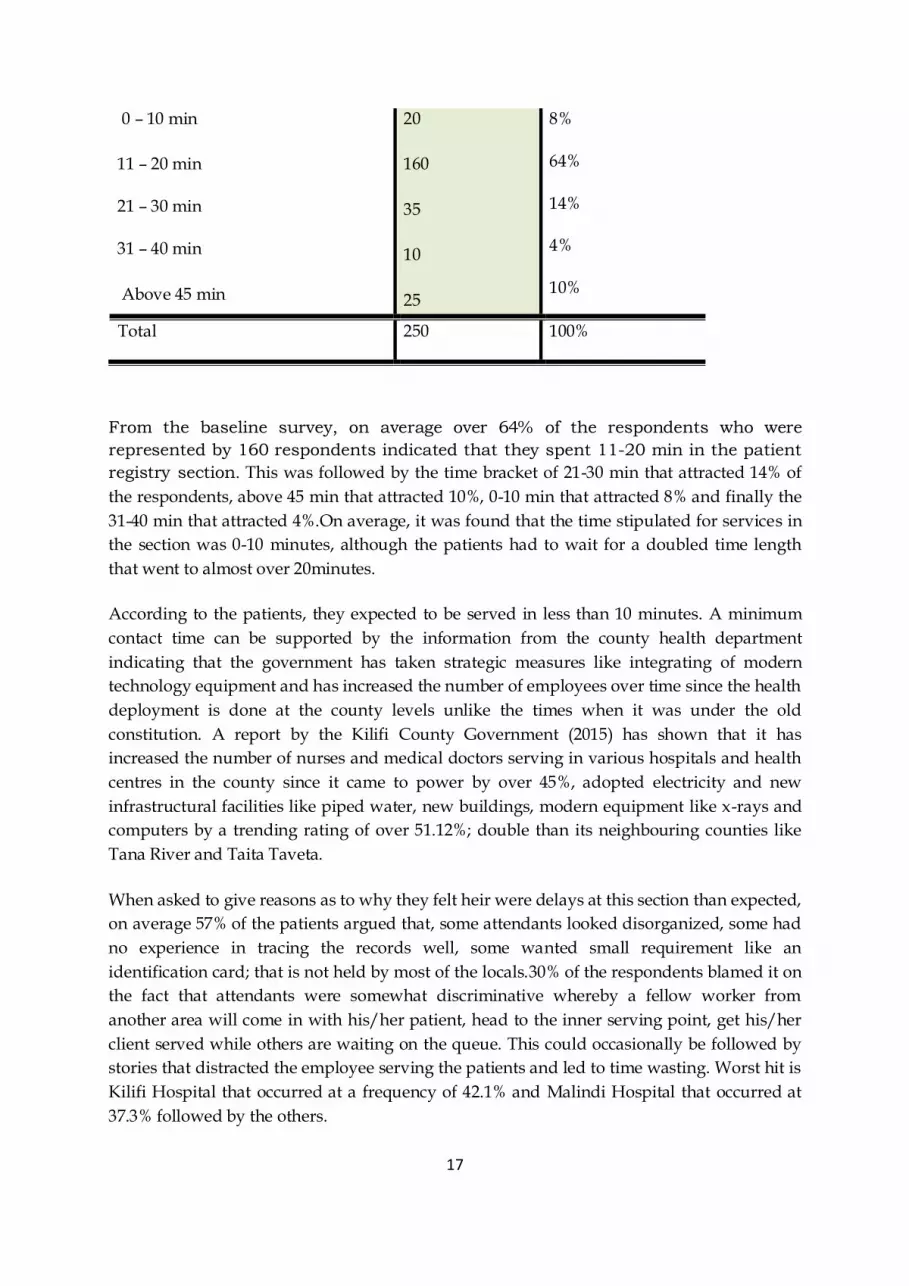
Table 3.2: Time Spent at the Patient Registry Section
Time in Minutes Frequency Percentage
17
From the baseline survey, on average over 64% of the respondents who were
represented by 160 respondents indicated that they spent 11-20 min in the patient
registry section. This was followed by the time bracket of 21-30 min that attracted 14% of
the respondents, above 45 min that attracted 10%, 0-10 min that attracted 8% and finally the
31-40 min that attracted 4%.On average, it was found that the time stipulated for services in
the section was 0-10 minutes, although the patients had to wait for a doubled time length
that went to almost over 20minutes.
According to the patients, they expected to be served in less than 10 minutes. A minimum
contact time can be supported by the information from the county health department
indicating that the government has taken strategic measures like integrating of modern
technology equipment and has increased the number of employees over time since the health
deployment is done at the county levels unlike the times when it was under the old
constitution. A report by the Kilifi County Government (2015) has shown that it has
increased the number of nurses and medical doctors serving in various hospitals and health
centres in the county since it came to power by over 45%, adopted electricity and new
infrastructural facilities like piped water, new buildings, modern equipment like x-rays and
computers by a trending rating of over 51.12%; double than its neighbouring counties like
Tana River and Taita Taveta.
When asked to give reasons as to why they felt heir were delays at this section than expected,
on average 57% of the patients argued that, some attendants looked disorganized, some had
no experience in tracing the records well, some wanted small requirement like an
identification card; that is not held by most of the locals.30% of the respondents blamed it on
the fact that attendants were somewhat discriminative whereby a fellow worker from
another area will come in with his/her patient, head to the inner serving point, get his/her
client served while others are waiting on the queue. This could occasionally be followed by
stories that distracted the employee serving the patients and led to time wasting. Worst hit is
Kilifi Hospital that occurred at a frequency of 42.1% and Malindi Hospital that occurred at
37.3% followed by the others.
0 – 10 min
11 – 20 min
21 – 30 min
31 – 40 min
Above 45 min
20
160
35
10
25
8%
64%
14%
4%
10%
Total 250 100%

18
3.2.2 Triage Section
The survey sought to establish the time taken for patients to be served in the Triage
Section. This is the second section where the patients visit in the hospital. The
questions included the specific time brackets spent, the expected time and some
reason for the time spent at the section.
Table 3.3 Time taken at Triage Section
From the baseline survey, on average over 70% of the respondents who were
represented by 175 respondents indicated that they spent 11-20 min in the Triage
Section. This was followed by the time bracket of 21-30 min that attracted 16% of the
respondents, above 45 min that attracted 6%, 0-10 min that attracted 4.4% and finally the 31-
40 min that attracted 3.6%.On average, it was found that the time stipulated for services in
this section also by the management was 0-10 minutes, although the patients had to wait for
a doubled time length that went to almost over 20 minutes.
According to the patients, they expected to be served in less than 10 minutes as proposed by
the county health sector. This expectation of a minimum contact time for service can be
supported by the information from the county health department indicating that the
government has taken strategic measures like in giving the county health service a new look.
This includes: integrating modern technology, acquiring better medical equipment, increased
the number of employees over time since the health employment and deployment is done at
the county levels unlike the times when it was under the old constitution, etc.
Also, the Kilifi County Government (2015) report indicated that, there has been an
increased number of nurses and medical doctors serving in various hospitals and health
centres in the county since it came to power in 2013 by over 45%, adopted electricity and new
infrastructural facilities like piped water, new buildings, modern equipment like x-rays and
computers by a trending rating of over 51.12%; double than its neighbouring counties like
Tana River and Taita Taveta. This has also been shown in its efforts of collaborating with
other bodies like KEMRI, UNICEF, USAID, WHO etc.
Time in Minutes Frequency Percentage
0 – 10 min
11 – 20 min
21 – 30 min
31 – 40 min
Above 45 min
11
175
40
9
15
4.4%
70%
16%
3.6%
6%
Total 250 100%
19
When asked to give reasons as to why they felt there were delays at this section than
expected, on average 54% of the patients argued that, some attendants looked disorganized
and relaxed/ not ready to handle their duties at speed. This was pronounced in areas of
Kaloleni and Ganze.
3.2.3 Examination Section (Doctor/Physician)
The survey sought to establish the time taken for patients to be served in the
Examination Section (Doctor/Physician). This is the third section where the
patients visit in the hospital. The questions included the specific time brackets
spent, the expected time and some reason for the time spent at the section.
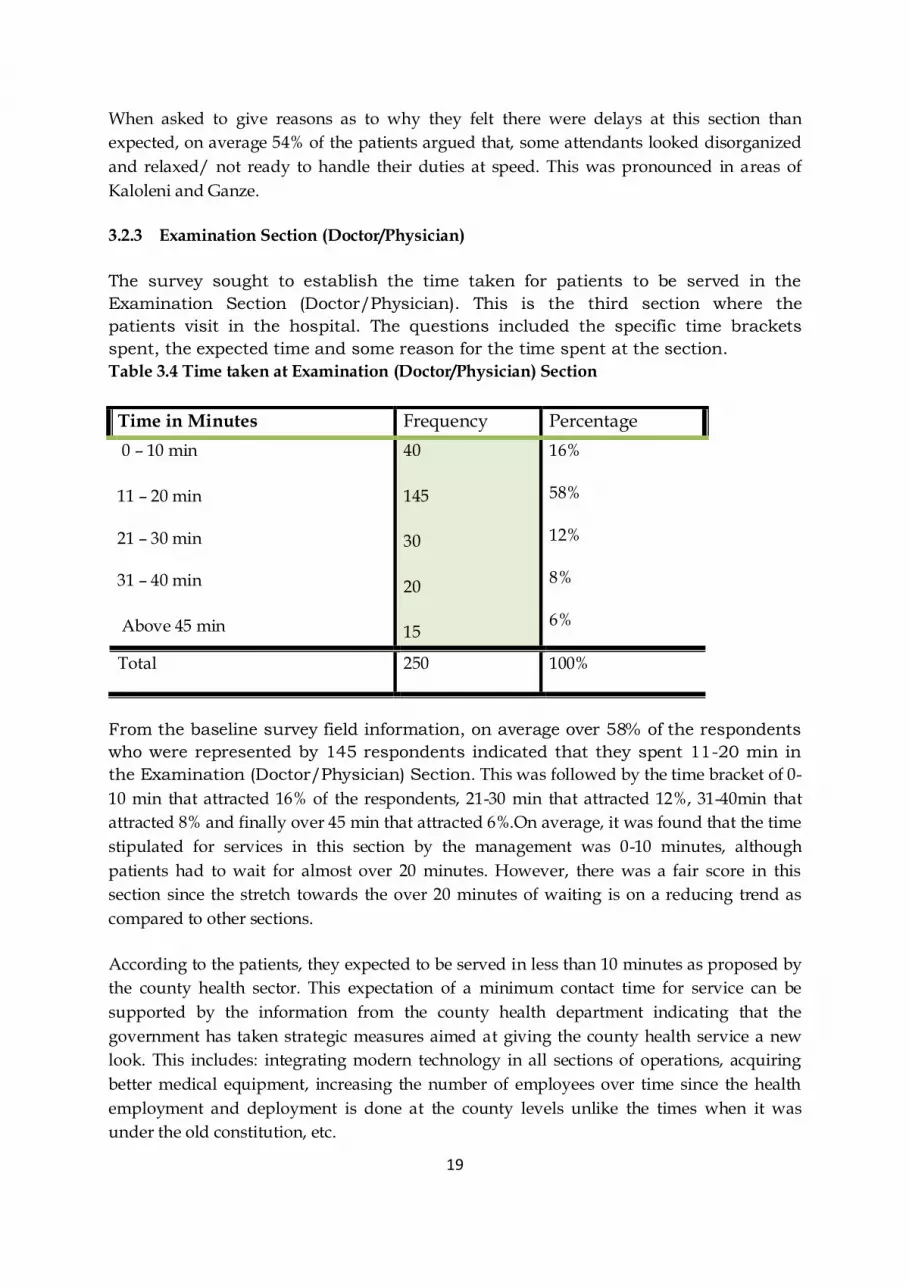
Table 3.4 Time taken at Examination (Doctor/Physician) Section
From the baseline survey field information, on average over 58% of the respondents
who were represented by 145 respondents indicated that they spent 11-20 min in
the Examination (Doctor/Physician) Section. This was followed by the time bracket of 0-
10 min that attracted 16% of the respondents, 21-30 min that attracted 12%, 31-40min that
attracted 8% and finally over 45 min that attracted 6%.On average, it was found that the time
stipulated for services in this section by the management was 0-10 minutes, although
patients had to wait for almost over 20 minutes. However, there was a fair score in this
section since the stretch towards the over 20 minutes of waiting is on a reducing trend as
compared to other sections.
According to the patients, they expected to be served in less than 10 minutes as proposed by
the county health sector. This expectation of a minimum contact time for service can be
supported by the information from the county health department indicating that the
government has taken strategic measures aimed at giving the county health service a new
look. This includes: integrating modern technology in all sections of operations, acquiring
better medical equipment, increasing the number of employees over time since the health
employment and deployment is done at the county levels unlike the times when it was
under the old constitution, etc.
Time in Minutes Frequency Percentage
0 – 10 min
11 – 20 min
21 – 30 min
31 – 40 min
Above 45 min
40
145
30
20
15
16%
58%
12%
8%
6%
Total 250 100%

20
Also, the Kilifi County Government (2015) report indicated that, there has been an
increased number of nurses and medical doctors serving in various hospitals and health
centres in the county since it came to power in 2013 by over 45%, adopted electricity and new
infrastructural facilities like piped water, new buildings, modern equipment like x-rays and
computers by a trending rating of over 51.12%; double than its neighbouring counties like
Tana River and Taita Taveta. This has also been shown in its efforts of collaborating with
other bodies like KEMRI, UNICEF, USAID, WHO etc.
When asked to give reasons as to why they felt there were delays at this section than
expected, on average 58% of the patients surprisingly did not blame it on the doctors/
Physician. Instead, they argued that, most of the patients gave unnecessary detailed
information to the doctors since they felt that if they gave them such historical information
can help them get the effective medication. It was noted that the complications of the patients
also differed and a number of them had different explanation and different problems that
required different checks/attention. For example, a statistical average of 59.01% of the
respondents indicated that they spent quality time with the doctor and felt better than the
fear they had before, without even being subjected to medication.
3.2.4 Laboratory Section
The survey sought to establish the time taken for patients to be served in the
Laboratory Section. This is the fourth section where the patients visit in the
hospital if need be. The questions included the specific time brackets spent, the
expected time and some reason for the time spent at the section.
Table 3.5 Time taken at Laboratory Section
Time in Minutes Frequency Percentage

21
From the baseline survey field information, on average over 66% of the respondents
who were represented by 165 respondents indicated that they spent the longest
time in this section of over 45 min as compared to other sections. This can be
attributed to the fact that most of the laboratory tests involve a series of processes
and some could even require some cultured processes that take up to three days.
This was followed by the time bracket of 31-40 min that attracted 16% of the respondents, 21-
30 min that attracted 7.6%, 11-20 min that attracted 6% and finally less than 10 min that
attracted 4.4%. On average, it was found that the time stipulated for services in this section
by the management was nonstandard and the discrepancy differed from one test to another.
For example HIV test, though done in a different section, had a maximum of 40 minutes due
to counseling, the malaria test had an allocated time of 10 minutes, STI like the UTI had a
time frame that went slightly above 40 minutes while others had times that went to over one
day, although patients had to wait for almost over 20 minutes.
However, according to some of the patients, they expected to be served in less than 10
minutes since their problems were not such complicated. This was supported by 37% of the
respondents, but the majority of over 63% seemed to be comfortable with the time spent in
this section. From the county of Kilifi, this expectation of a minimum contact time for service
at the laboratory can be supported by the information from the county health department
indicating that the government has done an integrating modern technology in all sections of
operations, acquired better medical equipment for almost all the laboratories, increased the
number of laboratory attendants/medical laboratory employees and technicians etc.
According to the Kilifi County Government (2015), there has been an increased number of
nurses, laboratory technicians/attendants and medical doctors serving in various hospitals
and health centres in the county since it came to power in 2013 by over 45%, adopted
electricity and new infrastructural facilities like piped water, new buildings, modern
equipment like x-rays and computers by a trending rating of over 51.12%; double than its
neighbouring counties like Tana River and Taita Taveta. This has also been shown in its
efforts of collaborating with other bodies like KEMRI, UNICEF, USAID, WHO, MTCs etc.
0 – 10 min
11 – 20 min
21 – 30 min
31 – 40 min
Above 45 min
11
15
19
40
165
4.4%
6%
7.6%
16%
66%
Total 250 100%

22
When asked to give reasons as to why they felt that there were delays at this section than
expected, on average, over 63% of the patients surprisingly did not blame it on the
technicians or attendants at the laboratories. Instead, they seemed to agree that, there are
different types of diagnosis done for each individual and therefore for a particular disease to
be effectively identified in some patients there need to be proper procedure to testing. This
differs from one disease to another, one hospital to another, one region to another and one
blood in an individual to another.
3.2.5 X-ray Section
The survey sought to establish the time taken for patients to be served in the X-ray
Section. This is the fifth section where the patients visit in the hospital if need be.
The questions included the specific time brackets spent, the expected time and
some reason for the time spent at the section.
Table 3.6 Time taken at X-ray Section
From the baseline survey field information all the questionnaires analyzed had
responses for this section. Therefore, on average over 50% of the respondents who
were represented by 125 respondents indicated that they spent between 31-40
minutes. This was followed by the time bracket of 21-30 min that attracted 22% of the
respondents, 11-20 min that attracted 14%, above 45 min that attracted 10% and finally less
than 10 min that attracted 4 %. On average, it was found that the time stipulated for services
in this section by the management was nonstandard and the discrepancy lied between 20
minutes and over one hour. This can be supported by the idea the machines being used and
not very modern and only 2 hospitals are served with x-ray machines.
However, according to some of the patients, they expected to be served in less than 20
minutes since their problems were not such complicated. This was supported by 48% of the
respondents. From the county of Kilifi, this expectation of a minimum contact time for
service at the x-ray section can be supported by the information from the county health
department indicating that the government has acquired better medical equipment like the
Time in Minutes Frequency Percentage
0 – 10 min
11 – 20 min
21 – 30 min
31 – 40 min
Above 45 min
10
35
55
125
25
4%
14%
22%
50%
10%
Total 250 100%

23
x-ray, has improved the x-ray by servicing it and increased the number of attendants/
technicians at the x-ray laboratories. According to the Kilifi County Government (2015),
there has been an increased number of nurses, laboratory technicians/attendants and
medical doctors serving in various hospitals and health centres in the county since it came to
power in 2013 by over 45%, adopted electricity and new infrastructural facilities like piped
water, new buildings, modern equipment like x-rays and computers by a trending rating of
over 51.12%; double than its neighbouring counties like Tana River and Taita Taveta. This
has also been shown in its efforts of collaborating with other bodies like KEMRI, UNICEF,
USAID, WHO, raining institutes and other that have better knowledge of x-ray machines
and knowledge to easy the delivery of services.
When asked to give reasons as to why they felt that there were delays at this section than
expected, on average, over 50% of the patients surprisingly did not blame it on the
technicians or attendants also. Instead, they seemed to agree that, there are different types of
diagnosis done for each individual. Also, the patients blamed it on the government for the
limited numbers of the x-ray machines, the lack of enough attendants for the services and the
unnecessary time wasted in waited for the x-ray picture to be read and interpreted.
3.2.6 Pharmacy Section
The survey sought to establish the time taken for patients to be served in the
Pharmacy Section. This is the sixth section where the patients visit in the hospital.
The questions included the specific time brackets spent, the expected time and
some reason for the time spent at the section.
Table 3.7 Time taken at Pharmacy Section
From the baseline survey, on average, over 49.2% of the respondents who were
represented by 123 respondents indicated that they spent 11-20 min in the
Pharmacy Section. This was followed by the time bracket of 0-10 min that attracted 16% of
the respondents, 31-40 min that attracted 14.8%, 21-30 min that attracted 12% and finally
above 45 min that attracted 8%.On average, it was found that the time stipulated for services
Time in Minutes Frequency Percentage
0 – 10 min
11 – 20 min
21 – 30 min
31 – 40 min
Above 45 min
40
123
30
37
20
16%
49.2%
12%
14.8%
8%
Total 250 100%
24
in this section by the management was 0-10 minutes, although the patients had to wait for a
doubled time length that went to almost over 20 minutes.
According to the patients, they expected to be served in less than 10 minutes as proposed by
the county health sector. This expectation of a minimum contact time for service can be
supported by the information from the county health department indicating that the
government has taken strategic measures in giving the county health service a new look.
This includes: integrating modern technology, acquiring better medical equipment, increased
the number of employees over time since the health employment and deployment is done at
the county levels unlike the times when it was under the old constitution, etc.
The Kilifi County Government (2015) report indicates that there has been an increased
number of nurses, pharmacists, laboratory attendants, relevant workers and medical doctors
serving in various hospitals and health centres in the county since it came to power in 2013
by over 45%, adopted electricity and new infrastructural facilities like piped water, new
buildings, modern equipment like x-rays and computers by a trending rating of over 51.12%;
double than its neighbouring counties like Tana River and Taita Taveta. This has also been
shown in its efforts of collaborating with other bodies like KEMRI, UNICEF, USAID, WHO
etc. that have provided modern records management that makes it easy for one to identify
the type of medicine to be given to the patients; limiting the time wasted in waiting for
subscription.
When asked to give reasons as to why they felt there were delays at this section than
expected, on average 50% of the patients argued that, some attendants were slow in
understanding what was required in the papers maybe due to the fact that there is no proper
link with the medical subscribes, others wasted time in calling some help from other
attendants, or in some occasions the attendants wasted time looking for medicine that was
not in stock; just to realize later and then send the patients to go and buy elsewhere.
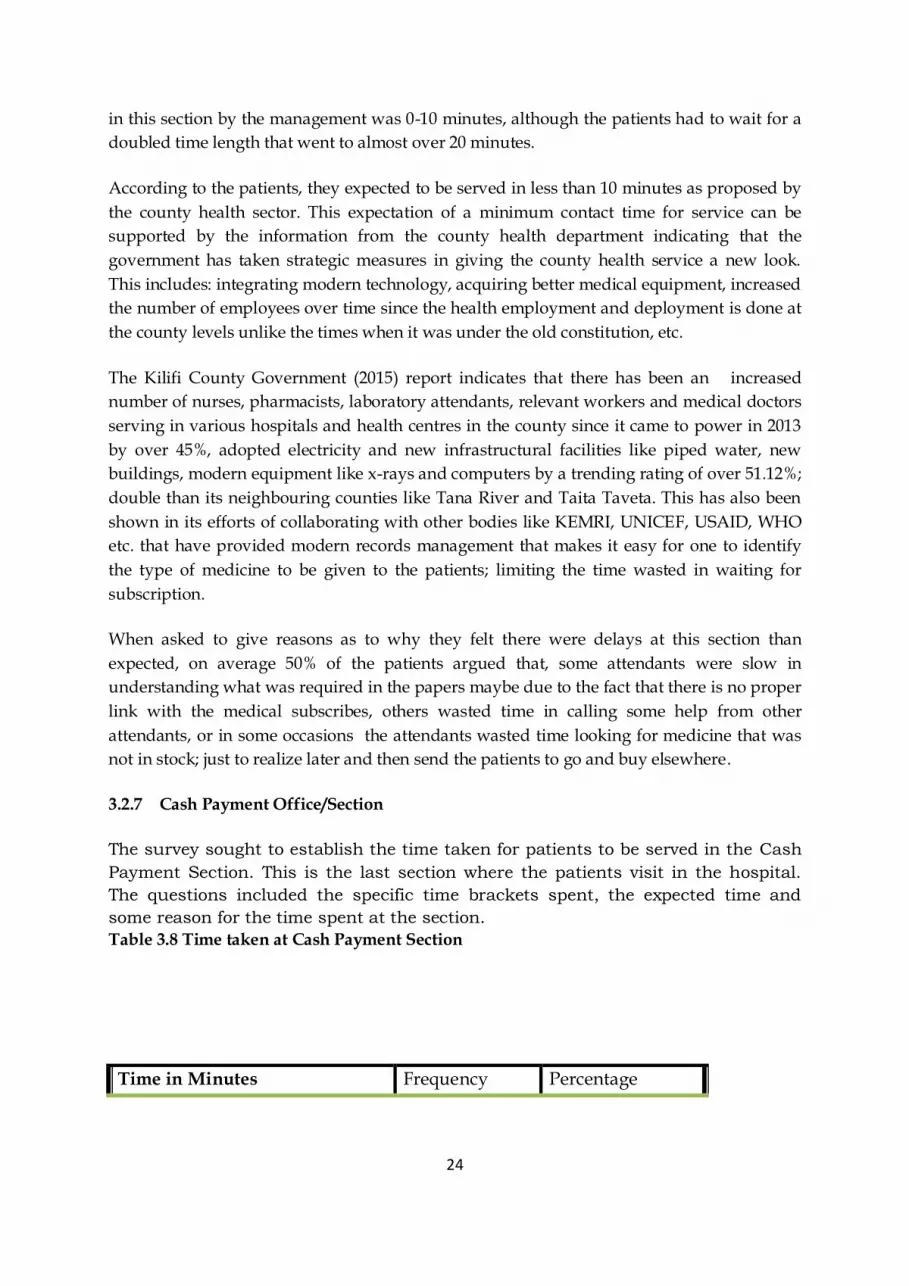
3.2.7 Cash Payment Office/Section
The survey sought to establish the time taken for patients to be served in the Cash
Payment Section. This is the last section where the patients visit in the hospital.
The questions included the specific time brackets spent, the expected time and
some reason for the time spent at the section.
Table 3.8 Time taken at Cash Payment Section
Time in Minutes Frequency Percentage

25
From the baseline survey, on average, over 80% of the respondents who were
indicated that they spent less than 20 min in the cash payment. General trend in the
hospitals performance indicates that this the best performing section so far; with a higher
percentage (44.4%) of the patients being served in less than 10 minutes. According to the
survey, age between 21-30 minutes attracted 12% of the respondents, 31-40 min that attracted
6 % and finally 45 minutes that attracted 2%.
According to the patients, they expected to be served in less than 10 minutes as proposed by
the county health sector. This expectation of a minimum contact time for service can be
supported by the information from the county health department indicating that the
integration of modern cash payment technology like the use of the M-pesa services has eased
the work of money payments. Also the use of computerized receipts helps the payments
process. Some employees who answered in the favour of delays in payments argued that
they delayed in payments due to the procedures involved and a good number of them did
not know how much they were supposed to pay since the government form time to time has
said that the medication at county levels is free; therefore they did not carry money.
3.2.8 Rating Customer Satisfaction on a Likert Scale
The patients were given a number of questions and the rating done on a scale to show the
magnitude of satisfaction and results discussed as follows:
0 – 10 min
11 – 20 min
21 – 30 min
31 – 40 min
Above 45 min
111
89
30
15
5
44.4%
35.6%
12%
6%
2%
Total 250 100%

26
Table 3.9: Rating Customer Satisfaction
Statement Aver
age
Percen
tage
Equivalency
Valid
Total
250
The Health facility staff treated me with
courtesy and respect.
3.5 70% Agree
The Health facility staff did explain things
to me in a way I could understand.
3.6 72% Agree
I was given ample time to discuss my
medical problem with the doctor/health
officer or the nurse.
3.8 76%
Agree
The Health facility is clean and well
maintained.
2.4 48% Disagree
Total average 3.33 66.6% Weakly
agree
On a rating scale of 1 to 5 where; 1=strongly disagree, 2=disagree, 3= weakly agree, 4=agree
and 5= strongly agree and the results below gotten:
The survey noted that, almost over 66.6% of the respondents were on average in agreement
that the county health sector was doing well and it offered services that satisfied them on an
average basis. This was supported by a computed average of 3.33 that equated to fairly
agree. This translates to a value of 66.6%.
The individual statement scores indicated that: 3.5 score that is equated to agree was scored
by the statement that said, the Health facility staff treated me with courtesy and respect; 3.6
score that was equated to agree was scored by the statement that said, the Health facility
staff did explain things to me in a way I could understand; 3.8 score that was equated to
agree was scored by the statement that said, I was given ample time to discuss my medical
problem with the doctor/health officer or the nurse; and, finally 2.4 score that is equated to
agree was scored by the statement that said, the Health facility is clean and well maintained.
The general trend indicated that the patients were on average satisfied with the services that were offered to them by the Ministry of Health centres, hospitals and dispensaries. However this needs to be improved because the score is a minimal fair score. 3.2.9 Recommendations by the Patients about the Health Facilities Respondents were asked if they would recommend the health facility to their friends and other family members and the response was that, 66% of the respondents argued that they could recommend their close people to the various facilities while the remaining 34% argued that they could recommend their family people or friends to these health facilities.
27
When asked to give reasons, over 60% of the respondents said that, they supported the way in which the health facilities have been improved unlike previous days when they were under the national government. Also, the respondents indicated that the county governments has set up new centres, brought electricity and increased the number of medical attendants; some of who are good and understanding than it was in the previous times. It is clear that this response therefore was dominate d by the respondents of ages between 30’s and 50’s who are considered to be the most beneficiaries of the new constitution. The patients recommended that the drugs should be increase as supported by 78% of the respondents, equipment like the x-rays be increased (56%), time for lunch should be having stand shift employees so that no closing of various offices is done (67%), more medical doctors should be added since the ones serving are few (57%), and at the Pharmacy, the attendants should keep better records of the drugs available and when sending someone to buy elsewhere, they should tell the person the prices/the cost of the drug (80%).
4: 0 CONCLUSIONS AND RECOMMENDATIONS
Based on the findings from the field and the figures indicated, the research concludes
that:
4.1 Conclusions
On average, the survey has indicated that the various sections of the county health
providers have not managed to beat time in serving their customers. As much as the
cash payment section has been rated as one of the best in observing time, still the
patients served in less than 10 minutes are still found to be less that 50%.
It has however been noted that the county government through various partnerships
and strategic operations has managed to increase the number of employees
throughout the various sections in the county hospitals, dispensaries and health
centres. The county government has been on a better rating as compared to
neighbours like Tana Delta by increasing the electricity coverage, the development of
infrastructure like necessary buildings (laboratories/wards/resting points),
acquiring necessary equipment and many more.
Due to its better services than it was previously, a greater percentage of the
respondents argued that they can recommend their close people for services in the
health centres. From the field report, 66% of the respondents argued that they could
recommend their close people to the various facilities while the remaining 34%
argued that they could recommend their family people or friends to these health
facilities.

28
4.2 Recommendations
The survey recommends that;
i. The county hospitals should adopt modern systems of keeping records at the
registry points so that the information about the patients can automatically be
generated and avoid the long queues and manual checking of the records of
the patients.
ii. The county government should come up with equipped laboratories with
various equipment of testing various diseases. The x-rays also should be
extended to other points in the county as opposed to two major hospitals. This
shall help in reducing the congestions and times wasted in scrambling for the
services.
iii. The county government should increase the variety if drugs in its store so that
the poor people of Kilifi can be saved of the trouble of being sent to various
point to buy medicine while they are already drained with life demanding
need food and water. The government should callable with other bodies like
donors to get more medicine for its people. ‘Finally the government should
better the health infrastructure, increase the number of employees and
increase the coverage of dispensaries and health centres across the county.
This shall help reduce congestion and eliminate the challenges of wasted time
and services delivery.

29
References
GOK. (20115). National Nutrition Action Plan 2012-2017. Nairobi: Government Printer.
Kilifi County Government. (2015). The County Treasury. Promoting Economic
Transformation for A Shared Prosperity.www.kilificounty.com.
Unite For Sight. (2015). Innovations in Healthcare for Women and Children. Module 15:
http://www.uniteforsight.org/women-children-course/innovation-women-children.
World Bank. (2015). Bulletin of the World Health Organization. 20 Avenue Appia, 1211
Geneva 27, Switzerland.
World Health Organization. (2015). World Health Report 2015. New York.USA.

30
KIMTUX ENTERPRISES LIMITED, BOX 16669 MOMBASA
Contact: 072 713 4649/0725247351/0721246744
_________________________________________________________________________
CUSTOMER (PATIENTS) SATISFACTION SURVEY QUESTIONNAIRE
Dear customer,
The Kilifi County Government Ministry of Health is conducting a Customer Satisfaction Survey
for the financial year 2016/2017. The purpose of this survey is to collect data to determine the
customer satisfaction levels, general perception about the county health services with regards
to service delivery and propose appropriate action plan for addressing the emerging issues for
recommendations and suggestions for interventions and for further improvement where
appropriate. This survey is administered by: KIMTUX ENTERPRISES LIMITED.
The survey is designed to solicit honest and candid feedback from respondents. The
information obtained will be kept confidential and used for the purpose of the survey only.
Please take a few minutes to complete this questionnaire.
Name of Health
Facility………………………………………………………………………………………………..
Service category: General/Maternal care/Children care
1.0 Personal Details
TOTAL
SOLUTIONS

31
1.1 Gender: Male Female
1.2 Age: 0-10 Years 11 – 20 Years 21 – 30 Years 31 – 40 Years
41 – 50 Years 51 –60 Years Above 60 Years
2.0 How much time did it take you to have the first contact with a health center staff on
your arrival in the following areas
a) Patient Registry Section :
0 – 10 min 11 – 20 min 21 – 30 min
31 – 40 min above 45 min
What was your expected waiting time?
.................................................................
Give a reason
........................................................................................................................................................................................
........................................................................................................................................................................................
..................................
b) Triage Section: 0 – 10 min 11 – 20 min 21 – 30 min
31 – 40 min above 45 min
What was your expected waiting time?

32
.................................................................
Give a reason
.............................................................................................................................................................. ..........................
........................................................................................................................................................................................
..................................
c) Examination (Doctor/Physician): 0 – 10 min 11 – 20 min 21 – 30 min
31 – 40 min above 45 min
What was your expected waiting time?
.................................................................
Give a reason
........................................................................................................................................................................................
........................................................................................................................................................................................
..................................
d) Laboratory : 0 – 10 min 11 – 20 min 21 – 30 min 31 – 40 min
above 45 min
What was your expected waiting time?
.................................................................
Give a reason
........................................................................................................................................................................................
........................................................................................................................................................................................
..................................
e) X-ray : 0 – 10 min 11 – 20 min 21 – 30 min 31 – 40 min
above 45 min
What was your expected waiting time?
.................................................................

33
Give a reason
........................................................................................................................................................................................
........................................................................................................................................................................................
..................................
f) Pharmacy: 0 – 10 min 11 – 20 min 21 – 30 min 31 – 40 min
above 45 min
What was your expected waiting time?
.................................................................
Give a reason
........................................................................................................................................................................................
........................................................................................................................................................................................
..................................
g) Cash Payment Office: 0 – 10 min 11 – 20 min 21 – 30 min 31 – 40 min
above 45 min
What was your expected waiting time?
.................................................................
Give a reason
........................................................................................................................................................................................
........................................................................................................................................................................................
..................................
3.0 The Health facility staff treated me with courtesy and respect
Strongly Disagree Disagree Weakly Agree Agree Strongly Agree

34
4.0 The Health facility staff did explain things to me in a way I could understand
Strongly Disagree Disagree Weakly Agree Agree Strongly Agree
5.0 I was given ample time to discuss my medical problem with the doctor/health officer
or
the nurse
Strongly Disagree Disagree Weakly Agree Agree Strongly Agree
6.0 The Health facility is clean and well maintained?
Strongly Disagree Disagree Weakly Agree Agree Strongly Agree
7.0 Would you recommend this Health facility to your friends and other family
members?
Yes [ ]
No [ ]
Give reasons to support your response
……………………………………………………………………………………………………………………………………
……………………………………………………………………………………………………………………………………
…………………..
8.0 What are your recommendations for health center sections above to improve on
their service delivery to the public and stakeholders in general?
i.

35
ii.
iii.
9.0 Indicate the section within the health facility that you are extremely happy about:
i.
ii.
iii.
10.0 State the section within the health facility that needs to improve on:
i.
ii.
iii.
Thank you for your cooperation.
Code number of Enumerator _______________________________________________
Date of data collection _____________________________________________________
Questionnaire serial number ___________________________________________________