high-throughput morphometric analysis of individual neurons
TRANSCRIPT

© Oxford University Press 2004; all rights reserved Cerebral Cortex DOI: 10.1093/cercor/bhh016
High-throughput Morphometric Analysis of Individual Neurons
Chi-Cheng Wu1, John F. Reilly1, Warren G. Young1,
John H. Morrison1,2 and Floyd E. Bloom1,3
1Neurome, Inc., 11149 North Torrey Pines Rd, La Jolla,
CA 92037, 2Fishberg Research Center, Mount Sinai School of
Medicine, Neurobiology, Box 1065, One Gustave L. Levy
Place, New York, NY 10029 and 3Department of
Neuropharmacology, The Scripps Research Institute, 10550
N. Torrey Pines Rd, La Jolla, CA 92037, USA
To facilitate high-throughput quantitative analysis of neuronal struc-ture, this study optimized the diOlistic method of whole neuronlabeling to examine multiple neurons in fixed brain, and optimizedimage acquisition parameters to preserve signal for subsequentphotoconversion. Fluorescent dye-coated gold particles weresuccessively delivered by helium-powered ejection to 250 µm thickbrain slices with loading density and penetration depth optimized tomaximize the yield of labeled neurons within the slice while avoidingoverlapping labeled dendritic processes in the x–y plane and z-axis.Labeled neurons were imaged using confocal laser-scanning micros-copy with pinhole aperture and scan speed enhanced to minimizecapture time and fluorescence degradation. Optimized image acqui-sition parameters preserved fluorescence signal and facilitatedsubsequent oxygen-enriched photoconversion for higher magnifica-tion dendritic spine analysis. Sampling criteria limited analysis toneurons whose z-axis dendritic processes were fully containedwithin the tissue slice and in which dye transport extended to themost distal portions of the dendrites. The yield of completely labeledneurons was, on average, more than 20 cells per brain region peranimal. With optimized spatio-temporal diOlistic loading parameters,along with image acquisition parameters optimized for subsequentphotoconversion, the present protocol provides a high-throughputstrategy for full-scale quantitative analysis of three-dimensionalneuronal morphology.
Keywords: cell morphology, diOlistic, photoconversion, single-cell resolution
IntroductionThe current methods for morphological characterization and
quantitative analyses of single neurons, such as Golgi staining,
intracellular injection and neuronal transfection, are labor-
intensive, technically demanding, and do not readily yield large
numbers of completely reconstructed neurons. Golgi impreg-
nation relies upon the crystallization of silver chromate.
However, the staining selectivity only labels less than 2–10% of
the neurons, which is insufficient for quantitative analysis, and
there is no experimental control over selection of neurons to
be studied. Moreover, data analysis is compromised by incom-
plete impregnation, unavoidable loss of dendritic branches due
to the plane of sectioning, and indistinguishable overlapping
fine dendritic processes. Dye loading into single cells by micro-
injection using intracellular or patch pipettes generates excel-
lent single-cell labeling but is technically demanding (e.g. Buhl
and Schlote, 1987; de Lima et al., 1990; Schmidt et al., 1996;
Taylor et al., 1996; Arnold et al., 2001; Morgan and Ohara,
2001; Duan et al., 2002). One of the major methodological
concerns with these techniques is that quantitative analysis
relies heavily upon subjective evaluations. The pipette tips are
maneuvered manually, thus the loading is likely to occur in
easy-to-access areas, such as a superficial cell layer, and/or in
large-diameter neurons. Therefore, the sampling of intra-
cellularly loaded cells often does not reflect the entire neuronal
population. Moreover, injection-induced damage and/or leakage
of dye via the needle track often results in unwanted labeling of
neighboring cells, which reduces the signal-to-noise ratio.
Using neuronal transfection methods, including micro-injec-
tion (Hall et al., 1997), electroporation (Lurquin, 1997), lipo-
fection (Strauss, 1996) and viral transfection (Robbins et al.,
1998), introducing DNA constructs into target cells and tissues
has become routine for examining gene regulation and func-
tion of the nervous system and for characterization of neuronal
morphology. However, several variables are responsible for
poor transfection efficiency using these methods. These
include DNA coating efficacy and intrinsic cell viability in the
cultures (Biewenga et al., 1997).
This neuronal transfection method has been improved by a
‘biolistic’ approach for in situ transfection and labeling of cells
(Lo et al., 1994; Usachev et al., 2000; O’Brien et al., 2001; Jin et
al., 2001; Danzer et al., 2002; Klimaschewski et al., 2002; Sun
et al., 2002). In this system, a hand-held gene gun utilizes a
pulse of helium gas to propel small particles coated with desic-
cated DNA, crossing plasma membrane to target cells. This
technique does not require the specialized equipment and
expertise that the conventional intracellular injection methods
rely upon. Furthermore, this biolistic approach provides a
means for random sampling, which is ideal for full-scale quanti-
tative analysis. However, temperature changes, decreased
atmospheric pressure, and high pressure-induced membrane
disruption potentially challenge the cell cycle and transcrip-
tion activity after bombardment, thereby affecting the expres-
sion of a gene product and the success of transfection
(Biewenga et al., 1997; Thomas et al., 1998).
A recent advancement of the biolistic approach has been
reported by Gan et al. (2000), who employed a gene gun to
propel gold particles coated with various combinations of
lipophilic dyes to target multiple neurons in live as well as
fixed slices. Although suitable for visualizing complex cell–cell
interactions, the ‘multi-diOlistic’ loading of neurons results in a
high density of labeled neurons, which constrains the ability to
perform quantitative morphological analysis of individual
neurons.
The present study had two goals: (i) to enhance the yield of
non-overlapping labeled neurons in a given brain region by
standardizing morphological criteria for cell sampling under
controlled conditions of dye-coated gold particle delivery, and
(ii) to optimize the image acquisition process parametrically to
reduce photo-bleaching, and facilitate non-fluorescent optical
analysis of dendritic spines following a protocol for high-
throughput photoconversion. The present study presents a
Cerebral Cortex Advance Access published March 28, 2004 by guest on June 12, 2013
http://cercor.oxfordjournals.org/D
ownloaded from

Page 2 of 12 High-throughput Morphometric Analysis of Individual Neurons • Wu et al.
standardized and efficient workflow that combines high-
throughput randomized diOlistic loading, optimized image
acquisition and photoconversion for the comprehensive quan-
titative analysis of individual neuronal morphology. Prelim-
inary data of the present study have been reported in abstract
form (Wu et al., 2003).
Materials and Methods
Tissue Preparation and Storage
Ninety-day-old male C57BL/6 mice (n = 12) were anesthetized with
avertin (0.5 mg/g body weight) and transcardially perfused with
normal saline followed by 4% paraformaldehyde (PFA) in 0.1 M phos-
phate buffer (PB). Brains were dissected and post-fixed with 4% PFA
overnight. After postfixation, the brains were coronally sectioned
(250 µm) using a vibratome. The anterior–posterior axis of the
hippocampus was subdivided into three levels based on the atlas of
Hof et al. (2000). The brain sections were collected and stored in 4%
PFA at 4°C prior to diOlistic shootings. The postfixation period varied
from 1 h to 2 weeks, which allowed for repetitive delivery of the parti-
cles to the brain sections (see below). After delivery of the particles,
the sections were stored in freshly made 4% PFA for confocal imaging
(see below).
Gene Gun Bullet Preparation
The current protocol was developed partly based on the manufac-
turer’s manual (BioRad, Hercules, CA) and the procedure of Gan et al.
(2000).
Tefzel tubing (BioRad) was placed on a tubing preparation station
(BioRad) and air-dried for 45 min using nitrogen gas (0.4 l/min).
Fifteen milligrams of gold particles (1.6 µm in diameter; BioRad) were
thoroughly/evenly spread (2 × 2 cm2) on a glass slide using a razor
blade. Five milligrams of 1,1′ -dioctadecyl-3,3,3′,3′ -tetramethylindocar-
bocyanine perchlorate crystals (DiI; Molecular Probes, Eugene, OR)
were dissolved in 500 µl methylene chloride and then gently dropped
onto the thin layer of gold particles on the glass slide. The DiI-coated
gold particles were carefully scrapped off with a razor blade,
collected, and sonicated in 3 ml of distilled water for 30 min. In order
to prevent aggregation of DiI-coated particles, 0.75 µl poly-
vinylpyrrolidone (20 mg/ml) was added to the sonicated solution. The
solution was then vortexed for 15 s and immediately injected into the
pre-dried tubing. Slow and continuous injection was crucial to
prevent inclusion of air bubbles. The tubing was rotated for 30 min to
allow the DiI-coated particles to precipitate and settle onto the inside
surface of the tube (also see Discussion). The solution was then slowly
withdrawn and the particle-coated tube was rotated and air-dried
under constant nitrogen flow (0.4 l/min) for 2 h. The particle-coated
tube was then cut into small pieces (microcarriers), and stored in a
desiccated environment at room temperature. In order to maintain the
quality of the labeling, the bullets were used within 24 h after coating.
Delivery of Particles
A commercially available biolistic ‘Helios gene gun system’ (BioRad)
was used to propel DiI-coated particles into fixed tissue. The gene
gun was stabilized by a custom-fabricated adjustable stand with a
mobile z-axis (see Supplementary Material Fig. S1). A custom-fabri-
cated centering tool was used to adjust the distance of the gun from
the target tissue (3.0 cm) and to pinpoint the focus point of the
landing field of the delivered particles. In addition to the manufac-
turer’s diffusion screen, a membrane filter with a 3 µm pore size and
8.0 × 10⁵ pores/cm2 (Falcon 3095; BD Biosciences Discovery Labware,
Bedford, MA) was placed between the gun and the tissue to filter out
large clusters of coated particles and to avoid shock wave damage to
the tissue. The particles were accelerated using inert helium gas
(200 psi) and each side of the tissue was shot up to three times inde-
pendently to enhance the yield of labeling. Each shooting was
performed after completion of confocal image acquisition (see
below).
Confocal Imaging and Optimized Parameters
Labeled neurons were imaged using a Zeiss CLSM PASCAL laser-scan-
ning confocal microscope (Carl Zeiss, Thornwood, NY) equipped
with a 10× Plan NeoFluar objective lens [numerical aperture (NA) =
0.3] and a 25× Plan NeoFluar water-immersion objective lens (NA =
0.8). For through-focus imaging, optical sections were collected using
the 25× objective with 0.5–1.2 µm z-axis steps to cover the full depth
of the dendritic trees. The z-axis stack compression that resulted from
water immersion was automatically corrected by the analysis soft-
ware. The 2-D stacks were superimposed digitally and the full 3-D
dataset was generated for visualization of dendritic complexity.
Labeled structures were excited using a 1 mW He:Ne laser (543 nm for
DiI) with their emissions passed through a 560 nm long pass filter set.
After scanning, images were taken using the 10× objective to docu-
ment anatomical localization of DiI-labeled neurons against a reflect-
ance-imaged background.
In order to enhance the imaging process, the pinhole aperture and
scan speed were systematically investigated and optimized. Targeted
neurons with either simple or complex dendrites were imaged separ-
ately using different pinhole apertures (48, 73 and 88 µm) with scan
speed held constant. Similarly, targeted neurons were imaged separ-
ately using different scan speeds (1.9, 3.9 and 7.8 s/scan), while
pinhole aperture was held constant. The scanned images were digi-
tized and reconstructed, and their dendritic lengths were then quanti-
fied and compared (see Results).
Morphological Criteria for Cell Sampling
The criteria for selecting completely labeled targeted neurons were
based on (i) the loading of DiI-coated gold particle in the soma, which
was found to yield optimal dye transport; (ii) the tapering of DiI in the
most distal dendrites; (iii) the visualization of the complete 3-D profile
of dendritic trees using the 3-D display of Zeiss CLSM 5 PASCAL soft-
ware (v2.8; Carl Zeiss). Neurons with incomplete dye transport and
neurons with truncations due to the plane of sectioning were not
collected. Moreover, cells with dendrites labeled retrogradely by
particle impacts in the surrounding neuropil were excluded. In the
present study, the types of labeled neurons collected included pyram-
idal cells in CA1 and granule cells in the dentate gyrus of the mouse
hippocampus.
Double-labeling Procedures
For visualizing targeted neurons, the sections were pre-incubated in
Hoechst 33258 (10 mg/ml, Molecular Probes), a fluorescent nucleic
acid stain, for 15 min prior to diOlistic labeling. The precision of
neuron loading was visualized by the co-labeling of Hoechst-stained
nuclei (blue channel) and DiI-coated particle (red channel) under
epi-fluorescence microscopy. To examine the spatial correlation of
dendritic complexity of the neurons and their anatomical location,
sections containing labeled neurons were incubated with NeuroTrace
green fluorescent Nissl 500/525 (1:100 in PBS, Molecular Probes) for
2 h and then imaged using confocal microscopy.
Neuronal Tracing and Data Analysis
The stacks of digitized 2-D images were downloaded and exported as
a series of TIFF images to a PC workstation (530 MT, Dell, Round
Rock, TX) and Neurolucida (MicroBrightField Inc., Williston, VT) was
used to contour the dendritic processes of the digitized 2-D images.
During the course of contouring, the 3-D dendritic geometry was visu-
alized using the Zeiss CLSM PASCAL 3-D display software, with glow-
scale image processing used to highlight neuronal processes.
All of the reconstructed data were exported to NeuroExplorer
(MicroBrightField Inc., Williston, VT) for quantitative analysis. Total
dendritic length and averaged lengths of each dendritic branch of
labeled CA1 pyramidal neurons were generated using dendrogram and
Sholl analysis, respectively. To validate the imaging parameters, each
neuron was scanned under different pinhole apertures and scan
speeds and then contoured three times each. Total dendritic length
and average length of each dendritic branch were compared to
examine the inter-trial variability. The results were analyzed using uni-
and multivariate analysis of variance and Bonferroni post hoc tests,
with significance set at P < 0.05 and 0.001, respectively.
by guest on June 12, 2013http://cercor.oxfordjournals.org/
Dow
nloaded from
Cerebral Cortex Page 3 of 12
Photoconversion Protocol
After confocal imaging, the sections were washed 3 × 10 min with PBS
and pre-incubated in filtered ice-cold diaminobenzidine tetrahydro-
chloride (DAB, Sigma, St Louis, MO) solution (1.5 mg/ml in 0.1 M Tris
buffer, pH 8.2) for 6–12 h, a period that optimized the full penetration
of DAB into 250 µm tissue slabs. Results from preliminary studies led
to complete omission of all H2O2 (0.1%) from the DAB solution. After
washes for 3 × 10 min, the sections were transferred to a custom-fabri-
cated closed conversion chamber (CCC; see Supplementary Material
Fig. S2), modified from Kacza et al. (1997).
The chamber was connected with silicone tubing that regulated the
in- and out-flow of pure oxygen, which is suggested to significantly
enhance the photoconversion process (Sandell and Masland, 1988;
also see Lübke, 1993; Kacza et al., 1997). The sections were soaked in
10 ml DAB solution in the reservoir bath within the CCC and then
covered with a plastic plate with a tightly fitting passage that allowed
the 10× objective to navigate both horizontally and vertically to focus
on the tissue during the conversion process. The light source was
supplied by a 100 W mercury lamp. The airflow within the chamber
was carefully regulated to prevent tissue dehydration. Unlike most
photoconversion protocols (e.g. Buhl and Schlote, 1987; Balercia et
al., 1992), the current protocol did not require frequent replenishing
of the ice-cold DAB solution during conversion. The conversion
process consisted of 30–45 min of exposure to epi-fluorescent illumi-
nation at 546 ± 30 nm, and when necessary, as for complex cell types
such as pyramidal cells, the DAB solution was periodically exchanged
with fresh DAB solution in the CCC to enhance the photoconversion
process. Step-through focus of the light source during conversion was
found to facilitate the quality of the final DAB reaction product. Low
concentrations of glutaraldehyde were evaluated (0.05%) and elimi-
nated as a fixative during perfusion because it substantially enhanced
background fluorescence and thus increased non-specific background
staining of the tissue.
The photoconverted tissue was then rinsed 3 × 10 min in PBS, and
exposed to 0.1% osmium tetroxide for 3–5 min. In order to reduce
shrinkage of neuronal structures, tissue sections were not dehydrated
but mounted directly on slides and coverslipped with GelMount
(Biomeda, Foster City, CA) for light microscopic analysis.
Results
DiOlistic Loading
In the present study, the custom-fabricated adjustable stand
was used to standardize and optimize the parameters of the
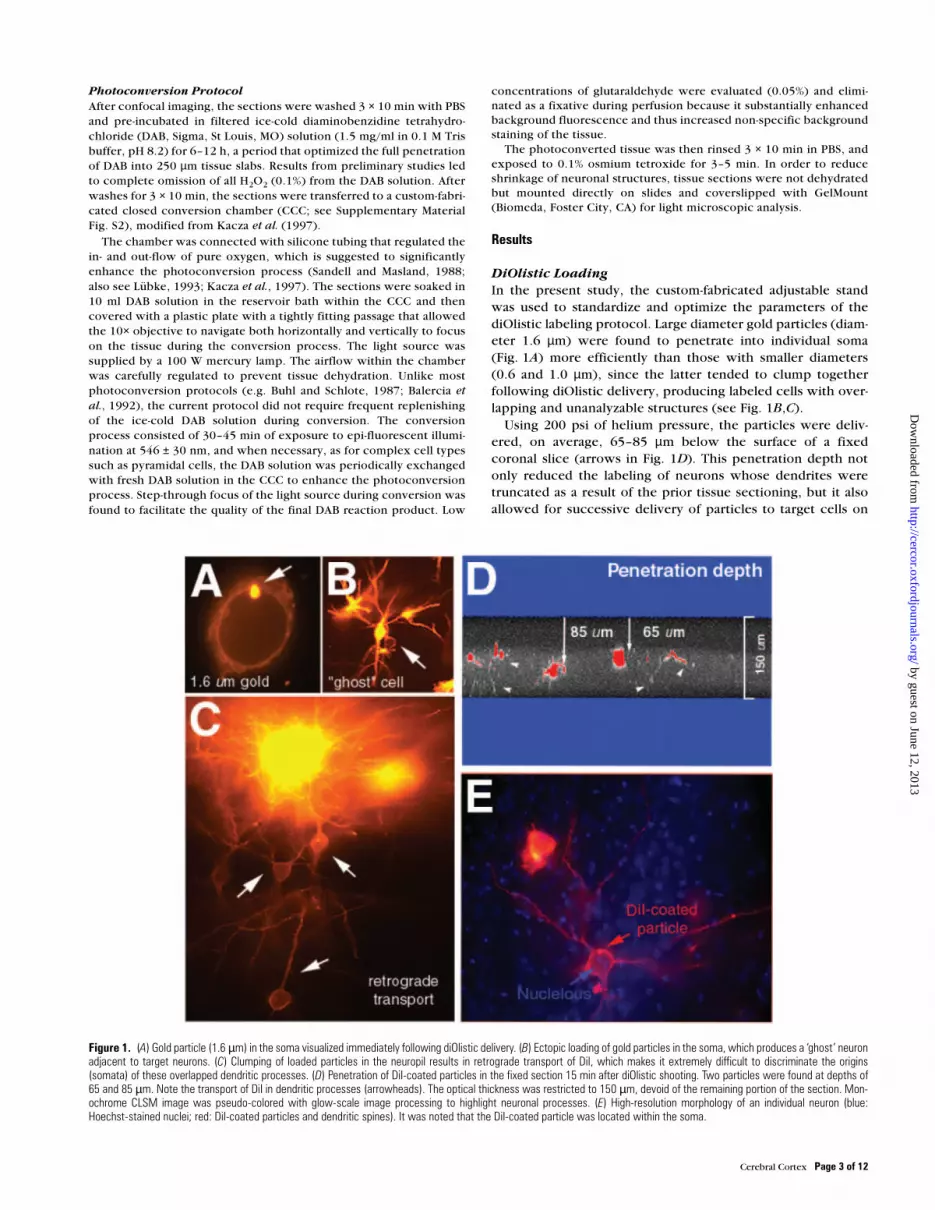
diOlistic labeling protocol. Large diameter gold particles (diam-
eter 1.6 µm) were found to penetrate into individual soma
(Fig. 1A) more efficiently than those with smaller diameters
(0.6 and 1.0 µm), since the latter tended to clump together
following diOlistic delivery, producing labeled cells with over-
lapping and unanalyzable structures (see Fig. 1B,C).
Using 200 psi of helium pressure, the particles were deliv-
ered, on average, 65–85 µm below the surface of a fixed
coronal slice (arrows in Fig. 1D). This penetration depth not
only reduced the labeling of neurons whose dendrites were
truncated as a result of the prior tissue sectioning, but it also
allowed for successive delivery of particles to target cells on
Figure 1. (A) Gold particle (1.6 µm) in the soma visualized immediately following diOlistic delivery. (B) Ectopic loading of gold particles in the soma, which produces a ‘ghost’ neuronadjacent to target neurons. (C) Clumping of loaded particles in the neuropil results in retrograde transport of DiI, which makes it extremely difficult to discriminate the origins(somata) of these overlapped dendritic processes. (D) Penetration of DiI-coated particles in the fixed section 15 min after diOlistic shooting. Two particles were found at depths of65 and 85 µm. Note the transport of DiI in dendritic processes (arrowheads). The optical thickness was restricted to 150 µm, devoid of the remaining portion of the section. Mon-ochrome CLSM image was pseudo-colored with glow-scale image processing to highlight neuronal processes. (E) High-resolution morphology of an individual neuron (blue:Hoechst-stained nuclei; red: DiI-coated particles and dendritic spines). It was noted that the DiI-coated particle was located within the soma.
by guest on June 12, 2013http://cercor.oxfordjournals.org/
Dow
nloaded from

Page 4 of 12 High-throughput Morphometric Analysis of Individual Neurons • Wu et al.
both sides of the tissues sufficiently far apart to avoid over-
lapping of their dendritic trees in the z-axis. The latter was
especially critical for enhancing the yield of loading, since
loading cells onto both sides of the tissue slice at different time
points appears technically impossible using conventional
methods. Moreover, to identify targeted cells precisely, the
double-labeling method was used to visualize Hoechst-stained
nuclei and DiI-coated particles within the soma (Fig. 1E). The
penetration of a single DiI-coated particle within the soma was
found to produce the optimal dye transport of neuronal
processes. Note the absence of lateral diffusion of DiI along the
penetration path, confirming an adequate velocity of bombard-
ment using the current protocol.
Placement of a cell culture filter between the gene gun and
the tissue was used to filter aggregated particles, and enabled
us to disperse single dye-coated gold particles within the tissue
(Fig. 2A). Optimal inter-particle distance of loaded somata
varied between 75 and 100 µm over the target area, which is
much greater than previously suggested by Gan et al. (see
detail in Discussion). The combination of optimized loading
density and penetration depth significantly reduced overlap-
ping of dendritic processes between labeled neurons and,
therefore allowed for full 3-D visualization of the neuronal
dendritic trees. Figure 2B presents a collapsed CLSM image in
which several dentate granule cells (GC) were concurrently
labeled at an interval of 80–100 µm in the dorsal and ventral
blades of the dentate gyrus, allowing for independent visualiza-
tion with minimal overlapping of labeled dendritic processes.
The somata of labeled cells were mainly located in the deep
granule cell layer (GCL). Note that the somata in the middle
position of Figure 2B (asterisk) did not contain labeled proc-
esses, mainly due to insufficient diffusion of DiI (see Discus-
sion). One advantage of using DiI as a marker is that it labels
extremely fine structures, such as spine necks, that are poorly
illuminated by conventional intracellular loaded dyes. For
example, Lucifer yellow (LY) readily diffuses through neuronal
cytoplasm, which not only significantly increases background
fluorescence, but also yields a LY-labeled dendritic trunk with
detached spine heads (Fig. 2C,D). On the other hand, the trans-
port of DiI efficiently labeled various types of spines with high
resolution (arrows in Fig. 2D), assuring the quality of the subse-
quently photoconverted DAB (see below).
Morphological Criteria and Effective Yield of Cell
Loading
In order to avoid artificial truncation of the dendritic tree,
sampling of loaded neurons was limited to those with cell
bodies sufficiently deep to the cut surface. Because an epi-fluo-
rescent microscope is optically limited to the x–y plane, a
confocal laser-scanning microscope was utilized to adequately
visualize the z-axis of labeled neurons. Zeiss 3-D display CLSM
PASCAL software was used to monitor full dendritic geometry
Figure 2. (A) Optimized dispersion of DiI-coated particles following delivery. The distance between particles, on average, varied between 75 and 100 µm (see detail in text).(B) Multiple cells were concurrently labeled in the dentate gyrus of hippocampus following diOlistic shooting. The inter-particle distance among three-labeled somata was ∼ 80 µm.Note the neuron in the middle position did not contain labeled processes (asterisk). (C, D) Comparison of spine density labeled by Lucifer yellow (LY) and DiI. Note that some spinesappear detached from the dendritic trunks labeled by LY (arrows). Abbreviations: GCL, the granule cell layer; ML, the molecular layer; HL: hilus.
by guest on June 12, 2013http://cercor.oxfordjournals.org/
Dow
nloaded from

Cerebral Cortex Page 5 of 12
with a 360° image rotation. This helped to verify the complete
filling of transported dye, which was evidenced by the tapering
of DiI in the most distal dendrites (arrows of Fig. 3A,B). Impor-
tantly, the lateral view of the CLSM image was used to verify
that the full extent of the dendritic profile of labeled neurons
(arrows of Fig. 3C) was contained within the slice. Neurons
with insufficient transports of DiI (arrows of Fig. 3D,E), due to
suboptimal fixation of tissue and/or inconsistent coating of DiI
to gold particles, or neurons with amputation of primary
dendritic processes (arrows of Fig. 3F) were excluded during
the sampling process.
Figure 4A,B illustrates full 3-D views of diOlistically labeled
neurons found in CA1 and the dentate gyrus of the mouse
hippocampus (see Supplementary Material Movies 1–2). The
basal dendrites of the labeled pyramidal cell reached the pial
surface, reflecting the optimal transport of DiI to the distal
dendrites (Fig. 4A). Similarly, we observed dentate GCs whose
apical dendrites were fully labeled throughout the molecular
Figure 3. Morphological criteria of diOlistic sampling. (A, B, C) Selection of a pyramidal neuron with complete transport of DiI in dendritic processes. Arrows indicate the taperingof DiI in most the distal dendrites. Lateral view of the images was used to verify the full dendritic profile (arrows in C). (D, E, F) Exclusion of a neuron with amputated dendriticprocesses. Incomplete transport of DiI was revealed in D and E (arrows). Lateral view reveals amputated apical dendrite (arrows in F).
Figure 4. DiOlistically labeled neurons with full 3-D visualization of dendritic trees. (A) A pyramidal cell of the dorsal portion of the CA1 was found to extend basal dendrites to thepia surface (asterisk). (B) A dentate granule cell with fully labeled dendritic trees in the molecular layer (ML). Note that the soma was located in a relatively deep position of thegranule cell layer (GCL). (C) Spatial correlations of the dentate ML and the dendritic arbors of labeled granule cell. See Supplementary Material movies 1–3 for 360° rotations ofimage stacks.
by guest on June 12, 2013http://cercor.oxfordjournals.org/
Dow
nloaded from

Page 6 of 12 High-throughput Morphometric Analysis of Individual Neurons • Wu et al.
layer (ML; Fig. 4B). In some cases, the somata of GCs resided in
a deep portion of the GCL and thus had an initial unbranched
apical dendrite (also see Fig. 2B). DiOlistic labeling with DiI
was combined with NeuroTrace, a fluorescent Nissl stain, to
reveal the laminar location of labeled neurons and dendritic
arbors (Fig. 4C). Thus, diOlistically labeled granule cell
dendrites could be defined relative to their position within the
dentate ML (see Supplementary Material, Movie 3). Dentate
granule cells located in a more superficial portion of GCL
tended to branch immediately upon entering the molecular
layer.
Based on the current protocol, on average, 20 analyzable
cells per region per animal were obtained. For example, in the
course of the anterior–posterior axis of CA1, the peak distribu-
tion of labeled cells was found in the mid-level of the hippo-
campus, mainly due to its prominent anatomical area (Fig. 5A).
Similar results were found in the dentate gyrus (∼ 25 cells/
animal; not shown). These yields significantly outnumber that
reported for other conventional cell loading methods (see
Discussion). Following diOlistic delivery, there was a high
degree of morphological heterogeneity of CA1 pyramidal cells
that varied with regard to their anatomical sites (see Fig. 5B).
Figure 5. (A) Distribution of diOlistically loaded pyramidal neurons in the A–P axis of the CA1. The anterior, middle, and posterior portion of the hippocampus were divided basedon Hof et al. (2000), each of which was composed of four serial sections. The middle level contained a relatively larger portion than the remainder of the CA1. (B) The heterogeneityof diOlistically loaded pyramidal neurons in the CA1 of the hippocampus. Note the difference in dendritic morphology of pyramidal cells relative to their anatomical locations. (C) Themontage image of the hippocampus following multiple diOlistic shootings. Arrows indicate specific cell types of the hippocampus (red: CA1 pyramidal cells; blue: granule cells;yellow: polymorphic cells). (D, E) Pyramidal, granule, and polymorphic cells were concurrently labeled in the same section as shown in C. The color contrast of CLSM images wasadjusted using Zeiss PASCAL software. Abbreviations: DG, dentate gyrus; GC, granule cell; HL, hilus; PYC, pyramidal cell; polymorph., polymorphic cell.
by guest on June 12, 2013http://cercor.oxfordjournals.org/
Dow
nloaded from

Cerebral Cortex Page 7 of 12
Note that several pyramidal cells were concurrently labeled in
the same section (the third figure of lower panel in Fig. 5B).
More importantly, the current protocol optimally loaded
multiple cells in other hippocampal subfields, including the
dentate gyrus and the hilus (colored arrows in Fig. 5C). High-
magnification images of labeled cells from Figure 5C are
presented in Figure 5D and E. Thus, the present study demon-
strates that successive diOlistic shootings of the same tissue
slice can be used to yield a large population of labeled neurons.
The inherent random sampling approach of the diOlistic
method is ideal for quickly and reliably revealing inter-animal
variability. In the present study, a pilot analytical study was
conducted by reconstructing diOlistically labeled CA1 pyra-
midal neurons of 90-day-old male C57 mice (n = 4). Morpholog-
ical differences of randomly labeled cells along the anterior-to-
posterior axis of the hippocampus (n = 10 cells/animal) were
quantified and compared by using dendrograms and Sholl
analysis (NeuroExplorer). In the dendrogram analysis (Fig. 6A),
a significant main effect on total length of apical dendrites was
found across the four mice (P < 0.05), whereas only a marginal
difference was found for basal dendrites. In the Sholl analysis
(Fig. 6B,C), the number of intersections of both apical and
basal dendrites was compared at 10 µm intervals from the soma
and was found to vary significantly among the four mice (P <
0.05). Although the total number of dendritic intersections
varied across the four mice, the total number of dendritic inter-
sections peaked at similar distances from the soma (arrows in
Fig. 6B,C). In apical dendrites, dendritic intersections peaked
at a distance of 65–215 µm from the soma, whereas in basal
dendrites, the peak was found at an approximate distance of
50–135 µm from the soma. Note that this pilot study did not
investigate hippocampal asymmetry, therefore no information
regarding inter-animal difference in the above-mentioned
dendritic parameters is available. The reported data of dendro-
grams and Sholl analysis strongly suggest that robust quan-
titative analyses can be obtained from diOlistically labeled
neurons.
Optimization of CLSM Imaging Parameters
High-resolution confocal images require a small pinhole aper-
ture with a long scan speed in order to optimize signal-to-noise
ratio. However, the consequence of lengthy scanning is
bleaching of fluorescent signal in small-diameter dendritic
spines. Also, because the intensity of membrane labeling
decreases in proportion to the distance from the soma, scan-
ning with a small pinhole aperture results in loss of fluorescent
labeling in distal dendrites. To retain these subtle signals, the
total scan time was reduced by increasing the pinhole aperture
and shortening the scan speed at the expense of increased
background fluorescence.
To test whether this optimization would affect image acqui-
sition or quantitative data with respect to variability (three
trials per image; also see Experimental Procedures), confocal
images of the same labeled neurons were acquired with 48, 73
and 88 µm pinhole apertures, and the total dendritic length
was obtained with reconstruction. ANOVA revealed a signifi-
cant main effect of pinhole aperture between the three groups
(P < 0.001). Bonferroni post hoc test confirmed that total
dendritic length was smaller with 48 µm-pinhole scanned
images (see Supplementary Material Fig. S3-A) compared to 73
or 88 µm-pinhole scanned images (P < 0.001), while no differ-
ence was found between the other two groups. It was noted
that scanning with a pinhole aperture of 48 µm underestimated
the total dendritic length by ∼ 10% compared to images
collected with 73 and 88 µm apertures. An interaction effect
was also found between pinhole aperture and branch order
(P < 0.05) and post hoc tests showed that the averaged length
of the most distal, sixth-order dendrites was underestimated
using 48 µm pinhole aperture (P < 0.05), while no difference
was found in other branch orders among the three groups
(see Supplementary Material Fig. S3-B). Therefore, the under-
estimated total dendritic length with the 48 µm pinhole aper-
ture is mainly attributable to the loss of the most distal
dendritic branches.
Similarly, confocal images of labeled neurons were acquired
with 1.9, 3.9 and 7.8 s/scan, and the total dendritic length was
obtained with reconstruction. No significant difference of total
dendritic length was found among the three groups (see
Supplementary Material Fig. S3-C). Post hoc tests showed no
difference in the averaged length of each branch order among
the three groups (see Supplementary Material Fig. S3-D). These
Figure 6. Quantitative analyses of CA1 pyramidal cells of 90-day-old male C57 mice(n = 4). For each animal, 10 cells were reconstructed using Neurolucida and subse-quently quantified using NeuroExplorer. (A) Dendrograms. There was a significant dif-ference in total length of both apical and basal dendrites among these animals (P <0.05). (B) Sholl analysis. In apical dendrites, a peak of dendritic intersections was foundat a distance of 65–215 µm from the soma, whereas in basal dendrites, the peak wasfound at a distance of 50–135 µm from the soma. It was noted that the number of den-dritic intersections varied significantly among the four mice (P < 0.05). Significant dif-ferences were found in both apical and basal dendrites, at the distance of 65–215 and50–135 µm from soma, respectively (P < 0.05; see detail in text).
by guest on June 12, 2013http://cercor.oxfordjournals.org/
Dow
nloaded from

Page 8 of 12 High-throughput Morphometric Analysis of Individual Neurons • Wu et al.
data suggested that scanning with a fast speed, 1.9 s/scan,
could obtain estimates of dendritic length as accurately as
scans with slower speeds.
Thus, with imaging parameters optimized to reduce
bleaching, at the expense of increased background fluores-
cence, accurate measurements of dendritic lengths can be
obtained. Most importantly, the optimization process has
reduced the total scan time by as much as ∼ 30% (see Supple-
mentary Material Fig. S4), minimizing dye bleaching and
preserving signal for subsequent photoconversion (see below).
Photoconversion of Diolistically Loaded Neuron
To validate the efficiency and applicability of the current
version of the CCC, the progress of photoconversion of a diOl-
istically labeled neuron was monitored. The presence of DAB
reaction product was found within the cytoplasm 5 min after
commencement of photoconversion (Fig. 7A). It was noted
that the dendritic geometry of a CLSM-imaged neuron resem-
bled that of the photoconverted cell, implying that a sufficient
amount of DiI signal is preserved (Fig. 7B,C). In the present
study, a 10× objective lens was used to illuminate the tissue
because the higher objective lens (25×) was found to easily
dehydrate the tissue using the CCC (not shown). Moreover, the
field of view of a 10× objective lens allowed for photoconver-
sion of multiple neurons concurrently labeled, as shown in
Figure 2B. Conventionally, it requires, on average, 1.5–2 h to
photoconvert the full dendritic tree of a diOlistically labeled
pyramidal cell. However, the current protocol has enhanced
the entire conversion process by reducing the illumination
time by 50% (Table 1).
With optimized imaging parameters that have minimized dye
bleaching, previously CLSM-imaged neurons could be photo-
converted for dendritic spine analysis (see Fig. 8A–G). Based
on the current protocol, the complete 3-D structure of diOlisti-
cally labeled neurons can be quickly acquired using optimized
CLSM parameters (Fig. 8A) in order to perform reconstruction
(Fig. 8B) for quantitative analysis, including dendrogram and
Sholl analysis (Fig. 8C). Meanwhile, the CLSM-imaged neurons,
with minimized bleaching, can be directly photoconverted
using the CCC method (Fig. 8D,E) for spine analysis (Fig.
8F,G). It was noted that the dendritic geometry of a CLSM-
imaged neuron resembled that of the photoconverted cell (Fig.
8A,E). This workflow provides the most accessible and effi-
cient way of obtaining systematic quantitative data for both the
dendritic arbor and spine density of individual neurons.
Discussion
The present study has enhanced the protocol of the current
diOlistic method for large-scale quantitative analyses of
neuronal morphology in fixed brain tissue. Using optimized
imaging parameters and morphological criteria, this study
systematically characterized diOlistically loaded neurons with
the preservation of diffuse signals in dendritic spines, allowing
for subsequent photoconversion to reveal spine morphology.
To our knowledge, this is the first report that has combined the
diOlistic and photoconversion methods for full-scale quantita-
tive characterization of individual neurons.
Diolistic versus Current Loading Methods
Most conventional methods, such as Golgi impregnation and
intracellular loading used to illustrate the dendritic morphology
are not only technically demanding but also are inadequate
to systematically characterize neurons. Furthermore, these
methods lack random sampling, making the resultant quantita-
tive data highly variable. Although the biolistic transfection
method is able to overcome the aforementioned limitations
and produces excellent staining of dendritic trees, the effi-
ciency of transfection heavily depends on the biological state
of the living cells after bombardment. A clear advantage of
Figure 7. High-throughput photoconversion protocol. (A) Validation of the efficiency of CCC. It was noted that the cytoplasm contained DAB reaction products 5 min after com-mencement of photoconversion. (B) Comparison of the distribution of dendritic spines before and after photoconversion. The distribution of dendritic spines of the two imagesappears similar (arrows).
Table 1 Comparison of time required per cell for photoconversion between conventional and CCC methods
aThe number of cells converted is indicated in parenthesis.bThe refreshing of DAB might facilitate oxidation of complex cells, i.e. pyramidal cells of thick sections.
CA1 pyramidal cells Dentate granule cells DAB refreshing
Conventional 2.1 h (n = 15)a 1.5 h (n = 10) >5 times
CCC 1.0 h (n = 15) 0.8 h (n = 10) <1–2 timesb
by guest on June 12, 2013http://cercor.oxfordjournals.org/
Dow
nloaded from

Cerebral Cortex Page 9 of 12
Figure 8. Photoconversion of a CLSM-imaged pyramidal cell. (A) A collapsed CLSM image of a diOlistically labeled pyramidal cell with fully labeled dendrites. Asterisks indicatesurrounding DiI clusters, which do not interfere with visualization of the dendritic trees. (B) Neuron reconstructed using Neurolucida. (C) Quantitation, including dendrogram (upperpanel) and Sholl analyses (lower panel). Note that the data of B and D were derived from the pilot study shown in Figure 6. (D) Low magnification view (2.5×) of a photoconvertedtissue slab. Note the high background of the converted area. (E) A photoconverted pyramidal cell. The suboptimal resolution of the cell was due to the optical limitation of imageacquisition in a 250 µm section. It was noted that the dendritic geometry of the converted pyramidal cell appeared similar to that of the collapsed CLSM and reconstructed images(see A and B). The box indicates one of the basal dendrites. (F) High resolution of spine morphology. The shapes of the spines are clearly visualized using a light microscope. (G)Spine analysis. The spine counting (red dots and arrows) is conducted using Neurolucida. Abbreviations: cc, corpus callosum; sp, stratum pyramidale; so, stratum oriens; sr, stratumradiatum.
by guest on June 12, 2013http://cercor.oxfordjournals.org/
Dow
nloaded from
Page 10 of 12 High-throughput Morphometric Analysis of Individual Neurons • Wu et al.
using the diOlistic approach on fixed tissue is the liberty of
tissue handling. Not only can the tissue be repeatedly
bombarded, but the diOlistic loading is also independent of the
cell’s gene transcription and protein synthesis.
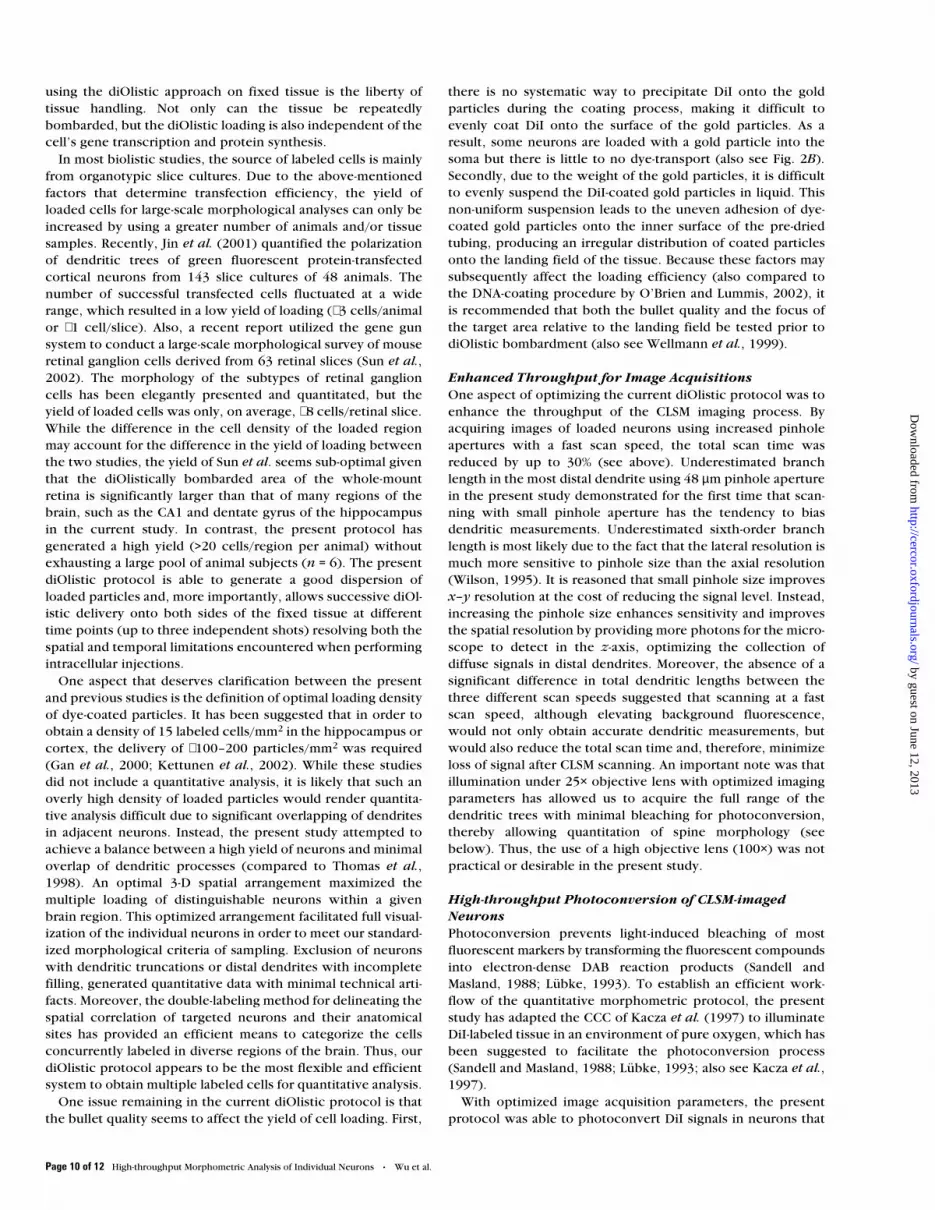
In most biolistic studies, the source of labeled cells is mainly
from organotypic slice cultures. Due to the above-mentioned
factors that determine transfection efficiency, the yield of
loaded cells for large-scale morphological analyses can only be
increased by using a greater number of animals and/or tissue
samples. Recently, Jin et al. (2001) quantified the polarization
of dendritic trees of green fluorescent protein-transfected
cortical neurons from 143 slice cultures of 48 animals. The
number of successful transfected cells fluctuated at a wide
range, which resulted in a low yield of loading (∼ 3 cells/animal
or ∼ 1 cell/slice). Also, a recent report utilized the gene gun
system to conduct a large-scale morphological survey of mouse
retinal ganglion cells derived from 63 retinal slices (Sun et al.,
2002). The morphology of the subtypes of retinal ganglion
cells has been elegantly presented and quantitated, but the
yield of loaded cells was only, on average, ∼ 8 cells/retinal slice.
While the difference in the cell density of the loaded region
may account for the difference in the yield of loading between
the two studies, the yield of Sun et al. seems sub-optimal given
that the diOlistically bombarded area of the whole-mount
retina is significantly larger than that of many regions of the
brain, such as the CA1 and dentate gyrus of the hippocampus
in the current study. In contrast, the present protocol has
generated a high yield (>20 cells/region per animal) without
exhausting a large pool of animal subjects (n = 6). The present
diOlistic protocol is able to generate a good dispersion of
loaded particles and, more importantly, allows successive diOl-
istic delivery onto both sides of the fixed tissue at different
time points (up to three independent shots) resolving both the
spatial and temporal limitations encountered when performing
intracellular injections.
One aspect that deserves clarification between the present
and previous studies is the definition of optimal loading density
of dye-coated particles. It has been suggested that in order to
obtain a density of 15 labeled cells/mm2 in the hippocampus or
cortex, the delivery of ∼ 100–200 particles/mm2 was required
(Gan et al., 2000; Kettunen et al., 2002). While these studies
did not include a quantitative analysis, it is likely that such an
overly high density of loaded particles would render quantita-
tive analysis difficult due to significant overlapping of dendrites
in adjacent neurons. Instead, the present study attempted to
achieve a balance between a high yield of neurons and minimal
overlap of dendritic processes (compared to Thomas et al.,
1998). An optimal 3-D spatial arrangement maximized the
multiple loading of distinguishable neurons within a given
brain region. This optimized arrangement facilitated full visual-
ization of the individual neurons in order to meet our standard-
ized morphological criteria of sampling. Exclusion of neurons
with dendritic truncations or distal dendrites with incomplete
filling, generated quantitative data with minimal technical arti-
facts. Moreover, the double-labeling method for delineating the
spatial correlation of targeted neurons and their anatomical
sites has provided an efficient means to categorize the cells
concurrently labeled in diverse regions of the brain. Thus, our
diOlistic protocol appears to be the most flexible and efficient
system to obtain multiple labeled cells for quantitative analysis.
One issue remaining in the current diOlistic protocol is that
the bullet quality seems to affect the yield of cell loading. First,
there is no systematic way to precipitate DiI onto the gold
particles during the coating process, making it difficult to
evenly coat DiI onto the surface of the gold particles. As a
result, some neurons are loaded with a gold particle into the
soma but there is little to no dye-transport (also see Fig. 2B).
Secondly, due to the weight of the gold particles, it is difficult
to evenly suspend the DiI-coated gold particles in liquid. This
non-uniform suspension leads to the uneven adhesion of dye-
coated gold particles onto the inner surface of the pre-dried
tubing, producing an irregular distribution of coated particles
onto the landing field of the tissue. Because these factors may
subsequently affect the loading efficiency (also compared to
the DNA-coating procedure by O’Brien and Lummis, 2002), it
is recommended that both the bullet quality and the focus of
the target area relative to the landing field be tested prior to
diOlistic bombardment (also see Wellmann et al., 1999).
Enhanced Throughput for Image Acquisitions
One aspect of optimizing the current diOlistic protocol was to
enhance the throughput of the CLSM imaging process. By
acquiring images of loaded neurons using increased pinhole
apertures with a fast scan speed, the total scan time was
reduced by up to 30% (see above). Underestimated branch
length in the most distal dendrite using 48 µm pinhole aperture
in the present study demonstrated for the first time that scan-
ning with small pinhole aperture has the tendency to bias
dendritic measurements. Underestimated sixth-order branch
length is most likely due to the fact that the lateral resolution is
much more sensitive to pinhole size than the axial resolution
(Wilson, 1995). It is reasoned that small pinhole size improves
x–y resolution at the cost of reducing the signal level. Instead,
increasing the pinhole size enhances sensitivity and improves
the spatial resolution by providing more photons for the micro-
scope to detect in the z-axis, optimizing the collection of
diffuse signals in distal dendrites. Moreover, the absence of a
significant difference in total dendritic lengths between the
three different scan speeds suggested that scanning at a fast
scan speed, although elevating background fluorescence,
would not only obtain accurate dendritic measurements, but
would also reduce the total scan time and, therefore, minimize
loss of signal after CLSM scanning. An important note was that
illumination under 25× objective lens with optimized imaging
parameters has allowed us to acquire the full range of the
dendritic trees with minimal bleaching for photoconversion,
thereby allowing quantitation of spine morphology (see
below). Thus, the use of a high objective lens (100×) was not
practical or desirable in the present study.
High-throughput Photoconversion of CLSM-imaged
Neurons
Photoconversion prevents light-induced bleaching of most
fluorescent markers by transforming the fluorescent compounds
into electron-dense DAB reaction products (Sandell and
Masland, 1988; Lübke, 1993). To establish an efficient work-
flow of the quantitative morphometric protocol, the present
study has adapted the CCC of Kacza et al. (1997) to illuminate
DiI-labeled tissue in an environment of pure oxygen, which has
been suggested to facilitate the photoconversion process
(Sandell and Masland, 1988; Lübke, 1993; also see Kacza et al.,
1997).
With optimized image acquisition parameters, the present
protocol was able to photoconvert DiI signals in neurons that
by guest on June 12, 2013http://cercor.oxfordjournals.org/
Dow
nloaded from

Cerebral Cortex Page 11 of 12
were previously imaged using the CLSM. The current protocol
has enhanced the quality of DAB reaction products as well as
reduced the oxidation time by 50% (see Results). While the
percentage loss of DiI signal in dendritic spines after CLSM
imaging requires further investigation, the present finding has
demonstrated a rather comparable resolution of the spine
signals before and after photoconversion (see Fig. 7B). These
data have validated our method for preservation of DiI signals
in dendritic spines after fast CLSM scanning for subsequent
photoconversion. Moreover, the quality of photoconversion
depends, among other factors, on the duration and intensity of
light irradiation, which are determined by the magnification
and numerical aperture of the objective lens that is used. While
most of the studies favor the use of a 20× or higher objective
lens, the present study utilized the wider illuminated field of
the 10× objective lens to simultaneously photoconvert multiple
labeled cells. This is highly advantageous for enhancing the
yield of photoconverted neurons, and thus has added a plus to
the high-throughput process of our combined protocols.
Accordingly, ultra-structural examinations of the dendritic
spines of diOlistically labeled neurons are feasible following
photoconversion.
ConclusionOur combined protocols have proven capable of (i) enhancing
the throughput of randomized cell loading by resolving the
spatial (3-D inter-particle space) and temporal (multiple shoot-
ings of the same tissue at different time points) restrictions that
often occur in conventional labeling techniques, (ii) opti-
mizing the image acquisition process to readily obtain dendro-
grams, and to (iii) subsequently conduct photoconversion of
previously CLSM-imaged neurons, for visualization and quanti-
tative analysis of spine morphology. This approach represents
the most efficient throughput for revealing the systematic
correlation of the dendrites and spines of individual neurons.
Because the morphology of the neurons reflects the physiology
and function of the nervous system, the current protocol is a
powerful tool for revealing subtle changes in the dendrites and
spines of neuropathologic specimens.
Supplementary MaterialSupplementary material can be found at:
http://cercor.oupjournals.org.
NotesThe authors are thankful for the scientific advice of Drs Barry E.
Kosofsky and Jeff M. Redwine, and excellent technical support from
Dr Ron S. Broide, Mr Faisal Chawla and Ms Anna M. Cervantes.
Address correspondence to Floyd E. Bloom, Neurome, Inc., 11149
North Torrey Pines Rd., La Jolla, CA 92037, USA. Email:
ReferencesArnold PB, Li CX, Waters RS (2001) Thalamocortical arbors extend
beyond single cortical barrels: an in vivo intracellular tracing study
in rat. Exp Brain Res 136:152–168.
Balercia G, Chen S, Bentivoglio M (1992) Electron microscopic
analysis of fluorescent neuronal labeling after photoconversion. J
Neurosci Methods 45:87–98.
Biewenga JE, Destree OH, Schrama LH (1997) Plasmid-mediated gene
transfer in neurons using the biolistics technique. J Neurosci
Methods 71:67–75.
Buhl EH, Schlote W (1987) Intracellular Lucifer yellow staining and
electron microscopy of neurones in slices of fixed epitumourous
human cortical tissue. Acta Neuropathol 75:140–146.
de Lima AD, Voigt T, Morrison JH (1990) Morphology of the cells
within the inferior temporal gyrus that project to the prefrontal
cortex in the macaque monkey. J Comp Neurol 296:159–172.
Danzer SC, Crooks KR, Lo DC, McNamara JO (2002) Increased expres-
sion of brain-derived neurotrophic factor induces formation of
basal dendrites and axonal branching in dentate granule cells in
hippocampal explant cultures. J Neurosci 22:9754–9763.
Duan H, Wearne SL, Morrison JH, Hof PR (2002) Quantitative analysis
of the dendritic morphology of corticocortical projection neurons
in the macaque monkey association cortex. Neuroscience
114:349–359.
Gan WB, Grutzendler J, Wong WT, Wong RO, Lichtman JW (2000)
Multicolor ‘DiOlistic’ labeling of the nervous system using
lipophilic dye combinations. Neuron 27:219–225.
Hall GF, Yao J, Lee G (1997) Human tau becomes phosphorylated and
forms filaments deposits when over expressed in lamprey central
neurons in situ. Proc Natl Acad Sci USA 94:4733–4738.
Hof PR, Young WG, Bloom FE, Belichenko PV, Celio MR (2000)
Comparative cytoarchitectonic atlas of the C57BL/6 and 129/Sv
mouse brains. New York: Elsevier Health Sciences.
Honig MG, Hume RI (1986) DiI and DiO: versatile fluorescent dyes for
neuronal labeling and pathway tracing. Trends Neurosci
12:333–341.
Jin X, Mathers PH, Szabo G, Katarova Z, Agmon A (2001) Vertical bias
in dendritic trees of non-pyramidal neocortical neurons expressing
GAD67-GFP in vitro. Cereb Cortex 11:666–678.
Kacza J, Härtig W, Seeger J (1997) Oxygen-enriched photoconversion
of fluorescent dyes by means of a closed conversion chamber. J
Neurosci Methods 71:225–232.
Kettunen P, Demas J, Lohmann C, Kasthuri, N, Gong Y, Wong RO,
Gan WB (2002) Imaging calcium dynamics in the nervous system
by means of ballistic delivery of indicators. J Neurosci Methods
119:37–43.
Klimaschewski L, Nindl W, Pimpl M, Waltinger P, Pfaller K (2002)
Biolistic transfection and morphological analysis of cultured
sympathetic neurons. J Neurosci Methods 113:63–71.
Lübke J (1993) Photoconversion of diaminobenzidine with different
fluorescent neuronal markers into a light and electron microscopic
dense reaction product. Microsc Res Tech 24:2–14.
Lo DC, McAllister AK, Katz LC (1994). Neuronal transfection in brain
slices using particle-mediated gene transfer. Neuron 13:1263–1268.
Lurquin PF (1997) Gene transfer by electroporation. Mol Biotechnolnol
7:5–35.
Morgan CW, Ohara PT (2001) Quantitative analysis of the dendrites of
sacral preganglionic neurons in the cat. J Comp Neurol 437:56–69.
O’Brien, J and Lummis, SC (2002) An improved method of preparing
microcarriers for biolistic transfection. Brain Res Protoc 10:12–15.
O’Brien JA, Holt M, Whiteside G, Lummis SC, Hastings MH (2001)
Modifications to the hand-held Gene Gun: improvements for in
vitro biolistic transfection of organotypic neuronal tissue. J
Neurosi Methods 112:57–64.
Robbins PD, Tahara H, Ghivizzani, SC (1998) Viral vectors for gene
therapy. Trends Biotechnol 16:35–40.
Sandell JH, Masland RH (1988) Photoconversion of some fluorescent
markers to a diaminobenzidine product. J Histochem Cytochem
36:555–559.
Schmidt M, Lehnert G, Baker RG, Hoffmann KP (1996) Dendritic
morphology of projection neurons in the cat pretectum. J Comp
Neurol 369:520–532.
Strauss WM (1996) Transfection of mammalian cells via lipofection.
Methods Mol Biol 54:307–327.
Sun W, Li N, He S (2002) Large-scale morphological survey of mouse
retinal ganglion cells. J Comp Neurol 451:115–126.
Taylor B, Peskin CS, Leonard CS (1996) Quantitative morphology of
physiologically identified and intracellularly labeled neurons from
the guinea-pig laterodorsal tegmental nucleus in vitro. Neuro-
science 72:375–392.
by guest on June 12, 2013http://cercor.oxfordjournals.org/
Dow
nloaded from

Page 12 of 12 High-throughput Morphometric Analysis of Individual Neurons • Wu et al.
Thomas A, Kim DS, Fields RL, Chin H, Gainer H (1998) Quantitative
analysis of gene expression in organotypic slice-explant cultures
by particle-mediated gene transfer. J Neurosci Methods 84:181–191.
Usachev YM, Khammanivong A, Campbell C, Thayer SA (2000)
Particle-mediated gene transfer to rat neurons in primary culture.
Pflugers Arch 439:730–738.
Wellmann H, Kaltschmidt B, Kaltschmidt C (1999) Optimized protocol
for biolistic transfection of brain slices and dissociated cultured
neurons with a hand-held gene gun. J Neurosci Methods 92:55–64.
Wilson T (1995) The role of the pinhole in confocal imaging system.
In: Handbook of biological confocal microscopy (Pawley JB, ed.),
pp. 167–182. New York: Plenum.
Wu C-C, Baumann B, Reilly JF, Morrison JH, Young WG, Bloom FE
(2003) High-throughput morphometric analysis of individual
neurons: diOlistic and automated reconstruction protocols. 2003
Experimental Biology Meeting Abstr 83060.
by guest on June 12, 2013http://cercor.oxfordjournals.org/
Dow
nloaded from