high-resolution map of sugarcane cultivation in brazil using a
TRANSCRIPT
1
High-resolution map of sugarcane cultivation in Brazil using a
phenology-based method
Yi Zheng1, Ana Cláudia dos Santos Luciano2,3, Jie Dong4, Wenping Yuan1*
1School of Atmospheric Sciences, Southern Marine Science and Engineering Guangdong Laboratory (Zhuhai), Sun Yat-sen
University, Zhuhai 519082, Guangdong, China 5 2Department of Biosystems Engineering, College of Agriculture “Luiz de Queiroz” (ESALQ), University of Sao Paulo, Sao
Paulo, P.O. Box 9 Av. Padua Dias 11, 13418-900 Piracicaba-SP, Brazil 3Interdisciplinary Center on Energy Planning (NIPE), UNICAMP, 13083-896 Campinas, Brazil 4College of Geomatics & Municipal Engineering, Zhejiang University of Water Resources and Electric Power, Hangzhou
310018, Zhejiang, China 10
Correspondence to: Wenping Yuan ([email protected]).
Abstract. Sugarcane is the most important source of sugar, and its cultivation area has undergone rapid expansion, replacing
other crops, pastures, and forests. Brazil is the world’s largest sugarcane producer and contributed to approximately 38.6% of
the world’s total production in 2019. Sugarcane in Brazil can be harvested from April to December in south-central area and
from September to April in northeast area. The flexible phenology and harvest conditions of sugarcane in Brazil make it 15
difficult to identify the harvest area at state to country scales. In this study, we developed a phenology-based method to identify
the harvest area of sugarcane in Brazil by incorporating the multiple phenology conditions into a time-weighted dynamic time
warping method (TWDTW). Then, we produced annual 30-m spatial resolution sugarcane harvest maps (2016-2019) for 14
states in Brazil (over 98% of the harvest area) based on the proposed method by using Landsat-7/8 and Sentinel-2 optical data.
The proposed method performed well in identifying sugarcane harvest area with limited training sample data. Validations for 20
the 2018 harvest year displayed high accuracy, with user’s, producer’s, and overall accuracies of 97.00%, 88.08%, and 92.99%
in Brazil, respectively. In addition, the identified harvest area of sugarcane exhibited good correlations with the agricultural
statistical data provided by the Brazilian Institute of Geography and Statistics (IBGE) at the municipality, microregion, and
mesoregion levels. The 30-m Brazil sugarcane harvest maps can be obtained at https://doi.org/10.6084/m9.figshare.14213909
(Zheng et al., 2021). 25
https://doi.org/10.5194/essd-2021-88
Ope
n A
cces
s Earth System
Science
DataD
iscussio
ns
Preprint. Discussion started: 23 June 2021c© Author(s) 2021. CC BY 4.0 License.
2
1 Introduction
Sugarcane (Saccharum officinarum) is a semi-perennial crop that can be cut multiple times throughout several years in tropical
and subtropical areas (Abdel-Rahman and Ahmed, 2008; Sindhu et al., 2016; Mulyono et al., 2017). Sugarcane is an important
sugar and energy crop. Over 70% of world sugar comes from sugarcane (Brar et al., 2015; Iqbal et al., 2015). Sugarcane
ethanol is an alternative energy source that can reduce CO2 emission resulting from fossil fuel use (Bordonal et al., 2015; 30
Jaiswal et al., 2017). In addition, sugarcane leaves can be used as fodder and be manufactured into paper and bioenergy (Leal
et al., 2013). Sugarcane accounts for approximately 20% of global crop production over the period from 2000–2018, and this
value is almost twice the share of maize, the second most produced crop worldwide (FAO, 2020). Sugarcane has now become
a crop with high socio-economic importance for Brazil and other producers, such as India, China, Thailand, Pakistan, the
United States, and Australia (Monteiro et al., 2018). Recently, sugarcane has undergone rapid expansion by occupying the 35
land of other crops, pastures, and forests (Adami et al., 2012; Ferreira et al., 2015; Wachholz de Souza et al., 2017; Defante et
al., 2018). The expansion of sugarcane production areas can influence regional land cover use, water use, greenhouse gas
emission, soil carbon balance, and climate change (Loarie et al., 2011; Mello et al., 2014; Zhang et al., 2015; Jaiswal et al.,
2017). Timely and accurate estimates of the distribution, harvest area and growing conditions of sugarcane are crucial for
sustainable sugarcane production and national food security. 40
Recently, single-date or time series moderate to high resolution remote sensing optical data (e.g., Landsat, Sentinel-2, SPOT,
and CBERS) and synthetic aperture radar (SAR) data (e.g., PALSAR and Sentinel-1) have been used for crop mapping based
on unsupervised and supervised classification methods (Lin et al., 2009; Johnson et al., 2014; Li et al., 2015; Belgiu et al.,
2018). The most current and popular classification method is machine learning, such as random forest (Zhou et al., 2015;
Luciano et al., 2018, 2019; Wang et al., 2019), support vector machine (Johnson et al., 2014; Zheng et al., 2015), and neural 45
networks (Cai et al., 2018). For sugarcane identification, Junior et al. (2017) mapped the area of sugarcane in Paraná state in
Brazil based on supervised maximum likelihood classification using Landsat/TM/OLI and IRS/LISS-3 images. Depending on
the sugarcane map from 2009-2014 generated by the Canasat Project (Rudorff et al., 2010) as ground truth sample data, a
random forest classification model was calibrated at 10 sites located across São Paulo state and employed to the entire state in
2015, showing the ability to create spatial and time generalization models (Luciano et al., 2019). Jiang et al. (2019) identified 50
sugarcane in Zhanjiang city in China using machine learning methods and Sentinel-1A/2 time series satellite data. However,
these methods strongly depend on extensive training samples, which are time-consuming and labor-intensive to obtain at the
state and country scales (Dong et al., 2020a; Wang et al., 2020). For example, the U.S. Department of Agriculture (USDA)
National Agricultural Statistics Service (NASS) produced the 30-m resolution Cropland Data Layer (CDL) product using a
decision tree classification method, and this approach mainly relied on the large volume of USDA Common Land Unit (CLU) 55
data to establish training samples that are updated annually (Boryan et al., 2011). Only in Nebraska did the CLD product need
more than 250,000 CLU records for training the classification method.
https://doi.org/10.5194/essd-2021-88
Ope
n A
cces
s Earth System
Science
DataD
iscussio
ns
Preprint. Discussion started: 23 June 2021c© Author(s) 2021. CC BY 4.0 License.
3
Phenology-based algorithms are also commonly used in regional classification (Wardlow et al., 2007; Zhong et al., 2014;
Massey et al., 2017; Dong et al., 2020b). These methods have been proposed and developed based on the crop calendar, e.g.,
the germination, tillering, grand growth, and ripening phases. Li et al. (2015) identified sugarcane on the Leizhou Peninsula in 60
China by comparing the polarization features (such as scattering angle and polarization entropy) of sugarcane with those of
other land use types in the early, middle, and late tillering periods using TerraSAR-X images. The result indicated that the
tillering period is a suitable growing phase that can be used for sugarcane cultivation area mapping. Mulyono et al. (2017)
identified sugarcane plantations in the Magetan district of East Java Province in Indonesia using support vector machine and
the crop phenology profile of enhanced vegetation index (EVI) time series derived from Landsat 8 images. Phenology-based 65
methods would be a potential alternative approach for identifying crop cultivation areas at the country scale with a low volume
of training samples (Dong et al., 2020a).
Dynamic time warping (DTW) is an effective phenology-based method in crop classification at large scales that compares the
differences in seasonal variations in the vegetation index of a target crop with those of other crop types and natural vegetation.
The original DTW method was developed for speech recognition and then employed for phenology-based classification using 70
time series satellite images (Sakoe and Chiba, 1978; Petitjean et al., 2012; Petitjean and Weber, 2014). However, the DTW
neglects the temporal ranges when searching the best alignment between two time series. Maus et al. (2016) proposed a time-
weighted version of the DTW method (TWDTW) by adding a temporal weight that accounts for the seasonality of crops into
the DTW method to balance shape matching and phenological changes. The TWDTW method performed well in identifying
winter wheat, crop, and forest with limited training data (Maus et al., 2016; Belgiu et al., 2018; Manabe et al., 2018; Dong et 75
al., 2020a).
Brazil is the world’s largest sugarcane production country and contributed to 37.6% of the world’s total harvest area in 2019,
followed by India (18.9%), Thailand (6.9%), China (5.3%), Pakistan (3.9%), and Mexico (3.9%) (FAO, 2020). Sugarcane in
Brazil is mainly located in south-central and northeast areas. Sugarcane is a semi-perennial crop. Its life cycle begins with the
planting of a stem cutting and grows for approximately 12 months or 12-18 months depending on the season, variety, and 80
region of planting (Rudorff et al., 2010). Generally, in the south-central area, sugarcane can be harvested from April to
December with a harvesting season spanning 9 months. In the northeast areas, sugarcane can be harvested from September to
April in the next year with a harvesting season spanning 8 months. The flexible phenology and harvest conditions of sugarcane
in Brazil make it difficult to identify the harvest area at large scales, particularly at the state to country scales. In this study,
based on Landsat and Sentinel-2 satellite data, we proposed a phenology-based method by incorporating multiple phenological 85
conditions of sugarcane into the TWDTW method to automatically identify the harvest area of sugarcane in Brazil at a spatial
resolution of 30-m from 2016 to 2019.
https://doi.org/10.5194/essd-2021-88
Ope
n A
cces
s Earth System
Science
DataD
iscussio
ns
Preprint. Discussion started: 23 June 2021c© Author(s) 2021. CC BY 4.0 License.
4
2 Data and methods
2.1 Study area
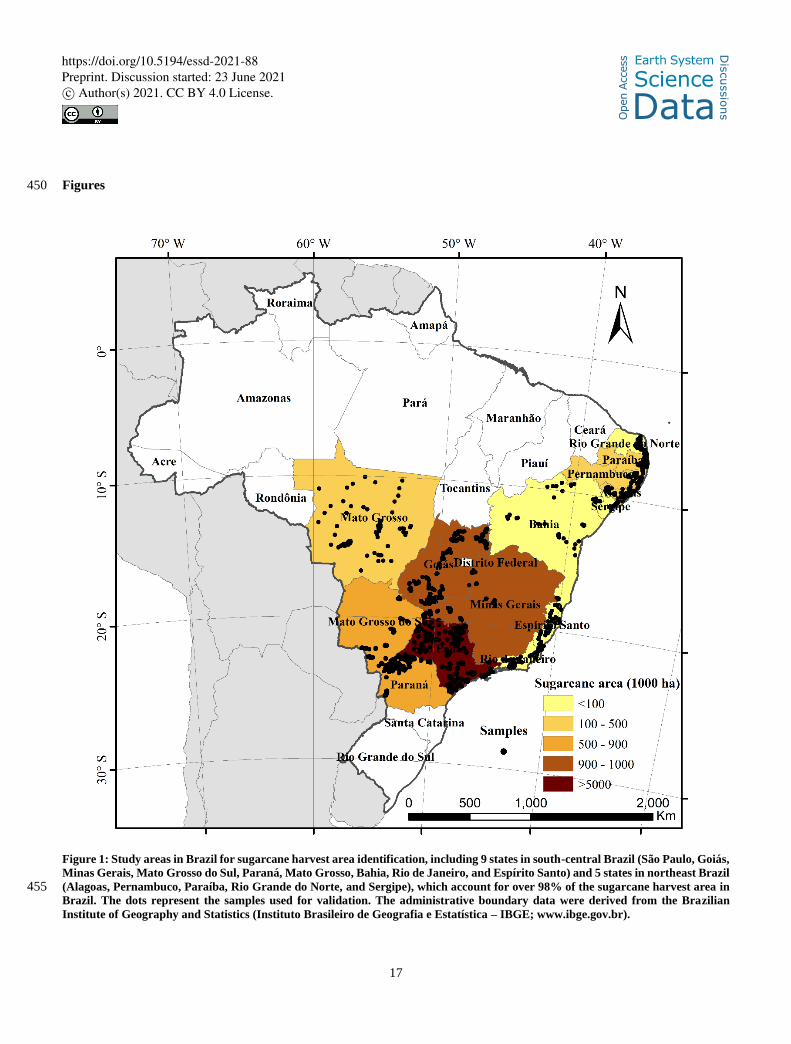
In Brazil, sugarcane is mainly located in the south-central and northeast regions, particularly in the state of São Paulo. In our 90
study, we mapped the harvest area of sugarcane in 14 states in Brazil, including São Paulo (SP, accounting for 55.1% of the
harvest area in Brazil), Goiás (GO, 9.5%), Minas Gerais (MG, 9.2%), Mato Grosso do Sul (MS, 6.8%), Paraná (PR, 6.1%),
Mato Grosso (MT, 2.8%), Bahia (BA, 0.7%), Rio de Janeiro (RJ, 0.5%), and Espírito Santo (ES, 0.4%) in south-central Brazil;
and Alagoas (AL, 2.8%), Pernambuco (PE, 2.4%), Paraíba (PB, 1.0%), Rio Grande do Norte (RN, 0.6%), and Sergipe (SE,
0.4%) in northeast Brazil (Fig. 1). The mapped areas constitute over 98% of the Brazilian sugarcane harvest area. 95
<<Figure 1>>
2.2 Datasets
2.2.1 Satellite data
In this study, all the available Landsat-7/8 and Sentinel-2 reflectance data from July 2015 to February 2020 were used to
generate 16-day composite normalized difference vegetation index (NDVI) series at the Google Earth Engine (GEE) platform. 100
Landsat-7 and Landsat-8 data had a 30-m spatial resolution and a 16-day temporal resolution. The quality band BQA was used
to remove pixels contaminated by clouds. The Sentinel-2 data had a 10-m spatial resolution and a 5-day temporal resolution.
The quality band QA60 was used to remove pixels contaminated by clouds. NDVI was computed using the reflectance data
from the near infrared band (ρNIR) and red band (ρRED):
𝑁𝐷𝑉𝐼 =𝜌𝑁𝐼𝑅−𝜌𝑅𝐸𝐷
𝜌𝑁𝐼𝑅+𝜌𝑅𝐸𝐷 (1) 105
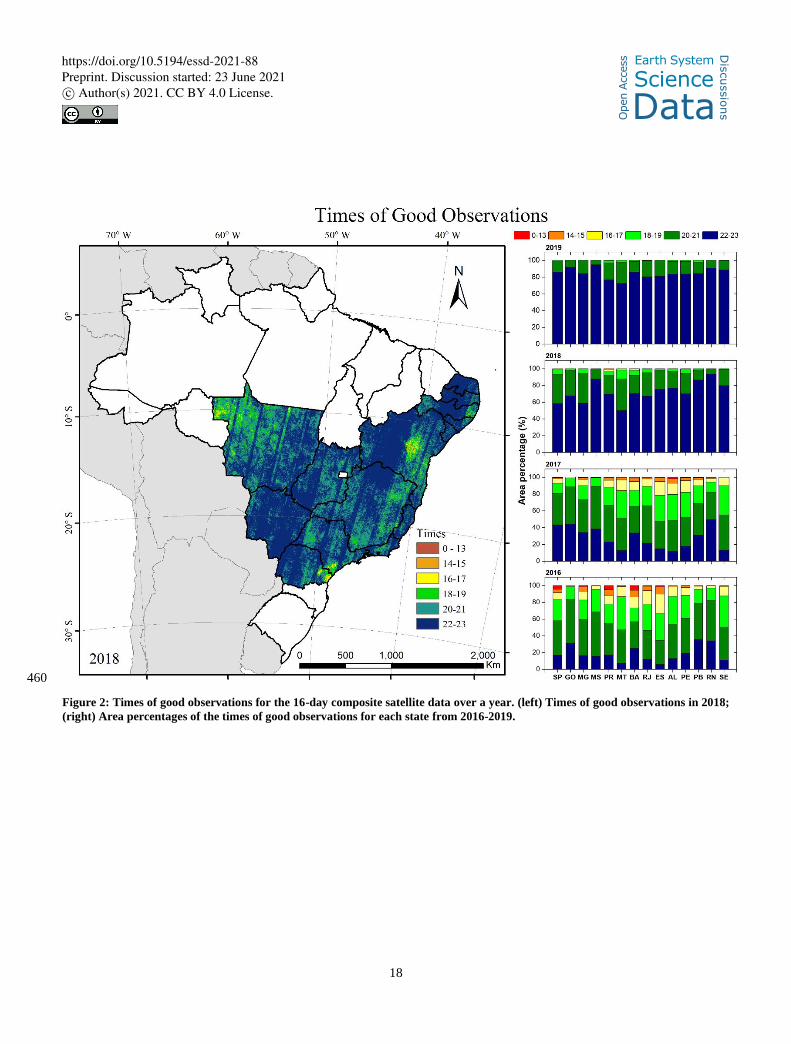
The cloud-free frequencies of the 16-day composite NDVI in a year for each pixel are shown in Figure 2. For 2018 and 2019,
most of the pixels had more than 20 times of good observations. For 2016 and 2017, the pixels with more than 20 times of
good observations were less, while most of the pixels had more than 18 times of good observations (Fig. 2). To reconstruct the
near real-time temporal profile of the 16-day NDVI, we filled the gaps in NDVI time series using a linear interpolation method
and then filtered the NDVI curves. 110
<<Figure 2>>
2.2.2 Field data
The field sample data in this study were mainly obtained based on the high-resolution images from Google Earth. We first
selected the samples using visual interpretations according to color and textures of the images from Google Earth, and we then
cross checked these samples using the NDVI series curves. Finally, we collected totally 2909 samples with 1393 for sugarcane 115
and 1516 for non-sugarcane in the year 2018 (Fig. 1).
https://doi.org/10.5194/essd-2021-88
Ope
n A
cces
s Earth System
Science
DataD
iscussio
ns
Preprint. Discussion started: 23 June 2021c© Author(s) 2021. CC BY 4.0 License.
5
2.2.3 Agricultural statistical data
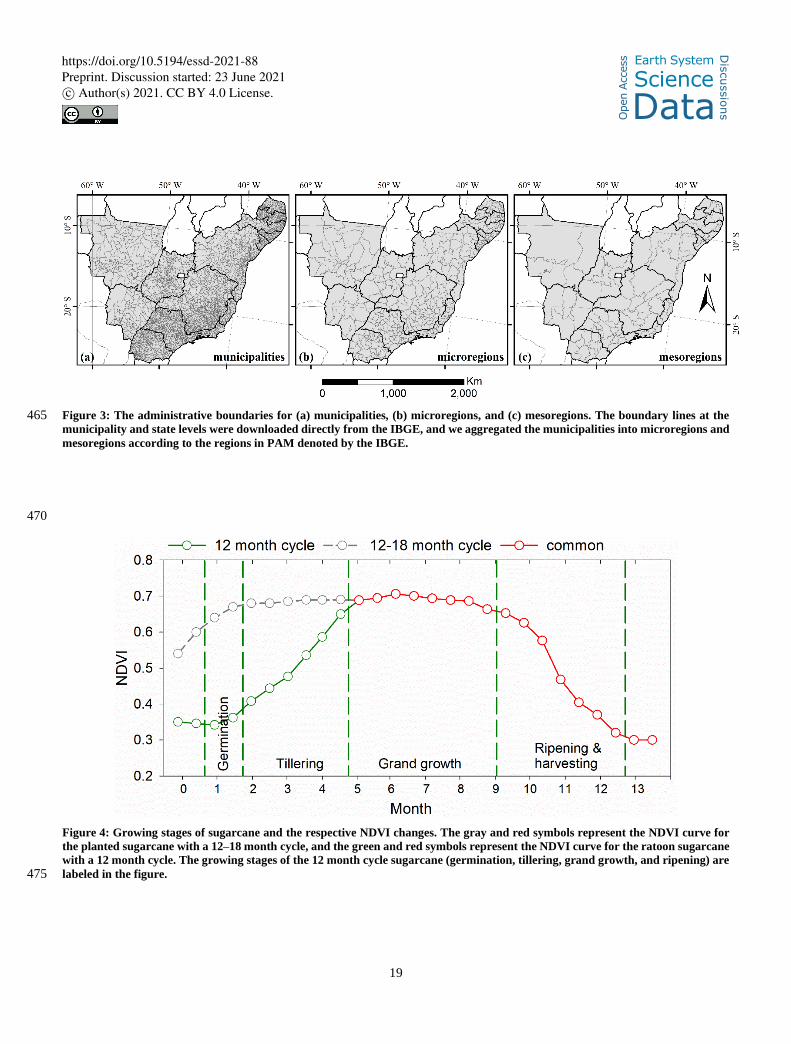
The agricultural statistical data for the sugarcane harvest area were derived from the Municipal Agricultural Production (PAM)
provided by the Brazilian Institute of Geography and Statistics (Instituto Brasileiro de Geografia e Estatística – IBGE;
www.ibge.gov.br). The PAM was carried out yearly across the entire country with the statistical data at the Brazil, major 120
region, federation unit, mesoregion, microregion and municipality levels. It provides information related to the plant area and
harvest area, production and average yield, and average price in the reference year for 64 agricultural products. In our study,
we used the harvest area from 14 major sugarcane planted states at the federation unit, municipality, microregion, and
mesoregion levels from 2016 to 2018 (the boundary lines of these regions are shown in Figure 3).
<<Figure 3>> 125
2.3 Methods
In this study, we employed a phenology-based method, namely the TWDTW method, to identify the harvest area of sugarcane
in Brazil. The workflow was as follows: (1) pre-processing of the satellite dataset (i.e., Landsat 7/8 and Sentinel-2) to obtain
the 16-day composite NDVI series, including low quality data removing (e.g., the elimination of clouds, cloud shadows, and
Landsat 7 ETM+ Scan Line Corrector (SLC-off) gaps), NDVI compositing, NDVI gap filling and data filtering; (2) extraction 130
of the standard NDVI curves of sugarcane in Brazil; (3) model development and sugarcane harvest area identification in Brazil
based on the TWDTW method; and (4) assessment of the mapping accuracy of the Brazil sugarcane harvest area.
2.3.1 Time-weighted dynamic time warping (TWDTW) method
TWDTW is a time-weighted version of the DTW method for land use and land cover classification (Belgiu et al., 2018; Dong
et al., 2020a). The TWDTW method performs phenology-based image classification by comparing the similarity between two 135
temporal sequences and finds the optimal alignment, namely, the minimum distance between the two time series (Petitjean et
al., 2012; Petitjean and Weber, 2014; Maus et al., 2016). The TWDTW algorithm includes three steps in land use classification
and identification: (1) generate the standard curve of a selected index (e.g., NDVI) for several crops or a single crop (e.g.,
sugarcane) based on time series images and field sample training data; (2) find the best alignment, and generate the
dissimilarities (TWDTW distances) between unknown curves of NDVI time series (i.e., the NDVI curves of the unknown 140
pixels) with the standard NDVI curve of sugarcane; (3) identify the unknown pixels based on the TWDTW distance; in this
process pixels with low distance indicate high similarity and a high probability of being associated with the specified class
(i.e., sugarcane).
2.3.2 Employing the TWDTW method for sugarcane mapping
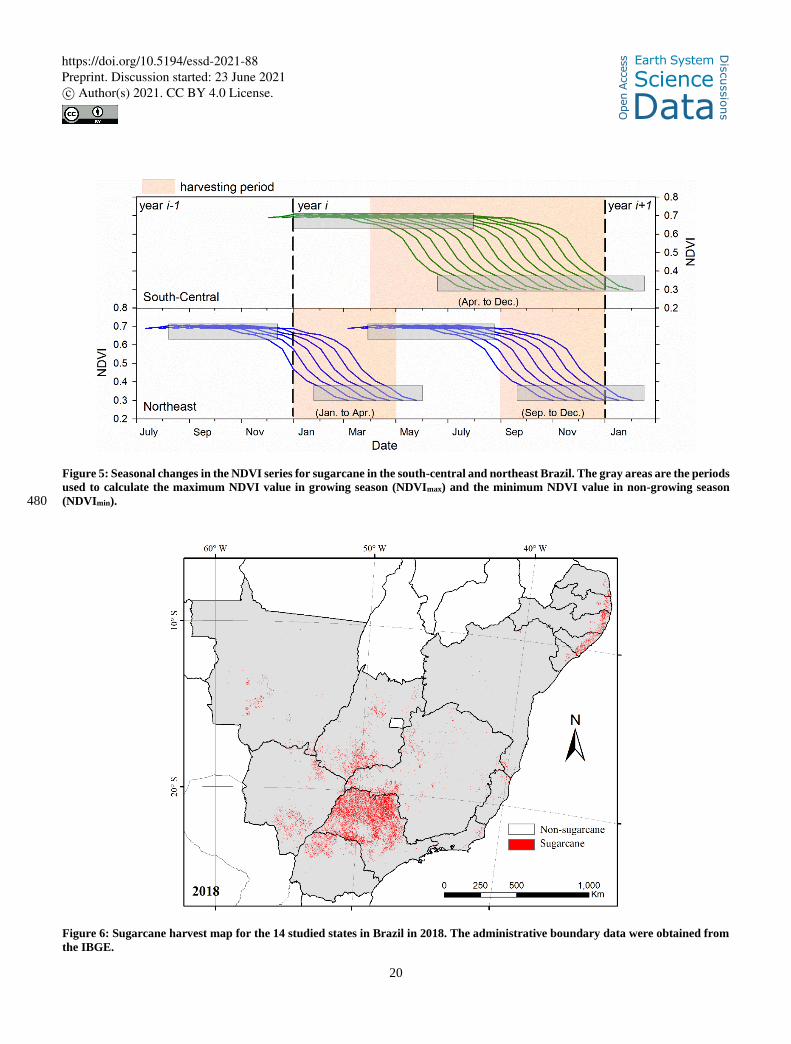
The growing period of sugarcane can be separated into four phases: the germination, tillering, grand growth, and ripening, and 145
the NDVI values vary in different growing phases (Fig. 4). (1) Germination phase. Sugarcane begins to germinate
https://doi.org/10.5194/essd-2021-88
Ope
n A
cces
s Earth System
Science
DataD
iscussio
ns
Preprint. Discussion started: 23 June 2021c© Author(s) 2021. CC BY 4.0 License.
6
approximately 15-30 days after planting. The NDVI starts to increase in this period. (2) Tillering phase. Tillering phase starts
after approximately 2 months of germination, and tillers emerge from the base of the mother shoot to form 5-10 stalks. The
NDVI increases quickly in this period. (3) Grand growth phase. This phase spans a period of approximately 4-10 months after
planting. The NDVI peaks during this period. (4) Ripening and harvesting phase. In this phase, the NDVI starts to decrease, 150
and the moisture content in sugarcane drastically drops.
From planting until the first cut, the crop is called planted sugarcane, and the growth cycle lasts between 12 and 18 months
depending on the season, variety, and region of planting. After the first harvest, ratoon sugarcane is harvested yearly with a
normal cycle of 12 months for a period of approximately 5 to 7 years or more (Rudorff et al., 2010). Although planted sugarcane
and ratoon sugarcane have different length in growing cycles, they shared similar NDVI curves from the grand growth to 155
ripening phases (red symbols in Fig. 4) which can be used as the standard seasonal curve for harvest area mapping. In Fig. 4,
the standard NDVI curves for sugarcane were generated by random selecting 50 sugarcane samples across Brazil from the
field data in 2018 (Section 2.2.2) and calculating their averaged NDVI values in the same growing period.
<<Figure 4>>
Sugarcane in Brazil covers an extensive harvesting period (Rudorff et al. 2010). In the south-central area (including São Paulo, 160
Goiás, Minas Gerais, Mato Grosso do Sul, Paraná, Mato Grosso, Bahia, Rio de Janeiro, and Espírito Santo), sugarcane is often
harvested from April to December, with a harvesting season spanning 9 months. In the northeast area (including Alagoas,
Pernambuco, Paraíba, Rio Grande do Norte, and Sergipe), sugarcane is harvested from September to April in the next year,
with a harvesting season spanning 8 months. According to the phenology of sugarcane in the south-central and northeast areas,
Figure 5 shows the possible standard NDVI curves (these NDVI curves were repeated from the NDVI standard curve for 165
sugarcane, as denoted by the red symbols and line in Fig. 4) for sugarcane in south-central and northeast Brazil. In this study,
we incorporate the flexible phenological and harvest conditions of sugarcane in Brazil into the TWDTW method as follows.
<<Figure 5>>
(1) We calculated all the possible “distance” values for each pixel by comparing the seasonal changes of NDVI curve with the
standard curves of sugarcane (Fig. 5) based on the TWDTW method from 2016-2019. In this process, we can obtain multiple 170
“distance” values for each pixel, and we selected the minimum value of the “distance” as the distance value for each pixel. (2)
The “difference” between the maximum NDVI value in the growing season (NDVImax: mean value of the two maximum NDVI
in the growing season) and the minimum NDVI value in the non-growing season (NDVImin: mean value of the two minimum
NDVI in the non-growing season) was calculated for each pixel (Fig. 5). In the Brazilian Cerrado, some vegetation types or
areas (such as grassland, seasonal forest, and grazing areas) exhibited low NDVI values between August and October (from 175
the end of the drought season to the beginning of the rainy season), and the corresponding NDVI curve is similar to the standard
NDVI curve of sugarcane harvesting in that period. However, the differences in NDVI between the growing season and non-
growing season for these vegetations were lower than those for sugarcane (Ferreira et al. 2004; Mueller et al. 2015). Therefore,
we used the NDVI difference between the growing season and non-growing season as another criterion to distinguish sugarcane
and other vegetation types. Theoretically, pixels with large NDVI differences have a high probability of being associated with 180
https://doi.org/10.5194/essd-2021-88
Ope
n A
cces
s Earth System
Science
DataD
iscussio
ns
Preprint. Discussion started: 23 June 2021c© Author(s) 2021. CC BY 4.0 License.
7
sugarcane cultivation. (3) To achieve the highest possible identification accuracy, we used an optimization method to determine
the “distance” and “difference” thresholds for identifying sugarcane. First, for each state, we set the flexible thresholds of
NDVI differences (TND) between the growing season and non-growing season from 0.1 to the possible maximum value with
an interval of 0.01. The pixels of NDVI differences larger than TND were selected as the possible sugarcane pixels for further
identification. Second, we used the agricultural statistical harvest area for sugarcane at the state level to determine the “distance” 185
threshold. A pixel with “distance” value lower than the “distance” threshold was considered a “sugarcane” pixel, and the total
area of all sugarcane pixels should be equal to the statistical harvest area of sugarcane in the investigated state. (4) We optimize
the TND value according to the identification error by comparing the estimated area with the agricultural statistical data at the
municipality level. In our study, municipalities with small areas of planted sugarcane (less than 1000 ha or less than 1% of the
total sugarcane area in the investigated state) were identified separately with other municipalities to improve the identification 190
accuracy of the entire investigated state.
2.3.3 Accuracy assessment
In this study, we first assessed the identification accuracy using the selected sugarcane and non-sugarcane samples based on
the high-resolution images from Google Earth (Section 2.2.2). The producer’s accuracy (PA), user’s accuracy (UA), and
overall accuracy (OA) were used for validation. The producer’s accuracy (PA) is the percentage of surveyed reference samples 195
correctly identified as the target class; the user’s accuracy (UA) is the percentage of surveyed reference samples identified as
the target class on the classification map actually confirmed by field surveys; and overall accuracy (OA) is the ratio of correctly
classified samples to all the samples. Additionally, we calculated the sugarcane harvest area on the map in different
administrative regions and compared them with agricultural statistical data at the municipality, microregion, and mesoregion
levels. The coefficient of determination (R2) and RMAE (relative mean absolute error) between the statistical harvest area and 200
the estimated harvest area were adopted to assess the map accuracy. The MAE (mean absolute error) can be expressed as:
𝑀𝐴𝐸 =1
𝑛∑ |𝑆𝑖 − �̂�𝑖|𝑛𝑖=1 (2)
where 𝑆𝑖 and �̂�𝑖 are the statistical area and identified area for the 𝑖 th administrative region, respectively. 𝑛 is the number of
the administrative regions with valid statistical data. RMAE is the value of MAE relative to the mean value of the statistical
area for all the 𝑛 administrative regions: 205
𝑅𝑀𝐴𝐸 =𝑀𝐴𝐸
∑ 𝑆𝑖/𝑛𝑛𝑖=1
(3)
3 Results
Annual cultivation maps of sugarcane in the 14 states of Brazil from 2016 to 2019 were produced using the TWDTW method
(taking 2018 as an example in Fig. 6). The validation demonstrated good performance of the proposed method in identifying
sugarcane harvest area in 2018. Based on the 2909 samples derived from Google Earth in 2018, the user’s, producer’s, and 210
https://doi.org/10.5194/essd-2021-88
Ope
n A
cces
s Earth System
Science
DataD
iscussio
ns
Preprint. Discussion started: 23 June 2021c© Author(s) 2021. CC BY 4.0 License.
8
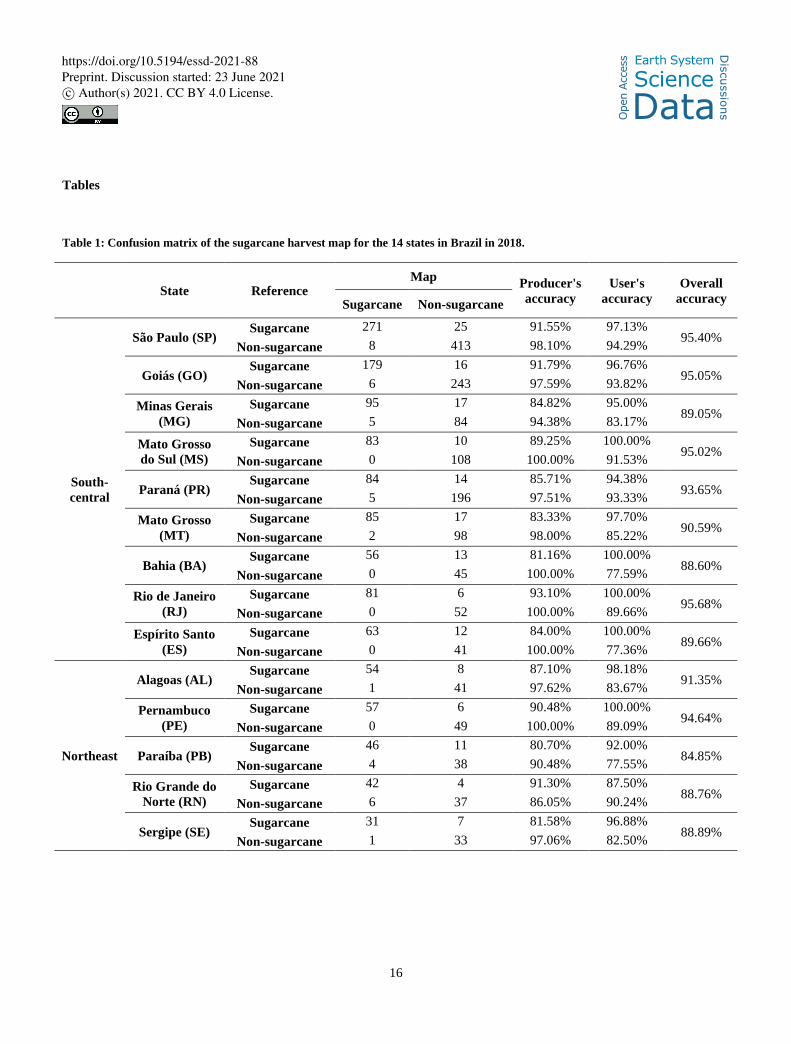
overall accuracies were 97.00%, 88.08%, and 92.99% in Brazil, respectively. The performance of the method varied by state
and region. For all the 14 studied states, the overall accuracy (OA) varied from 84.85% to 95.69%, with the user’s accuracy
(UA) ranging from 87.5% to 100% and producer’s accuracy (PA) ranging from 80.70% to 93.10% for sugarcane; and the
user’s accuracy (UA) ranging from 80.70% to 93.10% and producer’s accuracy (PA) ranging from 87.5% to 100% for non-
sugarcane (Table 1). São Paulo, the state with the largest planted area of sugarcane (accounting for over 50% of the sugarcane 215
in Brazil), displayed high user’s, producer’s, and overall accuracies of 97.13%, 91.55%, and 95.4%, respectively. Goiás, the
state with the second-largest planted area of sugarcane (accounting for approximately 10% of the sugarcane in Brazil), had
high user’s, producer’s, and overall accuracies of 96.76%, 91.79%, and 95.05%, respectively. All the investigated states
exhibited overall accuracy (OA) over 84% (Table 1).
<<Figure 6>> 220
<<Table 1>>
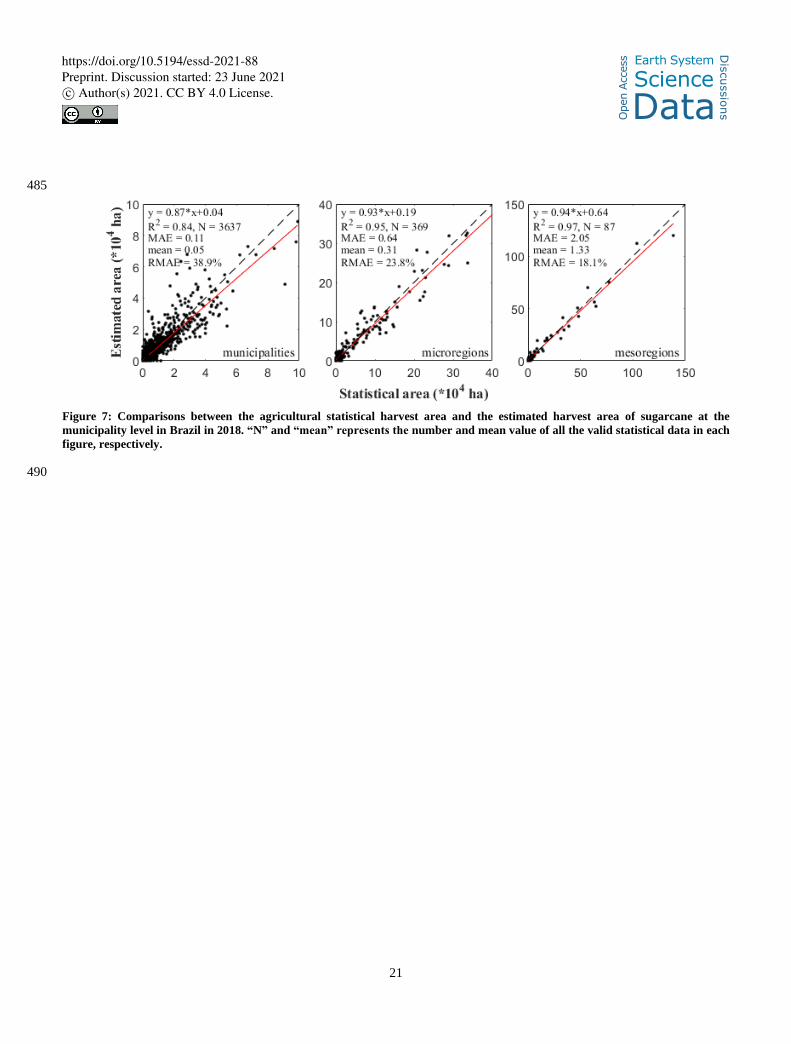
Additionally, the proposed method can accurately estimate the sugarcane harvest area compared with the agricultural statistical
data at different administrative levels. The estimated harvest area of sugarcane in 2018 exhibited good correlations with the
agricultural statistical area data derived from PAM at the municipality, microregion, and mesoregion levels. The coefficients
of determination (R2) were 0.84 (N=3637), 0.95 (N=369), and 0.97 (N=87) at the municipality, microregion, and mesoregion 225
levels, respectively, and the respective RMAEs were 38.9% (MAE=0.11×10⁴ ha), 23.8% (MAE=0.64×10⁴ ha), and 18.1%
(MAE=2.05×10⁴ ha) (Fig. 7). The performance was better when the validated regions were aggregated to larger areas, namely
the accuracy from low to high were at the municipality, microregion, and mesoregion levels.
<<Figure 7>>
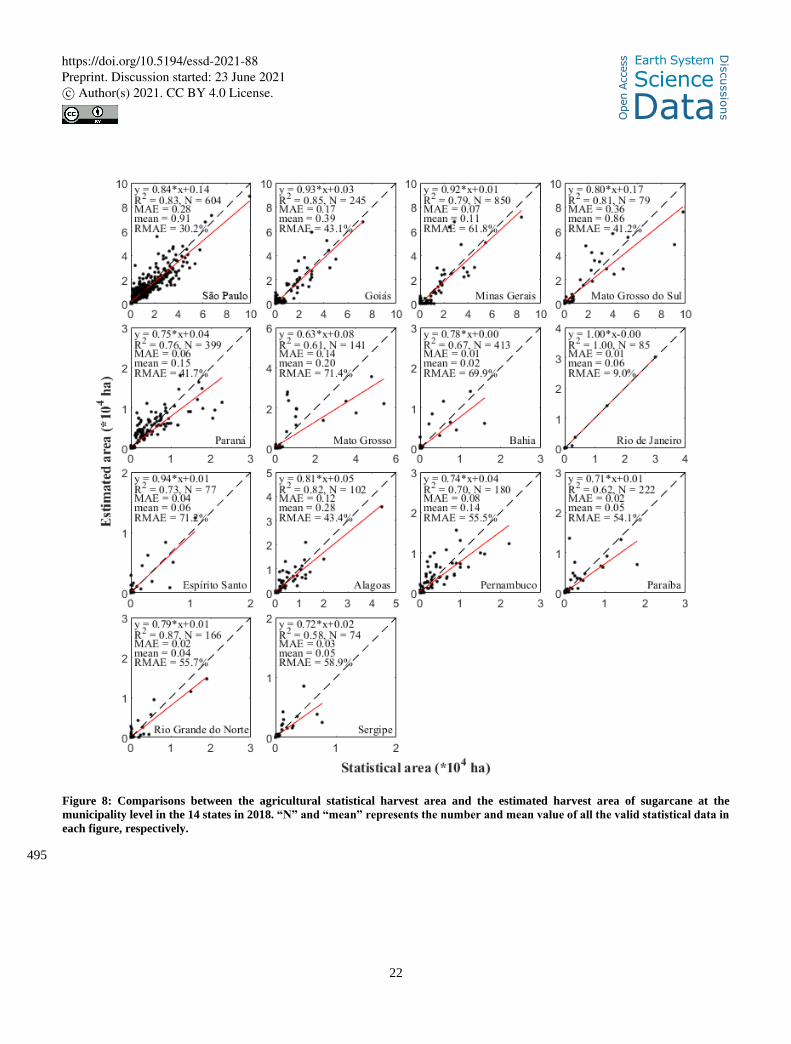
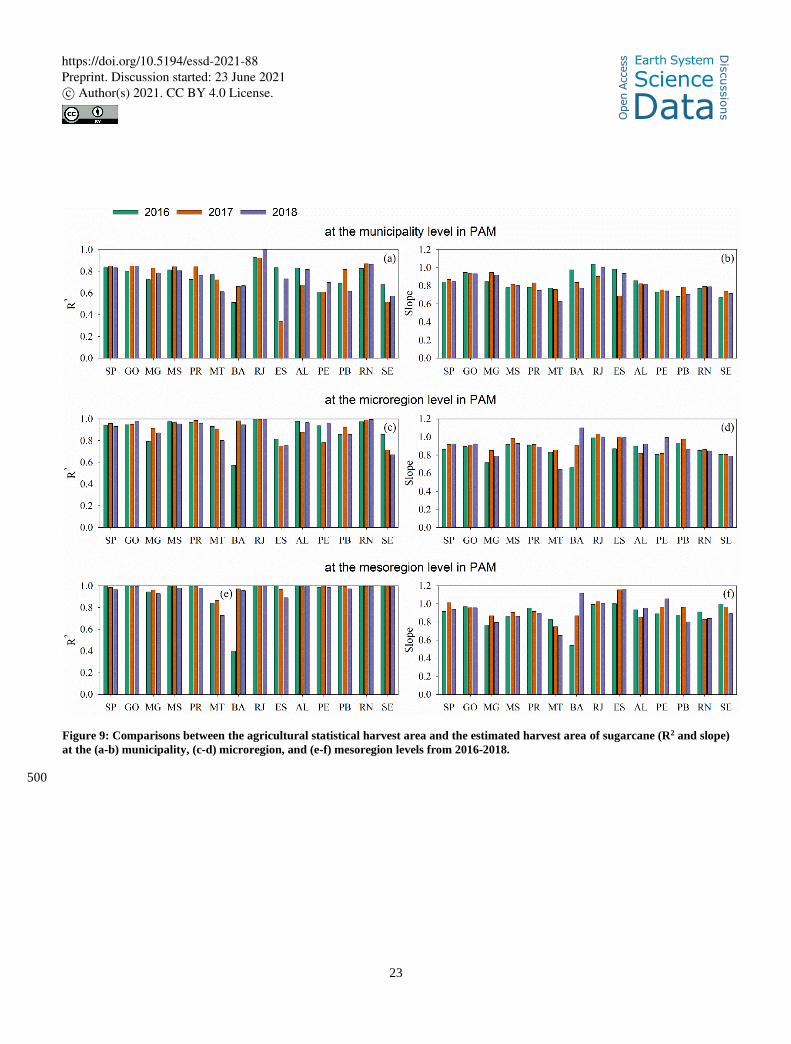
The correlations between the agricultural statistical and the estimated harvest areas varied by state and region. At the 230
municipality level, the coefficient of determination (R2) between the agricultural statistical and the estimated harvest areas
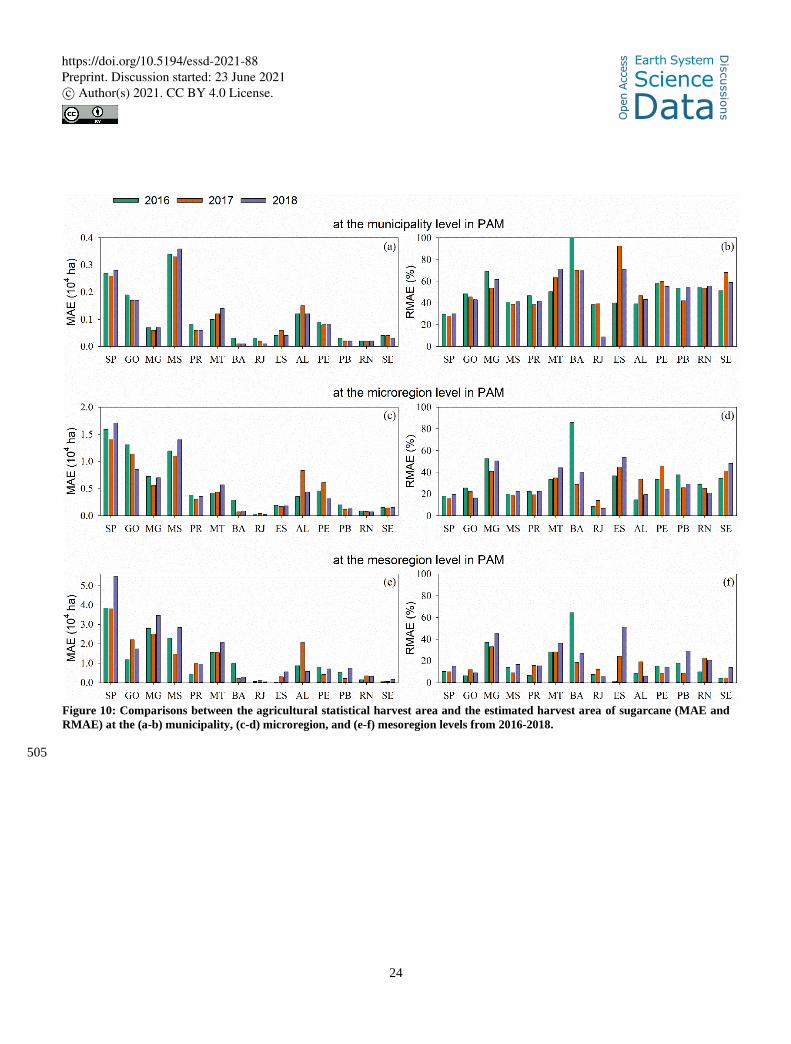
ranged from 0.61 to 1 in south-central Brazil and from 0.58 to 0.87 in northeast Brazil (Figs. 8-9); the RMAE ranged from
9.0% to 71.4% in south-central Brazil and from 43.4% to 58.9% in northeast Brazil (Fig. 8; Fig. 10). At the microregion level,
the R2 between the agricultural statistical and the estimated harvest areas ranged from 0.75 to 1 in south-central Brazil and
from 0.67 to 0.99 in northeast Brazil (Fig. 9); the RMAE ranged from 6.9% to 53.8% in south-central Brazil and from 19.5% 235
to 48.2% in northeast Brazil (Fig. 10). At the microregion level, the R2 between the agricultural statistical and the estimated
harvest areas ranged from 0.73 to 1 in south-central Brazil and from 0.99 to 1 in northeast Brazil (Fig. 9); the RMAE ranged
from 5.4% to 51.3% in south-central Brazil and from 6.1% to 29.0% in northeast Brazil (Fig. 10). Validation at all three levels
showed high performance, with high R2 and slope close to 1. In general, Mato Grosso and Bahia in the northern part of south-
central Brazil and Sergipe in the southern part of northeastern Brazil displayed lower R2 and higher RMAE values (Figs. 8-240
10). The performance for São Paulo and Goiás were higher than those for most other states, except Rio de Janeiro (Figs. 8-10).
Finally, we assessed the capability of the method and standard seasonal changes in NDVI (i.e., standard NDVI curves) acquired
from a single year (2018) to apply them to other years (2016 and 2017). Results indicated the R2 and RMAE values for the
period of 2016–2018 changed little in most states (Figs. 9-10).
https://doi.org/10.5194/essd-2021-88
Ope
n A
cces
s Earth System
Science
DataD
iscussio
ns
Preprint. Discussion started: 23 June 2021c© Author(s) 2021. CC BY 4.0 License.
9
<<Figures 8-10>> 245
4 Discussion
As the largest global producer of sugarcane, Brazil contributed to approximately 38.6% of the world’s sugarcane production
in 2019 and played an important role in retaining the global demand for sugarcane (FAO, 2020). While the cultivation area of
sugarcane in Brazil has increased by approximately 11% over the past 10 years according to census data (FAO, 2020), which
indicated substantial land cover changes and important feedback to regional climate systems (Loarie et al., 2011; Mello et al., 250
2014; Jaiswal et al., 2017). The first harvest area map of sugarcane in Brazil at a 30-m spatial resolution was generated only
for São Paulo state based on an automatic image classification method (Rudorff et al., 2005). Subsequently, the cultivation
map of sugarcane was updated using visual/manual image interpretation through 2013, and the coverage of the map extended
from São Paulo state to a total of 8 states in the south-central region of Brazil, accounting for 88% of the sugarcane cultivation
area in Brazil, as reported by the Canasat Project (Rudorff et al., 2010). Souza et al. (2020) reconstructed annual land use and 255
land cover information at a 30-m spatial resolution from 1985-2017 for Brazil based on random forest method and Landsat
data trained by plenty of samples selected from existing land cover maps, which provides the cultivation map of sugarcane
belonging to a subclass of agriculture (the producer’s and user’s accuracies for agriculture were 83.3% and of 81.3%,
respectively). However, these prevailing methods strongly require large volume of training samples, which makes it difficult
to update annually at large scales. 260
In this study, we proposed a phenology-based sugarcane classification method by incorporating multiple phenological
conditions of sugarcane into the TWDTW method. Then, we identified the harvest area of sugarcane with a spatial resolution
of 30-m in Brazil from 2016 to 2019 using 16-day composite NDVI series derived from Landsat and Sentinel-2 data. Our
proposed method can automatically identify the sugarcane areas with limited training data and needs only one standard NDVI
curve (Fig. 4) for all the 14 sugarcane planted states in Brazil. Validations against field sample data and agricultural statistical 265
area data showed that the generated sugarcane harvest maps were in high accuracy. For example, validations for 2018 displayed
the user’s, producer’s, and overall accuracies of 97.00%, 88.08%, and 92.99% in Brazil, respectively.
Although our method can effectively and accurately identify the sugarcane harvest area from the regional to national or
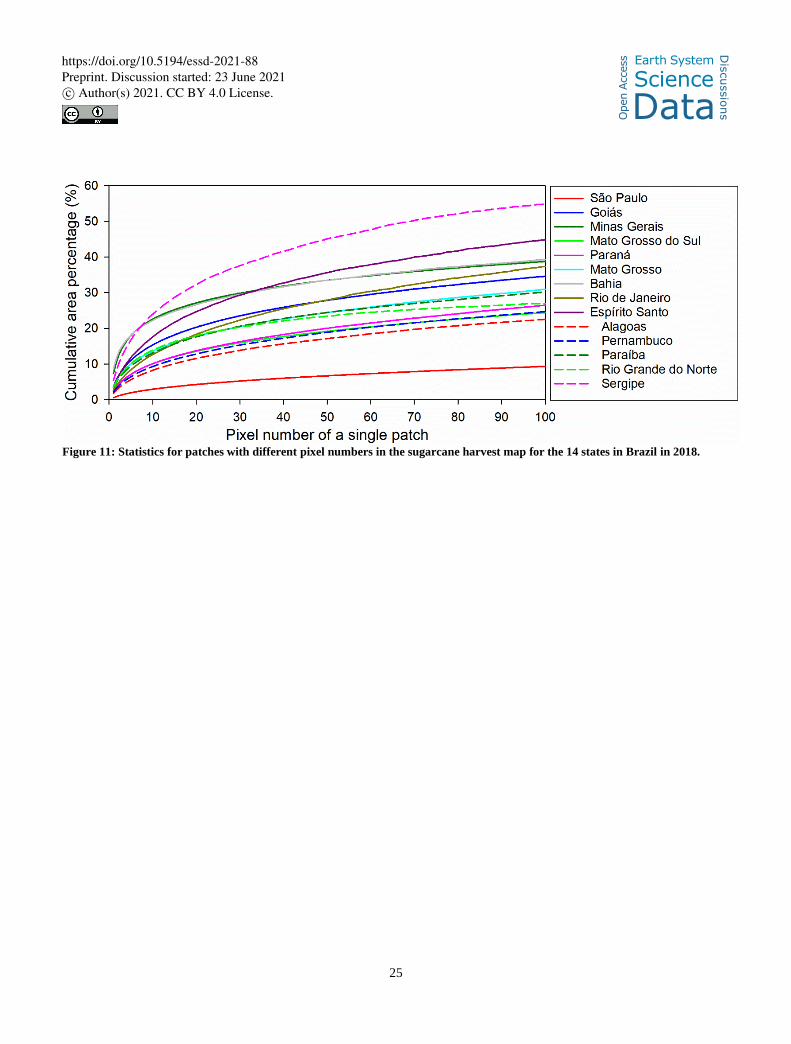
continental scales, there are still several potential uncertainties in the identification process. First, because of the quality of the
processed NDVI series, the speckle “salt-and-pepper” effects/noises exist in some areas of the harvest map. According to the 270
map statistics in 2018, sugarcane patches with only one pixel account for 0.55% (São Paulo) to 8.6% (Bahia) of the sugarcane
area (Fig. 11). In the future, the object-based identification by segmenting images into homogeneous objects, instead of the
pixel-based method used in our study, may alleviate the “salt-and-pepper” effects and improve the identification performance
(Belgiu et al., 2018).
<<Figure 11>> 275
https://doi.org/10.5194/essd-2021-88
Ope
n A
cces
s Earth System
Science
DataD
iscussio
ns
Preprint. Discussion started: 23 June 2021c© Author(s) 2021. CC BY 4.0 License.
10
Second, the identification accuracy for Bahia state was lower than that for other states. Because of the different harvest seasons
in south-central and northeast Brazil, we identified sugarcane in the south-central and northeast areas using different
phenological characteristics and standard curve combinations (Fig. 5). Bahia is a transition state between south-central and
northeast Brazil. Namely, sugarcane in southern Bahia has a harvest season similar to that in south-central Brazil, and
sugarcane in northern Bahia has a harvest season similar to that in northeast Brazil. In our study, we treated Bahia as a state in 280
south-central Brazil with a harvest season from April to December (Fig. 5), which may introduce errors to the identification in
the northern part of Bahia.
Third, Mato Grosso state exhibited a lower R2 and higher RMAE than other states when comparing the identified sugarcane
harvest area with the agricultural statistical sugarcane harvest area. Two major biomes are located in Mato Grosso, including
the humid tropical forests of the Amazon in the north and the heterogeneous Cerrado area (a tropical savanna) in the south-285
central part of the state (Kastens et al. 2017). In Mato Grosso, sugarcane may be misclassified with some kinds of grassland,
grazing areas, or seasonal forest, which exhibit phenological changes similar to those of sugarcane (Mueller et al. 2015; Bendini
et al. 2019). The NDVI values of these vegetation types decrease between August and October (from the end of the drought
season to the beginning of the rainy season) and increased thereafter (Ferreira et al. 2004), which is quite similar to that in the
harvesting stage of sugarcane, resulting in misclassification with the sugarcane harvested from August to October. In our study, 290
we used the “difference” between the maximum NDVI value in the growing season and the minimum NDVI value in the non-
growing season (see method in Section 2.3.2) to alleviate the misclassification at some extent because the “difference” for the
abovementioned vegetation types is generally lower than that for sugarcane (Ferreira et al. 2004). In the future, incorporating
more complex spectral-temporal variability metrics, such as the combination of more spectral information instead of NDVI
and a longer time window for several harvest seasons instead of one harvest season may help improve model performance 295
(Mueller et al. 2015).
5 Data availability
The 30-m Brazil sugarcane harvest area dataset from 2016-2019 is available at https://doi.org/10.6084/m9.figshare.14213909
(Zheng et al., 2021). The dataset is provided in .tif format with pixel values of 1 for sugarcane and 0 for non-sugarcane.
6 Conclusion 300
Brazil is the world’s largest sugarcane producer and contributes to approximately 38.6% of total global sugarcane production.
Based on the available Landsat and Sentinel images, we produced sugarcane harvest maps with a 30-m spatial resolution
(2016-2019) by incorporating multiple phenological conditions of sugarcane in Brazil into the TWDTW method. The proposed
method can automatically identify sugarcane harvest area with limited training sample data. Based on 2909 samples derived
from Google Earth, the validation experiment reflected high accuracy across the 14 sugarcane planted states in Brazil, with 305
https://doi.org/10.5194/essd-2021-88
Ope
n A
cces
s Earth System
Science
DataD
iscussio
ns
Preprint. Discussion started: 23 June 2021c© Author(s) 2021. CC BY 4.0 License.
11
the user’s, producer’s, and overall accuracies of 97.00%, 88.08%, and 92.99% in Brazil, respectively. Additionally, the
identified harvest area of sugarcane exhibited a good correlation with the agricultural statistical area data derived from PAM
at the municipality, microregion, and mesoregion levels. The maps can be used to monitor the harvest area and yield of
sugarcane, and evaluate the feedback to regional climate.
Author contributions. Wenping Yuan and Yi Zheng designed the research, performed the analysis, and wrote the paper; Ana 310
Cláudia dos Santos Luciano and Jie Dong edited and revised the manuscript.
Competing interests. The authors declare that they have no conflict of interest.
Acknowledgements
This study was supported by the National Science Fund for Distinguished Young Scholars (41925001), National Natural
Science Foundation of China (41971018 and 31930072), and Fundamental Research Funds for the Central Universities 315
(19lgjc02).
References
Abdel-Rahman, E. M. and Ahmed, F. B.: The application of remote sensing techniques to sugarcane (Saccharum spp. hybrid)
production: a review of the literature, Int. J. Remote Sens., 29, 3753-3767, https://doi.org/10.1080/01431160701874603, 2008.
Adami, M., Theodor Rudorff, B. F., Freitas, R. M., Aguiar, D. A., Sugawara, L. M., and Mello, M. P.: Remote Sensing Time 320
Series to Evaluate Direct Land Use Change of Recent Expanded Sugarcane Crop in Brazil, Sustainability, 4, 574-585,
https://doi.org/10.3390/su4040574, 2012.
Belgiu, M. and Csillik, O.: Sentinel-2 cropland mapping using pixel-based and object-based time-weighted dynamic time
warping analysis, Remote Sens. Environ., 204, 509-523, https://doi.org/10.1016/j.rse.2017.10.005, 2018.
Bendini, H. d. N., Fonseca, L. M. G., Schwieder, M., Korting, T. S., Rufin, P., Sanches, I. D. A., Leitao, P. J., and Hostert, P.: 325
Detailed agricultural land classification in the Brazilian cerrado based on phenological information from dense satellite image
time series, Int. J. Appl. Earth Observ. Geoinfo., 82, https://doi.org/10.1016/j.jag.2019.05.005, 2019.
Bordonal, R. d. O., Lal, R., Aguiar, D. A., de Figueiredo, E. B., Perillo, L. I., Adami, M., Theodor Rudorff, B. F., and La Scala,
N.: Greenhouse gas balance from cultivation and direct land use change of recently established sugarcane (Saccharum
officinarum) plantation in south-central Brazil, Renew. Sust. Energ. Rev., 52, 547-556, 330
https://doi.org/10.1016/j.rser.2015.07.137, 2015.
https://doi.org/10.5194/essd-2021-88
Ope
n A
cces
s Earth System
Science
DataD
iscussio
ns
Preprint. Discussion started: 23 June 2021c© Author(s) 2021. CC BY 4.0 License.
12
Boryan, C., Yang, Z., Mueller, R. and Craig, M.: Monitoring US agriculture: the US Department of Agriculture, National
Agricultural Statistics Service, Cropland Data Layer Program, Geocarto Int., 26(5), 341–358,
doi:10.1080/10106049.2011.562309, 2011.
Brar N S, Dhillon B S, Saini K S, et al. Agronomy of sugarbeet cultivation-A review. Agricultural Reviews, 36(3): 184-197, 335
2015.
Cai, Y., Guan, K., Peng, J., Wang, S., Seifert, C., Wardlow, B. and Li, Z.: A high-performance and in-season classification
system of field-level crop types using time-series Landsat data and a machine learning approach, Remote Sens. Environ., 210,
35–47, doi:10.1016/j.rse.2018.02.045, 2018.
Cechim Junior, C., Johann, J. A., and Antunes, J. F. G.: Mapping of sugarcane crop area in the Paraná State using 340
Landsat/TM/OLI and IRS/LISS-3 images, Revista Brasileira de Engenharia Agrícola e Ambiental, 21, 427-432,
https://doi.org/10.1590/1807-1929/agriambi.v21n6p427-432, 2017.
Dong, J., Fu, Y., Wang, J., Tian, H., Fu, S., Niu, Z., Han, W., Zheng, Y., Huang, J., and Yuan, W.: Early-season mapping of
winter wheat in China based on Landsat and Sentinel images, Earth Syst. Sci. Data, 12, 3081-3095,
https://doi.org/10.5194/essd-12-3081-2020, 2020a. 345
Dong, J., Liu, W., Han, W., Xiang, K., Lei, T., and Yuan, W.: A phenology-based method for identifying the planting fraction
of winter wheat using moderate-resolution satellite data, Int. J. Remote Sens., 41, 6892-6913,
https://doi.org/10.1080/01431161.2020.1755738, 2020b.
dos Santos Luciano, A. C., Araujo Picoli, M. C., Rocha, J. V., Junqueira Franco, H. C., Sanches, G. M., Lima Verde Leal, M.
R., and le Maire, G.: Generalized space-time classifiers for monitoring sugarcane areas in Brazil, Remote Sens. Environ., 215, 350
438-451, https://doi.org/10.1016/j.rse.2018.06.017, 2018.
dos Santos Luciano, A. C., Araujo Picoli, M. C., Rocha, J. V., Duft, D. G., Camargo Lamparelli, R. A., Lima Verde Leal, M.
R., and Le Maire, G.: A generalized space-time OBIA classification scheme to map sugarcane areas at regional scale, using
Landsat images time-series and the random forest algorithm, Int. J. Appl. Earth Observ. Geoinfo., 80, 127-136,
https://doi.org/10.1016/j.jag.2019.04.013, 2019. 355
Defante, L. R., Vilpoux, O. F., and Sauer, L.: Rapid expansion of sugarcane crop for biofuels and influence on food production
in the first producing region of Brazil, Food Policy, 79, 121-131, https://doi.org/10.1016/j.foodpol.2018.06.005, 2018.
FAOSTAT: Food and Agriculture Organization of the United Nations (FAO): FAO Statistical Databases., 2020.
Ferreira, L. G. and Huete, A. R.: Assessing the seasonal dynamics of the Brazilian Cerrado vegetation through the use of
spectral vegetation indices, Int. J. Remote Sens., 25, 1837-1860, https://doi.org/10.1080/0143116031000101530, 2004. 360
Ferreira, M. P., Alves, D. S., and Shimabukuro, Y. E.: Forest dynamics and land-use transitions in the Brazilian Atlantic Forest:
the case of sugarcane expansion, Reg. Environ. Change, 15, 365-377, https://doi.org/10.1007/s10113-014-0652-6, 2015.
Iqbal M A, Saleem A M. Sugar beet potential to beat sugarcane as a sugar crop in Pakistan[J]. Am. Eurasian. J. Agric. Environ.
Sci., 15(1): 36-44, 2015.
https://doi.org/10.5194/essd-2021-88
Ope
n A
cces
s Earth System
Science
DataD
iscussio
ns
Preprint. Discussion started: 23 June 2021c© Author(s) 2021. CC BY 4.0 License.
13
Jaiswal, D., De Souza, A. P., Larsen, S., LeBauer, D. S., Miguez, F. E., Sparovek, G., Bollero, G., Buckeridge, M. S., and 365
Long, S. P.: Brazilian sugarcane ethanol as an expandable green alternative to crude oil use, Nat. Clim. Change, 7, 788-+,
https://doi.org/10.1038/nclimate3410, 2017.
Jiang, H., Li, D., Jing, W., Xu, J., Huang, J., Yang, J., and Chen, S.: Early Season Mapping of Sugarcane by Applying Machine
Learning Algorithms to Sentinel-1A/2 Time Series Data: A Case Study in Zhanjiang City, China, Remote Sens., 11,
https://doi.org/10.3390/rs11070861, 2019. 370
Johnson, B. A., Scheyvens, H., and Shivakoti, B. R.: An ensemble pansharpening approach for finer-scale mapping of
sugarcane with Landsat 8 imagery, Int. J. Appl. Earth Observ. Geoinfo., 33, 218-225, https://doi.org/10.1016/j.jag.2014.06.003,
2014.
Kastens, J. H., Brown, J. C., Coutinho, A. C., Bishop, C. R., and Esquerdo, J. C. D. M.: Soy moratorium impacts on soybean
and deforestation dynamics in Mato Grosso, Brazil, PloS One, 12, https://doi.org/10.1371/journal.pone.0176168, 2017. 375
Leal, M. R. L. V., Galdos, M. V., Scarpare, F. V., Seabra, J. E. A., Walter, A., and Oliveira, C. O. F.: Sugarcane straw
availability, quality, recovery and energy use: A literature review, Biomass Bioenergy, 53, 11-19,
https://doi.org/10.1016/j.biombioe.2013.03.007, 2013.
Li, H., Chen, J., Liang, S., and Li, Q.: Sugarcane Mapping in Tillering Period by Quad-Polarization TerraSAR-X Data, IEEE
Geosci. Remote Sens. Lett., 12, 993-997, https://doi.org/10.1109/lgrs.2014.2372037, 2015. 380
Lin, H., Chen, J., Pei, Z., Zhang, S., and Hu, X.: Monitoring Sugarcane Growth Using ENVISAT ASAR Data, IEEE Trans.
Geosci. Remote Sens., 47, 2572-2580, https://doi.org/10.1109/tgrs.2009.2015769, 2009.
Loarie, S. R., Lobell, D. B., Asner, G. P., Mu, Q., and Field, C. B.: Direct impacts on local climate of sugar-cane expansion in
Brazil, Nat. Clim. Change, 1, 105-109, https://doi.org/10.1038/nclimate1067, 2011.
Manabe, V. D., Melo, M. R. S., and Rocha, J. V.: Framework for Mapping Integrated Crop-Livestock Systems in Mato Grosso, 385
Brazil, Remote Sens., 10, https://doi.org/10.3390/rs10091322, 2018.
Massey, R., Sankey, T. T., Congalton, R. G., Yadav, K., Thenkabail, P. S., Ozdogan, M., and Meador, A. J. S.: MODIS
phenology-derived, multi-year distribution of conterminous US crop types, Remote Sens. Environ., 198, 490-503,
https://doi.org/10.1016/j.rse.2017.06.033, 2017.
Maus, V., Camara, G., Cartaxo, R., Sanchez, A., Ramos, F. M., and de Queiroz, G. R.: A Time-Weighted Dynamic Time 390
Warping Method for Land-Use and Land-Cover Mapping, IEEE J. Sel. Top. Appl., 9, 3729-3739,
https://doi.org/10.1109/jstars.2016.2517118, 2016.
Mello, F. F. C., Cerri, C. E. P., Davies, C. A., Holbrook, N. M., Paustian, K., Maia, S. M. F., Galdos, M. V., Bernoux, M., and
Cerri, C. C.: Payback time for soil carbon and sugar-cane ethanol, Nat. Clim. Change, 4, 605-609,
https://doi.org/10.1038/nclimate2239, 2014. 395
Monteiro, L. A., Sentelhas, P. C., and Pedra, G. U.: Assessment of NASA/POWER satellite-based weather system for Brazilian
conditions and its impact on sugarcane yield simulation, Int. J. Clim., 38, 1571-1581, https://doi.org/10.1002/joc.5282, 2018.
https://doi.org/10.5194/essd-2021-88
Ope
n A
cces
s Earth System
Science
DataD
iscussio
ns
Preprint. Discussion started: 23 June 2021c© Author(s) 2021. CC BY 4.0 License.
14
Mueller, H., Rufin, P., Griffiths, P., Barros Siqueira, A. J., and Hostert, P.: Mining dense Landsat time series for separating
cropland and pasture in a heterogeneous Brazilian savanna landscape, Remote Sens. Environ., 156, 490-499,
https://doi.org/10.1016/j.rse.2014.10.014, 2015. 400
Mulyono, S., Nadirah, and Iop: Identifying Sugarcane Plantation using LANDSAT-8 Images with Support Vector Machines.
In: 2nd International Conference of Indonesian Society for Remote Sensing, IOP Conference Series-Earth and Environmental
Science, 2017.
Petitjean, F., Inglada, J., and Gancarski, P.: Satellite Image Time Series Analysis Under Time Warping, IEEE Trans. Geosci.
Remote Sens., 50, 3081-3095, https://doi.org/10.1109/tgrs.2011.2179050, 2012. 405
Petitjean, F., Weber, J.: Efficient satellite image time series analysis under time warping. IEEE Geosci. Remote Sens. Lett.,
11, 1143–1147, 2014.
Sakoe, H. and Chiba, S.: Dynamic programming algorithm optimization for spoken word recognition, IEEE T. Acoust. Speech,
26, 43–49, https://doi.org/10.1109/TASSP.1978.1163055, 1978.
Sindhu, R., Gnansounou, E., Binod, P., and Pandey, A.: Bioconversion of sugarcane crop residue for value added products - 410
An overview, Renew. Energy, 98, 203-215, https://doi.org/10.1016/j.renene.2016.02.057, 2016.
Souza Jr, C. M., Shimbo, J. Z., Rosa, M. R., Parente, L. L., Alencar, A. A., Rudorff, B. F. T., Hasenack, H., Matsumoto, M.,
Ferreira, L. G., Souza-Filho, P. W. M., de Oliveira, S. W., Rocha, W. F., Fonseca, A. V., Marques, C. B., Diniz, C. G., Costa,
D., Monteiro, D., Rosa, E. R., Velez-Martin, E., Weber, E. J., Lenti, F. E. B., Paternost, F. F., Pareyn, F. G. C., Siqueira, J. V.,
Viera, J. L., Ferreira Neto, L. C., Saraiva, M. M., Sales, M. H., Salgado, M. P. G., Vasconcelos, R., Galano, S., Mesquita, V. 415
V., and Azevedo, T.: Reconstructing Three Decades of Land Use and Land Cover Changes in Brazilian Biomes with Landsat
Archive and Earth Engine, Remote Sens., 12, https://doi.org/10.3390/rs12172735, 2020.
Theodor Rudorff, B. F., Berka, L.M.S., Moreira, M.A., Duarte, V., Xavier, A.C., Rosa, V.G.C., Shimabukuro, Y.E.: Imagens
de satélite no mapeamento e estimativa de área de cana-de-açúcar em São Paulo: ano-safra 2003/04. Agricultura em São Paulo,
52, 21-39, 2005 420
Theodor Rudorff, B. F., de Aguiar, D. A., da Silva, W. F., Sugawara, L. M., Adami, M., and Moreira, M. A.: Studies on the
Rapid Expansion of Sugarcane for Ethanol Production in Sao Paulo State (Brazil) Using Landsat Data, Remote Sens., 2, 1057-
1076, https://doi.org/10.3390/rs2041057, 2010.
Wachholz de Souza, C. H., Cervi, W. R., Brown, J. C., Rocha, J. V., and Camargo Lamparelli, R. A.: Mapping and evaluating
sugarcane expansion in Brazil's savanna using MODIS and intensity analysis: a case-study from the state of Tocantins, J. Land 425
Use Sci., 12, 457-476, https://doi.org/10.1080/1747423x.2017.1404647, 2017.
Wang, S., Azzari, G. and Lobell, D. B.: Crop type mapping without field-level labels: Random forest transfer and unsupervised
clustering techniques, Remote Sens. Environ., 222, 303–317, doi:10.1016/j.rse.2018.12.026, 2019.
Wang, J., Xiao, X., Liu, L., Wu, X., Qin, Y., Steiner, J. L., and Dong, J.: Mapping sugarcane plantation dynamics in Guangxi,
China, by time series Sentinel-1, Sentinel-2 and Landsat images, Remote Sens. Environ., 247, 430
https://doi.org/10.1016/j.rse.2020.111951, 2020.
https://doi.org/10.5194/essd-2021-88
Ope
n A
cces
s Earth System
Science
DataD
iscussio
ns
Preprint. Discussion started: 23 June 2021c© Author(s) 2021. CC BY 4.0 License.
15
Wardlow, B., Egbert, S. and Kastens, J.: Analysis of time-series MODIS 250 m vegetation index data for crop classification
in the U.S. Central Great Plains, Remote Sens. Environ., 108(3), 290–310, doi:10.1016/j.rse.2006.11.021, 2007.
Zhang, H., Anderson, R. G., and Wang, D.: Satellite-based crop coefficient and regional water use estimates for Hawaiian
sugarcane, Field Crop. Res., 180, 143-154, https://doi.org/10.1016/j.fcr.2015.05.023, 2015. 435
Zheng, B., Myint, S. W., Thenkabail, P. S. and Aggarwal, R. M.: A support vector machine to identify irrigated crop types
using time-series Landsat NDVI data, Int. J. Appl. Earth Observ. Geoinfo., 34, 103–112, doi:10.1016/j.jag.2014.07.002, 2015.
Zheng, Y., dos Santos Luciano, A. C., Dong, J., Yuan, W.: 30-m sugarcane harvest maps in Brazil, figshare, Dataset,
https://doi.org/10.6084/m9.figshare.14213909, 2021.
Zhong, L., Gong, P., Biging, G.S.: Efficient corn and soybean mapping with temporal extendability: A multi-year experiment 440
using Landsat imagery, Remote Sens. Environ., 140, 1–13, doi.org/10.1016/j.rse.2013.08.023, 2014.
Zhou, Z., Huang, J., Wang, J., Zhang, K., Kuang, Z., Zhong, S., and Song, X.: Object-Oriented Classification of Sugarcane
Using Time-Series Middle-Resolution Remote Sensing Data Based on AdaBoost, PloS One, 10,
https://doi.org/10.1371/journal.pone.0142069, 2015.
445
https://doi.org/10.5194/essd-2021-88
Ope
n A
cces
s Earth System
Science
DataD
iscussio
ns
Preprint. Discussion started: 23 June 2021c© Author(s) 2021. CC BY 4.0 License.
16
Tables
Table 1: Confusion matrix of the sugarcane harvest map for the 14 states in Brazil in 2018.
State Reference Map
Producer's
accuracy
User's
accuracy
Overall
accuracy Sugarcane Non-sugarcane
South-
central
São Paulo (SP) Sugarcane 271 25 91.55% 97.13%
95.40% Non-sugarcane 8 413 98.10% 94.29%
Goiás (GO) Sugarcane 179 16 91.79% 96.76%
95.05% Non-sugarcane 6 243 97.59% 93.82%
Minas Gerais
(MG)
Sugarcane 95 17 84.82% 95.00% 89.05%
Non-sugarcane 5 84 94.38% 83.17%
Mato Grosso
do Sul (MS)
Sugarcane 83 10 89.25% 100.00% 95.02%
Non-sugarcane 0 108 100.00% 91.53%
Paraná (PR) Sugarcane 84 14 85.71% 94.38%
93.65% Non-sugarcane 5 196 97.51% 93.33%
Mato Grosso
(MT)
Sugarcane 85 17 83.33% 97.70% 90.59%
Non-sugarcane 2 98 98.00% 85.22%
Bahia (BA) Sugarcane 56 13 81.16% 100.00%
88.60% Non-sugarcane 0 45 100.00% 77.59%
Rio de Janeiro
(RJ)
Sugarcane 81 6 93.10% 100.00% 95.68%
Non-sugarcane 0 52 100.00% 89.66%
Espírito Santo
(ES)
Sugarcane 63 12 84.00% 100.00% 89.66%
Non-sugarcane 0 41 100.00% 77.36%
Northeast
Alagoas (AL) Sugarcane 54 8 87.10% 98.18%
91.35% Non-sugarcane 1 41 97.62% 83.67%
Pernambuco
(PE)
Sugarcane 57 6 90.48% 100.00% 94.64%
Non-sugarcane 0 49 100.00% 89.09%
Paraíba (PB) Sugarcane 46 11 80.70% 92.00%
84.85% Non-sugarcane 4 38 90.48% 77.55%
Rio Grande do
Norte (RN)
Sugarcane 42 4 91.30% 87.50% 88.76%
Non-sugarcane 6 37 86.05% 90.24%
Sergipe (SE) Sugarcane 31 7 81.58% 96.88%
88.89% Non-sugarcane 1 33 97.06% 82.50%
https://doi.org/10.5194/essd-2021-88
Ope
n A
cces
s Earth System
Science
DataD
iscussio
ns
Preprint. Discussion started: 23 June 2021c© Author(s) 2021. CC BY 4.0 License.
17
Figures 450
Figure 1: Study areas in Brazil for sugarcane harvest area identification, including 9 states in south-central Brazil (São Paulo, Goiás,
Minas Gerais, Mato Grosso do Sul, Paraná, Mato Grosso, Bahia, Rio de Janeiro, and Espírito Santo) and 5 states in northeast Brazil
(Alagoas, Pernambuco, Paraíba, Rio Grande do Norte, and Sergipe), which account for over 98% of the sugarcane harvest area in 455 Brazil. The dots represent the samples used for validation. The administrative boundary data were derived from the Brazilian
Institute of Geography and Statistics (Instituto Brasileiro de Geografia e Estatística – IBGE; www.ibge.gov.br).
https://doi.org/10.5194/essd-2021-88
Ope
n A
cces
s Earth System
Science
DataD
iscussio
ns
Preprint. Discussion started: 23 June 2021c© Author(s) 2021. CC BY 4.0 License.
18
460
Figure 2: Times of good observations for the 16-day composite satellite data over a year. (left) Times of good observations in 2018;
(right) Area percentages of the times of good observations for each state from 2016-2019.
https://doi.org/10.5194/essd-2021-88
Ope
n A
cces
s Earth System
Science
DataD
iscussio
ns
Preprint. Discussion started: 23 June 2021c© Author(s) 2021. CC BY 4.0 License.
19
Figure 3: The administrative boundaries for (a) municipalities, (b) microregions, and (c) mesoregions. The boundary lines at the 465 municipality and state levels were downloaded directly from the IBGE, and we aggregated the municipalities into microregions and
mesoregions according to the regions in PAM denoted by the IBGE.
470
Figure 4: Growing stages of sugarcane and the respective NDVI changes. The gray and red symbols represent the NDVI curve for
the planted sugarcane with a 12–18 month cycle, and the green and red symbols represent the NDVI curve for the ratoon sugarcane
with a 12 month cycle. The growing stages of the 12 month cycle sugarcane (germination, tillering, grand growth, and ripening) are
labeled in the figure. 475
https://doi.org/10.5194/essd-2021-88
Ope
n A
cces
s Earth System
Science
DataD
iscussio
ns
Preprint. Discussion started: 23 June 2021c© Author(s) 2021. CC BY 4.0 License.
20
Figure 5: Seasonal changes in the NDVI series for sugarcane in the south-central and northeast Brazil. The gray areas are the periods
used to calculate the maximum NDVI value in growing season (NDVImax) and the minimum NDVI value in non-growing season
(NDVImin). 480
Figure 6: Sugarcane harvest map for the 14 studied states in Brazil in 2018. The administrative boundary data were obtained from
the IBGE.
https://doi.org/10.5194/essd-2021-88
Ope
n A
cces
s Earth System
Science
DataD
iscussio
ns
Preprint. Discussion started: 23 June 2021c© Author(s) 2021. CC BY 4.0 License.
21
485
Figure 7: Comparisons between the agricultural statistical harvest area and the estimated harvest area of sugarcane at the
municipality level in Brazil in 2018. “N” and “mean” represents the number and mean value of all the valid statistical data in each
figure, respectively.
490
https://doi.org/10.5194/essd-2021-88
Ope
n A
cces
s Earth System
Science
DataD
iscussio
ns
Preprint. Discussion started: 23 June 2021c© Author(s) 2021. CC BY 4.0 License.
22
Figure 8: Comparisons between the agricultural statistical harvest area and the estimated harvest area of sugarcane at the
municipality level in the 14 states in 2018. “N” and “mean” represents the number and mean value of all the valid statistical data in
each figure, respectively.
495
https://doi.org/10.5194/essd-2021-88
Ope
n A
cces
s Earth System
Science
DataD
iscussio
ns
Preprint. Discussion started: 23 June 2021c© Author(s) 2021. CC BY 4.0 License.
23
Figure 9: Comparisons between the agricultural statistical harvest area and the estimated harvest area of sugarcane (R2 and slope)
at the (a-b) municipality, (c-d) microregion, and (e-f) mesoregion levels from 2016-2018.
500
https://doi.org/10.5194/essd-2021-88
Ope
n A
cces
s Earth System
Science
DataD
iscussio
ns
Preprint. Discussion started: 23 June 2021c© Author(s) 2021. CC BY 4.0 License.
24
Figure 10: Comparisons between the agricultural statistical harvest area and the estimated harvest area of sugarcane (MAE and
RMAE) at the (a-b) municipality, (c-d) microregion, and (e-f) mesoregion levels from 2016-2018.
505
https://doi.org/10.5194/essd-2021-88
Ope
n A
cces
s Earth System
Science
DataD
iscussio
ns
Preprint. Discussion started: 23 June 2021c© Author(s) 2021. CC BY 4.0 License.
25
Figure 11: Statistics for patches with different pixel numbers in the sugarcane harvest map for the 14 states in Brazil in 2018.
https://doi.org/10.5194/essd-2021-88
Ope
n A
cces
s Earth System
Science
DataD
iscussio
ns
Preprint. Discussion started: 23 June 2021c© Author(s) 2021. CC BY 4.0 License.