high-resolution geoelectrical tomographies in the study of giarrossa landslide (southern italy)
TRANSCRIPT

High-resolution geoelectricaltomographies in the study ofGiarrossa landslide (southern Italy)Vincenzo Lapenna Æ Pietro Lorenzo Æ Angela Perrone Æ Sabatino Piscitelli
Francesco Sdao Æ Enzo Rizzo
Abstract New geoelectrical techniques have beenapplied to the study of the Giarrossa landslide in theLucano Appennines of southern Italy. Dipole–dipoleelectrical resistivity tomographies (ERT) and self-potential (SP) surveys were carried out using inno-vative techniques for data acquisition and inversion.The ERT showed the presence of a conductive zoneat a depth of about 25–35 m associated with thelandslide body and some shallow high-resistivitynuclei associated with intercalations (calcilutitic,calcarenitic blocks, etc.) in the disturbed material.Two SP areal surveys, undertaken after the winterand summer seasons, highlighted equipotentialcontours following the landslide boundary and anelectrical field predominantly negative in the sourcezone and positive in the accumulation zone.
Resume De nouvelles techniques geo-electriquesont appliquees pour l’etude du glissement de Giar-rossa dans les Apennins de Lucanie du sud de l’It-alie. Des tomographies de resistivites electriquesmethode dipole–dipole (ERT) et des prospectionselectriques par la methode de polarisation spontanee(SP) ont ete mises en œuvre, utilisant de nouvellestechniques pour l’acquisition et l’inversion desdonnees. La methode ERT a montre la presence dezones conductrices a des profondeurs d’environ 25–35 m en rapport avec le corps du glissement et d’unnoyau peu profond, de forte resistivite, en rapport
avec des intercalations (blocs de calcilutite et decalcarenite) dans le materiau remanie. Deux pro-spections SP, realisees apres l’hiver et l’ete, ontpermis de mettre en evidence par des lignes equi-potentielles les limites du glissement ainsi qu’unchamp electrique principalement negatif dans lazone source et positif dans la zone d’accumulation.
Keywords Landslide Æ Geoelectrical tomography ÆSliding surface Æ Thickness Æ Hydrogeologicalcondition
Mots cles Glissement de terrain Æ Tomographiegeo-electrique Æ Surface de glissement Æ Epaisseur ÆConditions hydrogeologiques
Introduction
Standard surface geophysical techniques, such as seismic,geoelectrical, electromagnetic, magnetic, global positionsystem (GPS) and ground penetrating radar (GPR) meth-ods, have been used in the study of landslide areas. Theyhave made a contribution to the determination of thesurface area and thickness of the slipped mass and to thestudy of the hydrogeological conditions within it (e.g.Bogoslovsky and Ogilvy 1977; Cassinis et al. 1984; Parasnis1986; McCann and Forster 1990; Sharma 1997 and refer-ences therein).Recently, considerable attention has been devoted to theelectrical resistivity tomography (ERT) or electricalimaging (Griffiths and Barker 1993; Loke and Barker 1996;Jongmans et al. 2000) and the self-potential (SP) tech-niques (Bogoslovsky and Ogilvy 1977; Patella et al. 1995;Bruno et al. 1998), which combine low costs, fast fieldsurvey procedures and high-resolution imaging of elec-trical properties of the subsurface.Electrical resistivity surveys have progressed from theconventional vertical soundings (Schlumberger method),which provide layer depths and resistivities at a singleplace, to techniques that provide 2D and even 3D high-resolution electrical images of the subsurface (Griffithsand Barker 1993; Dahlin 1996). This development startedwith the introduction of geoelectrical tomography fieldsystems and was soon followed by post-processing and
Received: 6 February 2001 / Accepted: 11 May 2002Published online: 15 January 2003ª Springer-Verlag 2003
V. Lapenna Æ A. Perrone Æ S. Piscitelli (&) Æ E. RizzoIstituto di Metodologie Avanzate di Analisi Ambientale,CNR, C. da S. Loja, 85050 Tito (PZ), Italye-mail: [email protected].: +39-971-427239Fax: +39-971-427271
P. Lorenzo Æ F. SdaoDipartimento di Strutture, Geotecnica,Geologia Applicata all’Ingegneria,Universita della Basilicata, Loc. Macchia Romana,85100 Potenza, Italy
DOI 10.1007/s10064-002-0184-z Bull Eng Geol Env (2003) 62:259–268 259

inversion algorithms, to transform the measured apparentresistivity pseudo-section in a true resistivity cross-sectionmodel or ERT (Loke and Barker 1996).SP anomalous patterns in landslide areas are the surfaceevidence of electrical charge distributions in the subsoildue to electrokinetic phenomena. These result in thegeneration of an electric field (streaming potential) due tothe movement of underground electrolytic waters in aporous permeable system. It follows, therefore, that the SPinverse problem consists of finding the location and de-lineating the geometry of any underground electricalsources, in order to obtain information on the main pat-terns of the underground fluid flow. This introduces a newinversion technique which has transformed this methodinto a powerful tool for reconstructing the electrical chargedistribution in the subsoil (Patella 1997).The main aim of this work was to study the Giarrossalandslide, an active transrotational earthflow slide (Crudenand Varnes 1996), located in the Lucano Appennines ofsouthern Italy (Fig. 1), by means of these two geoelectricaltechniques, in order to obtain an estimate of the thicknessand depth of the sliding surface and information on themain patterns of the underground fluid flow. The results ofthe geoelectrical surveys have been compared with detailedgeomorphologic information, derived from existing bore-holes, ground and aerial surveys.
Geological and geomorphologicalsetting
The Giarrossa landslide at Potenza in southern Italy is oneof the greatest mass movements of the whole LucanoApennines (Polemio and Sdao 1997). On 5 December 1976,following relentless heavy rain, the entire landslide mo-bilised, causing serious damage to suburban areas, com-munications and roads (Lazzari 1977; Polemio and Sdao1997). The initial failure was characterised by extremelyhigh displacement velocities, following which the move-ment gradually slowed down (Polemio and Sdao 1998).Now the landslide is effectively inactive, although there arelocal reactivations in the accumulation zones.The landslide is approximately 2,700 m long, about 60 to420 m wide, with an upper elevation of 1,215 m near Poggidi San Michele and 790 m above sea level (a.s.l.) near Fiu-mara Malamogliera. It has a mean inclination of about 9�.Surface outcrops of the bedrock indicate the material to bea structurally complex clayey-marly terrain comprisingVaricoloured Clays (Upper Cretaceous–Lower Oligocene)and Flysch Galestrino (Lower Cretaceous) of the Lago-negrese Unit (Di Nocera et al. 1988). Discordant on theseolder rocks are Middle Pliocene deposits comprising es-sentially poligenic conglomerates with sandy intercalations(Ariano Unit).The landslide involved the Varicoloured Clays composedof intensively tectonised, fissured clay shales, clay andmudstones, locally including disarranged blocks and lay-ers of lapideous rocks, such as marls, calcarenites or
limestones. Accurate in-situ geological and geomorphol-ogy surveys, aerial photo analysis (from 1956, 1982, 1991and 1997) and boreholes reaching the bottom of the de-tachment zone (Melidoro 1977) made it possible to definethe limits of the landslide, including the probable thick-ness of the displaced material and the depth of the slidingsurface.Figure 2 summarises the main geomorphologic features ofthe landslide and shows the location of the geological andgeophysical surveys. In Table 1 the principal morpholog-ical parameters are synthesised for the three different areasof the landslide (source area, flow track and accumulationzone). The source area of the earth flow is very wide andcan be described as a multiple and retrogressive transro-tational slide. The main scarp, at an elevation of about1,215–1,200 m a.s.l., is semicircular in plan and concave in
Fig. 1Geological map of the Giarrossa area (PZ) and geological sections:a transversal; b longitudinal. Sliding surface is mapped on the basisof interpretation of the geological studies. Investigated areas reported inFigs. 8 and 9 are shown in dashed orange frames
V. Lapenna et al.
260 Bull Eng Geol Env (2003) 62:259–268

longitudinal section. The thickness of the disturbed ma-terial is in the order of 35–40 m (Melidoro 1977). The flowtrack of the landslide, which is probably placed on a pre-existing drainage line, is approximately 960 m long andhas a mean inclination of 8�. The depth of the slidingsurface varies between 20 and 30 m. The flow track ischaracterised by lateral sliding surfaces, lateral levees and
shear zones. The accumulation zone is about 1,050 mwide, with a mean inclination of 7�. The toe materialblocked the bed of Fiumara Malamogliera, thereby split-ting it into channels that currently border the slide mass.The thickness of material displaced varies from about10 m in the lateral zones to 25–30 m in the central zones ofaccumulation.
Fig. 2Geomorphologic map of the Giarrossa landslideshowing location of geological and geophysicalsurveys
Table 1Main morphological parametersof the landslide
Length(m)
Width(m)
Difference inaltitude (m)
Gradient(degrees)
Depth max(m)
Source area 700 200–420 140 16.5 40Flow track 960 60–200 140 8 25Accumulation zone 1,050 150–300 150 7 30
High-resolution geoelectrical tomographies, Giarrossa landslide
Bull Eng Geol Env (2003) 62:259–268 261

Geoelectrical surveys
Geoelectrical surveys can be carried out using active (re-sistivity survey) or passive (SP survey) prospecting tech-niques. In the first case, a controlled source injectsstationary electric currents into the ground, while in thesecond, the measurement is of the natural electrical fieldobserved on the earth’s surface. Two very innovative to-mographic methods to analyse resistivity and SP data havebeen used. In the following paragraphs the mathematicalbackground of these geoelectrical tomographic methods isbriefly described.
Electrical resistivity tomographyThe electrical resistivity tomography (ERT) or electricalimaging is a geoelectrical method widely applied to ob-tain 2D and 3D high-resolution images of the resistivitysubsurface patterns in areas of complex geology (Griffithsand Barker 1993; Dahlin 1996). During the field survey,ERT can be carried out using different electrode config-urations (dipole–dipole, Wenner, etc.) placed at the sur-face to send the electric currents into the ground tomeasure the generated voltage signals. This study used adipole–dipole pseudo-section scheme (Sharma 1997) withan electrode spacing of 20–30 m to depict the geometryof the landslide body and, in particular, to delineate thesliding surface.Technically, during a geoelectrical dipole–dipole pseudo-section the electric current is injected into the ground viatwo contiguous electrodes a meters apart, and the poten-tial drop is measured between two other electrodes ameters apart in line with current electrodes (Fig. 3). Thespacing between the nearest current and potential probesis an integer n times the basic distance a. In surveying,several traverses are made with various values of n. Thevalues of the apparent resistivity for each traverse along ahorizontal axis are assigned at the intersections of twoconverging lines at 45� from the centre of the current
dipole and the centre of the measuring dipole. By choosinggeophysically significant apparent resistivity classes orvariable contour intervals, it is possible to consider thepseudo-section as a first tomographic image of the elec-trical subsurface structure.In a second step, it is necessary to transform the apparentresistivity values obtained during the field survey into realresistivities of the subsoil. Recently, many methods havebeen proposed to solve this problem. In this work, thealgorithm proposed by Loke and Barker (1996) for theautomatic 2D inversion of apparent resistivity data wasused. The inversion routine is based on the smoothnessconstrained least-squares inversion (Sasaki 1992) imple-mented by a quasi-Newton optimisation technique. Theoptimisation adjusts the 2D resistivity model trying toreduce iteratively the difference between the calculatedand measured apparent resistivity values. The root meansquare (RMS) error gives a measure of this difference.Five resistivity tomographies were undertaken: four ori-ented with a direction perpendicular (AA¢, BB¢, CC¢ andDD¢) and one parallel (EE¢) to the landslide body (Fig. 2).Figure 4 gives the inverse model resistivity sections relatedto the electrical tomographies carried out along the pro-files reported in Fig. 2. In all cases the number of iterationswas set to 7, with an RMS error less then 7.3%.The electrical images show a limited range of the resistivityvalues (1 <q <250 Wm), indicating uniformity in theelectrical behaviour of the investigated materials. Howev-er, even if weak, a lateral variability of the resistivity valueswith passages between low-resistivity zones and relativelyhigh-resistivity zones can be detected. The low-resistivityvalues (q<20–30 Wm) observed in the middle part of allresistivity tomographies could be associated with thelandslide body, characterised by a high content of clayeymaterial and water. The relatively high-resistivity (q>60–100 Wm) values present on the sides and at the bottom ofthe slide could be related to the in-situ rock head ratherthan being involved in the landslide. Furthermore, the
Fig. 3Method of plotting dipole–dipole apparentresistivity data in a pseudo-section.n represents relative spacing between thecurrent and potential dipoles. (Sharma1997)
V. Lapenna et al.
262 Bull Eng Geol Env (2003) 62:259–268
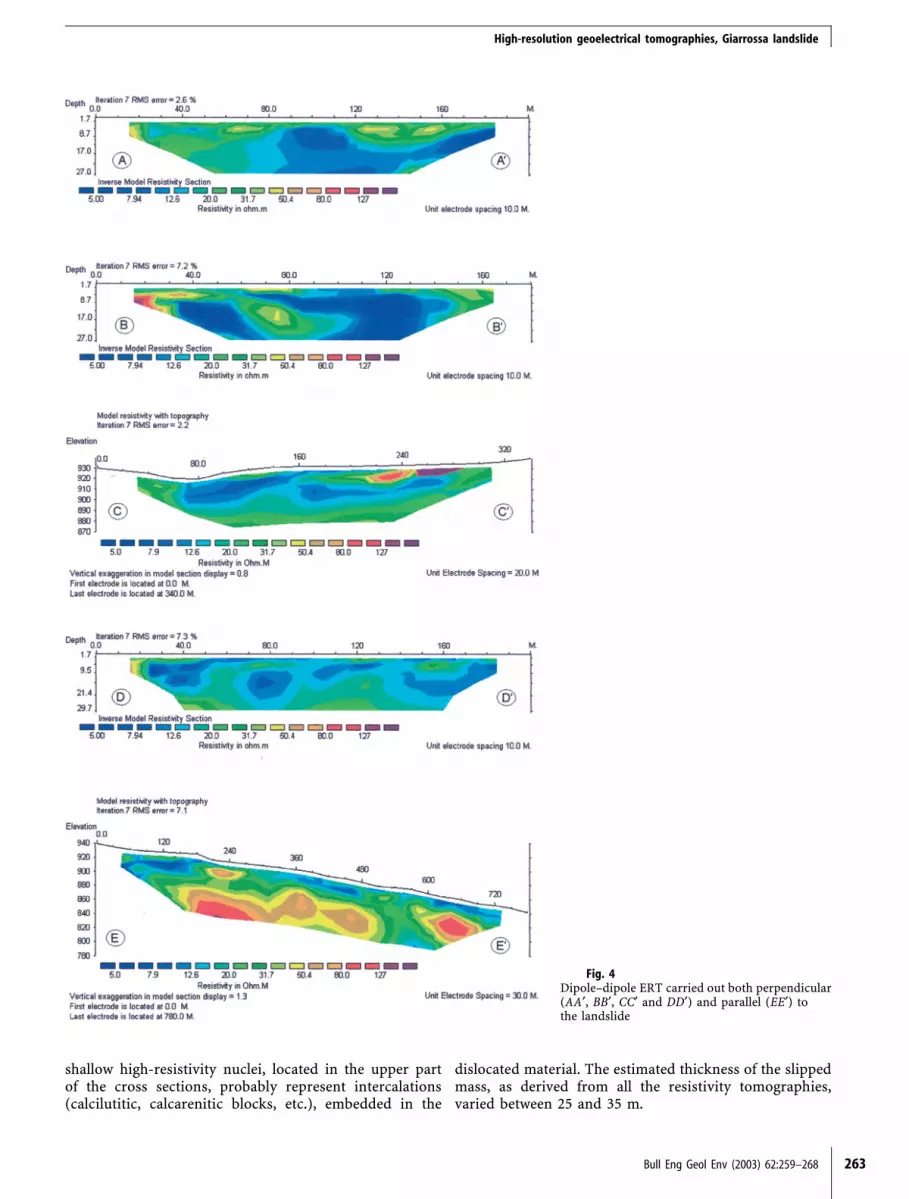
shallow high-resistivity nuclei, located in the upper partof the cross sections, probably represent intercalations(calcilutitic, calcarenitic blocks, etc.), embedded in the
dislocated material. The estimated thickness of the slippedmass, as derived from all the resistivity tomographies,varied between 25 and 35 m.
Fig. 4Dipole–dipole ERT carried out both perpendicular(AA¢, BB¢, CC¢ and DD¢) and parallel (EE¢) tothe landslide
High-resolution geoelectrical tomographies, Giarrossa landslide
Bull Eng Geol Env (2003) 62:259–268 263

Self-potential tomographyThe SP method consists of measuring at the earth surfacethe natural electrotelluric field developed in the subsurfaceby several mechanisms: electrokinetic coupling (streamingpotential), thermoelectric coupling, electrochemical ef-fects, cultural activity, etc. (Nourbehecht 1963; Corwin andHoover 1979). Significant results regarding the observationof electrokinetic effects have been obtained in landslideareas. In particular, spatial and temporal measurements ofthe SP field may provide information on the dynamic as-pects of the hydrogeologic conditions within the landslides(Bogoslovsky and Ogilvy 1973; Schiavone and Quarto1984; Ernstson and Scherer 1986; Coppola et al. 1994;Patella et al. 1995).The results of an SP survey are profiles and/or maps thatcan be strongly affected by the presence in the subsurfaceof charge accumulation points. As it concerns the analysisand quantitative interpretation of the SP data, a new SPtomographic procedure (Patella 1997) was adopted, able todepict the spatial distribution of electrical charge accu-mulation phenomena in the subsoil with high resolutionand reliability.The probability tomography is based on the decompo-sition of the SP field into a sum of elementary contri-butions due to a discrete distribution of charge
accumulation centres. The inversion problem consists ofrecovering the most probable discrete charge distribu-tion underground, responsible for the measured SP field.The 2D tomography is based on a cross-correlationalgorithm between a theoretical scanner function andthe observed SP electric field. In the 2D case a chargeoccurrence probability (COP) function g(xq, hq) isdefined as the probability to find in a point (xq, hq) ofthe cross section through the profile, a positive (g>0) ornegative (g<0) electric charge accumulation which isresponsible for the whole field observed on the surface(Patella 1997).Two SP maps were carried out in the investigated area indifferent climatic conditions (April and September 1999)and six SP profiles were obtained measuring the electrical
Fig. 5Maps of SP anomalies relative to the areal survey carried out in April1999 (above) and September 1999 (below). Red zones are positive values,blue zones are negative values and white bands zones are zero values.Dashed line represents contour of slide
Fig. 62D SP probability tomographies related to profiles SP1-SP6 reportedin Fig. 2. Red and blue nuclei are positive and negative SP source centresrespectively. COP Charge occurrence probability
V. Lapenna et al.
264 Bull Eng Geol Env (2003) 62:259–268

field on the earth’s surface, along several transverseprofiles. The equipment for SP measurements consisted ofa pair of copper rod electrodes, 50 m apart, connected viascreened cables to a high-impedance millivoltmeter. Forfurther details about the field operation, instrumentationand data processing, see previous papers (Di Maio et al.1998; Giano et al. 2000).Figure 5 shows the two SP areal surveys, with a contourinterval of 50 mV. Both SP maps show a long-wave-length electrotelluric field, predominantly negative in thesource zone and positive in the accumulation zone, inpart due to the so-called topographic effect often ob-served in mountainous areas (Corwin and Hoover 1979).Moreover, strong SP horizontal gradients from nega-tive to positive values border the accumulation zone.Finally, the area with positive SP values is reduced andmoved toward the toe of the landslide in the Septembermap.According to the theory of electrokinetic potentials(Bogoslovsky and Ogilvy 1973), it would be possible tohypothesise a movement of underground water from thesource zone to the accumulation zone within the land-slide body, which would explain the negative and posi-tive charges. Further, the reduction and migration
downwards of the positive SP area in the September mapcould reflect the lowering of the water level inside thelandslide body after the dry summer period. In thesource area a quite uniform negative electrotelluric fieldis present, indicative of weak groundwater movement,while in the accumulation area a clear separation isnoted between the negative and positive SP field.Moreover, strong SP horizontal changes from negative topositive SP values geometrically delimit the accumulationzone of the landslide. Such configuration could beassociated with water infiltration from the surroundingin-situ terrain into the disturbed material, which, beingreworked, has a lower density. The clear separation,indicative of the dynamics of the underground waters,suggests that the accumulation area is most at risk fromremobilisation.Figure 6 gives the six transversal SP tomographies carriedout along the profiles shown in Fig. 2. All the SP to-mographies reaching an investigation depth of about80 m bgl, show an irregularly spaced alternate sequenceof shallow positive and negative SP source centres thatcould be associated with the presence of intercalations(calcilutitic, calcarenitic blocks, etc.) embedded in thedisturbed material, as already outlined by the ERT. Thebarycentre of these nuclei, reaching a depth not exceed-ing 30–35 m, makes it reasonable to assume this is thedepth of the slip surface. Moreover, on all the SP to-mographies the lateral boundaries of the landslide appear
Fig. 73D SP probability tomography in the depth interval from 20 to100 m b.g.l. of accumulation zone of slide
High-resolution geoelectrical tomographies, Giarrossa landslide
Bull Eng Geol Env (2003) 62:259–268 265

to be at the position of the strong horizontal changes ofthe COP function.In order to define the depth of the SP sources in the ac-cumulation zone of the landslide, 3D SP probability to-mography was constructed. Figure 7 shows a set of SPtomographies between 20 and 120 m b.g.l. The maximumCOP values are observed in the tomography at 80 m depth.It is worth pointing out that in the middle part of all thetomographies, an elongated COP positive anomaly ispresent along the landslide body, with lateral limits welldefined by the high horizontal changes separating positivefrom negative COP values. However, the sliding surface(35–40 m) is not well identified, probably due to thepresence of a high water content in the accumulation zoneof the slide. As observed above, this disguises the electricaldiscontinuity surface to the passage between the slidingsurface and the rock head.
Discussion and results
Figure 8 shows the analysis between the ERT and SP to-mographies and the geological section, comparing the CC¢ERT, the SP4 tomography and the geological section, all ofwhich were carried out along the same profile. In Fig. 9 theEE¢ ERT and the stratigraphic data derived from theboreholes are reported.The ERT CC¢ (with topographical correction) shows a weakresistivity contrast between a relatively high-resistivityzone (q >30 Wm) and a relatively low-resistivity zone(q <20 Wm) in the central part at a depth of about 25–30 m.The low-resistivity zone has a lenticular shape which is likelyto be associated with a high clayey content and high satu-ration levels in the landslide, as observed in the boreholes.The deep relatively high-resistivity zone is considered toreflect the in-situ rock head which is not involved in the
Fig. 8Comparison between analysis ofERT (above), SP tomography(middle) and geological section(below) of the CC¢ profile.Top diagram also shows HVSRmeasurements (yellow dots)
V. Lapenna et al.
266 Bull Eng Geol Env (2003) 62:259–268

landslide. The shallow high-resistivity nuclei may be asso-ciated with intercalations within the disturbed material. It isworth noting that the low-resistivity zone is limited on bothsides of the landslide. Five microtremor measurements(yellow dots) carried out along the same profile (Gallipoliet al. 2000), using the sonic survey or HVSR (horizontal tovertical spectral ratio) technique (Nakamura 1989; Bodinand Horton 1999) are given in ERT CC¢ which indicates apossible sliding surface at a depth of about 30 m.The SP4 tomography shows a multipolar configuration,presenting several shallow positive and negative SP sourcecentres that could be associated with the presence of in-tercalations. The barycentre of these nuclei reach a depthof 30–35 m, which has been interpreted as the slidingsurface. The lateral boundaries of the landslide body, re-ported on the SP tomography, fall just within the laterallimits indicated on the ERT and on the geologic–geomorphologic section.The ERT EE¢ (Fig. 9), carried out longitudinally to thelandslide, shows a clear resistivity contrast between a low-resistivity zone (q<5–20 Wm) and a relatively high-resis-tivity zone (q>20 Wm) at about 30 m depth. The formerhas an irregular shape and could be associated with themobilised body, while the latter probably reflects the in-situ formations, unaffected by the landslide. The two rel-atively high-resistivity zones, observed in the shallow partof the ERT just within the accumulation fronts, could beinterpreted as intercalated blocks. The electrical imagecrosses three boreholes (S3, S2, S1) (Melidoro 1977) thatreport a sliding surface at about 30 m, in good agreementwith the results obtained by the ERT. A low-resistivityzone was also identified between boreholes S2 and S1. Thisis likely to be associated with an area of higher watercontent such that it is likely to be prone to remobilisationin the future.
Conclusions
This study has utilised new geoelectrical methods thatcombine low costs and fast field survey procedures withhigh-resolution imaging of electrical properties of the sub-surface. In the study of the Giarrossa landslide in southernItaly, the ERT has indicated the presence of a sliding surfaceat a depth of between 25 and 30 m and individuated the mainsurface boundaries, while the SP tomographies identified amajor concentration of groundwater in the accumulationzone of the landslide. Such an approach, integrated withgeological and geomorphologic information, is consideredto be a powerful tool for the investigation of landslides inareas of complex geology.Repeated surveying, combined with the powerful imagingtechniques of the local SP and ERT configuration, couldhelp us to understand the time-dynamics of the geoelec-trical parameters in connection with the meteorologicalconditions and identify zones of likely instability due to ahigh water content.In the near future, this strategy will be adopted in theframework of a project supported by the Italian Ministryfor University and Scientific and Technological Researchto be devoted to the geophysical monitoring of landslideareas in the Southern Apennine chain (Italy).
Acknowledgement This work has been financially supported byMURST (Ministry for University and Scientific and TechnologicalResearch).
References
Bodin P, Horton S (1999) Broadband microtremor observation ofbasin resonance in the Mississippi embayment. Central USGeophys Res Lett 26(7):903–906
Bogoslovsky VA, Ogilvy AA (1973) Deformations of naturalelectric fields near drainage structures. Geophys Prospect21(4):716–723
Fig. 9Analysis of ERT EE¢ longitudinal profile and data from boreholes (S3,S2, S1) carried out in the accumulation zone of the landslide body.Dashed line represents interpreted sliding surface
High-resolution geoelectrical tomographies, Giarrossa landslide
Bull Eng Geol Env (2003) 62:259–268 267

Bogoslovsky VA, Ogilvy AA (1977) Geophysical methods in theinvestigation of landslides. Geophysics 42:562–571
Bruno F, Levato L, Marillier F (1998) High resolution seismicreflection, EM and electrokinetic SP applied to landslide studies:‘‘Le Boup’’ landslide (western Swiss Alps). In: Proc Environ-mental and Engineering Geophysical Society (EuropeanSection), 14–17 Sept
Cassinis R, Tabacco I, Bruzzi GF, Corno C, Brandolini A, Cara-belli E (1984) The contribution of geophysical methods to thestudy of the great Ancona landslide (December 13, 1982).Geoexploration 23:363–386
Coppola B, Lapenna V, Mancini M, Patella D (1994) Applicationof unconventional geoelectrical methods to the hydrogeologicalexamination of the Mt. S. Croce rock formations (Umbria, Italy)involved in a railway tunnel project. Ann Geofis 37(5):1251–1267
Corwin RF, Hoover DB (1979) The self-potential method ingeothermal exploration. Geophysics 44(2):226–245
Cruden DM, Varnes DJ (1996) Landslide types and processes.In: Turner AK, Schuster RL (eds) Landslides – investigationand mitigation. Transportation Research Board, Spec Rep247, National Academy of Sciences, Washington, DC, pp 36–75
Dahlin T (1996) 2D resistivity surveying for environmental andengineering applications. First Break 14(7):275–283
Di Maio R, Mauriello P, Patella D, Petrillo Z, Piscitelli S, Sini-scalchi A (1998) Electric and electromagnetic outline of theMount Somma-Vesuvius structural setting. J Volcanol Geo-therm Res 82:219–238
Di Nocera S, Lazzari S, Pescatore T, Tramutoli M (1988) Aspettigeologici e geotecnici dell’area urbana di Potenza. Mem SocGeol It 41(1):373–390
Ernstson K, Scherer HU (1986) Self-potential variations with timeand their relation to hydrogeologic and meteorological para-meters. Geophysics 51(10):1967–1977
Gallipoli MR, Lapenna V, Lorenzo P, Mucciarelli M, PerroneA, Piscitelli S, Sdao F (2000) Comparison of geological andgeophysical prospecting techniques in the study of a land-slide in southern Italy. Eur J Environ Eng Geophys 4:117–128
Giano SI, Lapenna V, Piscitelli S, Schiattarella M (2000) Electricalimaging and self-potential surveys to study the geological set-ting of the Quaternary slope deposits in the Agri high valley(southern Italy). Ann Geofis 43(2):409–419
Griffiths DH, Barker RD (1993) Two-dimensional resistivityimaging and modelling in areas of complex geology. J ApplGeophys 29:211–226
Jongmans D, Hemroulle P, Demanet D, Renardy F, Vanbrabant Y(2000) Application of 2D electrical and seismic tomographytechniques for investigating landslides. Eur J Environ EngGeophys 8:75–89
Lazzari S (1977) Analisi geologica della frana di Giarrossa nelcomune di Potenza. Ras Econ Lucana 20(1) Potenza
Loke MH, Barker RD (1996) Rapid least-squares inversion ofapparent resistivity pseudosections by quasi-Newton method.Geophys Prospect 44:131–152
McCann DM, Forster A (1990) Reconnaissance geophysicalmethods in landslide investigations. Eng Geol 29(1):59–78
Melidoro G (1977) Relazione geologica sul movimento franosodel 1976 in localita Giarrossa (Comune di Potenza). RegioneBasilicata, Ufficio Genio Civile di Potenza
Nakamura Y (1989) A method for dynamic characteristics esti-mation of subsurface using microtremor on the ground surface.Q R Railway Tech Res Inst 30:1
Nourbehecht B (1963) Irreversible thermodynamics in homoge-neous media and its application to certain geoelectric problems.PhD Thesis, Massachusetts Institute of Technology, Cambridge
Parasnis DS (1986) Principles of applied geophysics. Chapmanand Hall, London
Patella D (1997) Introduction to ground surface self-potentialtomography. Geophys Prospect 45:653–681
Patella D, Di Maio R, Alfinito A (1995) Misure di potenzialespontaneo su un versante in frana. In: Ippolito F, Bonardi G,De Vivo B, Gasparini P, Vallario A (eds) Proc Cinquanta Annidi Attivita Didattica e Scientifica, Liguori, Naples, pp 183–196
Polemio M, Sdao F (1997) Le piogge e il rischio di frana in areeurbane della Basilicata. In: Proc Conf La Stabilita del Suolo,Accademia del Lincei, Roma
Polemio M, Sdao F (1998) Heavy rainfalls and extensive land-slides occurred in Basilicata, southern Italy, in 1976. In: Proc 8thInt Congr EEGS, Vancouver, Canada, pp 1849–1855
Sasaki Y (1992) Resolution of resistivity tomography inferredfrom numerical simulation. Geophys Prospect 40:453–464
Schiavone D, Quarto R (1984) Self-potential prospecting in thestudy of water movement. Geoexploration 22:47–58
Sharma PV (1997) Environmental and engineering geophysics.Cambridge University Press, Cambridge
V. Lapenna et al.
268 Bull Eng Geol Env (2003) 62:259–268