high-density surface emg to investigate muscle activity during
TRANSCRIPT

04 August 2020
POLITECNICO DI TORINORepository ISTITUZIONALE
High-density surface EMG to investigate muscle activity during standing: implications for the training of postural controlwith EMG biofeedback in the elderly / VIEIRA DOS ANJOS, Fabio. - (2017).
Original
High-density surface EMG to investigate muscle activity during standing: implications for the training ofpostural control with EMG biofeedback in the elderly
Publisher:
PublishedDOI:10.6092/polito/porto/2690493
Terms of use:Altro tipo di accesso
Publisher copyright
(Article begins on next page)
This article is made available under terms and conditions as specified in the corresponding bibliographic description inthe repository
Availability:This version is available at: 11583/2690493 since: 2017-11-09T12:39:07Z
Politecnico di Torino
Doctoral Dissertation
Doctoral Program in Electronic Engineering (29th Cycle)
High-density surface EMG to
investigate muscle activity during
standing: implications for the training
of postural control with EMG
biofeedback in the elderly
By
Fabio Vieira dos Anjos
******
Supervisor(s):
Prof. Marco Gazzoni, Supervisor
Dr. Taian Martins Vieira, Co-Supervisor
Politecnico di Torino
2017
Declaration
I hereby declare that, the contents and organization of this dissertation
constitute my own original work and does not compromise in any way the rights of
third parties, including those relating to the security of personal data.
Fabio Vieira dos Anjos
2017
* This dissertation is presented in partial fulfillment of the requirements for
Ph.D. degree in the Graduate School of Politecnico di Torino (ScuDo).

I would like to dedicate this thesis especially to Talita Peixoto Pinto who
support and encourage me throughout this journey.

Acknowledgment
I would like to express my sincere gratitude to the professors:
Marco Gazzoni, for the continuous assistance and constructive criticism,
allowing me to prepare this Thesis.
Taian Martins Vieira, for all teachings, continuous support and constructive
criticism, collaborating for the progression of this Thesis.
Roberto Merletti, for the opportunity to carry out three years as PhD student at
the Laboratory for Engineering of the Neuromuscular System (LISiN), Politecnico
di Torino, Italy.
Luís Aureliano Imbiriba Silva, for introducing and encouraging me to proceed
in the research field of human postural control.
I am also deeply grateful to:
My loving family, for encouraging me to start the doctorate and for supporting
me.
My colleagues of LISiN, for all dedication, availability and sharing of
knowledge throughout the doctorate.
Abstract
By recording surface EMG using standard bipolar EMG, previous studies have
demonstrated that elderlies tend to activate their postural muscles during standing
with a higher degree of activity and for a prolonged duration compared with young
adults. The EMG biofeedback technique has been widely used to reduce the
excessive level of muscle activity in different fields, e.g. the prevention and
reduction of low back pain. In this view, EMG biofeedback could be a potential
tool to assist aged subjects in reducing the excessive muscle activity during standing
balance. However, whether the greater, prolonged activation observed locally in the
muscles of aged subjects reflects the activation of the entire muscle is still an open
question. It is possible that differences in the activation of postural muscles with
aging are more or less expressive than previously appreciated. This thesis aimed at
obtaining new insights into the rationale and the effects of the use of EMG
biofeedback for the improvement of muscle efficiency during standing in the
elderly. It was evaluated whether muscle activation during standing differ between
young and aged subjects through a sophisticated detection system for the
acquisition of surface EMGs from multiple regions of a single muscle (i.e., high-
density surface EMG). Before to test this hypothesis, a methodological issue was
addressed to verify whether high-density surface EMG is selective enough to detect
during standing: (a) different activation between ankle muscles, as observed with
other techniques (intramuscular electromyography); (b) variations in the activity
within ankle muscles (i.e., soleus muscles). The results of this methodological study
revealed that the medial portion of soleus muscle was activated continuously
compared to the lateral portion of soleus and medial gastrocnemius, which were
activated intermittently. These results suggest high-density surface EMGs can be
used to discriminate the activity between ankle muscles (i.e., medial gastrocnemius
and soleus) and muscle activity sampled from different regions of a single muscle
(i.e., soleus) can provide estimates more representative of muscle activity during
standing. High-density surface EMG was therefore used to assess muscle activity
between young and aged subjects during standing. Key results indicate that during
standing: (a) tibialis anterior and medial gastrocnemius muscles were active for a
longer duration in aged than young subjects; (b) a greater proportion of medial
gastrocnemius volume was active in aged individuals. Collectively, these results
corroborate previous evidence that elderlies tend to stand with a greater muscle
effort than young subjects. Thus, the well-documented attenuation effect of EMG
biofeedback on muscle activity may extend to the control of human standing
posture with aging. This Thesis addressed additional issues which could be relevant
to provide more representative EMGs of muscle activity to the subject through
EMG biofeedback and to prove the attenuation effect of EMG biofeedback on the
activity of lower limb muscles during standing. The following two questions were
addressed: i) should EMGs be sampled from both lower limbs to provide more
representative information about calf muscles activity? It was observed differences
in muscle activity between left and right ankle muscle while young subjects stood
at ease. These results indicate muscle activity should be sampled from the ankle
muscles of both legs to avoid a biased recording and feedback of muscle activity
during standing. ii) Is the attenuation effect of EMG biofeedback on the ankle
muscles activity generalized to – or compensated by – other muscles during
standing? These findings revealed the attenuation effect of EMG-audio feedback
on ankle muscles is not compensated by other lower limbs muscles not included for
the feedback. Therefore, the EMG biofeedback may be a promising technique to
assist individuals in more efficiently controlling lower limbs muscles during
standing. If the short-term, attenuation, effect of EMG-audio feedback on ankle
muscles’ activity in young individuals observed here is generalized to other
populations (e.g., the elderly) and retained after training, then, improvement in
postural muscle efficiency may contribute significantly to an ability to maintain
standing balance, to respond to unexpected perturbation, standing on narrow
stances and walking; with potential implication for the prevention of falls.
Contents
1. Human Standing Balance, EMG and Aging ...................................................... 1
1.1 Human standing balance .......................................................................... 1
1.2 EMG and the control of standing balance ............................................... 2
1.2.1 How electromyography has been used in the literature of human
postural control? ............................................................................................... 2
1.2.2 Insights into the optimal, active control of standing posture from
electromyography ............................................................................................. 7
1.3 Age-related changes in the active control of standing balance ............... 9
1.4 Available protocols for the training of postural control with aging ...... 10
2. EMG biofeedback for the training of postural control .................................... 13
2.1 EMG biofeedback to re-educate muscle activation ............................... 13
2.2 EMG biofeedback for reducing the excessive muscle effort during
standing .............................................................................................................. 17
3. Does the global temporal activation differ in triceps surae during standing
balance? ........................................................................................................... 20
3.1 Abstract .................................................................................................. 20
3.2 Introduction ........................................................................................... 21
3.3 Methods ................................................................................................. 21
3.3.1 Participants ...................................................................................... 21
3.3.2 Experimental procedures ................................................................ 22
3.3.3 Instrumentation ............................................................................... 22
3.3.4 Data analysis and statistics ............................................................. 23
3.4 Results ................................................................................................... 26

3.5 Discussion .............................................................................................. 26
3.6 Conclusion ............................................................................................. 28
4. The spatial distribution of ankle muscles activity discriminates aged from young
subjects during standing .................................................................................. 29
4.1 Abstract .................................................................................................. 29
4.2 Introduction ........................................................................................... 30
4.3 Material and Methods ............................................................................ 31
4.3.1 Participants ...................................................................................... 31
4.3.2 Experimental protocol ..................................................................... 32
4.3.3 Electrodes’ positioning ................................................................... 33
4.3.4 Electromyographic and stabilometric recording ............................. 34
4.3.5 Quantifying muscle activity during standing .................................. 34
4.3.6 Measurements of ankle muscles’ length and subcutaneous thickness
........................................................................................................................ 37
4.3.7 Quantifying the CoP sway area ...................................................... 38
4.3.8 Statistical analysis ........................................................................... 38
4.4 Results ................................................................................................... 38
4.5 Discussion .............................................................................................. 42
5. Does the plantar flexors activity differ between lower limbs during standing?
......................................................................................................................... 48
5.1 Abstract .................................................................................................. 48
5.2 Introduction ........................................................................................... 49
5.3 Methods ................................................................................................. 50
5.3.1 Participants ...................................................................................... 50
5.3.2 Experimental protocol ..................................................................... 50
5.3.3 Signal recordings ............................................................................ 50
5.3.4. Assessment of muscle activity ....................................................... 52
5.3.5 Calculation of CoP lateral position ................................................. 52
5.3.6 Statistical Analysis .......................................................................... 53
5.4 Results ................................................................................................... 53
5.5 Discussion .............................................................................................. 55
6. Is the attenuation effect on the ankle muscles activity from the EMG
biofeedback generalized to – or compensated by – other lower limb muscles
during standing? ............................................................................................... 59
6.1 Abstract .................................................................................................. 59
6.2 Introduction ........................................................................................... 60
6.3 Methods ................................................................................................. 62
6.3.1 Participants ...................................................................................... 62
6.3.2 Experimental protocol ..................................................................... 62
6.3.3 Electrodes’ positioning ................................................................... 63
6.3.4 Electromyographic and stabilometric recordings ........................... 65
6.3.5 Modulation of audio signal from bipolar, surface EMG ................ 66
6.3.6 Quantifying variations in the degree of muscle activity ................. 68
6.3.7 Quantifying variations in the center of pressure ............................. 69
6.3.8 Statistical Analysis .......................................................................... 69
6.4 Results ................................................................................................... 70
6.5 Discussion .............................................................................................. 73
7. General conclusions ......................................................................................... 79
8. References ........................................................................................................ 81
List of Figures
Figure 1: Simplified block diagram for the acquisition of bipolar surface EMG.
The main steps for the acquisition of bipolar EMGs are: (1) detection and
amplification of differential, bipolar surface EMG signals; (2) filtering and
converting into digital voltage values; (3) signal processing to compute
electromyographic indices or features. .................................................................... 4
Figure 2: Spatial variation in medial gastrocnemius’ activity during standing.
(A) A linear array of surface electrodes (1 cm inter-electrode distance; IED)
positioned on the skin region covering the medial gastrocnemius muscle of the left
leg while a young subject stood at ease. (B) Raw surface EMGs collected in single-
differential derivation from the medial gastrocnemius during 10s of standing. Note
EMGs with relatively high amplitude were detected by 11 channels (channel 4 to 8
and channel 10 to 15). Relatively low modulations in EMG activity were recorded
by channels 1-3 and 9 (i.e., four channels). (C) An expanded view (i.e., 500 ms) of
all EMGs. Note signal propagation in channels 13-15. ........................................... 6
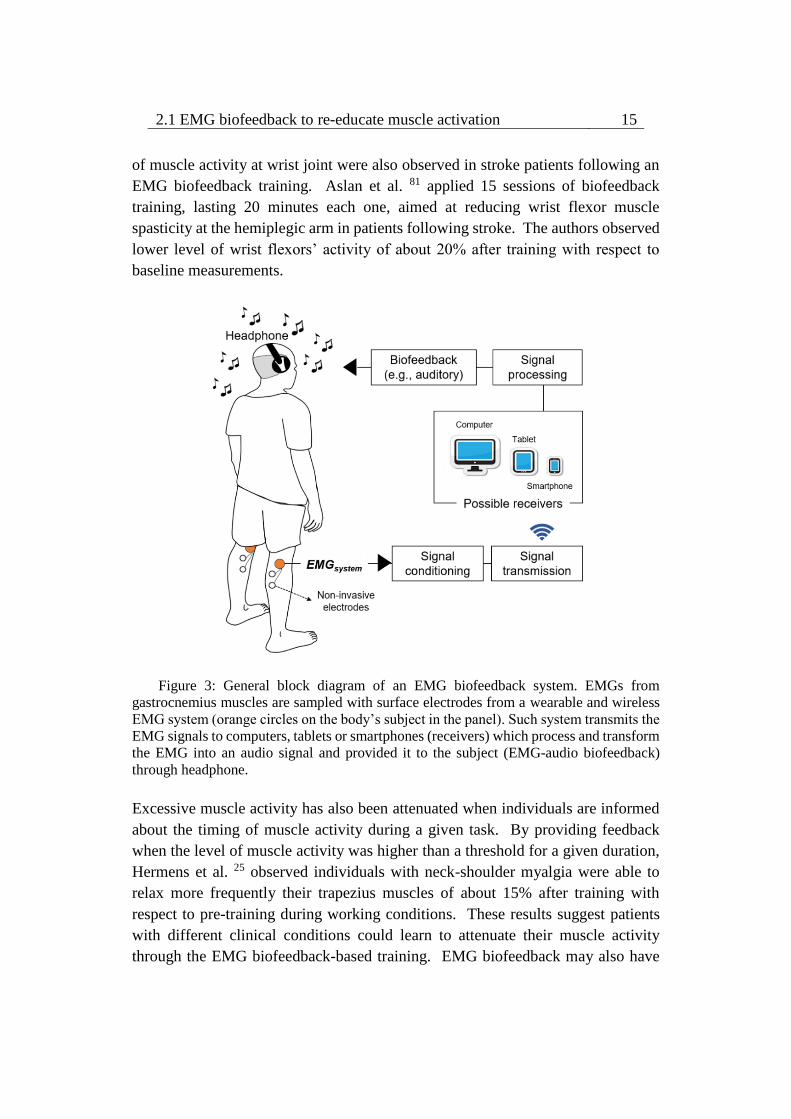
Figure 3: General block diagram of an EMG biofeedback system. EMGs from
gastrocnemius muscles are sampled with surface electrodes from a wearable and
wireless EMG system (orange circles on the body’s subject in the panel). Such
system transmits the EMG signals to computers, tablets or smartphones (receivers)
which process and transform the EMG into an audio signal and provided it to the
subject (EMG-audio biofeedback) through headphone. ........................................ 15
Figure 4: A: Schematic representation of the linear surface arrays positioned on
MG and SOL while a subject is standing. B: MG-Achilles tendon junction (arrow
point) identified in the ultrasound image to guide the placement of surface arrays.
............................................................................................................................... 23
Figure 5: An example of fluctuations in calf muscles’ EMG amplitude and in
COP position during the voluntary sway task. EMGs in the intervals indicated with
grey bar (backward sways) were considered to compute the baseline level. ........ 24
Figure 6: Calculation of the resultant ON-OFF signal of MG for a representative
subject while standing. A: Identification of MG channels over different muscle
fibers for MG ON-OFF calculation. B: ON-OFF computation for each channel
selected from MG muscle; Raw EMGs (grey), RMS baseline (dashed line), RMS
signal (black) and ON-OFF signal (blue). C: Resultant ON-OFF signal of MG
calculated through logical disjunction (“Or”) between EMGs from MG muscle. 25
Figure 7: Resultant ON-OFF signal obtained for the MG (A), MSOL (B) and
LSOL (C) muscles for a representative individual while standing. ....................... 26
Figure 8: Box plot of temporal index of muscle activation. The temporal index
was computed through the resultant ON-OFF signal of each muscle. Temporal
index of MSOL was significantly higher than temporal index of MG and LSOL (*
p<0.05). .................................................................................................................. 27
Figure 9: Standing protocol and feet and electrode positioning. (A) Schematic
illustration showing the procedure considered to measure feet length. The midpoint
between the tip of left and right calcaneus bones was considered as the origin of the
reference system for center of pressure (CoP) and foot length measurements. The
target value, corresponding to 65% of the foot length projected on the anterior-
posterior axis (AP axis), was calculated and then considered for the normalization
task shown in (B). In such task, participants were asked to keep their CoP position
in the AP axis (black line) within 10% (±5%) of the target value (thick, gray line).
(C) The positioning of electrode arrays is shown for the tibialis anterior muscle
(left), for the medial and lateral gastrocnemius heads and for the soleus medial and
lateral portions (right). ........................................................................................... 33
Figure 10: Computation of instants of muscle activation. (A) Shows examples
of single-differential EMGs detected by channels 1, 7, and 10 from the medial
gastrocnemius muscle of a single participant. Note action potentials do not appear
with equally high amplitude in the three channels. The muscle was considered
active whenever for any given instants the RMS amplitude exceeded the
background activity in at least one channel. Light gray rectangles in the grid denote
periods within which the RMS amplitude of EMGs in each channel exceeded the
background activity computed with the muscle at rest (see text). The resulting series
of instants of muscle activity for this representative example is illustrated with a
succession of white (Inactive state; muscle at rest) and gray (Active state; muscle
active) rectangles (B). ............................................................................................ 36
Figure 11: Modulations in ankle muscles’ activity during standing. Single-
differential EMGs collected for a representative channel from the tibialis anterior,
the soleus medial and lateral portions and from the lateral gastrocnemius of a
representative young and elderly participant are shown for 10s of standing at ease.
Light gray areas in the bars indicate periods within which the RMS amplitude
exceeded the background activity (i.e., Active state). ........................................... 39
Figure 12: Duration and distribution of medial gastrocnemius activity during
standing. Raw EMGs detected by channels located over the gastrocnemius
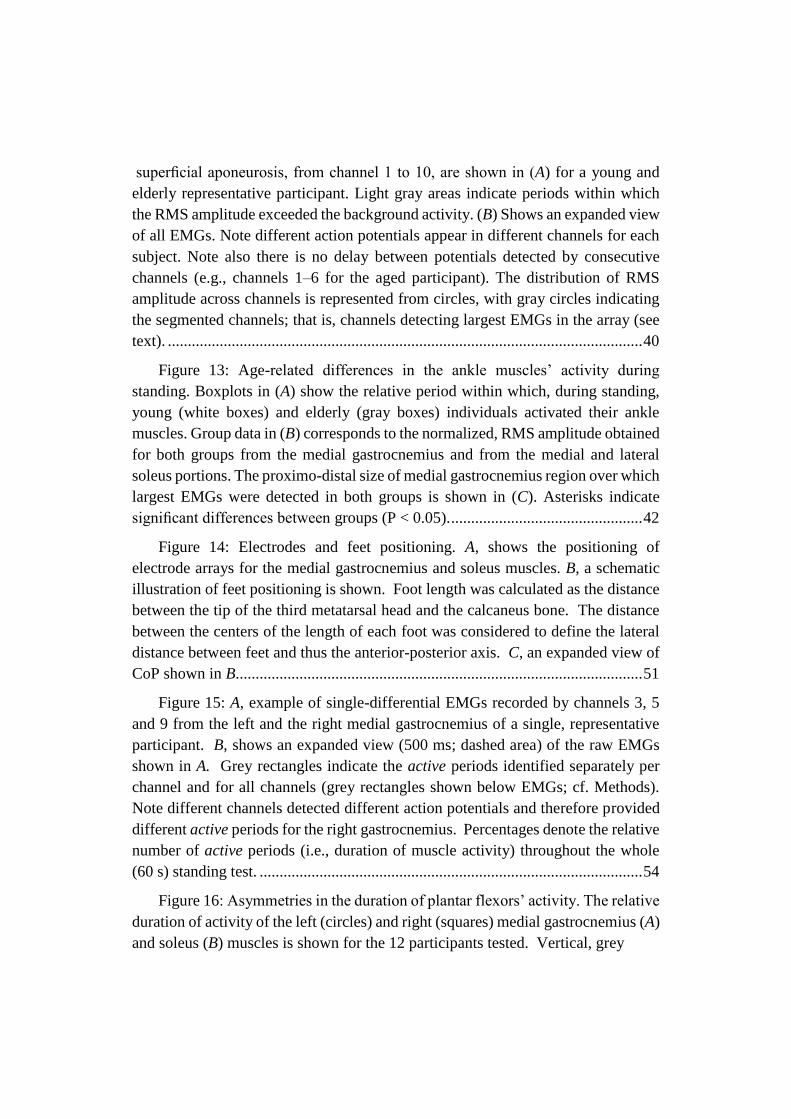
superficial aponeurosis, from channel 1 to 10, are shown in (A) for a young and
elderly representative participant. Light gray areas indicate periods within which
the RMS amplitude exceeded the background activity. (B) Shows an expanded view
of all EMGs. Note different action potentials appear in different channels for each
subject. Note also there is no delay between potentials detected by consecutive
channels (e.g., channels 1–6 for the aged participant). The distribution of RMS
amplitude across channels is represented from circles, with gray circles indicating
the segmented channels; that is, channels detecting largest EMGs in the array (see
text). ....................................................................................................................... 40
Figure 13: Age-related differences in the ankle muscles’ activity during
standing. Boxplots in (A) show the relative period within which, during standing,
young (white boxes) and elderly (gray boxes) individuals activated their ankle
muscles. Group data in (B) corresponds to the normalized, RMS amplitude obtained
for both groups from the medial gastrocnemius and from the medial and lateral
soleus portions. The proximo-distal size of medial gastrocnemius region over which
largest EMGs were detected in both groups is shown in (C). Asterisks indicate
significant differences between groups (P < 0.05). ................................................ 42
Figure 14: Electrodes and feet positioning. A, shows the positioning of
electrode arrays for the medial gastrocnemius and soleus muscles. B, a schematic
illustration of feet positioning is shown. Foot length was calculated as the distance
between the tip of the third metatarsal head and the calcaneus bone. The distance
between the centers of the length of each foot was considered to define the lateral
distance between feet and thus the anterior-posterior axis. C, an expanded view of
CoP shown in B. ..................................................................................................... 51
Figure 15: A, example of single-differential EMGs recorded by channels 3, 5
and 9 from the left and the right medial gastrocnemius of a single, representative
participant. B, shows an expanded view (500 ms; dashed area) of the raw EMGs
shown in A. Grey rectangles indicate the active periods identified separately per
channel and for all channels (grey rectangles shown below EMGs; cf. Methods).
Note different channels detected different action potentials and therefore provided
different active periods for the right gastrocnemius. Percentages denote the relative
number of active periods (i.e., duration of muscle activity) throughout the whole
(60 s) standing test. ................................................................................................ 54
Figure 16: Asymmetries in the duration of plantar flexors’ activity. The relative
duration of activity of the left (circles) and right (squares) medial gastrocnemius (A)
and soleus (B) muscles is shown for the 12 participants tested. Vertical, grey
rectangles indicate the relative amount of the standing duration within which
muscles in both legs were active concurrently. Asterisks indicate significant
differences in the duration of activity between the legs (P<0.05). ........................ 55
Figure 17: Side differences in the duration of muscle activity and centre of
pressure position. Scatter plots are shown, with the ratio (right/left) of the duration
of medial gastrocnemius (A) and soleus (B) activity plotted in the y axis and the
centre of pressure (CoP) position in the frontal plane plotted in the x axis. CoP
position was normalised with respect to the lateral distance between feet (cf. Fig.
1). Regression (dashed) lines were drawn for clarity. .......................................... 56
Figure 18: Electrodes’ positioning. Schematic illustration showing the
positioning of pair of electrodes for the tibialis anterior, vastus lateralis and vastus
medialis (left), medial gastrocnemius, soleus medial aspect, semitendinosus and
biceps femoris (right) of the right leg. ................................................................... 65
Figure 19: (A) Standing with EMG-audio feedback, where participants were
asked to reduce the volume of an audio signal proportional to the level of activity
of their ankle muscles without changing standing posture. (B) Modulating audio
signal from bipolar EMGs. B shows a short epoch (700 ms) of raw bipolar EMGs
collected from both soleus (SO, EMG signals 1 and 2) and medial gastrocnemius
(MG; EMG signals 3 and 4) while participant stood at ease and exhibits the
averaged, EMG envelope computed from these bipolar EMGs, which its amplitude
was considered for modulating the audio stimulus (sinusoidal signal). The
amplitude and the frequency of this audio signal were respectively modulated
according to a sigmoid and linear function. Note the correspondence between the
amplitude of bipolar EMGs, the EMG envelope and the modulated audio signal.
............................................................................................................................... 68
Figure 20: Modulations in the ankle and thigh muscles’ activity with EMG-
audio feedback. Bipolar EMGs collected from the soleus (SO) medial aspect, the
medial gastrocnemius (MG), the tibialis anterior (TA), the semitendinosus (ST), the
biceps femoris (BF), the vastus medialis (VM) and vastus lateralis (VL) of a
representative participant are shown during standing at ease and standing with
EMG-audio feedback. Signals are shown over a relatively short epoch (5s) to
facilitate observing the modulations in bipolar EMG amplitude for the different
standing conditions. ............................................................................................... 71
Figure 21: Differences in the degree of ankle and thigh muscles’ activity during
EMG-audio feedback conditions. Boxplots are shown for the RMS amplitude of
surface EMGs collected from the ankle and thigh muscles during standing

conditions. Whiskers denote non-outlier range and asterisks indicate significant
differences between conditions (P < 0.05)............................................................. 72
List of Tables
Table 1: The effect of EMG biofeedback (BF) - based training on muscle
activity ................................................................................................................... 18
1.1 Human standing balance 1
Chapter 1
Human Standing Balance, EMG
and Aging
1.1 Human standing balance
Human beings usually stand upright to perform most motor tasks. Standing is
essential for the majority of voluntary motor skills, such as walking, running,
jumping, dancing and playing. Imagine dancers performing ballet movements, they
often have to stand, stand on tip toes, stand on one leg or jump. Now, imagine a
person doing daily activities. Probably this person performed different motor tasks
while standing throughout the day, such as cooking or cleaning the house. People
succeed in performing most functional tasks thanks to our ability to assume
different body positions in space (i.e., postures) establishing a vertical orientation,
commonly referred to as postural control. The possibility of performing a
repertoire of postures during standing demands body stability.
In the human standing posture, body stability or balance is the ability of
neuromuscular system to control the vertical projection of the body center of mass
within the limits of a small base of support (i.e., feet; 1). Once the body center of
mass sways out of the limits of support base, the individual inevitably loses its
balance. Could the vertical projection of body center of mass move away from the
limits of support base? When people stand upright, the gravity pulls the body
forward. It occurs since our body center of mass is often projected in front of the
ankle joint due to the arrangement of body segments. Such an anterior sway of
2 Human Standing Balance, EMG and Aging
body must be compensated in the opposite direction (i.e., backward) to maintain
body stability, otherwise the vertical projection of the body center of mass would
fall off the limits of support base and individual would lose its balance. Then, the
standing posture is characterized by some sort of movement, i.e. spontaneous,
continuous and small body sways 2,3.
Efforts have been made to understand how humans control their posture during
standing. There is a consensus in the literature that the control of standing posture
relies on passive and active contribution of skeletal muscles. In contrast to some
evidences 4, studies have demonstrated the intrinsic muscle stiffness contributes
partially (from about 67% to 90% of the load stiffness; the gravitational toppling
torque) to stabilize body sways 5,6. Thus, the active contribution of skeletal muscles
seems of marked relevance to maintain body stability during standing. Indeed,
muscle activity have long been observed while subjects stand upright 7. Insights
have been gained into the active control of human standing balance from a
technique referred to as electromyography. The following sections of this chapter
provide brief introduction and recent methodological issues regarding the
electromyography and its contribution to the recent knowledge of the control of
standing balance even with aging.
1.2 EMG and the control of standing balance
The EMG signal. Electromyography is a technique for the detection and analysis
of electrical potentials produced during muscle contractions (i.e., the
electromyogram or EMG signal). The electrical potentials observed from the EMG
signal reflect the functional units’ activity of the neuromuscular system. Concisely,
the functional unit of the neuromuscular system is the motor unit. The motor unit
consists in a single motor neuron, including its dendrites and axon, and the muscle
fibers innervated by its axonal branches 8. Once a motor neuron discharges an
electrical potential, it goes toward the neuromuscular junctions and generates action
potentials within the muscles fibers. In literature, the summation of muscle fibers’
activity in the motor unit is referred to as motor unit action potential.
1.2.1 How electromyography has been used in the literature of
human postural control?
Surface and intramuscular EMG. EMGs are usually collected from electrodes
positioned on the skin region over the muscle (surface electromyography) or
inserted in the muscle tissue (intramuscular electromyography). Both techniques
1.2 EMG and the control of standing balance 3
provide different advantages. On one hand, intramuscular electromyography has
high selectivity for individual motor unit action potential in relation to surface
electromyography, since intramuscular electrodes (e.g., needles or wires) are
inserted close to the muscle fibers 9. The action potentials of single motor units
therefore can be easily observed from intramuscular EMGs, at least at moderate
force levels (cf. Figure 1 in 10). Then, intramuscular electrodes are often used to
measure motor unit activity. On the other hand, detection systems for the
acquisition of surface EMGs are expected to provide a more representative view of
muscle activity, since surface electrodes sample from a larger muscle volume than
intramuscular electrodes. The surface EMG signal normally conveys many action
potentials from a population of active motor units 10. Due to its non-invasiveness,
surface EMG rather than intramuscular EMG has been broadly used in the
literature. Recently, a methodological issue in the acquisition of surface EMGs for
the understanding of active control of posture consists in how to use different
detection systems for the sampling of surface EMG from postural muscles.
Recent findings from high-density surface EMG to bipolar surface EMG. A
single pair of surface electrodes has been typically used for the sampling of EMGs
from individual muscles 11–15. Briefly, this acquisition procedure consists in: (1)
determining and amplifying the voltage (potential difference) between the signal
detected from surface electrodes and the reference electrode by a device, known as
differential amplifier; (2) filtering such differential signal to attenuate possible
undesired frequency components (e.g., 50 or 60 Hz) and converted into digital
voltages values to be stored on a computer; (3) finally, surface EMGs are processed
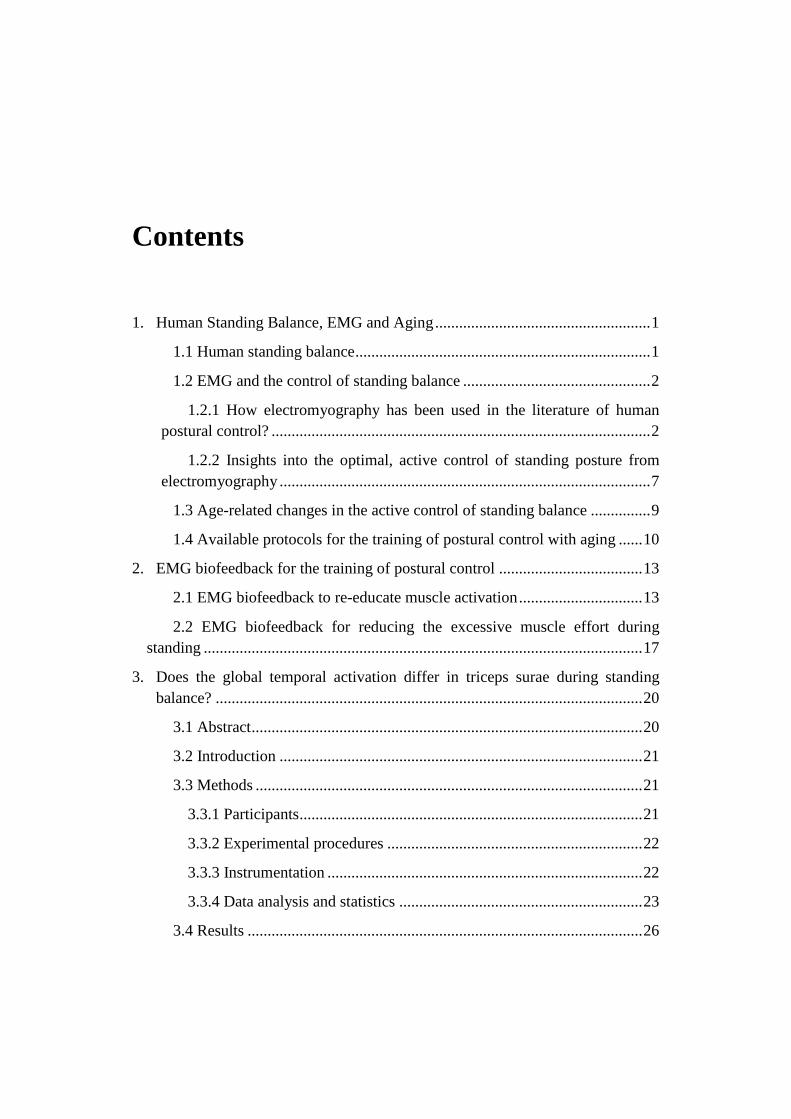
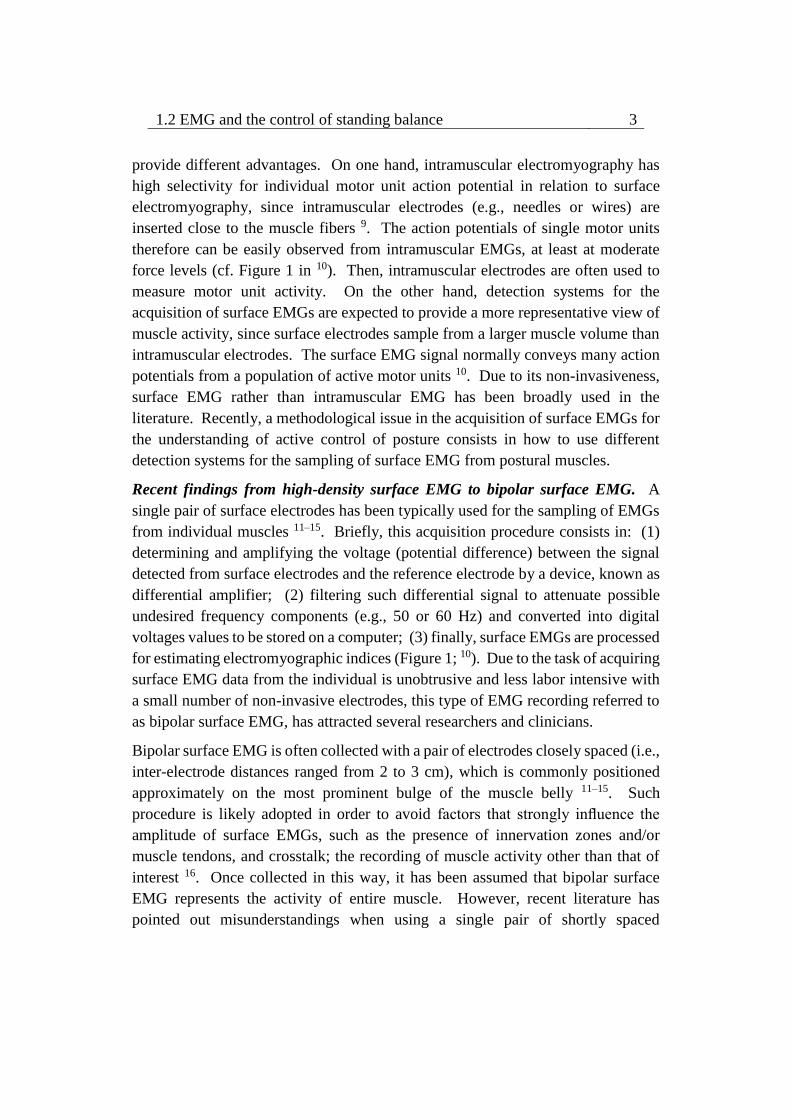
for estimating electromyographic indices (Figure 1; 10). Due to the task of acquiring
surface EMG data from the individual is unobtrusive and less labor intensive with
a small number of non-invasive electrodes, this type of EMG recording referred to
as bipolar surface EMG, has attracted several researchers and clinicians.
Bipolar surface EMG is often collected with a pair of electrodes closely spaced (i.e.,
inter-electrode distances ranged from 2 to 3 cm), which is commonly positioned
approximately on the most prominent bulge of the muscle belly 11–15. Such
procedure is likely adopted in order to avoid factors that strongly influence the
amplitude of surface EMGs, such as the presence of innervation zones and/or
muscle tendons, and crosstalk; the recording of muscle activity other than that of
interest 16. Once collected in this way, it has been assumed that bipolar surface
EMG represents the activity of entire muscle. However, recent literature has
pointed out misunderstandings when using a single pair of shortly spaced
4 Human Standing Balance, EMG and Aging
electrodes, for example, to estimate the activity of muscles which play a
predominant postural role.
Figure 1: Simplified block diagram for the acquisition of bipolar surface EMG. The
main steps for the acquisition of bipolar EMGs are: (1) detection and amplification of
differential, bipolar surface EMG signals; (2) filtering and converting into digital voltage
values; (3) signal processing to compute electromyographic indices or features.
The majority of muscles which have a postural role are large and pennate in-depth
direction. For example, the fascicles of gastrocnemius and biceps femoris muscles
are extended from the superficial to deep aponeurosis 17–19. This muscle
architecture implies the muscle fibers are not parallel to the skin and, consequently,
action potentials do not propagate along the muscle. Action potential propagates
toward the superficial aponeurosis and toward the deep aponeurosis, starting from
the position of innervation zone. Then, a single pair of shortly spaced electrodes
positioned over pennate muscles likely records surface EMG from a local muscle
region. High representativeness of pennate muscles’ activity from a couple of
electrodes closely spaced depends on previously knowledge whether a localized
muscle region (e.g., muscle belly) is activated during a given a task, e.g. standing.
Different regional patterns of activity within postural muscles (e.g., gastrocnemius),
however, have been observed while subjects stand at ease. Such an uneven
distribution of activity in the muscle have been usually appreciated from
sophisticated detection systems based on multiple surface electrodes. High-density
surface EMG is the general terminology used to indicate the sampling of multiple
surface EMGs from a single muscle 10. By collecting surface EMGs from different
1.2 EMG and the control of standing balance 5
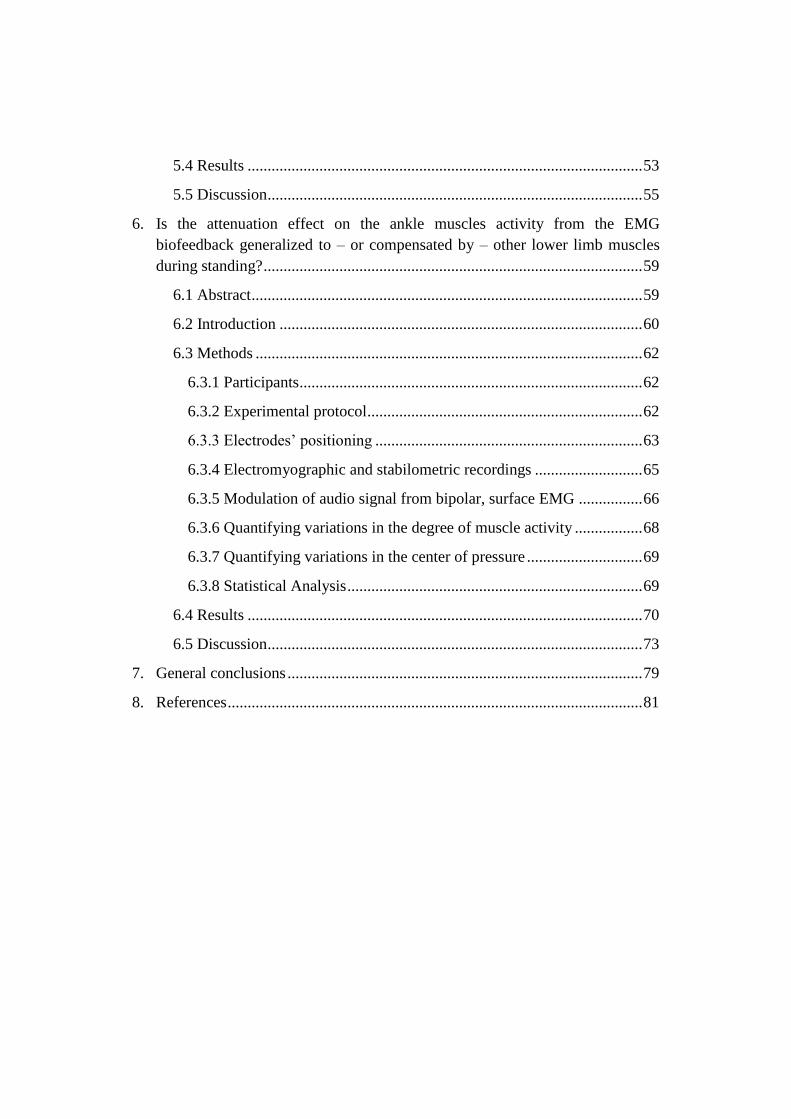
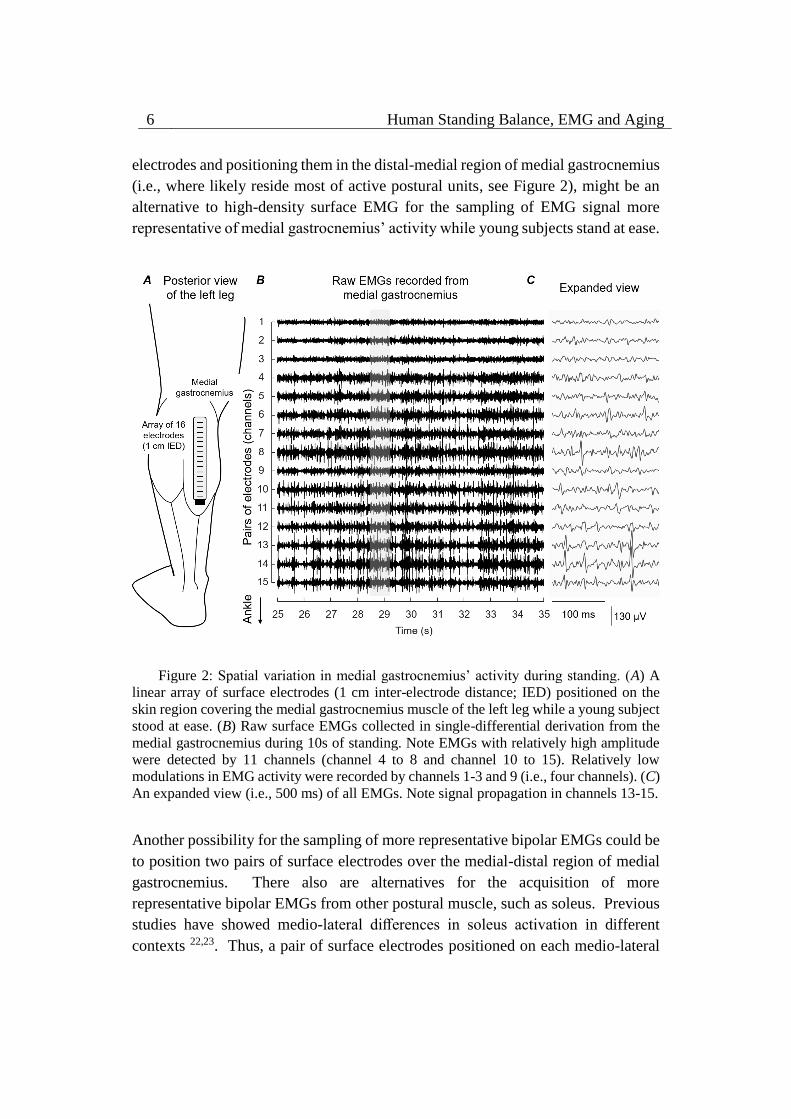
portions along the longitudinal axis of medial gastrocnemius with a linear array of
surface electrodes (Figure 2A), for example, it is possible to observe the spatial
variation in medial gastrocnemius’ activity while a young subject stood at ease.
More specifically, raw surface EMGs with relatively high amplitude were detected
in the distal-medial region of medial gastrocnemius (channels 4-15) while EMGs
with relatively low amplitude were sampled by channels 1-3 (Figure 2B). Close
inspection of figure 2C shows that different action potentials were detected from
different channels in the array. Once fascicles are orientated more parallel to the
skin closer to the junction between medial gastrocnemius and Achilles tendon,
propagating potentials may be observed in the distal region of this muscle. In such
case, most distal electrodes (i.e., channels 13-15) sample from the same group of
fibers rather than from different proximo-distal fibers 20. Actions potentials detected
by other channels in the array, thus, likely belong to different motor units. By
comparing multiple intramuscular and surface EMGs sampled from different
regions of gastrocnemius muscle, Vieira et al. 17 have demonstrated that the active
motor units within gastrocnemius while subjects stand at ease likely occupy small
territories along the muscle’s longitudinal axis (~4cm), suggesting that surface
EMG recordings are selective to reveal spatial variations in gastrocnemius’ activity.
Moreover, these authors detected a greater amount of active motor units in the
distal-medial muscle portion compared with the proximal region. Likewise, by
collecting surface EMGs from multiple gastrocnemius’ regions with an array of
surface electrodes, Hodson-Tole et al. 20 observed that gastrocnemius’ postural
motor units tend to be localized more distally (i.e., ~above the most distal part of
gastrocnemii junction). On one hand, based on these evidences, one could argue
that a couple of electrodes, not closely spaced, could provide bipolar EMG
representative of medial gastrocnemius’ activity during standing if positioned on
the distal-medial regions of this muscle. On the other hand, a couple of electrodes
shortly spaced would not suffice for the sampling of representative EMG activity
from postural muscles, e.g. gastrocnemius. High-density surface EMGs seems to
provide therefore more representative view of muscle activity in pennate muscles.
Are there alternatives for the acquisition of representative bipolar EMGs? Of
more recent and applied interest is the notion of possible alternatives for the
acquisition of bipolar EMGs which provide more representative estimates of
postural muscles’ activation. For example, the increase in the distance between the
couple of electrodes. By combining surface and intramuscular electromyography,
from a preliminary study, Vieira et al. 21 observed inter-electrode distances up to 5-
7 cm may provide bipolar EMGs representative of medial gastrocnemius’ activity
with negligible soleus crosstalk. Then, increasing the distance between a couple of
6 Human Standing Balance, EMG and Aging
electrodes and positioning them in the distal-medial region of medial gastrocnemius
(i.e., where likely reside most of active postural units, see Figure 2), might be an
alternative to high-density surface EMG for the sampling of EMG signal more
representative of medial gastrocnemius’ activity while young subjects stand at ease.
Figure 2: Spatial variation in medial gastrocnemius’ activity during standing. (A) A
linear array of surface electrodes (1 cm inter-electrode distance; IED) positioned on the
skin region covering the medial gastrocnemius muscle of the left leg while a young subject
stood at ease. (B) Raw surface EMGs collected in single-differential derivation from the
medial gastrocnemius during 10s of standing. Note EMGs with relatively high amplitude
were detected by 11 channels (channel 4 to 8 and channel 10 to 15). Relatively low
modulations in EMG activity were recorded by channels 1-3 and 9 (i.e., four channels). (C)
An expanded view (i.e., 500 ms) of all EMGs. Note signal propagation in channels 13-15.
Another possibility for the sampling of more representative bipolar EMGs could be
to position two pairs of surface electrodes over the medial-distal region of medial
gastrocnemius. There also are alternatives for the acquisition of more
representative bipolar EMGs from other postural muscle, such as soleus. Previous
studies have showed medio-lateral differences in soleus activation in different
contexts 22,23. Thus, a pair of surface electrodes positioned on each medio-lateral
1.2 EMG and the control of standing balance 7
portion of soleus (i.e., the soleus portions which are not covered by gastrocnemius
heads) could be relevant to detect a more representative view of soleus activity in
case of possible spatial differences in activity within soleus.
These alternatives for the acquisition of more representative bipolar surface EMGs
from ankle muscles with a parsimonious system of electrodes likely have potential
implications in rehabilitation and training protocols. Systems for the acquisition of
bipolar EMGs has been widely used, for example, as the core of a technique known
as EMG biofeedback which is used to re-educate muscle activation 24,25. Such
technique has been recently proposed for the training of postural control (see
Chapter 2). The knowledge and the possibility of sampling bipolar EMGs reflecting
as much as possible the activation in the muscle as a whole seem to be crucial to
avoid a biased view of muscle activity. Even though current issues from high-
density surface EMG to bipolar surface EMG presented here, both techniques have
provided insights into the understanding of human postural control.
1.2.2 Insights into the optimal, active control of standing posture
from electromyography
Applications involving electromyography in the literature of human postural
control generally consist in investigating: (i) which and how muscles are activated
during standing; (ii) the mechanisms underpinning the control of standing posture;
(iii) the effect of age and dementias on the postural muscles’ activity during
standing; (iv) the effect of training programs on postural activity. The priceless
information obtained from these applications have drawn attention to a paradigm
of optimal, active, control of standing balance; body stabilization with minimal
muscle effort. The following lines summarize the studies that have indicated
potential sources leading to such paradigm.
For more than fifty years, studies have demonstrated that specific muscles seem to
contribute actively for the maintenance of standing balance. By sampling bipolar
EMGs from different lower limbs muscles while young subjects stood at ease,
Joseph et al. 7 observed clearly action potentials (amplitude ranged from 50 to 100
µVpp) for the gastrocnemius and soleus muscles while for the thigh muscles (i.e.,
quadriceps and hamstrings), modulations in the amplitude of surface EMGs were
usually close to the noise level (2 µVpp). Even though Joseph et al. 7 have reported
marginal contribution of thigh muscles for standing balance, recent studies have
detected somewhat high degree of thigh muscles’ activity while young subjects
stood at ease 14 and observed that such degree seems to increase progressively with
8 Human Standing Balance, EMG and Aging
aging 11. Extending the previous results, Heroux et al. 26 observed the calf muscles
contributed differently while subjects stood at ease, in particular gastrocnemius’
heads. By collecting intramuscular EMGs from gastrocnemius’ heads (medial and
lateral) and soleus muscle of seven subjects, these authors rarely observed motor
units’ activity in lateral gastrocnemius, while motor units’ activity was identified
within the medial gastrocnemius and soleus muscles. A forward lean on the verge
of eliciting a step response was required to elicit moto units’ activity in lateral
gastrocnemius. Collectively, these findings demonstrate that the active
contribution of calf muscles is crucial for the control of standing balance.
Besides evidences on a substantial degree of calf muscles’ activity, studies have
observed calf muscles are recruited intermittently in the standing posture. By
collecting intramuscular EMGs from different regions along the longitudinal axis
of medial gastrocnemius, Vieira et al. 27 showed that the active contribution of
medial gastrocnemius to the ankle torque in standing was preferentially due to the
intermittent recruitment of motor units. The intermittent motor units’ recruitment
occurred with a modal interval of ~500 ms, i.e. two recruitments per second. These
two adjustments per second are consistent with tiny alterations in gastrocnemius
and soleus movements for the compensation of the bodily forward sways. Loram
et al. 28 observed that gastrocnemius and soleus active movements are orthodox,
impulsive and sluggish (~400 ms) during standing balance. Regardless of potential
sources account for such intermittent calf muscles’ activation, e.g. internal planning 28 or event-triggered 29, timely postural activation reflects an efficient, active control
of standing balance by the central nervous system.
The insights that normal population activates efficiently, not continually and
intensely, their postural muscles during standing is congruent with the recent notion
that the control of posture is primarily concerned with minimizing muscle
activation. Recent studies have drawn attention to alternating periods of muscle
activation and silencing (i.e., intermittent open loop control) seem to be a natural
strategy of choice adopted by the central nervous system due to potential benefits:
(1) allow the nervous system to sense joint angles without interference from muscle
contraction 30; (2) compensate for delays in the feedback loop 31; (3) reduce
metabolic costs 29; (4) not increase postural instability 31. As recently put forward
in the literature, postural control system seems to prioritize the minimization of
muscle activation at the cost of increased, though not excessive, postural sways 32.
In the view of optimal postural controller based on minimal muscle effort, learning
to efficiently activate the postural muscles could be advantageous for the control of
1.3 Age-related changes in the active control of standing balance 9
posture in individuals who stand with excessive muscle activation, e.g. elderly
subjects.
1.3 Age-related changes in the active control of standing
balance
Of recent interest is the notion of age-related alterations in postural muscles’
activity during standing. From bipolar surface EMGs collected from the plantar
flexors, previous studies have reported the elderlies tend to stand with a more
continuous and higher degree of activation than young individuals. Moreover,
while tibialis anterior is typically silent in young subjects during standing 33,34, in
aged individuals it is often recruited 14. Then, changes in the level of
agonist/antagonist ratio have been often observed with aging. Benjuya et al. 11, for
example, collecting bipolar surface EMGs from soleus and tibialis anterior muscles,
observed the soleus/tibialis anterior activity ratio was significantly lower for the
aged subjects when compared with the young individuals during standing,
suggesting increases in the level of muscle cocontraction at the ankle in the elderly.
Besides the differences in the ankle muscles’ activity, the contribution of thigh
muscles for standing balance seems to change with aging. By collecting surface
EMGs locally from thigh muscles, Laughton et al. 14 observed aged subjects
activated for a longer duration the vastus lateralis than young individuals during
standing. Alternatively, Benjuya et al. 11 detected a higher degree of
semitendinosus’ activity (hamstring) while elderly individuals stood at ease with
respect to young subjects. Collectively, the higher degree of calf and thigh muscles’
activity for a prolonged duration in aged than young subjects suggest standing
becomes progressively more demanding with aging.
The excessive muscle effort may be detrimental for postural control in the old age.
As discussed previously, some ankle muscles are rarely activated while young
subjects stand at ease (e.g., tibialis anterior). Such muscle silencing, however,
seems to indicate the tibialis anterior plays a proprioceptive role for the control of
standing balance. By recording EMG signals and ultrasound images during
standing, Di Giulio et al. 33 revealed that changes in muscle length of tibialis anterior
was markedly associated with alterations in the ankle joint angle, suggesting tibialis
anterior may have an important, passive, postural role; it may be a better source of
proprioceptive information than active muscles in the standing posture (e.g., calf
muscles). The insight that silent muscles may have a strong proprioceptive role
during standing implies aged subjects, when activating intensely their dorsal and
plantar flexors for a long duration, are predicted to sense postural sway with
10 Human Standing Balance, EMG and Aging
interference from muscle contraction 30. Prior account, indeed, has reported lower
efficacy of proprioceptive pathway in aged than young subjects for the control of
standing balance 35. Besides a less economical, fatigue-resistant control 36,
excessive muscle activity during standing might compromise the sensitivity of
proprioceptive feedback for the control of posture. Therefore, the pattern of muscle
activation should be considered in the repertoire of protocols so far designed for the
improvement of postural control to understanding whether aged subjects are able to
activate more efficiently their postural muscles during standing.
1.4 Available protocols for the training of postural control
with aging
Generally, declines in the control of posture with aging has long been indicated due
to the high incidence of falls; a major health problem for the elderly. Falls in elderly
people have resulted in serious, different types of fractures (e.g., hip fractures) and
physical injuries. Then, fall-related hospitalization is particularly common in this
population 37–39. Besides to cause individual morbidity, researchers have also
stressed that falls can lead to declines in independence of activities of daily life and
placement in assisted-living facilities, having potential impacts in the life of people
65 years and older 40,41.
Age-related alterations in the neuromuscular and sensory systems have been
thought to contribute to an increased likelihood for falls. Briefly, advancing age
has been associated with: (i) reductions in ankle muscle strength 42; (ii) slow
muscle response when compensating for sway perturbations 43,44; (iii) excessive
ankle muscle coactivation for standing 11–13; and (iv) declines in function within
sensory systems 45. Such changes in the postural control systems lead to increases
in the size of postural sway while aged subjects stand upright 45,46. Increases in the
amplitude of body sways might compromise upright balance and can lead to falls 47,48. Thus, several training programs have been proposed primarily to preserve
and/or reduce postural sway within functional levels. These training programs are
usually referred to as balance training. Some examples of balance training are
shown as follows:
One or two legged exercises on unstable support surfaces. Conventional balance
training focus on challenging body stability while individuals stand on unstable
support surfaces with one or two legs 49. Different training devices are used as
unstable support surfaces, such as wobbling boards, tilt boards, spinning tops, half
discs, soft mats and cushions (cf. Figure 1 in 50). An alternative to these training
1.4 Available protocols for the training of postural control with
aging
11
devices is keeping the balance control on a tightened ribbon, sport activity known
as “slacklining”. Studies have shown balance training with unstable support
surfaces leads to reductions in the amplitude of postural sway. For example, by
applying the balance training based on single limb stance on an ankle disk in
athletes who swayed excessively due to ankle joint injury, Gauffin et al. 51 observed
that these subjects were able to reduce the size of their postural sway (~3 mm) while
standing on the symptomatic foot, suggesting an improved body stability after this
training. Keller et al. 52 observed individuals who attended slackline training could
decrease their postural sways while standing on a free-swinging platform with one
leg and maintain balance on the slackline for at least 20 s after training. Elderly
subjects were also able to reduce the amount of postural sway following a balance
training program 53.
Besides reductions in the postural sway size, balance training exposing individual
to unstable support surface may: (i) increase the muscle strength 53; (ii) improve
jumping abilities 54; (iii) increase maximal rate of force development 55; and (iv)
decrease the level of ankle muscles’ activity during standing 53,56. Then, this type
of training is also frequently used in prevention and rehabilitation of the lower limb
muscles, e.g. in athletes. More recently, studies have indicated this type of balance
training induces plasticity of the sensory-motor pathways 49,53, contributing likely
for a more efficient control of posture by means of reduction in the neural drive to
the muscle.
Human bodily practices. The effects of human bodily practices as martial arts (e.g.,
Tai Chi and Qigong) and Yoga on aged postural control has been recently
investigated in literature, since they demand the performance of several postures
with relatively slow, meditative, dance-like movements during standing (for a
review see 57,58). Prior accounts have reported aged subjects who practice these
types of “standing meditation postures” may improve their balance skills and,
consequently, they are less likely to falls 59–61. For example, Li et al. 60 observed
the Tai Chi training was more promising to reduce fall risk with respect to stretching
training. More specifically, these authors reported a small number of falls, injurious
falls and reduced fear of falling after 6-month in elderly subjects who attended Tai
Chi training than those following stretching training. In addition, Tai Chi group
obtained greater score in Berg Balance Scale than stretching group; this result
suggests Tai Chi contributed for improvements of balance skills in different
functional tasks. Additionally, a recent study observed Tai Chi training may be
effective to reduce the size of postural sway during standing (Sheng et al., 2014).
12 Human Standing Balance, EMG and Aging
On the view of decrease risk for falling and improvements of balance skills, human
bodily practices (e.g., Tai Chi, Qigong and Yoga) have been indicated as promising
training of postural control 62.
Biofeedback of postural sways. Motor tasks based on the precise control of body
position in space from the feedback of variables related to human motion have been
proposed recently as a promising component in balance training programs. More
specifically, biofeedback techniques for balance training involve typically the
acquisition of variables related to balance performance (e.g., joint angles, trunk
acceleration or the position of body center of pressure) and feed back to the subject,
allowing thus individuals to have an augmented information about their own body
sways and control them voluntarily 63,64. Among available biofeedback-based
balance training, information can be displayed back to the subject from different
modalities, such as audio or visual 63,65. The protocol which is widely used in
rehabilitation programs is the visual feedback of center of pressure (CoP) position
while individuals stand at ease 66. From the visualization of CoP signal, subjects
are expected to reduce their postural sways during standing 67. More specifically,
force plates are often used for the quantification of CoP position during standing
(i.e., the resultant vector of ground reaction forces under the feet; 47). With aging,
individuals who attended training programs related to CoP visual biofeedback could
learn to maintain upright stability with smaller body sways 66,68. Reductions in the
size of postural sway were also achieved by the elderly from wearable systems for
body motion-based audio biofeedback 69,70. Most importantly, although not very
clear, improvements in balance performance after the biofeedback-based training
protocols likely reflect in a reduced incidence of falls. Significant effect of the
visual feedback-based balance training compared with control group was observed
on recurrent falls (8% vs 55% of falls) during a 1-year follow up period as well as
a reduced risk of falling 71.
Recently, an alternative biofeedback approach based on biological-related signals,
i.e., surface EMGs, has been proposed for balance training 72. On the view of
optimal postural control based on minimal muscle effort and the potential impact
of EMG biofeedback technique in reducing the excessive muscle activity, EMG
biofeedback-based balance training is a promising approach for the improvement
of postural control and, consequently, prevention of falls in the elderly. The
following chapter provides brief overview about the significant effects of EMG
biofeedback on the pattern of muscle activity of aged and young subjects in
different contexts, besides its potential impact in reducing the unnecessary muscle
effort while individuals stand at ease.
2.1 EMG biofeedback to re-educate muscle activation 13
Chapter 2
EMG biofeedback for the training
of postural control
2.1 EMG biofeedback to re-educate muscle activation
Biofeedback technique has been applied since at least the 60s, to train and/or allow
subjects to control biomechanical or biological variables which are not under direct
control 66,73. On one hand, biomechanical biofeedback is related to variables of
body motion (e.g., joint angle or CoP position), which are commonly used for
balance training, as discussed previously (see chapter 1, subsection 1.4). On the
other hand, biological-related variables include, for example, the electrical activity
of muscles (e.g., bipolar surface EMG), brain and heart 73. Several researchers have
reported the EMG biofeedback is a promising technique to suppress the excessive
level of agonist activity or muscle coactivation 74–76, with potential implications for
the improvement of postural control in terms of muscle efficient, e.g. with aging.
One of pioneers in suggesting biofeedback as potential tool for the training of
muscle activity was Basmajian et al. 77, testing a biofeedback protocol for the
training of single motor units within a hand muscle. By sampling intramuscular
EMGs from a hand muscle (i.e., abductor pollicis brevis) and feed back them to the
subject in the form of auditory or visual signals, the author reported volunteers were
able to learn how to: (i) repress the activity of a single motor unit and recruit another
one; (ii) recruit the several units over which they have gained control; (iii) reduce
14 EMG biofeedback for the training of postural control
and increase the discharge frequency of a well-controlled unit. After biofeedback
training, most participants learnt to control the activity of individual motor units
even in the absence of feedback. From these evidences, several researchers have
widely accepted the idea of using biofeedback technique to assist subjects with
impaired motor control in recovering the normal pattern of muscle activity 78.
Bipolar surface EMG rather than intramuscular EMG, however, are often used
within the designs of EMG biofeedback techniques due to its non-invasiveness and
simplest form to detect surface EMGs.
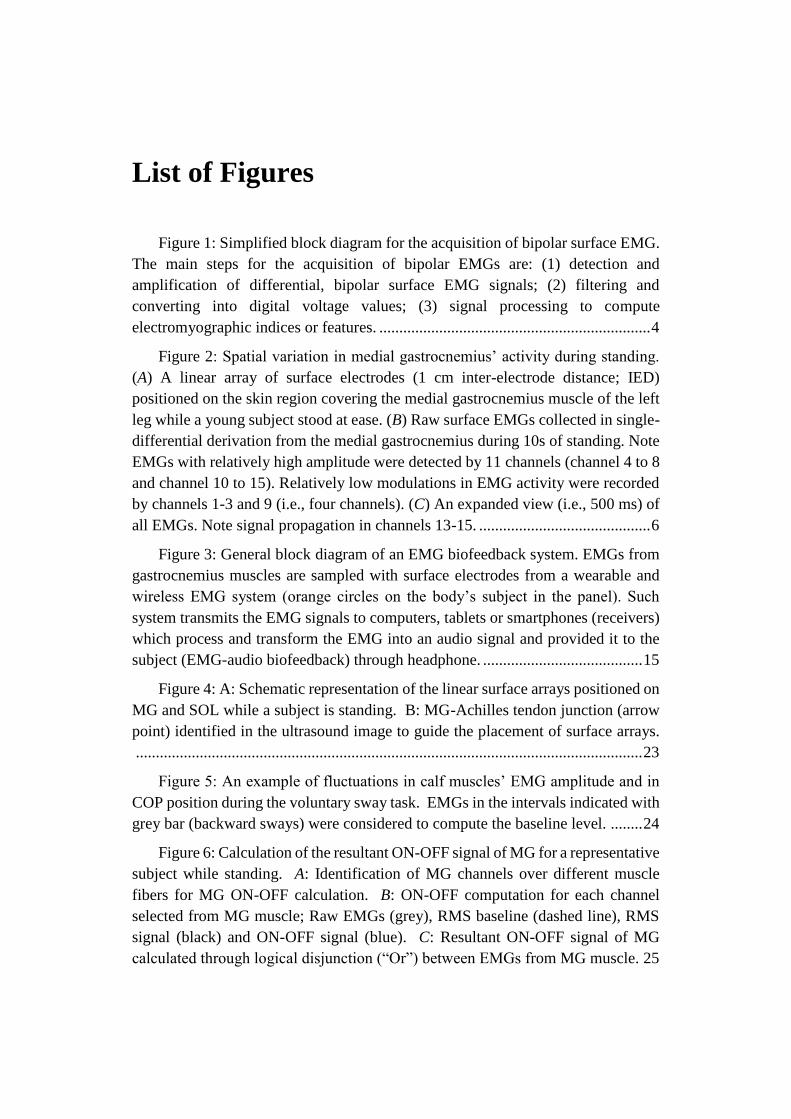
Briefly, EMG biofeedback design involves typically three technical stages to
transmit feedback based on surface EMGs to the subject: (1) the sampling of EMG
signal from a couple of surface electrodes; (2) the estimation of the level or timing
of muscle activity (i.e., descriptive signal of raw surface EMG); (3) the
representation of this signal to the subject through audio, visual or vibration cues
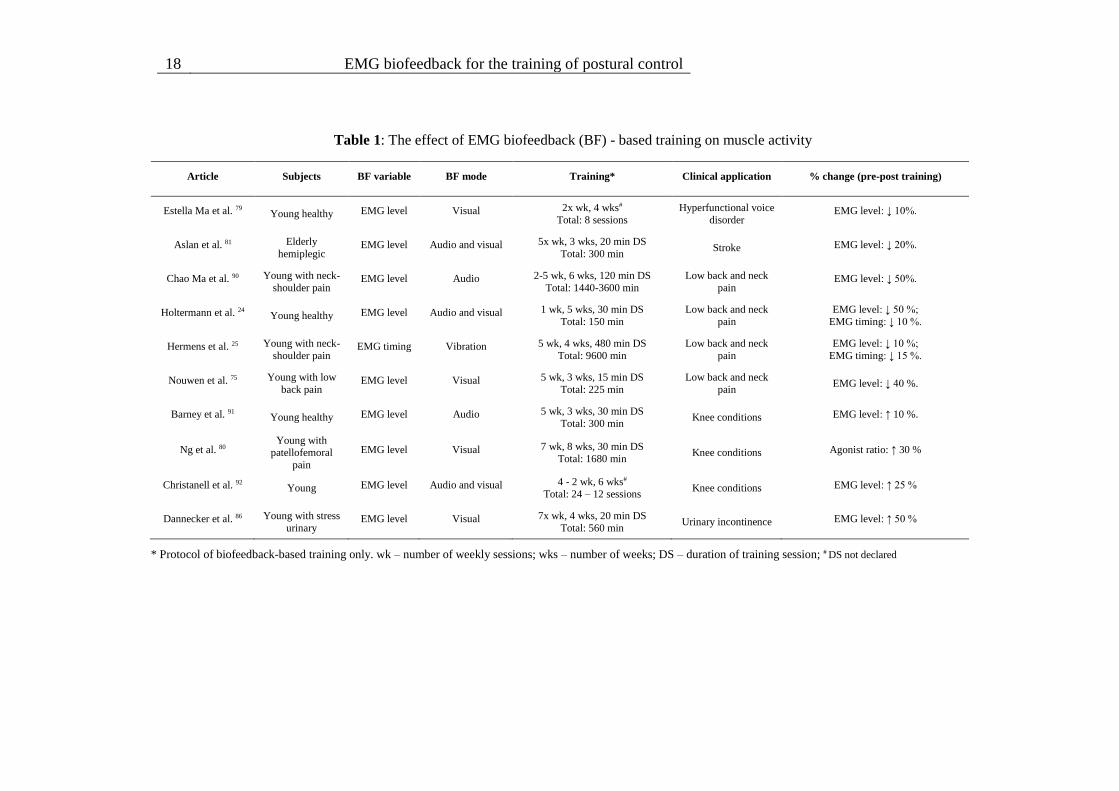
(Figure 3). From table 1, for example, it is possible to observe that studies have
commonly monitored the EMG level and feed back it to the subject from audio
and/or visual modality. More recent biofeedback techniques, as shown in Figure 3,
use wireless EMG devices to transmit bipolar surface EMGs to receivers such as
notebook, tablet or smartphone. Within the receiver, the targeted information is
processed and transmitted to the subject as biofeedback. These sophisticated and
wearable EMG devices are thought to have a relevant potential for rehabilitation or
training programs. Once these recent EMG systems are based on surface EMG
recording and easy to use software to acquire and provide biofeedback information
to the subject, biofeedback protocols can be easily implemented in the community
setting, and potentially in patients’ homes, contributing for a more frequent training.
In addition, the task of providing EMG biofeedback information to subjects is less
time consuming and less intrusive.
When using biofeedback techniques to continuously detect and provide real-time
information about muscle activity to the subject, the main goals are (i) attenuation
of unnecessary muscle activity and (ii) muscle activity facilitation 25,79,80. From
table 1, it is possible to appreciate the multiple pathologies the biofeedback
techniques have been tested on. For instance, the EMG biofeedback has been
effective to directly assist patients with chronic low back pain in reducing the
excessive level of paraspinal activity during standing 75. By providing the visual
feedback of erector spinae’ activity, collected from a pair of surface electrodes, to
the patients within 15 treatment sessions spread over a period of three weeks,
Nouwen 75 observed these patients were able to stand with relatively low levels of
paraspinal activity after biofeedback training. Alternatively, reductions in the level
2.1 EMG biofeedback to re-educate muscle activation 15
of muscle activity at wrist joint were also observed in stroke patients following an
EMG biofeedback training. Aslan et al. 81 applied 15 sessions of biofeedback
training, lasting 20 minutes each one, aimed at reducing wrist flexor muscle
spasticity at the hemiplegic arm in patients following stroke. The authors observed
lower level of wrist flexors’ activity of about 20% after training with respect to
baseline measurements.
Figure 3: General block diagram of an EMG biofeedback system. EMGs from
gastrocnemius muscles are sampled with surface electrodes from a wearable and wireless
EMG system (orange circles on the body’s subject in the panel). Such system transmits the
EMG signals to computers, tablets or smartphones (receivers) which process and transform
the EMG into an audio signal and provided it to the subject (EMG-audio biofeedback)
through headphone.
Excessive muscle activity has also been attenuated when individuals are informed
about the timing of muscle activity during a given task. By providing feedback
when the level of muscle activity was higher than a threshold for a given duration,
Hermens et al. 25 observed individuals with neck-shoulder myalgia were able to
relax more frequently their trapezius muscles of about 15% after training with
respect to pre-training during working conditions. These results suggest patients
with different clinical conditions could learn to attenuate their muscle activity
through the EMG biofeedback-based training. EMG biofeedback may also have
16 EMG biofeedback for the training of postural control
the potential to facilitate the level of activity in individual muscles. For example,
Ng et al. 80 compared the EMG ratio of vastus medialis/vastus lateralis between an
exercise group and an EMG biofeedback+exercise group. The biofeedback
protocol proposed by Ng et al. 80 aimed at assisting subjects to perform different
exercises while increasing the level of activity in vastus medialis and maintaining
a constant level of vastus lateralis’ activity. These authors reported increases in the
vastus medialis/vastus lateralis EMG ratio of about 30% after training.
Collectively, these results indicate EMG biofeedback as potential tool to re-educate
muscle activity.
Possible mechanisms may underpin the effectiveness of EMG biofeedback in
alternating muscle activity. Two hypotheses come from the experiments of
Basmajian 77 who observed subjects can recall voluntarily the activity of different
single motor units while inhibiting the activity of neighbors after EMG biofeedback
training. Basmajian 82 speculated either new pathways or auxiliary feedback
pathways can be recruited following the EMG biofeedback training. Favoring the
latter hypothesis, Wolf 83 suggested that the primary role of EMG biofeedback
might be to activate central synapses previously unused or underused in executing
motor commands. These potential sources accounting for the effectiveness of EMG
biofeedback are still considered in recent literature (Huang et al. 2006). Regardless
of possible mechanisms underpinning the effect of EMG biofeedback on muscle
activation, subjects may be able to change their pattern of muscle activity through
this technique.
Notwithstanding reductions/increases in muscle activity from the EMG
biofeedback, it is not clear whether such changes in the muscle activity are retained
after training. A common question raised by researchers is “Are any benefits
maintained after biofeedback training ceases?”84. It seems well-accepted in
literature different biofeedback training programs may be effective to improve
muscle activity temporary, regardless of clinical application. The minimal training
volume showed in Table 1, for example, was that one of Holtermann et al. 24. More
specifically, participants involved in this study attended five sessions of unilateral
biofeedback training on trapezius activity during normal computer work at their
workplace was carried out. Holtermann et al. 24 observed this short EMG
biofeedback-based training was sufficient to reduce the degree as well as the timing
of trapezius activity in computers workers during normal work. However, the long-
term effect of the EMG biofeedback training is not commonly evaluated, e.g. for
reduction of pain intensity in fibromyalgia 85. Among the studies presented in table
1, only the studies of Hermens et al. 25 and Dannecker et al. 86 performed follow-up
2.2 EMG biofeedback for reducing the excessive muscle effort
during standing
17
measurement. For example, Hermens et al. 25 reported the attenuation effect of
EMG biofeedback was retained even after 4 weeks of EMG biofeedback training.
The results of Hermens et al. 25 reflect learning has taken place in addition to short-
term improvements in performance, with potential implications for rehabilitation
process 84. Therefore, it seems relevant to consider the assessment of retention
effect for determining the effectiveness of biofeedback protocols by means of
learning in different clinical applications.
2.2 EMG biofeedback for reducing the excessive muscle
effort during standing
EMG biofeedback has been recently proposed as alternative biofeedback technique
for the improvement of postural control in standing posture. Vieira et al. 72
investigated for the first time the influence of EMG-audio feedback protocol on the
ankle muscles’ activity during standing. With this feedback approach and in
relation to standing at ease, these authors observed young subjects were able to
decrease by 5% and 10% the degree of medial gastrocnemius and soleus activity,
respectively. Most importantly, such a reduced muscular effort did not lead to
larger postural sways and greater antagonistic activation (i.e., higher tibialis
anterior’s activity). These results reveal young individuals could attenuate the level
of ankle muscles’ activity, reflecting likely more efficient postural activation with
the EMG-audio feedback without hindering postural stability. Additional
investigations related to the effects of EMG biofeedback on postural activity,
however, might be relevant to prove the effectiveness of this technique in reducing
the level of postural activity during standing.
Researchers have long been indicated the assessment of response generalization of
EMG biofeedback should be considered, that is, the effect of EMG biofeedback on
muscles other than that included for biofeedback (i.e., targeted muscle) 87. For
example, Poppen et al. 88 stated “the biofeedback trainer should systematically
observe and record the postural changes that occur throughout the trainees’ body,
and not focus narrowly on the EMG signal from a particular muscle group”. The
main concern is whether the attenuation effect in an individual muscle from EMG
biofeedback is manifested at – or compensated by - other muscles during a given
task 89. Prior accounts have demonstrated that an attenuation effect and/or
compensation effect from EMG biofeedback protocols may occur between muscles
depending on the motor task. More specifically, the following effects have been
observed when the EMG biofeedback is provided from a single muscle: (i) the
18 EMG biofeedback for the training of postural control
Table 1: The effect of EMG biofeedback (BF) - based training on muscle activity
Article Subjects BF variable BF mode Training* Clinical application % change (pre-post training)
Estella Ma et al. 79 Young healthy EMG level Visual 2x wk, 4 wks#
Total: 8 sessions
Hyperfunctional voice
disorder EMG level: ↓ 10%.
Aslan et al. 81 Elderly
hemiplegic EMG level Audio and visual 5x wk, 3 wks, 20 min DS
Total: 300 min Stroke EMG level: ↓ 20%.
Chao Ma et al. 90 Young with neck-
shoulder pain EMG level Audio 2-5 wk, 6 wks, 120 min DS
Total: 1440-3600 min
Low back and neck
pain EMG level: ↓ 50%.
Holtermann et al. 24 Young healthy EMG level Audio and visual 1 wk, 5 wks, 30 min DS
Total: 150 min
Low back and neck
pain
EMG level: ↓ 50 %;
EMG timing: ↓ 10 %.
Hermens et al. 25 Young with neck-
shoulder pain EMG timing Vibration 5 wk, 4 wks, 480 min DS
Total: 9600 min
Low back and neck
pain
EMG level: ↓ 10 %;
EMG timing: ↓ 15 %.
Nouwen et al. 75 Young with low
back pain EMG level Visual 5 wk, 3 wks, 15 min DS
Total: 225 min
Low back and neck
pain EMG level: ↓ 40 %.
Barney et al. 91 Young healthy EMG level Audio 5 wk, 3 wks, 30 min DS
Total: 300 min Knee conditions EMG level: ↑ 10 %.
Ng et al. 80 Young with
patellofemoral
pain
EMG level Visual 7 wk, 8 wks, 30 min DS
Total: 1680 min Knee conditions Agonist ratio: ↑ 30 %
Christanell et al. 92 Young EMG level Audio and visual 4 - 2 wk, 6 wks#
Total: 24 – 12 sessions Knee conditions EMG level: ↑ 25 %
Dannecker et al. 86 Young with stress
urinary EMG level Visual 7x wk, 4 wks, 20 min DS
Total: 560 min Urinary incontinence EMG level: ↑ 50 %
* Protocol of biofeedback-based training only. wk – number of weekly sessions; wks – number of weeks; DS – duration of training session; # DS not declared
2.2 EMG biofeedback for reducing the excessive muscle effort
during standing
19
transfer of the attenuation effect to the contralateral muscle 24,93; (ii) limitation to
transfer the relaxation effect to not-synergistic muscles 93; and (iii) compensation
effect (i.e., increases in the level of activity) on other muscles not included in the
feedback during strictly controlled biomechanics conditions (i.e., isometric
shoulder abductions 94). These results suggest is relevant to consider the assessment
of effect generalization to prove the effectiveness of innovative biofeedback
protocols, e.g. in reducing the level of muscle activity during standing.
If EMG biofeedback is able to assist young individuals in more efficiently
controlling leg muscle activity, it could be a promising technique to recover muscle
activity within optimal levels in different populations or patients during standing.
For example, it is well-documented aged individuals activate their ankle and thigh
muscles to a greater extent and for a prolonged duration while stand at ease
compared with young subjects 11,12,14. With respect to healthy aged subjects,
parkinsonians show exacerbated ankle stiffness and muscle coactivation during
standing balance 95. In the case of individuals with excessive muscle activity learn
to control more efficiently their postural muscles from an EMG biofeedback-based
balance training, thus, improvement in the postural muscle efficiency could
contribute significantly to an ability to maintain standing balance, to respond to
unexpected perturbation, standing on narrow stances and walking; with potential
implication for the prevention of falls.
20 Does the global temporal activation differ in triceps surae during
standing balance?
Chapter 3
Does the global temporal activation
differ in triceps surae during
standing balance? 1
3.1 Abstract
One of the most important muscular groups which contribute to maintain standing
balance is triceps surae. However, it is unclear whether the muscles which
constitute the triceps surae, medial gastrocnemius and soleus, have different
temporal patterns of activation during upright stance. The work described in this
chapter aimed at evaluating whether the temporal activation differ among the
postural muscles of triceps surae in young subjects during standing. Nine male
volunteers performed two tasks: standing quietly and with voluntary back and
forward sways over their ankle. Electromyograms (EMGs) from soleus medial and
lateral regions and from MG were sampled with linear arrays of surface electrodes.
The percentage of muscle activation in time (i.e. temporal index) was computed for
each muscle during upright standing. The results revealed that the medial portion
1 Scientific paper published in “37th Annual International Conference of the IEEE Engineering
in Medicine and Biology Society”, 2015; Authors: Dos Anjos F, Fontanella F, Gazzoni M, Vieira
TM.
3.2 Introduction 21
of soleus muscle was activated continuously compared to the lateral portion of
soleus and medial gastrocnemius, which were activated intermittently. Therefore,
the global temporal activation differed among the postural muscles of triceps surae
during standing balance.
3.2 Introduction
Triceps surae activation is crucial for the control of human standing posture. As
the human center of gravity is projected anteriorly to the ankle joint, plantar flexors
must compensate the gravitational toppling torque to ensure standing balance 1,96–
98. Curiously, these agonist muscles seem to present distinct pattern of activation;
small portions of soleus (SOL) are continuously activated while those of medial
gastrocnemius (MG) are intermittently activated during upright stance 27,99,100.
Conversely, lateral gastrocnemius provides a marginal, active contribution to
standing maintenance 26,101. However, as intramuscular electrodes and bipolar
electrodes sample from a localized muscle region, it is unknown whether the
temporal activation between the main postural controllers of ankle, MG and SOL,
differs globally. In this context, the evaluation of different SOL and MG portions
may be essential to distinguish whether theses muscles are differently controlled by
the central nervous system (CNS) during standing balance. Action potentials
generated by different populations of motor units in a large calf muscle volume may
be sampled with an array of surface electrodes 17,20, allowing to investigate whether
the temporal pattern of activation observed locally for the SOL and MG during
upright stance represents a larger muscle volume. This study aimed at evaluating
whether the temporal activation estimated from a large muscle volume (i.e., global)
differs between the medial gastrocnemius and soleus muscles during standing
balance.
3.3 Methods
3.3.1 Participants
Nine male volunteers (mean±SD: 26±3 years; 72.33±9.43 kg body mass; 1.77±0.06
m height) provided written informed consent before participating in the study. All
procedures used in this study were in accordance with the Helsinki Declaration of
1975, as revised in 2000. These subjects did not report any balance impairment,
neurological disorders, muscular injuries or the intake of medications that could
affect their standing balance.
22 Does the global temporal activation differ in triceps surae during
standing balance?
3.3.2 Experimental procedures
Participants were instructed to stand upright on a force plate with their eyes open,
their arms alongside the body and their feet in parallel and comfortable position.
Previous evidence has shown a significant effect of intention on the standing control
mechanisms 102. As we wish to investigate the muscle activation during natural,
unconscious standing, subjects were engaged in active conversation to get
distracted from the task of controlling their standing body. Furthermore,
participants were also asked to sway as much as possible back and forward over
their ankles, without lifting their heels and toes. These standing tasks lasted 60s
and data acquisition was initiated and ceased upon the issuing of the auditory cues
“ready, go” and “stop”, respectively.
3.3.3 Instrumentation
Linear arrays of surface electrodes (10 mm inter-electrode distance) were placed on
MG and SOL muscles of dominant leg after carefully cleaning the skin with
abrasive paste 103. The positioning of electrodes on each muscle was guided
through ultrasound imaging (Telemed, Echo Blaster 128, 2 MHz to 10 MHz linear
probe). Specifically, for the MG muscle, EMGs were sampled with an array of 16
electrodes, placed along the length of MG, aligned with MG-Achilles tendon
junction and with its most proximal electrode positioned 2 cm distally from the
popliteal fossa (Figure 4). For the SOL muscle, a surface array of 4 electrodes was
placed on each muscle medial (MSOL) and lateral (LSOL) portions in order to
investigate different temporal pattern of activation. The medial and lateral arrays
were positioned at an angle of 45 degrees to the leg longitudinal axis and with their
most proximal electrode located 3 cm distally to the junction between MG and LG
and the Achilles tendon, respectively. Such array orientation may facilitate the
recording of small action potentials while standing and it is characterized by a high
signal-to-noise ratio 23.
EMGs were recorded in single-differential derivation with a multi-channel
amplifier (10-750 Hz bandwidth; EMG-USB, OTBioelettronica, Turin, Italy). All
signals were sampled at 2048 kHz using a 12-bit A/D converter (± 2.5 V input
dynamic range). EMGs were amplified by 5000-10000 to maximise signal-to-noise
ratio and then offline, band-pass filtered (cutoff frequencies: 15-350 Hz) with a
second order Butterworth filter. COP displacement was computed from the vertical
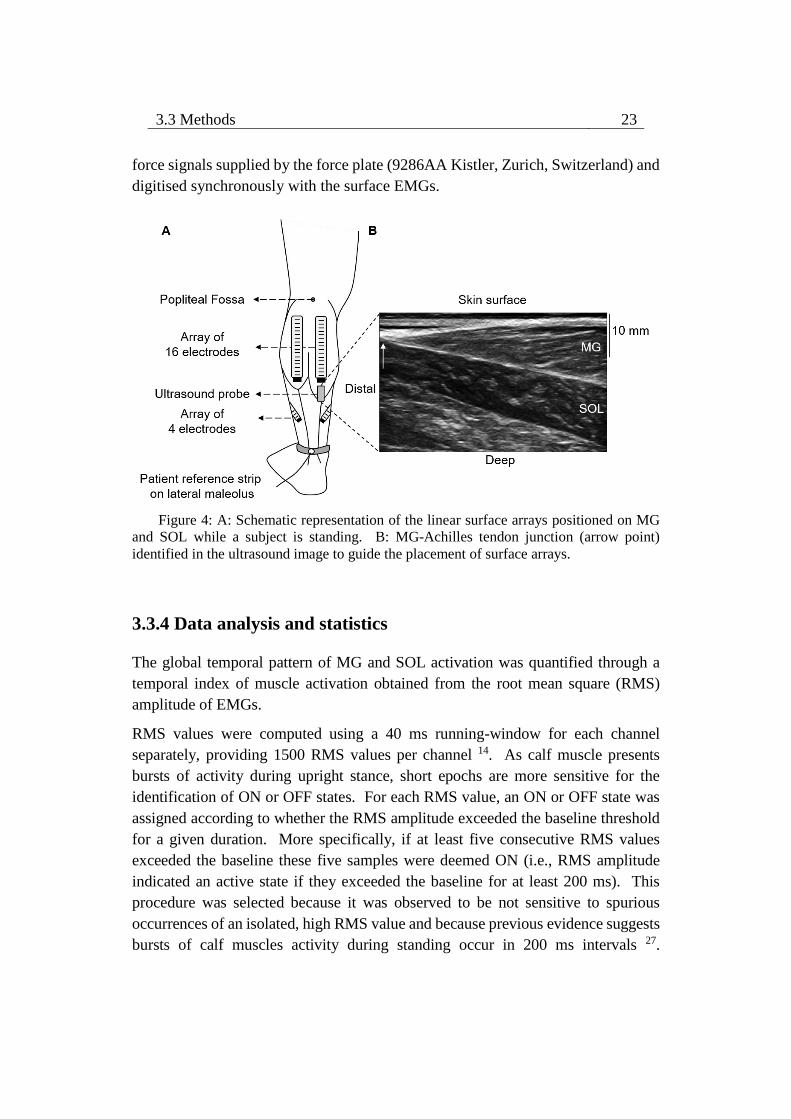
3.3 Methods 23
force signals supplied by the force plate (9286AA Kistler, Zurich, Switzerland) and
digitised synchronously with the surface EMGs.
Figure 4: A: Schematic representation of the linear surface arrays positioned on MG
and SOL while a subject is standing. B: MG-Achilles tendon junction (arrow point)
identified in the ultrasound image to guide the placement of surface arrays.
3.3.4 Data analysis and statistics
The global temporal pattern of MG and SOL activation was quantified through a
temporal index of muscle activation obtained from the root mean square (RMS)
amplitude of EMGs.
RMS values were computed using a 40 ms running-window for each channel
separately, providing 1500 RMS values per channel 14. As calf muscle presents
bursts of activity during upright stance, short epochs are more sensitive for the
identification of ON or OFF states. For each RMS value, an ON or OFF state was
assigned according to whether the RMS amplitude exceeded the baseline threshold
for a given duration. More specifically, if at least five consecutive RMS values
exceeded the baseline these five samples were deemed ON (i.e., RMS amplitude
indicated an active state if they exceeded the baseline for at least 200 ms). This
procedure was selected because it was observed to be not sensitive to spurious
occurrences of an isolated, high RMS value and because previous evidence suggests
bursts of calf muscles activity during standing occur in 200 ms intervals 27.
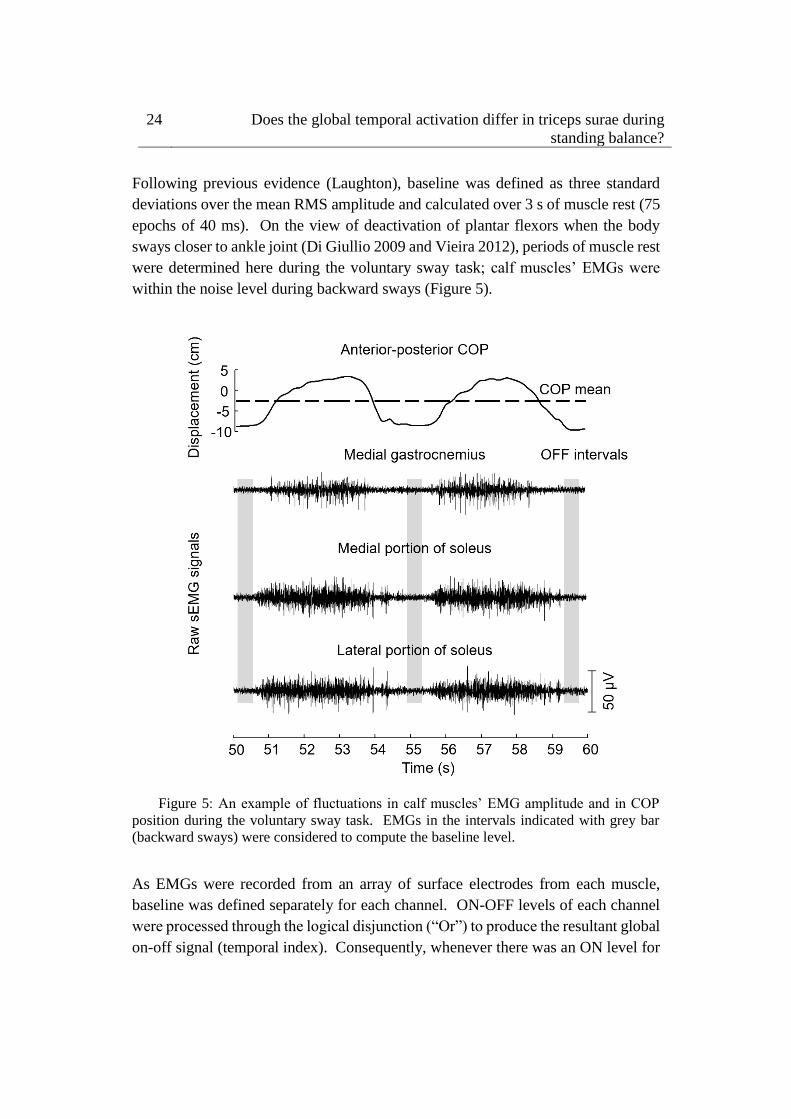
24 Does the global temporal activation differ in triceps surae during
standing balance?
Following previous evidence (Laughton), baseline was defined as three standard
deviations over the mean RMS amplitude and calculated over 3 s of muscle rest (75
epochs of 40 ms). On the view of deactivation of plantar flexors when the body
sways closer to ankle joint (Di Giullio 2009 and Vieira 2012), periods of muscle rest
were determined here during the voluntary sway task; calf muscles’ EMGs were
within the noise level during backward sways (Figure 5).
Figure 5: An example of fluctuations in calf muscles’ EMG amplitude and in COP
position during the voluntary sway task. EMGs in the intervals indicated with grey bar
(backward sways) were considered to compute the baseline level.
As EMGs were recorded from an array of surface electrodes from each muscle,
baseline was defined separately for each channel. ON-OFF levels of each channel
were processed through the logical disjunction (“Or”) to produce the resultant global
on-off signal (temporal index). Consequently, whenever there was an ON level for
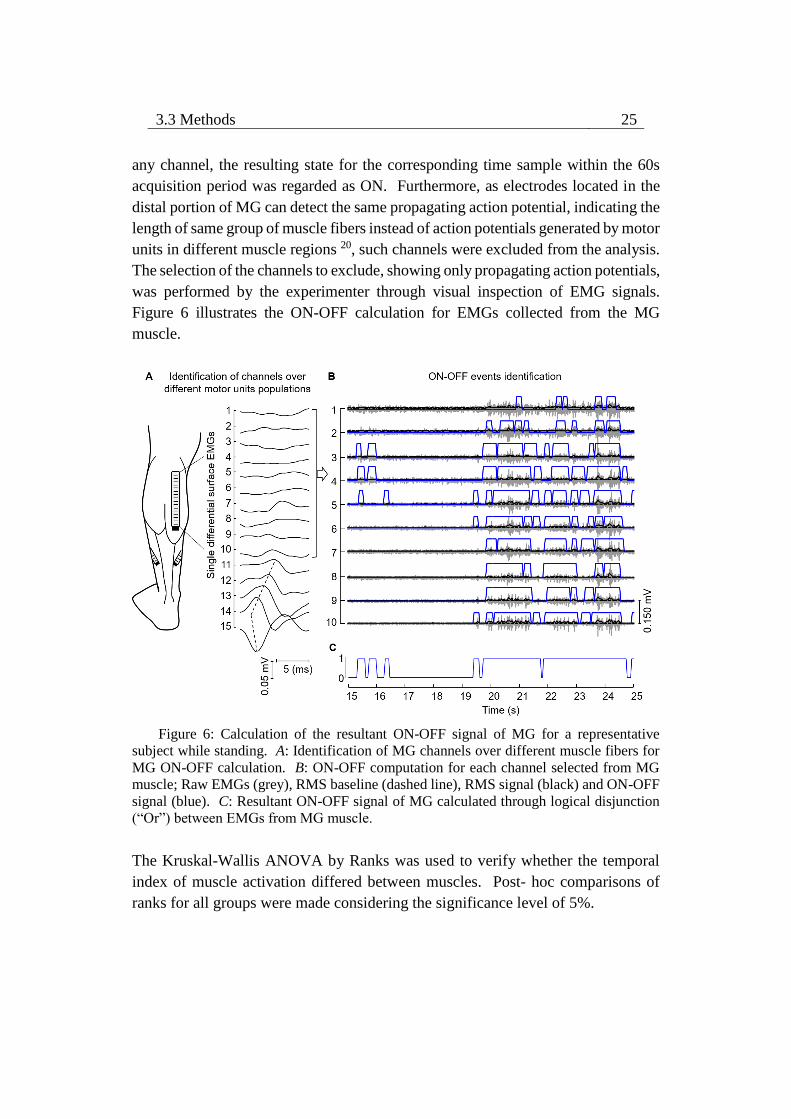
3.3 Methods 25
any channel, the resulting state for the corresponding time sample within the 60s
acquisition period was regarded as ON. Furthermore, as electrodes located in the
distal portion of MG can detect the same propagating action potential, indicating the
length of same group of muscle fibers instead of action potentials generated by motor
units in different muscle regions 20, such channels were excluded from the analysis.
The selection of the channels to exclude, showing only propagating action potentials,
was performed by the experimenter through visual inspection of EMG signals.
Figure 6 illustrates the ON-OFF calculation for EMGs collected from the MG
muscle.
Figure 6: Calculation of the resultant ON-OFF signal of MG for a representative
subject while standing. A: Identification of MG channels over different muscle fibers for
MG ON-OFF calculation. B: ON-OFF computation for each channel selected from MG
muscle; Raw EMGs (grey), RMS baseline (dashed line), RMS signal (black) and ON-OFF
signal (blue). C: Resultant ON-OFF signal of MG calculated through logical disjunction
(“Or”) between EMGs from MG muscle.
The Kruskal-Wallis ANOVA by Ranks was used to verify whether the temporal
index of muscle activation differed between muscles. Post- hoc comparisons of
ranks for all groups were made considering the significance level of 5%.
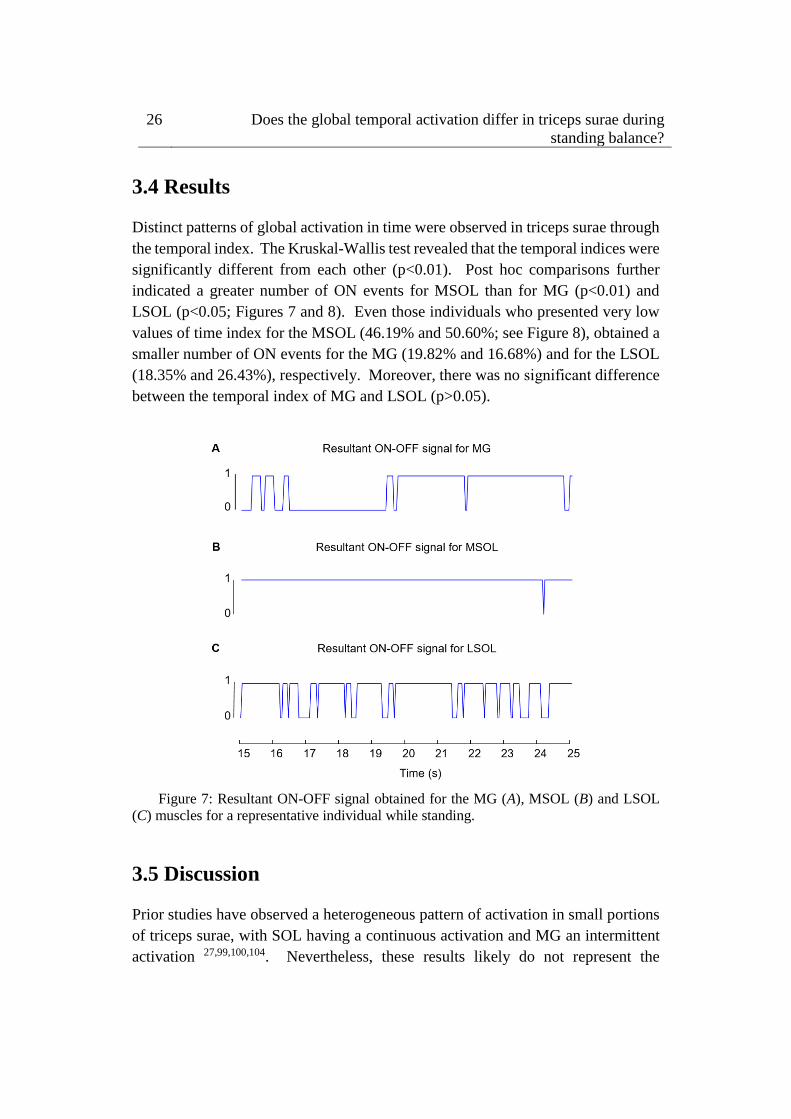
26 Does the global temporal activation differ in triceps surae during
standing balance?
3.4 Results
Distinct patterns of global activation in time were observed in triceps surae through
the temporal index. The Kruskal-Wallis test revealed that the temporal indices were
significantly different from each other (p<0.01). Post hoc comparisons further
indicated a greater number of ON events for MSOL than for MG (p<0.01) and
LSOL (p<0.05; Figures 7 and 8). Even those individuals who presented very low
values of time index for the MSOL (46.19% and 50.60%; see Figure 8), obtained a
smaller number of ON events for the MG (19.82% and 16.68%) and for the LSOL
(18.35% and 26.43%), respectively. Moreover, there was no significant difference
between the temporal index of MG and LSOL (p>0.05).
Figure 7: Resultant ON-OFF signal obtained for the MG (A), MSOL (B) and LSOL
(C) muscles for a representative individual while standing.
3.5 Discussion
Prior studies have observed a heterogeneous pattern of activation in small portions
of triceps surae, with SOL having a continuous activation and MG an intermittent
activation 27,99,100,104. Nevertheless, these results likely do not represent the
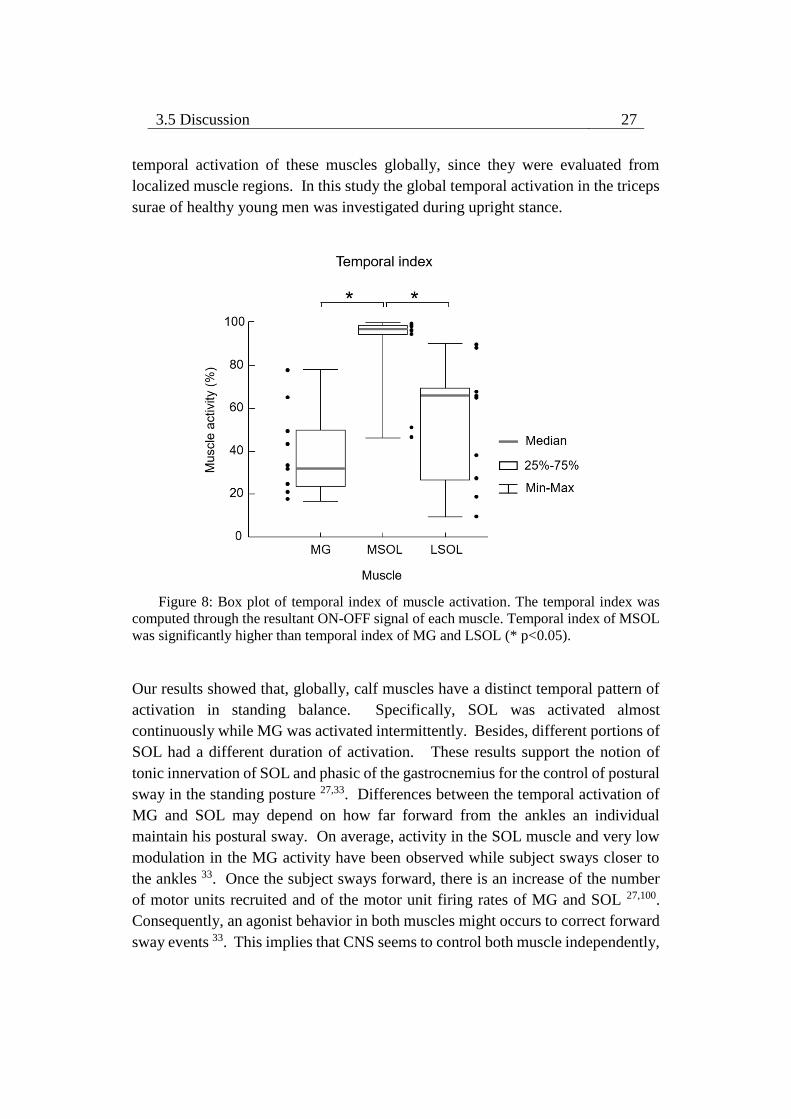
3.5 Discussion 27
temporal activation of these muscles globally, since they were evaluated from
localized muscle regions. In this study the global temporal activation in the triceps
surae of healthy young men was investigated during upright stance.
Figure 8: Box plot of temporal index of muscle activation. The temporal index was
computed through the resultant ON-OFF signal of each muscle. Temporal index of MSOL
was significantly higher than temporal index of MG and LSOL (* p<0.05).
Our results showed that, globally, calf muscles have a distinct temporal pattern of
activation in standing balance. Specifically, SOL was activated almost
continuously while MG was activated intermittently. Besides, different portions of
SOL had a different duration of activation. These results support the notion of
tonic innervation of SOL and phasic of the gastrocnemius for the control of postural
sway in the standing posture 27,33. Differences between the temporal activation of
MG and SOL may depend on how far forward from the ankles an individual
maintain his postural sway. On average, activity in the SOL muscle and very low
modulation in the MG activity have been observed while subject sways closer to
the ankles 33. Once the subject sways forward, there is an increase of the number
of motor units recruited and of the motor unit firing rates of MG and SOL 27,100.
Consequently, an agonist behavior in both muscles might occurs to correct forward
sway events 33. This implies that CNS seems to control both muscle independently,
28 Does the global temporal activation differ in triceps surae during
standing balance?
in which MG onset occurs to assist SOL muscle in the correction of forward sway.
Therefore, CNS seems to adopt a control strategy based on intermittent synergistic
effect of MG and SOL to maintain upright stance.
Furthermore, distinct proportions of muscle fiber type in the muscles of triceps surae
could favor the continuous activation of SOL muscle while standing. It was
observed that SOL contains a higher proportion of slow twitch fibers (70%) than
MG (50%) 105 Thus, the recruitment of SOL MUs likely result in a muscular
contraction characterized by low force generating capabilities and high fatigue
resistance 106. As low active ankle torques have been observed during upright stance
[~5 Nm; 107], SOL may be more suited to compensate the forward sway during
standing balance. However, suppose that differences in the duration of activity
between plantar flexors are accounted for differences in the fiber type composition
between these muscles is questionable, since fiber type is highly adapted to physical
demand 108 and, therefore, can be extremely variable among individuals 109.
Interestingly, distinct temporal patterns of activation were also observed between
the medial and lateral portions of SOL muscle. Functional differences between the
medial and lateral parts of SOL in the control of lateral sway could explain their
distinct temporal patterns of activation. On one hand, the emergence of LSOL
EMGs related to ankle eversion movement seems to indicate that LSOL also
contribute in the compensation of lateral sway during standing balance 110. On the
other hand, the activation of medial muscles located at calf might contribute to ankle
inversion movement, since MG activation together with other ankle inversors
contribute to ankle lateral stabilization 111. However, future studies are needed to
confirm functional differences between MSOL and LSOL during standing balance.
These results suggest that CNS may control independently the compensatory activity
of plantar flexors in standing balance. This selective activation of triceps surae may
reflect an efficient control of standing balance, since CNS prioritizes an intermittent
activation of MG and within SOL muscle instead of a continuous activation.
3.6 Conclusion
The results of this study indicate that global temporal activations of the muscles
located at calf differ during standing balance. MSOL is continuously activated
while LSOL and MG are intermittently activated during upright stance.
4.1 Abstract 29
Chapter 4
The spatial distribution of ankle
muscles activity discriminates aged
from young subjects during
standing 2
4.1 Abstract
During standing, age-related differences in the activation of ankle muscles have
been reported from surface electromyograms (EMGs) sampled locally. Given
though activity seems to distribute unevenly within ankle muscles, the local
sampling of surface EMGs may provide a biased view on how often and how much
elderly and young individuals activate these muscles during standing. This study
aimed therefore at sampling EMGs from multiple regions of individual ankle
muscles to evaluate whether the distribution of muscle activity differs between aged
and young subjects during standing. Thirteen young and eleven aged, healthy
subjects were tested. Surface EMGs were sampled at multiple skin locations from
tibialis anterior, soleus and medial and lateral gastrocnemius muscles while subjects
stood at ease. The root mean square amplitude of EMGs was considered to estimate
2 Scientific paper published in Frontiers in Human Neuroscience, 2017; Authors: Dos Anjos F,
Pinto TP, Gazzoni M, Vieira TM.
30 The spatial distribution of ankle muscles activity discriminates aged
from young subjects during standing
the duration, the degree of activity and the size of the region where muscle activity
was detected. Our main findings revealed the medial gastrocnemius was active for
longer periods in aged (interquartile interval; 74.1–98.2%) than young (44.9–
81.9%) individuals (P = 0.02). Similarly, while tibialis anterior was rarely active
in young (0.7– 4.4%), in elderly subjects (2.6–82.5%) it was often recruited (P =
0.01). Moreover, EMGs with relatively higher amplitude were detected over a
significantly wider proximo-distal region of medial gastrocnemius in aged (29.4–
45.6%) than young (20.1–31.3%) subjects (P = 0.04). These results indicate the
duration and the size of active muscle volume, as quantified from the spatial
distribution of surface EMGs, may discriminate aged from young individuals
during standing; elderlies seem to rely more heavily on the active loading of ankle
muscles to control their standing posture than young individuals. Most importantly,
current results suggest different conclusions on the active control of standing
posture may be drawn depending on the skin location from where EMGs are
collected, in particular for the medial gastrocnemius.
4.2 Introduction
Different mechanisms have been suggested to account for the control of human,
standing posture. Of recent interest is the notion that bodily sways are arrested by
timely, triggered bursts of calf muscles’ activity 26–28. The physiological
mechanism underpinning timed activation in standing is controversial; some
suggest there is an internal clock triggering calf muscles’ activation 112 while others
believe activation is event-triggered 29. In spite of the potential sources accounting
for such intermittent, postural activation, alternating periods of muscle activation
with silencing seems advantageous. Periodically silencing postural muscles during
standing may: (i) allow the nervous system to sense joint angles without
interference from muscle contraction 36; (ii) compensate for intrinsic, feedback
delays 31; (iii) reduce metabolic costs 29; (iv) not increase postural instability 31. In
this view, the assessment of muscle activation may therefore reveal pivotal features
of the control of standing posture, especially e.g., in persons with balance
impairments.
Surface EMGs revealed, indeed, key differences in the activation of postural
muscles with aging. From bipolar surface EMGs collected from the plantar flexor
muscles, for example, previous studies reported that elderlies tend to stand with a
more continuous and higher degree of activation than young individuals 12–14.
Moreover, while tibialis anterior is typically silent in young subjects during
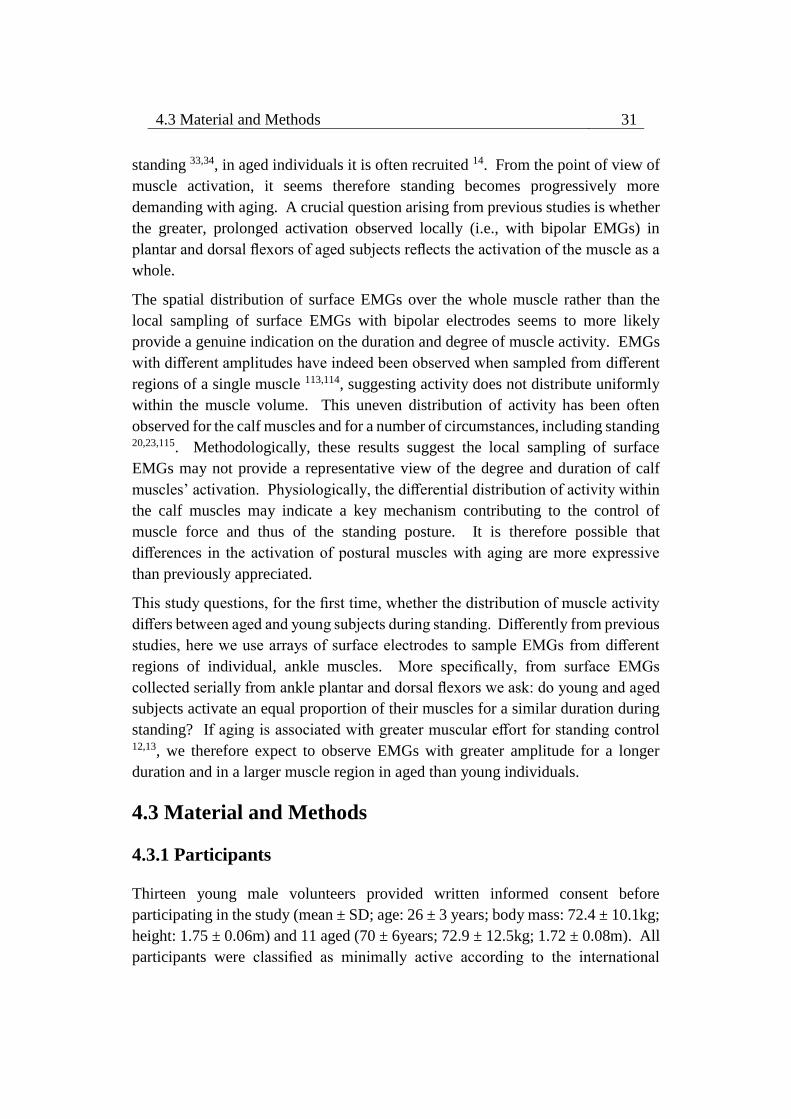
4.3 Material and Methods 31
standing 33,34, in aged individuals it is often recruited 14. From the point of view of
muscle activation, it seems therefore standing becomes progressively more
demanding with aging. A crucial question arising from previous studies is whether
the greater, prolonged activation observed locally (i.e., with bipolar EMGs) in
plantar and dorsal flexors of aged subjects reflects the activation of the muscle as a
whole.
The spatial distribution of surface EMGs over the whole muscle rather than the
local sampling of surface EMGs with bipolar electrodes seems to more likely
provide a genuine indication on the duration and degree of muscle activity. EMGs
with different amplitudes have indeed been observed when sampled from different
regions of a single muscle 113,114, suggesting activity does not distribute uniformly
within the muscle volume. This uneven distribution of activity has been often
observed for the calf muscles and for a number of circumstances, including standing 20,23,115. Methodologically, these results suggest the local sampling of surface
EMGs may not provide a representative view of the degree and duration of calf
muscles’ activation. Physiologically, the differential distribution of activity within
the calf muscles may indicate a key mechanism contributing to the control of
muscle force and thus of the standing posture. It is therefore possible that
differences in the activation of postural muscles with aging are more expressive
than previously appreciated.
This study questions, for the first time, whether the distribution of muscle activity
differs between aged and young subjects during standing. Differently from previous
studies, here we use arrays of surface electrodes to sample EMGs from different
regions of individual, ankle muscles. More specifically, from surface EMGs
collected serially from ankle plantar and dorsal flexors we ask: do young and aged
subjects activate an equal proportion of their muscles for a similar duration during
standing? If aging is associated with greater muscular effort for standing control 12,13, we therefore expect to observe EMGs with greater amplitude for a longer
duration and in a larger muscle region in aged than young individuals.
4.3 Material and Methods
4.3.1 Participants
Thirteen young male volunteers provided written informed consent before
participating in the study (mean ± SD; age: 26 ± 3 years; body mass: 72.4 ± 10.1kg;
height: 1.75 ± 0.06m) and 11 aged (70 ± 6years; 72.9 ± 12.5kg; 1.72 ± 0.08m). All
participants were classified as minimally active according to the international
32 The spatial distribution of ankle muscles activity discriminates aged
from young subjects during standing
physical activity questionnaire (IPAQ); short self-administered version 116. All
community-dwelling older adults lived independently. We decided to include
participants without a sedentary lifestyle because physical inactivity may further
broaden the between subjects variability often reported for stabilometric descriptors 117. The experimental procedures considered in this study conformed to the
Declaration of Helsinki and were approved by the Regional Ethics Committee
(Commissione di Vigilanza, Servizio Sanitario Nazionale—Regione Piemonte—
ASL 1—Torino, Italy). Volunteers did not report any balance impairments,
neurological disorders, muscular injuries, or the intake of medications that could
affect their standing balance at the occasion of experiments.
4.3.2 Experimental protocol
Participants were instructed to stand upright barefoot on a force-plate, with eyes
open and arms alongside the body. They positioned their feet at a comfortable
orientation and distance, while keeping heels and toes at the same position along
the force plate anterior-posterior axis (Figure 9A). Prior to starting experiments,
the contour of both feet was marked on the force plate to ensure participants would
keep the same feet position throughout the standing tests.
Two standing tasks were applied. In the first task, participants were provided with
visual feedback of their CoP position in the anterior-posterior axis and were
instructed to keep it at 65% of the longitudinal size of their support base for 60s
(Figure 9B). The size of the support base in the anterior-posterior axis was defined
as the distance between the tip of the third metatarsal head and the tip of the
calcaneus bone projected in the anterior-posterior direction (Figure 9A). The 65%
figure corresponds roughly to 80% of the distance between the heels and the anterior
limit of stability of healthy, young subjects 118; this figure was selected to ensure a
somewhat high degree of calf muscles active loading while not threatening stability,
in particular for the aged individuals. All elderly subjects tested could stand with
their CoP at the target value without losing balance. This postural task was
considered for the normalization of EMGs, as described below. In the second task,
volunteers were asked to stand at ease for 60s. Subjects were engaged in active
conversation to ensure they would take their mind off the test and thus avoid any
voluntary change in muscle activity 102. The trial started over in the case gross body
movements were noticed by the experimenter. The standing at ease task was
applied three times, in accordance with previous evidence on excellent reliability
of stabilometric descriptors 119. Similarly, good-to excellent reliability has been
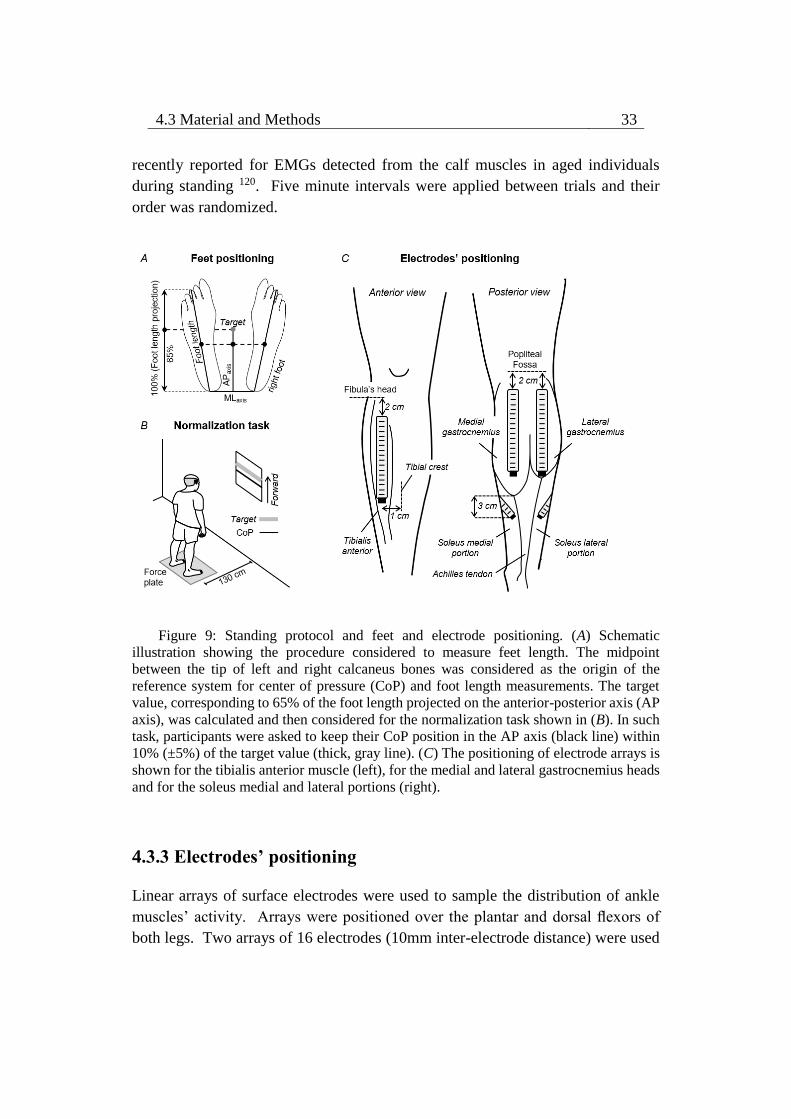
4.3 Material and Methods 33
recently reported for EMGs detected from the calf muscles in aged individuals
during standing 120. Five minute intervals were applied between trials and their
order was randomized.
Figure 9: Standing protocol and feet and electrode positioning. (A) Schematic
illustration showing the procedure considered to measure feet length. The midpoint
between the tip of left and right calcaneus bones was considered as the origin of the
reference system for center of pressure (CoP) and foot length measurements. The target
value, corresponding to 65% of the foot length projected on the anterior-posterior axis (AP
axis), was calculated and then considered for the normalization task shown in (B). In such
task, participants were asked to keep their CoP position in the AP axis (black line) within
10% (±5%) of the target value (thick, gray line). (C) The positioning of electrode arrays is
shown for the tibialis anterior muscle (left), for the medial and lateral gastrocnemius heads
and for the soleus medial and lateral portions (right).
4.3.3 Electrodes’ positioning
Linear arrays of surface electrodes were used to sample the distribution of ankle
muscles’ activity. Arrays were positioned over the plantar and dorsal flexors of
both legs. Two arrays of 16 electrodes (10mm inter-electrode distance) were used
34 The spatial distribution of ankle muscles activity discriminates aged
from young subjects during standing
to detect surface EMGs from the medial and lateral gastrocnemius muscles. The
most proximal electrode was located 2cm distally to the popliteal fossa and arrays
were aligned parallel to the longitudinal axis of each gastrocnemius’ head (Figure
9C). Such positioning maximizes the representation of action potentials from
muscle units residing in different, proximo-distal gastrocnemius’ regions 17. EMGs
were sampled with one array of 16 electrodes (10mm inter-electrode distance) from
the tibialis anterior muscle, aligned 1cm laterally and parallel to the tibial crest and
with the most proximal electrode located 2cm distally to the fibula’s head (Figure
9C). Given the in-depth pennate architecture of tibialis anterior, as for
gastrocnemius, such positioning is expected to provide EMGs representative of
different, proximo-distal fibers. Two arrays with four electrodes each (10mm inter-
electrode distance) were used to sample EMGs from the soleus medial and lateral
portions. For each soleus portion, arrays were aligned ∼45 degree outward to the
line connecting the junction between gastrocnemius’ heads and the calcaneus tip.
The lower border of both the medial and lateral arrays was positioned 3cm distally
to the medial gastrocnemius myotendinous junction (Figure 9C; 23). Gastrocnemii
junction and their myotendinous junction were identified with ultrasound imaging
(cf. Supplementary Material in 101). Arrays were positioned after cleaning the skin
with abrasive paste.
4.3.4 Electromyographic and stabilometric recording
EMGs were recorded in single-differential derivation. All 51 single-differential
EMGs were amplified by a between-individuals variable factor—5,000 or 10,000—
to ensure the highest signal-to-noise ratio without saturation (10–750 Hz bandwidth
amplifier; EMG-USB, OTBioelettronica and LISiN, Politecnico di Torino, Turin,
Italy). CoP coordinates in the sagittal and frontal planes were computed from the
ground reaction forces supplied by a piezoelectric force-plate (9286AA Kistler,
Zurich, Switzerland). Reaction forces and surface EMGs were sampled
synchronously at 2,048Hz using a 12-bit A/D converter (±2.5 V input dynamic
range).
4.3.5 Quantifying muscle activity during standing
Raw surface EMGs were visually inspected. Whenever any channel in the array
presented contact problems, likely due to high skin-electrode impedance, or
massive power line interference, the corresponding channel was disregarded.
Occurrences of low quality EMGs were infrequent (17 out of 1,224 EMGs detected
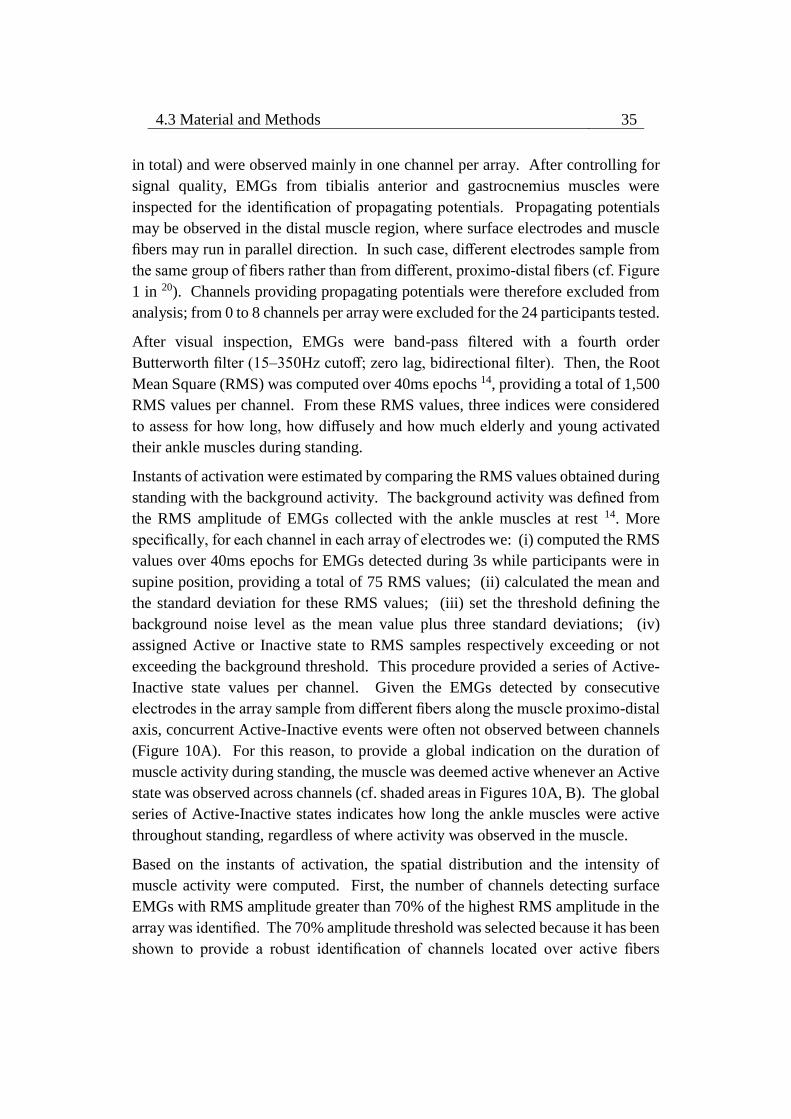
4.3 Material and Methods 35
in total) and were observed mainly in one channel per array. After controlling for
signal quality, EMGs from tibialis anterior and gastrocnemius muscles were
inspected for the identification of propagating potentials. Propagating potentials
may be observed in the distal muscle region, where surface electrodes and muscle
fibers may run in parallel direction. In such case, different electrodes sample from
the same group of fibers rather than from different, proximo-distal fibers (cf. Figure
1 in 20). Channels providing propagating potentials were therefore excluded from
analysis; from 0 to 8 channels per array were excluded for the 24 participants tested.
After visual inspection, EMGs were band-pass filtered with a fourth order
Butterworth filter (15–350Hz cutoff; zero lag, bidirectional filter). Then, the Root
Mean Square (RMS) was computed over 40ms epochs 14, providing a total of 1,500
RMS values per channel. From these RMS values, three indices were considered
to assess for how long, how diffusely and how much elderly and young activated
their ankle muscles during standing.
Instants of activation were estimated by comparing the RMS values obtained during
standing with the background activity. The background activity was defined from
the RMS amplitude of EMGs collected with the ankle muscles at rest 14. More
specifically, for each channel in each array of electrodes we: (i) computed the RMS
values over 40ms epochs for EMGs detected during 3s while participants were in
supine position, providing a total of 75 RMS values; (ii) calculated the mean and
the standard deviation for these RMS values; (iii) set the threshold defining the
background noise level as the mean value plus three standard deviations; (iv)
assigned Active or Inactive state to RMS samples respectively exceeding or not
exceeding the background threshold. This procedure provided a series of Active-
Inactive state values per channel. Given the EMGs detected by consecutive
electrodes in the array sample from different fibers along the muscle proximo-distal
axis, concurrent Active-Inactive events were often not observed between channels
(Figure 10A). For this reason, to provide a global indication on the duration of
muscle activity during standing, the muscle was deemed active whenever an Active
state was observed across channels (cf. shaded areas in Figures 10A, B). The global
series of Active-Inactive states indicates how long the ankle muscles were active
throughout standing, regardless of where activity was observed in the muscle.
Based on the instants of activation, the spatial distribution and the intensity of
muscle activity were computed. First, the number of channels detecting surface
EMGs with RMS amplitude greater than 70% of the highest RMS amplitude in the
array was identified. The 70% amplitude threshold was selected because it has been
shown to provide a robust identification of channels located over active fibers
36 The spatial distribution of ankle muscles activity discriminates aged
from young subjects during standing
within muscles pennate in the depth direction 121. The number of segmented
channels multiplied by the inter-electrode distance was then normalized with
respect to the muscle length (see below). Second, the degree of muscle activity was
estimated by averaging the RMS values across all segmented channels for each
muscle tested. This average RMS amplitude was then normalized with respect to
the RMS amplitude averaged across channels identified during the normalization,
standing task (Figure 9B), to compensate for the effect of anatomical differences
between participants on the surface EMGs 122. It should be noted here the
Figure 10: Computation of instants of muscle activation. (A) Shows examples of
single-differential EMGs detected by channels 1, 7, and 10 from the medial gastrocnemius
muscle of a single participant. Note action potentials do not appear with equally high
amplitude in the three channels. The muscle was considered active whenever for any given
instants the RMS amplitude exceeded the background activity in at least one channel. Light
gray rectangles in the grid denote periods within which the RMS amplitude of EMGs in
each channel exceeded the background activity computed with the muscle at rest (see text).
The resulting series of instants of muscle activity for this representative example is
illustrated with a succession of white (Inactive state; muscle at rest) and gray (Active state;
muscle active) rectangles (B).
4.3 Material and Methods 37
normalization of EMGs collected in a given condition with respect to that collected
in a reference condition compensates for the effect of inter-individual differences
on their amplitude though not on the spatial distribution of their amplitude. Finally,
the size of the active region in the proximo-distal direction and the degree of activity
were considered for analysis whenever any given muscle was active for at least 10%
of the total, standing duration. Following previous evidence, occurrences of such
sporadic activity was regarded as of marginal relevance for the control of standing
posture 26. Given we observed medial gastrocnemius was active for different
durations (∼20%) between legs in both aged and young subjects, the
electromyographic indices and architectural muscle parameters (see below)
computed from the subject’s leg active for longer durations (left side for 10 young
and 8 elderly subjects) were used for comparisons between groups.
4.3.6 Measurements of ankle muscles’ length and subcutaneous
thickness
Parasagittal images from tibialis anterior and gastrocnemii were taken with a linear,
ultrasound probe (10MHz, 4cm length; Echo Blaster 128, Telemed Ltd., Vilnius,
Lithuania), with participants lying comfortably on a padded bed in prone position.
The participants’ feet were positioned out of the padded bad. Initially, the
myotendinous junction was identified and marked on the skin. The length of tibialis
anterior was then quantified as the distance between its myotendinous junction and
the head of the fibula, whereas the length of each gastrocnemius head was defined
as the shortest distance between the myoetendinous junction and the popliteal fossa.
Subcutaneous thickness and pennation angle were further quantified to assist in the
interpretation of potential proximo-distal differences in the distribution of activity
with aging. Subcutaneous thickness was computed as the distance between the
skin/fat layer over the muscle and its superficial aponeurosis from parasagittal
images obtained with the probe centered halfway the muscle length. Thickness
measurements were taken from the central region of the proximal, central and distal
thirds of the ultrasound images and then averaged, providing a representative
indication on the general subcutaneous thickness per subject 123. Finally, the
pennation angle was estimated as the angle between a clearly visible fascicle in the
image and the muscle deep aponeurosis 124. Thickness and pennation angle values
were obtained with the muscle at rest.
38 The spatial distribution of ankle muscles activity discriminates aged
from young subjects during standing
4.3.7 Quantifying the CoP sway area
The CoP sway area was considered to assess how largely young and elderly
individuals swayed during the whole standing tests. The overall size of postural
sways was estimated from the elliptic area conveying almost 85% of the total CoP
samples during standing 125. The CoP elliptic area, as well as the EMG descriptors,
were averaged across the three standing trials and considered for between-group
comparisons. CoP data was 50Hz low-pass filtered with a second order Butterworth
filter to remove high-frequency noise.
4.3.8 Statistical analysis
Non-parametric statistics were applied to compare the distribution of ankle
muscles’ activity between young and aged individuals, after ensuring the data
distribution was not Gaussian (Shapiro-Wilk’s W-test, P < 0.03 in all cases). The
Mann-Whitney U-test was used to verify whether, during standing and for each
muscle independently, the duration of the active period, the degree of activity, the
relative size of the active region and the CoP elliptic area were different between
groups. The same statistics was applied to assess regional differences in activity
within soleus, by comparing the normalized RMS amplitude obtained for the
muscle medial and lateral aspects. The level of statistical significance was set at
5% and data were reported using non-parametric, descriptive statistics.
4.4 Results
Representative examples of variations in ankle muscles’ activity during
standing
Different ankle muscles were activated differently when young and aged individuals
stood at ease. Descriptive considerations on these differences are summarized in
this section based on the data shown in Figure 11 for one young and one aged,
representative participant. Lateral gastrocnemius was active for 6 and 17% of the
whole standing trial for the young and aged subjects respectively. For the tibialis
anterior muscle, the amplitude of EMGs remained below the background activity
for the young subject during the whole standing duration while, for the elderly,
bursts of activity were observed and provided an active duration of 36%.
Conversely, EMGs with remarkably high amplitude in the soleus medial and lateral
portions were observed consistently for both subjects (cf. shaded areas in Figure
11).
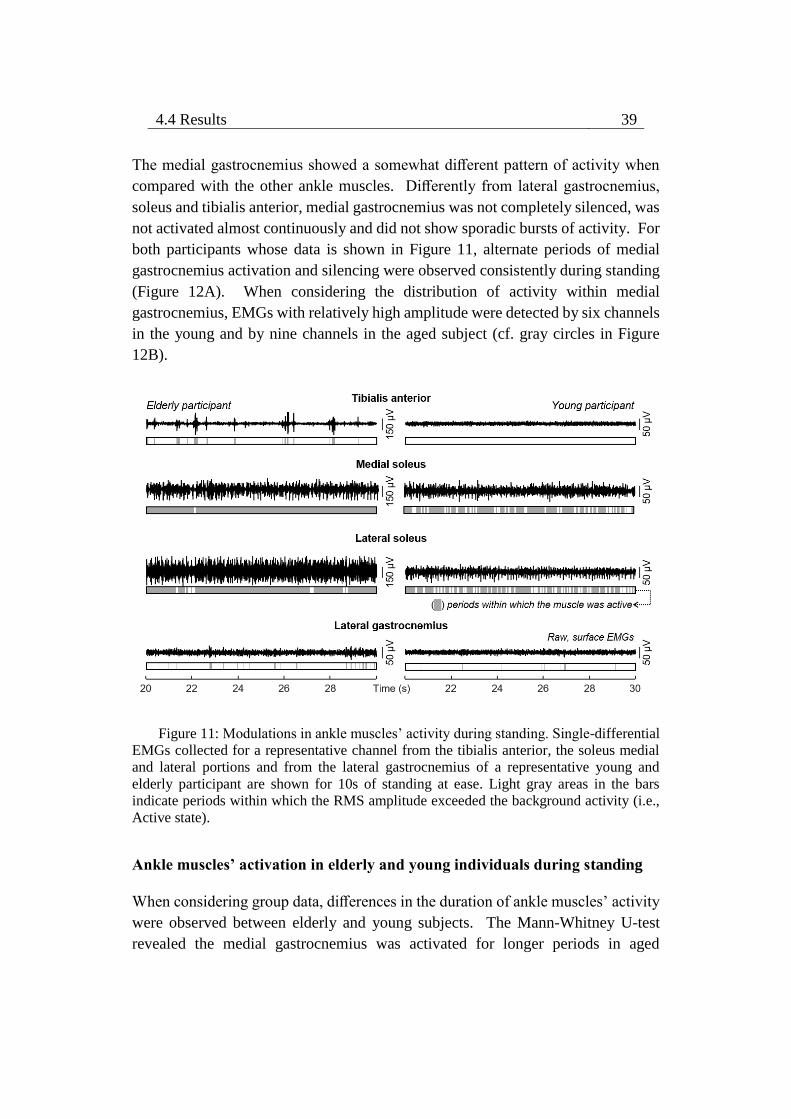
4.4 Results 39
The medial gastrocnemius showed a somewhat different pattern of activity when
compared with the other ankle muscles. Differently from lateral gastrocnemius,
soleus and tibialis anterior, medial gastrocnemius was not completely silenced, was
not activated almost continuously and did not show sporadic bursts of activity. For
both participants whose data is shown in Figure 11, alternate periods of medial
gastrocnemius activation and silencing were observed consistently during standing
(Figure 12A). When considering the distribution of activity within medial
gastrocnemius, EMGs with relatively high amplitude were detected by six channels
in the young and by nine channels in the aged subject (cf. gray circles in Figure
12B).
Figure 11: Modulations in ankle muscles’ activity during standing. Single-differential
EMGs collected for a representative channel from the tibialis anterior, the soleus medial
and lateral portions and from the lateral gastrocnemius of a representative young and
elderly participant are shown for 10s of standing at ease. Light gray areas in the bars
indicate periods within which the RMS amplitude exceeded the background activity (i.e.,
Active state).
Ankle muscles’ activation in elderly and young individuals during standing
When considering group data, differences in the duration of ankle muscles’ activity
were observed between elderly and young subjects. The Mann-Whitney U-test
revealed the medial gastrocnemius was activated for longer periods in aged
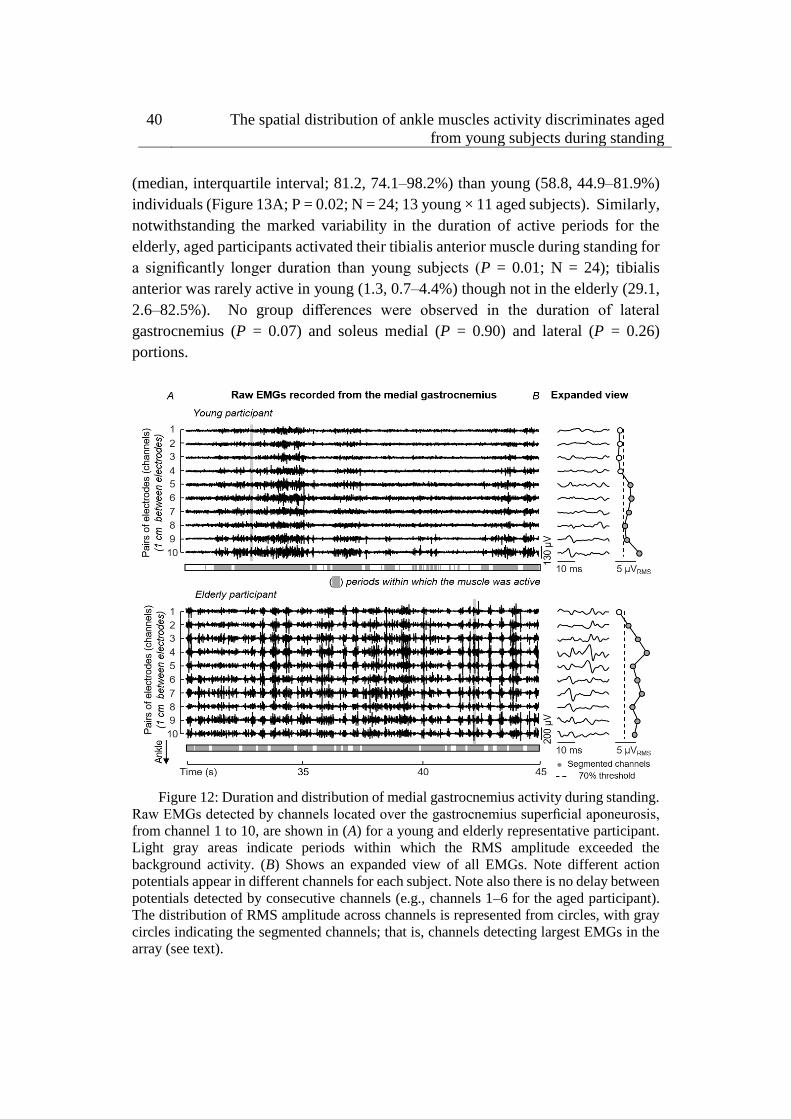
40 The spatial distribution of ankle muscles activity discriminates aged
from young subjects during standing
(median, interquartile interval; 81.2, 74.1–98.2%) than young (58.8, 44.9–81.9%)
individuals (Figure 13A; P = 0.02; N = 24; 13 young × 11 aged subjects). Similarly,
notwithstanding the marked variability in the duration of active periods for the
elderly, aged participants activated their tibialis anterior muscle during standing for
a significantly longer duration than young subjects (P = 0.01; N = 24); tibialis
anterior was rarely active in young (1.3, 0.7–4.4%) though not in the elderly (29.1,
2.6–82.5%). No group differences were observed in the duration of lateral
gastrocnemius (P = 0.07) and soleus medial (P = 0.90) and lateral (P = 0.26)
portions.
Figure 12: Duration and distribution of medial gastrocnemius activity during standing.
Raw EMGs detected by channels located over the gastrocnemius superficial aponeurosis,
from channel 1 to 10, are shown in (A) for a young and elderly representative participant.
Light gray areas indicate periods within which the RMS amplitude exceeded the
background activity. (B) Shows an expanded view of all EMGs. Note different action
potentials appear in different channels for each subject. Note also there is no delay between
potentials detected by consecutive channels (e.g., channels 1–6 for the aged participant).
The distribution of RMS amplitude across channels is represented from circles, with gray
circles indicating the segmented channels; that is, channels detecting largest EMGs in the
array (see text).
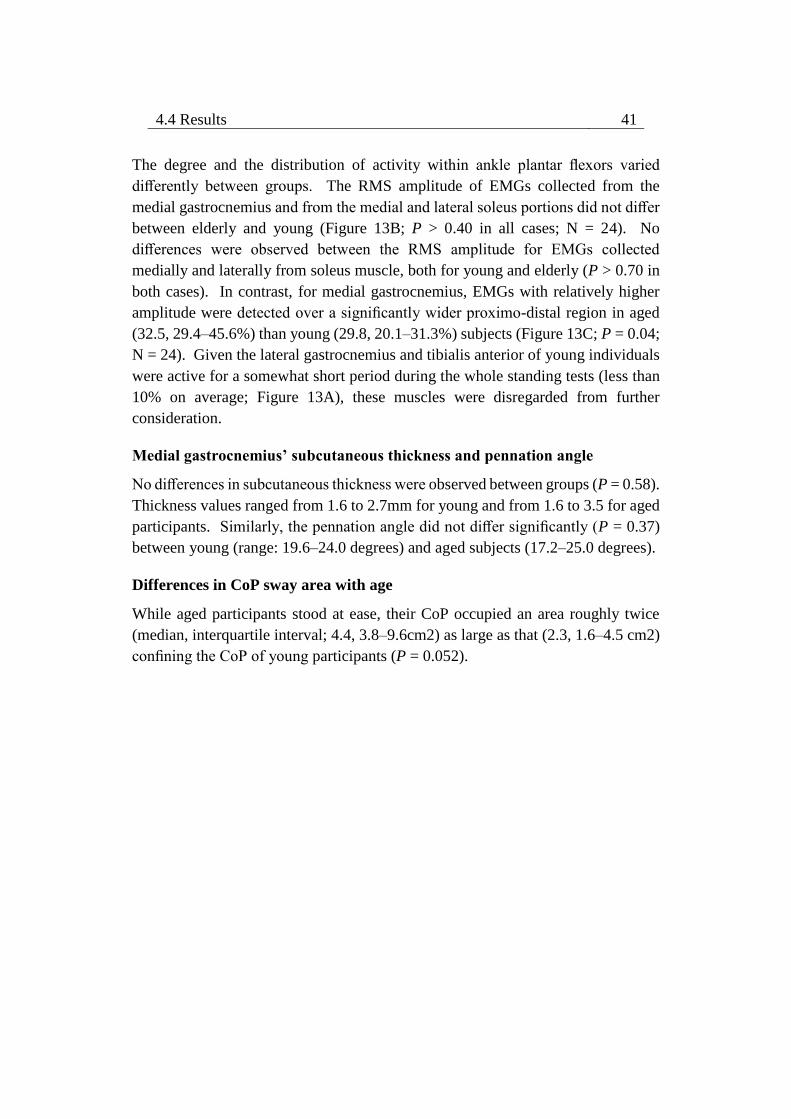
4.4 Results 41
The degree and the distribution of activity within ankle plantar flexors varied
differently between groups. The RMS amplitude of EMGs collected from the
medial gastrocnemius and from the medial and lateral soleus portions did not differ
between elderly and young (Figure 13B; P > 0.40 in all cases; N = 24). No
differences were observed between the RMS amplitude for EMGs collected
medially and laterally from soleus muscle, both for young and elderly (P > 0.70 in
both cases). In contrast, for medial gastrocnemius, EMGs with relatively higher
amplitude were detected over a significantly wider proximo-distal region in aged
(32.5, 29.4–45.6%) than young (29.8, 20.1–31.3%) subjects (Figure 13C; P = 0.04;
N = 24). Given the lateral gastrocnemius and tibialis anterior of young individuals
were active for a somewhat short period during the whole standing tests (less than
10% on average; Figure 13A), these muscles were disregarded from further
consideration.
Medial gastrocnemius’ subcutaneous thickness and pennation angle
No differences in subcutaneous thickness were observed between groups (P = 0.58).
Thickness values ranged from 1.6 to 2.7mm for young and from 1.6 to 3.5 for aged
participants. Similarly, the pennation angle did not differ significantly (P = 0.37)
between young (range: 19.6–24.0 degrees) and aged subjects (17.2–25.0 degrees).
Differences in CoP sway area with age
While aged participants stood at ease, their CoP occupied an area roughly twice
(median, interquartile interval; 4.4, 3.8–9.6cm2) as large as that (2.3, 1.6–4.5 cm2)
confining the CoP of young participants (P = 0.052).
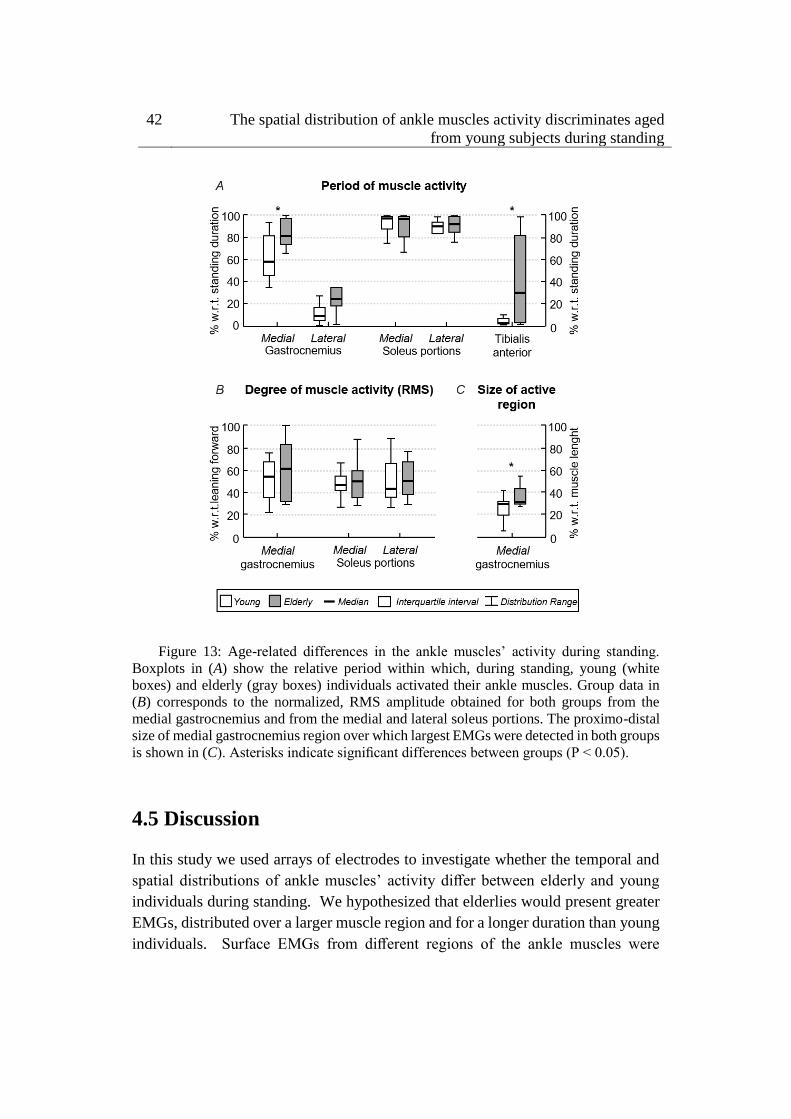
42 The spatial distribution of ankle muscles activity discriminates aged
from young subjects during standing
Figure 13: Age-related differences in the ankle muscles’ activity during standing.
Boxplots in (A) show the relative period within which, during standing, young (white
boxes) and elderly (gray boxes) individuals activated their ankle muscles. Group data in
(B) corresponds to the normalized, RMS amplitude obtained for both groups from the
medial gastrocnemius and from the medial and lateral soleus portions. The proximo-distal
size of medial gastrocnemius region over which largest EMGs were detected in both groups
is shown in (C). Asterisks indicate significant differences between groups (P < 0.05).
4.5 Discussion
In this study we used arrays of electrodes to investigate whether the temporal and
spatial distributions of ankle muscles’ activity differ between elderly and young
individuals during standing. We hypothesized that elderlies would present greater
EMGs, distributed over a larger muscle region and for a longer duration than young
individuals. Surface EMGs from different regions of the ankle muscles were
4.5 Discussion 43
collected while subjects stood at ease to test this hypothesis. Our key results
indicate that during standing: (i) tibialis anterior and medial gastrocnemius muscles
were active for a longer duration in aged than young subjects; (ii) a greater
proportion of medial gastrocnemius volume was active in elderlies. Collectively,
these results indicate elderlies rely more heavily on the active loading of ankle
muscles to control their standing posture than young individuals.
Preliminary, methodological considerations on surface EMG detection
Differently from previous studies, here we sampled surface EMGs with arrays of
electrodes (Figure 9C). Our decision to sample activity from multiple locations of
individual ankle muscles was motivated by recent evidence suggesting different
muscle regions may be activated differently 113,114, in particular for pennate muscles 17,20,22,115; EMGs sampled locally (i.e., with a single pair of shortly spaced
electrodes) may not provide a representative view of muscle activation. Indeed, as
shown in Figure 10, EMGs in different locations may provide different estimations
for the duration of gastrocnemius activity. Considering EMGs were represented
with different amplitude in different muscle regions (Figures 10, 12), the duration
of muscle activity would have been likely underestimated if we had not considered
EMGs detected at different skin regions (cf. shaded areas for individual and all
channels in Figure 10). Similarly, biased estimations on the degree of each calf
muscles’ activity would have been obtained if we had considered the RMS
amplitude of EMGs detected locally. Depending on where EMGs were detected
from, in particular for young individuals (Figure 12), their corresponding RMS
values would provide either under- (white circles in Figure 12B) or over (gray
circles in Figure 12B) estimates of the degree of activity in the whole muscle.
Through arrays of surface electrodes, we were able to obtain estimates of the
duration and degree of activity presumably more representative of individual ankle
muscles’ volumes than previously appreciated. As discussed below, new insights
have been gained into age-related differences in postural activation from such a
high-density, surface EMG approach.
Are the ankle muscles activated for a similar duration in aged and young
subjects?
The differences between aged and young individuals reported here were muscle
dependent. When considering the duration of activity for lateral gastrocnemius and
soleus muscles, statistic differences were not observed between groups. Both
groups recruited lateral gastrocnemius for less than ∼20% of the total, standing
44 The spatial distribution of ankle muscles activity discriminates aged
from young subjects during standing
duration (Figures 11, 13A). The soleus muscle, on the other hand, was activated
for periods roughly longer than 80% of standing. These results corroborate
previous findings on the duration of calf muscles’ activity, extensively reported for
young subjects. Indeed, while the absence of activity in lateral gastrocnemius has
been observed in some subjects 26,34, it seems well-documented that soleus is
recruited at almost all time during standing 14,26. Even though the temporal
activation of postural muscles is not as commonly assessed for elderlies as it is for
young individuals, Laughton et al. 14 observed age similarities for the duration of
soleus activity during standing. Extending the observation of Laughton et al. 14, our
current results suggest the duration of activity of the lateral gastrocnemius and
soleus regions accessed by our surface electrodes is unlikely sensitive to aging.
Age differences emerged however in the duration of medial gastrocnemius and
tibialis anterior activity during standing. Aged individuals activated their medial
gastrocnemius muscle for a period ∼20% longer, on average, than their young
counterparts (Figure 13A). Similarly, tibialis anterior was active for a longer
(∼30%) period in aged than in young subjects (Figure 13A). The median duration
of tibialis anterior activity observed here, both for young (∼2%) and elderlies
(∼30%), is well in agreement with the duration of activity periods reported by
Laughton et al. 14 for this muscle. From a first inspection of results presented in
Figure 13A, we feel inclined to consider the co-activation mechanism as
responsible for the age differences in the timing of plantar and dorsal flexors’
activation during standing. More specifically, while young subjects predominantly
activated their plantar flexors, elderlies activated both plantar and dorsal flexor
muscles during standing (Figures 11, 12A, 13A). In spite of controversies on
whether co-activation may be detrimental or may compensate for poor control of
posture, co-activation is often associated with increased postural sways 12,13,126.
Corroborating this common view, in the elderlies, we observed the CoP was
confined within an elliptic area almost twice as large as that confining the CoP of
young subjects. Regardless of the mechanisms underpinning age-differences in
posture control, current results here suggest elderlies activate their ankle muscles
for longer durations during standing than young subjects.
Do elderly and young recruit their calf muscles to a similar extent during
standing?
Two notes on our estimates of the degree of activity are necessary before
interpreting results. Young subjects activated tibialis anterior and lateral
4.5 Discussion 45
gastrocnemius somewhat rarely (Figures 11, 13A). We therefore disregarded both
muscles from age comparisons. A second observation concerns how we conceived
muscle activity. While the amplitude of EMGs is traditionally considered to assess
the degree of muscle activity, here we considered both the amplitude and the size
of skin region where EMGs with relatively high amplitude were sampled (Figures
10, 12). As argued below, the extent to which elderly and young activate their calf
muscles depends both on the amplitude and on the amplitude distribution of surface
EMGs.
The proximo-distal distribution of the amplitude of medial gastrocnemius EMGs
distinguished aged from young individuals during standing. While young subjects
presented EMGs with relatively high amplitude in the gastrocnemius distal region,
corroborating previous findings 20, EMGs with similarly high amplitude were
sampled from a larger, proximo-distal muscle region in aged individuals (c.f. gray
circles in Figures 12B, 13C). Different sources could have accounted for a
somewhat extensive distribution of EMG amplitude in the elderlies. A first issue
to consider is the potential difference in muscle architecture between groups. Both
subcutaneous thickness and pennation angle have shown to affect dramatically the
amplitude distribution of surface EMGs; thicker subcutaneous tissue and smaller
pennation angle result both in more spatially diffused surface EMGs 122,127. Current
results however did not indicate significant, age differences in gastrocnemius
architecture. The lack of anatomical differences between groups leads us to
consider the possibility that elderlies activated a larger gastrocnemius volume than
young subjects during standing. In spite of recent controversies 128,129, it seems
well-accepted that, for the gastrocnemius muscle, EMGs sampled in different
proximo-distal regions reflect the activity of different muscle fibers 17. The
amplitude of EMGs detected distally and proximally, for example, is associated
with the number of active fibers in the muscle distal and proximal regions
respectively 127. Given the mean amplitude of EMGs sampled from medial
gastrocnemius was similar between groups (Figure 13B), the wider skin region
from where EMGs with high amplitude were detected (Figure 13C) suggests a
relatively greater proportion of muscle fibers may have been recruited in the
elderlies.
Age differences in the distribution of activity for soleus were not as clear as for
gastrocnemius. Since soleus is largely covered by the gastrocnemius muscles,
spatial differences in soleus activation were assessed by comparing the amplitude
of EMGs detected laterally and medially (Figure 9C). Our decision to assess both
regions was based on previous evidence showing medio-lateral differences in soleus
46 The spatial distribution of ankle muscles activity discriminates aged
from young subjects during standing
activation 22,23. Given we were here interested in assessing the degree of muscle
activity during standing, sampling EMGs unilaterally could provide a biased view
on the actual degree of soleus, postural activity. Indeed, even though results in
Figure 13B indicate EMGs with equal amplitude were detected medio-laterally for
both age groups, stating young and aged subjects activate a similar proportion of
their soleus muscle in standing is potentially fairly speculative. Considerations on
the relevance of spatial differences in soleus activation with age are therefore
conditioned to the possibility of sampling EMGs from a greater soleus region (with
e.g., intramuscular electrodes) in future investigations.
Future perspectives and limitations
Spatial differences in the amplitude of EMGs collected from elderlies and young
during standing have methodological and physiological implications. A first crucial
point to consider is the localized representation of surface EMG during standing.
Here we show that, depending on where a single bipolar EMG is collected from the
gastrocnemius muscle, different conclusions maybe drawn on age differences
during standing. The local sampling of muscle activity provided by bipolar surface
EMGs may indeed contribute to explaining current disparities observed in the
literature. While some studies did not report age differences in the degree of plantar
flexors’ activity during standing at ease 14,130, others have however documented a
significantly higher degree of plantar flexor activation with aging 12,13. Anticipating
the differences between studies were due to inappropriate EMG sampling is a
statement we strongly discourage. On the other hand, though, our current results
suggest that different interpretations may emerge from EMGs detected locally
during standing. Of more physiological, applied interest, is the suggestion that
elderlies tend to stand with a greater degree of muscle effort than young subjects
(Figures 13A, C). According to recent evidence, standing with minimal muscular
effort while affording some degree of bodily sways may be advantageous; it may
reduce the metabolic cost of standing 29, eliminate motor noise 36 and compensate
for delays in the feedback loop 31. While acknowledging the value of different
protocols so far devised for the balance training 60,131, here we suggest that learning
to efficiently activate dorsal and plantar flexors during standing could be beneficial
for the control of standing posture in aged individuals.
Some additional considerations on the results presented here are necessary. Both
young and aged subjects showed a somewhat large variability in the duration of
ankle muscles activity (Figure 13A). A first possible explanation to such inter-
4.5 Discussion 47
individual variability is the difference in ankle stiffness between subjects 6.
Additionally, the inter-individual variability in muscle activation during standing,
in particular the duration of tibialis anterior activation in the elderly, may be due to
different neural sources. With aging, an assortment of impairments arising at the
peripheral and central levels of the nervous system may develop, each impacting
detrimentally and differently on the control of the standing posture 132. By testing
subjects without a sedentary lifestyle we expect to have limited the repertoire of
posture-related impairments affecting present results. A final consideration regards
whether crosstalk could have affected our results. We believe this possibility is
unlikely. First because action potentials were represented locally in the surface
EMGs. For example, the fact that action potentials detected from a given
gastrocnemius region did not appear in neighbor channels (cf. Figure 10 and
expanded view of EMGs in Figure 12) suggest any crosstalk from muscles other
than gastrocnemius was relatively marginal. Moreover, the duration of activity of
both muscles would be the same if crosstalk from soleus had contributed
substantially to EMGs collected from gastrocnemius. In spite of these
considerations, our results show the duration and the region of muscle activity, as
quantified from surface EMGs, discriminate well-aged from young individuals
during standing.
48 Does the plantar flexors activity differ between lower limbs during
standing?
Chapter 5
Does the plantar flexors activity
differ between lower limbs during
standing?
5.1 Abstract
Inferences on the active contribution of plantar flexors to the stabilisation of human
standing posture have been drawn from surface electromyograms (EMGs). Surface
EMGs were however often detected unilaterally, presuming the myoelectric activity
from muscles in a single leg reflects the pattern of muscle activation in both legs.
In this study we question whether surface EMGs detected from plantar flexor
muscles in both legs provide equal estimates of the duration of activity. Arrays of
surface electrodes were used to collect EMGs from gastrocnemius and soleus
muscles while twelve, young male participants stood at ease for 60 s. Muscles in
each leg were deemed active whenever the Root Mean Square amplitude of EMGs
(40ms epochs) detected by any channel in the arrays exceeded the noise level,
defined from EMGs detected during rest. The Chi-Square statistics revealed
significant differences in the relative number of active periods for both muscles in
the majority of participants tested, ranging from 2% to 65% (χ2>17.90; P<0.01).
Pearson correlation analysis indicated side differences in the duration of
gastrocnemius though not soleus activity were associated with the centre of pressure
5.2 Introduction 49
mean, lateral position (R=0.60; P=0.035). These results suggest therefore that
surface EMGs may provide different estimates of the timing of plantar flexors’
activity if collected unilaterally during standing and that asymmetric activation may
be not necessarily associated with weight distribution between limbs. Depending
on the body side from which EMGs are collected, the active contribution of plantar
flexors to standing stabilization may be either under- or over-valued.
5.2 Introduction
Insights into the neuromuscular mechanisms underpinning the control of human
standing posture have been gained from surface EMGs. It seems well established,
for example, that medial gastrocnemius is activated intermittently and soleus is
activated continuously during standing 26,33 . An apparently, equally well accepted
notion in the literature is the neural stiffening of the ankle joint in unstable
circumstances, as suggested by the increased degree of co-activation of plantar and
dorsal flexors 133,134. Moreover, different mechanisms for standing control have
been implicated from calf muscles’ surface EMGs 2,28,135,136. While all these pieces
of evidence substantiate the potential relevance of surface electromyography,
inferences on the neuromuscular determinants of posture control have been often
drawn from EMGs collected from calf muscles in either left or right leg.
Side differences in calf muscles’ activation have been however observed from
surface EMGs detected in different standing conditions. Uneven distribution of
body weight, muscle fatigue, disturbances in proprioceptive or vestibular inputs and
proximity of the center of gravity vertical projection to the ankle joint are some
factors possibly associated with asymmetric activation of ankle plantar flexors 137–
140. While asymmetric activation of plantar flexors may be well expected during
prolonged standing, when e.g. occurrences of shifts in body weight between limbs
are frequent 141, the differential activation of plantar flexors between legs seems
controversial during quiet standing. For example, although Masani et al. 34 reported
the left and right plantar flexors are activated equally during standing others
detected plantar flexors’ EMGs with different amplitudes between legs 139,142. On
top of these disparities, recent evidence has shown surface EMGs sampled locally
from gastrocnemius unlikely represent the whole muscle volume 17,20. It seems
therefore relevant to ask whether inferences on the activation of plantar flexors may
be drawn from EMGs collected unilaterally while subjects stand at ease.
In this study we investigate whether left and right plantar flexors are elicited for
equal durations during standing. Instances of muscle activation are estimated from
50 Does the plantar flexors activity differ between lower limbs during
standing?
surface EMGs sampled with arrays of electrodes from different regions of the
gastrocnemius and soleus muscles, ensuring action potentials represented in
different muscle regions would contribute to estimating periods of muscle activity 143. If plantar flexors of both legs are activated equally during standing, we expect
to observe EMGs with relatively high amplitude for similar durations between
limbs. To our knowledge this is the first study to systematically evaluate the
bilateral representation of plantar flexors’ myoelectric activity during standing.
5.3 Methods
5.3.1 Participants
Twelve young male volunteers (range: 24-34 years; 60-90 kg; 1.70-1.87 m)
participated in this study after providing written, informed consent. Experimental
procedures conformed to the Declaration of Helsinki and were approved by the
Local Ethics Committee (Commissione di Vigilanza, Servizio Sanitario
Nazionale—Regione Piemonte—ASL1—Torino, Italy).
5.3.2 Experimental protocol
Two different tasks were applied. In the first task, subjects were instructed to relax
their muscles completely while lying supine on a padded bed. Surface EMGs
collected at this condition were considered to set the background, noise level as
indicated below. In the second task subjects stood on a force plate for 60 s, with
eyes open, arms alongside the body and feet in a comfortable position. Their heels
and toes were aligned parallel to the force plate lateral axis (Figure 14). The feet
contour was marked on the force plate to ensure participants would keep the same
stance throughout experiments. Subjects were engaged in active conversation to
suppress any voluntary control of calf muscles’ activity during standing 102. The
second task was applied three times, with 2 min intervals in-between.
5.3.3 Signal recordings
Single-differential EMGs were collected from the soleus and medial gastrocnemius
muscles of both legs with linear arrays of silver-bar, surface electrodes (1x10mm;
10mm inter-electrode distance). Arrays of 16 electrodes were positioned over
medial gastrocnemius muscles, aligned parallel to the muscle longitudinal axis and
with the most proximal electrode located 2 cm distally to the popliteal fossa (Figure
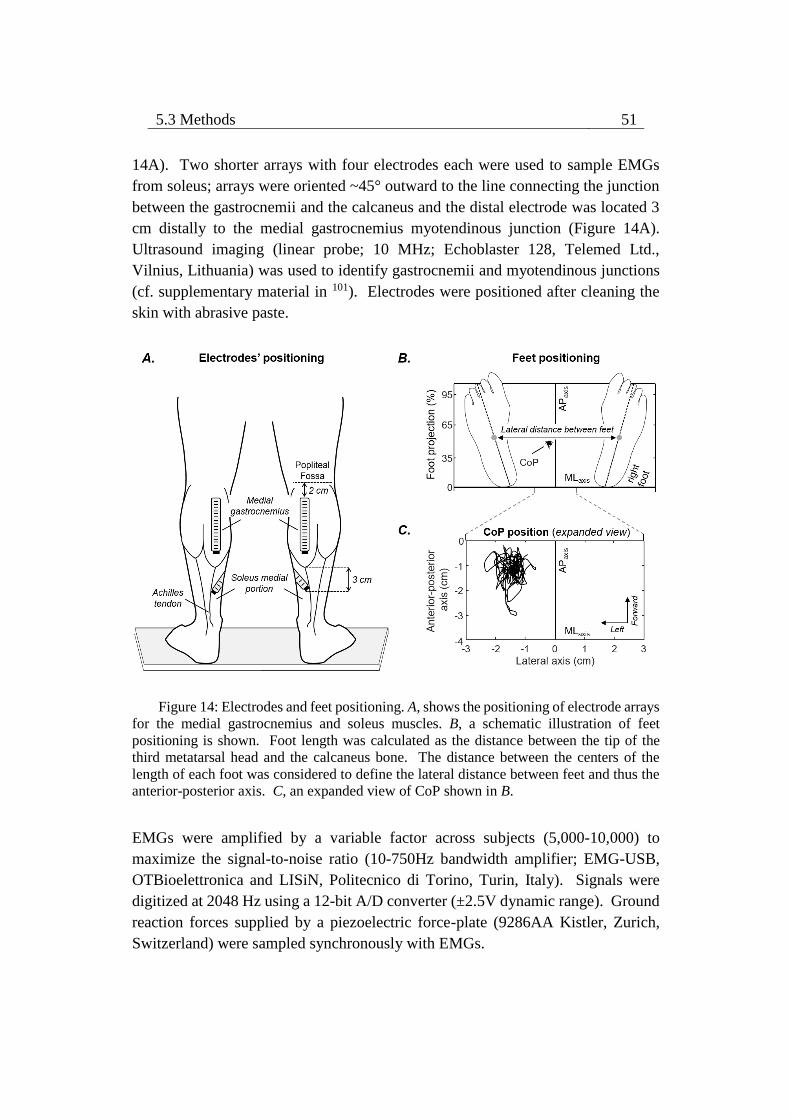
5.3 Methods 51
14A). Two shorter arrays with four electrodes each were used to sample EMGs
from soleus; arrays were oriented ~45° outward to the line connecting the junction
between the gastrocnemii and the calcaneus and the distal electrode was located 3
cm distally to the medial gastrocnemius myotendinous junction (Figure 14A).
Ultrasound imaging (linear probe; 10 MHz; Echoblaster 128, Telemed Ltd.,
Vilnius, Lithuania) was used to identify gastrocnemii and myotendinous junctions
(cf. supplementary material in 101). Electrodes were positioned after cleaning the
skin with abrasive paste.
Figure 14: Electrodes and feet positioning. A, shows the positioning of electrode arrays
for the medial gastrocnemius and soleus muscles. B, a schematic illustration of feet
positioning is shown. Foot length was calculated as the distance between the tip of the
third metatarsal head and the calcaneus bone. The distance between the centers of the
length of each foot was considered to define the lateral distance between feet and thus the
anterior-posterior axis. C, an expanded view of CoP shown in B.
EMGs were amplified by a variable factor across subjects (5,000-10,000) to
maximize the signal-to-noise ratio (10-750Hz bandwidth amplifier; EMG-USB,
OTBioelettronica and LISiN, Politecnico di Torino, Turin, Italy). Signals were
digitized at 2048 Hz using a 12-bit A/D converter (±2.5V dynamic range). Ground
reaction forces supplied by a piezoelectric force-plate (9286AA Kistler, Zurich,
Switzerland) were sampled synchronously with EMGs.
52 Does the plantar flexors activity differ between lower limbs during
standing?
5.3.4. Assessment of muscle activity
Initially, raw EMGs were visually inspected for the identification of channels with
contact problems or massive power line interference; 13 out of 432 channels were
discarded. Moreover, specifically for gastrocnemius, the most distal channels in the
array detecting propagating potentials were excluded. The presence of propagating
potentials indicates the distal channels provide redundant information on muscle
activation, given they sample from the same rather than from different
gastrocnemius fibres (cf. Figure 1 in 20). After visual inspection, EMGs were band-
pass filtered (15–350Hz cut-off; 4th order Butterworth bidirectional filter). Root
Mean Square (RMS) amplitude was then computed over 40ms epochs 14, providing
a total of 1,500 RMS values per channel.
The duration of muscle activity was estimated from RMS values. First, background
activity was defined from RMS values calculated for EMGs detected with the plantar
flexors at rest; background level was set as the mean plus three standard deviations
calculated over 3s of rest (40ms epochs;14). Background level was defined
separately for each channel in each array of electrodes. Whenever the RMS
amplitude of any channel in a given array exceeded the background level, the
corresponding muscle was deemed active during standing. This procedure provided
a series of active instances, indicating the proportion of the standing test during
which the activity of each muscle in each limb exceeded the background level (cf.
Figure 2 in 143). Finally, the median number of active periods across the three
standing tests was considered for analysis.
5.3.5 Calculation of CoP lateral position
CoP position was computed from the vertical, ground reaction forces and then low-
pass filtered (5 Hz cut-off; 2nd order Butterworth filter). CoP coordinates in the
frontal plane were averaged across the whole standing duration and across the three
standing tests. This mean CoP position was then: i) referred to the anterior-posterior
axis passing midway through the lateral distance between feet (Figure 14B), with
negative values indicating CoP was on average closer to the left foot; ii) normalized
with respect to the lateral distance between feet, compensating for the different,
comfortable stances adopted by participants.
5.4 Results 53
5.3.6 Statistical Analysis
Contingence tables were created from the median number of active instances,
separately for each muscle and subject. The Chi-square (χ2) test was then applied
to test for whether the proportion of active periods between limbs was similar
during standing 144. After ensuring the data distribution was Gaussian (Shapiro-
Wilk’s W test, P>0.23 in all cases), Pearson correlation was applied to verify
whether side-differences in the duration of activity (i.e., right/left ratio of the
number of active periods) were associated with the CoP mean position in the frontal
plane.
5.4 Results
Side-differences in plantar flexors’ activity
Activation periods obtained from surface EMGs detected from different muscle
regions were not the same. As shown for a representative participant (5s epoch;
Fig. 15A), EMGs with relatively high amplitude were predominantly detected from
the distal region of the right gastrocnemius muscle. Close inspection of an
expanded view of these raw EMGs further indicates that action potentials of
different motor units were detected from different regions, resulting in the
identification of different periods of activity across channels. Our procedure for
estimating the duration of muscle activity was not sensitive however to regional
differences in EMG amplitude; regardless of where action potentials were detected
from the muscle they were considered to estimate periods of activity (cf. grey
rectangles in Fig. 15B right panel).
Statistically significant side differences in the duration of activity were observed
for at least 10 out of 12 participants tested during standing (Fig. 16). The absolute
right-left difference in the duration of activity ranged from 3.7% to 65.3% for the
gastrocnemius muscle (Fig. 16A; χ2>33.35; P<0.01; N=10 subjects). For the soleus
muscle, this difference ranged from 2.0% to 37.2% (Fig. 3B; χ2>17.90; P<0.01;
N=11 subjects). Differences in the duration of activity were not observed
consistently for the same side and muscle; two and four participants activated
respectively more frequently the gastrocnemius and soleus muscles of the right leg
(cf. circles and squares in Fig. 16). Although participants five and six activated the
left and right gastrocnemius for a similar, relative duration (~50%; Fig. 16A), these
muscles were concurrently active during less than 30% of the standing test (cf. grey
rectangles in Fig. 16). Finally, for all participants, regardless of the leg considered,
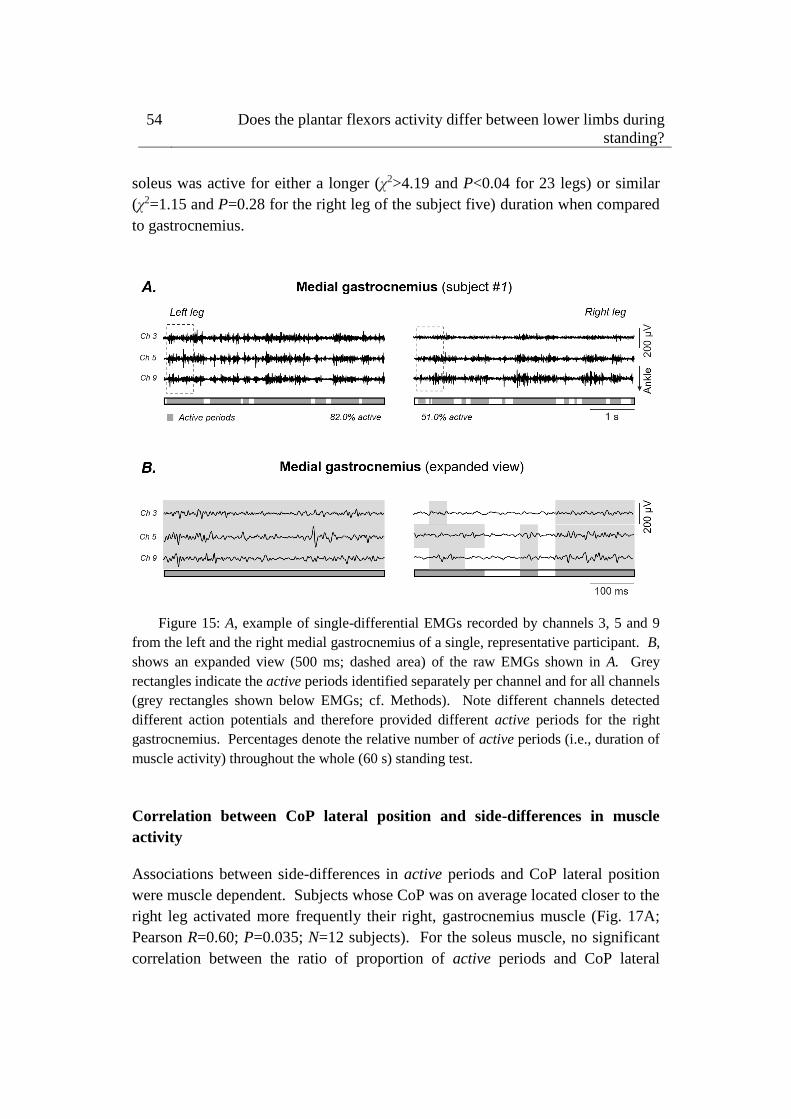
54 Does the plantar flexors activity differ between lower limbs during
standing?
soleus was active for either a longer (χ2>4.19 and P<0.04 for 23 legs) or similar
(χ2=1.15 and P=0.28 for the right leg of the subject five) duration when compared
to gastrocnemius.
Figure 15: A, example of single-differential EMGs recorded by channels 3, 5 and 9
from the left and the right medial gastrocnemius of a single, representative participant. B,
shows an expanded view (500 ms; dashed area) of the raw EMGs shown in A. Grey
rectangles indicate the active periods identified separately per channel and for all channels
(grey rectangles shown below EMGs; cf. Methods). Note different channels detected
different action potentials and therefore provided different active periods for the right
gastrocnemius. Percentages denote the relative number of active periods (i.e., duration of
muscle activity) throughout the whole (60 s) standing test.
Correlation between CoP lateral position and side-differences in muscle
activity
Associations between side-differences in active periods and CoP lateral position
were muscle dependent. Subjects whose CoP was on average located closer to the
right leg activated more frequently their right, gastrocnemius muscle (Fig. 17A;
Pearson R=0.60; P=0.035; N=12 subjects). For the soleus muscle, no significant
correlation between the ratio of proportion of active periods and CoP lateral
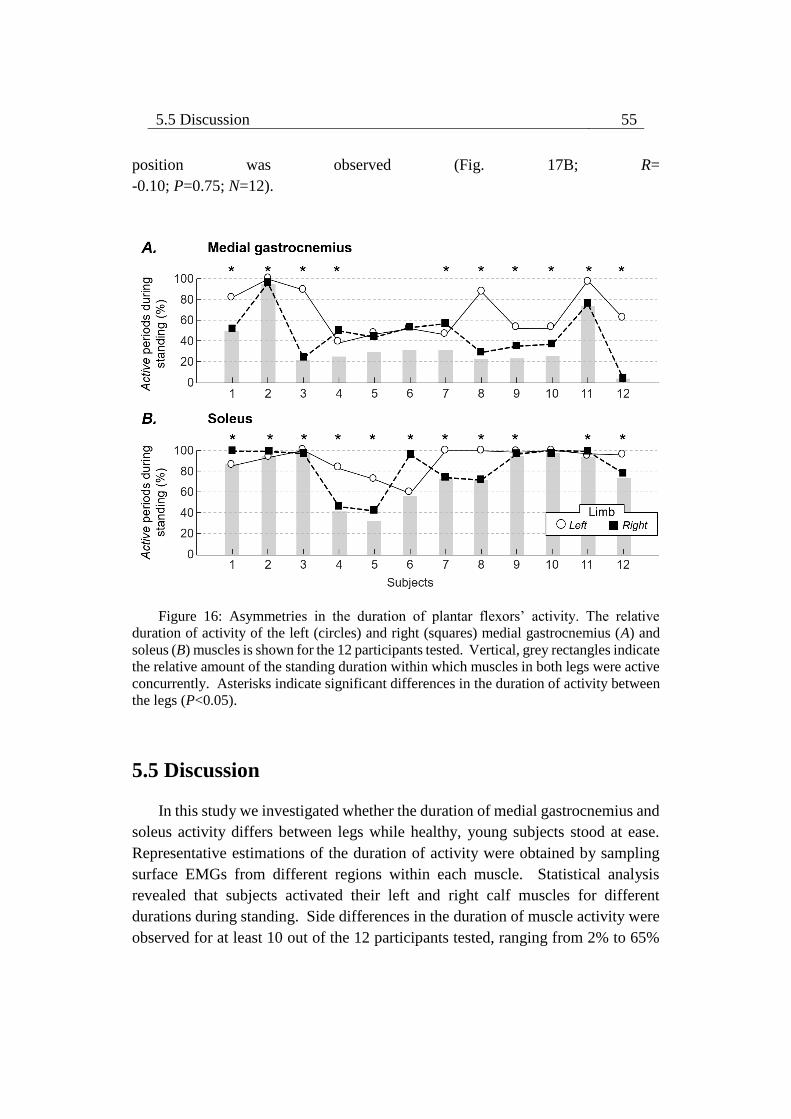
5.5 Discussion 55
position was observed (Fig. 17B; R=
-0.10; P=0.75; N=12).
Figure 16: Asymmetries in the duration of plantar flexors’ activity. The relative
duration of activity of the left (circles) and right (squares) medial gastrocnemius (A) and
soleus (B) muscles is shown for the 12 participants tested. Vertical, grey rectangles indicate
the relative amount of the standing duration within which muscles in both legs were active
concurrently. Asterisks indicate significant differences in the duration of activity between
the legs (P<0.05).
5.5 Discussion
In this study we investigated whether the duration of medial gastrocnemius and
soleus activity differs between legs while healthy, young subjects stood at ease.
Representative estimations of the duration of activity were obtained by sampling
surface EMGs from different regions within each muscle. Statistical analysis
revealed that subjects activated their left and right calf muscles for different
durations during standing. Side differences in the duration of muscle activity were
observed for at least 10 out of the 12 participants tested, ranging from 2% to 65%
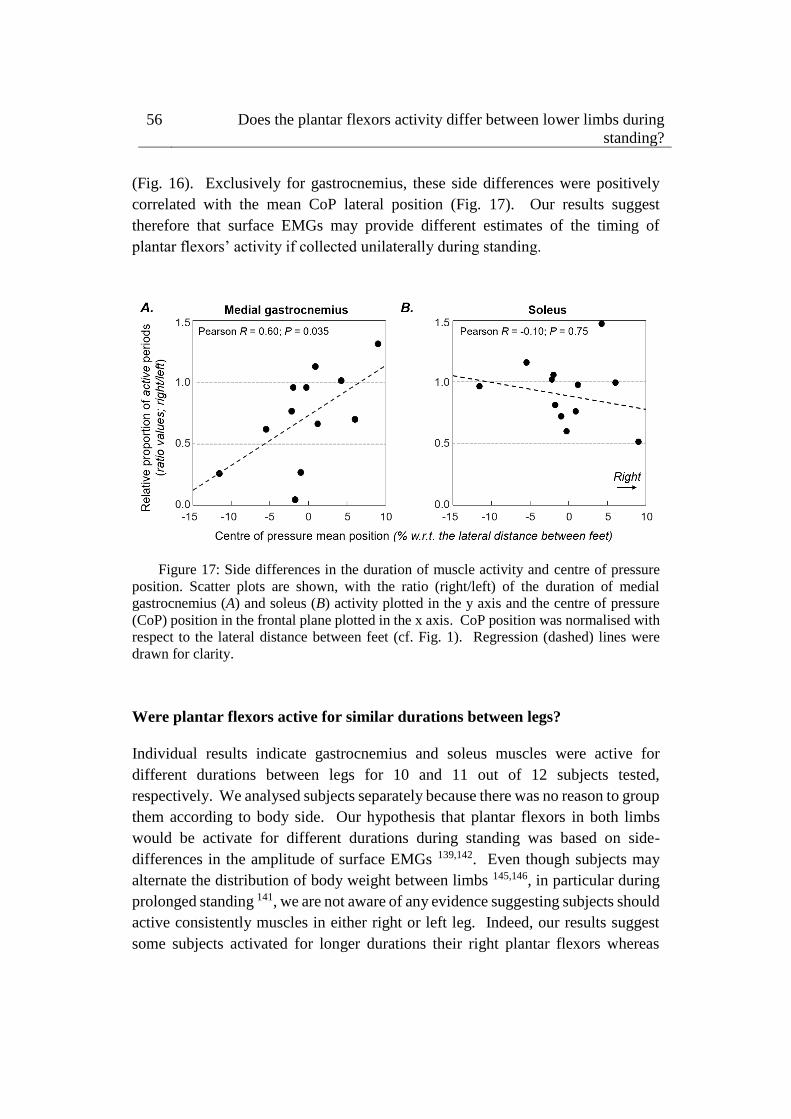
56 Does the plantar flexors activity differ between lower limbs during
standing?
(Fig. 16). Exclusively for gastrocnemius, these side differences were positively
correlated with the mean CoP lateral position (Fig. 17). Our results suggest
therefore that surface EMGs may provide different estimates of the timing of
plantar flexors’ activity if collected unilaterally during standing.
Figure 17: Side differences in the duration of muscle activity and centre of pressure
position. Scatter plots are shown, with the ratio (right/left) of the duration of medial
gastrocnemius (A) and soleus (B) activity plotted in the y axis and the centre of pressure
(CoP) position in the frontal plane plotted in the x axis. CoP position was normalised with
respect to the lateral distance between feet (cf. Fig. 1). Regression (dashed) lines were
drawn for clarity.
Were plantar flexors active for similar durations between legs?
Individual results indicate gastrocnemius and soleus muscles were active for
different durations between legs for 10 and 11 out of 12 subjects tested,
respectively. We analysed subjects separately because there was no reason to group
them according to body side. Our hypothesis that plantar flexors in both limbs
would be activate for different durations during standing was based on side-
differences in the amplitude of surface EMGs 139,142. Even though subjects may
alternate the distribution of body weight between limbs 145,146, in particular during
prolonged standing 141, we are not aware of any evidence suggesting subjects should
active consistently muscles in either right or left leg. Indeed, our results suggest
some subjects activated for longer durations their right plantar flexors whereas
5.5 Discussion 57
others showed the opposite (Fig. 16). Differences in the duration of muscle activity
between legs were also variable between subjects, ranging from 4% to 65% for
gastrocnemius and from 2% to 40% for soleus. Regardless of these inter-individual
differences in the duration of activity, asymmetries in the duration of the period
through which gastrocnemius and soleus muscles were active were generally
observed (Fig. 16). Results shown in Fig. 16 seem therefore to support the notion
that muscles in both limbs were elicited for different durations during standing.
Side differences in the duration of activity differed between muscles. Subjects
showing the greatest differences in the duration of gastrocnemius and soleus
activity between legs were different (Fig. 16). Specifically concerning
gastrocnemius, the duration of activity was associated with the CoP mean, lateral
position; subjects standing closer to the right leg activated for longer duration their
right gastrocnemius muscle and vice-versa (Fig. 17). This observation is consistent
with the documented contribution of gastrocnemius muscle to the production of
ankle inversion torque 111,147. Similar reports on a systematic contribution of soleus
to ankle inversion-eversion moments were not found, possibly because the soleus
line of action is directed more closely to the midline of the foot than that of
gastrocnemius 147. Asymmetries in the timing of activation of gastrocnemius
though not of soleus were partly explained (36%; Fig. 17) by lateral differences in
the CoP mean position, which may be therefore associated with the uneven loading
of both legs 148. Corroborating this differential muscle response, Henry and
colleagues 110 observed the medial gastrocnemius responds to surface translations
directed over a larger, oblique range than soleus (cf. their Fig. 3). When drawing
considerations on differences between muscles from current results, it should be
noted however we were able to sample from a small, medial region of the large
soleus muscle (Fig. 14), not concealed by gastrocnemius. As discussed by Agur et
al. 149, in virtue of architectural differences within soleus, surface EMGs collected
from the muscle medial region may reflect a predominant, plantar flexion action.
Regardless of the actual, predominant action of the soleus region sampled in this
study, asymmetries in the duration of activity were observed (Fig. 16). Factors
other than CoP mean lateral position may contribute to explaining side differences
in the duration of plantar flexors’ activity. While the identification of these sources
urges further investigation, current results suggest inferences on the timing of
muscle activation during standing may not proceed from EMGs collected
unilaterally.
58 Does the plantar flexors activity differ between lower limbs during
standing?
What are the implications of asymmetric activation of plantar flexors?
Before commenting on the implications of current findings, we would like to
mention we assessed side differences in the timing rather than in the degree of
muscle activity. Two reasons motivated our decision. First, averaging the
amplitude of EMGs across the whole standing duration would provide a biased
indication on the degree of muscle activity; low, average EMG amplitude may not
necessarily indicate low degree of activation but e.g. alternated periods of rest and
activity 14,143. Most importantly, the timing of muscle activity, as quantified from
surface EMGs, has provided substantial contribution to our understanding of the
human, postural control. It seems to discriminate well the pattern of activation of
different muscles 33 and populations 14,95 during standing. It has also driven the
notion that standing stabilisation may be achieved well by alternating periods of
muscle silencing and activation 28,33. Asking therefore whether surface EMGs
detected from muscles in either leg reflect muscles in both legs during standing
seems of general relevance.
Results presented here have direct, practical and methodological implications. On
one hand, our results corroborate the general view that gastrocnemius and soleus
remain active for different durations during standing; despite the inter-individual
difference in the stiffness of the ankle joint 6, previous studies consistently report
that gastrocnemius and soleus are activated respectively intermittently and
continuously during standing 26,33. On the other hand, our results (Fig. 16) indicate
that surface EMGs detected bilaterally do not provide equal estimates of the
duration of plantar flexors activity. Even the soleus muscle, which is often observed
to be active continuously during standing 26,34, showed a variable duration of
activity between legs for some subjects (Fig. 16B). These results are not necessarily
in contrast with the view that humans sway as an inverted pendulum during
standing. While experimental observations of CoP and centre of gravity sways have
confirmed the inverted pendulum, standing model 4, the inverted pendulum
assumption does not seem to justify stating ankle muscles in both legs are activated
similarly (Fig. 16). More specifically, according to results presented here, the
active participation of plantar flexors to the correction of bodily sways may be
either under- or over-valued, depending on the body side from which surface EMGs
are detected. Drawing inferences on the neural mechanisms governing the
activation of plantar flexors during standing may therefore require the detection of
EMGs from both legs.
6.1 Abstract 59
Chapter 6
Is the attenuation effect on the ankle
muscles activity from the EMG
biofeedback generalized to – or
compensated by – other lower limb
muscles during standing?
6.1 Abstract
Biofeedback based on electromyograms (EMGs) is a promising technique to reduce
exaggerated muscle activity. For example, it has been recently shown that healthy
subjects are able to suppress the plantar flexors’ activity when provided with EMG-
audio feedback during standing without threatening stability. Whether however the
effect of EMG-biofeedback on the ankle muscles’ activity generalizes to – or is
compensated by – other muscles not included for the biofeedback is still an open
question we address here. Fourteen young individuals were asked to stand barefoot
comfortably with eyes open. Three 60 s standing trials were applied: (i) without
EMG-audio feedback, (ii) with EMG-audio feedback from medial gastrocnemius
and soleus and (iii) with EMG-audio feedback from medial gastrocnemius and
tibialis anterior muscles. Surface EMGs from the soleus medial aspect, medial
60 Is the attenuation effect on the ankle muscles activity from the EMG
biofeedback generalized to – or compensated by – other lower limb
muscles during standing?
gastrocnemius, tibialis anterior, vastus medialis, vastus lateralis, semitendinosus,
and biceps femoris of both legs were sampled with a pair of surface electrodes. The
Root Mean Square (RMS) of EMGs over the whole standing duration was averaged
across sides to assess the degree of postural activity for each muscle. In relation to
standing at ease, our main findings revealed EMG-audio feedback from medial
gastrocnemius and soleus muscles decreases the EMG level of plantar flexors
(~15%; P < 0.05), did not change the level of tibialis anterior’s activity (P > 0.05)
and increases the amplitude of surface EMGs sampled from vastus medialis and
lateralis muscles (~ 40%; P < 0.05). In contrast, EMG-audio feedback from medial
gastrocnemius and tibialis anterior muscles leads to a reduction in the level plantar
flexors’ activity (~5%; P < 0.05) without increasing the amplitude of EMGs
collected from the tibialis anterior, vastus medialis, vastus lateralis, semitendinosus,
and biceps femoris (P > 0.05). These alterations in the level of postural activity
were accompanied by a posterior shift of the mean CoP position (~5% of the foot
length projection; P < 0.05 when using the feedback from both plantar flexors) and
no significant changes in the size of CoP sways (P > 0.05) regardless of EMG
biofeedback condition. These results indicate the attenuation effect of EMG-audio
feedback on calf muscles is not compensated by other lower limbs muscles not
included for the feedback depending on the biofeedback condition tested here.
Therefore, the EMG-audio feedback may be a promising technique to assist
individuals in reducing excessive muscle activity without overloading other lower
limbs muscle during standing.
6.2 Introduction
EMG biofeedback is a promising technique to re-educate the pattern of muscle
activity during a task. Prior accounts have observed individuals while receiving
continuously real-time information about the own level of muscle activity are able
to attenuate or extend the level of muscle activity. For example, EMG biofeedback
has been effective to directly assist patients with chronic muscle pain in reducing
the excessive level of muscle activity associated likely with the muscle pain (e.g.,
in the neck-shoulder; 25). Likewise, reductions in the level of wrist flexor muscle
spasticity at the hemiplegic arm in patients following stroke were also observed
after an EMG biofeedback training 81. Alternatively, EMG biofeedback may also
assist individuals in increasing the degree of muscle activity 80,91. Collectively,
these results suggest individuals could learn to change their pattern of muscle
6.2 Introduction 61
activity with the EMG biofeedback-based training; potential technique to re-
educate muscle activity.
Recently, EMG biofeedback has been proposed for reducing the exaggerated
muscle activity while individuals stand at ease. To author knowledge, Vieira et al. 72 investigated for the first time the influence of EMG-audio feedback protocol on
the ankle muscles’ activity during standing. In relation to standing at ease, the
authors observed young subjects were able to decrease by 5% and 10% the degree
of medial gastrocnemius and soleus muscles’ activity, respectively, with the EMG-
audio feedback. This attenuation effect on the calf muscles’ activity from the EMG-
audio feedback did not lead to excessive postural sways and greater level of
antagonistic activation. These results indicate EMG-audio feedback could assist
young subjects in more efficiently controlling leg muscle activity without hindering
postural stability. As recently put forward in the literature, reduction of
unnecessary muscle activation may provide possible advantages for the control of
posture, such as: (i) proprioceptive feedback without noise from muscle contraction 30; (ii) body stability from an economical, fatigue-resistant control 36; (iii) decreases
in postural rigidity 56. Thus, the possibility of minimizing muscular effort without
excessively increasing the size of postural sway may posit an innovative training
paradigm specifically targeting the fine control of postural sways, with particular
relevance for the training of populations who activate exaggeratedly their muscles
during standing, e.g. aged individuals.
Additional investigations, however, might be relevant to understand the effects of
this technique on the level of activity of lower limbs muscles. Researchers have
long been indicated the assessment of response generalization of EMG biofeedback
should be considered in the repertoire of EMG biofeedback protocols aimed at
reducing the general level of muscle activity 87. The main concern is whether the
attenuation effect on an single muscle from EMG biofeedback is manifested at – or
compensated by - other muscles during the task 89. Prior accounts have
demonstrated that an attenuation effect and/or compensation effect from EMG
biofeedback protocols may occur between muscles depending on the motor task.
On one hand, EMG feedback from a targeted muscle seems sufficient to transfer
the relaxation effect to the contralateral muscle during computer work conditions 24,93. On the other hand, limitation to transfer the relaxation effect to not-synergistic
muscles may occur when biofeedback is provided from a single muscle during
computer work conditions 93. Moreover, other muscles not included in the feedback
may compensate the attenuation effect on the targeted muscle from the EMG
biofeedback in strictly controlled biomechanics conditions (i.e., isometric shoulder
62 Is the attenuation effect on the ankle muscles activity from the EMG
biofeedback generalized to – or compensated by – other lower limb
muscles during standing?
abductions 94). Collectively, these results suggest it is relevant to assess the activity
of other muscles not included in the biofeedback to prove the effectiveness of
innovative biofeedback protocols in reducing the level of muscle activity, e.g.
during standing.
This study aimed at investigating therefore whether the attenuation effect on calf
muscles from the EMG-audio biofeedback is generalized to – or compensated by -
other lower limbs muscles during standing. If the attenuation effect of EMG-audio
feedback on calf muscle’ activity is not compensated by other muscles, we expect
to observe: (i) bipolar EMGs collected from the ankle muscles with lower amplitude
than those sampled during standing at ease; and (ii) bipolar EMGs collected from
the thigh muscles with amplitude values within standing at ease levels, since thigh
muscles seem to contribute marginally for the control of standing balance in
healthy, young subjects 11,14.
6.3 Methods
6.3.1 Participants
Fourteen young individuals (12 men; range values: age 21–36 years; body mass 58–
88 kg; height 162–190 cm) were tested and provided written informed consent
before participating in the study. The experimental procedures considered in this
study conformed to the latest Declaration of Helsinki and were approved by the
Regional Ethics Committee (Commissione di Vigilanza, Servizio Sanitario
Nazionale—Regione Piemonte—ASL1—Torino, Italy). Volunteers did not report
any balance impairments, neurological disorders, muscular injuries, or the intake of
medications that could affect their standing balance at the occasion of experiments.
6.3.2 Experimental protocol
Participants were instructed to stand upright barefoot on a force plate, with eyes
open and arms alongside the body. They positioned their feet at a comfortable
orientation and distance, while keeping heels and toes at the same position along
the force plate anterior-posterior axis. Prior to starting experiments, the contour of
both feet was marked on the force plate to ensure participants would keep the same
feet position throughout the standing tests.
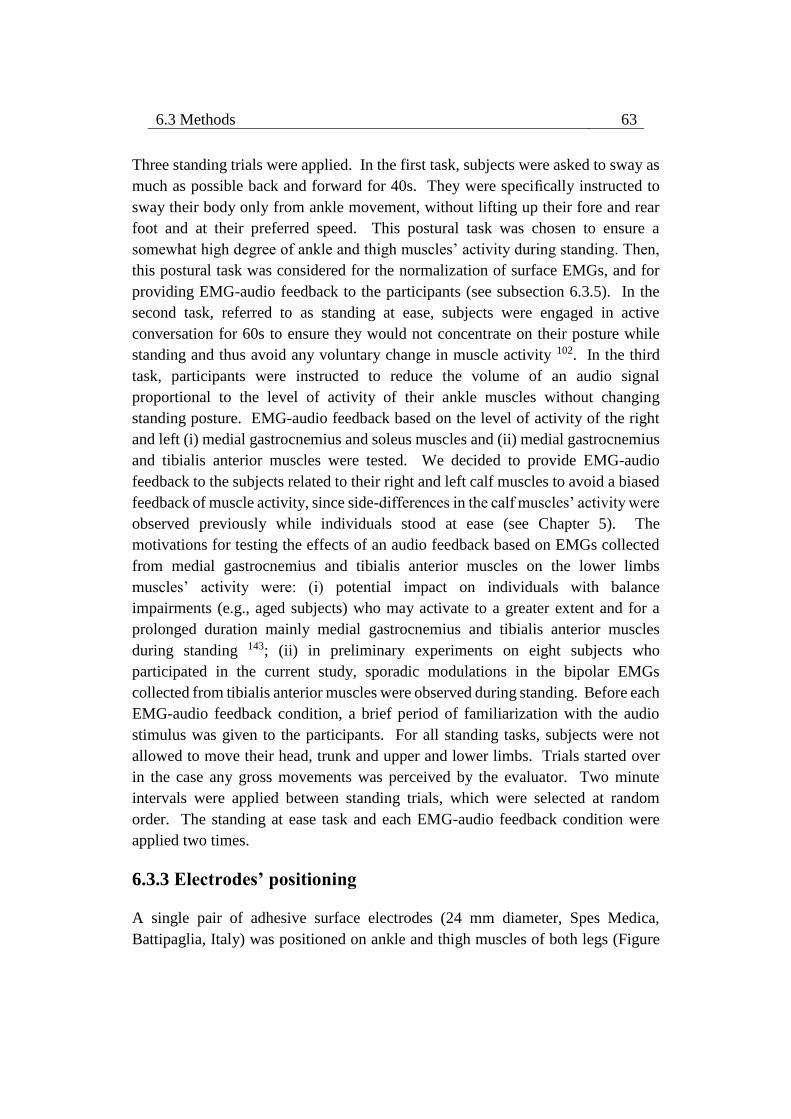
6.3 Methods 63
Three standing trials were applied. In the first task, subjects were asked to sway as
much as possible back and forward for 40s. They were specifically instructed to
sway their body only from ankle movement, without lifting up their fore and rear
foot and at their preferred speed. This postural task was chosen to ensure a
somewhat high degree of ankle and thigh muscles’ activity during standing. Then,
this postural task was considered for the normalization of surface EMGs, and for
providing EMG-audio feedback to the participants (see subsection 6.3.5). In the
second task, referred to as standing at ease, subjects were engaged in active
conversation for 60s to ensure they would not concentrate on their posture while
standing and thus avoid any voluntary change in muscle activity 102. In the third
task, participants were instructed to reduce the volume of an audio signal
proportional to the level of activity of their ankle muscles without changing
standing posture. EMG-audio feedback based on the level of activity of the right
and left (i) medial gastrocnemius and soleus muscles and (ii) medial gastrocnemius
and tibialis anterior muscles were tested. We decided to provide EMG-audio
feedback to the subjects related to their right and left calf muscles to avoid a biased
feedback of muscle activity, since side-differences in the calf muscles’ activity were
observed previously while individuals stood at ease (see Chapter 5). The
motivations for testing the effects of an audio feedback based on EMGs collected
from medial gastrocnemius and tibialis anterior muscles on the lower limbs
muscles’ activity were: (i) potential impact on individuals with balance
impairments (e.g., aged subjects) who may activate to a greater extent and for a
prolonged duration mainly medial gastrocnemius and tibialis anterior muscles
during standing 143; (ii) in preliminary experiments on eight subjects who
participated in the current study, sporadic modulations in the bipolar EMGs
collected from tibialis anterior muscles were observed during standing. Before each
EMG-audio feedback condition, a brief period of familiarization with the audio
stimulus was given to the participants. For all standing tasks, subjects were not
allowed to move their head, trunk and upper and lower limbs. Trials started over
in the case any gross movements was perceived by the evaluator. Two minute
intervals were applied between standing trials, which were selected at random
order. The standing at ease task and each EMG-audio feedback condition were
applied two times.
6.3.3 Electrodes’ positioning
A single pair of adhesive surface electrodes (24 mm diameter, Spes Medica,
Battipaglia, Italy) was positioned on ankle and thigh muscles of both legs (Figure
64 Is the attenuation effect on the ankle muscles activity from the EMG
biofeedback generalized to – or compensated by – other lower limb
muscles during standing?
18). Inter-electrode distance was defined according to the total tissue
(subcutaneous + muscle) thickness for each muscle tested using ultrasound imaging
as described in the following. We expected such inter-electrode distance provides
more representative information of muscle activity with negligible activity from
nearby muscles (i.e., crosstalk) 21. At the ankle level, medial gastrocnemius, soleus
(medial aspect) and tibialis anterior muscles were studied. In the medial
gastrocnemius, the center of distal electrode was positioned medially to the most
distal part of junction between gastrocnemius’ heads and, the bipolar system was
positioned parallel to the line connecting the junction between medial
gastrocnemius and Achilles tendon and the popliteal fossa. The positioning of a
pair of surface electrodes moderately spaced on the medial gastrocnemius’ distal-
medial region may sample bipolar EMG more representative of muscle activity,
since active postural units may reside more distally in the medial gastrocnemius 20.
In the medial aspect of soleus muscle, the distal electrode was positioned 3 cm
distally from the junction between the Achilles tendon and the medial
gastrocnemius 23 and the center of the proximal electrode was positioned at an angle
of 45 degrees to the line connecting the junction between gastrocnemius’ heads and
the calcaneus tip. The bipolar system on the tibialis anterior muscle was positioned
parallel to the muscle longitudinal axis and located 1 cm laterally to the tibial crest;
the center of the proximal electrode was positioned 2 cm distally to the head of
fibula bone. As propagating potentials may be observed in surface EMGs collected
from multiple surface electrodes positioned serially on the distal-medial region of
tibialis anterior muscle 143, we expected that a pair of surface electrodes moderately
spaced and positioned on the medial-proximal region of tibialis anterior provides
bipolar EMG representative of different muscle fibers. For each thigh muscle, the
pair of surface electrodes was positioned approximately on the most prominent
bulge of the muscle belly 11,14,130 and with an inter-electrode distance equivalent to
total tissue thickness. Given the pennate architecture of thigh muscles18, such
positioning is expected to provide bipolar EMGs more representative of muscle
activity.
Ultrasound imaging was used to estimate total tissue (subcutaneous + muscle)
thickness as well as to identify gastrocnemii junction and their myotendinous
junction (cf. Supplementary Material in Vieira et al., 2010b). Briefly, parasagittal
images of ankle and thigh muscles were taken with a linear, ultrasound probe
(10MHz, 4cm length; Echo Blaster 128, Telemed Ltd., Vilnius, Lithuania) located
approximately on the same electrodes’ positioning, with participants lying
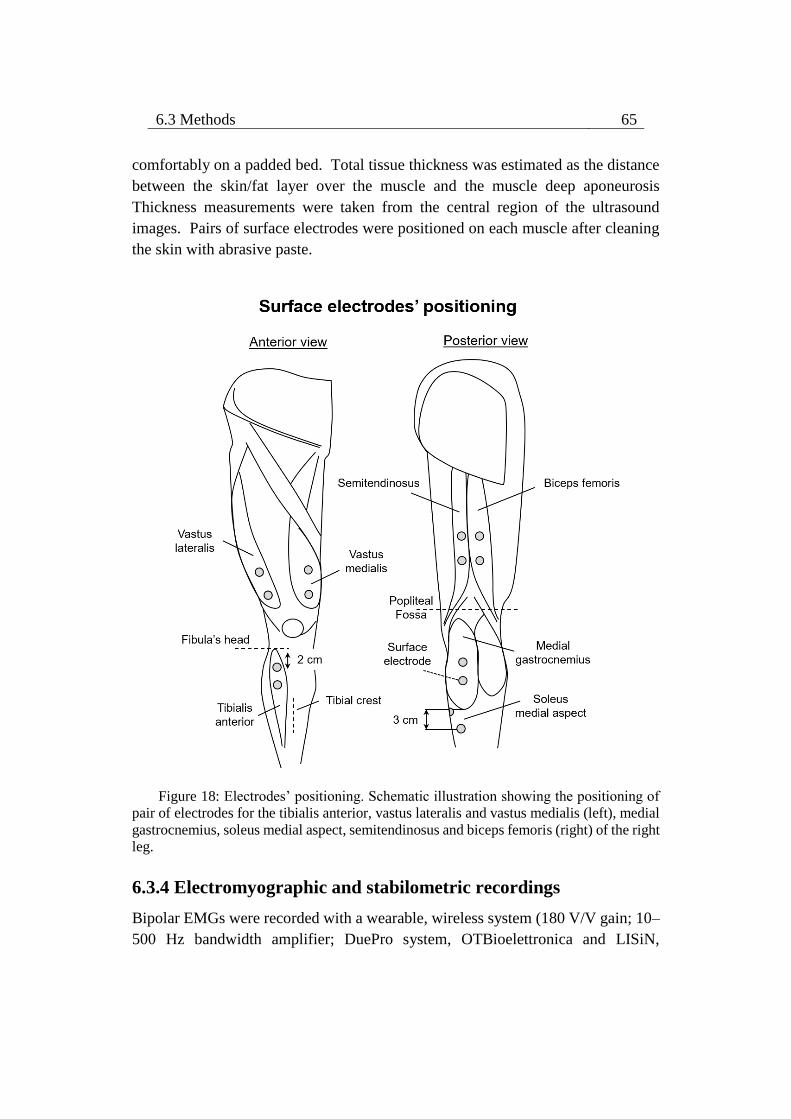
6.3 Methods 65
comfortably on a padded bed. Total tissue thickness was estimated as the distance
between the skin/fat layer over the muscle and the muscle deep aponeurosis
Thickness measurements were taken from the central region of the ultrasound
images. Pairs of surface electrodes were positioned on each muscle after cleaning
the skin with abrasive paste.
Figure 18: Electrodes’ positioning. Schematic illustration showing the positioning of
pair of electrodes for the tibialis anterior, vastus lateralis and vastus medialis (left), medial
gastrocnemius, soleus medial aspect, semitendinosus and biceps femoris (right) of the right
leg.
6.3.4 Electromyographic and stabilometric recordings
Bipolar EMGs were recorded with a wearable, wireless system (180 V/V gain; 10–
500 Hz bandwidth amplifier; DuePro system, OTBioelettronica and LISiN,
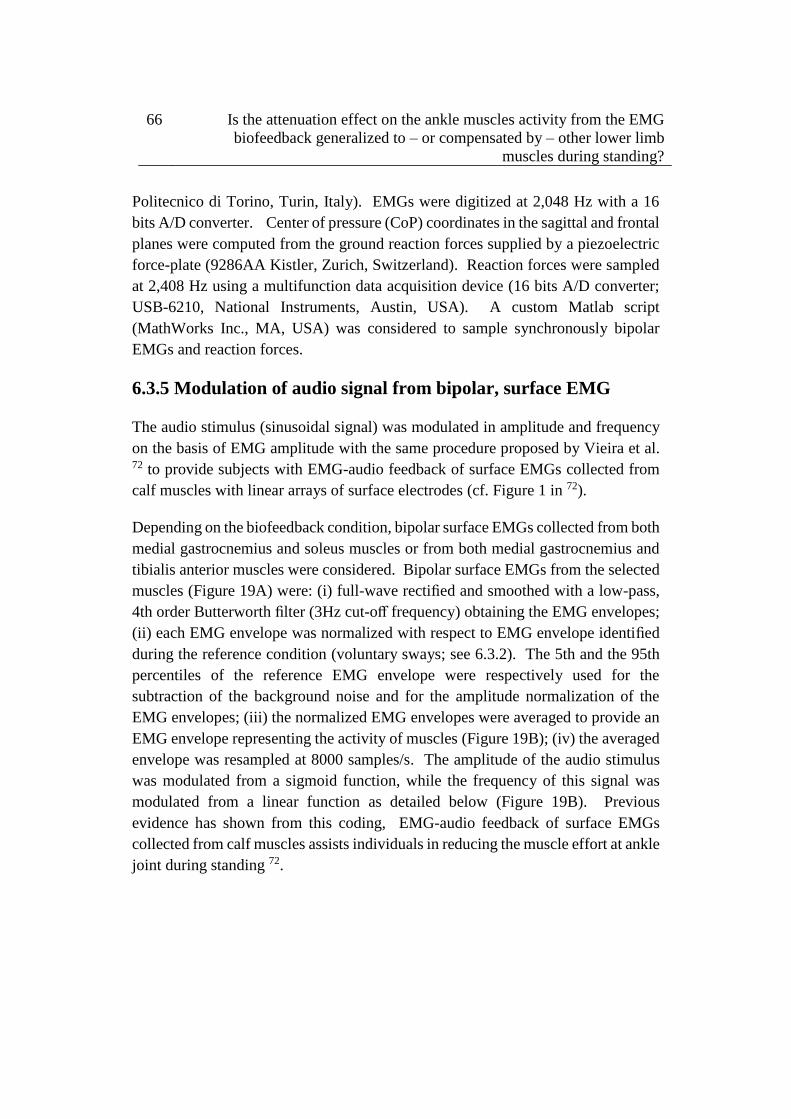
66 Is the attenuation effect on the ankle muscles activity from the EMG
biofeedback generalized to – or compensated by – other lower limb
muscles during standing?
Politecnico di Torino, Turin, Italy). EMGs were digitized at 2,048 Hz with a 16
bits A/D converter. Center of pressure (CoP) coordinates in the sagittal and frontal
planes were computed from the ground reaction forces supplied by a piezoelectric
force-plate (9286AA Kistler, Zurich, Switzerland). Reaction forces were sampled
at 2,408 Hz using a multifunction data acquisition device (16 bits A/D converter;
USB-6210, National Instruments, Austin, USA). A custom Matlab script
(MathWorks Inc., MA, USA) was considered to sample synchronously bipolar
EMGs and reaction forces.
6.3.5 Modulation of audio signal from bipolar, surface EMG
The audio stimulus (sinusoidal signal) was modulated in amplitude and frequency
on the basis of EMG amplitude with the same procedure proposed by Vieira et al. 72 to provide subjects with EMG-audio feedback of surface EMGs collected from
calf muscles with linear arrays of surface electrodes (cf. Figure 1 in 72).
Depending on the biofeedback condition, bipolar surface EMGs collected from both
medial gastrocnemius and soleus muscles or from both medial gastrocnemius and
tibialis anterior muscles were considered. Bipolar surface EMGs from the selected
muscles (Figure 19A) were: (i) full-wave rectified and smoothed with a low-pass,
4th order Butterworth filter (3Hz cut-off frequency) obtaining the EMG envelopes;
(ii) each EMG envelope was normalized with respect to EMG envelope identified
during the reference condition (voluntary sways; see 6.3.2). The 5th and the 95th
percentiles of the reference EMG envelope were respectively used for the
subtraction of the background noise and for the amplitude normalization of the
EMG envelopes; (iii) the normalized EMG envelopes were averaged to provide an
EMG envelope representing the activity of muscles (Figure 19B); (iv) the averaged
envelope was resampled at 8000 samples/s. The amplitude of the audio stimulus
was modulated from a sigmoid function, while the frequency of this signal was
modulated from a linear function as detailed below (Figure 19B). Previous
evidence has shown from this coding, EMG-audio feedback of surface EMGs
collected from calf muscles assists individuals in reducing the muscle effort at ankle
joint during standing 72.
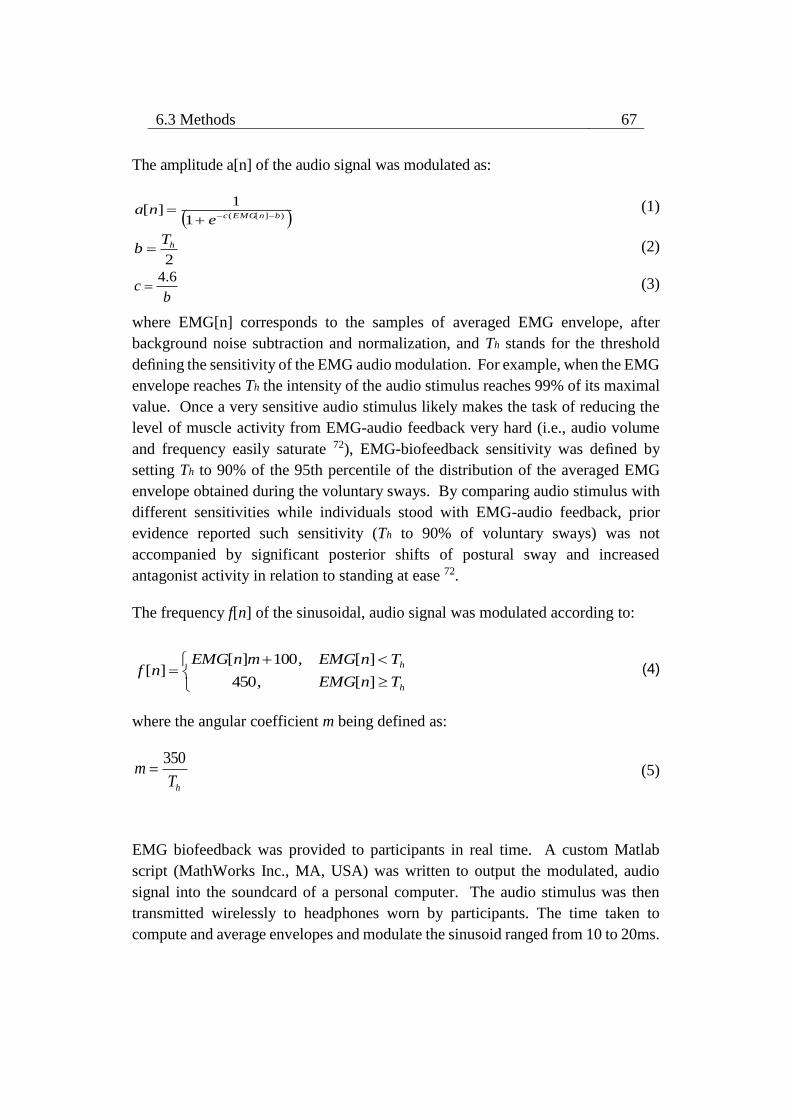
6.3 Methods 67
The amplitude a[n] of the audio signal was modulated as:
)][(1
1][
bnEMGcena
(1)
2
hTb (2)
bc
6.4 (3)
where EMG[n] corresponds to the samples of averaged EMG envelope, after
background noise subtraction and normalization, and Th stands for the threshold
defining the sensitivity of the EMG audio modulation. For example, when the EMG
envelope reaches Th the intensity of the audio stimulus reaches 99% of its maximal
value. Once a very sensitive audio stimulus likely makes the task of reducing the
level of muscle activity from EMG-audio feedback very hard (i.e., audio volume
and frequency easily saturate 72), EMG-biofeedback sensitivity was defined by
setting Th to 90% of the 95th percentile of the distribution of the averaged EMG
envelope obtained during the voluntary sways. By comparing audio stimulus with
different sensitivities while individuals stood with EMG-audio feedback, prior
evidence reported such sensitivity (Th to 90% of voluntary sways) was not
accompanied by significant posterior shifts of postural sway and increased
antagonist activity in relation to standing at ease 72.
The frequency f[n] of the sinusoidal, audio signal was modulated according to:
h
h
TnEMG
TnEMGmnEMGnf
][,450
][,100][][ (4)
where the angular coefficient m being defined as:
hTm
350 (5)
EMG biofeedback was provided to participants in real time. A custom Matlab
script (MathWorks Inc., MA, USA) was written to output the modulated, audio
signal into the soundcard of a personal computer. The audio stimulus was then
transmitted wirelessly to headphones worn by participants. The time taken to
compute and average envelopes and modulate the sinusoid ranged from 10 to 20ms.
68 Is the attenuation effect on the ankle muscles activity from the EMG
biofeedback generalized to – or compensated by – other lower limb
muscles during standing?
Figure 19: (A) Standing with EMG-audio feedback, where participants were asked to
reduce the volume of an audio signal proportional to the level of activity of their ankle
muscles without changing standing posture. (B) Modulating audio signal from bipolar
EMGs. B shows a short epoch (700 ms) of raw bipolar EMGs collected from both soleus
(SO, EMG signals 1 and 2) and medial gastrocnemius (MG; EMG signals 3 and 4) while
participant stood at ease and exhibits the averaged, EMG envelope computed from these
bipolar EMGs, which its amplitude was considered for modulating the audio stimulus
(sinusoidal signal). The amplitude and the frequency of this audio signal were respectively
modulated according to a sigmoid and linear function. Note the correspondence between
the amplitude of bipolar EMGs, the EMG envelope and the modulated audio signal.
6.3.6 Quantifying variations in the degree of muscle activity
The Root Mean Square (RMS) was used to quantify the amplitude of surface EMGs
collected from the ankle and thigh muscles during the standing conditions. Bipolar
EMGs were band-pass filtered with a fourth order Butterworth filter (20–350Hz
6.3 Methods 69
cutoff; zero lag, bidirectional filter). Then, the RMS amplitude of EMGs was
computed over the whole standing duration (60s) and it was averaged across sides
to assess the degree of postural activity for each muscle. Averaging the amplitude
of EMGs across the whole standing duration would provide an overall indication of
any increase in the degree of muscle activity throughout standing condition. The
RMS amplitude of EMGs was averaged across the standing trials.
6.3.7 Quantifying variations in the center of pressure
Global posturographic parameters of CoP displacement were considered to assess
whether subjects change their postural sway due to EMG-audio feedback
conditions. Specifically, alterations in the size of CoP sways and in the mean CoP
position (during the whole standing duration) were quantified in the sagittal plane.
Our interest in evaluating CoP variations in the anterior-posterior direction was due
to previous study demonstrating the EMG biofeedback affects the CoP position and
displacements in the sagittal rather than in the frontal plane while young subjects
stood at ease 72. The standard deviation was computed over 2 s epochs to evaluate
the effect of EMG-audio feedback on the size of individual CoP sways 72. The
mean CoP position in the anterior-posterior direction was normalized with respect
to the foot length projection for assessing how much the mean CoP position travels
in relation to the boundary of foot (i.e., support base) between standing conditions.
The size of the support base in the anterior-posterior axis was defined as the distance
between the tip of the third metatarsal head and the tip of the calcaneus bone
projected in the anterior-posterior direction (cf. Figure 1 in 143). The standard
deviation and the mean CoP position were averaged across the standing tests. CoP
data was 50 Hz low-pass filtered with a second order Butterworth filter to attenuate
high-frequency noise.
6.3.8 Statistical Analysis
After verifying that the data distribution for the RMS amplitude of bipolar EMGs
computed from some muscles was not Gaussian (Shapiro-Wilk’s W-test, P < 0.05
in nine cases), non-parametric statistics were used to compare the degree of muscle
activity between standing conditions. The effect of EMG-biofeedback on the
degree of muscle activity was assessed with Friedman ANOVA by ranks, with
standing conditions as repeated measures. Paired comparisons were made with
Wilcoxon signed-rank test 144, considering the significance level of 5 %. The same
statistics was applied to compare the CoP mean position and the size of CoP sways
(i.e., standard deviation) between standing conditions in the sagittal plane.
70 Is the attenuation effect on the ankle muscles activity from the EMG
biofeedback generalized to – or compensated by – other lower limb
muscles during standing?
6.4 Results
The level of lower limbs muscles’ activity with EMG-audio feedback
Bipolar EMGs collected from the ankle and thigh muscles of a representative
participant were clearly different between standing at ease and EMG-audio
feedback conditions (Figure 20). For the ankle muscles, Figure 20 shows bipolar
EMGs with greater amplitude for the plantar flexors during the standing at ease
with respect to EMG-audio feedback conditions for a representative participant.
For the tibialis anterior, however, EMGs with low amplitude were observed
between standing conditions. Contrary to the ankle muscles, greater EMGs were
observed for the thigh muscles when EMG-audio feedback was provided from both
medial gastrocnemius and soleus muscles in relation to the other conditions. More
specifically, EMGs with markedly high amplitude were observed for the vastus
medialis and vastus lateralis while standing with EMG-audio feedback from both
plantar flexors. High modulations in the EMG amplitude for the semitendinosus
and biceps femoris muscles, however, were not often observed between standing
conditions for this individual.
Group data revealed that the RMS amplitude of bipolar EMGs, i.e. level of muscle
activity, varied significantly with biofeedback conditions during standing
(Friedman ANOVA main effect; P < 0.05 for soleus, medial gastrocnemius, vastus
medialis and vastus lateralis). For soleus, RMS amplitude decreased of about 15%
when EMG-audio feedback was provided from plantar flexors (median,
interquartile range; 31.33, 25.93 - 56.77%) and of about 5% with the EMG-audio
feedback from plantar and dorsal flexors (medial gastrocnemius and tibialis
anterior; 40.47, 32.47 - 70.32%) in relation to standing at ease (44.56, 40.13 -
68.25%, P < 0.05 in all cases; Figure 21). When considering the difference in the
normalized RMS amplitude between standing conditions, lower RMS values were
observed for fourteen (range: 1.27 - 41.90%) and ten (range: 0.82 – 27.58%) out of
fourteen subjects during EMG-audio biofeedback from medial gastrocnemius-
soleus and from medial gastrocnemius-tibialis anterior respectively with respect to
standing at ease. For the medial gastrocnemius, EMG-audio feedback from plantar
flexors reduced significantly RMS amplitude in ~10% (10.10, 8.01 - 18.56%),
while EMG-audio feedback from medial gastrocnemius-tibialis anterior attenuated
significantly it in ~5% (13.52, 10.07 - 19.40%) when compared with standing
naturally (18.30, 12.11 - 25.67%, P < 0.05 in all cases; Figure 21). While thirteen
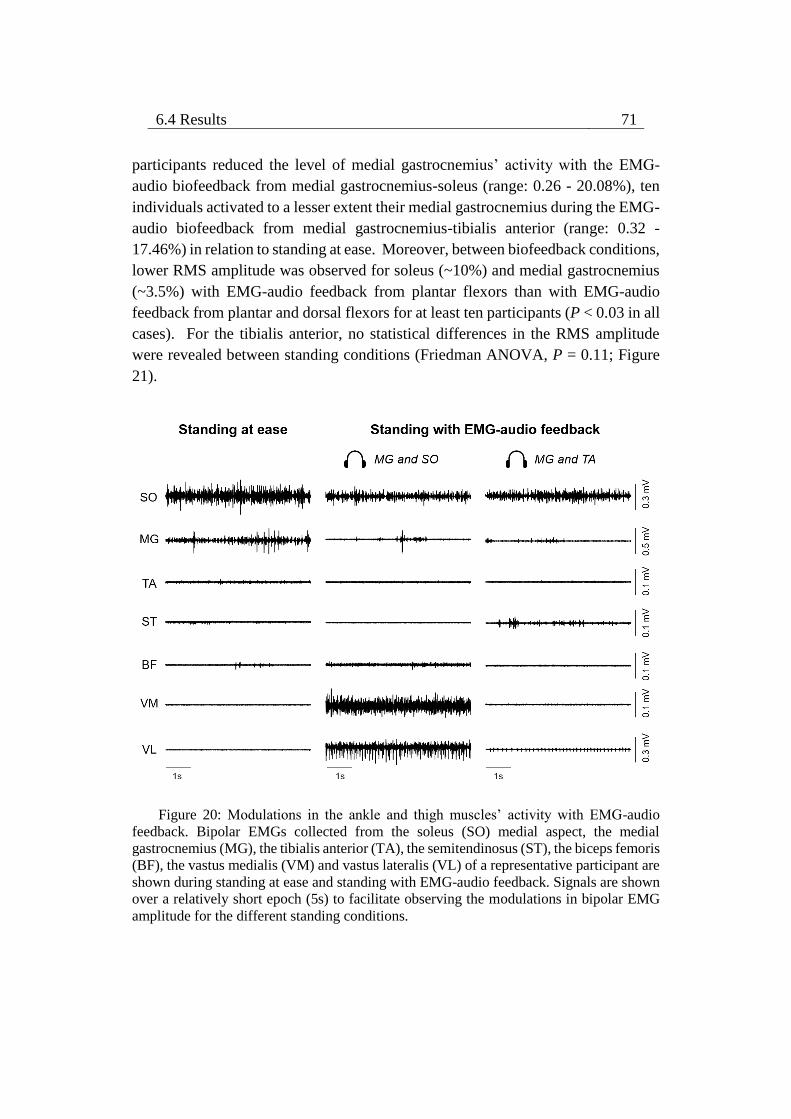
6.4 Results 71
participants reduced the level of medial gastrocnemius’ activity with the EMG-
audio biofeedback from medial gastrocnemius-soleus (range: 0.26 - 20.08%), ten
individuals activated to a lesser extent their medial gastrocnemius during the EMG-
audio biofeedback from medial gastrocnemius-tibialis anterior (range: 0.32 -
17.46%) in relation to standing at ease. Moreover, between biofeedback conditions,
lower RMS amplitude was observed for soleus (~10%) and medial gastrocnemius
(~3.5%) with EMG-audio feedback from plantar flexors than with EMG-audio
feedback from plantar and dorsal flexors for at least ten participants (P < 0.03 in all
cases). For the tibialis anterior, no statistical differences in the RMS amplitude
were revealed between standing conditions (Friedman ANOVA, P = 0.11; Figure
21).
Figure 20: Modulations in the ankle and thigh muscles’ activity with EMG-audio
feedback. Bipolar EMGs collected from the soleus (SO) medial aspect, the medial
gastrocnemius (MG), the tibialis anterior (TA), the semitendinosus (ST), the biceps femoris
(BF), the vastus medialis (VM) and vastus lateralis (VL) of a representative participant are
shown during standing at ease and standing with EMG-audio feedback. Signals are shown
over a relatively short epoch (5s) to facilitate observing the modulations in bipolar EMG
amplitude for the different standing conditions.
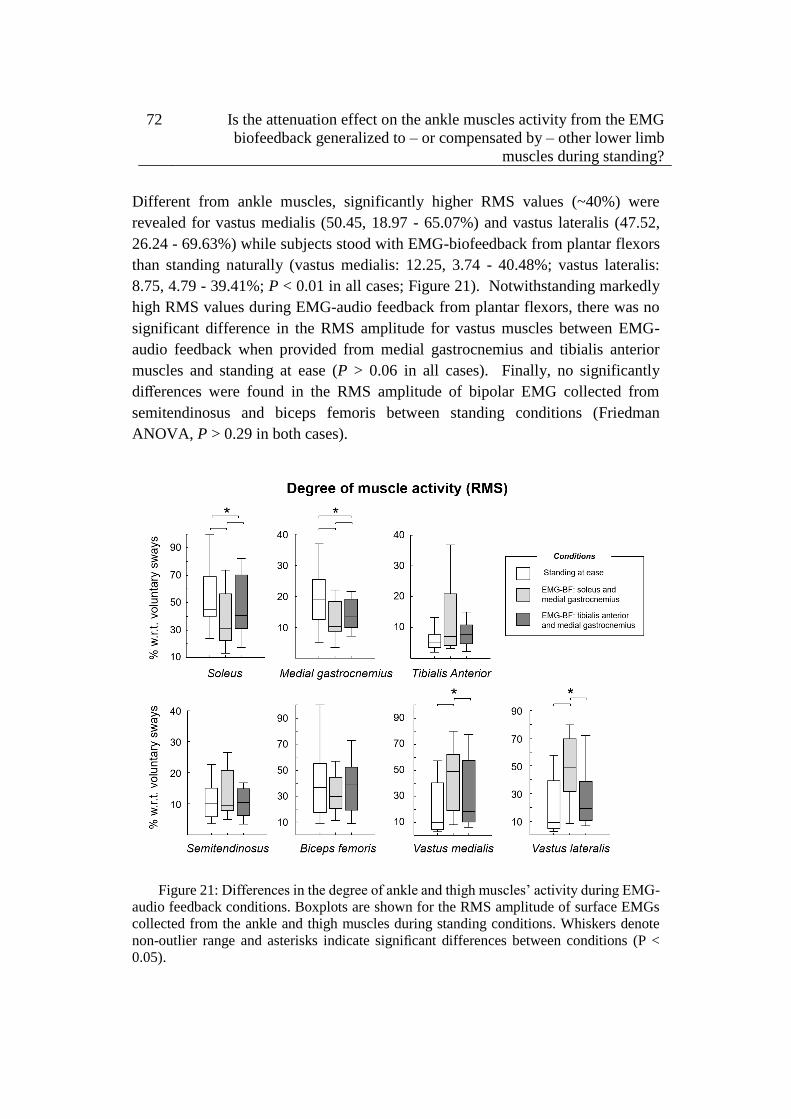
72 Is the attenuation effect on the ankle muscles activity from the EMG
biofeedback generalized to – or compensated by – other lower limb
muscles during standing?
Different from ankle muscles, significantly higher RMS values (~40%) were
revealed for vastus medialis (50.45, 18.97 - 65.07%) and vastus lateralis (47.52,
26.24 - 69.63%) while subjects stood with EMG-biofeedback from plantar flexors
than standing naturally (vastus medialis: 12.25, 3.74 - 40.48%; vastus lateralis:
8.75, 4.79 - 39.41%; P < 0.01 in all cases; Figure 21). Notwithstanding markedly
high RMS values during EMG-audio feedback from plantar flexors, there was no
significant difference in the RMS amplitude for vastus muscles between EMG-
audio feedback when provided from medial gastrocnemius and tibialis anterior
muscles and standing at ease (P > 0.06 in all cases). Finally, no significantly
differences were found in the RMS amplitude of bipolar EMG collected from
semitendinosus and biceps femoris between standing conditions (Friedman
ANOVA, P > 0.29 in both cases).
Figure 21: Differences in the degree of ankle and thigh muscles’ activity during EMG-
audio feedback conditions. Boxplots are shown for the RMS amplitude of surface EMGs
collected from the ankle and thigh muscles during standing conditions. Whiskers denote
non-outlier range and asterisks indicate significant differences between conditions (P <
0.05).
6.5 Discussion 73
Alterations in the CoP displacement with EMG-audio feedback
When considering data from all participants for the posturographic parameters of
CoP displacement, significant differences were revealed for the mean CoP position
between standing conditions in the sagittal plane (Friedman ANOVA main effect;
P < 0.01). Wilcoxon signed-rank test showed that the mean CoP position
normalized by foot length projection was localized closer to the heel while
individuals stood with the EMG-audio feedback from plantar flexors (median,
interquartile range; 37.27, 34.67 – 40.62%) in relation to that estimated during
standing without (42.00, 38.32 – 44.49%) and with the EMG-audio feedback from
plantar and dorsal flexors (38.83, 35.46 – 49.10%; P < 0.01 in all cases). Contrary
to the mean CoP position, the size of CoP sways did not change (Friedman ANOVA
main effect; P = 0.29) between standing at ease (1.97, 1.63 – 3.05 mm), with EMG-
audio feedback from plantar flexors (2.41, 1.90 – 2.83 mm) and with EMG-audio
feedback from plantar and dorsal flexors (1.96, 1.68 – 2.23 mm).
6.5 Discussion
In this study, we specifically asked whether the attenuation effect of EMG-audio
biofeedback on the level of calf muscles’ activity is generalized to – or compensated
by - other lower limb muscles during standing. Surface EMGs were collected from
different ankle and thigh muscles of both legs with pairs of surface electrodes to
estimate the degree of muscle activity. We hypothesized EMGs collected from the
calf muscles with lower amplitude during biofeedback conditions than standing at
ease, and those sampled from the thigh muscles with amplitude values within
standing at ease levels, regardless of biofeedback condition. The main findings of
this study were: (i) the RMS amplitude of bipolar EMGs collected from medial
gastrocnemius and soleus muscles decreased significantly during the EMG
biofeedback conditions tested here in relation to standing at ease; (ii) the RMS
amplitude of EMGs sampled from the thigh muscles did not change during the
EMG-audio feedback from medial gastrocnemius and tibialis anterior muscles
when compared with standing naturally. These results suggest with the feedback
from the medial gastrocnemius and tibialis anterior muscles, EMG-audio feedback
assists young individuals in reducing the level of ankle muscles’ activity without
increasing the level of activity in other lower limb muscles.
74 Is the attenuation effect on the ankle muscles activity from the EMG
biofeedback generalized to – or compensated by – other lower limb
muscles during standing?
Methodological issues on surface EMG detection for EMG biofeedback
In the current study, we provided EMG-audio feedback based on calf muscles’
activity from both lower limbs and sampled surface EMGs with a pair of surface
electrodes. Firstly, the motivation to provide EMG-audio feedback involving
surface EMGs recorded from ankle muscles of both legs was based on our previous
study (see Chapter 5 in this Thesis) showing side-differences in the ankle muscles’
activity while young subjects stand at ease. Depending on the side where bipolar
EMGs are collected from (ankle muscles of right or left leg), therefore, a biased
view of ankle muscles’ activity can be estimated and provided to the subjects as
EMG biofeedback (cf. subjects #3 and #12 in Figure 16). On the recent view that
a pair of surface electrodes may sample bipolar EMG more representative of muscle
activity, at least in postural muscles during standing 21, we opted by providing
EMG-audio feedback from a parsimonious electrodes system rather than the use of
a high number of electrodes in order to make the task of acquiring surface EMG
data from lower limbs muscles unobtrusive and less labor intensive; extremely
recommended in applications of EMG biofeedback 78. More specifically, by
triggering and averaging surface EMGs collected from medial gastrocnemius with
firing instants of soleus’ motor units identified from intramuscular EMGs during
standing, Vieira et al. 21 observed medial gastrocnemius’ EMGs with high
amplitude (i.e., comprising a high number of pennate fibers) and with negligible
crosstalk of soleus muscle using inter-electrode distances up to 5-7 cm. Increasing
the distance between electrodes may therefore be a simple alternative to surface
electrodes’ array for the sampling of more representative bipolar EMG from
postural muscles during standing. We opted for inter-electrode distances
proportional to the total tissue (muscle + subcutaneous) thickness to contain the
contribution of any crosstalk marginal in the bipolar EMG collected from the
targeted muscle. Collectively, through these methodological procedures, we
believe to provide a more representative EMG-audio feedback information about
the ankle muscles’ activity to the subject and from a parsimonious electrodes
system. As discussed below, new insights have been gained into the effects of EMG
biofeedback on the level of activity in lower limbs muscles using this EMG-audio
feedback approach.
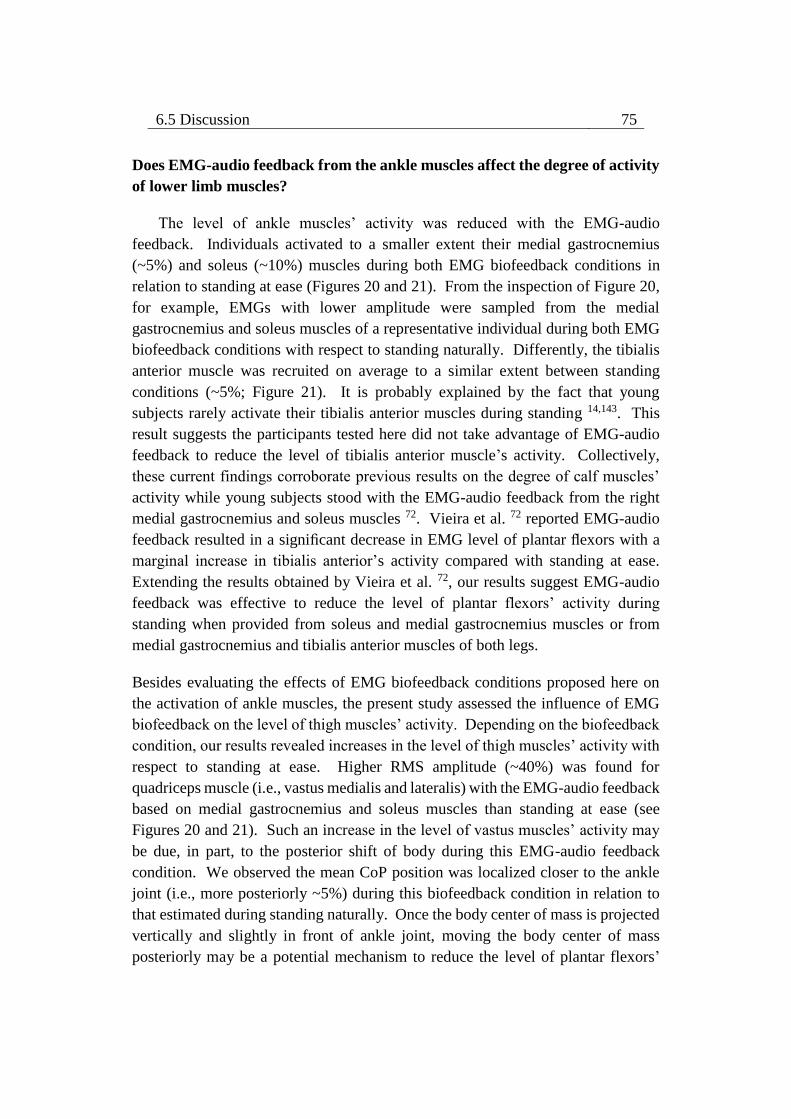
6.5 Discussion 75
Does EMG-audio feedback from the ankle muscles affect the degree of activity
of lower limb muscles?
The level of ankle muscles’ activity was reduced with the EMG-audio
feedback. Individuals activated to a smaller extent their medial gastrocnemius
(~5%) and soleus (~10%) muscles during both EMG biofeedback conditions in
relation to standing at ease (Figures 20 and 21). From the inspection of Figure 20,
for example, EMGs with lower amplitude were sampled from the medial
gastrocnemius and soleus muscles of a representative individual during both EMG
biofeedback conditions with respect to standing naturally. Differently, the tibialis
anterior muscle was recruited on average to a similar extent between standing
conditions (~5%; Figure 21). It is probably explained by the fact that young
subjects rarely activate their tibialis anterior muscles during standing 14,143. This
result suggests the participants tested here did not take advantage of EMG-audio
feedback to reduce the level of tibialis anterior muscle’s activity. Collectively,
these current findings corroborate previous results on the degree of calf muscles’
activity while young subjects stood with the EMG-audio feedback from the right
medial gastrocnemius and soleus muscles 72. Vieira et al. 72 reported EMG-audio
feedback resulted in a significant decrease in EMG level of plantar flexors with a
marginal increase in tibialis anterior’s activity compared with standing at ease.
Extending the results obtained by Vieira et al. 72, our results suggest EMG-audio
feedback was effective to reduce the level of plantar flexors’ activity during
standing when provided from soleus and medial gastrocnemius muscles or from
medial gastrocnemius and tibialis anterior muscles of both legs.
Besides evaluating the effects of EMG biofeedback conditions proposed here on
the activation of ankle muscles, the present study assessed the influence of EMG
biofeedback on the level of thigh muscles’ activity. Depending on the biofeedback
condition, our results revealed increases in the level of thigh muscles’ activity with
respect to standing at ease. Higher RMS amplitude (~40%) was found for
quadriceps muscle (i.e., vastus medialis and lateralis) with the EMG-audio feedback
based on medial gastrocnemius and soleus muscles than standing at ease (see
Figures 20 and 21). Such an increase in the level of vastus muscles’ activity may
be due, in part, to the posterior shift of body during this EMG-audio feedback
condition. We observed the mean CoP position was localized closer to the ankle
joint (i.e., more posteriorly ~5%) during this biofeedback condition in relation to
that estimated during standing naturally. Once the body center of mass is projected
vertically and slightly in front of ankle joint, moving the body center of mass
posteriorly may be a potential mechanism to reduce the level of plantar flexors’
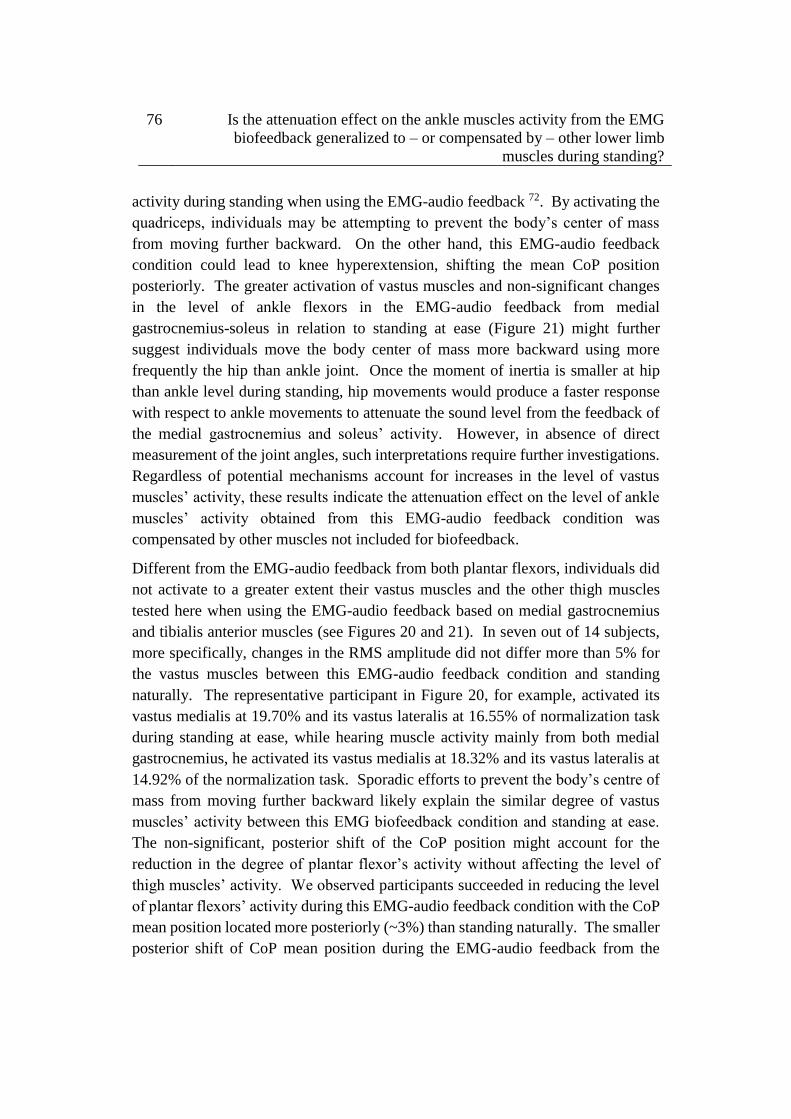
76 Is the attenuation effect on the ankle muscles activity from the EMG
biofeedback generalized to – or compensated by – other lower limb
muscles during standing?
activity during standing when using the EMG-audio feedback 72. By activating the
quadriceps, individuals may be attempting to prevent the body’s center of mass
from moving further backward. On the other hand, this EMG-audio feedback
condition could lead to knee hyperextension, shifting the mean CoP position
posteriorly. The greater activation of vastus muscles and non-significant changes
in the level of ankle flexors in the EMG-audio feedback from medial
gastrocnemius-soleus in relation to standing at ease (Figure 21) might further
suggest individuals move the body center of mass more backward using more
frequently the hip than ankle joint. Once the moment of inertia is smaller at hip
than ankle level during standing, hip movements would produce a faster response
with respect to ankle movements to attenuate the sound level from the feedback of
the medial gastrocnemius and soleus’ activity. However, in absence of direct
measurement of the joint angles, such interpretations require further investigations.
Regardless of potential mechanisms account for increases in the level of vastus
muscles’ activity, these results indicate the attenuation effect on the level of ankle
muscles’ activity obtained from this EMG-audio feedback condition was
compensated by other muscles not included for biofeedback.
Different from the EMG-audio feedback from both plantar flexors, individuals did
not activate to a greater extent their vastus muscles and the other thigh muscles
tested here when using the EMG-audio feedback based on medial gastrocnemius
and tibialis anterior muscles (see Figures 20 and 21). In seven out of 14 subjects,
more specifically, changes in the RMS amplitude did not differ more than 5% for
the vastus muscles between this EMG-audio feedback condition and standing
naturally. The representative participant in Figure 20, for example, activated its
vastus medialis at 19.70% and its vastus lateralis at 16.55% of normalization task
during standing at ease, while hearing muscle activity mainly from both medial
gastrocnemius, he activated its vastus medialis at 18.32% and its vastus lateralis at
14.92% of the normalization task. Sporadic efforts to prevent the body’s centre of
mass from moving further backward likely explain the similar degree of vastus
muscles’ activity between this EMG biofeedback condition and standing at ease.
The non-significant, posterior shift of the CoP position might account for the
reduction in the degree of plantar flexor’s activity without affecting the level of
thigh muscles’ activity. We observed participants succeeded in reducing the level
of plantar flexors’ activity during this EMG-audio feedback condition with the CoP
mean position located more posteriorly (~3%) than standing naturally. The smaller
posterior shift of CoP mean position during the EMG-audio feedback from the
6.5 Discussion 77
medial gastrocnemius-tibialis anterior may explain the smaller differences in the
level of medial gastrocnemius and soleus muscles in this biofeedback condition
with respect to the feedback from medial gastrocnemius-soleus (Figure 21). The
posterior shift of CoP mean position with a concomitant reduction in the level of
plantar flexors’ activity fits well with the notion the plantar flexors’ activity tends
to be attenuated when individuals sway closer to ankle joint during standing 27,33,72.
Collectively, these results indicate the EMG-audio feedback from the medial
gastrocnemius and tibialis anterior muscles was effective enough to reduce
significantly the level of plantar flexors’ activity (cf. Figure 21) without increasing
the level of activity in the other lower limbs muscles not included for the
biofeedback.
Methodological implications and additional considerations
The results obtained in this study have methodological implications for applied and
clinical research. We observed different effects may emerge between lower limbs
muscles depending on the muscles included for the EMG biofeedback. A
compensation effect on the knee muscles from the EMG-audio feedback of both
calf muscles may occur, while an attenuation effect on the ankle muscles from the
EMG-audio feedback based on medial gastrocnemius and tibialis anterior muscles
may prevail during standing. Then, our results seem to discourage the use of EMG-
audio feedback based on medial gastrocnemius and soleus muscles of both legs, if
the goal is to assist individuals in more efficiently controlling leg muscle activity
during standing. For example, it is well documented aged individuals activate their
ankle and thigh muscles to a greater extent 12,13,143 and for a prolonged duration 14,143
with respect to young subjects during standing. From the EMG-audio feedback
based on the right and left medial gastrocnemius and soleus muscles, therefore,
aged subjects could activate to a greater extent their thigh muscles while decreasing
the level of calf muscles’ activity. By acknowledging the possible benefits related
to the reduction of excessive muscle activation for the control of posture, such as
(i) correction of postural sway without muscle noise 30, (ii) reduction of postural
rigidity 56, (iii) concession of economical, fatigue-resistant control 36, EMG audio-
feedback based on both medial gastrocnemius and tibialis anterior muscles may be
more appropriate to assist individuals in reducing the unnecessary muscle activation
during standing. Whether the short-term, attenuation effect of EMG-audio
feedback based on the medial gastrocnemius-tibialis anterior activity in young
individuals observed here is generalized to other populations (e.g., the elderly) and
retained after training is the topic of future research.
78 Is the attenuation effect on the ankle muscles activity from the EMG
biofeedback generalized to – or compensated by – other lower limb
muscles during standing?
Additional investigations are also necessary, however, to verify whether the
compensation effect of EMG-audio feedback from both plantar flexors on thigh
muscles ceases after training, prevailing the attenuation effect on ankle muscles. A
progressive decrease in leg muscle activity has been observed in literature with task
practice, as suggested by the shift from co-activation to reciprocal activation of
ankle muscles after repeated and predictable perturbations of stance 134. If this
assumption holds, the training with EMG-audio feedback from both medial
gastrocnemius and soleus muscles could attenuate the exaggerated ankle muscles’
activity (Figure 21) without increasing thigh muscles’ activity, enabling the
application of different types of EMG-audio feedback (from one or more calf
muscles) to improve muscle efficiency during standing. Even in the case of postural
sway closer to heel with respect to standing naturally with the EMG-audio feedback
condition, it is expected such shift does not compromise body stability in the
standing posture.
In relation to standing at ease, we observed participants succeeded in reducing the
level of plantar flexors’ activity in both biofeedback conditions with the mean CoP
position located closer to the ankle joint (i.e., more posteriorly). One could argue
whether such difference was enough to bring the mean CoP position closer to the
posterior, functional limit of stability, and threaten body stability during standing.
Our results revealed the significant posterior shift of mean CoP position when using
the feedback from the medial gastrocnemius-soleus was of about 5% of foot length
projection with respect to standing at ease. Such difference likely was not enough
to move the mean CoP position away from the midfoot. By measuring the CoP
excursions while young subjects performed different leaning postures during
standing, previous studies observed that: (i) the anterior and posterior boundaries
of functional limit of stability correspond roughly to 80% and 15% of the distance
between the heels and the toes; and (ii) the mean CoP position is on average located
at 40% of foot length during standing naturally, as identified in this study 118,150.
During the EMG biofeedback conditions tested here, therefore, the mean CoP
position was likely maintained around midfoot without compromising body
stability during standing. Threats to the body stability could exist depending on the
size of postural sway while individuals heard the activity of their calf muscles from
the EMG-audio feedback. In the present study, however, we observed that the size
of postural sway remained within standing at ease levels regardless of EMG
biofeedback condition.
6.5 Discussion 79
Chapter 7
General conclusions
This PhD thesis attempted to bring physiological information about the relevance
and the effects of the use of EMG biofeedback for the improvement of muscle
efficiency during standing in the elderly. From the studies “The spatial distribution
of ankle muscles activity discriminates aged from young subjects during standing”
(Chapter 4) and “Is the attenuation effect on the ankle muscles from the EMG
biofeedback generalized to – or compensated by – other lower limb muscles during
standing” (Chapter 6), it was concluded that:
1) Different from young individuals, the elderly activates to a greater extent the
medial gastrocnemius in terms of the size of muscle’s active region and for a
prolonged duration the medial gastrocnemius and tibialis anterior muscles during
standing balance (Chapter 4). Then, the elderly tends to stand with a greater muscle
effort than young subjects. Given that the reduction of excessive muscle activation
may be advantageous for postural control, learning to efficiently activate the
postural muscles during standing could be beneficial for the control of standing
posture in aged individuals, with potential implication for the prevention of falls.
2) The attenuation effect of EMG-audio biofeedback on the ankle muscles during
standing is not compensated by other lower limbs muscles when using the feedback
from the medial gastrocnemius and tibialis anterior muscles (Chapter 6). These
results prove the attenuation effect of EMG biofeedback on the activity of lower
limb muscles during standing. Then, the training based on the EMG-audio
feedback mainly from the medial gastrocnemius and tibialis anterior muscles might
80 General conclusions
have a high impact on the rehabilitation of individuals who activate their lower limb
muscles excessively during standing, e.g. elderly subjects.
From the methodological studies on differences in the timing of muscle activity,
estimated with surface EMGs sampled from a large muscle volume, between calf
muscles (Chapters 3 and 5), it was concluded that:
1) The duration of muscle activity differs between and within calf muscles of a
single leg. It was observed the medial portion of soleus was almost continuously
active while the lateral portion of soleus and the medial portion of gastrocnemius
muscle were active more intermittently during standing (Chapter 3). These results
suggest high-density surface EMG discriminated well the activity between ankle
muscles (i.e., medial gastrocnemius and soleus), as observed from intramuscular
EMGs in literature, and muscle activity sampled from different regions of a single
muscle (e.g., soleus) can provide estimates more representative of muscle activity
during standing. Therefore, key information on the postural control in different
populations could be extracted by sampling surface EMGs from a representative
muscle volume and from different calf muscles.
2) The timing of calf muscles’ activity differs between lower limbs during standing.
Specifically, it was demonstrated soleus and medial gastrocnemius were active for
different durations between legs (Chapter 5). This finding indicates surface EMGs
collected unilaterally may provide a biased view of calf muscles’ activity while
individuals stand at ease. Thus, surface EMGs should be collected bilaterally to
provide a representative estimation of calf muscles’ activity in the standing posture.
Such result has direct implications on the application of EMG biofeedback for the
training of postural control, suggesting a representative feedback of ankle muscles’
activity requires the sampling of surface EMGs from both legs.
81
References
1. Shumway-Cook A, Woollacott MH. Motor Control: Translating Research
into Clinical Practice. LWW, 2011.
2. Gatev P, Thomas S, Kepple T, et al. Feedforward ankle strategy of balance
during quiet stance in adults. J Physiol 1999; 514: 915–928.
3. Day B, Steiger M, Thompson P, et al. Effect of vision and stance width on
human body motion when standing: implications for afferent control of
lateral sway. J Physiol 1993; 469: 479–499.
4. Winter DA, Patla AE, Prince F, et al. Stiffness control of balance in quiet
standing. J Neurophysiol 1998; 80: 1211–1221.
5. Casadio M, Morasso PG, Sanguineti V. Direct measurement of ankle
stiffness during quiet standing: Implications for control modelling and
clinical application. Gait Posture 2005; 21: 410–424.
6. Loram ID, Lakie M. Direct measurement of human ankle stiffness during
quiet standing: the intrinsic mechanical stiffness is insufficient for stability.
J Physiol 2002; 545: 1041–1053.
7. Joseph J, Nightingale A, Williams PL. A detailed study of the electric
potentials recorded over some postural muscles while relaxed and standing.
J Physiol 1955; 127: 617–625.
8. Merletti R, Farina D. Surface Electromyography: Physiology, Engineering
and Applications. IEEE Press. Wiley, 2016.
9. Merletti R, Farina D. Analysis of intramuscular electromyogram signals.
Philos Trans R Soc A Math Phys Eng Sci 2009; 367: 357–368.
82 References
10. Cavalcanti Garcia MA, Vieira TMM. Surface electromyography: Why,
when and how to use it. Rev Andal Med Deport 2011; 4: 17–28.
11. Benjuya N, Melzer I, Kaplanski J. Aging-induced shifts from a reliance on
sensory input to muscle cocontraction during balanced standing. J Gerontol
A Biol Sci Med Sci 2004; 59: M166–M171.
12. Baudry S, Lecoeuvre G, Duchateau J. Age-related changes in the behavior
of the muscle-tendon unit of the gastrocnemius medialis during upright
stance. J Appl Physiol 2012; 112: 296–304.
13. Nagai K, Yamada M, Uemura K, et al. Differences in muscle coactivation
during postural control between healthy older and young adults. Arch
Gerontol Geriatr 2011; 53: 338–343.
14. Laughton CA, Slavin M, Katdare K, et al. Aging, muscle activity, and
balance control: Physiologic changes associated with balance impairment.
Gait Posture 2003; 18: 101–108.
15. Kouzaki M, Shinohara M. Steadiness in plantar flexor muscles and its
relation to postural sway in young and elderly adults. Muscle and Nerve
2010; 42: 78–87.
16. Hermens HJ. Development of recommendations for SEMG sensors and
sensor placement procedures. J Electromyogr Kinesiol 2000; 10: 361–374.
17. Vieira TMM, Loram ID, Muceli S, et al. Postural activation of the human
medial gastrocnemius muscle: are the muscle units spatially localised? J
Physiol 2011; 589: 431–443.
18. Oliveira VB De, Carneiro SP, Oliveira LF De. Reliability of biceps femoris
and semitendinosus muscle architecture measurements obtained with
ultrasonography. Res Biomed Eng 2016; 32: 365–371.
19. Kellis E, Galanis N, Natsis K, et al. Muscle architecture variations along the
human semitendinosus and biceps femoris ( long head ) length. J
Electromyogr Kinesiol 2010; 20: 1237–1243.
20. Hodson-Tole EF, Loram ID, Vieira TMM. Myoelectric activity along human
gastrocnemius medialis: different spatial distributions of postural and
electrically elicited surface potentials. J Electromyogr Kinesiol 2013; 23:
43–50.
83
21. Vieira T, Muceli S, Farina D, et al. Large inter-electrode distances lead to
more representative bipolar EMGs, not necessarily affected by crosstalk.
Gait Posture 2016; 49: S28–S29.
22. Staudenmann D, Kingma I, Daffertshofer A, et al. Heterogeneity of muscle
activation in relation to force direction: A multi-channel surface
electromyography study on the triceps surae muscle. J Electromyogr
Kinesiol 2009; 19: 882–895.
23. Reffad A, Mebarkia K, Vieira TMM, et al. Effect of contraction force and
knee joint angle on the spatial representation of soleus activity using high-
density surface EMG. Biomed Tech 2014; 59: 399–411.
24. Holtermann A, Søaard K, Christensen H, et al. The influence of biofeedback
training on trapezius activity and rest during occupational computer work: A
randomized controlled trial. Eur J Appl Physiol 2008; 104: 983–989.
25. Hermens HJ, Hutten MM. Muscle activation in chronic pain: its treatment
using a new approach of myofeedback. Int J Ind Ergon 2002; 30: 325–336.
26. Heroux ME, Dakin CJ, Luu BL, et al. Absence of lateral gastrocnemius
activity and differential motor unit behavior in soleus and medial
gastrocnemius during standing balance. J Appl Physiol 2014; 116: 140–148.
27. Vieira TMM, Loram ID, Muceli S, et al. Recruitment of motor units in the
medial gastrocnemius muscle during human quiet standing: is recruitment
intermittent? What triggers recruitment? J Neurophysiol 2012; 107: 666–
676.
28. Loram ID, Maganaris CN, Lakie M. Human postural sway results from
frequent, ballistic bias impulses by soleus and gastrocnemius. J Physiol
2005; 564: 295–311.
29. Bottaro A, Yasutake Y, Nomura T, et al. Bounded stability of the quiet
standing posture: An intermittent control model. Hum Mov Sci 2008; 27:
473–495.
30. Loram ID, Lakie M, Di Giulio I, et al. The consequences of short-range
stiffness and fluctuating muscle activity for proprioception of postural joint
rotations: the relevance to human standing. J Neurophysiol 2009; 102: 460–
74.
31. Cabrera JL, Milton JG. On-off intermittency in a human balancing task. Phys
Rev Lett 2002; 89: 158702.
84 References
32. Kiemel T, Zhang Y, Jeka JJ. Identification of neural feedback for upright
stance in humans: stabilization rather than sway minimization. J Neurosci
2011; 31: 15144–53.
33. Di Giulio I, Maganaris CN, Baltzopoulos V, et al. The proprioceptive and
agonist roles of gastrocnemius, soleus and tibialis anterior muscles in
maintaining human upright posture. J Physiol 2009; 587: 2399–416.
34. Masani K, Sayenko DG, Vette AH. What triggers the continuous muscle
activity during upright standing? Gait Posture 2013; 37: 72–77.
35. Baudry S, Penzer F, Duchateau J. Input-output characteristics of soleus
homonymous Ia afferents and corticospinal pathways during upright
standing differ between young and elderly adults. Acta Physiol 2014; 210:
667–677.
36. Loram ID, Gollee H, Lakie M, et al. Human control of an inverted pendulum:
is continuous control necessary? Is intermittent control effective? Is
intermittent control physiological? J Physiol 2011; 589: 307–324.
37. Bruce HA, Fredenck PR, Marsha EW. The cost and frequency of
hospitalization for fall-related injuries in older adults. Public Heal briefs
1992; 82: 5–8.
38. Hartholt KA, Polinder S, Van der Cammen TJM, et al. Costs of falls in an
ageing population: A nationwide study from the Netherlands (2007–2009).
Injury 2012; 43: 1199–1203.
39. Stel VS, Smit JH, Pluijm SMF, et al. Consequences of falling in older men
and women and risk factors for health service use and functional decline. Age
Ageing 2004; 33: 58–65.
40. Talbot LA, Musiol RJ, Witham EK, et al. Falls in young, middle-aged and
older community dwelling adults: perceived cause, environmental factors
and injury. BMC Public Health 2005; 5: 86.
41. Gazibara T, Kurtagic I, Kisic-Tepavcevic D, et al. Falls, risk factors and fear
of falling among persons older than 65 years of age. Psychogeriatrics 2017;
1–9.
42. Cattagni T, Scaglioni G, Laroche D, et al. Ankle muscle strength
discriminates fallers from non-fallers. Front Aging Neurosci 2014; 6: 1–7.
85
43. Lin S-I, Woollacott MH. Postural muscle responses following changing
balance threats in young, stable older, and unstable older adults. J Mot Behav
2002; 34: 37–44.
44. Woollacott MH, Shumway-Cook A, Nashner LM. Aging and posture
control: changes in sensory organization and muscular coordination. Int J
Aging Hum Dev 1986; 23: 97–114.
45. Woollacott M. Systems contributing to balance disorders in older adutls. J
Gerontol 2000; 55: 424–428.
46. Horak FB, Shupert CL, Mirka A. Components of postural dyscontrol in the
elderly: A review. Neurobiol Aging 1989; 10: 727–738.
47. Visser JE, Carpenter MG, van der Kooij H, et al. The clinical utility of
posturography. Clin Neurophysiol 2008; 119: 2424–2436.
48. Nardone A, Schieppati M. The role of instrumental assessment of balance in
clinical decision making. Eur J Phys Rehabil Med 2010; 46: 221–237.
49. Taube W, Gruber M, Gollhofer A. Spinal and supraspinal adaptations
associated with balance training and their functional relevance. Acta Physiol
2008; 193: 101–116.
50. Gruber M, Gruber S, Taube W, et al. Differential effects of ballistic versus
sensorimotor training on rate of force development and neural activation in
humans. J Strength Cond Res 2007; 21: 274–282.
51. Gauffin H, Tropp H, Odenrick P. Effect of ankle disk training on postural
control in patients with functional instability of the ankle joint. Int J Sports
Med 1988; 9: 141–144.
52. Keller M, Pfusterschmied J, Buchecker M, Müller E TW. Improved postural
control after slackline training is accompanied by reduced H-reflexes. Scand
J Med Sci Sport 2012; 22: 471–477.
53. Penzer F, Duchateau J, Baudry S. Effects of short-term training combining
strength and balance exercises on maximal strength and upright standing
steadiness in elderly adults. Exp Gerontol 2015; 61: 38–46.
54. Taube W, Kullmann N, Leukel C, et al. Differential reflex adaptations
following sensorimotor and strength training in young elite athletes. Int J
Sports Med 2007; 28: 999–1005.
55. Gruber M, Gollhofer A. Impact of sensorimotor training on the rate of force
86 References
development and neural activation. Eur J Appl Physiol 2004; 92: 98–105.
56. Nagai K, Yamada M, Tanaka B, et al. Effects of balance training on muscle
coactivation during postural control in older adults: a randomized controlled
trial. Journals Gerontol Ser A Biol Sci Med Sci 2012; 67: 882–889.
57. Jahnke R, Larkey L, Rogers C, et al. A comprehensive review of health
benefits of qigong and tai chi. Am J Health Promot 2010; 24: e1–e25.
58. Jeter PE, Nkodo A-F, Moonaz SH, et al. A systematic review of yoga for
balance in a healthy population. J Altern Complement Med 2014; 20: 221–
232.
59. S. Wolf HB, N. Kutner EM, Coogler C, et al. Reducing frailty and falls in
older persons: an investigation of Tai Chi and computerized balance training.
Atlanta FICSIT Group. Frailty and Injuries: Cooperative Studies of
Intervention Techniques. J Am Geriatr Soc 1996; 44: 489–497.
60. Li F, Harmer P, Fisher KJ, et al. Tai Chi and fall reductions in older adults:
a randomized controlled trial. J Gerontol A Biol Sci Med Sci 2005; 60: 187–
194.
61. Loftus SL. Qi Gong to improve postural stability (QTIPS) for parkinson fall
prevention. Top Geriatr Rehabil 2014; 30: 58–69.
62. Society AG, Society BG. Guideline for the prevention of falls in older
persons. American Geriatrics Society, British Geriatrics Society, and
American Academy of Orthopaedic Surgeons Panel on Falls Prevention. J
Am Geriatr Soc 2001; 49: 664–72.
63. Chiari L, Dozza M, Cappello A, et al. Audio-biofeedback for balance
improvement: An accelerometry-based system. IEEE Trans Biomed Eng
2005; 52: 2108–2111.
64. Dault MC, de Haart M, Geurts ACH, et al. Effects of visual center of pressure
feedback on postural control in young and elderly healthy adults and in
stroke patients. Hum Mov Sci 2003; 22: 221–236.
65. Cawsey RP, Chua R, Carpenter MG, et al. To what extent can increasing the
magnification of visual feedback of the centre of pressure position change
the control of quiet standing balance? Gait Posture 2009; 29: 280–284.
66. Van Peppen R, Kortsmit M, Lindeman E, et al. Effects of visual feedback
therapy on postural control in bilateral standing after stroke: a systematic
review. J Rehabil Med 2006; 38: 3–9.
87
67. Dos Anjos F, Lemos T, Imbiriba LA. Does the type of visual feedback
information change the control of standing balance? Eur J Appl Physiol
2016; 116: 1771–1779.
68. Zijlstra GA, Mancini M, Chiari L, et al. Biofeedback for training balance and
mobility tasks in older populations: a systematic review. J Neuroeng Rehabil
2010; 7: 58.
69. Mirelman A, Herman T, Nicolai S, et al. Audio-biofeedback training for
posture and balance in patients with Parkinson’s disease. J Neuroeng Rehabil
2011; 8: 35.
70. Dozza M, Chiari L, Horak FB. Audio-biofeedback improves balance in
patients with bilateral vestibular loss. Arch Phys Med Rehabil 2005; 86:
1401–1403.
71. Sihvonen S, Sipilä S, Taskinen S, et al. Fall incidence in frail older women
after individualized visual feedback-based balance training. Gerontology
2004; 50: 411–416.
72. Vieira TM, Baudry S, Botter A. Young, healthy subjects can reduce the
activity of calf muscles when provided with EMG biofeedback in upright
stance. Front Physiol 2016; 7: 1–12.
73. Giggins OM, Persson UM, Caulfield B. Biofeedback in rehabilitation. J
Neuroeng Rehabil 2013; 10: 60.
74. Wright ZA, Rymer WZ, Slutzky MW. Reducing abnormal muscle
coactivation after stroke using a myoelectric-computer interface: a pilot
study. Neurorehabil Neural Repair 2014; 28: 443–51.
75. Nouwen A. EMG biofeedback used to reduce standing levels of paraspinal
muscle tension in chronic low back pain. Pain 1983; 17: 353–360.
76. Nestoriuc Y, Martin A, Rief W, et al. Biofeedback treatment for headache
disorders: a comprehensive efficacy review. Appl Psychophysiol
Biofeedback 2008; 33: 125–140.
77. Basmajian J V. Control and training of individual motor units. Science 1963;
141: 440–1.
78. Huang H, Wolf SL, He J. Recent developments in biofeedback for
neuromotor rehabilitation. J Neuroeng Rehabil 2006; 3: 11.
79. Ma EP-M, Yiu GK-Y, Yiu EM-L. The effects of self-controlled feedback on
88 References
learning of a ‘relaxed phonation task’. J Voice 2013; 27: 723–8.
80. Ng GYF, Zhang AQ, Li CK. Biofeedback exercise improved the EMG
activity ratio of the medial and lateral vasti muscles in subjects with
patellofemoral pain syndrome. J Electromyogr Kinesiol 2008; 18: 128–133.
81. Doan-Aslan M, Nakipolu-Yüzer GF, Doan A, et al. The effect of
electromyographic biofeedback treatment in improving upper extremity
functioning of patients with hemiplegic stroke. J Stroke Cerebrovasc Dis
2012; 21: 187–192.
82. Basmajian J V. Research foundations of EMG biofeedback in rehabilitation.
Biofeedback Self Regul 1988; 13: 275–298.
83. Wolf SL. Electromyographic biofeedback applications to stroke patients. A
critical review. Phys Ther 1983; 63: 1448–1459.
84. Stanton R, Ada L, Dean CM, et al. Biofeedback improves activities of the
lower limb after stroke: a systematic review. J Physiother 2011; 57: 145–
155.
85. Glombiewski JA, Bernardy K, Häuser W. Efficacy of EMG- and EEG-
biofeedback in fibromyalgia syndrome: a meta-analysis and a systematic
review of randomized controlled trials. Evidence-based Complement Altern
Med; 2013.
86. Dannecker C, Wolf V, Raab R, et al. EMG-biofeedback assisted pelvic floor
muscle training is an effective therapy of stress urinary or mixed
incontinence: a 7-year experience with 390 patients. Arch Gynecol Obstet
2005; 273: 93–97.
87. Wilkinson M. Biofeedback in General Relaxation Training. Arch Phys Med
1975; 11: 182–184.
88. Poppen R, Hanson HB, Ip SM. Generalization of EMG biofeedback training.
Biofeedback Self Regul 1988; 13: 235–43.
89. Ince LP, Leon MS, Christidis D. Experimental foundations of EMG
biofeedback with the upper extremity: a review of the literature. Biofeedback
Self Regul 1984; 9: 371–83.
90. Ma C, Szeto GP, Yan T, et al. Comparing biofeedback with active exercise
and passive treatment for the management of work-related neck and shoulder
pain: A randomized controlled trial. Arch Phys Med Rehabil 2011; 92: 849–
858.
89
91. LeVeau BF, Rogers C. Selective training of the vastus medialis muscle using
EMG biofeedback. Phys Ther 1980; 60: 1410–5.
92. Christanell F, Hoser C, Huber R, et al. The influence of electromyographic
biofeedback therapy on knee extension following anterior cruciate ligament
reconstruction: a randomized controlled trial. Sports Med Arthrosc Rehabil
Ther Technol 2012; 4: 41.
93. Vedsted P, Søgaard K, Blangsted AK, et al. Biofeedback effectiveness to
reduce upper limb muscle activity during computer work is muscle specific
and time pressure dependent. J Electromyogr Kinesiol 2011; 21: 49–58.
94. Palmerud G, Sporrong H, Herberts P, et al. Consequences of trapezius
relaxation on the distribution of shoulder muscle forces: An
electromyographic study. J Electromyogr Kinesiol 1998; 8: 185–193.
95. Horak FB, Frank J, Nutt J. Effects of dopamine on postural control in
parkinsonian subjects: scaling, set, and tone. J Neurophysiol 1996; 75: 2380–
2396.
96. Basmajian J V., De Luca CJ. Muscles Alive: their functions revealed by
electromyography. 5th Editio. Williams & Wilkins, 1985.
97. Winter DA. Human balance and posture control during standing and
walking. Gait and Posture 1995; 3: 193–214.
98. Loram ID, Maganaris CN, Lakie M. Paradoxical muscle movement in human
standing. J Physiol 2004; 556: 683–689.
99. Joseph J, Nightingale A. Electromyography of muscles of posture: leg and
thigh muscles in women, including the effects of high heels. J Physiol 1956;
132: 465–8.
100. Mochizuki G, Semmler JG, Ivanova TD, et al. Low-frequency common
modulation of soleus motor unit discharge is enhanced during postural
control in humans. Exp Brain Res 2006; 175: 584–595.
101. Vieira TMM, Windhorst U, Merletti R. Is the stabilization of quiet upright
stance in humans driven by synchronized modulations of the activity of
medial and lateral gastrocnemius muscles? J Appl Physiol 2010; 108: 85–97.
102. Loram ID, Lakie M. Human balancing of an inverted pendulum: position
control by small, ballistic-like, throw and catch movements. J Physiol 2002;
540: 1111–1124.
90 References
103. Merletti R, Botter A, Troiano A, et al. Technology and instrumentation for
detection and conditioning of the surface electromyographic signal: state of
the art. Clinical Biomechanics 2009; 24: 122–134.
104. Loram ID, Maganaris CN, Lakie M. Paradoxical muscle movement in human
standing. J Physiol 2004; 556: 683–689.
105. Edgerton VR, Smith JL, Simpson DR. Muscle fibre type populations of
human leg muscles. Histochem J 1975; 7: 259–266.
106. Merletti R, Parker P (eds). Electromyography: Physiology, Engineering, and
Noninvasive Applications. Hoboken, NJ, USA: John Wiley & Sons, Inc.
Epub ahead of print 12 July 2004. DOI: 10.1002/0471678384.
107. Jacono M, Casadio M, Morasso PG, et al. The sway-density curve and the
underlying postural stabilization process. Motor Control 2004; 8: 292–311.
108. Malisoux L, Francaux M, Theisen D. What do single-fiber studies tell us
about exercise training? Med Sci Sports Exerc 2007; 39: 1051–1060.
109. Simoneau JA, Bouchard C. Human variation in skeletal muscle fiber-type
proportion and enzyme activities. Am J Physiol 1989; 257: E567-72.
110. Henry SM, Fung J, Horak FB. EMG responses to maintain stance during
multidirectional surface translations. J Neurophysiol 1998; 80: 1939–1950.
111. Vieira TMM, Minetto MA, Hodson-Tole EF, et al. How much does the
human medial gastrocnemius muscle contribute to ankle torques outside the
sagittal plane? Hum Mov Sci 2013; 32: 753–767.
112. Loram ID, Lakie M, Gawthrop PJ. Visual control of stable and unstable
loads: what is the feedback delay and extent of linear time-invariant control?
J Physiol 2009; 587: 1343–65.
113. Brown JMM, Wickham JB, McAndrew DJ, et al. Muscles within muscles:
coordination of 19 muscle segments within three shoulder muscles during
isometric motor tasks. J Electromyogr Kinesiol 2007; 17: 57–73.
114. Farina D, Leclerc F, Arendt-Nielsen L, et al. The change in spatial
distribution of upper trapezius muscle activity is correlated to contraction
duration. J Electromyogr Kinesiol 2008; 18: 16–25.
115. McLean L, Goudy N. Neuromuscular response to sustained low-level muscle
activation: within- and between-synergist substitution in the triceps surae
muscles. Eur J Appl Physiol 2004; 91: 204–216.
91
116. Tomioka K, Iwamoto J, Saeki K, et al. Reliability and validity of the
international physical activity questionnaire (IPAQ) in elderly adults: the
fujiwara-kyo study. J Epidemiol 2011; 21: 459–465.
117. Chiari L, Rocchi L, Cappello A. Stabilometric parameters are affected by
anthropometry and foot placement. Clin Biomech 2002; 17: 666–677.
118. Duarte M, Zatsiorsky VM. Effects of body lean and visual information on
the equilibrium maintenance during stance. Exp Brain Res 2002; 146: 60–
69.
119. Pinsault N, Vuillerme N. Test-retest reliability of centre of foot pressure
measures to assess postural control during unperturbed stance. Med Eng Phys
2009; 31: 276–286.
120. Gallina A, Pollock CL, Vieira TM, et al. Between-day reliability of triceps
surae responses to standing perturbations in people post-stroke and healthy
controls: A high-density surface EMG investigation. Gait Posture 2016; 44:
103–109.
121. Vieira TMM, Merletti R, Mesin L. Automatic segmentation of surface EMG
images: improving the estimation of neuromuscular activity. J Biomech
2010; 43: 2149–2158.
122. Farina D, Cescon C, Merletti R. Influence of anatomical, physical, and
detection-system parameters on surface EMG. Biol Cybern 2002; 86: 445–
456.
123. Onambele GL, Narici M V, Maganaris CN. Calf muscle-tendon properties
and postural balance in old age. J Appl Physiol 2006; 100: 2048–2056.
124. Avancini C, De Oliveira LF, Menegaldo LL, et al. Variations in the spatial
distribution of the amplitude of surface electromyograms are unlikely
explained by changes in the length of medial gastrocnemius fibres with knee
joint angle. PLoS One 2015; 10: e0126888.
125. Oliveira LF, Simpson DM, Nadal J. Calculation of area of stabilometric
signals using principal component analysis. Physiol Meas 1996; 17: 305–12.
126. Warnica MJ, Weaver TB, Prentice SD, et al. The influence of ankle muscle
activation on postural sway during quiet stance. Gait Posture 2014; 39:
1115–1121.
92 References
127. Mesin L, Merletti R, Vieira TMM. Insights gained into the interpretation of
surface electromyograms from the gastrocnemius muscles: a simulation
study. J Biomech 2011; 44: 1096–1103.
128. Blouin JS, Brown HJ, Héroux ME, et al. Reply from J. S. Blouin, H. J.
Brown, M. E. Héroux, J. T. Inglis and G. P. Siegmund. J Physiol 2016; 594:
1955–1955.
129. Vieira TM, Wakeling JM, Hodson-Tole EF. Is there sufficient evidence to
claim muscle units are not localised and functionally grouped within the
human gastrocnemius? J Physiol 2016; 594: 1953–1954.
130. Amiridis IG, Hatzitaki V, Arabatzi F. Age-induced modifications of static
postural control in humans. Neurosci Lett 2003; 350: 137–140.
131. Sayenko D, Alekhina M, Masani K, et al. Positive effect of balance training
with visual feedback on standing balance abilities in people with incomplete
spinal cord injury. Spinal Cord 2010; 48: 886–893.
132. Horak FB, Henry SM, Shumway-Cook a. Postural perturbations: new
insights for treatment of balance disorders. Phys Ther 1997; 77: 517–533.
133. Horak FB, Nashner LM. Central programming of postural movements:
adaptation to altered support-surface configurations. J Neurophysiol 1986;
55: 1369–1381.
134. Sozzi S, Nardone A, Schieppati M. Calibration of the leg muscle responses
elicited by predictable perturbations of stance and the effect of vision. Front
Hum Neurosci 2016; 10: 419.
135. Peterka RJ. Postural control model interpretation of stabilogram diffusion
analysis. Biol Cybern 2000; 82: 335–343.
136. Masani K, Popovic MR, Nakazawa K, et al. Importance of body sway
velocity information in controlling ankle extensor activities during quiet
stance. J Neurophysiol 2003; 90: 3774–82.
137. Marsden JF, Castellote J, Day BL. Bipedal distribution of human vestibular-
evoked postural responses during asymmetrical standing. J Physiol 2002;
542: 323–331.
138. Wu G, MacLeod M. The control of body orientation and center of mass
location under asymmetrical loading. Gait Posture 2001; 13: 95–101.
93
139. Mochizuki G, Ivanova TD, Garland SJ. Factors affecting the common
modulation of bilateral motor unit discharge in human soleus muscles. J
Neurophysiol 2007; 97: 3917–3925.
140. Monsour M, Ivanova TD, Wilson TD, et al. Influence of vestibular afferent
input on common modulation of human soleus motor units during standing.
Motor Control 2012; 16: 466–79.
141. Duarte M, Zatsiorsky VM. Patterns of center of pressure migration during
prolonged unconstrained standing. Motor Control 1999; 3: 12–27.
142. Liang S, Xu J, wang L, et al. An investigation into the bilateral functional
differences of the lower limb muscles in standing and walking. PeerJ 2016;
4: e2315.
143. Dos Anjos F V., Pinto TP, Gazzoni M, et al. The spatial distribution of ankle
muscles activity discriminates aged from young subjects during standing.
Front Hum Neurosci 2017; 11: 1–12.
144. Dawson-Saunders B, Trapp RG. Basic & Clinical Biostatistics. Second edi.
Appleton & Lange, 1994.
145. Haddad JM, Rietdyk S, Ryu JH, et al. Postural asymmetries in response to
holding evenly and unevenly distributed loads during self-selected stance. J
Mot Behav 2011; 43: 345–355.
146. Blaszczyk JW, Prince F, Raiche M, et al. Effect of ageing and vision on limb
load asymmetry during quiet stance. J Biomech 2000; 33: 1243–1248.
147. Lee SSM, Piazza SJ. Inversion-eversion moment arms of gastrocnemius and
tibialis anterior measured in vivo. J Biomech 2008; 41: 3366–3370.
148. Genthon N, Gissot AS, Froger J, et al. Posturography in patients with stroke:
estimating the percentage of body weight on each foot from a single force
platform. Stroke 2008; 39: 489–491.
149. Agur AM, Ng-Thow-Hing V, Ball KA, et al. Documentation and three-
dimensional modelling of human soleus muscle architecture. Clin Anat 2003;
16: 285–293.
150. Schieppati M, Hugon M, Grasso M, et al. The limits of equilibrium in young
and elderly normal subjects and in parkinsonians. Electroencephalogr Clin
Neurophysiol 1994; 93: 286–298.