hierarchical analysis of population genetic variation in nuclear and mitochondrial genes in daphnia
TRANSCRIPT

Hierarchical Analysis of Population Genetic Variation in Mitochondrial and Nuclear Genes of Daphnia pulex’
Teresa J. Crease, * Michael Lynch,7 and Ken Spitzet *Department o f Biology, University of Windsor; and TDepartment of Biology, University of Oregon
The geographic structure of Daphnia pulex populations from the central United States is analyzed with respect to isozyme and mitochondrial DNA variation. The species complex consists of cyclic and obligate parthenogens. A hierarchical analysis of population structure in the cyclic parthenogens by using a fixation-index approach indicates that this is one of the most extremely subdivided species yet studied. This genetic structure, much of which accrues within 100 km, is certainly due in part to the limited dispersal ability of Daphnia. However, previous work has shown that fluctuating selection can account for the spatial heterogeneity in isozyme frequencies in these populations. This may explain why the population subdivision for the mitochondrial genome increases approximately three times as rapidly with distance as does that for nuclear genes, which is slower than the neutral expectation. The obligate parthenogens are shown to be polyphyletic in origin, evolutionarily young, and, in some cases, geographically widespread.
Introduction
Population subdivision is not expected to have the same effect on the geographic distribution of variability in nuclear and mitochondrial genomes (Birky et al. 1983, 1989; Takahata and Slatkin 1984; Takahata and Palumbi 1985 ) . Because of maternal and clonal inheritance, the effective population size for mitochondrial genes is only about one-fourth as large as that for nuclear genes. Thus, for equivalent genie mutation rates and selection intensities, the equilibrium variation for mitochondrial genes within demes is expected to be lower, and the divergence between demes higher, than in the case of nuclear genes. Interdemic migration does not alter this conclusion if migration is equal in both sexes, provided that the average number of mitochondrial haplotypes per zygote is less than two, which is usually the case. However, if migration is male biased, the difference between the distribution of variation for nuclear and mitochon- drial genes becomes magnified further, since males do not transmit mitochondria to their progeny. Thus, a population can be effectively subdivided for organelle genes, while the nuclear genes give the appearance of panmixia.
The few studies that have compared patterns of population differentiation for nuclear and mitochondrial genes are in general agreement with the above predictions (Avise et al. 1979; Davis 1986; DeSalle et al. 1987; Hale and Singh 1987). However, there is some indication that the usual pattern of mitochondrial/nuclear gene differ- entiation is reversed in the races of modern man (Nei 1982).
The purpose of the present study is to analyze population structure in the cla-
1. Key words: population structure, isozymes, mitochondrial DNA, geographic variation, Duphniu.
Address for correspondence and reprints: Teresa J. Crease, Department of Biology, University of Windsor, Windsor, Ontario, Canada N9B 3P4.
Mol. Biol. Evol. 7(5):444-458. 1990. 0 1990 by The University of Chicago. All rights reserved. 0737-4038/90/0705-0005$02.00
444

Population Structure in Daphnia pulex 445
doceran Daphnia pulex by using genetic markers for nuclear and mitochondrial genes. This species inhabits freshwater ponds and small lakes across much of North America. Because of the discrete nature of the habitat, population boundaries are easily defined and opportunities for population differentiation are enhanced. Past studies have doc- umented the existence of two reproductive systems in the species: cyclic and obligate parthenogenesis (Hebert and Crease 1980; Lynch 1983). During the spring and sum- mer, females of both types typically produce eggs via ameiotic parthenogenesis for several generations. Under certain environmental conditions, most notably crowding and low food concentrations, males and resting eggs are produced. The resting eggs normally require a period of diapause before development and are able to withstand freezing, desiccation, and passage through the digestive tracts of animals. These eggs are the means by which Daphnia repopulate habitats after periods of unfavorable conditions, as well as the means by which they disperse to new habitats. Agents of dispersal are thought to include mammals, birds, and for short distances, even wind.
In temporary habitats, cyclic parthenogens must go through at least one sexual generation per year, since they produce haploid resting eggs that require fertilization. Such populations exhibit substantial variation at isozyme loci, with genotype fre- quencies in close agreement with Hardy-Weinberg expectations, similar to purely sexual organisms (Lynch 1983, 1984, 1987). Obligately parthenogenetic D. pulex produce their resting eggs ameiotically, so their mode of reproduction is purely clonal.
Isozyme surveys and direct observations of D. pulex in east-central Canada and central United States have shown there to be a shift in the reproductive system in the region of the Great Lakes (Lynch 1983, 1984; Innes et al. 1986; Weider et al. 1987; Hebert et al. 1988 ) . Obligate parthenogenesis predominates in populations from Hud- son Bay down through Ontario, while cyclic parthenogenesis is more common south of the Great Lakes. Isozyme and mitochondrial DNA (mtDNA) surveys (Crease et al. 1989; Hebert et al. 1989) have confirmed the close genetic relationship between cyclically parthenogenetic D. pulex and the obligately parthenogenetic clones.
In the present study, several populations from central Illinois and Indiana were surveyed for isozyme and mtDNA variability. To gain a broader perspective on the spatial scale of population structure, these results were integrated with those from an earlier study on more distant Michigan populations (Crease et al. 1989; Hebert et al. 1989).
Material and Methods .
The locations of the 15 study populations are shown in figure 1. Seven of the populations (prefixed with S: SA, SB, SC, SD, SE, SP, and SW) are located on the Smith farm (SF). The ponds were sampled in the spring, just after their reestablishment from ephippial eggs. Animals were returned to the lab and maintained in culture for subsequent isozyme and mtDNA analysis. The reproductive system of each population was determined from both the pattern of isozyme diversity and direct observation (for a detailed discussion of this approach, see Lynch 1983; Hebert et al. 1988).
Four polymorphic enzyme systems were analyzed by starch-gel electrophoresis according to a method described in Lynch ( 1983) : Pgm (phosphoglucomutase; E.C.2.7.5.1), Pgi (phosphoglucose isomerase; E.C.5.3.1.9), Got (glutamate oxaloacetate transaminase; E.C.2.6.1.1)) and Pep (peptidase; E.C.3.4.11/ 13). Three polymorphic loci were assayed on cellulose acetate gels according to the procedures of Hebert and Payne ( 1985) : Fh ( fumarate hydratase; E.C.4.2.1.2)) Mpi (mannosephosphate isom- erase; E.C.5.3.1.8), and Ldh (lactate dehydrogenase; E.C. 1.1.1.27). Large sample sizes

446 Crease et al.
r Shelby Co.
TR .
BU@
Chompoign Co.
Vermilion Co.
0 25 50km
Warren Co.
FIG. 1 .- Daphnia pulex study sites in Illinois and Indiana
were acquired for allele frequency estimation by pooling samples taken over the past few years. Such treatment is justified, since temporal changes in allozyme frequencies in these populations are known to be small and fluctuating in direction (Lynch 1983, 1984, 1987).
Restriction-site variability of mtDNA was assayed using the Southern blot ap- proach according to the methods described by Crease et al. ( 1989). The following type II restriction enzymes were used: ApaI, AvaI, BamHI, MI, BgZII, BstEII, BstNI, ClaI, DraI, EcoRI, EcoRV, HindIII, HpaI, MluI, NcoI, PstI, PvuII, SacI, StuI, XbaI, XhoI, and XmnI. All of these enzymes recognize a single 6-bp sequence-except for AvaI, which recognizes four 6-bp sequences, and BstNI, which recognizes two 5-bp sequences.
Three Daphnia pulex mtDNA fragments, which were cloned in the plasmid pUC 12 and together constitute 98% of the mitochondrial genome, were used as hybridization probes in the Southern blot analysis. The cloning and characterization of these mtDNA clones will be described elsewhere (D. J. Stanton, T. J. Crease, and P. D. N. Hebert, unpublished data). The probes were 32P labeled using the oligolabeling technique of Feinberg and Vogelstein ( 1983). Restriction sites were mapped using double digests and sequential probing of the Southern blots with the three cloned fragments.
Sequence divergence between pairs of mitochondrial haplotypes was calculated by the maximum-likelihood method of Nei and Tajima ( 1983). The average number of substitutions per nucleotide site between random pairs of mitochondria (hereafter referred to as mtDNA variation) within and between populations was calculated by the method of Lynch and Crease ( 1990). The standard error (SE) estimators for the population statistics, also obtained with formulas of Lynch and Crease ( 1990)) include

Population Structure in Daphnia pulex 447
the error due to haplotype sampling (Nei and Jin 1989)) and, in the case of pooled estimates, to sampling a finite number of populations. For comparison of the Illinois and Michigan mtDNA data, only the 17 restriction enzymes common to both studies were used in the analysis.
The degree of genetic differentiation at each hierarchical level was estimated using a fixation-index approach. For the cyclic populations, the isozyme and mtDNA variation were partitioned among four hierarchical levels: ( 1) within populations, (2) between populations within locales, ( 3) between locales within regions, and (4) between regions. There are two regions: Illinois (including one population from Indiana) and Michigan. In Michigan, there are eight locales, with one population sampled from each (Hebert et al. 1989). In Illinois, there are four locales (PA, KA, BU, and SF). Four populations from SF form the basis of the within-locale analysis; one population was sampled from the other three locales. Subscripts for the fixation index at each level are as follows: I = individuals; S = populations; L = locales; R = regions; and T = total.
For the mtDNA data, the degree of differentiation at each hierarchical level was calculated as N = i$,/ (8, + 66), where 6, is the average number of nucleotide sub- stitutions per site for random pairs of mitochondria within populations (or locales or regions) and where &, is the analogous measure between populations (Lynch and Crease 1990 ) .
For the isozyme data, the degree of differentiation at each hierarchical level,was calculated by use of Nei’s ( 1987 ) gene diversity indices. To obtain indices comparable to those for the mtDNA data, we used identical computational techniques, except that alleles were unweighted by their genetic distances, as is usually the case in haplotype analyses. The composite G statistics, pooled over all variable enzyme loci, were obtained from averages of the locus-specific within- and between-population diversity measures, and the SEs were obtained by Taylor expansion (Chakraborty 1974). We assume that there is no inbreeding within populations ( G1s = 0 ) , on the basis of repeated observation of genotype frequencies close to Hardy-Weinberg expectations (Lynch 1983, 1984, 1987).
Results Isozyme Variation in the Cyclic Parthenogens
Of the 15 study populations, seven (PA, KA, SA, SC, SD, SE, and BU) are dominated by cyclic parthenogens, although an obligate clone is also present in BU and SA. Two populations ( SB and SW) are dominated by an obligate clone but also contain cyclic parthenogens. The other six populations (TR, TS, SP, LT, DW, and ON) contain one to three obligate clones but no cyclic parthenogens.
While several of the cyclically parthenogenetic populations are monomorphic for loci that are polymorphic elsewhere, all alleles except Pgi-F are found in two or more populations (table 1). The average heterozygosity is quite constant across pop- ulations, the main exception being PA, which exhibits twice the usual amount of variation. Not recorded in table 1 are monomorphic loci and several loci for which we have difficulty scoring gels. When these loci are included, -50% of the enzyme loci are polymorphic. Thus, when it is averaged over all populations, the observable heterozygosity is -8%, well within the range reported for other invertebrates (Nei 1987). On both a local and a regional scale there is significant spatial heterogeneity of allele frequencies for all loci (P < 0.005, G test).
With the exception of Got, all loci exhibit substantially smaller estimates of G

448 Crease et al.
Table 1 Allele Frequency Estimates for Polymorphic Isozyme Loci in Cyclically Parthenogenetic Daphnia pulex
LOCUS AND ALLELE
POPULATION
PA KA BU SC SD SA SE
Pgm: F ............ M ............ s ............
Pgi: F ............ M+ ........... M ............ M- ........... S ............ Got:
M ............ S- ............
Pep F ............ M ............ s ............
Fh: M ............ S s-::::::IIII:l
Mpi: M ............ s ............ s- ............
IP ......... SE .........
n = 529 0.49 1 0.106 0.403
n = 529
. . . 1 .ooo
. . . n = 529
1.000 . . .
n = 529
d.Bs; 0.347 n = 98 0.464 0.536 . . .
n = 97
Gsb 0.216 0.31 0.10
n = 517 n = 7,879 n = 729 0.075 0.252 0.103 0.925 0.748 0.897 . . .
n = 555 0.047
d.84;
. . . . . . n = 7,879 n = 742
. . . . . .
d.84b 0.02 1 0.135
n = 738 0.870 0.130
n = 705 0.080 0.906 0.014
n= 168
d. l-06 n = 562
0.955 0.045
n = 567 . . . 1.000 . . .
n = 84 0.905 0.905 . . .
n= 128 . . . 1 .OOo . . .
0.11 0.04
. . . n = 7,879
1 .ooo . . .
n = 6,105
d.87.l 0.129
n= 144 . . . 1 .ooo
n L.143 . . . 1 .OOo
d. io’ 0.07
. . . 0.96 1 0.039
n= 168
i.97; 0.027 0.16 0.03
n = 412 . . . 1 .ooo . . .
n = 412
n = 250 0.146 0.818 0.036
n = 259 . . .
0.029 0.909 0.023 0.039
n = 254 0.992 0.008
n= 174 0.011 0.925 0.064
n= 113 0.053 0.938 0.009
n= 106 0.075 0.910 0.015 0.15 0.04
. . .
;.ss;
d. ;4; n’= 412
0.868 0.132
n = 412 0.005 0.706 0.287
n= 108 . . . 1 .ooo . . .
n= 108 . . . 1 .ooo
d. i5’ 0.07
n = 202 0.158 0.827 0.015
n = 200 . . .
0.012 0.860 0.065 0.063
n = 205 0.995 0.005
n= 196 0.003 0.964 0.033 n = 92 0.011 0.984 0.005
n = 92 0.033 0.940 0.027 0.13 0.05
NOTE.-+ = number of individuals sampled. ’ Heterozygosity averaged over all six loci.
on the local scale than on the regional scale (table 2). The pooled GsR estimates for the Illinois and Michigan regions are not significantly different. Noting that ( 1 - GSR) = ( 1 - G&( 1 - GLR) and substituting the pooled Illinois-Michigan mean f SE estimate for GsR (0.25 +: 0.03), we obtain G LR + SE = 0.20 f 0.04. The mean + SE estimate of between-region differentiation (GRT) is 0.11 + 0.04.
mtDNA Variation in the Cyclic Parthenogens
A map of the restriction sites for all enzymes except BstNI and DraI is shown in figure 2. The small size of the fragments produced by the latter enzymes precluded an accurate estimate of their size. On average, 82 restriction sites were assayed per mitochondrial genome.
Nine haplotypes were identified among the seven Illinois cyclic populations. Five of these populations contain at least two haplotypes (table 3). In some cases, the coexisting haplotypes differ by only a single restriction site ( fig. 3 ) . However, it is not unusual to find two divergent haplotypes in the same population (e.g., see PA, SA, SC, and SD). This suggests that some ponds are colonized by multiple founders.

Population Structure in Daphnia pulex 449
Table 2 G Statistics for Polymorphic Isozyme Loci among Cyclically Parthenogenetic Populations of Daphnia pulex
G SR
ENZYME GSL Illinois” Michigan b
Pgm ................ Pgi ................. Got” ................ Pep ................. Fh .................. Mpi ................. Amy ................
Pooled mean + SE ...
0.06 0.41 0.18 0.02 0.10 0.37 0.08 0.07 . . .c 0.13 0.18 . . .d 0.02 0.33 . . : 0.03 0.23 d
d d . . . . . . -O.-l6
. 0.06 f 0.02 0.29 0.06 + 0.22 + 0.04
’ Averages of four calculations, each involving PA, KA, BU, and one of the SF pop ulations.
b Source: Hebert et al. (1989, table 3). ’ Monomorphic in the Michigan populations. d Loci were not assayed.
Twelve haplotypes were identified among the eight cyclic populations from Michigan (Crease et al. 1989); only one of these is also found in Illinois.
The mtDNA haplotypes from Illinois and Michigan do not form two distinct groups (fig. 3). The mean + SE sequence divergence between pairs of haplotypes from Illinois cyclic parthenogens is 0.0073 & 0.0017, while that among haplotypes from Michigan is 0.0090 k 0.002 1, and that between haplotypes from cyclic parthenogens in Michigan versus Illinois is 0.0085 k 0.00 13 [standard errors were obtained by use of the Nei and Jin ( 1989) algorithm]. Thus, the genetic distance among haplotypes from different regions is no greater than that within regions.
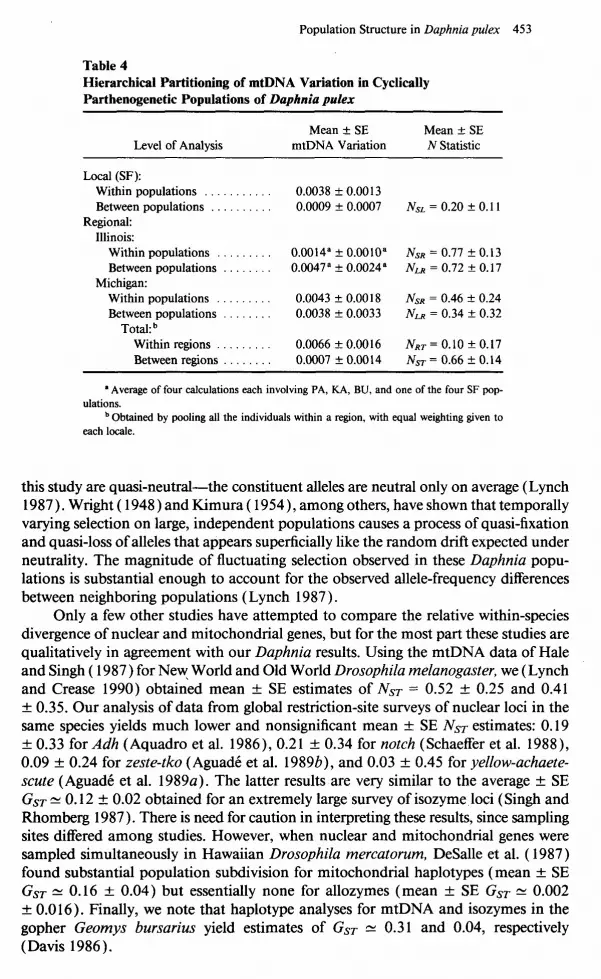
Estimates of mtDNA variation (mean number of nucleotide substitutions per site for random pairs of mitochondria) within cyclic populations from Illinois range from 0.0000 to 0.0052 (table 3). On average, the SF populations are twice as variable as the other Illinois populations (table 4). There is moderately significant inter- population differentiation at the level of locales (mean + SE Nsr, = 0.20 f 0.11)) but differentiation at the regional level appears to be higher-mean f SE NLR = 0.64 + 0.15, when the Illinois and Michigan estimates are pooled. In contrast, the estimate of mtDNA variation between the Michigan and Illinois regions is low, approximately the same as that between populations at the local level (mean + SE NRT = 0.10 k 0.17).
Isozyme and mtDNA Diversity in the Obligate Parthenogens
Six multilocus isozyme genotypes were recognized among the obligate partheno- gens from Illinois (table 5 ) . All but one of these are heterozygous at L&z. This suggests that they all (with one exception) belong to the urban group of obligate parthenogens, which is thought to have arisen via hybridization between Daphnia pulex and D. pulicaria (Hebert et al. 1989).
Multiple isolates of each isozyme genotype were analyzed for mtDNA variation (table 6). There is only one case in which isolates with the same isozyme genotype have a different mitochondrial haplotype (2-4 and 2-6)) and that involves clones from

hq 9 0 P a p me e i f eh I I II 9
i jk rfaqb’e no I I III Ir’ I u
I I II I I
q q cg::,i, j ii i S
(Jkb, FIG. 2.-Map of the mitochondrial genome of Daphnia pulex, based on the recognition sites for 20 restriction enzymes. Sites that are conserved in all haplotypes from
Illinois are shown above the line. Sites that are variable in one or more haplotypes are shown below the line. The letter codes for the restriction enzymes are as follows: a = ApaI; b = AvaI; c = BamHI; d = BclI; e = BglII; f = BstEII; g = ClaI; h = EcoRI; i = EcoRV; j = HindIII; k = HpaI; 1 = MZuI; m = NC& n = PstI; o = fvuI1; p = SacI; q = S&I; r = XbaI; s = XhoI; t = XmnI.

Population Structure in Duphnia pulex 45 1
Table 3 Mitochondrial Haplotype Frequency Estimates in Illinois/Indiana Populations of Cyclically Parthenogenetic Daphnia pulex
SF
HAPLOTYPE PA BU SA SC SD SE
7 8 ::: 9 . . . 10 . . 11 . . 12 . . 13 . . 14 . . 15 . .
aa SE
(n = 31) (n = 21) (n = 16) (n = 26) . . . . 0.19 . . . . . . . . . . . . . . . . . . . . . . . 0.27 . . . . . . . . . . . . . 0.03
. . . . . . . . . . . . . . 0.12
. . . . . . . . . . . . . . 0.19
. . . . . . . . . . 1.00 0.12
. . . . . 0.27
. . . . . bii ::: ::: . . .
. . . . . . . . 1.00 . . . . . .
. . . . 0.0017 0.0000 0.m 0.0052
. . . . . 0.0009 0.0000 0.0000 0.0014
(n = 23) (n = 21) (n = 17) . . . 0.44 b.-l4 : : : . . . . . .
b.b4 b.G biti 0.71
0.04 0.48 b.G iii
. . . * - . . . 0.0044 0.0028 0.0027 0.0015 0.00 13 0.0012
’ mtDNA variation within each population (average number of nucleotide substitutions per site for random pairs of mitochondria).
different populations. Thus, on the basis of the isozyme and mtDNA data, seven unique genotypes appear among the obligate parthenogens. Four of these are restricted to single populations. One clone, however, is found in six populations, and another is found in three populations (table 6). Some of these obligate parthenogenetic clones are geographically widespread. For example, clones 2-4,4- 1, and 5-3 have been found in Essex County, Ontario (Crease et al. 1989; Hebert et al. 1989). Clone 4-l has also been found in Michigan.
The mitochondrial haplotypes of the obligate and cyclic parthenogens are closely related. The haplotypes within obligate and within cyclic parthenogens have mean + SE sequence divergences of 0.0049 + 0.00 14 and 0.0073 + 0.00 17, respectively, while the average + SE divergence between haplotypes across the two groups is 0.0063 + 0.00 12. Thus, the mitochondrial genomes of the obligate parthenogens are no more different from each other than they are from those of the cyclic parthenogens. Five of the seven obligate clone haplotypes cluster very tightly with one another, but one type (13 ) is quite divergent (fig. 4). One haplotype was found in both obligate and cyclic parthenogens.
Discussion
In principle, the population subdivision indices N and G, which we used for mtDNA and isozymes, respectively, need not measure the same type of population structure, since the N statistics weight pairs of genes by their genetic distance while G statistics rely on equal weighting. However, we have shown elsewhere (Lynch and Crease 1990) that for Daphnia pulex mtDNA estimates of GST are very similar to the NST estimates. Thus, it does not seem unreasonable to compare the two types of indices to evaluate the relative extent of population subdivision for mitochondrial and nuclear genes.
For the cyclic parthenogens, there is substantially more population subdivision for the mitochondrial genome than for the nuclear genome, at all levels in the spatial

452 Crease et al.
113/114 M9 Ml4
- Ml5 7 Ml3
M8
18
19 II0
II5
.009 .008 .007 .006 .005 .004 .003 .002 .OOl 0
Sequence Divergence ($1
FIG. 3.-Dendrogram of the haplotypes found in the cyclic populations from Illinois and Michigan, constructed from the matrix of sequence divergence estimates by using the computer program KITSCH supplied by J. Felsenstein. Haplotype numbers preceded by an M are from Michigan and correspond to the numbers given by Crease et al. ( 1989); those from Illinois are preceded by an I. Branch lengths are plotted as half the fitted sequence divergence between haplotypes. Two pairs of Illinois haplotypes (Ill and 112, and 113 and 114) were indistinguishable from one another on the basis of the reduced set of 17 restriction enzymes used in this analysis.
hierarchy (fig. 5 ) . The relative rates of geographic divergence of the two types of genes can be estimated by letting G = 1 - exp( --id) for nuclear genes and N = 1 - exp( -khd) for mitochondrial genes, where d is the distance between populations and where h is the rate of buildup of population subdivision with distance for nuclear genes. We then have I% = In ( 1 - #)/ln ( 1 - G), where .. denotes an estimate. For the three pairs of points in figure 5, we obtain mean f SE R = 3.61 f 2.5 1, 3.36 + 1.36, and 2.69 -t 1.10. Thus, while the rate of mitochondrial divergence is inflated relative to that for nuclear genes, the inflation is somewhat less than the fourfold increase expected under neutrality.
Although we cannot rule out the possibility that the mitochondrial haplotypes of Daphnia are subject to selection, which could cause their geographic rate of diver- gence to be less rapid than the neutral expectation, we do know that the isozymes are diverging more rapidly than expected under the neutral model. The enzyme loci in
Population Structure in Daphnia pulex 453
Table 4 Hierarchical Partitioning of mtDNA Variation in Cyclically Parthenogenetic Populations of Duphniu pulex
Level of Analysis Mean +- SE Mean +- SE
mtDNA Variation N Statistic
Local (SF): Within populations . . . . Between populations . . .
Regional: Illinois:
Within populations . . Between populations .
Michigan: Within populations . . Between populations
Total: b Within regions . . Between regions .
0.0038 + 0.00 13 0.0009 + 0.0007 NsL = 0.20 zk 0.11
0.0014” f 0.0010” NsR = 0.77 + 0.13 0.0047” + 0.0024” NLR = 0.72 + 0.17
0.0043 + 0.00 18 NsR = 0.46 + 0.24 0.0038 + 0.0033 Nm = 0.34 + 0.32
0.0066 AZ 0.00 16 NRT = 0.10 f 0.17 0.0007 f 0.0014 NST = 0.66 + 0.14
a Average of four calculations each involving PA, KA, BU, and one of the four SF pop- ulations.
b Obtained by pooling all the individuals within a region, with equal weighting given to each locale.
this study are quasi-neutral-the constituent alleles are neutral only on average (Lynch 1987). Wright ( 1948 ) and Kimura ( 1954)) among others, have shown that temporally varying selection on large, independent populations causes a process of quasi-fixation and quasi-loss of alleles that appears superficially like the random drift expected under neutrality. The magnitude of fluctuating selection observed in these Daphnia popu- lations is substantial enough to account for the observed allele-frequency differences between neighboring populations ( Lynch 1987 ) .
Only a few other studies have attempted to compare the relative within-species divergence of nuclear and mitochondrial genes, but for the most part these studies are qualitatively in agreement with our Daphnia results. Using the mtDNA data of Hale and Singh ( 1987) for New, World and Old World Drosophila melanogaster, we (Lynch and Crease 1990) obtained mean + SE estimates of N&- = 0.52 + 0.25 and 0.41 f 0.35. Our analysis of data from global restriction-site surveys of nuclear loci in the same species yields much lower and nonsignificant mean & SE NST estimates: 0.19 + 0.33 for Adh (Aquadro et al. 1986), 0.21 k 0.34 for notch (Schaeffer et al. 1988), 0.09 + 0.24 for zeste-tko ( AguadC et al. 19896), and 0.03 f 0.45 for yellow-achaete- scute ( AguadC et al. 1989a). The latter results are very similar to the average * SE GST= 0.12 + 0.02 bt o ained for an extremely large survey of isozyme loci (Singh and Rhomberg 1987). There is need for caution in interpreting these results, since sampling sites differed among studies. However, when nuclear and mitochondrial genes were sampled simultaneously in Hawaiian Drosophila mercatorum, DeSalle et al. ( 1987) found substantial population subdivision for mitochondrial haplotypes (mean + SE GST II 0.16 -+ 0.04) b u essentially none for allozymes (mean f SE GST N 0.002 t * 0.016). Finally, we note that haplotype analyses for mtDNA and isozymes in the gopher Geomys bursar& yield estimates of GST N 0.31 and 0.04, respectively (Davis 1986).

454 Crease et al.
Table 5 Multilocus Isozyme Genotypes for Obligately Parthenogenetic Daphniu pufex
Genotype &w Pgi Got Pep Fh Ldh
1 . . . . . 2 3 ::::: 4 . . . . . 5 6 :::::
MS- MM FM MM ss FS MM MM FM MM ss FS FF M+M MM MM ss FS MM MS MM MM ss FS FM MM MM MM ss FS FM MM MM MM ss ss
All of these results support the idea that mitochondrial genes diverge more ex- tensively in subdivided populations than do nuclear genes. The situation in modem man appears to be rather different. Nei ( 1982) has estimated the subdivision (GST) for nuclear gene loci in the three major races to be 0.09 for proteins and 0.11 for blood groups but to be only 0.06 for mtDNA. Although the sample sizes for Nei’s ( 1982) mitochondrial analysis were small, a much more extensive study has yielded essentially the same result (Whittam et al. 1986).
The present study has only covered a small portion of the circumpolar distribution of Daphnia pulex. Nevertheless, it has been sufficient to document the extreme degree of population subdivision of this species. The estimates of mtDNA NST and nuclear gene GST for populations in a three-state area exceed those for the global populations of Drosophila melanogaster and man. Broad geographic surveys of most other species of animals exhibit lower levels of subdivision than does Daphnia pulex, for both mi- tochondrial (Lynch and Crease 1990) and nuclear (Nei 1987) genes. As noted above, fluctuating selection plays a role in the divergence of Daphnia allozyme frequencies. It may also influence the distribution of mitochondrial haplotypes, perhaps even more so than in the case of nuclear genes. Because mitochondrial genes are completely linked, selection can act effectively on entire haplotypes. ‘Some evidence for selective differences in mtDNA have been reported for Drosophila pseudoobscura (MacRae
Table 6 Distribution of Obligate Clones in the Illinois Populations of Duphniu pulex
COMPOSITE GENOTYPE OF OBLIGATE CLONE’
POPULATION l-5 2-4 2-6 3-2 4-l 5-3 6-7
SF: SA . . . . SB . . . . SP . . . . SW . . .
DW . . . . . ON . . . . . TR . . . . . . LT . . . . . . TS . . . . . . BU . . . . . .
...... ... ......... 1 ... ...
......... ...... 3 .........
...... ............ 8 8 ...
...... ......... 3 .........
.................. 6 ......
.................. 1 7 ...
......... ......... 12 ... 1
......... 1 ... 5 3 ... ...
8 The first number of the clone name refers to the isozyme genotype (table 5), and the second number refers to the mitochondrial haplotype (fig. 4).

Population Structure in Daphnia pulex 455
I----
-- --
----
--e-
1
---_---
14 II I6 12 15 113
II4
Ill
II2
I7
II0
19
18
II5
13
.006 .005 .004 .003 .002 .OOl 0
Sequence Divergence 6)
FIG. 4.-Dendrogram of Illinois haplotypes, as in fig. 3. Branches drawn with solid lines correspond to haplotypes found in cyclic parthenogens, while those drawn with broken lines correspond to haplotypes found in obligate parthenogens.
and Anderson 1988). However, a major factor responsible for the divergence of local populations of Daphnia pulex must be the inability of this organism to actively disperse.
Despite the fact that mtDNA variation in Daphnia pulex is highly structured within regions, there is little additional differentiation between regions. This same pattern of weak macrogeographic divergence superimposed on strong microgeographic differentiation has been observed both in human blood group surveys in Japan (Nei and Imaizumi 1966a, 1966b) and in isozyme surveys of the snails Cepaea nemoralis and C. hortensis from Europe and Britain (Ochman et al. 1987), of the sunfish Lepomis macrochirus from various drainage systems in the southeastern United States (Avise and Smith 1974; Avise and Felley 1979), and of the salamander Plethodon cinereus from areas of North America that were glaciated during the Pleistocene (Larson et al. 1984). For species with low dispersal rates, this type of pattern can result from multiple colonization events, with each new population being founded by a small number of propagules.
Such a scenario seems likely for Daphnia. All of the Daphnia pulex populations in t.he present study are located in areas that were glaciated during the Pleistocene (Flint 197 1). Thus, the pattern of macrogeographic homogeneity and microgeographic heterogeneity may reflect the fact that the species has recently spread northward from relict populations that persisted south of the last glaciation. Despite their inability to

Crease et al. 456
0.8
0.7
0.6
0.5
0.4
0.3
0.2
0.1
0.1 . . .
Distance’ ~etvvee~~opul~~ins 1000.0
(km) FIG. L-Graph of the cumulative population subdivision as a function of the distance between pop
ulations. The solid circles represent estimates of N based on the mtDNA data, and the open circles represent estimates of G based on the isozyme data. The value of G (or N) at each level is calculated from ( 1 - G) = II( 1 - Gx), where the G, are the lower-order G statistics. The error bars represent + 1 standard error.
disperse actively, Daphnia do have the potential to disperse over long distances via birds. A major flyway for migrating ducks and geese runs through the central United States. If migrating birds are responsible for the observed genetic homogeneity between regions, one might expect to find divergent Daphnia pulex populations outside the range of the central flyway. Few, if any, migration routes cross the Rocky Mountains, but there is another flyway along the West Coast. Surveys of isozyme and mtDNA variation are currently underway with populations from Oregon to test this prediction.
Obligate parthenogenesis is common in the Daphnia pulex complex, and the fact that several such clones are widespread geographically suggests that some genotypes of this species can be ecologically successful in the absence of sex. The results of the present study support the hypothesis that obligate parthenogenesis is polyphyletic in origin in Daphnia pulex and that the extant clones are evolutionarily young (i.e., have existed for a period shorter than the coalescent time for genes within the sexual species). Thus, unless obligate parthenogenesis is a recently evolved reproductive mode in Daphnia pulex, the short-term ecological success experienced by some clones cannot be taken as evidence of evolutionary longevity.
Acknowledgments
This work was supported by NSF grants BSR 86-00487 and BSR 89-l 1038 to M.L., by a Sloan Foundation postdoctoral fellowship to T.J.C., and by an NSF graduate fellowship to K.S. We would like to thank J. Felsenstein for supplying the computer program used to construct the dendrograms; R. Chakraborty, P. Jarrell, and M. Nei for helpful comments; J. Smith for access to the SF collecting sites; and D. Enstrom for obtaining Daphnia samples from the DW population.

Population Structure in Duphnia pulex 457
LITERATURE CITED
AGUADB, M., N. MIYASHITA, and C. H. LANGLEY. 1989~. Reduced variation in the yellow- achaete-scute region in natural populations of Drosophila melanogaster. Genetics 122:607-
. 615. ~ 1989b. Restriction-map variation at the Zeste-tko region in natural populations of .
Drosophila melanogaster. Mol. Biol. Evol. 6: 123- 130. AQUADRO, C. F., S. F. DESSE, M. M. BLAND, C. H. LANGLEY, and C. C. LAURIE-AHLBERG.
1986. Molecular population genetics of the alcohol dehydrogenase gene region of DrosophiZa melunogaster. Genetics 114: 1165- 1190.
AVISE, J. C., and J. FELLEY. 1979. Population structure of freshwater fishes. I. Genetic variation of bluegill (Lepomis macrochirus) populations in man-made reservoirs. Evolution 33: 15- 26.
AVISE, J. C., C. GIBLIN-DAVIDSON, J. LAERM, J. C. PATTON, and R. A. LANSMAN. 1979. Mitochondrial DNA clones and matriarchal phylogeny within and among geographic pop- ulations of the pocket gopher, Geomys pinetis. Proc. Natl. Acad. Sci. USA 76:6694-6698.
AVISE, J. C., and M. H. SMITH. 1974. Biochemical genetics of sunfish. I. Geographic variation and subspecific inter-gradation in the bluegill, Lepomis macrochirus. Evolution 28:42-56.
BIRKY, C. W. JR., P. FUERST, and T. MARUYAMA. 1989. Organelle gene diversity under mi- gration, mutation, and drift: equilibrium expectations, approach to equilibrium, effects of heteroplasmic cells, and comparisons to nuclear genes. Genetics 121:6 13-627.
BIRKY, C. W. JR., T. MARUYAMA, and P. FUERST. 1983. An approach to population and evolutionary genetic theory for genes in mitochondria and chloroplasts, and some results. Genetics 103:5 13-527.
CHAKRABORTY, R. 1974. A note on Nei’s measure of gene diversity in a substructured population. Humangenetik 21:85-88.
CREASE, T. C., D. J. STANTON, and P. D. N. HEBERT. 1989. Polyphyletic origins of asexuality in Duphnia pulex. II. Mitochondrial-DNA variation. Evolution 43: 10 16- 1026.
DAVIS, S. K. 1986. Population structure and patterns of speciation in Geomys (Rodentia:Geo- myidae): an analysis using mitochondrial and ribosomal DNA. Ph.D. diss., Washington University, St. Louis.
DESALLE, A. TEMPLETON, I. MORI, S. PLETSCHER, and J. S. JOHNSTON. 1987. Temporal and spatial heterogeneity of mtDNA polymorphisms in natural populations of Drosophila mer- catorum. Genetics 116:2 15-223.
FEINBERG, A. P., and B. V~GELSTEIN. 1983. A technique for radiolabelling DNA restriction endonuclease fragments to high specific activity. Anal. Biochem. 132:6- 13.
FL.INT, R. F. 197 1. Glacial and quaternary geology. John Wiley & Sons, New York. HALE, L. R., and R. S. SING& 1987. Mitochondrial DNA variation and genetic structure in
populations of DrosophiZa melanoguster. Mol. Biol. Evol. 4:622-637. HEBERT, P. D. N., M. J. BEATON, and S. S. SCHWARTZ. 1989. Polyphyletic origins of asexuality
in Daphnia pulex. I. Breeding-system variation and levels of clonal diversity. Evolution 43: 1004-1015.
HEBERT, P. D. N., and T. J. CREASE. 1980. Clonal coexistence in Daphnia pulex Leydig: another planktonic paradox. Science 207: 1373- 1375.
HEBERT, P. D. N., and W. J. PAYNE. 1985. Genetic variation in populations of the hermaphroditic flatworm Mesostoma lingua ( Turbellaria; Rhabdocoela ) . Biol. Bull. 169: 143- 15 1.
HEBERT, P. D. N., R. D. WARD, and L. J. WEIDER. 1988. Clonal diversity patterns and breeding system variation in Daphnia pulex, an asexual-sexual complex. Evolution 42: 147- 159.
INNES, D. J., S. S. SCHWARTZ, and P. D. N. HEBERT. 1986. Genotypic diversity and variation in mode of reproduction among populations in the Duphnia pulex group. Heredity 57:345- 355.
RIMURA, M. 1954. Process leading to quasi-fixation of genes in natural populations due to random fluctuation of selection intensities. Genetics 39:280-295.

458 Crease et al.
LARSON, A., D. B. WAKE, and K. P. YANEV. 1984. Measuring gene flow among populations having high levels of genetic fragmentation. Genetics 106:293-308.
LYNCH, M. 1983. Ecological genetics of Duphnia p&x. Evolution 37:358-374. . 1984. The genetic structure of a cyclical parthenogen. Evolution 38: 186-203.
1987. The consequences of fluctuating selection for isozyme polymorphisms in Daphniu. Genetics 115:657-669.
LYNCH, M., and T. J. CREASE. 1990. The analysis of population survey data on DNA sequence variation. Mol. Biol. Evol. 7: 377-394.
MACRAE, A. F., and W. W. ANDERSON. 1988. Evidence for non-neutrality of mitochondrial DNA haplotypes in Drosophila pseudoobscura. Genetics 120:485-494.
NEI, M. 1982. Evolution of human races at the gene level. Pp. 167-18 1 in B. BONNE-TAMIR, P. COHEN, and R. N. GOODMAN, eds. Human genetics, part A: the unfolding genome. Alan R. Liss, New York.
. 1987. Molecular evolutionary genetics. Columbia University Press, New York. NEI, M., and Y. IMAIZUMI. 1966a. Genetic structure of human populations. I. Local differen-
tiation of blood group gene frequencies in Japan. Heredity 21:9-35. . 1966b. Genetic structure of human populations. III. Differentiation of ABO blood
group gene frequencies in small areas of Japan. Heredity .21:46 l-472. NEI, M., and L. JIN . 1989. Variances of the average numbers of nucleotide substitutions within
and between populations. Mol. Biol. Evol. 6:290-300. NEI, M., and F. TAJIMA. 1983. Maximum likelihood estimation of the number of nucleotide
substitutions from restriction sites data. Genetics 105:207-2 17. OCHMAN, H., J. S. JONES, and R. K. SELANDER. 1987. Large scale patterns of genetic differ-
entiation at enzyme loci in the land snails Cepaea nemoralis and Cepaea hortensis. Heredity 58:127-138.
SCHAEFFER, S. W., C. F. AQUADRO, and C. H. LANGLEY. 1988. Restriction-map variation in the Notch region of Drosophila melunogaster. Mol. Biol. Evol. 5:30-40.
SINGH, R. S., and L. R. RHOMBERG. 1987. A comprehensive study of genetic variation in natural populations of Drosphilu melanogaster. II. Estimates of heterozygosity and patterns of geographic differentiation. Genetics 117:255-27 1.
TAKAHATA, N., and S. R. PALUMBI. 1985. Extranuclear differentiation and gene flow in the finite island model. Genetics 109:441-457.
TAKAHATA, N., and M. SLATKIN. 1984. Mitochondrial gene flow. Proc. Natl. Acad. Sci. USA 81:1764-1767.
WEIDER, L. J., M. J. BEATON, and P. D. N. HEBERT. 1987. Clonal diversity in high-arctic populations of Duphnia pulex: a polyploid apomictic complex. Evolution 41: 1335- 1346.
WHITTAM, T. S., A. G. CLARK, M. STONEKING, R. L. CANN, and A. C. WILSON. 1986. Allelic variation in human mitochondrial genes based on patterns of restriction site polymorphism. Proc. Natl. Acad. Sci. USA 83:96 1 l-96 15.
WRIGHT, S. 1948. On the roles of directed and random changes in gene frequency in the genetics of populations. Evolution 2:279-294.
MASATOSHI NEI, reviewing editor .
Received April 25, 1989; revision received April 26, 1990
Accepted May 7, 1990