heteroleptic fe ii complexes of 2,2′-biimidazole and its alkylated derivatives: spin-crossover and...
TRANSCRIPT
DOI: 10.1002/chem.201202045
Heteroleptic FeII Complexes of 2,2’-Biimidazole and Its AlkylatedDerivatives: Spin-Crossover and Photomagnetic Behavior
Hoa V. Phan,[a] Pradip Chakraborty,[b] Meimei Chen,[c] Yitzi M. Calm,[d] Kirill Kovnir,[a, e]
Lawrence K. Keniley, Jr.,[a] Jordan M. Hoyt,[a] Elisabeth S. Knowles,[d] C�line Besnard,[f]
Mark W. Meisel,*[d] Andreas Hauser,*[b] Catalina Achim,*[c] and Michael Shatruk*[a]
Introduction
The transformation between the high-spin (HS) and low-spin (LS) forms of a transition-metal ion was first discoveredin FeIII dithiocarbamates.[1] Subsequently, this spin-crossover
(SCO) phenomenon has been found most commonly incomplexes of the octahedral FeII ion.[2] The SCO can be in-duced by changes in either temperature or pressure, and byphotoexcitation. The change in spin state is accompanied bypronounced changes in the magnetic, structural, and spec-
Abstract: Three iron(II) complexes,[Fe ACHTUNGTRENNUNG(TPMA) ACHTUNGTRENNUNG(BIM)] ACHTUNGTRENNUNG(ClO4)2·0.5H2O (1),[Fe ACHTUNGTRENNUNG(TPMA) ACHTUNGTRENNUNG(XBIM)] ACHTUNGTRENNUNG(ClO4)2 (2), and[Fe ACHTUNGTRENNUNG(TPMA) ACHTUNGTRENNUNG(XBBIM)] ACHTUNGTRENNUNG(ClO4)2
·0.75CH3OH (3), were prepared by re-actions of FeII perchlorate and the cor-responding ligands (TPMA = tris(2-pyr-idylmethyl)amine, BIM =2,2’-biimida-zole, XBIM= 1,1’-(a,a’-o-xylyl)-2,2’-bii-midazole, XBBIM= 1,1’-(a,a’-o-xylyl)-2,2’-bibenzimidazole). The compoundswere investigated by a combination ofX-ray crystallography, magnetic andphotomagnetic measurements, andMçssbauer and optical absorption spec-troscopy. Complex 1 exhibits a gradualspin crossover (SCO) with T1/2 = 190 K,whereas 2 exhibits an abrupt SCO withapproximately 7 K thermal hysteresis(T1/2 =196 K on cooling and 203 K onheating). Complex 3 is in the high-spin
state in the 2–300 K range. The differ-ence in the magnetic behavior wastraced to differences between the inter-and intramolecular interactions in 1and 2. The crystal packing of 2 featuresa hierarchy of intermolecular interac-tions that result in increased coopera-tivity and abruptness of the spin transi-tion. In 3, steric repulsion between Hatoms of one of the pyridyl substituentsof TPMA and one of the benzene ringsof XBBIM results in a strong distortionof the FeII coordination environment,which stabilizes the high-spin state ofthe complex. Both 1 and 2 exhibit aphotoinduced low-spin to high-spin
transition (LIESST effect) at 5 K. Thedifference in the character of intermo-lecular interactions of 1 and 2 alsomanifests in the kinetics of the decayof the photoinduced high-spin state.For 1, the decay rate constant followsthe single-exponential law, whereas for2 it is a stretched exponential, reflect-ing the hierarchical nature of intermo-lecular contacts. The structural parame-ters of the photoinduced high-spinstate at 50 K are similar to those deter-mined for the high-spin state at 295 K.This study shows that N-alkylation ofBIM has a negligible effect on theligand field strength. Therefore, thecombination of TPMA and BIM offersa promising ligand platform for thedesign of functionalized SCO com-plexes.
Keywords: iron complexes ·LIESST effect · N ligands · photo-magnetism · spin crossover
[a] H. V. Phan, Dr. K. Kovnir, L. K. Keniley, Jr., J. M. Hoyt,Prof. M. ShatrukDepartment of Chemistry and BiochemistryFlorida State University95 Chieftan Way, Tallahassee, FL 32306 (USA)Fax: (+1) 850-644-8281E-mail : [email protected]
[b] P. Chakraborty, Prof. A. HauserDepartement de Chimie Physique, Universit� de Gen�ve30, quai Ernest-Ansermet, 1211 Geneve 4 (Switzerland)Fax: (+41) 22-379-6103E-mail : [email protected]
[c] M. Chen, Prof. C. AchimDepartment of Chemistry, Carnegie Mellon University4400 Fifth Ave, Pittsburgh, PA 15213 (USA)Fax: (+1) 412-268-1061E-mail : [email protected]
[d] Y. M. Calm, E. S. Knowles, Prof. M. W. MeiselDepartment of Physics and NHMFL, University of FloridaGainesville, FL 32611-8440 (USA)Fax: (+1) 325-392-9147E-mail : [email protected]
[e] Dr. K. KovnirPresent address: Department of ChemistryUniversity of California at DavisDavis, CA 95616 (USA)
[f] Dr. C. BesnardLaboratoire de Cristallographie, Universit� de Gen�ve24, quai Ernest-Anserment, 1211 Gen�ve 4 (Switzerland)Fax: (+41) 22-397-6103
Supporting information for this article is available on the WWWunder http://dx.doi.org/10.1002/chem.201202045.
Chem. Eur. J. 2012, 18, 15805 – 15815 � 2012 Wiley-VCH Verlag GmbH & Co. KGaA, Weinheim 15805
FULL PAPER
troscopic properties of the transition-metal complex. Hence,the SCO complexes have potential applications in data stor-age and as sensors.[3] Recent progress in molecular electron-ics, facilitated by our improved ability to synthesize, manipu-late, and assemble matter at nanoscales, provided new impe-tus to study SCO complexes for potential applications inhigh-speed, high-density switches and recording media.[4] Inthis vein, formation of arrays of SCO centers on varioussubstrates is of great fundamental interest.[5]
Three principal requirements must be satisfied to utilizeSCO complexes in such nanoscale architectures:
1) the complex should possess pendant functionalities forattachment to the corresponding substrate;
2) the pendant group should be easily tunable to allow at-tachment to various surfaces and under different envi-ronments;
3) the SCO behavior should be retained after the complexhas been attached to the surface.
The design of such a compound is nontrivial becausesmall change in the structure of the complex and modifica-tion of its environment may lead to loss of the SCO behav-ior.
In an effort to design a SCO complex appropriate for sur-face binding, we noted the compound [FeII ACHTUNGTRENNUNG(DPEA) ACHTUNGTRENNUNG(BIM)]-ACHTUNGTRENNUNG(ClO4)2 (DPEA= (2-aminoethyl)bis(2-pyridylmethyl)amine,BIM= 2,2’-biimidazole) that was reported to undergo agradual spin transition with T1/2 =200 K (T1/2 is defined asthe temperature at which the amounts of HS and LS speciesin the sample are equal.).[6a] The protonated N atoms on theperiphery of the chelating BIM ligand offer convenientaccess to a variety of derivatives through N-alkylation. Wehypothesized that such substitution of the aliphatic groupsfor the H atoms should have a relatively small effect on theligand field strength of BIM.
The study reported herein aimed to verify the hypothesisthat BIM could be used as a ligand platform for attachmentof various functionalities to an FeII SCO complex, while pre-serving the existing spin transition. Additionally, to increasethe long-term stability of the ligands and complexes in-
volved, we decided to replace the amino-containing DPEAwith the tris(2-pyridylmethyl)amine (TPMA) ligand, whichwas also shown to be effective for achieving SCO behaviorin FeII complexes.[6b–d] We present the synthesis and a de-tailed study of the structural, magnetic, and photomagneticproperties of a series of FeII complexes that have as ligandseither BIM or one of its alkylated derivatives (Scheme 1)and TPMA. We discuss various aspects of spin transitions inthese complexes and demonstrate the viability of the chosenset of ligands for the preparation of modified SCO com-plexes appropriate for surface binding studies.
Results and Discussion
Synthesis : Complexes [Fe ACHTUNGTRENNUNG(TPMA)(L2)] ACHTUNGTRENNUNG(ClO4)2·Solv (1, L2 =
BIM, Solv= 0.5H2O; 2, L2 =XBIM; 3, L2 =XBBIM, Solv=
0.75CH3OH) were synthesized by reacting FeACHTUNGTRENNUNG(ClO4)2·6H2Owith the corresponding bidentate ligand L2 in a 1:1 ratio, fol-lowed by the addition of one equivalent of TPMA. The ini-tial reaction between the FeII precursor and L2 is fast, as in-dicated by the formation of a clear solution within secondsafter mixing a solution of FeACHTUNGTRENNUNG(ClO4)2·6H2O with a suspensionof L2. The obtained solution becomes cloudy after a few mi-nutes. TPMA is added into the reaction mixture as soon ascloudiness is observed. The resulting clear solution was stir-red vigorously for a few seconds and then quickly filtered.Crystals of all complexes were obtained either by leavingthe filtrate undisturbed overnight (for 1) or by layering thefitrate with diethyl ether (for 2 and 3). The crystallizationwas performed under inert atmosphere to avoid decreasedreaction yields.
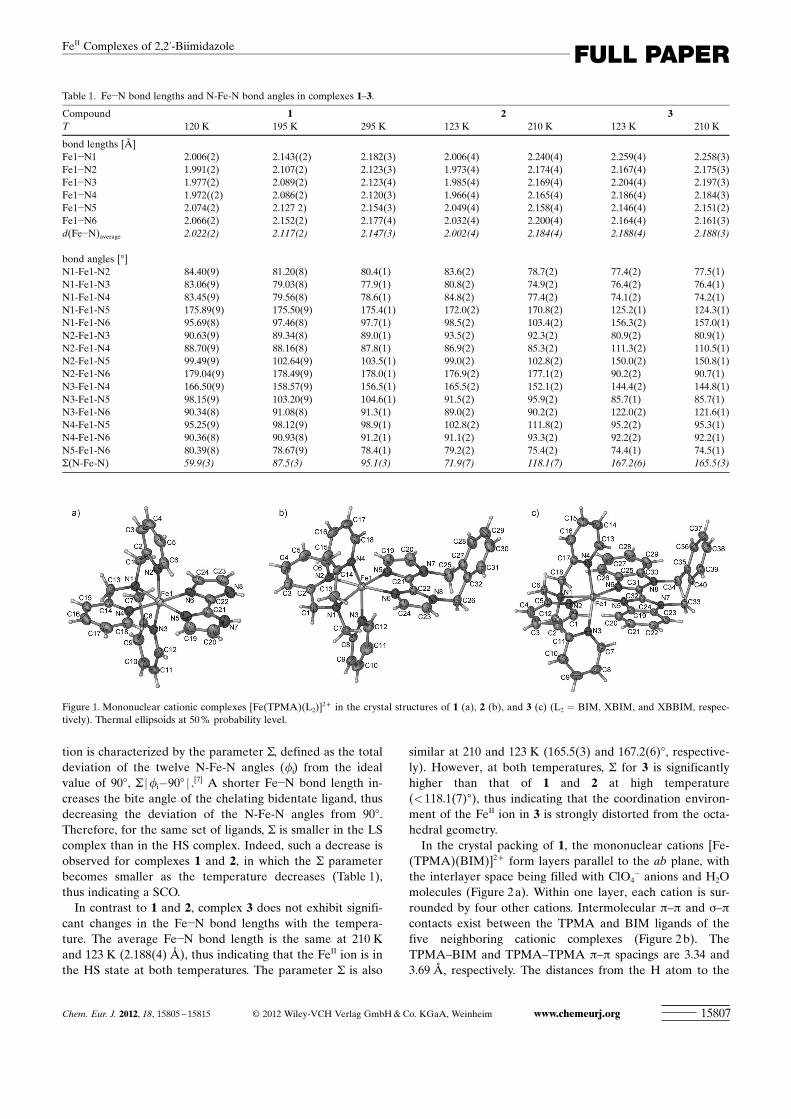
Crystal structures : The crystal structure of complexes 1–3was determined at different temperatures. All complexescrystallize in monoclinic space groups (see Table 4 in theExperimental Section). No symmetry change was observedupon changing the temperature. 1 and 3 crystallized with in-terstitial solvent molecules. The crystals of 2 did not containsolvent. In each complex, the FeII ion is coordinated by fourN atoms of TPMA and two imino N atoms of the corre-sponding L2 ligand (Figure 1). The Fe�N bond lengths andN-Fe-N bond angles are listed in Table 1.
Complexes 1 and 2 exhibit dramatic changes in the coor-dination environment of the FeII ion as a function of temper-ature (Table 1). In the structure of 1, the average Fe�Nbond length increases from 2.022(2) to 2.117(2) to2.147(3) � at 120, 195, and 295 K, respectively. Similarly for2, the average Fe�N bond length increases from 2.002(4) at123 K to 2.184(4) � at 210 K. The observed changes areconsistent with SCO, that is, the transition of FeII ions fromthe LS state to the HS state as the temperature increases,because the population of the antibonding eg orbitals in theHS state should lead to the longer bond lengths.
SCO affects the distortion of octahedral coordination ofthe FeII ion in complexes with chelating ligands. This distor-
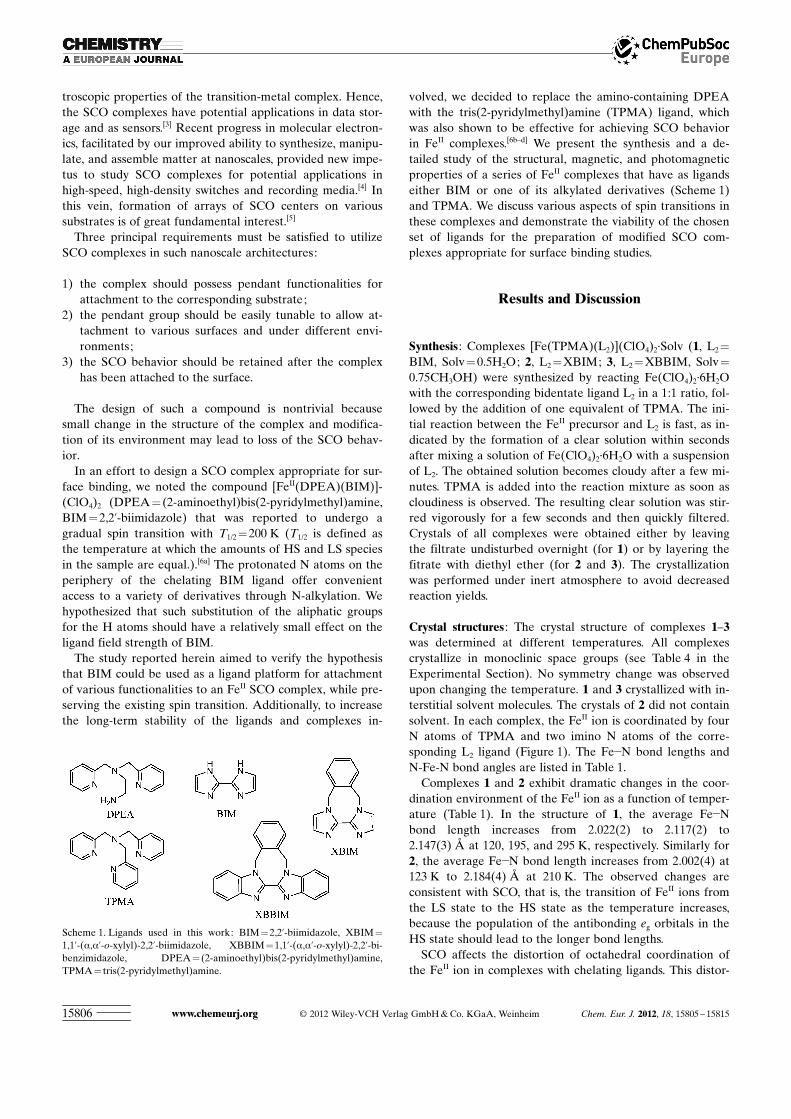
Scheme 1. Ligands used in this work: BIM =2,2’-biimidazole, XBIM =
1,1’-(a,a’-o-xylyl)-2,2’-biimidazole, XBBIM =1,1’-(a,a’-o-xylyl)-2,2’-bi-benzimidazole, DPEA = (2-aminoethyl)bis(2-pyridylmethyl)amine,TPMA = tris(2-pyridylmethyl)amine.
www.chemeurj.org � 2012 Wiley-VCH Verlag GmbH & Co. KGaA, Weinheim Chem. Eur. J. 2012, 18, 15805 – 1581515806
tion is characterized by the parameter S, defined as the totaldeviation of the twelve N-Fe-N angles (fi) from the idealvalue of 908, S jfi�908 j .[7] A shorter Fe�N bond length in-creases the bite angle of the chelating bidentate ligand, thusdecreasing the deviation of the N-Fe-N angles from 908.Therefore, for the same set of ligands, S is smaller in the LScomplex than in the HS complex. Indeed, such a decrease isobserved for complexes 1 and 2, in which the S parameterbecomes smaller as the temperature decreases (Table 1),thus indicating a SCO.
In contrast to 1 and 2, complex 3 does not exhibit signifi-cant changes in the Fe�N bond lengths with the tempera-ture. The average Fe�N bond length is the same at 210 Kand 123 K (2.188(4) �), thus indicating that the FeII ion is inthe HS state at both temperatures. The parameter S is also
similar at 210 and 123 K (165.5(3) and 167.2(6)8, respective-ly). However, at both temperatures, S for 3 is significantlyhigher than that of 1 and 2 at high temperature(<118.1(7)8), thus indicating that the coordination environ-ment of the FeII ion in 3 is strongly distorted from the octa-hedral geometry.
In the crystal packing of 1, the mononuclear cations [Fe-ACHTUNGTRENNUNG(TPMA) ACHTUNGTRENNUNG(BIM)]2+ form layers parallel to the ab plane, withthe interlayer space being filled with ClO4
� anions and H2Omolecules (Figure 2 a). Within one layer, each cation is sur-rounded by four other cations. Intermolecular p–p and s–p
contacts exist between the TPMA and BIM ligands of thefive neighboring cationic complexes (Figure 2 b). TheTPMA–BIM and TPMA–TPMA p–p spacings are 3.34 and3.69 �, respectively. The distances from the H atom to the
Table 1. Fe�N bond lengths and N-Fe-N bond angles in complexes 1–3.
Compound 1 2 3T 120 K 195 K 295 K 123 K 210 K 123 K 210 K
bond lengths [�]Fe1�N1 2.006(2) 2.143((2) 2.182(3) 2.006(4) 2.240(4) 2.259(4) 2.258(3)Fe1�N2 1.991(2) 2.107(2) 2.123(3) 1.973(4) 2.174(4) 2.167(4) 2.175(3)Fe1�N3 1.977(2) 2.089(2) 2.123(4) 1.985(4) 2.169(4) 2.204(4) 2.197(3)Fe1�N4 1.972((2) 2.086(2) 2.120(3) 1.966(4) 2.165(4) 2.186(4) 2.184(3)Fe1�N5 2.074(2) 2.127 2) 2.154(3) 2.049(4) 2.158(4) 2.146(4) 2.151(2)Fe1�N6 2.066(2) 2.152(2) 2.177(4) 2.032(4) 2.200(4) 2.164(4) 2.161(3)d ACHTUNGTRENNUNG(Fe�N)average 2.022(2) 2.117(2) 2.147(3) 2.002(4) 2.184(4) 2.188(4) 2.188(3)
bond angles [8]N1-Fe1-N2 84.40(9) 81.20(8) 80.4(1) 83.6(2) 78.7(2) 77.4(2) 77.5(1)N1-Fe1-N3 83.06(9) 79.03(8) 77.9(1) 80.8(2) 74.9(2) 76.4(2) 76.4(1)N1-Fe1-N4 83.45(9) 79.56(8) 78.6(1) 84.8(2) 77.4(2) 74.1(2) 74.2(1)N1-Fe1-N5 175.89(9) 175.50(9) 175.4(1) 172.0(2) 170.8(2) 125.2(1) 124.3(1)N1-Fe1-N6 95.69(8) 97.46(8) 97.7(1) 98.5(2) 103.4(2) 156.3(2) 157.0(1)N2-Fe1-N3 90.63(9) 89.34(8) 89.0(1) 93.5(2) 92.3(2) 80.9(2) 80.9(1)N2-Fe1-N4 88.70(9) 88.16(8) 87.8(1) 86.9(2) 85.3(2) 111.3(2) 110.5(1)N2-Fe1-N5 99.49(9) 102.64(9) 103.5(1) 99.0(2) 102.8(2) 150.0(2) 150.8(1)N2-Fe1-N6 179.04(9) 178.49(9) 178.0(1) 176.9(2) 177.1(2) 90.2(2) 90.7(1)N3-Fe1-N4 166.50(9) 158.57(9) 156.5(1) 165.5(2) 152.1(2) 144.4(2) 144.8(1)N3-Fe1-N5 98.15(9) 103.20(9) 104.6(1) 91.5(2) 95.9(2) 85.7(1) 85.7(1)N3-Fe1-N6 90.34(8) 91.08(8) 91.3(1) 89.0(2) 90.2(2) 122.0(2) 121.6(1)N4-Fe1-N5 95.25(9) 98.12(9) 98.9(1) 102.8(2) 111.8(2) 95.2(2) 95.3(1)N4-Fe1-N6 90.36(8) 90.93(8) 91.2(1) 91.1(2) 93.3(2) 92.2(2) 92.2(1)N5-Fe1-N6 80.39(8) 78.67(9) 78.4(1) 79.2(2) 75.4(2) 74.4(1) 74.5(1)S ACHTUNGTRENNUNG(N-Fe-N) 59.9(3) 87.5(3) 95.1(3) 71.9(7) 118.1(7) 167.2(6) 165.5(3)
Figure 1. Mononuclear cationic complexes [Fe ACHTUNGTRENNUNG(TPMA)(L2)]2+ in the crystal structures of 1 (a), 2 (b), and 3 (c) (L2 = BIM, XBIM, and XBBIM, respec-tively). Thermal ellipsoids at 50% probability level.
Chem. Eur. J. 2012, 18, 15805 – 15815 � 2012 Wiley-VCH Verlag GmbH & Co. KGaA, Weinheim www.chemeurj.org 15807
FULL PAPERFeII Complexes of 2,2’-Biimidazole
plane of the aromatic ring along the s–p contact are 2.76and 3.10 � for the BIM–TPMA and TPMA–TPMA interac-tions, respectively. Notably, a pronounced double-layerstructure is observed along the c axis (Figure 2 a). No signifi-cant p–p or s–p contacts can be identified between mole-cules in different layers.
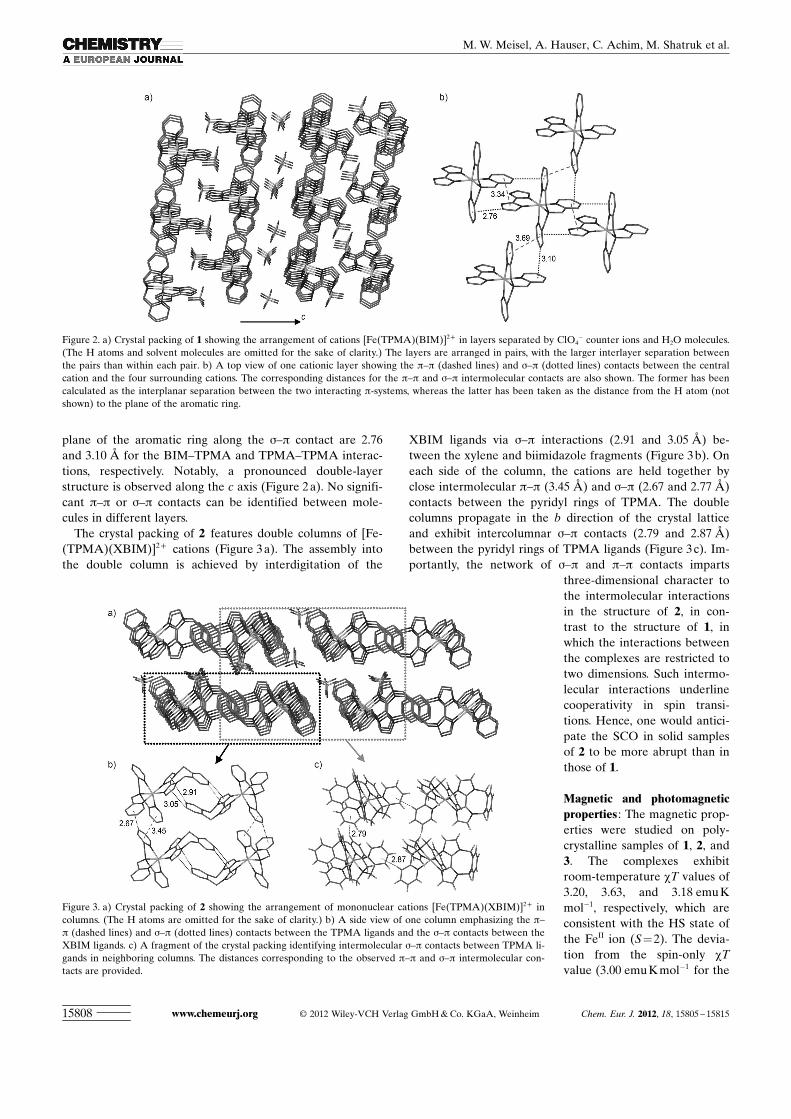
The crystal packing of 2 features double columns of [Fe-ACHTUNGTRENNUNG(TPMA) ACHTUNGTRENNUNG(XBIM)]2+ cations (Figure 3 a). The assembly intothe double column is achieved by interdigitation of the
XBIM ligands via s–p interactions (2.91 and 3.05 �) be-tween the xylene and biimidazole fragments (Figure 3 b). Oneach side of the column, the cations are held together byclose intermolecular p–p (3.45 �) and s–p (2.67 and 2.77 �)contacts between the pyridyl rings of TPMA. The doublecolumns propagate in the b direction of the crystal latticeand exhibit intercolumnar s–p contacts (2.79 and 2.87 �)between the pyridyl rings of TPMA ligands (Figure 3 c). Im-portantly, the network of s–p and p–p contacts imparts
three-dimensional character tothe intermolecular interactionsin the structure of 2, in con-trast to the structure of 1, inwhich the interactions betweenthe complexes are restricted totwo dimensions. Such intermo-lecular interactions underlinecooperativity in spin transi-tions. Hence, one would antici-pate the SCO in solid samplesof 2 to be more abrupt than inthose of 1.
Magnetic and photomagneticproperties : The magnetic prop-erties were studied on poly-crystalline samples of 1, 2, and3. The complexes exhibitroom-temperature cT values of3.20, 3.63, and 3.18 emu Kmol�1, respectively, which areconsistent with the HS state ofthe FeII ion (S=2). The devia-tion from the spin-only cTvalue (3.00 emu K mol�1 for the
Figure 2. a) Crystal packing of 1 showing the arrangement of cations [Fe ACHTUNGTRENNUNG(TPMA)ACHTUNGTRENNUNG(BIM)]2+ in layers separated by ClO4� counter ions and H2O molecules.
(The H atoms and solvent molecules are omitted for the sake of clarity.) The layers are arranged in pairs, with the larger interlayer separation betweenthe pairs than within each pair. b) A top view of one cationic layer showing the p–p (dashed lines) and s–p (dotted lines) contacts between the centralcation and the four surrounding cations. The corresponding distances for the p–p and s–p intermolecular contacts are also shown. The former has beencalculated as the interplanar separation between the two interacting p-systems, whereas the latter has been taken as the distance from the H atom (notshown) to the plane of the aromatic ring.
Figure 3. a) Crystal packing of 2 showing the arrangement of mononuclear cations [Fe ACHTUNGTRENNUNG(TPMA) ACHTUNGTRENNUNG(XBIM)]2+ incolumns. (The H atoms are omitted for the sake of clarity.) b) A side view of one column emphasizing the p–p (dashed lines) and s–p (dotted lines) contacts between the TPMA ligands and the s–p contacts between theXBIM ligands. c) A fragment of the crystal packing identifying intermolecular s–p contacts between TPMA li-gands in neighboring columns. The distances corresponding to the observed p–p and s–p intermolecular con-tacts are provided.
www.chemeurj.org � 2012 Wiley-VCH Verlag GmbH & Co. KGaA, Weinheim Chem. Eur. J. 2012, 18, 15805 – 1581515808
M. W. Meisel, A. Hauser, C. Achim, M. Shatruk et al.
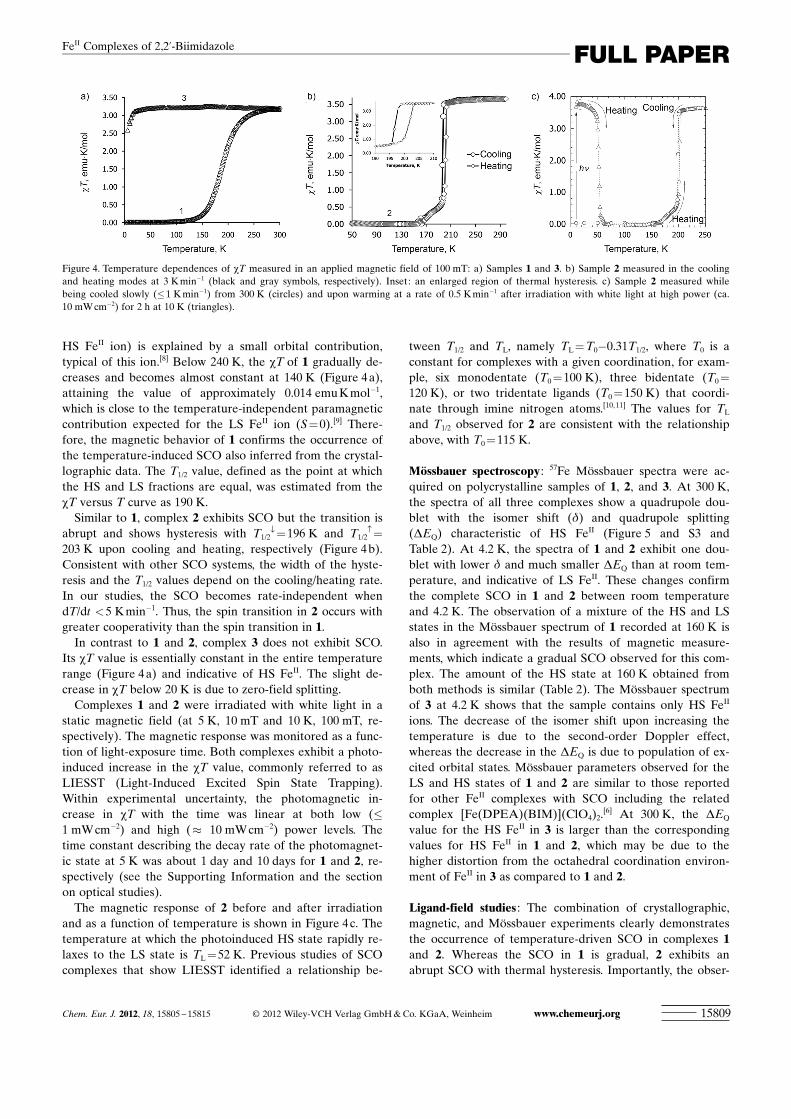
HS FeII ion) is explained by a small orbital contribution,typical of this ion.[8] Below 240 K, the cT of 1 gradually de-creases and becomes almost constant at 140 K (Figure 4 a),attaining the value of approximately 0.014 emu K mol�1,which is close to the temperature-independent paramagneticcontribution expected for the LS FeII ion (S=0).[9] There-fore, the magnetic behavior of 1 confirms the occurrence ofthe temperature-induced SCO also inferred from the crystal-lographic data. The T1/2 value, defined as the point at whichthe HS and LS fractions are equal, was estimated from thecT versus T curve as 190 K.
Similar to 1, complex 2 exhibits SCO but the transition isabrupt and shows hysteresis with T1/2
fl=196 K and T1/2›=
203 K upon cooling and heating, respectively (Figure 4 b).Consistent with other SCO systems, the width of the hyste-resis and the T1/2 values depend on the cooling/heating rate.In our studies, the SCO becomes rate-independent whendT/dt <5 K min�1. Thus, the spin transition in 2 occurs withgreater cooperativity than the spin transition in 1.
In contrast to 1 and 2, complex 3 does not exhibit SCO.Its cT value is essentially constant in the entire temperaturerange (Figure 4 a) and indicative of HS FeII. The slight de-crease in cT below 20 K is due to zero-field splitting.
Complexes 1 and 2 were irradiated with white light in astatic magnetic field (at 5 K, 10 mT and 10 K, 100 mT, re-spectively). The magnetic response was monitored as a func-tion of light-exposure time. Both complexes exhibit a photo-induced increase in the cT value, commonly referred to asLIESST (Light-Induced Excited Spin State Trapping).Within experimental uncertainty, the photomagnetic in-crease in cT with the time was linear at both low (�1 mW cm�2) and high (� 10 mW cm�2) power levels. Thetime constant describing the decay rate of the photomagnet-ic state at 5 K was about 1 day and 10 days for 1 and 2, re-spectively (see the Supporting Information and the sectionon optical studies).
The magnetic response of 2 before and after irradiationand as a function of temperature is shown in Figure 4 c. Thetemperature at which the photoinduced HS state rapidly re-laxes to the LS state is TL =52 K. Previous studies of SCOcomplexes that show LIESST identified a relationship be-
tween T1/2 and TL, namely TL = T0�0.31T1/2, where T0 is aconstant for complexes with a given coordination, for exam-ple, six monodentate (T0 =100 K), three bidentate (T0 =
120 K), or two tridentate ligands (T0 = 150 K) that coordi-nate through imine nitrogen atoms.[10,11] The values for TL
and T1/2 observed for 2 are consistent with the relationshipabove, with T0 = 115 K.
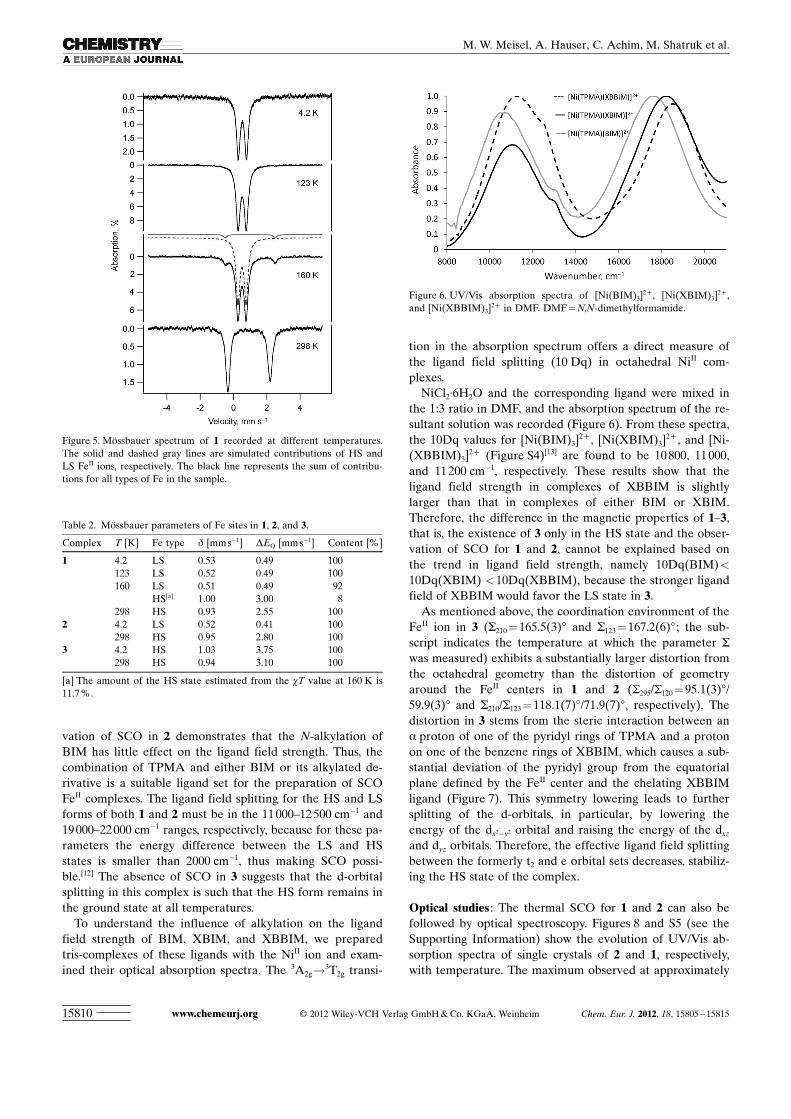
Mçssbauer spectroscopy: 57Fe Mçssbauer spectra were ac-quired on polycrystalline samples of 1, 2, and 3. At 300 K,the spectra of all three complexes show a quadrupole dou-blet with the isomer shift (d) and quadrupole splitting(DEQ) characteristic of HS FeII (Figure 5 and S3 andTable 2). At 4.2 K, the spectra of 1 and 2 exhibit one dou-blet with lower d and much smaller DEQ than at room tem-perature, and indicative of LS FeII. These changes confirmthe complete SCO in 1 and 2 between room temperatureand 4.2 K. The observation of a mixture of the HS and LSstates in the Mçssbauer spectrum of 1 recorded at 160 K isalso in agreement with the results of magnetic measure-ments, which indicate a gradual SCO observed for this com-plex. The amount of the HS state at 160 K obtained fromboth methods is similar (Table 2). The Mçssbauer spectrumof 3 at 4.2 K shows that the sample contains only HS FeII
ions. The decrease of the isomer shift upon increasing thetemperature is due to the second-order Doppler effect,whereas the decrease in the DEQ is due to population of ex-cited orbital states. Mçssbauer parameters observed for theLS and HS states of 1 and 2 are similar to those reportedfor other FeII complexes with SCO including the relatedcomplex [Fe ACHTUNGTRENNUNG(DPEA) ACHTUNGTRENNUNG(BIM)] ACHTUNGTRENNUNG(ClO4)2.
[6] At 300 K, the DEQ
value for the HS FeII in 3 is larger than the correspondingvalues for HS FeII in 1 and 2, which may be due to thehigher distortion from the octahedral coordination environ-ment of FeII in 3 as compared to 1 and 2.
Ligand-field studies : The combination of crystallographic,magnetic, and Mçssbauer experiments clearly demonstratesthe occurrence of temperature-driven SCO in complexes 1and 2. Whereas the SCO in 1 is gradual, 2 exhibits anabrupt SCO with thermal hysteresis. Importantly, the obser-
Figure 4. Temperature dependences of cT measured in an applied magnetic field of 100 mT: a) Samples 1 and 3. b) Sample 2 measured in the coolingand heating modes at 3 K min�1 (black and gray symbols, respectively). Inset: an enlarged region of thermal hysteresis. c) Sample 2 measured whilebeing cooled slowly (�1 K min�1) from 300 K (circles) and upon warming at a rate of 0.5 Kmin�1 after irradiation with white light at high power (ca.10 mW cm�2) for 2 h at 10 K (triangles).
Chem. Eur. J. 2012, 18, 15805 – 15815 � 2012 Wiley-VCH Verlag GmbH & Co. KGaA, Weinheim www.chemeurj.org 15809
FULL PAPERFeII Complexes of 2,2’-Biimidazole
vation of SCO in 2 demonstrates that the N-alkylation ofBIM has little effect on the ligand field strength. Thus, thecombination of TPMA and either BIM or its alkylated de-rivative is a suitable ligand set for the preparation of SCOFeII complexes. The ligand field splitting for the HS and LSforms of both 1 and 2 must be in the 11 000–12 500 cm�1 and19 000–22 000 cm�1 ranges, respectively, because for these pa-rameters the energy difference between the LS and HSstates is smaller than 2000 cm�1, thus making SCO possi-ble.[12] The absence of SCO in 3 suggests that the d-orbitalsplitting in this complex is such that the HS form remains inthe ground state at all temperatures.
To understand the influence of alkylation on the ligandfield strength of BIM, XBIM, and XBBIM, we preparedtris-complexes of these ligands with the NiII ion and exam-ined their optical absorption spectra. The 3A2g!3T2g transi-
tion in the absorption spectrum offers a direct measure ofthe ligand field splitting (10 Dq) in octahedral NiII com-plexes.
NiCl2·6H2O and the corresponding ligand were mixed inthe 1:3 ratio in DMF, and the absorption spectrum of the re-sultant solution was recorded (Figure 6). From these spectra,the 10Dq values for [Ni ACHTUNGTRENNUNG(BIM)3]
2+ , [Ni ACHTUNGTRENNUNG(XBIM)3]2+ , and [Ni-ACHTUNGTRENNUNG(XBBIM)3]
2+ (Figure S4)[13] are found to be 10 800, 11 000,and 11 200 cm�1, respectively. These results show that theligand field strength in complexes of XBBIM is slightlylarger than that in complexes of either BIM or XBIM.Therefore, the difference in the magnetic properties of 1–3,that is, the existence of 3 only in the HS state and the obser-vation of SCO for 1 and 2, cannot be explained based onthe trend in ligand field strength, namely 10Dq ACHTUNGTRENNUNG(BIM)<10Dq ACHTUNGTRENNUNG(XBIM) <10Dq ACHTUNGTRENNUNG(XBBIM), because the stronger ligandfield of XBBIM would favor the LS state in 3.
As mentioned above, the coordination environment of theFeII ion in 3 (S210 = 165.5(3)8 and S123 =167.2(6)8 ; the sub-script indicates the temperature at which the parameter S
was measured) exhibits a substantially larger distortion fromthe octahedral geometry than the distortion of geometryaround the FeII centers in 1 and 2 (S295/S120 = 95.1(3)8/59.9(3)8 and S210/S123 =118.1(7)8/71.9(7)8, respectively). Thedistortion in 3 stems from the steric interaction between ana proton of one of the pyridyl rings of TPMA and a protonon one of the benzene rings of XBBIM, which causes a sub-stantial deviation of the pyridyl group from the equatorialplane defined by the FeII center and the chelating XBBIMligand (Figure 7). This symmetry lowering leads to furthersplitting of the d-orbitals, in particular, by lowering theenergy of the dx2�y2 orbital and raising the energy of the dxz
and dyz orbitals. Therefore, the effective ligand field splittingbetween the formerly t2 and e orbital sets decreases, stabiliz-ing the HS state of the complex.
Optical studies : The thermal SCO for 1 and 2 can also befollowed by optical spectroscopy. Figures 8 and S5 (see theSupporting Information) show the evolution of UV/Vis ab-sorption spectra of single crystals of 2 and 1, respectively,with temperature. The maximum observed at approximately
Table 2. Mçssbauer parameters of Fe sites in 1, 2, and 3.
Complex T [K] Fe type d [mm s�1] DEQ [mm s�1] Content [%]
1 4.2 LS 0.53 0.49 100123 LS 0.52 0.49 100160 LS 0.51 0.49 92
HS[a] 1.00 3.00 8298 HS 0.93 2.55 100
2 4.2 LS 0.52 0.41 100298 HS 0.95 2.80 100
3 4.2 HS 1.03 3.75 100298 HS 0.94 3.10 100
[a] The amount of the HS state estimated from the cT value at 160 K is11.7 %.
Figure 6. UV/Vis absorption spectra of [Ni ACHTUNGTRENNUNG(BIM)3]2+ , [Ni ACHTUNGTRENNUNG(XBIM)3]
2+ ,and [Ni ACHTUNGTRENNUNG(XBBIM)3]
2+ in DMF. DMF= N,N-dimethylformamide.
Figure 5. Mçssbauer spectrum of 1 recorded at different temperatures.The solid and dashed gray lines are simulated contributions of HS andLS FeII ions, respectively. The black line represents the sum of contribu-tions for all types of Fe in the sample.
www.chemeurj.org � 2012 Wiley-VCH Verlag GmbH & Co. KGaA, Weinheim Chem. Eur. J. 2012, 18, 15805 – 1581515810
M. W. Meisel, A. Hauser, C. Achim, M. Shatruk et al.
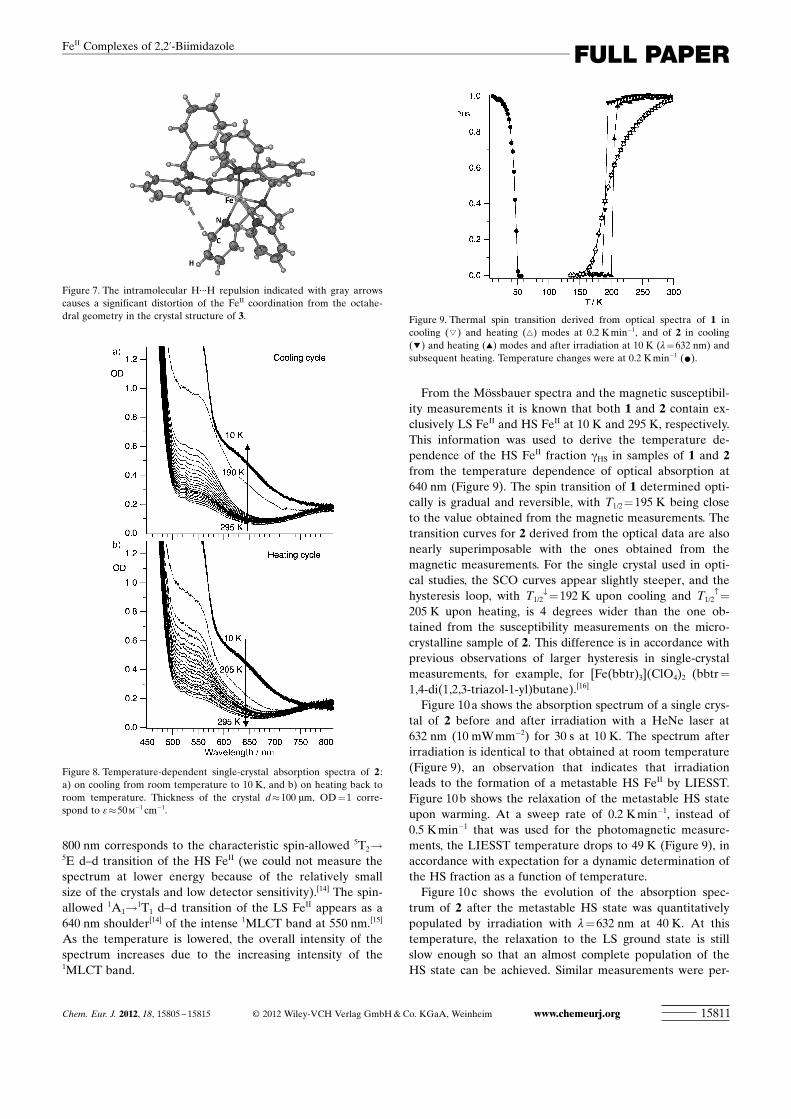
800 nm corresponds to the characteristic spin-allowed 5T2!5E d–d transition of the HS FeII (we could not measure thespectrum at lower energy because of the relatively smallsize of the crystals and low detector sensitivity).[14] The spin-allowed 1A1!1T1 d–d transition of the LS FeII appears as a640 nm shoulder[14] of the intense 1
MLCT band at 550 nm.[15]
As the temperature is lowered, the overall intensity of thespectrum increases due to the increasing intensity of the1MLCT band.
From the Mçssbauer spectra and the magnetic susceptibil-ity measurements it is known that both 1 and 2 contain ex-clusively LS FeII and HS FeII at 10 K and 295 K, respectively.This information was used to derive the temperature de-pendence of the HS FeII fraction gHS in samples of 1 and 2from the temperature dependence of optical absorption at640 nm (Figure 9). The spin transition of 1 determined opti-cally is gradual and reversible, with T1/2 =195 K being closeto the value obtained from the magnetic measurements. Thetransition curves for 2 derived from the optical data are alsonearly superimposable with the ones obtained from themagnetic measurements. For the single crystal used in opti-cal studies, the SCO curves appear slightly steeper, and thehysteresis loop, with T1/2
fl=192 K upon cooling and T1/2›=
205 K upon heating, is 4 degrees wider than the one ob-tained from the susceptibility measurements on the micro-crystalline sample of 2. This difference is in accordance withprevious observations of larger hysteresis in single-crystalmeasurements, for example, for [FeACHTUNGTRENNUNG(bbtr)3] ACHTUNGTRENNUNG(ClO4)2 (bbtr=
1,4-di(1,2,3-triazol-1-yl)butane).[16]
Figure 10 a shows the absorption spectrum of a single crys-tal of 2 before and after irradiation with a HeNe laser at632 nm (10 mW mm�2) for 30 s at 10 K. The spectrum afterirradiation is identical to that obtained at room temperature(Figure 9), an observation that indicates that irradiationleads to the formation of a metastable HS FeII by LIESST.Figure 10 b shows the relaxation of the metastable HS stateupon warming. At a sweep rate of 0.2 K min�1, instead of0.5 K min�1 that was used for the photomagnetic measure-ments, the LIESST temperature drops to 49 K (Figure 9), inaccordance with expectation for a dynamic determination ofthe HS fraction as a function of temperature.
Figure 10 c shows the evolution of the absorption spec-trum of 2 after the metastable HS state was quantitativelypopulated by irradiation with l= 632 nm at 40 K. At thistemperature, the relaxation to the LS ground state is stillslow enough so that an almost complete population of theHS state can be achieved. Similar measurements were per-
Figure 7. The intramolecular H···H repulsion indicated with gray arrowscauses a significant distortion of the FeII coordination from the octahe-dral geometry in the crystal structure of 3.
Figure 8. Temperature-dependent single-crystal absorption spectra of 2 :a) on cooling from room temperature to 10 K, and b) on heating back toroom temperature. Thickness of the crystal d�100 mm, OD =1 corre-spond to e�50m
�1 cm�1.
Figure 9. Thermal spin transition derived from optical spectra of 1 incooling (!) and heating (~) modes at 0.2 K min�1, and of 2 in cooling(!) and heating (~) modes and after irradiation at 10 K (l =632 nm) andsubsequent heating. Temperature changes were at 0.2 K min�1 (*).
Chem. Eur. J. 2012, 18, 15805 – 15815 � 2012 Wiley-VCH Verlag GmbH & Co. KGaA, Weinheim www.chemeurj.org 15811
FULL PAPERFeII Complexes of 2,2’-Biimidazole
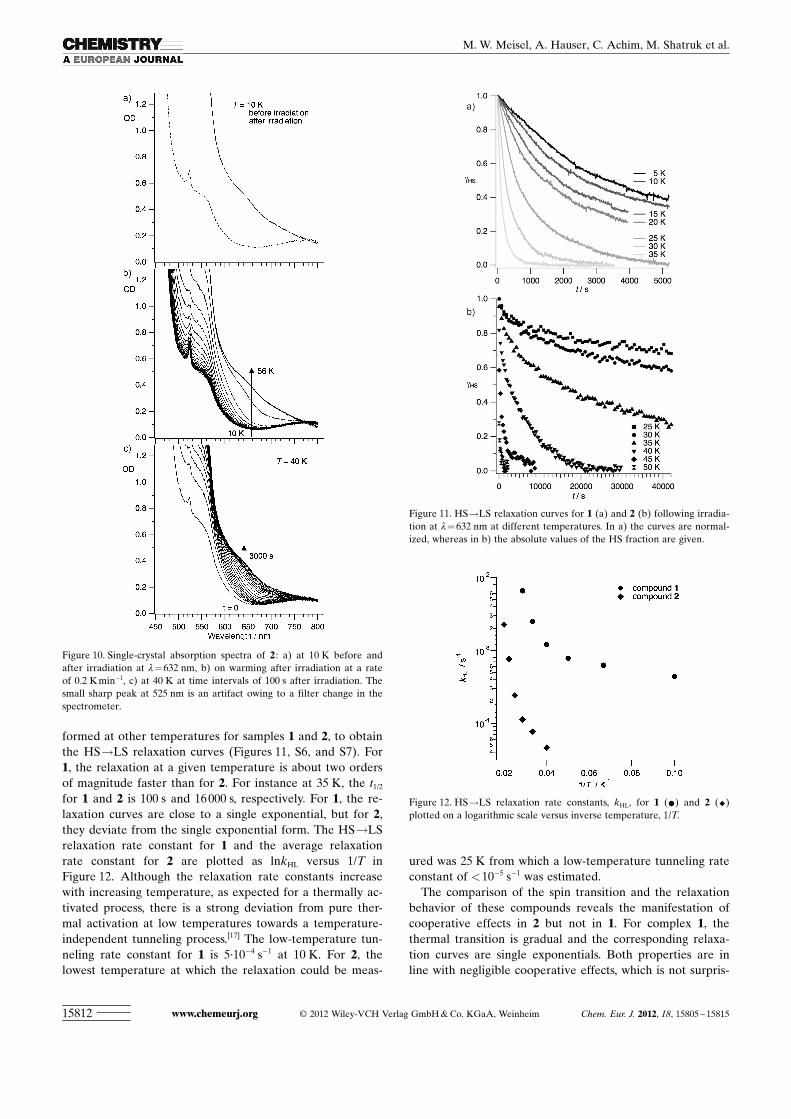
formed at other temperatures for samples 1 and 2, to obtainthe HS!LS relaxation curves (Figures 11, S6, and S7). For1, the relaxation at a given temperature is about two ordersof magnitude faster than for 2. For instance at 35 K, the t1/2
for 1 and 2 is 100 s and 16 000 s, respectively. For 1, the re-laxation curves are close to a single exponential, but for 2,they deviate from the single exponential form. The HS!LSrelaxation rate constant for 1 and the average relaxationrate constant for 2 are plotted as lnkHL versus 1/T inFigure 12. Although the relaxation rate constants increasewith increasing temperature, as expected for a thermally ac-tivated process, there is a strong deviation from pure ther-mal activation at low temperatures towards a temperature-independent tunneling process.[17] The low-temperature tun-neling rate constant for 1 is 5·10�4 s�1 at 10 K. For 2, thelowest temperature at which the relaxation could be meas-
ured was 25 K from which a low-temperature tunneling rateconstant of <10�5 s�1 was estimated.
The comparison of the spin transition and the relaxationbehavior of these compounds reveals the manifestation ofcooperative effects in 2 but not in 1. For complex 1, thethermal transition is gradual and the corresponding relaxa-tion curves are single exponentials. Both properties are inline with negligible cooperative effects, which is not surpris-
Figure 10. Single-crystal absorption spectra of 2 : a) at 10 K before andafter irradiation at l=632 nm, b) on warming after irradiation at a rateof 0.2 K min�1, c) at 40 K at time intervals of 100 s after irradiation. Thesmall sharp peak at 525 nm is an artifact owing to a filter change in thespectrometer.
Figure 11. HS!LS relaxation curves for 1 (a) and 2 (b) following irradia-tion at l= 632 nm at different temperatures. In a) the curves are normal-ized, whereas in b) the absolute values of the HS fraction are given.
Figure 12. HS!LS relaxation rate constants, kHL, for 1 (*) and 2 (^)plotted on a logarithmic scale versus inverse temperature, 1/T.
www.chemeurj.org � 2012 Wiley-VCH Verlag GmbH & Co. KGaA, Weinheim Chem. Eur. J. 2012, 18, 15805 – 1581515812
M. W. Meisel, A. Hauser, C. Achim, M. Shatruk et al.

ing given the lack of strong p–p or hydrogen-bonding inter-actions between the molecules of 1 in the crystals. For 2, thethermal transition is abrupt and the relaxation at low tem-perature is slow. These observations can be rationalizedbased on cooperativity supported by the existence of a hier-archy of interactions between complexes, which include
1) strong p–p and s–p interactions between the pyridylrings of TMPA and s–p interactions between the xyleneand biimidazole moieties of XBIM along the double col-umns;
2) weaker s–p interactions between the pyridyl rings ofTPMA ligands of complexes situated in adjacent doublecolumns; and
3) electrostatic interactions between the [FeACHTUNGTRENNUNG(TPMA)-ACHTUNGTRENNUNG(XBIM)]2+ ions and the perchlorate anions.
The strong anisotropic interactions within crystals of 2result in a cooperative first-order phase transition propagat-ing through the chains, with the weaker interchain interac-tions operating concertedly along the chains. At low temper-ature, the relaxation occurs stochastically within the chains,whereas the intrachain interactions act like a friction for themacroscopic transformation of the chains. The resulting re-laxation curves have a faster initial decay followed by aslower relaxation behavior at longer times.
The LIESST structure : We have obtained a crystal structureof 2 at approximately 50 K (the lowest temperature attaina-ble in our experiment), in the dark state and under continu-ous irradiation with l=632 nm (10 mW mm�2). Despite thefast HS!LS relaxation (t1/2 � 500 s) observed at this tem-perature, the continuous irradiation at approximately10 mW m�1 m2 is sufficient to maintain a steady-state HSfraction of more than 90 % as determined by optical absorp-tion spectroscopy. Both before and during irradiation, thespace group (P21/c) remained the same as observed in theconventional X-ray diffraction experiments (Table 4). Theaverage Fe�N bond lengths (Table 3) observed before andduring irradiation (1.98(1) and 2.17(3) �, respectively) com-pare well with the values obtained for the structure of 2 inthe LS and HS forms at 123 and 210 K (2.002(4) and2.184(4) �, respectively). The same holds true for the com-parison of the parameter S which is equal to 75.38 beforeand 114.58 during irradiation and to 71.98 at 123 K and
118.18 at 210 K in the experiments without irradiation. Allthese observations indicate an almost quantitative transfor-mation of the LS to HS FeII under continuous irradiation atapproximately 50 K, that is, near the LIESST temperatureTL.
Conclusion
This study identified the combination of TPMA and BIM asan effective ligand platform for achieving temperature-driven SCO in the mononuclear complex [FeACHTUNGTRENNUNG(TPMA)-ACHTUNGTRENNUNG(BIM)] ACHTUNGTRENNUNG(ClO4)2·0.5 H2O (1). Importantly, the SCO behavioris retained upon N-alkylation of BIM, as shown by the mag-netic and structural properties of [FeACHTUNGTRENNUNG(TPMA) ACHTUNGTRENNUNG(XBIM)]-ACHTUNGTRENNUNG(ClO4)2 (2). This compound exhibits an abrupt spin transi-tion with thermal hysteresis in both microcrystalline(powder) and single-crystal forms. Nevertheless, not all BIMderivatives are appropriate for the preparation of SCO com-plexes. For example, the introduction of a bulky substituentin XBBIM causes intramolecular steric repulsion betweenthe ligands, distorts the coordination environment of the FeII
ion, and stabilizes the HS state of the complex. Indeed, thecomplex [Fe ACHTUNGTRENNUNG(TPMA) ACHTUNGTRENNUNG(XBBIM)] ACHTUNGTRENNUNG(ClO4)2·0.75 CH3OH (3)exists in the HS state at all temperatures. We are currentlydesigning new SCO FeII complexes with ligands derivedfrom BIM, and the synthesis and properties of these materi-als will be reported in due course.
Experimental Section
Syntheses : All reactions were performed in an inert atmosphere usingstandard Schlenk techniques, unless noted otherwise. All reagents andanhydrous solvents were purchased from Aldrich, except for glyoxal(Alfa Aesar), and used as received. Elemental analyses were carried outby Atlantic Microlab, Inc. Ligands TPMA,[18] BIM,[19] and XBBIM[20]
were synthesized according to the published procedures.
1,1’-(a,a’-o-Xylyl)-2,2’-biimidazole (XBIM) was synthesized by a modifi-cation of the procedure described by Thummel et al.[21] To a solution con-taining a,a’-dibromo-o-xylene (0.528 g, 2.00 mmol) in acetonitrile(30 mL) in a 100 mL round-bottom flask was added with stirring of BIM(0.32 g, 2.4 mmol) followed by a 2.5m aqueous solution of NaOH (5 mL).The temperature of the mixture was increased to reflux. After refluxingfor ca. 10 min, a yellow-brown solution formed. The reflux was continuedfor 24 h, after which time the reaction mixture was allowed to cool downto room temperature. After adding deionized water (20 mL), the mixturewas extracted with dichloromethane (3 � 20 mL). The organic fractionswere combined, dried over anhydrous MgSO4, and evaporated to dryness.The obtained product was washed with diethyl ether, affording XBIM aswhite solid (0.385 g, 68 %). 1H NMR ([D6]DMSO): d=7.47 (s, 2H), 7.39(m, 4 H), 7.11 (s, 2H), 4.98 (s, 4H).
Caution : The complexes between metal ions and organic ligands withperchlorate counter ion are potentially explosive. The compounds shouldbe prepared in small amounts and handled with great care!
[Fe ACHTUNGTRENNUNG(TPMA) ACHTUNGTRENNUNG(BIM)] ACHTUNGTRENNUNG(ClO4)2·0.5 H2O (1). A solution of Fe ACHTUNGTRENNUNG(ClO4)2·6H2O(72.6 mg, 0.200 mmol) in methanol (2 mL) was added to a suspension of
Table 3. Selected structural data for complex 2 at ca. 50 K before andduring continuous irradiation at l=632 nm, 10 mW m�1 m2.
Bond Bond length [�]Before irradiation Under irradiation
Fe1�N1 1.96(2) 2.17(4)Fe1�N2 1.976(9) 2.19(2)Fe1�N3 1.98(1) 2.14(2)Fe1�N4 1.96(1) 2.18(2)Fe1�N5 1.95(2) 2.11(4)Fe1�N6 2.025(8) 2.21(2)d ACHTUNGTRENNUNG(Fe�N)average 1.98(1) 2.17(3)S ACHTUNGTRENNUNG(N-Fe-N) [8] 75.3 114.5
Chem. Eur. J. 2012, 18, 15805 – 15815 � 2012 Wiley-VCH Verlag GmbH & Co. KGaA, Weinheim www.chemeurj.org 15813
FULL PAPERFeII Complexes of 2,2’-Biimidazole
BIM (26.8 mg, 0.200 mmol) in ethanol (8 mL) with stirring. The yellowishsuspension obtained was stirred for ca. 30 s, followed by addition of a sol-ution of TPMA (58 mg, 0.20 mmol) in methanol (2 mL). The resultingmixture was stirred vigorously for a few seconds and then quickly fil-tered. The filtrate was left undisturbed under inert atmosphere overnight.Block-shaped yellow-brown crystals that formed were recovered by filtra-tion and washed successively with ethanol and diethyl ether. Yield=
71.6 mg (52 %). Elemental analysis (%) calcd for FeCl2O8.5N8C24H25 (1):C 41.85, H 3.63, N 16.28; found: C 41.68, H 3.62, N 16.27; HR ESI-MS:m/z : calcd for [Fe ACHTUNGTRENNUNG(TPMA) ACHTUNGTRENNUNG(BIM)]2+ : 240.07312; found: 240.07586.
[Fe ACHTUNGTRENNUNG(TPMA) ACHTUNGTRENNUNG(XBIM)] ACHTUNGTRENNUNG(ClO4)2 (2): This complex was prepared in a mannersimilar to that described for 1, starting with Fe ACHTUNGTRENNUNG(ClO4)2·6H2O (36.3 mg,0.100 mmol), XBIM (23.6 mg, 0.100 mmol), and TPMA (29 mg,0.10 mmol), and using a methanol/ethanol (10 mL, 9:1 v/v) solvent mix-ture. Diethyl ether was layered on the top of a yellow solution obtainedto afford yellowish crystals. The product was recovered by filtration andwashed successively with ethanol and diethyl ether. Yield=38.7 mg(50 %). Elemental analysis (%) calcd for FeCl2O8N8C32H30 (2): C 49.19,H 3.97, N 14.34; found: C 49.44, H 3.90, N 14.42; HR ESI-MS: m/z :calcd for [Fe ACHTUNGTRENNUNG(TPMA)ACHTUNGTRENNUNG(XBIM)]2+ : 291.09660; found: 291.09934.
[Fe ACHTUNGTRENNUNG(TPMA) ACHTUNGTRENNUNG(XBBIM)] ACHTUNGTRENNUNG(ClO4)2·1.5 CH3OH·H2O (3·0.75 CH3OH·H2O):This complex was prepared in a manner similar to that described for 1,starting with Fe ACHTUNGTRENNUNG(ClO4)2.6H2O (72.6 mg, 0.200 mmol), XBBIM (67.2 mg,0.200 mmol), and TPMA (58 mg, 0.20 mmol) and using the same volumesof solvent. Diethyl ether was layered on the top of a yellow solution ob-tained. Bright red crystals that appeared after two days were filtered andwashed successively with ethanol and diethyl ether. Yield=104 mg(55 %). Elemental analysis calcd (%) for FeCl2O10.5N8C41.5H42
(3·0.75CH3OH·H2O): C 52.60, H 4.47, N, 11.83; found: C 52.62, H 4.28, N11.81; HR-ESI-MS: m/z : calcd for [Fe ACHTUNGTRENNUNG(TPMA)ACHTUNGTRENNUNG(XBBIM)]2+ : 341.11226;found: 341.11520.
Examination of ligand field strength : The ligand field strength of BIM,XBIM, and XBBIM was examined by mixing a solution of NiCl2·6H2O
in DMF with a suspension of corresponding ligand in DMF in a 1:3 ratioand recording an absorption spectrum of the obtained clear pale-orangesolution.
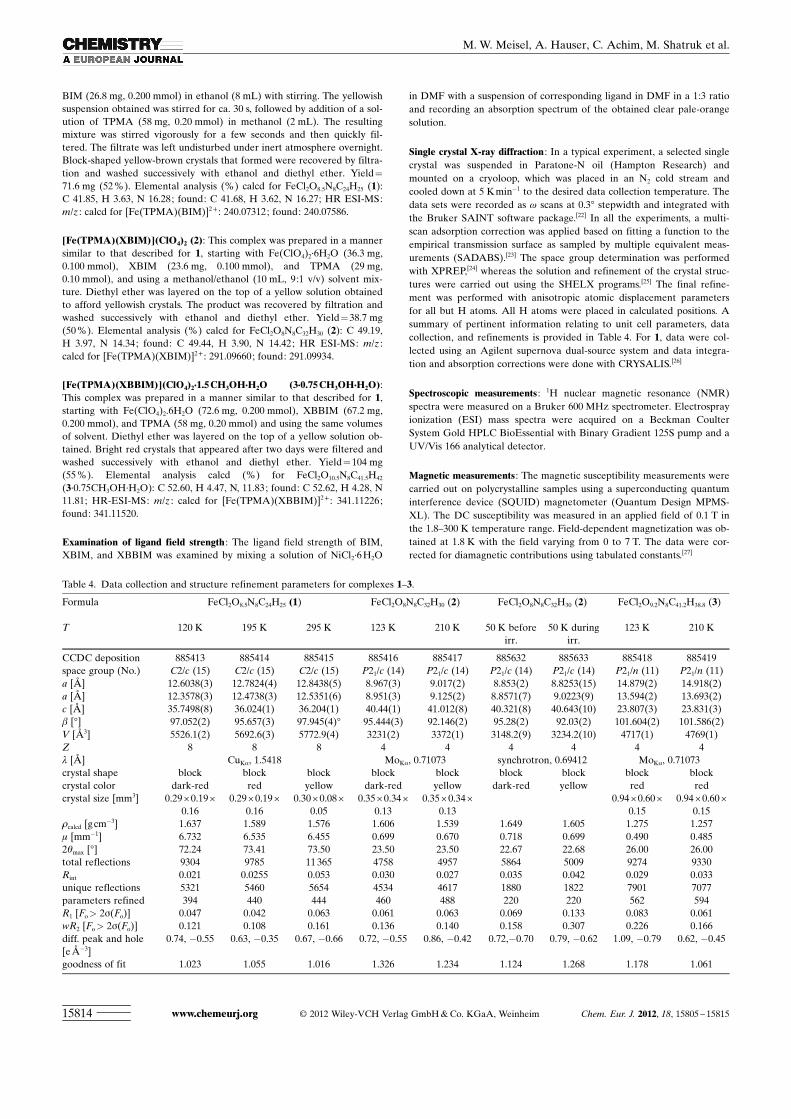
Single crystal X-ray diffraction : In a typical experiment, a selected singlecrystal was suspended in Paratone-N oil (Hampton Research) andmounted on a cryoloop, which was placed in an N2 cold stream andcooled down at 5 K min�1 to the desired data collection temperature. Thedata sets were recorded as w scans at 0.38 stepwidth and integrated withthe Bruker SAINT software package.[22] In all the experiments, a multi-scan adsorption correction was applied based on fitting a function to theempirical transmission surface as sampled by multiple equivalent meas-urements (SADABS).[23] The space group determination was performedwith XPREP,[24] whereas the solution and refinement of the crystal struc-tures were carried out using the SHELX programs.[25] The final refine-ment was performed with anisotropic atomic displacement parametersfor all but H atoms. All H atoms were placed in calculated positions. Asummary of pertinent information relating to unit cell parameters, datacollection, and refinements is provided in Table 4. For 1, data were col-lected using an Agilent supernova dual-source system and data integra-tion and absorption corrections were done with CRYSALIS.[26]
Spectroscopic measurements : 1H nuclear magnetic resonance (NMR)spectra were measured on a Bruker 600 MHz spectrometer. Electrosprayionization (ESI) mass spectra were acquired on a Beckman CoulterSystem Gold HPLC BioEssential with Binary Gradient 125S pump and aUV/Vis 166 analytical detector.
Magnetic measurements : The magnetic susceptibility measurements werecarried out on polycrystalline samples using a superconducting quantuminterference device (SQUID) magnetometer (Quantum Design MPMS-XL). The DC susceptibility was measured in an applied field of 0.1 T inthe 1.8–300 K temperature range. Field-dependent magnetization was ob-tained at 1.8 K with the field varying from 0 to 7 T. The data were cor-rected for diamagnetic contributions using tabulated constants.[27]
Table 4. Data collection and structure refinement parameters for complexes 1–3.
Formula FeCl2O8.5N8C24H25 (1) FeCl2O8N8C32H30 (2) FeCl2O8N8C32H30 (2) FeCl2O9.2N8C41.2H38.8 (3)
T 120 K 195 K 295 K 123 K 210 K 50 K beforeirr.
50 K duringirr.
123 K 210 K
CCDC deposition 885413 885414 885415 885416 885417 885632 885633 885418 885419space group (No.) C2/c (15) C2/c (15) C2/c (15) P21/c (14) P21/c (14) P21/c (14) P21/c (14) P21/n (11) P21/n (11)a [�] 12.6038(3) 12.7824(4) 12.8438(5) 8.967(3) 9.017(2) 8.853(2) 8.8253(15) 14.879(2) 14.918(2)a [�] 12.3578(3) 12.4738(3) 12.5351(6) 8.951(3) 9.125(2) 8.8571(7) 9.0223(9) 13.594(2) 13.693(2)c [�] 35.7498(8) 36.024(1) 36.204(1) 40.44(1) 41.012(8) 40.321(8) 40.643(10) 23.807(3) 23.831(3)b [8] 97.052(2) 95.657(3) 97.945(4)8 95.444(3) 92.146(2) 95.28(2) 92.03(2) 101.604(2) 101.586(2)V [�3] 5526.1(2) 5692.6(3) 5772.9(4) 3231(2) 3372(1) 3148.2(9) 3234.2(10) 4717(1) 4769(1)Z 8 8 8 4 4 4 4 4 4l [�] CuKa, 1.5418 MoKa, 0.71073 synchrotron, 0.69412 MoKa, 0.71073crystal shape block block block block block block block block blockcrystal color dark-red red yellow dark-red yellow dark-red yellow red redcrystal size [mm3] 0.29 � 0.19 �
0.160.29 � 0.19 �
0.160.30 � 0.08 �
0.050.35 � 0.34 �
0.130.35 � 0.34 �
0.130.94 � 0.60 �
0.150.94 � 0.60 �
0.151calcd [gcm�3] 1.637 1.589 1.576 1.606 1.539 1.649 1.605 1.275 1.257m [mm�1] 6.732 6.535 6.455 0.699 0.670 0.718 0.699 0.490 0.4852qmax [8] 72.24 73.41 73.50 23.50 23.50 22.67 22.68 26.00 26.00total reflections 9304 9785 11 365 4758 4957 5864 5009 9274 9330Rint 0.021 0.0255 0.053 0.030 0.027 0.035 0.042 0.029 0.033unique reflections 5321 5460 5654 4534 4617 1880 1822 7901 7077parameters refined 394 440 444 460 488 220 220 562 594R1 [Fo> 2s(Fo)] 0.047 0.042 0.063 0.061 0.063 0.069 0.133 0.083 0.061wR2 [Fo> 2s(Fo)] 0.121 0.108 0.161 0.136 0.140 0.158 0.307 0.226 0.166diff. peak and hole[e��3]
0.74, �0.55 0.63, �0.35 0.67, �0.66 0.72, �0.55 0.86, �0.42 0.72,�0.70 0.79, �0.62 1.09, �0.79 0.62, �0.45
goodness of fit 1.023 1.055 1.016 1.326 1.234 1.124 1.268 1.178 1.061
www.chemeurj.org � 2012 Wiley-VCH Verlag GmbH & Co. KGaA, Weinheim Chem. Eur. J. 2012, 18, 15805 – 1581515814
M. W. Meisel, A. Hauser, C. Achim, M. Shatruk et al.
Photomagnetic measurements : Irradiation was performed at 5 K by cou-pling a sample, centered in the pick-up coils of a SQUID magnetometer,to a room temperature white-light source (Halogen bulb) in two differentways. At low power (�1 mW cm�2), the microcrystals were spread ontotransparent adhesive tape and immobilized near the end of a bundle ofoptical fibers.[28] For high power (ca. 10 mW cm�2), a commercial sampleholder (Quantum Design Fiber Optic Sample Holder) was used, whereina quartz bucket, containing <1 mg of microcrystals, was held against theend of a quartz rod. The raw data have been corrected for a paramagnet-ic background arising from the sample holder. Following common practi-ces,[11] the resulting magnetic signal has been scaled to match the hightemperature values obtained with a more massive sample measured witha low background probe.
Mçssbauer spectroscopy : The 57Fe Mçssbauer spectra were collected onconstant acceleration instruments over the temperature range of 1.5–300 K, in applied external fields up to 8 T. Samples for experiments inlow applied magnetic fields (<50 mT) were prepared by placing polycrys-talline solids in Mçssbauer cups covered with Teflon lids. For high-fieldmeasurements, the solid materials were ground to finely divided powdersand suspended in mineral oil. Spectral simulations were generated usingWMOSS (WEB Research, Edina, MN), and isomer shifts are reportedrelative to Fe metal foil at room temperature.
Optical and LIESST measurements : For optical measurements, smallsingle crystals (0.20 � 0.20 � 0.10 mm3) were mounted on a copper plate soas to completely cover a small aperture. The copper plate was insertedinto a cryostat (Janis-Sumitomo) capable of reaching 10 K. Full absorp-tion spectra were recorded in transmission mode on a double beam spec-trometer (Cary 5000) between 400 and 800 nm. For the small samples itwas not possible to record spectra further into the infrared region be-cause of insufficient sensitivity of the detector. Irradiation was performedwith a HeNe laser at 632 nm with a maximum rating of 30 mW. Powerdensity on the sample was adjusted to 10 mW mm�2 with grey filters. Thewavelength chosen is optimal for penetration depth and efficiency of thelight-induced transformation. For slow kinetics, full absorption spectrawere recorded with the above spectrometer at given time intervals afterswitching off the laser. For faster kinetics a home-built single-beam setupwith a CCD camera allowed for faster recording of spectra with a delayless than a second between switching off the laser and acquiring the firstspectrum.
Crystallographic experiment at the Swiss–Norwegian Beam Line : Syn-chrotron diffraction data were collected at the Swiss–Norwegian BeamLine (SBNL) BM01 A. The selected crystal was mounted into a modifiedversion of a Cryovac KONTI cryostat system. The base sample tempera-ture achievable with the cryostat was around 50 K. Although the HS!LS relaxation is already quite fast (t1/2�500 s) at this temperature, contin-uous irradiation at l= 632 nm with an intensity of ca. 10 mW mm�2 wassufficient to maintain a steady-state HS fraction of more than 90%. Thedata were collected using The Oxford Diffraction KM6 Kappa diffrac-tometer before and during continuous irradiation with a 30 mW He–Nelaser at 632. The laser beam was guided to the crystal via an optical fiber,and the power density on the sample was adjusted to 10 mW m�1 m2 usinga grey filter. The temperature at the crystal was estimated to be ca. 50 K.Data reduction and absorption correction were done using the CRYSA-LIS software package and the refinement was carried out in the using theSHELX suite of programs.[25] Owing to the low completeness of the data-sets, all atoms but Fe and Cl were refined isotropically.
Acknowledgements
This work was supported by the U.S. National Science Foundationthrough grants CHE-0911109 (M.S.) and DMR-0654118 (NHMFL) andby the Swiss National Science Foundation (Grant No. 200020_137567).We thank P. Pattison and the Swiss–Norwegian Beam Line for access todetermine the low-temperature LIESST structure. H.V.P. acknowledges
the support of the Vietnam Ministry of Education and Training throughthe VIED Scholarship.
[1] L. Cambi, L. Szegç, Ber. Deutsch. Chem. Gesell. B 1933, 66B, 656.[2] P. G�tlich, H. A. Goodwin, Top. Curr. Chem. 2004, 233, 1.[3] O. Kahn, C. J. Martinez, Science 1998, 279, 44.[4] a) K. S. Murray, Aus. J. Chem. 2009, 62, 1081; b) S. Brooker, J. A.
Kitchen, Dalton Trans. 2009, 7331.[5] a) G. F�lix, K. Abdul-Kader, T. Mahfoud, I. A. Gural�skiy, W. Nico-
lazzi, L. Salmon, G. Molnr, A. Bousseksou, J. Am. Chem. Soc.2011, 133, 15342; b) T. Mahfoud, G. Molnr, S. Cobo, L. Salmon, C.Thibault, C. Vieu, P. Demont, A. Bousseksou, Appl. Phys. Lett.2011, 99, 053307; c) H. Naggert, A. Bannwarth, S. Chemnitz, T. vonHofe, E. Quandt, F. Tuczek, Dalton Trans. 2011, 40, 6364; d) J. A.Kitchen, N. G. White, C. Gandolfi, M. Albrecht, G. N. L. Jameson,J. L. Tallon, S. Brooker, Chem. Commun. 2010, 46, 6464.
[6] a) G. S. Matouzenko, J. F. L�tard, S. Lecocq, A. Bousseksou, L.Capes, L. Salmon, M. Perrin, O. Kahn, A. Collet, Eur. J. Inorg.Chem. 2001, 2935; b) K. S. Min, A. DiPasquale, A. L. Rheingold,J. S. Miller, Inorg. Chem. 2007, 46, 1048; c) K. S. Min, K. Swierczek,A. G. DiPasquale, A. L. Rheingold, W. M. Reiff, A. M. Arif, J. S.Miller, Chem. Commun. 2008, 317; d) M. Nihei, M. Ui, M. Yokata,L. Han, A. Maeda, H. Kishida, H. Oshio, Angew. Chem. 2005, 117,6642; Angew. Chem. Int. Ed. 2005, 44, 6484.
[7] P. Guionneau, M. Marchivie, G. Bravic, J. F. L�tard, D. Chasseau,Top. Curr. Chem. 2004, 234, 97.
[8] M. Shatruk, A. Dragulescu-Andrasi, K. E. Chambers, S. A. Stoian,E. L. Bominaar, C. Achim, K. R. Dunbar, J. Am. Chem. Soc. 2007,129, 6104.
[9] R. L. Carlin, Magnetochemistry. Springer-Verlag: Berlin, Germany,1986.
[10] J. F. L�tard, L. Capes, G. Chastanet, N. Moliner, S. L�tard, J. A.Real, O. Kahn, Chem. Phys. Lett. 1999, 313, 115.
[11] J. F. L�tard, J. Mater. Chem. 2006, 16, 2550.[12] A. Hauser, Top. Curr. Chem. 2004, 233, 49.[13] To demonstrate the formation of the tris-complexes, we used one of
the obtained solutions for crystallization and established the crystalstructure of [Ni ACHTUNGTRENNUNG(XBBIM)3] ACHTUNGTRENNUNG(ClO4)2 (see the Supporting Information).The nearly identical UV/Vis spectra confirm that the analogous spe-cies are obtained in the case of BIM and XBIM ligands.
[14] S. Decurtins, P. G�tlich, K. M. Hasselbach, A. Hauser, H. Spiering,Inorg. Chem. 1985, 24, 2174.
[15] A. B. P. Lever, Inorganic Electronic Spectroscopy, Vol. 33, 2nd ed.,Elsevier, Amsterdam, 1984.
[16] I. Krivokapic, C. Enachescu, R. Bronisz, A. Hauser, Chem. Phys.Lett. 2008, 455, 192.
[17] A. Hauser, Top. Curr. Chem. 2004, 234, 155.[18] T. Kojima, R. A. Leising, S. Yan, L. Que, Jr., J. Am. Chem. Soc.
1993, 115, 11328.[19] J. C. Xiao, J. M. Shreeve, J. Org. Chem. 2005, 70, 3072.[20] Z. Shi, R. P. Thummel, J. Org. Chem. 1995, 60, 5935.[21] R. P. Thummel, V. Goulle, B. Chen, J. Org. Chem. 1989, 54, 3057.[22] Bruker, SMART and SAINT, Bruker AXS Inc., Madison, WI, USA,
2007.[23] G. M. Sheldrick SADABS, University of Gottingen, Gottingen, Ger-
many, 1996.[24] G. M. Sheldrick, XPREP. Space group determination and reciprocal
space plots, Siemens Analytical X-ray Instruments, Madison, WI,USA, 1991.
[25] G. M. Sheldrick, Acta Crystallogr. Sect. A 2008, 64, 112.[26] Oxford Diffraction, CrysAlis. Oxford Diffraction Ltd., Abingdon,
England, 2006.[27] G. A. Bain, J. F. Berry, J. Chem. Educ. 2008, 85, 532.[28] J. H. Park, Ph.D. Dissertation, University of Florida, Gainesville,
FL, USA, 2006.Received: June 8, 2012
Published online: October 15, 2012
Chem. Eur. J. 2012, 18, 15805 – 15815 � 2012 Wiley-VCH Verlag GmbH & Co. KGaA, Weinheim www.chemeurj.org 15815
FULL PAPERFeII Complexes of 2,2’-Biimidazole