heroin addiction in african americans: a hypothesis-driven association study
TRANSCRIPT
Heroin addiction in African Americans: a hypothesis-drivenassociation study
Orna Levran1, Douglas Londono2, Kim O'Hara1, Matthew Randesi1, John Rotrosen3, PaulCasadonte3, Shirley Linzy4, Jurg Ott2,5, Miriam Adelson1,4, and Mary Jeanne Kreek1
1The Laboratory of the Biology of Addictive Diseases, The Rockefeller University, New York, NY,USA2The Laboratory of Statistical Genetics, The Rockefeller University, New York, NY, USA3VA New York Harbor Healthcare System and NYU School of Medicine New York, NY, USA4Dr. Miriam and Sheldon G. Adelson Clinic for Drug Abuse Treatment and Research, Las Vegas,NV, USA5Beijing Institute of Genomics, Chinese Academy of Sciences, Beijing, China
AbstractHeroin addiction is a chronic complex disease with a substantial genetic contribution. This studywas designed to identify gene variants associated with heroin addiction in African Americans. Theemphasis was on genes involved in reward modulation, behavioral control, cognitive function,signal transduction, and stress response. We have performed a case-control association analysis byscreening with 1350 variants of 130 genes. The sample consisted of 202 former severe heroinaddicts in methadone treatment and 167 healthy controls with no history of drug abuse. Single-SNP, haplotype and multi-SNP genotype pattern analyses were performed. Seventeen SNPsshowed point-wise significant association with heroin addiction (nominal P < 0.01). These SNPsare from genes encoding several receptors: adrenergic (ADRA1A), arginine vasopressin (AVPR1A),cholinergic (CHRM2), dopamine (DRD1), GABA-A (GABRB3), glutamate (GRIN2A), andserotonin (HTR3A), as well as alcohol dehydrogenase (ADH7), glutamic acid decarboxylase(GAD1 and GAD2), the nucleoside transporter (SLC29A1), and diazepam binding inhibitor (DBI).The most significant result of the analyses was obtained for the GRIN2A haplotype G-A-T(rs4587976-rs1071502-rs1366076) with protective effect (P uncorrected = 9.6E-05, P corrected =0.058). This study corroborates several reported associations with alcohol and drug addiction aswell as other related disorders, and extends the list of variants that may affect the development ofheroin addiction. Further studies will be necessary to replicate these associations and to elucidatethe roles of these variants in drug addiction vulnerability.
Keywordsassociation study; heroin addiction; polymorphisms; African Americans; NMDA glutamatereceptor
Correspondence: Orna Levran Ph.D, The Laboratory of the Biology of Addictive Diseases, Box 171, The Rockefeller University, NewYork, NY 10065, USA. Tel: (212) 327-8282. FAX: (212) 327-7023. E-mail: [email protected].
NIH Public AccessAuthor ManuscriptGenes Brain Behav. Author manuscript; available in PMC 2010 July 1.
Published in final edited form as:Genes Brain Behav. 2009 July ; 8(5): 531–540. doi:10.1111/j.1601-183X.2009.00501.x.
NIH
-PA Author Manuscript
NIH
-PA Author Manuscript
NIH
-PA Author Manuscript
IntroductionHeroin addiction is a chronic, relapsing brain disease that is characterized by drugdependence, tolerance and compulsive seeking and use despite harmful consequences. Thiscomplex disorder is a worldwide major public health problem. The relatively highheritability (40-60%) of this disorder (Tsuang et al., 1996) indicates that genetic variantsmay play a role in vulnerability to its development. Chronic drug use alters gene expression,which activates or attenuates biochemical pathways and produces neuroadaptive changes insignal transduction functions. Identifying these variants is important for the understanding ofthe possible causes of this disease and to improve its diagnosis and treatment, as well as forprimary prevention purposes.
Studies have suggested association of a number of gene variants with heroin addiction orcombined drug addiction. These include variants in genes encoding opioid, dopamine,serotonin, and GABA receptors and also cholinergic muscarinic 2, ACTH, and cannabinoid1 receptors. In addition, association was suggested for catechol-O-methyltransferase(COMT), period circadian protein 3, proenkephalin, proopiomelanocortin, tryptophanhydroxylase 2, and brain-derived neurotrophic factor (Kreek et al., 2005, Cheng et al., 2005,Loh et al., 2007, Nielsen et al., 2008, Proudnikov et al., 2008, Proudnikov et al., 2006,Szilagyi et al., 2005, Xu et al., 2004, Zou et al., 2007, Zuo et al., 2007)}. We have recentlyconducted a candidate gene association study in European Americans (EA), in which wedetected associations with SNPs in OPRM1, OPRK1 OPRD1, GAL, HTR3B and CSNK1E,with severe heroin addiction (Levran et al., 2008)
Specific disease-associated genetic factors may vary in frequency among populationsbecause of random drift or natural selection (Lohmueller et al., 2006). The degree andpattern of linkage disequilibrium (LD) also differ among populations. In addition, somefunctional variants may have different effects in different ethnic groups (Tate & Goldstein,2004).
We performed a hypothesis -driven case-control association study, using an “addiction-focused” SNP array (Hodgkinson et al., 2008) in African Americans (AA) that extends ouroriginal study in EA (Levran et al., 2008). The two populations were separated for analysisbased on significant differences in allele frequencies and the vulnerabilities of these studiesto population stratification. The cases were selected from the extreme margin of the specificphenotype range (e.g., severe heroin addicts in methadone maintenance treatment) and thecontrols were selected by detailed personal interview and stringent criteria.
Materials and methodsSubjects
Three hundred and sixty nine subjects participated in the study (202 cases and 167 controls).There were 54% percent females in the control group and 38% in the case group. The meanage at recruitment was 31.9 (±11.7) years in the control group and 47.0 (±8.8) years in thecase group. The patients (cases) were former severe heroin addicts from methadonemaintenance treatment programs. Subjects were recruited at the Rockefeller UniversityHospital, the Manhattan Campus of the VA NY Harbor Health Care System, Weill MedicalCollege of Cornell University, and the Dr. Miriam and Sheldon G. Adelson Clinic for DrugAbuse Treatment and Research, Las Vegas. Ascertainment was made by personal interview,using several instruments: the Addiction Severity Index (ASI) (Mclellan et al., 1992), theKreek-McHugh-Schluger-Kellogg scale (KMSK) (Kellogg et al., 2003), and the Diagnosticand Statistical Manual of Mental Disorders, 4th Edition (DSM-IV). All subjects had ahistory of using heroin multiple times per day, every day for at least one year. The 167
Levran et al. Page 2
Genes Brain Behav. Author manuscript; available in PMC 2010 July 1.
NIH
-PA Author Manuscript
NIH
-PA Author Manuscript
NIH
-PA Author Manuscript
control subjects were recruited at the Rockefeller University Hospital. Each of the followingwas used as an exclusion criterion from this category: a) At least one instance of drinking tointoxication, or any illicit drug use, in the previous 30 days. b) A past history of alcoholdrinking to intoxication, or illicit drug use, more than twice a week, for more than sixconsecutive months. c) Cannabis use for more than 12 days in the prior 30 days or past usefor more than twice a week for more than 4 years. All subjects completed a family historyquestionnaire and were self-identified as AA for three generations. Participants wereexcluded from the study if they had a relative in the study, or had a mixed ancestry. TheInstitutional Review Boards of Rockefeller University, VA NY and Cornell Universityapproved the study. Rockefeller University IRB also reviews the Adeslon Clinic, LasVegas.. All subjects signed informed consent for genetic studies.
DNA preparationBlood samples were taken and DNA was extracted using the standard salting-out method.DNA was quantified using PicoGreen (Invitrogen, Carlsbad, CA). 700 ng DNA (45 μL) wasethanol-precipitated for a second time and re-suspended in 7 μl Tris-EDTA (10 mM Tris-HCl, 1 mM EDTA, pH 8.0) as described (Levran et al., 2008). 5 μl (250-500 ng) were usedfor genotyping.
Genotyping and quality assessmentGenotyping was performed on a 1,536-plex GoldenGate Custom Panel (GS0007064-OPA,Illumina, San Diego, CA). 1350 SNPs were selected from 130 candidate genes (Hodgkinsonet al., 2008). In addition, the array included 186 ancestry informative markers (AIMs) thatwere selected based on allele frequencies in the European, African and Chinese populationof the HapMap project (Enoch et al., 2006, Hodgkinson et al., 2008). Genotyping wasperformed at the Rockefeller University Genomics Resource Center according to themanufacturer's protocol (Illumina). Analysis was performed using BeadStudio genotypingsoftware (Illumina). Genotype data was filtered based on SNP call rates (>99.5%),MAF>0.01, cluster separation score, and deviation from Hardy-Weinberg Equilibrium(HWE). Random samples (~10%) were genotyped in duplicate and two identical sampleswere genotyped on each of the arrays for reproducibility control purposes.
Statistical analysisPopulation stratification—Ancestry informative markers were employed to test forpopulation stratification using the STRUCTURE v2.2 software (Pritchard et al., 2000). Thissoftware places individuals in K clusters of potential putative populations separated bymarker frequencies. A no-admixture ancestry model with K set to 1 was initially used toinfer the Dirichlet parameter lambda of the distribution of allele frequencies. The value oflambda thus obtained was later used under an admixture model with allele frequenciescorrelated using a burn-in length of 50,000 followed by 50,000 Markov Chain Monte Carloiterations which was sufficient to yield stable results.
STRUCTURE was also used to compare the AA sample in this study with the EA sampleanalyzed in a recent study (Levran et al., 2008). Although two clear clusters were observed,K was set to 3 for better display of the results in the yielded triangle plot. The coordinates ofany given point in this triangle are given by the relative distance to each edge (putativepopulation). Individuals who are in one of the corners are therefore assigned completely to aparticular population.
The genomic control method (Devlin et al., 2001) was used to estimate the degree ofsubdivision in our study sample. In this method, markers are used to estimate the
Levran et al. Page 3
Genes Brain Behav. Author manuscript; available in PMC 2010 July 1.
NIH
-PA Author Manuscript
NIH
-PA Author Manuscript
NIH
-PA Author Manuscript
background association which can then be used to infer the variance inflation factor, lambda,introduced when there is subdivision.
Association Analysis—The frequency of marker alleles and genotypes in cases andcontrols were compared using Fisher's exact test, as implemented in R v2.7.0(http://www.R-project.org). This test was preferred over a parametric test since there werenumerous instances of small cell counts in the tables. This test was also used to estimateallelic odds ratios (OR) with their corresponding 95% confidence intervals. The mostsignificant results were also evaluated using the chi-square test and no substantialdifferences were found. An uncorrected P-value of 0.01 was chosen as the threshold forpoint-wise significance for the association tests.
Marker genotype quality control was performed in the control sample by using the exact testof deviation from the Hardy-Weinberg (DHW) proportions as implemented in the R packageGenetics Base v1.6.0 (http://rgenetics.org/). This test estimates allelic correlations occurringat the locus level which may be caused by genotyping errors. The DHW test is not powerfulenough to detect deviations caused by small error rates but can be used to detect grossgenotyping errors which can cause large DHW. For this reason, a conservative p-value of0.05/1114 = 0.000045 was used as a cut-off for declaring significant departures from HWproportions.
To adjust for possible age and gender effects, a logistic regression analysis was run on theset of markers using PLINK v1.05 (http://pngu.mgh.harvard.edu/purcell/plink/)
Linkage Disequilibrium (LD) Blocks, Haplotype Analysis and GenotypePatterns—The pattern of pair-wise LD between SNPs was measured by the standardizeddisequilibrium value (D') as implemented in Haploview v4.1 (Barrett et al., 2005). In orderto capture the blocks that consist of the specific SNPs indicated in the single SNPassociation tests, LD haplotype blocks were identified using the Gabriel's method (Gabriel etal., 2002). When no block was identified by this method, the alternative solid spine of LDdefinition (Barrett et al., 2005) was employed.
Haplotypes were reconstructed using the accelerated expectation-maximization algorithmimplemented in Haploview for genes that include at least one marker whose P-value wasless than 0.01 in the single-locus association test. Haplotype association analysis wasperformed for each of the reconstructed haplotypes (against the rest) using the Fisher's exacttest. Multi-locus genotype patterns (MLGP) of the markers in the blocks identified byHaploview were determined. For a set of a given number m SNPs, n observed m locusgenotype pattern frequencies were stored in an n x 2 contingency table where the twocolumns corresponded to cases and controls. A Fisher's exact test for differences in MLGPfrequencies between the two groups was performed. In addition to single-locus effects,MLGP analysis also evaluates epistatic interaction influencing the outcome. Since we arenot interested in the effects of rare genotype patterns, in this analysis, pattern frequenciesbelow 5% in cases and controls each were pooled into a single “rare” class.
Multiple Testing Corrections—Results were adjusted for multiple testing by using the Rpackage QVALUE v1.1 (Storey, 2003, Storey & Tibshirani, 2003). Rather than dealing withthe probability of rejecting a true null hypothesis (the family-wise error rate), the approachimplemented in QVALUE estimates the expected proportion of false positives among allrejected hypotheses (the false discovery rate, FDR) (Benjamini et al., 2001). QVALUEtakes a given set of P values and, for each test, estimates the minimum FDR that is incurredwhen calling that particular test significant (the q-value of the test). The q-value measuresthe significance of each of a family of tests performed simultaneously and holds under
Levran et al. Page 4
Genes Brain Behav. Author manuscript; available in PMC 2010 July 1.
NIH
-PA Author Manuscript
NIH
-PA Author Manuscript
NIH
-PA Author Manuscript
different forms of dependence. The smallest nominal P value of all tests performed (Pmin)was observed from the haplotype association tests. The QVALUE program was run on thelist of P values created by adding Pmin to the set of P values obtained from the single-locustests. The result is the estimated experiment-wise significance of Pmin. An FDR of 0.05 wasused as the significance level.
ResultsGenotype and allele frequencies of 1194 SNPs from 130 candidate genes (Hodgkinson et al.,2008) were analyzed for association with heroin addiction in 369 AA samples (202 casesand 167 controls). One hundred fifty six SNPs were excluded from analysis because ofinadequate quality (cluster separation score < 0.4), low variability (MAF < 0.01) (Table S1),or deviation from Hardy-Weinberg equilibrium in the control sample. Genotypingreproducibility was 99.9% and the mean marker call rate after exclusion was 99.8%.
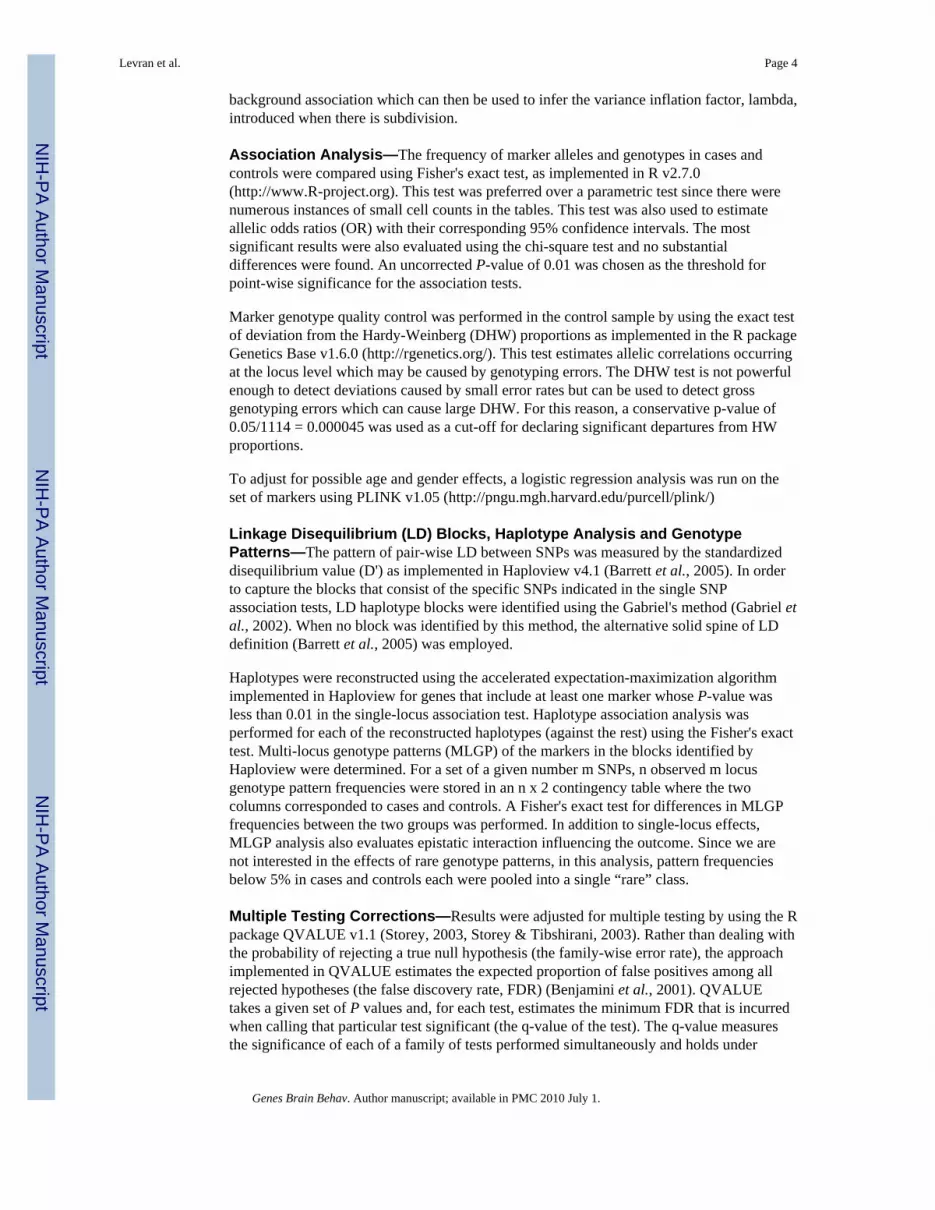
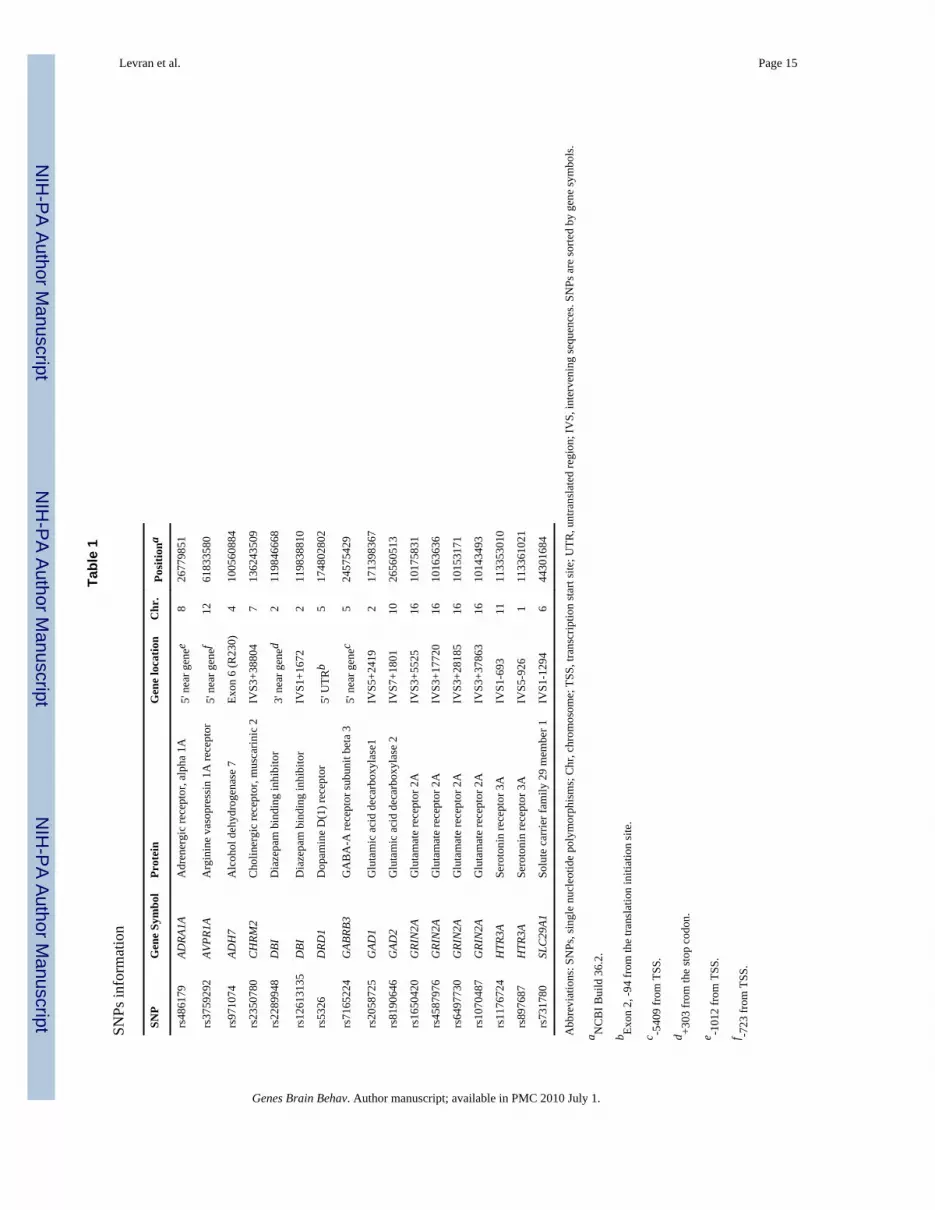
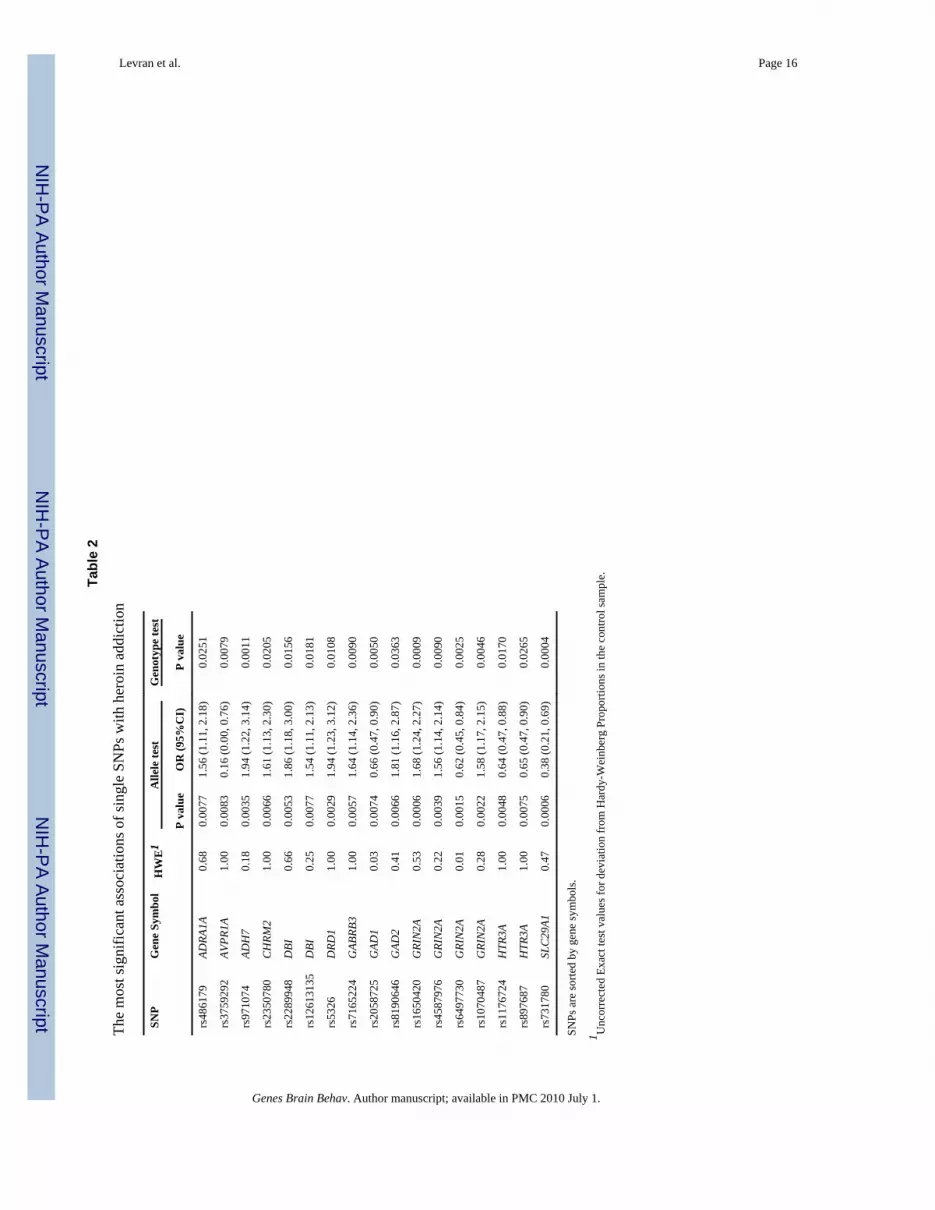
Association analysisResults of the most significant single SNP association tests are shown in Tables 1 and 2.Indication of association with heroin addiction was observed with seventeen SNPs(uncorrected P < 0.01) in the following genes: glutamate receptor, ionotropic, N-methyl D-aspartate (NMDA) subtype 2A, solute carrier family 29 (nucleoside transporters) member 1,dopamine receptor D1, alcohol dehydrogenase isozyme 7, 5-hydroxytryptamine (5-HT,serotonin) receptor, subtype 3A, glutamate decarboxylase isoforms 1 and 2, GABA-Areceptor, subunit beta 3, diazepam binding inhibitor, cholinergic receptor, muscarinic 2,adrenergic receptor alpha-1A, and arginine vasopressin receptor subtype 1A. Listed in TableS2 are the alleles and genotype frequencies in cases and controls. Odds ratios werecalculated for the minor allele and indicate a small effect (OR for risk effect range 1.54-1.94and OR for a protective effect range 0.16-0.66 for the allelic test, Table 2). None of the testswere significant after correction for multiple testing. No significant effect was found foreither age or gender.
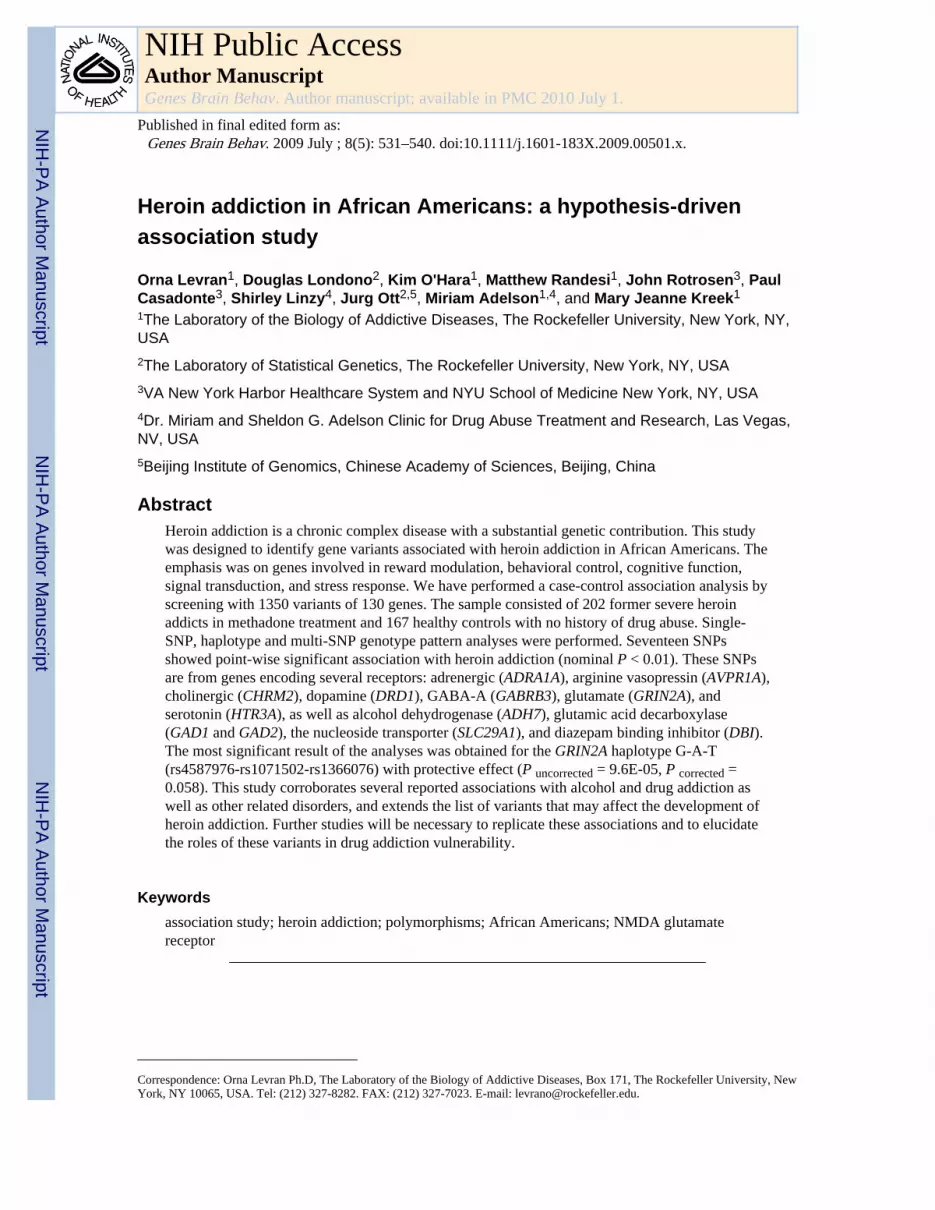
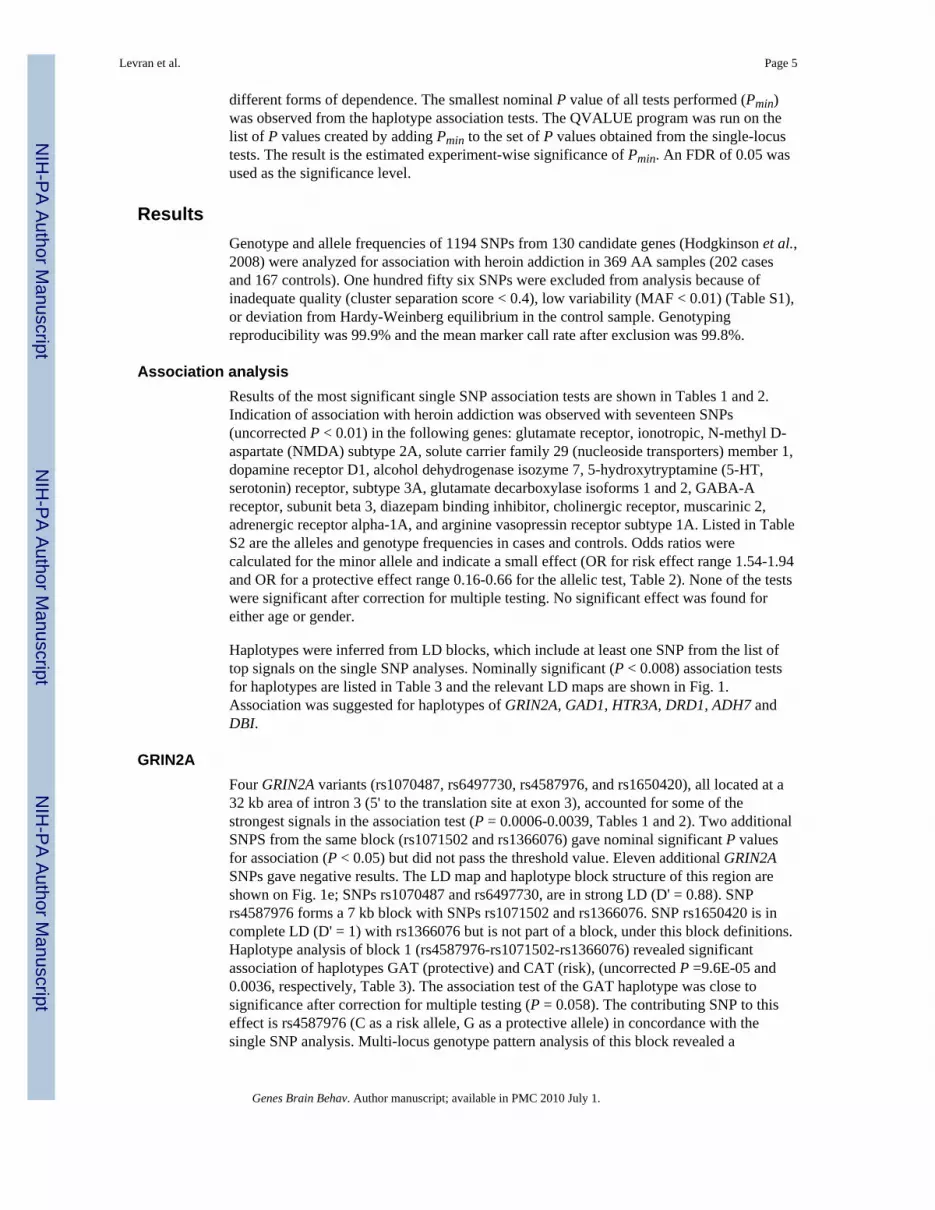
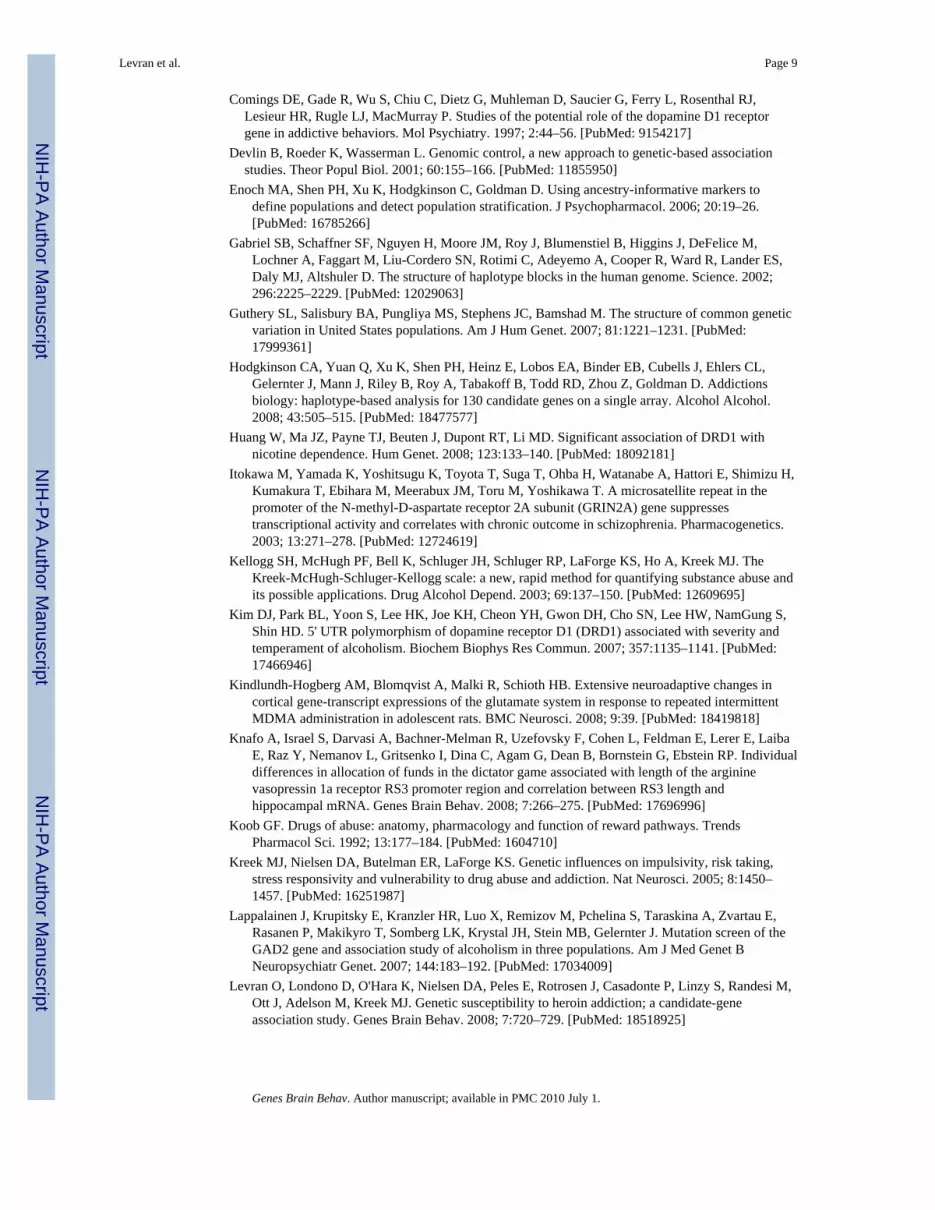
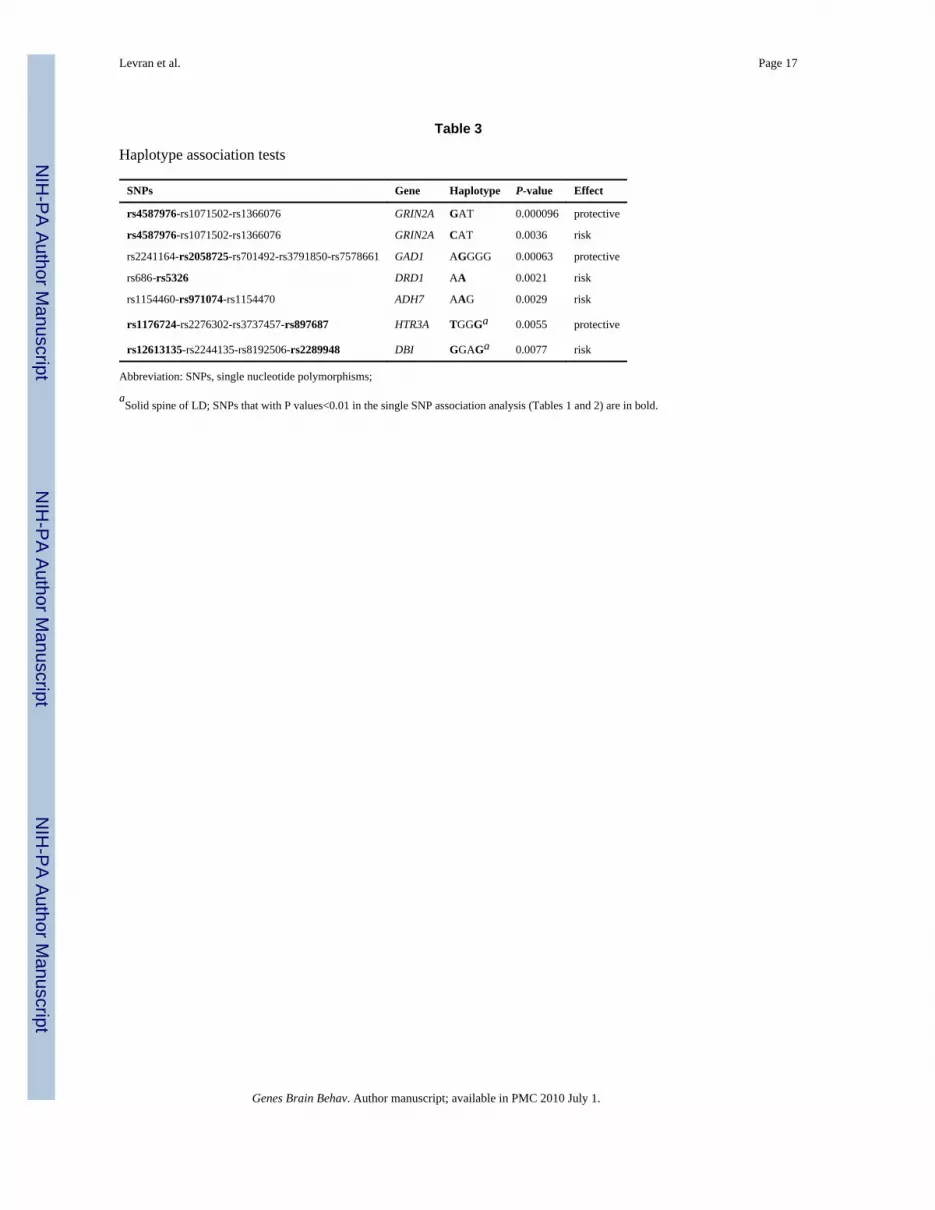
Haplotypes were inferred from LD blocks, which include at least one SNP from the list oftop signals on the single SNP analyses. Nominally significant (P < 0.008) association testsfor haplotypes are listed in Table 3 and the relevant LD maps are shown in Fig. 1.Association was suggested for haplotypes of GRIN2A, GAD1, HTR3A, DRD1, ADH7 andDBI.
GRIN2AFour GRIN2A variants (rs1070487, rs6497730, rs4587976, and rs1650420), all located at a32 kb area of intron 3 (5' to the translation site at exon 3), accounted for some of thestrongest signals in the association test (P = 0.0006-0.0039, Tables 1 and 2). Two additionalSNPS from the same block (rs1071502 and rs1366076) gave nominal significant P valuesfor association (P < 0.05) but did not pass the threshold value. Eleven additional GRIN2ASNPs gave negative results. The LD map and haplotype block structure of this region areshown on Fig. 1e; SNPs rs1070487 and rs6497730, are in strong LD (D' = 0.88). SNPrs4587976 forms a 7 kb block with SNPs rs1071502 and rs1366076. SNP rs1650420 is incomplete LD (D' = 1) with rs1366076 but is not part of a block, under this block definitions.Haplotype analysis of block 1 (rs4587976-rs1071502-rs1366076) revealed significantassociation of haplotypes GAT (protective) and CAT (risk), (uncorrected P =9.6E-05 and0.0036, respectively, Table 3). The association test of the GAT haplotype was close tosignificance after correction for multiple testing (P = 0.058). The contributing SNP to thiseffect is rs4587976 (C as a risk allele, G as a protective allele) in concordance with thesingle SNP analysis. Multi-locus genotype pattern analysis of this block revealed a
Levran et al. Page 5
Genes Brain Behav. Author manuscript; available in PMC 2010 July 1.
NIH
-PA Author Manuscript
NIH
-PA Author Manuscript
NIH
-PA Author Manuscript
significant difference between cases and controls with a similar effect, uncorrected P =0.0005, data not shown).
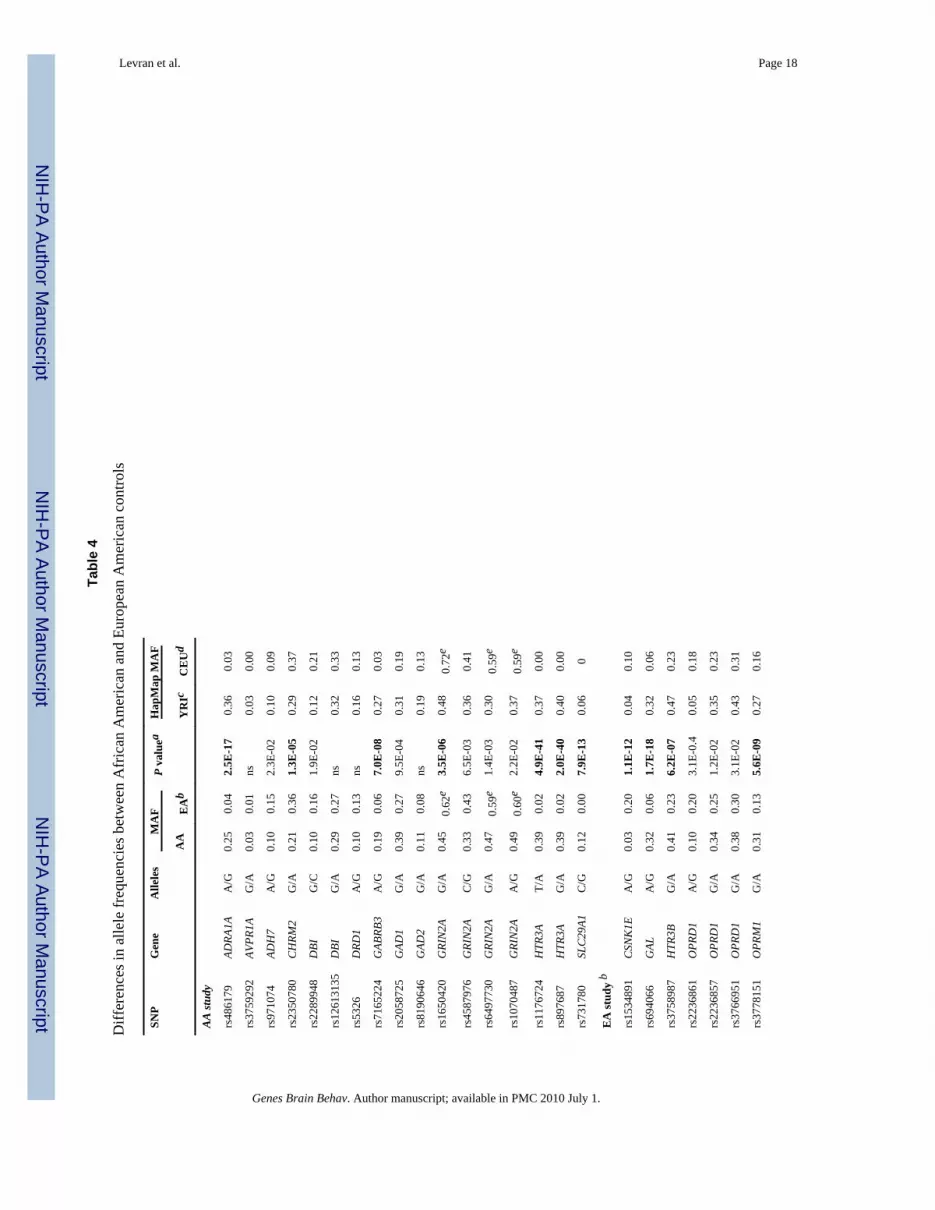
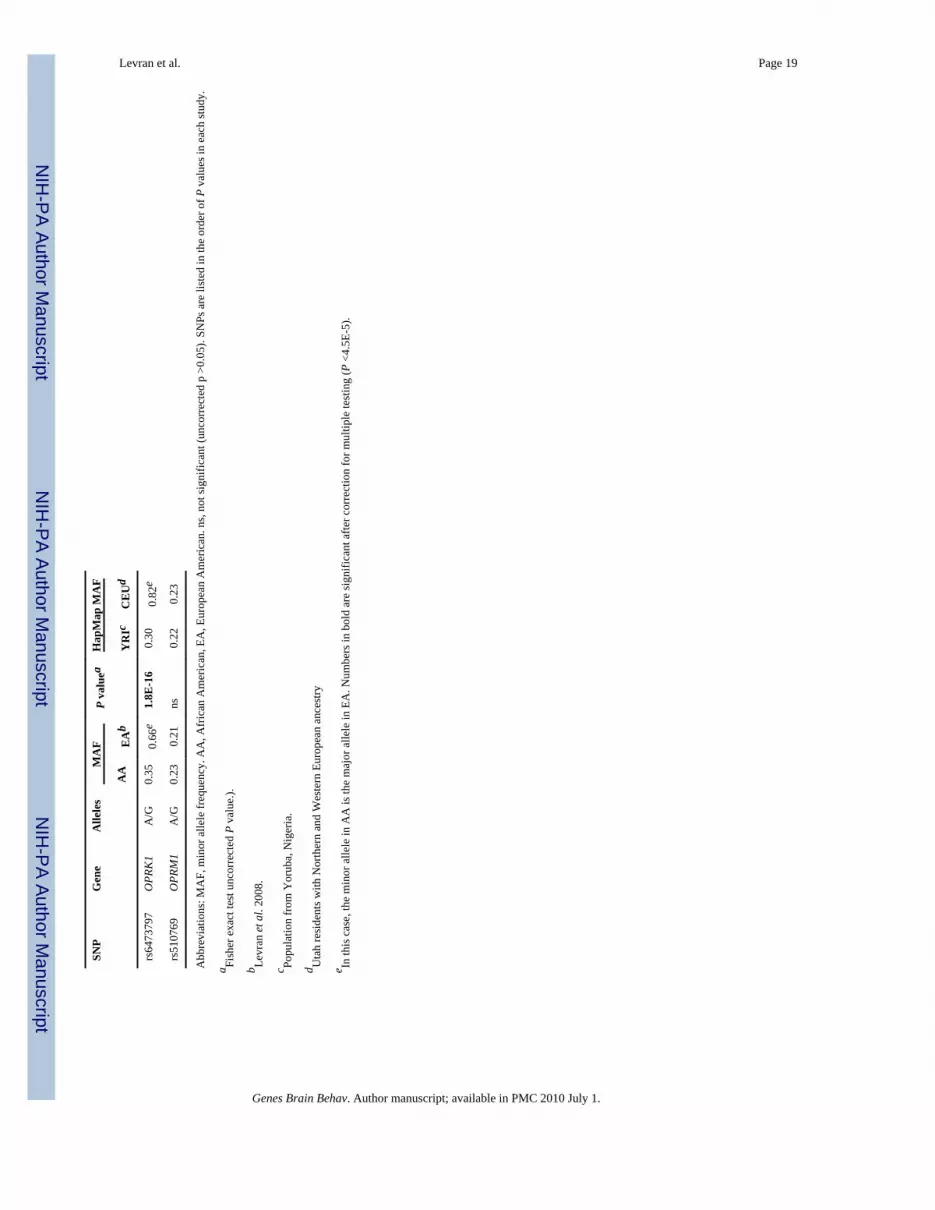
These four SNPs (rs1650420, rs6497730, rs4587976 and rs1070487) are common in bothAA and EA (MAF > 0.33, Table 4), but the minor allele frequencies differ between theseethnic groups. The four SNPs are more common in EA and the difference in allele frequencyof rs1650420 is significant after correction for multiple testing (P = 3.5E-06, Table 4). Theminor alleles of SNPs rs1650420, rs1070487 and rs6497730 in AA are the major alleles inEA (Table 4).
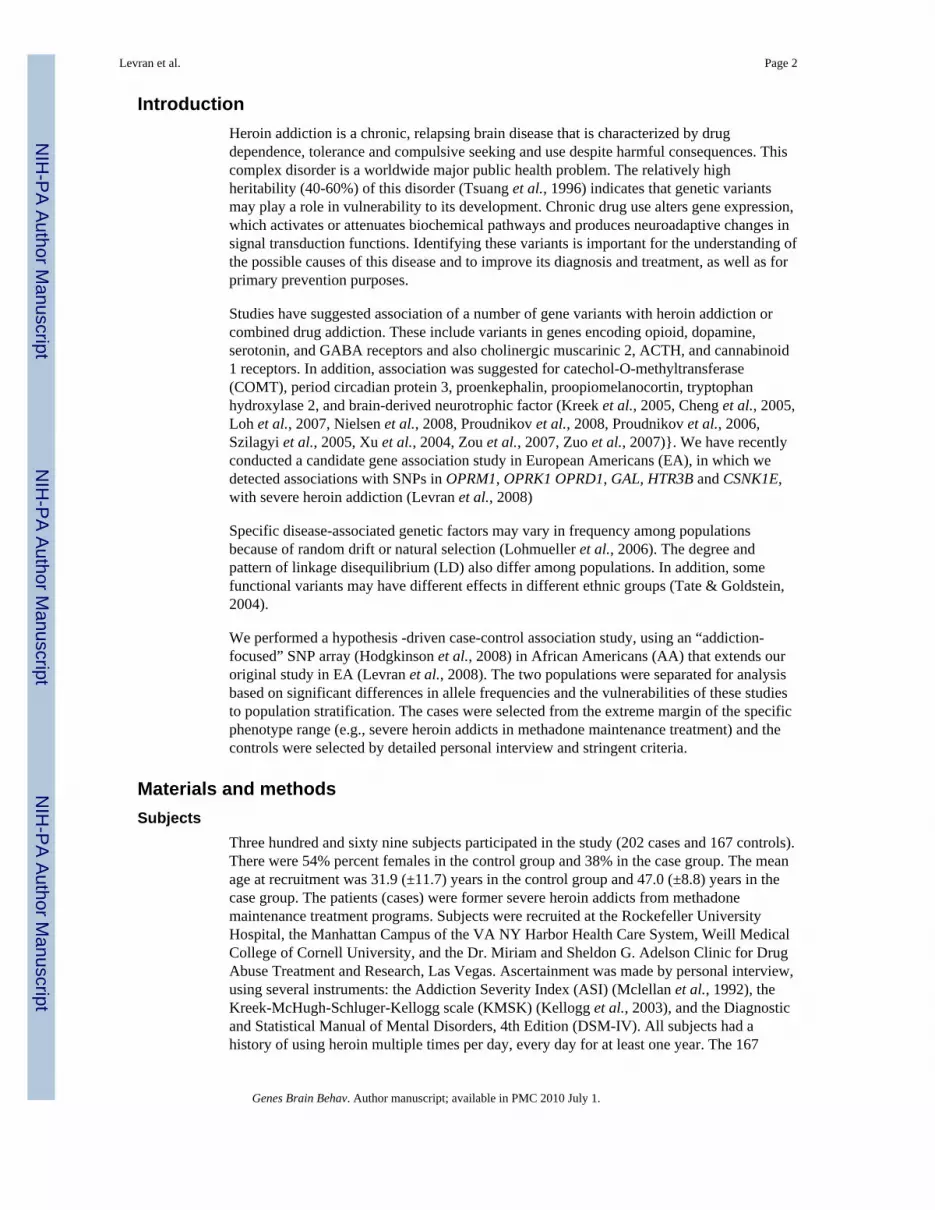
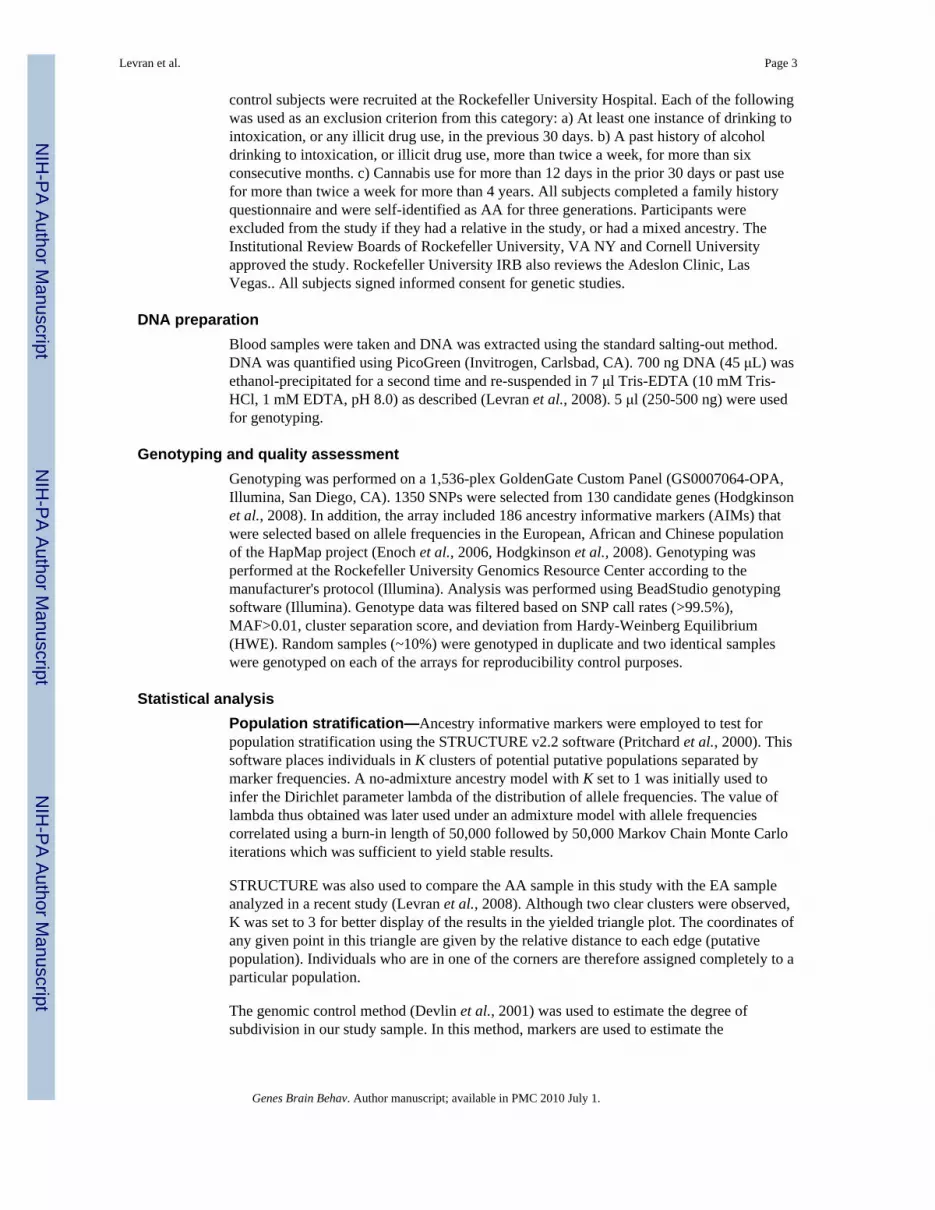
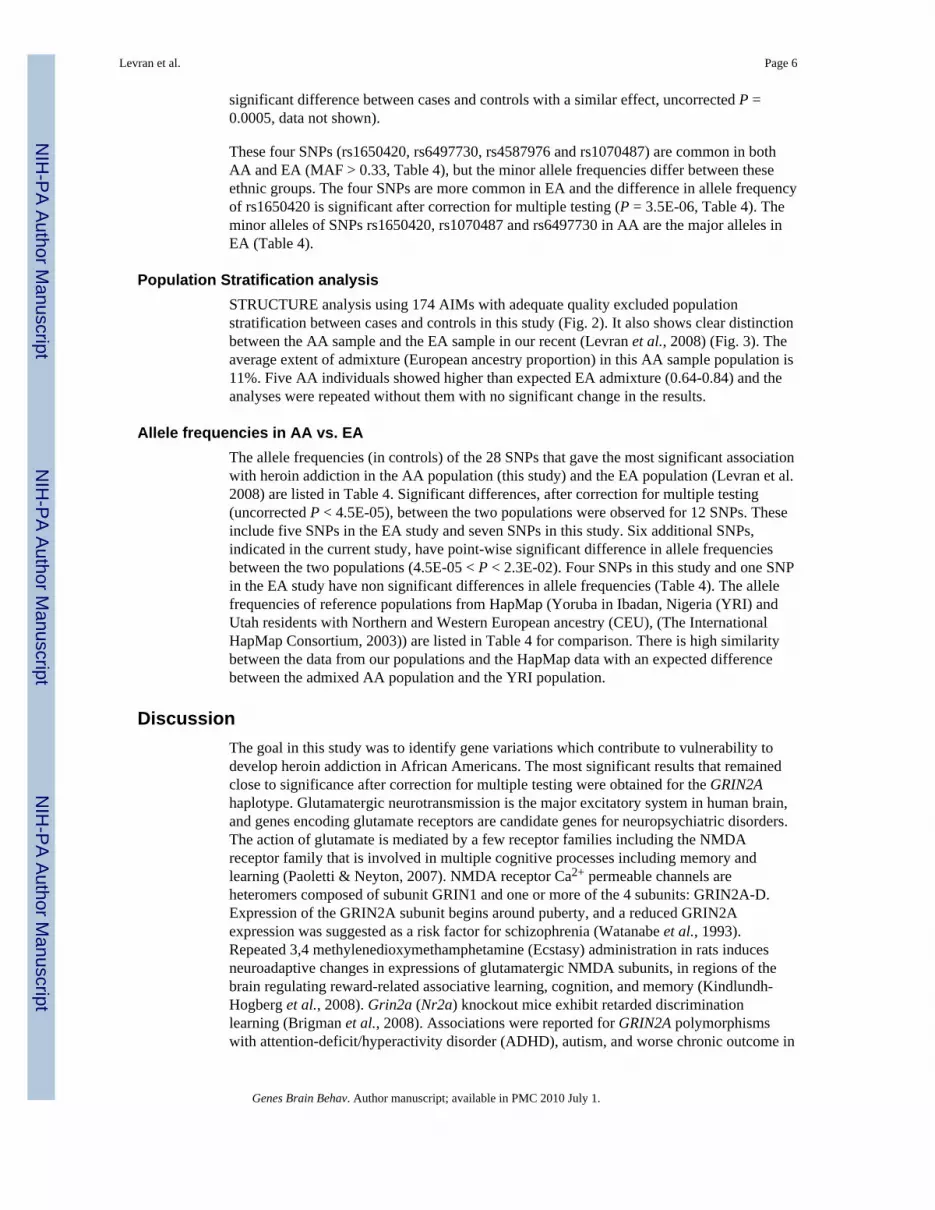
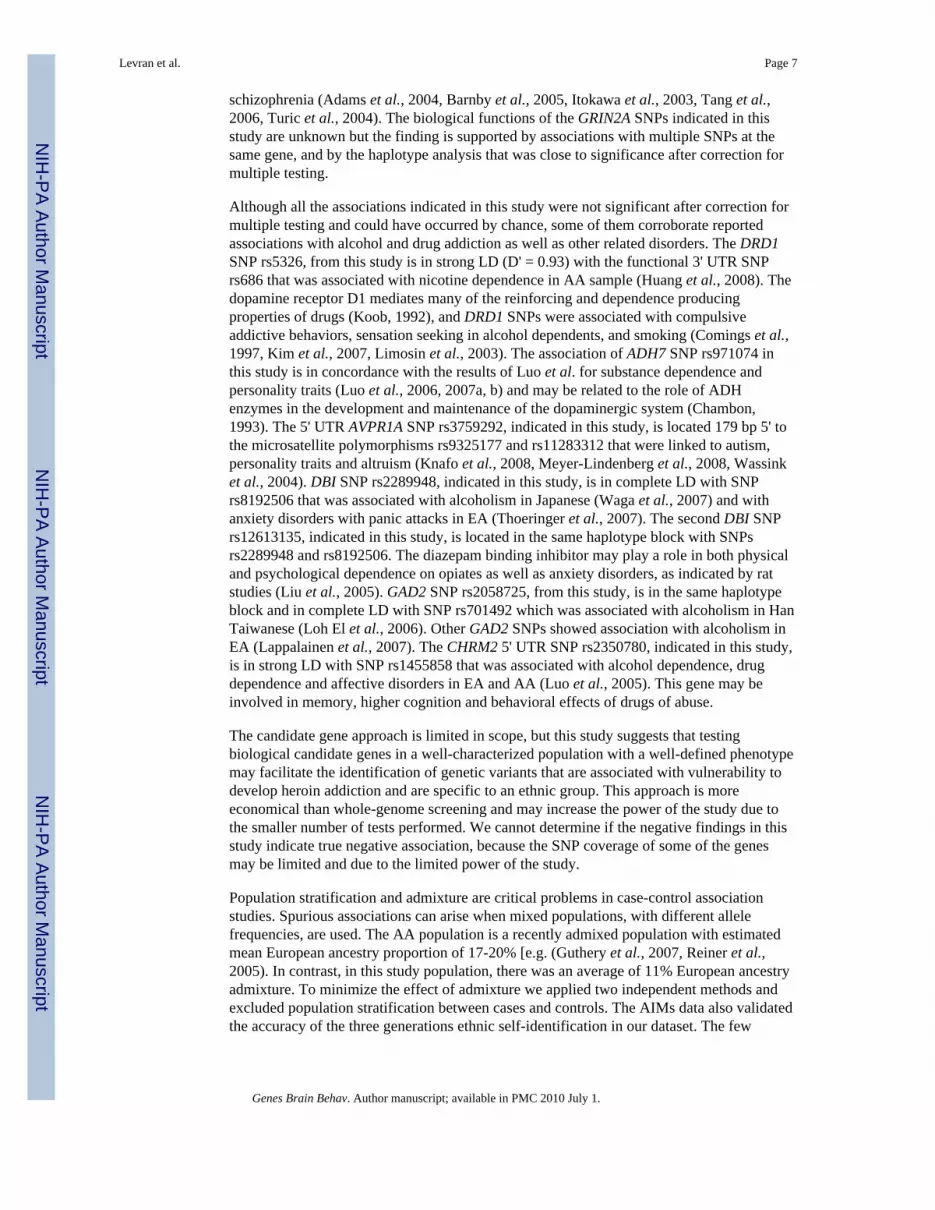
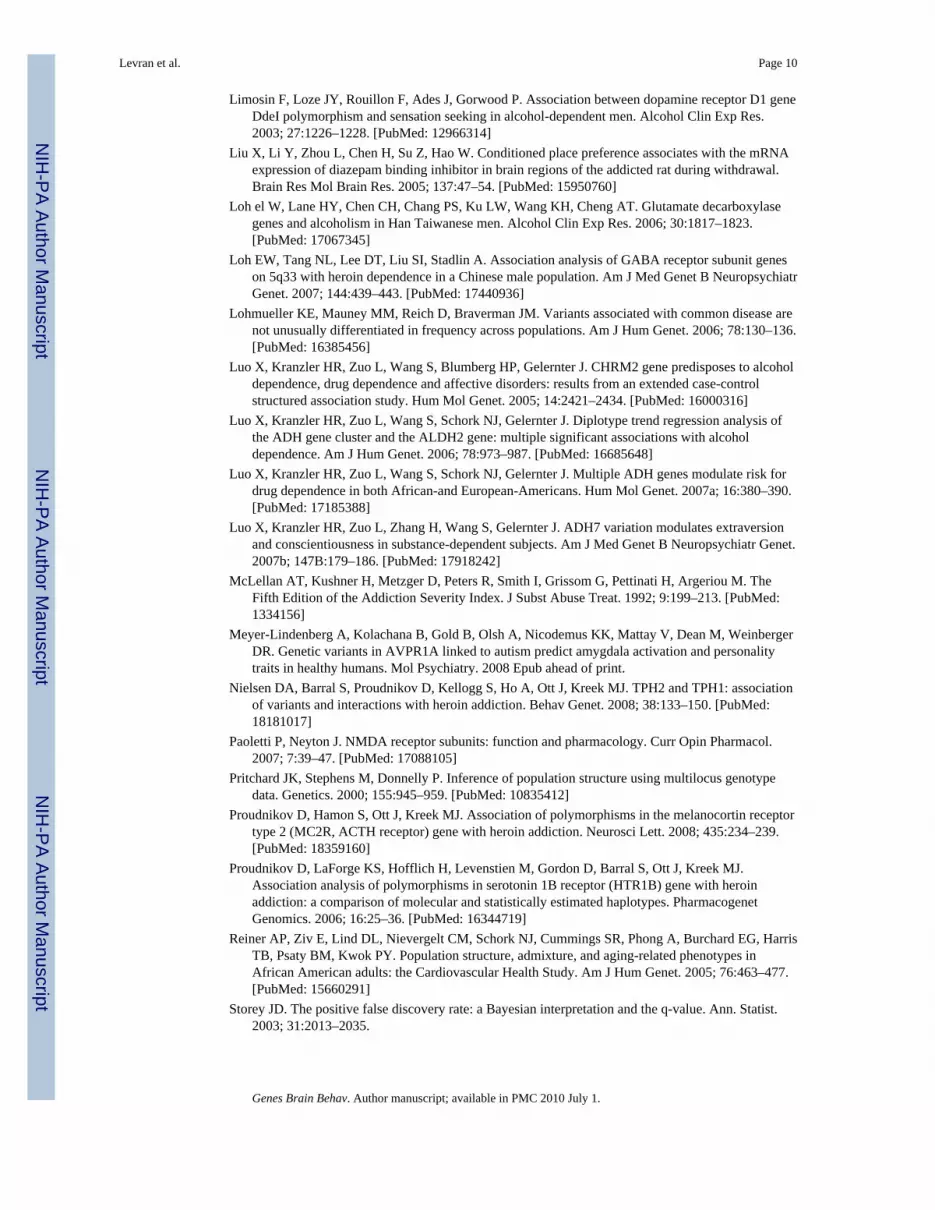
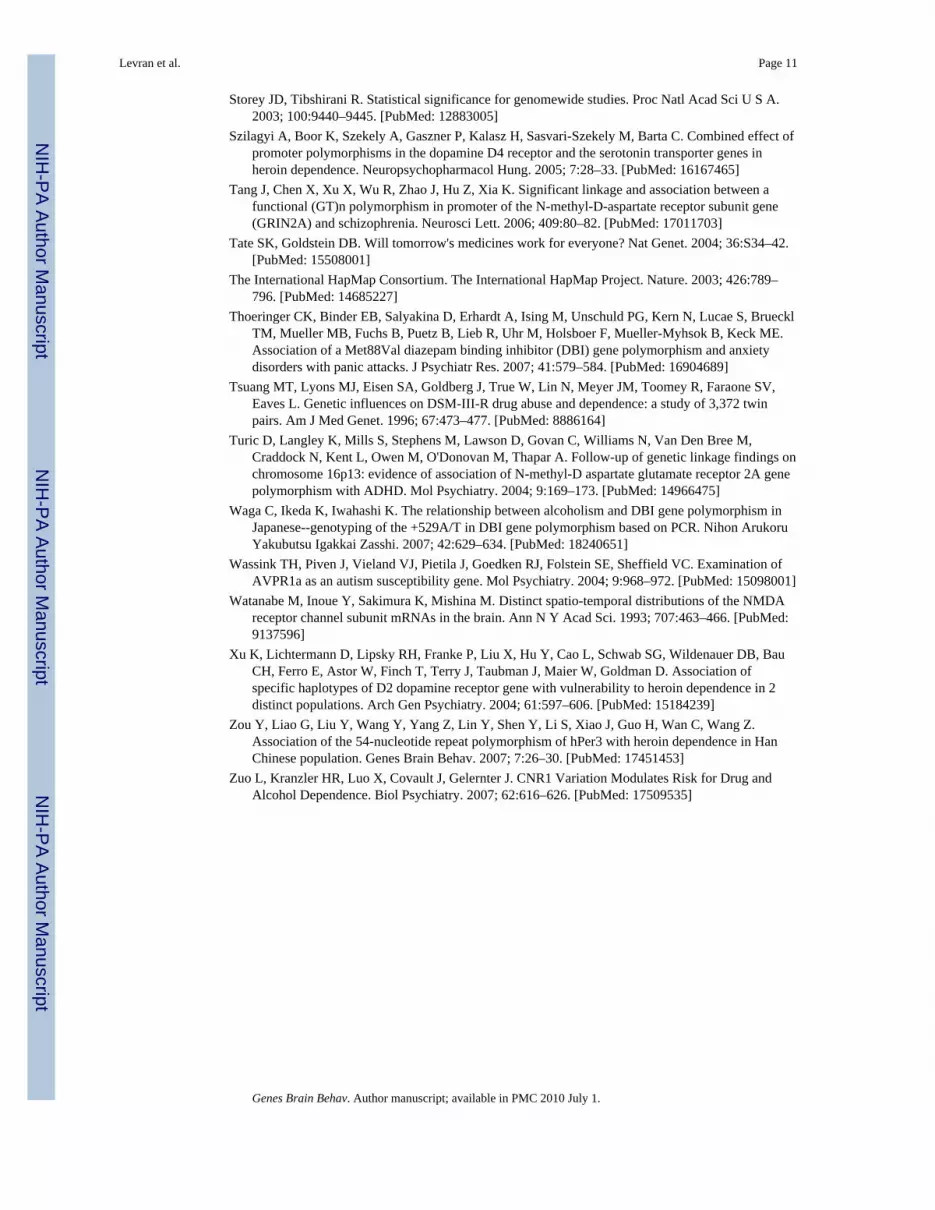
Population Stratification analysisSTRUCTURE analysis using 174 AIMs with adequate quality excluded populationstratification between cases and controls in this study (Fig. 2). It also shows clear distinctionbetween the AA sample and the EA sample in our recent (Levran et al., 2008) (Fig. 3). Theaverage extent of admixture (European ancestry proportion) in this AA sample population is11%. Five AA individuals showed higher than expected EA admixture (0.64-0.84) and theanalyses were repeated without them with no significant change in the results.
Allele frequencies in AA vs. EAThe allele frequencies (in controls) of the 28 SNPs that gave the most significant associationwith heroin addiction in the AA population (this study) and the EA population (Levran et al.2008) are listed in Table 4. Significant differences, after correction for multiple testing(uncorrected P < 4.5E-05), between the two populations were observed for 12 SNPs. Theseinclude five SNPs in the EA study and seven SNPs in this study. Six additional SNPs,indicated in the current study, have point-wise significant difference in allele frequenciesbetween the two populations (4.5E-05 < P < 2.3E-02). Four SNPs in this study and one SNPin the EA study have non significant differences in allele frequencies (Table 4). The allelefrequencies of reference populations from HapMap (Yoruba in Ibadan, Nigeria (YRI) andUtah residents with Northern and Western European ancestry (CEU), (The InternationalHapMap Consortium, 2003)) are listed in Table 4 for comparison. There is high similaritybetween the data from our populations and the HapMap data with an expected differencebetween the admixed AA population and the YRI population.
DiscussionThe goal in this study was to identify gene variations which contribute to vulnerability todevelop heroin addiction in African Americans. The most significant results that remainedclose to significance after correction for multiple testing were obtained for the GRIN2Ahaplotype. Glutamatergic neurotransmission is the major excitatory system in human brain,and genes encoding glutamate receptors are candidate genes for neuropsychiatric disorders.The action of glutamate is mediated by a few receptor families including the NMDAreceptor family that is involved in multiple cognitive processes including memory andlearning (Paoletti & Neyton, 2007). NMDA receptor Ca2+ permeable channels areheteromers composed of subunit GRIN1 and one or more of the 4 subunits: GRIN2A-D.Expression of the GRIN2A subunit begins around puberty, and a reduced GRIN2Aexpression was suggested as a risk factor for schizophrenia (Watanabe et al., 1993).Repeated 3,4 methylenedioxymethamphetamine (Ecstasy) administration in rats inducesneuroadaptive changes in expressions of glutamatergic NMDA subunits, in regions of thebrain regulating reward-related associative learning, cognition, and memory (Kindlundh-Hogberg et al., 2008). Grin2a (Nr2a) knockout mice exhibit retarded discriminationlearning (Brigman et al., 2008). Associations were reported for GRIN2A polymorphismswith attention-deficit/hyperactivity disorder (ADHD), autism, and worse chronic outcome in
Levran et al. Page 6
Genes Brain Behav. Author manuscript; available in PMC 2010 July 1.
NIH
-PA Author Manuscript
NIH
-PA Author Manuscript
NIH
-PA Author Manuscript
schizophrenia (Adams et al., 2004, Barnby et al., 2005, Itokawa et al., 2003, Tang et al.,2006, Turic et al., 2004). The biological functions of the GRIN2A SNPs indicated in thisstudy are unknown but the finding is supported by associations with multiple SNPs at thesame gene, and by the haplotype analysis that was close to significance after correction formultiple testing.
Although all the associations indicated in this study were not significant after correction formultiple testing and could have occurred by chance, some of them corroborate reportedassociations with alcohol and drug addiction as well as other related disorders. The DRD1SNP rs5326, from this study is in strong LD (D' = 0.93) with the functional 3' UTR SNPrs686 that was associated with nicotine dependence in AA sample (Huang et al., 2008). Thedopamine receptor D1 mediates many of the reinforcing and dependence producingproperties of drugs (Koob, 1992), and DRD1 SNPs were associated with compulsiveaddictive behaviors, sensation seeking in alcohol dependents, and smoking (Comings et al.,1997, Kim et al., 2007, Limosin et al., 2003). The association of ADH7 SNP rs971074 inthis study is in concordance with the results of Luo et al. for substance dependence andpersonality traits (Luo et al., 2006, 2007a, b) and may be related to the role of ADHenzymes in the development and maintenance of the dopaminergic system (Chambon,1993). The 5' UTR AVPR1A SNP rs3759292, indicated in this study, is located 179 bp 5' tothe microsatellite polymorphisms rs9325177 and rs11283312 that were linked to autism,personality traits and altruism (Knafo et al., 2008, Meyer-Lindenberg et al., 2008, Wassinket al., 2004). DBI SNP rs2289948, indicated in this study, is in complete LD with SNPrs8192506 that was associated with alcoholism in Japanese (Waga et al., 2007) and withanxiety disorders with panic attacks in EA (Thoeringer et al., 2007). The second DBI SNPrs12613135, indicated in this study, is located in the same haplotype block with SNPsrs2289948 and rs8192506. The diazepam binding inhibitor may play a role in both physicaland psychological dependence on opiates as well as anxiety disorders, as indicated by ratstudies (Liu et al., 2005). GAD2 SNP rs2058725, from this study, is in the same haplotypeblock and in complete LD with SNP rs701492 which was associated with alcoholism in HanTaiwanese (Loh El et al., 2006). Other GAD2 SNPs showed association with alcoholism inEA (Lappalainen et al., 2007). The CHRM2 5' UTR SNP rs2350780, indicated in this study,is in strong LD with SNP rs1455858 that was associated with alcohol dependence, drugdependence and affective disorders in EA and AA (Luo et al., 2005). This gene may beinvolved in memory, higher cognition and behavioral effects of drugs of abuse.
The candidate gene approach is limited in scope, but this study suggests that testingbiological candidate genes in a well-characterized population with a well-defined phenotypemay facilitate the identification of genetic variants that are associated with vulnerability todevelop heroin addiction and are specific to an ethnic group. This approach is moreeconomical than whole-genome screening and may increase the power of the study due tothe smaller number of tests performed. We cannot determine if the negative findings in thisstudy indicate true negative association, because the SNP coverage of some of the genesmay be limited and due to the limited power of the study.
Population stratification and admixture are critical problems in case-control associationstudies. Spurious associations can arise when mixed populations, with different allelefrequencies, are used. The AA population is a recently admixed population with estimatedmean European ancestry proportion of 17-20% [e.g. (Guthery et al., 2007, Reiner et al.,2005). In contrast, in this study population, there was an average of 11% European ancestryadmixture. To minimize the effect of admixture we applied two independent methods andexcluded population stratification between cases and controls. The AIMs data also validatedthe accuracy of the three generations ethnic self-identification in our dataset. The few
Levran et al. Page 7
Genes Brain Behav. Author manuscript; available in PMC 2010 July 1.
NIH
-PA Author Manuscript
NIH
-PA Author Manuscript
NIH
-PA Author Manuscript
exceptions (~1%) may be due to the individuals' inaccurate knowledge of their own familyhistories.
It is intriguing that the SNPs with the lowest P values for association with heroin addictionin the AA populations, in this study, and the EA population in our recent study (Levran etal., 2008), are so distinct. One possible explanation for these findings is the differences inallele frequencies between the two populations that are observed for 18 SNPs out of the totalof 26 SNPs indicated in both studies and are supported by the HapMap data. The results forthe rest of the SNPs, if their association with heroin addiction is validated, can not beexplained by allele frequency differences and may be influenced by other factors such as LDpattern or modifier genes that may be different in these populations.
It was documented that the risk to develop heroin addiction is similar among all ethnicgroups. The possibility that the specific gene variants contributing to the vulnerability todevelop heroin addiction differ among ethnic groups, is intriguing. This phenomenon wasfound for Crohn's disease (where the susceptibility CARD15 variants in EA were not presentin Japanese), AIDS (where the protective CCR5 variant is common in EA and absent inother ethnic groups), and Alzheimer's disease (where the APOE E4 variant have differentialeffect between ethnic groups) (Tate & Goldstein, 2004). It points to a public healthchallenge to provide population-specific, and in the future individual-specific, diagnosis andtreatment.
AcknowledgmentsWe thank all the clinical staff that enrolled and assessed subjects for this study, including Elizabeth Ducat, BrendaRay, Dorothy Melia and Lisa Borg. We are grateful to D. Goldman and his group from the NIH/NIAAA, for thedesign of the micro-array; Connie Zhao and Bin Zhang from the Rockefeller Genomic Resource Center, for theirexcellent assistance in genotyping. We thank Ann Ho, David Nielsen, Vadim Yuferov and Susan Russo fordiscussion, comments and/or proofreading of the manuscript. We would like to express our profound gratitude tothe late K. Steven LaForge for setting the foundation for this study.
ReferencesAdams J, Crosbie J, Wigg K, Ickowicz A, Pathare T, Roberts W, Malone M, Schachar R, Tannock R,
Kennedy JL, Barr CL. Glutamate receptor, ionotropic, N-methyl D-aspartate 2A (GRIN2A) gene asa positional candidate for attention-deficit/hyperactivity disorder in the 16p13 region. MolPsychiatry. 2004; 9:494–499. [PubMed: 14699423]
Barnby G, Abbott A, Sykes N, Morris A, Weeks DE, Mott R, Lamb J, Bailey AJ, Monaco AP.Candidate-gene screening and association analysis at the autism-susceptibility locus onchromosome 16p: evidence of association at GRIN2A and ABAT. Am J Hum Genet. 2005; 76:950–966. [PubMed: 15830322]
Barrett JC, Fry B, Maller J, Daly MJ. Haploview: analysis and visualization of LD and haplotypemaps. Bioinformatics. 2005; 21:263–265. [PubMed: 15297300]
Benjamini Y, Drai D, Elmer G, Kafkafi N, Golani I. Controlling the false discovery rate in behaviorgenetics research. Behav Brain Res. 2001; 125:279–284. [PubMed: 11682119]
Brigman JL, Feyder M, Saksida LM, Bussey TJ, Mishina M, Holmes A. Impaired discriminationlearning in mice lacking the NMDA receptor NR2A subunit. Learn Mem. 2008; 15:50–54.[PubMed: 18230672]
Chambon P. The molecular and genetic dissection of the retinoid signalling pathway. Gene. 1993;135:223–228. [PubMed: 8276261]
Cheng CY, Hong CJ, Yu YW, Chen TJ, Wu HC, Tsai SJ. Brain-derived neurotrophic factor(Val66Met) genetic polymorphism is associated with substance abuse in males. Brain Res MolBrain Res. 2005; 140:86–90. [PubMed: 16109452]
Levran et al. Page 8
Genes Brain Behav. Author manuscript; available in PMC 2010 July 1.
NIH
-PA Author Manuscript
NIH
-PA Author Manuscript
NIH
-PA Author Manuscript
Comings DE, Gade R, Wu S, Chiu C, Dietz G, Muhleman D, Saucier G, Ferry L, Rosenthal RJ,Lesieur HR, Rugle LJ, MacMurray P. Studies of the potential role of the dopamine D1 receptorgene in addictive behaviors. Mol Psychiatry. 1997; 2:44–56. [PubMed: 9154217]
Devlin B, Roeder K, Wasserman L. Genomic control, a new approach to genetic-based associationstudies. Theor Popul Biol. 2001; 60:155–166. [PubMed: 11855950]
Enoch MA, Shen PH, Xu K, Hodgkinson C, Goldman D. Using ancestry-informative markers todefine populations and detect population stratification. J Psychopharmacol. 2006; 20:19–26.[PubMed: 16785266]
Gabriel SB, Schaffner SF, Nguyen H, Moore JM, Roy J, Blumenstiel B, Higgins J, DeFelice M,Lochner A, Faggart M, Liu-Cordero SN, Rotimi C, Adeyemo A, Cooper R, Ward R, Lander ES,Daly MJ, Altshuler D. The structure of haplotype blocks in the human genome. Science. 2002;296:2225–2229. [PubMed: 12029063]
Guthery SL, Salisbury BA, Pungliya MS, Stephens JC, Bamshad M. The structure of common geneticvariation in United States populations. Am J Hum Genet. 2007; 81:1221–1231. [PubMed:17999361]
Hodgkinson CA, Yuan Q, Xu K, Shen PH, Heinz E, Lobos EA, Binder EB, Cubells J, Ehlers CL,Gelernter J, Mann J, Riley B, Roy A, Tabakoff B, Todd RD, Zhou Z, Goldman D. Addictionsbiology: haplotype-based analysis for 130 candidate genes on a single array. Alcohol Alcohol.2008; 43:505–515. [PubMed: 18477577]
Huang W, Ma JZ, Payne TJ, Beuten J, Dupont RT, Li MD. Significant association of DRD1 withnicotine dependence. Hum Genet. 2008; 123:133–140. [PubMed: 18092181]
Itokawa M, Yamada K, Yoshitsugu K, Toyota T, Suga T, Ohba H, Watanabe A, Hattori E, Shimizu H,Kumakura T, Ebihara M, Meerabux JM, Toru M, Yoshikawa T. A microsatellite repeat in thepromoter of the N-methyl-D-aspartate receptor 2A subunit (GRIN2A) gene suppressestranscriptional activity and correlates with chronic outcome in schizophrenia. Pharmacogenetics.2003; 13:271–278. [PubMed: 12724619]
Kellogg SH, McHugh PF, Bell K, Schluger JH, Schluger RP, LaForge KS, Ho A, Kreek MJ. TheKreek-McHugh-Schluger-Kellogg scale: a new, rapid method for quantifying substance abuse andits possible applications. Drug Alcohol Depend. 2003; 69:137–150. [PubMed: 12609695]
Kim DJ, Park BL, Yoon S, Lee HK, Joe KH, Cheon YH, Gwon DH, Cho SN, Lee HW, NamGung S,Shin HD. 5' UTR polymorphism of dopamine receptor D1 (DRD1) associated with severity andtemperament of alcoholism. Biochem Biophys Res Commun. 2007; 357:1135–1141. [PubMed:17466946]
Kindlundh-Hogberg AM, Blomqvist A, Malki R, Schioth HB. Extensive neuroadaptive changes incortical gene-transcript expressions of the glutamate system in response to repeated intermittentMDMA administration in adolescent rats. BMC Neurosci. 2008; 9:39. [PubMed: 18419818]
Knafo A, Israel S, Darvasi A, Bachner-Melman R, Uzefovsky F, Cohen L, Feldman E, Lerer E, LaibaE, Raz Y, Nemanov L, Gritsenko I, Dina C, Agam G, Dean B, Bornstein G, Ebstein RP. Individualdifferences in allocation of funds in the dictator game associated with length of the argininevasopressin 1a receptor RS3 promoter region and correlation between RS3 length andhippocampal mRNA. Genes Brain Behav. 2008; 7:266–275. [PubMed: 17696996]
Koob GF. Drugs of abuse: anatomy, pharmacology and function of reward pathways. TrendsPharmacol Sci. 1992; 13:177–184. [PubMed: 1604710]
Kreek MJ, Nielsen DA, Butelman ER, LaForge KS. Genetic influences on impulsivity, risk taking,stress responsivity and vulnerability to drug abuse and addiction. Nat Neurosci. 2005; 8:1450–1457. [PubMed: 16251987]
Lappalainen J, Krupitsky E, Kranzler HR, Luo X, Remizov M, Pchelina S, Taraskina A, Zvartau E,Rasanen P, Makikyro T, Somberg LK, Krystal JH, Stein MB, Gelernter J. Mutation screen of theGAD2 gene and association study of alcoholism in three populations. Am J Med Genet BNeuropsychiatr Genet. 2007; 144:183–192. [PubMed: 17034009]
Levran O, Londono D, O'Hara K, Nielsen DA, Peles E, Rotrosen J, Casadonte P, Linzy S, Randesi M,Ott J, Adelson M, Kreek MJ. Genetic susceptibility to heroin addiction; a candidate-geneassociation study. Genes Brain Behav. 2008; 7:720–729. [PubMed: 18518925]
Levran et al. Page 9
Genes Brain Behav. Author manuscript; available in PMC 2010 July 1.
NIH
-PA Author Manuscript
NIH
-PA Author Manuscript
NIH
-PA Author Manuscript
Limosin F, Loze JY, Rouillon F, Ades J, Gorwood P. Association between dopamine receptor D1 geneDdeI polymorphism and sensation seeking in alcohol-dependent men. Alcohol Clin Exp Res.2003; 27:1226–1228. [PubMed: 12966314]
Liu X, Li Y, Zhou L, Chen H, Su Z, Hao W. Conditioned place preference associates with the mRNAexpression of diazepam binding inhibitor in brain regions of the addicted rat during withdrawal.Brain Res Mol Brain Res. 2005; 137:47–54. [PubMed: 15950760]
Loh el W, Lane HY, Chen CH, Chang PS, Ku LW, Wang KH, Cheng AT. Glutamate decarboxylasegenes and alcoholism in Han Taiwanese men. Alcohol Clin Exp Res. 2006; 30:1817–1823.[PubMed: 17067345]
Loh EW, Tang NL, Lee DT, Liu SI, Stadlin A. Association analysis of GABA receptor subunit geneson 5q33 with heroin dependence in a Chinese male population. Am J Med Genet B NeuropsychiatrGenet. 2007; 144:439–443. [PubMed: 17440936]
Lohmueller KE, Mauney MM, Reich D, Braverman JM. Variants associated with common disease arenot unusually differentiated in frequency across populations. Am J Hum Genet. 2006; 78:130–136.[PubMed: 16385456]
Luo X, Kranzler HR, Zuo L, Wang S, Blumberg HP, Gelernter J. CHRM2 gene predisposes to alcoholdependence, drug dependence and affective disorders: results from an extended case-controlstructured association study. Hum Mol Genet. 2005; 14:2421–2434. [PubMed: 16000316]
Luo X, Kranzler HR, Zuo L, Wang S, Schork NJ, Gelernter J. Diplotype trend regression analysis ofthe ADH gene cluster and the ALDH2 gene: multiple significant associations with alcoholdependence. Am J Hum Genet. 2006; 78:973–987. [PubMed: 16685648]
Luo X, Kranzler HR, Zuo L, Wang S, Schork NJ, Gelernter J. Multiple ADH genes modulate risk fordrug dependence in both African-and European-Americans. Hum Mol Genet. 2007a; 16:380–390.[PubMed: 17185388]
Luo X, Kranzler HR, Zuo L, Zhang H, Wang S, Gelernter J. ADH7 variation modulates extraversionand conscientiousness in substance-dependent subjects. Am J Med Genet B Neuropsychiatr Genet.2007b; 147B:179–186. [PubMed: 17918242]
McLellan AT, Kushner H, Metzger D, Peters R, Smith I, Grissom G, Pettinati H, Argeriou M. TheFifth Edition of the Addiction Severity Index. J Subst Abuse Treat. 1992; 9:199–213. [PubMed:1334156]
Meyer-Lindenberg A, Kolachana B, Gold B, Olsh A, Nicodemus KK, Mattay V, Dean M, WeinbergerDR. Genetic variants in AVPR1A linked to autism predict amygdala activation and personalitytraits in healthy humans. Mol Psychiatry. 2008 Epub ahead of print.
Nielsen DA, Barral S, Proudnikov D, Kellogg S, Ho A, Ott J, Kreek MJ. TPH2 and TPH1: associationof variants and interactions with heroin addiction. Behav Genet. 2008; 38:133–150. [PubMed:18181017]
Paoletti P, Neyton J. NMDA receptor subunits: function and pharmacology. Curr Opin Pharmacol.2007; 7:39–47. [PubMed: 17088105]
Pritchard JK, Stephens M, Donnelly P. Inference of population structure using multilocus genotypedata. Genetics. 2000; 155:945–959. [PubMed: 10835412]
Proudnikov D, Hamon S, Ott J, Kreek MJ. Association of polymorphisms in the melanocortin receptortype 2 (MC2R, ACTH receptor) gene with heroin addiction. Neurosci Lett. 2008; 435:234–239.[PubMed: 18359160]
Proudnikov D, LaForge KS, Hofflich H, Levenstien M, Gordon D, Barral S, Ott J, Kreek MJ.Association analysis of polymorphisms in serotonin 1B receptor (HTR1B) gene with heroinaddiction: a comparison of molecular and statistically estimated haplotypes. PharmacogenetGenomics. 2006; 16:25–36. [PubMed: 16344719]
Reiner AP, Ziv E, Lind DL, Nievergelt CM, Schork NJ, Cummings SR, Phong A, Burchard EG, HarrisTB, Psaty BM, Kwok PY. Population structure, admixture, and aging-related phenotypes inAfrican American adults: the Cardiovascular Health Study. Am J Hum Genet. 2005; 76:463–477.[PubMed: 15660291]
Storey JD. The positive false discovery rate: a Bayesian interpretation and the q-value. Ann. Statist.2003; 31:2013–2035.
Levran et al. Page 10
Genes Brain Behav. Author manuscript; available in PMC 2010 July 1.
NIH
-PA Author Manuscript
NIH
-PA Author Manuscript
NIH
-PA Author Manuscript
Storey JD, Tibshirani R. Statistical significance for genomewide studies. Proc Natl Acad Sci U S A.2003; 100:9440–9445. [PubMed: 12883005]
Szilagyi A, Boor K, Szekely A, Gaszner P, Kalasz H, Sasvari-Szekely M, Barta C. Combined effect ofpromoter polymorphisms in the dopamine D4 receptor and the serotonin transporter genes inheroin dependence. Neuropsychopharmacol Hung. 2005; 7:28–33. [PubMed: 16167465]
Tang J, Chen X, Xu X, Wu R, Zhao J, Hu Z, Xia K. Significant linkage and association between afunctional (GT)n polymorphism in promoter of the N-methyl-D-aspartate receptor subunit gene(GRIN2A) and schizophrenia. Neurosci Lett. 2006; 409:80–82. [PubMed: 17011703]
Tate SK, Goldstein DB. Will tomorrow's medicines work for everyone? Nat Genet. 2004; 36:S34–42.[PubMed: 15508001]
The International HapMap Consortium. The International HapMap Project. Nature. 2003; 426:789–796. [PubMed: 14685227]
Thoeringer CK, Binder EB, Salyakina D, Erhardt A, Ising M, Unschuld PG, Kern N, Lucae S, BruecklTM, Mueller MB, Fuchs B, Puetz B, Lieb R, Uhr M, Holsboer F, Mueller-Myhsok B, Keck ME.Association of a Met88Val diazepam binding inhibitor (DBI) gene polymorphism and anxietydisorders with panic attacks. J Psychiatr Res. 2007; 41:579–584. [PubMed: 16904689]
Tsuang MT, Lyons MJ, Eisen SA, Goldberg J, True W, Lin N, Meyer JM, Toomey R, Faraone SV,Eaves L. Genetic influences on DSM-III-R drug abuse and dependence: a study of 3,372 twinpairs. Am J Med Genet. 1996; 67:473–477. [PubMed: 8886164]
Turic D, Langley K, Mills S, Stephens M, Lawson D, Govan C, Williams N, Van Den Bree M,Craddock N, Kent L, Owen M, O'Donovan M, Thapar A. Follow-up of genetic linkage findings onchromosome 16p13: evidence of association of N-methyl-D aspartate glutamate receptor 2A genepolymorphism with ADHD. Mol Psychiatry. 2004; 9:169–173. [PubMed: 14966475]
Waga C, Ikeda K, Iwahashi K. The relationship between alcoholism and DBI gene polymorphism inJapanese--genotyping of the +529A/T in DBI gene polymorphism based on PCR. Nihon ArukoruYakubutsu Igakkai Zasshi. 2007; 42:629–634. [PubMed: 18240651]
Wassink TH, Piven J, Vieland VJ, Pietila J, Goedken RJ, Folstein SE, Sheffield VC. Examination ofAVPR1a as an autism susceptibility gene. Mol Psychiatry. 2004; 9:968–972. [PubMed: 15098001]
Watanabe M, Inoue Y, Sakimura K, Mishina M. Distinct spatio-temporal distributions of the NMDAreceptor channel subunit mRNAs in the brain. Ann N Y Acad Sci. 1993; 707:463–466. [PubMed:9137596]
Xu K, Lichtermann D, Lipsky RH, Franke P, Liu X, Hu Y, Cao L, Schwab SG, Wildenauer DB, BauCH, Ferro E, Astor W, Finch T, Terry J, Taubman J, Maier W, Goldman D. Association ofspecific haplotypes of D2 dopamine receptor gene with vulnerability to heroin dependence in 2distinct populations. Arch Gen Psychiatry. 2004; 61:597–606. [PubMed: 15184239]
Zou Y, Liao G, Liu Y, Wang Y, Yang Z, Lin Y, Shen Y, Li S, Xiao J, Guo H, Wan C, Wang Z.Association of the 54-nucleotide repeat polymorphism of hPer3 with heroin dependence in HanChinese population. Genes Brain Behav. 2007; 7:26–30. [PubMed: 17451453]
Zuo L, Kranzler HR, Luo X, Covault J, Gelernter J. CNR1 Variation Modulates Risk for Drug andAlcohol Dependence. Biol Psychiatry. 2007; 62:616–626. [PubMed: 17509535]
Levran et al. Page 11
Genes Brain Behav. Author manuscript; available in PMC 2010 July 1.
NIH
-PA Author Manuscript
NIH
-PA Author Manuscript
NIH
-PA Author Manuscript
Figure 1.LD maps of six genes in AA controls.The pair-wise correlation between SNPs was measured as D' and is shown (×100) in eachbox. The color scheme indicates the magnitude of D'. Dark red indicated D'>0.80 withD'=1.0 when no number is given. Haplotypes were generated using block definitions of thesolid spine of LD (a-b) and Gabriel (c-f), and haplotype blocks are marked. (a) DBI (b)HTR3A (c) GAD1 (d) DRD1 (e) GRIN2A (f) ADH7.
Levran et al. Page 12
Genes Brain Behav. Author manuscript; available in PMC 2010 July 1.
NIH
-PA Author Manuscript
NIH
-PA Author Manuscript
NIH
-PA Author Manuscript
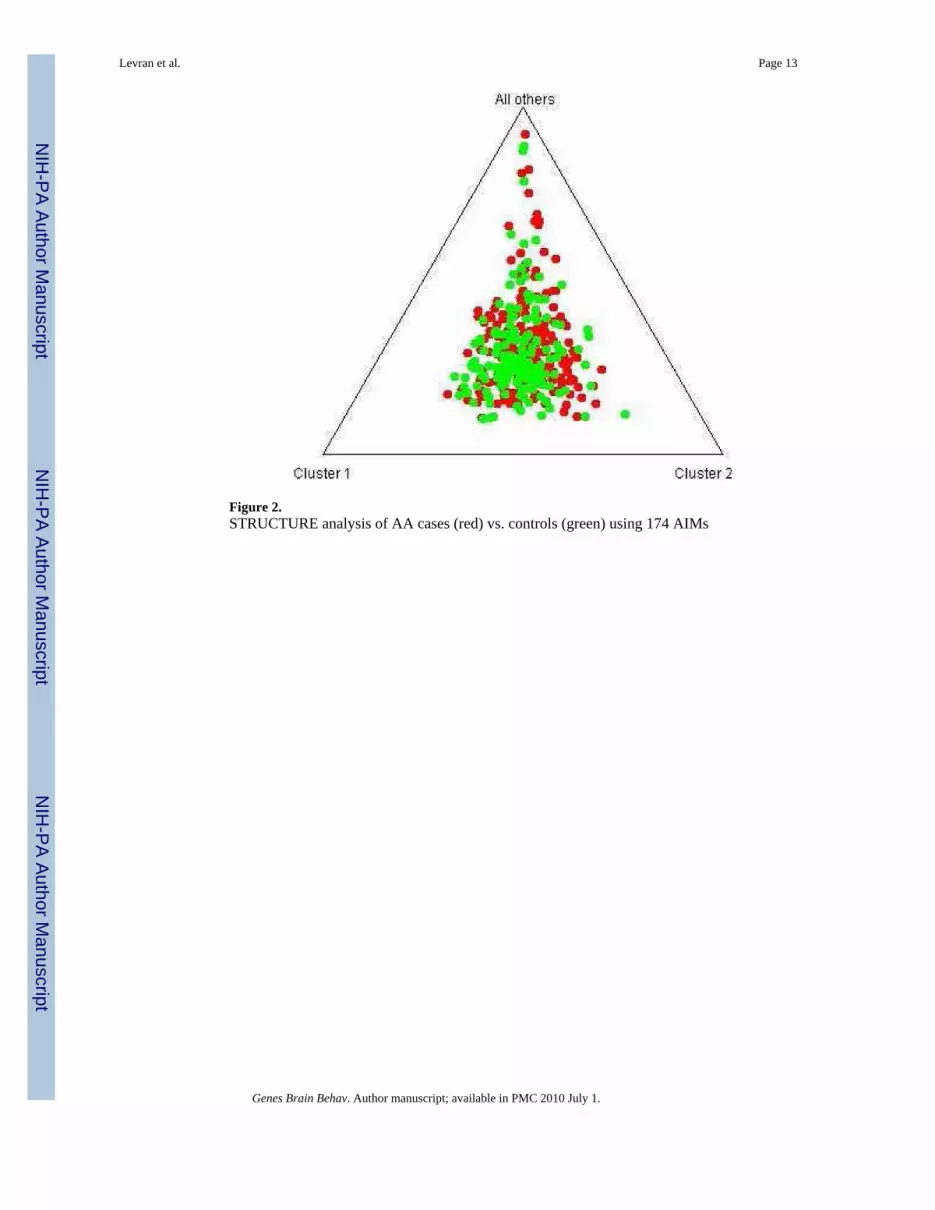
Figure 2.STRUCTURE analysis of AA cases (red) vs. controls (green) using 174 AIMs
Levran et al. Page 13
Genes Brain Behav. Author manuscript; available in PMC 2010 July 1.
NIH
-PA Author Manuscript
NIH
-PA Author Manuscript
NIH
-PA Author Manuscript
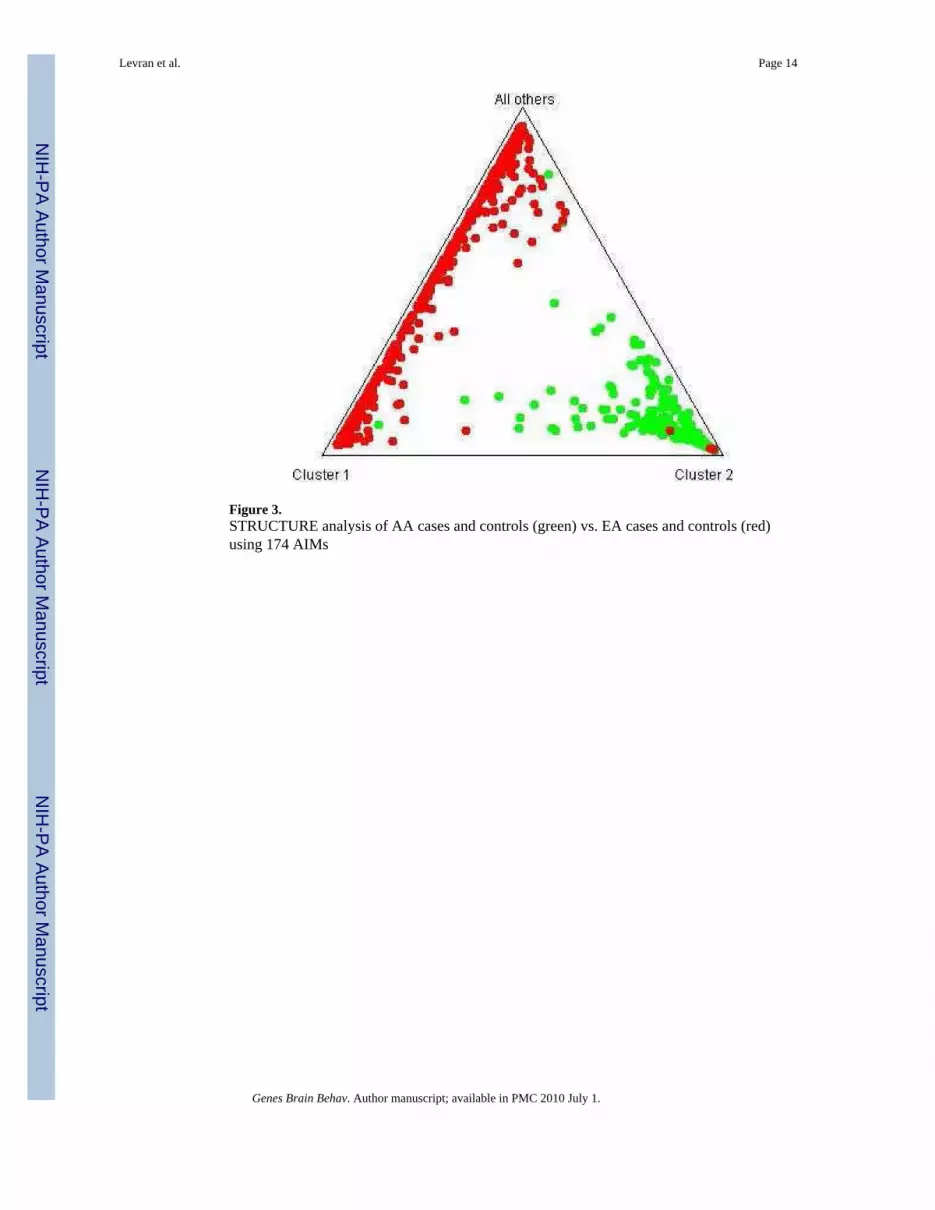
Figure 3.STRUCTURE analysis of AA cases and controls (green) vs. EA cases and controls (red)using 174 AIMs
Levran et al. Page 14
Genes Brain Behav. Author manuscript; available in PMC 2010 July 1.
NIH
-PA Author Manuscript
NIH
-PA Author Manuscript
NIH
-PA Author Manuscript
NIH
-PA Author Manuscript
NIH
-PA Author Manuscript
NIH
-PA Author Manuscript
Levran et al. Page 15
Tabl
e 1
SNPs
info
rmat
ion
SNP
Gen
e Sy
mbo
lPr
otei
nG
ene
loca
tion
Chr
.Po
sitio
na
rs48
6179
ADRA
1AA
dren
ergi
c re
cept
or, a
lpha
1A
5' n
ear g
enee
826
7798
51
rs37
5929
2AV
PR1A
Arg
inin
e va
sopr
essi
n 1A
rece
ptor
5' n
ear g
enef
1261
8335
80
rs97
1074
ADH
7A
lcoh
ol d
ehyd
roge
nase
7Ex
on 6
(R23
0)4
1005
6088
4
rs23
5078
0C
HRM
2C
holin
ergi
c re
cept
or, m
usca
rinic
2IV
S3+3
8804
713
6243
509
rs22
8994
8D
BID
iaze
pam
bin
ding
inhi
bito
r3'
nea
r gen
ed2
1198
4666
8
rs12
6131
35D
BID
iaze
pam
bin
ding
inhi
bito
rIV
S1+1
672
211
9838
810
rs53
26D
RD1
Dop
amin
e D
(1) r
ecep
tor
5' U
TRb
517
4802
802
rs71
6522
4G
ABRB
3G
AB
A-A
rece
ptor
subu
nit b
eta
35'
nea
r gen
ec5
2457
5429
rs20
5872
5G
AD1
Glu
tam
ic a
cid
deca
rbox
ylas
e1IV
S5+2
419
217
1398
367
rs81
9064
6G
AD2
Glu
tam
ic a
cid
deca
rbox
ylas
e 2
IVS7
+180
110
2656
0513
rs16
5042
0G
RIN
2AG
luta
mat
e re
cept
or 2
AIV
S3+5
525
1610
1758
31
rs45
8797
6G
RIN
2AG
luta
mat
e re
cept
or 2
AIV
S3+1
7720
1610
1636
36
rs64
9773
0G
RIN
2AG
luta
mat
e re
cept
or 2
AIV
S3+2
8185
1610
1531
71
rs10
7048
7G
RIN
2AG
luta
mat
e re
cept
or 2
AIV
S3+3
7863
1610
1434
93
rs11
7672
4H
TR3A
Sero
toni
n re
cept
or 3
AIV
S1-6
9311
1133
5301
0
rs89
7687
HTR
3ASe
roto
nin
rece
ptor
3A
IVS5
-926
111
3361
021
rs73
1780
SLC
29A1
Solu
te c
arrie
r fam
ily 2
9 m
embe
r 1IV
S1-1
294
644
3016
84
Abb
revi
atio
ns: S
NPs
, sin
gle
nucl
eotid
e po
lym
orph
ism
s; C
hr, c
hrom
osom
e; T
SS, t
rans
crip
tion
star
t site
; UTR
, unt
rans
late
d re
gion
; IV
S, in
terv
enin
g se
quen
ces.
SNPs
are
sorte
d by
gen
e sy
mbo
ls.
a NC
BI B
uild
36.
2.
b Exon
2, -
94 fr
om th
e tra
nsla
tion
initi
atio
n si
te.
c -540
9 fr
om T
SS.
d +303
from
the
stop
cod
on.
e -101
2 fr
om T
SS.
f -723
from
TSS
.
Genes Brain Behav. Author manuscript; available in PMC 2010 July 1.
NIH
-PA Author Manuscript
NIH
-PA Author Manuscript
NIH
-PA Author Manuscript
Levran et al. Page 16
Tabl
e 2
The
mos
t sig
nific
ant a
ssoc
iatio
ns o
f sin
gle
SNPs
with
her
oin
addi
ctio
n
SNP
Gen
e Sy
mbo
lH
WE
1A
llele
test
Gen
otyp
e te
st
P va
lue
OR
(95%
CI)
P va
lue
rs48
6179
ADRA
1A0.
680.
0077
1.56
(1.1
1, 2
.18)
0.02
51
rs37
5929
2AV
PR1A
1.00
0.00
830.
16 (0
.00,
0.7
6)0.
0079
rs97
1074
ADH
70.
180.
0035
1.94
(1.2
2, 3
.14)
0.00
11
rs23
5078
0C
HRM
21.
000.
0066
1.61
(1.1
3, 2
.30)
0.02
05
rs22
8994
8D
BI0.
660.
0053
1.86
(1.1
8, 3
.00)
0.01
56
rs12
6131
35D
BI0.
250.
0077
1.54
(1.1
1, 2
.13)
0.01
81
rs53
26D
RD1
1.00
0.00
291.
94 (1
.23,
3.1
2)0.
0108
rs71
6522
4G
ABRB
31.
000.
0057
1.64
(1.1
4, 2
.36)
0.00
90
rs20
5872
5G
AD1
0.03
0.00
740.
66 (0
.47,
0.9
0)0.
0050
rs81
9064
6G
AD2
0.41
0.00
661.
81 (1
.16,
2.8
7)0.
0363
rs16
5042
0G
RIN
2A0.
530.
0006
1.68
(1.2
4, 2
.27)
0.00
09
rs45
8797
6G
RIN
2A0.
220.
0039
1.56
(1.1
4, 2
.14)
0.00
90
rs64
9773
0G
RIN
2A0.
010.
0015
0.62
(0.4
5, 0
.84)
0.00
25
rs10
7048
7G
RIN
2A0.
280.
0022
1.58
(1.1
7, 2
.15)
0.00
46
rs11
7672
4H
TR3A
1.00
0.00
480.
64 (0
.47,
0.8
8)0.
0170
rs89
7687
HTR
3A1.
000.
0075
0.65
(0.4
7, 0
.90)
0.02
65
rs73
1780
SLC
29A1
0.47
0.00
060.
38 (0
.21,
0.6
9)0.
0004
SNPs
are
sorte
d by
gen
e sy
mbo
ls.
1 Unc
orre
cted
Exa
ct te
st v
alue
s for
dev
iatio
n fr
om H
ardy
-Wei
nber
g Pr
opor
tions
in th
e co
ntro
l sam
ple.
Genes Brain Behav. Author manuscript; available in PMC 2010 July 1.
NIH
-PA Author Manuscript
NIH
-PA Author Manuscript
NIH
-PA Author Manuscript
Levran et al. Page 17
Table 3
Haplotype association tests
SNPs Gene Haplotype P-value Effect
rs4587976-rs1071502-rs1366076 GRIN2A GAT 0.000096 protective
rs4587976-rs1071502-rs1366076 GRIN2A CAT 0.0036 risk
rs2241164-rs2058725-rs701492-rs3791850-rs7578661 GAD1 AGGGG 0.00063 protective
rs686-rs5326 DRD1 AA 0.0021 risk
rs1154460-rs971074-rs1154470 ADH7 AAG 0.0029 risk
rs1176724-rs2276302-rs3737457-rs897687 HTR3A TGGGa 0.0055 protective
rs12613135-rs2244135-rs8192506-rs2289948 DBI GGAGa 0.0077 risk
Abbreviation: SNPs, single nucleotide polymorphisms;
aSolid spine of LD; SNPs that with P values<0.01 in the single SNP association analysis (Tables 1 and 2) are in bold.
Genes Brain Behav. Author manuscript; available in PMC 2010 July 1.
NIH
-PA Author Manuscript
NIH
-PA Author Manuscript
NIH
-PA Author Manuscript
Levran et al. Page 18
Tabl
e 4
Diff
eren
ces i
n al
lele
freq
uenc
ies b
etw
een
Afr
ican
Am
eric
an a
nd E
urop
ean
Am
eric
an c
ontro
ls
SNP
Gen
eA
llele
sM
AF
P va
luea
Hap
Map
MA
F
AA
EA
bY
RIc
CE
Ud
AA st
udy
rs48
6179
ADRA
1AA
/G0.
250.
042.
5E-1
70.
360.
03
rs37
5929
2AV
PR1A
G/A
0.03
0.01
ns0.
030.
00
rs97
1074
ADH
7A
/G0.
100.
152.
3E-0
20.
100.
09
rs23
5078
0C
HRM
2G
/A0.
210.
361.
3E-0
50.
290.
37
rs22
8994
8D
BIG
/C0.
100.
161.
9E-0
20.
120.
21
rs12
6131
35D
BIG
/A0.
290.
27ns
0.32
0.33
rs53
26D
RD1
A/G
0.10
0.13
ns0.
160.
13
rs71
6522
4G
ABRB
3A
/G0.
190.
067.
0E-0
80.
270.
03
rs20
5872
5G
AD1
G/A
0.39
0.27
9.5E
-04
0.31
0.19
rs81
9064
6G
AD2
G/A
0.11
0.08
ns0.
190.
13
rs16
5042
0G
RIN
2AG
/A0.
450.
62e
3.5E
-06
0.48
0.72
e
rs45
8797
6G
RIN
2AC
/G0.
330.
436.
5E-0
30.
360.
41
rs64
9773
0G
RIN
2AG
/A0.
470.
59e
1.4E
-03
0.30
0.59
e
rs10
7048
7G
RIN
2AA
/G0.
490.
60e
2.2E
-02
0.37
0.59
e
rs11
7672
4H
TR3A
T/A
0.39
0.02
4.9E
-41
0.37
0.00
rs89
7687
HTR
3AG
/A0.
390.
022.
0E-4
00.
400.
00
rs73
1780
SLC
29A1
C/G
0.12
0.00
7.9E
-13
0.06
0
EA
stud
y b
rs15
3489
1C
SNK
1EA
/G0.
030.
201.
1E-1
20.
040.
10
rs69
4066
GAL
A/G
0.32
0.06
1.7E
-18
0.32
0.06
rs37
5898
7H
TR3B
G/A
0.41
0.23
6.2E
-07
0.47
0.23
rs22
3686
1O
PRD
1A
/G0.
100.
203.
1E-0
.40.
050.
18
rs22
3685
7O
PRD
1G
/A0.
340.
251.
2E-0
20.
350.
23
rs37
6695
1O
PRD
1G
/A0.
380.
303.
1E-0
20.
430.
31
rs37
7815
1O
PRM
1G
/A0.
310.
135.
6E-0
90.
270.
16
Genes Brain Behav. Author manuscript; available in PMC 2010 July 1.
NIH
-PA Author Manuscript
NIH
-PA Author Manuscript
NIH
-PA Author Manuscript
Levran et al. Page 19
SNP
Gen
eA
llele
sM
AF
P va
luea
Hap
Map
MA
F
AA
EA
bY
RIc
CE
Ud
rs64
7379
7O
PRK
1A
/G0.
350.
66e
1.8E
-16
0.30
0.82
e
rs51
0769
OPR
M1
A/G
0.23
0.21
ns0.
220.
23
Abb
revi
atio
ns: M
AF,
min
or a
llele
freq
uenc
y. A
A, A
fric
an A
mer
ican
, EA
, Eur
opea
n A
mer
ican
. ns,
not s
igni
fican
t (un
corr
ecte
d p
>0.0
5). S
NPs
are
list
ed in
the
orde
r of P
val
ues i
n ea
ch st
udy.
a Fish
er e
xact
test
unc
orre
cted
P v
alue
.).
b Levr
an e
t al.
2008
.
c Popu
latio
n fr
om Y
orub
a, N
iger
ia.
d Uta
h re
side
nts w
ith N
orth
ern
and
Wes
tern
Eur
opea
n an
cest
ry
e In th
is c
ase,
the
min
or a
llele
in A
A is
the
maj
or a
llele
in E
A. N
umbe
rs in
bol
d ar
e si
gnifi
cant
afte
r cor
rect
ion
for m
ultip
le te
stin
g (P
<4.
5E-5
).
Genes Brain Behav. Author manuscript; available in PMC 2010 July 1.