helder novais e bastos identification of human and pathogen
TRANSCRIPT

Universidade do MinhoEscola de Medicina
Helder Novais e Bastos
Identification of human and pathogen molecular variants associated to tuberculosis heterogeneity Identificação de variantes moleculares do humano e patogénio associados à heterogeneidade da tuberculose
Tese de DoutoramentoMedicina
Trabalho efectuado sob a orientação de
Doutora Margarida SaraivaInvestigadora Principal do Instituto de Biologia Molecular e CelularUniversidade do Porto, Porto, Portugal
Doutor Rui Manuel Rosário Sarmento e CastroProfessor Catedrático Convidado da Escola de MedicinaUniversidade do Minho, Braga, Portugal
Abril de 2017
ii
DECLARAÇÃO
Nome: Helder Novais e Bastos
Endereço eletrónico: [email protected]
Telefone: +351 962250784
Número de Cartão do Cidadão: 12585975
Título da dissertação:
Identification of human and pathogen molecular variants associated to
tuberculosis heterogeneity
Identificação de variantes moleculares do humano e patogénio associados à
heterogeneidade da tuberculose
Orientadores:
Doutora Margarida Saraiva
Doutor Rui Manuel Rosario Sarmento e Castro
Ano de conclusão: 2017
Designação Ramo de Conhecimento: Medicina
É AUTORIZADA A REPRODUCÃO INTEGRAL DESTA TESE APENAS PARA EFEITOS
DE INVESTIGACÃO, MEDIANTE DECLARACÃO ESCRITA DO INTERESSADO, QUE A
TAL SE COMPROMETE.
Universidade do Minho, 19 de Abril de 2017
_____________________________
Helder Novais e Bastos

iii
STATEMENT OF INTEGRITY
I hereby declare having conducted my thesis with integrity. I confirm that I have
not used plagiarism or any form of falsification of results in the process of the
thesis elaboration.
I further declare that I have fully acknowledged the Code of Ethical Conduct of
the University of Minho.
University of Minho, April 2017
Full name: HELDER NOVAIS E BASTOS
Signature:
iv
FINANCIAMENTO | FUNDING
The work presented in this dissertation was
performed in the Microbiology and Infection
Research Domain of the Life and Health Sciences
Research Institute (ICVS), School of Medicine,
University of Minho, Braga, Portugal (ICVS/3B’s –
PT Government Associate Laboratory,
Braga/Guimarães, Portugal); in Centro Hospitalar
São João, Porto, Portugal; and at the Institute for
Molecular and Cell Biology (IBMC), University of
Porto, Portugal. The financial support was
provided by Fundação Amélia de Mello/José de
Mello Saúde, Sociedade Portuguesa de
Pneumologia (SPP) and by a Research Grant
from the European Society for Clinical and
Infectious Diseases (ESCMID). The study was
cofunded by Programa Operacional Regional do
Norte (ON.2 – O Novo Norte), Quadro de
Referência Estratégico Nacional (QREN), through
the Fundo Europeu de Desenvolvimento Regional
(FEDER).

v
À Teresa, meu pilar de serenidade, que me deu a força para ultrapassar
os momentos em que senti não ser capaz, pela sua paciência e
compreensão pelo alheamento físico ou mental nos momentos
irrepetíveis da nossa vida conjunta. À Sara e à pequena Sofia, que me
trouxeram uma nova perspectiva sobre o homem que quero ser.

vi

vii
AGRADECIMENTOS | ACKNOWLEDGMENTS
A Medicina não é uma ciência exacta, mas usurpa o saber dessas
disciplinas de precisão para o transformar num exercício de arte. Aprender a
caminhar neste ténue equilíbrio entre o saber (ciência) e o saber fazer (arte) é
geralmente um processo longo, mas eu estava disposto a tentar fazê-lo no mais
curto espaço de tempo possível. Foi fruto da inquietação que me foi incutida por
antigos mestres da faculdade, como o Prof. Doutor José Rueff ou Prof. Doutor
Jorge Gaspar, que me acolheram na sua equipa no Departamento de Genética e
apostaram no meu atrevimento de querer investigar, independentemente da
minha classificação nessa cadeira. Foi também por influência dos meus pais, em
especial minha mãe, de espírito lutador, cujo papel foi crucial no meu
desenvolvimento escolar e intelectual.
Durante os últimos anos de trabalho que conduziram a esta tese, cruzei-
me com inúmeras pessoas, que de forma mais directa ou indirecta, com
generosidade me apoiaram na concretização do projecto nas suas mais diversas
etapas. A todos lhes estou reconhecido, mas há um grupo particular de amigos
que quero destacar.
Em primeiro lugar à minha orientadora, Doutora Margarida Saraiva, a
quem devo a concretização desta tese, por ter confiado nas minhas
competências, por saber organizar e estimular o trabalho. Retribuo-lhe com a
forte amizade que consolidámos ao longo destes anos.
Ao Prof. Doutor Gil Castro, que foi uma peça fundamental em todo o
projecto, fico-lhe grato por ter partilhado comigo o seu fascínio pela ciência e por
me alertar a retirar prazer de tudo quanto fiz. A sua experiência científica e
humana foi central para amenizar o desassossego de quem esperava
ansiosamente por resultados.
Pela sua disponibilidade e enriquecedoras discussões científicas, agradeço
aos Professores Fernando Rodrigues, Nuno Osório e Patrício Costa. Recordarei
com saudade as reuniões em que todos participávamos, cada um com a sua
perspectiva, mostrando que a ciência não se faz na individualidade, é um trabalho

viii
colectivo e multidisciplinar. Foi essa partilha que tornou este processo ainda mais
entusiasmante.
Graças à sua visão, ao criar e manter um banco de amostras
microbiológicas, o Prof. Doutor João Tiago Guimarães providenciou um alicerce
ímpar para estudar a tuberculose em Portugal. Pelos seus importantes
contributos no desenho e concretização do projecto, agradeço à Dr.ª Teresa
Carvalho e Dr.ª Angélica Ramos, que colaboraram com brio em todas as tarefas
designadas.
Um apreço especial aos meus colegas de laboratório Jeremy Sousa,
Henrique Machado, Filipa Cardoso, Joana Gaifém e Isabel Veiga, com quem
partilhei as grandes alegrias da descoberta.
Agradeço ao Prof. Doutor Rui Sarmento e Castro pelo seu apoio e
orientação, essencial nas primeiras etapas de definição do projecto de tese e de
conciliação com o internato médico.
Ao Prof. Doutor Agostinho Marques devo o reconhecimento por ter
acarinhado a minha intenção de conciliar a formação médica no seu Serviço,
com a frequência de um programa doutoral numa instituição diferente. Apoiou-
me também na aquisição do estatuto de interno-doutorando e na possibilidade
de suspender o internato médico para me dedicar à investigação. Esse foi um
passo determinante na prossecução do projecto.
Agradeço à Prof. Doutora Cecília Leão pelo seu voto de confiança ao
permitir a continuidade dos meus estudos doutorais, após sucessivos
adiamentos.
Agradeço ao Prof. Jorge Pedrosa por me ter estimulado a iniciar um
projecto de investigação no âmbito do programa doutoral em Medicina e pelo
seu apoio institucional enquanto Director do ICVS.
Por último, Teresa, a quem dedico esta tese, por demasiadas vezes
suportou sozinha as responsabilidades familiares, mesmo quando o meu papel
deveria ser insubstituível. As minhas palavras de agradecimento cabem na
dedicatória.
ix
IDENTIFICATION OF HUMAN AND PATHOGEN MOLECULAR VARIANTS ASSOCIATED TO TUBERCULOSIS HETEROGENEITY
ABSTRACT
Tuberculosis (TB) imposes high human and economic tolls. One of the
most striking features of TB is the variability of infection outcomes, which has
been classically attributed to environmental and host determinants. More
recently, studies uncovering Mycobacterium tuberculosis complex (MTBC)
genomic diversity have shown the potential importance of pathogen-related
factors to the disease pathogenesis. We approached this question from different
angles, by combining the study of the pathogen properties, the host immune
response and the clinical features of TB, within a cohort of 681 culture-confirmed
pulmonary TB (PTB) cases diagnosed at the Hospital de São João, a major
healthcare center in Porto, Portugal, between 2007 and 2013.
We started by developing a severity assessment tool for stratifying
mortality risk in PTB patients. Five risk features were selected for the prediction
model: hypoxemic respiratory failure (OR 4.7, 95% CI 2.8-7.9), age ≥50 years (OR
2.9, 95% CI 1.7-4.8), bilateral lung involvement (OR 2.5, 95% CI 1.4-4.4), ≥1
significant comorbidity – HIV infection, diabetes mellitus, liver failure or cirrhosis,
congestive heart failure and chronic respiratory disease – (OR 2.3, 95% CI 1.3-
3.8), and hemoglobin <12 g/dL (OR 1.8, 95% CI 1.1-3.1). A TB risk assessment
tool (TReAT) was developed, stratifying patients with low (score ≤2), moderate
(score 3-5) and high (score ≥6) mortality risk. The mortality associated with each
group was 2.9%, 22.9% and 53.9%, respectively. The model performed equally
well in the validation cohort.
After focusing on the host clinical prognostic predictors, in the second part
of the project we assessed the impact of M. tuberculosis diversity on the disease
clinical severity. We started by developing a clinical decision tree to classify the
severity of the disease and by applying it to a selected group of 133 individuals
that in our cohort did not present known predictor or precipitator TB factors. We
found that, for this group of patients, no association existed between the severity
of disease and the phylogeny of the infecting bacteria. We also found that M.

x
tuberculosis isolates from patients with mild disease grew significantly slower,
while strains associated to moderate outcome had a longer lag phase and
reached the highest plateau, after a steep exponential phase. To gain in-depth
knowledge of the genetic basis for differential mycobacterial growth, we
performed whole genome sequencing analysis. We detected several single
nucleotide polymorphisms (SNPs) in genes that were previously associated with
growth suppression and identified novel gene candidates involved in membrane
transport and biosynthetic pathways.
Finally, in the third part of this work, we studied the architecture of the
immune response triggered by the different isolates of M. tuberculosis. Sixteen
clinical isolates associated with different clinical severity of TB were selected and
used to infect peripheral blood mononuclear cells (PBMCs) from non-
treated/non-recent latent TB infected (LTBI) donors or past/cured TB patients.
Independently of the host genetics, we identified two distinct groups of M.
tuberculosis isolates: high versus low inflammatory triggers. Furthermore, we
report that PBMCs from past TB patients produced less IL-1β than those from
LTBI participants in response to a variety of isolates, whereas the opposite was
observed for IL-1RA. LTBI subjects elicited responses with significantly higher IL-
1β/IL-1RA ratios than those from TB patients, thus suggesting this ratio as a
discriminator of risk for latent to active TB progression.
Overall, we provide a new clinical prediction rule for the risk of death in TB
patients and propose a new classification tree for TB severity. On the pathogen
side, we unveiled the differential growth of clinical isolates associated with
moderate outcomes of TB as a distinctive feature. On the host side, we suggest
the ratio IL-1β/IL-1RA as a possible biomarker of disease resistance versus
susceptibility to TB. Our findings present new platforms for active and latent TB
management and open new avenues for basic research, to unveil host and
pathogen determinants of TB outcomes.
xi
IDENTIFICAÇÃO DE VARIANTES MOLECULARES DO HUMANO E PATOGÉNIO ASSOCIADOS À HETEROGENEIDADE DA TUBERCULOSE
RESUMO
A tuberculose (TB) continua a impor elevados custos económicos e humanos.
Uma das características mais notáveis da TB é a variabilidade de resultados da
infeção, que tem sido classicamente atribuída a determinantes ambientais e do
hospedeiro. Trabalhos mais recentes estudaram a diversidade genómica do
Mycobacterium tuberculosis complex (MTBC) e revelaram o potencial impacto dos
fatores da bactéria na patogénese da TB. Esta questão foi abordada por diferentes
ângulos, combinando o estudo das propriedades do patogénio, a resposta imune do
hospedeiro e as características clínicas de TB, a partir de uma coorte de 681 casos
de TB pulmonar confirmados por cultura, diagnosticados no Hospital de São João,
um centro clínico de excelência do Porto, Portugal, entre 2007 e 2013.
Começámos por desenvolver uma ferramenta de avaliação de gravidade
clínica para estratificar o risco de mortalidade de doentes com TB pulmonar. Cinco
fatores de risco foram selecionados para o modelo de predição: insuficiência
respiratória hipoxémica (OR 4.7, 95% CI 2.8-7.9), idade ≥50 anos (OR 2.9, 95% CI
1.7-4.8), envolvimento pulmonar bilateral (OR 2.5, 95% CI 1.4-4.4), ≥1 comorbilidade
significativa – infeção HIV, diabetes mellitus, insuficiência hepática ou cirrose,
insuficiência cardíaca congestiva e doença respiratória crónica – (OR 2.3, 95% CI
1.3-3.8), e hemoglobina <12 g/dL (OR 1.8, 95% CI 1.1-3.1). Desenvolveu-se a
tuberculosis risk assessment tool (TReAT), estratificando doentes com baixo
(pontuação ≤2), moderado (pontuação 3-5) e alto (pontuação ≥6) risco de
mortalidade. A mortalidade em cada grupo foi de 2.9%, 22.9% e 53.9%,
respetivamente. O modelo manteve um bom desempenho na coorte de validação.
Após nos termos focado nos preditores clínicos de prognóstico do hospedeiro,
na segunda parte do projeto quisemos analisar o impacto da diversidade de M.
tuberculosis na gravidade da doença. Desenvolvemos uma árvore de decisão clínica
para classificar a gravidade da doença e aplicámo-la a um grupo selecionado de 133
doentes que na nossa coorte não apresentavam fatores preditores ou precipitantes
conhecidos de TB. Neste grupo não se verificou uma associação entre a gravidade
clínica e a filogenia da bactéria infetante. Porém, mostrámos que os isolados de M.
tuberculosis de indivíduos com doença ligeira crescem de forma significativamente
xii
mais lenta, enquanto que as estirpes associadas com TB moderada apresentam uma
fase lag mais longa e atingem um patamar mais elevado, após uma fase uma
íngreme fase exponencial. Para conhecer em detalhe as bases genéticas do
crescimento micobacteriano, realizámos uma análise de sequenciação genómica.
Detetaram-se diversos single nucleotide polymorphisms (SNPs) em genes que
previamente tinham sido associados com a supressão de crescimento e
identificámos novos genes candidatos envolvidos no transporte de membrana e em
vias biossintéticas.
Finalmente, na terceira parte do trabalho, estudámos a arquitetura da
resposta imune desencadeada por diferentes estirpes de M. tuberculosis. Dezasseis
isolados clínicos associados a diferentes gravidades clínicas de TB foram
selecionados e usados para infetar células mononucleares do sangue periférico
(PBMCs) de dadores com infeção latente não recente e não tratada ou de doentes
com TB passada/curada. Independentemente da genética do hospedeiro,
identificámos dois grupos distintos de isolados de M. tuberculosis muito e pouco
inflamatórias. Além disso, mostrámos que PBMCs de doentes com TB passada
produzem menos IL-1βem resposta a uma variedade de isolados, enquanto o oposto
se verificou para IL-1RA. Dadores com infeção latente apresentaram respostas com
razão IL-1β/IL-1RA significativamente mais elevada.
Em suma, propomos uma nova regra de predição clínica para o risco de
mortalidade por TB e uma nova árvore de classificação de gravidade da doença. Na
vertente do patogénio, desvendámos um perfil de crescimento distinto dos isolados
clínicos associados com TB moderada. Na vertente do hospedeiro, os nossos
resultados sugerem que a razão IL-1β/IL-1RA poderá ser um biomarcador de
resistência versus suscetibilidade para TB. Estes dados fornecem novas plataformas
para a investigação básica dos determinantes do hospedeiro e patogénio na
heterogeneidade da TB.
xiii
TABLE OF CONTENTS
Abstract ................................................................................................................................................... ix
Resumo ................................................................................................................................................... xi
Table of contents ................................................................................................................................. xiii
Figure index .......................................................................................................................................... xvi
Tables index ....................................................................................................................................... xviii
List of abbreviations ............................................................................................................................ xix
Thesis planning .................................................................................................................................. xxiii
Chapter 1 – General Introduction ........................................................................................................ 1
1. Tuberculosis: a global health problem ..................................................................................... 3
1.1. Current and future perspectives on prevention, diagnosis and treatment ..... 6
2. The etiological agent(s) of TB: Mycobacterium tuberculosis complex ........................ 10
2.1. Global phylogeography of M. tuberculosis and the origin of TB ........................ 11
2.2. Driving forces of genetic diversity in M. tuberculosis and the potential
impact on phenotype heterogeneity ............................................................................................................. 13
3. An overview of the transmission and the immune response to M. tuberculosis ... 17
3.1. Transmission ........................................................................................................................... 17
3.2. Recognition and early events after infection: the innate immune
response 17
3.3. The adaptive immune response ..................................................................................... 20
3.4. Inflammatory mediators ..................................................................................................... 21
4. Host immune imbalances in TB: from genetic determinants to environmental
factors………. ................................................................................................................................................................ 30
4.1. Host genetics: role in immunomodulation ................................................................. 30
4.2. The modulation of the immune response by extrinsic factors .......................... 32
5. Concluding remarks ....................................................................................................................... 38
References ............................................................................................................................................ 40
Chapter 2 – Objectives of the thesis ................................................................................................. 63
Chapter 3 – A prediction rule to stratify mortality risk of patients with pulmonary
tuberculosis .......................................................................................................................................... 69
Abstract ................................................................................................................................................. 71
Introduction .......................................................................................................................................... 72

xiv
Materials and Methods ....................................................................................................................... 74
1. Study design and patient population ...................................................................................... 74
2. Data collection .................................................................................................................................. 75
3. Statistical analysis ........................................................................................................................... 76
4. Ethics .................................................................................................................................................... 78
Results ................................................................................................................................................... 79
1. Study design ...................................................................................................................................... 79
2. Development of a practical CPR to assess risk of death ................................................ 80
3. Development of TReAT: a scoring system to stratify the risk of death in TB
patients…….. ................................................................................................................................................................. 86
4. Validation of TReAT ......................................................................................................................... 88
Discussion ............................................................................................................................................. 90
References ............................................................................................................................................ 94
Chapter 4 – Stratification of tuberculosis severity and its association with pathogen phylogeny
and properties ...................................................................................................................................... 97
Abstract ................................................................................................................................................. 99
Introduction ........................................................................................................................................ 101
Materials and methods ..................................................................................................................... 104
1. Study population and clinical severity stratification ...................................................... 104
2. Growth of M. tuberculosis clinical isolates .......................................................................... 107
3. Genomic DNA extraction from bacterial suspensions .................................................. 108
4. M. tuberculosis lineage and sublineage genotyping ....................................................... 109
5. Mycobacterial growth curves from standardized inoculum ....................................... 112
6. M. tuberculosis whole genome sequencing and analysis ............................................. 113
7. Statistical analysis ........................................................................................................................ 115
8. Ethics statement ............................................................................................................................ 115
Results ................................................................................................................................................. 116
1. Stratification of TB severity in the study group ............................................................... 116
2. Lineage diversity of M. tuberculosis within disease severity groups ........................ 118
3. Differential bacterial growth kinetics across TB severity groups .............................. 121
4. Genetic diversity underlying differential bacterial growth ........................................... 126
4.1. Phylogenetic structure unrelated to growth pattern ........................................... 126
4.2. Genome-wide scan of SNPs associated with growth .......................................... 127
Discussion ........................................................................................................................................... 133
References .......................................................................................................................................... 137

xv
Supplementary information ............................................................................................................. 143
Chapter 5 – Host and bacterial modulation of the protective IL-1 receptor signaling in TB ... 147
Abstract ............................................................................................................................................... 149
Introduction ........................................................................................................................................ 150
Materials and methods ..................................................................................................................... 153
1. M. tuberculosis clinical isolates selection and growth ................................................... 153
2. PBMCs isolation ............................................................................................................................ 154
3. PBMCs infection ............................................................................................................................ 154
4. Cytokine detection by Enzyme-Linked Immunosorbent Assay (ELISA) and
Multiplex analysis…….. ......................................................................................................................................... 155
5. Statistical analysis ........................................................................................................................ 155
6. Ethics statement ............................................................................................................................ 156
Results ................................................................................................................................................. 157
1. Group definition and experimental design ........................................................................ 157
2. Heterogeneity of host responses to clinical isolates associated with different TB
outcomes…… ............................................................................................................................................................ 160
3. The strain-related hierarchy in inflammatory response is maintained across
multiple human donors ........................................................................................................................................ 163
4. PBMCs from past active TB patients respond to M. tuberculosis infection
differently than those from LTBI donors ....................................................................................................... 165
5. TB patients have imbalanced IL-1 signaling ..................................................................... 169
6. Diagnostic performance of IL-1β/IL-1RA ratio to predict protection ...................... 170
Discussion ........................................................................................................................................... 172
References .......................................................................................................................................... 176
Chapter 6 – General discussion ....................................................................................................... 179
References .......................................................................................................................................... 188
xvi
FIGURE INDEX
Figure I.1 – Trends in TB incidence from 1990 to 2014|p.5
Figure I.2 – Global phylogeography of MTBC|p.12
Figure I.3 – The levels of genetic diversity across the MTBC and its epidemiological and clinical
impact |p.14
Figure I.4 – The innate and adaptive immune response network after M. tuberculosis infection|p.19
Figure I.5 – Schematic summary of IL-1–type I IFN counter-regulation during M. tuberculosis
infection|p.27
Figure I.6 – Heterogeneity of outcomes after M. tuberculosis exposure|p.31
Figure I.7 – Causes of tuberculosis presentation heterogeneity and severity|p.39
Figure III.1 – Flow chart for the selection of the participating patients, according to the STROBE
guidelines|p.79
Figure III.2 – Equations for the derived clinical prediction model that estimates TB patient-specific
death probability|p.83
Figure III.3 – ROC curve for the logistic regression model and clinical scoring system|p.86
Figure III.4 – Kaplan-Meier estimates of survival|p.87
Figure III.5 – Tuberculosis risk assessment tool (TReAT)|p.87
Figure IV.1 – Flow chart for the selection of the participating patients|p.105
Figure IV.2 – Classification system developed to define the TB clinical phenotype|p.106
Figure IV.3 – Decision tree grading system developed to assess the radiographic extent of
disease|p.107
Figure IV.4 – M. tuberculosis lineage genotyping was performed by a custom TaqMan® real-time
PCR SNP assay|p.110
Figure IV.5 – Tuberculosis severity stratification for the study population|p.116
Figure IV.6 – Allele discrimination for Lineage 4 and LAM sublineage|p.119
Figure IV.7 – Characterization of lineages among M. tuberculosis isolates and distribution of
sublineage genotypes through the different clinical outcomes of TB|p.120
Figure IV.8 – Growth of M. tuberculosis strains in MGIT™ 960 tubes|p.123
Figure IV.9 – Average growth curve in MGIT™ 960 tubes for M. tuberculosis strains belonging to
each clinical phenotype and H37Rv|p.123
Figure IV.10 – Comparison of (A) time to positivity, (B) doubling time and (C) maximum point on
the growth curve (Cmax) for different clinical isolates |p.124
Figure IV.11 – Correlation between CFUs present in the original suspension with growth of strains
inoculated into MGIT™ 960 tubes|p.125
Figure IV.12 – Maximum likelihood phylogenetic tree|p.127
xvii
Figure IV.13 – Manhattan plot showing genome-wide association data comparing fast and slow
growing strains|p.128
Figure IV.14 – Functional distribution of the genes identified with allelic frequencies differing more
than 40% (∆DAF >0.4) between fast and slow growing strains| p.129
Figure V.1 – General characteristics of the PBMCs isolated from 19 non-treated LTBI donors and
8 TB patients|p.159
Figure V.2 – M. tuberculosis isolates can be divided in high and low inducers of responses in a
host-independent way|p.161
Figure V.3 – Cytokine production induced by mild, severe or H37Rv Trudeau infection of
PBMCs|p.162
Figure V.4 – Strain-related hierarchy in inflammatory response is maintained across multiple
human donors|p.163
Figure V.5 – Host immune response to all isolates also shows some hierarchy|p.164
Figure V.6 – Linear regression analysis shows significant correlations between pro- and anti-
inflammatory cytokine responses to the different strains used in the study|p.165
Figure V.7 – The intensity of the response is not related to specific host-pathogen pairs|p.166
Figure V.8 – Scatter plot representation of the production of IL-1β, IL-12p40 and IL-10 by PBMCs
from LTBI donors or past TB patients|p.168
Figure V.9 – Comparison of IL-1β/IL-1RA ratio responses between LTBI and TB groups|p.169
Figure V.10 – ROC curve for the use of IL-1β/IL-1RA ratio as a classifier to distinguish LTBI
individuals at risk to active TB transition|p.170
xviii
TABLES INDEX
Table III.1 – Definition of coexistent illnesses used in the present study|p.75
Table III.2 – Study population characteristics and comparison between survivor and fatality
groups|p.81-82
Table III.3 – Clinically plausible interactions tested on univariate analysis|p.83
Table III.4 – Comparison of the marginal effects between the Clinical Prediction Rule and the two-
stage Heckman model|p.84
Table III.5 – Multivariable logistic regression analysis for deriving tuberculosis risk score for
death|p.85
Table III.6 – Test characteristics with different prediction scores for mortality in the derivation
cohort of patients with pulmonary tuberculosis|p.88
Table III.7 – Comparison of the distribution of predictors for derivation and validation cohorts|p.89
Table III.8 – Comparison of risk groups mortality in the derivation and validation cohorts|p.89
Table IV.1 – Primer and probes sequences for TaqMan® SNP genotyping real-time assays|p.111
Table IV.2 – Study population characteristics and comparison between severity groups|p.117
Table IV.3 – Description of the hosts with mild, moderate or severe disease corresponding to the
clinical isolates selected for growth analysis|p.122
Table IV.4 – Hierarchical view of GO (molecular function) for the 87 SNPs with ∆DAF >0.4|p.130
Table IV.5 – List of loci associated with in vitro and intracellular growth that have allelic frequencies
differing more than 40% (∆DAF >0.4) between fast and slow growing strains|p.132
Table IV.S1 – List of loci with allelic frequencies differing more than 40% (∆DAF >0.4) between
fast and slow growing strains |p.143-145
Table V.1 – Description of the hosts with mild or severe disease corresponding to the clinical
isolates selected for functional analysis|p.158
Table V.2 – M. tuberculosis isolates associated with severe disease induced significantly less pro-
inflammatory (IL-1β, IL-6, IL-12p40) and anti-inflammatory (IL-1RA, IL-10) cytokine production
by infected PBMCs than isolates associated with mild disease|p.162
Table V.3 – M. tuberculosis isolates induced significantly less production of IL-1β, IL-12p40 and
IL-10 cytokines by infected PBMCs belonging to TB patients, when compared with LTBI
donors|p.167
Table V.4 – Diagnostic performance of IL-1β/IL-1RA ratio to distinguish LTBI individuals at risk to
active TB transition|p.171
xix
LIST OF ABBREVIATIONS
ABC ATP-binding cassette
AFB Acid fast bacilli
AIDS Acquired immune deficiency syndrome
AIM2 Absent in melanoma 2
ALOX Arachidonate lypoxigenase
ANOVA Analysis of variance
APC Antigen-presenting cell
AUC Area under the curve
BALF Bronchoalveolar lavage fluid
bp Base pair(s)
BCG Bacillus Calmette-Guérin
BDL Below detection level
BWA Burrows wheeler aligner
CAMP Cathelicidin antimicrobial peptide
CDC Chest disease centre
CFP-10 Culture filtrate protein 10
CFU Colony-forming unit
CHARMS Checklist for critical appraisal and data extraction for systematic
reviews of prediction modelling studies
CHF Congestive heart failure
CI Confidence intervals
COPD Chronic obstructive pulmonary disease
CPR Clinical prediction rule
CRD Chronic respiratory disease
CRP C-reactive protein
CT Computed tomography
CTL Cytotoxic T cells
DAF Derived allele frequencies
DCs Dendritic cells

xx
DNA Deoxyribonucleic acid
DOTS Directly observed treatment, short course
DST Drug sensitivity testing
ELISA
ELISPOT
Enzyme-linked immunosorbent assay
Enzyme-linked immunospot assay
ESAT-6 Early secretory antigenic target 6
FDG-PET Fluorodeoxyglucose positron emission tomography
GO Gene ontology
GU Growth units
GWAS Genome-wide association studies
HCV Hepatitis C virus
HEPES 4-(2-hydroxyethyl)-1-piperazineethanesulfonic acid
HDT Host-directed therapies
HIV Human immunodeficiency virus
HSJ Hospital de São João
IFN
IGRA
Interferon
IFN-g release assay
IL Interleukin
iNOS Inducible nitric oxide synthase
IP Interferon-inducible protein
IQR Interquartile range
LAM Latin-American-Mediterranean
LED Light emitting diode
LPA Line probe assays
LSP Large sequence polymorphisms
LTB4
LTBI
Leukotriene B4
Latent tuberculosis infection
LXA4 Lipoxin A4
Mb Megabase
MDR Multidrug resistant
MFS Major facilitator superfamily
MGB Minor groove binding
xxi
MHC Major histocompatibility complex
MIRU-VNTR Variable-number tandem repeats of mycobacterial interspersed
repetitive units
MOI Multiplicity of infection
mRNA Messenger RNA
MSMD Mendelian susceptibility to mycobacterial disease
MTBC Mycobacterium tuberculosis complex
NFQ Non-fluorescent quencher
NGS Next generation sequencing
NK Natural killer T cells
NLR NOD-like receptors
NLRP3 NLR pyrin domain containing 3
NO Nitric oxide
NOD Nucleotide-binding oligomerization domain
NOS2 Nitric oxide synthase 2
OADC Oleic acid/albumin/dextrose/catalase
OR Odds ratio
PAMP Pathogen-associated molecular patterns
PBMCs Peripheral blood mononuclear cells
PBS Phosphate-buffered saline
PCR Polymerase chain reaction
PDIM Phthiocerol dimycocerosate
PGE2 Prostaglandin E2
PIM
PPD
Phosphatidylinositolmannoside
Purified protein derivative
PRR Pattern recognition receptors
PTB Pulmonary tuberculosis
RAG Recombination activating gene
RNA Ribonucleic acid
RNI Reactive nitrogen intermediates
ROC Receiving operator characteristic
ROI Reactive oxygen intermediates
xxii
RPMI Roswell Park Memorial Institute
SD Standard deviation
SIFT Sorting intolerant from tolerant
SNP Single nucleotide polymorphism
STROBE Strengthening the reporting of observational studies in
epidemiology
TB Tuberculosis
td Doubling time
TGF Transforming growth factor
Th T helper
TLR Toll-like receptor
TNF Tumor necrosis factor
TReAT Tuberculosis risk assessment tool
Treg Regulatory T cells
TST Tuberculin skin test
VDR Vitamin D receptor
WHO World Health Organization
XDR Extensively drug resistant
xxiii
THESIS PLANNING
The present thesis is organized in 4 different chapters.
In Chapter 1, a general introduction is presented, launching the
fundamentals on the present knowledge and questions on tuberculosis (TB). An
historical perspective of the fight against TB and all the major epidemiological
breakthroughs till the present time are described. It follows a review of the
etiological agent, Mycobacterium tuberculosis, and the basis for its genetic diversity
and how different genotypes are linked to clinical and immune phenotypes. Then,
a summary of the literature on the host immune response and host-pathogen
interaction is provided. Chapter 1 ends with an overview of the hypothetical link
of inflammation level gradient and TB clinical heterogeneity.
In Chapter 2, the aims of the present dissertation are proposed.
Chapter 3 describes the cohort of TB patients diagnosed at the Hospital
de São João, Porto, between 2007 and 2013, in which the present thesis was
based. After a full demographic, clinical and radiological characterization,
mortality risk factors were identified in a derivation set of 681 pulmonary TB
(PTB) patients selected. In this longitudinal, retrospective study, a clinical
prediction rule was generated, with 6-month mortality as the outcome measure,
and patients were stratified according to a severity score into low-, moderate- and
high-risk groups. The results were validated in an independent cohort from a non-
hospital center. This was the first prognostic scoring system to be proposed in a
high-income region of low to intermediate TB incidence for both inpatient and
outpatient settings.
The clinical characterization of TB cases, for which matched M. tuberculosis
infecting strains were available, offered the foundations to the biological studies
described in Chapter 4. To underpin the molecular mechanisms underlying the
heterogeneity of TB clinical manifestations, cases with predictor or precipitator
factors (comorbid conditions) were excluded, arriving to a study cohort of 133
otherwise healthy TB patients. Then, the biology of infecting M. tuberculosis strains

xxiv
was dissected through phylogenetic stratification and whole genome analysis,
correlating these data with phenotypic features of associated disease severity and
bacterial growth kinetics. Next, in Chapter 5, we explored the architecture of the
immune response triggered by the different isolates of M. tuberculosis and
propose a possible biomarker of risk of transition from latent to active TB.
The general discussion of the developed work is presented in Chapter 6.
Future perspectives of the ongoing work are also considered in this section.

1
CHAPTER 1 – GENERAL INTRODUCTION ______________________________________________________________

2
Part of this chapter was submitted as a review manuscript
Title: Modulation of inflammation by host, pathogen and extrinsic factors in
tuberculosis: a meaningful troika?
Authors: Helder Novais Bastos, Nuno S. Osório, Sebastien Gagneux, Iñaki Comas
and Margarida Saraiva
Chapter 1 | General Introduction
3
1. Tuberculosis: a global health problem
Tuberculosis (TB) is estimated to have caused 20% of the deaths in the
Western globe cities during the 19th century. Rates of infection were as high as
79-90% and TB was named "the captain of all these men of death" [1]. These
figures reflected the impact of industrialization on the incidence of the disease
mainly in urban areas, where malnutrition and poor living conditions allied with
overcrowded dwellings and congested factories generated the perfect
environment for TB to spread. Two seminal discoveries were decisive in the fight
against TB. First, the conclusion of its infectious nature by the French military
surgeon Jean-Antoine Villemin, in a report in 1865 where he described TB
transmission by inoculation from humans to rabbits [2]. Later, in 1882 the
German physician Robert Koch identified the bacterial agent [3]. These
discoveries paved the way for the development of diagnostic, preventive and
therapeutic tools to fight TB, which together with improved social and living
circumstances, led to drastic reductions in the global disease incidence, reaching
historical lows in most Western countries.
Mortality rates in Europe and North America began to decline in the mid-
19th century. The sanatorium movement took a relevant part in this fight against
TB. Therapeutic interventions undertook during this time were largely empiric,
ranging from the simplest bed rest in the horizontal position, to invasive
procedures, like artificial pneumothorax, thoracoplasty, plombage and lung
resection [4]. The later has recently deserved renewed attention in selected
patients with TB caused by drug-resistant organisms [5]. The introduction of
streptomycin in 1946 made sanatorium and collapse therapy in all its forms
obsolete for susceptible bacteria [6], and further developments allowed for
shorter, less toxic and more effective treatment regimens.
However, 70 years after introducing antibiotic treatment, we are still far
from TB elimination, as defined by <1 case per 1 million population [7]. Instead,
TB remains a major cause or morbidity and mortality in the developing world,
accounting for approximately 1.8 million deaths every year [8]. With nearly 10.4
million new cases occurring worldwide, Mycobacterium tuberculosis continues to
Chapter 1 | General Introduction
4
rank among the leading causes of death by an infectious agent [8]. Further
aggravating this scenario, one quarter of the world’s population is estimated to
be latently infected with M. tuberculosis, providing a virtually impossible to
eliminate reservoir [9, 10]. South Africa has nowadays the highest incidence of
TB in the world, which is the leading cause of natural death in this country [8].
Records from Cape Town show a clear decrease of the fatality rate after the
introduction of combination chemotherapy [11]. However, childhood TB
remained unchanged, suggesting that active transmission remained high, and
notification rates returned to pre-chemotherapy levels with the advent of the
human immunodeficiency virus (HIV)-epidemic in the 1990s [11]. Since its initial
appearance in the 1980s, the HIV-1 infection contributed to large escalations in
the incidence of TB, affecting more heavily the sub-Saharan Africa [12]. More or
less at the same time, the dissolution of the USSR produced a major
socioeconomic crisis and the collapse of the health services, which also resulted
in a significant increase of new TB cases in that region [10, 13]. Moreover, recent
times have witnessed the appearance of a new force driving the TB epidemic in
the former USSR countries: the emergence of multidrug-resistant (MDR) strains
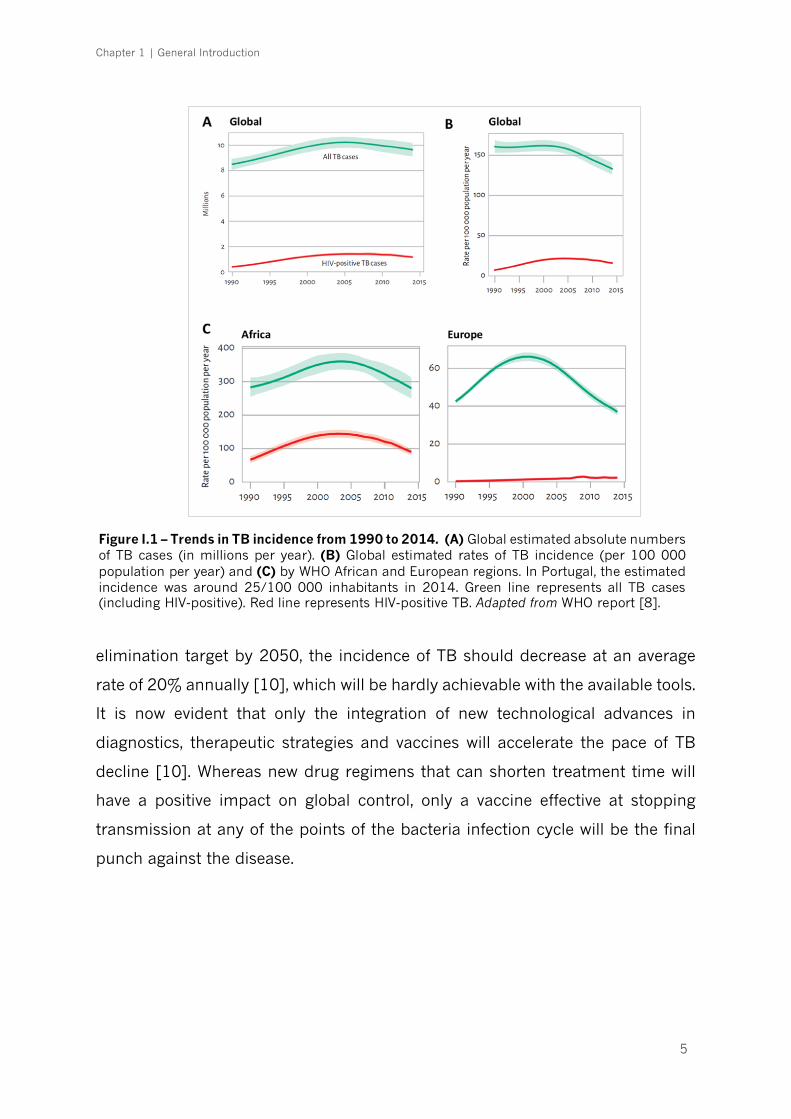
[14]. Figure I.1 shows the trends in TB incidence from 1990 to 2014. The
expanding TB problem was declared a "Global Emergency" by the World Health
Organization (WHO) in 1993. At the time, it was envisaged that the efficient use
of existing tools would result in a progressive regression of disease incidence
towards worldwide elimination [15]. The widespread implementation and
success of the WHO global control program, subsequently labelled as the directly
observed treatment, short course (DOTS) strategy [16], is estimated to have
saved up to six million lives [17]. Despite this undeniable success, to meet the TB
Chapter 1 | General Introduction
5
elimination target by 2050, the incidence of TB should decrease at an average
rate of 20% annually [10], which will be hardly achievable with the available tools.
It is now evident that only the integration of new technological advances in
diagnostics, therapeutic strategies and vaccines will accelerate the pace of TB
decline [10]. Whereas new drug regimens that can shorten treatment time will
have a positive impact on global control, only a vaccine effective at stopping
transmission at any of the points of the bacteria infection cycle will be the final
punch against the disease.
Figure I.1 – Trends in TB incidence from 1990 to 2014. (A) Global estimated absolute numbers of TB cases (in millions per year). (B) Global estimated rates of TB incidence (per 100 000 population per year) and (C) by WHO African and European regions. In Portugal, the estimated incidence was around 25/100 000 inhabitants in 2014. Green line represents all TB cases (including HIV-positive). Red line represents HIV-positive TB. Adapted from WHO report [8].
Chapter 1 | General Introduction
6
1.1. Current and future perspectives on prevention, diagnosis and
treatment
The vaccine Mycobacterium bovis Bacillus Calmette-Guerin (BCG), almost a
century old, is the only tool currently in use to prevent TB, but its efficacy against
the predominant pulmonary form of TB is inconsistent [18]. BCG is effective
against TB meningitis and milliary TB among children, but its protective effect
wanes with time, with virtually no effect on adult TB [19]. However, although 15
TB vaccine candidates have been tested in pre-clinical or clinical trials since 2005,
none has shown high efficacy so far [20]. It should be noted that TB vaccine
development has faced several obstacles. First, animal models in current use only
partially resemble the broad spectrum of human outcomes after exposure to M.
tuberculosis, either due to biological differences of the host or difficulty in
mimicking the natural infection conditions in the experimental setting [21].
Second, phase III trials require large cohorts, comprising several tens of
thousands of participants, to validate new vaccine’s effectiveness. Third, since the
time for progression to active disease is largely unpredictable, clinical trials likely
need to last for several years for evaluation of efficacy. One option toward this
goal is stratification based on biomarkers which would identify the study
participants at greatest risk to develop active TB disease within the duration of a
standard clinical trial [22, 23]. However, such biomarkers are still unknown.
Despite rapid progress over the last decade, vaccine development and
biomarker research have not yet been successfully applied in the area of TB
management. Hence the importance of screening latent TB infection (LTBI) in
selected risk population groups to prevent progression to active transmissible
disease [7]. Latent-infected subjects are clinically asymptomatic and have no
radiographic lung lesions of active TB, but present a specific immune response
detected by an IFN-g release assay (IGRA) or the tuberculin skin test (TST) [24].
TST is based on skin infiltration caused by intradermal injection of purified
protein derivative (PPD), which is a crude mixture of antigens many of which are
shared by M. tuberculosis, M. bovis, BCG and several species of environmental
mycobacteria [25]. The two commercial IGRA kits, QuantiFERON-TB Gold In-Tube
(QFT-GIT®) and T-SPOT.TB®, measure in vitro IFN-g production by whole blood
Chapter 1 | General Introduction
7
enzyme-linked immunosorbent assay (ELISA) or an enzyme-linked immunospot
(ELISPOT) assay by stimulated peripheral blood mononuclear cells (PBMCs) [26,
27]. Blood is stimulated with M. tuberculosis antigens culture filtrate protein 10
(CFP-10), early secretory antigenic target 6 (ESAT-6) and, in the case of QFT-
GIT®, also with TB7.7 (Rv2654c) [27, 28], providing better sensitivity and
specificity to identify LTBI in a single patient visit compared to TST [29]. In vitro
tests may also discriminate true negative responses from anergy [30]. It should
be noted that both TST and IGRA have a low accuracy in immune-compromised
patients and they cannot distinguish between LTBI and active disease [31, 32].
Alternative biomarkers have been proposed to distinguish active TB, such as
interleukin (IL)-17, interferon-inducible protein (IP)-10 and IL-10 [33], with IP-10
retaining high accuracy in the HIV infected patients in several reports [34, 35].
However, none of these biomarkers accurately identify those subjects with LTBI
who are at risk of developing active disease [36, 37]. The most advanced research
in this topic has been conveyed by the analysis of whole blood transcriptomic
mRNA expression signatures. Recently, a 16-gene RNA signature was discovered
in a set of 46 progressors (TB patients) and 107 matched controls that correlated
with the risk of developing active TB [38]. Noteworthy, the 16 genes that comprise
the transcriptomic signature are all regulated by type I and II IFNs, suggesting
that chronic peripheral activation of the IFN response, previously shown to be
associated with active TB disease at the time of diagnosis [39-42], may also
precede the onset of active TB disease.
While improved TB vaccines or better biomarkers of progression of
infection are not available for current use, the central programmatic intervention
in the Stop TB Strategy has been focused on the diagnosis and treatment of active
disease [10]. The main objective of this program is to reduce transmission by
early case detection, by increased diagnostic accuracy and treatment outcomes
and by a reduction in case fatality.
Staining for acid fast bacilli (AFB) has been the cornerstone of TB
diagnosis, despite having a sensitivity of merely 50-60% [43], leaving a large
portion of cases to be diagnosed based only on clinical judgment and radiography
evaluation. International guidelines recommend 2 to 3 consecutive sputum
Chapter 1 | General Introduction
8
smears, with at least one being an early morning specimen [44, 45], but the
incremental yield of a third smear is low (2–3%) [46, 47]. Sensitivity may be
improved by fluorescent microscopy, with similar specificity, which is further
enhanced by sample concentration [48], and also can reduce reading time to 1
minute for a single smear, compared to 4 minutes for a conventional smear [49].
Recently, the WHO has recommended the replacement of conventional
fluorescence microscopes by light emitting diode (LED) fluorescent microscopes,
that are more robust and function in a standard light room [50]. Yet, culture is
still the gold standard method for diagnosis [51], presenting increased sensitivity
over AFB smear, which is crucial in smear negative patients, usually occurring in
the context of high rates of HIV coinfection, and allows to distinguish between
non-tuberculous and tuberculous mycobacteria [52]. But mycobacterial culture
requires a high degree of laboratory capacity, which is often not available in high-
TB burden areas. Its utility is also limited because of the positivity delay (4-6
weeks in the case of solid media culture) [53]. Newer liquid media culture
systems use fluorometric growth indicators that provide better sensitivity over
solid media, with an increased yield of about 10%, and allow faster M. tuberculosis
identification, usually within 2-3 weeks [54, 55]. They are also useful for drug
sensitivity testing (DST), based on a proportional method of comparing growth in
a critical concentration of antibiotics versus antibiotic-free media. For those
reasons, liquid culture systems became the standard of care in developed nations
[56].
The demand for faster diagnosis prompted the development of methods
based on polymerase chain reaction (PCR) for the detection of pathogen’s DNA.
Line probe assays (LPA) contain specific oligonucleotide probes immobilized on
a strip that hybridize with target PCR products, activating a colorimetric indicator
[57]. Their main use has been for the rapid detection of drug resistant TB, with
the advantage of reporting results in a matter of hours, much less than the
traditional methods. The most exciting advance in TB diagnostics has been the
automated PCR using the GeneXpert MTB/RIF platform [58]. This method is able
to simultaneously identify the presence of M. tuberculosis, with higher sensitivity
than smear microscopy (89% if smear-positive, 67% if smear-negative) [59], as
Chapter 1 | General Introduction
9
well as the rpoB gene mutation status, which encodes for the majority of rifampin
resistance and is a strong indicator of concurrent isoniazid resistance (MDR TB)
[60]. One study showed that Xpert shortened the detection of rifampin resistance
from 106 days with traditional DST to 1 day [43]. However, two recent
randomized studies of Xpert versus microscopy in real-world settings failed to
show a significant impact of the former on morbidity or mortality at 6 months
[61, 62]. Furthermore, Xpert does not provide the full drug susceptibility profile
and also detects the DNA of nonviable M. tuberculosis, thus limiting its use for the
identification of extensively drug resistant TB (XDR-TB) and for treatment
monitoring [43].
Effective therapy is also central to any strategy for controlling TB. High cure
rates are achieved with the standard regimen for drug-susceptible TB, established
four decades ago, comprising 6 to 9 months of isoniazid and rifampicin,
combined with pyrazinamide and ethambutol for the first 2 months [8, 63].
However, the treatment regimen has two major drawbacks [63]. One is the
duration of therapy, raising concerns regarding the adherence and the possibility
of emerging drug resistance caused by treatment default. The other limitation is
the lack of tolerance in some patients, who may need dose adjustments or even
suspension due to drug side effects that are frequently reported. Efforts have
been made to shorten treatment without increasing the risk of relapse. One trial
reported 4 months of standard treatment (2 months of daily isoniazid, rifampicin,
ethambutol and pyrazinamide, followed by 2 months of daily isoniazid and
rifampicin) in adults with noncavitary disease and culture conversion after 2
months yielded an acceptable relapse rate of 7% [64]. Moxifloxacin and
gatifloxacin have also been tried in treatment-shortening trials [65-69]. However,
three large, multicentre phase 3 trials (REMox [70], OFLOTUB [71], and RIFAQUIN
[72]) reported a relapse risk increase from less than 5% with 6 month-treatment
to more than 10% with 4 months. Similar results were found with high doses of
rifampicin and rifapentine [73]. There are currently eight antituberculosis drugs
in phase 2–3 trials, either to drug-susceptible or MDR TB [73]. Recently two new
drugs for MDR-TB (bedaquiline and delamanid) were approved [74, 75], but they
will probably yield a little impact of the global epidemiology of TB, since only a
Chapter 1 | General Introduction
10
minority of cases with MDR-TB are actually detected [76]. A growing body of
evidence places the development of host-directed therapies (HDTs) as a foremost
innovative step for the treatment of TB and at the forefront of precision medicine
approaches.
To conclude, while innovative diagnostics, treatment and prevention
measures are being fostered, they must be combined with better quality of
laboratory services and TB national control policies to effectively hasten
epidemiological changes towards elimination of TB in both low- and high-
incidence countries.
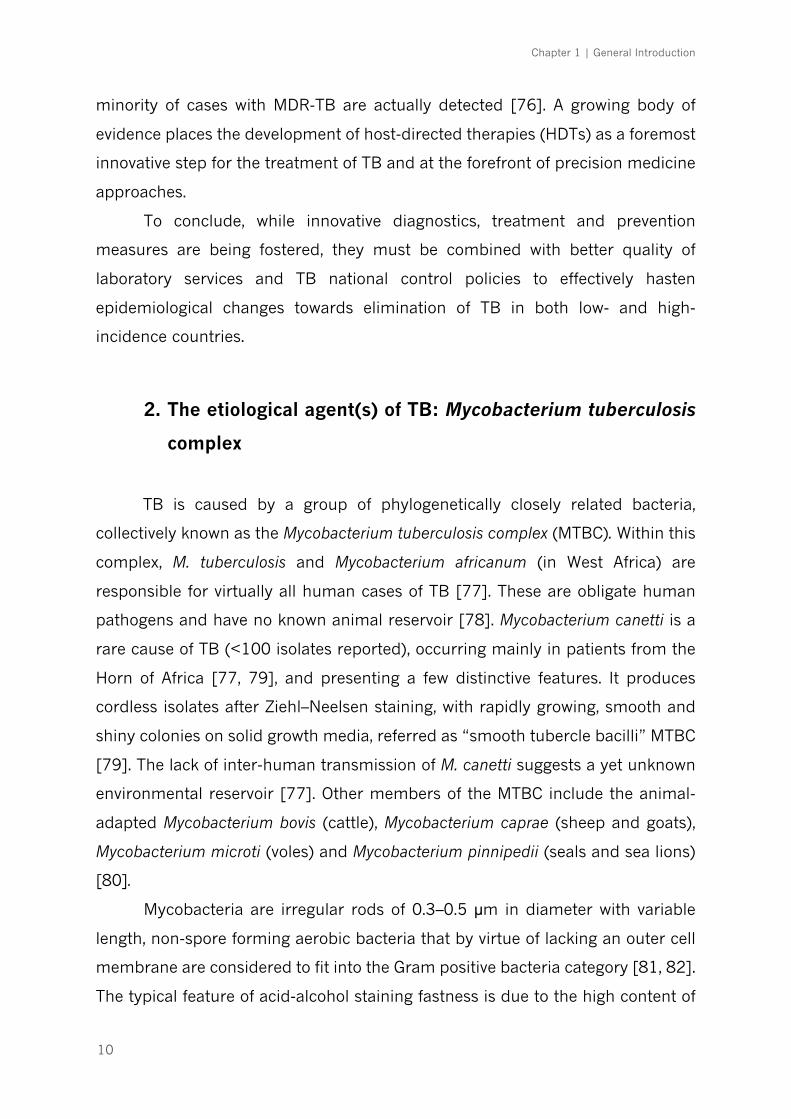
2. The etiological agent(s) of TB: Mycobacterium tuberculosis
complex
TB is caused by a group of phylogenetically closely related bacteria,
collectively known as the Mycobacterium tuberculosis complex (MTBC). Within this
complex, M. tuberculosis and Mycobacterium africanum (in West Africa) are
responsible for virtually all human cases of TB [77]. These are obligate human
pathogens and have no known animal reservoir [78]. Mycobacterium canetti is a
rare cause of TB (<100 isolates reported), occurring mainly in patients from the
Horn of Africa [77, 79], and presenting a few distinctive features. It produces
cordless isolates after Ziehl–Neelsen staining, with rapidly growing, smooth and
shiny colonies on solid growth media, referred as “smooth tubercle bacilli” MTBC
[79]. The lack of inter-human transmission of M. canetti suggests a yet unknown
environmental reservoir [77]. Other members of the MTBC include the animal-
adapted Mycobacterium bovis (cattle), Mycobacterium caprae (sheep and goats),
Mycobacterium microti (voles) and Mycobacterium pinnipedii (seals and sea lions)
[80].
Mycobacteria are irregular rods of 0.3–0.5 µm in diameter with variable
length, non-spore forming aerobic bacteria that by virtue of lacking an outer cell
membrane are considered to fit into the Gram positive bacteria category [81, 82].
The typical feature of acid-alcohol staining fastness is due to the high content of
Chapter 1 | General Introduction
11
mycolic acids (>50% of its dry weight) within the mycobacterial cell wall [82].
The thickness of the mycolic acids layer impairs the entry of nutrients, being
responsible for the slow growth of the bacteria, but it also increases cellular
resistance to degradation through lysosomal enzymes [83]. In optimal laboratory
conditions, M. tuberculosis may achieve a maximum generation time of around
16 hours [84]. This extremely slow growth rate has two consequences of clinical
significance: i) the infection develops in an insidious process of several weeks or
months before becoming clinically evident, and ii) at 37 °C and under optimal
conditions of oxygen and nutrients on solid culture media, identifiable
mycobacterial colonies may not appear for 3 to 6 weeks [82]. When they do
appear, the colonies are irregular, waxy, and white to light-yellow coloured, with
bacteria piled up into clumps or ridges [84].
The M. tuberculosis strain H37Rv is the most studied in research
laboratories. Its genome has been completely sequenced in 1998 [85], which has
opened grounds to identify genes that translate into virulence factors, antigens
and also candidate targets for HDTs against TB.
2.1. Global phylogeography of M. tuberculosis and the origin of TB
Given the low mutation rate and lack of horizontal gene transfer and of
genetic recombination [86-88], the human-adapted members of the MTBC were
long assumed to be essentially identical. Over the years, the genotyping of clinical
isolates by spoligotyping [89], MIRU-VNTR [90], single and large sequence
polymorphisms [91, 92] and more recently by whole genome sequencing [93],
revealed the existence of 7 different phylogenetic lineages of human TB-causing
bacteria [92, 94]. A long period of coevolution of the pathogen with different
populations of modern humans following the out-of-Africa migrations [95]
resulted in the fact that different bacterial lineages prevail in different
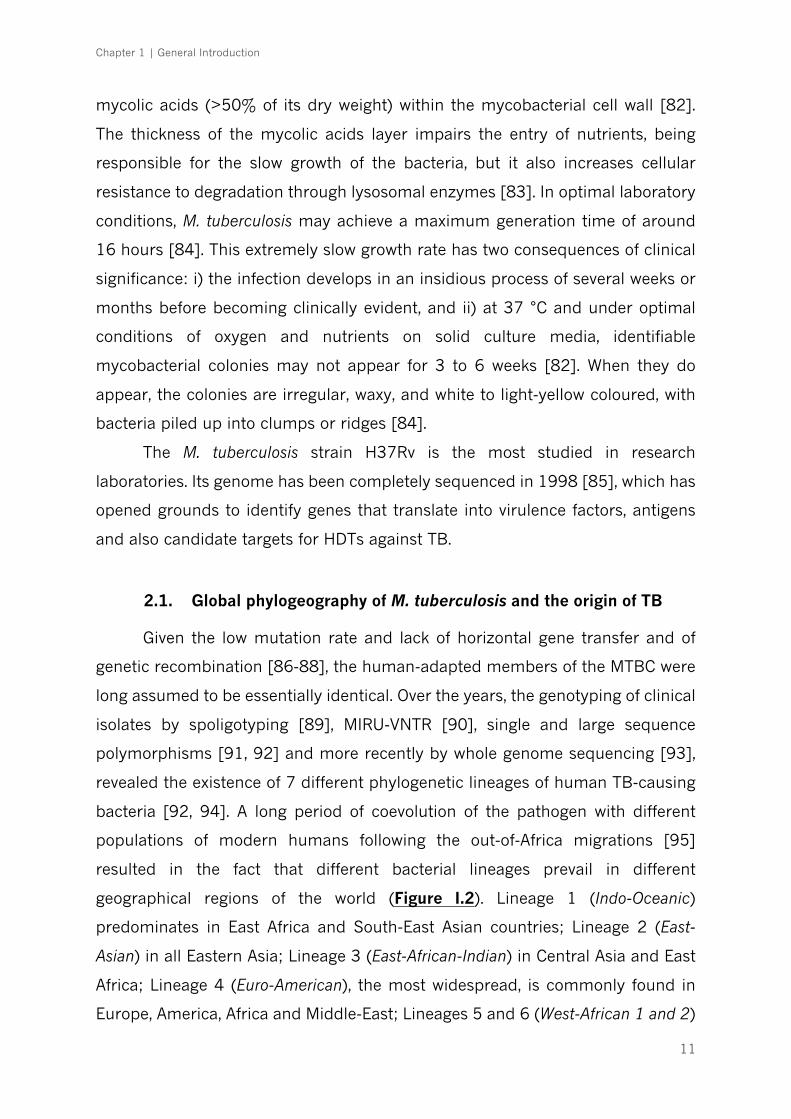
geographical regions of the world (Figure I.2). Lineage 1 (Indo-Oceanic)
predominates in East Africa and South-East Asian countries; Lineage 2 (East-
Asian) in all Eastern Asia; Lineage 3 (East-African-Indian) in Central Asia and East
Africa; Lineage 4 (Euro-American), the most widespread, is commonly found in
Europe, America, Africa and Middle-East; Lineages 5 and 6 (West-African 1 and 2)
Chapter 1 | General Introduction
12
are restricted to West Africa and finally, Lineage 7 has only been found in Ethiopia
[94, 96]. Echoes of this type of interaction are still observed in cosmopolitan
settings, where the phylogeny of the isolate correlates with the ethnic origin of
the patient [97, 98].
Figure I.2 – Global phylogeography of MTBC (A) Maximum parsimony phylogeny based on molecular typing of 964 specimens from patients in Ethiopia, 2006-2010. Adapted from Firdessa et al [94]. Phylogeny shown is based on 13,199 nucleotide positions that were variable in at least 1 of the 28 MTBC strains represented in the tree. Numbers near nodes indicate percentage of bootstrap replicates supporting the topology after 1000 pseudoreplicates. (B) Each coloured dot represent the dominant MTBC lineage(s) in each country. Adapted from Gagneux [77] and Coscolla et al [96].
The African origin of TB has been supported by several studies [95, 99-
101], including by the fact that all 7 MTBC lineages are represented in that
continent [94, 95]. Besides large human migrations into Eurasia starting 70 000
years ago, which led to the emergence of the phylogenetically-related lineages 2,
3 and 4, collectively known as the “modern” lineages, a few other major branching
events have been proposed. One of the most important seems to be the Neolithic
demographic transition 10 000 years ago, when animal domestication and
agricultural developments boosted the population expansion and crowding that
helped to sustain the infectious cycle [95]. In the last centuries, the shape of the
phylogeographic distribution of M. tuberculosis strains changed again, to its
present form (Figure I.2), as a result of the continuous waves of European
migration to the overseas colonial possessions and simultaneous increase of the
human population density in a pace that had never been seen before [99, 100].
A B

Chapter 1 | General Introduction
13
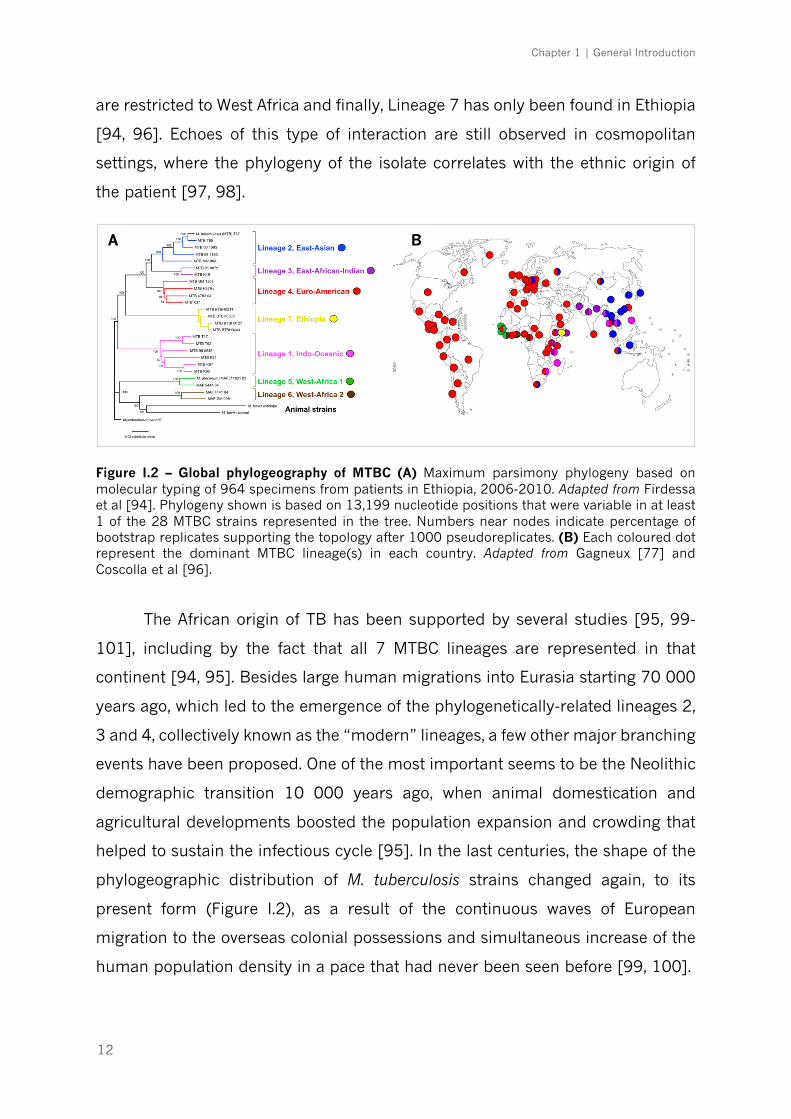
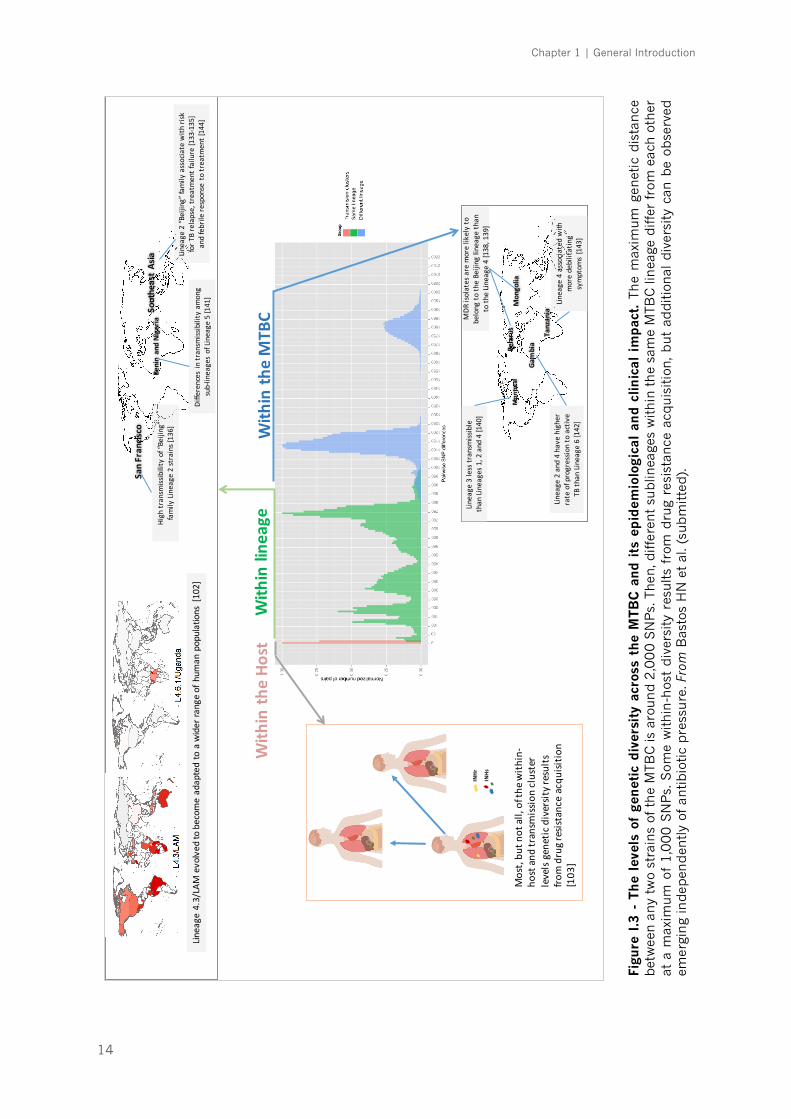
Importantly, MTBC diversity can be found at very different evolutionary and
geographical scales (Figure I.3). For example, a phylogeographical structure can
also be observed at the sublineage level within Lineage 4 [102], with some
globally distributed sublineages, while others are more geographically restricted.
Moreover, there is an increasing body of evidence documenting the diversification
of the initial infecting bacteria in sub-populations within a single patient [103].
Out of all the diversity observed, from macro- to micro-evolutionary scales, the
challenge will be to identify those genetic changes that represent an adaptation
of the bacteria to the host immune responses.
2.2. Driving forces of genetic diversity in M. tuberculosis and the
potential impact on phenotype heterogeneity
Until early 1990s, when the first molecular strain-typing techniques were
developed, there was a general belief that genetic diversity within MTBC was too
limited to account for any differences in the infection course [104]. However, it is
now well established that the genetic variation within the MTBC is higher than
originally expected.
Across all lineages, more than 30 000 single nucleotide polymorphisms
(SNPs) have been described [95]. The majority of the mutations in coding regions
that have accumulated in the different MTBC phylogenetic branches are non-
synonymous (i.e. that alter the amino acid sequence in the protein), with a large
proportion of them placed inside highly conserved regions in other mycobacteria
[93, 95, 99, 105, 106], thus suggesting a functional impact. Interestingly, there is
evidence that the immune system may be, in fact, one major driving force in M.
tuberculosis evolution, as shown by the disruption of adaptation of M. tuberculosis
to sympatric human populations in the case of HIV patients [107] and by the
evidence of positive selection in the M. tuberculosis genome driven by non-
antibiotic forces [108]. In contrast to most other pathogens, that have evolved to
evade host immunity by antigenic variation, M. tuberculosis seems to have
explored the opposite strategy, since the known human T-cell epitopes (i.e.
membrane proteins) are evolutionarily hyperconserved, with more than 95% of
Chapter 1 | General Introduction
14
With
inlineage
With
intheMTB
CWith
intheHo
st
INHr
INHs
SoutheastAsia
Lineage4.3/LAM
evolvedtobecom
eadaptedtoawiderra
ngeofhum
anpopulations[102]
Lineage2“B
eijing”familyassociatewith
risk
forT
Brelapse,treatm
entfailure[133-135]
andfebrilere
sponsetotreatm
ent[144]
SanFrancisco
Hightransm
issibilityof“Beijing”
familyLineage2strains[136]
BeninandNigeria
Differencesin
transm
issibilityamong
sub-lineagesofLineage5[141]
Most,bu
tnotall,ofth
ewith
in-
hostan
dtransm
issioncluster
levelsgenetic
diversityresults
fromdrugresistanceacquisition
[103
]
Mon
treal
Gambia
Lineage2and4havehigher
rateofprogressio
ntoactive
TBth
anLineage6[142]
Lineage3lesstransm
issible
thanLineages1,2and4[140]
Tanzania
Lineage
4associa
tedwith
moredebilitating
symptom
s[143]
MDR
isolatesaremorelikelyto
belongto
theBeijinglineagethan
toth
eLin
eage4[138,139]
Belarus
Mongolia
Figu
re I
.3 -
Th
e le
vels
of
gen
etic
div
ersi
ty a
cros
s th
e M
TBC
and
its
ep
idem
iolo
gica
l an
d cl
inic
al i
mp
act.
Th
e m
axim
um
gen
etic
dis
tance
bet
wee
n a
ny
two
stra
ins
of t
he
MTB
C is
aro
un
d 2
,00
0 S
NP
s. T
hen
, diff
eren
t su
blin
eage
s w
ithin
th
e sa
me
MTB
C li
nea
ge d
iffer
fro
m e
ach o
ther
at
a m
axim
um
of
1,0
00
SN
Ps.
Som
e w
ithin
-hos
t div
ersi
ty r
esults
from
dru
g re
sist
ance
acq
uis
itio
n, b
ut
additio
nal
div
ersi
ty c
an b
e ob
serv
ed
emer
gin
g in
dep
end
ently
of a
ntibio
tic
pre
ssu
re. F
rom
Bas
tos
HN
et
al. (
sub
mitte
d).

Chapter 1 | General Introduction
15
the 491 individual epitopes analysed in one study having no amino acid change
at all [93]. These data suggest that M. tuberculosis may have evolved to induce T
cell responses to its own advantage, in order to ensue tissue destruction and the
development of cavitary disease, contributing to its successful transmission
[109]. This aspect is corroborated by the observation that TB/HIV coinfected
patients with low CD4+ T-cell counts are less likely to present cavitations [12].
The formation of the granuloma itself, needed to control the infection, may also
paradoxically offer a niche for long-term survival of the bacteria, as studies
showed that many asymptomatic humans harbour virulent bacteria in their
tuberculous granulomas [110, 111]. On the other hand, a subset of predicted T
cell epitopes in M. tuberculosis that evolved to escape the host immune system
have been identified [108]. This is important, as the alteration of a single amino
acid in an epitope can have a large impact in its affinity to a specific HLA molecule,
thus influencing the T cell synapse and modulating the level and type of immune
response elicited [112, 113]. These epitopes could potentially be exploited as
vaccine components as envisaged for other diseases.
In 1995, an outbreak of TB in a low-risk rural area of the United States of
America was traced to an isolate designated CDC1551, which attracted attention
due to an unusually high skin test conversion rate and unusually large PPD
reactions [114]. Later, Manca et al showed that CDC1551 isolates were more
potent than others in inducing the secretion of inflammatory mediators by
infected monocytes [115], providing the evidence for a link between bacterial
genotypes and immune response phenotypes. Subsequent works by further
supported these observations in vitro [116-120] and in experimental infections
[121-125]. In turn, the differential stimulation of the immune response may
impact the pathogen virulence. Thus, certain isolates of M. tuberculosis appear to
have acquired immune evasion strategies to imbalance the immune system in
their benefit. As an example of this, the hypervirulent isolate HN878 prevents the
development of protective T helper (Th) 1 cells and enhances the expression of
type I IFNs in infected mice [122, 126]. Virulent strains also appear to be able to
escape host immunity by differentially modulating the death of the infected cell.
Indeed, some M. tuberculosis isolates inhibit apoptosis and trigger necrosis of host
Chapter 1 | General Introduction
16
macrophages to delay the initiation of adaptive immunity [127]. Similarly,
neutrophil necrotic cell death can be induced, with subsequent spilling of the
noxious granule-contents into the surrounding tissue and bacteria spreading to
the extracellular space [128].
The clinical relevance of MTBC diversity at the lineage and sublineage levels
is also increasingly recognized [96], as highlighted in Figure I.3. Experimental
studies exploring the molecular mechanisms underlying differential virulence of
MTBC strains found differences in growth rates [118, 119, 129, 130], gene
expression [106, 130], metabolic profiles [131] and cell wall composition [118,
132]. It is conceivable that these findings account for the differences on the level
of the inflammatory response generated by the host. Lineage 2 (Beijing) strains
have been associated with treatment failure and relapse [133-135] and a highly
transmissible sublineage of Lineage 2 has been found in San Francisco [136].
Moreover, one in vitro study demonstrated that Lineage 2 may acquire drug
resistances more rapidly than Lineage 4 [137], which was confirmed in reports
from Belarus and Mongolia, where MDR isolates were more likely to belong to the
Lineage 2 Beijing family of strains [138, 139]. Lineage 3 was reported to be less
transmissible than Lineages 1, 2 and 4 across Montreal, Canada [140], whereas
striking differences in transmissibility among sublineages of Lineage 5 in Benin
and Nigeria were registered [141]. Lineages 2 and 4 were shown to have a higher
rate of progression to active TB comparatively to Lineage 6 in Gambia [142]. In
addition, more debilitating symptoms (such as weight loss) have been associated
with Lineage 4 strains in Tanzania [143], whereas increased febrile response was
seen in patients infected with Beijing genotype strains [144]. Moreover, Lineage
4 was linked mainly to pulmonary TB [145], while lineages 2 [145-147] and 3
[148] were reported to associate more with extrapulmonary disease.
Taken together, these findings suggest that genetic differences within
MTBC account, at least partially, for the phenotypic heterogeneity seen in host
immune responses and, by consequence, in the clinical presentation of TB.
Chapter 1 | General Introduction
17
3. An overview of the transmission and the immune response
to M. tuberculosis
3.1. Transmission
Infectious droplet nuclei are generated when pulmonary or laryngeal TB
patients cough, sneeze, shout, or sing [149]. Depending on the environment,
these tiny particles can remain suspended in the air for several hours [150].
Transmission occurs after inhalation by a second individual of airborne particles
carrying just a few mycobacteria [151]. Although transmission models of TB have
not yet been fully established, it is thought that mainly the smaller droplets,
containing fewer bacteria, will make it past the upper respiratory track and into
the relatively sterile environment of the distal alveoli [152, 153]. It is thus
considered that infection with M. tuberculosis results in a low dose infection. Only
10 to 30% of the individuals that contact with M. tuberculosis become infected
and although not being capable of eliminating the pathogen, the majority
develops an immune response that is able to contain infection in its latent form
[82].
3.2. Recognition and early events after infection: the innate immune
response
Much of what is known on the immune response to M. tuberculosis (Figure
I.4) comes from studies using the mouse model of experimental
infection. Research showed early recruitment of phagocytic cells into the
airways and alveoli of the infected mice [154], following the inhalation of airborne
droplets carrying M. tuberculosis. Important cellular players at this stage are
macrophages, neutrophils and dendritic cells (DCs), which sense the presence of
the bacteria through the activation of various pattern recognition receptors
(PRRs) by microbial components known as pathogen-associated molecular
patterns (PAMPs) [155]. Some examples of PRRs are toll like receptors (TLRs),
nucleotide-binding oligomerization domain (NOD) receptors, DC-SIGN and
dectin-1 (C-type lectin receptors) [154, 156, 157] and all of them have been
Chapter 1 | General Introduction
18
shown to be involved in the recognition of M. tuberculosis [154]. The TLRs have
been the most widely studied in the context of TB, among which TLR2, -4 and -9
are the best characterized [157-159]. A vast array of inflammatory mediators are
released following mycobacterial recognition by TLRs, shaping the immune
response to M. tuberculosis [156, 160]. For instance, in vitro studies show that
mycobacterial triggering of both TLR2 and TLR4 are important for the production
of tumor necrosis factor (TNF) [158, 161-163], TLR2 and TLR9 are major drivers
of IL-12 production [158, 161, 164] and IL-10 secretion by antigen-presenting
cells (APCs) is highly dependent on mycobacterial TLR2 engagement [165, 166].
The activated innate immune cells also take up the bacteria to attempt at
destroying it [167]. Resident macrophages provide the first phagocytic response
and initiate a number of effector mechanisms, such as phagosome/lysosome
fusion [168], generation of reactive nitrogen (RNI) and oxygen intermediates
(ROI) [169, 170] and apoptosis [171, 172]. However, there is also evidence
suggesting that M. tuberculosis can use macrophage intracellular media to
replicate and to persist within lung granulomas [171-174]. Neutrophils are
heavily recruited after infection and become the most abundant cell type found
in the bronchoalveolar lavage of active pulmonary TB patients [175], where they
exert important microbicidal activities [176]. Berry et al [39] described a
transcriptional signature dominated by a neutrophil-driven IFN-inducible gene
profile, consisting of both IFN-g and type I IFNs (IFN-α and IFN-β) signalling, that
was specific to patients with active TB and correlated with radiological severity.
Several other reports also emphasize the contribution of neutrophils to pathologic
exacerbation in TB [177-180].
DCs are fundamental players in the host immune response to
mycobacterial challenges, standing out as the main APCs, crucial for B and T cell
activation [181]. They engulf and process M. tuberculosis or apoptotic bodies and
are directed to the draining mediastinal lymph nodes through the presence of
specific cytokine and chemokine gradients to initiate the adaptive immune
response [182, 183], which further discussed in the next section.
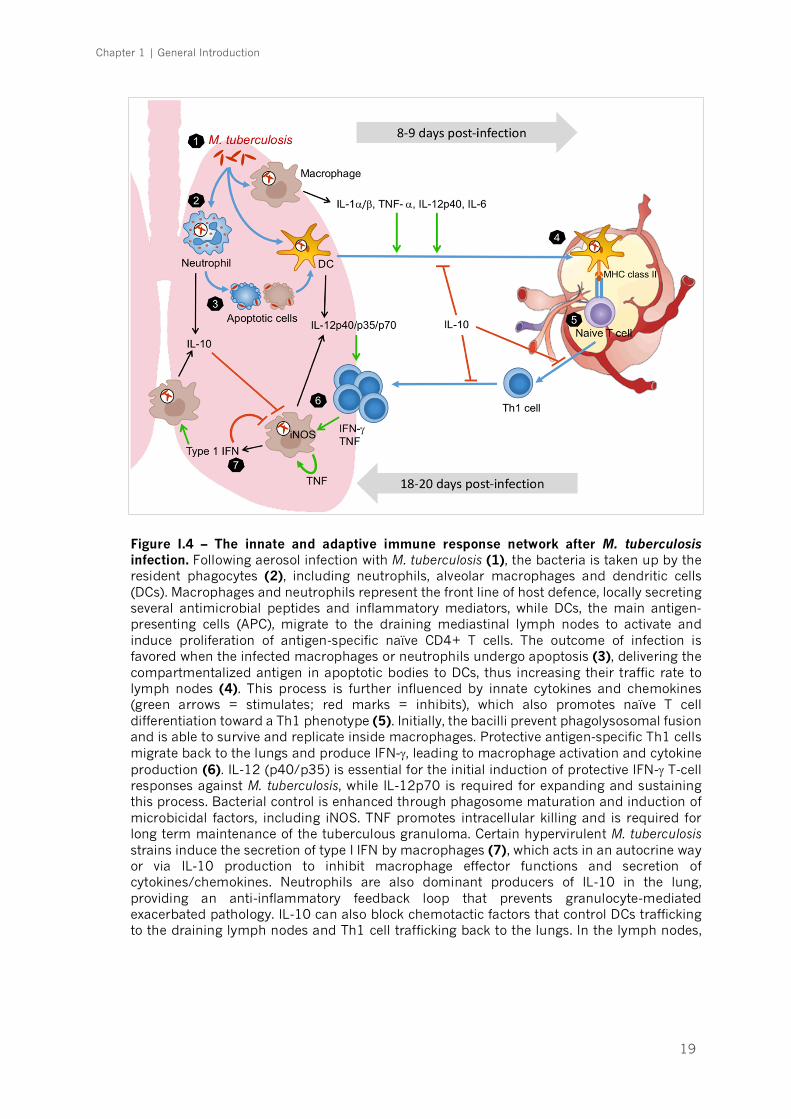
Chapter 1 | General Introduction
19
Figure I.4 – The innate and adaptive immune response network after M. tuberculosis infection. Following aerosol infection with M. tuberculosis (1), the bacteria is taken up by the resident phagocytes (2), including neutrophils, alveolar macrophages and dendritic cells (DCs). Macrophages and neutrophils represent the front line of host defence, locally secreting several antimicrobial peptides and inflammatory mediators, while DCs, the main antigen-presenting cells (APC), migrate to the draining mediastinal lymph nodes to activate and induce proliferation of antigen-specific naïve CD4+ T cells. The outcome of infection is favored when the infected macrophages or neutrophils undergo apoptosis (3), delivering the compartmentalized antigen in apoptotic bodies to DCs, thus increasing their traffic rate to lymph nodes (4). This process is further influenced by innate cytokines and chemokines (green arrows = stimulates; red marks = inhibits), which also promotes naïve T cell differentiation toward a Th1 phenotype (5). Initially, the bacilli prevent phagolysosomal fusion and is able to survive and replicate inside macrophages. Protective antigen-specific Th1 cells migrate back to the lungs and produce IFN-g, leading to macrophage activation and cytokine production (6). IL-12 (p40/p35) is essential for the initial induction of protective IFN-g T-cell responses against M. tuberculosis, while IL-12p70 is required for expanding and sustaining this process. Bacterial control is enhanced through phagosome maturation and induction of microbicidal factors, including iNOS. TNF promotes intracellular killing and is required for long term maintenance of the tuberculous granuloma. Certain hypervirulent M. tuberculosis strains induce the secretion of type I IFN by macrophages (7), which acts in an autocrine way or via IL-10 production to inhibit macrophage effector functions and secretion of cytokines/chemokines. Neutrophils are also dominant producers of IL-10 in the lung, providing an anti-inflammatory feedback loop that prevents granulocyte-mediated exacerbated pathology. IL-10 can also block chemotactic factors that control DCs trafficking to the draining lymph nodes and Th1 cell trafficking back to the lungs. In the lymph nodes, IL-10 impairs the differentiation of naïve T cells to IFN-g-producing Th1 cells.
Chapter 1 | General Introduction
20
3.3. The adaptive immune response
Activated DCs arrive to the draining lymph nodes, where they present
processed bacterial antigens at the cell surface via major histocompatibility
complexes (MHC) I and II, leading to the activation of naïve CD8+ and CD4+ T
cells, respectively. This process creates the micro-environment needed for
differentiation and proliferation of CD8+ cytotoxic T cells (CTLs) and, under IL-12
and IFN-g influence, of CD4+ Th1 cells [183]. Then, protective antigen-specific
Th1 cells migrate back to the lungs and produce IFN-g, enhancing macrophage
activation and cytokine production [167, 184] (Figure I.4). Bacterial control is
promoted through phagosome maturation and induction of microbicidal factors,
which in the mouse model of infection include the production of nitric oxide (NO)
and its metabolites (RNI) in a reaction catalyzed by the enzyme inducible NO
synthase (iNOS or NOS2) [185, 186]. Mice deficient on NOS2 are highly
susceptible to mycobacterial challenges [185-187]. Moreover, mycobacterial
growth is enhanced when iNOS is inhibited in infected human alveolar
macrophages [188, 189].
With a still relatively unappreciated role, Th17 cell subset also takes part
in the immune response of TB. These cells mainly secrete IL-17 which is known
to modulate granuloma formation and is required for BCG vaccine-dependent
accelerated recruitment of IFN-g producing Th1 cells to the site of infection [190,
191]. However, it has been shown that repeated BCG exposure of M. tuberculosis-
infected mice leads to increased Th17 cell responses accompanied by
neutrophil/granulocyte recruitment and consequently increased
immunopathology [192]. Therefore, Th17 cells need to be tightly regulated
during mycobacterial infections to avoid serious tissue damage.
The relevance of adaptive immune responses to control M. tuberculosis
infection is reiterated on HIV infected patients with low CD4+ T cell counts,
rendering these patients more prone to develop disseminated TB [193, 194]. A
similar outcome is observed in recombination activating gene (RAG) deficient
mice, which are unable to produce B and T lymphocytes and succumb to M.
tuberculosis shortly after infection [195, 196]. Other cell subsets have also been
studied under the scope of TB, including CTLs [197, 198], Th2 [199] and B cells
Chapter 1 | General Introduction
21
[200-204], however they showed inconsistent results. Foxp3+ regulatory T (Treg)
cells, on the other hand, have been pointed as important players in the control of
immune responses to infection, to prevent exacerbated immunopathology [154].
Their role in TB is suggested by the increased numbers detected in patients with
active disease, when compared to latent infected individuals [205]. In the mouse
model, Tregs were also shown to proliferate and accumulate at the mycobacterial
infection sites [206], where they suppress the development of IFN-g-producing
CD4+ T cells and overall Th expansion [207, 208].
As already highlighted, to orchestrate the different components of the
cellular responses to TB, an extensive array of immune mediators is required.
Important examples of cytokines involved will be described in the following
sections.
3.4. Inflammatory mediators
Upon recognition and internalization of M. tuberculosis, a vast array of
inflammatory mediators is released to the vicinity of the infected cell [157, 209].
These mediators include, among others, IL-12, including subunit IL-12p40, IFN-
g, IL-17, IL-6, IL-1β, type I IFN, TNF-α and eicosanoids [157, 209]. Together these
molecules shape the immune response to M. tuberculosis.
3.4.1. IL-12p40, homodimers and heterodimers
IL-12p40 associates to another IL-12p40 molecule to form the homodimer
IL-12p80 [209, 210], which is secreted by phagocytes readily after infection and
is essential to induce a migratory phenotype in DCs, allowing these cells to travel
to the lymph node where naïve T cells will be activated [154, 184, 209]. This IL-
12p80-dependent mechanism is believed to be enhanced through the expression
of a splice variant of the IL-12 receptor b1 (IL-12Rb1, which binds to IL-12p40)
by DCs early after infection [211]. Although IL-12p80 is important for the early
events leading to the adaptive immune response, this molecule is unable to
trigger the production of IFN-g, a critical cytokine required for the control of M.

Chapter 1 | General Introduction
22
tuberculosis [209]. This role belongs to another mediator within the IL-12 family
of cytokines.
Unlike IL-12p40, IL-12p35 is not significantly expressed in the early stages
after infection [209]. Accordingly, the critical role of IL-12p70 (also known as IL-
12), a product of dimerization of IL-12p40 with IL-12p35, may not involve the
initial triggering of an adaptive immune response. Instead, IL-12p70 is essential
for the induction and maintenance of IFN-g-producing T cells, through Th1
lineage differentiation, which are protective in later stages of infection [212, 213].
IL-12p40 also dimerizes with IL-23p19, forming the bioactive molecule IL-
23. This cytokine is produced in response to M. tuberculosis by macrophages and
DCs in a TLR2-dependent manner [214, 215]. In contrast to IL-12p70, IL-23 is
not essential to control M. tuberculosis infection, as IL-23p19 deficient mice
remain capable of controlling mycobacterial growth and of maintaining stable
levels of local IFN-g mRNA expression [213]. However, IL-23 is required to sustain
optimal Th17 cell responses, IL-6 and TNF [213, 216-219], and partially
compensates for the generation of IFN-g-producing CD4+ T cells in the absence
of IL-12p70 [213]. Also, the IL-23/IL-17 immune axis is critical to regulate the
early recruitment of neutrophils to the infection site [220].
3.4.2. IFN-g
The primary source of IFN-g are CD4+ T cells [221]. Antigen specific CD8+
T cells and cells of the innate immune system γδ T cells, natural killer (NK) T cells,
NK cells and macrophages, also produce this cytokine during mycobacterial
infection [222, 223], although they generally do not compensate for CD4+ T cells
insufficiency [154]. However, it has been hypothesized that these innate sources
play an important protective role in the case of T cell immunodeficiency as seen
in HIV/TB coinfected individuals [223].
The role of IFN-g in the immune response to M. tuberculosis infection is
central, as illustrated both in the mouse model [224, 225] and in humans [226].
Indeed, TB control is severely compromised in subjects bearing genetic
deficiencies that impair Th1 cell differentiation, IFN-g production or the cellular
Chapter 1 | General Introduction
23
response to this molecule, leading to increased susceptibility even to weakly
virulent mycobacteria [227, 228]. Ifng deficient mice have defective macrophage
activation and low NOS2 expression [225]. As a result, there is unrestricted
mycobacterial growth and granulomas become quickly necrotic. However, IFN-g-
induced NO production cannot explain totally the antimycobacterial action of this
cytokine [229]. Treatment of cells with IFN-g stimulate autophagic pathways that
promote mycobacterial phagosomes to mature into phagolysosomes and
increase M. tuberculosis killing [230, 231]. On the other hand, IFN-g also have
anti-inflammatory properties, by negatively regulating IL-17 production and
neutrophil recruitment [232-234], both of which might be beneficial in early
stages of infection, but have detrimental effects if they persist in chronic phase.
Given its critical role against mycobacterial infection, the detection of TB
antigen-specific circulating effector memory T cells through IGRA has emerged
as useful immunological marker of M. tuberculosis infection [154]. However, IFN-
g production is not a direct correlate of protection and, in fact, patients with more
severe TB disease have the highest IFN-g levels in the serum [235] and
bronchoalveolar lavage fluid (BALF) [236], which fall during successful therapy
[235, 236].
3.4.3. IL-17
The differentiation from naïve precursor cells to Th17 cells, a subset of IL-
17-producing CD4+ T cells [237], depends on the production of IL-23, IL-1β, IL-
6, and TNF-α [223, 238] and it is inhibited by IFN-g or IL-4 [239]. The importance
of Th17 cells is illustrated by the fact that defective production of Th17-related
cytokines influences the outcome of the infection [240]. Despite the presence of
Th17 cells during infection, γδ T cells were shown to be the primary source of IL-
17 in response to IL-23 in M. tuberculosis infection [241, 242].
Experimental evidence in the mouse model support the role of IL-17 in the
formation, maintenance and long-term integrity of granuloma in mycobacterial
infection [191, 242]. In mice, the absence of IL-17 provokes a significant
reduction in the mononuclear and polymorphonuclear inflammatory infiltrates to
Chapter 1 | General Introduction
24
the lung [240, 243]. Conversely, uncontrolled IL-17 signaling drives the
accumulation of a large number of granulocytes, leading to increased tissue
damage and host susceptibility upon TB infection [190]. In the context of
vaccination against TB, IL-23 improves the vaccine efficacy when used as an
adjuvant [244], by inducing a protective Th17 memory population [243]. Hence,
a fine-tuned Th17 immune response is essential to ensure that infection is
resolved without permanent sequelae.
3.4.4. IL-6
IL-6 is produced mainly by monocytes/macrophages [245] and epithelial
cells [246] in early phases of the M. tuberculosis infection. This cytokine is usually
found in elevated levels in the BALF from involved sites with TB [247]. IL-6 is
known to exert a series of effects during M. tuberculosis infection. For instance, IL-
6 signaling (together with transforming growth factor [TGF]-β) plays a critical role
during the initial stages of Th17 cell differentiation, while inhibiting the generation
of Treg cells induced by TGF-β [248]. Moreover, IL-6 is required for the induction
of an optimal T cell response [249], probably through a set of mechanisms that
include the regulation of acute phase proteins synthesis [250], regulation of
serum iron levels [251], B-cell [252] and T-cell differentiation [248, 253-255].
Though IL-6 deficient mice are able to control M. tuberculosis after lower dose
aerosol infection, they rapidly succumb when exposed to high doses of bacteria
[256].
3.4.5. TNF-α
TNF is a critical cytokine involved in the control of M. tuberculosis growth
by promoting intracellular killing and participating in the long-term maintenance
of the tuberculous granuloma [257]. TNF deficient mice are unable to control the
growth of M. tuberculosis and quickly succumb to infection [258-260]. In humans,
pharmacological disruption of the TNF signaling pathway also increases
susceptibility to TB, particularly favoring the transition from latent infection to
Chapter 1 | General Introduction
25
active disease [261]. In apparent contrast to these findings, an increase in plasma
TNF levels was reported to associate with clinical deterioration observed early in
the treatment of severe TB [262]. This implies that a balanced TNF production is
needed to ensure favorable TB outcome. Furthermore, anti-TNF therapy was
successfully used in patients with severe pulmonary TB [263], presumably by
diminishing extreme inflammation.
3.4.6. The type I IFN/IL-1β/eicosanoids circle within the inflammasome
network
Recent investigations ascribe great importance to the IL-1 family of
cytokines during the immune response in TB. IL-1β is synthesized as an inactive
precursor, pro-IL-1β, which requires cleavage by caspase-1 in order to attain its
active form. Pro-IL-1β is virtually absent in naïve myeloid cells, but upon
stimulation by pro-inflammatory cytokines (IL-1, TNF, TGF-β), stressors and by
various TLRs, an inflammatory signaling pathway is activated through TAK1 (TGF-
β-activated kinase 1) [264], promoting the nuclear translocation of NF-κB which
upregulates pro-IL-1β mRNA transcription [265, 266]. Caspase-1 activation is
accomplished within the inflammasome, an intracellular complex of proteins that
are assembled after activation of PRRs in innate immune cells, mainly the NOD-
like receptors (NLRs) NLRP1, NLRP3, NLRC4, and NAIP [267, 268]. IL-1β is
readily secreted after bacterial challenge [269-272] and enhances the monocyte
to macrophage transition, with improved phagocytic and antigen-presentation
functions [273]. This cytokine also plays a role in the T-cell activation and T-cell-
dependent antibody production, and guiding the transmigration of leukocytes
into the stress location [274]. Moreover, IL-6 and IL-23 production are both IL-
1β-dependent [274, 275], justifying the failure to induce Th17 differentiation and
IL-17 production in IL-1 receptor (IL-1R) type I-deficient mice [276]. In addition
to local inflammation, IL-1β is also responsible for systemic responses, such as
generation of fever and acute-phase proteins production [274]. Given the
importance of this molecular pathway against infections, it is not surprising to

Chapter 1 | General Introduction
26
find that IL-1R deficient mice are extremely sensitive to low-dose aerosol infection
with M. tuberculosis [277-280]. On the other hand, IL-1β is highly expressed in
the BALF from pulmonary TB patients compared with that from healthy controls
[281] and correlated with more advanced disease [282]. These data suggest that
initial triggering of a protective IL-1β response is critical for host survival upon
infection with M. tuberculosis and that keeping the balanced level of cytokine is
vital to prevent disease progression. Previous studies have shown that continuous
IL-1β expression promotes sustained recruitment of granulocytes to the lung,
induces the expression of additional inflammatory mediators such as
prostaglandin E2 (PGE2) and stimulates tissue-damaging metalloproteinases
[283, 284].
More recently, the function of IL-1β within the context of eicosanoid
pathway regulation was further explored. M. tuberculosis-infected Il1r1−/− mice
present increased bacterial load, associated to reduced levels of PGE2 in BALF,
while those of leukotriene B4 (LTB4) and lipoxin A4 (LXA4) are higher as
compared to wild-type animals [285]. The causal link between these molecules
appears to be the modulation of the infected cell death type by the eicosanoid
mediators balance, which is known to affect the viability of the infection [173,
286, 287]. PGE2 induces apoptosis of infected macrophages, a mechanism
associated with protection against mycobacteria. In contrast, LXA4 induces a
necrotic phenotype, which favors bacterial proliferation and infection of bystander
cells, thus enabling the formation of new infectious foci [127, 171-173, 288]. In
line with this model, arachidonate 5-lypoxigenase (ALOX5) deficient mice, which
are unable to produce LTB4 and LXA4, therefore shifting the eicosanoid
metabolic pathway towards PGE2 production, are more resistant to M.
tuberculosis [173, 288]. Human studies also highlight the relevance of
eicosanoids in TB, as individuals harboring polymorphisms in ALOX5 and LTA4H
(involved in LTA4 synthesis) show increased susceptibility to TB [289, 290].
The extent of the role of eicosanoids in TB is not yet fully understood. There
is evidence suggesting that PGE2 is also important for the regulation of the
crosstalk between IL-1β and type I IFNs [285]. The latter subvert anti-tuberculous
host defenses by inhibiting iNOS and IL-12p40, while inducing the
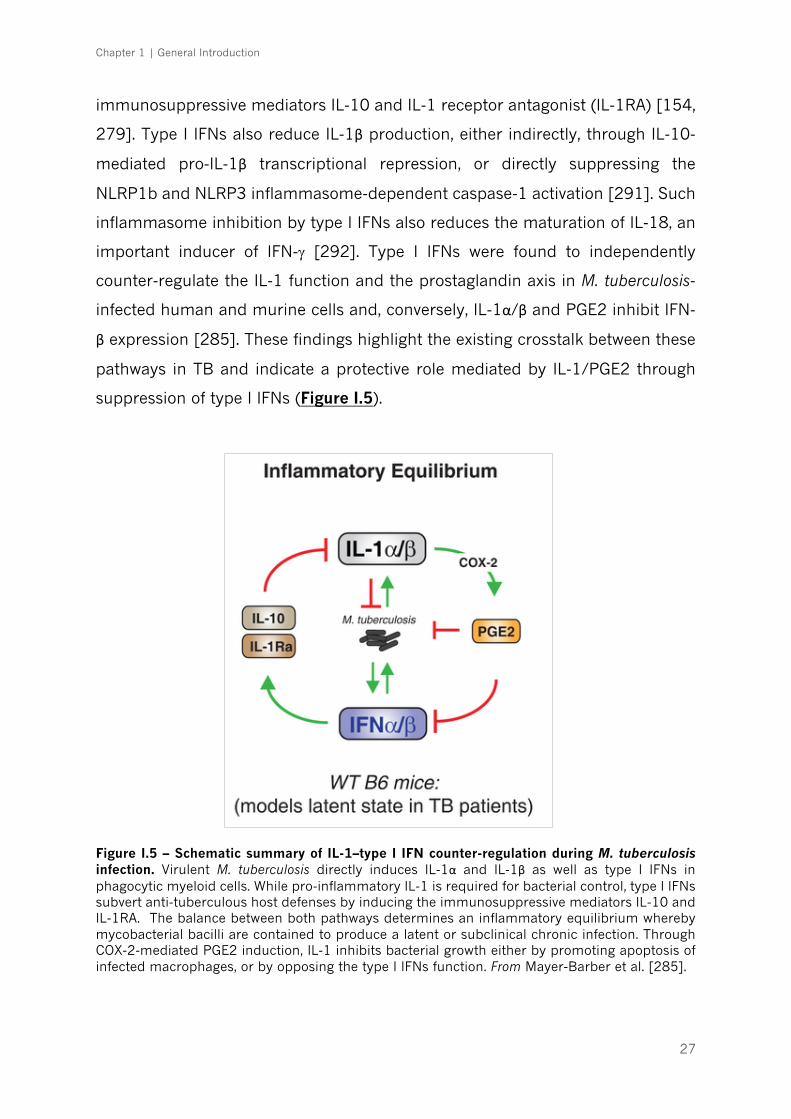
Chapter 1 | General Introduction
27
immunosuppressive mediators IL-10 and IL-1 receptor antagonist (IL-1RA) [154,
279]. Type I IFNs also reduce IL-1β production, either indirectly, through IL-10-
mediated pro-IL-1β transcriptional repression, or directly suppressing the
NLRP1b and NLRP3 inflammasome-dependent caspase-1 activation [291]. Such
inflammasome inhibition by type I IFNs also reduces the maturation of IL-18, an
important inducer of IFN-g [292]. Type I IFNs were found to independently
counter-regulate the IL-1 function and the prostaglandin axis in M. tuberculosis-
infected human and murine cells and, conversely, IL-1α/β and PGE2 inhibit IFN-
β expression [285]. These findings highlight the existing crosstalk between these
pathways in TB and indicate a protective role mediated by IL-1/PGE2 through
suppression of type I IFNs (Figure I.5).
Figure I.5 – Schematic summary of IL-1–type I IFN counter-regulation during M. tuberculosis infection. Virulent M. tuberculosis directly induces IL-1α and IL-1β as well as type I IFNs in phagocytic myeloid cells. While pro-inflammatory IL-1 is required for bacterial control, type I IFNs subvert anti-tuberculous host defenses by inducing the immunosuppressive mediators IL-10 and IL-1RA. The balance between both pathways determines an inflammatory equilibrium whereby mycobacterial bacilli are contained to produce a latent or subclinical chronic infection. Through COX-2-mediated PGE2 induction, IL-1 inhibits bacterial growth either by promoting apoptosis of infected macrophages, or by opposing the type I IFNs function. From Mayer-Barber et al. [285].

Chapter 1 | General Introduction
28
3.4.7. IL-10 and IL-1RA balancing the inflammatory response
The initial triggering of a protective immune response is critical for host
survival upon infection with M. tuberculosis, as described above, and keeping the
appropriate level of immunity is vital to prevent disease progression. Once active
disease is established, and the bacterial burden increases, the host immunity is
further activated leading to a potentially dangerous level of inflammation. In this
context, IL-10 and IL-1RA induction may be beneficial to counteract tissue
destruction caused by the infection itself, shifting the architecture of the immune
response towards a tissue regenerative one [293-295].
IL-10 is an important anti-inflammatory mediator and is found increased
in the sputum [296], BALF [297] and serum [235] of patients with pulmonary
TB. This cytokine acts in an autocrine/paracrine way, especially on the innate
compartment, to inhibit the production of pro-inflammatory cytokines such as IL-
1, IL-6, TNF and IL-12 [298-301], which in turn compromises the production of
IFN-g by T cells [302-304], IL-12p40-dependent migration of infected DC to the
draining lymph nodes [184, 305] and the lytic activity of T cells [304]. A good
clinical example of the importance of IL-10 in the regulation of TB-induced
inflammation was brought by the finding that anergic subjects, designated this
way because they fail to develop a delayed-type hypersensitivity responses to
mycobacterial antigens and, therefore, lack dermal reactivity to tuberculin PPD,
have constitutively active IL-10-producing T cells [306]. Some human data
suggest the genetic association between IL-10 polymorphisms and susceptibility
to TB [307-309]. Yet, these data remain largely inconsistent, with studies in some
populations reporting association of IL-10 SNPs with TB susceptibility and others
not [310-313].
In the animal model, transgenic mice that overexpress IL-10 have
enhanced susceptibility to BCG [314] and M. tuberculosis [315], because of an
inability to mount a protective immune response. Nevertheless, studies focusing
in IL-10 deficient mice show contradictory results. When IL-10 activity is blocked
during the chronic stage of infection (day 90 post-infection) in CBA/J mice, that
by default are susceptible to M. tuberculosis, an increased survival was observed,
accompanied by diminished bacterial burdens and enhanced Th1 immunity
Chapter 1 | General Introduction
29
[316]. Moreover, IL-10 deficient mice showed enhanced control of the bacterial
load in the lung and spleen during M. tuberculosis infection independently of the
genetic backgrounds studied, BALB/c and C57BL/6, after one month of disease
[317]. Conversely, data from other studies show that infected IL-10 deficient mice
in C57BL/6 background , were either transiently protected [318], or had similar
bacterial burdens as wild type mice [319, 320]. This was despite enhanced levels
of IFN-g, IL-12p40 and iNOS [319]. Furthermore, at late stages of infection (over
60 days) these mice succumb and show increased bacterial burdens, due to an
overall lack of control of the inflammatory responses, leading to tissue damage
and disease progression [321]. These data underline the key role played by IL-
10 in dampening the Th1 response to limit chronic lung inflammation in TB.
Another potentially relevant counter-regulatory mediator is IL-1RA, a
natural competitive antagonist of IL-1Rs, exerting its anti-inflammatory effects by
blocking the binding of IL-1α and IL-1β to the IL-1R [322, 323]. Similarly to IL-1β
[281], studies have shown that IL-1RA is also significantly increased in BALF
[282] from TB patients. However, while circulating IL-1β was undetectable,
elevated serum concentrations of IL-1RA were found in patients with active TB as
compared to control subjects [324], suggesting that IL-1RA could be used as a
biomarker of disease activity. The precise impact of IL-1RA on TB pathogenesis
remains elusive. Anakinra, a recombinant human IL-1RA, has been used on a
large number of patients with different inflammatory diseases, from gout to
rheumatoid arthritis [325], and still, records show little or absent risk of M.
tuberculosis reactivation in latently infected individuals [325, 326].
Chapter 1 | General Introduction
30
4. Host immune imbalances in TB: from genetic determinants
to environmental factors
The status of the host immune system is a critical determinant of TB
outcome. Many studies unequivocally show that immune imbalances resulting
from genetic variants, life habits or comorbidities affecting the host determine the
course of disease, notably transmission, immediate manifestation of active TB or
transition from latent infection to active TB (Figure I.6). The outstanding question
remains: how can we predict the outcome of infection for a given individual? This
question has prompted genetic association studies over the years, but a definite
answer is still unavailable.
4.1. Host genetics: role in immunomodulation
Family clustering of TB cases offered the first clues for a putative genetic
susceptibility to TB [327, 328]. However, family clustering could also be explained
by common environmental factors and closer physical proximity that would
increase the chance of M. tuberculosis transmission. In this sense, compelling
evidence for the role of host genetic factors in TB was provided by twin studies,
which showed higher concordance rates for monozygotic than for dizygotic pairs
[329, 330]. Further evidence came from the description of ethnic differences
associated to TB, namely suggesting that subjects of African ancestry are more
prone to become infected than caucasians, possibly due to differential
permissiveness of macrophages to bacilli intracellular growth [331, 332]. The
search for specific molecular pathways affected by single gene defects
predisposing to disease progression has however failed to provide specific
answers, except in the case of vulnerability to severe mycobacteriosis observed
in otherwise healthy children [333]. This rare inherited condition was named
Mendelian susceptibility to mycobacterial disease (MSMD), ranging from
localized to disseminated infections with one or more mycobacterial species,
including the most virulent M. tuberculosis [228]. The first reports occurred with
children with impaired IL-12-dependent cellular response due to autosomal

Chapter 1 | General Introduction
31
recessive IL-12Rb1 deficiency [334-336]. Other MSMD-causing mutations have
been described in autosomal (IFNGR1, IFNGR2, IL12B, STAT1, IRF8, ISG15) and
X-linked (NEMO, CYBB) genes [337-341], which are all physiologically related, as
they all result in an impairment of the CD4 T cell-mediated immunity. MSMD
provided decisive evidence on the critical protective role of the IL-12/IL-23/IFN-g
loop, that was further confirmed in the context of secondary immunodeficiencies,
such as in HIV infection.
Figure I.6 – Heterogeneity of outcomes after M. tuberculosis exposure. Although roughly 10 million new tuberculosis (TB) cases are still reported every year, it is thought to represent only a minor proportion of individuals exposed. As many as 70% of people exposed do not get infected, which can be explained in different ways: (a) the new host presents an highly effective innate immune response capable of rapidly clearing the infection, without developing a detectable adaptive immune response, i.e., negative tuberculin skin test (TST) and/or IFN-g release assay (IGRA) results; (b) environmental factors that decrease the transmissibility of airborne contaminated droplets; (c) infection dose or time exposed was insufficient to lead to infection. It is estimated that nearly 2 billion people of the world’s population contain the infection in a dormant asymptomatic state. The majority of these (around 90%) will keep this latent TB under the control of an effective innate and adaptive immune response. Some of these will clear the infection, but will still demonstrate reactivity to mycobacterial antigens with TST and/or IGRA. However, 5-10% will develop active TB during their lifetime (half during the first 2 years after infection), usually triggered by an immunosuppressive event. Other precipitating factors include metabolic diseases, life habits and host genetics. Increasing evidence suggests bacteria diversity as major player in the TB pathogenesis. Developed and expanded from the work by O’Garra et al. [154].
Chapter 1 | General Introduction
32
In the case of adult patients, genetic studies did not show any major
susceptibility locus [342, 343] and remarkably no variants of genes from the IL-
12/IFN-g axis have been consistently found [310, 343]. Nevertheless, several
specific candidate gene-based studies were performed over the years and a
number of genetic variants were associated with TB susceptibility. This is the case
of NRAMP1, DC-SIGN, TLRs, vitamin D receptor, TNF, IL-1β, IL-10 or some HLA
class II molecules [310, 344, 345]. Remarkably, these data remain largely
inconsistent, with studies in some populations reporting association with TB
susceptibility and others not [310, 311, 346]. As an example, different
polymorphisms in the human TLR2 gene were reported to associate with
increased susceptibility to TB [347-350], whereas such association was not
observed in other studies [351-354]. This discrepancy might be explained on the
basis of a dynamic host-pathogen genetic and pathogen phenotypic interplay
[145]. This example calls for the need of integrating the pathogen genotype in
human genetic association studies. More recently, the rise of genome-wide
association studies (GWAS) allowed the unbiased identification of numerous
SNPs with impact on pulmonary TB risk [355-363]. However, results did not
support previous candidate-based studies and so far have not been validated on
different populations [344, 363]. In all, the lack of clear genetic variants
associated with TB susceptibility most likely reflects the fact that adult pulmonary
TB is associated with complex genetic traits, where gene-gene interactions
(epistasis) and extrinsic factors play a far more important role in an individual's
susceptibility to develop the disease than single polymorphisms on their own
[364, 365].
4.2. The modulation of the immune response by extrinsic factors
Evidence shows that the progression from LTBI to pulmonary TB in adults
usually reflects an impairment of host resistance due to non-genetic factors, such
as aging, life habits, AIDS, diabetes or other comorbidities [36]. The converging
point of these extrinsic factors is the immune imbalance they impose to the host.
Recent changes in the human population are, through these factors, changing the
Chapter 1 | General Introduction
33
face of the TB epidemics, in many cases contributing to increase the number of
new active TB cases [366, 367]. However, for most of these factors much more
research is needed to understand the molecular basis of the interaction.
4.2.1. Coinfections
A role for coinfection with other pathogens during infection and
transmission of TB has been addressed. A major driver of the current TB
epidemics has been the HIV syndemic, as it dramatically decreases the host
protective responses to TB in a CD4+ T cell count dependent manner [12].
However, the risk of developing TB is largely increased in HIV infected individuals
even before CD4+ T cell count decreases [368, 369]. TB/HIV coinfection is
complex and leads to an acceleration of both diseases. The pathogenesis of TB is
different in HIV-coinfected individuals [369, 370] resulting in the lack of cavitation
[371, 372] and in a higher incidence of disseminated disease [373, 374]. A direct
impact of HIV infection in M. tuberculosis physiology has been recently drawn.
Coinfected individuals seem to have a detrimental alternative activation of
macrophages, with less NO expression and poorly-formed granulomas, which in
turn down-regulates M. tuberculosis DosR regulon [375], a set of genes known to
be induced during anaerobic dormancy [376]. Therefore, changes in the host
immunity resulting from HIV coinfection may remodel the bacteria functioning,
which further rewires the host tissue micro-environment.
Other less studied coinfections with impact on TB include helminths, flu
and Helicobacter pylori. In TB patients coinfected with helminths a more advanced
form of disease was reported [377], possibly related with decreased Th1 and
Th17 cell responses and increased secretion of IL-10 [378, 379]. In the case of
influenza, the increased susceptibility to M. tuberculosis infection is mediated by
type I IFN signalling [380]. Contrastingly, infection with the ubiquitous bacteria
H. pylori may help to avoid progression to active TB in latent individuals due to
enhanced IFN-γ and other Th1-like cytokine responses generated in response to
H. pylori and that restrain M. tuberculosis [381]. It is interesting that of these three

Chapter 1 | General Introduction
34
infections only influenza is also a lung disease, thus indicating that distant events
also shape the lung micro-environment.
4.2.2. The host microbiome
Not only coinfections with other pathogens, but also alterations in the
commensal bacterial populations of the host may impact the outcome of TB. This
is not surprising, considering that the microbiota composition plays an important
role at the immunological level, by shaping the early development of the immune
system, so that it can develop balanced responses to infections [382]. Using
mouse models of infections depleted of commensal gut microbiota after
antibiotic treatment, it has been shown that the risk of colonization by respiratory
pathogens, like Streptococcus pneumoniae [383], Staphylococcus aureus [384]
and Klebsiella pneumoniae, increased [385]. Limited available data suggest that
the gut microbiota of mice infected with M. tuberculosis also changes drastically
[386]. Furthermore, early studies in this topic reported an increase in the lung
bacterial burden in germ-free mice early post M. tuberculosis infection [387].
Thus, specific microbiota may distally alter the local environment and eventually
the course of disease. How the intestinal microbiota distally affects pulmonary
immunity and how the gut-lung axis may impact TB await further research.
While the effects of the microbiota of the gut on health status have been
well established [388], we are still very far from understanding the composition
and the impact of changes in the oral-nasal cavity and the lung microbiota [389].
When M. tuberculosis firstly infects the host it has to find its way to the lower
respiratory tract, where it will establish infection and resort to a collection of
immune evasion strategies [154]. So, M. tuberculosis has to initially evade
microbiota-activated macrophages of the upper respiratory tract [390]. It
remains to be seen if the presence/absence of certain species in the upper
respiratory airway generates a more permissive environment for the
establishment of TB infection. Thus, restoring key players of the microbiota may
help to fight invasion or even improve immunity, possibilities not yet explored in
Chapter 1 | General Introduction
35
TB infection [391]. Compared with the gut microbiome studies, the lung
microbiome is still in its infancy and remains an exciting area for future research.
4.2.3. Non-communicable comorbidities
Among the non-communicable comorbidities, diabetes stands out as a
major risk factor for TB. Diabetic patients have a three times higher risk of
developing TB than healthy individuals [392, 393]. Owing to the dimension of the
diabetes epidemics, predicted to affect 552 million individuals in the world by
2030 [394], its predicted impact on the global numbers of TB cases is therefore
alarming. This is particularly worrying as the prevalence of diabetes is increasing
in TB-endemic areas, thus putting at risk a considerable number of individuals.
Not only does diabetes increase the risk for TB, but it also worsens disease
severity [395], is a risk factor for death in TB patients [396, 397] and is associated
with increased failure of standard TB treatment [395, 398, 399]. Evidence coming
from human patients and experimental models of infection suggest that the
interaction of M. tuberculosis with macrophages and DCs is impaired in the
context of diabetes, leading to an initial hypo-inflammatory state [400-403]. Once
the infection is established, there is evidence for increased inflammation in
diabetic TB patients, as an augmented level of pro-inflammatory cytokines in the
peripheral blood is measured, likely due to hyperactive T cell responses [401-
403].
Similarly to diabetes, other chronic diseases are expected to increase
globally in prevalence over the coming years. This is the case of chronic
obstructive pulmonary disease (COPD) [404], specially in developing countries
with high TB incidence [405]. Studies also showed that subjects with COPD have
greater risk to undergo the latent M. tuberculosis infection to active disease
transition [406, 407] and they also die more compared to TB patients without
this comorbid condition [396, 406]. It is clear that COPD and TB share a few
common risk factors, such as smoking and malnutrition [408]. Nevertheless,
impaired lung function due to COPD itself has been associated with increased
risk of TB, after adjusting for confounding factors, like smoking or corticosteroids
use [409]. COPD is characterized by a disruption of defence mechanisms that
Chapter 1 | General Introduction
36
increase susceptibility to lower respiratory tract bacterial infections, including M.
tuberculosis. These include decreased mucocilliary clearance of the airways and
impaired macrophage phagocytosis [410, 411], as well as adaptive immune
function impairment, as a result of the frail effector T cell response to bacterial
antigens and accumulation of suppressive Tregs. At the cytokine level, circulating
levels of Treg-generated cytokines IL-10 and TGF-ß are elevated [412].
In populations with high incidence of TB, there have been an increased
number of TB cases reported in patients treated with TNF antagonists [413]. TNF
is a potent inducer of tissue destruction associated with autoimmune diseases,
but it is also a critical cytokine involved in the control of M. tuberculosis, as already
mentioned above. Consequently, the risk of reactivation of latent TB is 1.6-25.2
times higher in rheumatoid arthritis patients receiving biologic inhibitors of TNF
activity, compared to conventional immunosuppressive therapy [261, 413, 414].
For that reason, currently all national guidelines recommend the exclusion of
active TB disease and LTBI in patients in whom anti-TNF therapy is considered
[414].
4.2.4. Environmental factors
Smoking exposure is an independent risk factor for M. tuberculosis
infection, progression to active disease and for poor treatment outcomes [415-
417]. The immunological mechanisms are just starting to be unveiled and include
reduced production of TNF, IL-1β and IFN-g by in vitro infected alveolar
macrophages [418], decreased number of DCs [419, 420] and compromised
recruitment of CD4+IFN-γ+ T cells to the lung, thus weakening the formation of
granuloma [421]. More recently, alveolar macrophages from smokers were found
to exhibit lysosomal accumulations of tobacco smoke particulates, which
impaired their migration towards M. tuberculosis-infected cells [422].
Alcohol consumption has also been pointed as a predisposing factor to M.
tuberculosis infection and to greater progression from initial infection to active
disease [423-425]. The mechanism of susceptibility was partially exposed in a
mouse study, where consumption of a liquid ethanol diet for 9 weeks blunted the
Chapter 1 | General Introduction
37
CD4+ and CD8+ T-cells responses and resulted in significantly higher bacterial
burden in the lung [426]. Other study also identified impaired lung CD4+ and
draining lymph node T-cell IFN-g responses of alcohol-consuming mice compared
with control mice [427].
One of the oldest described associations with TB has been the poor
nutritional status, although it remains unclear whether malnutrition is a cause or
a consequence of the disease [428]. It is known, however, the dismal impact that
nutritional deprivation has on immune dysregulation [429]. This association is
even worse in the framework of HIV infection [430]. Nutritional status not only
can affect the function of T cells and other immune cells, but in addition impacts
the pharmacodynamics of the drugs [431]. One particular nutrient, vitamin D,
has been the focus of renewed attention by researchers [432, 433]. Historically,
both vitamin D and exposure to sunlight, which endogenously promotes the
conversion in the skin of 7-dehydrocholesterol into pre-vitamin D3, were used in
the treatment of TB [434]. Insufficiency of this molecule has been linked to higher
risk of active TB [435, 436] and increased propensity for extrapulmonary
involvement [437]. Therefore, variation in sunlight may be behind some of the
differences in TB incidence rate and clinical manifestations across the globe
[435]. The immunomodulatory role of vitamin D is well established both during
innate and adaptive immune responses leading to several changes in immune
responses, including the induction of cathelicidin antimicrobial peptide (CAMP),
beta-defensin and the promotion of authophagy and/or bacterial killing [438,
439]. Finally, vitamin D levels have been shown to impact adaptive immune
responses by influencing Th cell function and by promoting Tregs [440]. Despite
all the evidence, several clinical trials have shown that supplementation of drug
regimens with vitamin D does not improve TB outcomes in general population
[441], but it has been shown to accelerate sputum conversion in patients with
the tt genotype of the Taql vitamin D receptor (VDR) polymorphism [442]. It
remains to be seen if supplementation with vitamin D can play a role in
preventing infection or progress to active TB.
Chapter 1 | General Introduction
38
5. Concluding remarks
The complexity of TB pathogenesis and natural history of infection, the
perfect adaptation of M. tuberculosis to the human host and the incredibly high
number of factors that impact on the disease, make the understanding of TB one
of the greater challenges in research. It remains to be explained why only few
individuals exposed develop active disease, whereas the majority will either clear
the infection or become latently infected (Figure I.6) [443]. Most interestingly,
even among the active TB patients, the clinical manifestation of disease is highly
variable, with mild to extensive pulmonary involvement (Figure I.7),
extrapulmonary and disseminated forms. So, TB is not a unique type of disease,
but instead a continuous spectrum of TB likely exists [444]. While the exact
mechanisms governing the transitions along the M. tuberculosis infection stages
are still unknown, many observations indicate a role for the imbalances of the
host immune response. The best evidence supporting this thesis is the case of
latent to active disease transition due to acquired immunosuppressive conditions,
such as HIV coinfection and anti-TNF treatment, as previously described.
Nevertheless, the immune condition of an infected subject is probably shaped by
many other factors, including host genetics and by extrinsic factors that alter the
local micro-environment [36], but also by the heterogeneity of the infecting
bacteria [445]. Altogether, this troika determines the threshold of the immune
response generated during infection and consequently the disease outcome.
Modulating these thresholds and uncovering the links between host, pathogen
and micro-environments should allow for the discovery of solid correlates of
protection, molecular markers for disease prognosis, and the development of safe
and effective HDT to TB [446-448].
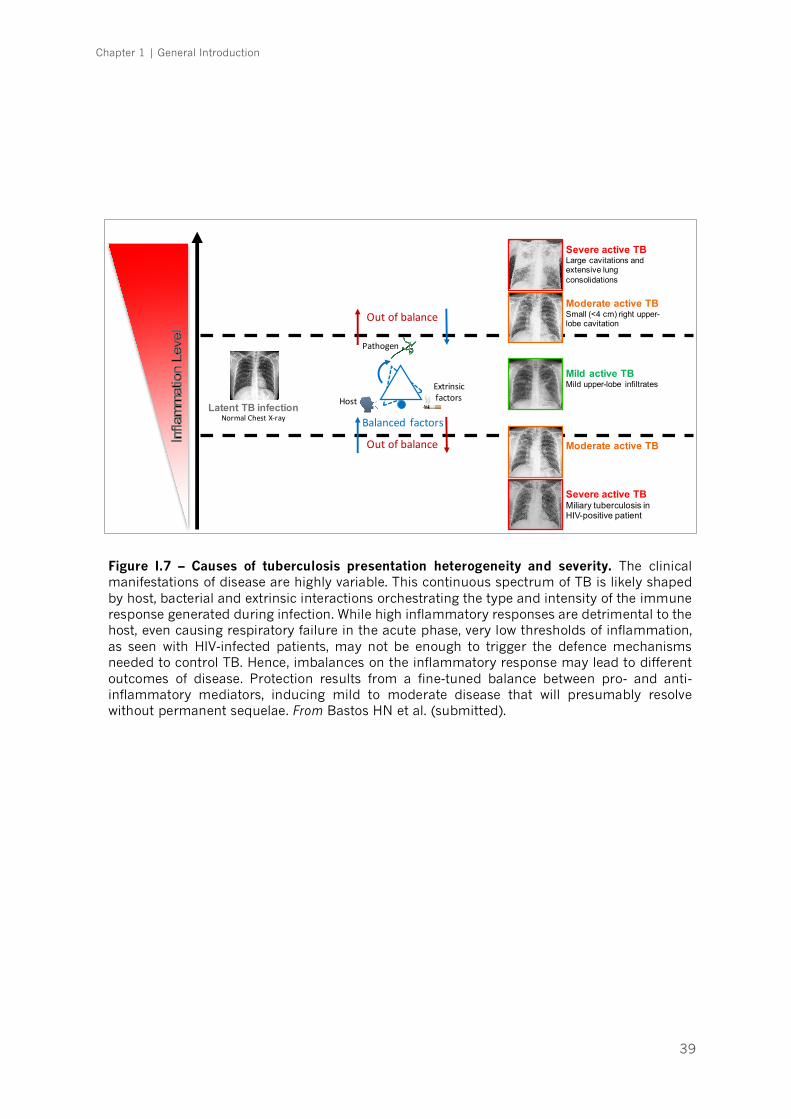
Chapter 1 | General Introduction
39
! "Host
Pathogen
Extrinsicfactors
Balanced factors
Outofbalance
Outofbalance
Severe active TBMiliary tuberculosis in HIV-positive patient
Severe active TBLarge cavitations and extensive lung consolidations
Moderate active TBSmall (<4 cm) right upper-lobe cavitation
Mild active TBMild upper-lobe infiltrates
Moderate active TB
Latent TB infectionNormalChestX-ray
Figure I.7 – Causes of tuberculosis presentation heterogeneity and severity. The clinical manifestations of disease are highly variable. This continuous spectrum of TB is likely shaped by host, bacterial and extrinsic interactions orchestrating the type and intensity of the immune response generated during infection. While high inflammatory responses are detrimental to the host, even causing respiratory failure in the acute phase, very low thresholds of inflammation, as seen with HIV-infected patients, may not be enough to trigger the defence mechanisms needed to control TB. Hence, imbalances on the inflammatory response may lead to different outcomes of disease. Protection results from a fine-tuned balance between pro- and anti-inflammatory mediators, inducing mild to moderate disease that will presumably resolve without permanent sequelae. From Bastos HN et al. (submitted).
Chapter 1 | General Introduction
40
REFERENCES
1. Rubin SA. Tuberculosis. Captain of all these men of death. Radiol Clin North Am. 1995;33(4):619-39. 2. Villemin JA. Études expérimentales et cliniques sur tuberculose. Paris: Ballière et Fils; 1868. 3. Koch R. Die Aetiologie der Tuberculose. Berl Klin Wochenschr 1882;19:221–30. 4. Murray JF, Schraufnagel DE, Hopewell PC. Treatment of Tuberculosis. A Historical Perspective. Ann Am Thorac Soc. 2015;12(12):1749-59. 5. Fox GJ, Mitnick CD, Benedetti A, Chan ED, Becerra M, Chiang CY, et al. Surgery as an Adjunctive Treatment for Multidrug-Resistant Tuberculosis: An Individual Patient Data Metaanalysis. Clin Infect Dis. 2016;62(7):887-95. 6. Mitchison D, Davies G. The chemotherapy of tuberculosis: past, present and future. Int J Tuberc Lung Dis. 2012;16(6):724-32. 7. Lönnroth K, Migliori GB, Abubakar I, D'Ambrosio L, de Vries G, Diel R, et al. Towards tuberculosis elimination: an action framework for low-incidence countries. Eur Respir J. 2015;45(4):928-52. 8. World Health Organization. Global tuberculosis report 2016. Geneva: World Health Organization; 2016. 9. Houben RM, Dodd PJ. The Global Burden of Latent Tuberculosis Infection: A Re-estimation Using Mathematical Modelling. PLoS Med. 2016;13(10):e1002152. 10. Dye C, Glaziou P, Floyd K, Raviglione M. Prospects for tuberculosis elimination. Annu Rev Public Health. 2013;34:271-86. 11. Hermans S, Horsburgh CR Jr, Wood R. A century of tuberculosis epidemiology in the northern and southern hemisphere: The differential impact of control interventions. PLoS One. 2015;10(8):e0135179. 12. Kwan CK, Ernst JD. HIV and tuberculosis: a deadly human syndemic. Clin Microbiol Rev. 2011;24(2):351-76. 13. Raviglione MC, Pio A. Evolution of WHO policies for tuberculosis control, 1948-2001. Lancet. 2002;359(9308):775-80. 14. Lange C, Abubakar I, Alffenaar JW, Bothamley G, Caminero JA, Carvalho AC, et al. Management of patients with multidrug-resistant/extensively drug-resistant tuberculosis in Europe: a TBNET consensus statement. Eur Respir J. 2014;44(1):23-63. 15. World Health Organization. Tuberculosis: a global emergency. World Health Forum. 1993;14(4):438. 16. Jassal MS, Bishai WR. Epidemiology and challenges to the elimination of global tuberculosis. Clin Infect Dis. 2010;50(Suppl 3):S156-64. 17. Glaziou P, Floyd K, Korenromp EL, Sismanidis C, Bierrenbach AL, Williams BG, et al. Lives saved by tuberculosis control and prospects for achieving the 2015 global target for reducing tuberculosis mortality. Bull World Health Organ. 2011;89(8):573-82. 18. Colditz GA, Brewer TF, Berkey CS, Wilson ME, Burdick E, Fineberg HV, et al. Efficacy of BCG vaccine in the prevention of tuberculosis. Meta-analysis of the published literature. JAMA. 1994;271(9):698-702. 19. Wejse C. Tuberculosis elimination in the post Millennium Development Goals era. Int J Infect Dis. 2015;32:152-5. 20. Ahsan MJ. Recent advances in the development of vaccines for tuberculosis. Ther Adv Vaccines. 2015;3(3):66-75. 21. Karp CL, Wilson CB, Stuart LM. Tuberculosis vaccines: barriers and prospects on the quest for a transformative tool. Immunol Rev. 2015;264(1):363-81. 22. Kaufmann SH, Evans TG, Hanekom WA. Tuberculosis vaccines: time for a global strategy. Sci Transl Med. 2015;7(276):276fs8. 23. Weiner J 3rd, Kaufmann SH. Recent advances towards tuberculosis control: vaccines and biomarkers. J Intern Med. 2014;275(5):467-80. 24. Getahun H, Matteelli A, Chaisson RE, Raviglione M. Latent Mycobacterium tuberculosis infection. N Engl J Med. 2015;372(22):2127-35.

Chapter 1 | General Introduction
41
25. Pai M, Riley LW, Colford JM Jr. Interferon-gamma assays in the immunodiagnosis of tuberculosis: a systematic review. Lancet Infect Dis. 2004;4(12):761-76. 26. Mori T, Sakatani M, Yamagishi F, Takashima T, Kawabe Y, Nagao K, et al. Specific detection of tuberculosis infection: an interferon-gamma-based assay using new antigens. Am J Respir Crit Care Med. 2004;170(1):59-64. 27. Grimes CZ, Hwang LY, Williams ML, Austin CM, Graviss EA. Tuberculosis infection in drug users: interferon-gamma release assay performance. Int J Tuberc Lung Dis. 2007;11(11):1183-9. 28. Arlehamn CS, Sidney J, Henderson R, Greenbaum JA, James EA, Moutaftsi M, et al. Dissecting mechanisms of immunodominance to the common tuberculosis antigens ESAT-6, CFP10, Rv2031c (hspX), Rv2654c (TB7.7), and Rv1038c (EsxJ). J Immunol. 2012;188(10):5020-31. 29. Menzies D, Pai M, Comstock G. Meta-analysis: new tests for the diagnosis of latent tuberculosis infection: areas of uncertainty and recommendations for research. Ann Intern Med. 2007;146(5):340-54. 30. Goletti D, Sanduzzi A, Delogu G. Performance of the tuberculin skin test and interferon-γ release assays: an update on the accuracy, cutoff stratification, and new potential immune-based approaches. J Rheumatol Suppl. 2014;91:24-31. 31. Sester M, van Leth F, Bruchfeld J, Bumbacea D, Cirillo DM, Dilektasli AG, et al. Risk assessment of tuberculosis in immunocompromised patients. A TBNET study. Am J Respir Crit Care Med. 2014;190(10):1168-76. 32. Diel R, Loddenkemper R, Nienhaus A. Predictive value of interferon-γ release assays and tuberculin skin testing for progression from latent TB infection to disease state: a meta-analysis. Chest. 2012;142(1):63-75. 33. You E, Kim MH, Lee WI, Kang SY. Evaluation of IL-2, IL-10, IL-17 and IP-10 as potent discriminative markers for active tuberculosis among pulmonary tuberculosis suspects. Tuberculosis. 2016;99:100-8. 34. Vanini V, Petruccioli E, Gioia C, Cuzzi G, Orchi N, Rianda A, et al. IP-10 is an additional marker for tuberculosis (TB) detection in HIV-infected persons in a low-TB endemic country. J Infect. 2012;65(1):49-59. 35. Wergeland I, Pullar N, Assmus J, Ueland T, Tonby K, Feruglio S, et al. IP-10 differentiates between active and latent tuberculosis irrespective of HIV status and declines during therapy. J Infect. 2015;70(4):381-91. 36. Esmail H, Barry CE 3rd, Young DB, Wilkinson RJ. The ongoing challenge of latent tuberculosis. Philos Trans R Soc Lond B Biol Sci. 2014;369(1645):20130437. 37. Petruccioli E, Scriba TJ, Petrone L, Hatherill M, Cirillo DM, Joosten SA, et al. Correlates of tuberculosis risk: predictive biomarkers for progression to active tuberculosis. Eur Respir J. 2016;48(6):1751-63. 38. Zak DE, Penn-Nicholson A, Scriba TJ, Thompson E, Suliman S, Amon LM, et al. A blood RNA signature for tuberculosis disease risk: a prospective cohort study. Lancet. 2016;387(10035):2312-22. 39. Berry MP, Graham CM, McNab FW, Xu Z, Bloch SA, Oni T, et al. An interferon-inducible neutrophil-driven blood transcriptional signature in human tuberculosis. Nature. 2010;466(7309):973-7. 40. Bloom CI, Graham CM, Berry MP, Rozakeas F, Redford PS, Wang Y, et al. Transcriptional blood signatures distinguish pulmonary tuberculosis, pulmonary sarcoidosis, pneumonias and lung cancers. PLoS One. 2013;8(8):e70630. 41. Kaforou M, Wright VJ, Oni T, French N, Anderson ST, Bangani N, et al. Detection of tuberculosis in HIV-infected and -uninfected African adults using whole blood RNA expression signatures: a case-control study. PLoS Med. 2013;10(10):e1001538. 42. Kaforou M, Wright VJ, Levin M. Host RNA signatures for diagnostics: an example from paediatric tuberculosis in Africa. J Infect. 2014;69(Suppl 1):S28-31. 43. Boehme CC, Nicol MP, Nabeta P, Michael JS, Gotuzzo E, Tahirli R, et al. Feasibility, diagnostic accuracy, and effectiveness of decentralised use of the Xpert MTB/RIF test for diagnosis of tuberculosis and multidrug resistance: a multicentre implementation study. Lancet. 2011;377(9776):1495-505.
Chapter 1 | General Introduction
42
44. World Health Organization. Same-day diagnosis of tuberculosis by microscopy: policy statement 2011 [4 Sep 2016]. Available from: http://www.ncbi.nlm.nih.gov/books/NBK131903/. 45. Jensen PA, Lambert LA, Iademarco MF, Centers for Disease Control and Prevention. Guidelines for preventing the transmission of Mycobacterium tuberculosis in health-care settings, 2005. MMWR. 2005;54(RR-17):1–141. 46. Mase SR, Ramsay A, Ng V, Henry M, Hopewell PC, Cunningham J, et al. Yield of serial sputum specimen examinations in the diagnosis of pulmonary tuberculosis: a systematic review. Int J Tuberc Lung Dis. 2007;11(5):485–95. 47. Rieder HL, Chiang CY, Rusen ID. A method to determine the utility of the third diagnostic and the second follow-up sputum smear examinations to diagnose tuberculosis cases and failures. Int J Tuberc Lung Dis. 2005;9(4):384-91. 48. Hooja S, Pal N, Malhotra B, Goyal S, Kumar V, Vyas L. Comparison of Ziehl Neelsen & Auramine O staining methods on direct and concentrated smears in clinical specimens. Indian J Tuberc. 2011;58(2):72-6. 49. Steingart KR, Henry M, Ng V, Hopewell PC, Ramsay A, Cunningham J, et al. Fluorescence versus conventional sputum smear microscopy for tuberculosis: a systematic review. Lancet Infect Dis. 2006;6(9):570-81. 50. World Health Organization. Fluorescent Light-Emitting Diode (LED) Microscopy for Diagnosis of Tuberculosis: Policy Statement. Geneva 2011. 51. World Health Organization. Guidelines for treatment of tuberculosis - 4rd edition Geneva: World Health Organization; 2010. 52. Hargreaves NJ, Kadzakumanja O, Whitty CJM, Salaniponi FML, Harries AD, Squire SB. “Smear-negative” pulmonary tuberculosis in a DOTS programme: poor outcomes in an area of high HIV seroprevalence. Int J Tuberc Lung Dis. 2001;5(9):847–54. 53. Toman K, Frieden T, Toman K. World Health Organization. Toman’s tuberculosis: case detection, treatment, and monitoring: questions and answers. Organization WH, editor. Geneva2004. 54. Cruciani M, Scarparo C, Malena M, Bosco O, Serpelloni G, Mengoli C. Meta-analysis of BACTEC MGIT 960 and BACTEC 460 TB, with or without solid media, for detection of mycobacteria. J Clin Microbiol. 2004;42(5):2321-5. 55. Williams-Bouyer N, Yorke R, Lee HI, Woods GL. Comparison of the BACTEC MGIT 960 and ESP culture system II for growth and detection of mycobacteria. J Clin Microbiol. 2000;38(11):4167-70. 56. World Health Organization. Expert group meeting on the use of liquid culture media. Use of liquid TB culture and drug susceptibility testing (DST) in low and medium income settings 2007 [4 Sep 2016]. Available from: http://www.who.int/tb/laboratory/use_of_liquid_tb_culture_summary_report.pdf?ua=1. 57. World Health Organization. Molecular line probe assays for rapid screening of patients at risk of multidrug-resistant tuberculosis (MDR-TB): Policy Statement. Committee WGAbtGR, editor. Geneva2008. 58. Boehme CC, Nabeta P, Hillemann D, Nicol MP, Shenai S, Krapp F, et al. Rapid molecular detection of tuberculosis and rifampin resistance. N Engl J Med. 2010;363(11):1005-15. 59. Steingart KR, Schiller I, Horne DJ, Pai M, Boehme CC, Dendukuri N. Xpert® Mtb/Rif assay for pulmonary tuberculosis and rifampicin resistance in adults. Cochrane Database Syst Rev. 2014;1:1–166. 60. Lawn SD, Nicol MP. XpertR MTB/RIF assay: development, evaluation and implementation of a new rapid molecular diagnostic for tuberculosis and rifampicin resistance. Future Microbiol. 2011;6(9):1067–82. 61. Theron G, Zijenah L, Chanda D, Clowes P, Rachow A, Lesosky M, et al. Feasibility, accuracy, and clinical effect of point-of-care Xpert MTB/RIF testing for tuberculosis in primary-care settings in Africa: a multicentre, randomised, controlled trial. Lancet. 2014;383(9915):424–35. 62. Churchyard GJ, Stevens WS, Mametja LD, McCarthy KM, Chihota V, Nicol MP, et al. Xpert MTB/RIF versus sputum microscopy as the initial diagnostic test for tuberculosis: a cluster-randomised trial embedded in South African roll-out of Xpert MTB/RIF. The Lancet Global Health. 2015;3(8):e450–7. 63. Dheda K, Barry CE 3rd, Maartens G. Tuberculosis. Lancet. 2016;387(10024):1211-26.

Chapter 1 | General Introduction
43
64. Johnson JL, Hadad DJ, Dietze R, Maciel EL, Sewali B, Gitta P, et al. Shortening treatment in adults with noncavitary tuberculosis and 2-month culture conversion. Am J Respir Crit Care Med. 2009;180(6):558-63. 65. Wang JY, Wang JT, Tsai TH, Hsu CL, Yu CJ, Hsueh PR, et al. Adding moxifloxacin is associated with a shorter time to culture conversion in pulmonary tuberculosis. Int J Tuberc Lung Dis. 2010;14(1):65-71. 66. Dorman SE, Johnson JL, Goldberg S, Muzanye G, Padayatchi N, Bozeman L, et al. Substitution of moxifloxacin for isoniazid during intensive phase treatment of pulmonary tuberculosis. Am J Respir Crit Care Med. 2009;180(3):273-80. 67. Conde MB, Efron A, Loredo C, De Souza GR, Graça NP, Cezar MC, et al. Moxifloxacin versus ethambutol in the initial treatment of tuberculosis: a double-blind, randomised, controlled phase II trial. Lancet. 2009;373(9670):1183-9. 68. Rustomjee R, Lienhardt C, Kanyok T, Davies GR, Levin J, Mthiyane T, et al. A Phase II study of the sterilising activities of ofloxacin, gatifloxacin and moxifloxacin in pulmonary tuberculosis. Int J Tuberc Lung Dis. 2008;12(2):128-38. 69. Burman WJ, Goldberg S, Johnson JL, Muzanye G, Engle M, Mosher AW, et al. Moxifloxacin versus ethambutol in the first 2 months of treatment for pulmonary tuberculosis. Am J Respir Crit Care Med. 2006;174(3):331-8. 70. Gillespie SH, Crook AM, McHugh TD, Mendel CM, Meredith SK, Murray SR, et al. Four-month moxifloxacin-based regimens for drug-sensitive tuberculosis. N Engl J Med. 2014;371(17):1577-87. 71. Merle CS, Fielding K, Sow OB, Gninafon M, Lo MB, Mthiyane T, et al. A four-month gatifloxacin-containing regimen for treating tuberculosis. N Engl J Med. 2014;371(17):1588-98. 72. Jindani A, Harrison TS, Nunn AJ, Phillips PP, Churchyard GJ, Charalambous S, et al. High-dose rifapentine with moxifloxacin for pulmonary tuberculosis. N Engl J Med. 2014;371(17):1599-608. 73. Wallis RS, Maeurer M, Mwaba P, Chakaya J, Rustomjee R, Migliori GB, et al. Tuberculosis--advances in development of new drugs, treatment regimens, host-directed therapies, and biomarkers. Lancet Infect Dis. 2016;16(4):e34-46. 74. Kakkar AK, Dahiya N. Bedaquiline for the treatment of resistant tuberculosis: promises and pitfalls. Tuberculosis. 2014;94(4):357-62. 75. Gupta R, Geiter LJ, Wells CD, Gao M, Cirule A, Xiao H. Delamanid for Extensively Drug-Resistant Tuberculosis. N Engl J Med. 2015;373(3):291-2. 76. Zumla AI, Gillespie SH, Hoelscher M, Philips PP, Cole ST, Abubakar I, et al. New antituberculosis drugs, regimens, and adjunct therapies: needs, advances, and future prospects. Lancet Infect Dis. 2014;14(4):327-40. 77. Gagneux S. Host–pathogen coevolution in human tuberculosis. Phil Trans R Soc B. 2012;367(1590):850–9. 78. de Jong BC, Antonio M, Gagneux S. Mycobacterium africanum–review of an important cause of human tuberculosis in West Africa. PLoS Negl Trop Dis. 2010;4:e744. 79. Aboubaker Osman D, Bouzid F, Canaan S, Drancourt M. Smooth Tubercle Bacilli: Neglected Opportunistic Tropical Pathogens. Front Public Health. 2016;3:283. 80. Smith NH, Kremer K, Inwald J, Dale J, Driscoll JR, Gordon SV, et al. Ecotypes of the Mycobacterium tuberculosis complex. J Theor Biol. 2006;239(2):220-5. 81. Wayne LG, Kubica GP. The Mycobacteria. Bergey's manual of systematic bacteriology. 1986;2:1435–57. 82. North RJ, Jung YJ. Immunity to tuberculosis. Annu Rev Immunol. 2004;22:599-623. 83. Brennan PJ, Nikaido H. The envelope of mycobacteria. Annual Review of Biochemistry. 1995;64:29–63. 84. Beste DJ, Espasa M, Bonde B, Kierzek AM, Stewart GR, McFadden J. The genetic requirements for fast and slow growth in mycobacteria. PLoS One. 2009;4(4):e5349. 85. Cole ST, Brosch R, Parkhill J, Garnier T, Churcher C, Harris D, et al. Deciphering the biology of Mycobacterium tuberculosis from the complete genome sequence. Nature. 1998;393(6685):537-44. 86. Eldholm V, Norheim G, von der Lippe B, Kinander W, Dahle UR, Caugant DA, et al. Evolution of extensively drug-resistant Mycobacterium tuberculosis from a susceptible ancestor in a single patient. Genome Biol. 2014;15(11):490.
Chapter 1 | General Introduction
44
87. David HL. Probability distribution of drug-resistant mutants in unselected populations of Mycobacterium tuberculosis. Appl Microbiol. 1970;20(5):810-4. 88. Ford CB, Lin PL, Chase MR, Shah RR, Iartchouk O, Galagan J, et al. Use of whole genome sequencing to estimate the mutation rate of Mycobacterium tuberculosis during latent infection. Nat Genet. 2011;43(5):482-6. 89. Kamerbeek J, Schouls L, Kolk A, van Agterveld M, van Soolingen D, Kuijper S, et al. Simultaneous detection and strain differentiation of Mycobacterium tuberculosis for diagnosis and epidemiology. J Clin Microbiol. 1997;35:907–14. 90. Supply P, Allix C, Lesjean S, Cardoso-Oelemann M, Rüsch-Gerdes S, Willery E, et al. Proposal for standardization of optimized mycobacterial interspersed repetitive unit-variable-number tandem repeat typing of Mycobacterium tuberculosis. J Clin Microbiol. 2006;44:4498–510. 91. Stucki D, Malla B, Hostettler S, Huna T, Feldmann J, Yeboah-Manu D, et al. Two new rapid SNP-typing methods for classifying Mycobacterium tuberculosis complex into the main phylogenetic lineages. PLoS One. 2012;7:e41253. 92. Gagneux S, DeRiemer K, Van T, Kato-Maeda M, de Jong BC, Narayanan S, et al. Variable host-pathogen compatibility in Mycobacterium tuberculosis. Proc Natl Acad Sci U S A. 2006;103(8):2869-73. 93. Comas I, Chakravartti J, Small PM, Galagan J, Niemann S, Kremer K, et al. Human T cell epitopes of Mycobacterium tuberculosis are evolutionarily hyperconserved. Nat Genet. 2010;42:498-503. 94. Firdessa R, Berg S, Hailu E, Schelling E, Gumi B, Erenso G, et al. Mycobacterial lineages causing pulmonary and extrapulmonary tuberculosis, Ethiopia. Emerg Infect Dis. 2013;19(3):460-3. 95. Comas I, Coscolla M, Luo T, Borrell S, Holt KE, Kato-Maeda M, et al. Out-of-Africa migration and Neolithic coexpansion of Mycobacterium tuberculosis with modern humans. Nat Genet. 2013;45(10):1176-82. 96. Coscolla M, Gagneux S. Consequences of genomic diversity in Mycobacterium tuberculosis. Semin Immunol. 2014;26(6):431-44. 97. Hirsh AE, Tsolaki AG, DeRiemer K, Feldman MW, Small PM. Stable association between strains of Mycobacterium tuberculosis and their human host populations. Proc Natl Acad Sci USA. 2004;101(14):4871–6. 98. Reed MB, Pichler VK, McIntosh F, Mattia A, Fallow A, Masala S, et al. Major Mycobacterium tuberculosis Lineages Associate with Patient Country of Origin. J Clin Microbiol. 2009;47(4):1119–28. 99. Hershberg R, Lipatov M, Small PM, Sheffer H, Niemann S, Homolka S, et al. High functional diversity in Mycobacterium tuberculosis driven by genetic drift and human demography. PLoS Biol. 2008;6:e311. 100. Wirth T, Hildebrand F, Allix-Beguec C, Wölbeling F, Kubica T, Kremer K, et al. Origin, spread and demography of the Mycobacterium tuberculosis complex. PLoS Pathog. 2008;4:e1000160. 101. Brisse S Gutierrez MC, Brosch R, et al. Ancient origin and gene mosaicism of the progenitor of Mycobacterium tuberculosis. PLoS Pathog. 2005;1:e5. 102. Stucki D, Brites D, Jeljeli L, Coscolla M, Liu Q, Trauner A, et al. Mycobacterium tuberculosis lineage 4 comprises globally distributed and geographically restricted sublineages. Nat Genet. 2016;48(12):1535-43. 103. Pérez-Lago L, Comas I, Navarro Y, González-Candelas F, Herranz M, Bouza E, et al. Whole genome sequencing analysis of intrapatient microevolution in Mycobacterium tuberculosis: potential impact on the inference of tuberculosis transmission. J Infect Dis. 2014;209(1):98-108. 104. Lin PL, Flynn JL. Understanding latent tuberculosis: a moving target. J Immunol. 2010;185:15-22. 105. Fleischmann RD, Alland D, Eisen JA, Carpenter L, White O, Peterson J, et al. Whole-genome comparison of Mycobacterium tuberculosis clinical and laboratory strains. J Bacteriol. 2002;184(19):5479-90. 106. Rose G, Cortes T, Comas I, Coscolla M, Gagneux S, Young DB. Mapping of genotype-phenotype diversity among clinical isolates of Mycobacterium tuberculosis by sequence-based transcriptional profiling. Genome Biol Evol. 2013;5(10):1849-62.
Chapter 1 | General Introduction
45
107. Fenner L, Egger M, Bodmer T, Furrer H, Ballif M, Battegay M, et al. HIV Infection Disrupts the Sympatric Host–Pathogen Relationship in Human Tuberculosis. PLoS Genet. 2013;9(3):e1003318. 108. Osório NS, Rodrigues F, Gagneux S, Pedrosa J, Pinto-Carbó M, Castro AG, et al. Evidence for Diversifying Selection in a Set of Mycobacterium tuberculosis Genes in Response to Antibiotic- and Nonantibiotic-Related Pressure. Mol Biol Evol. 2013;30(6):1326-36. 109. Rodrigo T, Caylà JA, García de Olalla P, Galdós-Tangüis H, Jansà JM, Miranda P, et al. Characteristics of tuberculosis patients who generate secondary cases. Int J Tuberc Lung Dis. 1997;1(4):352-7. 110. Bouley DM, Ghori N, Mercer KL, Falkow S, Ramakrishnan L. Dynamic nature of host-pathogen interactions in Mycobacterium marinum granulomas. Infect Immun. 2001;69(12):7820-31. 111. Tufariello JM, Chan J, Flynn JL. Latent tuberculosis: mechanisms of host and bacillus that contribute to persistent infection. Lancet Infect Dis. 2003;3(9):578-90. 112. da Silva J. The evolutionary adaptation of HIV-1 to specific immunity. Curr HIV Res. 2003;1(3):363-71. 113. Copin R, Coscollá M, Efstathiadis E, Gagneux S, Ernst JD. Impact of in vitro evolution on antigenic diversity of Mycobacterium bovis bacillus Calmette-Guerin (BCG). Vaccine. 2014;32(45):5998-6004. 114. Valway SE, Sanchez MP, Shinnick TF, Orme I, Agerton T, Hoy D, et al. An outbreak involving extensive transmission of a virulent strain of Mycobacterium tuberculosis. N Engl J Med. 1998;338(10):633-9. 115. Manca C, Tsenova L, Barry CE 3rd, Bergtold A, Freeman S, Haslett PA, et al. Mycobacterium tuberculosis CDC1551 induces a more vigorous host response in vivo and in vitro, but is not more virulent than other clinical isolates. J Immunol. 1999;162(11):6740-6. 116. Carmona J, Cruz A, Moreira-Teixeira L, Sousa C, Sousa J, Osorio NS, et al. Mycobacterium tuberculosis strains are differentially recognized by TLRs with an impact on the immune response. PLoS One. 2013;8(6):e67277. 117. Portevin D, Gagneux S, Comas I, Young D. Human macrophage responses to clinical isolates from the Mycobacterium tuberculosis complex discriminate between ancient and modern lineages. PLoS Pathog. 2011;7(3):e1001307. 118. Krishnan N, Malaga W, Constant P, Caws M, Tran TH, Salmons J, et al. Mycobacterium tuberculosis lineage influences innate immune response and virulence and is associated with distinct cell envelope lipid profiles. PLoS One. 2011;6(9):e23870. 119. Sarkar R, Lenders L, Wilkinson KA, Wilkinson RJ, Nicol MP. Modern lineages of Mycobacterium tuberculosis exhibit lineage-specific patterns of growth and cytokine induction in human monocyte-derived macrophages. PLoS One. 2012;7(8):e43170. 120. Wang C, Peyron P, Mestre O, Kaplan G, van Soolingen D, Gao Q, et al. Innate immune response to Mycobacterium tuberculosis Beijing and other genotypes. PLoS One. 2010;5(10):e13594. 121. Dormans J, Burger M, Aguilar D, Hernandez-Pando R, Kremer K, Roholl P, et al. Correlation of virulence, lung pathology, bacterial load and delayed type hypersensitivity responses after infection with different Mycobacterium tuberculosis genotypes in a BALB/c mouse model. Clin Exp Immunol. 2004;137(3):460–8. 122. Manca C, Tsenova L, Bergtold A, Freeman S, Tovey M, Musser JM, et al. Virulence of a Mycobacterium tuberculosis clinical isolate in mice is determined by failure to induce Th1 type immunity and is associated with induction of IFN-alpha/beta. Proc Natl Acad Sci U S A. 2001;98(10):5752-7. 123. López B, Aguilar D, Orozco H, Burger M, Espitia C, Ritacco V, et al. A marked difference in pathogenesis and immune response induced by different Mycobacterium tuberculosis genotypes. Clin Exp Immunol. 2003;133(1):30-7. 124. Dunn PL, North RJ. Virulence ranking of some Mycobacterium tuberculosis and Mycobacterium bovis strains according to their ability to multiply in the lungs, induce lung pathology, and cause mortality in mice. Infect Immun. 1995;63(9):3428-37. 125. Aguilar D, Hanekom M, Mata D, Gey van Pittius NC, van Helden PD, Warren RM, et al. Mycobacterium tuberculosis strains with the Beijing genotype demonstrate variability in virulence associated with transmission. Tuberculosis. 2010;90(5):319-25.

Chapter 1 | General Introduction
46
126. Manca C, Tsenova L, Freeman S, Barczak AK, Tovey M, Murray PJ, et al. Hypervirulent M. tuberculosis W/Beijing strains upregulate type I IFNs and increase expression of negative regulators of the Jak-Stat pathway. J Interferon Cytokine Res. 2005;25(11):694-701. 127. Divangahi M, Behar SM, Remold H. Dying to live: how the death modality of the infected macrophage affects immunity to tuberculosis. Adv Exp Med Biol. 2013;783:103-20. 128. Corleis B, Korbel D, Wilson R, Bylund J, Chee R, Schaible UE. Escape of Mycobacterium tuberculosis from oxidative killing by neutrophils. Cell Microbiol. 2012;14(7):1109-21. 129. Gehre F, Otu J, DeRiemer K, de Sessions PF, Hibberd ML, Mulders W, et al. Deciphering the growth behaviour of Mycobacterium africanum. PLoS Negl Trop Dis. 2013;7(5):e2220. 130. Homolka S, Niemann S, Russell DG, Rohde KH. Functional genetic diversity among Mycobacterium tuberculosis complex clinical isolates: delineation of conserved core and lineage-specific transcriptomes during intracellular survival. PLoS Pathog. 2010;6(7):e1000988. 131. Khatri B, Fielder M, Jones G, Newell W, Abu-Oun M, Wheeler PR. High throughput phenotypic analysis of Mycobacterium tuberculosis and Mycobacterium bovis strains' metabolism using biolog phenotype microarrays. PLoS One. 2013;8(1):e52673. 132. Portevin D, Sukumar S, Coscolla M, Shui G, Li B, Guan XL, et al. Lipidomics and genomics of Mycobacterium tuberculosis reveal lineage-specific trends in mycolic acid biosynthesis. Microbiology Open. 2014;3(6):823-35. 133. Parwati I, Alisjahbana B, Apriani L, Soetikno RD, Ottenhoff TH, van der Zanden AG, et al. Mycobacterium tuberculosis Beijing genotype is an independent risk factor for tuberculosis treatment failure in Indonesia. J Infect Dis. 2010;201(4):553-7. 134. Lan NT, Lien HT, Tung le B, Borgdorff MW, Kremer K, van Soolingen D. Mycobacterium tuberculosis Beijing genotype and risk for treatment failure and relapse, Vietnam. Emerg Infect Dis. 2003;9(12):1633-5. 135. Sun YJ, Lee AS, Wong SY, Paton NI. Association of Mycobacterium tuberculosis Beijing genotype with tuberculosis relapse in Singapore. Epidemiol Infect. 2006;134(2):329-32. 136. Kato-Maeda M, Kim EY, Flores L, Jarlsberg LG, Osmond D, Hopewell PC. Differences among sublineages of the East-Asian lineage of Mycobacterium tuberculosis in genotypic clustering. Int J Tuberc Lung Dis. 2010;14(5):538-44. 137. Ford CB, Shah RR, Maeda MK, Gagneux S, Murray MB, Cohen T, et al. Mycobacterium tuberculosis mutation rate estimates from different lineages predict substantial differences in the emergence of drug-resistant tuberculosis. Nat Genet. 2013;45(7):784-90. 138. Wollenberg KR, Desjardins CA, Zalutskaya A, Slodovnikova V, Oler AJ, Quiñones M, et al. Whole genome sequencing of Mycobacterium tuberculosis provides insight into the evolution and genetic composition of drug-resistant tuberculosis in Belarus. J Clin Microbiol. 2016. Epub Nov 30. doi: 10.1128/JCM.02116-16. 139. Gurjav U, Erkhembayar B, Burneebaatar B, Narmandakh E, Tumenbayar O, Hill-Cawthorne GA, et al. Transmission of multi-drug resistant tuberculosis in Mongolia is driven by Beijing strains of Mycobacterium tuberculosis resistant to all first-line drugs. Tuberculosis. 2016;101:49-53. 140. Albanna AS, Reed MB, Kotar KV, Fallow A, McIntosh FA, Behr MA, et al. Reduced transmissibility of East African Indian strains of Mycobacterium tuberculosis. PLoS One. 2011;6(9):e25075. 141. Gehre F, Antonio M, Faïhun F, Odoun M, Uwizeye C, de Rijk P, et al. The first phylogeographic population structure and analysis of transmission dynamics of M. africanum West African 1--combining molecular data from Benin, Nigeria and Sierra Leone. PLoS One. 2013;8(10):e77000. 142. de Jong BC, Hill PC, Aiken A, Awine T, Antonio M, Adetifa IM, et al. Progression to active tuberculosis, but not transmission, varies by Mycobacterium tuberculosis lineage in The Gambia. J Infect Dis. 2008;198(7):1037–43. 143. Stavrum R, PrayGod G, Range N, Faurholt-Jepsen D, Jeremiah K, Faurholt-Jepsen M, et al. Increased level of acute phase reactants in patients infected with modern Mycobacterium tuberculosis genotypes in Mwanza, Tanzania. BMC Infect Dis. 2014;14:309. 144. van Crevel R, Nelwan RH, de Lenne W, Veeraragu Y, van der Zanden AG, Amin Z, et al. Mycobacterium tuberculosis Beijing genotype strains associated with febrile response to treatment. Emerg Infect Dis. 2001;7(5):880-3.
Chapter 1 | General Introduction
47
145. Caws M, Thwaites G, Dunstan S, Hawn TR, Lan NT, Thuong NT, et al. The influence of host and bacterial genotype on the development of disseminated disease with Mycobacterium tuberculosis. PLoS Pathog. 2008;4(3):e1000034. 146. Kong Y, Cave MD, Zhang L, Foxman B, Marrs CF, Bates JH, et al. Association between Mycobacterium tuberculosis Beijing/W lineage strain infection and extrathoracic tuberculosis: Insights from epidemiologic and clinical characterization of the three principal genetic groups of M. tuberculosis clinical isolates. J Clin Microbiol. 2007;45(2):409-14. 147. Kong Y, Cave MD, Yang D, Zhang L, Marrs CF, Foxman B, et al. Distribution of insertion- and deletion-associated genetic polymorphisms among four Mycobacterium tuberculosis phospholipase C genes and associations with extrathoracic tuberculosis: a population-based study. J Clin Microbiol. 2005;43(12):6048-53. 148. Lari N, Rindi L, Cristofani R, Rastogi N, Tortoli E, Garzelli C. Association of Mycobacterium tuberculosis complex isolates of M. bovis and Central Asian (CAS) genotypic lineages with extrapulmonary disease. Clin Microbiol Infect. 2009;15(6):538-43. 149. American Thoracic Society/CDC. Diagnostic standards and classification of tuberculosis. Am Rev Respir Dis. 1990;142:725-35. 150. Wells WF. Aerodynamics of droplet nuclei. In: Airborne contagion and air hygiene. Cambridge: Harvard University Press; 1995. 151. Fennelly KP, Jones-López EC, Ayakaka I, Kim S, Menyha H, Kirenga B, et al. Variability of infectious aerosols produced during coughing by patients with pulmonary tuberculosis. Am J Respir Crit Care Med. 2012;186(5):450-7. 152. Wells WF, Ratcliffe HL, Grumb C. On the mechanics of droplet nuclei infection; quantitative experimental air-borne tuberculosis in rabbits. Am J Hyg. 1948;47:11–28. 153. Bates J, Potts W, Lewis M. Epidemiology of Primary Tuberculosis in an Industrial School. N Engl J Med. 1965;272:714–7. 154. O'Garra A, Redford PS, McNab FW, Bloom CI, Wilkinson RJ, Berry MP. The immune response in tuberculosis. Annu Rev Immunol. 2013;31:475–527. 155. Bhatt K, Salgame P. Host innate immune response to Mycobacterium tuberculosis. J Clin Immunol. 2007;27(4):347-62. 156. Akira S, Uematsu S, Takeuchi O. Pathogen recognition and innate immunity. Cell. 2006;124(4):783-801. 157. Kleinnijenhuis J, Oosting M, Joosten LA, Netea MG, Van Crevel R. Innate immune recognition of Mycobacterium tuberculosis. Clin Dev Immunol. 2011;2011:405310. 158. Bafica A, Scanga C, Feng C, Leifer C, Cheever A, Sher A. TLR9 regulates Th1 responses and cooperates with TLR2 in mediating optimal resistance to Mycobacterium tuberculosis. J Exp Med. 2005;202:1715-24. 159. Means TK, Wang S, Lien E, Yoshimura A, Golenbock DT, Fenton MJ. Human toll-like receptors mediate cellular activation by Mycobacterium tuberculosis. J Immunol. 1999;163(7):3920-7. 160. Medzhitov R. Recognition of microorganisms and activation of the immune response. Nature. 2007;449(7164):819-26. 161. Reiling N, Hölscher C, Fehrenbach A, Kröger S, Kirschning CJ, Goyert S, et al. Cutting edge: Toll-like receptor (TLR)2- and TLR4-mediated pathogen recognition in resistance to airborne infection with Mycobacterium tuberculosis. J Immunol. 2002;169(7):3480-4. 162. Underhill DM, Ozinsky A, Smith KD, Aderem A. Toll-like receptor-2 mediates mycobacteria-induced proinflammatory signaling in macrophages. Proc Natl Acad Sci U S A. 1999;96(25):14459-63. 163. Means TK, Jones BW, Schromm AB, Shurtleff BA, Smith JA, Keane J, et al. Differential effects of a Toll-like receptor antagonist on Mycobacterium tuberculosis-induced macrophage responses. J Immunol. 2001;166(6):4074-82. 164. Pompei L, Jang S, Zamlynny B, Ravikumar S, McBride A, Hickman SP, et al. Disparity in IL-12 release in dendritic cells and macrophages in response to Mycobacterium tuberculosis is due to use of distinct TLRs. J Immunol. 2007;178(8):5192-9. 165. Jang S, Uematsu S, Akira S, Salgame P. IL-6 and IL-10 induction from dendritic cells in response to Mycobacterium tuberculosis is predominantly dependent on TLR2-mediated recognition. J Immunol. 2004;173(5):3392-7.
Chapter 1 | General Introduction
48
166. Nair S, Ramaswamy PA, Ghosh S, Joshi DC, Pathak N, Siddiqui I, et al. The PPE18 of Mycobacterium tuberculosis interacts with TLR2 and activates IL-10 induction in macrophage. J Immunol. 2009;183(10):6269-81. 167. Cooper AM. Cell-mediated immune response in TB. Annu Rev Immunol. 2009;27:393-422. 168. Vergne I, Chua J, Singh SB, Deretic V. Cell biology of mycobacterium tuberculosis phagosome. Annu Rev Cell Dev Biol. 2004;20:367-94. 169. Nathan C, Shiloh MU. Reactive oxygen and nitrogen intermediates in the relationship between mammalian hosts and microbial pathogens. Proc Natl Acad Sci U S A. 2000;97(16):8841-8. 170. Adams LB, Dinauer MC, Morgenstern DE, Krahenbuhl JL. Comparison of the roles of reactive oxygen and nitrogen intermediates in the host response to Mycobacterium tuberculosis using transgenic mice. Tuber Lung Dis. 1997;78(5-6):237-46. 171. Divangahi M, Desjardins D, Nunes-Alves C, Remold HG, Behar SM. Eicosanoid pathways regulate adaptive immunity to Mycobacterium tuberculosis. Nat Immunol. 2010;11(8):751-8. 172. Behar SM, Martin CJ, Booty MG, Nishimura T, Zhao X, Gan HX, et al. Apoptosis is an innate defense function of macrophages against Mycobacterium tuberculosis. Mucosal Immunol. 2011;4(3):279-87. 173. Chen M, Divangahi M, Gan H, Shin DS, Hong S, Lee DM, et al. Lipid mediators in innate immunity against tuberculosis: opposing roles of PGE2 and LXA4 in the induction of macrophage death. J Exp Med. 2008;205(12):2791-801. 174. Hossain MM, Norazmi MN. Pattern recognition receptors and cytokines in Mycobacterium tuberculosis infection--the double-edged sword? Biomed Res Int. 2013;2013:179174. 175. Eum SY, Kong JH, Hong MS, Lee YJ, Kim JH, Hwang SH, et al. Neutrophils are the predominant infected phagocytic cells in the airways of patients with active pulmonary TB. Chest. 2010;137(1):122-8. 176. Eruslanov EB, Lyadova IV, Kondratieva TK, Majorov KB, Scheglov IV, Orlova MO, et al. Neutrophil responses to Mycobacterium tuberculosis infection in genetically susceptible and resistant mice. Infect Immun. 2005;73(3):1744-53. 177. Alemán M, Beigier-Bompadre M, Borghetti C, de la Barrera S, Abbate E, Isturiz M, et al. Activation of peripheral blood neutrophils from patients with active advanced tuberculosis. Clin Immunol. 2001;100(1):87-95. 178. Kisich KO, Higgins M, Diamond G, Heifets L. Tumor necrosis factor alpha stimulates killing of Mycobacterium tuberculosis by human neutrophils. Infect Immun. 2002;70(8):4591-9. 179. Pokkali S, Das SD. Augmented chemokine levels and chemokine receptor expression on immune cells during pulmonary tuberculosis. Hum Immunol. 2009;70(2):110–5. 180. Pedrosa J, Saunders BM, Appelberg R, Orme IM, Silva MT, Cooper AM. Neutrophils play a protective nonphagocytic role in systemic Mycobacterium tuberculosis infection of mice. Infect Immun. 2000;68(2):577-83. 181. Banchereau J, Steinman RM. Dendritic cells and the control of immunity. Nature. 1998;392(6673):245-52. 182. Robinson RT, Orme IM, Cooper AM. The onset of adaptive immunity in the mouse model of tuberculosis and the factors that compromise its expression. Immunol Rev. 2015;264(1):46-59. 183. Dorhoi A, Reece ST, Kaufmann SH. For better or for worse: the immune response against Mycobacterium tuberculosis balances pathology and protection. Immunol Rev. 2011;240(1):235-51. 184. Khader SA, Partida-Sanchez S, Bell G, Jelley-Gibbs DM, Swain S, Pearl JE, et al. Interleukin 12p40 is required for dendritic cell migration and T cell priming after Mycobacterium tuberculosis infection. J Exp Med. 2006;203(7):1805-15. 185. Scanga CA, Mohan VP, Tanaka K, Alland D, Flynn JL, Chan J. The inducible nitric oxide synthase locus confers protection against aerogenic challenge of both clinical and laboratory strains of Mycobacterium tuberculosis in mice. Infect Immun. 2001;69(12):7711-7. 186. MacMicking JD, North RJ, LaCourse R, Mudgett JS, Shah SK, Nathan CF. Identification of nitric oxide synthase as a protective locus against tuberculosis. Proc Natl Acad Sci U S A. 1997;94(10):5243-8.
Chapter 1 | General Introduction
49
187. Jung YJ, LaCourse R, Ryan L, North RJ. Virulent but not avirulent Mycobacterium tuberculosis can evade the growth inhibitory action of a T helper 1-dependent, nitric oxide Synthase 2-independent defense in mice. J Exp Med. 2002;196(7):991-8. 188. Nicholson S, Bonecini-Almeida Mda G, Lapa e Silva JR, Nathan C, Xie QW, Mumford R, et al. Inducible nitric oxide synthase in pulmonary alveolar macrophages from patients with tuberculosis. J Exp Med. 1996;183(5):2293-302. 189. Nozaki Y, Hasegawa Y, Ichiyama S, Nakashima I, Shimokata K. Mechanism of nitric oxide-dependent killing of Mycobacterium bovis BCG in human alveolar macrophages. Infect Immun. 1997;65(9):3644-7. 190. Torrado E, Cooper AM. IL-17 and Th17 cells in tuberculosis. Cytokine Growth Factor Rev. 2010;21(6):455-62. 191. Okamoto Yoshida Y, Umemura M, Yahagi A, O'Brien RL, Ikuta K, Kishihara K, et al. Essential role of IL-17A in the formation of a mycobacterial infection-induced granuloma in the lung. J Immunol. 2010;184(8):4414-22. 192. Cruz A, Fraga AG, Fountain JJ, Rangel-Moreno J, Torrado E, Saraiva M, et al. Pathological role of interleukin 17 in mice subjected to repeated BCG vaccination after infection with Mycobacterium tuberculosis. J Exp Med. 2010;207(8):1609-16. 193. Jones BE, Young SM, Antoniskis D, Davidson PT, Kramer F, Barnes PF. Relationship of the manifestations of tuberculosis to CD4 cell counts in patients with human immunodeficiency virus infection. Am Rev Respir Dis. 1993;148(5):1292-7. 194. Lawn SD, Butera ST, Shinnick TM. Tuberculosis unleashed: the impact of human immunodeficiency virus infection on the host granulomatous response to Mycobacterium tuberculosis. Microbes Infect. 2002;4(6):635-46. 195. Ehlers S, Benini J, Held HD, Roeck C, Alber G, Uhlig S. Alphabeta T cell receptor-positive cells and interferon-gamma, but not inducible nitric oxide synthase, are critical for granuloma necrosis in a mouse model of mycobacteria-induced pulmonary immunopathology. J Exp Med. 2001;194(12):1847-59. 196. Feng CG, Jankovic D, Kullberg M, Cheever A, Scanga CA, Hieny S, et al. Maintenance of pulmonary Th1 effector function in chronic tuberculosis requires persistent IL-12 production. J Immunol. 2005;174(7):4185-92. 197. Mogues T, Goodrich ME, Ryan L, LaCourse R, North RJ. The relative importance of T cell subsets in immunity and immunopathology of airborne Mycobacterium tuberculosis infection in mice. J Exp Med. 2001;193(3):271-80. 198. Rolph MS, Raupach B, Köbernick HH, Collins HL, Pérarnau B, Lemonnier FA, et al. MHC class Ia-restricted T cells partially account for beta2-microglobulin-dependent resistance to Mycobacterium tuberculosis. Eur J Immunol. 2001;31(6):1944-9. 199. Rook GA, Hernández-Pando R, Zumla A. Tuberculosis due to high-dose challenge in partially immune individuals: a problem for vaccination? J Infect Dis. 2009;199(5):613-8. 200. Abebe F, Bjune G. The protective role of antibody responses during Mycobacterium tuberculosis infection. Clin Exp Immunol. 2009;157(2):235-43. 201. Vordermeier HM, Venkataprasad N, Harris DP, Ivanyi J. Increase of tuberculous infection in the organs of B cell-deficient mice. Clin Exp Immunol. 1996;106(2):312-6. 202. Maglione PJ, Xu J, Chan J. B cells moderate inflammatory progression and enhance bacterial containment upon pulmonary challenge with Mycobacterium tuberculosis. J Immunol. 2007;178(11):7222-34. 203. Turner J, Frank AA, Brooks JV, Gonzalez-Juarrero M, Orme IM. The progression of chronic tuberculosis in the mouse does not require the participation of B lymphocytes or interleukin-4. Exp Gerontol. 2001;36(3):537-45. 204. Johnson CM, Cooper AM, Frank AA, Bonorino CB, Wysoki LJ, Orme IM. Mycobacterium tuberculosis aerogenic rechallenge infections in B cell-deficient mice. Tuber Lung Dis. 1997;78(5-6):257-61. 205. Marin ND, París SC, Vélez VM, Rojas CA, Rojas M, García LF. Regulatory T cell frequency and modulation of IFN-gamma and IL-17 in active and latent tuberculosis. Tuberculosis. 2010;90(4):252-61. 206. Scott-Browne JP, Shafiani S, Tucker-Heard G, Ishida-Tsubota K, Fontenot JD, Rudensky AY, et al. Expansion and function of Foxp3-expressing T regulatory cells during tuberculosis. J Exp Med. 2007;204(9):2159-69.
Chapter 1 | General Introduction
50
207. Kursar M, Koch M, Mittrücker HW, Nouailles G, Bonhagen K, Kamradt T, et al. Cutting Edge: Regulatory T cells prevent efficient clearance of Mycobacterium tuberculosis. J Immunol. 2007;178(5):2661-5. 208. Urdahl KB, Shafiani S, Ernst JD. Initiation and regulation of T-cell responses in tuberculosis. Mucosal Immunol. 2011;4(3):288-93. 209. Cooper AM, Mayer-Barber KD, Sher A. Role of innate cytokines in mycobacterial infection. Mucosal Immunol. 2011;4(3):252-60. 210. Watford WT, Moriguchi M, Morinobu A, O'Shea JJ. The biology of IL-12: coordinating innate and adaptive immune responses. Cytokine Growth Factor Rev. 2003;14(5):361-8. 211. Robinson RT, Khader SA, Martino CA, Fountain JJ, Teixeira-Coelho M, Pearl JE, et al. Mycobacterium tuberculosis infection induces il12rb1 splicing to generate a novel IL-12Rbeta1 isoform that enhances DC migration. J Exp Med. 2010;207(3):591-605. 212. Cooper AM, Kipnis A, Turner J, Magram J, Ferrante J, Orme IM. Mice lacking bioactive IL-12 can generate protective, antigen-specific cellular responses to mycobacterial infection only if the IL-12 p40 subunit is present. J Immunol. 2002;168(3):1322-7. 213. Khader SA, Pearl JE, Sakamoto K, Gilmartin L, Bell GK, Jelley-Gibbs DM, et al. IL-23 compensates for the absence of IL-12p70 and is essential for the IL-17 response during tuberculosis but is dispensable for protection and antigen-specific IFN-gamma responses if IL-12p70 is available. J Immunol. 2005;175(2):788-95. 214. Re F, Strominger JL. Toll-like receptor 2 (TLR2) and TLR4 differentially activate human dendritic cells. J Biol Chem. 2001;276(40):37692-9. 215. Teixeira-Coelho M, Cruz A, Carmona J, Sousa C, Ramos-Pereira D, Saraiva AL, et al. TLR2 deficiency by compromising p19 (IL-23) expression limits Th 17 cell responses to Mycobacterium tuberculosis. Int Immunol. 2011;23:89-96. 216. Aggarwal S, Ghilardi N, Xie MH, de Sauvage FJ, Gurney AL. Interleukin-23 promotes a distinct CD4 T cell activation state characterized by the production of interleukin-17. J Biol Chem. 2003;278(3):1910-4. 217. Ghilardi N, Kljavin N, Chen Q, Lucas S, Gurney AL, De Sauvage FJ. Compromised humoral and delayed-type hypersensitivity responses in IL-23-deficient mice. J Immunol. 2004;172(5):2827-33. 218. Langrish CL, Chen Y, Blumenschein WM, Mattson J, Basham B, Sedgwick JD, et al. IL-23 drives a pathogenic T cell population that induces autoimmune inflammation. J Exp Med. 2005;201(2):233-40. 219. Murphy CA, Langrish CL, Chen Y, Blumenschein W, McClanahan T, Kastelein RA, et al. Divergent pro- and anti-inflammatory roles for IL-23 and IL-12 in joint autoimmune inflammation. J Exp Med. 2003;198(12):1951-7. 220. Freches D, Korf H, Denis O, Havaux X, Huygen K, Romano M. Mice genetically inactivated in interleukin-17A receptor are defective in long-term control of Mycobacterium tuberculosis infection. Immunology. 2013;140(2):220-31. 221. Orme IM, Roberts AD, Griffin JP, Abrams JS. Cytokine secretion by CD4 T lymphocytes acquired in response to Mycobacterium tuberculosis infection. J Immunol. 1993;151(1):518-25. 222. Vesosky B, Turner OC, Turner J, Orme IM. Gamma interferon production by bovine gamma delta T cells following stimulation with mycobacterial mycolylarabinogalactan peptidoglycan. Infect Immun. 2004;72(8):4612-8. 223. Zuñiga J, Torres-García D, Santos-Mendoza T, Rodriguez-Reyna TS, Granados J, Yunis EJ. Cellular and humoral mechanisms involved in the control of tuberculosis. Clin Dev Immunol. 2012;2012(2012):193923. 224. Cooper AM, Dalton DK, Stewart TA, Griffin JP, Russell DG, Orme IM. Disseminated tuberculosis in interferon gamma gene-disrupted mice. J Exp Med. 1993;178(6):2243-7. 225. Flynn JL, Chan J, Triebold KJ, Dalton DK, Stewart T, Bloom BR. An essential role for Interferon-γ in resistance to Mycobacterium tuberculosis infection. J Exp Med. 1993;178:2249–54. 226. Ottenhof TH, Kumararatne D, Casanova JL. Novel human immunodeficiencies reveal the essential role of type-1 cytokines in immunity to intracellular bacteria. Immunol Today. 1998;19:491–4. 227. Levin M, Newport M. Understanding the genetic basis of susceptibility to mycobacterial infection. Proc Assoc Am Physicians. 1999;111(4):308-12.

Chapter 1 | General Introduction
51
228. Bustamante J, Boisson-Dupuis S, Abel L, Casanova JL. Mendelian susceptibility to mycobacterial disease: genetic, immunological, and clinical features of inborn errors of IFN-γ immunity. Semin Immunol. 2014;26(6):454-70. 229. MacMicking JD, Taylor GA, McKinney JD. Immune control of tuberculosis by IFN-gamma-inducible LRG-47. Science. 2003;302(5645):654-9. 230. Gutierrez MG, Master SS, Singh SB, Taylor GA, Colombo MI, Deretic V. Autophagy is a defense mechanism inhibiting BCG and Mycobacterium tuberculosis survival in infected macrophages. Cell. 2004;119(6):753–66. 231. Colombo MI, Gutierrez MG, Romano PS. The two faces of autophagy: Coxiella and Mycobacterium. Autophagy. 2006;2(3):162–4. 232. Cruz A, Khader SA, Torrado E, Fraga A, Pearl JE, Pedrosa J, et al. Cutting edge: IFN-gamma regulates the induction and expansion of IL-17-producing CD4 T cells during mycobacterial infection. J Immunol. 2006;177(3):1416-20. 233. Desvignes L, Ernst JD. Interferon-gamma-responsive nonhematopoietic cells regulate the immune response to Mycobacterium tuberculosis. Immunity. 2009;31(6):974-85. 234. Nandi B, Behar SM. Regulation of neutrophils by interferon-γ limits lung inflammation during tuberculosis infection. J Exp Med. 2011;208(11):2251–62. 235. Verbon A, Juffermans N, Van Deventer SJ, Speelman P, Van Deutekom H, Van Der Poll T. Serum concentrations of cytokines in patients with active tuberculosis (TB) and after treatment. Clin Exp Immunol. 1999;115(1):110-3. 236. Tsao TC, Huang CC, Chiou WK, Yang PY, Hsieh MJ, Tsao KC. Levels of interferon-γ and interleukin-2 receptor-α for bronchoalveolar lavage fluid and serum were correlated with clinical grade and treatment of pulmonary tuberculosis. Int J Tuberc Lung Dis. 2002;6(8):720–7. 237. Harrington LE, Hatton RD, Mangan PR, Turner H, Murphy TL, Murphy KM, et al. Interleukin 17-producing CD4+ effector T cells develop via a lineage distinct from the T helper type 1 and 2 lineages. Nat Immunol. 2005;6(11):1123-32. 238. Acosta-Rodriguez EV, Napolitani G, Lanzavecchia A, Sallusto F. Interleukins 1β and 6 but not transforming growth factor-β are essential for the differentiation of interleukin 17-producing human T helper cells. Nature Immunology. 2007;8(9):942–9. 239. Park H, Li Z, Yang XO, Chang SH, Nurieva R, Wang YH, et al. A distinct lineage of CD4 T cells regulates tissue inflammation by producing interleukin 17. Nat Immunol. 2005;6(11):1133-41. 240. Khader S, Cooper A. IL-23 and IL-17 in tuberculosis. Cytokine. 2008;41(2):79-83. 241. Lockhart E, Green AM, Flynn JL. IL-17 production is dominated by gammadelta T cells rather than CD4 T cells during Mycobacterium tuberculosis infection. J Immunol. 2006;177(7):4662-9. 242. Umemura M, Yahagi A, Hamada S, Begum MD, Watanabe H, Kawakami K, et al. IL-17-mediated regulation of innate and acquired immune response against pulmonary Mycobacterium bovis bacille Calmette-Guerin infection. J Immunol. 2007;178(6):3786-96. 243. Khader SA, Bell GK, Pearl JE, Fountain JJ, Rangel-Moreno J, Cilley GE, et al. IL-23 and IL-17 in the establishment of protective pulmonary CD4+ T cell responses after vaccination and during Mycobacterium tuberculosis challenge. Nat Immunol. 2007;8(4):369-77. 244. Wozniak TM, Ryan AA, Britton WJ. Interleukin-23 restores immunity to Mycobacterium tuberculosis infection in IL-12p40-deficient mice and is not required for the development of IL-17-secreting T cell responses. J Immunol. 2006;177(12):8684-92. 245. Horii Y, Muraguchi A, Suematsu S, Matsuda T, Yoshizaki K, Hirano T, et al. Regulation of BSF-2/IL-6 production by human mononuclear cells. Macrophage-dependent synthesis of BSF-2/IL-6 by T cells. J Immunol. 1988;141(5):1529-35. 246. Stríz I, Mio T, Adachi Y, Romberger DJ, Rennard SI. Th2-type cytokines modulate IL-6 release by human bronchial epithelial cells. Immunol Lett. 1999;70(2):83-8. 247. Law K, Weiden M, Harkin T, Tchou-Wong K, Rom WN Chi C. Increased release of interleukin-1 beta, interleukin-6, and tumor necrosis factor-alpha by bronchoalveolar cells lavaged from involved sites in pulmonary tuberculosis. Am J Respir Crit Care Med. 1996;153(2):799-804. 248. Bettelli E, Carrier Y, Gao W, Korn T, Strom TB, Oukka M, et al. Reciprocal developmental pathways for the generation of pathogenic effector TH17 and regulatory T cells. Nature. 2006;441(7090):235-8.
Chapter 1 | General Introduction
52
249. Leal IS, Smedegârd B, Andersen P, Appelberg R. Interleukin-6 and interleukin-12 participate in induction of a type 1 protective T-cell response during vaccination with a tuberculosis subunit vaccine. Infect Immun. 1999;67(11):5747-54. 250. Heinrich PC, Castell JV, Andus T. Interleukin-6 and the acute phase response. Biochem J. 1990;265(3):621-36. 251. Nemeth E, Rivera S, Gabayan V, Keller C, Taudorf S, Pedersen BK, et al. IL-6 mediates hypoferremia of inflammation by inducing the synthesis of the iron regulatory hormone hepcidin. J Clin Invest. 2004;113(9):1271-6. 252. Kishimoto T. Factors affecting B-cell growth and differentiation. Annu Rev Immunol. 1985;3:133-57. 253. Korn T, Bettelli E, Oukka M, Kuchroo VK. IL-17 and Th17 cells. Annu Rev Immunol. 2009;27:485-517. 254. Ma CS, Deenick EK, Batten M, Tangye SG. The origins, function, and regulation of T follicular helper cells. J Exp Med. 2012;209(7):1241-53. 255. Okada M, Kitahara M, Kishimoto S, Matsuda T, Hirano T, Kishimoto T. IL-6/BSF-2 functions as a killer helper factor in the in vitro induction of cytotoxic T cells. J Immunol. 1988;141(5):1543-9. 256. Ladel CH, Blum C, Dreher A, Reifenberg K, Kopf M, Kaufmann SH. Lethal tuberculosis in interleukin-6-deficient mutant mice. Infect Immun. 1997;65(11):4843-9. 257. Roach DR, Bean AG, Demangel C, France MP, Briscoe H, Britton WJ. TNF regulates chemokine induction essential for cell recruitment, granuloma formation, and clearance of mycobacterial infection. J Immunol. 2002;168(9):4620-7. 258. Flynn JL, Goldstein MM, Chan J, Triebold KJ, Pfeffer K, Lowenstein CJ, et al. Tumor necrosis factor-alpha is required in the protective immune response against Mycobacterium tuberculosis in mice. Immunity. 1995;2(6):561-72. 259. Bean AG, Roach DR, Briscoe H, France MP, Korner H, Sedgwick JD, et al. Structural deficiencies in granuloma formation in TNF gene-targeted mice underlie the heightened susceptibility to aerosol Mycobacterium tuberculosis infection, which is not compensated for by lymphotoxin. J Immunol. 1999;162(6):3504-11. 260. Kaneko H, Yamada H, Mizuno S, Udagawa T, Kazumi Y, Sekikawa K, et al. Role of tumor necrosis factor-alpha in Mycobacterium-induced granuloma formation in tumor necrosis factor-alpha-deficient mice. Lab Invest. 1999;79(4):379-86. 261. Keane J, Gershon S, Wise RP, Mirabile-Levens E, Kasznica J, Schwieterman WD, et al. Tuberculosis associated with infliximab, a tumor necrosis factor alpha-neutralizing agent. N Engl J Med. 2001;345(15):1098-104. 262. Bekker LG, Maartens G, Steyn L, Kaplan G. Selective increase in plasma tumor necrosis factor-alpha and concomitant clinical deterioration after initiating therapy in patients with severe tuberculosis. J Infect Dis. 1998;178(2):580-4. 263. Wallis RS, van Vuuren C, Potgieter S. Adalimumab treatment of life-threatening tuberculosis. Clin Infect Dis. 2009;48(10):1429-32. 264. Sakurai H. Targeting of TAK1 in inflammatory disorders and cancer. Trends Pharmacol Sci. 2012;33(10):522-30. 265. Vallabhapurapu S, Karin M. Regulation and function of NF-kappaB transcription factors in the immune system. Annu Rev Immunol. 2009;27:693-733. 266. Roth S, Rottach A, Lotz-Havla AS, Laux V, Muschaweckh A, Gersting SW, et al. Rad50-CARD9 interactions link cytosolic DNA sensing to IL-1β production. Nat Immunol. 2014;15(6):538-45. 267. Dubois H, Wullaert A, Lamkanfi M. General strategies in inflammasome biology. Curr Top Microbiol Immunol. 2016;397:1-22. 268. Lamkanfi M, Dixit VM. Mechanisms and functions of inflammasomes. Cell. 2014;157(5):1013-22. 269. Koo IC, Wang C, Raghavan S, Morisaki JH, Cox JS, Brown EJ. ESX-1-dependent cytolysis in lysosome secretion and inflammasome activation during mycobacterial infection. Cell Microbiol. 2008;10(9):1866-78. 270. Mayer-Barber KD, Barber DL, Shenderov K, White SD, Wilson MS, Cheever A, et al. Caspase-1 independent IL-1beta production is critical for host resistance to mycobacterium tuberculosis and does not require TLR signaling in vivo. J Immunol. 2010;184(7):3326-30.

Chapter 1 | General Introduction
53
271. McElvania Tekippe E, Allen IC, Hulseberg PD, Sullivan JT, McCann JR, Sandor M, et al. Granuloma formation and host defense in chronic Mycobacterium tuberculosis infection requires PYCARD/ASC but not NLRP3 or caspase-1. PLoS One. 2010;5(8):e12320. 272. Mishra BB, Moura-Alves P, Sonawane A, Hacohen N, Griffiths G, Moita LF, et al. Mycobacterium tuberculosis protein ESAT-6 is a potent activator of the NLRP3/ASC inflammasome. Cell Microbiol. 2010;12(8):1046-63. 273. Schenk M, Fabri M, Krutzik SR, Lee DJ, Vu DM, Sieling PA, et al. Interleukin-1β triggers the differentiation of macrophages with enhanced capacity to present mycobacterial antigen to T cells. Immunology. 2014;141(2):174-80. 274. Dinarello CA. Immunological and inflammatory functions of the interleukin-1 family. Annu Rev Immunol. 2009;27:519-50. 275. Harris KM, Fasano A, Mann DL. Cutting edge: IL-1 controls the IL-23 response induced by gliadin, the etiologic agent in celiac disease. J Immunol. 2008;181(7):4457-60. 276. Sutton C, Brereton C, Keogh B, Mills KH, Lavelle EC. A crucial role for interleukin (IL)-1 in the induction of IL-17-producing T cells that mediate autoimmune encephalomyelitis. J Exp Med. 2006;203(7):1685-91. 277. Di Paolo NC, Shafiani S, Day T, Papayannopoulou T, Russell DW, Iwakura Y, et al. Interdependence between Interleukin-1 and Tumor Necrosis Factor regulates TNF-dependent control of Mycobacterium tuberculosis Infection. Immunity. 2015;43(6):1125-36. 278. Fremond CM, Togbe D, Doz E, Rose S, Vasseur V, Maillet I, et al. IL-1 receptor-mediated signal is an essential component of MyD88-dependent innate response to Mycobacterium tuberculosis infection. J Immunol. 2007;179(2):1178-89. 279. Mayer-Barber KD, Andrade BB, Barber DL, Hieny S, Feng CG, Caspar P, et al. Innate and adaptive interferons suppress IL-1α and IL-1β production by distinct pulmonary myeloid subsets during Mycobacterium tuberculosis infection. Immunity. 2011;35(6):1023-34. 280. Juffermans NP, Florquin S, Camoglio L, Verbon A, Kolk AH, Speelman P, et al. Interleukin-1 signaling is essential for host defense during murine pulmonary tuberculosis. J Infect Dis. 2000;182(3):902-8. 281. Condos R, Rom WN, Liu YM, Schluger NW. Local immune responses correlate with presentation and outcome in tuberculosis. Am J Respir Crit Care Med. 1998;157(3 Pt 1):729-35. 282. Tsao TC, Li L, Hsieh M, Liao S, Chang KS. Soluble TNF-alpha receptor and IL-1 receptor antagonist elevation in BAL in active pulmonary TB. Eur Respir J. 1999;14(3):490-5. 283. Harris JE, Fernandez-Vilaseca M, Elkington PT, Horncastle DE, Graeber MB, Friedland JS. IFNgamma synergizes with IL-1beta to up-regulate MMP-9 secretion in a cellular model of central nervous system tuberculosis. FASEB J. 2007;21(2):356-65. 284. O'Kane CM, Elkington PT, Jones MD, Caviedes L, Tovar M, Gilman RH, et al. STAT3, p38 MAPK, and NF-kappaB drive unopposed monocyte-dependent fibroblast MMP-1 secretion in tuberculosis. Am J Respir Cell Mol Biol. 2010;43(4):465–74. 285. Mayer-Barber KD, Andrade BB, Oland SD, Amaral EP, Barber DL, Gonzales J, et al. Host-directed therapy of tuberculosis based on interleukin-1 and type I interferon crosstalk. Nature. 2014;511(7507):99-103. 286. Chen M, Gan H, Remold HG. A mechanism of virulence: virulent Mycobacterium tuberculosis strain H37Rv, but not attenuated H37Ra, causes significant mitochondrial inner membrane disruption in macrophages leading to necrosis. J Immunol. 2006;176(6):3707-16. 287. Keane J, Remold HG, Kornfeld H. Virulent Mycobacterium tuberculosis strains evade apoptosis of infected alveolar macrophages. J Immunol. 2000;164(4):2016-20. 288. Bafica A, Scanga CA, Serhan C, Machado F, White S, Sher A, et al. Host control of Mycobacterium tuberculosis is regulated by 5-lipoxygenase-dependent lipoxin production. J Clin Invest. 2005;115(6):1601-6. 289. Tobin DM, Vary JC Jr, Ray JP, Walsh GS, Dunstan SJ, Bang ND, et al. The lta4h locus modulates susceptibility to mycobacterial infection in zebrafish and humans. Cell. 2010;140(5):717-30. 290. Herb F, Thye T, Niemann S, Browne EN, Chinbuah MA, Gyapong J, et al. ALOX5 variants associated with susceptibility to human pulmonary tuberculosis. Hum Mol Genet. 2008;17(7):1052-60. 291. Guarda G, Braun M, Staehli F, Tardivel A, Mattmann C, Förster I, et al. Type I interferon inhibits interleukin-1 production and inflammasome activation. Immunity. 2011;34(2):213-23.
Chapter 1 | General Introduction
54
292. Okamura H, Tsutsi H, Komatsu T, Yutsudo M, Hakura A, Tanimoto T, et al. Cloning of a new cytokine that induces IFN-gamma production by T cells. Nature. 1995;378(6552):88-91. 293. Gopal R, Monin L, Torres D, Slight S, Mehra S, McKenna KC, et al. S100A8/A9 proteins mediate neutrophilic inflammation and lung pathology during tuberculosis. Am J Respir Crit Care Med. 2013;188(9):1137-46. 294. Lázár-Molnár E, Chen B, Sweeney KA, Wang EJ, Liu W, Lin J, et al. Programmed death-1 (PD-1)-deficient mice are extraordinarily sensitive to tuberculosis. Proc Natl Acad Sci U S A. 2010;107(30):13402-7. 295. Larson RP, Shafiani S, Urdahl KB. Foxp3(+) regulatory T cells in tuberculosis. Adv Exp Med Biol. 2013;783:165-80. 296. Almeida AS, Lago PM, Boechat N, Huard RC, Lazzarini LC, Santos AR, et al. Tuberculosis is associated with a down-modulatory lung immune response that impairs Th1-type immunity. J Immunol. 2009;183(1):718-31. 297. Bonecini-Almeida MG, Ho JL, Boéchat N, Huard RC, Chitale S, Doo H, et al. Down-modulation of lung immune responses by interleukin-10 and transforming growth factor beta (TGF-beta) and analysis of TGF-beta receptors I and II in active tuberculosis. Infect Immun. 2004;72(5):2628-34. 298. de Waal Malefyt R, Abrams J, Bennett B, Figdor CG, de Vries JE. Interleukin 10 (IL-10) inhibits cytokine synthesis by human monocytes: an autoregulatory role of IL-10 produced by monocytes. J Exp Med. 1991;174(5):1209-20. 299. Boonstra A, Rajsbaum R, Holman M, Marques R, Asselin-Paturel C, Pereira JP, et al. Macrophages and myeloid dendritic cells, but not plasmacytoid dendritic cells, produce IL-10 in response to MyD88- and TRIF-dependent TLR signals, and TLR-independent signals. J Immunol 2006;177(11):7551-8. 300. Dillon S, Agrawal A, Van Dyke T, Landreth G, McCauley L, Koh A, et al. A Toll-like receptor 2 ligand stimulates Th2 responses in vivo, via induction of extracellular signal-regulated kinase mitogen-activated protein kinase and c-Fos in dendritic cells. J Immunol. 2004;172(8):4733-43. 301. Fiorentino DF, Zlotnik A, Mosmann TR, Howard M, O'Garra A. IL-10 inhibits cytokine production by activated macrophages. J Immunol. 1991;147(11):3815-22. 302. Gong JH, Zhang M, Modlin RL, Linsley PS, Iyer D, Lin Y, et al. Interleukin-10 downregulates Mycobacterium tuberculosis-induced Th1 responses and CTLA-4 expression. Infect Immun. 1996;64(3):913-8. 303. Rojas RE, Balaji KN, Subramanian A, Boom WH. Regulation of human CD4(+) alphabeta T-cell-receptor-positive (TCR(+)) and gammadelta TCR(+) T-cell responses to Mycobacterium tuberculosis by interleukin-10 and transforming growth factor beta. Infect Immun. 1999;67(12):6461-72. 304. de la Barrera S, Aleman M, Musella R, Schierloh P, Pasquinelli V, Garcia V, et al. IL-10 down-regulates costimulatory molecules on Mycobacterium tuberculosis-pulsed macrophages and impairs the lytic activity of CD4 and CD8 CTL in tuberculosis patients. Clin Exp Immunol. 2004;138(1):128-38. 305. Demangel C, Bertolino P, Britton WJ. Autocrine IL-10 impairs dendritic cell (DC)-derived immune responses to mycobacterial infection by suppressing DC trafficking to draining lymph nodes and local IL-12 production. Eur J Immunol. 2002;32(4):994-1002. 306. Boussiotis VA, Tsai EY, Yunis EJ, Thim S, Delgado JC, Dascher CC, et al. IL-10-producing T cells suppress immune responses in anergic tuberculosis patients. J Clin Invest. 2000;105(9):1317-25. 307. Awomoyi AA, Marchant A, Howson JM, McAdam KP, Blackwell JM, Newport MJ. Interleukin-10, polymorphism in SLC11A1 (formerly NRAMP1), and susceptibility to tuberculosis. J Infect Dis. 2002;186(12):1808-14. 308. Oh JH, Yang CS, Noh YK, Kweon YM, Jung SS, Son JW, et al. Polymorphisms of interleukin-10 and tumour necrosis factor-alpha genes are associated with newly diagnosed and recurrent pulmonary tuberculosis. Respirology. 2007;12(4):594-8. 309. Oral HB, Budak F, Uzaslan EK, Baştürk B, Bekar A, Akalin H, et al. Interleukin-10 (IL-10) gene polymorphism as a potential host susceptibility factor in tuberculosis. Cytokine. 2006;35(3-4):143-7. 310. Azad AK, Sadee W, Schlesinger LS. Innate immune gene polymorphisms in tuberculosis. Infect Immun. 2012;80:3343–59.
Chapter 1 | General Introduction
55
311. Möller M, de Wit E, Hoal EG. Past, present and future directions in human genetic susceptibility to tuberculosis. FEMS Immunol Med Microbiol. 2010;581(1):3-26. 312. Delgado JC, Baena A, Thim S, Goldfeld AE. Ethnic-specific genetic associations with pulmonary tuberculosis. J Infect Dis. 2002;186(10):1463-8. 314. Murray PJ, Wang L, Onufryk C, Tepper RI, Young RA. T cell-derived IL-10 antagonizes macrophage function in mycobacterial infection. J Immunol. 1997;158(1):315-21. 315. Turner J, Gonzalez-Juarrero M, Ellis DL, Basaraba RJ, Kipnis A, Orme IM, et al. In vivo IL-10 production reactivates chronic pulmonary tuberculosis in C57BL/6 mice. J Immunol. 2002;169(11):6343-51. 316. Beamer GL, Flaherty DK, Assogba BD, Stromberg P, Gonzalez-Juarrero M, de Waal Malefyt R, et al. Interleukin-10 promotes Mycobacterium tuberculosis disease progression in CBA/J mice. J Immunol. 2008;181(8):5545-50. 317. Redford PS, Boonstra A, Read S, Pitt J, Graham C, Stavropoulos E, et al. Enhanced protection to Mycobacterium tuberculosis infection in IL-10-deficient mice is accompanied by early and enhanced Th1 responses in the lung. Eur J Immunol. 2010;40(8):2200-10. 318. Roach DR, Martin E, Bean AG, Rennick DM, Briscoe H, Britton WJ. Endogenous inhibition of antimycobacterial immunity by IL-10 varies between mycobacterial species. Scand J Immunol. 2001;54(1-2):163-70. 319. Jung YJ, Ryan L, LaCourse R, North RJ. Increased interleukin-10 expression is not responsible for failure of T helper 1 immunity to resolve airborne Mycobacterium tuberculosis infection in mice. Immunology. 2003;109(2):295-9. 320. North RJ. Mice incapable of making IL-4 or IL-10 display normal resistance to infection with Mycobacterium tuberculosis. Clin Exp Immunol. 1998;113(1):55-8. 321. Higgins DM, Sanchez-Campillo J, Rosas-Taraco AG, Lee EJ, Orme IM, Gonzalez-Juarrero M. Lack of IL-10 alters inflammatory and immune responses during pulmonary Mycobacterium tuberculosis infection. Tuberculosis. 2009;89(2):149-57. 322. Dripps DJ, Brandhuber BJ, Thompson RC, Eisenberg SP. Interleukin-1 (IL-1) receptor antagonist binds to the 80-kDa IL-1 receptor but does not initiate IL-1 signal transduction. J Biol Chem. 1991;266(16):10331-6. 323. Granowitz EV, Clark BD, Mancilla J, Dinarello CA. Interleukin-1 receptor antagonist competitively inhibits the binding of interleukin-1 to the type II interleukin-1 receptor. J Biol Chem. 1991;266(22):14147-50. 324. Juffermans NP, Verbon A, van Deventer SJ, van Deutekom H, Speelman P, van der Poll T. Tumor necrosis factor and interleukin-1 inhibitors as markers of disease activity of tuberculosis. Am J Respir Crit Care Med. 1998;157(4 Pt 1):1328-31. 325. Lopalco G, Rigante D, Giannini M, Galeazzi M, Lapadula G, Iannone F, et al. Safety profile of anakinra in the management of rheumatologic, metabolic and autoinflammatory disorders. Clin Exp Rheumatol. 2016;34(3):531-8. 326. Cantarini L, Lopalco G, Caso F, Costa L, Iannone F, Lapadula G, et al. Effectiveness and tuberculosis-related safety profile of interleukin-1 blocking agents in the management of Behçet's disease. Autoimmun Rev. 2015;14(1):1-9. 327. Dubos RJ, Dubos J. The white plague; tuberculosis, man and society. 1st ed. Boston, MA: Little Brown; 1952. 328. Puffer R. Familial susceptibility to tuberculosis; its importance as a public health problem. Cambridge, MA: Harvard University Press; 1944. 329. Kallmann FJ, Reisner D. Twin studies on the significance of genetic factors in tuberculosis. Am Rev Tuberc. 1943;47:549–74. 330. Comstock GW. Tuberculosis in twins: a re-analysis of the Prophit survey. Am Rev Respir Dis. 1978;117(4):621-4. 331. Stead WW, Senner JW, Reddick WT, Lofgren JP. Racial differences in susceptibility to infection by Mycobacterium tuberculosis. N Engl J Med. 1990;322(7):422–7. 332. Crowle AJ, Elkins N. Relative permissiveness of macrophages from black and white people for virulent tubercle bacilli. Infect Immun. 1990;58(3):632–8. 333. Al-Muhsen S, Casanova JL. The genetic heterogeneity of mendelian susceptibility to mycobacterial diseases. J Allergy Clin Immunol. 2008;122(6):1043-51.
Chapter 1 | General Introduction
56
334. Boisson-Dupuis S, El Baghdadi J, Parvaneh N, Bousfiha A, Bustamante J, Feinberg J, et al. IL-12Rβ1 deficiency in two of fifty children with severe tuberculosis from Iran, Morocco, and Turkey. PLoS One. 2011;6(4):e18524. 335. Ozbek N, Fieschi C, Yilmaz BT, de Beaucoudrey L, Demirhan B, Feinberg J, et al. Interleukin-12 receptor beta 1 chain deficiency in a child with disseminated tuberculosis. Clin Infect Dis. 2005;40(6):e55-8. 336. Alcaïs A, Quintana-Murci L, Thaler DS, Schurr E, Abel L, Casanova JL. Life-threatening infectious diseases of childhood: single-gene inborn errors of immunity? Ann N Y Acad Sci. 2010;1214:18-33. 337. Casanova JL, Abel L, 581–620. Annu. Rev. Immunol. 20. Genetic dissection of immunity to mycobacteria: the human model. Annu Rev Immunol. 2002;20:581-620. 338. Filipe-Santos O, Bustamante J, Chapgier A, Vogt G, de Beaucoudrey L, Feinberg J, et al. Inborn errors of IL-12/23- and IFN-gamma-mediated immunity: molecular, cellular, and clinical features. Semin Immunol. 2006;18(6):347-61. 339. Hambleton S, Salem S, Bustamante J, Bigley V, Boisson-Dupuis S, Azevedo J, et al. IRF8 mutations and human dendritic-cell immunodeficiency. N Engl J Med. 2011;365(2):127-38. 340. Bustamante J, Arias AA, Vogt G, Picard C, Galicia LB, Prando C, et al. Germline CYBB mutations that selectively affect macrophages in kindreds with X-linked predisposition to tuberculous mycobacterial disease. Nat Immunol. 2011;12(3):213-21. 341. Bogunovic D, Byun M, Durfee LA, Abhyankar A, Sanal O, Mansouri D, et al. Mycobacterial disease and impaired IFN-γ immunity in humans with inherited ISG15 deficiency. Science. 2012;337(6102):1684-8. 342. Bellamy R, Beyers N, McAdam KP, Ruwende C, Gie R, Samaai P, et al. Genetic susceptibility to tuberculosis in Africans: a genome-wide scan. Proc Natl Acad Sci U S A. 2000;97(14):8005-9. 343. Alcais A, Fieschi C, Abel L, Casanova JL. Tuberculosis in children and adults: two distinct genetic diseases. J Exp Med. 2005;202:1617–21. 344. Qu HQ, Fisher-Hoch SP, McCormick JB. Knowledge gaining by human genetic studies on tuberculosis susceptibility. J Hum Genet. 2011;56(3):177-82. 345. Abel L, El-Baghdadi J, Bousfiha AA, Casanova JL, Schurr E. Human genetics of tuberculosis: a long and winding road. Philos Trans R Soc Lond B Biol Sci. 2014;369(1645):20130428. 346. Schurz H, Daya M, Möller M, Hoal EG, Salie M. TLR1, 2, 4, 6 and 9 Variants Associated with Tuberculosis Susceptibility: A Systematic Review and Meta-Analysis. PLoS One. 2015;10(10):e0139711. 347. Ogus AC, Yoldas B, Ozdemir T, Uguz A, Olcen S, Keser I, et al. The Arg753GLn polymorphism of the human toll-like receptor 2 gene in tuberculosis disease. Eur Respir J. 2004;23(2):219-23. 348. Thuong NT, Hawn TR, Thwaites GE, Chau TT, Lan NT, Quy HT, et al. A polymorphism in human TLR2 is associated with increased susceptibility to tuberculous meningitis. Genes Immun. 2007;8(5):422-8. 349. Velez DR, Wejse C, Stryjewski ME, Abbate E, Hulme WF, Myers JL, et al. Variants in toll-like receptors 2 and 9 influence susceptibility to pulmonary tuberculosis in Caucasians, African-Americans, and West Africans. Hum Genet. 2010;127:65-73. 350. Yim JJ, Lee HW, Lee HS, Kim YW, Han SK, Shim YS, et al. The association between microsatellite polymorphisms in intron II of the human Toll-like receptor 2 gene and tuberculosis among Koreans. Genes Immun. 2006;7(2):150-5. 351. Biswas D, Gupta SK, Sindhwani G, Patras A. TLR2 polymorphisms, Arg753Gln and Arg677Trp, are not associated with increased burden of tuberculosis in Indian patients. BMC Res Notes. 2009;2:162. 352. Ma MJ, Xie LP, Wu SC, Tang F, Li H, Zhang ZS, et al. Toll-like receptors, tumor necrosis factor-α, and interleukin-10 gene polymorphisms in risk of pulmonary tuberculosis and disease severity. Hum Immunol. 2010;71(10):1005-10. 353. Selvaraj P, Harishankar M, Singh B, Jawahar MS, Banurekha VV. Toll-like receptor and TIRAP gene polymorphisms in pulmonary tuberculosis patients of South India. Tuberculosis. 2010;90(5):306-10.

Chapter 1 | General Introduction
57
354. Xue Y, Zhao ZQ, Wang HJ, Jin L, Liu CP, Wang Y, et al. Toll-like receptors 2 and 4 gene polymorphisms in a southeastern Chinese population with tuberculosis. Int J Immunogenet. 2010;37(2):135-8. 355. Thye T, Vannberg FO, Wong SH, Owusu-Dabo E, Osei I, Gyapong J, et al. Genome-wide association analyses identifies a susceptibility locus for tuberculosis on chromosome 18q11.2. Nat Genet. 2010;42(9):739-41. 356. Thye T, Owusu-Dabo E, Vannberg FO, van Crevel R, Curtis J, Sahiratmadja E, et al. Common variants at 11p13 are associated with susceptibility to tuberculosis. Nat Genet. 2012;44(3):257-9. 357. Chimusa ER, Zaitlen N, Daya M, Moller M, van Helden PD, Mulder NJ, et al. Genome-wide association study of ancestry-specific TB risk in the South African coloured population. Hum Mol Genet. 2013;23(3):796–809. 358. Mahasirimongkol S, Yanai H, Mushiroda T, Promphittayarat W, Wattanapokayakit S, Phromjai J, et al. Genome-wide association studies of tuberculosis in Asians identify distinct at-risk locus for young tuberculosis. J Hum Genet. 2012;57(6):363-7. 359. Dai Y, Zhang X, Pan H, Tang S, Shen H, Wang J. Fine mapping of genetic polymorphisms of pulmonary tuberculosis within chromosome 18q11.2 in the Chinese population: a case-control study. BMC Infect Dis. 2011;11:282. 360. Wang X, Tang NL, Leung CC, Kam KM, Yew WW, Tam CM, et al. Association of polymorphisms in the Chr18q11.2 locus with tuberculosis in Chinese population. Hum Genet. 2013;132(6):691-5. 361. Curtis J, Luo Y, Zenner HL, Cuchet-Lourenço D, Wu C, Lo K, et al. Susceptibility to tuberculosis is associated with variants in the ASAP1 gene encoding a regulator of dendritic cell migration. Nat Genet. 2015;47(5):523-7. 362. Png E, Alisjahbana B, Sahiratmadja E, Marzuki S, Nelwan R, Balabanova Y, et al. A genome wide association study of pulmonary tuberculosis susceptibility in Indonesians. BMC Med Genet. 2012;13:5. 363. Grant AV, Sabri A, Abid A, Abderrahmani Rhorfi I, Benkirane M, Souhi H, et al. A genome-wide association study of pulmonary tuberculosis in Morocco. Hum Genet. 2016;135(3):299-307. 364. de Wit E, van der Merwe L, van Helden PD, Hoal EG. Gene-gene interaction between tuberculosis candidate genes in a South African population. Mamm Genome. 2011;22(1-2):100-10. 365. Daya M, van der Merwe L, van Helden PD, Möller M, Hoal EG. Investigating the Role of Gene-Gene Interactions in TB Susceptibility. PLoS One. 2015;10(4):e0123970. 366. Anyama N, Bracebridge S, Black C, Niggebrugge A, Griffin SJ. What happens to people diagnosed with tuberculosis? A population-based cohort. Epidemiol Infect. 2007;135(7):1069-76. 367. Marais BJ, Lönnroth K, Lawn SD, Migliori GB, Mwaba P, Glaziou P, et al. Tuberculosis comorbidity with communicable and non-communicable diseases: integrating health services and control efforts. Lancet Infect Dis. 2013;13(5):436-48. 368. Sonnenberg P, Glynn JR, Fielding K, Murray J, Godfrey-Faussett P, Shearer S. How soon after infection with HIV does the risk of tuberculosis start to increase? A retrospective cohort study in South African gold miners. J Infect Dis. 2005;191(2):150-8. 369. Deffur A, Mulder NJ, Wilkinson RJ. Co-infection with Mycobacterium tuberculosis and human immunodeficiency virus: an overview and motivation for systems approaches. Pathog Dis. 2013;69(2):101-13. 370. Diedrich CR, Flynn JL. HIV-1/Mycobacterium tuberculosis coinfection immunology: how does HIV-1 exacerbate tuberculosis? Infect Immun. 2011;79(4):1407-17. 371. Raviglione MC, Narain JP, Kochi A. HIV-associated tuberculosis in developing countries: clinical features, diagnosis, and treatment. Bull World Health Organ. 1992;70(4):515-26. 372. Harries AD, Maher D, Nunn P. An approach to the problems of diagnosing and treating adult smear-negative pulmonary tuberculosis in high-HIV-prevalence settings in sub-Saharan Africa. Bull World Health Organ. 1998;76(6):651-62. 373. Crump JA, Ramadhani HO, Morrissey AB, Saganda W, Mwako MS, Yang LY, et al. Bacteremic disseminated tuberculosis in sub-saharan Africa: a prospective cohort study. Clin Infect Dis. 2012;55(2):242-50. 374. Crump JA, Reller LB. Two decades of disseminated tuberculosis at a university medical center: the expanding role of mycobacterial blood culture. Clin Infect Dis. 2003;37:1037–43.
Chapter 1 | General Introduction
58
375. Walter ND, de Jong BC, Garcia BJ, Dolganov GM, Worodria W, Byanyima P, et al. Adaptation of Mycobacterium tuberculosis to Impaired Host Immunity in HIV-Infected Patients. J Infect Dis. 2016;214(8):1205-11. 376. Leistikow RL, Morton RA, Bartek IL, Frimpong I, Wagner K, Voskuil MI. The Mycobacterium tuberculosis DosR regulon assists in metabolic homeostasis and enables rapid recovery from nonrespiring dormancy. J Bacteriol. 2010;192(6):1662-70. 377. Resende Co T, Hirsch CS, Toossi Z, Dietze R, Ribeiro-Rodrigues R. Intestinal helminth co-infection has a negative impact on both anti-Mycobacterium tuberculosis immunity and clinical response to tuberculosis therapy. Clin Exp Immunol. 2007;147(1):45-52. 378. Chatterjee S, Nutman TB. Helminth-induced immune regulation: implications for immune responses to tuberculosis. PLoS Pathog. 2015;11(1):e1004582. 379. George PJ, Anuradha R, Kumar NP, Sridhar R, Banurekha VV, Nutman TB, et al. Helminth infections coincident with active pulmonary tuberculosis inhibit mono- and multifunctional CD4+ and CD8+ T cell responses in a process dependent on IL-10. PLoS Pathog. 2014;10(9):e1004375. 380. Redford PS, Mayer-Barber KD, McNab FW, Stavropoulos E, Wack A, Sher A, et al. Influenza A virus impairs control of Mycobacterium tuberculosis coinfection through a type I interferon receptor-dependent pathway. J Infect Dis. 2014;209(2):270-4. 381. Perry S, de Jong BC, Solnick JV, de la Luz Sanchez M, Yang S, Lin PL, et al. Infection with Helicobacter pylori is associated with protection against tuberculosis. PLoS One. 2010;5(1):e8804. 382. Belkaid Y, Hand TW. Role of the microbiota in immunity and inflammation. Cell. 2014;157(1):121-41. 383. Schuijt TJ, Lankelma JM, Scicluna BP, de Sousa e Melo F, Roelofs JJ, de Boer JD, et al. The gut microbiota plays a protective role in the host defence against pneumococcal pneumonia. Gut. 2016;65(4):575-83. 384. Gauguet S, D'Ortona S, Ahnger-Pier K, Duan B, Surana NK, Lu R, et al. Intestinal Microbiota of Mice Influences Resistance to Staphylococcus aureus Pneumonia. Infect Immun. 2015;83(10):4003-14. 385. Clarke TB. Early innate immunity to bacterial infection in the lung is regulated systemically by the commensal microbiota via nod-like receptor ligands. Infect Immun. 2014;82(11):4596-606. 386. Winglee K, Eloe-Fadrosh E, Gupta S, Guo H, Fraser C, Bishai W. Aerosol Mycobacterium tuberculosis infection causes rapid loss of diversity in gut microbiota. PLoS One. 2014;9(5):e97048. 387. Huempfner HR, Deuschle KW. Experimental Tuberculosis in Germ-Free and Conventional Mice. Am Rev Respir Dis. 1966;93(3P1):465-7. 388. Forbes JD, Van Domselaar G, Bernstein CN. The Gut Microbiota in Immune-Mediated Inflammatory Diseases. Front Microbiol. 2016;7:1081. 389. Hauptmann M, Schaible UE. Linking microbiota and respiratory disease. FEBS Lett. 2016. Epub Sep 17. doi: 10.1002/1873-3468.12421. 390. Cambier CJ, Takaki KK, Larson RP, Hernandez RE, Tobin DM, Urdahl KB, et al. Mycobacteria manipulate macrophage recruitment through coordinated use of membrane lipids. Nature. 2014;505(7482):218-22. 391. Ubeda C, Bucci V, Caballero S, Djukovic A, Toussaint NC, Equinda M, et al. Intestinal microbiota containing Barnesiella species cures vancomycin-resistant Enterococcus faecium colonization. Infect Immun. 2013;81(3):965-73. 392. Restrepo BI, Schlesinger LS. Impact of diabetes on the natural history of tuberculosis. Diabetes Res Clin Pract. 2014;106(2):191-9. 393. Bates M, Marais BJ, Zumla A. Tuberculosis Comorbidity with Communicable and Noncommunicable Diseases. Cold Spring Harb Perspect Med. 2015;5(11):a017889. 394. Whiting DR, Guariguata L, Weil C, Shaw J. IDF diabetes atlas: global estimates of the prevalence of diabetes for 2011 and 2030. Diabetes Res Clin Pract. 2011;94(3):311-21. 395. Jiménez-Corona ME, Cruz-Hervert LP, García-García L, Ferreyra-Reyes L, Delgado-Sánchez G, Bobadilla-Del-Valle M, et al. Association of diabetes and tuberculosis: impact on treatment and post-treatment outcomes. Thorax. 2013;68(3):214-20. 396. Bastos HN, Osório NS, Castro AG, Ramos A, Carvalho T, Meira L, et al. A prediction rule to stratify mortality risk of patients with pulmonary tuberculosis. PLoS One. 2016;11(9):e0162797.
Chapter 1 | General Introduction
59
397. Baker MA, Harries AD, Jeon CY, Hart JE, Kapur A, Lönnroth K, et al. The impact of diabetes on tuberculosis treatment outcomes: a systematic review. BMC Med. 2011;9:81. 398. Alisjahbana B, Sahiratmadja E, Nelwan EJ, Purwa AM, Ahmad Y, Ottenhoff TH, et al. The effect of type 2 diabetes mellitus on the presentation and treatment response of pulmonary tuberculosis. Clin Infect Dis. 2007;45(4):428-35. 399. Viswanathan V, Vigneswari A, Selvan K, Satyavani K, Rajeswari R, Kapur A. Effect of diabetes on treatment outcome of smear-positive pulmonary tuberculosis - a report from South India. J Diabetes Complications. 2014;28(2):162-5. 400. Hodgson K, Morris J, Bridson T, Govan B, Rush C, Ketheesan N. Immunological mechanisms contributing to the double burden of diabetes and intracellular bacterial infections. Immunology. 2015;144(2):171-85. 401. Martinez N, Kornfeld H. Diabetes and immunity to tuberculosis. Eur J Immunol. 2014;44(3):617-26. 402. Restrepo BI, Schlesinger LS. Host-pathogen interactions in tuberculosis patients with type 2 diabetes mellitus. Tuberculosis. 2013;93 Suppl:S10-4. 403. Ronacher K, Joosten SA, van Crevel R, Dockrell HM, Walzl G, Ottenhoff TH. Acquired immunodeficiencies and tuberculosis: focus on HIV/AIDS and diabetes mellitus. Immunol Rev. 2015;264(1):121-37. 404. World Health Organization. Global burden of disease website 2016 [8 December 2016]. Available from: http://www.who.int/topics/global_burden_of_disease/en/. 405. van Zyl Smit RN, Pai M, Yew WW, Leung CC, Zumla A, Bateman ED, et al. Global lung health: the colliding epidemics of tuberculosis, tobacco smoking, HIV and COPD. Eur Respir J. 2010;35(1):27-33. 406. Inghammar M, Ekbom A, Engström G, Ljungberg B, Romanus V, Löfdahl CG, et al. COPD and the risk of tuberculosis--a population-based cohort study. PLoS One. 2010;5(4):e10138. 407. Lee CH, Lee MC, Shu CC, Lim CS, Wang JY, Lee LN, et al. Risk factors for pulmonary tuberculosis in patients with chronic obstructive airway disease in Taiwan: a nationwide cohort study. BMC Infect Dis. 2013;13(194). 408. O'Toole RF, Shukla SD, Walters EH. TB meets COPD: An emerging global co-morbidity in human lung disease. Tuberculosis. 2015;95(6):659-63. 409. Inghammar M, Löfdahl CG, Winqvist N, Ljungberg B, Egesten A, Engström G. Impaired pulmonary function and the risk of tuberculosis: a population-based cohort study. Eur Respir J. 2011;37(5):1285-7. 410. Sethi S, Murphy TF. Infection in the pathogenesis and course of chronic obstructive pulmonary disease. N Engl J Med. 2008;359(22):2355-65. 411. Taylor AE, Finney-Hayward TK, Quint JK, Thomas CM, Tudhope SJ, Wedzicha JA, et al. Defective macrophage phagocytosis of bacteria in COPD. Eur Respir J. 2010;35(5):1039-47. 412. Bhat TA, Panzica L, Kalathil SG, Thanavala Y. Immune Dysfunction in Patients with Chronic Obstructive Pulmonary Disease. Ann Am Thorac Soc. 2015;12(Suppl 2):S169-75. 413. Gómez-Reino JJ, Carmona L, Valverde VR, Mola EM, Montero MD, BIOBADASER Group. Treatment of rheumatoid arthritis with tumor necrosis factor inhibitors may predispose to significant increase in tuberculosis risk: a multicenter active-surveillance report. Arthritis Rheum. 2003;48(8):2122-7. 414. Duarte R, Campainha S, Cotter J, Rosa B, Varela P, Correia A, et al. Position paper on tuberculosis screening in patients with immune mediated inflammatory diseases candidates for biological therapy. Acta Reumatol Port. 2012;37(3):253-9. 415. Slama K, Chiang CY, Enarson DA, Hassmiller K, Fanning A, Gupta P, et al. Tobacco and tuberculosis: a qualitative systematic review and meta-analysis. Int J Tuberc Lung Dis. 2007;11(10):1049-61. 416. Lin HH, Ezzati M, Murray M. Tobacco smoke, indoor air pollution and tuberculosis: a systematic review and meta-analysis. PLoS Med. 2007;4(1):e20. 417. Bates MN, Khalakdina A, Pai M, Chang L, Lessa F, Smith KR. Risk of tuberculosis from exposure to tobacco smoke: a systematic review and meta-analysis. Arch Intern Med. 2007;167(4):335-42. 418. O'Leary SM, Coleman MM, Chew WM, Morrow C, McLaughlin AM, Gleeson LE, et al. Cigarette smoking impairs human pulmonary immunity to Mycobacterium tuberculosis. Am J Respir Crit Care Med. 2014;190(12):1430-6.
Chapter 1 | General Introduction
60
419. Robbins CS, Dawe DE, Goncharova SI, Pouladi MA, Drannik AG, Swirski FK, et al. Cigarette smoke decreases pulmonary dendritic cells and impacts antiviral immune responsiveness. Am J Respir Cell Mol Biol. 2004;30(2):202-11. 420. Givi ME, Folkerts G, Wagenaar GT, Redegeld FA, Mortaz E. Cigarette smoke differentially modulates dendritic cell maturation and function in time. Respir Res. 2015;16:131. 421. Shaler CR, Horvath CN, McCormick S, Jeyanathan M, Khera A, Zganiacz A, et al. Continuous and discontinuous cigarette smoke exposure differentially affects protective Th1 immunity against pulmonary tuberculosis. PLoS One. 2013;8(3):e59185. 422. Berg RD, Levitte S, O'Sullivan MP, O'Leary SM, Cambier CJ, Cameron J, et al. Lysosomal disorders drive susceptibility to tuberculosis by compromising macrophage migration. Cell. 2016;165(1):139-52. 423. Feingold AO. Association of tuberculosis with alcoholism. South Med J. 1976;69:1336-7. 424. Olin JS, Grzybowski S. Tuberculosis and alcoholism. Can Med Assoc J. 1966;94:999-1001. 425. Brown KE, Campbell AH. Tobacco, alcohol and tuberculosis. Br J Dis Chest 1961;55:150-8. 426. Mason CM, Dobard E, Zhang P, Nelson S. Alcohol exacerbates murine pulmonary tuberculosis. Infect Immun. 2004;72(5):2556-63. 427. Porretta E, Happel KI, Teng XS, Ramsay A, Mason CM. The impact of alcohol on BCG-induced immunity against Mycobacterium tuberculosis. Alcohol Clin Exp Res. 2012;36(2):310-7. 428. Schaible UE, Kaufmann SH. Malnutrition and infection: complex mechanisms and global impacts. PLoS Med. 2007;4(5):e115. 429. Cegielski JP, McMurray DN. The relationship between malnutrition and tuberculosis: evidence from studies in humans and experimental animals. Int J Tuberc Lung Dis. 2004;8(3):286-98. 430. Scalcini M, Occenac R, Manfreda J, Long R. Pulmonary tuberculosis, human immunodeficiency virus type-1 and malnutrition. Bull Int Union Tuberc Lung Dis. 1991;66(1):37-41. 431. Jeremiah K, Denti P, Chigutsa E, Faurholt-Jepsen D, PrayGod G, Range N, et al. Nutritional supplementation increases rifampin exposure among tuberculosis patients coinfected with HIV. Antimicrob Agents Chemother. 2014;58(6):3468-74. 432. Davies PD. A possible link between vitamin D deficiency and impaired host defence to Mycobacterium tuberculosis. Tubercle. 1985;66(4):301-6. 433. Hewison M. Vitamin D and the immune system: New perspectives on an old theme. Rheum Dis Clin N Am. 2012;38:125–39. 434. Martineau AR, Wilkinson KA, Newton SM, Floto RA, Norman AW, Skolimowska K, et al. IFN-gamma- and TNF-independent vitamin D-inducible human suppression of mycobacteria: the role of cathelicidin LL-37. J Immunol. 2007;178(11):7190-8. 435. Martineau AR, Nhamoyebonde S, Oni T, Rangaka MX, Marais S, Bangani N, et al. Reciprocal seasonal variation in vitamin D status and tuberculosis notifications in Cape Town, South Africa. Proc Natl Acad Sci U S A. 2011;108(47):19013-7. 436. Kim JH, Park JS, Cho YJ, Yoon HI, Song JH, Lee CT, et al. Low serum 25-hydroxyvitamin D level: an independent risk factor for tuberculosis? Clin Nutr. 2014;33(6):1081-6. 437. Pareek M, Innes J, Sridhar S, Grass L, Connell D, Woltmann G, et al. Vitamin D deficiency and TB disease phenotype. Thorax. 2015;70(12):1171-80. 438. Coussens AK, Wilkinson RJ, Hanifa Y, Nikolayevskyy V, Elkington PT, Islam K, et al. Vitamin D accelerates resolution of inflammatory responses during tuberculosis treatment. Proc Natl Acad Sci U S A. 2012;109(38):15449-54. 439. Campbell GR, Spector SA. Vitamin D inhibits human immunodeficiency virus type 1 and Mycobacterium tuberculosis infection in macrophages through the induction of autophagy. PLoS Pathog. 2012;8(5):e1002689. 440. Chambers ES, Hawrylowicz CM. The impact of vitamin D on regulatory T cells. Curr Allergy Asthma Rep. 2011;11(1):29-36. 441. Cegielski P, Vernon A. Tuberculosis and vitamin D: what's the rest of the story? Lancet Infect Dis. 2015;15(5):489-90. 442. Martineau AR, Timms PM, Bothamley GH, Hanifa Y, Islam K, Claxton AP, et al. High-dose vitamin D(3) during intensive-phase antimicrobial treatment of pulmonary tuberculosis: a double-blind randomised controlled trial. Lancet. 2011;377(9761):242-50.

Chapter 1 | General Introduction
61
443. Young DB, Perkins MD, Duncan K, Barry CE 3rd. Confronting the scientific obstacles to global control of tuberculosis. J Clin Invest. 2008;118(4):1255-65. 444. Barry CE 3rd, Boshoff HI, Dartois V, Dick T, Ehrt S, Flynn J, et al. The spectrum of latent tuberculosis: rethinking the biology and intervention strategies. Nat Rev Microbiol. 2009;7(12):845-55. 445. Coscolla M, Gagneux S. Does M. tuberculosis genomic diversity explain disease diversity? Drug Discov Today Dis Mech. 2010;7(1):e43. 446. Zumla A, Maeurer M; Host-Directed Therapies Network, Chakaya J, Hoelscher M, Ntoumi F, Rustomjee R, et al. Towards host-directed therapies for tuberculosis. Nat Rev Drug Discov. 2015;14(8):511-12. 447. Zumla A, Maeurer M, Host-Directed Therapies Network (HDT-NET) Consortium. Host-directed therapies for tackling multi-drug resistant tuberculosis: learning from the Pasteur-Bechamp debates. Clin Infect Dis. 2015;61(9):1432–8. 448. Wallis RS, Hafner R. Advancing host-directed therapy for tuberculosis. Nat Rev Immunol. 2015;15(4):255–63.

62

63
CHAPTER 2 – OBJECTIVES OF THE THESIS ____________________________________________________________

64
Chapter 2 | Objectives of the thesis
65
Although tuberculosis (TB) is a main global cause of morbidity and
mortality, its pathophysiology remains only partly characterized. Upon
exposure, some subjects become infected and only a smaller proportion of
these undergo transition to active disease during their lifetime. Remarkably,
among the active TB patients, the clinical manifestation of disease is also highly
variable, with mild or extensive pulmonary involvement, extrapulmonary or
disseminated forms of TB. While the precise mechanisms governing the
transitions along this spectrum remain largely unknown, immune imbalances
are widely accepted as key participants in this process. These imbalances are
shaped by the host genetics, the bacterial heterogeneity and by extrinsic
factors. Altogether, this troika orchestrates the type and intensity of the immune
response generated during infection and consequently its outcome. This
project aimed at building and exploring a biological bank of samples from TB-
exposed individuals or patients and of M. tuberculosis isolates that would
provide a platform for genetic and biological studies. In this thesis, we focused
on the contribution of host and bacteria factors to the heterogeneity of TB, in
the light of inflammation as a central process for pathogenesis. The specific
objectives, leading to the results presented in this dissertation are described
below.
1. Clinical characterization of TB patients, identification of risk factors
and stratification of severity
After identifying cases of culture-confirmed pulmonary TB (PTB)
diagnosed at the Hospital de São João, Porto, Portugal, between 2007
and 2013, a clinical characterization was undergone by collecting
demographic and standard clinical information. This task led to the
development of a TB risk assessment tool (TReAT), with the aim of
stratifying the risk of death among PTB patients, thereby possibly
helping on the decision for different management options. The study
of clinical features of the cohort also provided the foundations for the
following tasks, in terms of selecting cases without predictor or
Chapter 2 | Objectives of the thesis
66
precipitator TB factors for biological studies and to characterize the
severity of TB within this group.
2. Correlating the pathogen genotypic and phenotypic properties with
TB clinical features and severity
The cohort described above, where the patient’s clinical data and the
matched M. tuberculosis infecting strains were available, provided a
unique ground to investigate the complex interplay between the
pathogen properties and the disease severity. The purpose of this task
was to explore the phylogenetic distribution of M. tuberculosis isolates
collected from a group of patients without known predictor or
precipitator TB factors in Hospital de São João, a major healthcare
center in the Porto area, Portugal. Furthermore, we aimed to
understand the possible links between the phylogenetic structure and
bacterial growth properties of molecularly characterized strains with
clinical phenotypes of severity.
3. Correlating the cytokine expression profile induced in human cells
by different M. tuberculosis isolates associated with specific clinical
features
We proposed to investigate the interaction of selected M. tuberculosis
isolates with human peripheral blood mononuclear cells (PBMCs) to
evaluate if a specific pattern of inflammatory responses associated
with the outcome of TB. Representative M. tuberculosis strains were
selected based on their association with the extreme (mild versus
severe) clinical manifestations of TB, in order to uncover a possible
relationship between the profile of the inflammatory response
induced by clinical isolates and their association with severity of
disease. We also compared the cell responses of non-progressor
(non-recent/non-treated latent infected donors) with progressor
subjects (past TB patients), to underpin potential immunological
correlates of protection/susceptibility for latent to active TB transition.

Chapter 2 | Objectives of the thesis
67
By achieving the proposed objectives, we will enhance our understanding
on the intricate network of events modulating inflammation in TB, which will
possibly help to build more effective vaccines and host directed therapies to
stop this disease being one of the main killers of our times.

68

69
CHAPTER 3 – A PREDICTION RULE TO STRATIFY
MORTALITY RISK OF PATIENTS WITH
PULMONARY TUBERCULOSIS ______________________________________________________________
70
The results presented in this chapter were published:
(i) in an international peer reviewed journal
Bastos HN, Osório NS, Castro AG, Ramos A, Carvalho T, Meira L, Araújo D, Almeida
L, Boaventura R, Fragata P, Chaves C, Costa P, Portela M, Ferreira I, Magalhães SP,
Rodrigues F, Sarmento-Castro R, Duarte R, Guimarães JT, Saraiva M. A prediction
rule to stratify mortality risk of patients with pulmonary tuberculosis. PLoS One.
2016; 11(9): e0162797
(ii) in conferences
European Respiratory Society (ERS) Annual Congress 2016 | London, 3-7
September 2016
A prediction rule to stratify mortality risk of patients with pulmonary tuberculosis
(Oral communication) | Authors: Helder Novais e Bastos, Nuno Osório, António Gil Castro,
Angélica Ramos, Teresa Carvalho, Leonor Meira, David Araújo, Leonor Almeida, Rita Boaventura,
Patrícia Fragata, Catarina Chaves, Patrício Costa, Ivo Ferreira, Sara Magalhães, Fernando Rodrigues,
Rui Sarmento Castro, Raquel Duarte, João Tiago Guimarães, Margarida Saraiva
Eur Respir J 2016; 48 (Suppl. 60): OA4825
Chapter 3 | A prediction rule to stratify mortality risk of patients with pulmonar tuberculosis
71
ABSTRACT Tuberculosis imposes high human and economic tolls, including in Europe.
This study was conducted to develop a severity assessment tool for stratifying
mortality risk in pulmonary tuberculosis (PTB) patients. A derivation cohort of
681 PTB cases was retrospectively reviewed to generate a model based on
multiple logistic regression analysis of prognostic variables with 6-month
mortality as the outcome measure. A clinical scoring system was developed and
tested against a validation cohort of 103 patients. Five risk features were selected
for the prediction model: hypoxemic respiratory failure (OR 4.7, 95% CI 2.8-7.9),
age ≥50 years (OR 2.9, 95% CI 1.7-4.8), bilateral lung involvement (OR 2.5, 95%
CI 1.4-4.4), ≥1 significant comorbidity – HIV infection, diabetes mellitus, liver
failure or cirrhosis, congestive heart failure and chronic respiratory disease – (OR
2.3, 95% CI 1.3-3.8), and hemoglobin <12 g/dL (OR 1.8, 95% CI 1.1-3.1). A
tuberculosis risk assessment tool (TReAT) was developed, stratifying patients with
low (score ≤2), moderate (score 3-5) and high (score ≥6) mortality risk. The
mortality associated with each group was 2.9%, 22.9% and 53.9%, respectively.
The model performed equally well in the validation cohort. We provide a new,
easy-to-use clinical scoring system to identify PTB patients with high-mortality
risk in settings with good healthcare access, helping clinicians to decide which
patients are in need of closer medical care during treatment.

Chapter 3 | A prediction rule to stratify mortality risk of patients with pulmonar tuberculosis
72
INTRODUCTION Tuberculosis (TB) remains a major global health problem, with an
estimated 9.6 million new cases and 1.5 million deaths in 2014 [1]. In Portugal,
the incidence was still 25/100.000 inhabitants (intermediate incidence rate) and,
contrasting to the majority of other European countries, most of the new TB cases
are Portuguese native. A very recent report [2] analysed the social profile of the
highest TB incidence areas in Portugal between 2002 and 2012 and concluded
that immigrants comprised only 1.6 to 1.8% in the region of Porto, while the
highest proportion was seen in the Lisbon area (8.4-8.8%), where larger migration
influx has occurred mainly from sub-Saharan African former colonies. In spite of
the greater incidence as compared to other countries, treatment success rate in
Portugal is high [1] and the case-fatality rate has been below the European Union
average [3], which accounts for the efficiency of the national healthcare system.
An increased risk of death from TB has been attributed to drug resistance
acquisition and HIV coinfection, especially in developing countries with high
incidence [3]. However, following population-based epidemiological studies in
regions of low and intermediate TB incidence, other predictors of mortality have
been identified. This was the case of increasing age, male gender, the occurrence
of extrapulmonary TB and several comorbidities [3-7]. Therefore, objective
clinical assessment of risk factors may help lowering the death rate associated
with TB by selecting those patients who might be in need of increased clinical
supervision or advanced medical treatment.
The use of clinical prediction rules (CPR) gained has relevance in the field
of lung diseases in the last decades [8]. Although several prediction scores have
been developed in the field of TB, most of them are available for diagnostic
purposes [9-13], with only three providing prognosis-centred CPRs [6, 14, 15].
Among these, none is representative of a low to intermediate incidence region,
with low rates of drug resistance, in both hospital and ambulatory settings. In this
context, we developed a TB risk assessment tool (TReAT) based on readily
available clinical features, with the aim of stratifying the risk of death among

Chapter 3 | A prediction rule to stratify mortality risk of patients with pulmonar tuberculosis
73
pulmonary TB (PTB) patients and possibly helping on the decision for different
management options.

Chapter 3 | A prediction rule to stratify mortality risk of patients with pulmonar tuberculosis
74
MATERIALS AND METHODS
1. Study design and patient population
For the derivation (training) set, the clinical records of patients with
Mycobacterium tuberculosis positive culture at a University-affiliated hospital
(Hospital de São João - HSJ, Porto) during the period of 7 years (2007-2013)
were retrospectively analysed. TB cases were defined according to the WHO
guidelines and treatment was administered by DOT 5-7 days/week, with the
recommended treatment regimens [16]. Exclusion criteria were: i) exclusively
extrathoracic TB; ii) age <18 years and iii) lack of information (no registries
found). Subjects were categorized according to the disease site as: i) exclusively
pulmonary; ii) pleural, with or without proven PTB; or iii) combined extrathoracic
and PTB. Extrathoracic involvement was defined as disease in organs other than
the lungs or pleura, with either M. tuberculosis culture isolation or histologic
demonstration of caseating granulomas [16].
The validation set was provided by the Chest Disease Centre (CDC) of Vila
Nova de Gaia, an ambulatory referral centre for TB screening and treatment in a
large urban area of the north of Portugal. Since mortality of patients diagnosed
at the hospital is higher than what is observed in the non-hospital setting, we
forced a ratio cases (deaths) to controls (survivors) similar to the derivation
cohort, by using an entry-time-matched validation set. Cases that immediately
preceded and/or immediately followed each of the fatalities occurring between
2007 and 2014 were defined as time-matched controls (survivors). No particular
pairing was performed as the order of the individuals in the dataset was arbitrary.
The reporting of this study conforms to the Strengthening the Reporting of
Observational Studies in Epidemiology (STROBE) statement [17] and to the
CHecklist for critical Appraisal and data extraction for systematic Reviews of
prediction Modelling Studies (CHARMS) [18].
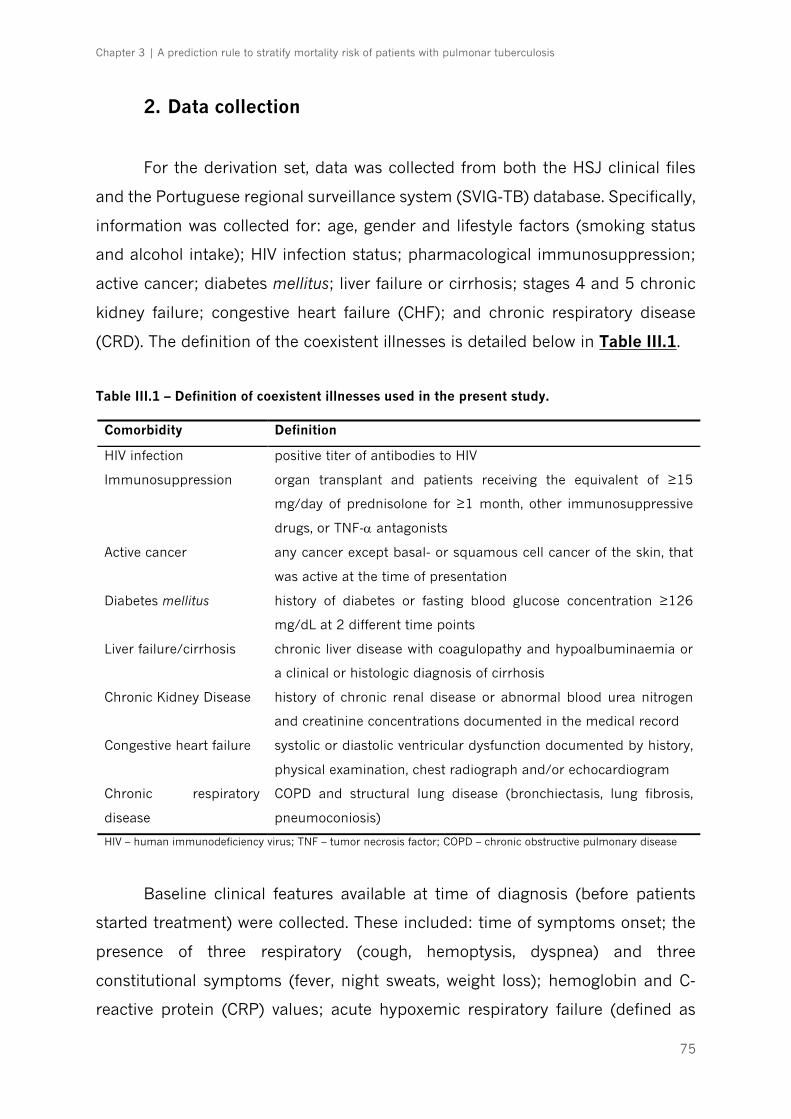
Chapter 3 | A prediction rule to stratify mortality risk of patients with pulmonar tuberculosis
75
2. Data collection
For the derivation set, data was collected from both the HSJ clinical files
and the Portuguese regional surveillance system (SVIG-TB) database. Specifically,
information was collected for: age, gender and lifestyle factors (smoking status
and alcohol intake); HIV infection status; pharmacological immunosuppression;
active cancer; diabetes mellitus; liver failure or cirrhosis; stages 4 and 5 chronic
kidney failure; congestive heart failure (CHF); and chronic respiratory disease
(CRD). The definition of the coexistent illnesses is detailed below in Table III.1.
Table III.1 – Definition of coexistent illnesses used in the present study.
Comorbidity Definition
HIV infection positive titer of antibodies to HIV
Immunosuppression organ transplant and patients receiving the equivalent of ≥15
mg/day of prednisolone for ≥1 month, other immunosuppressive
drugs, or TNF-a antagonists
Active cancer any cancer except basal- or squamous cell cancer of the skin, that
was active at the time of presentation
Diabetes mellitus history of diabetes or fasting blood glucose concentration ≥126
mg/dL at 2 different time points
Liver failure/cirrhosis chronic liver disease with coagulopathy and hypoalbuminaemia or
a clinical or histologic diagnosis of cirrhosis
Chronic Kidney Disease history of chronic renal disease or abnormal blood urea nitrogen
and creatinine concentrations documented in the medical record
Congestive heart failure systolic or diastolic ventricular dysfunction documented by history,
physical examination, chest radiograph and/or echocardiogram
Chronic respiratory
disease
COPD and structural lung disease (bronchiectasis, lung fibrosis,
pneumoconiosis)
HIV – human immunodeficiency virus; TNF – tumor necrosis factor; COPD – chronic obstructive pulmonary disease
Baseline clinical features available at time of diagnosis (before patients
started treatment) were collected. These included: time of symptoms onset; the
presence of three respiratory (cough, hemoptysis, dyspnea) and three
constitutional symptoms (fever, night sweats, weight loss); hemoglobin and C-
reactive protein (CRP) values; acute hypoxemic respiratory failure (defined as

Chapter 3 | A prediction rule to stratify mortality risk of patients with pulmonar tuberculosis
76
newly onset partial pressure of oxygen decrease to <60 mmHg, or arterial oxygen
saturation <90%); and digital images of plain chest radiographs. Baseline chest
radiographs were blindly analysed by two independent physicians according to
the lesions extent, the presence of lung cavitation and pleural effusion.
Disagreement between readers was resolved through a consensus read by a third
physician. Most cases had microscopic examination of auramine-stained sputum
slides, ranking acid-fast bacilli load as negative, 1+, 2+, or 3+ [19] and a drug
susceptibility profile was also available. Deaths that occurred during the first 6
months after diagnosis were classified as TB death [16]. The survival time was
calculated between dates of the first microbiological sampling (which allowed for
the provisional diagnosis before culture positivity could be ascertained) and
death. Patients were censored at the date of the last visit if they were lost to follow-
up or at the end of TB treatment. Data were recorded as missing if information
could not be ascertained by review of paper and electronic charts. Missing values
within the derivation set are detailed on Table III.2. For the validation set, only
cases with complete data for the predictors included in the clinical score were
considered.
3. Statistical analysis
Univariate analyses were conducted for all variables comparing survivors
and fatalities in the derivation cohort. Continuous variables were recategorized
into binary factors. In the absence of previously described thresholds in the
literature, we used the Youden index criterion to estimate the optimal cut-point
when giving equal weight to sensitivity and specificity [20]. For categorical
variables, comparisons were made using a Chi-square test or Fisher exact test as
appropriate. For continuous variables, comparisons were made using an
independent group t-test, or a Mann-Whitney U-test for non-normally distributed
variables.
Models to predict death in PTB patients were derived using stepwise
logistic regression with 6-month mortality as the outcome measure. Eight
Chapter 3 | A prediction rule to stratify mortality risk of patients with pulmonar tuberculosis
77
clinically plausible interactions were tested (listed in Table III.3). The results of
significant predictors were reported as odds ratios (ORs) and 95% confidence
intervals (CI). Models were assessed for goodness-of-fit using receiving operator
characteristic (ROC) curves and the Hosmer-Lemeshow test. Then, using the
Heckman's selection model, values of significant variables with missing data were
modeled and incorporated into the initial model to assess and correct for
potential bias. This method attempts to control for the effect of nonrandom
selection by incorporating both the observed and unobserved factors that affect
nonresponse [21].
To derive a simple-to-compute risk score, the regression coefficients of the
predictors were divided by the smallest coefficient and then rounded to the
nearest integer [22]. For each patient, a total risk score was obtained by
calculating the sum of individual points attributed to each of the variable.
Three methods were used to validate the CPR. Pearson's Chi-square tests
for independence were performed to test the association between risk score
groups and observed deaths on derivation and validation cohorts and for total
sample. Association between categories was evaluated based on the adjusted
residual scores, where absolute values >1.96 represent significant differences for
95% confidence level (P<0.05). Significant positive scores reveal a tendency to
observe death in the considered group. To describe the accuracy of the model
for predicting mortality, we reported the sensitivity, specificity and test predictive
values. The area under the ROC curve (AUC) and its 95% CI were determined and
compared in the derivation and validation cohorts. All the statistical analyses were
performed using the SPSS software program, version 22 (IBM® SPSS®, Inc.) and
STATA, version 14 (STATA Corp) for Heckman modeling.
Chapter 3 | A prediction rule to stratify mortality risk of patients with pulmonar tuberculosis
78
4. Ethics
The study protocol was approved by the Health Ethics Committees of the
HSJ (approval number 109-11), the North Health Region Administration
(approval number 71-2014) and the Portuguese Data Protection Authority
(approval number 12174-2011). The requirement to obtain informed written
consent from each individual was waived, as the study was limited to the review
of existing medical records. To ensure confidentiality, each case was anonymized
by the assignment of a random identification number.
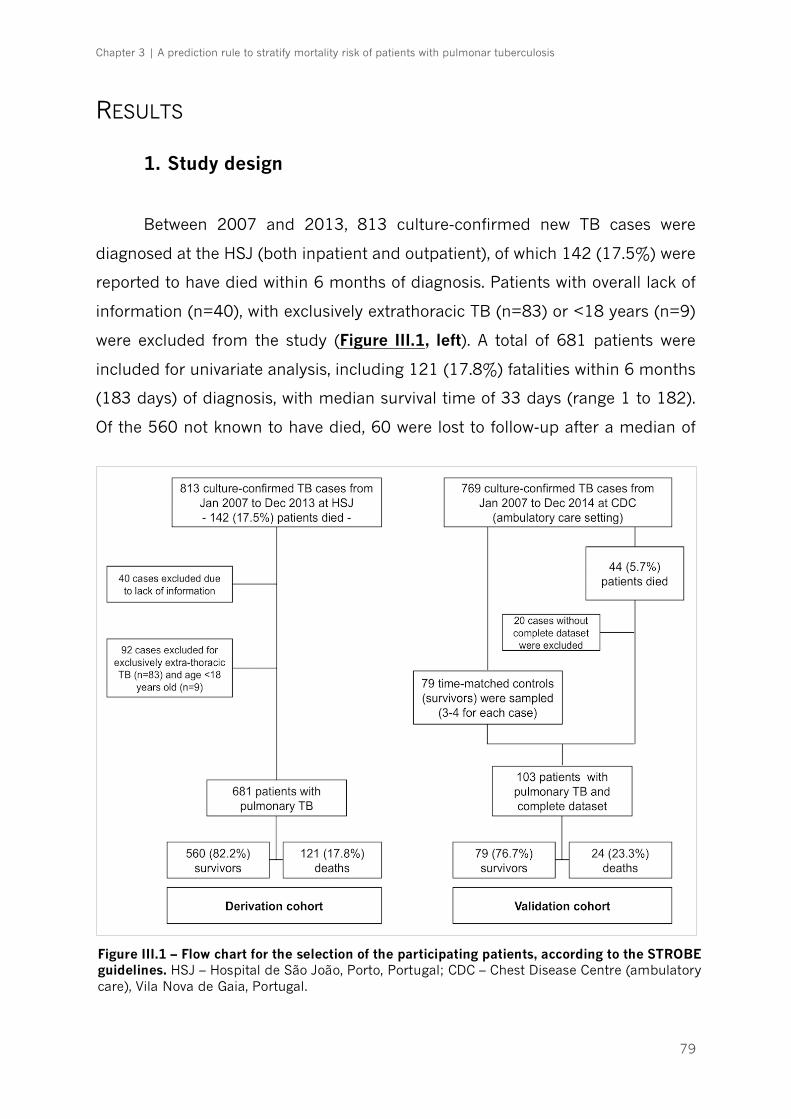
Chapter 3 | A prediction rule to stratify mortality risk of patients with pulmonar tuberculosis
79
RESULTS
1. Study design
Between 2007 and 2013, 813 culture-confirmed new TB cases were
diagnosed at the HSJ (both inpatient and outpatient), of which 142 (17.5%) were
reported to have died within 6 months of diagnosis. Patients with overall lack of
information (n=40), with exclusively extrathoracic TB (n=83) or <18 years (n=9)
were excluded from the study (Figure III.1, left). A total of 681 patients were
included for univariate analysis, including 121 (17.8%) fatalities within 6 months
(183 days) of diagnosis, with median survival time of 33 days (range 1 to 182).
Of the 560 not known to have died, 60 were lost to follow-up after a median of
Figure III.1 – Flow chart for the selection of the participating patients, according to the STROBE guidelines. HSJ – Hospital de São João, Porto, Portugal; CDC – Chest Disease Centre (ambulatory care), Vila Nova de Gaia, Portugal.
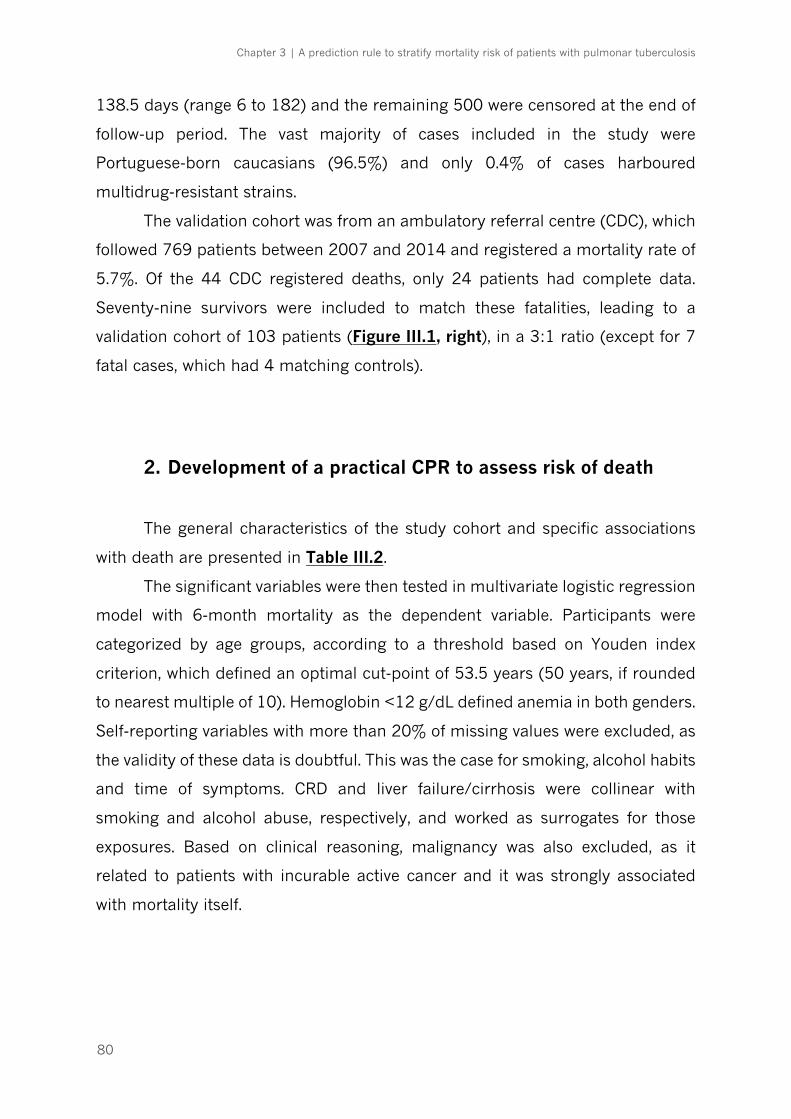
Chapter 3 | A prediction rule to stratify mortality risk of patients with pulmonar tuberculosis
80
138.5 days (range 6 to 182) and the remaining 500 were censored at the end of
follow-up period. The vast majority of cases included in the study were
Portuguese-born caucasians (96.5%) and only 0.4% of cases harboured
multidrug-resistant strains.
The validation cohort was from an ambulatory referral centre (CDC), which
followed 769 patients between 2007 and 2014 and registered a mortality rate of
5.7%. Of the 44 CDC registered deaths, only 24 patients had complete data.
Seventy-nine survivors were included to match these fatalities, leading to a
validation cohort of 103 patients (Figure III.1, right), in a 3:1 ratio (except for 7
fatal cases, which had 4 matching controls).
2. Development of a practical CPR to assess risk of death
The general characteristics of the study cohort and specific associations
with death are presented in Table III.2.
The significant variables were then tested in multivariate logistic regression
model with 6-month mortality as the dependent variable. Participants were
categorized by age groups, according to a threshold based on Youden index
criterion, which defined an optimal cut-point of 53.5 years (50 years, if rounded
to nearest multiple of 10). Hemoglobin <12 g/dL defined anemia in both genders.
Self-reporting variables with more than 20% of missing values were excluded, as
the validity of these data is doubtful. This was the case for smoking, alcohol habits
and time of symptoms. CRD and liver failure/cirrhosis were collinear with
smoking and alcohol abuse, respectively, and worked as surrogates for those
exposures. Based on clinical reasoning, malignancy was also excluded, as it
related to patients with incurable active cancer and it was strongly associated
with mortality itself.
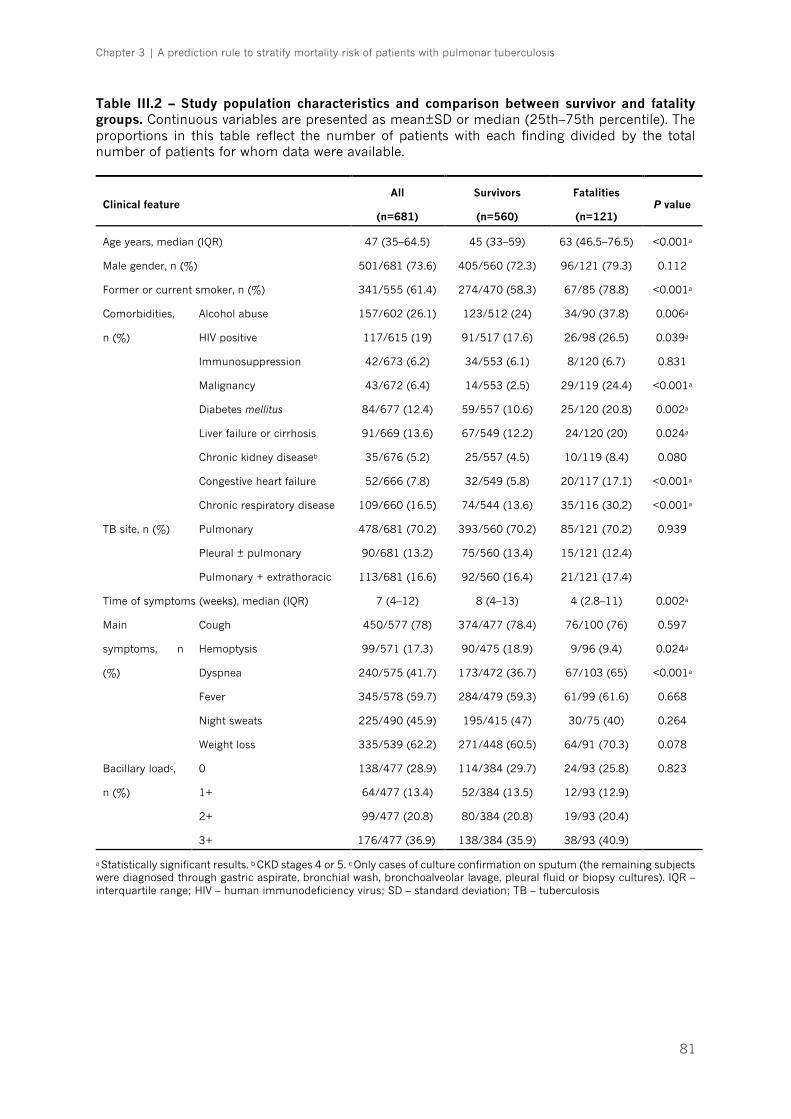
Chapter 3 | A prediction rule to stratify mortality risk of patients with pulmonar tuberculosis
81
Table III.2 – Study population characteristics and comparison between survivor and fatality groups. Continuous variables are presented as mean±SD or median (25th–75th percentile). The proportions in this table reflect the number of patients with each finding divided by the total number of patients for whom data were available.
Clinical feature All
(n=681)
Survivors
(n=560)
Fatalities
(n=121) P value
Age years, median (IQR) 47 (35–64.5) 45 (33–59) 63 (46.5–76.5) <0.001a
Male gender, n (%) 501/681 (73.6) 405/560 (72.3) 96/121 (79.3) 0.112
Former or current smoker, n (%) 341/555 (61.4) 274/470 (58.3) 67/85 (78.8) <0.001a
Comorbidities,
n (%)
Alcohol abuse 157/602 (26.1) 123/512 (24) 34/90 (37.8) 0.006a
HIV positive 117/615 (19) 91/517 (17.6) 26/98 (26.5) 0.039a
Immunosuppression 42/673 (6.2) 34/553 (6.1) 8/120 (6.7) 0.831
Malignancy 43/672 (6.4) 14/553 (2.5) 29/119 (24.4) <0.001a
Diabetes mellitus 84/677 (12.4) 59/557 (10.6) 25/120 (20.8) 0.002a
Liver failure or cirrhosis 91/669 (13.6) 67/549 (12.2) 24/120 (20) 0.024a
Chronic kidney diseaseb 35/676 (5.2) 25/557 (4.5) 10/119 (8.4) 0.080
Congestive heart failure 52/666 (7.8) 32/549 (5.8) 20/117 (17.1) <0.001a
Chronic respiratory disease 109/660 (16.5) 74/544 (13.6) 35/116 (30.2) <0.001a
TB site, n (%) Pulmonary 478/681 (70.2) 393/560 (70.2) 85/121 (70.2) 0.939
Pleural ± pulmonary 90/681 (13.2) 75/560 (13.4) 15/121 (12.4)
Pulmonary + extrathoracic 113/681 (16.6) 92/560 (16.4) 21/121 (17.4)
Time of symptoms (weeks), median (IQR) 7 (4–12) 8 (4–13) 4 (2.8–11) 0.002a
Main
symptoms, n
(%)
Cough 450/577 (78) 374/477 (78.4) 76/100 (76) 0.597
Hemoptysis 99/571 (17.3) 90/475 (18.9) 9/96 (9.4) 0.024a
Dyspnea 240/575 (41.7) 173/472 (36.7) 67/103 (65) <0.001a
Fever 345/578 (59.7) 284/479 (59.3) 61/99 (61.6) 0.668
Night sweats 225/490 (45.9) 195/415 (47) 30/75 (40) 0.264
Weight loss 335/539 (62.2) 271/448 (60.5) 64/91 (70.3) 0.078
Bacillary loadc,
n (%)
0 138/477 (28.9) 114/384 (29.7) 24/93 (25.8) 0.823
1+ 64/477 (13.4) 52/384 (13.5) 12/93 (12.9)
2+ 99/477 (20.8) 80/384 (20.8) 19/93 (20.4)
3+ 176/477 (36.9) 138/384 (35.9) 38/93 (40.9)
a Statistically significant results. b CKD stages 4 or 5. c Only cases of culture confirmation on sputum (the remaining subjects were diagnosed through gastric aspirate, bronchial wash, bronchoalveolar lavage, pleural fluid or biopsy cultures). IQR – interquartile range; HIV – human immunodeficiency virus; SD – standard deviation; TB – tuberculosis
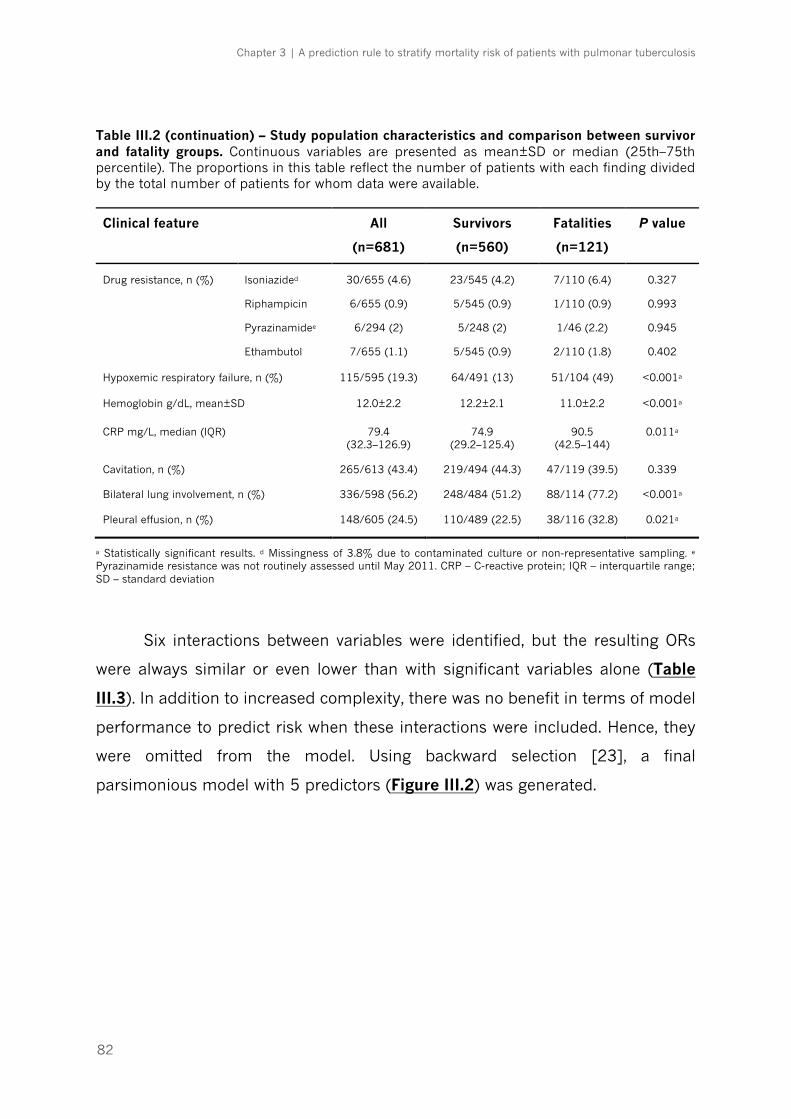
Chapter 3 | A prediction rule to stratify mortality risk of patients with pulmonar tuberculosis
82
Table III.2 (continuation) – Study population characteristics and comparison between survivor and fatality groups. Continuous variables are presented as mean±SD or median (25th–75th percentile). The proportions in this table reflect the number of patients with each finding divided by the total number of patients for whom data were available.
Clinical feature All
(n=681)
Survivors
(n=560)
Fatalities
(n=121)
P value
Drug resistance, n (%) Isoniazided 30/655 (4.6) 23/545 (4.2) 7/110 (6.4) 0.327
Riphampicin 6/655 (0.9) 5/545 (0.9) 1/110 (0.9) 0.993
Pyrazinamidee 6/294 (2) 5/248 (2) 1/46 (2.2) 0.945
Ethambutol 7/655 (1.1) 5/545 (0.9) 2/110 (1.8) 0.402
Hypoxemic respiratory failure, n (%) 115/595 (19.3) 64/491 (13) 51/104 (49) <0.001a
Hemoglobin g/dL, mean±SD 12.0±2.2 12.2±2.1 11.0±2.2 <0.001a
CRP mg/L, median (IQR) 79.4 (32.3–126.9)
74.9 (29.2–125.4)
90.5 (42.5–144)
0.011a
Cavitation, n (%) 265/613 (43.4) 219/494 (44.3) 47/119 (39.5) 0.339
Bilateral lung involvement, n (%) 336/598 (56.2) 248/484 (51.2) 88/114 (77.2) <0.001a
Pleural effusion, n (%) 148/605 (24.5) 110/489 (22.5) 38/116 (32.8) 0.021a
a Statistically significant results. d Missingness of 3.8% due to contaminated culture or non-representative sampling. e Pyrazinamide resistance was not routinely assessed until May 2011. CRP – C-reactive protein; IQR – interquartile range; SD – standard deviation
Six interactions between variables were identified, but the resulting ORs
were always similar or even lower than with significant variables alone (Table
III.3). In addition to increased complexity, there was no benefit in terms of model
performance to predict risk when these interactions were included. Hence, they
were omitted from the model. Using backward selection [23], a final
parsimonious model with 5 predictors (Figure III.2) was generated.
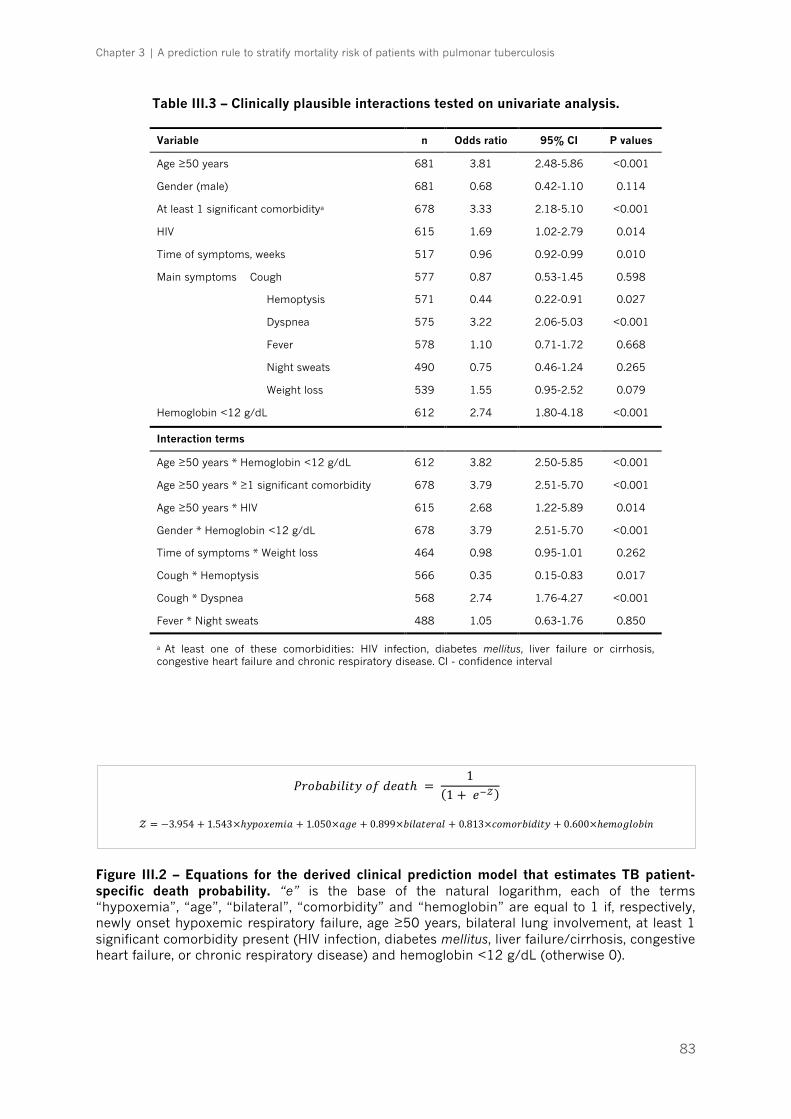
Chapter 3 | A prediction rule to stratify mortality risk of patients with pulmonar tuberculosis
83
Table III.3 – Clinically plausible interactions tested on univariate analysis.
Figure III.2 – Equations for the derived clinical prediction model that estimates TB patient-specific death probability. “e” is the base of the natural logarithm, each of the terms “hypoxemia”, “age”, “bilateral”, “comorbidity” and “hemoglobin” are equal to 1 if, respectively, newly onset hypoxemic respiratory failure, age ≥50 years, bilateral lung involvement, at least 1 significant comorbidity present (HIV infection, diabetes mellitus, liver failure/cirrhosis, congestive heart failure, or chronic respiratory disease) and hemoglobin <12 g/dL (otherwise 0).
Variable n Odds ratio 95% CI P values
Age ≥50 years 681 3.81 2.48-5.86 <0.001
Gender (male) 681 0.68 0.42-1.10 0.114
At least 1 significant comorbiditya 678 3.33 2.18-5.10 <0.001
HIV 615 1.69 1.02-2.79 0.014
Time of symptoms, weeks 517 0.96 0.92-0.99 0.010
Main symptoms Cough
Hemoptysis
Dyspnea
Fever
Night sweats
Weight loss
577
571
575
578
490
539
0.87
0.44
3.22
1.10
0.75
1.55
0.53-1.45
0.22-0.91
2.06-5.03
0.71-1.72
0.46-1.24
0.95-2.52
0.598
0.027
<0.001
0.668
0.265
0.079
Hemoglobin <12 g/dL 612 2.74 1.80-4.18 <0.001
Interaction terms
Age ≥50 years * Hemoglobin <12 g/dL 612 3.82 2.50-5.85 <0.001
Age ≥50 years * ≥1 significant comorbidity 678 3.79 2.51-5.70 <0.001
Age ≥50 years * HIV 615 2.68 1.22-5.89 0.014
Gender * Hemoglobin <12 g/dL 678 3.79 2.51-5.70 <0.001
Time of symptoms * Weight loss 464 0.98 0.95-1.01 0.262
Cough * Hemoptysis 566 0.35 0.15-0.83 0.017
Cough * Dyspnea 568 2.74 1.76-4.27 <0.001
Fever * Night sweats 488 1.05 0.63-1.76 0.850
a At least one of these comorbidities: HIV infection, diabetes mellitus, liver failure or cirrhosis, congestive heart failure and chronic respiratory disease. CI - confidence interval
𝑃𝑟𝑜𝑏𝑎𝑏𝑖𝑙𝑖𝑡𝑦𝑜𝑓𝑑𝑒𝑎𝑡ℎ = 1
(1 + 𝑒3𝒵)
𝒵 = −3.954 + 1.543×ℎ𝑦𝑝𝑜𝑥𝑒𝑚𝑖𝑎 + 1.050×𝑎𝑔𝑒 + 0.899×𝑏𝑖𝑙𝑎𝑡𝑒𝑟𝑎𝑙 + 0.813×𝑐𝑜𝑚𝑜𝑟𝑏𝑖𝑑𝑖𝑡𝑦 + 0.600×ℎ𝑒𝑚𝑜𝑔𝑙𝑜𝑏𝑖𝑛
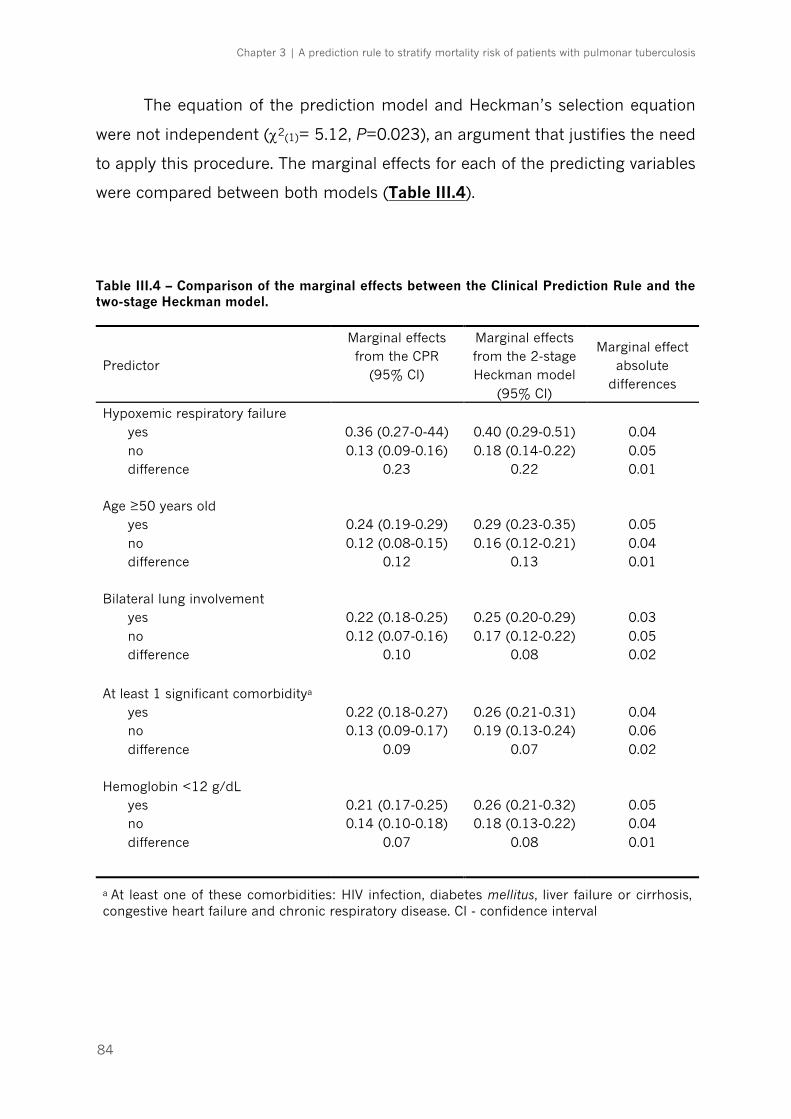
Chapter 3 | A prediction rule to stratify mortality risk of patients with pulmonar tuberculosis
84
The equation of the prediction model and Heckman’s selection equation
were not independent (c2(1)= 5.12, P=0.023), an argument that justifies the need
to apply this procedure. The marginal effects for each of the predicting variables
were compared between both models (Table III.4).
Table III.4 – Comparison of the marginal effects between the Clinical Prediction Rule and the two-stage Heckman model.
Predictor
Marginal effects from the CPR
(95% CI)
Marginal effects from the 2-stage Heckman model
(95% CI)
Marginal effect absolute
differences
Hypoxemic respiratory failure yes no difference
0.36 (0.27-0-44) 0.13 (0.09-0.16)
0.23
0.40 (0.29-0.51) 0.18 (0.14-0.22)
0.22
0.04 0.05 0.01
Age ≥50 years old yes no difference
0.24 (0.19-0.29) 0.12 (0.08-0.15)
0.12
0.29 (0.23-0.35) 0.16 (0.12-0.21)
0.13
0.05 0.04 0.01
Bilateral lung involvement yes no difference
0.22 (0.18-0.25) 0.12 (0.07-0.16)
0.10
0.25 (0.20-0.29) 0.17 (0.12-0.22)
0.08
0.03 0.05 0.02
At least 1 significant comorbiditya
yes no difference
0.22 (0.18-0.27) 0.13 (0.09-0.17)
0.09
0.26 (0.21-0.31) 0.19 (0.13-0.24)
0.07
0.04 0.06 0.02
Hemoglobin <12 g/dL yes no difference
0.21 (0.17-0.25) 0.14 (0.10-0.18)
0.07
0.26 (0.21-0.32) 0.18 (0.13-0.22)
0.08
0.05 0.04 0.01
a At least one of these comorbidities: HIV infection, diabetes mellitus, liver failure or cirrhosis, congestive heart failure and chronic respiratory disease. CI - confidence interval
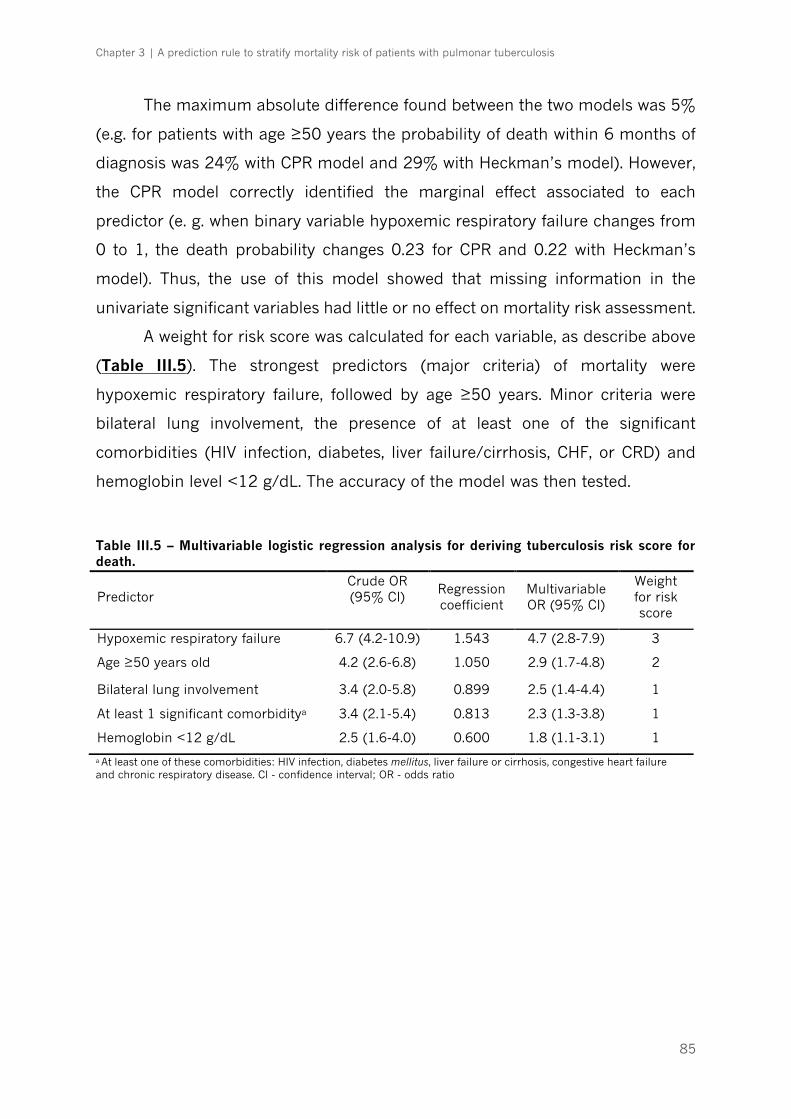
Chapter 3 | A prediction rule to stratify mortality risk of patients with pulmonar tuberculosis
85
The maximum absolute difference found between the two models was 5%
(e.g. for patients with age ≥50 years the probability of death within 6 months of
diagnosis was 24% with CPR model and 29% with Heckman’s model). However,
the CPR model correctly identified the marginal effect associated to each
predictor (e. g. when binary variable hypoxemic respiratory failure changes from
0 to 1, the death probability changes 0.23 for CPR and 0.22 with Heckman’s
model). Thus, the use of this model showed that missing information in the
univariate significant variables had little or no effect on mortality risk assessment.
A weight for risk score was calculated for each variable, as describe above
(Table III.5). The strongest predictors (major criteria) of mortality were
hypoxemic respiratory failure, followed by age ≥50 years. Minor criteria were
bilateral lung involvement, the presence of at least one of the significant
comorbidities (HIV infection, diabetes, liver failure/cirrhosis, CHF, or CRD) and
hemoglobin level <12 g/dL. The accuracy of the model was then tested.
Table III.5 – Multivariable logistic regression analysis for deriving tuberculosis risk score for death.
a At least one of these comorbidities: HIV infection, diabetes mellitus, liver failure or cirrhosis, congestive heart failure and chronic respiratory disease. CI - confidence interval; OR - odds ratio
Predictor Crude OR (95% CI)
Regression coefficient
Multivariable OR (95% CI)
Weight for risk score
Hypoxemic respiratory failure 6.7 (4.2-10.9) 1.543 4.7 (2.8-7.9) 3
Age ≥50 years old 4.2 (2.6-6.8) 1.050 2.9 (1.7-4.8) 2
Bilateral lung involvement 3.4 (2.0-5.8) 0.899 2.5 (1.4-4.4) 1
At least 1 significant comorbiditya 3.4 (2.1-5.4) 0.813 2.3 (1.3-3.8) 1
Hemoglobin <12 g/dL 2.5 (1.6-4.0) 0.600 1.8 (1.1-3.1) 1
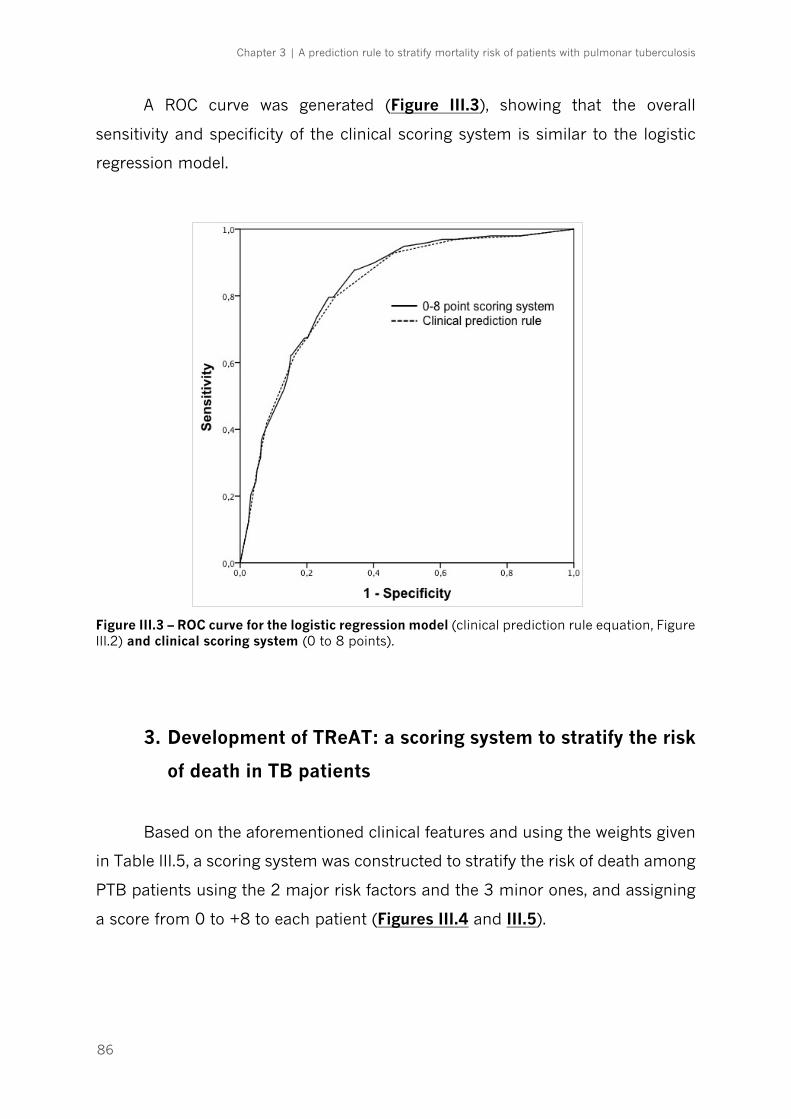
Chapter 3 | A prediction rule to stratify mortality risk of patients with pulmonar tuberculosis
86
A ROC curve was generated (Figure III.3), showing that the overall
sensitivity and specificity of the clinical scoring system is similar to the logistic
regression model.
Figure III.3 – ROC curve for the logistic regression model (clinical prediction rule equation, Figure III.2) and clinical scoring system (0 to 8 points).
3. Development of TReAT: a scoring system to stratify the risk
of death in TB patients
Based on the aforementioned clinical features and using the weights given
in Table III.5, a scoring system was constructed to stratify the risk of death among
PTB patients using the 2 major risk factors and the 3 minor ones, and assigning
a score from 0 to +8 to each patient (Figures III.4 and III.5).
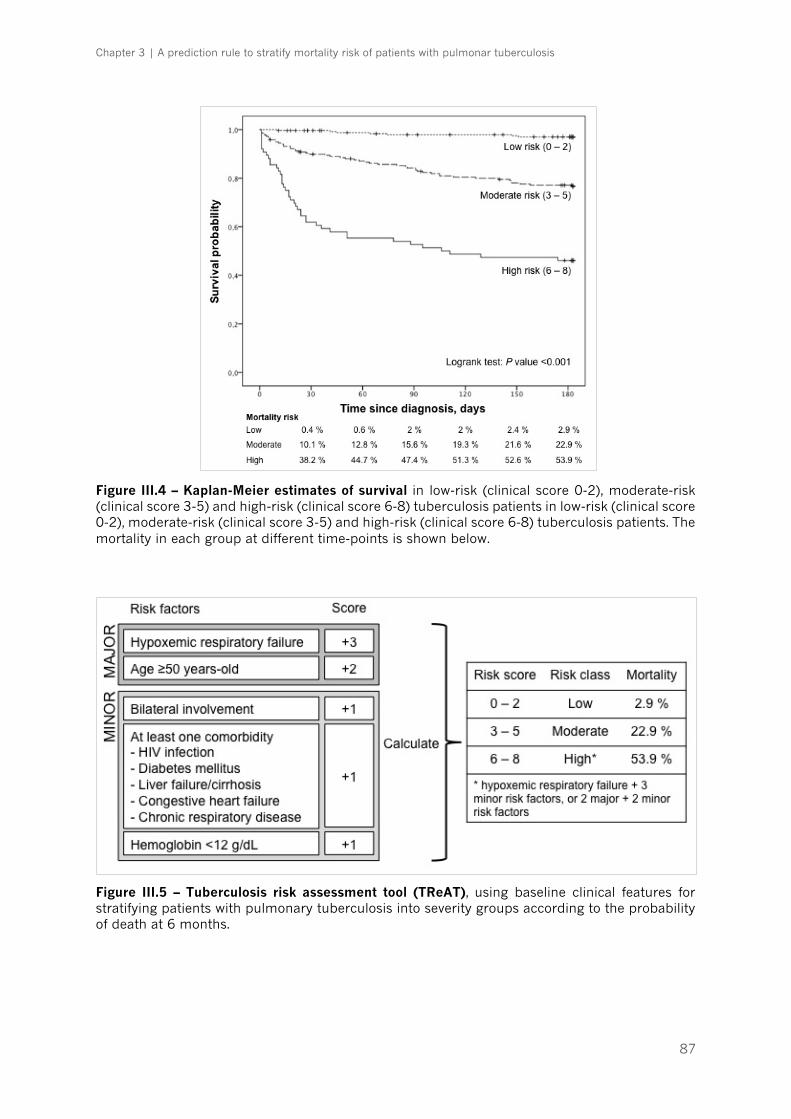
Chapter 3 | A prediction rule to stratify mortality risk of patients with pulmonar tuberculosis
87
Figure III.4 – Kaplan-Meier estimates of survival in low-risk (clinical score 0-2), moderate-risk (clinical score 3-5) and high-risk (clinical score 6-8) tuberculosis patients in low-risk (clinical score 0-2), moderate-risk (clinical score 3-5) and high-risk (clinical score 6-8) tuberculosis patients. The mortality in each group at different time-points is shown below.
Figure III.5 – Tuberculosis risk assessment tool (TReAT), using baseline clinical features for stratifying patients with pulmonary tuberculosis into severity groups according to the probability of death at 6 months.
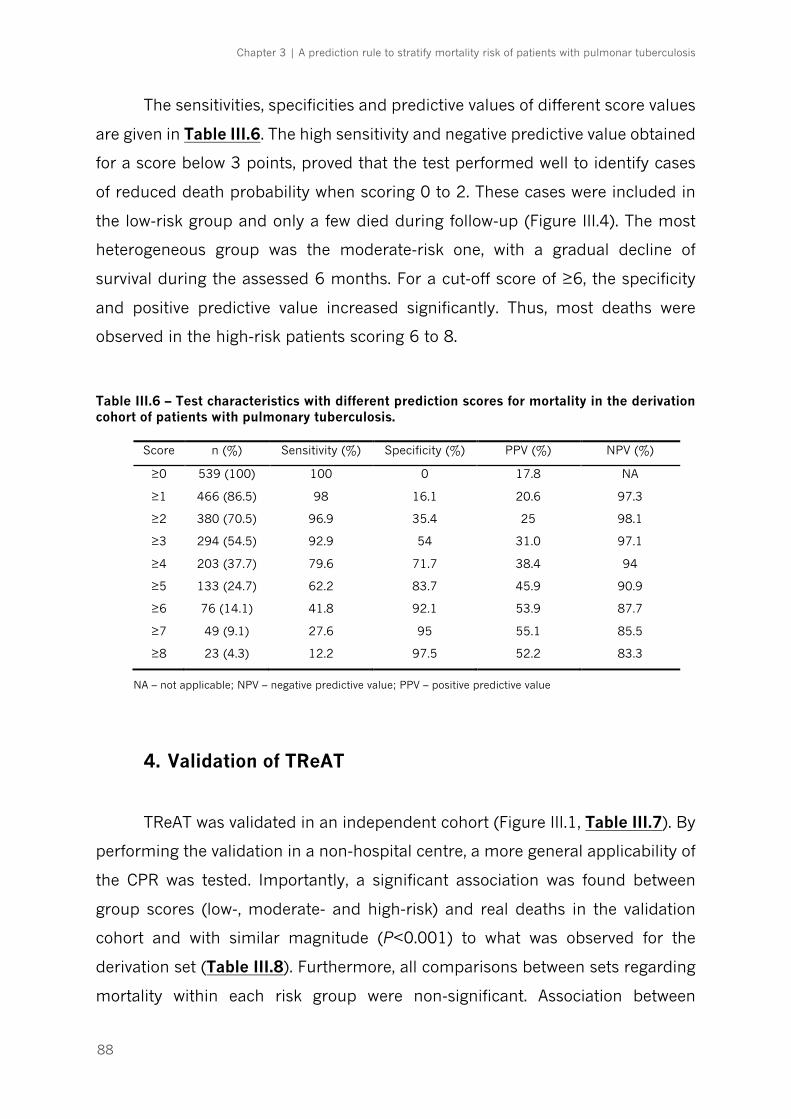
Chapter 3 | A prediction rule to stratify mortality risk of patients with pulmonar tuberculosis
88
The sensitivities, specificities and predictive values of different score values
are given in Table III.6. The high sensitivity and negative predictive value obtained
for a score below 3 points, proved that the test performed well to identify cases
of reduced death probability when scoring 0 to 2. These cases were included in
the low-risk group and only a few died during follow-up (Figure III.4). The most
heterogeneous group was the moderate-risk one, with a gradual decline of
survival during the assessed 6 months. For a cut-off score of ≥6, the specificity
and positive predictive value increased significantly. Thus, most deaths were
observed in the high-risk patients scoring 6 to 8.
Table III.6 – Test characteristics with different prediction scores for mortality in the derivation cohort of patients with pulmonary tuberculosis.
Score n (%) Sensitivity (%) Specificity (%) PPV (%) NPV (%)
≥0 539 (100) 100 0 17.8 NA
≥1 466 (86.5) 98 16.1 20.6 97.3
≥2 380 (70.5) 96.9 35.4 25 98.1
≥3 294 (54.5) 92.9 54 31.0 97.1
≥4 203 (37.7) 79.6 71.7 38.4 94
≥5 133 (24.7) 62.2 83.7 45.9 90.9
≥6 76 (14.1) 41.8 92.1 53.9 87.7
≥7 49 (9.1) 27.6 95 55.1 85.5
≥8 23 (4.3) 12.2 97.5 52.2 83.3
NA – not applicable; NPV – negative predictive value; PPV – positive predictive value
4. Validation of TReAT
TReAT was validated in an independent cohort (Figure III.1, Table III.7). By
performing the validation in a non-hospital centre, a more general applicability of
the CPR was tested. Importantly, a significant association was found between
group scores (low-, moderate- and high-risk) and real deaths in the validation
cohort and with similar magnitude (P<0.001) to what was observed for the
derivation set (Table III.8). Furthermore, all comparisons between sets regarding
mortality within each risk group were non-significant. Association between
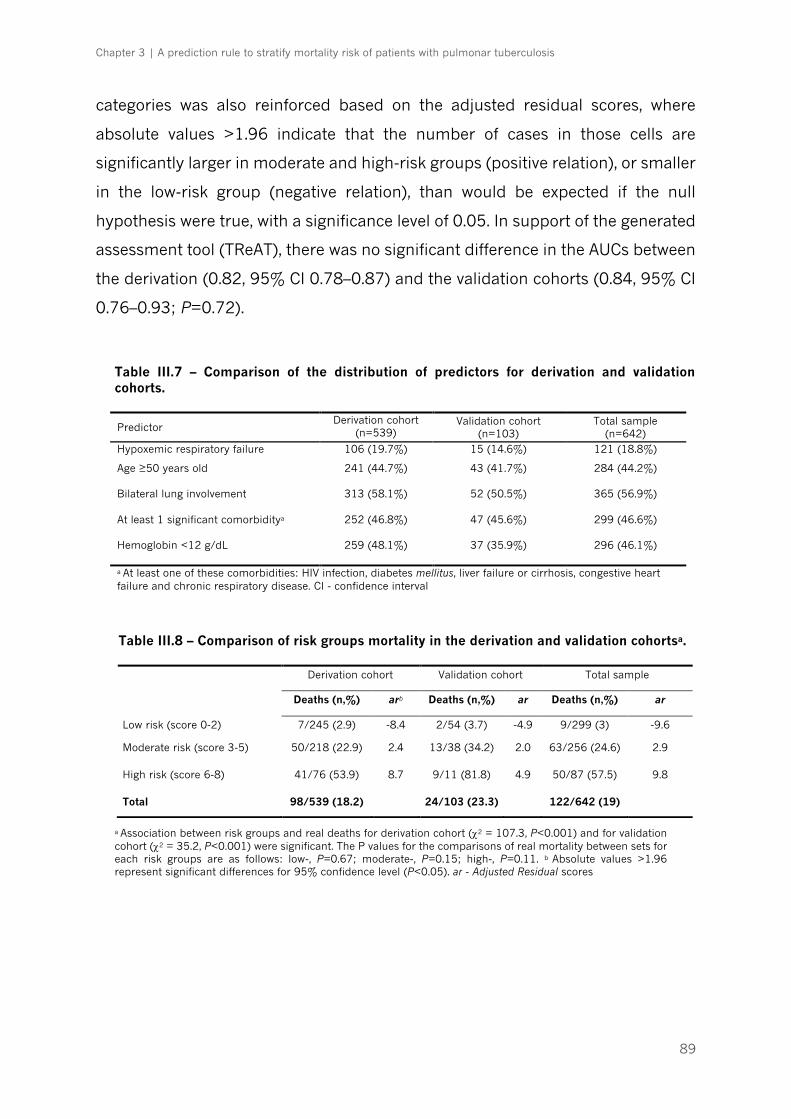
Chapter 3 | A prediction rule to stratify mortality risk of patients with pulmonar tuberculosis
89
categories was also reinforced based on the adjusted residual scores, where
absolute values >1.96 indicate that the number of cases in those cells are
significantly larger in moderate and high-risk groups (positive relation), or smaller
in the low-risk group (negative relation), than would be expected if the null
hypothesis were true, with a significance level of 0.05. In support of the generated
assessment tool (TReAT), there was no significant difference in the AUCs between
the derivation (0.82, 95% CI 0.78–0.87) and the validation cohorts (0.84, 95% CI
0.76–0.93; P=0.72).
Table III.7 – Comparison of the distribution of predictors for derivation and validation cohorts.
Predictor Derivation cohort
(n=539) Validation cohort
(n=103) Total sample
(n=642) Hypoxemic respiratory failure 106 (19.7%) 15 (14.6%) 121 (18.8%)
Age ≥50 years old
241 (44.7%) 43 (41.7%) 284 (44.2%)
Bilateral lung involvement
313 (58.1%) 52 (50.5%) 365 (56.9%)
At least 1 significant comorbiditya
252 (46.8%) 47 (45.6%) 299 (46.6%)
Hemoglobin <12 g/dL
259 (48.1%) 37 (35.9%) 296 (46.1%)
a At least one of these comorbidities: HIV infection, diabetes mellitus, liver failure or cirrhosis, congestive heart failure and chronic respiratory disease. CI - confidence interval
Table III.8 – Comparison of risk groups mortality in the derivation and validation cohortsa.
a Association between risk groups and real deaths for derivation cohort (c2 = 107.3, P<0.001) and for validation cohort (c2 = 35.2, P<0.001) were significant. The P values for the comparisons of real mortality between sets for each risk groups are as follows: low-, P=0.67; moderate-, P=0.15; high-, P=0.11. b Absolute values >1.96 represent significant differences for 95% confidence level (P<0.05). ar - Adjusted Residual scores
Derivation cohort Validation cohort Total sample
Deaths (n,%) arb Deaths (n,%) ar Deaths (n,%) ar
Low risk (score 0-2) 7/245 (2.9) -8.4 2/54 (3.7) -4.9 9/299 (3) -9.6
Moderate risk (score 3-5) 50/218 (22.9) 2.4 13/38 (34.2) 2.0 63/256 (24.6) 2.9
High risk (score 6-8) 41/76 (53.9) 8.7 9/11 (81.8) 4.9 50/87 (57.5) 9.8
Total 98/539 (18.2) 24/103 (23.3) 122/642 (19)
Chapter 3 | A prediction rule to stratify mortality risk of patients with pulmonar tuberculosis
90
DISCUSSION
This study offers, to the best of our knowledge, the first CPR for TB death
prognosis in a high-income region of low to intermediate TB incidence, without
expressive multi-drug resistance, comprising both hospital and ambulatory
settings. The aim of this CPR is to signal confirmed cases of TB who are at higher
risk of death and thus need a stricter medical supervision. Other TB scoring
systems have been previously developed, but a few limitations likely hinder their
use in this specific context. To the best of our knowledge, only three prognostic
rules have been developed for TB. Wejse et al. proposed the first prediction rule
(the Bandim TBscore) in a low-resource country (Guinea-Bissau), based on five
symptoms and six clinical signs [14]. There are a few reasons why this score may
not be applicable to our setting: i) it was never validated in a high-income region,
which has very different epidemiological features and better healthcare access;
ii) a large proportion of the patients included in the Bandim TBscore study were
HIV-infected and had no antiretroviral treatment available, which could
independently affect mortality; and iii) in the same study more than half of the
cases were smear negative and had no culture confirmation of TB diagnosis. In
our cohort, smear negative cases comprised only one third of the subjects, mostly
old and HIV-infected patients, but all had culture-proven TB. Another prognostic
score was developed by Horita et al. to predict in-hospital death in a context
similar to ours [6]. However, the analysis was biased by excluding multidrug
resistant-TB and HIV-infected subjects, which are known to increase mortality [3,
4, 24, 25]. Also, other comorbidities were not included in their score and diabetes
was not significantly associated to death (possibly due to the small sample size),
contrarily to the majority of other studies [26-28], including the present one. By
including coexistent conditions in TReAT, the weight given to age was attenuated,
as young patients with diseases, like HIV/AIDS and liver failure/cirrhosis, were
also considered at risk. Moreover, all patients included in the Horita et al. study
were admitted to the ward, which is hardly representative for the overall
population of culture-positive TB patients, since in many European countries,
Chapter 3 | A prediction rule to stratify mortality risk of patients with pulmonar tuberculosis
91
including Portugal, TB treatment is done largely outside the hospital setting.
Finally, Valade et al. [15] assessed only 53 cases to propose a prognostic scoring
system for TB patients admitted to the intensive care unit. It will be interesting,
in future, to compare TReAT with each of these scores and analyse their relative
performance and applicability to different settings.
In the present work, the fatal outcome was determined until 6 months after
diagnosis, which is supported by several studies, including clinical trials [29-31],
and contemplates the minimum duration of the standard multidrug treatment.
Late mortality related to TB was previously described to stabilize after 6-months
of treatment [30]. Nevertheless, patients died more frequently during the first 30
days after diagnosis, which did not appear to be related with diagnostic delay,
since fatal cases usually had shorter time of symptoms compared to survivors
(Table III.1). Our results thus suggest that high-risk subjects are usually severely
ill from the beginning and should, therefore, be strictly followed and start anti-TB
drugs under close monitoring. Initial care in an intensive care or high dependency
unit may be appropriate for some cases, particularly because they may have a
slow response to standard treatment regimens. The mortality in the derivation
cohort (17.5%) was higher than the national estimate (6.4%) [1] and that of the
validation cohort (5.7%). This is in line with the described worse TB outcome in
hospitalized patients [32, 33]. However, in-hospital mortality due to PTB seems
underestimated, when those who require advanced respiratory support face a
much higher death rate (up to 70%) than subjects with respiratory failure due to
other causes [34].
One of the strengths of this study was the clear definition of our predictor
variables, which are not dependent on patient’s recall or susceptible to clinicians’
subjective judgement. The proposed prediction model is based on intrinsic
patients’ characteristics (age and comorbidities), disease extent (respiratory
failure and one radiographic feature) and a measure of consumption and overall
nutritional status (hemoglobin level). The relevance of these variables to the
outcome of TB is in line with previous studies [3-7, 14, 31, 34-36].
Limitations of the current study include its retrospective nature and the
fact that the validation set is relatively small. Owing to the retrospective design of
Chapter 3 | A prediction rule to stratify mortality risk of patients with pulmonar tuberculosis
92
the study, a significant number of missing values were found in certain variables.
The causes of non-random missing information are very heterogeneous, mainly
dependent on the patient status, or on the clinicians, who were of different
medical specialties, acting in different settings (emergency room, ward, ICU,
outpatient clinic), and may have neglected differential data. For instance, there
was a 12.6% of missingness in the “hypoxemic respiratory failure” variable. It is
possible that less severe patients without any signs of respiratory distress were
not assessed for hypoxemia. On the other hand, patients who were admitted at
the busy emergency room and who died during the first 24-48h after admission
may have had a short description of his/her clinical condition or past history.
Also, 66 patients (9%) of the derivation cohort were not tested for HIV. In a recent
work [37] with 7683 TB cases notified in Northern Portugal between 2006 and
2012, 879 (11%) had also unknown HIV status (usually older patients or without
history of addiction). We addressed the missingness issue by applying the
Heckman method and showed the little impact on the validity of the prediction
model. Moreover, sample collection was based in two centres with geographical
proximity. It is however important to note that these centres had very different
characteristics (hospital versus ambulatory) and yet the accuracy of TReAT was
similar. Considering the small validation set, it will undoubtedly be of interest to
test this CPR prospectively to other surroundings, in whole cohorts or in
multicentric studies that would allow larger sample sizes.
The WHO has recently launched the End TB Strategy, which defined the
lines towards TB elimination [38]. Among the discussed requirements was the
importance of monitoring treatment outcomes. As TB incidence rates decrease
with a combination of near-universal access to high-quality diagnosis and
treatment and general socioeconomic development, it is expected that the TB
death rate will become one of the core indicators for disease control [11].
Implementation of a CPR to identify patients who are more likely to die may
prompt screening initiatives in particular risk groups and point directions for
further programmatic interventions. On the other hand, the great variability of
reported rates of hospital admission and lengths of stay for TB [39, 40] may
reflect the uncertainty among clinicians regarding the definition of severity of

Chapter 3 | A prediction rule to stratify mortality risk of patients with pulmonar tuberculosis
93
illness. We expect that the proposed TReAT helps to bridge these gaps, providing
more cost-effectiveness use of medical resources by selecting more appropriately
patients that will need closer clinical surveillance.
Chapter 3 | A prediction rule to stratify mortality risk of patients with pulmonar tuberculosis
94
REFERENCES
1. World Health Organization. Global tuberculosis report 2016. Geneva: World Health Organization; 2016. 2. Franco I, Sousa P, Gomes M, Oliveira A, Gaio AR, Duarte R. Social profile of the highest tuberculosis incidence areas in Portugal. Rev Port Pneumol. 2016;22(1):50-2. 3. Lefebvre N, Falzon D. Risk factors for death among tuberculosis cases: analysis of European surveillance data. Eur Respir J. 2008;31(6):1256-60. 4. Low S, Ang LW, Cutter J, James L, Chee CB, Wang YT, et al. Mortality among tuberculosis patients on treatment in Singapore. Int J Tuberc Lung Dis. 2009;13(3):328-34. 5. Walpola HC, Siskind V, Patel AM, Konstantinos A, Derhy P. Tuberculosis-related deaths in Queensland, Australia, 1989-1998: characteristics and risk factors. Int J Tuberc Lung Dis. 2003;7(8):742-50. 6. Horita N, Miyazawa N, Yoshiyama T, Sato T, Yamamoto M, Tomaru K, et al. Development and validation of a tuberculosis prognostic score for smear-positive in-patients in Japan. Int J Tuberc Lung Dis. 2013;17(1):54-60. 7. Lui G, Wong RY, Li F, Lee MK, Lai RW, Li TC, et al. High mortality in adults hospitalized for active tuberculosis in a low HIV prevalence setting. PLoS One. 2014;9(3):e92077. 8. Lim WS, van der Eerden MM, Laing R, Boersma WG, Karalus N, Town GI, et al. Defining community acquired pneumonia severity on presentation to hospital: an international derivation and validation study. Thorax. 2003;58(5):377-82. 9. Mello FC, Bastos LG, Soares SL, Rezende VM, Conde MB, Chaisson RE, et al. Predicting smear negative pulmonary tuberculosis with classification trees and logistic regression: a cross-sectional study. BMC Public Health. 2006;6:43. 10. Fournet N, Sanchez A, Massari V, Penna L, Natal S, Biondi E, et al. Development and evaluation of tuberculosis screening scores in Brazilian prisons. Public Health. 2006;120(10):976-83. 11. Pontali E, Centis R, D'Ambrosio L, Migliori GB. Monitoring predictors of mortality: A necessary action to reach TB elimination. Rev Port Pneumol. 2015;21(6):295-8. 12. Wisnivesky JP, Henschke C, Balentine J, Willner C, Deloire AM, McGinn TG. Prospective validation of a prediction model for isolating inpatients with suspected pulmonary tuberculosis. Arch Intern Med. 2005;165(4):453-7. 13. Solari L, Acuna-Villaorduna C, Soto A, Agapito J, Perez F, Samalvides F, et al. A clinical prediction rule for pulmonary tuberculosis in emergency departments. Int J Tuberc Lung Dis. 2008;12(6):619-24. 14. Wejse C, Gustafson P, Nielsen J, Gomes VF, Aaby P, Andersen PL, et al. TBscore: Signs and symptoms from tuberculosis patients in a low-resource setting have predictive value and may be used to assess clinical course. Scand J Infect Dis. 2008;40(2):111-20. 15. Valade S, Raskine L, Aout M, Malissin I, Brun P, Deye N, et al. Tuberculosis in the intensive care unit: A retrospective descriptive cohort study with determination of a predictive fatality score. Can J Infect Dis Med Microbiol. 2012;23(4):173-8. 16. World Health Organization. Guidelines for treatment of tuberculosis - 4rd edition Geneva: World Health Organization; 2010. 17. von Elm E, Altman DG, Egger M, Pocock SJ, Gotzsche PC, Vandenbroucke JP. The Strengthening the Reporting of Observational Studies in Epidemiology (STROBE) statement: guidelines for reporting observational studies. Lancet. 2007;370:1453–7. 18. Moons KGM, de Groot JAH, Bouwmeester W, Vergouwe Y, Mallett S, Altman DG, et al. Critical Appraisal and Data Extraction for Systematic Reviews of Prediction Modelling Studies: The CHARMS Checklist. PLoS Med. 2014;11(10):e1001744. 19. Isenberg HD. Clinical Microbiology Procedures Handbook. 2nd ed. Washington D.C: ASM Press; 2004. 20. Fluss R, Faraggi D, Reiser B. Estimation of the Youden index and its associated cutoff point. Biom J. 2005;47(4):458-72.
Chapter 3 | A prediction rule to stratify mortality risk of patients with pulmonar tuberculosis
95
21. Sales AE, Plomondon ME, Magid DJ, Spertus JA, Rumsfeld JS. Assessing response bias from missing quality of life data: the Heckman method. Health Qual Life Outcomes. 2004;16(2):49. 22. Toll DB, Janssen KJ, Vergouwe Y, Moons KG. Validation, updating and impact of clinical prediction rules: a review. J Clin Epidemiol. 2008;61(11):1085-94. 23. Bouwmeester W, Zuithoff NP, Mallett S, Geerlings MI, Vergouwe Y, Steyerberg EW, et al. Reporting and methods in clinical prediction research: a systematic review. PLoS Med. 2012;9(5):1-12. 24. Horne DJ, Hubbard R, Narita M, Exarchos A, Park DR, Goss CH. Factors associated with mortality in patients with tuberculosis. BMC Infect Dis. 2010;10:258. doi: 10.1186/1471-2334-10-258. 25. Millet JP, Orcau A, Rius C, Casals M, de Olalla PG, Moreno A, et al. Predictors of death among patients who completed tuberculosis treatment: a population-based cohort study. PLoS One. 2011;6(9):e25315. 26. Dooley KE, Chaisson RE. Tuberculosis and diabetes mellitus: convergence of two epidemics. Lancet Infect Dis. 2009;9(12):737-46. 27. Lee PH, Lin HC, Huang AS, Wei SH, Lai MS, Lin HH. Diabetes and risk of tuberculosis relapse: nationwide nested case-control study. PLoS One. 2014;9(3):e92623. 28. Baker MA, Lin HH, Chang HY, Murray MB. The risk of tuberculosis disease among persons with diabetes mellitus: a prospective cohort study. Clin Infect Dis. 2012;54(6):818-25. 29. Nunn P, Brindle R, Carpenter L, Odhiambo J, Wasunna K, Newnham R, et al. Cohort study of human immunodeficiency virus infection in patients with tuberculosis in Nairobi, Kenya. Analysis of early (6-month) mortality. Am Rev Respir Dis. 1992;146(4):849–54. 30. Ismail I, Bulgiba A. Predictors of death during tuberculosis treatment in TB/HIV co-infected patients in Malaysia. PLoS One. 2013;8(8):e73250. 31. Marcy O, Laureillard D, Madec Y, Chan S, Mayaud C, Borand L, et al. Causes and Determinants of Mortality in HIV-Infected Adults With Tuberculosis: An Analysis From the CAMELIA ANRS 1295-CIPRA KH001 Randomized Trial. Clin Infect Dis. 2014;59(3):435-45. 32. Perrechi MC, Ribeiro SA. Outcomes of tuberculosis treatment among inpatients and outpatients in the city of São Paulo, Brazil. J Bras Pneumol. 2011;37(6):783–90. 33. Yen YF, Yen MY, Shih HC, Deng CY. Risk factors for unfavorable outcome of pulmonary tuberculosis in adults in Taipei, Taiwan. Trans R Soc Trop Med Hyg. 2012;106(5):303–8. 34. Balkema CA, Irusen EM, Taljaard JJ, Koegelenberg CF. Tuberculosis in the intensive care unit: a prospective observational study. Int J Tuberc Lung Dis. 2014;18(7):824-30. 35. Isanaka S, Mugusi F, Urassa W, Willett WC, Bosch RJ, Villamor E, et al. Iron deficiency and anemia predict mortality in patients with tuberculosis. J Nutr. 2012;142(2):350-7. 36. Lanoix JP, Gaudry S, Flicoteaux R, Ruimy R, Wolff M. Tuberculosis in the intensive care unit: a descriptive analysis in a low-burden country. Int J Tuberc Lung Dis. 2014;18(5):581-7. 37. Reina S, Silva C, Gaio AR, Correia AM, Duarte R. HIV screening in tuberculosis patients in the northern region of Portugal. Int J Tuberc Lung Dis. 2015;19(12):1554-5. 38. Lönnroth K, Migliori GB, Abubakar I, D'Ambrosio L, de Vries G, Diel R, et al. Towards tuberculosis elimination: an action framework for low-incidence countries. Eur Respir J. 2015;45(4):928-52. 39. Taylor Z, Marks SM, Ríos Burrows NM, Weis SE, Stricof RL, Miller B. Causes and costs of hospitalization of tuberculosis patients in the United States. Int J Tuberc Lung Dis. 2000;4(10):931-9. 40. MacIntyre CR, Plant AJ, Hendrie D. Shifting the balance between in-patient and out-patient care for tuberculosis results in economic savings. Int J Tuberc Lung Dis. 2001;5(3):266-71.

96

97
CHAPTER 4 – STRATIFICATION OF
TUBERCULOSIS SEVERITY AND ITS
ASSOCIATION WITH PATHOGEN PHYLOGENY
AND PROPERTIES ____________________________________________________________

98
The results presented in this chapter were published:
(i) in conferences
XXX Congresso de Pneumologia/VIII Congresso Luso-Brasileiro | Albufeira, 6-8
November 2014
Caracterização molecular das linhagens filogenéticas de Mycobacterium
tuberculosis num grupo de doentes de baixo risco para tuberculose do norte de
Portugal (Oral communication) | Authors: Helder Novais e Bastos, Henrique Machado, Maria
Isabel Veiga, Patrício Costa, Nuno S. Osório, Ivo Ferreira, Sara Magalhães, Angélica Ramos, Teresa
Carvalho, Jorge Pedrosa, Fernando Rodrigues, António Gil Castro, João Tiago Guimarães, Margarida
Saraiva
Rev Port Pneumol. 2014;20(Esp Cong 4):1-45
Chapter 4 | Tuberculosis severity and its association with pathogen phylogeny and properties
99
ABSTRACT A striking feature of tuberculosis (TB) is the variability of infection
outcomes. The heterogeneity observed has been classically attributed to
environmental and host determinants. However, studies uncovering
Mycobacterium tuberculosis complex (MTBC) genomic diversity and its association
to clinical outcomes of TB have shown the potential importance of pathogen-
related factors to the disease pathogenesis. Nonetheless, the role of this variability
in the clinical setting remains poorly understood. To address this question, we
resorted to a cohort of 681 pulmonary TB cases and selected a group of 133
patients without known predictor or precipitator factors. After developing a
clinical decision tree to stratify TB, the disease manifestation in each of these
patients was classified in different severities. Corresponding MTBC strains were
isolated and genotyped using single nucleotide polymorphisms (SNPs) as stable
genetic markers to define the phylogeny. A highly homogeneous
phylogeographical structure was observed, with the majority of isolates belonging
to Lineage 4 and LAM sublineage. In parallel, we assessed the growth features of
M. tuberculosis isolates associated with different clinical phenotypes. We found
that isolates from patients with mild disease grew significantly slower than
moderate or severe strains. Strikingly, isolates associated to moderate outcome
had a longer lag phase and reached a highest plateau, after a steep exponential
phase. To gain in-depth knowledge of the genetic basis for differential growth
phenotype, we performed whole genome sequencing and genomic analysis. The
heterogeneity observed was not lineage-specific, but we identified several SNPs
as potentially related with the phenotype of differential growth. Functional
annotation analysis of the genes harboring the identified SNPs showed a
significant enrichment of the ATP binding Gene Ontology molecular function.
Analysis of previous literature allowed to identify which genes were previously
associated with growth suppression. Among the genes that had not been formerly
implicated in phenotypes of in vitro growth, the membrane transport and
biosynthetic pathways were highlighted. In conclusion, mutations implicated in
disease severity could be related to microevolution events within the host.

Chapter 4 | Tuberculosis severity and its association with pathogen phylogeny and properties
100
Furthermore, the altered growth behaviour of moderate strains of MTBC might
indicate an adaptation of the pathogen to induce a high transmissible disease
without devastating effects to the host, ensuring the transmission to new hosts.
Chapter 4 | Tuberculosis severity and its association with pathogen phylogeny and properties
101
INTRODUCTION Despite largely curable, tuberculosis (TB) continues to rank among the
leading causes of death by an infectious agent, accounting for 1 death every 18
seconds, according to the latest estimates [1]. Further aggravating this scenario,
one quarter of the world’s population is estimated to be latently infected with the
TB-causing agent Mycobacterium tuberculosis, thus providing a virtually
impossible to eliminate reservoir [2, 3]. Recent studies start to question the
concept of the existence of two opposing poles in TB outcome, active disease and
latent TB infection (LTBI) [4, 5]. Instead, a continuous spectrum of TB likely exists
between both extremes, with cases of subclinical disease described in patients
with normal chest X-ray regardless of human immunodeficiency virus (HIV)
infection status [6], and reports of human subjects with latent infection that have
metabolically active lesions, as assessed by 18-fluorodeoxyglucose positron
emission tomography (18-FDG PET) [7-9]. Another study that combined FDG-
PET and computed tomography (CT) in asymptomatic, antiretroviral-therapy-
naïve, HIV-1-infected adults with latent tuberculosis, described a subgroup of
individuals presenting pulmonary abnormalities suggestive of subclinical form of
TB and had an increased likelihood of progressing to active disease [10]. Finally,
viable M. tuberculosis bacilli were recovered from incidental TB lesions discovered
post-mortem [11, 12].
Following these observations, molecular and clinical biomarkers that drive
the host along the range of manifestations for both latent and active forms have
just started to be unveiled [8, 13-17]. The heterogeneity of TB has been classically
attributed to environmental and host determinants [18]. However, studies
uncovering M. tuberculosis complex (MTBC) genomic diversity have shown the
potential importance of pathogen-related factors. Given the low mutation rate and
lack of evidence for genetic recombination or horizontal gene transfer [19-21],
the human-adapted members of the MTBC were long assumed to be essentially
identical. Over the years, improved methods for the genotyping of clinical isolates
revealed the existence of 7 different phylogenetic lineages causing human TB [22,
23], associated with different geographic regions and sympatric human
Chapter 4 | Tuberculosis severity and its association with pathogen phylogeny and properties
102
populations in cosmopolitan settings [24-27]. These facts suggest that different
lineages of M. tuberculosis evolved in parallel and are possibly adapted to
particular human populations [28]. This association may be disrupted in the case
of HIV patients [29], possibly due to deficient recognition of pathogen’s epitopes
associated with CD4 T-cell depletion. A phylogeographical structure can also be
observed at the sublineage level. Lineage 4 (L4), or Euro-American, is the most
globally widespread, predominating throughout Europe and America, but also in
some parts of Africa and the Middle East [22, 23]. This lineage comprises at least
10 sublineages, including Haarlem, Latin-American-Mediterranean (LAM), X and
T families of strains [30, 31], which differ in their geographical distribution [32].
A recent work demonstrated that some L4 sublineages are geographically
restricted “specialists”, while others with higher epitope diversity have a global
distribution, which is in agreement with the idea of being “generalists” regarding
the host population range [32].
The phylogenetic classification of the MTBC provided the rational
framework for a number of studies around the world linking the genotypic
diversity of MTBC to diversity in clinical phenotypes. For instance, L4 causes
mainly pulmonary TB [33], while Lineages 2 [33-35] and 3 [36] were reported
to associate with extrapulmonary disease. In addition, more debilitating
symptoms (such as weight loss) have been associated with L4 strains in Tanzania
[37]. Lineage 2 (L2), or East-Asian, is another highly successful phylogenetic
branch that has collected much attention in research. This lineage has been
repeatedly associated with treatment failure and relapse [38-40]. Moreover, one
in vitro study demonstrated that L2 may acquire drug resistances more rapidly
than L4 [41], which was confirmed in reports from Belarus and Mongolia, where
multidrug-resistant (MDR) isolates were more likely to belong to the L2 Beijing
family of strains [42, 43]. Both L2 and L4 were shown to have a higher rate of
progression to active TB as compared to Lineage 6 in the Gambia [44]. There are
also differences in terms of efficacy of transmission. Beijing strains showed higher
transmissibility in San Francisco [45], whereas Lineage 3 was reported to be less
transmissible than Lineages 1, 2 and 4 in TB patients from Montreal, Canada

Chapter 4 | Tuberculosis severity and its association with pathogen phylogeny and properties
103
[46], and striking differences in transmissibility among sublineages of Lineage 5
in Benin and Nigeria were reported [47].
The purpose of the present study was to explore the phylogenetic
distribution of MTBC isolates collected from a group of patients without known
host-related predictor or precipitator TB factors in a main hospital in the Porto
area, Portugal. Furthermore, we aimed to understand the possible links between
the phylogenetic structure and bacterial growth properties of molecularly
characterized strains with clinical phenotypes of severity.
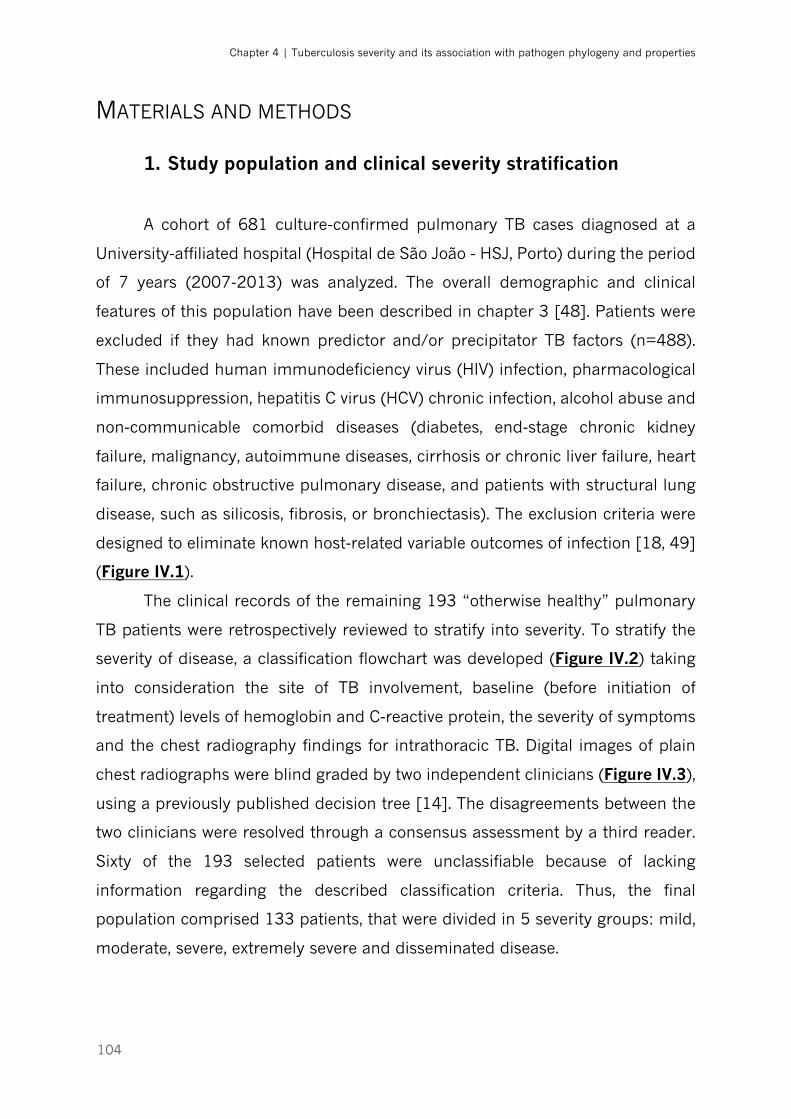
Chapter 4 | Tuberculosis severity and its association with pathogen phylogeny and properties
104
MATERIALS AND METHODS
1. Study population and clinical severity stratification
A cohort of 681 culture-confirmed pulmonary TB cases diagnosed at a
University-affiliated hospital (Hospital de São João - HSJ, Porto) during the period
of 7 years (2007-2013) was analyzed. The overall demographic and clinical
features of this population have been described in chapter 3 [48]. Patients were
excluded if they had known predictor and/or precipitator TB factors (n=488).
These included human immunodeficiency virus (HIV) infection, pharmacological
immunosuppression, hepatitis C virus (HCV) chronic infection, alcohol abuse and
non-communicable comorbid diseases (diabetes, end-stage chronic kidney
failure, malignancy, autoimmune diseases, cirrhosis or chronic liver failure, heart
failure, chronic obstructive pulmonary disease, and patients with structural lung
disease, such as silicosis, fibrosis, or bronchiectasis). The exclusion criteria were
designed to eliminate known host-related variable outcomes of infection [18, 49]
(Figure IV.1).
The clinical records of the remaining 193 “otherwise healthy” pulmonary
TB patients were retrospectively reviewed to stratify into severity. To stratify the
severity of disease, a classification flowchart was developed (Figure IV.2) taking
into consideration the site of TB involvement, baseline (before initiation of
treatment) levels of hemoglobin and C-reactive protein, the severity of symptoms
and the chest radiography findings for intrathoracic TB. Digital images of plain
chest radiographs were blind graded by two independent clinicians (Figure IV.3),
using a previously published decision tree [14]. The disagreements between the
two clinicians were resolved through a consensus assessment by a third reader.
Sixty of the 193 selected patients were unclassifiable because of lacking
information regarding the described classification criteria. Thus, the final
population comprised 133 patients, that were divided in 5 severity groups: mild,
moderate, severe, extremely severe and disseminated disease.
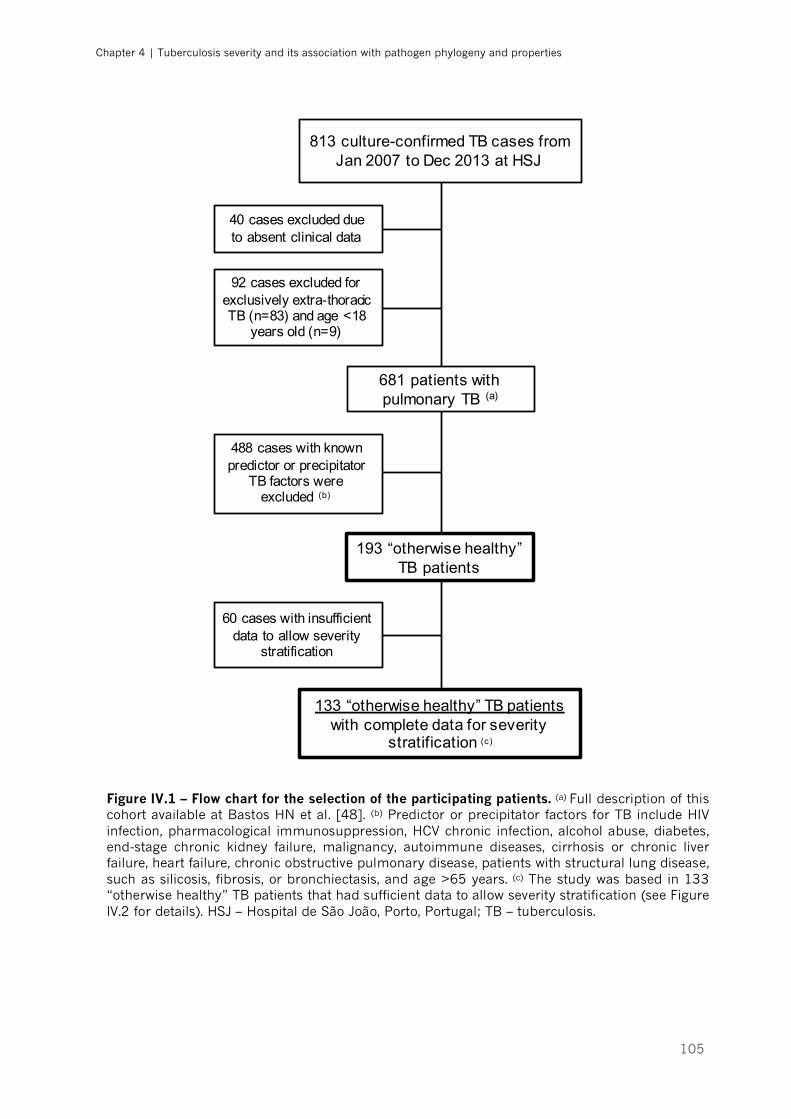
Chapter 4 | Tuberculosis severity and its association with pathogen phylogeny and properties
105
Figure IV.1 – Flow chart for the selection of the participating patients. (a) Full description of this cohort available at Bastos HN et al. [48]. (b) Predictor or precipitator factors for TB include HIV infection, pharmacological immunosuppression, HCV chronic infection, alcohol abuse, diabetes, end-stage chronic kidney failure, malignancy, autoimmune diseases, cirrhosis or chronic liver failure, heart failure, chronic obstructive pulmonary disease, patients with structural lung disease, such as silicosis, fibrosis, or bronchiectasis, and age >65 years. (c) The study was based in 133 “otherwise healthy” TB patients that had sufficient data to allow severity stratification (see Figure IV.2 for details). HSJ – Hospital de São João, Porto, Portugal; TB – tuberculosis.
813 culture-confirmed TB cases from Jan 2007 to Dec 2013 at HSJ
681 patients with pulmonary TB (a)
40 cases excluded due to absent clinical data
92 cases excluded for exclusively extra-thoracic TB (n=83) and age <18
years old (n=9)
488 cases with known predictor or precipitator
TB factors were excluded (b)
193 “otherwise healthy” TB patients
60 cases with insufficient data to allow severity
stratification
133 “otherwise healthy” TB patients with complete data for severity
stratification (c)
Chapter 4 | Tuberculosis severity and its association with pathogen phylogeny and properties
106
Figure IV.2 – Classification system developed to define the TB clinical phenotype. TB diagnosis was defined according to the WHO guidelines [50]. Disseminated disease was characterized by the presence of any of the following conditions: i) isolation of M. tuberculosis from blood, bone marrow, liver biopsy specimen, or ≥2 noncontiguous organs; ii) mycobacterial isolation from 1 organ and either histologic demonstration of caseating granulomatous inflammation from another noncontiguous organ, bone marrow and liver biopsy specimen, or radiographic finding of miliary lung lesions [51]. The dual sites involvement of cervical or axillary lymph node and lung was regarded as a locoregional disease rather than disseminated disease [52]. Grading of the radiographic extent of disease was based on the decision tree supplied in Figure IV.3. Hemoglobin <12 g/dL defined anemia in both genders. Acute hypoxemic respiratory failure was defined as newly onset partial pressure of oxygen decrease to <60 mmHg, or arterial oxygen saturation <90%. A symptom score scale (0 to 6) was calculated on the basis of the presence of 3 respiratory symptoms - cough, hemoptysis, dyspnea - and 3 constitutional symptoms - fever, night sweats, weight loss (1 point for each item) [53]. Patients presenting a symptom score >4, or a score >3 that included the presence of dyspnea, were classified as having highly symptomatic disease. CRP – C-reactive protein; Hb – Hemoglobin; N – No; TB – Tuberculosis; Y – Yes.
Extrathoracic TB involvement
Mild disease Moderate disease Severe disease Extremely
severe diseaseDisseminated
disease
Y
Pulmonary and/or pleural TB
N
Chest X-ray classification
Moderate lesions Advanced lesionsMinimal lesions
Respiratory failure
Highly symptomatic
N
Y
Y
CRP <25 mg/LHb >12 g/dL
Low symptomatic
CRP >75 mg/LHb <12 g/dL
YN
N
Y

Chapter 4 | Tuberculosis severity and its association with pathogen phylogeny and properties
107
Figure IV.3 – Decision tree grading system developed to assess the radiographic extent of disease. Adaptation of the algorithm developed and expanded by Berry et al. [14] from the text description definitions given in Falk et al. [54]. Baseline chest radiographs were blindly analysed by two independent physicians according to the lesions extent, the presence of lung cavitation and pleural effusion. Disagreement between readers was resolved through a consensus read by a third physician.
2. Growth of M. tuberculosis clinical isolates
Bacterial samples of the selected 133 subjects were recovered from stored
primary cultures of M. tuberculosis clinical isolates at HSJ. Two hundred μL of
inoculum were plated and smeared uniformly on solid Mycobacteria 7H11 agar
supplemented with Oleic Albumin Dextrose Catalase Growth Supplement (OADC)
and PANTA antibiotic mixture (to prevent non-mycobacteria growth). The plates
were incubated at 37 °C for 4 to 8 weeks. After this period, grown colonies were
gently rubbed and transferred to 20 mL of Middlebrook 7H9 liquid medium (BD
Biosciences, San Jose, USA) complemented with OADC enrichment, 2% glycerol
Radiograph abnormal? Normal / No visible disease No
Yes
Is the only abnormality lymph node / hilar enlargement? Minimal Yes
No
>1/3 of one lung or Cavitation >4cm or Effusion <2cm of carina
Advanced
What is the lesion density? Dense and confluent (equal to cardial shadow)
Slight to moderate
<1/3 of one lung No cavitation No effusion
Minimal
< 1 whole lung Cavitation <4cm Effusion >2cm of carina
Moderate
> 1 whole lung or Cavitation >4cm or Effusion <2cm of carina
Advanced
<1/3 of one lung Cavitation <4cm Effusion >2cm of carina
Moderate
Chapter 4 | Tuberculosis severity and its association with pathogen phylogeny and properties
108
as a carbon source and 0.5% Tween® 80 (Sigma-Aldrich, St. Louis, USA) to
prevent bacterial clumping. Cultures were incubated at 37 °C with constant 120
rpm shaking for an additional 7–10 days, to increase the bacterial yield. Upon
reaching an optical density at 570 nm of at least 0.7 (mid log-phase growth stage)
the bacterial suspension was aliquoted into 1 mL inoculums, which were frozen
at -80 °C for further use.
3. Genomic DNA extraction from bacterial suspensions
Ten to 15 mL of the bacterial suspension was centrifuged at 3500 g for 5
minutes at 4 °C and the resulting pellet was resuspended in water to a final
volume of 1000 μL and then inactivated with 500 μL a 1:2 phenol-water solution
for DNA extraction. Fifty μL of 0.1 mm diameter zirconia beads and 55 μL TEN
10x buffer (1 M Tris, 500 mM EDTA, 5 M NaCl) were added to 750 μL of phenol-
inactivated bacterial suspension and the mixture was subsequently homogenized
in the Fast-Prep24 bead beater at 4 M/s for 30 seconds, twice. Then, 250 μL of
chloroform were added to the samples, followed by mild agitation and 5-minute
centrifugation at 12,000 rpm at 4 °C in order to separate the sample into an
organic and an aqueous phase. The upper aqueous phases (containing mostly
nucleic acids and water) were then recovered and mixed with a 1:1 volume of
chloroform, followed by a repetition of the previous centrifuging step to further
purify the samples. The phenol-chlorophorm extraction method was chosen since
it grants a good DNA yield, a low amount of contaminants and an effective way
to inactivate the bacterium [55]. The final aqueous phases were recovered and
mixed with 1 mL of ice cold absolute ethanol and 40 μL of 3M sodium acetate
(NaAc). The samples were then incubated at -20 °C for 30 minutes, to allow the
DNA to precipitate, and centrifuged for 5 minutes at 14,000 rpm at 4 °C. The
supernatant was discarded, the pellet washed in 500 μL of 70% ethanol and the
samples centrifuged again for 5 minutes at 12000 rpm at 4°C. The supernatant
was then removed, the DNA pellet allowed to dry and resuspended in TE buffer
(1M Tris [pH 8], 500 mM EDTA). The DNA was quantified by spectrophotometry
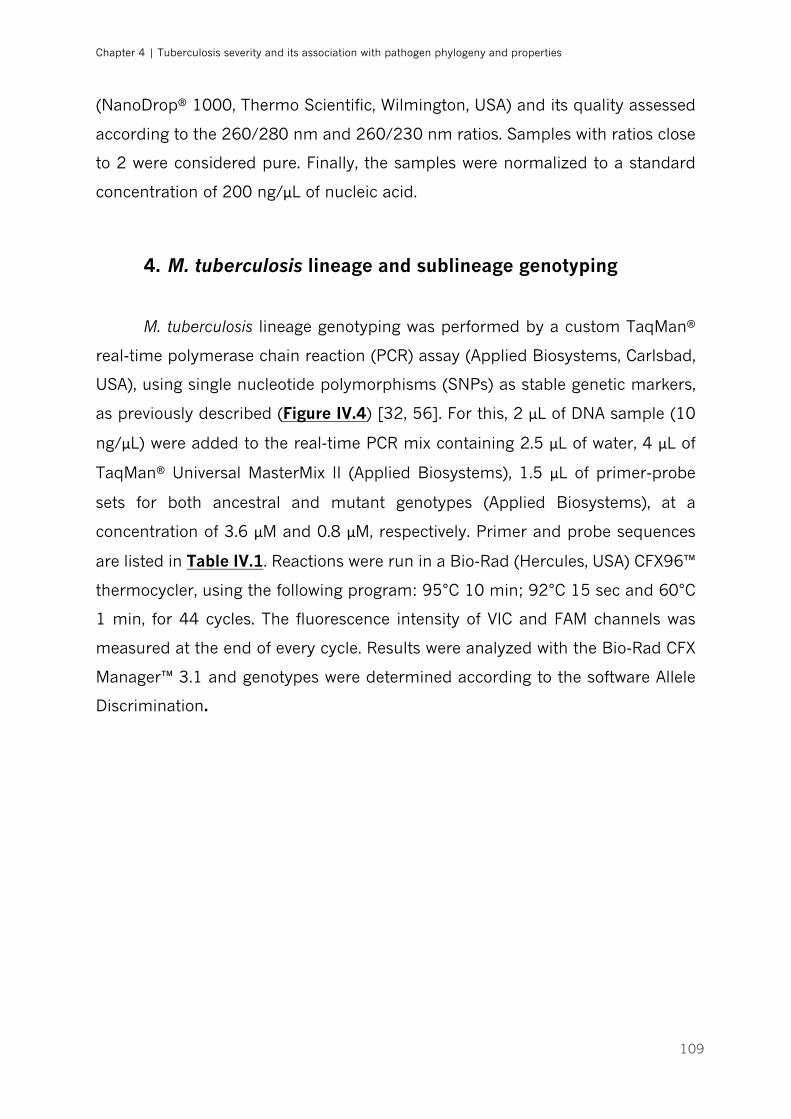
Chapter 4 | Tuberculosis severity and its association with pathogen phylogeny and properties
109
(NanoDrop® 1000, Thermo Scientific, Wilmington, USA) and its quality assessed
according to the 260/280 nm and 260/230 nm ratios. Samples with ratios close
to 2 were considered pure. Finally, the samples were normalized to a standard
concentration of 200 ng/μL of nucleic acid.
4. M. tuberculosis lineage and sublineage genotyping
M. tuberculosis lineage genotyping was performed by a custom TaqMan®
real-time polymerase chain reaction (PCR) assay (Applied Biosystems, Carlsbad,
USA), using single nucleotide polymorphisms (SNPs) as stable genetic markers,
as previously described (Figure IV.4) [32, 56]. For this, 2 μL of DNA sample (10
ng/μL) were added to the real-time PCR mix containing 2.5 μL of water, 4 μL of
TaqMan® Universal MasterMix II (Applied Biosystems), 1.5 μL of primer-probe
sets for both ancestral and mutant genotypes (Applied Biosystems), at a
concentration of 3.6 μM and 0.8 μM, respectively. Primer and probe sequences
are listed in Table IV.1. Reactions were run in a Bio-Rad (Hercules, USA) CFX96™
thermocycler, using the following program: 95°C 10 min; 92°C 15 sec and 60°C
1 min, for 44 cycles. The fluorescence intensity of VIC and FAM channels was
measured at the end of every cycle. Results were analyzed with the Bio-Rad CFX
Manager™ 3.1 and genotypes were determined according to the software Allele
Discrimination.
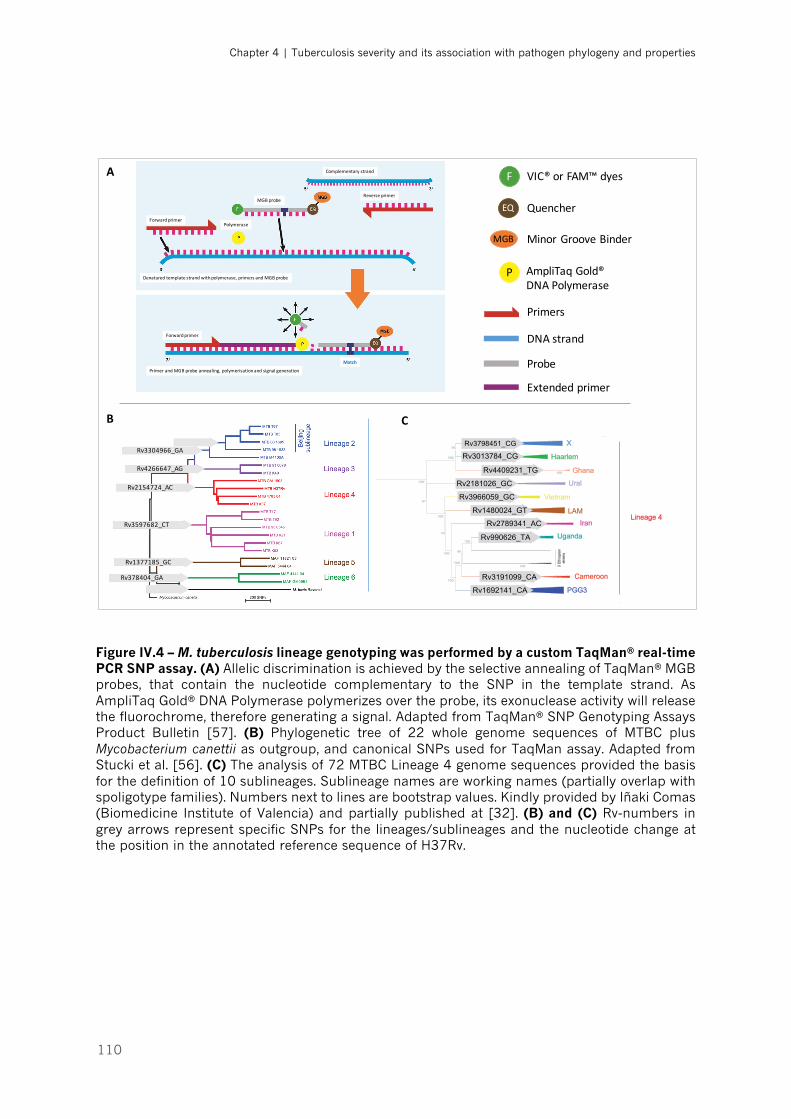
Chapter 4 | Tuberculosis severity and its association with pathogen phylogeny and properties
110
Figure IV.4 – M. tuberculosis lineage genotyping was performed by a custom TaqMan® real-time PCR SNP assay. (A) Allelic discrimination is achieved by the selective annealing of TaqMan® MGB probes, that contain the nucleotide complementary to the SNP in the template strand. As AmpliTaq Gold® DNA Polymerase polymerizes over the probe, its exonuclease activity will release the fluorochrome, therefore generating a signal. Adapted from TaqMan® SNP Genotyping Assays Product Bulletin [57]. (B) Phylogenetic tree of 22 whole genome sequences of MTBC plus Mycobacterium canettii as outgroup, and canonical SNPs used for TaqMan assay. Adapted from Stucki et al. [56]. (C) The analysis of 72 MTBC Lineage 4 genome sequences provided the basis for the definition of 10 sublineages. Sublineage names are working names (partially overlap with spoligotype families). Numbers next to lines are bootstrap values. Kindly provided by Iñaki Comas (Biomedicine Institute of Valencia) and partially published at [32]. (B) and (C) Rv-numbers in grey arrows represent specific SNPs for the lineages/sublineages and the nucleotide change at the position in the annotated reference sequence of H37Rv.
F VIC®orFAM™dyes
EQ Quencher
MGB MinorGrooveBinder
P AmpliTaq Gold®DNAPolymerase
Primers
DNAstrand
Probe
Extendedprimer
Denaturedtemplatestrandwithpolymerase,primersandMGBprobe
Forwardprimer
ReverseprimerMGBprobe
Polymerase
Forwardprimer
PrimerandMGBprobeannealing,polymerisationandsignalgeneration
Complementarystrand
Match
Global phylogeography of MTBC Lineage 4Phylogenetic tree of 272 genome sequences of MTBC (72 Lineage 4 genome sequences). 10 sublineages of Lineage 4 (Euro-American lineage) were defined based on PCA, genetic distances and LSPs, and partially overlap with spoligotyping families:
Sublineage names are working names (partially overlap with spoligotype families, but MTBC strains don‘t necessarily need to be from country orregion of sublineage name). Numbers next to lines are bootstrap values. Arrows indicate position (in reference to H37Rv) and nucleotide change(hypothetical ancestor > mutant) of Single Nucleotide Polymorphisms (SNP) that are specific for the sublineages. 21.8.2012 DSt.
A
B C
Rv3304966_GA
Rv4266647_AG
Rv2154724_AC
Rv3597682_CT
Rv1377185_GC
Rv378404_GA
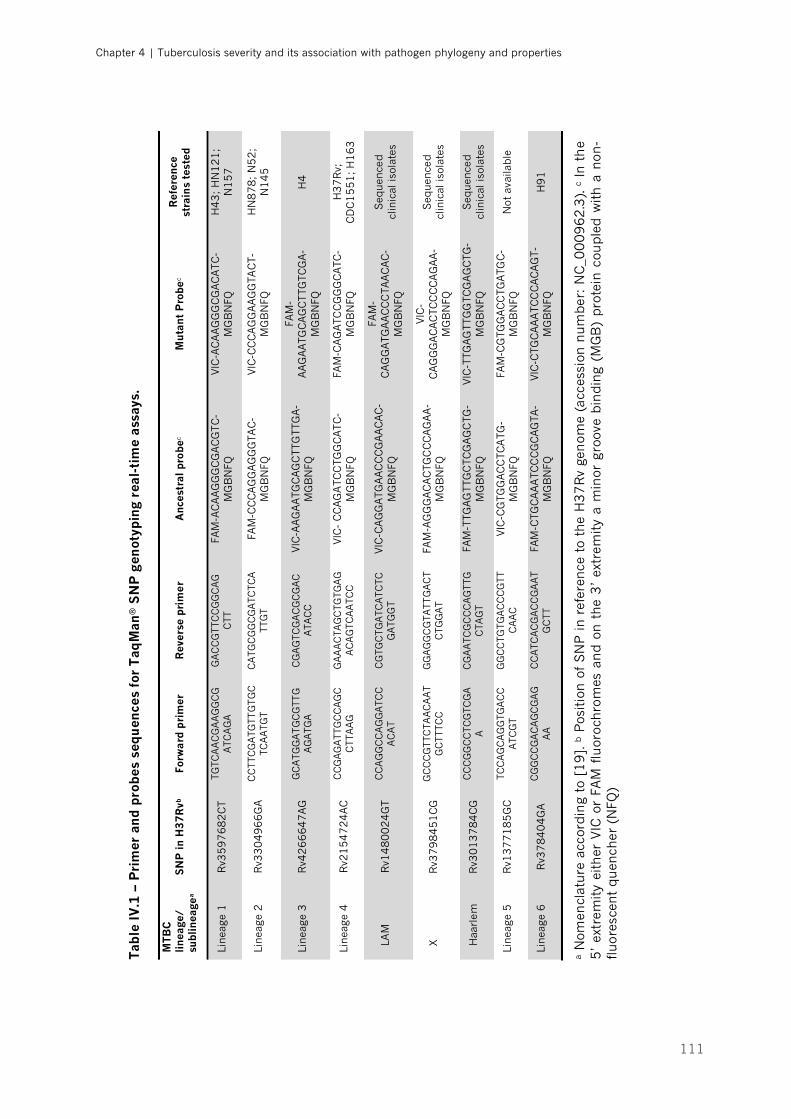
Chapter 4 | Tuberculosis severity and its association with pathogen phylogeny and properties
111
Tab
le I
V.1
– P
rim
er a
nd p
robe
s se
quen
ces
for
Taq
Man
® S
NP
gen
otyp
ing
real
-tim
e as
says
.
MTB
C
linea
ge/
subl
inea
gea
SN
P in
H3
7R
vb
Forw
ard
pri
mer
R
ever
se p
rim
er
Anc
estr
al p
robe
c M
utan
t P
robe
c R
efer
ence
st
rain
s te
sted
Linea
ge 1
R
v35
97
68
2C
T TG
TCA
AC
GA
AG
GC
GA
TCA
GA
G
AC
CG
TTC
CG
GC
AG
CTT
FA
M-A
CA
AG
GG
CG
AC
GTC
-M
GB
NFQ
VIC
-AC
AA
GG
GC
GA
CA
TC
-M
GB
NFQ
H
43
; H
N1
21
; N
15
7
Linea
ge 2
R
v33
04
96
6G
A
CC
TTC
GA
TGTT
GTG
CTC
AA
TGT
CA
TGC
GG
CG
ATC
TCA
TTG
T
FAM
-CC
CA
GG
AG
GG
TAC
-M
GB
NFQ
VIC
-CC
CA
GG
AA
GG
TAC
T-M
GB
NFQ
H
N8
78
; N
52
; N
14
5
Linea
ge 3
R
v42
66
64
7A
G
GC
ATG
GA
TG
CG
TTG
AG
ATG
A
CG
AG
TCG
AC
GC
GA
CA
TAC
C
VIC
-AA
GA
ATG
CA
GC
TTG
TTG
A-
MG
BN
FQ
FAM
-A
AG
AA
TGC
AG
CTTG
TCG
A-
MG
BN
FQ
H4
Linea
ge 4
R
v21
54
72
4A
C
CC
GA
GA
TTG
CC
AG
CC
TTA
AG
G
AA
AC
TAG
CTG
TGA
GA
CA
GTC
AA
TCC
VIC
- C
CA
GA
TCC
TGG
CA
TC
-M
GB
NFQ
FA
M-C
AG
ATC
CG
GG
CA
TC-
MG
BN
FQ
H3
7R
v;
CD
C1
55
1; H
16
3
LA
M
Rv1
48
00
24
GT
CC
AG
GC
CA
GG
ATC
CA
CA
T C
GTG
CTG
ATC
ATC
TCG
ATG
GT
VIC
-CA
GG
ATG
AA
CC
CG
AA
CA
C-
MG
BN
FQ
FAM
-C
AG
GA
TGA
AC
CC
TAA
CA
C-
MG
BN
FQ
Seq
uen
ced
clin
ical
isol
ates
X
R
v37
98
45
1C
G
GC
CC
GTT
CTA
AC
AA
TG
CTT
TCC
G
GA
GG
CG
TATT
GA
CT
CTG
GA
T
FAM
-AG
GG
AC
AC
TGC
CC
AG
AA
-M
GB
NFQ
VIC
-C
AG
GG
AC
AC
TCC
CC
AG
AA
-M
GB
NFQ
Seq
uen
ced
clin
ical
isol
ates
H
aarl
em
Rv3
01
37
84
CG
C
CC
GG
CC
TCG
TCG
AA
C
GA
ATC
GC
CC
AG
TTG
CTA
GT
FAM
-TTG
AG
TTG
CTC
GA
GC
TG-
MG
BN
FQ
VIC
-TTG
AG
TTG
GTC
GA
GC
TG-
MG
BN
FQ
Seq
uen
ced
clin
ical
isol
ates
Linea
ge 5
R
v13
77
18
5G
C
TCC
AG
CA
GG
TGA
CC
ATC
GT
GG
CC
TGTG
AC
CC
GTT
CA
AC
VIC
-CG
TGG
AC
CTC
ATG
-M
GB
NFQ
FA
M-C
GTG
GA
CC
TGA
TGC
-M
GB
NFQ
N
ot a
vaila
ble
Linea
ge 6
R
v37
84
04
GA
CG
GC
CG
AC
AG
CG
AG
AA
CC
ATC
AC
GA
CC
GA
AT
GC
TT
FAM
-CTG
CA
AA
TCC
CG
CA
GTA
-M
GB
NFQ
VIC
-CTG
CA
AA
TCC
CA
CA
GT-
MG
BN
FQ
H9
1
a N
omen
clat
ure
acc
ordin
g to
[1
9]. b
Pos
itio
n o
f S
NP
in r
efer
ence
to
the
H3
7R
v ge
nom
e (a
cces
sion
num
ber
: N
C_0
00
96
2.3
). c
In t
he
5’
extr
emity
eith
er V
IC o
r FA
M f
luor
ochro
mes
an
d o
n t
he
3’
extr
emity
a m
inor
gro
ove
bin
din
g (M
GB
) pro
tein
cou
ple
d w
ith a
non
-flu
ores
cent
qu
ench
er (
NFQ
)

Chapter 4 | Tuberculosis severity and its association with pathogen phylogeny and properties
112
5. Mycobacterial growth curves from standardized inoculum
We studied and compared the growth properties of 8 isolates associated
with mild, 8 with severe and 10 with moderate outcomes of TB. Matching of
selected isolates was based on at least 2 out of 3 variables: age within 15 years,
gender and smoking habits. For each clinical isolate, a standardized inoculum
was prepared, as previously described [58]. The isolates were grown for 21 days
in Middlebrook 7H9 liquid medium (BD Biosciences), as described above, and
the 570 nm OD of these subcultures adjusted to 0.01–0.03. One hundred µL of
this standardized inoculum were used to inoculate in duplicate BACTEC™ MGIT™
(Mycobacteria Growth Indicator Tubes) 960 tubes (BD Biosciences)
supplemented with 0.8 mL of OADC. The MGIT™ 960 culture tubes contain 7 mL
of modified Middlebrook 7H9 broth, a growth supplement (bovine albumin,
catalase, dextrose, oleic acid and polyoxyethylene stearate) and an antibiotic
mixture consisting of polymyxin B, amphotericin B, nalidixic acid, trimethoprim
and azlocillin (MGIT™ PANTA) [59]. After inoculation, the tubes are entered into
a BACTEC™ MGIT™ 960 instrument (BD Biosciences), where cultures are
incubated at 37 ºC for a maximum of 42 days.
Growth curves were generated by automatically monitoring of the MGIT
cultures using the BD Epicentre software, which collected fluorescence data from
each tube every 60 minutes. The amount of fluorescence is inversely proportional
to the oxygen level in the culture medium, indicating the consumption of oxygen
due to the growth of inoculated organisms in the culture tubes, measured as
Growth Units (GU) [59]. Data were extracted and the length of the lag phase or
‘‘time to positivity’’ (the manufacturer-set threshold is 75 GU, corresponding to
approximately 105–106 CFU per ml of medium) for each isolate was measured.
Furthermore, the doubling time (td = time required for the number of cells or
bacterial density to double during the exponential phase) and the peak point on
the bacterial growth curve (Cmax) were calculated. The doubling time was
calculated using the following equation td = FGHI
, where 𝜅 represents the growth
rate [60]. To determine the growth rate, a graph of GU (acquired by the BACTEC™
Chapter 4 | Tuberculosis severity and its association with pathogen phylogeny and properties
113
system) as a function of time with exponential growth was plotted and the method
of least squares regression using GraphPad Prism® 7 software (GraphPad
Software, Inc.) was applied [61]. To validate the present methodology, the above
described procedures were performed with the reference strain H37Rv.
From the same initial standardized inoculum, four 10-fold dilutions were
prepared in sterile PBS 1x and 100 µL of each dilution plated on 7H11 solid
medium. The plates were incubated for 3 weeks at 37 ºC to estimate the number
of CFU present in the original suspension, using a binocular magnifying glass.
This controlled for differences in the bacterial burden of the standardized inocula.
6. M. tuberculosis whole genome sequencing and analysis
Next generation sequencing (NGS) of selected strains was performed on
the Illumina MiSeq or HiSeq platforms with 50-300 base pairs (bp) and 101 bp
paired-end run modes respectively, using Nextera libraries. The quality of raw
Illumina sequence data for each isolate was assessed using the FastQC toolkit
[62]. Low quality reads were trimmed using trimmomatic software [63]. Nextera
adapter sequences were removed and bases were trimmed from the ends of the
reads with parameters chosen according to the information given by FastQC on
“per base sequence content” and “per base sequence quality”. Reads with <20
average quality or less than 30 bases were excluded.
The reference genome sequence used for the analysis was the most recent
common ancestor of MTBC [64]. Using this sequence and not the reference
genome of H37Rv strain [65, 66] is advantageous since H37Rv harbors SNPs
typical of Lineage 4 and from adaptation to the laboratory. At first, mapping to
reference and SNP calling was done with Geneious [67]. Then, reads were again
mapped using Burrows Wheeler Aligner (BWA) [68] and called using SAMtools
[69] and VarScan.v2.3.7 [70, 71]. To improve accuracy, the genomic positions
were filtered and classified as SNPs only when detected by both approaches, with
a variant frequency ≥90% and a coverage ≥10. Genomic positions pertaining to
repetitive regions, mobile elements and pe/ppe genes were excluded from our
Chapter 4 | Tuberculosis severity and its association with pathogen phylogeny and properties
114
analysis due to the technical difficulties in obtaining reliable nucleotide
sequences in these regions using NGS methods based on short reads [72].
Calculation of a maximum likelihood phylogenetic tree was performed with
RaXML [73] using 1797 concatenated genome-wide SNPs and the resulting tree
was rooted to the M. tuberculosis ancestor. Bootstrap support was calculated
based on 1000 replicates to determine the confidence of the branching. The
resulting maximum likelihood tree was confirmed by a second phylogenetic tree
built with a Bayesian approach. A barcode of 62 SNPs chosen to identify MTBC
lineage and sublineages [74] was also used for the phylogenetic classification of
the isolates.
SNPs in coding regions were categorized as non-synonymous or
synonymous using Geneious [67]. Prediction of the effects of coding non-
synonymous variants on protein function was performed using the Sorting
Intolerant From Tolerant (SIFT) algorithm [75]. Briefly, SIFT uses sequence
homology to compute the likelihood that an amino acid substitution will have an
adverse effect on protein function. The underlying assumption is that
evolutionarily conserved regions tend to be less tolerant to mutations, and hence
amino acid substitutions or insertions/deletions in these regions are more likely
to affect function [76]. A SIFT score is a normalized probability of observing the
new amino acid at that position, and ranges from 0 to 1. Substituted amino acids
with a SIFT score ≤0.05 was used as the cut-off value for prediction of impact on
protein function.
Genes identified were compared with a set of genes previously associated
with growth in vitro [77] and in vivo [78]. Functional characterization of novel gene
candidates detected was based on annotations contained in the TubercuList
database (http://tuberculist.epfl.ch/) and by a Gene Ontology (GO) analysis. The
PANTHER (protein annotation through evolutionary relationship) enrichment tool
(http://www.pantherdb.org/) was used to obtain the GO terms for molecular
function [79]. A two-tailed Fisher’s Exact Test was used to measure the
significance of enrichment. Proteins assigned to enriched GO categories (P value
< 0.05) were grouped according to the PANTHER classification system [80].
Chapter 4 | Tuberculosis severity and its association with pathogen phylogeny and properties
115
7. Statistical analysis
The association of SNPs and phylogenetic branches of the selected isolates
with different clinical phenotype groups was assessed using a Chi-square test or
Fisher exact test as appropriate. Growth curve analysis was performed with one-
way ANOVA and LSD post hoc test, or Kruskal-Wallis rank test and Mann-Whitney
U-test if non-normal distribution of measured variables. All the statistical analyses
were performed using the GraphPad Prism® 7 software (GraphPad Software, Inc.)
or SPSS software program, version 24 (IBM® SPSS®, Inc.). Values of P<0.05 were
considered statistically significant.
8. Ethics statement
The study protocol was approved by the Health Ethics Committees of the
HSJ (approval number 109-11), the North Health Region Administration
(approval number 71-2014) and the Portuguese Data Protection Authority
(approval number 12174-2011). To ensure confidentiality, each case was
anonymized by the assignment of a random identification number. Experiments
were conducted according to the principles expressed in the Declaration of
Helsinki.

Chapter 4 | Tuberculosis severity and its association with pathogen phylogeny and properties
116
RESULTS
1. Stratification of TB severity in the study group
Since the aim of this study was to relate disease outcome with bacterial
properties, we reasoned that host factors known to influence the course of the
infection should be kept to a minimum. Therefore, we reviewed the clinical files
of a selected group of 133 “otherwise healthy” patients (Figure IV.1) and the
severity of TB at presentation was assigned to each individual following the
classification criteria presented in Figures IV.2 and IV.3. As shown in Figure IV.5,
most (52.3%) TB cases within the study group were classified as moderate
disease, followed by mild (23.3%) and severe (9.8%) manifestations. A smaller
group of patients (5.3%) presented an extremely severe form of TB. Finally,
almost 10% of the cases had evidence of disseminated disease. We then decided
to focus our study in the mild, moderate and severe TB groups. This was because
the extremely severe TB group represented a rare phenotype and because
disseminated disease associated with significantly longer duration of disease
before diagnosis (median time of symptoms was 18 weeks in this group of
patients). The general characteristics of the patients within this range of severity,
as well as comparisons between categories, are shown in Table IV.2. Of note, the
vast majority of subjects studied were Portuguese-born caucasians (92.2%),
which is in line with previous estimates [81] and with the full cohort [48], and
only one (0.5%) case harbored multidrug-resistant strains.
Figure IV.5 – Tuberculosis severity stratification for the study population. The clinical files for the study group of 133 were revised and the TB disease severity assigned according to the fluxogram supplied in Figure IV.2.
Mild
Moderat
e
Sever
e
Extrem
ely se
vere
Dissem
inat
ed0
20
40
60
80
Num
ber
of c
ases
31 (23.3%)
69 (51.9%)
13 (9.8%) 13 (9.8%)7 (5.3%)
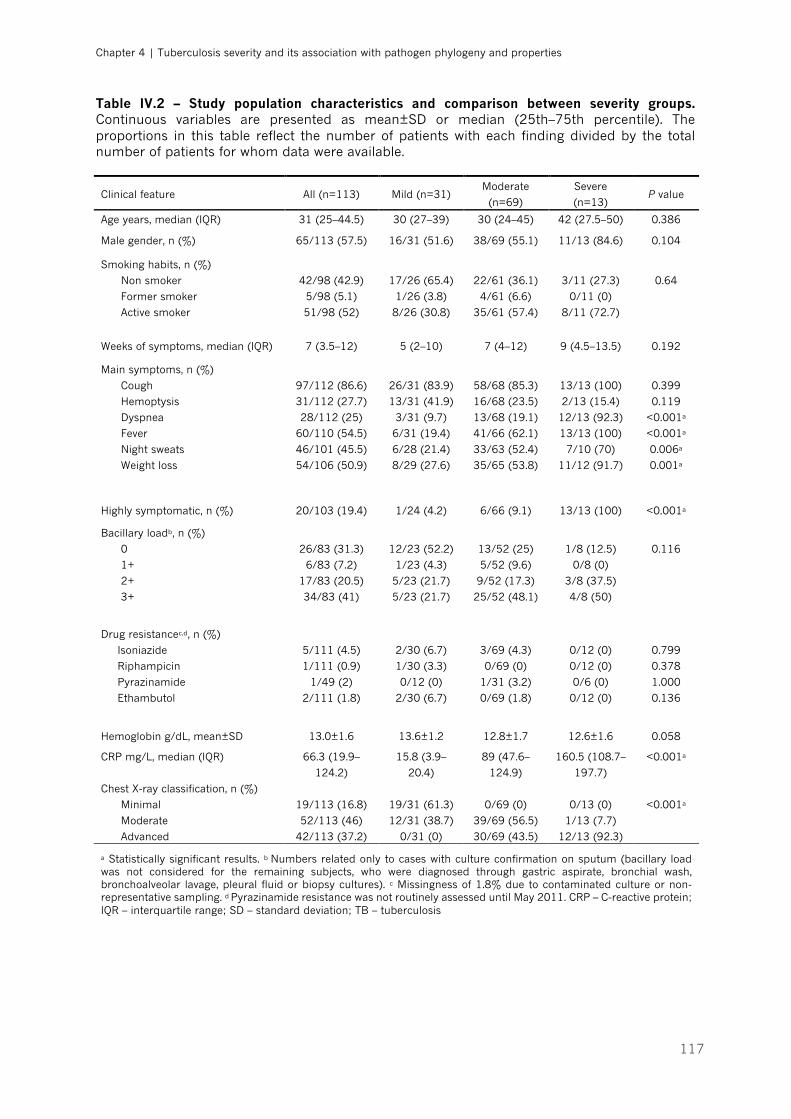
Chapter 4 | Tuberculosis severity and its association with pathogen phylogeny and properties
117
Table IV.2 – Study population characteristics and comparison between severity groups. Continuous variables are presented as mean±SD or median (25th–75th percentile). The proportions in this table reflect the number of patients with each finding divided by the total number of patients for whom data were available.
Clinical feature All (n=113) Mild (n=31) Moderate
(n=69)
Severe
(n=13) P value
Age years, median (IQR) 31 (25–44.5) 30 (27–39) 30 (24–45) 42 (27.5–50) 0.386
Male gender, n (%) 65/113 (57.5) 16/31 (51.6) 38/69 (55.1) 11/13 (84.6) 0.104
Smoking habits, n (%)
Non smoker
Former smoker
Active smoker
42/98 (42.9)
5/98 (5.1)
51/98 (52)
17/26 (65.4)
1/26 (3.8)
8/26 (30.8)
22/61 (36.1)
4/61 (6.6)
35/61 (57.4)
3/11 (27.3)
0/11 (0)
8/11 (72.7)
0.64
Weeks of symptoms, median (IQR) 7 (3.5–12) 5 (2–10) 7 (4–12) 9 (4.5–13.5) 0.192
Main symptoms, n (%)
Cough
Hemoptysis
Dyspnea
Fever
Night sweats
Weight loss
97/112 (86.6)
31/112 (27.7)
28/112 (25)
60/110 (54.5)
46/101 (45.5)
54/106 (50.9)
26/31 (83.9)
13/31 (41.9)
3/31 (9.7)
6/31 (19.4)
6/28 (21.4)
8/29 (27.6)
58/68 (85.3)
16/68 (23.5)
13/68 (19.1)
41/66 (62.1)
33/63 (52.4)
35/65 (53.8)
13/13 (100)
2/13 (15.4)
12/13 (92.3)
13/13 (100)
7/10 (70)
11/12 (91.7)
0.399
0.119
<0.001a
<0.001a
0.006a
0.001a
Highly symptomatic, n (%) 20/103 (19.4) 1/24 (4.2) 6/66 (9.1) 13/13 (100) <0.001a
Bacillary loadb, n (%)
0
1+
2+
3+
26/83 (31.3)
6/83 (7.2)
17/83 (20.5)
34/83 (41)
12/23 (52.2)
1/23 (4.3)
5/23 (21.7)
5/23 (21.7)
13/52 (25)
5/52 (9.6)
9/52 (17.3)
25/52 (48.1)
1/8 (12.5)
0/8 (0)
3/8 (37.5)
4/8 (50)
0.116
Drug resistancec,d, n (%)
Isoniazide
Riphampicin
Pyrazinamide
Ethambutol
5/111 (4.5)
1/111 (0.9)
1/49 (2)
2/111 (1.8)
2/30 (6.7)
1/30 (3.3)
0/12 (0)
2/30 (6.7)
3/69 (4.3)
0/69 (0)
1/31 (3.2)
0/69 (1.8)
0/12 (0)
0/12 (0)
0/6 (0)
0/12 (0)
0.799
0.378
1.000
0.136
Hemoglobin g/dL, mean±SD 13.0±1.6 13.6±1.2 12.8±1.7 12.6±1.6 0.058
CRP mg/L, median (IQR) 66.3 (19.9–
124.2)
15.8 (3.9–
20.4)
89 (47.6–
124.9)
160.5 (108.7–
197.7)
<0.001a
Chest X-ray classification, n (%)
Minimal
Moderate
Advanced
19/113 (16.8)
52/113 (46)
42/113 (37.2)
19/31 (61.3)
12/31 (38.7)
0/31 (0)
0/69 (0)
39/69 (56.5)
30/69 (43.5)
0/13 (0)
1/13 (7.7)
12/13 (92.3)
<0.001a
a Statistically significant results. b Numbers related only to cases with culture confirmation on sputum (bacillary load was not considered for the remaining subjects, who were diagnosed through gastric aspirate, bronchial wash, bronchoalveolar lavage, pleural fluid or biopsy cultures). c Missingness of 1.8% due to contaminated culture or non-representative sampling. d Pyrazinamide resistance was not routinely assessed until May 2011. CRP – C-reactive protein; IQR – interquartile range; SD – standard deviation; TB – tuberculosis
Chapter 4 | Tuberculosis severity and its association with pathogen phylogeny and properties
118
2. Lineage diversity of M. tuberculosis within disease severity
groups
MTBC typing methods have evolved substantially over the years, from
simple phenotypic approaches, like phage typing and drug susceptibility profiling,
to the more recent DNA-based strain genotyping methods [82]. Despite being
standard methods for transmission studies, both spacer oligonucleotide typing
(spoligotyping) and variable-number tandem repeats of mycobacterial
interspersed repetitive units (MIRU-VNTR) typing rely on repetitive DNA elements
with high propensity for convergent evolution, making its use for the inference of
phylogenies misleading [30]. Contrasting with mobile genetic elements, large
sequence polymorphisms (LSP) and SNPs are considered robust phylogenetically
markers of MTBC [30, 83]. In particular, SNPs are ideal markers for genotyping
of MTBC, as they represent unique events and show virtually no homoplasy [30,
56].
Given these facts, we genotyped the mycobacterial isolates through a
custom TaqMan® real-time PCR assay, using phylogenetically informative SNPs
obtained from 22 MTBC whole genome sequences representative of lineages 1
to 6 (Table IV.1) [56]. This SNP-typing technique has an additional advantage,
since it can be very accurate and fast (<2h/96 samples) [56, 84]. We first
validated the method by performing a test with reference strains, which were
available for all lineages, except Lineage 5. Our assays generated steady and
consistent amplification curves (Figure IV.6, A-B). The ancestral and mutant
genotypes were defined by whether or not they contained the lineage defining
SNP in a specific assay. For instance, in an assay containing L4 primers and
probes, the DNA of a L4 isolate (e.g. H37Rv) annealed with the mutant probe. On
the other hand, in the same assay, the DNA of a L6 strain (e.g. H91) annealed
with the ancestral probe.
Once the genotyping method was optimized, the bacterial lineage for the
bacteria associated with each of the 113 mild, moderate and severe TB patients
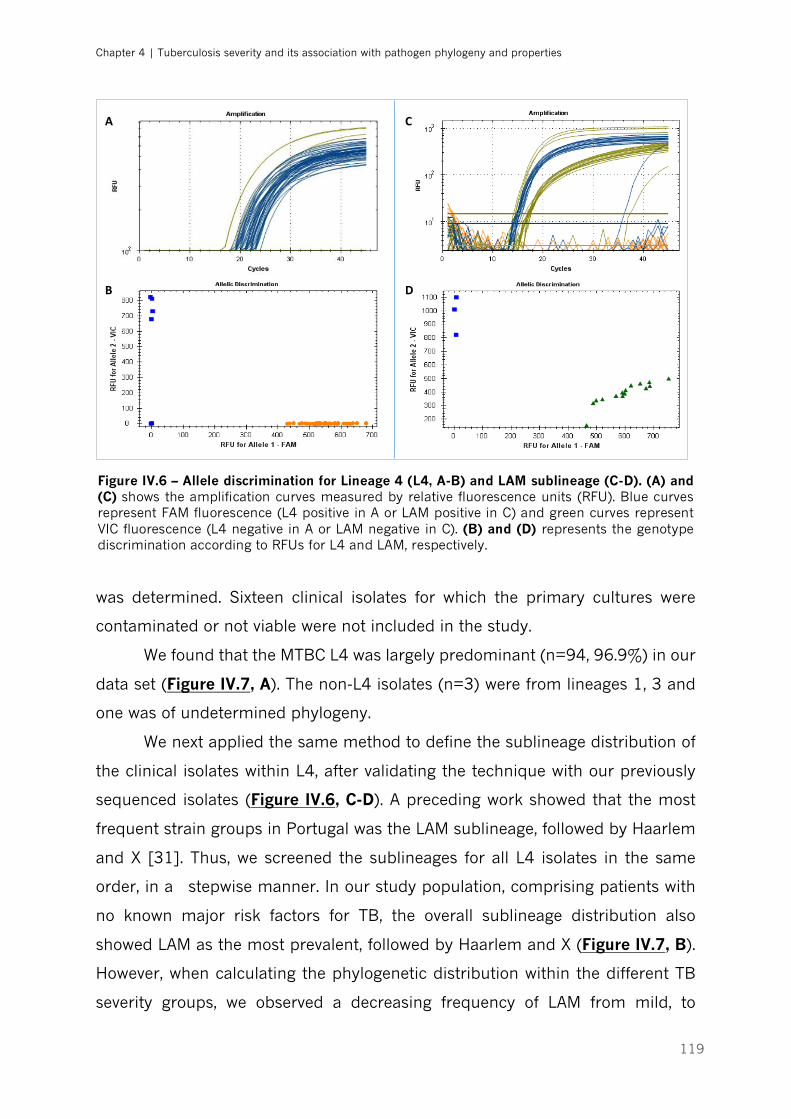
Chapter 4 | Tuberculosis severity and its association with pathogen phylogeny and properties
119
was determined. Sixteen clinical isolates for which the primary cultures were
contaminated or not viable were not included in the study.
We found that the MTBC L4 was largely predominant (n=94, 96.9%) in our
data set (Figure IV.7, A). The non-L4 isolates (n=3) were from lineages 1, 3 and
one was of undetermined phylogeny.
We next applied the same method to define the sublineage distribution of
the clinical isolates within L4, after validating the technique with our previously
sequenced isolates (Figure IV.6, C-D). A preceding work showed that the most
frequent strain groups in Portugal was the LAM sublineage, followed by Haarlem
and X [31]. Thus, we screened the sublineages for all L4 isolates in the same
order, in a stepwise manner. In our study population, comprising patients with
no known major risk factors for TB, the overall sublineage distribution also
showed LAM as the most prevalent, followed by Haarlem and X (Figure IV.7, B).
However, when calculating the phylogenetic distribution within the different TB
severity groups, we observed a decreasing frequency of LAM from mild, to
A
B
C
D
Figure IV.6 – Allele discrimination for Lineage 4 (L4, A-B) and LAM sublineage (C-D). (A) and (C) shows the amplification curves measured by relative fluorescence units (RFU). Blue curves represent FAM fluorescence (L4 positive in A or LAM positive in C) and green curves represent VIC fluorescence (L4 negative in A or LAM negative in C). (B) and (D) represents the genotype discrimination according to RFUs for L4 and LAM, respectively.
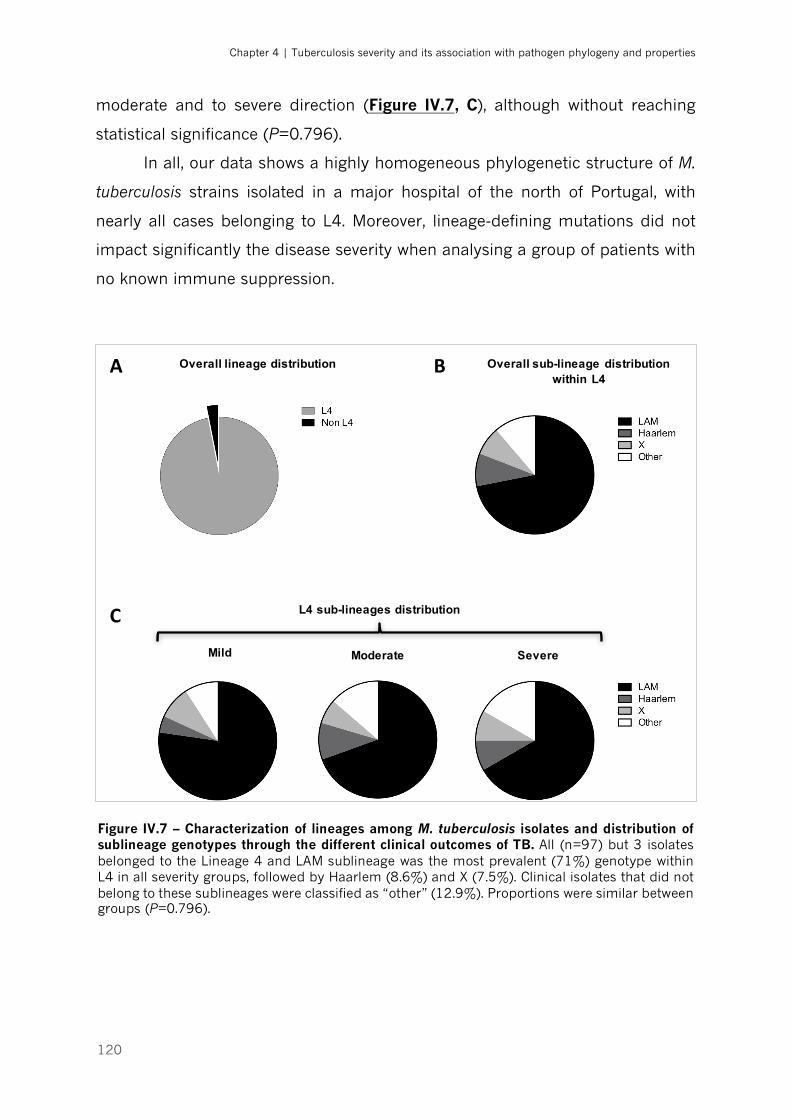
Chapter 4 | Tuberculosis severity and its association with pathogen phylogeny and properties
120
moderate and to severe direction (Figure IV.7, C), although without reaching
statistical significance (P=0.796).
In all, our data shows a highly homogeneous phylogenetic structure of M.
tuberculosis strains isolated in a major hospital of the north of Portugal, with
nearly all cases belonging to L4. Moreover, lineage-defining mutations did not
impact significantly the disease severity when analysing a group of patients with
no known immune suppression.
Figure IV.7 – Characterization of lineages among M. tuberculosis isolates and distribution of sublineage genotypes through the different clinical outcomes of TB. All (n=97) but 3 isolates belonged to the Lineage 4 and LAM sublineage was the most prevalent (71%) genotype within L4 in all severity groups, followed by Haarlem (8.6%) and X (7.5%). Clinical isolates that did not belong to these sublineages were classified as “other” (12.9%). Proportions were similar between groups (P=0.796).
Mild Moderate Severe
Overall lineage distribution Overall sub-lineage distribution within L4
L4 sub-lineages distribution
A
C
B
Chapter 4 | Tuberculosis severity and its association with pathogen phylogeny and properties
121
3. Differential bacterial growth kinetics across TB severity
groups
Differences in growth rates have been proposed as a possible explanation
for the lower severity of Mycobacterium africanum as compared with M.
tuberculosis [58]. Since we obtained different M. tuberculosis isolates associated
with a spectrum of severity within pulmonary active TB, we reasoned that they
may display differences in the growth rates. To test this hypothesis, growth curves
(each performed in duplicate) for clinical isolates associated with 8 mild, 10
moderate and 8 severe TB cases were obtained using a previously published
method [58, 59]. General characteristics of the selected cases are presented in
Table IV.3.
As expected, all curves displayed a lag phase, followed by a steep
exponential phase and finally reaching a high plateau (stationary phase) (Figure
IV.8). The overall analysis of the data showed that, whereas clinical isolates
associated with mild or severe TB presented some degree of dispersion (Figure
IV.8, A and B), all moderate strains tested showed a very similar growth profile
(Figure IV.8, C). An overlap of all growth curves obtained per isolate category
further illustrates the differences between the moderate TB-associated isolates
when compared to mild or severe TB-associated ones (Figure IV.9). The growth
profile observed for the H37Rv Trudeau (Figure IV.9, blue line) provides a
reference for comparison with the other groups of strains. This laboratory strain
has been adapted to in vitro culture, with evidence of accumulating genetic
diversity during serial passaging of cultures [85]. Compared to mild and severe
strains, the H37Rv strain exhibits a steeper exponential growth, however without
reaching the same maximum concentration level seen with the moderate strains
(Figure IV.9). The length of lag phase (5.12±0.12 [mean±SD] days) and mean
doubling time (21.03 hours, 95% CI 20.29—21.8 h) measured (Figure IV.8, D)
were in line with previous descriptions [58, 86], which validates the current
methodology.
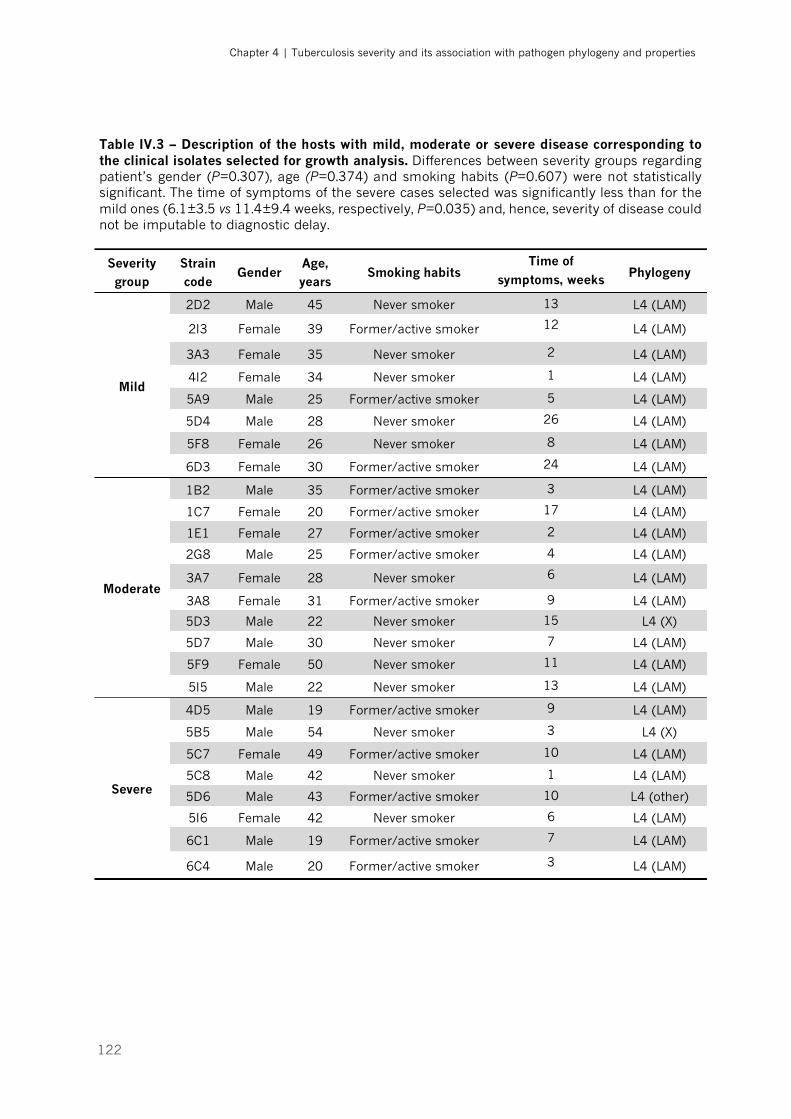
Chapter 4 | Tuberculosis severity and its association with pathogen phylogeny and properties
122
Table IV.3 – Description of the hosts with mild, moderate or severe disease corresponding to the clinical isolates selected for growth analysis. Differences between severity groups regarding patient’s gender (P=0.307), age (P=0.374) and smoking habits (P=0.607) were not statistically significant. The time of symptoms of the severe cases selected was significantly less than for the mild ones (6.1±3.5 vs 11.4±9.4 weeks, respectively, P=0.035) and, hence, severity of disease could not be imputable to diagnostic delay.
Severity group
Strain code
Gender Age, years
Smoking habits Time of
symptoms, weeks Phylogeny
Mild
2D2 Male 45 Never smoker 13 L4 (LAM)
2I3 Female 39 Former/active smoker 12 L4 (LAM)
3A3 Female 35 Never smoker 2 L4 (LAM)
4I2 Female 34 Never smoker 1 L4 (LAM)
5A9 Male 25 Former/active smoker 5 L4 (LAM)
5D4 Male 28 Never smoker 26 L4 (LAM)
5F8 Female 26 Never smoker 8 L4 (LAM)
6D3 Female 30 Former/active smoker 24 L4 (LAM)
Moderate
1B2 Male 35 Former/active smoker 3 L4 (LAM)
1C7 Female 20 Former/active smoker 17 L4 (LAM)
1E1 Female 27 Former/active smoker 2 L4 (LAM)
2G8 Male 25 Former/active smoker 4 L4 (LAM)
3A7 Female 28 Never smoker 6 L4 (LAM)
3A8 Female 31 Former/active smoker 9 L4 (LAM)
5D3 Male 22 Never smoker 15 L4 (X)
5D7 Male 30 Never smoker 7 L4 (LAM)
5F9 Female 50 Never smoker 11 L4 (LAM)
5I5 Male 22 Never smoker 13 L4 (LAM)
Severe
4D5 Male 19 Former/active smoker 9 L4 (LAM)
5B5 Male 54 Never smoker 3 L4 (X)
5C7 Female 49 Former/active smoker 10 L4 (LAM)
5C8 Male 42 Never smoker 1 L4 (LAM)
5D6 Male 43 Former/active smoker 10 L4 (other)
5I6 Female 42 Never smoker 6 L4 (LAM)
6C1 Male 19 Former/active smoker 7 L4 (LAM)
6C4 Male 20 Former/active smoker 3 L4 (LAM)
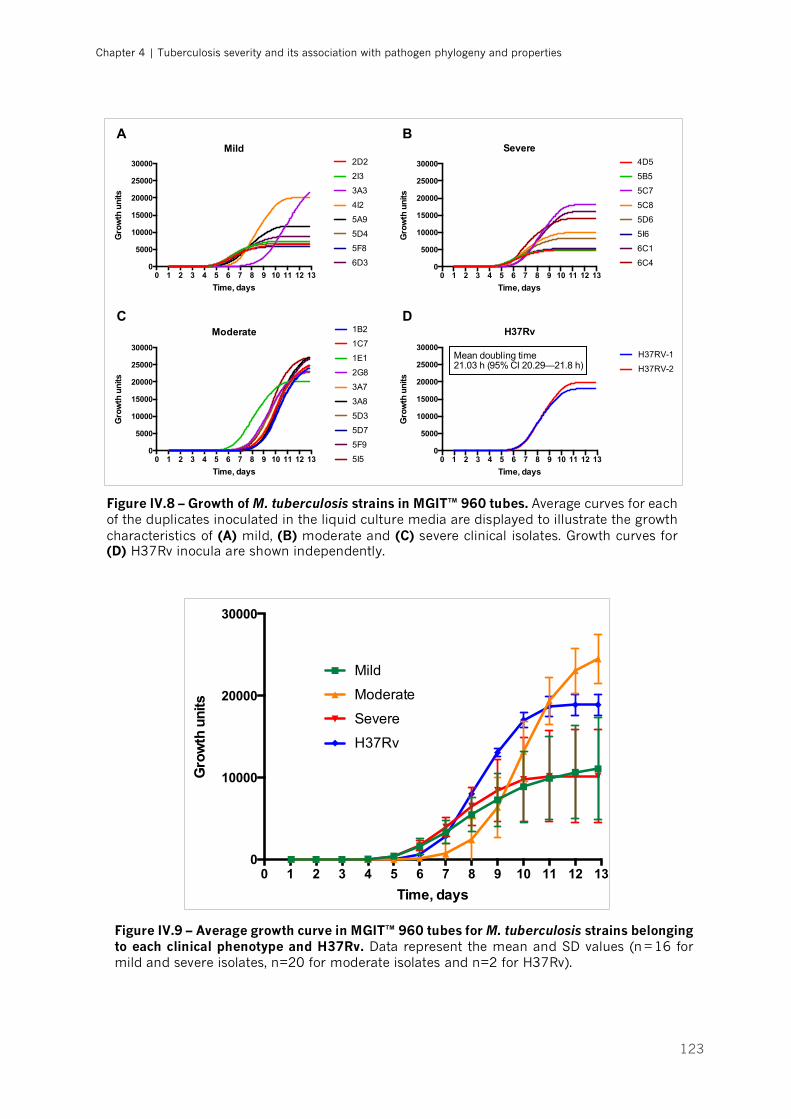
Chapter 4 | Tuberculosis severity and its association with pathogen phylogeny and properties
123
0 1 2 3 4 5 6 7 8 9 10 11 12 130
5000
10000
15000
20000
25000
30000
Time, days
Gro
wth
uni
ts
Mild2D2
2I3
3A3
4I2
5A9
5D4
5F8
6D3
0 1 2 3 4 5 6 7 8 9 10 11 12 130
5000
10000
15000
20000
25000
30000
Time, days
Gro
wth
uni
ts
Moderate 1B2
1C7
1E1
2G8
3A7
3A8
5D3
5D7
5F9
5I5 0 1 2 3 4 5 6 7 8 9 10 11 12 130
5000
10000
15000
20000
25000
30000
Time, days
Gro
wth
uni
ts
H37Rv
H37RV-1
H37RV-2
0 1 2 3 4 5 6 7 8 9 10 11 12 130
5000
10000
15000
20000
25000
30000
Time, days
Gro
wth
uni
ts
Severe4D5
5B5
5C7
5C8
5D6
5I6
6C1
6C4
Mean doubling time21.03 h (95% CI 20.29—21.8 h)
A B
C D
Figure IV.8 – Growth of M. tuberculosis strains in MGIT™ 960 tubes. Average curves for each of the duplicates inoculated in the liquid culture media are displayed to illustrate the growth characteristics of (A) mild, (B) moderate and (C) severe clinical isolates. Growth curves for (D) H37Rv inocula are shown independently.
0 1 2 3 4 5 6 7 8 9 10 11 12 130
10000
20000
30000
Time, days
Gro
wth
uni
ts
Mild
Moderate
Severe
H37Rv
Figure IV.9 – Average growth curve in MGIT™ 960 tubes for M. tuberculosis strains belonging to each clinical phenotype and H37Rv. Data represent the mean and SD values (n = 16 for mild and severe isolates, n=20 for moderate isolates and n=2 for H37Rv).
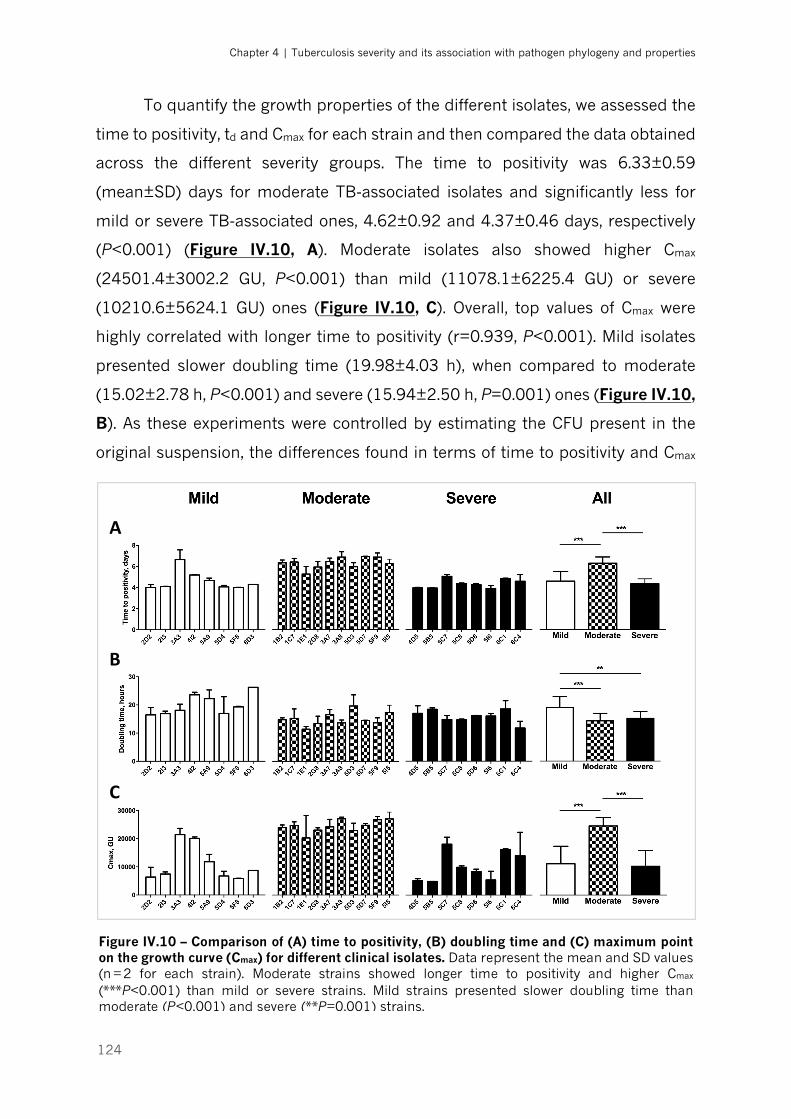
Chapter 4 | Tuberculosis severity and its association with pathogen phylogeny and properties
124
To quantify the growth properties of the different isolates, we assessed the
time to positivity, td and Cmax for each strain and then compared the data obtained
across the different severity groups. The time to positivity was 6.33±0.59
(mean±SD) days for moderate TB-associated isolates and significantly less for
mild or severe TB-associated ones, 4.62±0.92 and 4.37±0.46 days, respectively
(P<0.001) (Figure IV.10, A). Moderate isolates also showed higher Cmax
(24501.4±3002.2 GU, P<0.001) than mild (11078.1±6225.4 GU) or severe
(10210.6±5624.1 GU) ones (Figure IV.10, C). Overall, top values of Cmax were
highly correlated with longer time to positivity (r=0.939, P<0.001). Mild isolates
presented slower doubling time (19.98±4.03 h), when compared to moderate
(15.02±2.78 h, P<0.001) and severe (15.94±2.50 h, P=0.001) ones (Figure IV.10,
B). As these experiments were controlled by estimating the CFU present in the
original suspension, the differences found in terms of time to positivity and Cmax
A
B
C
Figure IV.10 – Comparison of (A) time to positivity, (B) doubling time and (C) maximum point on the growth curve (Cmax) for different clinical isolates. Data represent the mean and SD values (n = 2 for each strain). Moderate strains showed longer time to positivity and higher Cmax (***P<0.001) than mild or severe strains. Mild strains presented slower doubling time than moderate (P<0.001) and severe (**P=0.001) strains.
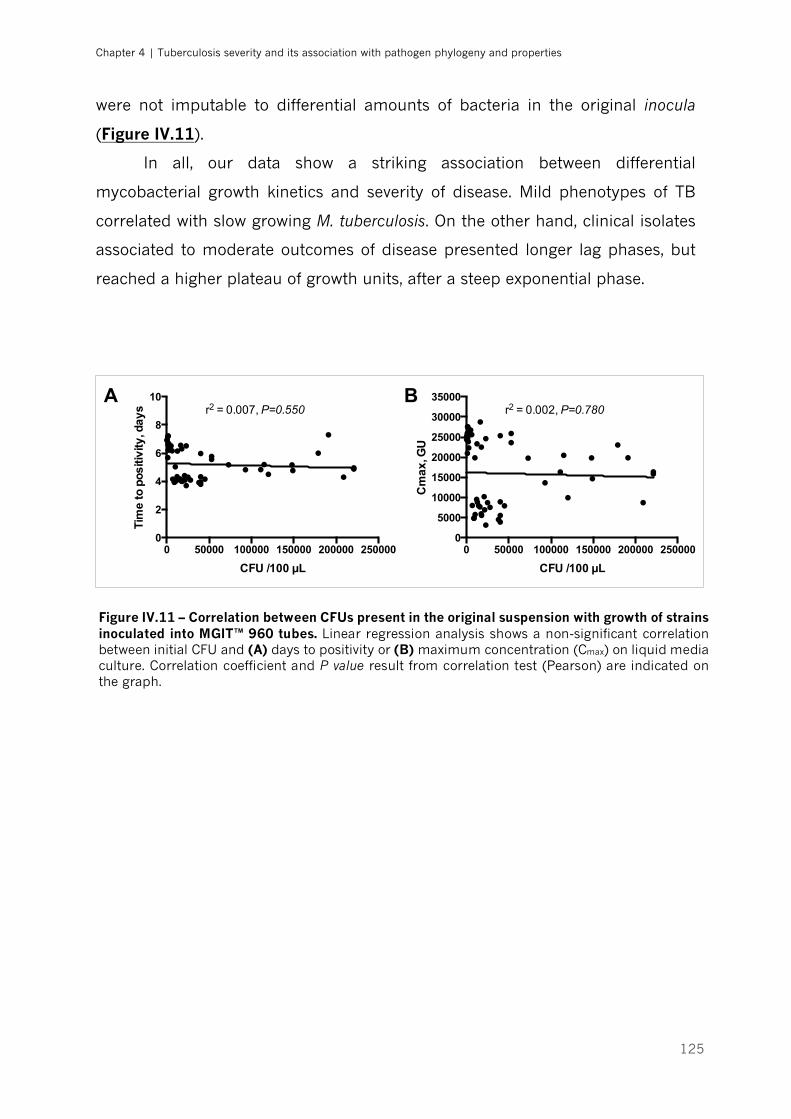
Chapter 4 | Tuberculosis severity and its association with pathogen phylogeny and properties
125
were not imputable to differential amounts of bacteria in the original inocula
(Figure IV.11).
In all, our data show a striking association between differential
mycobacterial growth kinetics and severity of disease. Mild phenotypes of TB
correlated with slow growing M. tuberculosis. On the other hand, clinical isolates
associated to moderate outcomes of disease presented longer lag phases, but
reached a higher plateau of growth units, after a steep exponential phase.
0 50000 100000 150000 200000 2500000
2
4
6
8
10
CFU /100 µL
Tim
e to
pos
itivi
ty, d
ays r2 = 0.007, P=0.550
0 50000 100000 150000 200000 2500000
5000
10000
15000
20000
25000
30000
35000
CFU /100 µL
Cm
ax, G
Ur2 = 0.002, P=0.780
A B
Figure IV.11 – Correlation between CFUs present in the original suspension with growth of strains inoculated into MGIT™ 960 tubes. Linear regression analysis shows a non-significant correlation between initial CFU and (A) days to positivity or (B) maximum concentration (Cmax) on liquid media culture. Correlation coefficient and P value result from correlation test (Pearson) are indicated on the graph.
Chapter 4 | Tuberculosis severity and its association with pathogen phylogeny and properties
126
4. Genetic diversity underlying differential bacterial growth
To gain insight on the genetic mechanisms underlying the phenotypic
differences observed we resorted to whole genome comparisons. For this, two
groups of clinical isolates were defined: fast and slow growers. The fast growing
group comprised all moderate strains, except one (5I5), for which the sequence
was not yet available. Mild and severe strains were included in the slow growing
group. Two mild isolates with discordant growth profile (3A3 and 4I2) were
excluded from the analysis, and one severe strain (5I6) also lacked genome
sequence for comparison.
4.1. Phylogenetic structure unrelated to growth pattern
The information for 1797 concatenated genome-wide SNPs across the 22
clinical isolates was used to construct a phylogenetic tree using maximum
likelihood and Bayesian analysis (Figure IV.12). The phylogenetic analysis
confirmed our previous SNP-typing results (Table IV.3), with the branching of the
tree following the distribution of our isolates into sublineages 4.1 (X family) and
4.3 (LAM).
We then explored the distribution of fast and slow growing strains across
the phylogenetic tree (Figure IV.12) and found that the majority of the
represented taxa were not specifically associated with a particular growth profile.
The exceptions were taxa 4.3.3 and 4.9 that are composed only by slow growers
and taxa 4.3.4.2 formed by fast growers. However, the low number of isolates
from these taxa (4.3.3, n=5; 4.9, n=1; 4.3.4.2, n=2) is clearly insufficient to make
any generalization about the growth profile of the taxa.
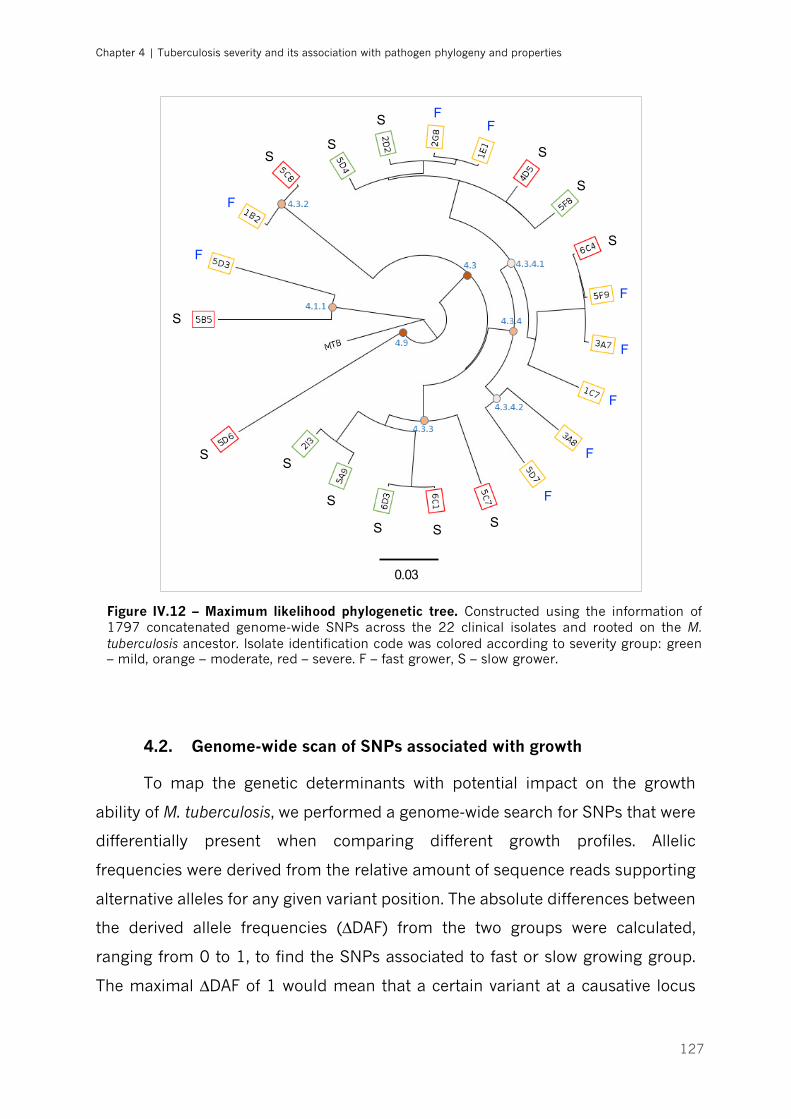
Chapter 4 | Tuberculosis severity and its association with pathogen phylogeny and properties
127
4.2. Genome-wide scan of SNPs associated with growth
To map the genetic determinants with potential impact on the growth
ability of M. tuberculosis, we performed a genome-wide search for SNPs that were
differentially present when comparing different growth profiles. Allelic
frequencies were derived from the relative amount of sequence reads supporting
alternative alleles for any given variant position. The absolute differences between
the derived allele frequencies (∆DAF) from the two groups were calculated,
ranging from 0 to 1, to find the SNPs associated to fast or slow growing group.
The maximal ∆DAF of 1 would mean that a certain variant at a causative locus
F
F
FF
F
F
F
F
F
S
S
S
S
S
SS
S
S S
S
S
0.03
S
Figure IV.12 – Maximum likelihood phylogenetic tree. Constructed using the information of 1797 concatenated genome-wide SNPs across the 22 clinical isolates and rooted on the M. tuberculosis ancestor. Isolate identification code was colored according to severity group: green – mild, orange – moderate, red – severe. F – fast grower, S – slow grower.
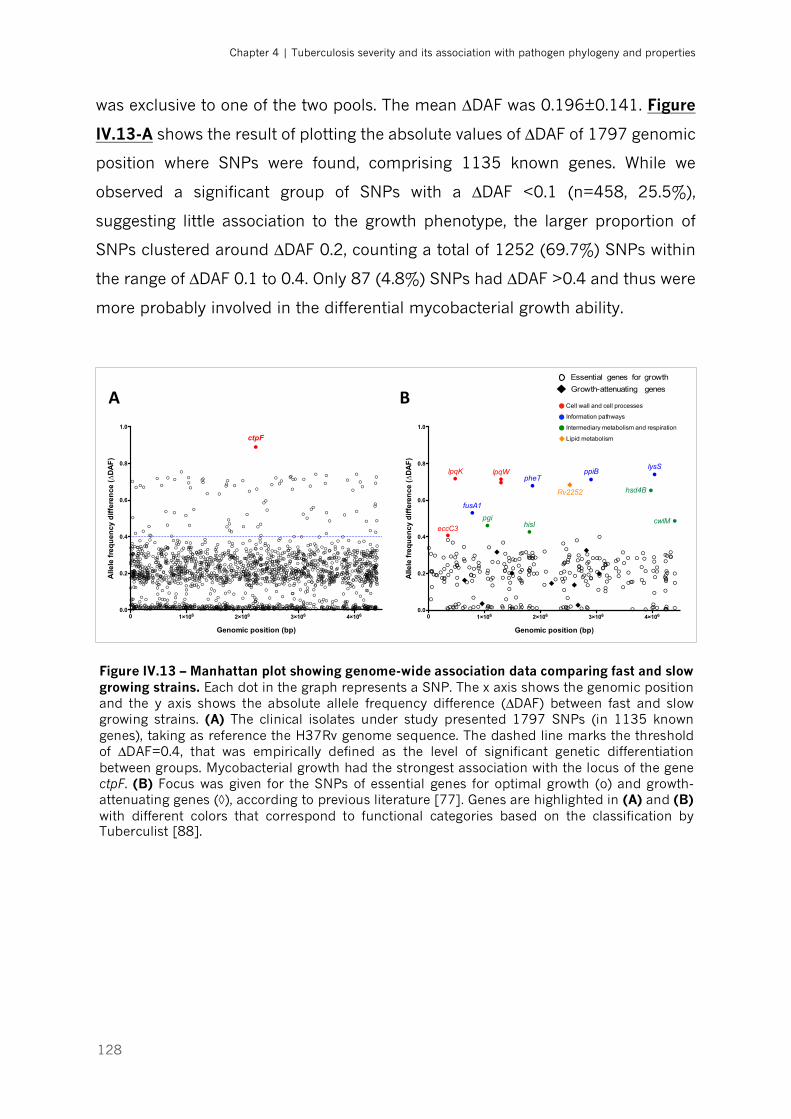
Chapter 4 | Tuberculosis severity and its association with pathogen phylogeny and properties
128
was exclusive to one of the two pools. The mean ∆DAF was 0.196±0.141. Figure
IV.13-A shows the result of plotting the absolute values of ∆DAF of 1797 genomic
position where SNPs were found, comprising 1135 known genes. While we
observed a significant group of SNPs with a ∆DAF <0.1 (n=458, 25.5%),
suggesting little association to the growth phenotype, the larger proportion of
SNPs clustered around ∆DAF 0.2, counting a total of 1252 (69.7%) SNPs within
the range of ∆DAF 0.1 to 0.4. Only 87 (4.8%) SNPs had ∆DAF >0.4 and thus were
more probably involved in the differential mycobacterial growth ability.
Figure IV.13 – Manhattan plot showing genome-wide association data comparing fast and slow growing strains. Each dot in the graph represents a SNP. The x axis shows the genomic position and the y axis shows the absolute allele frequency difference (∆DAF) between fast and slow growing strains. (A) The clinical isolates under study presented 1797 SNPs (in 1135 known genes), taking as reference the H37Rv genome sequence. The dashed line marks the threshold of ∆DAF=0.4, that was empirically defined as the level of significant genetic differentiation between groups. Mycobacterial growth had the strongest association with the locus of the gene ctpF. (B) Focus was given for the SNPs of essential genes for optimal growth (o) and growth-attenuating genes (◊), according to previous literature [77]. Genes are highlighted in (A) and (B) with different colors that correspond to functional categories based on the classification by Tuberculist [88].
0 1×10⁶ 2×10⁶ 3×10⁶ 4×1060.0
0.2
0.4
0.6
0.8
1.0
!
!
!
!
!
!
!
!
!
!
!! ! ! !!!!! !!! ! !! !! ! !! ! ! !! ! !!!! !! !! ! ! ! ! !!! ! !! ! !!!! ! !!! !!! ! !! !
!! !! !! ! !! ! !!! !! !! !!! !!! !! ! !! !!! !!! ! !! ! !! !!! ! !! ! ! !! !!! ! ! !! !! ! !! ! !! !! !!! !! ! ! !! !!! ! !! ! ! ! !! ! ! ! !! ! ! !! ! !! !!!! ! ! ! !! !! ! !! ! !! ! !! ! !! ! !! ! !! !! !!!! !!! !! !! ! !! !! !! !! ! !!! ! !! !! !! !! !!! !! !!! !! !! !!! !! ! !! !!! ! ! ! !! ! !! !! !! !!!! ! !!
!" ""
""
""" """
"
Genomic position (bp)
Alle
le fr
equ
ency
diff
eren
ce (∆
DA
F)
lysSppiBlpqK lpqWpheT
hsd4B
fusA1
cwlMpgihisIeccC3
Rv2252
0 1×10⁶ 2×10⁶ 3×10⁶ 4×1060.0
0.2
0.4
0.6
0.8
1.0
!
!
!
!
!
!
!
!
!
!!
!!
!
!
!!
!!
!
!!
!!
!
!
!
!
!!
!
!!
!
!
!
!
!!!!
!
!!!
!
!!
!!!
!
!
!
!
!
!
!!
!
!
!
!!
!
!
!
!
!
!
!
!
!
!
!
!!
!
!
!!
!
!
!
!
!
!
!
!
!!
!
!
!!
!
!
!
!!
!!
!
!
!!!
!
!!
!
!
!
!
!
!
!
!
!
!
!
!
!!
!
!
!
!
!
!
!
!!!!!
!
!
!
!
!
!
!
!
!
!
!
!
!!!!
!
!
!
!
!
!
!
!
!
!
!
!
!
!
!
!
!
!!!
!
!
!
!
!
!
!
!!!!!
!
!!
!
!
!
!
!
!
!!
!
!
!
!!
!
!
!!
!
!
!
!
!
!
!!!!
!
!
!
!
!
!
!
!
!
!
!
!
!!
!
!
!
!
!
!
!
!
!
!
!
!
!!
!!!
!
!
!
!
!
!
!
!
!
!
!!
!!
!
!
!
!
!
!
!
!!!
!
!
!
!
!!
!!
!
!
!
!!
!!
!
!
!
!
!!
!!
!
!
!
!
!
!
!!
!
!
!
!
!!
!
!
!
!!
!
!
!
!
!
!!!
!
!!
!
!
!!
!!
!
!
!
!
!
!!
!!
!!!
!
!
!!
!
!!!
!
!
!
!
!
!
!!
!
!
!
!
!
!
!
!
!
!
!!
!
!
!
!
!
!
!
!
!
!
!!!!
!
!
!!
!
!
!
!
!!
!
!!
!!
!!
!
!
!
!
!
!
!!
!
!
!
!
!!!
!
!!
!!
!!
!
!!
!
!
!
!
!
!!
!
!!
!!
!!
!
!
!
!
!
!
!
!
!
!
!!!!!
!
!
!
!!
!!
!
!
!
!
!
!
!
!
!!
!
!
!
!
!
!
!
!
!
!
!!!!
!
!
!
!
!!
!
!
!
!
!
!
!!
!
!!!
!
!!
!!
!
!
!!
!
!
!
!
!
!!
!
!!!
!
!
!
!!
!!
!!
!
!
!
!
!
!
!
!!!
!
!
!!!
!
!
!!
!
!
!
!
!
!!!
!!
!
!
!
!
!
!!
!!
!!
!
!!!
!
!!
!
!!
!
!
!!!
!
!
!
!!!!
!!
!
!
!
!!
!
!
!
!!
!
!
!
!
!
!
!
!
!
!
!
!!
!
!
!
!
!!
!!
!
!
!
!!
!
!
!
!
!
!
!
!
!
!!
!
!
!
!
!
!
!
!
!
!!
!
!!!
!
!
!
!
!!
!
!
!
!
!
!
!
!
!
!
!
!
!!
!
!
!!
!
!
!!
!
!
!!
!
!
!
!
!
!
!
!!
!
!
!
!
!!
!
!
!
!
!
!
!!!
!
!!
!
!
!!
!
!
!
!!
!!!
!
!
!
!
!
!!
!
!
!
!
!!!
!
!
!
!
!
!
!
!
!
!
!
!!
!
!
!
!
!!
!!
!
!
!
!!
!
!!
!
!
!
!!
!!
!
!
!
!
!!
!
!
!
!!
!!
!!!
!
!
!
!
!
!
!
!!
!!
!
!!
!
!!!
!!
!
!
!
!
!
!
!
!
!
!
!
!
!
!
!!
!
!
!!
!
!!!
!
!
!
!
!
!
!
!
!
!
!
!
!
!!
!
!
!
!
!
!
!
!
!
!!
!
!
!
!
!!
!
!
!
!!
!
!
!!
!
!
!
!
!
!!
!
!
!
!
!
!
!
!!
!
!
!
!
!
!
!
!
!
!
!
!
!
!
!
!
!
!!
!
!
!
!
!
!
!
!
"
!
!
!
!
!
!
!!
!
!
!
!
!
!
!
!
!
!!
!
!
!
!
!
!!
!
!
!!
!
!!
!
!
!
!
!
!
!
!
!
!
!
!
!
!
!
!
!!
!
!!
!!!
!
!!
!
!
!
!
!
!
!
!
!
!
!
!!
!
!
!
!
!!
!
!!
!
!
!
!
!!
!
!
!!!
!
!!
!!
!
!!!
!
!!
!
!
!
!
!
!
!
!
!!
!!
!
!
!
!
!
!
!
!!
!
!
!
!
!
!
!!
!
!!
!
!
!
!
!
!
!
!
!
!
!
!!
!
!
!
!
!!
!
!
!
!!
!
!
!
!
!!
!
!
!
!
!!
!
!
!
!
!
!
!
!
!
!
!
!
!!!
!
!!!
!
!!
!!
!!!
!
!
!
!
!
!
!
!
!
!!!
!
!!
!
!!!
!
!
!
!
!!
!
!
!
!
!
!
!!
!
!
!
!
!
!
!
!
!
!
!
!
!
!
!
!
!
!!!
!
!
!
!
!
!
!
!
!
!
!
!
!
!!!
!
!
!
!
!
!
!
!
!
!
!
!
!
!
!
!!
!
!
!
!
!
!
!
!
!
!
!!!
!!
!
!
!
!!
!!
!!
!
!
!
!
!
!
!
!
!
!!
!
!
!!!
!
!
!
!!
!
!
!
!
!
!
!!
!!
!
!
!
!
!
!
!
!
!!
!
!!
!
!
!!!
!
!
!
!
!
!
!!
!!
!
!
!
!!
!!
!!!!
!
!!
!
!
!
!
!
!
!
!
!
!
!
!
!!
!
!
!!
!!!
!!!
!
!
!
!
!
!
!
!
!
!
!
!!
!
!
!
!
!
!
!
!
!!
!
!
!
!
!
!!!
!
!
!
!!!
!!!
!
!
!
!
!!!!
!
!
!!
!
!!!
!
!
!
!
!
!
!
!
!
!
!!
!
!
!
!
!
!
!
!
!
!
!
!
!
!
!
!
!!
!
!!
!
!
!
!
!!
!
!
!
!
!!
!
!
!
!!
!
!!
!
!!
!
!!!
!
!
!
!
!
!
!
!
!
!!!
!
!!!
!
!
!!
!
!!
!!
!
!
!
!
!
!
!
!!!
!!
!
!
!
!
!!
!!
!
!
!
!
!
!
!
!
!
!
!!
!
!
!
!
!!!
!
!
!
!!
!
!
!
!
!!
!
!
!
!
!
!
!
!!
!
!
!!!
!
!
!
!
!
!
!
!
!
!
!
!
!!!
!
!
!
!
!
!
!
!
!
!
!
!
!!
!
!!
!!
!
!
!
!!!
!
!!
!!!
!
!
!!!
!
!
!!
!
!!
!
!
!
!
!
!!
!!
!
!
!
!
!!
!
!
!
!
!
!
!
!
!
!
!
!
!
!!
!!
!!
!
!
!
!
!
!
!
!
!
!
!
!!!
!
!
!
!
!
!!
!!
!
!
!
!
!
!!
!
!
!!
!
!
!!
!
!
!!
!!
!!!!
!
!
!!
!
!!
!
!
!
!
!
!
!
!
!
!!
!
!!
!!
!
!
!
!
!!
!
!!
!
!
!
!
!
!
!
!
!
!
!!
!
!
!
!
!
!
!
!!!
!
!
!
!
!
!
!!
!
!!!
!
!
!
!!
!!!!
!
!
!
!
!
!!
!
!
!
!
!
!
!
!
!!
!
!
!!
!
!
!
!
!!!
!
!
!
!!
!
!
!
!
!
!
!
!
!
!
!
!
!
!
Genomic position (bp)
Alle
le fr
equ
ency
diff
eren
ce (∆
DA
F)
ctpF
Essential genes for growth!
Growth-attenuating genes!
Lipid metabolism
Cell wall and cell processes
Information pathways
Intermediary metabolism and respiration
Essential genes for growthGrowth-attenuating genesA B
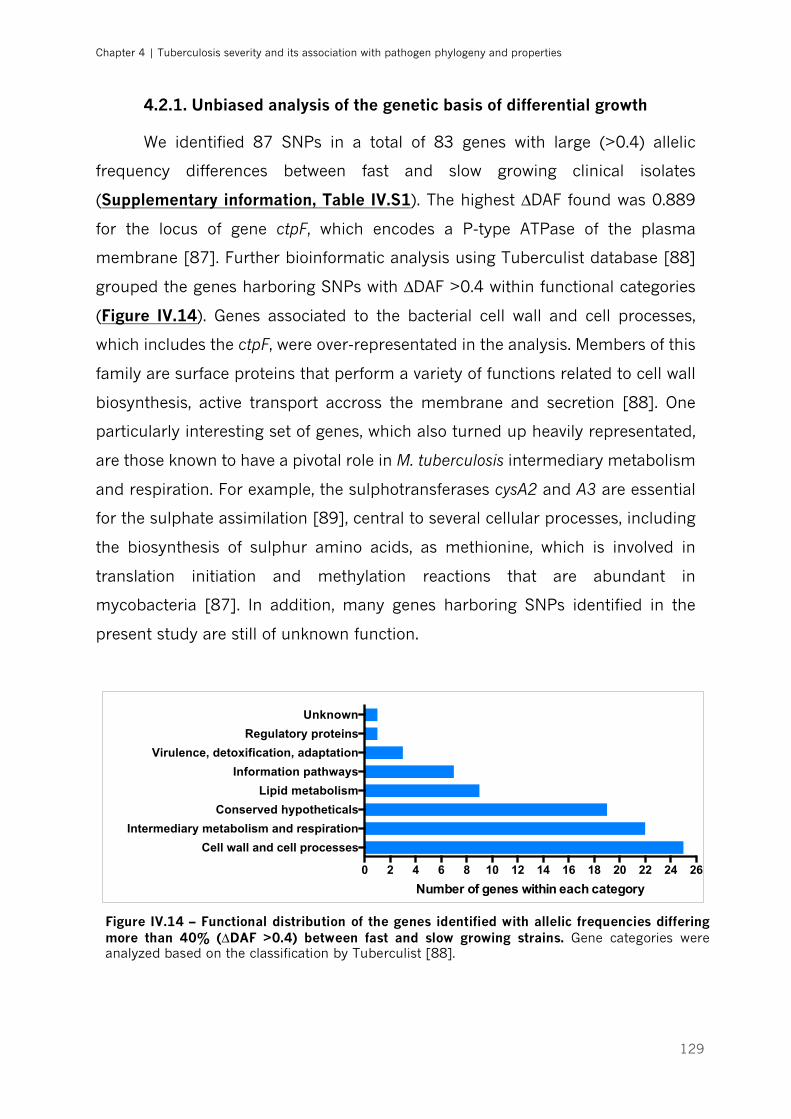
Chapter 4 | Tuberculosis severity and its association with pathogen phylogeny and properties
129
4.2.1. Unbiased analysis of the genetic basis of differential growth
We identified 87 SNPs in a total of 83 genes with large (>0.4) allelic
frequency differences between fast and slow growing clinical isolates
(Supplementary information, Table IV.S1). The highest ∆DAF found was 0.889
for the locus of gene ctpF, which encodes a P-type ATPase of the plasma
membrane [87]. Further bioinformatic analysis using Tuberculist database [88]
grouped the genes harboring SNPs with ∆DAF >0.4 within functional categories
(Figure IV.14). Genes associated to the bacterial cell wall and cell processes,
which includes the ctpF, were over-representated in the analysis. Members of this
family are surface proteins that perform a variety of functions related to cell wall
biosynthesis, active transport accross the membrane and secretion [88]. One
particularly interesting set of genes, which also turned up heavily representated,
are those known to have a pivotal role in M. tuberculosis intermediary metabolism
and respiration. For example, the sulphotransferases cysA2 and A3 are essential
for the sulphate assimilation [89], central to several cellular processes, including
the biosynthesis of sulphur amino acids, as methionine, which is involved in
translation initiation and methylation reactions that are abundant in
mycobacteria [87]. In addition, many genes harboring SNPs identified in the
present study are still of unknown function.
0 2 4 6 8 10 12 14 16 18 20 22 24 26
Cell wall and cell processes
Intermediary metabolism and respiration
Conserved hypotheticals
Lipid metabolism
Information pathways
Virulence, detoxification, adaptation
Regulatory proteins
Unknown
Number of genes within each category
Figure IV.14 – Functional distribution of the genes identified with allelic frequencies differing more than 40% (∆DAF >0.4) between fast and slow growing strains. Gene categories were analyzed based on the classification by Tuberculist [88].
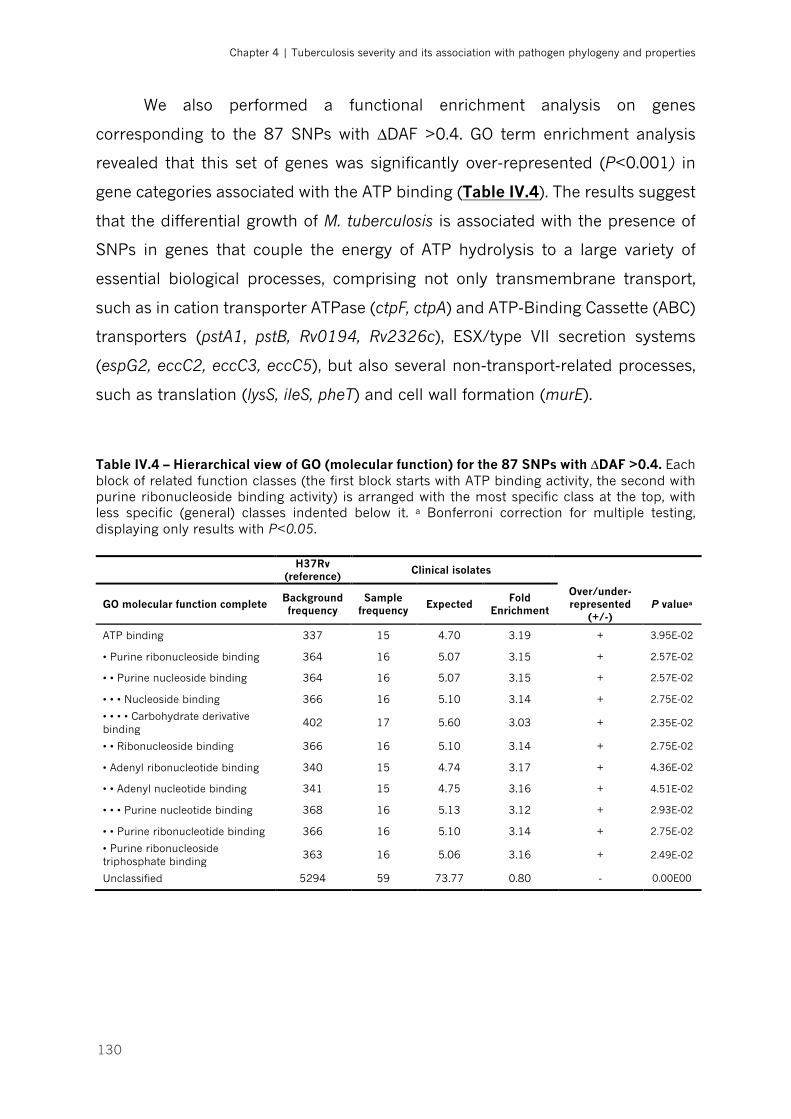
Chapter 4 | Tuberculosis severity and its association with pathogen phylogeny and properties
130
We also performed a functional enrichment analysis on genes
corresponding to the 87 SNPs with ∆DAF >0.4. GO term enrichment analysis
revealed that this set of genes was significantly over-represented (P<0.001) in
gene categories associated with the ATP binding (Table IV.4). The results suggest
that the differential growth of M. tuberculosis is associated with the presence of
SNPs in genes that couple the energy of ATP hydrolysis to a large variety of
essential biological processes, comprising not only transmembrane transport,
such as in cation transporter ATPase (ctpF, ctpA) and ATP-Binding Cassette (ABC)
transporters (pstA1, pstB, Rv0194, Rv2326c), ESX/type VII secretion systems
(espG2, eccC2, eccC3, eccC5), but also several non-transport-related processes,
such as translation (lysS, ileS, pheT) and cell wall formation (murE).
Table IV.4 – Hierarchical view of GO (molecular function) for the 87 SNPs with ∆DAF >0.4. Each block of related function classes (the first block starts with ATP binding activity, the second with purine ribonucleoside binding activity) is arranged with the most specific class at the top, with less specific (general) classes indented below it. a Bonferroni correction for multiple testing, displaying only results with P<0.05.
H37Rv (reference) Clinical isolates
GO molecular function complete Background frequency
Sample frequency Expected Fold
Enrichment
Over/under-represented
(+/-) P valuea
ATP binding 337 15 4.70 3.19 + 3.95E-02
• Purine ribonucleoside binding 364 16 5.07 3.15 + 2.57E-02
• • Purine nucleoside binding 364 16 5.07 3.15 + 2.57E-02
• • • Nucleoside binding 366 16 5.10 3.14 + 2.75E-02
• • • • Carbohydrate derivative binding
402 17 5.60 3.03 + 2.35E-02
• • Ribonucleoside binding 366 16 5.10 3.14 + 2.75E-02
• Adenyl ribonucleotide binding 340 15 4.74 3.17 + 4.36E-02
• • Adenyl nucleotide binding 341 15 4.75 3.16 + 4.51E-02
• • • Purine nucleotide binding 368 16 5.13 3.12 + 2.93E-02
• • Purine ribonucleotide binding 366 16 5.10 3.14 + 2.75E-02
• Purine ribonucleoside triphosphate binding
363 16 5.06 3.16 + 2.49E-02
Unclassified 5294 59 73.77 0.80 - 0.00E00
Chapter 4 | Tuberculosis severity and its association with pathogen phylogeny and properties
131
4.2.2. Essential and non-essential growth-attenuating genes
A previous work used transposon insertion and gene-disruption to identify
the genes required for optimal growth of M. tuberculosis, and broadly classified
them into two groups: essential or non-essential for in vitro growth [77]. In
addition, the authors described a set of non-essential genes that, when inactivated
through transposon insertion, resulted in mild growth attenuation, and were thus
designated as growth-attenuating genes [77]. As expected most of these genes
are highly conserved having a very reduced number of SNPs across the MTBC.
However, in the whole genome analysis of the studied clinical isolates we found
SNPs in 201 out of the 614 essential genes and in 10 of the 42 growth-
attenuating genes formerly described for H37Rv (Figure IV.13, B). The SNPs in
some of these genes had very low ∆DAF, indicating identical allele frequency in
both fast and slow growing groups. This is the case of rmlB (∆DAF=0.002),
encoding an enzyme involved in dTDP-rhamnose synthetic pathway
(fundamental to the structural integrity of mycobacterial cell wall), that has been
previously demonstrated to be essential for mycobacterial growth [90]. Thirteen
SNPs in 11 essential genes and in one growth-attenuating gene presented ∆DAF
>0.4, of which 7 genes had non-synonymous mutations. However, only three of
these genes (Rv2252, pgi and hisl) were affected in their protein function as
predicted by SIFT analysis. A detailed description of the analysis is provided in
Table IV.5.
4.2.3. Genes essential for intracellular survival
Another work using transposon mutants identified 126 genes required for
M. tuberculosis to grow within primary macrophages [78]. In our study, we found
at least one nucleotide change in 54 out of the 126 genes essential for
intracellular survival, 6 of which were already identified for in vitro growth [77].
Of the remaining set of genes exclusively associated with in vivo growth, 4 had
∆DAF >0.4, two of which with non-synonymous mutations, though amino acid
changes in the coded proteins were predicted to be tolerated by the bacteria
(Table IV.5).
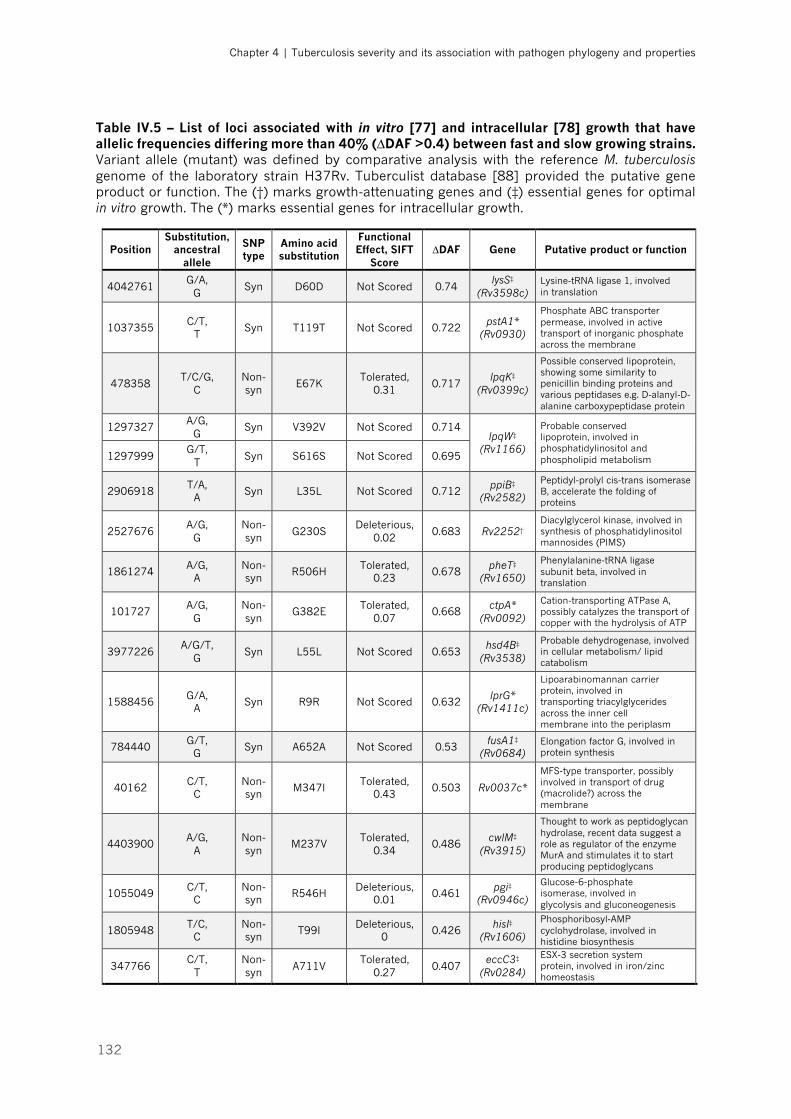
Chapter 4 | Tuberculosis severity and its association with pathogen phylogeny and properties
132
Table IV.5 – List of loci associated with in vitro [77] and intracellular [78] growth that have allelic frequencies differing more than 40% (∆DAF >0.4) between fast and slow growing strains. Variant allele (mutant) was defined by comparative analysis with the reference M. tuberculosis genome of the laboratory strain H37Rv. Tuberculist database [88] provided the putative gene product or function. The (†) marks growth-attenuating genes and (‡) essential genes for optimal in vitro growth. The (*) marks essential genes for intracellular growth.
Position Substitution,
ancestral allele
SNP type
Amino acid substitution
Functional Effect, SIFT
Score ∆DAF Gene Putative product or function
4042761 G/A,
G Syn D60D Not Scored 0.74
lysS‡ (Rv3598c)
Lysine-tRNA ligase 1, involved in translation
1037355 C/T,
T Syn T119T Not Scored 0.722
pstA1* (Rv0930)
Phosphate ABC transporter permease, involved in active transport of inorganic phosphate across the membrane
478358 T/C/G,
C Non-syn
E67K Tolerated,
0.31 0.717
lpqK‡ (Rv0399c)
Possible conserved lipoprotein, showing some similarity to penicillin binding proteins and various peptidases e.g. D-alanyl-D-alanine carboxypeptidase protein
1297327 A/G,
G Syn V392V Not Scored 0.714
lpqW‡ (Rv1166)
Probable conserved lipoprotein, involved in phosphatidylinositol and phospholipid metabolism 1297999
G/T, T
Syn S616S Not Scored 0.695
2906918 T/A,
A Syn L35L Not Scored 0.712
ppiB‡ (Rv2582)
Peptidyl-prolyl cis-trans isomerase B, accelerate the folding of proteins
2527676 A/G,
G Non-syn
G230S Deleterious,
0.02 0.683 Rv2252†
Diacylglycerol kinase, involved in synthesis of phosphatidylinositol mannosides (PIMS)
1861274 A/G,
A Non-syn
R506H Tolerated,
0.23 0.678
pheT‡ (Rv1650)
Phenylalanine-tRNA ligase subunit beta, involved in translation
101727 A/G,
G Non-syn
G382E Tolerated,
0.07 0.668
ctpA* (Rv0092)
Cation-transporting ATPase A, possibly catalyzes the transport of copper with the hydrolysis of ATP
3977226 A/G/T,
G Syn L55L Not Scored 0.653
hsd4B‡ (Rv3538)
Probable dehydrogenase, involved in cellular metabolism/ lipid catabolism
1588456 G/A,
A Syn R9R Not Scored 0.632
lprG* (Rv1411c)
Lipoarabinomannan carrier protein, involved in transporting triacylglycerides across the inner cell membrane into the periplasm
784440 G/T,
G Syn A652A Not Scored 0.53
fusA1‡ (Rv0684)
Elongation factor G, involved in protein synthesis
40162 C/T,
C Non-syn
M347I Tolerated,
0.43 0.503 Rv0037c*
MFS-type transporter, possibly involved in transport of drug (macrolide?) across the membrane
4403900 A/G,
A Non-syn
M237V Tolerated,
0.34 0.486
cwlM‡ (Rv3915)
Thought to work as peptidoglycan hydrolase, recent data suggest a role as regulator of the enzyme MurA and stimulates it to start producing peptidoglycans
1055049 C/T,
C Non-syn
R546H Deleterious,
0.01 0.461
pgi‡ (Rv0946c)
Glucose-6-phosphate isomerase, involved in glycolysis and gluconeogenesis
1805948 T/C,
C Non-syn
T99I Deleterious,
0 0.426
hisI‡ (Rv1606)
Phosphoribosyl-AMP cyclohydrolase, involved in histidine biosynthesis
347766 C/T,
T Non-syn
A711V Tolerated,
0.27 0.407
eccC3‡ (Rv0284)
ESX-3 secretion system protein, involved in iron/zinc homeostasis
Chapter 4 | Tuberculosis severity and its association with pathogen phylogeny and properties
133
DISCUSSION
We studied a population of patients between 18 and 65 years-old, without
known predictor or precipitator TB factors, diagnosed at a major hospital center
in the north of Portugal, and proposed a classification system for disease severity
taking into consideration the extension of lung involvement and baseline clinical
features. Even after excluding comorbid conditions, we still determined a normal
distribution of disease manifestations, with extreme cases of mild and severe TB
and, with the most prevalent group presenting moderate TB. This distribution was
independent of age, gender, smoking habits, duration of symptoms and drug
resistance profile of the infecting bacteria. Given the common host characteristics
between groups of severity, we investigated if the MTBC diversity was related to
the clinical heterogeneity observed.
The publication of the complete genome sequence of M. tuberculosis
H37Rv in 1998 [87] had an enormous impact in the biological studies for TB,
supporting numerous works addressing the clinical relevance of MTBC diversity
at the lineage and sublineage level [24]. Moreover, exploring the pathogen
diversity has proven important for epidemiological purposes, to monitor
predominant or emerging MTBC genotypes and their associations with TB
outbreaks, transmission clusters and drug resistance mutations acquisition. The
determination of lineages and sublineages based on SNPs provided a
phylogenetically robust classification system [30]. We used a panel of SNPs that
are mutually exclusive between different clades, allowing for a fast and cost-
effective approach. Epidemiologic data show that most of the new TB cases in the
country are Portuguese native and that immigrants comprise only 1.6 to 1.8% in
the region of Porto, where our study was based [81]. This fact accounts for the
highly homogeneous phylogeographical structure observed, with almost all
isolates belonging to Lineage 4. Though we confirmed that Lineage 4 is also
genetically diverse, the large majority of the cases were infected with strains of
sublineage LAM, which is in line with previous descriptions [31, 32]. Disease
severity was not exclusively related to any specific phylogenetic taxa within
Chapter 4 | Tuberculosis severity and its association with pathogen phylogeny and properties
134
Lineage 4 in the present study. However, this conclusion should be further
supported by the analysis of more clinical isolates, in particular of sublineages of
Lineage 4 that are less represented in the geographic area where this study was
conducted.
Our findings strongly suggest that the growth patterns of MTBC strains are
associated with differences in TB clinical severity. This heterogeneity in growth
does not seem to be lineage-specific, but we identify in these strains a number of
SNPs that might underlie the phenotypes of fast and slow growth. Whereas many
genes harbouring the SNPs were already described to be essential for optimal
growth [77, 78], we also provide new links between M. tuberculosis genotypes and
varying growth phenotypes. The majority of these genes are predicted to encode
products vital to cellular metabolism, but some still have no clear function
assigned.
Previous experimental work exploring the molecular mechanisms
underlying differential virulence of MTBC strains found differences in growth rates
[58, 91-93], that possibly modulate the level of the inflammatory response
generated by the host. In the present study, isolates from patients with mild
disease grow significantly slower in liquid media. Conversely, moderate- and
severe-associated isolates present higher growth rates, with doubling times
shorter by 4-5 h, when compared to mild-associated ones. Although growth in
liquid broth hardly reflects the much more complex infection pathogenesis in
humans, this method has already proved to be well suited to compare the growth
behaviour of different bacterial isolates [58]. The lower growth rate may be
related with the decreased virulence of these isolates, generally causing non-
cavitary lung disease and with minimal symptoms. Similar associations have
been described previously with Lineage 3, that was reported to be less
transmissible compared to other modern lineages [46] and also grows slowly in
liquid broth [91, 94, 95]. Likewise, Lineages 6 (M. africanum) exhibits slower
progression to active disease [44] and slower growth rate [58].
Strains associated to moderate TB outcomes showed a remarkably distinct
growth pattern, characterized by a longer lag phase, followed by a steep
exponential phase, that is related to a very short doubling time (around 15 h),
Chapter 4 | Tuberculosis severity and its association with pathogen phylogeny and properties
135
and finally reaching the highest plateau. The clinical relevance of this finding is
still unclear. However, several previous studies have assessed intracellular growth
of M. tuberculosis in human macrophages as a marker of virulence [96-99].
Furthermore, one study demonstrated that the Beijing-family strain 210 (Lineage
2), responsible for an outbreak in Los Angeles, grows more rapidly than small
cluster or unique cluster strains in human macrophages [100]. In fact, the
conception of “virulence” is tightly connected to the transmissibility of the
infecting strain [101, 102]. M. tuberculosis is a human-adapted obligate pathogen,
without animal or environmental reservoir, whose success lays in its ability to
transmit successfully to a new human host. In order to ensure that goal, the
bacteria have to be recognized and simultaneously survive to the host immune
microenvironment, be able to grow intracellularly, cause lung damage and to
survive the aerosolization process outside of the host [24]. So, it is possible that
the moderate-associated isolates represent the most successful group of MTBC
strains, that has evolved to interact with the immune cells and cause destructive
cavitary lung lesions, a marker of high transmissible disease [101], but only
mildly inflicting systemic deleterious effects, so that the host is able to continue
at ambulatory for enough time to keep spreading the disease.
To unveil the underlying mechanisms for the observed differences in the
growth profiles, we compared the genome sequences of fast growing (moderate)
strains with the slow growing isolates (associated to mild and severe clinical
outcome). We found variants in 1797 genomic positions. The large majority of
detected SNPs formed a cluster below ∆DAF 0.4, and only 87 SNPs in 83 genes
had allelic differences greater than 40% (∆DAF >0.4).
The top ∆DAF was found for the gene ctpF, encoding a P-type ATPase of
the plasma membrane [87], which is responsible for generating an
electrochemical gradient that is necessary for transmembrane ion transport,
possibly Mg2+ or Ca2+ [103]. Evidence suggests that this gene is upregulated
under hypoxic environment [104] and helps to protect mycobacteria against toxic
heavy-metal cation levels, as well as maintaining cell volume in hostile conditions
and nutrient transport across the cell membrane [105]. The transporter function
was overrepresented in the unbiased analysis (Figure IV.14). Future studies
Chapter 4 | Tuberculosis severity and its association with pathogen phylogeny and properties
136
regarding the functional impact of this gene to the observed phenotype will be
required. It is interesting to note that ctpF was not identified as an essential gene
for growth in previous studies [77]. This may be due to the fact that our approach
is unveiling possible gain- or loss-of-function mutations associated with growth
patterns, whereas the cited approach was based in a complete deletion mutant.
We next investigated the genes that within our 87 hits had already been
determined to affect in vitro [77] and in vivo [78] growth. Of the 16 genes
presenting ∆DAF >0.4 (Table IV.5), nine presented non-synonymous SNPs. In
particular, three gene products (Rv2252, pgi, hisI) were predicted by SIFT analysis
to be affected in their protein function. These three proteins are likely candidates
to be responsible for the observed profile of slow growing isolates. The candidates
are involved in essential biological pathways, such as protein synthesis (hisI),
cellular metabolism (pgi) and biosynthesis of cell envelope components (Rv2252).
In addition to previously characterized pathways, many genes identified in
the unbiased genome-wide analysis are conserved hypotheticals with unknown
function. Further studies now require the inclusion of more isolates and validation
of candidate hits, the study of the growth properties under other conditions, for
example, other growth media, and the growth pattern of representative isolates
in infected cells or animals. In future experiments we will also relate the growth
curves obtained in the terms of growth units to effective increase in bacterial
CFUs.
In summary, these findings suggest that genotypic diversity of MTBC must
be, at least, partially responsible for the phenotypic heterogeneity seen in clinical
presentation of TB. However, the infecting bacteria will face distinct immune
status and micro-environments in different hosts, resulting in different
interactions, which in turn contribute for different final outcomes of disease. The
identification of the pathways that are required for mycobacterial growth provide
insight into the structural and metabolic requirements of the pathogen and may
direct the rational design of effective antimicrobial agents towards new molecular
targets. This is of particular importance in the case of moderate-to-severe and
drug-resistant strains.
Chapter 4 | Tuberculosis severity and its association with pathogen phylogeny and properties
137
REFERENCES
1. World Health Organization. Global tuberculosis report 2016. Geneva: World Health Organization; 2016. 2. Houben RM, Dodd PJ. The Global Burden of Latent Tuberculosis Infection: A Re-estimation Using Mathematical Modelling. PLoS Med. 2016;13(10):e1002152. 3. Dye C, Glaziou P, Floyd K, Raviglione M. Prospects for tuberculosis elimination. Annu Rev Public Health. 2013;34:271-86. 4. Barry CE 3rd, Boshoff HI, Dartois V, Dick T, Ehrt S, Flynn J, et al. The spectrum of latent tuberculosis: rethinking the biology and intervention strategies. Nat Rev Microbiol. 2009;7(12):845-55. 5. Lin PL, Flynn JL. Understanding latent tuberculosis: a moving target. J Immunol. 2010;185:15-22. 6. Pepper T, Joseph P, Mwenya C, McKee GS, Haushalter A, Carter A, et al. Normal chest radiography in pulmonary tuberculosis: implications for obtaining respiratory specimen cultures. Int J Tuberc Lung Dis. 2008;12(4):397-403. 7. Hofmeyr A, Lau WF, Slavin MA. Mycobacterium tuberculosis infection in patients with cancer, the role of 18-fluorodeoxyglucose positron emission tomography for diagnosis and monitoring treatment response. Tuberculosis. 2007;87(5):459-63. 8. Kim IJ, Lee JS, Kim SJ, Kim YK, Jeong YJ, Jun S, et al. Double-phase 18F-FDG PET-CT for determination of pulmonary tuberculoma activity. Eur J Nucl Med Mol Imaging. 2008;35(4):808-14. 9. Park IN, Ryu JS, Shim TS. Evaluation of therapeutic response of tuberculoma using F-18 FDG positron emission tomography. Clin Nucl Med. 2008;33(1):1-3. 10. Esmail H, Lai RP, Lesosky M, Wilkinson KA, Graham CM, Coussens AK, et al. Characterization of progressive HIV-associated tuberculosis using 2-deoxy-2-[18F]fluoro-D-glucose positron emission and computed tomography. Nat Med. 2016;22(10):1090-3. 11. Chan J, Flynn J. The immunological aspects of latency in tuberculosis. Clin Immunol. 2004;110(1):2-12. 12. Vandiviere HM, Loring WE, Melvin I, Willis S. The treated pulmonary lesion and its tubercle bacillus. II. The death and resurrection. Am J Med Sci. 1956;232(1):30-7. 13. Lin PL, Rodgers M, Smith L, Bigbee M, Myers A, Bigbee C, et al. Quantitative comparison of active and latent tuberculosis in the cynomolgus macaque model. Infect Immun. 2009;77(10):4631-42. 14. Berry MP, Graham CM, McNab FW, Xu Z, Bloch SA, Oni T, et al. An interferon-inducible neutrophil-driven blood transcriptional signature in human tuberculosis. Nature. 2010;466(7309):973-7. 15. Weiner J 3rd, Parida SK, Maertzdorf J, Black GF, Repsilber D, Telaar A, et al. Biomarkers of inflammation, immunosuppression and stress with active disease are revealed by metabolomic profiling of tuberculosis patients. PLoS One. 2012;7(7):e40221. 16. Kaforou M, Wright VJ, Oni T, French N, Anderson ST, Bangani N, et al. Detection of tuberculosis in HIV-infected and -uninfected African adults using whole blood RNA expression signatures: a case-control study. PLoS Med. 2013;10(10):e1001538. 17. Lin PL, Ford CB, Coleman MT, Myers AJ, Gawande R, Ioerger T, et al. Sterilization of granulomas is common in active and latent tuberculosis despite within-host variability in bacterial killing. Nat Med. 2014;20(1):75-9. 18. Esmail H, Barry CE 3rd, Young DB, Wilkinson RJ. The ongoing challenge of latent tuberculosis. Philos Trans R Soc Lond B Biol Sci. 2014;369(1645):20130437. 19. Eldholm V, Norheim G, von der Lippe B, Kinander W, Dahle UR, Caugant DA, et al. Evolution of extensively drug-resistant Mycobacterium tuberculosis from a susceptible ancestor in a single patient. Genome Biol. 2014;15(11):490. 20. David HL. Probability distribution of drug-resistant mutants in unselected populations of Mycobacterium tuberculosis. Appl Microbiol. 1970;20(5):810-4.
Chapter 4 | Tuberculosis severity and its association with pathogen phylogeny and properties
138
21. Ford CB, Lin PL, Chase MR, Shah RR, Iartchouk O, Galagan J, et al. Use of whole genome sequencing to estimate the mutation rate of Mycobacterium tuberculosis during latent infection. Nat Genet. 2011;43(5):482-6. 22. Gagneux S, DeRiemer K, Van T, Kato-Maeda M, de Jong BC, Narayanan S, et al. Variable host-pathogen compatibility in Mycobacterium tuberculosis. Proc Natl Acad Sci U S A. 2006;103(8):2869-73. 23. Firdessa R, Berg S, Hailu E, Schelling E, Gumi B, Erenso G, et al. Mycobacterial lineages causing pulmonary and extrapulmonary tuberculosis, Ethiopia. Emerg Infect Dis. 2013;19(3):460-3. 24. Coscolla M, Gagneux S. Consequences of genomic diversity in Mycobacterium tuberculosis. Semin Immunol. 2014;26(6):431-44. 25. Hirsh AE, Tsolaki AG, DeRiemer K, Feldman MW, Small PM. Stable association between strains of Mycobacterium tuberculosis and their human host populations. Proc Natl Acad Sci USA. 2004;101(14):4871–6. 26. Baker L, Brown T, Maiden MC, Drobniewski F. Silent nucleotide polymorphisms and a phylogeny for Mycobacterium tuberculosis. Emerg Infect Dis. 2004;10:1568–77. 27. Reed MB, Pichler VK, McIntosh F, Mattia A, Fallow A, Masala S, et al. Major Mycobacterium tuberculosis Lineages Associate with Patient Country of Origin. J Clin Microbiol. 2009;47(4):1119–28. 28. Gagneux S. Host–pathogen coevolution in human tuberculosis. Phil Trans R Soc B. 2012;367(1590):850–9. 29. Fenner L, Egger M, Bodmer T, Furrer H, Ballif M, Battegay M, et al. HIV Infection Disrupts the Sympatric Host–Pathogen Relationship in Human Tuberculosis. PLoS Genet. 2013;9(3):e1003318. 30. Comas I, Homolka S, Niemann S, Gagneux S. Genotyping of genetically monomorphic bacteria: DNA sequencing in Mycobacterium tuberculosis highlights the limitations of current methodologies. Plos One. 2009;4:e7815. 31. Lopes JS, Marques I, Soares P, Nebenzahl-Guimaraes H, Costa J, Miranda A, et al. SNP typing reveals similarity in Mycobacterium tuberculosis genetic diversity between Portugal and Northeast Brazil. Infect Genet Evol. 2013;18:238-46. 32. Stucki D, Brites D, Jeljeli L, Coscolla M, Liu Q, Trauner A, et al. Mycobacterium tuberculosis lineage 4 comprises globally distributed and geographically restricted sublineages. Nat Genet. 2016;48(12):1535-43. 33. Caws M, Thwaites G, Dunstan S, Hawn TR, Lan NT, Thuong NT, et al. The influence of host and bacterial genotype on the development of disseminated disease with Mycobacterium tuberculosis. PLoS Pathog. 2008;4(3):e1000034. 34. Kong Y, Cave MD, Zhang L, Foxman B, Marrs CF, Bates JH, et al. Association between Mycobacterium tuberculosis Beijing/W lineage strain infection and extrathoracic tuberculosis: Insights from epidemiologic and clinical characterization of the three principal genetic groups of M. tuberculosis clinical isolates. J Clin Microbiol. 2007;45(2):409-14. 35. Kong Y, Cave MD, Yang D, Zhang L, Marrs CF, Foxman B, et al. Distribution of insertion- and deletion-associated genetic polymorphisms among four Mycobacterium tuberculosis phospholipase C genes and associations with extrathoracic tuberculosis: a population-based study. J Clin Microbiol. 2005;43(12):6048-53. 36. Lari N, Rindi L, Cristofani R, Rastogi N, Tortoli E, Garzelli C. Association of Mycobacterium tuberculosis complex isolates of M. bovis and Central Asian (CAS) genotypic lineages with extrapulmonary disease. Clin Microbiol Infect. 2009;15(6):538-43. 37. Stavrum R, PrayGod G, Range N, Faurholt-Jepsen D, Jeremiah K, Faurholt-Jepsen M, et al. Increased level of acute phase reactants in patients infected with modern Mycobacterium tuberculosis genotypes in Mwanza, Tanzania. BMC Infect Dis. 2014;14:309. 38. Parwati I, Alisjahbana B, Apriani L, Soetikno RD, Ottenhoff TH, van der Zanden AG, et al. Mycobacterium tuberculosis Beijing genotype is an independent risk factor for tuberculosis treatment failure in Indonesia. J Infect Dis. 2010;201(4):553-7. 39. Lan NT, Lien HT, Tung le B, Borgdorff MW, Kremer K, van Soolingen D. Mycobacterium tuberculosis Beijing genotype and risk for treatment failure and relapse, Vietnam. Emerg Infect Dis. 2003;9(12):1633-5.
Chapter 4 | Tuberculosis severity and its association with pathogen phylogeny and properties
139
40. Sun YJ, Lee AS, Wong SY, Paton NI. Association of Mycobacterium tuberculosis Beijing genotype with tuberculosis relapse in Singapore. Epidemiol Infect. 2006;134(2):329-32. 41. Ford CB, Shah RR, Maeda MK, Gagneux S, Murray MB, Cohen T, et al. Mycobacterium tuberculosis mutation rate estimates from different lineages predict substantial differences in the emergence of drug-resistant tuberculosis. Nat Genet. 2013;45(7):784-90. 42. Wollenberg KR, Desjardins CA, Zalutskaya A, Slodovnikova V, Oler AJ, Quiñones M, et al. Whole genome sequencing of Mycobacterium tuberculosis provides insight into the evolution and genetic composition of drug-resistant tuberculosis in Belarus. J Clin Microbiol. 2016. Epub Nov 30. doi: 10.1128/JCM.02116-16. 43. Gurjav U, Erkhembayar B, Burneebaatar B, Narmandakh E, Tumenbayar O, Hill-Cawthorne GA, et al. Transmission of multi-drug resistant tuberculosis in Mongolia is driven by Beijing strains of Mycobacterium tuberculosis resistant to all first-line drugs. Tuberculosis. 2016;101:49-53. 44. de Jong BC, Hill PC, Aiken A, Awine T, Antonio M, Adetifa IM, et al. Progression to active tuberculosis, but not transmission, varies by Mycobacterium tuberculosis lineage in The Gambia. J Infect Dis. 2008;198(7):1037–43. 45. Kato-Maeda M, Kim EY, Flores L, Jarlsberg LG, Osmond D, Hopewell PC. Differences among sublineages of the East-Asian lineage of Mycobacterium tuberculosis in genotypic clustering. Int J Tuberc Lung Dis. 2010;14(5):538-44. 46. Albanna AS, Reed MB, Kotar KV, Fallow A, McIntosh FA, Behr MA, et al. Reduced transmissibility of East African Indian strains of Mycobacterium tuberculosis. PLoS One. 2011;6(9):e25075. 47. Gehre F, Antonio M, Faïhun F, Odoun M, Uwizeye C, de Rijk P, et al. The first phylogeographic population structure and analysis of transmission dynamics of M. africanum West African 1--combining molecular data from Benin, Nigeria and Sierra Leone. PLoS One. 2013;8(10):e77000. 48. Bastos HN, Osório NS, Castro AG, Ramos A, Carvalho T, Meira L, et al. A prediction rule to stratify mortality risk of patients with pulmonary tuberculosis. PLoS One. 2016;11(9):e0162797. 49. Dheda K, Barry CE 3rd, Maartens G. Tuberculosis. Lancet. 2016;387(10024):1211-26. 50. World Health Organization. Guidelines for treatment of tuberculosis - 4rd edition Geneva: World Health Organization; 2010. 51. Wang JY, Hsueh PR, Wang SK, Jan IS, Lee LN, Liaw YS, et al. Disseminated tuberculosis: a 10-year experience in a medical center. Medicine. 2007;86(1):39-46. 52. Yew WW, Lee J. Pathogenesis of cervical tuberculous lymphadenitis: pathways to anatomic localization. Tuber Lung Dis. 1995;76:275-6. 53. Alisjahbana B, Sahiratmadja E, Nelwan EJ, Purwa AM, Ahmad Y, Ottenhoff TH, et al. The effect of type 2 diabetes mellitus on the presentation and treatment response of pulmonary tuberculosis. Clin Infect Dis. 2007;45(4):428-35. 54. Falk A, O’Connor JB. Diagnosis Standards and Classification of Tuberculosis. Association NTaRD, editor: eds Falk, A. et al; 1969. 55. Käser M, Ruf MT, Hauser J, Marsollier L, Pluschke G. Optimized method for preparation of DNA from pathogenic and environmental mycobacteria. Appl Environ Microbiol. 2009;75(2):414-8. 56. Stucki D, Malla B, Hostettler S, Huna T, Feldmann J, Yeboah-Manu D, et al. Two new rapid SNP-typing methods for classifying Mycobacterium tuberculosis complex into the main phylogenetic lineages. PLoS One. 2012;7:e41253. 57. Life Technologies. TaqMan® SNP Genotyping Assays. 2011 [Jan 30th 2017]. Available from: http://tools.lifetechnologies.com/content/sfs/brochures/cms_040597.pdf. 58. Gehre F, Otu J, DeRiemer K, de Sessions PF, Hibberd ML, Mulders W, et al. Deciphering the growth behaviour of Mycobacterium africanum. PLoS Negl Trop Dis. 2013;7(5):e2220. 59. Hillemann D, Richter E, Rüsch-Gerdes S. Use of the BACTEC Mycobacteria Growth Indicator Tube 960 automated system for recovery of Mycobacteria from 9,558 extrapulmonary specimens, including urine samples. J Clin Microbiol. 2006;44(11):4014-7. 60. Coultas MK, Hutchison DJ. Metabolism of resistant mutants of Streptococcus faecalis. IV. Use of a biophotometer in growth-curve studies. J Bacteriol. 1962;84:393-401. 61. GraphPad Software Inc. Curve fitting with Prism 6. Equation: Exponential growth 2015. Available from: http://www.graphpad.com/guides/prism/6/curve-fitting/index.htm?reg_exponential_growth.htm.
Chapter 4 | Tuberculosis severity and its association with pathogen phylogeny and properties
140
62. Andrews S. FastQC: A Quality Control tool for High Throughput Sequence Data 2010. Available from: http://www.bioinformatics.babraham.ac.uk/projects/fastqc. 63. Bolger AM, Lohse M, Usadel B. Trimmomatic: a flexible trimmer for Illumina sequence data. Bioinformatics. 2014;30(15):2114–20. 64. Comas I, Chakravartti J, Small PM, Galagan J, Niemann S, Kremer K, et al. Human T cell epitopes of Mycobacterium tuberculosis are evolutionarily hyperconserved. Nat Genet. 2010;42:498-503. 65. Cole ST, Barrell BG. Analysis of the genome of Mycobacterium tuberculosis H37Rv. Novartis Found Symp. 1998;217:160-77. 66. Bifani P, Moghazeh S, Shopsin B, Driscoll J, Ravikovitch A, Kreiswirth BN. Molecular Characterization of Mycobacterium tuberculosis H37Rv/Ra Variants: Distinguishing the Mycobacterial Laboratory Strain. J Clin Microbiol. 2000;38(9):3200–4. 67. Kearse M, Moir R, Wilson A, Stones-Havas S, Sturrock S, Buxton S, et al. Geneious Basic: An integrated and extendable desktop software platform for the organization and analysis of sequence data. Bioinformatics. 2012;28(12):1647–9. 68. Li H, Durbin R. Fast and accurate short read alignment with Burrows-Wheeler transform. Bioinformatics. 2009;25(14):1754–60. 69. Li H, Handsaker B, Wysoker A, Fennell T, Ruan J, Homer N, et al. The Sequence Alignment/Map format and SAMtools. Bioinformatics. 2009;25(16):2078-9. 70. Koboldt DC, Chen K, Wylie T, Larson DE, McLellan MD, Mardis ER, et al. VarScan: variant detection in massively parallel sequencing of individual and pooled samples. Bioinformatics. 2009;25(17):2283-5. 71. Koboldt DC, Zhang Q, Larson DE, Shen D, McLellan MD, Lin L, et al. VarScan 2: somatic mutation and copy number alteration discovery in cancer by exome sequencing. Genome Res. 2012;22(3):568-76. 72. McEvoy CR, Cloete R, Müller B, Schürch AC, van Helden PD, Gagneux S, et al. Comparative analysis of Mycobacterium tuberculosis pe and ppe genes reveals high sequence variation and an apparent absence of selective constraints. PLoS One. 2012;7(4):e30593. 73. Stamatakis A. RAxML Version 8: A tool for phylogenetic analysis and post-analysis of large phylogenies. Bioinformatics. 2014;30(9):1312-3. 74. Coll F, McNerney R, Guerra-Assunção JA, Glynn JR, Perdigão J, Viveiros M, et al. A robust SNP barcode for typing Mycobacterium tuberculosis complex strains. Nat Commun. 2014;5:4812. 75. Kumar P, Henikoff S, Ng PC. Predicting the effects of coding non-synonymous variants on protein function using the SIFT algorithm. Nat Protoc. 2009;4(7):1073-81. 76. Sim NL, Kumar P, Hu J, Henikoff S, Schneider G, Ng PC. SIFT web server: predicting effects of amino acid substitutions on proteins. Nucleic Acids Res. 2012;40(Web Server issue):W452-7. 77. Sassetti CM, Boyd DH, Rubin EJ. Genes required for mycobacterial growth defined by high density mutagenesis. Mol Microbiol. 2003;48(1):77-84. 78. Rengarajan J, Bloom BR, Rubin EJ. Genome-wide requirements for Mycobacterium tuberculosis adaptation and survival in macrophages. Proc Natl Acad Sci U S A. 2005;102(23):8327-32. 79. Mi H, Huang X, Muruganujan A, Tang H, Mills C, Kang D, et al. PANTHER version 11: expanded annotation data from Gene Ontology and Reactome pathways, and data analysis tool enhancements. Nucleic Acids Res. 2017;45(D1):D183-D9. 80. Mi H, Muruganujan A, Casagrande JT, Thomas PD. Large-scale gene function analysis with the PANTHER classification system. Nat Protoc. 2013;8(8):1551-66. 81. Franco I, Sousa P, Gomes M, Oliveira A, Gaio AR, Duarte R. Social profile of the highest tuberculosis incidence areas in Portugal. Rev Port Pneumol. 2016;22(1):50-2. 82. Schürch AC, van Soolingen. DNA fingerprinting of Mycobacterium tuberculosis: From phage typing to whole-genome sequencing. D Infect Genet Evol. 2012;12:602–9. 83. Flores L, Van T, Narayanan S, DeRiemer K, Kato-Maeda M, Gagneux S. Large sequence polymorphisms classify Mycobacterium tuberculosis strains with ancestral spoligotyping patterns. J Clin Microbiol. 2007;45(10):3393-5. 84. Ben Shabat M, Mikula I, Gerchman I, Lysnyansky I. Development and evaluation of a novel single-nucleotide-polymorphism real-time PCR assay for rapid detection of fluoroquinolone-resistant Mycoplasma bovis. J Clin Microbiol. 2010;48(8):2909-15.

Chapter 4 | Tuberculosis severity and its association with pathogen phylogeny and properties
141
85. Domenech P, Reed MB. Rapid and spontaneous loss of phthiocerol dimycocerosate (PDIM) from Mycobacterium tuberculosis grown in vitro: implications for virulence studies. Microbiology. 2009;155(Pt 11):3532-43. 86. von Groll A, Martin A, Portaels F, da Silva PE, Palomino JC. Growth kinetics of Mycobacterium tuberculosis measured by quantitative resazurin reduction assay: a tool for fitness studies. Braz J Microbiol. 2010;41(2):300-3. 87. Cole ST, Brosch R, Parkhill J, Garnier T, Churcher C, Harris D, et al. Deciphering the biology of Mycobacterium tuberculosis from the complete genome sequence. Nature. 1998;393(6685):537-44. 88. Lew JM, Kapopoulou A, Jones LM, Cole ST. TubercuList – 10 years after. Tuberculosis. 2011;91(1):1–7. 89. Wooff E, Michell SL, Gordon SV, Chambers MA, Bardarov S, Jacobs WR Jr, et al. Functional genomics reveals the sole sulphate transporter of the Mycobacterium tuberculosis complex and its relevance to the acquisition of sulphur in vivo. Mol Microbiol. 2002;43(3):653-63. 90. Li W, Xin Y, McNeil MR, Ma Y. rmlB and rmlC genes are essential for growth of mycobacteria. Biochem Biophys Res Commun. 2006;342(1):170-8. 91. Sarkar R, Lenders L, Wilkinson KA, Wilkinson RJ, Nicol MP. Modern lineages of Mycobacterium tuberculosis exhibit lineage-specific patterns of growth and cytokine induction in human monocyte-derived macrophages. PLoS One. 2012;7(8):e43170. 92. Homolka S, Niemann S, Russell DG, Rohde KH. Functional genetic diversity among Mycobacterium tuberculosis complex clinical isolates: delineation of conserved core and lineage-specific transcriptomes during intracellular survival. PLoS Pathog. 2010;6(7):e1000988. 93. Krishnan N, Malaga W, Constant P, Caws M, Tran TH, Salmons J, et al. Mycobacterium tuberculosis lineage influences innate immune response and virulence and is associated with distinct cell envelope lipid profiles. PLoS One. 2011;6(9):e23870. 94. Tanveer M, Hasan Z, Kanji A, Hussain R, Hasan R. Reduced TNF-alpha and IFN-gamma responses to Central Asian strain 1 and Beijing isolates of Mycobacterium tuberculosis in comparison with H37Rv strain. Trans R Soc Trop Med Hyg. 2009;103(6):581-7. 95. Newton SM, Smith RJ, Wilkinson KA, Nicol MP, Garton NJ, Staples KJ, et al. A deletion defining a common Asian lineage of Mycobacterium tuberculosis associates with immune subversion. Proc Natl Acad Sci U S A. 2006;103(42):15594-8. 96. Li Q, Whalen CC, Albert JM, Larkin R, Zukowski L, Cave MD, et al. Differences in rate and variability of intracellular growth of a panel of Mycobacterium tuberculosis clinical isolates within a human monocyte model. Infect Immun. 2002;70(11):6489-93. 97. Zhang M, Gong J, Yang Z, Samten B, Cave MD, Barnes PF. Enhanced capacity of a widespread strain of Mycobacterium tuberculosis to grow in human macrophages. J Infect Dis. 1999;179(5):1213–7. 98. Hoal-van Helden EG, Hon D, Lewis LA, Beyers N, van Helden PD. Mycobacterial growth in human macrophages: variation according to donor, inoculum and bacterial strain. Cell Biol Int. 2001;25(1):71-81. 99. Wong KC, Leong WM, Law HK, Ip KF, Lam JT, Yuen KY, et al. Molecular characterization of clinical isolates of Mycobacterium tuberculosis and their association with phenotypic virulence in human macrophages. Clin Vaccine Immunol. 2007;14(10):1279-84. 100. Theus SA, Cave MD, Eisenach KD. Intracellular macrophage growth rates and cytokine profiles of Mycobacterium tuberculosis strains with different transmission dynamics. J Infect Dis. 2005;191(3):453-60. 101. Rodrigo T, Caylà JA, García de Olalla P, Galdós-Tangüis H, Jansà JM, Miranda P, et al. Characteristics of tuberculosis patients who generate secondary cases. Int J Tuberc Lung Dis. 1997;1(4):352-7. 102. Brites D, Gagneux S. Old and new selective pressures on Mycobacterium tuberculosis. Infect Genet Evol. 2012;12(4):678-85. 103. Agranoff D, Krishna S. Metal ion transport and regulation in Mycobacterium tuberculosis. Front Biosci. 2004;9:2996-3006. 104. Pulido PA, Novoa-Aponte L, Villamil N, Soto CY. The DosR dormancy regulator of Mycobacterium tuberculosis stimulates the Na(+)/K (+) and Ca (2+) ATPase activities in plasma membrane vesicles of mycobacteria. Curr Microbiol. 2014;69(5):604-10.

Chapter 4 | Tuberculosis severity and its association with pathogen phylogeny and properties
142
105. Ayala-Torres C, Novoa-Aponte L, Soto CY. Pma1 is an alkali/alkaline earth metal cation ATPase that preferentially transports Na(+) and K(+) across the Mycobacterium smegmatis plasma membrane. Microbiol Res. 2015;176:1-6.
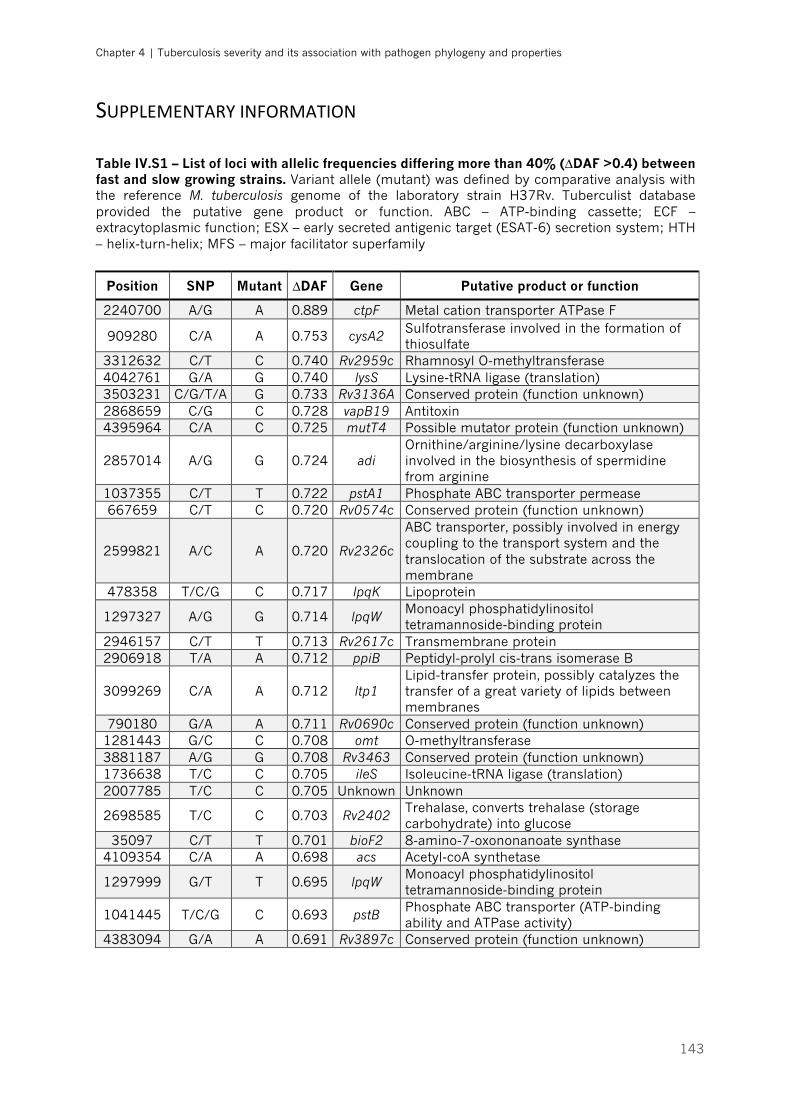
Chapter 4 | Tuberculosis severity and its association with pathogen phylogeny and properties
143
SUPPLEMENTARYINFORMATION Table IV.S1 – List of loci with allelic frequencies differing more than 40% (∆DAF >0.4) between fast and slow growing strains. Variant allele (mutant) was defined by comparative analysis with the reference M. tuberculosis genome of the laboratory strain H37Rv. Tuberculist database provided the putative gene product or function. ABC – ATP-binding cassette; ECF – extracytoplasmic function; ESX – early secreted antigenic target (ESAT-6) secretion system; HTH – helix-turn-helix; MFS – major facilitator superfamily
Position SNP Mutant ∆DAF Gene Putative product or function
2240700 A/G A 0.889 ctpF Metal cation transporter ATPase F
909280 C/A A 0.753 cysA2 Sulfotransferase involved in the formation of thiosulfate
3312632 C/T C 0.740 Rv2959c Rhamnosyl O-methyltransferase 4042761 G/A G 0.740 lysS Lysine-tRNA ligase (translation) 3503231 C/G/T/A G 0.733 Rv3136A Conserved protein (function unknown) 2868659 C/G C 0.728 vapB19 Antitoxin 4395964 C/A C 0.725 mutT4 Possible mutator protein (function unknown)
2857014 A/G G 0.724 adi Ornithine/arginine/lysine decarboxylase involved in the biosynthesis of spermidine from arginine
1037355 C/T T 0.722 pstA1 Phosphate ABC transporter permease 667659 C/T C 0.720 Rv0574c Conserved protein (function unknown)
2599821 A/C A 0.720 Rv2326c
ABC transporter, possibly involved in energy coupling to the transport system and the translocation of the substrate across the membrane
478358 T/C/G C 0.717 lpqK Lipoprotein
1297327 A/G G 0.714 lpqW Monoacyl phosphatidylinositol tetramannoside-binding protein
2946157 C/T T 0.713 Rv2617c Transmembrane protein 2906918 T/A A 0.712 ppiB Peptidyl-prolyl cis-trans isomerase B
3099269 C/A A 0.712 ltp1 Lipid-transfer protein, possibly catalyzes the transfer of a great variety of lipids between membranes
790180 G/A A 0.711 Rv0690c Conserved protein (function unknown) 1281443 G/C C 0.708 omt O-methyltransferase 3881187 A/G G 0.708 Rv3463 Conserved protein (function unknown) 1736638 T/C C 0.705 ileS Isoleucine-tRNA ligase (translation) 2007785 T/C C 0.705 Unknown Unknown
2698585 T/C C 0.703 Rv2402 Trehalase, converts trehalase (storage carbohydrate) into glucose
35097 C/T T 0.701 bioF2 8-amino-7-oxononanoate synthase 4109354 C/A A 0.698 acs Acetyl-coA synthetase
1297999 G/T T 0.695 lpqW Monoacyl phosphatidylinositol tetramannoside-binding protein
1041445 T/C/G C 0.693 pstB Phosphate ABC transporter (ATP-binding ability and ATPase activity)
4383094 G/A A 0.691 Rv3897c Conserved protein (function unknown)
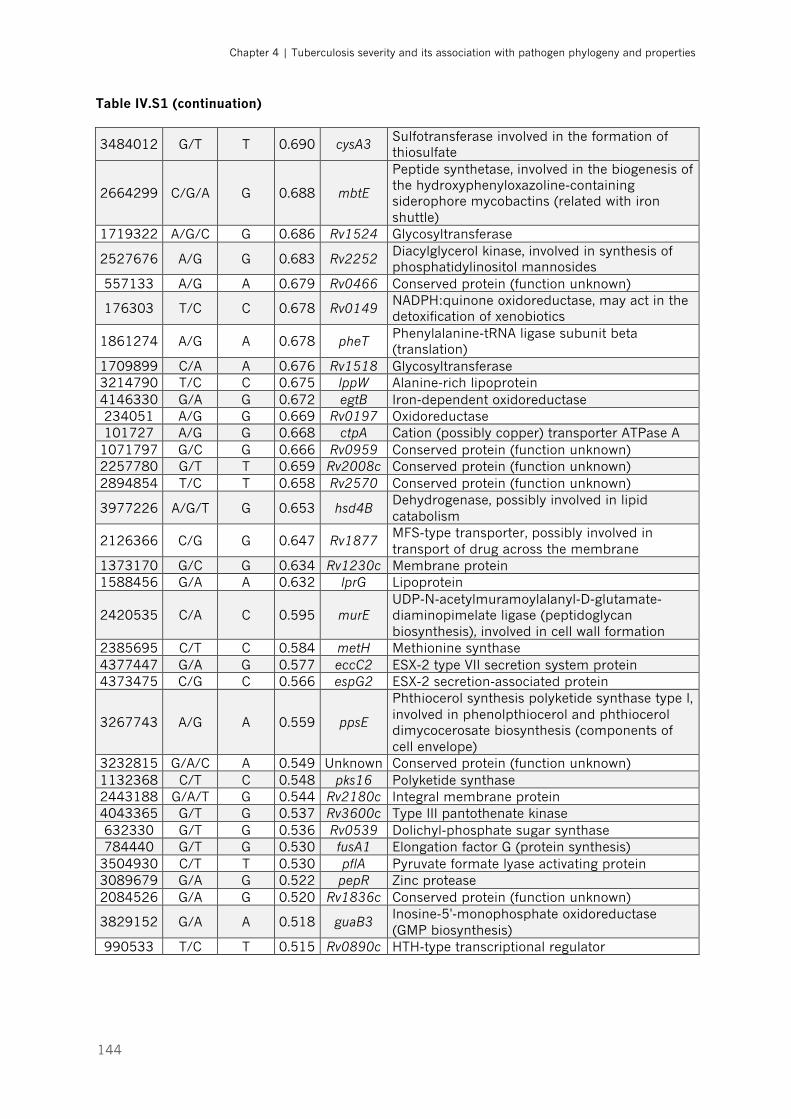
Chapter 4 | Tuberculosis severity and its association with pathogen phylogeny and properties
144
Table IV.S1 (continuation)
3484012 G/T T 0.690 cysA3 Sulfotransferase involved in the formation of thiosulfate
2664299 C/G/A G 0.688 mbtE
Peptide synthetase, involved in the biogenesis of the hydroxyphenyloxazoline-containing siderophore mycobactins (related with iron shuttle)
1719322 A/G/C G 0.686 Rv1524 Glycosyltransferase
2527676 A/G G 0.683 Rv2252 Diacylglycerol kinase, involved in synthesis of phosphatidylinositol mannosides
557133 A/G A 0.679 Rv0466 Conserved protein (function unknown)
176303 T/C C 0.678 Rv0149 NADPH:quinone oxidoreductase, may act in the detoxification of xenobiotics
1861274 A/G A 0.678 pheT Phenylalanine-tRNA ligase subunit beta (translation)
1709899 C/A A 0.676 Rv1518 Glycosyltransferase 3214790 T/C C 0.675 lppW Alanine-rich lipoprotein 4146330 G/A G 0.672 egtB Iron-dependent oxidoreductase 234051 A/G G 0.669 Rv0197 Oxidoreductase 101727 A/G G 0.668 ctpA Cation (possibly copper) transporter ATPase A
1071797 G/C G 0.666 Rv0959 Conserved protein (function unknown) 2257780 G/T T 0.659 Rv2008c Conserved protein (function unknown) 2894854 T/C T 0.658 Rv2570 Conserved protein (function unknown)
3977226 A/G/T G 0.653 hsd4B Dehydrogenase, possibly involved in lipid catabolism
2126366 C/G G 0.647 Rv1877 MFS-type transporter, possibly involved in transport of drug across the membrane
1373170 G/C G 0.634 Rv1230c Membrane protein 1588456 G/A A 0.632 lprG Lipoprotein
2420535 C/A C 0.595 murE UDP-N-acetylmuramoylalanyl-D-glutamate-diaminopimelate ligase (peptidoglycan biosynthesis), involved in cell wall formation
2385695 C/T C 0.584 metH Methionine synthase 4377447 G/A G 0.577 eccC2 ESX-2 type VII secretion system protein 4373475 C/G C 0.566 espG2 ESX-2 secretion-associated protein
3267743 A/G A 0.559 ppsE
Phthiocerol synthesis polyketide synthase type I, involved in phenolpthiocerol and phthiocerol dimycocerosate biosynthesis (components of cell envelope)
3232815 G/A/C A 0.549 Unknown Conserved protein (function unknown) 1132368 C/T C 0.548 pks16 Polyketide synthase 2443188 G/A/T G 0.544 Rv2180c Integral membrane protein 4043365 G/T G 0.537 Rv3600c Type III pantothenate kinase 632330 G/T G 0.536 Rv0539 Dolichyl-phosphate sugar synthase 784440 G/T G 0.530 fusA1 Elongation factor G (protein synthesis)
3504930 C/T T 0.530 pflA Pyruvate formate lyase activating protein 3089679 G/A G 0.522 pepR Zinc protease 2084526 G/A G 0.520 Rv1836c Conserved protein (function unknown)
3829152 G/A A 0.518 guaB3 Inosine-5'-monophosphate oxidoreductase (GMP biosynthesis)
990533 T/C T 0.515 Rv0890c HTH-type transcriptional regulator
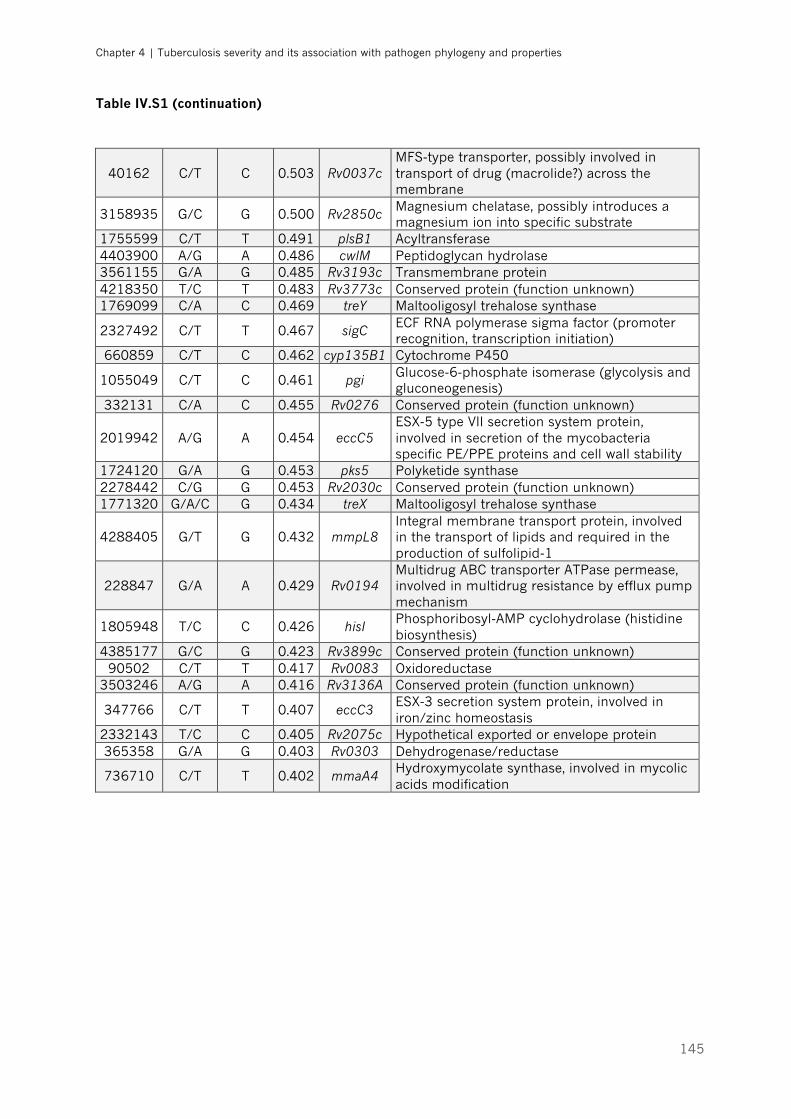
Chapter 4 | Tuberculosis severity and its association with pathogen phylogeny and properties
145
Table IV.S1 (continuation)
40162 C/T C 0.503 Rv0037c MFS-type transporter, possibly involved in transport of drug (macrolide?) across the membrane
3158935 G/C G 0.500 Rv2850c Magnesium chelatase, possibly introduces a magnesium ion into specific substrate
1755599 C/T T 0.491 plsB1 Acyltransferase 4403900 A/G A 0.486 cwlM Peptidoglycan hydrolase 3561155 G/A G 0.485 Rv3193c Transmembrane protein 4218350 T/C T 0.483 Rv3773c Conserved protein (function unknown) 1769099 C/A C 0.469 treY Maltooligosyl trehalose synthase
2327492 C/T T 0.467 sigC ECF RNA polymerase sigma factor (promoter recognition, transcription initiation)
660859 C/T C 0.462 cyp135B1 Cytochrome P450
1055049 C/T C 0.461 pgi Glucose-6-phosphate isomerase (glycolysis and gluconeogenesis)
332131 C/A C 0.455 Rv0276 Conserved protein (function unknown)
2019942 A/G A 0.454 eccC5 ESX-5 type VII secretion system protein, involved in secretion of the mycobacteria specific PE/PPE proteins and cell wall stability
1724120 G/A G 0.453 pks5 Polyketide synthase 2278442 C/G G 0.453 Rv2030c Conserved protein (function unknown) 1771320 G/A/C G 0.434 treX Maltooligosyl trehalose synthase
4288405 G/T G 0.432 mmpL8 Integral membrane transport protein, involved in the transport of lipids and required in the production of sulfolipid-1
228847 G/A A 0.429 Rv0194 Multidrug ABC transporter ATPase permease, involved in multidrug resistance by efflux pump mechanism
1805948 T/C C 0.426 hisI Phosphoribosyl-AMP cyclohydrolase (histidine biosynthesis)
4385177 G/C G 0.423 Rv3899c Conserved protein (function unknown) 90502 C/T T 0.417 Rv0083 Oxidoreductase
3503246 A/G A 0.416 Rv3136A Conserved protein (function unknown)
347766 C/T T 0.407 eccC3 ESX-3 secretion system protein, involved in iron/zinc homeostasis
2332143 T/C C 0.405 Rv2075c Hypothetical exported or envelope protein 365358 G/A G 0.403 Rv0303 Dehydrogenase/reductase
736710 C/T T 0.402 mmaA4 Hydroxymycolate synthase, involved in mycolic acids modification

146
147
CHAPTER 5 – HOST AND BACTERIAL
MODULATION OF THE PROTECTIVE IL-1
RECEPTOR SIGNALING IN TB ____________________________________________________________
148
The results presented in this chapter were published:
(i) in conferences
2016 Annual Meeting of the SPI (Sociedade Portugusa de Imunologia), "Immunity,
from cells to organisms" | Instituto Gulbenkian de Ciências (Oeiras), 1-3 June 2016
and
Tuberculosis 2016 EMBO Conference, "Interdisciplinary research on tuberculosis
and pathogenic mycobacteria" | Institut Pasteur (Paris), 19-23 September 2016
Host and Mycobacterium tuberculosis determinants of immune cells activation
(Poster presentation) | Authors: Jeremy Sousa*, Helder Novais e Bastos*, Nuno S. Osório, Maria
Isabel Veiga, Henrique Machado, Filipa Cardoso, Joana Gaifem, Angélica Ramos, Teresa Carvalho,
Jorge Vieira, Cristina Vieira, Fernando Rodrigues, João Tiago Guimarães, António Gil Castro, Margarida
Saraiva
Keystone Symposia 2017, "New Developments in Our Basic Understanding of
Tuberculosis"| Fairmont Hotel, Vancouver, 14-18 January 2017
Impact of host and Mycobacterium tuberculosis molecular determinants of immune
cells activation to the outcome of disease| Authors: Jeremy Sousa*, Helder Novais e Bastos*,
Nuno S. Osório, Maria Isabel Veiga, Henrique Machado, Filipa Cardoso, Joana Gaifem, Angélica Ramos,
Teresa Carvalho, Jorge Vieira, Cristina Vieira, Fernando Rodrigues, João Tiago Guimarães, António Gil
Castro, Margarida Saraiva
(*equal contributions)
Chapter 5 | Host and bacterial modulation of the protective IL-1 receptor signaling in TB
149
ABSTRACT
A striking feature of tuberculosis (TB) is the variability of disease outcomes,
including pathogen clearance, latency establishment and active disease. Immune
imbalances clearly contribute to this heterogeneity, assuming a rising importance
as therapeutic targets. Several studies show a central role of the cross-talk
between host and bacteria in defining the immune response and the outcome of
disease. To underpin the molecular mechanisms regulating this cross-talk and its
impact in immunity, we are studying a cohort of TB patients, showing different
severity of disease at presentation. Sixteen Mycobacterium tuberculosis clinical
isolates associated with different clinical severity of TB were selected and PBMCs
from non-treated/non-recent latent TB infected (LTBI) donors or past/cured TB
patients infected. Cytokine production by the infected cells was then measured.
Independently of the host genetics, we identified two distinct groups of M.
tuberculosis isolates: high versus low inflammatory triggers. Furthermore, we
report that PBMCs from past TB patients produced less IL-1β than those from
LTBI participants in response to a variety of isolates, whereas the opposite was
observed for IL-1RA. LTBI subjects elicited responses with significantly higher IL-
1β/IL-1RA ratios than those from TB patients. Our findings suggest that infected
hosts producing elevated IL-1β/IL-1RA ratio may be protected from active
disease, offering a platform to predict those individuals in higher risk of latent to
active TB transition.
Chapter 5 | Host and bacterial modulation of the protective IL-1 receptor signaling in TB
150
INTRODUCTION
Tuberculosis (TB) still imposes high morbidity and mortality burdens in
the developing world, with nearly 10.4 million new cases occurring worldwide and
approximately 1.8 million deaths every year, making Mycobacterium tuberculosis
one of the most lethal infectious agents of the history of mankind [1]. Further
aggravating this scenario, one quarter of the world’s population is estimated to
be latently infected with M. tuberculosis, providing a virtually impossible to
eliminate reservoir [2, 3]. Tackling TB requires fresh ways of thinking and
paradigm breaking research. Recent studies have placed host-directed therapies
(HDT) based in immune modulatory approaches among the most promising
strategies to treat TB [4]. However, the rational development of HDTs requires a
deep knowledge of the factors that modulate host-pathogen interactions and
protective immunity in TB. For this, both host and pathogen determinants need
to be considered. A growing body of evidence suggest that M. tuberculosis has
learned to modulate the host immune response to its own advantage, along the
millennia of coevolution with Man. For instance, the pathogen has evolved to use
the macrophage intracellular compartment to replicate and to persist within lung
granulomas [5]. Moreover, genome sequencing of M. tuberculosis showed that the
known human T-cell epitopes are evolutionarily hyperconserved [6], suggesting
an exploitation of host T cell responses by the bacteria. Indeed, M. tuberculosis
appears to have evolved to elicit a “permissive” inflammatory state where cavitary
pulmonary disease develops, ensuring its successful transmission [7], while the
patient remains ambulatory enough to spread TB upon contact with many other
individuals. Work from our group provided evidence of diversifying selection in
the genome of M. tuberculosis in response to non-antibiotic pressure, strongly
suggesting the immune system as a driver of bacterial adaptation [8]. Therefore,
a certain degree of adaptation to the host immune response within a population
of M. tuberculosis is expected. In line with this hypothesis, cellular and
experimental infections with different strains belonging to the M. tuberculosis
complex (MTBC) show the production of distinct cytokine secretion profiles and
Chapter 5 | Host and bacterial modulation of the protective IL-1 receptor signaling in TB
151
different outcomes of infection [9-13]. However, studies linking bacterial
genotypes with distinct phenotypes of immune responses and with specific
clinical outcomes, in different hosts, are still scarce.
The initiation of the immune response during M. tuberculosis infection relies
on the activation of pattern recognition receptors (PRRs) by pathogen-associated
molecular patterns (PAMPs) [14]. PRRs include Toll-like receptors (TLRs), C-type
lectin receptors, and the cytosolic NOD-like receptors (NLRs) recognizing
microbial molecules in the intracellular compartment. Among the NLR family of
proteins, NLR pyrin domain containing 3 (NLRP3) is known to induce the
assembly of the inflammasome in response to mycobacterial infection [15].
Another inflammasome complex is initiated by the absent in melanoma 2 (AIM2)
in response to bacterial dsDNA delivered in the cytosol of infected macrophages
[16]. The activation of the inflammasome has a pivotal role in the maturation and
secretion of interleukin 1-beta (IL-1β), which is a critical cytokine in host immune
defence against M. tuberculosis [14]. In the animal model, IL-1β and IL-1-receptor
deficient mice presented acute mortality and increased pulmonary bacterial
burden after infection [17, 18]. On the other hand, human data showed that IL-
1β and IL-1 receptor antagonist (IL-1RA), a natural competitive antagonist of IL-1
signaling, are highly expressed in the bronchoalveolar lavage fluid from
pulmonary TB patients [19, 20]. However, the precise impact of IL-1RA on TB
pathogenesis remains elusive. Anakinra, a recombinant human IL-1RA, has been
used on a large number of patients with different inflammatory diseases [21],
and still, records show little or absent risk of M. tuberculosis reactivation in latently
infected individuals [21, 22]. Conversely, Type I IFNs that counter-regulate the IL-
1 function [23], have been linked to pathologic exacerbation in TB [24].
In this study, we hypothesized that the initial events of the immune
response to M. tuberculosis infection may be important determinants of the
infection outcome and that both pathogen and host molecular elements are in
place to modulate these events. In order to address this point, we analysed the
cytokine expression profile induced in human peripheral blood mononuclear cells
(PBMCs) by different M. tuberculosis isolates associated with specific clinical
outcomes. As host donors, we analysed individuals who were latently infected for

Chapter 5 | Host and bacterial modulation of the protective IL-1 receptor signaling in TB
152
at least 2 years and individuals who had pulmonary TB in the past. Independently
of the host genetics, we identified two distinct groups of M. tuberculosis isolates:
high versus low inflammatory triggers. Furthermore, our findings suggest that
individuals producing elevated IL-1β/IL-1RA ratio may be protected from active
disease. These results highlight the importance of considering both host- and
bacteria-associated characteristics when designing immunomodulatory
interventions for TB.
Chapter 5 | Host and bacterial modulation of the protective IL-1 receptor signaling in TB
153
MATERIALS AND METHODS
1. M. tuberculosis clinical isolates selection and growth
We recovered the bacterial samples from a cohort of 133 TB cases with at
least pulmonary or pleural involvement [25], diagnosed at a University-affiliated
hospital (Hospital de São João - HSJ, Porto) during the period of 7 years (2007-
2013). All these cases were individuals who did not present known TB
precipitating or predictor factors. Details on inclusion criteria, overall
demographic and clinical features of this population have been described in the
former chapters. The study population was stratified in 5 severity groups,
according to the classification algorithm provided in Chapter 4 (Figure IV.2). Eight
M. tuberculosis isolates were selected from patients with a mild manifestation of
TB. Eight matched strains from patients with severe TB were then selected.
Matching was based on at least 2 out of 3 host variables: age within 15 years,
gender and smoking habits.
Recovery of the selected isolates was performed as described in Chapter
4. The stocks were amplified in 7H9 medium for 7–10 days of growth, till reaching
the mid log-phase growth stage. To determine the concentration of the M.
tuberculosis stocks, 6 frozen aliquots were serial diluted and plated in
Middlebrook 7H11 (BD Biosciences) agar plates supplemented with 10% Oleic
Albumin Dextrose Catalase Growth Supplement (OADC) and 0.5% glycerol. Viable
bacteria were determined by counting colony-forming units (CFUs) after 19-21
days of incubation at 37°C. Prior to infections, the frozen M. tuberculosis stocks
were thawed, syringed and directly diluted in complete Roswell Park Memorial
Institute (RPMI) medium, considering the obtained values for CFU.
Chapter 5 | Host and bacterial modulation of the protective IL-1 receptor signaling in TB
154
2. PBMCs isolation
Venous blood was drawn into 9 mL EDTA tubes (Vacutest Kima, Italy) from
the cubital vein of 19 healthy adult volunteer donors with non-treated latent TB
infection (LTBI), to whom a positive interferon-gamma release assay (IGRA) was
known for more than 2 years. Eight past TB patients were also enrolled in the
study, corresponding to specific host-pathogen pairs associated with either mild
or severe outcomes. PBMCs were isolated from whole blood on a Ficoll-Paque
(Sigma-Aldrich, Missouri, USA) density gradient, according standard protocols
[13]. The PBMCs interface was carefully removed into fresh RPMI-1640 medium,
centrifuged and the resulting cellular pellet resuspended in 5 mL of RPMI
supplemented with 10% heat-inactivated fetal bovine serum, 2mM L-glutamine,
1mM sodium pyruvate and 10mM 4-(2-hydroxyethyl)-1-
piperazineethanesulfonic acid (HEPES). Cell suspensions were then counted in
trypan blue. For the phenotypic analysis of the PBMCs obtained for each donor,
1x10⁶ PBMCs were stained with specific antibodies against human CD3 (clone
UCHT1, labelled with PE, BD Pharmingen), CD4 (clone RPAT4, labelled with APC,
BD Pharmingen), CD19 (clone HIB19, labelled with FITC, Biolegend), CD14 (clone
M5E2, labelled with FITC, BD Pharmingen) and CD16 (clone 3G8, labelled with
APC Cy7, BD Pharmingen) and analysed by fluorescence-activated cell sorting
(FACS). All antibodies were titrated prior to be used. A viability dye (7AAD,
Biolegend) was also included in the analysis. Data was acquired in a LSRII flow
cytometer and analysed using the FlowJo software (Ashland, USA).
3. PBMCs infection
Freshly isolated PBMCs were plated in 24 well-plates at a density of
0.5x10⁶ cells/well and infected with each of the selected M. tuberculosis isolates
or with the laboratory strain H37Rv Trudeau at a multiplicity of infection (moi) of
1:1. Non-infected cells were incubated with culture medium alone, to work as

Chapter 5 | Host and bacterial modulation of the protective IL-1 receptor signaling in TB
155
negative controls. Cell culture supernatants were collected 24 hours post-
infection, filter-sterilized and frozen in 50 μL aliquots at -80 ºC for future analysis.
4. Cytokine detection by Enzyme-Linked Immunosorbent
Assay (ELISA) and Multiplex analysis
Cell supernatants were screened for IL-6 and interferon (IFN)-g by
sandwich ELISA kits (eBioscience, San Diego, USA), following the manufacturer’s
instructions. Production of IFN-β, IL-1β, IL-1RA, IL-10, IL-12p40 and TNF-α was
measured using a Multiplex kit according to the manufacturer’s
recommendations (ProcartaPlex®, eBioscience).
5. Statistical analysis
Cytokines were analysed using the non-parametric Mann Whitney U-test.
Correlations were assessed using Spearman’s rank correlation. Receiver
operating characteristic (ROC) curve was used to determine the cutoff point
yielding the highest combined specificity and sensitivity (Youden index criterion)
[26], and discriminative ability was evaluated by the area under the ROC curve
(AUC) and its 95% confidence interval (CI). All the statistical analyses were
performed using the GraphPad Prism® 7 software (GraphPad Software, Inc.) and
SPSS software program, version 24 (IBM® SPSS®, Inc.). Values of P<0.05 were
considered statistically significant.
Chapter 5 | Host and bacterial modulation of the protective IL-1 receptor signaling in TB
156
6. Ethics statement
The study protocol was approved by the Health Ethics Committees of the
HSJ (approval number 109-11), the North Health Region Administration
(approval number 71-2014) and the Portuguese Data Protection Authority
(approval number 12174-2011). Written informed consent was obtained from all
patients and LTBI donors prior to draw samples of venous blood. To ensure
confidentiality, each case was anonymized by the assignment of a random
identification number. Experiments were conducted according to the principles
expressed in the Declaration of Helsinki.
Chapter 5 | Host and bacterial modulation of the protective IL-1 receptor signaling in TB
157
RESULTS
1. Group definition and experimental design
To investigate a possible relation between the clinical outcome of TB and
the inflammatory phenotype induced by different M. tuberculosis isolates in
immune cells, we selected 8 clinical isolates associated with mild TB outcomes
and another 8 associated with severe TB, according to matching criteria
described before (Table V.1). The isolates are geographically matched with the
hosts, to ensure that mutual adaptations may be revealed. To avoid deviations in
the clinical outcome due to imbalanced host immunity, the selected M.
tuberculosis isolates were obtained from TB patients who did not present known
TB precipitating or predicting factors, such as HIV, metabolic disease, or general
immune suppression.
These isolates were then used to infect PBMCs obtained from individuals
who were latently infected for at least 2 years (as measured by IGRA+ data), who
did not undergo preventive antibiotherapy and who did not develop TB. PBMCs
from individuals who had pulmonary TB in the past and have been successfully
cured upon antibiotherapy were also included. These two groups are respectively
representative of individuals who are resistant or susceptible to active TB
progression upon infection. By choosing IGRA+ participants we also minimized
innate resistance to TB, likely existing in some IGRA- individuals. As controls, non-
stimulated cells and cells infected with the laboratory reference strain H37Rv
Trudeau were included.
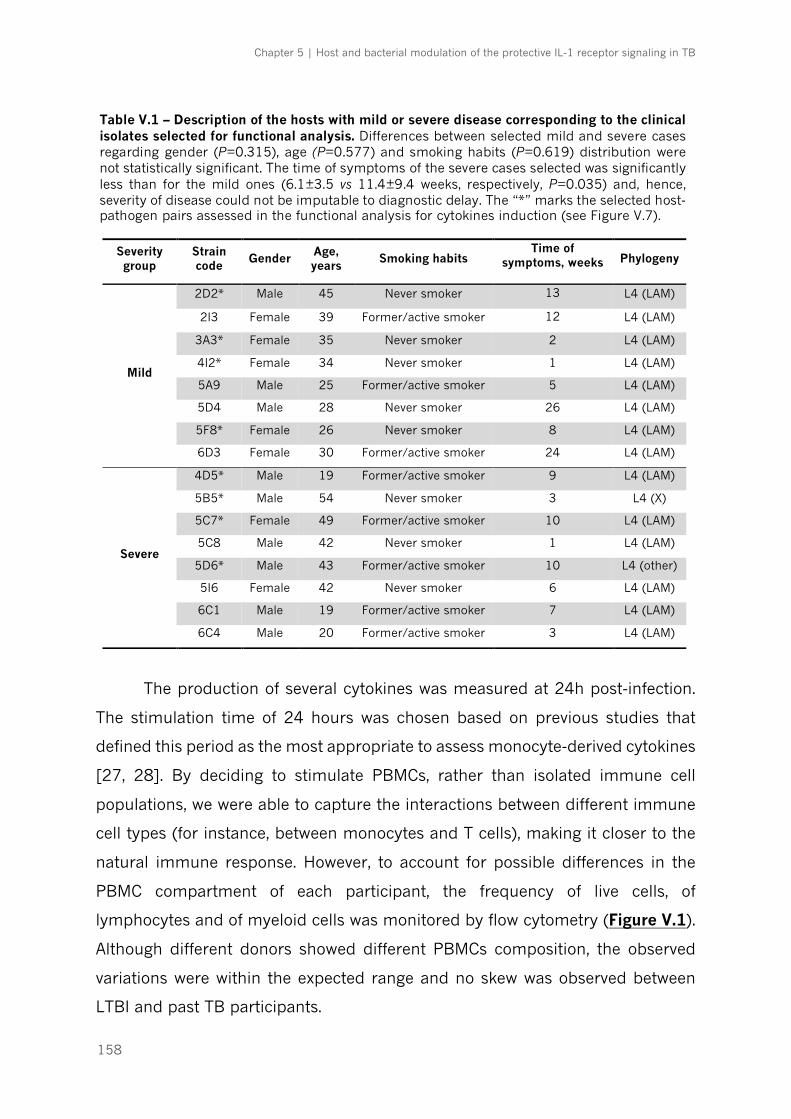
Chapter 5 | Host and bacterial modulation of the protective IL-1 receptor signaling in TB
158
The production of several cytokines was measured at 24h post-infection.
The stimulation time of 24 hours was chosen based on previous studies that
defined this period as the most appropriate to assess monocyte-derived cytokines
[27, 28]. By deciding to stimulate PBMCs, rather than isolated immune cell
populations, we were able to capture the interactions between different immune
cell types (for instance, between monocytes and T cells), making it closer to the
natural immune response. However, to account for possible differences in the
PBMC compartment of each participant, the frequency of live cells, of
lymphocytes and of myeloid cells was monitored by flow cytometry (Figure V.1).
Although different donors showed different PBMCs composition, the observed
variations were within the expected range and no skew was observed between
LTBI and past TB participants.
Severity group
Strain code
Gender Age, years
Smoking habits Time of
symptoms, weeks Phylogeny
Mild
2D2* Male 45 Never smoker 13 L4 (LAM)
2I3 Female 39 Former/active smoker 12 L4 (LAM)
3A3* Female 35 Never smoker 2 L4 (LAM)
4I2* Female 34 Never smoker 1 L4 (LAM)
5A9 Male 25 Former/active smoker 5 L4 (LAM)
5D4 Male 28 Never smoker 26 L4 (LAM)
5F8* Female 26 Never smoker 8 L4 (LAM)
6D3 Female 30 Former/active smoker 24 L4 (LAM)
Severe
4D5* Male 19 Former/active smoker 9 L4 (LAM)
5B5* Male 54 Never smoker 3 L4 (X)
5C7* Female 49 Former/active smoker 10 L4 (LAM)
5C8 Male 42 Never smoker 1 L4 (LAM)
5D6* Male 43 Former/active smoker 10 L4 (other)
5I6 Female 42 Never smoker 6 L4 (LAM)
6C1 Male 19 Former/active smoker 7 L4 (LAM)
6C4 Male 20 Former/active smoker 3 L4 (LAM)
Table V.1 – Description of the hosts with mild or severe disease corresponding to the clinical isolates selected for functional analysis. Differences between selected mild and severe cases regarding gender (P=0.315), age (P=0.577) and smoking habits (P=0.619) distribution were not statistically significant. The time of symptoms of the severe cases selected was significantly less than for the mild ones (6.1±3.5 vs 11.4±9.4 weeks, respectively, P=0.035) and, hence, severity of disease could not be imputable to diagnostic delay. The “*” marks the selected host-pathogen pairs assessed in the functional analysis for cytokines induction (see Figure V.7).

Chapter 5 | Host and bacterial modulation of the protective IL-1 receptor signaling in TB
159
Figure V.1 – General characteristics of the PBMCs isolated from 19 non-treated LTBI donors and 8 TB patients. Each dot in the graphs corresponds to one participant. The cellular concentration in the isolated PBMCs obtained per donor was determined by trypan blue cell counting and the viability and cellular composition determined by FACS as indicated in the Material and Methods section. (A) Cellular concentration per mL obtained for each donor. (B) Viability of PBMCs isolated for each donor. (C) Frequency of T cells (CD3+ and CD3+CD4+), B cells (CD19+) and (D) monocytes (classical CD14++CD16- and non-classical CD14+CD16++).
LTBI donors TB patients0
2×10⁶
4×10⁶
6×10⁶
8×10⁶
!
!!
!
!
!
!
!
Cel
l num
ber/
mL
LTBI donors TB patients99.0
99.2
99.4
99.6
99.8
100.0
!
!
!
!
!!
!!
Cel
l via
bilit
y, %
T CD3 T CD3CD4 B CD19 T CD3 T CD3CD4 B CD190
2
4
6
20
40
60
80
"
"
"
""
""
""
""
"
"
"" "
"
"
"
#
#
#
###
# ##
##
#
#
#
#
# ##
#
!
!
!
!
!! !
!
$
$
$
$
$$
$
$
!!
!!
!
!!
!
Lym
phoc
ytes
, %
LTBI donors TB patients
CD14++CD16- CD14+CD16++ CD14++CD16- CD14+CD16++0
10
20
30
"
""
"" ""
""
""
""""
"
"
"
"
"
!
!
!!
!
!
!
!
$
$
$$
$
$
$
$
Mye
loid
cel
ls, %
LTBI donors TB patients
A C
B D
Chapter 5 | Host and bacterial modulation of the protective IL-1 receptor signaling in TB
160
2. Heterogeneity of host responses to clinical isolates
associated with different TB outcomes
We started by investigating a possible correlation between the outcome of
TB and the capacity of the infecting M. tuberculosis isolate to induce a particular
type of cytokine production in PBMCs. For that we focused on the response of
LTBI donors. A heatmap was calculated, considering the response of 10 LTBI
participants to each of the isolates tested (Figure V.2). For all tested cytokines
(IL-1β, IL-6, IL-12p40, IFN-β, IL-1RA, IL-10), some isolates clearly induced higher
production of cytokines than others, suggesting the presence of bacterial
determinants of the immune response, independently of the host background.
Interestingly, among the top three inducers of cytokine production were isolates
that associate with mild TB, whereas among the lowest three inducers were
isolates associated with a severe manifestation of TB (Figure V.2). This led us to
compare the overall PBMC response to the group of isolates related to mild versus
those related to severe TB presentation (Table V.2). It was interesting to observe
that M. tuberculosis isolates associated with severe disease consistently induced
lower levels of pro-inflammatory (IL-1β, IL-6, IL-12p40) and anti-inflammatory (IL-
1RA, IL-10) cytokines than did mild isolates (P<0.001). Of note, H37Rv infections
of PBMCs led to significantly higher production of cytokines by every donor as
compared to those detected for the clinical isolates (Figure V.3). The same result
was observed in previous studies and is likely to reflect a laboratorial adaptation
of this strain towards the induction of high inflammatory responses [29]. An
exception to this finding was the production of IL-1RA, which did not vary
significantly for the H37Rv infection.

Chapter 5 | Host and bacterial modulation of the protective IL-1 receptor signaling in TB
161
FigureV.2–M
.tub
erculosisisolatesc
anbedivide
dinhighan
dlowindu
cersofrespo
nsesinahost-inde
pend
entw
ay.PBM
Csof10LTBIsu
bjectswereinfected
with
eachofth
e16
clinicalisolatesassociatedwith
eith
erm
ildorsevereou
tcom
e(m
oi1:1).24
hou
rspost-infectionsupe
rnatan
tswereha
rvestedan
dfiltered
andtheprod
uctio
nofth
eindicatedcytokine
sassessedbyim
mun
oassay.The
heatm
apsh
owsthestrain-related
hierarchyinth
einfla
mmatoryrespon
se.The
clinicalisolatesarera
nked
accordingto
themed
ianconcen
trationofeachcytokine
.Colored
dotsa
tleftind
icateth
emild
and
severestrains.
LTBI
6C4
5D6
5I6
5F8
6D3
5C7
5C8
5B5
2I3
5A9
6C1
4D5
2D2
4I2
5D4
3A3
IL-1b
pg/mL 500
1000
1500
2000
LTBI
6C4
5D6
5I6
5B5
5C7
6D3
5F8
5C8
2I3
5A9
4D5
4I2
6C1
2D2
3A3
5D4
IL-1RA
pg/mL 5000
10000
15000
20000
LTBI
6C4
5D6
5I6
5C7
6D3
5F8
5C8
5B5
2I3
5A9
4D5
2D2
6C1
3A3
4I2
5D4
IL-6
pg/mL
5000
10000
15000
20000
LTBI
6C4
5D6
5I6
5C7
6D3
5B5
5F8
5C8
2I3
4D5
5A9
6C1
2D2
3A3
4I2
5D4
IL-10
pg/mL
200
400
LTBI
5D6
6C4
5C7
6D3
5B5
5C8
5I6
5F8
2I3
4D5
5A9
6C1
4I2
3A3
2D2
5D4
IL-12p40
pg/mL
100
200
300
400
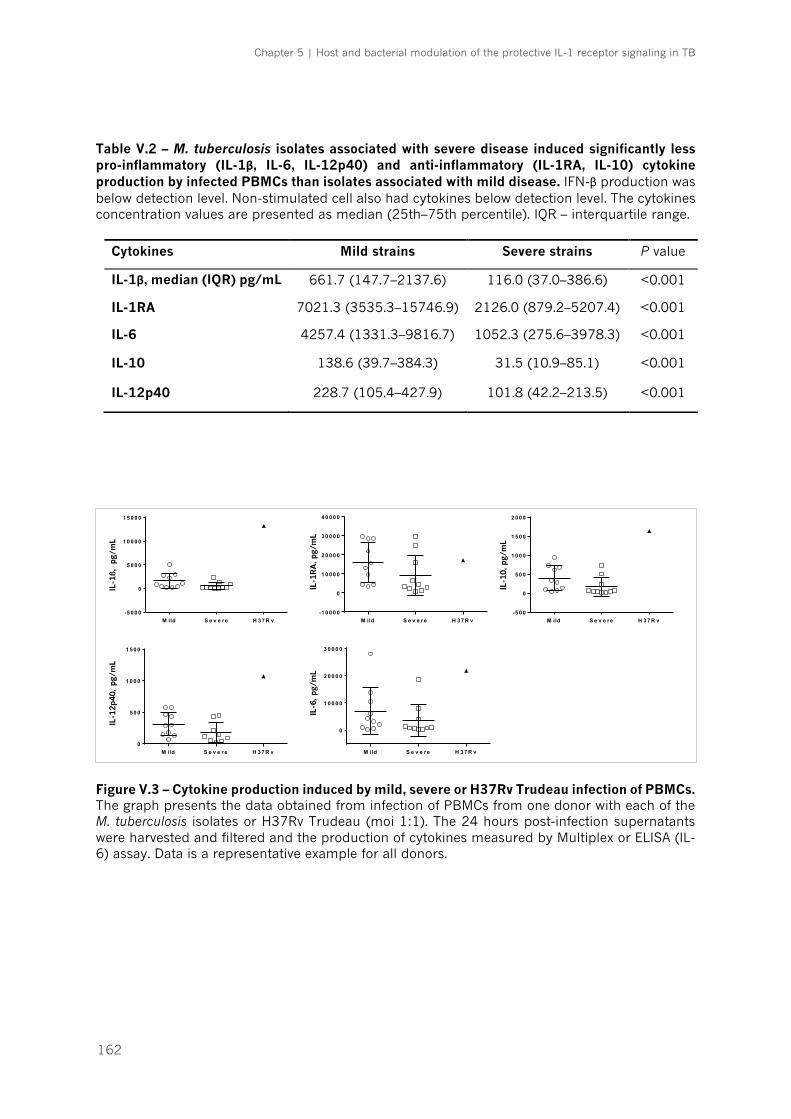
Chapter 5 | Host and bacterial modulation of the protective IL-1 receptor signaling in TB
162
Table V.2 – M. tuberculosis isolates associated with severe disease induced significantly less pro-inflammatory (IL-1β, IL-6, IL-12p40) and anti-inflammatory (IL-1RA, IL-10) cytokine production by infected PBMCs than isolates associated with mild disease. IFN-β production was below detection level. Non-stimulated cell also had cytokines below detection level. The cytokines concentration values are presented as median (25th–75th percentile). IQR – interquartile range.
Figure V.3 – Cytokine production induced by mild, severe or H37Rv Trudeau infection of PBMCs. The graph presents the data obtained from infection of PBMCs from one donor with each of the M. tuberculosis isolates or H37Rv Trudeau (moi 1:1). The 24 hours post-infection supernatants were harvested and filtered and the production of cytokines measured by Multiplex or ELISA (IL-6) assay. Data is a representative example for all donors.
Cytokines Mild strains Severe strains P value
IL-1β, median (IQR) pg/mL 661.7 (147.7–2137.6) 116.0 (37.0–386.6) <0.001
IL-1RA 7021.3 (3535.3–15746.9) 2126.0 (879.2–5207.4) <0.001
IL-6 4257.4 (1331.3–9816.7) 1052.3 (275.6–3978.3) <0.001
IL-10 138.6 (39.7–384.3) 31.5 (10.9–85.1) <0.001
IL-12p40 228.7 (105.4–427.9) 101.8 (42.2–213.5) <0.001
M ild S e v e r e H 3 7 R v-5 0 0 0
0
5 0 0 0
1 0 0 0 0
1 5 0 0 0
H D 2
IL-1b
(p
g/m
L)
M ild S e v e r e H 3 7 R v-1 0 0 0 0
0
1 0 0 0 0
2 0 0 0 0
3 0 0 0 0
4 0 0 0 0
H D 2
IL-1
RA
(p
g/m
L)
M ild S e v e r e H 3 7 R v-5 0 0
0
5 0 0
1 0 0 0
1 5 0 0
2 0 0 0
H D 2IL
-10
(p
g/m
L)
M ild S e v e r e H 3 7 R v0
5 0 0
1 0 0 0
1 5 0 0
H D 2
IL-1
2p
40
(p
g/m
L)
M ild S e v e r e H 3 7 R v
0
1 0 0 0 0
2 0 0 0 0
3 0 0 0 0
H D 2
IL-6
(p
g/m
L)
IL-1
ß, p
g/m
LIL
-12p
40,
pg/m
L
IL-6
, pg/
mL
IL-1
RA
, pg/
mL
IL-1
0, p
g/m
L
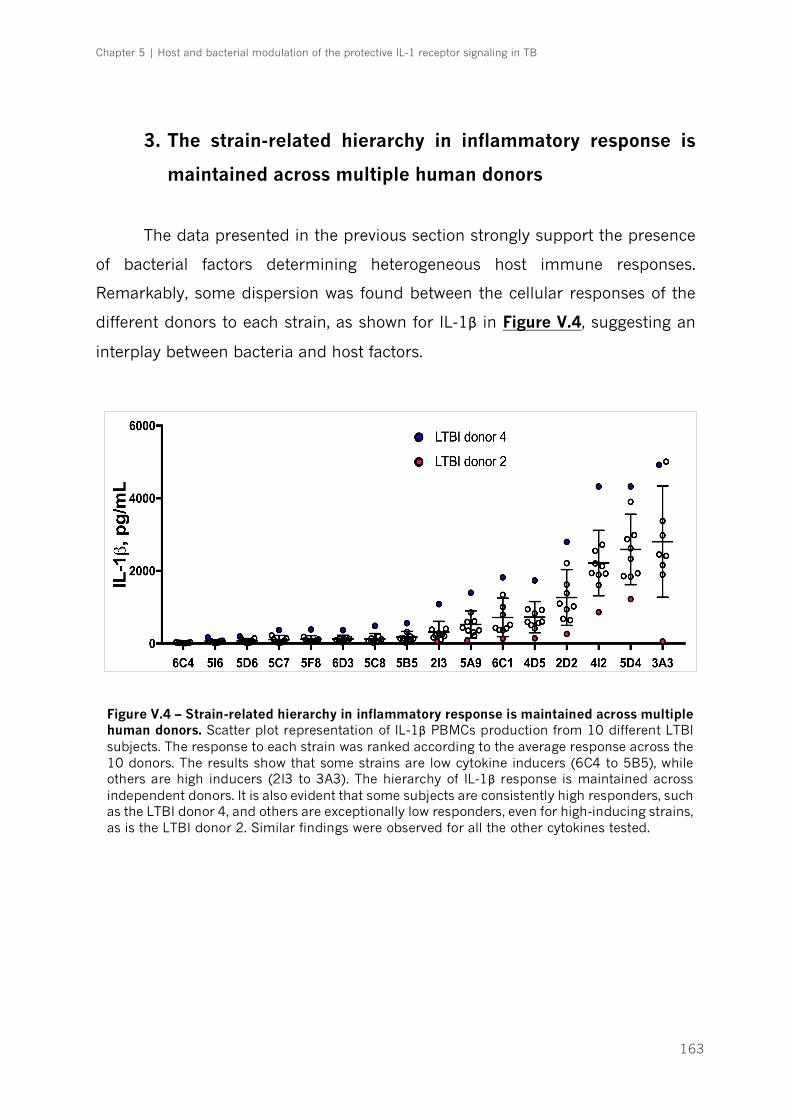
Chapter 5 | Host and bacterial modulation of the protective IL-1 receptor signaling in TB
163
3. The strain-related hierarchy in inflammatory response is
maintained across multiple human donors
The data presented in the previous section strongly support the presence
of bacterial factors determining heterogeneous host immune responses.
Remarkably, some dispersion was found between the cellular responses of the
different donors to each strain, as shown for IL-1β in Figure V.4, suggesting an
interplay between bacteria and host factors.
Figure V.4 – Strain-related hierarchy in inflammatory response is maintained across multiple human donors. Scatter plot representation of IL-1β PBMCs production from 10 different LTBI subjects. The response to each strain was ranked according to the average response across the 10 donors. The results show that some strains are low cytokine inducers (6C4 to 5B5), while others are high inducers (2I3 to 3A3). The hierarchy of IL-1β response is maintained across independent donors. It is also evident that some subjects are consistently high responders, such as the LTBI donor 4, and others are exceptionally low responders, even for high-inducing strains, as is the LTBI donor 2. Similar findings were observed for all the other cytokines tested.

Chapter 5 | Host and bacterial modulation of the protective IL-1 receptor signaling in TB
164
When heatmaps based on the host immune response were generated, an
overall hierarchy of cytokine production was also found, where low and high
responders could be identified among the LTBI participants, independently of the
infecting bacteria (Figure V.5).
It is interesting to note that the pattern of response of the host PBMCs was
similar in what respected pro- and anti-inflammatory cytokine production. As an
example, a highly significant correlation between production of IL-12p40 and IL-
10 (Spearman rank correlation coefficient = 0.788, P<0.001) and between IL-1β
and IL-1RA (rs = 0.882, P<0.001) was observed (Figure V.6). This suggested that
a common pathway for cytokine production is in place in the different individuals,
rather than a specific pro- or anti-inflammatory signalling.
Figure V.5 – Host immune response to all isolates also shows some hierarchy. Heatmap representation of average cytokines production from 10 different LTBI subjects. LTBI donor 2 was a low responder regardless of the strain and cytokine measured, while LTBI donor 4 was a top responder.
L T B I2
L T B I7
L T B I8
L T B I6
L T B I3
L T B I5
L T B I1
L T B I10
L T B I9
L T B I4
IL -1 2p 40
pg/m
L1 0 0
200
300
400
500
LTBI2
LTBI7
LTBI6
LTBI9
LTBI10
LTBI5
LTBI3
LTBI8
LTBI1
LTBI4
LTBI2
LTBI6
LTBI3
LTBI10
LTBI1
LTBI5
LTBI7
LTBI9
LTBI8
LTBI4
LTBI2
LTBI7
LTBI8
LTBI6
LTBI3
LTBI5
LTBI1
LTBI10
LTBI9
LTBI4
LTBI9
LTBI10
LTBI7
LTBI5
LTBI2
LTBI6
LTBI3
LTBI8
LTBI4
LTBI1
LTBI2
LTBI7
LTBI9
LTBI6
LTBI5
LTBI10
LTBI3
LTBI1
LTBI8
LTBI4
pg/mL
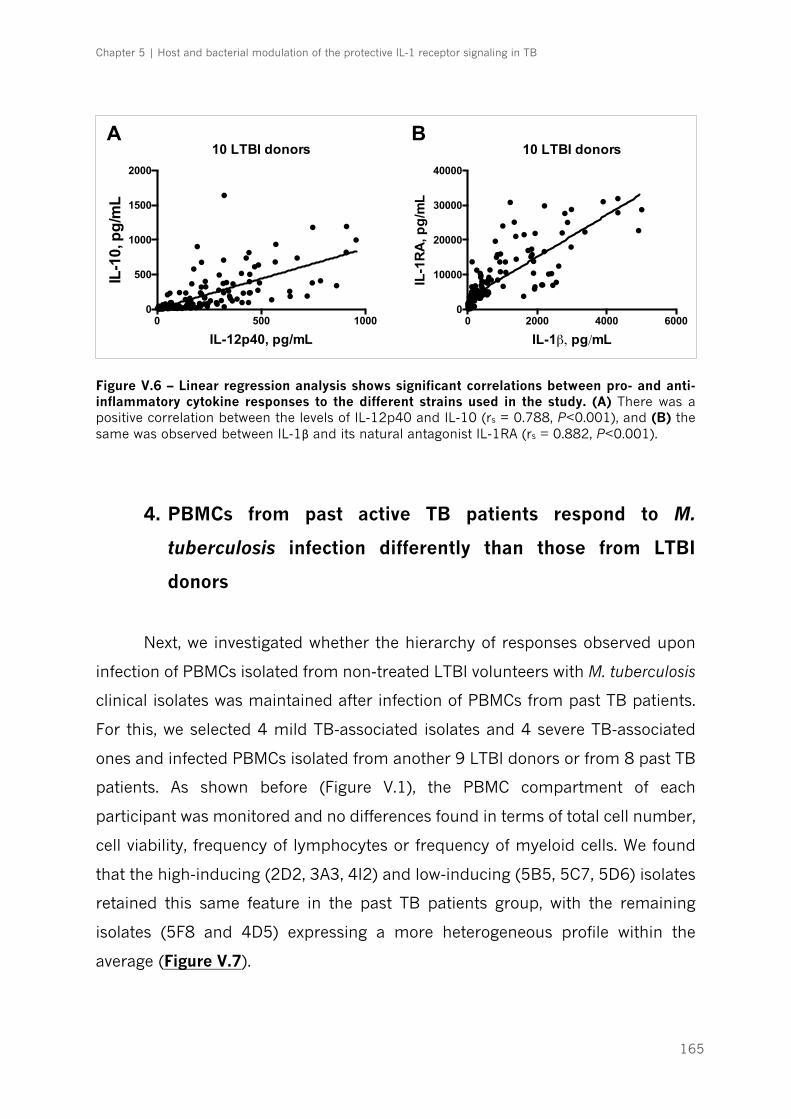
Chapter 5 | Host and bacterial modulation of the protective IL-1 receptor signaling in TB
165
Figure V.6 – Linear regression analysis shows significant correlations between pro- and anti-inflammatory cytokine responses to the different strains used in the study. (A) There was a positive correlation between the levels of IL-12p40 and IL-10 (rs = 0.788, P<0.001), and (B) the same was observed between IL-1β and its natural antagonist IL-1RA (rs = 0.882, P<0.001).
4. PBMCs from past active TB patients respond to M.
tuberculosis infection differently than those from LTBI
donors
Next, we investigated whether the hierarchy of responses observed upon
infection of PBMCs isolated from non-treated LTBI volunteers with M. tuberculosis
clinical isolates was maintained after infection of PBMCs from past TB patients.
For this, we selected 4 mild TB-associated isolates and 4 severe TB-associated
ones and infected PBMCs isolated from another 9 LTBI donors or from 8 past TB
patients. As shown before (Figure V.1), the PBMC compartment of each
participant was monitored and no differences found in terms of total cell number,
cell viability, frequency of lymphocytes or frequency of myeloid cells. We found
that the high-inducing (2D2, 3A3, 4I2) and low-inducing (5B5, 5C7, 5D6) isolates
retained this same feature in the past TB patients group, with the remaining
isolates (5F8 and 4D5) expressing a more heterogeneous profile within the
average (Figure V.7).
0 500 10000
500
1000
1500
2000
IL-12p40, pg/mL
IL-1
0, p
g/m
L
10 LTBI donors
0 2000 4000 60000
10000
20000
30000
40000
IL-1β, pg/mL
IL-1
RA
, pg
/mL
10 LTBI donorsA B

Chapter 5 | Host and bacterial modulation of the protective IL-1 receptor signaling in TB
166
5D6 5F8 5B5 5C7 4D5 2D2 4I2 3A30
500
1000
1500
2000
2500
!!!!!
! !! !! !!!! !! !!
! !! !! ! !!!!
!!
!!
!
!
!
!
!
!!
!
!
!
!!
!
!
!
!
!
!
!
!!
!
!
!
!
!
!
!
!
!
!
IL-1β,
pg/
mL
5D6 5B5 5F8 5C7 4I2 4D5 3A3 2D20
10000
20000
30000
40000
50000
60000
70000
!! ! !!!!! !! !
! !!!!
!! !! !
!
!!
!
!!
!!
!!
!
!
!
!
!
!
!!
!
!
!!
!!
!
! !
!
!
!
! !
!!
!
!
!
!
!
! !
!
!IL-1
RA
, pg/
mL
5D6 5B5 5F8 5C7 4D5 3A3 2D2 4I20
100
200
300
400
500
!!! ! !!! !! ! !!!!! !
!! !!!
! !!!
!!
!
!!
!
!!
!
!
!
!
! !
!!
!
!
!
!
!
!
!!
!
!
!
!
!
IL-1
0, p
g/m
L
5D6 5B5 5C7 5F8 4D5 3A3 4I2 2D20
100
200
300
400
500
!! !!
!!
!! !!!
!
!!
! !!!
!! !
!
!!!!
!
!
!
!
!! !!
!
!
!
!
!
!
!!
!
!!
!
!
!
!
!
!
!
!
!
!
!
!
!IL-1
2p40
, pg/
mL
Mild strainsSevere strains
Specific host-pathogen pairs
Figure V.7 – The intensity of the response is not related to specific host-pathogen pairs. PBMCs of 8 past TB patients were infected with each of the corresponding strains, associated with either mild (n=4) or severe (n=4) outcome. The response of specific host-pathogen pairs (colored square n) was concordant with the overall profile for each strain. Missing dots correspond to cases where cytokine production was below detection level.
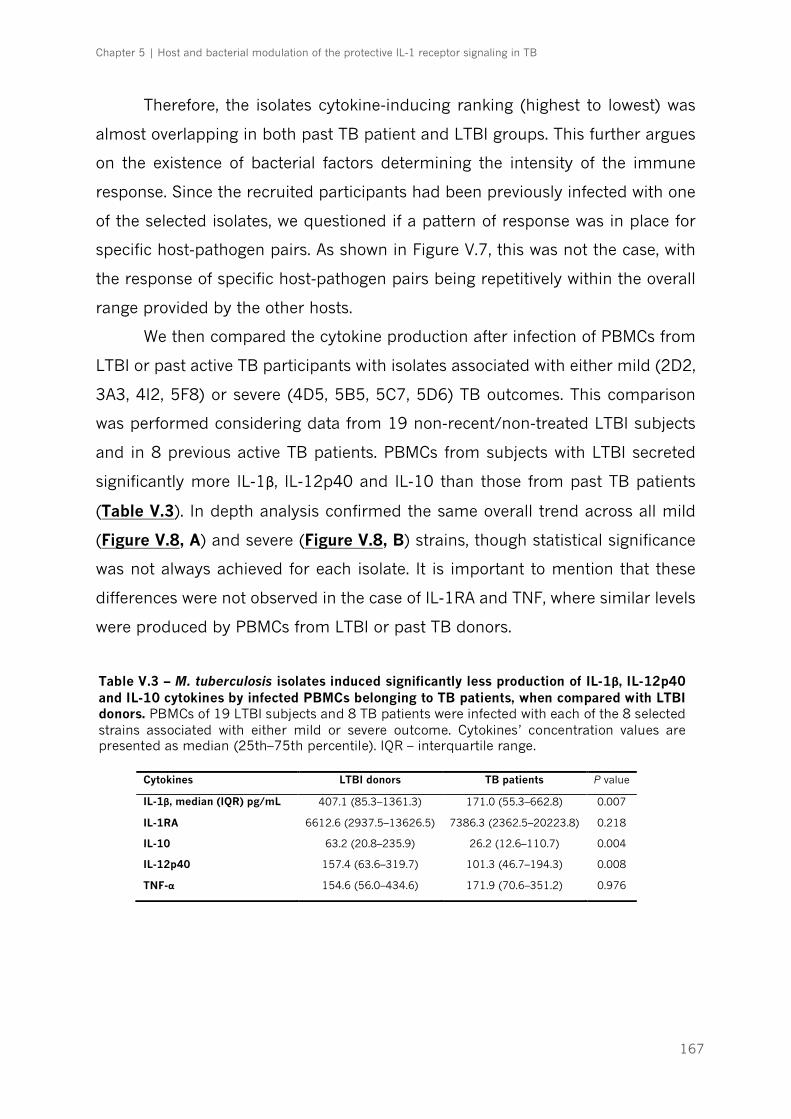
Chapter 5 | Host and bacterial modulation of the protective IL-1 receptor signaling in TB
167
Therefore, the isolates cytokine-inducing ranking (highest to lowest) was
almost overlapping in both past TB patient and LTBI groups. This further argues
on the existence of bacterial factors determining the intensity of the immune
response. Since the recruited participants had been previously infected with one
of the selected isolates, we questioned if a pattern of response was in place for
specific host-pathogen pairs. As shown in Figure V.7, this was not the case, with
the response of specific host-pathogen pairs being repetitively within the overall
range provided by the other hosts.
We then compared the cytokine production after infection of PBMCs from
LTBI or past active TB participants with isolates associated with either mild (2D2,
3A3, 4I2, 5F8) or severe (4D5, 5B5, 5C7, 5D6) TB outcomes. This comparison
was performed considering data from 19 non-recent/non-treated LTBI subjects
and in 8 previous active TB patients. PBMCs from subjects with LTBI secreted
significantly more IL-1β, IL-12p40 and IL-10 than those from past TB patients
(Table V.3). In depth analysis confirmed the same overall trend across all mild
(Figure V.8, A) and severe (Figure V.8, B) strains, though statistical significance
was not always achieved for each isolate. It is important to mention that these
differences were not observed in the case of IL-1RA and TNF, where similar levels
were produced by PBMCs from LTBI or past TB donors.
Cytokines LTBI donors TB patients P value
IL-1β, median (IQR) pg/mL 407.1 (85.3–1361.3) 171.0 (55.3–662.8) 0.007
IL-1RA 6612.6 (2937.5–13626.5) 7386.3 (2362.5–20223.8) 0.218
IL-10 63.2 (20.8–235.9) 26.2 (12.6–110.7) 0.004
IL-12p40 157.4 (63.6–319.7) 101.3 (46.7–194.3) 0.008
TNF-α 154.6 (56.0–434.6) 171.9 (70.6–351.2) 0.976
Table V.3 – M. tuberculosis isolates induced significantly less production of IL-1β, IL-12p40 and IL-10 cytokines by infected PBMCs belonging to TB patients, when compared with LTBI donors. PBMCs of 19 LTBI subjects and 8 TB patients were infected with each of the 8 selected strains associated with either mild or severe outcome. Cytokines’ concentration values are presented as median (25th–75th percentile). IQR – interquartile range.
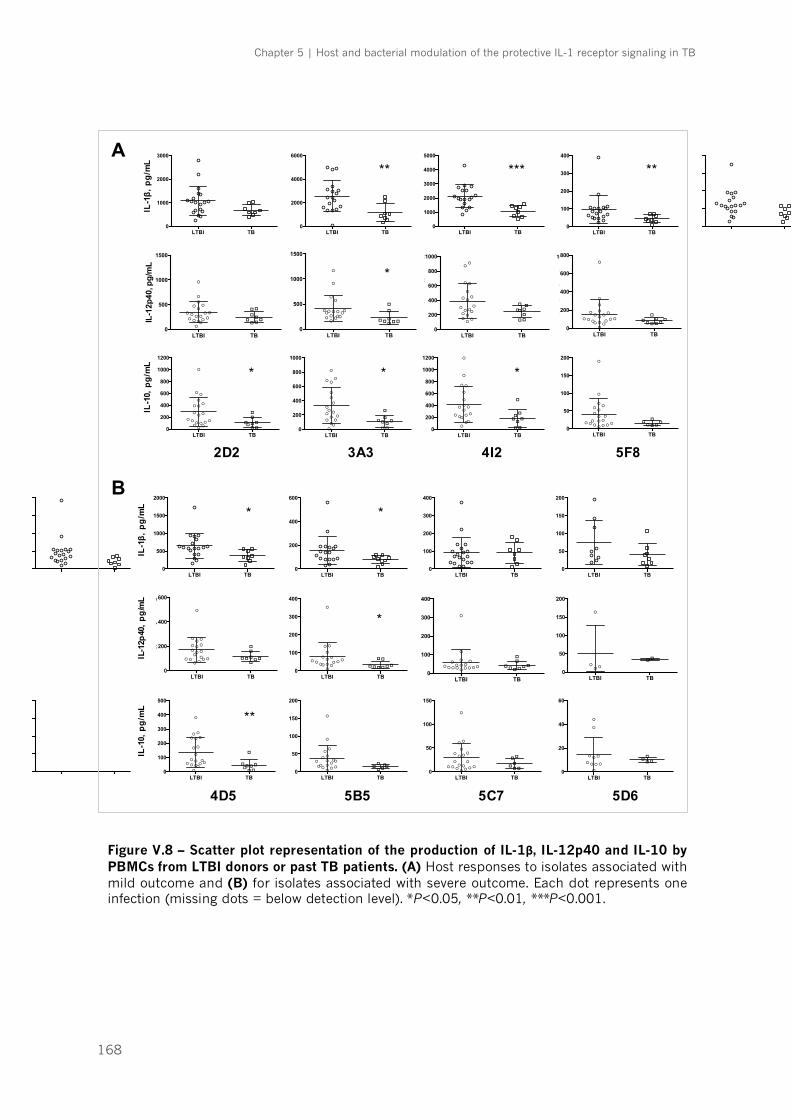
Chapter 5 | Host and bacterial modulation of the protective IL-1 receptor signaling in TB
168
Figure V.8 – Scatter plot representation of the production of IL-1β, IL-12p40 and IL-10 by PBMCs from LTBI donors or past TB patients. (A) Host responses to isolates associated with mild outcome and (B) for isolates associated with severe outcome. Each dot represents one infection (missing dots = below detection level). *P<0.05, **P<0.01, ***P<0.001.
LTBI TB0
1000
2000
3000IL
-1β,
pg/
mL
LTBI TB0
2000
4000
6000
LTBI TB0
1000
2000
3000
4000
5000
LTBI TB0
100
200
300
400
LTBI TB0
500
1000
1500
2000
LTBI TB0
200
400
600
LTBI TB0
100
200
300
400
LTBI TB0
50
100
150
200
LTBI TB0
200
400
600
800
1000
1200
!
!
!
!
!! !
!
!
!
!
!
!!!
!
!
!
!
!!!
!!
!!
!
2D2
IL-1
0, p
g/m
L
LTBI TB0
200
400
600
800
1000
!
!
!
!
!!
!
!!
!
!
!!
!
!
!
!
!
!
!!!
!
!
!!
3A3LTBI TB
0
200
400
600
800
1000
1200
!
!
!
!
!!!
!
!
!
!
!
!!
!
!
!
!
!
!!
!
!
!
!
!
4I2LTBI TB
0
50
100
150
200
!
!
!
!
!!!
!!
!
!
!
!!!
!
!
!
!
!!!
!! !
5F8LTBI TB
0
100
200
300
400
500
!
!
!
!
! !!
!
!
!
!
!
! !!
!
!
!
!
!!!
!!
!
!!
4D5LTBI TB
0
50
100
150
200
!
!
!
!
!! !
!!!
!
!
!!!
!!
!
!!!!
! !
5B5LTBI TB
0
50
100
150
!
!
!
!
!!
!
!
!!
!
!
!!!
!
!
!!
!!
!
!!!
5C7LTBI TB
0
20
40
60
!
!
!
!
! !
!!
!!
!!!
!
5D6
LTBI TB0
500
1000
1500
2000
!
!
!
!!
!!
!
!!
!
!
!!!!
!!!
!
!!
!
! !!
!
IL-1
2p40
, pg/
mL
LTBI TB0
1000
2000
3000
4000
!!
!
!
!
!
!
!
!!
!
!!! !!!!
!
!!!
!!! !
LTBI TB0
1000
2000
3000
!
!!
!
!
!
!
!
!! !
!
!!
!
!! ! ! !! !
!!!
!
LTBI TB0
200
400
600
800
1000
!
!
!
!
!! !!
!
!
!
!
!! !!!
!!
! !!!
!!!!
LTBI TB0
200
400
600
!
!
!
!
!
!
!
!!
!
!
!!
!!
!
!! !!
!!
!! !!
LTBI TB0
200
400
600
!!
!
!! !
!
!!
!!
!!!!
!
!!!
!!
!! !!
LTBI TB0
100
200
300
400
!!
!
!!
!!!
!
!
!
!!! !
! !! !!
!!
! !!!
LTBI TB0
50
100
150
200
!
!
!
!
!
!!
!!
Mild strains Severe strains
LTBI TB0
1000
2000
3000
IL-1β,
pg/
mL
LTBI TB0
2000
4000
6000
LTBI TB0
1000
2000
3000
4000
5000
LTBI TB0
100
200
300
400
LTBI TB0
500
1000
1500
2000
LTBI TB0
200
400
600
LTBI TB0
100
200
300
400
LTBI TB0
50
100
150
200
LTBI TB0
200
400
600
800
1000
1200
!
!
!
!
!! !
!
!
!
!
!
!!!
!
!
!
!
!!!
!!
!!
!
2D2
IL-1
0, p
g/m
L
LTBI TB0
200
400
600
800
1000
!
!
!
!
!!
!
!!
!
!
!!
!
!
!
!
!
!
!!!
!
!
!!
3A3LTBI TB
0
200
400
600
800
1000
1200
!
!
!
!
!!!
!
!
!
!
!
!!
!
!
!
!
!
!!
!
!
!
!
!
4I2LTBI TB
0
50
100
150
200
!
!
!
!
!!!
!!
!
!
!
!!!
!
!
!
!
!!!
!! !
5F8LTBI TB
0
100
200
300
400
500
!
!
!
!
! !!
!
!
!
!
!
! !!
!
!
!
!
!!!
!!
!
!!
4D5LTBI TB
0
50
100
150
200
!
!
!
!
!! !
!!!
!
!
!!!
!!
!
!!!!
! !
5B5LTBI TB
0
50
100
150
!
!
!
!
!!
!
!
!!
!
!
!!!
!
!
!!
!!
!
!!!
5C7LTBI TB
0
20
40
60
!
!
!
!
! !
!!
!!
!!!
!
5D6
LTBI TB0
500
1000
1500
2000
!
!
!
!!
!!
!
!!
!
!
!!!!
!!!
!
!!
!
! !!
!
IL-1
2p40
, pg/
mL
LTBI TB0
1000
2000
3000
4000
!!
!
!
!
!
!
!
!!
!
!!! !!!!
!
!!!
!!! !
LTBI TB0
1000
2000
3000
!
!!
!
!
!
!
!
!! !
!
!!
!
!! ! ! !! !
!!!
!
LTBI TB0
200
400
600
800
1000
!
!
!
!
!! !!
!
!
!
!
!! !!!
!!
! !!!
!!!!
LTBI TB0
200
400
600
!
!
!
!
!
!
!
!!
!
!
!!
!!
!
!! !!
!!
!! !!
LTBI TB0
200
400
600
!!
!
!! !
!
!!
!!
!!!!
!
!!!
!!
!! !!
LTBI TB0
100
200
300
400
!!
!
!!
!!!
!
!
!
!!! !
! !! !!
!!
! !!!
LTBI TB0
50
100
150
200
!
!
!
!
!
!!
!!
Mild strains Severe strains
IL-1
0, p
g/m
L
IL
-12p
40, p
g/m
LIL
-1β,
pg/
mL
IL-1
0, p
g/m
L
IL
-12p
40, p
g/m
LIL
-1β,
pg/
mL
A
B
* * *
*
* * *
**
** *** **
* *
2D2 3A3 4I2 5F8
4D5 5B5 5C7 5D6
LTBI TB0
500
1000
1500
!!
!!
!!
!!
! !!
!
!
!!
!!
!
!
!
!!!
!!!
!IL-1
2p40
, pg/
mL
LTBI TB0
500
1000
1500
! !
!
!!
!
!!!!
!
!
!
!!
!
!
!
!!
!
!!! !
LTBI TB0
200
400
600
800
1000
!
!
!
!
!!
!
!
!!
!
!
!!
!!
!
!
!
!!!
!!
!
!
LTBI TB0
200
400
600
800
!
!
! !!!
!
!
!!
!!
!
!!
!
!
!
!! !!
!
!!!!
LTBI TB0
200
400
600
!
!
!!
!!
!!
!
! !
!
!
!! !
!
!
!!
!!
!! !!
LTBI TB0
100
200
300
400
!
!!
!!!
!
!!
! !!
!
!!
!
!!!
!!
!! !!
LTBI TB0
100
200
300
400
!!
!!
! !
!
! !!!!
!
!
!
!
! !!
!!
! !!!
LTBI TB0
50
100
150
200
!! !
!
!!
*
*
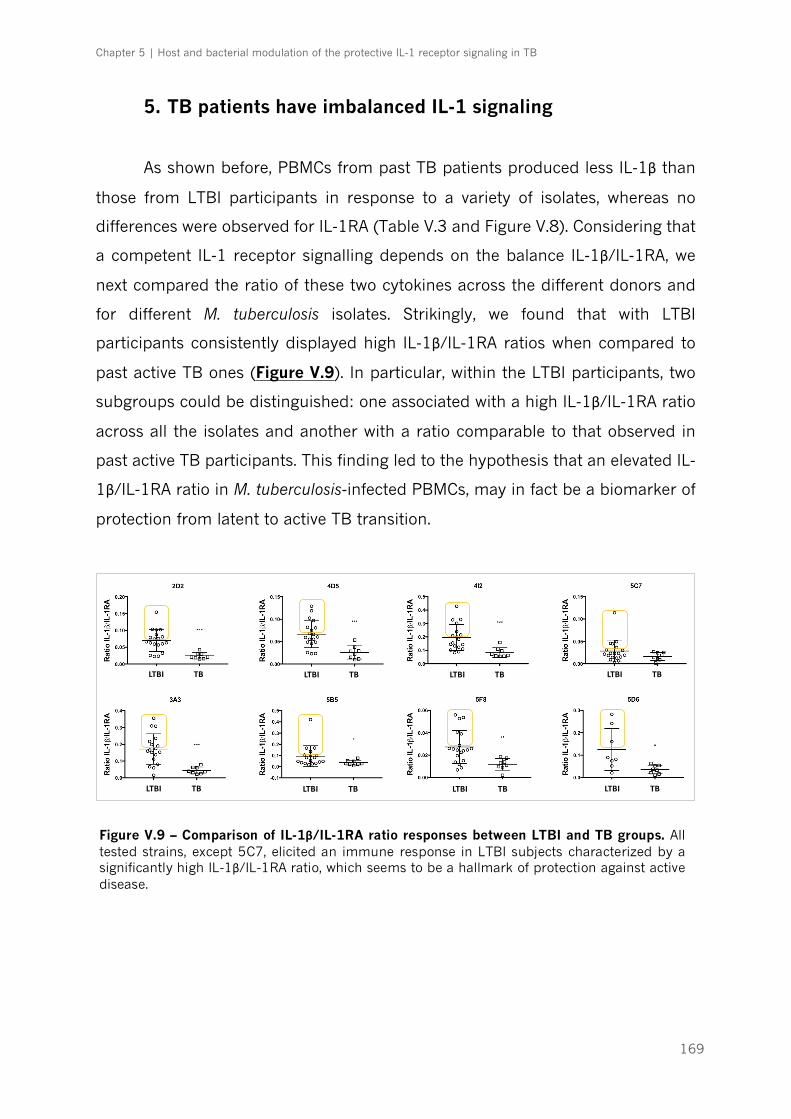
Chapter 5 | Host and bacterial modulation of the protective IL-1 receptor signaling in TB
169
5. TB patients have imbalanced IL-1 signaling
As shown before, PBMCs from past TB patients produced less IL-1β than
those from LTBI participants in response to a variety of isolates, whereas no
differences were observed for IL-1RA (Table V.3 and Figure V.8). Considering that
a competent IL-1 receptor signalling depends on the balance IL-1β/IL-1RA, we
next compared the ratio of these two cytokines across the different donors and
for different M. tuberculosis isolates. Strikingly, we found that with LTBI
participants consistently displayed high IL-1β/IL-1RA ratios when compared to
past active TB ones (Figure V.9). In particular, within the LTBI participants, two
subgroups could be distinguished: one associated with a high IL-1β/IL-1RA ratio
across all the isolates and another with a ratio comparable to that observed in
past active TB participants. This finding led to the hypothesis that an elevated IL-
1β/IL-1RA ratio in M. tuberculosis-infected PBMCs, may in fact be a biomarker of
protection from latent to active TB transition.
LTBI TB LTBI TB LTBI TB LTBI TB
LTBI TB LTBI TB LTBI TB LTBI TB
Figure V.9 – Comparison of IL-1β/IL-1RA ratio responses between LTBI and TB groups. All tested strains, except 5C7, elicited an immune response in LTBI subjects characterized by a significantly high IL-1β/IL-1RA ratio, which seems to be a hallmark of protection against active disease.
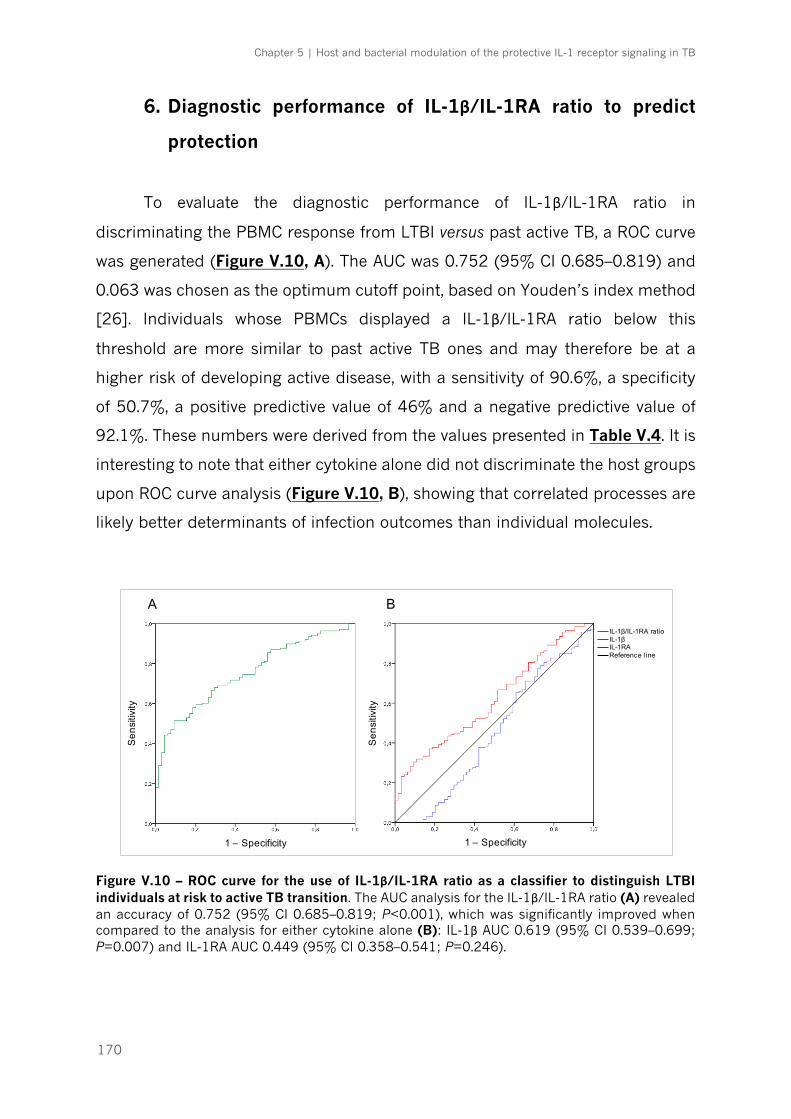
Chapter 5 | Host and bacterial modulation of the protective IL-1 receptor signaling in TB
170
6. Diagnostic performance of IL-1β/IL-1RA ratio to predict
protection
To evaluate the diagnostic performance of IL-1β/IL-1RA ratio in
discriminating the PBMC response from LTBI versus past active TB, a ROC curve
was generated (Figure V.10, A). The AUC was 0.752 (95% CI 0.685–0.819) and
0.063 was chosen as the optimum cutoff point, based on Youden’s index method
[26]. Individuals whose PBMCs displayed a IL-1β/IL-1RA ratio below this
threshold are more similar to past active TB ones and may therefore be at a
higher risk of developing active disease, with a sensitivity of 90.6%, a specificity
of 50.7%, a positive predictive value of 46% and a negative predictive value of
92.1%. These numbers were derived from the values presented in Table V.4. It is
interesting to note that either cytokine alone did not discriminate the host groups
upon ROC curve analysis (Figure V.10, B), showing that correlated processes are
likely better determinants of infection outcomes than individual molecules.
Figure V.10 – ROC curve for the use of IL-1β/IL-1RA ratio as a classifier to distinguish LTBI individuals at risk to active TB transition. The AUC analysis for the IL-1β/IL-1RA ratio (A) revealed an accuracy of 0.752 (95% CI 0.685–0.819; P<0.001), which was significantly improved when compared to the analysis for either cytokine alone (B): IL-1β AUC 0.619 (95% CI 0.539–0.699; P=0.007) and IL-1RA AUC 0.449 (95% CI 0.358–0.541; P=0.246).
Sen
sitiv
ity
Sen
sitiv
ity
1 – Specificity1 – Specificity
IL-1β
Reference lineIL-1RA
IL-1β/IL-1RA ratio
A B

Chapter 5 | Host and bacterial modulation of the protective IL-1 receptor signaling in TB
171
Table V.4 – Diagnostic performance of IL-1β/IL-1RA ratio to distinguish LTBI individuals at risk to active TB transition. A ratio below 0.063 was considered as “positive test”, or risk value. Given this cutoff point, subjects at risk of having active disease (TB) may be identified with a sensitivity of 90.6%a and a specificity of 50.7%b.
IL-1β/IL-1RA ratio LTBI, n (%) TB, n (%) Total
≥0.063 (–) 70 (50.7b) 6 (9.4) 76
<0.063 (+) 68 (49.3) 58 (90.6a) 126
Total 138 64 202
Chapter 5 | Host and bacterial modulation of the protective IL-1 receptor signaling in TB
172
DISCUSSION
Previous studies provided the evidence that M. tuberculosis strains differ in
their ability to stimulate host immune cells [9-13, 29-34]. However, the classical
setup for these studies involves the use of M. tuberculosis of different lineages to
infect immune cells of unrelated hosts. In our study, we resorted to a collection
of M. tuberculosis clinical isolates for which the outcome of TB is fully
characterized and used them to infect PBMCs of geographically related PBMCs.
Moreover, the PBMCs obtained belonged to two different groups of participants.
On one hand, we recruited individuals who were IGRA+ for longer than 2 years,
had not taken therapy for latent TB and had not developed an active TB episode.
We consider this group to encompass individuals who are naturally resistant to
active TB infection. On the other hand, we also recruited individuals who, despite
being immunocompetent, had active TB, but were subsequently cured through
successful antibiotherapy. This second group, of past TB patients, encompasses
susceptible individuals, but because they are now cured, allows for the elimination
of confounding effects caused by acute inflammatory responses related with
increased bacterial burdens during active TB. Overall, our experimental setup
allows for the investigation of different long-lasting questions in TB:
i) can we draw links between the inflammatory phenotype generated by a
specific M. tuberculosis isolate and the outcome of TB?
ii) is there a specific response observed for matched pairs of host-M.
tuberculosis infecting isolate?
iii) can we find differences between the responses of PBMCs from each
group to M. tuberculosis infection and correlate them with resistance versus
susceptibility to disease?
To answer these questions, we started by comparing the inflammatory
response triggered in PBMCs from LTBI donors by isolates associated with mild
or severe outcomes of TB. The classification basis for TB outcomes has been
described in Chapter 4. Our data clearly defined a M. tuberculosis hierarchy with
some isolates inducing low cytokine production for all cytokines tested, in a host-
Chapter 5 | Host and bacterial modulation of the protective IL-1 receptor signaling in TB
173
independent fashion. Our results were consistent with previous reports
associating high virulent strains with low inflammatory responses [11, 31, 35-42],
highlighting the notion that certain isolates of M. tuberculosis appear to have
acquired immune evasion strategies to imbalance the immune system in their
benefit [43]. Since a certain degree of association was observed between the
intensity of the inflammatory response triggered and the outcome of TB, it is
tempting to speculate that the initial threshold of the immune response may
define the course of infection. If the immune response does not reach a certain
threshold of activation, the development of the adaptive response may be delayed
[44], the growth of M. tuberculosis will not be concealed and the bacterial burden
will raise rapidly to a level that would associate with a fast-evolving severe TB.
From the evolutionary point of view, that strategy may be advantageous in the
context of high human population densities of the modern world, since even when
causing potentially fatal disease, the isolates have already provoked lung
pathology that ensued its propagation to new hosts. Conversely, a vigorous host
immune response after infection may be protective. As a practical example,
CDC1551, which is a representative of Lineage 4, was shown to induce high levels
of pro-inflammatory cytokines in monocyte cultures [9, 36]. During an outbreak
with this strain, despite an unusually high frequency of seroconversion in exposed
persons, the rate of new TB cases was not correspondingly high [45]. Thus,
despite initial strong immune response, these isolates should be able to induce a
complex network of counter-regulating pathways that limit the pathological
damage at a later stage. Corroborating this hypothesis, our results showed that
high-inflammatory isolates induce both pro- and anti-inflammatory cytokines in
similar proportions, as shown with the significant correlations between IL-1β and
IL-1RA levels, or between IL-12p40 and IL-10. This observation is in line with
previous reports [12, 29] and suggest common induction signals. It is important
to highlight that the immune responses were not uniform within each group of
severity. While top inducers were always isolates associated with mild outcome,
and the least inducers were recovered from severe cases, within the average we
observed low-inflammatory mild isolates (such as 6D3) and high-inflammatory
severe isolates (such as 6C1). This is not surprising considering that the
Chapter 5 | Host and bacterial modulation of the protective IL-1 receptor signaling in TB
174
complexity of TB is regulated by multiple and largely unknown factors. It will now
be important to search for the bacterial determinants associated with high versus
low cytokine triggering. This can be done through whole genome analysis, as
performed in Chapter 4 when investigating genetic players of differential growth.
In what respects the response triggered by specific host-bacteria pairs, our
findings demonstrate that the response of PBMCs to the bacteria that previously
infected that host is no different to that obtained for other bacteria. This can be
justified by the close proximity of the isolates used, that namely belong to the
same lineage and, most of them, same sublineage too.
Finally, when comparing the response of PBMCs from LTBI versus past
active TB donors across different isolates, several conclusions could be drawn.
Firstly, we clearly found that certain subjects were high responders whereas
others were exceptionally low responders. One possible explanation for this fact
may be linked to a differential innate recognition of M. tuberculosis strains related
with molecular diversity in human TLR genes [46] or a variety of other genetic
polymorphisms in the innate immune system that modulate the host response
[47]. Resorting to whole genome and functional analysis, we are now investigating
the host determinants underlying the observed differences. Another important
conclusion came from the comparison of the PBMC responses of LTBI donors
with those of past TB patients. We observed that PBMCs from past TB patients
secreted significantly less IL-1β, IL-12p40 and IL-10 when infected with a series
of isolates. However, their production of IL-1RA was not significatively different.
Considering that several studies show that higher IL-1β [48] and IL-10 levels [49,
50] were associated to active disease, our data suggest that bacteria clearance
with antibiotherapy brings the host immune response back to a close to basal
level. Thus, differences found between LTBI and cured TB donors are more likely
reflecting their inherent characteristics, rather than alterations due to infection.
In this context, the finding that the IL-1β/IL-1RA is differently modulated in LTBI
and past active TB participants could be explored from a biomarker point of view.
This would make sense in light of the protective role for IL-1β in TB. Particularly,
it is possible that a high IL-1β/IL-1RA ratio associates with protection from
progression to active TB, as individuals who had past TB consistently present low
Chapter 5 | Host and bacterial modulation of the protective IL-1 receptor signaling in TB
175
ratios. Long term follow-up of the LTBI participants presenting ratios below 0.063
would be useful to verify if those individuals will develop active disease. A larger
prospective longitudinal study will be needed to validate our findings. Similar
experiments in other geographical settings would also be important. Our findings
also call for deeper studies on the mechanisms modulating the production of IL-
1β and IL-1RA upon infection in cells from these different backgrounds. We are
now investigating the bases for a higher IL-1β production in some individuals,
namely a differential activation of the inflammasome, which is a critical pathway
regulating IL-1β production.
In summary, we show that the initial events of the immune response to M.
tuberculosis infection may be important determinants of the infection outcome
and that both pathogen and host molecular elements are in place to modulate
these events. Understanding these determinants will help in a better definition of
the immune response triggered to different bacteria and in defining possible
immunomodulatory strategies in the context of host-directed therapies.
Chapter 5 | Host and bacterial modulation of the protective IL-1 receptor signaling in TB
176
REFERENCES
1. World Health Organization. Global tuberculosis report 2016. Geneva: World Health Organization; 2016. 2. Houben RM, Dodd PJ. The Global Burden of Latent Tuberculosis Infection: A Re-estimation Using Mathematical Modelling. PLoS Med. 2016;13(10):e1002152. 3. Dye C, Glaziou P, Floyd K, Raviglione M. Prospects for tuberculosis elimination. Annu Rev Public Health. 2013;34:271-86. 4. Zumla A, Maeurer M; Host-Directed Therapies Network, Chakaya J, Hoelscher M, Ntoumi F, Rustomjee R, et al. Towards host-directed therapies for tuberculosis. Nat Rev Drug Discov. 2015;14(8):511-12. 5. Hossain MM, Norazmi MN. Pattern recognition receptors and cytokines in Mycobacterium tuberculosis infection--the double-edged sword? Biomed Res Int. 2013;2013:179174. 6. Comas I, Chakravartti J, Small PM, Galagan J, Niemann S, Kremer K, et al. Human T cell epitopes of Mycobacterium tuberculosis are evolutionarily hyperconserved. Nat Genet. 2010;42:498-503. 7. Rodrigo T, Caylà JA, García de Olalla P, Galdós-Tangüis H, Jansà JM, Miranda P, et al. Characteristics of tuberculosis patients who generate secondary cases. Int J Tuberc Lung Dis. 1997;1(4):352-7. 8. Osório NS, Rodrigues F, Gagneux S, Pedrosa J, Pinto-Carbó M, Castro AG, et al. Evidence for Diversifying Selection in a Set of Mycobacterium tuberculosis Genes in Response to Antibiotic- and Nonantibiotic-Related Pressure. Mol Biol Evol. 2013;30(6):1326-36. 9. Manca C, Tsenova L, Barry CE 3rd, Bergtold A, Freeman S, Haslett PA, et al. Mycobacterium tuberculosis CDC1551 induces a more vigorous host response in vivo and in vitro, but is not more virulent than other clinical isolates. J Immunol. 1999;162(11):6740-6. 10. Dormans J, Burger M, Aguilar D, Hernandez-Pando R, Kremer K, Roholl P, et al. Correlation of virulence, lung pathology, bacterial load and delayed type hypersensitivity responses after infection with different Mycobacterium tuberculosis genotypes in a BALB/c mouse model. Clin Exp Immunol. 2004;137(3):460–8. 11. Manca C, Tsenova L, Bergtold A, Freeman S, Tovey M, Musser JM, et al. Virulence of a Mycobacterium tuberculosis clinical isolate in mice is determined by failure to induce Th1 type immunity and is associated with induction of IFN-alpha/beta. Proc Natl Acad Sci U S A. 2001;98(10):5752-7. 12. Carmona J, Cruz A, Moreira-Teixeira L, Sousa C, Sousa J, Osorio NS, et al. Mycobacterium tuberculosis strains are differentially recognized by TLRs with an impact on the immune response. PLoS One. 2013;8(6):e67277. 13. Portevin D, Gagneux S, Comas I, Young D. Human macrophage responses to clinical isolates from the Mycobacterium tuberculosis complex discriminate between ancient and modern lineages. PLoS Pathog. 2011;7(3):e1001307. 14. Dubois H, Wullaert A, Lamkanfi M. General strategies in inflammasome biology. Curr Top Microbiol Immunol. 2016;397:1-22. 15. Mishra BB, Moura-Alves P, Sonawane A, Hacohen N, Griffiths G, Moita LF, et al. Mycobacterium tuberculosis protein ESAT-6 is a potent activator of the NLRP3/ASC inflammasome. Cell Microbiol. 2010;12(8):1046-63. 16. Rathinam VA, Jiang Z, Waggoner SN, Sharma S, Cole LE, Waggoner L, et al. The AIM2 inflammasome is essential for host defense against cytosolic bacteria and DNA viruses. Nat Immunol. 2010;11(5):395–402. 17. Mayer-Barber KD, Barber DL, Shenderov K, White SD, Wilson MS, Cheever A, et al. Caspase-1 independent IL-1beta production is critical for host resistance to mycobacterium tuberculosis and does not require TLR signaling in vivo. J Immunol. 2010;184(7):3326-30. 18. McElvania Tekippe E, Allen IC, Hulseberg PD, Sullivan JT, McCann JR, Sandor M, et al. Granuloma formation and host defense in chronic Mycobacterium tuberculosis infection requires PYCARD/ASC but not NLRP3 or caspase-1. PLoS One. 2010;5(8):e12320. 19. Condos R, Rom WN, Liu YM, Schluger NW. Local immune responses correlate with presentation and outcome in tuberculosis. Am J Respir Crit Care Med. 1998;157(3 Pt 1):729-35.
Chapter 5 | Host and bacterial modulation of the protective IL-1 receptor signaling in TB
177
20. Tsao TC, Li L, Hsieh M, Liao S, Chang KS. Soluble TNF-alpha receptor and IL-1 receptor antagonist elevation in BAL in active pulmonary TB. Eur Respir J. 1999;14(3):490-5. 21. Lopalco G, Rigante D, Giannini M, Galeazzi M, Lapadula G, Iannone F, et al. Safety profile of anakinra in the management of rheumatologic, metabolic and autoinflammatory disorders. Clin Exp Rheumatol. 2016;34(3):531-8. 22. Cantarini L, Lopalco G, Caso F, Costa L, Iannone F, Lapadula G, et al. Effectiveness and tuberculosis-related safety profile of interleukin-1 blocking agents in the management of Behçet's disease. Autoimmun Rev. 2015;14(1):1-9. 23. Guarda G, Braun M, Staehli F, Tardivel A, Mattmann C, Förster I, et al. Type I interferon inhibits interleukin-1 production and inflammasome activation. Immunity. 2011;34(2):213-23. 24. Berry MP, Graham CM, McNab FW, Xu Z, Bloch SA, Oni T, et al. An interferon-inducible neutrophil-driven blood transcriptional signature in human tuberculosis. Nature. 2010;466(7309):973-7. 25. World Health Organization. Guidelines for treatment of tuberculosis - 4rd edition Geneva: World Health Organization; 2010. 26. Fluss R, Faraggi D, Reiser B. Estimation of the Youden index and its associated cutoff point. Biom J. 2005;47(4):458-72. 27. van Crevel R, van der Ven-Jongekrijg J, Netea MG, de Lange W, Kullberg BJ, van der Meer JW. Disease-specific ex vivo stimulation of whole blood for cytokine production: applications in the study of tuberculosis. J Immunol Methods. 1999;222(1-2):145-53. 28. Li Y, Oosting M, Deelen P, Ricaño-Ponce I, Smeekens S, Jaeger M, et al. Inter-individual variability and genetic influences on cytokine responses to bacteria and fungi. Nat Med. 2016;22(8):952-60. 29. Wang C, Peyron P, Mestre O, Kaplan G, van Soolingen D, Gao Q, et al. Innate immune response to Mycobacterium tuberculosis Beijing and other genotypes. PLoS One. 2010;5(10):e13594. 30. Krishnan N, Malaga W, Constant P, Caws M, Tran TH, Salmons J, et al. Mycobacterium tuberculosis lineage influences innate immune response and virulence and is associated with distinct cell envelope lipid profiles. PLoS One. 2011;6(9):e23870. 31. Sarkar R, Lenders L, Wilkinson KA, Wilkinson RJ, Nicol MP. Modern lineages of Mycobacterium tuberculosis exhibit lineage-specific patterns of growth and cytokine induction in human monocyte-derived macrophages. PLoS One. 2012;7(8):e43170. 32. López B, Aguilar D, Orozco H, Burger M, Espitia C, Ritacco V, et al. A marked difference in pathogenesis and immune response induced by different Mycobacterium tuberculosis genotypes. Clin Exp Immunol. 2003;133(1):30-7. 33. Dunn PL, North RJ. Virulence ranking of some Mycobacterium tuberculosis and Mycobacterium bovis strains according to their ability to multiply in the lungs, induce lung pathology, and cause mortality in mice. Infect Immun. 1995;63(9):3428-37. 34. Aguilar D, Hanekom M, Mata D, Gey van Pittius NC, van Helden PD, Warren RM, et al. Mycobacterium tuberculosis strains with the Beijing genotype demonstrate variability in virulence associated with transmission. Tuberculosis. 2010;90(5):319-25. 35. Li Q, Whalen CC, Albert JM, Larkin R, Zukowski L, Cave MD, et al. Differences in rate and variability of intracellular growth of a panel of Mycobacterium tuberculosis clinical isolates within a human monocyte model. Infect Immun. 2002;70(11):6489-93. 36. Manca C, Reed MB, Freeman S, Mathema B, Kreiswirth B, Barry CE 3rd, et al. Differential monocyte activation underlies strain-specific Mycobacterium tuberculosis pathogenesis. Infect Immun. 2004;72(9):5511-4. 37. Manca C, Tsenova L, Freeman S, Barczak AK, Tovey M, Murray PJ, et al. Hypervirulent M. tuberculosis W/Beijing strains upregulate type I IFNs and increase expression of negative regulators of the Jak-Stat pathway. J Interferon Cytokine Res. 2005;25(11):694-701. 38. Tsenova L, Ellison E, Harbacheuski R, Moreira AL, Kurepina N, Reed MB, et al. Virulence of selected Mycobacterium tuberculosis clinical isolates in the rabbit model of meningitis is dependent on phenolic glycolipid produced by the bacilli. J Infect Dis. 2005;192(1):98-106. 39. Chacón-Salinas R, Serafín-López J, Ramos-Payán R, Méndez-Aragón P, Hernández-Pando R, Van Soolingen D, et al. Differential pattern of cytokine expression by macrophages infected in vitro with different Mycobacterium tuberculosis genotypes. Clin Exp Immunol. 2005;140(3):443-9.
Chapter 5 | Host and bacterial modulation of the protective IL-1 receptor signaling in TB
178
40. Rocha-Ramírez LM, Estrada-García I, López-Marín LM, Segura-Salinas E, Méndez-Aragón P, Van Soolingen D, et al. Mycobacterium tuberculosis lipids regulate cytokines, TLR-2/4 and MHC class II expression in human macrophages. Tuberculosis. 2008;88(3):212-20. 41. Subbian S, Bandyopadhyay N, Tsenova L, O'Brien P, Khetani V, Kushner NL, et al. Early innate immunity determines outcome of Mycobacterium tuberculosis pulmonary infection in rabbits. Cell Commun Signal. 2013;11:60. 42. Reiling N, Homolka S, Walter K, Brandenburg J, Niwinski L, Ernst M, et al. Clade-specific virulence patterns of Mycobacterium tuberculosis complex strains in human primary macrophages and aerogenically infected mice. MBio. 2013;4(4):e00250-13. 43. Newton SM, Smith RJ, Wilkinson KA, Nicol MP, Garton NJ, Staples KJ, et al. A deletion defining a common Asian lineage of Mycobacterium tuberculosis associates with immune subversion. Proc Natl Acad Sci U S A. 2006;103(42):15594-8. 44. Rakotosamimanana N, Raharimanga V, Andriamandimby SF, Soares JL, Doherty TM, Ramarokoto H, et al. Variation in IFN-{gamma} responses to different infecting strains of Mycobacterium tuberculosis in AFB smear positive patients and household contacts in Antananarivo, Madagascar. Clin Vaccine Immunol. 2010;17(7):1094–103. 45. Valway SE, Sanchez MP, Shinnick TF, Orme I, Agerton T, Hoy D, et al. An outbreak involving extensive transmission of a virulent strain of Mycobacterium tuberculosis. N Engl J Med. 1998;338(10):633-9. 46. Velez DR, Wejse C, Stryjewski ME, Abbate E, Hulme WF, Myers JL, et al. Variants in toll-like receptors 2 and 9 influence susceptibility to pulmonary tuberculosis in Caucasians, African-Americans, and West Africans. Hum Genet. 2010;127:65-73. 47. Azad AK, Sadee W, Schlesinger LS. Innate immune gene polymorphisms in tuberculosis. Infect Immun. 2012;80:3343–59. 48. Prabhavathi M, Kabeer BS, Deenadayalan A, Raja A. Role of QuantiFERON-TB Gold antigen-specific IL-1β in diagnosis of active tuberculosis. Med Microbiol Immunol. 2015;204(5):567-74. 49. Tebruegge M, Dutta B, Donath S, Ritz N, Forbes B, Camacho-Badilla K, et al. Mycobacteria-Specific Cytokine Responses Detect Tuberculosis Infection and Distinguish Latent from Active Tuberculosis. Am J Respir Crit Care Med. 2015;192(4):485-99. 50. Jeong YH, Hur YG, Lee H, Kim S, Cho JE, Chang J, et al. Discrimination between active and latent tuberculosis based on ratio of antigen-specific to mitogen-induced IP-10 production. J Clin Microbiol. 2015;53(2):504-10.

179
CHAPTER 6 – GENERAL DISCUSSION ____________________________________________________________

180
Chapter 6 | General Discussion
181
In 2015 tuberculosis (TB) remained the main cause of death by a single
infectious agent and one of the top 10 causes of death overall [1]. Not only the
high number of active TB patients, but also the massive reservoir of latently
infected individuals hamper TB control, putting at risk the elimination target set
to 2050 [2, 3]. To effectively address these two groups, an understanding of the
course of infection in different individuals is needed, so that treatment measures
could be applied in a rational way to those at higher risk of disease. Indeed,
clinical biomarkers of progression along the continuous spectrum of TB, from
latent to active forms, are just starting to be unveiled [4-9] and many observations
indicate a role of the host immune response in this process [10-17]. Overall,
available evidence shows that the immune condition of an infected host is going
to be shaped by genetics and by extrinsic factors that alter the local micro-
environment [18], but also by the heterogeneity of the infecting bacteria [19].
Altogether, this troika determines the threshold of the immune response
generated during infection and consequently the disease outcome. Modulating
these thresholds and uncovering the links between host, pathogen and micro-
environments should allow for the discovery of solid correlates of protection,
molecular markers for disease prognosis, and the development of safe and
effective host-directed therapies (HDT) to TB [20-22].
The starting point of the current project was to understand which
mechanisms underlie TB clinical heterogeneity. We approached this question
from different angles, by combining the study of the pathogen properties, the
host immune response and the clinical features of TB, within a cohort of 681
culture-confirmed pulmonary TB cases diagnosed at the Hospital de São João, a
major healthcare center in Porto, Portugal, between 2007 and 2013. Such a
cohort, where for each patient the clinical files and the infecting Mycobacterium
tuberculosis isolate were available, provided the foundations for this work.
We started by examining the clinical files for all patients with culture-
confirmed TB, which led to the establishment of a clinical prediction rule to
stratify TB patients according to their risk of death [23]. The proposed prediction
model was named TReAT (Tuberculosis Risk Assessment Tool) and presented as
Chapter 6 | General Discussion
182
major strengths (1) the clear definition of the predictor variables (age; presence
of comorbidities; disease extent determined by respiratory failure and one
radiographic feature; and a measure of consumption or overall nutritional status,
the hemoglobin level), and (2) an external validation in an independent cohort,
attesting the general applicability to both hospital and ambulatory settings. In
addition to understand the main severity factors in TB, which generally are
confirmed with previous studies [24-33], we provided a prognosis tool to identify
high-risk cases, that often have rapidly progressive disease and are at major risk
of dying within the first 30 days after diagnosis. We discuss that this particular
group need a stricter medical supervision and may benefit on the admission in
high-dependency units. As TB incidence rates decrease with a combination of
near-universal access to high-quality diagnosis and treatment and general
socioeconomic development, it is expected that the TB death rate will become
one of the core indicators for disease control [34]. In this context, the
implementation of TReAT may improve treatment outcomes. Current efforts are
being made to plan a prospective validation study in a different location.
After focusing on the host clinical indicators associated with the prognosis
of death in TB patients, in the second part of the project we wanted to assess the
impact of M. tuberculosis diversity on the disease clinical severity. We started by
developing a clinical decision tree to classify the severity of the disease and by
applying it to the group of individuals that in our cohort did not present known
predictor or precipitator TB factors [35]. The disease presentation in these
“otherwise healthy” TB patients was classified into 5 possible outcomes: mild,
moderate, severe, extremely severe and disseminated. Whereas disseminated TB
in immunocompetent hosts appeared to correlate with the natural course of
disease, individuals within the mild, moderate or severe presented similar time of
symptoms. Thus, these 3 categories most likely reflect an outcome of disease
resulting from different factors or events, and not simply reflecting the course of
infection. The most common outcome for the “otherwise healthy” group was the
moderate TB. It is possible that the moderate isolates represent the most
successful group of M. tuberculosis complex (MTBC) strains, that has evolved to
interact with the immune cells and cause destructive cavitary lung lesions, a
Chapter 6 | General Discussion
183
marker of high transmissible disease [36], but only mildly inflicting systemic
deleterious effects, so that the host is able to continue at ambulatory for enough
time to keep spreading the disease. Further studies are now being pursued to
decipher how the presence of major TB comorbidities, as HIV and diabetes, alter
this disease presentation.
Next we investigated the M. tuberculosis phylogeny within the “otherwise
healthy” individuals and its phylogenetic distribution along the disease severity.
We found a highly homogeneous phylogenetic composition, with almost all
isolates belonging to Lineage 4 (Euro-American) and within this family, the
majority of them to sublineage Latin-American-Mediterranean (LAM). This is in
line with previous descriptions for Portugal [37, 38]. These results are also
consistent with the fact that the vast majority of subjects included in the study
were Portuguese-born Caucasians, thus further supporting the described
phylogeographical structure of MTBC population [39]. The phylogenetic
classification of the MTBC provided the rational framework for a number of
studies around the world linking the genotypic diversity of MTBC to heterogeneity
in clinical phenotypes [40-53]. In the present study, disease severity was not
related to any specific phylogenetic taxa, although a decrease on the prevalence
of the LAM sublineage was observed from mild to moderate to severe forms of
disease. This is indicative that any bacterial contribution to the outcome of
disease in “otherwise healthy” TB patients is not due to ancestral events, but
instead to the occurrence of microevolution. We are currently addressing the
distribution of the different phylogenies in patients with a disrupted immune
system (such as HIV) to investigate for the loss of any sympatric interactions
between M. tuberculosis and its host in our specific cohort. We are also performing
whole genome analysis to compare isolates associated with mild or severe
disease, with the goal of finding traceable variations that could be used as
prognosis of disease outcomes.
Although no association was found between the ancestry of the infecting
isolate and the clinical outcome of TB, our results showed a correlation between
the growth patterns of MTBC strains and the TB clinical severity. Isolates obtained
from patients with mild disease grew significantly slower in liquid media. These
Chapter 6 | General Discussion
184
isolates generally caused non-cavitary lung disease and minimal symptoms. We
propose that limited growth may be one of the features required for decreased
virulence. Similar associations have been described previously with Lineage 3,
that was reported to be less transmissible compared to other modern lineages
[54], and also grows slowly in liquid broth [55-57]. Likewise, Lineage 6
(Mycobacterium africanum West-Africa 2) exhibits slower progression to active
disease [51] and slower growth rate [58]. Although growth in liquid broth only
partially reflects the much more complex infection pathogenesis in humans, this
method has already proved to be well suited to compare the growth behaviour of
different bacterial isolates [58]. Conversely, moderate and severe strains present
higher growth rates, with doubling times shorter by 4-5 h, when compared to
mild isolates. In particular, isolates associated to moderate outcomes showed a
remarkably distinct growth pattern, characterized by a longer lag phase, followed
by a steep exponential phase, that is related to a very short doubling time (around
15 h), and finally reaching the highest plateau. The clinical relevance of this
finding is still unclear, but may contribute for the success of this group of strains,
as described above in the context of its prevalence in the present cohort. Previous
studies have assessed intracellular growth of M. tuberculosis in human
macrophages as a marker of virulence [59-62]. Furthermore, one study
demonstrated that the Beijing-family strain 210 (Lineage 2), responsible for an
outbreak in Los Angeles, grows more rapidly than small cluster or unique cluster
strains in human macrophages [63]. It will now be important to understand if the
growth differences reported hold in infected cells and organisms. For this, we will
perform experiments using in vitro macrophage culture systems and the mouse
model of infection.
To unveil the underlying mechanisms for the observed differences in the
growth profiles, we compared the genome sequences of fast growing (moderate)
strains with the slow growing isolates (associated to mild and severe clinical
outcome). We found single nucleotide polymorphisms (SNPs) in 1135 genes, with
varying levels of allelic differences between groups. Only 83 (7.3%) genes had
allelic differences greater than 40% (∆DAF >0.4), while the large majority of SNPs
formed a cluster below ∆DAF 0.4. The top ∆DAF was found for the gene ctpF,
Chapter 6 | General Discussion
185
encoding a P-type ATPase of the plasma membrane [64], which is responsible
for generating the electrochemical gradient necessary for transmembrane ion
transport, possibly Mg2+ or Ca2+ [65]. Previous evidence suggest that this gene is
upregulated under hypoxic environment [66] and helps to protect mycobacteria
against toxic heavy-metal cation levels, as well as maintaining cell volume in
hostile conditions and nutrient transport across the cell membrane [67]. The
transporter function was overrepresented in the unbiased analysis. Future studies
will be dedicated to the functional implications of our bioinformatics predictions.
When we investigated the group of genes already determined to affect in
vitro [68] and in vivo [69] growth, of the 16 genes presenting ∆DAF >0.4, nine
presented non-synonymous SNPs. In particular, three gene products (Rv2252,
pgi, hisI) were predicted by SIFT analysis to be affected in their protein function.
These three proteins are the most likely candidates responsible for the observed
profile of fast growing isolates. The candidates are involved in essential biological
pathways, such as protein synthesis (hisI), cellular metabolism (pgi) and
biosynthesis of cell envelope components (Rv2252).
In addition to previously characterized pathways, many genes identified in
the unbiased genome-wide analysis are conserved hypotheticals with unknown
function. Further biological validation on these loci is warranted. This is important,
because the identification of the pathways that are required for mycobacterial
growth provide insight into the structural and metabolic requirements of the
pathogen and may direct the rational design of effective antimicrobial agents
towards new molecular targets in the moderate-to-severe and drug-resistant
strains.
Finally, in the third part of this work, we studied the architecture of the
immune response triggered by the different isolates of M. tuberculosis associated
with mild and severe phenotypes in peripheral blood mononuclear cells (PBMCs)
from latent TB infected (LTBI) donors or past TB patients. Although many studies
provide evidence that M. tuberculosis strains differ in their ability to stimulate the
host immune cells [57, 70-79], the links of inflammatory phenotypes with clinical
outcomes remain elusive. Our findings clearly show that even within a relatively
homogeneous group of M. tuberculosis isolates, diversity in the cytokine
Chapter 6 | General Discussion
186
production triggered in PBMCs existed. Certain isolates of M. tuberculosis appear
to have acquired immune evasion strategies to reduce the cellular response at
early stages of infection. As these low inflammatory isolates tended to be
associated with severe outcomes of TB, it is possible that this adaptation occurs
in the pathogen benefit, with a permissive immune response allowing the rapid
mycobacterial growth that induces exacerbated lung pathology [56, 57, 59, 76,
80-86]. From the evolutionary point of view, that strategy may be advantageous
in the context of high human population densities of the modern world, since
even when severe strains cause potentially fatal disease, the isolates have already
provoked large pulmonary cavitations that ensued its propagation to new hosts.
To gain more insight in this association, a higher number of isolates needs to be
tested.
Interestingly, this strain-related hierarchy in the response induced in
PBMCs upon infection was maintained across multiple human donors,
independently of being LTBI or past TB participants. This strongly suggests the
existence of bacterial molecular determinants associated with high versus low
triggers. As before, whole genome comparisons might prove useful to identify and
study these molecular signatures. Also, comparing the progression of infection
with two extreme bacterial examples in mice might provide important information
about the consequences of the differential initial interaction to the course of the
immune response, bacterial burdens and tissue pathology.
Despite the importance of the bacteria in determining the intensity of the
immune response, we also observed that some donors were consistently high
responders and others were exceptionally low responders, even for high-inducing
strains. Therefore, host factors also play a role in determining the final cytokine
response against each clinical isolate. It is plausible that a diverse range of
mutations might influence the innate immune recognition of the pathogen,
something that is now under study in the lab.
One of the most interesting findings in this work relates to the identification
of the IL-1β/IL-1RA ratio as a possible discriminator of latently infected
individuals. We found that independently of the M. tuberculosis isolate used to
infect PBMCs, two possible responses were observed: a high IL-1β/IL-1RA ratio,
Chapter 6 | General Discussion
187
which was only observed in a subgroup of LTBI participants; and a low IL-1β/IL-
1RA ratio, which was observed in some LTBI participants and in all past TB ones.
These two groups could be discriminated with a ROC curve analysis, showing that
despite the still low numbers, a robust result is already obtained. Assuming a
genetic basis for this observation, we are impelled to think that individuals with a
high ratio may be at a less risk of progressing to active TB disease. However,
because in active TB a high production of IL-1β has been reported [87], it is also
possible that latent participants with a high ratio may actually represent a
subgroup of individuals still undergoing a dynamic fight with the bacteria,
providing evidence for trained immunity [88]. To clarify these various possibilities
similar experiments performed with more participants in these two groups and
also with IGRA negative and active TB participants will be required. In any case,
it is tempting to speculate that an imbalance of the IL-1 receptor signalling might
be a biomarker of susceptibility to active disease after infection. This in turn
awaits validation in prospective studies, being now planned in the lab. Clarifying
this issue is of utmost importance as it would provide a platform for rational
management of LTBI, namely by highlighting those individuals who would benefit
more from preventive antibiotherapy.
In summary, this work combined the study of clinical data, infecting
bacteria and human PBMC responses to M. tuberculosis. A new clinical prediction
rule for the risk of death in TB patients was developed and validated, and a new
classification tree for TB severity was proposed. On the pathogen side, we
unveiled the differential growth of clinical isolates associated with moderate
outcomes of TB as a distinctive feature. On the host side, we suggest the ratio IL-
1β/IL-1RA as a possible biomarker of disease resistance versus susceptibility to
TB. This way, we believe that our findings present new platforms for active and
latent TB management and open new avenues for basic research, to unveil host
and pathogen determinants of TB outcomes.
Chapter 6 | General Discussion
188
REFERENCES
1. World Health Organization. Global tuberculosis report 2016. Geneva: World Health Organization; 2016. 2. Houben RM, Dodd PJ. The Global Burden of Latent Tuberculosis Infection: A Re-estimation Using Mathematical Modelling. PLoS Med. 2016;13(10):e1002152. 3. Dye C, Glaziou P, Floyd K, Raviglione M. Prospects for tuberculosis elimination. Annu Rev Public Health. 2013;34:271-86. 4. Kim IJ, Lee JS, Kim SJ, Kim YK, Jeong YJ, Jun S, et al. Double-phase 18F-FDG PET-CT for determination of pulmonary tuberculoma activity. Eur J Nucl Med Mol Imaging. 2008;35(4):808-14. 5. Lin PL, Rodgers M, Smith L, Bigbee M, Myers A, Bigbee C, et al. Quantitative comparison of active and latent tuberculosis in the cynomolgus macaque model. Infect Immun. 2009;77(10):4631-42. 6. Berry MP, Graham CM, McNab FW, Xu Z, Bloch SA, Oni T, et al. An interferon-inducible neutrophil-driven blood transcriptional signature in human tuberculosis. Nature. 2010;466(7309):973-7. 7. Weiner J 3rd, Parida SK, Maertzdorf J, Black GF, Repsilber D, Telaar A, et al. Biomarkers of inflammation, immunosuppression and stress with active disease are revealed by metabolomic profiling of tuberculosis patients. PLoS One. 2012;7(7):e40221. 8. Kaforou M, Wright VJ, Oni T, French N, Anderson ST, Bangani N, et al. Detection of tuberculosis in HIV-infected and -uninfected African adults using whole blood RNA expression signatures: a case-control study. PLoS Med. 2013;10(10):e1001538. 9. Lin PL, Ford CB, Coleman MT, Myers AJ, Gawande R, Ioerger T, et al. Sterilization of granulomas is common in active and latent tuberculosis despite within-host variability in bacterial killing. Nat Med. 2014;20(1):75-9. 10. Cooper AM, Mayer-Barber KD, Sher A. Role of innate cytokines in mycobacterial infection. Mucosal Immunol. 2011;4(3):252-60. 11. Cooper AM. Cell-mediated immune response in TB. Annu Rev Immunol. 2009;27:393-422. 12. O'Garra A, Redford PS, McNab FW, Bloom CI, Wilkinson RJ, Berry MP. The immune response in tuberculosis. Annu Rev Immunol. 2013;31:475–527. 13. Dorhoi A, Reece ST, Kaufmann SH. For better or for worse: the immune response against Mycobacterium tuberculosis balances pathology and protection. Immunol Rev. 2011;240(1):235-51. 14. Sia JK, Georgieva M, Rengarajan J. Innate Immune Defenses in Human Tuberculosis: An Overview of the Interactions between Mycobacterium tuberculosis and Innate Immune Cells. J Immunol Res. 2015;2015:747543. 15. Nunes-Alves C, Booty MG, Carpenter SM, Jayaraman P, Rothchild AC, Behar SM. In search of a new paradigm for protective immunity to TB. Nat Rev Microbiol. 2014;12(4):289-99. 16. Jasenosky LD, Scriba TJ, Hanekom WA, Goldfeld AE. T cells and adaptive immunity to Mycobacterium tuberculosis in humans. Immunol Rev. 2015;264(1):74-87. 17. Cliff JM, Kaufmann SH, McShane H, van Helden P, O'Garra A. The human immune response to tuberculosis and its treatment: a view from the blood. Immunol Rev. 2015;264(1):88-102. 18. Esmail H, Barry CE 3rd, Young DB, Wilkinson RJ. The ongoing challenge of latent tuberculosis. Philos Trans R Soc Lond B Biol Sci. 2014;369(1645):20130437. 19. Coscolla M, Gagneux S. Does M. tuberculosis genomic diversity explain disease diversity? Drug Discov Today Dis Mech. 2010;7(1):e43. 20. Zumla A, Maeurer M; Host-Directed Therapies Network, Chakaya J, Hoelscher M, Ntoumi F, Rustomjee R, et al. Towards host-directed therapies for tuberculosis. Nat Rev Drug Discov. 2015;14(8):511-12. 21. Zumla A, Maeurer M, Host-Directed Therapies Network (HDT-NET) Consortium. Host-directed therapies for tackling multi-drug resistant tuberculosis: learning from the Pasteur-Bechamp debates. Clin Infect Dis. 2015;61(9):1432–8.
Chapter 6 | General Discussion
189
22. Wallis RS, Hafner R. Advancing host-directed therapy for tuberculosis. Nat Rev Immunol. 2015;15(4):255–63. 23. Bastos HN, Osório NS, Castro AG, Ramos A, Carvalho T, Meira L, et al. A prediction rule to stratify mortality risk of patients with pulmonary tuberculosis. PLoS One. 2016;11(9):e0162797. 24. Lefebvre N, Falzon D. Risk factors for death among tuberculosis cases: analysis of European surveillance data. Eur Respir J. 2008;31(6):1256-60. 25. Low S, Ang LW, Cutter J, James L, Chee CB, Wang YT, et al. Mortality among tuberculosis patients on treatment in Singapore. Int J Tuberc Lung Dis. 2009;13(3):328-34. 26. Walpola HC, Siskind V, Patel AM, Konstantinos A, Derhy P. Tuberculosis-related deaths in Queensland, Australia, 1989-1998: characteristics and risk factors. Int J Tuberc Lung Dis. 2003;7(8):742-50. 27. Horita N, Miyazawa N, Yoshiyama T, Sato T, Yamamoto M, Tomaru K, et al. Development and validation of a tuberculosis prognostic score for smear-positive in-patients in Japan. Int J Tuberc Lung Dis. 2013;17(1):54-60. 28. Lui G, Wong RY, Li F, Lee MK, Lai RW, Li TC, et al. High mortality in adults hospitalized for active tuberculosis in a low HIV prevalence setting. PLoS One. 2014;9(3):e92077. 29. Wejse C, Gustafson P, Nielsen J, Gomes VF, Aaby P, Andersen PL, et al. TBscore: Signs and symptoms from tuberculosis patients in a low-resource setting have predictive value and may be used to assess clinical course. Scand J Infect Dis. 2008;40(2):111-20. 30. Isanaka S, Mugusi F, Urassa W, Willett WC, Bosch RJ, Villamor E, et al. Iron deficiency and anemia predict mortality in patients with tuberculosis. J Nutr. 2012;142(2):350-7. 31. Marcy O, Laureillard D, Madec Y, Chan S, Mayaud C, Borand L, et al. Causes and Determinants of Mortality in HIV-Infected Adults With Tuberculosis: An Analysis From the CAMELIA ANRS 1295-CIPRA KH001 Randomized Trial. Clin Infect Dis. 2014;59(3):435-45. 32. Lanoix JP, Gaudry S, Flicoteaux R, Ruimy R, Wolff M. Tuberculosis in the intensive care unit: a descriptive analysis in a low-burden country. Int J Tuberc Lung Dis. 2014;18(5):581-7. 33. Balkema CA, Irusen EM, Taljaard JJ, Koegelenberg CF. Tuberculosis in the intensive care unit: a prospective observational study. Int J Tuberc Lung Dis. 2014;18(7):824-30. 34. Pontali E, Centis R, D'Ambrosio L, Migliori GB. Monitoring predictors of mortality: A necessary action to reach TB elimination. Rev Port Pneumol. 2015;21(6):295-8. 35. H. Esmail, C. E. Barry, 3rd, D. B. Young, R. J. Wilkinson. The ongoing challenge of latent tuberculosis. Philos Trans R Soc Lond B Biol Sci. 2014;369(1645):20130437. doi: 10.1098/rstb.2013.0437. PubMed PMID: 24821923; PubMed Central PMCID: PMC4024230. 36. Rodrigo T, Caylà JA, García de Olalla P, Galdós-Tangüis H, Jansà JM, Miranda P, et al. Characteristics of tuberculosis patients who generate secondary cases. Int J Tuberc Lung Dis. 1997;1(4):352-7. 37. Lopes JS, Marques I, Soares P, Nebenzahl-Guimaraes H, Costa J, Miranda A, et al. SNP typing reveals similarity in Mycobacterium tuberculosis genetic diversity between Portugal and Northeast Brazil. Infect Genet Evol. 2013;18:238-46. 38. Stucki D, Brites D, Jeljeli L, Coscolla M, Liu Q, Trauner A, et al. Mycobacterium tuberculosis lineage 4 comprises globally distributed and geographically restricted sublineages. Nat Genet. 2016;48(12):1535-43. 39. Gagneux S. Host–pathogen coevolution in human tuberculosis. Phil Trans R Soc B. 2012;367(1590):850–9. 40. Caws M, Thwaites G, Dunstan S, Hawn TR, Lan NT, Thuong NT, et al. The influence of host and bacterial genotype on the development of disseminated disease with Mycobacterium tuberculosis. PLoS Pathog. 2008;4(3):e1000034. 41. Kong Y, Cave MD, Zhang L, Foxman B, Marrs CF, Bates JH, et al. Association between Mycobacterium tuberculosis Beijing/W lineage strain infection and extrathoracic tuberculosis: Insights from epidemiologic and clinical characterization of the three principal genetic groups of M. tuberculosis clinical isolates. J Clin Microbiol. 2007;45(2):409-14. 42. Kong Y, Cave MD, Yang D, Zhang L, Marrs CF, Foxman B, et al. Distribution of insertion- and deletion-associated genetic polymorphisms among four Mycobacterium tuberculosis phospholipase C genes and associations with extrathoracic tuberculosis: a population-based study. J Clin Microbiol. 2005;43(12):6048-53.
Chapter 6 | General Discussion
190
43. Lari N, Rindi L, Cristofani R, Rastogi N, Tortoli E, Garzelli C. Association of Mycobacterium tuberculosis complex isolates of M. bovis and Central Asian (CAS) genotypic lineages with extrapulmonary disease. Clin Microbiol Infect. 2009;15(6):538-43. 44. Stavrum R, PrayGod G, Range N, Faurholt-Jepsen D, Jeremiah K, Faurholt-Jepsen M, et al. Increased level of acute phase reactants in patients infected with modern Mycobacterium tuberculosis genotypes in Mwanza, Tanzania. BMC Infect Dis. 2014;14:309. 45. Parwati I, Alisjahbana B, Apriani L, Soetikno RD, Ottenhoff TH, van der Zanden AG, et al. Mycobacterium tuberculosis Beijing genotype is an independent risk factor for tuberculosis treatment failure in Indonesia. J Infect Dis. 2010;201(4):553-7. 46. Lan NT, Lien HT, Tung le B, Borgdorff MW, Kremer K, van Soolingen D. Mycobacterium tuberculosis Beijing genotype and risk for treatment failure and relapse, Vietnam. Emerg Infect Dis. 2003;9(12):1633-5. 47. Sun YJ, Lee AS, Wong SY, Paton NI. Association of Mycobacterium tuberculosis Beijing genotype with tuberculosis relapse in Singapore. Epidemiol Infect. 2006;134(2):329-32. 48. Ford CB, Shah RR, Maeda MK, Gagneux S, Murray MB, Cohen T, et al. Mycobacterium tuberculosis mutation rate estimates from different lineages predict substantial differences in the emergence of drug-resistant tuberculosis. Nat Genet. 2013;45(7):784-90. 49. Wollenberg KR, Desjardins CA, Zalutskaya A, Slodovnikova V, Oler AJ, Quiñones M, et al. Whole genome sequencing of Mycobacterium tuberculosis provides insight into the evolution and genetic composition of drug-resistant tuberculosis in Belarus. J Clin Microbiol. 2016. Epub Nov 30. doi: 10.1128/JCM.02116-16. 50. Gurjav U, Erkhembayar B, Burneebaatar B, Narmandakh E, Tumenbayar O, Hill-Cawthorne GA, et al. Transmission of multi-drug resistant tuberculosis in Mongolia is driven by Beijing strains of Mycobacterium tuberculosis resistant to all first-line drugs. Tuberculosis. 2016;101:49-53. 51. de Jong BC, Hill PC, Aiken A, Awine T, Antonio M, Adetifa IM, et al. Progression to active tuberculosis, but not transmission, varies by Mycobacterium tuberculosis lineage in The Gambia. J Infect Dis. 2008;198(7):1037–43. 52. Kato-Maeda M, Kim EY, Flores L, Jarlsberg LG, Osmond D, Hopewell PC. Differences among sublineages of the East-Asian lineage of Mycobacterium tuberculosis in genotypic clustering. Int J Tuberc Lung Dis. 2010;14(5):538-44. 53. Gehre F, Antonio M, Faïhun F, Odoun M, Uwizeye C, de Rijk P, et al. The first phylogeographic population structure and analysis of transmission dynamics of M. africanum West African 1--combining molecular data from Benin, Nigeria and Sierra Leone. PLoS One. 2013;8(10):e77000. 54. Albanna AS, Reed MB, Kotar KV, Fallow A, McIntosh FA, Behr MA, et al. Reduced transmissibility of East African Indian strains of Mycobacterium tuberculosis. PLoS One. 2011;6(9):e25075. 55. Tanveer M, Hasan Z, Kanji A, Hussain R, Hasan R. Reduced TNF-alpha and IFN-gamma responses to Central Asian strain 1 and Beijing isolates of Mycobacterium tuberculosis in comparison with H37Rv strain. Trans R Soc Trop Med Hyg. 2009;103(6):581-7. 56. Newton SM, Smith RJ, Wilkinson KA, Nicol MP, Garton NJ, Staples KJ, et al. A deletion defining a common Asian lineage of Mycobacterium tuberculosis associates with immune subversion. Proc Natl Acad Sci U S A. 2006;103(42):15594-8. 57. Sarkar R, Lenders L, Wilkinson KA, Wilkinson RJ, Nicol MP. Modern lineages of Mycobacterium tuberculosis exhibit lineage-specific patterns of growth and cytokine induction in human monocyte-derived macrophages. PLoS One. 2012;7(8):e43170. 58. Gehre F, Otu J, DeRiemer K, de Sessions PF, Hibberd ML, Mulders W, et al. Deciphering the growth behaviour of Mycobacterium africanum. PLoS Negl Trop Dis. 2013;7(5):e2220. 59. Li Q, Whalen CC, Albert JM, Larkin R, Zukowski L, Cave MD, et al. Differences in rate and variability of intracellular growth of a panel of Mycobacterium tuberculosis clinical isolates within a human monocyte model. Infect Immun. 2002;70(11):6489-93. 60. Zhang M, Gong J, Yang Z, Samten B, Cave MD, Barnes PF. Enhanced capacity of a widespread strain of Mycobacterium tuberculosis to grow in human macrophages. J Infect Dis. 1999;179(5):1213–7. 61. Hoal-van Helden EG, Hon D, Lewis LA, Beyers N, van Helden PD. Mycobacterial growth in human macrophages: variation according to donor, inoculum and bacterial strain. Cell Biol Int. 2001;25(1):71-81.
Chapter 6 | General Discussion
191
62. Wong KC, Leong WM, Law HK, Ip KF, Lam JT, Yuen KY, et al. Molecular characterization of clinical isolates of Mycobacterium tuberculosis and their association with phenotypic virulence in human macrophages. Clin Vaccine Immunol. 2007;14(10):1279-84. 63. Theus SA, Cave MD, Eisenach KD. Intracellular macrophage growth rates and cytokine profiles of Mycobacterium tuberculosis strains with different transmission dynamics. J Infect Dis. 2005;191(3):453-60. 64. Cole ST, Brosch R, Parkhill J, Garnier T, Churcher C, Harris D, et al. Deciphering the biology of Mycobacterium tuberculosis from the complete genome sequence. Nature. 1998;393(6685):537-44. 65. Agranoff D, Krishna S. Metal ion transport and regulation in Mycobacterium tuberculosis. Front Biosci. 2004;9:2996-3006. 66. Pulido PA, Novoa-Aponte L, Villamil N, Soto CY. The DosR dormancy regulator of Mycobacterium tuberculosis stimulates the Na(+)/K (+) and Ca (2+) ATPase activities in plasma membrane vesicles of mycobacteria. Curr Microbiol. 2014;69(5):604-10. 67. Ayala-Torres C, Novoa-Aponte L, Soto CY. Pma1 is an alkali/alkaline earth metal cation ATPase that preferentially transports Na(+) and K(+) across the Mycobacterium smegmatis plasma membrane. Microbiol Res. 2015;176:1-6. 68. Sassetti CM, Boyd DH, Rubin EJ. Genes required for mycobacterial growth defined by high density mutagenesis. Mol Microbiol. 2003;48(1):77-84. 69. Rengarajan J, Bloom BR, Rubin EJ. Genome-wide requirements for Mycobacterium tuberculosis adaptation and survival in macrophages. Proc Natl Acad Sci U S A. 2005;102(23):8327-32. 70. Manca C, Tsenova L, Barry CE 3rd, Bergtold A, Freeman S, Haslett PA, et al. Mycobacterium tuberculosis CDC1551 induces a more vigorous host response in vivo and in vitro, but is not more virulent than other clinical isolates. J Immunol. 1999;162(11):6740-6. 71. Carmona J, Cruz A, Moreira-Teixeira L, Sousa C, Sousa J, Osorio NS, et al. Mycobacterium tuberculosis strains are differentially recognized by TLRs with an impact on the immune response. PLoS One. 2013;8(6):e67277. 72. Portevin D, Gagneux S, Comas I, Young D. Human macrophage responses to clinical isolates from the Mycobacterium tuberculosis complex discriminate between ancient and modern lineages. PLoS Pathog. 2011;7(3):e1001307. 73. Krishnan N, Malaga W, Constant P, Caws M, Tran TH, Salmons J, et al. Mycobacterium tuberculosis lineage influences innate immune response and virulence and is associated with distinct cell envelope lipid profiles. PLoS One. 2011;6(9):e23870. 74. Wang C, Peyron P, Mestre O, Kaplan G, van Soolingen D, Gao Q, et al. Innate immune response to Mycobacterium tuberculosis Beijing and other genotypes. PLoS One. 2010;5(10):e13594. 75. Dormans J, Burger M, Aguilar D, Hernandez-Pando R, Kremer K, Roholl P, et al. Correlation of virulence, lung pathology, bacterial load and delayed type hypersensitivity responses after infection with different Mycobacterium tuberculosis genotypes in a BALB/c mouse model. Clin Exp Immunol. 2004;137(3):460–8. 76. Manca C, Tsenova L, Bergtold A, Freeman S, Tovey M, Musser JM, et al. Virulence of a Mycobacterium tuberculosis clinical isolate in mice is determined by failure to induce Th1 type immunity and is associated with induction of IFN-alpha/beta. Proc Natl Acad Sci U S A. 2001;98(10):5752-7. 77. López B, Aguilar D, Orozco H, Burger M, Espitia C, Ritacco V, et al. A marked difference in pathogenesis and immune response induced by different Mycobacterium tuberculosis genotypes. Clin Exp Immunol. 2003;133(1):30-7. 78. Dunn PL, North RJ. Virulence ranking of some Mycobacterium tuberculosis and Mycobacterium bovis strains according to their ability to multiply in the lungs, induce lung pathology, and cause mortality in mice. Infect Immun. 1995;63(9):3428-37. 79. Aguilar D, Hanekom M, Mata D, Gey van Pittius NC, van Helden PD, Warren RM, et al. Mycobacterium tuberculosis strains with the Beijing genotype demonstrate variability in virulence associated with transmission. Tuberculosis. 2010;90(5):319-25. 80. Manca C, Reed MB, Freeman S, Mathema B, Kreiswirth B, Barry CE 3rd, et al. Differential monocyte activation underlies strain-specific Mycobacterium tuberculosis pathogenesis. Infect Immun. 2004;72(9):5511-4.
Chapter 6 | General Discussion
192
81. Manca C, Tsenova L, Freeman S, Barczak AK, Tovey M, Murray PJ, et al. Hypervirulent M. tuberculosis W/Beijing strains upregulate type I IFNs and increase expression of negative regulators of the Jak-Stat pathway. J Interferon Cytokine Res. 2005;25(11):694-701. 82. Tsenova L, Ellison E, Harbacheuski R, Moreira AL, Kurepina N, Reed MB, et al. Virulence of selected Mycobacterium tuberculosis clinical isolates in the rabbit model of meningitis is dependent on phenolic glycolipid produced by the bacilli. J Infect Dis. 2005;192(1):98-106. 83. Chacón-Salinas R, Serafín-López J, Ramos-Payán R, Méndez-Aragón P, Hernández-Pando R, Van Soolingen D, et al. Differential pattern of cytokine expression by macrophages infected in vitro with different Mycobacterium tuberculosis genotypes. Clin Exp Immunol. 2005;140(3):443-9. 84. Rocha-Ramírez LM, Estrada-García I, López-Marín LM, Segura-Salinas E, Méndez-Aragón P, Van Soolingen D, et al. Mycobacterium tuberculosis lipids regulate cytokines, TLR-2/4 and MHC class II expression in human macrophages. Tuberculosis. 2008;88(3):212-20. 85. Subbian S, Bandyopadhyay N, Tsenova L, O'Brien P, Khetani V, Kushner NL, et al. Early innate immunity determines outcome of Mycobacterium tuberculosis pulmonary infection in rabbits. Cell Commun Signal. 2013;11:60. 86. Reiling N, Homolka S, Walter K, Brandenburg J, Niwinski L, Ernst M, et al. Clade-specific virulence patterns of Mycobacterium tuberculosis complex strains in human primary macrophages and aerogenically infected mice. MBio. 2013;4(4):e00250-13. 87. Condos R, Rom WN, Liu YM, Schluger NW. Local immune responses correlate with presentation and outcome in tuberculosis. Am J Respir Crit Care Med. 1998;157(3 Pt 1):729-35. 88. Netea MG, Joosten LA, Latz E, Mills KH, Natoli G, Stunnenberg HG, et al. Trained immunity: A program of innate immune memory in health and disease. Science. 2016;352(6284):aaf1098.