hearing in marine fish and its application in fisheries
TRANSCRIPT
45
Chapter 3 Hearing in Marine Fish and Its
Application in Fisheries
Hong Young Yan , Kazuhiko Anraku , and Ricardo P. Babaran
3.1 INTRODUCTION
The acousticolateralis system of fi sh is composed of two major structures — the inner ear and the lateral line. The inner ear is responsible for the balance and detection of acoustic signals, whereas the lateral line detects water - borne vibration signals (Hawkins 1986 ). These mechanosensory functions are crucial for the survival of fi sh. In terms of ana-tomical structure, the functional units of the inner ear are sensory hair cells and are used to detect underwater acoustical signals, whereas the neuro-masts of the lateral line detect waterborne low - frequency vibrations caused by physical as well as biological forces. The sensation of water - borne sound and vibration offers fi sh a dual detection system to measure mechanical disturbances of their environment. In turn, fi sh can listen to sounds pro-duced by either conspecifi cs or heterospecifi cs, and they can take corresponding actions such as retreat-ing or escalating agonistic behavior or being attracted to the source if the sounds are courtship signals. Likewise, sensation from the lateral line informs recipients of the presence of obstacles, predators or prey. In conjunction with their eyes, the lateral line system also participates in the schooling behavior of fi sh (Pitcher 1979 ).
The successful operation of fi sheries whether at the commercial or subsistence level requires proper designs of fi shing gears and methods. In light of how the auditory functions of ears and the sensation abilities of lateral line modulate the behaviors of fi sh, it would be useful to understand the physiolog-
ical processes involved in the acousticolateralis system and to make the best use of the knowledge in the designs of fi shing gear and operation. This chapter reviews the fundamental knowledge of physical properties of sound and discusses the phys-iological characteristics of the ear. Methodologies involved in understanding fi sh hearing in terms of frequency range and hearing threshold are reviewed along with a discussion on how exposure to noise will impact the overall hearing abilities of targeted fi shes. The last section of this chapter provides a few examples of practical applications of acoustic signals in fi sheries either to attract or to expel fi sh.
3.2 PROPERTIES OF UNDERWATER SOUND AND VIBRATION
An understanding of two major properties of sound in terms of sound pressure and water particle motion (displacement, velocity, and acceleration) is neces-sary to understand the responses of the ear and the lateral line system. The propagations of sound pres-sure and particle motion are complicated because of large differences in the attenuation level related to the type of sound source, its frequency, and the distance from the stimulus.
3.2.1 Sound Source and Sound Field
Sound propagation speed in air (340 m/s) and water (1500 m/s) are different because the acoustic imped-ance values ( ρ c) of sound (where ρ represents the density of medium and c is the velocity of sound) in the two media are different due to differences in
Behavior of Marine Fishes: Capture Processes and Conservation Challenges Edited by Pingguo He
© 2010 Blackwell Publishing Ltd. ISBN: 978-0-813-81536-7
46 Locomotion and Sensory Capabilities in Marine Fish
media density. The acoustic impedance is a measure of the total reaction of a medium to sound trans-mission (i.e., the easiness of sound passing through the specifi c medium). The acoustic impedances of air and water are about 39.6 g cm − 2 s − 1 and 150,000 g cm − 2 s − 1 , respectively.
Harris and van Bergeijk (1962) described the propagation of sound pressure and water particle motion generated by two types of sound source — a monopole and a dipole source. A monopole sound source is represented by a pulsating air bubble in the water that changes its volume. Sounds gener-ated from underwater speakers and fi sh gas bladders are considered monopole sounds. Following the expansion of the air bubble, water particles move along the radial direction relative to the center of the bubble, and this movement is transferred from one particle to the next. Displacement of water par-ticles decreases in an inverse proportion to the square of the distance from the sound source. Furthermore, a compression wave (i.e., pressure wave) is also induced during the propagation process, because water has a slight compressibility. As sound propagates, its pressure decreases inversely with increasing distance from the source. Within this sound fi eld, the magnitude is larger for particle motion within the distance of λ /2 π where λ is the wavelength, while the pressure is larger outside the distance of λ /2 π . The sound fi eld within the distance of λ /2 π from the source is termed the near fi eld and the sound fi eld outside of the distance of λ /2 π is termed the far fi eld.
In the case of dipole sound source, sound is gen-erated by the motion of the object without changing its volume. Displacement of water particles is the largest along the axis of the motion and decreases with the cube of the distance from the sound source. The magnitude of sound pressure, on the other hand, decreases with the square of the distance from the sound source. Hence, the propagation properties of sound pressure and water particle motion are different depending on the sound source. In the meantime, sound frequency affects the velocity and acceleration of particle motion but not the displace-ment. For example, the velocity of the particle motion u is expressed as u = 2 π fd , where f and d are sound frequency and displacement, respec-tively. Therefore, velocity of particle motion is
higher in high - frequency sounds. In terms of attenu-ation of a sound pressure level (SPL), high - fre-quency sounds lose their energy more rapidly than do low - frequency sounds because of the high rate of absorption — that is, the transformation of sound energy to thermal energy. Hence, low - frequency sounds remain in the medium for longer distances, and this is why low - frequency sounds dominate the underwater world (Hawkins 1986 ).
3.2.2 Sound Pressure Level
SPL in water can be calculated with the following equation:
SPL dB( ) = ( )20 0log p p
where p is the pressure level of the sound in μ Pa and p 0 is the reference pressure level. For underwa-ter sounds, the reference pressure level is 1 μ Pa; therefore, underwater sound pressure is usually expressed as “ dB re 1 μ Pa. ” For sounds in air, p 0 is 20 μ Pa, which is the hearing threshold for human with 1000 - Hz sound stimulus. Prior to 1990, under-water acoustic studies used “ dB re 1 μ bar ” as the measurement unit. To convert “ dB re 1 μ bar ” data to “ dB re 1 μ Pa, ” 100 dB is added to the “ dB re 1 μ bar ” data — that is, dB re 1 μ Pa = dB re 1 μ bar + 100.
3.2.3 Variations of Underwater Sound Pressure Levels
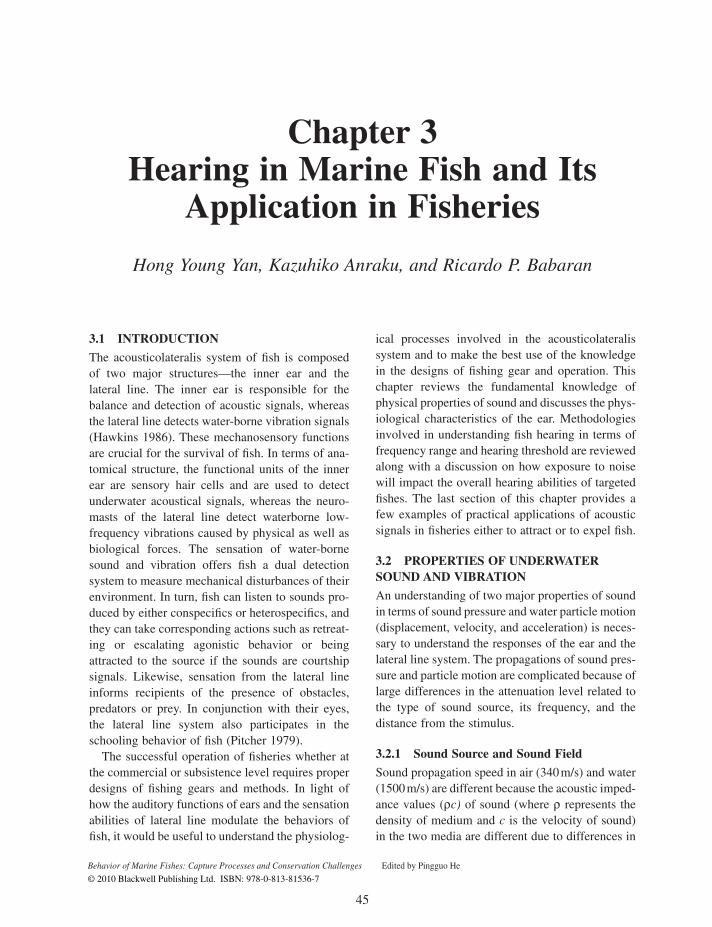
Characteristics of underwater sound vary with the location in water. Hatakeyama (1996) reviewed underwater sound pressure in relation to various sound sources and approximated auditory thresh-olds of fi shes (Fig. 3.1 ). One of the distinctive dif-ferences of the underwater sound is the noise levels in shallow waters compared with those in deep waters. In coastal marine waters, snapping sounds of the pistol shrimp ( Alpheoidea spp. ) are usually very loud, but such sounds have not been detected in deep water or freshwater (Urick 1983 ). Hearing thresholds are much lower in otophysan fi shes (Ostariophysi: Otophysi), also known as hearing specialists, which account for 64% of the freshwa-ter species (Nelson 1994 ), than are nonotophysan fi shes, which are called as hearing generalists (details described later). Artifi cial sounds generated
Hearing in Marine Fish and Its Application in Fisheries 47
Figure 3.1. Underwater sound pressure levels of various types of sound sources. (Redrawn from Hatakeyama 1992 .)
from underwater piling drilling and dynamite explosions result in high SPLs. In general, high - intensity sound is considered aversive for fi shes and can cause damage to fi sh (e.g., dynamite fi shing [high sound pressure in coupling with compression waves]). A 200 - dB SPL sound would cause an esti-mated 10 10 μ Pa (or about 100 gf/cm 2 ) force to the fi sh. For the lowest threshold level of otophysan fi shes is 60 dB, the force is about 10 3 μ Pa (or about 0.01 mgf/cm 2 ), whereas the lowest threshold level for nonotophysan fi shes is 90 - dB SPL, equivalent to 3.16 × 10 4 μ Pa (or about 0.3 mgf/cm 2 ).
3.3 UNDERWATER SOUND SOURCES AND THEIR CHARACTERISTICS
3.3.1 Natural Underwater Ambient Sounds
Underwater ambient noise covers a wide range of frequencies from 1 Hz up to about 100 kHz (NRC 2003 ; Urick 1983 ). Urick (1983) classifi ed sources of ambient noise in the ocean into the following six categories:
• Those resulted from tides and hydrostatic pres-sure changes of relatively large amplitude and at the low - frequency end of the spectrum
• Seismic disturbances that generate noise between 1 and 100 Hz
• Oceanic turbulence in the form of irregular random water currents of large or small scales (Wenz 1962 ) — For instance, steady current at 1 knot can generate noise around 106 dB (re 1 μ Pa).
• Ship traffi c that generates frequency in the range of 50 to 500 Hz — Such noise can be detected at distances of 1000 miles or more from the site of measurement.
• Surface waves that caused noise in the frequen-cies between 1 and 50 kHz (NRC 2003 ) — When below 5 to 10 Hz, the dominant ambient noise source was the nonlinear interaction of oppo-sitely propagating ocean surface waves.
• Noise caused by precipitation (rain, hail, and snow) — The spectrum of rain noise, for wind speeds below 1.5 m/s, showed a peak at 13.5 kHz
48 Locomotion and Sensory Capabilities in Marine Fish
with a sharp cutoff on the low - frequency side and a gradual fall - off (7 dB per octave) on the high - frequency side.
3.3.2 Sounds Produced by Fishes
Many fi sh produce calls as part of a specifi c behav-ioral pattern. Sounds are believed to elicit changes in the behavior of other individuals of the same or different species. Sounds vary in structure and char-acteristics depending on the mechanism used to produce them. In general, two major sound types are produced by fi sh. The stridulatory sounds result from rubbing hard parts of the body. For example, members of the grunt family, Pomadasyidae, produce a sharp, vibrant call by grating a dorsal patch of pharyngeal denticles against smaller ventral patches. Some catfi sh (Family: Siluridae, e.g., channel catfi sh Ictalurus punctatus ) produce a squeak when the enlarged pectoral spines are moved against each other (Hawkins 1986 ; Fine et al. 1997 ). The second type of sound, the drumming sound, is produced by contraction of skeletal muscles along the body wall against a gas - holding structure, such as gas bladder. The notable cases are sounds pro-duced in oyster toadfi sh ( Opsanus tau ), croaker ( Micropogonius undulates) (Fine et al. 1997, 2001 ), and fi sh of the Family Gadiade, such as haddock ( Melanogrammus aeglefi nus ), cod ( Gadus morhua ), pollock ( Pollachius pollachius ), and Tadpole - fi sh ( Raniceps raniceps ) (Hawkins 1986 ). The major difference between stridulation sound and drum-ming sound is that the former tends to have wider frequency bandwidth than the latter. Recently, fi sh-ermen have use the knowledge and new technology (e.g., hydrophone) to locate aggregation of spawn-ers of sciaenid fi sh in the coastal area of central Taiwan, and this has resulted in a large - quantity catch of sciaenids. This has raised concerns that the wild stock of these sciaenids could be depleted within a short time if the new technology is not properly managed (Tu et al. 2004 ).
3.3.3 Sounds Produced by Fishing, Research, and Whale - Watching Vessels
Modern fi shing and research vessels use diesel engines in conjunction with high - thrust propulsion systems that can generate signifi cant levels of noises that are radiated underwater. Field tests
revealed that a ship with the combination of a diesel engine and generator produced noise in the fre-quency range of 8 to 6 kHz with SPL between 110 and 140 dB (Mitson and Knudsen 2003 ). The fre-quency range and SPL of vessel noise are thus in the hearing range of many commercial important marine fi sh species such as cod (10 – 600 Hz, 60 – 140 dB) and herring (50 – 1500 Hz, 55 – 150 dB) (Astrup and M ø hl 1993 ; Chapman and Hawkins 1973 ; Blaxter et al. 1981 ; Enger 1967 ; Sand and Karlsen 1986 ; Schwarz and Greer 1984 ). Winger (2004) reported that Atlantic cod responded to an approaching vessel from as far as 1500 m.
Over the past few decades, whale - watching has been promoted in many parts of the world and has become an important tourist industry (Hoyt 2000 ). A fi eld study conducted in the Juan de Fuca Strait area of southern British Columbia and northwestern Washington, where killer whale watching is a sig-nifi cant business, revealed that SPLs of noise gener-ated by the vessels were in the range of 145 to 169 dB (100 – 20 kHz). The recorded killer whale call source levels were 105 to 124 dB and the audio-gram showed best frequency at 20 kHz (range 100 – 100 kHz) with a hearing threshold of 40 dB. These data clearly indicated that noises generated from whale - watching vessels could be perceived by whales and most of the fi sh in the vicinity of the vessels (Erbe 2002 ). The long - term consequences of noise exposure generated by whale - watching vessels on dolphins and whales remain to be examined.
Bottom trawl is carried out by towing a net over the bottom of the ocean (see Chapters 4 and 12 ). Such operations result in underwater noise when the fi shing gear makes contact with the seabed. Buerkle (1968, 1977) reported that Atlantic cod were able to detect noise generated by a bottom trawl at a range of at least 2.5 km. Response of fi sh as indi-cated by a change in behavior due to noises from a combination of the trawler and the trawl it was towing has been reported (Winger 2004 ).
3.4 GENERAL MORPHOLOGY AND FUNCTIONS OF INNER EARS AND ANCILLARY STRUCTURES
The inner ear of fi sh, including elasmobranches, consists of three semicircular canals (with associ-
Hearing in Marine Fish and Its Application in Fisheries 49
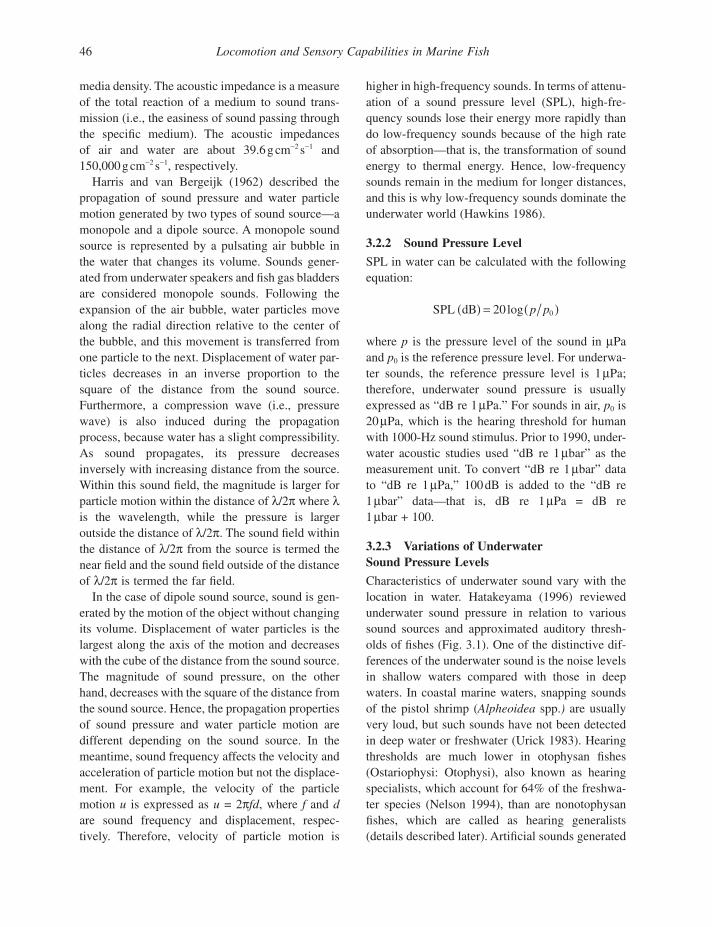
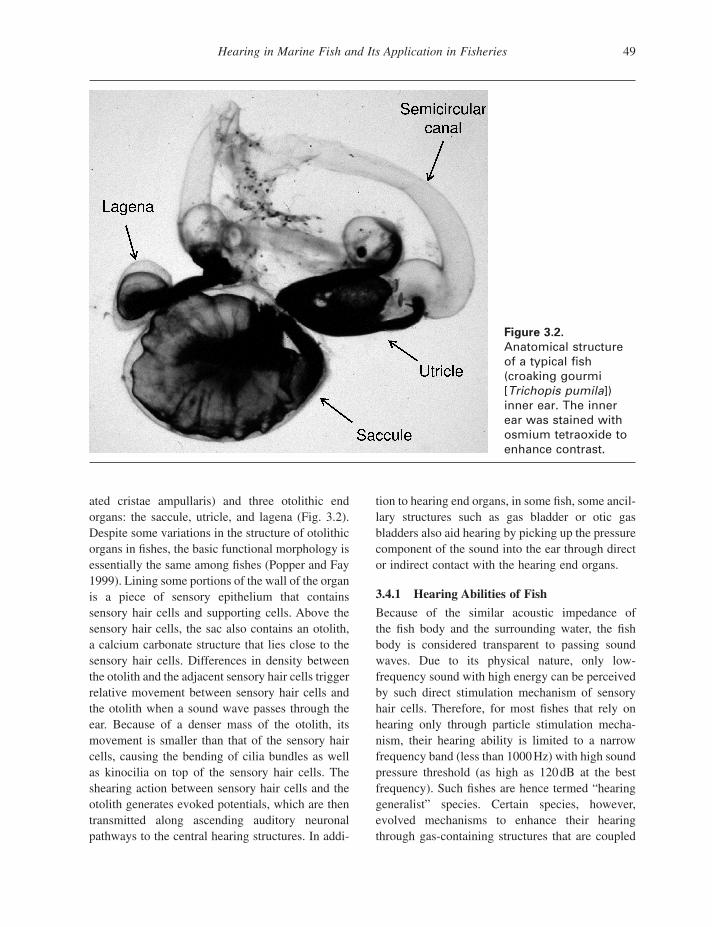
Figure 3.2. Anatomical structure of a typical fi sh (croaking gourmi [ Trichopis pumila ]) inner ear. The inner ear was stained with osmium tetraoxide to enhance contrast.
ated cristae ampullaris) and three otolithic end organs: the saccule, utricle, and lagena (Fig. 3.2 ). Despite some variations in the structure of otolithic organs in fi shes, the basic functional morphology is essentially the same among fi shes (Popper and Fay 1999 ). Lining some portions of the wall of the organ is a piece of sensory epithelium that contains sensory hair cells and supporting cells. Above the sensory hair cells, the sac also contains an otolith, a calcium carbonate structure that lies close to the sensory hair cells. Differences in density between the otolith and the adjacent sensory hair cells trigger relative movement between sensory hair cells and the otolith when a sound wave passes through the ear. Because of a denser mass of the otolith, its movement is smaller than that of the sensory hair cells, causing the bending of cilia bundles as well as kinocilia on top of the sensory hair cells. The shearing action between sensory hair cells and the otolith generates evoked potentials, which are then transmitted along ascending auditory neuronal pathways to the central hearing structures. In addi-
tion to hearing end organs, in some fi sh, some ancil-lary structures such as gas bladder or otic gas bladders also aid hearing by picking up the pressure component of the sound into the ear through direct or indirect contact with the hearing end organs.
3.4.1 Hearing Abilities of Fish
Because of the similar acoustic impedance of the fi sh body and the surrounding water, the fi sh body is considered transparent to passing sound waves. Due to its physical nature, only low - frequency sound with high energy can be perceived by such direct stimulation mechanism of sensory hair cells. Therefore, for most fi shes that rely on hearing only through particle stimulation mecha-nism, their hearing ability is limited to a narrow frequency band (less than 1000 Hz) with high sound pressure threshold (as high as 120 dB at the best frequency). Such fi shes are hence termed “ hearing generalist ” species. Certain species, however, evolved mechanisms to enhance their hearing through gas - containing structures that are coupled
50 Locomotion and Sensory Capabilities in Marine Fish
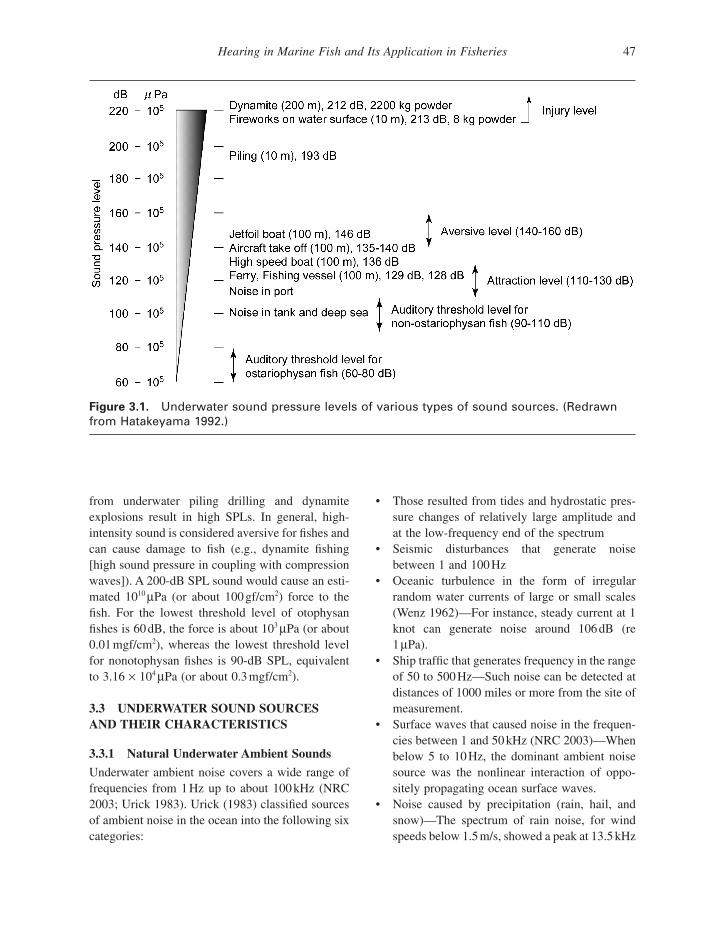
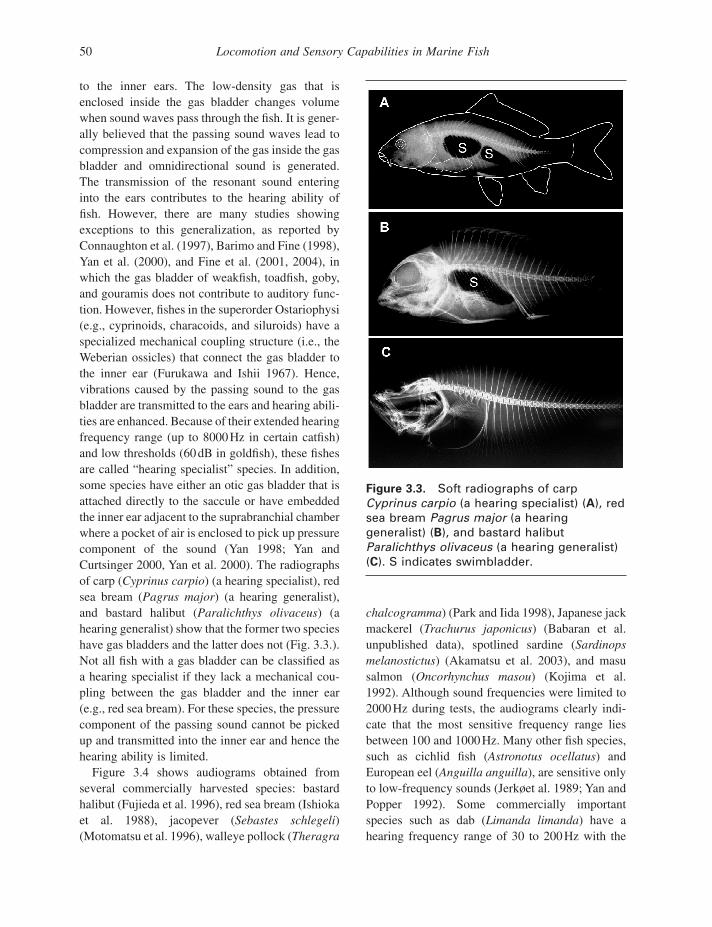
to the inner ears. The low - density gas that is enclosed inside the gas bladder changes volume when sound waves pass through the fi sh. It is gener-ally believed that the passing sound waves lead to compression and expansion of the gas inside the gas bladder and omnidirectional sound is generated. The transmission of the resonant sound entering into the ears contributes to the hearing ability of fi sh. However, there are many studies showing exceptions to this generalization, as reported by Connaughton et al. (1997) , Barimo and Fine (1998) , Yan et al. (2000) , and Fine et al. (2001, 2004) , in which the gas bladder of weakfi sh, toadfi sh, goby, and gouramis does not contribute to auditory func-tion. However, fi shes in the superorder Ostariophysi (e.g., cyprinoids, characoids, and siluroids) have a specialized mechanical coupling structure (i.e., the Weberian ossicles) that connect the gas bladder to the inner ear (Furukawa and Ishii 1967 ). Hence, vibrations caused by the passing sound to the gas bladder are transmitted to the ears and hearing abili-ties are enhanced. Because of their extended hearing frequency range (up to 8000 Hz in certain catfi sh) and low thresholds (60 dB in goldfi sh), these fi shes are called “ hearing specialist ” species. In addition, some species have either an otic gas bladder that is attached directly to the saccule or have embedded the inner ear adjacent to the suprabranchial chamber where a pocket of air is enclosed to pick up pressure component of the sound (Yan 1998 ; Yan and Curtsinger 2000 , Yan et al. 2000 ). The radiographs of carp ( Cyprinus carpio ) (a hearing specialist), red sea bream ( Pagrus major ) (a hearing generalist), and bastard halibut ( Paralichthys olivaceus ) (a hearing generalist) show that the former two species have gas bladders and the latter does not (Fig. 3.3 .). Not all fi sh with a gas bladder can be classifi ed as a hearing specialist if they lack a mechanical cou-pling between the gas bladder and the inner ear (e.g., red sea bream). For these species, the pressure component of the passing sound cannot be picked up and transmitted into the inner ear and hence the hearing ability is limited.
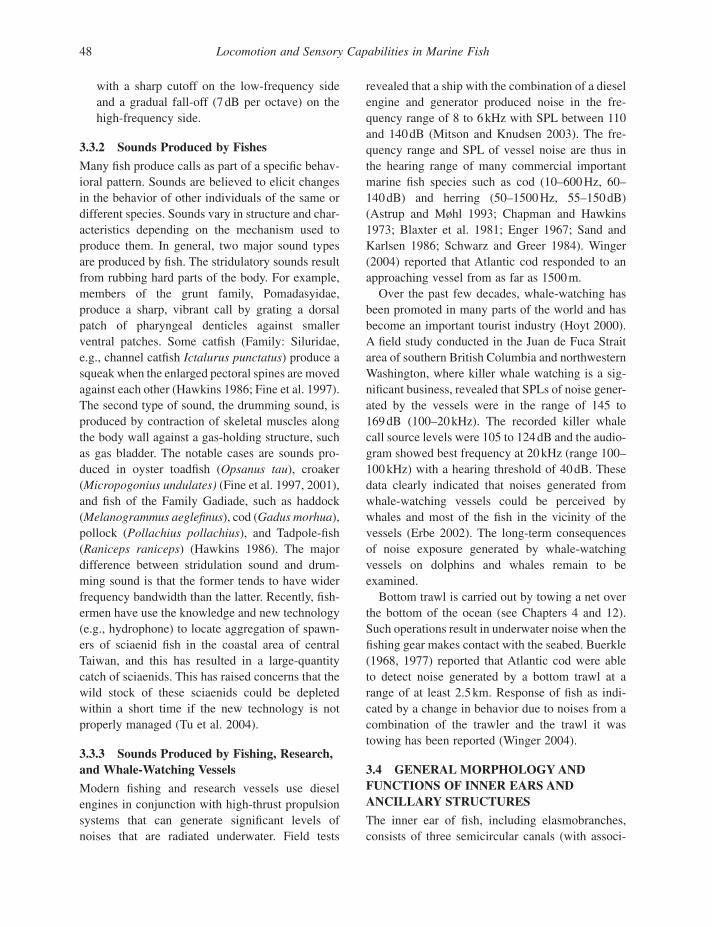
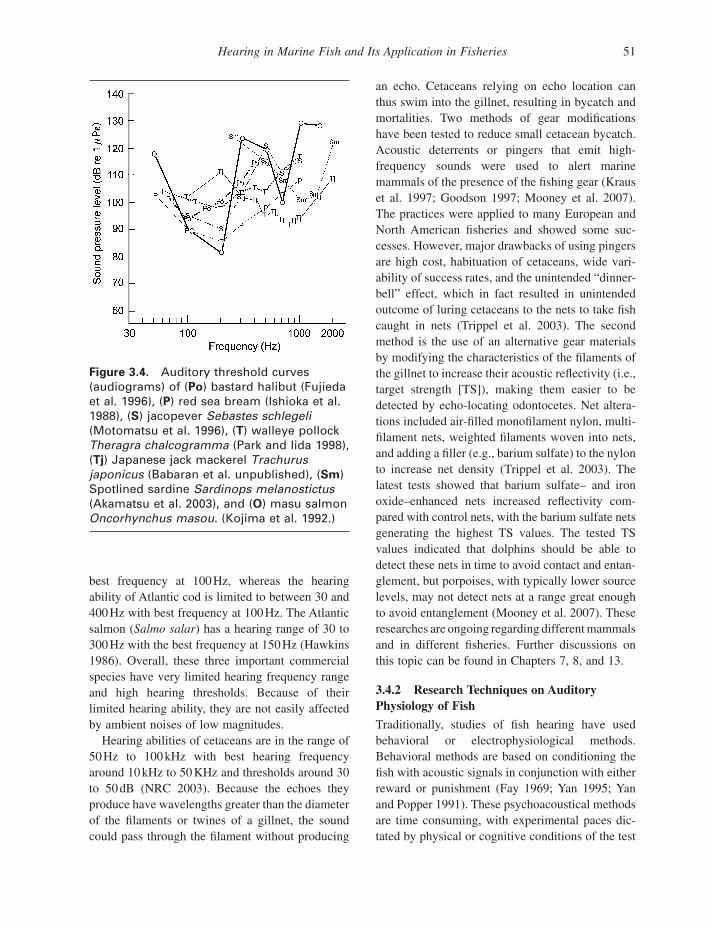
Figure 3.4 shows audiograms obtained from several commercially harvested species: bastard halibut (Fujieda et al. 1996 ), red sea bream (Ishioka et al. 1988 ), jacopever ( Sebastes schlegeli ) (Motomatsu et al. 1996 ), walleye pollock ( Theragra
Figure 3.3. Soft radiographs of carp Cyprinus carpio (a hearing specialist) ( A ), red sea bream Pagrus major (a hearing generalist) ( B ), and bastard halibut Paralichthys olivaceus (a hearing generalist) ( C ). S indicates swimbladder.
chalcogramma ) (Park and Iida 1998 ), Japanese jack mackerel ( Trachurus japonicus ) (Babaran et al. unpublished data), spotlined sardine ( Sardinops melanostictus ) (Akamatsu et al. 2003 ), and masu salmon ( Oncorhynchus masou ) (Kojima et al. 1992 ). Although sound frequencies were limited to 2000 Hz during tests, the audiograms clearly indi-cate that the most sensitive frequency range lies between 100 and 1000 Hz. Many other fi sh species, such as cichlid fi sh ( Astronotus ocellatus ) and European eel ( Anguilla anguilla ), are sensitive only to low - frequency sounds (Jerk ø et al. 1989 ; Yan and Popper 1992 ). Some commercially important species such as dab ( Limanda limanda ) have a hearing frequency range of 30 to 200 Hz with the
Hearing in Marine Fish and Its Application in Fisheries 51
an echo. Cetaceans relying on echo location can thus swim into the gillnet, resulting in bycatch and mortalities. Two methods of gear modifi cations have been tested to reduce small cetacean bycatch. Acoustic deterrents or pingers that emit high - frequency sounds were used to alert marine mammals of the presence of the fi shing gear (Kraus et al. 1997 ; Goodson 1997 ; Mooney et al. 2007 ). The practices were applied to many European and North American fi sheries and showed some suc-cesses. However, major drawbacks of using pingers are high cost, habituation of cetaceans, wide vari-ability of success rates, and the unintended “ dinner - bell ” effect, which in fact resulted in unintended outcome of luring cetaceans to the nets to take fi sh caught in nets (Trippel et al. 2003 ). The second method is the use of an alternative gear materials by modifying the characteristics of the fi laments of the gillnet to increase their acoustic refl ectivity (i.e., target strength [TS]), making them easier to be detected by echo - locating odontocetes. Net altera-tions included air - fi lled monofi lament nylon, multi-fi lament nets, weighted fi laments woven into nets, and adding a fi ller (e.g., barium sulfate) to the nylon to increase net density (Trippel et al. 2003 ). The latest tests showed that barium sulfate – and iron oxide – enhanced nets increased refl ectivity com-pared with control nets, with the barium sulfate nets generating the highest TS values. The tested TS values indicated that dolphins should be able to detect these nets in time to avoid contact and entan-glement, but porpoises, with typically lower source levels, may not detect nets at a range great enough to avoid entanglement (Mooney et al. 2007 ). These researches are ongoing regarding different mammals and in different fi sheries. Further discussions on this topic can be found in Chapters 7 , 8 , and 13 .
3.4.2 Research Techniques on Auditory Physiology of Fish
Traditionally, studies of fi sh hearing have used behavioral or electrophysiological methods. Behavioral methods are based on conditioning the fi sh with acoustic signals in conjunction with either reward or punishment (Fay 1969 ; Yan 1995 ; Yan and Popper 1991 ). These psychoacoustical methods are time consuming, with experimental paces dic-tated by physical or cognitive conditions of the test
Figure 3.4. Auditory threshold curves (audiograms) of ( Po ) bastard halibut (Fujieda et al. 1996 ) , ( P ) red sea bream (Ishioka et al. 1988 ) , ( S ) jacopever Sebastes schlegeli (Motomatsu et al. 1996 ) , ( T ) walleye pollock Theragra chalcogramma (Park and Iida 1998 ) , ( Tj ) Japanese jack mackerel Trachurus japonicus (Babaran et al. unpublished), ( Sm ) Spotlined sardine Sardinops melanostictus (Akamatsu et al. 2003 ) , and ( O ) masu salmon Oncorhynchus masou. (Kojima et al. 1992 .)
best frequency at 100 Hz, whereas the hearing ability of Atlantic cod is limited to between 30 and 400 Hz with best frequency at 100 Hz. The Atlantic salmon ( Salmo salar ) has a hearing range of 30 to 300 Hz with the best frequency at 150 Hz (Hawkins 1986 ). Overall, these three important commercial species have very limited hearing frequency range and high hearing thresholds. Because of their limited hearing ability, they are not easily affected by ambient noises of low magnitudes.
Hearing abilities of cetaceans are in the range of 50 Hz to 100 kHz with best hearing frequency around 10 kHz to 50 KHz and thresholds around 30 to 50 dB (NRC 2003 ). Because the echoes they produce have wavelengths greater than the diameter of the fi laments or twines of a gillnet, the sound could pass through the fi lament without producing
52 Locomotion and Sensory Capabilities in Marine Fish
subject. In addition, behavioral responses near the threshold fl uctuated greatly even in a specifi c indi-vidual. Therefore, threshold determinations are made with the aid of mathematical probability para-digms. The electrophysiological methods record neuronal activities either from microphonics of auditory organs (Saidel and Popper 1987 ) or from single - unit recordings, which register single nerve fi ber discharge patterns in response to acoustic signals (Enger and Anderson 1967 ). These two invasive electrophysiological methods have some common limitations. Preparations are rather com-plicated and invasive surgery is needed. The place-ment of electrodes is restricted to specifi c end organs or fi bers; therefore, responses do not accu-rately represent the whole auditory pathways. Lately, a noninvasive auditory brainstem response (ABR) method was developed to measure responses of the whole auditory pathways in fi sh (Kenyon et al. 1998 ). Advantages of the ABR protocol include noninvasiveness, rapid completion, and measurement of relevant neuronal cells participated in the signal processing. These advantages are in stark contrast to qualitative psychoacoustical method or invasive electrophysiological method. The ABR method involves simple sedation of test fi sh, placement of recording electrodes on the cephalic region, and presentation of acoustic stimuli via either airborne sound or waterborne sound to the subject. Recordings of evoked potentials are through electrodes to a two - stage amplifi er, averaged, and displayed on a computer screen. Determinations of hearing threshold (in terms of dB; re 1 μ Pa) of a particular frequency are made using either the tra-ditional visual inspection method (Kenyon et al. 1998 ) or statistical method (Yan 1998 ). The whole process of obtaining an auditory tuning curve can be completed in less than 2 hours. The ABR system has been widely used by auditory research scientists around the world since its fi rst publication in 1998. The ABR method has become the de facto standard method for fi sh auditory physiology research.
3.4.3 Effects of Noise Exposure on Hearing Ability of Fishes
Urick (1983) chronicled noises that come from seismic disturbances, oceanic turbulence, ship traffi c, surface waves, thermal noise, and coastal
water wave actions as well as biological sounds (e.g., calls of porpoises, noises of a mass of snap-ping shrimps). Snapping shrimps can produce sound ranging from 700 to 30,000 Hz with SPL as high as 70 dB (re 1 μ Pa), and the croaking sound of croakers (family: Sciaenidae) had a frequency range of 100 to 3000 Hz (dominant frequency around 200 Hz) with the highest sound pressure greater than 110 dB (re 1 μ Pa) (Barimo and Fine 1998 ; Fine et al. 2004 ; Urick 1983 ). The ambient noise caused by rain, as recorded in Long Island Sound, New York, showed a frequency range of 700 to 20,000 Hz with sound pressure as high as 85 dB (re 1 μ Pa) (Urick 1983 ). These natural or biological underwa-ter sounds generally exert no harm to fi sh. However, anthropogenic sounds (i.e., man - made noises) have been increasingly become an issue that could harm the welfare of fi sh and other marine animals (Richardson and W ü rsig 1997 ).
In a series of pioneering experiments, Scholik and Yan (2001, 2002a, 2002b) and Scholik et al. (2004) demonstrated that exposure to the noise (band width: 100 – 6000 Hz, with dominant fre-quency at 1300 Hz) generated by an 55 - horsepower (hp) outboard engine hampered the hearing ability of a hearing specialist, the fathead minnow ( Pimephales promelas ), and led to elevation of the hearing threshold at 1, 1.5, and 2 kHz for 7.8, 13.5, and 10.5 dB, respectively. Further experiments by exposing fathead minnow to white noise (i.e., dif-ferent frequencies of sound with equal energy) of 142 dB (band width 0.3 – 4 KHz) for either 1, 2, 4, 8, and 24 hours showed elevation of thresholds at 0.8, 1, 1.5, and 2 kHz. Even 14 days after exposure, hearing thresholds for 1.5 and 2 kHz were still sig-nifi cantly higher than the baseline data. The thresh-old shifts were, however, not observed in a hearing generalist species, the bluegill sunfi sh ( Lepomis macrochirus ) (Scholik and Yan 2002b ). These results indicate that hearing specialist species are more vulnerable to negative impacts of prolonged exposure to noise than are hearing generalist species. A follow - up study by Scholik et al. (2004) showed that the negative effect of noise exposure to fathead minnow can be mitigated by feeding diets added with vitamin E at a dose of 450 mg/kg. The rationale of using vitamin E to offset the delete-rious effect of reactive oxygen species (ROS) (i.e.,
Hearing in Marine Fish and Its Application in Fisheries 53
free radicals) from the acoustic trauma is based on the chain - braking antioxidant effect of vitamin E to neutralize ROS (Chow et al. 1999 ).
Following Scholik and Yan ’ s work, the study of noise effects has become a research topic of interest and a number of laboratories have examined the various effects of noise exposure on fi sh hearing. For examples, the effect of powerboat races in Alpine lake, exposure to laboratory - induced noises, exposure to seismic airguns, and ship noises (e.g., McCauley et al. 2003 ) have been examined. These studies provide further evidence that underwater noise exerts a negative impact on fi sh hearing, com-munication and can causes behavioral changes. Interestingly, two gobies living under the waterfall areas in Italy evolved hearing ability and produce sounds outside the frequency range of the back-ground noise (Lugli et al. 2003 ).
Yan et al. (2006) found that the levels of noises generated from various types of aerators used in aquaculture ponds were between 119 dB and 154 dB. These noise levels were found higher than hearing thresholds of 15 species of fi sh and shrimp commonly cultured in Taiwan. The long - term effects of noises generated from aerators remain to be investigated and attention should be paid to improve the design of aerators with less noise so as not to exert a negative effect on the growth and welfare of cultured fi sh and shrimp.
3.5 RESPONSES OF FISH TO SOUND AND ITS APPLICATION IN FISHERIES
3.5.1 Acoustic Attraction
Underwater sound travels at a speed of about 1500m/s and may be used to control fi sh behavior over a longer distance compared with chemical or visual stimuli. Several applications of the use of sound in fi shery operation to attract fi sh have been reviewed by Hashimoto and Maniwa (1964, 1966) , and Maniwa and Hatakeyama (1970, 1975) . For example, it was reported that fi sh schools can be driven into the set - net by the vocal sound of Risso ’ s dolphin ( Grampus griseus ) and that the yel-lowtail ( Seriola quinqueradiata ) could be attracted to the surface from a deep layer on the fi shing ground by the swimming and feeding sounds of conspecifi cs.
One of Japanese traditional fi shing methods, the “ donburi ” or “ boko , ” uses acoustical signals to attract fi sh to the desired fi shing area. This tech-nique is still being used in Shibushi Township, Kagoshima Prefecture, Japan, to harvest demersal fi shes, such as red sea bream ( Pagrus major ).
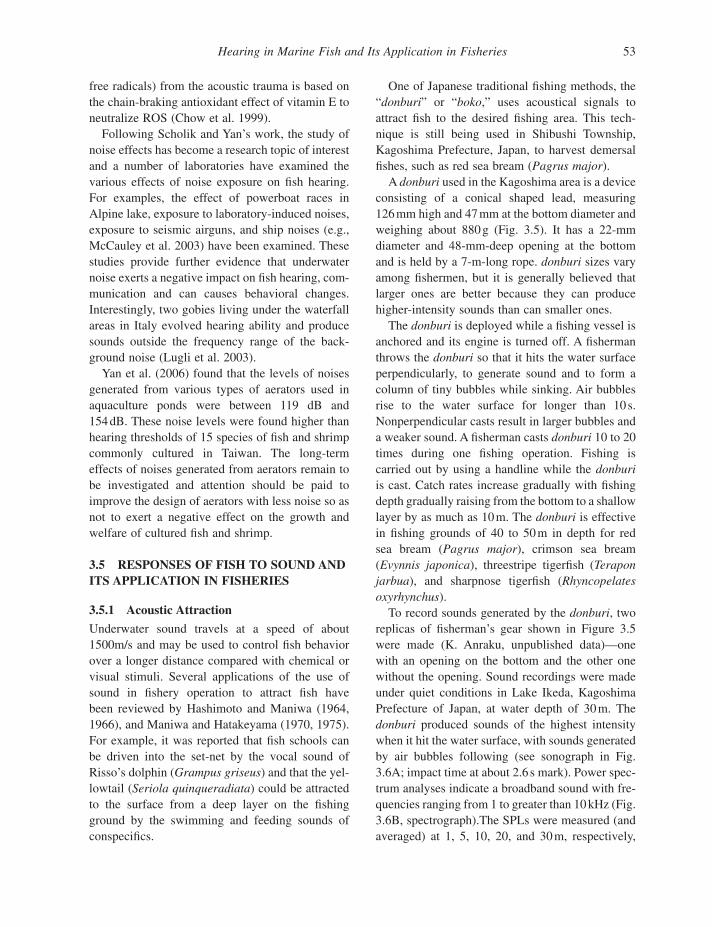
A donburi used in the Kagoshima area is a device consisting of a conical shaped lead, measuring 126 mm high and 47 mm at the bottom diameter and weighing about 880 g (Fig. 3.5 ). It has a 22 - mm diameter and 48 - mm - deep opening at the bottom and is held by a 7 - m - long rope. donburi sizes vary among fi shermen, but it is generally believed that larger ones are better because they can produce higher - intensity sounds than can smaller ones.
The donburi is deployed while a fi shing vessel is anchored and its engine is turned off. A fi sherman throws the donburi so that it hits the water surface perpendicularly, to generate sound and to form a column of tiny bubbles while sinking. Air bubbles rise to the water surface for longer than 10 s. Nonperpendicular casts result in larger bubbles and a weaker sound. A fi sherman casts donburi 10 to 20 times during one fi shing operation. Fishing is carried out by using a handline while the donburi is cast. Catch rates increase gradually with fi shing depth gradually raising from the bottom to a shallow layer by as much as 10 m. The donburi is effective in fi shing grounds of 40 to 50 m in depth for red sea bream ( Pagrus major ), crimson sea bream ( Evynnis japonica ), threestripe tigerfi sh ( Terapon jarbua ), and sharpnose tigerfi sh ( Rhyncopelates oxyrhynchus ).
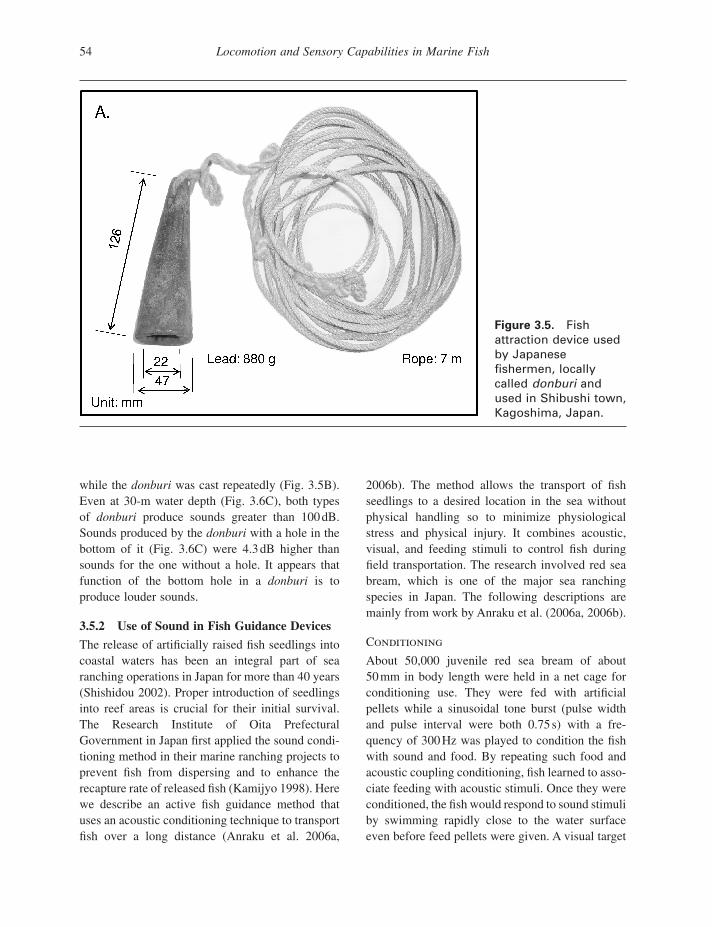
To record sounds generated by the donburi , two replicas of fi sherman ’ s gear shown in Figure 3.5 were made (K. Anraku, unpublished data) — one with an opening on the bottom and the other one without the opening. Sound recordings were made under quiet conditions in Lake Ikeda, Kagoshima Prefecture of Japan, at water depth of 30 m. The donburi produced sounds of the highest intensity when it hit the water surface, with sounds generated by air bubbles following (see sonograph in Fig. 3.6 A; impact time at about 2.6 s mark). Power spec-trum analyses indicate a broadband sound with fre-quencies ranging from 1 to greater than 10 kHz (Fig. 3.6 B, spectrograph).The SPLs were measured (and averaged) at 1, 5, 10, 20, and 30 m, respectively,
54 Locomotion and Sensory Capabilities in Marine Fish
Figure 3.5. Fish attraction device used by Japanese fi shermen, locally called donburi and used in Shibushi town, Kagoshima, Japan.
while the donburi was cast repeatedly (Fig. 3.5 B). Even at 30 - m water depth (Fig. 3.6 C), both types of donburi produce sounds greater than 100 dB. Sounds produced by the donburi with a hole in the bottom of it (Fig. 3.6 C) were 4.3 dB higher than sounds for the one without a hole. It appears that function of the bottom hole in a donburi is to produce louder sounds.
3.5.2 Use of Sound in Fish Guidance Devices
The release of artifi cially raised fi sh seedlings into coastal waters has been an integral part of sea ranching operations in Japan for more than 40 years (Shishidou 2002 ). Proper introduction of seedlings into reef areas is crucial for their initial survival. The Research Institute of Oita Prefectural Government in Japan fi rst applied the sound condi-tioning method in their marine ranching projects to prevent fi sh from dispersing and to enhance the recapture rate of released fi sh (Kamijyo 1998 ). Here we describe an active fi sh guidance method that uses an acoustic conditioning technique to transport fi sh over a long distance (Anraku et al. 2006a,
2006b ). The method allows the transport of fi sh seedlings to a desired location in the sea without physical handling so to minimize physiological stress and physical injury. It combines acoustic, visual, and feeding stimuli to control fi sh during fi eld transportation. The research involved red sea bream, which is one of the major sea ranching species in Japan. The following descriptions are mainly from work by Anraku et al. (2006a, 2006b) .
Conditioning
About 50,000 juvenile red sea bream of about 50 mm in body length were held in a net cage for conditioning use. They were fed with artifi cial pellets while a sinusoidal tone burst (pulse width and pulse interval were both 0.75 s) with a fre-quency of 300 Hz was played to condition the fi sh with sound and food. By repeating such food and acoustic coupling conditioning, fi sh learned to asso-ciate feeding with acoustic stimuli. Once they were conditioned, the fi sh would respond to sound stimuli by swimming rapidly close to the water surface even before feed pellets were given. A visual target
Hearing in Marine Fish and Its Application in Fisheries 55
Figure 3.6. ( A ) Sound wave and ( B ) sound spectrograph recorded before and after a donburi is cast to sea (impact time at 2.6 s). ( C ) The mean sound pressure levels recorded at the different water depths, which were generated by a donburi with a hole. Error bar indicates standard deviation of means of 10 measurements. (K. Anraku, unpublished data.)
made of strings of blue plastic ribbons (each string was 15 cm in length) served as the aggregation point for fi sh. The underwater speaker was suspended in water at all times while the visual target was sus-pended only during conditioning. Feed pellets were given 0.5 to 1 min after sound was broadcasted. Each training session lasted between 5 and 10 min and a total of 20 to 30 training sessions were con-ducted each day for 9 days. The fi shes ’ response to the sound stimuli clearly changed within the fi rst day but at least 3 days of training were required before dense aggregation around the visual target was observed. Once the fi sh were trained, fi sh would immediately respond to sound stimuli by increasing their swimming speed and swimming around the visual target in a schooling formation. The fi sh school followed the target even when its position was changed.
The Guiding Device
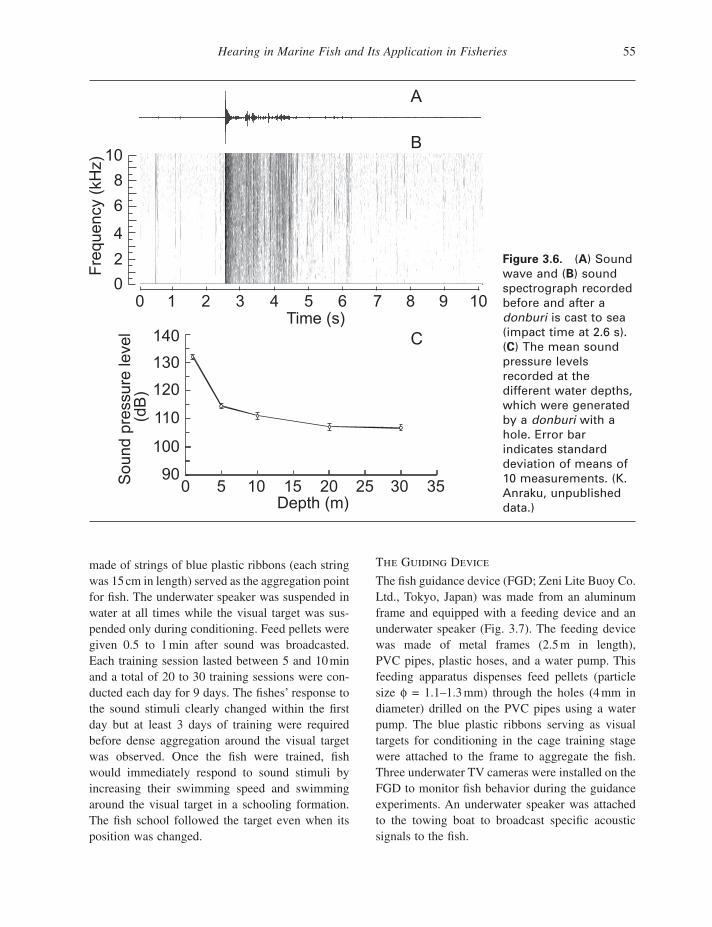
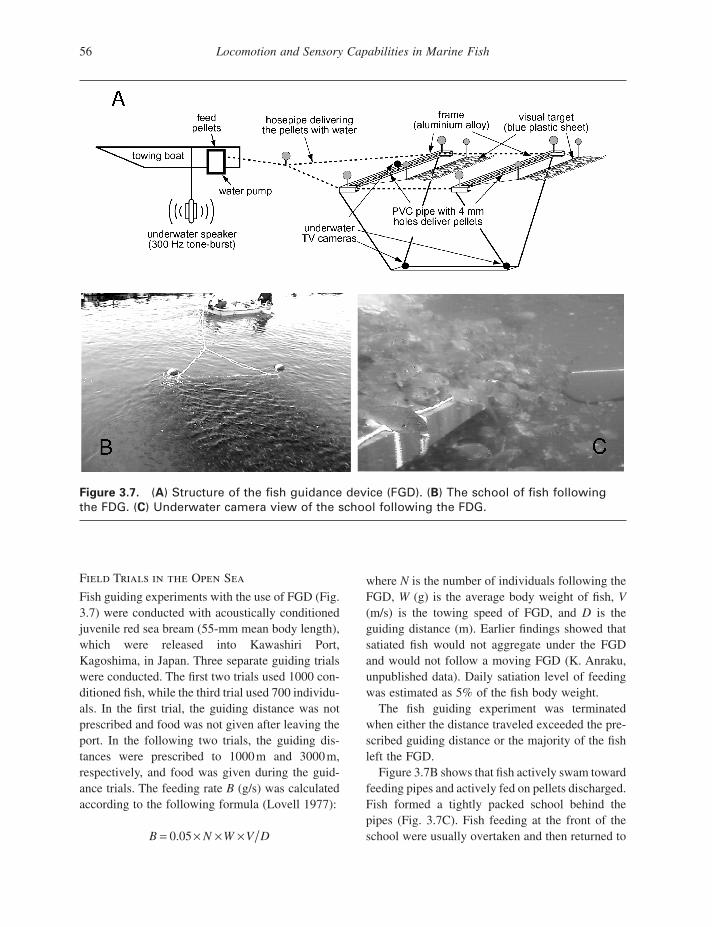
The fi sh guidance device (FGD; Zeni Lite Buoy Co. Ltd., Tokyo, Japan) was made from an aluminum frame and equipped with a feeding device and an underwater speaker (Fig. 3.7 ). The feeding device was made of metal frames (2.5 m in length), PVC pipes, plastic hoses, and a water pump. This feeding apparatus dispenses feed pellets (particle size φ = 1.1 – 1.3 mm) through the holes (4 mm in diameter) drilled on the PVC pipes using a water pump. The blue plastic ribbons serving as visual targets for conditioning in the cage training stage were attached to the frame to aggregate the fi sh. Three underwater TV cameras were installed on the FGD to monitor fi sh behavior during the guidance experiments. An underwater speaker was attached to the towing boat to broadcast specifi c acoustic signals to the fi sh.
56 Locomotion and Sensory Capabilities in Marine Fish
Figure 3.7. ( A ) Structure of the fi sh guidance device (FGD). ( B ) The school of fi sh following the FDG. ( C ) Underwater camera view of the school following the FDG.
Field Trials in the Open Sea
Fish guiding experiments with the use of FGD (Fig. 3.7 ) were conducted with acoustically conditioned juvenile red sea bream (55 - mm mean body length), which were released into Kawashiri Port, Kagoshima, in Japan. Three separate guiding trials were conducted. The fi rst two trials used 1000 con-ditioned fi sh, while the third trial used 700 individu-als. In the fi rst trial, the guiding distance was not prescribed and food was not given after leaving the port. In the following two trials, the guiding dis-tances were prescribed to 1000 m and 3000 m, respectively, and food was given during the guid-ance trials. The feeding rate B (g/s) was calculated according to the following formula (Lovell 1977 ):
B N W V D= × × ×0 05.
where N is the number of individuals following the FGD, W (g) is the average body weight of fi sh, V (m/s) is the towing speed of FGD, and D is the guiding distance (m). Earlier fi ndings showed that satiated fi sh would not aggregate under the FGD and would not follow a moving FGD (K. Anraku, unpublished data). Daily satiation level of feeding was estimated as 5% of the fi sh body weight.
The fi sh guiding experiment was terminated when either the distance traveled exceeded the pre-scribed guiding distance or the majority of the fi sh left the FGD.
Figure 3.7 B shows that fi sh actively swam toward feeding pipes and actively fed on pellets discharged. Fish formed a tightly packed school behind the pipes (Fig. 3.7 C). Fish feeding at the front of the school were usually overtaken and then returned to
Hearing in Marine Fish and Its Application in Fisheries 57
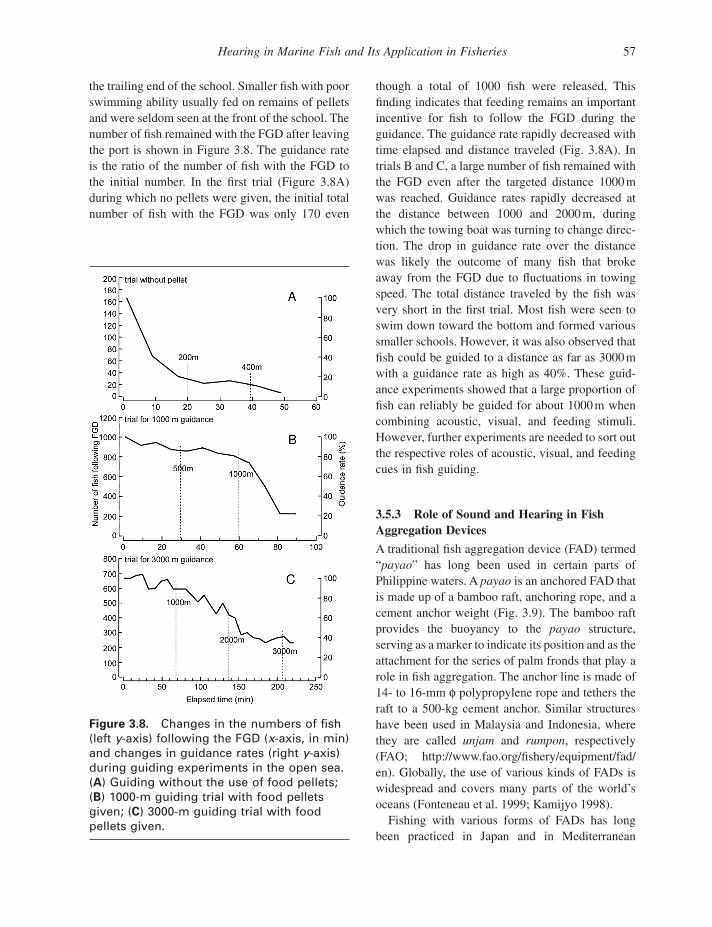
Figure 3.8. Changes in the numbers of fi sh (left y - axis) following the FGD ( x - axis, in min) and changes in guidance rates (right y - axis) during guiding experiments in the open sea. ( A ) Guiding without the use of food pellets; ( B ) 1000 - m guiding trial with food pellets given; ( C ) 3000 - m guiding trial with food pellets given.
the trailing end of the school. Smaller fi sh with poor swimming ability usually fed on remains of pellets and were seldom seen at the front of the school. The number of fi sh remained with the FGD after leaving the port is shown in Figure 3.8 . The guidance rate is the ratio of the number of fi sh with the FGD to the initial number. In the fi rst trial (Figure 3.8 A) during which no pellets were given, the initial total number of fi sh with the FGD was only 170 even
though a total of 1000 fi sh were released. This fi nding indicates that feeding remains an important incentive for fi sh to follow the FGD during the guidance. The guidance rate rapidly decreased with time elapsed and distance traveled (Fig. 3.8 A). In trials B and C, a large number of fi sh remained with the FGD even after the targeted distance 1000 m was reached. Guidance rates rapidly decreased at the distance between 1000 and 2000 m, during which the towing boat was turning to change direc-tion. The drop in guidance rate over the distance was likely the outcome of many fi sh that broke away from the FGD due to fl uctuations in towing speed. The total distance traveled by the fi sh was very short in the fi rst trial. Most fi sh were seen to swim down toward the bottom and formed various smaller schools. However, it was also observed that fi sh could be guided to a distance as far as 3000 m with a guidance rate as high as 40%. These guid-ance experiments showed that a large proportion of fi sh can reliably be guided for about 1000 m when combining acoustic, visual, and feeding stimuli. However, further experiments are needed to sort out the respective roles of acoustic, visual, and feeding cues in fi sh guiding.
3.5.3 Role of Sound and Hearing in Fish Aggregation Devices
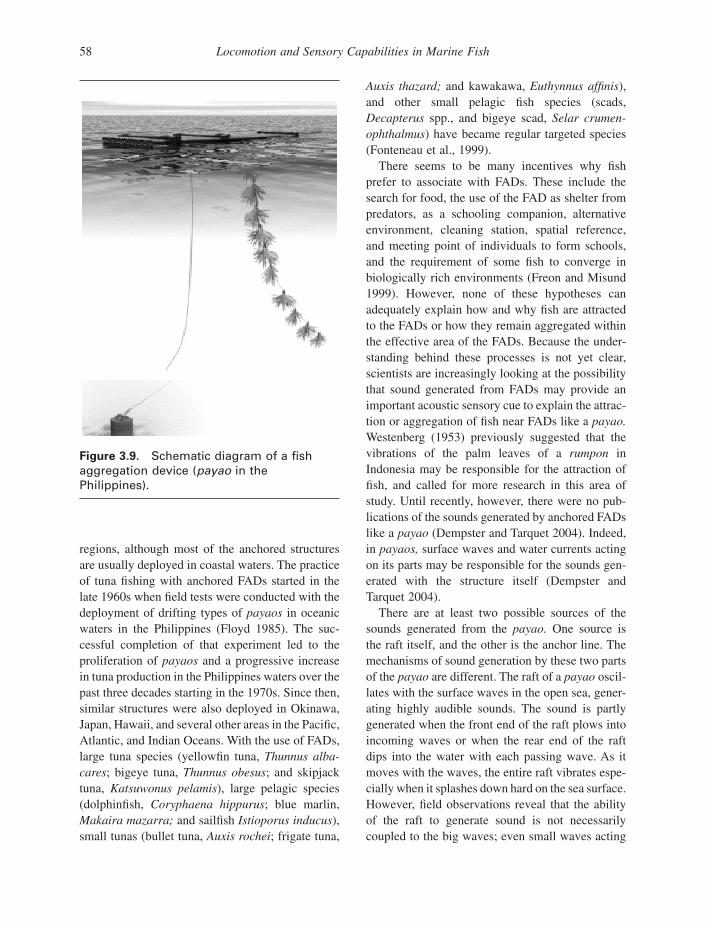
A traditional fi sh aggregation device (FAD) termed “ payao ” has long been used in certain parts of Philippine waters. A payao is an anchored FAD that is made up of a bamboo raft, anchoring rope, and a cement anchor weight (Fig. 3.9 ). The bamboo raft provides the buoyancy to the payao structure, serving as a marker to indicate its position and as the attachment for the series of palm fronds that play a role in fi sh aggregation. The anchor line is made of 14 - to 16 - mm φ polypropylene rope and tethers the raft to a 500 - kg cement anchor. Similar structures have been used in Malaysia and Indonesia, where they are called unjam and rumpon , respectively (FAO; http://www.fao.org/fi shery/equipment/fad/en ). Globally, the use of various kinds of FADs is widespread and covers many parts of the world ’ s oceans (Fonteneau et al. 1999 ; Kamijyo 1998 ).
Fishing with various forms of FADs has long been practiced in Japan and in Mediterranean
58 Locomotion and Sensory Capabilities in Marine Fish
Auxis thazard; and kawakawa, Euthynnus affi nis ), and other small pelagic fi sh species (scads, Decapterus spp., and bigeye scad, Selar crumen-ophthalmus ) have became regular targeted species (Fonteneau et al., 1999 ).
There seems to be many incentives why fi sh prefer to associate with FADs. These include the search for food, the use of the FAD as shelter from predators, as a schooling companion, alternative environment, cleaning station, spatial reference, and meeting point of individuals to form schools, and the requirement of some fi sh to converge in biologically rich environments (Freon and Misund 1999 ). However, none of these hypotheses can adequately explain how and why fi sh are attracted to the FADs or how they remain aggregated within the effective area of the FADs. Because the under-standing behind these processes is not yet clear, scientists are increasingly looking at the possibility that sound generated from FADs may provide an important acoustic sensory cue to explain the attrac-tion or aggregation of fi sh near FADs like a payao. Westenberg (1953) previously suggested that the vibrations of the palm leaves of a rumpon in Indonesia may be responsible for the attraction of fi sh, and called for more research in this area of study. Until recently, however, there were no pub-lications of the sounds generated by anchored FADs like a payao (Dempster and Tarquet 2004 ). Indeed, in payaos, surface waves and water currents acting on its parts may be responsible for the sounds gen-erated with the structure itself (Dempster and Tarquet 2004 ).
There are at least two possible sources of the sounds generated from the payao. One source is the raft itself, and the other is the anchor line. The mechanisms of sound generation by these two parts of the payao are different. The raft of a payao oscil-lates with the surface waves in the open sea, gener-ating highly audible sounds. The sound is partly generated when the front end of the raft plows into incoming waves or when the rear end of the raft dips into the water with each passing wave. As it moves with the waves, the entire raft vibrates espe-cially when it splashes down hard on the sea surface. However, fi eld observations reveal that the ability of the raft to generate sound is not necessarily coupled to the big waves; even small waves acting
Figure 3.9. Schematic diagram of a fi sh aggregation device ( payao in the Philippines).
regions, although most of the anchored structures are usually deployed in coastal waters. The practice of tuna fi shing with anchored FADs started in the late 1960s when fi eld tests were conducted with the deployment of drifting types of payaos in oceanic waters in the Philippines (Floyd 1985 ). The suc-cessful completion of that experiment led to the proliferation of payaos and a progressive increase in tuna production in the Philippines waters over the past three decades starting in the 1970s. Since then, similar structures were also deployed in Okinawa, Japan, Hawaii, and several other areas in the Pacifi c, Atlantic, and Indian Oceans. With the use of FADs, large tuna species (yellowfi n tuna, Thunnus alba-cares ; bigeye tuna, Thunnus obesus ; and skipjack tuna, Katsuwonus pelamis ), large pelagic species (dolphinfi sh, Coryphaena hippurus ; blue marlin, Makaira mazarra; and sailfi sh Istioporus inducus ), small tunas (bullet tuna, Auxis rochei ; frigate tuna,
Hearing in Marine Fish and Its Application in Fisheries 59
head - on against the hollow ends of the bamboo could generate a loud sound that is perceptible to the human ear at distances of greater than 50 m (authors ’ personal observation, unpublished data). Meanwhile, the action of tidal currents on the anchor line of the payao also generates sound similar to that of the Aeolian tunes of telephone lines when blown by a consistently strong wind. The sound could also be generated by the anchor line resulting from its lateral vibrations due to the shedding of vortices when acted on by passing water currents.
The fi rst fi eld recording of underwater sound ever made near an anchored FAD was made near a payao in the Philippines (Babaran et al., 2008 ). Payao - generated sounds were recorded with a hydrophone at various depths and distances down-stream from the payao. The dominant peak depended on the conditions in the fi eld at the time of recording. For example, during rough weather, the payao generated sound at a level as high as 145 dB close to the raft with a frequency centered around 63 Hz (Babaran et al., 2008 ). This sound, which was higher than the background noise by about 20 dB, had a limited range and attenuated rapidly with both increasing distances from the raft and increasing depths. The frequency of the gener-
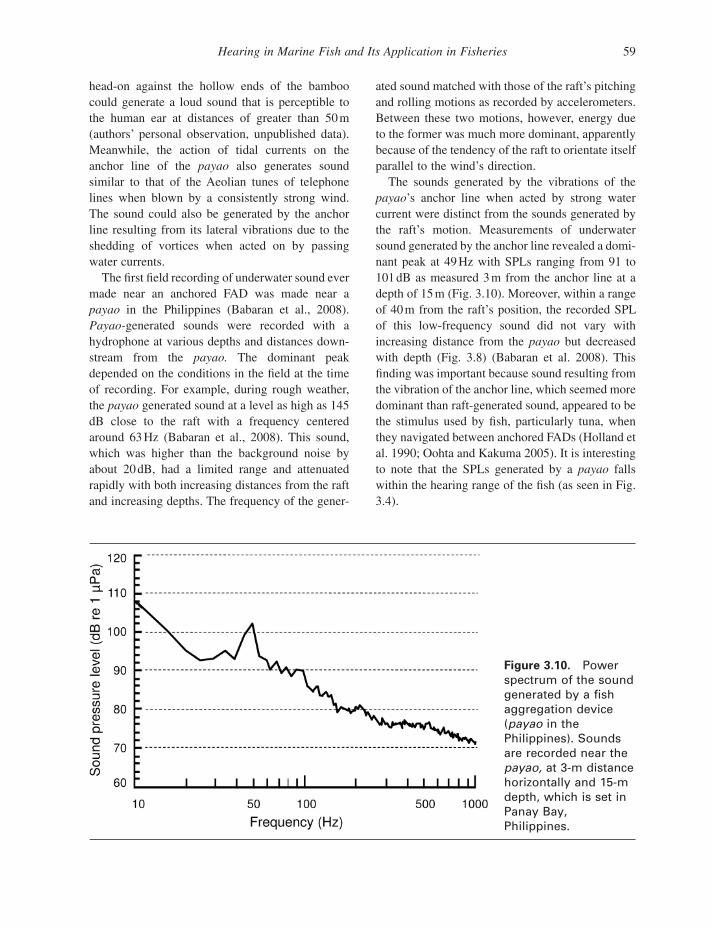
Figure 3.10. Power spectrum of the sound generated by a fi sh aggregation device ( payao in the Philippines). Sounds are recorded near the payao, at 3 - m distance horizontally and 15 - m depth, which is set in Panay Bay, Philippines.
ated sound matched with those of the raft ’ s pitching and rolling motions as recorded by accelerometers. Between these two motions, however, energy due to the former was much more dominant, apparently because of the tendency of the raft to orientate itself parallel to the wind ’ s direction.
The sounds generated by the vibrations of the payao ’ s anchor line when acted by strong water current were distinct from the sounds generated by the raft ’ s motion. Measurements of underwater sound generated by the anchor line revealed a domi-nant peak at 49 Hz with SPLs ranging from 91 to 101 dB as measured 3 m from the anchor line at a depth of 15 m (Fig. 3.10 ). Moreover, within a range of 40 m from the raft ’ s position, the recorded SPL of this low - frequency sound did not vary with increasing distance from the payao but decreased with depth (Fig. 3.8 ) (Babaran et al. 2008 ). This fi nding was important because sound resulting from the vibration of the anchor line, which seemed more dominant than raft - generated sound, appeared to be the stimulus used by fi sh, particularly tuna, when they navigated between anchored FADs (Holland et al. 1990 ; Oohta and Kakuma 2005 ). It is interesting to note that the SPLs generated by a payao falls within the hearing range of the fi sh (as seen in Fig. 3.4 ).
60 Locomotion and Sensory Capabilities in Marine Fish
3.5.4 Aversive Sound to Reduce Fish Entrapment in the Cooling Water Intakes
Much research to develop techniques to control fi sh behavior to prevent their entry into water intakes of the power plants has been carried out worldwide (Carlson and Popper 1997 ). Conventional coal - burning and nuclear power plants have to draw in a large volume of water to cool either steam tur-bines or reactors. Inevitably, some fi sh are either impinged or entrapped (Grimes 1975 ; Hanson et al. 1977 ; Stanford et al. 1982 ). The compositions of species and economic losses due to the impinge-ment and entrapment of fi shes have been assessed, and a case study in Taiwan showed that US$2.5 million yearly economic loss could be due to the intake in the Nuclear Power Plant I (Shao et al. 1990 ). Additionally, many fi sh deformities caused by the thermal plume of cooling water discharge have been observed in Taiwan. Four species of marine fi sh — Jarbua tarpon ( Terapon jarbua ), large scale mullet ( Liza macrolepis ), milkfi sh ( Chanos chanos ), and grey mullet ( Mugil cephalus ) — were attracted to the thermal plume at the discharge outlet site of a Nuclear Power Plant II in northern Taiwan, which caused extensive lordosis of verte-bral columns. Prolonged exposure to high water temperature caused defi ciency of ascorbic acid in the fi sh ’ s muscle, which then led to mismatched growth between vertebrates and therefore muscles that resulted in lordosis formation (Shao et al. 1990 ). Various methods, including mechanical screening devices, electric barriers, strobe light, and sound (EPRI 1992 , Humbles 1993 ), have been deployed to reduce either impingement or entrap-ment (see summary in Ross and Dunning 1996 ). Work by Ross and Dunning (1996) demonstrated that by broadcasting high - frequency sound (122 – 128 KHz) at a pressure level of 190 dB, alewives ( Alosa pseudoharengus) could be driven from the water intake of the James A. FitzPatrick nuclear power plant in Ontario, Canada.
In Taiwan, a study using aversive underwater sound to drive fi sh from intake areas has been undertaken since 2006. First, the audiograms of 11 species of the most frequently entrapped fi sh were obtained with the aforementioned ABR protocol. Based on their best hearing frequencies and thresh-old data, randomized pulsed low - frequency sound
(100 – 2000 Hz interval; 100 Hz duration; 1 s in each frequency) was digitized with a function generator and amplifi ed through an Industrial Power Amplifi er (IPA 300T) and broadcast with a underwater speaker (Lubell Labs LL9162; sound pressure of 187 dB, measured with an Okidata SW - 1030 hydro-phone placed 10 m from the speaker) at the water intake of Nuclear Power Plant II in northern Taiwan coast (Wu et al. 2009 ). A total of 17 fi eld tests were conducted from November 13, 2006, to February 26, 2008, each with sound on or off for a period of 24 h. During periods when the sound was off, a total of 17 species (1076 individuals) were entrapped. During the periods when sound was on, 10 species (572 individuals) were entrapped. The results indi-cated that sound signifi cantly reduced the entrap-ment rate by almost 50% (Wu et al. 2009 ). The promising results prompted the planning and execu-tion of the long - term use of underwater aversive sound to repel fi sh from the cooling water intakes and discharge sites of nuclear power plants in Taiwan.
3.6 CONCLUDING REMARKS
The underwater world is full of sound and vibration. Fish evolved to have a mechanosensory system to detect both sound and vibration. Hearing generalist fi sh have a narrower hearing frequency range (less than 1500 Hz) and higher hearing threshold (above 100 dB, re 1 μ Pa) than do hearing specialist fi sh (up to 8 kHz and down to 60 dB re 1 μ Pa). For com-munication purposes, some fi sh evolved to produce sound. Unwanted noises generated by fi shing, research, and whale - watching vessels can inevita-bly affect commercially important fi sh species. Prolonged exposure to noise results in reduced hearing abilities of fi sh. Fish can be conditioned by coupling the sound with food and visual cues. Devices utilizing this knowledge can be used to guide the fi sh over a long distance for underwater transport purposes to minimize physiological stress. A donburi fi shing method that uses sound generated underwater to attract fi sh has been used in the Kagoshima area of Japan. Many FADs using sound as the main attraction feature have been deployed by fi shermen around the world. Artifi cial underwa-ter noise has been widely used by power plant operators to drive fi sh away from cooling water
Hearing in Marine Fish and Its Application in Fisheries 61
intake areas to reduce unwanted impingement and entrapment.
REFERENCES Akamatsu T , Nanami A and Yan HY . 2003 . Spotlined
sardine Sardinops melanostictus listens to 1 - kHz sound by using its gas bladder . Fish. Sci. 69 : 348 – 354 .
Anraku K , Kawamura G , Nakahara M , Shigesato N and Archdale MV . 2006a . Fish behavior control-methods in marine ranching in Japan - I. Development of conditioning method on the basis of hearingabil-ity and auditory behavior. INOC - UMS/BMRI, ICCOSMA. pp 391 – 397 .
Anraku K , Makino T , Okawa F , Watanabe K , Masu S , Ozono H , Takeshita H , Kawamura G and Archdale MV . 2006b . Fish behavior control methods in marine ranching in Japan – III. Development of fi sh guidance device. INOC - UMS/BMRI, ICCOSMA. pp 405 – 413 .
Astrup J and M ø hl B . 1993 . Detection of intense ultra-sound by the cod ( Gadus morhua L.) . J. Exp. Biol. 182 : 31 – 42 .
Babaran RP , Anraku K , Ishizaki M , Watanabe K , Matsuoka T and Shirai H . 2008 . Sound generated by a payao and comparison with auditory sensitivity of jack mackerel Trachurus japonicus . Fish. Sci. 74 : 1207 – 1214 .
Barimo JF and Fine ML . 1998 . Relationship of swim - bladder shape to the directionality pattern of under-water sound in the oyster toadfi sh . Can. J. Zool. 76 : 134 – 143 .
Blaxter JHS , Gray JAB and Denton EJ . 1981 . Sound and startle responses in herring shoals . J. Mar. Biol. Assoc. UK. 61 : 851 – 869 .
Buerkle U . 1968 . Relation of pure tone thresholds to background noise level in the Atlantic cod ( Gadus morhua ) . J. Fish. Res. Bd. Can. 25 : 1155 – 1160 .
Buerkle U . 1977 . Detection of trawling noise by Atlantic cod ( Gadus morphua L.) . Mar. Freshw. Behav. Physiol. 4 : 233 – 242 .
Carlson TJ and Popper AN . 1997 . Using sound to modify fi sh behavior at power - production and water - control facilities: A workshop. December 12 – 13, 1995. Portland State University, Portland, OR. Phase II: Final Report to Bonneville Power Administration, Contract No. 1986BP62611, Project No. 199207101, 360 pp. (BPA Report DOE/BP - 62611 - 11.)
Chapman CJ and Hawkins AD . 1973 . A fi eld study of hearing in the cod ( Gadus morhua L.) . J. Comp. Physiol. 85 : 147 – 167 .
Chow CK , Ibrahim W , Wei Z and Chan AC . 1999 . Vitamin E regulates mitochondrial hydrogen peroxide generation. Free Rad . Biol. Med . 27 : 580 – 587 .
Connaughton M , Fine ML and Taylor MH . 1997 . The effects of seasonal hypertrophy and atrophy on fi ber morphology, metabolic substrate concentration and sound characteristics of the weak fi sh sonic muscle . J. Exp. Biol. 200 : 2449 – 2457 .
Dempster T and Tarquet M . 2004 . Fish aggregation device (FAD) research: gaps in current knowledge and future directions for ecological studies . Rev. Fish Biol. Fish. 14 : 21 – 42 .
Enger PS . 1967 . Hearing in herring . Comp. Biochem. Physiol. 22 : 527 – 538 .
Enger PS and Anderson R . 1967 . An electrophysiolog-ical fi eld study of hearing in fi sh . Comp. Biochem. Physiol. 22 : 517 – 525 .
EPRI . 1992 . Evaluation of strobe lights for fi sh diver-sion at the York Haven hydroelectric project. Electric Power Research Institute EPRI - TR - 101703. Final Report. Boston, MA. 120 pp.
Erbe C . 2002 . Underwater noise of whale - watching boats and potential effects on killer whales ( Orcinus orca ), based on an acoustic impact model . Mar. Mam. Sci. 18 : 394 – 418 .
Fay RR . 1969 . Behavioral audiogram for the goldfi sh . J. Audit. Res. 9 : 112 – 121 .
Fine ML , Friel JP , McElroy D , King CB , Loesser KE and Newton S . 1997 . Pectoral spinelocking and sound production in the Channel Catfi sh Ictalurus punctatus . Copeia. 1997 : 777 – 790
Fine ML , Malloy KL , King CB , Mitchell SL and Cameron TM . 2001 . Movement and sound genera-tion by the toadfi sh swimbladder . J. Comp. Physiol. (A) . 187 : 371 – 379 .
Fine ML , Schrinel J and Cameron TM . 2004 . The effect of loading on disturbance sounds of the Atlantic croaker Micropogonius undulates : air vs. water . J. Acoust. Soc. Am. 116 : 1271 – 1275 .
Floyd JM . 1985 . Development of the Philippine tuna industry. Pacifi c Islands Development Program, East - West Center, Honolulu, Hawaii. 60 pp.
Fonteneau A , Pallares P and Pianet R . 1999 . A world-wide review of purse seine fi sheries on FADs . In: Tuna Fishing and Fish Aggregating Devices Symposium . pp. 13 – 25 . Caribbean , Martinique , October 15 – 19, 1999.
Freon P and Misund OA . 1999 . Dynamics of Pelagic Fish Distribution and Behavior: Effects on Fisheries and Stock Assessment . Cambridge : Fishing News Books . 360 pp.
62 Locomotion and Sensory Capabilities in Marine Fish
Fujieda S , Matsuno Y and Yamanaka Y . 1996 . The auditory threshold of the bastard halibut Paralichthys olivaceus . Nippon Suisan Gakkaishi . 62 : 201 – 204 .
Furukawa T and Ishii Y . 1967 . Neurophysiological studies on hearing in goldfi sh . J. Neurophysiol. 30 : 1377 – 1403 .
Goodson AD . 1997 . Developing deterrent devices designed to reduce the mortality of small cetaceans in commercial fi shing nets . Mar. Freshw. Behav. Physiol. 29 : 211 – 236 .
Grimes CB . 1975 . Entrapment of fi shes on intake water screens at a stream electric generating station . Chesapeake Sci. 16 : 172 – 177 .
Hanson CH , White JR and Li WH . 1977 . Entrapment and impingement of fi shes by power plant cooling - water intakes . Mar. Fish. Rev. 1266 : 7 – 17 .
Harris GG and van Bergeijk WA . 1962 . Evidence that the lateral - line organ responds to near - fi eld dis-placements of sound sources in water . J. Acoust. Soc. Am. 34 : 1831 – 1841 .
Hashimoto T and Maniwa Y . 1964 . Research on the luring of fi sh schools by utilizing underwater acousti-cal equipment (1) . Tech. Rep. Fish. Boat. 19 : 1 – 12 .
Hashimoto T and Maniwa Y . 1966 . Research on the luring of fi sh schools by utilizing underwater acous-tical equipment (2) . Tech. Rep. Fish. Boat. 20 : 1 – 5 .
Hatakeyama Y . 1992 . Hearing abilities of fi sh . Fish. Eng. 28 : 111 – 119 . (In Japanese)
Hatakeyama Y . 1996 . Hearing abilities of fi sh and its responses to underwater sound (II) . J. Mar. Acoust. Soc. Jpn. 23 : 132 – 139 (in Japanese).
Hawkins AD . 1986 . Underwater sound and fi sh behav-ior . In: Pitcher T (ed). The Behavior of Teleost Fishes . pp 114 – 151 . Baltimore, MD : The Johns Hopkins University Press .
Holland KN , Brill RW and Chang RKC . 1990 . Horizontal and vertical movements of yellowfi n and bigeye tuna associated with fi sh aggregating devices . Fish. Bull. 88 : 493 – 507 .
Hoyt E . 2000 . Whale watching 2000: worldwide tourism numbers, expenditures, and expanding socioeconomic benefi ts . Yarmouthport, MA : Inter-national Fund for Animals Welfare . 157 pp.
Humbles G . 1993 . Evaluation of Smith - Root type elec-tric fi sh barrier. Yakima Project, Yakima, WA. 84 pp.
Ishioka H ., Hatakeyama Y and Sakaguchi S . 1988 . The hearing ability of the red sea bream Pagrus major . Nippon Suisan Gakkaishi . 54 : 947 – 951 .
Jerk ø K , Turunen - Rise I , Enger PS and Sand O . 1989 . Hearing in the eel ( Anguilla anguilla ) . J. Comp. Physiol. (A) . 165 : 455 – 459 .
Kamijyo Y . 1998 . Example of marine ranching system (Kaiyou Bokuzyou no Jitsurei) . In: Soeda H , Hatakeyama Y and Kawamura G (eds). Hearing Physiology in Fishes (Gyorui no Choukaku Seiri) . pp 359 – 367 . Tokyo : Kouseisya Kouseikaku .
Kenyon TN , Ladich F and Yan HY . 1998 . A compara-tive study of hearing ability in fi shes: the auditory-brainstem response approach . J. Comp. Physiol. (A) . 182 : 307 – 318 .
Kojima T , Shimamura T , Yoza K , Okumoto N , Hatakeyama Y and Soeda H . 1992 . W - shaped audi-tory threshold curves of masu salmon Oncor hynchus masou . Nippon Suisan Gakkaishi . 58 : 1447 – 1452 .
Kraus SD , Read AJ , Solow A , Baldwin K , Spradlin T , Anderson E and Williamson J . 1997 . Acoustic alarms reduce porpoise mortality . Nature . 388 : 525 .
Lovell RT . 1977 . Fish nutrition: energy. Comm . Fish Farmer . 2 : 29 – 30 .
Lugli M , Yan HY and Fine ML . 2003 . Acoustic com-munication in two freshwater gobies: the relation-ship between ambient noise, hearing thresholds and sound spectrum . J. Comp. Physiol. (A) . 189 : 309 – 320 .
Maniwa Y and Hatakeyama Y . 1970 . Research on the luring of fi sh schools by utilizing underwater acous-tical equipment (3) . Tech. Rep. Fish. Boat. 24 : 1 – 5 .
Maniwa Y and Hatakeyama Y . 1975 . Research on the luring and driving away of fi sh schools by utilizing underwater acoustical equipment (4) – Experiments and practical use in the squid fi shing . Tech. Rep. Fish. Boat. 28 : 1 – 22 .
McCauley RD , Fewrell J and Popper AN . 2003 . High intensity anthropogenic sound damages fi sh ear . J. Acoust. Soc. Am. 113 : 638 – 642 .
Mitson RB and Knudsen HP . 2003 . Causes and effects of underwater noise on fi sh abundance estimation . Aquat. Living Resour . 16 : 225 – 263 .
Mooney TA , Au WWL , Nachtigall PE and Trippel EA . 2007 . Acoustic and stiffness properties of gill-nets as they relate to small cetacean bycatch . ICES J. Mar. Sci. 64 : 1324 – 1332 .
Motomatsu K , Hiraishi T , Yamamoto K and Nashimoto K . 1996 . Auditory threshold and critical ratio of black rockfi sh Sebastes schlegeli . Nippon Suisan Gakkaishi . 62 : 785 – 790 .
Nelson JS . 1994 . Fishes of the World , 3rd. ed. New York : Wiley and Sons . 624 pp.
NRC . 2003 . Ocean noise and marine mammals . Washington, DC : National Research Council . 204 pp.
Oohta I and Kakuma S . 2005 . Periodic behavior and residence time of yellowfi n and bigeye tuna associ-ated with fi sh aggregating devices around Okinawa
Hearing in Marine Fish and Its Application in Fisheries 63
Islands, as identifi ed with automated listening sta-tions . Mar. Biol. 146 : 581 – 594 .
Park Y and Iida K . 1998 . Walleye pollock , In: Soeda H , Hatakeyama Y and Kawamura G (eds). Hearing Physiology in Fishes (Gyorui no Choukaku Seiri) . pp 223 – 233 . Tokyo : Kouseisha - Kouseikaku .
Pitcher TJ . 1979 . Sensory information and the organi-zation of behavior in a shoaling cyprinid . Anim. Behav. 27 : 126 – 149 .
Popper AN and Fay RR . 1999 . The auditory periphery in fi shes . In: Fay RR and Popper AN (eds). Comparative Hearing: Fish and Amphibians . pp 43 – 100 . New York : Springer - Verlag .
Richardson WJ and W ü rsig B . 1997 . Infl uences of man - made noise and other human actions on ceta-cean behavior . Mar. Freshw. Behav. Physiol. 29 : 183 – 209 .
Ross QE and Dunning DJ . 1996 . Reducing impinge-ment of alewives with high frequency sound at a power plant in Ontario . N. Am. J. Fish. Manag. 16 : 548 – 559 .
Saidel WM and Popper AN . 1987 . Sound perception in two anabantoid fi shes . Comp. Biochem. Physiol. 88 : 37 – 44 .
Sand O and Karlsen HE . 1986 . Detection of infrasound by the Atlantic cod . J. Exp. Biol. 125 : 197 – 204 .
Scholik AR and Yan HY . 2001 . Effects of underwater noise on auditory sensitivity of a cyprinid fi sh . Hear. Res. 152 : 17 – 24 .
Scholik AR and Yan HY . 2002a . Effects of boat engine noise on the auditory sensitivity of the fathead minnow, Pimephales promelas . Environ. Biol. Fish. 63 : 203 – 209 .
Scholik AR and Yan HY . 2002b . The effects of noise on the auditory sensitivity of the bluegill sunfi sh, Lepomis macrochirus . Comp. Biochem. Physiol. (A) . 133 : 43 – 52 .
Scholik AR , Lee US , Chow CK and Yan HY . 2004 . Dietary vitamin E protects the fathead minnow, Pimephales promelas, against noise exposure . Comp. Biochem. Physiol. (C) . 137 : 313 – 323 .
Schwarz AL and Greer GL . 1984 . Responses of Pacifi c herring, Clupea harengus pallasi , to some underwa-ter sounds . Can. J. Fish. Aquat. Sci. 41 : 1183 – 1192 .
Shao KT , Lin CP , Ho LT and Lin PL . 1990 . Study on the fi sh communities from northern and southern waters of Taiwan by analyzing the impingement data . J. Fish. Soc. Taiwan 17 : 73 – 90 .
Shishidou H . 2002 . Stocking effectiveness of red sea bream, Pagrus major , in Kagoshima Bay , Japan. Fish. Sci. 68 ( suppl. 1 ): 904 – 907 .
Stanford RM , Jordan SW , Talhelm DR , Liston CR , Korson C and Steinmuller MH . 1982 . The bioeco-
nomic impact of impingement and entrapment on yellow perch in Lake Erie . N. Am. J. Fish. Manag. 2 : 285 – 293 .
Trippel EA , Holy NL , Palka DL , Shepard TD , Melvin GD and Terhyne JM . 2003 . Nylonbarium sulphate gillnet reduces porpoise and seabird mortality . Mar. Mam. Sci. 19 : 240 – 243 .
Tu C , Wei RC and Chan HS . 2004 . Passive acoustic localization for sciaenid habitat in coastal water of Taiwan . J. Acoust. Soc. Am. 115 : 2474 .
Urick RJ . 1983 . Principles of underwater sound . Los Altos, CA : Peninsula Publishing . 423 pp.
Wenz GM . 1962 . Acoustic ambient noise in the ocean: spectra and sources . J. Acoust. Soc. Am. 34 : 1936 – 1956 .
Westenberg J . 1953 . Acoustical properties of some Indonesian fi sheries . J. Mar. Sci. 18 : 311 – 325 .
Winger P . 2004 . Effect of Environmental Conditions on the Natural Activity Rhythms and Bottom Trawl Catchability of Atlantic Cod ( Gadus morhua ). PhD thesis, Memorial University of Newfoundland. 151 pp.
Wu YH , Yu HY , Shao IT , Lee ZC , Lin ST , Yan HY , Hsu CH , Lee CP , and Jiang HH . 2009 . The method using underwater sound in reducing fi sh entrain-ment and impingement at the cooling water inlets of nuclear power plants in northem Taiwan . TaiPower Eng. Month. 733 : 108 – 117 .
Yan HY . 1995 . Investigations of fi sh hearing ability using an automated reward method . In: Klump GM , Dooling RJ , Fay RR and Stebbins WC (eds). Methods in Comparative Psychoacoustics . pp 263 – 276 . Basel, Switzerland : Birkhauser Verlag .
Yan HY . 1998 . Auditory role of the suprabranchial chamber in gourami fi sh . J. Comp. Physiol. (A) . 183 : 325 – 333 .
Yan HY and Curtsinger WS . 2000 . The otic gas bladder as an ancillary auditory structure in a mor-myridfi sh . J. Comp. Physiol. (A) . 186 : 595 – 602 .
Yan HY and Popper AN . 1991 . An automated positive reward method for measuring acoustic sensitivity in fi sh . Behav. Res. Method. Instru. Compu. 23 : 351 – 356 .
Yan HY and Popper AN . 1992 . Auditory sensitivity of the cichlid fi sh Astronotus ocellatus (Cuvier) . J. Comp. Physiol. (A) . 171 : 105 – 109 .
Yan HY , Fine ML , Horn NS and Colon WE . 2000 . Variability in the role of the gas bladder in fi sh audi-tion . J. Comp. Physiol. A. 186 : 435 – 445 .
Yan HY , Lin SH , Yu HY and Lee WJ . 2006 . Analyses on noises generated by aerators and its possible impacts on cultured fi sh and shrimp . Proc. Taiwan - France Symp. Marine Biodiver. Sustain. Fish. Maricult. pp. 95 – 108. Kao - Hsiung, Taiwan .
64 Locomotion and Sensory Capabilities in Marine Fish
SPECIES MENTIONED IN THE TEXT
alewife, Alosa pseudoharengus Atlantic salmon, Salmo salar bastard halibut, Paralichthys olivaceus bigeye scad, Selar crumenophthalmus bigeye tuna, Thunnus obesus blue marlin, Makaira mazarra bluegill sunfi sh, Lepomis macrochirus bullet tuna, Auxis rochei carp, Cyprinus carpio channel catfi sh, Ictalurus punctatus cichlid fi sh, Astronotus ocellatus cod, Gadus morhua crimson sea bream, Evynnis japonica croaker, Micropogonius undulates dab, Limanda limanda dolphinfi sh, Coryphaena hippurus European eel, Anguilla anguilla fathead minnow, Pimephales promelas frigate tuna, Auxis thazard grey mullet, Mugil cephalus jacopever, Sebastes schlegeli
Japanese jack mackerel, Trachurus japonicus Jarbua tarpon, Terapon jarbua kawakawa, Euthynnus affi nis large scale mullet, Liza macrolepis masu salmon, Oncorhynchus masou milkfi sh, Chanos chanos oyster toadfi sh, Opsanus tau pistol shrimp, Alpheoidea spp. pollock, Pollachius pollachius red sea bream, Pagrus major Risso ’ s dolphin, Grampus griseus sailfi sh, Istioporus inducus scads, Decapterus spp. sharpnose tigerfi sh, Rhyncopelates oxyrhynchus skipjack tuna, Katsuwonus pelamis spotlined sardine, Sardinops melanostictus tadpole - fi sh, Raniceps raniceps threestripe tigerfi sh, Terapon jarbua walleye pollock, Theragra chalcogramma yellowfi n tuna, Thunnus albacares yellowtail, Seriola quinqueradiata