health, physical activity and medicine - repository stikes
TRANSCRIPT
PROCEEDINGS
ISPHE 2018
THE 4th INTERNATIONAL SEMINAR ON
PUBLIC HEALTH AND EDUCATION
“Wellbeing Promotion and Technologies: Health, Physical Activity
and Medicine”
The Wujil Resort and Conventions,
Semarang, May 8-9, 2018
FACULTY OF SPORTS SCIENCE
UNIVERSITAS NEGERI SEMARANG
iii
PROCEEDINGS OF ISPHE 2018 (THE 4th INTERNATIONAL SEMINAR ON PUBLIC HEALTH AND EDUCATION) “Wellbeing Promotion and Technologies: Health, Physical Activity and Medicine” The Wujil Resort and Conventions, Semarang, May 8-9, 2018
Committee : Rudatin Windraswara, M.Sc. dr. RR. Sri Ratna Rahayu, M.Kes., Ph.D. Lukman Fauzi, M.P.H. Anggit Wicaksono, M.Pd. Bertakalswa Hermawati, M.Si. Gustiana Mega Anggita, M.Or. Moch Fahmi Abdulaziz, M.Pd. Reviewer : Mohammad Arif Ali, S.Si., M.Sc. Arum Siwiendrayanti, S.K.M., M.Kes. Prof. Dr. dr. Oktia Woro Kasmini Handayani, M.Kes. dr. RR. Sri Ratna Rahayu, M.Kes., Ph.D. dr. Mahalul Azam, M.Kes. Dr. Heny Setyawati, M.Si. Donny Wira Yudha Kusuma, S.Pd., M.Pd., Ph.D. Dr. Siti Baitul Mukarromah, S.Si., M.Si.Med. Dr. drh R. Susanti, M.P. Dr. Tri Sri Noor Asih, S.Si., M.Si. Dr. Bambang Endroyo, S.E., M.Pd., M.T. Dr. Ning Setiati, M.Si. Dr. Edy Purwanto, M.Si. Editor : Rudatin Windraswara, M.Sc. Lukman Fauzi, M.P.H. Cover Design : Alma Saske Amidar Layout : Dhinda Trimadyaningsih Anggita Yuliani
ISBN : 978-602-61215-6-1
Publisher:
Faculty of Sports Science Universitas Negeri Semarang Dean Office of Faculty of Sports Science, UNNES Campus Gunungpati, Semarang 50229 Email : [email protected] Website : http://fik.unnes.ac.id Phone/Fax : +6224 8508007
iv
PREFACE
The 4th International Seminar on Public Health Education (ISPHE 2018) was held on
The Wujil Resorts and Conventions, Semarang, Indonesia on May 8-9 2018 by the Faculty of
Sports Science Universitas Negeri Semarang. The 328 scientific participants, 163 of whom
were students, had many fruitful discussions and exchanges that contributed to the success
of the conference. The 251 abstracts including poster session that were presented on the
first two days formed the heart of the conference and provided ample opportunity for
discussion. The abstracts were split almost equally between the four main conference areas,
i.e.; Interdisciplinary Health and Medicine, Physiology, Kinesiology and Psychology of
Wellness, Public Health Policies and Practices, and Health Promotion and Physical
Education.
Of the total number of presented abstracts, 16 of these are included in this
proceedings volume. Other publication options are 3 respectable scientific journals and one
national proceedings. The review procedure was thoroughly done by two blind reviewers
have reviewed each paper from the participant. There were 4 plenary lectures covering the
different areas of the conference: Prof. Chia-Hua Kuo. Ph.D. (Dean of Research and
Development University of Taipei, Taiwan) talked about the latest research on nutrition and
food metabolism, Dr. Toru Okuwaki (Japan Institute of Sports Sciences) for sports
development in Japan, Dr. Mahenderan Appukutty (Head of Postgraduate Studies UiTM,
Malaysia) for nutritional science of early childhood and last are Dr. Sugeng Eko Irianto (WHO
Representative of the Republic of Indonesia) and Prof. Dr. dr. Oktia Woro Kasmini
Handayani, M.Kes (Universitas Negeri Semarang, Indonesia) on health and nutrition status
in Indonesia.
Generous support for the conference was provided by the Indonesian Public Health
Association (IAKMI) and some prominent Indonesia universities in health education and sport
(Malang State University, Gorontalo State University, and Manado State University). The
next ISPHE will take place in Semarang in 2020, and the ones after that will be in Malang in
2022 and Gorontalo in 2024. Given the rapidity with which science is advancing in all of the
areas covered by ISPHE, we expect that these future ISPHE conferences will be as
stimulating as this most recent one was, as indicated by the contributions presented in this
proceedings volume.
Semarang, May 9, 2018
Chairperson,
Rudatin Windraswara, M.Sc
v
TABLE OF CONTENTS
PREFACE ............................................................................................................................ iv
TABLE OF CONTENTS ...................................................................................................... v
ORAL PRESENTATIONS
1. Physical and Performance Condition of Field Hockey Athlete in East Java
Heryanto Nur Muhammad, Hari Setijono, Nur Hasan ................................................ 1
2. Shooting Movement Analysis in Futsal
Rahmat Hidayah ........................................................................................................... 6
3. Physical Fitness Evaluation in Mental Retardation Students at Sigi Biromaru
Regency
Bulu Baan Addriana, Rahayu Tandiyo, KS. Soegiyanto, Sulaiman ............................ 10
4. The Effect of Kettlebell Training on Total Increase of Strength among Central
Java PPLOP Weightlifting Athletes in 2017
Hadi............................................................................................................................... 16
5. The Influence of Learning Model Play to Increase Vo2Max
Ruslan, Hasan, Palmizal. A ......................................................................................... 19
6. Educational Test and Measurement in Sport to Semarang City Community
through Activities FIK Goes to Public
Rivan Saghita Pratama, Soedjatmiko, Nasuka, Joko Hartono .................................... 23
7. Effective Method Effleurage Traction Reposition to the Improvement of ROM
(Range of Motion) in Knee Instructions
Arif Setiawan ................................................................................................................ 26
8. The Development of Jump Power Meter 2
Sri Haryono ................................................................................................................... 32
9. The Characteristics of The Patients Doing HIV Test in KTHIV Clinic at
Ambarawa Hospital
Anidaul Fajriyah, Niar Ardian ....................................................................................... 36
10. Adolescent Experience in Dealing With Kids Transition to Puberty in 33
Junior High School Semarang
Herlin Fitriyanti, Rose Nurhudhariani, Anita Indra Afriani ................................................. 40
11. Food Intake Relationship With Duration of Inpatient Care at Sinjai Regional
General Hospital
Satriani, Wawan Iskandar, Nurhasanah Azis .............................................................. 43
12. Environmental Factors on Spreading Filariasis Disease on Demak Coast
Rudatin Windraswara, Dyah Mahendrasari Sukendra, Ririn Wardhani ...................... 47
13. The Characteristics of the Patients Doing HIV Test in KTHIV Clinic at
Ambarawa Hospital
Anidaul Fajriyah, Niar Ardian ....................................................................................... 53
14. The Overview of LBW (Low Birth Weight) Risk Factors in Puskesmas
(Community Health Center) Sumowono of Semarang Regency in 2016
Asyumdah .................................................................................................................... 58
15. Knowledge Differences Class X before and after Giving Counselling About
Sexual Infection in Mandiri Balaraja High School 2015
Arifatul Hidayah, Tri Novitasari..................................................................................... 65
16. Characteristics of ARI in Terms of the Presence of Smoked Family and
Nutritional Status in Metro Kibang
Fitra Juwita, Shinta Amelia, Sofyan Akbar Budiman ................................................... 69

vi
17. Level of Preference, Economic Value and Nutrition on Spring Rolls the Katuk
Leaf
Bernadetha, Diah U’um Ulfiah, Ratih Wirapuspita ………………………………… ...... 72
18. Phenol Urine Level as a Biomarker Benzene Exposure of Gas Station
Workers in Semarang
Safirina Aulia Rahmi, Wahidah Rohmawati, Budiyono……………………………. ...... 80

1
Physical and Performance Condition of
Field Hockey Athlete in East Java
1st Heryanto Nur Muhammad
Universitas Negeri Surabaya Surabaya, Indonesia
2nd Hari Setijono
Universitas Negeri Surabaya Surabaya, Indonesia
[email protected] line
3rd Nur Hasan
Universitas Negeri Surabaya Surabaya, Indonesia
Abstract-The purpose of this study is to
analyze the results of hockey long term
development program for athlete in East Java.
The method used is the CIPP evaluation model
(context, input, process, and product). The
subjects were male athletes from 5 regional
members of the provincial hockey board in East
Java. The results showed that the physical
condition of the vital capacity (Vo2max) aspect
is in the poor category, the speed aspect is in the
average category, and the speed endurance
aspect is in the poor category. On the technical
side, it showed that on the aspect of dribble
speed is in average category, agility dribble
aspect is in average category, and for shoot
accuracy aspect is in poor category. The
conclusion of the research result is that the
coaching product achievement at the level of
physical condition is still lacking, and on the
basic technique of playing hockey is adequate.
The suggestion of the conclusion is that the
coach needs to improve their competence in
order to perform athlete recruitment, compile
and run an exercise program, as well as
promote and degrade. It also, the need to make
the try out program and competitions for
athletes.
Keyword- physical, performance, skills,
hockey
INTRODUCTION
The Long Term Athlete Development
Program (LTAD) is a gradual training model
ranging from sports literacy to compete for
winning [5]. Hockey is an invasive sport
played by two opposing teams of 11 players
using sticks and balls to score against goal
[12]. One indicator of achievement for
athletes is the level of physical condition and
good skills [2]. As a sport game, hockey
requires an excellent level of physical
condition [3]. Hockey as an intermittent sport
is performed with high-intensity physical
performance either when controlling the ball
or not [15]. These physical conditions include
strength, agility, and aerobic fitness [11],
particularly in endurance [18] as well as
technical skills [1].
The achievement of Hockey East Java
Province at the national level in the last 17
years (2000-2017) is not good. They have
never been ranked in the top three nationally.
Such facts require an analysis of the physical
condition and technical skills of the athlete.
Therefore, this study was conducted to
analyze the profile of physical condition and
skill of hockey athletes from area in East Java
Province.
The purpose of this study is to analyze the
results of long-term athlete development
program in East Java. Especially on the
aspects of physical condition and playing
skills of hockey athletes. With the analysis
results both are expected and the coach can
determine the correct program to improve the
achievement at the national level.
MATERIALS AND METHODS
In this study used qualitative methods to
explore the meaning of a fact that occurred
[8]. Subjects were male and female athletes
of 71 people from five cities with the top
three in the previous provincial championship
(Porprov). The five cities are Surabaya,
Sidoarjo, Tulungagung, Banyuwangi, and
Gresik. The data collected are athlete aerobic
capacity (VO2Max), speed endurance, and
speed for physical aspects [19]. Data on
hockey playing skills are speed dribbling,
dribbling agility, and shooting accuracy [13,
14]. The research instrument used is field test.
Data were analyzed using flow models from
Miles and Huberman.
2
RESULTS AND DISCUSSION
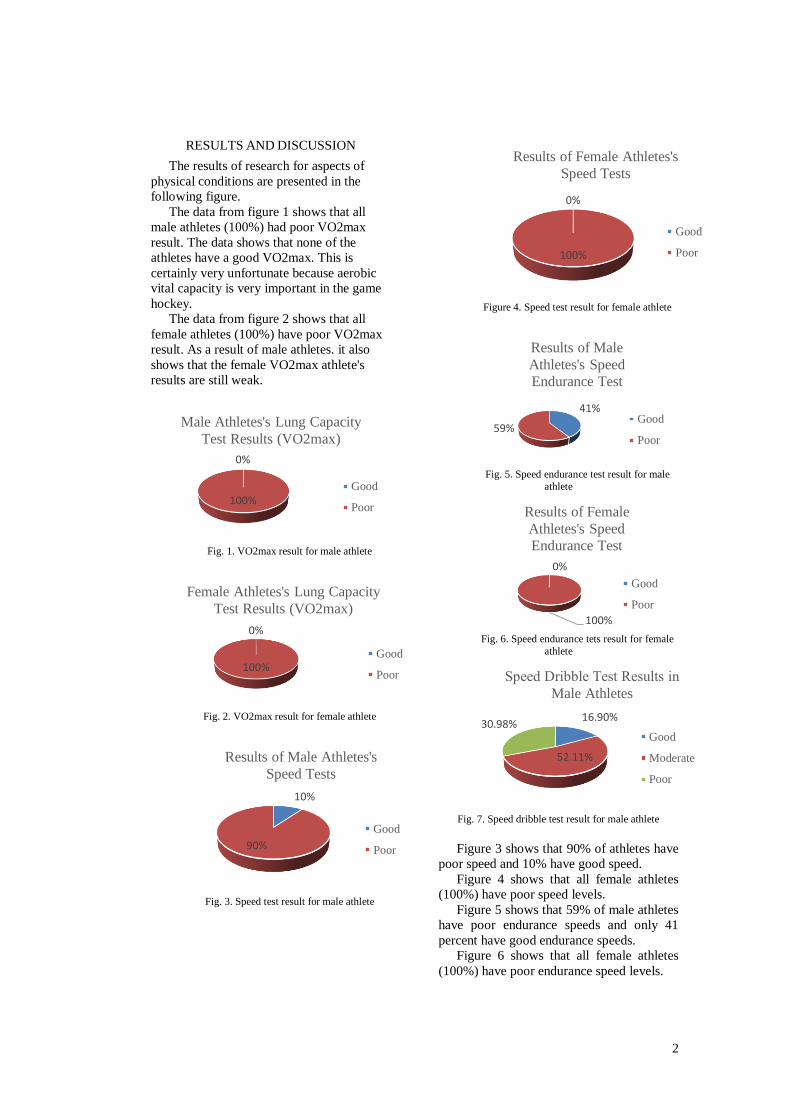
The results of research for aspects of
physical conditions are presented in the
following figure.
The data from figure 1 shows that all
male athletes (100%) had poor VO2max
result. The data shows that none of the
athletes have a good VO2max. This is
certainly very unfortunate because aerobic
vital capacity is very important in the game
hockey.
The data from figure 2 shows that all
female athletes (100%) have poor VO2max
result. As a result of male athletes. it also
shows that the female VO2max athlete's
results are still weak.
Fig. 1. VO2max result for male athlete
Fig. 2. VO2max result for female athlete
Fig. 3. Speed test result for male athlete
Figure 4. Speed test result for female athlete
Fig. 5. Speed endurance test result for male
athlete
Fig. 6. Speed endurance tets result for female
athlete
Fig. 7. Speed dribble test result for male athlete
Figure 3 shows that 90% of athletes have
poor speed and 10% have good speed.
Figure 4 shows that all female athletes
(100%) have poor speed levels.
Figure 5 shows that 59% of male athletes
have poor endurance speeds and only 41
percent have good endurance speeds.
Figure 6 shows that all female athletes
(100%) have poor endurance speed levels.
0%
100%
Male Athletes's Lung Capacity
Test Results (VO2max)
Good
Poor
0%
100%
Female Athletes's Lung Capacity
Test Results (VO2max)
Good
Poor
10%
90%
Results of Male Athletes's
Speed Tests
Good
Poor
0%
100%
Results of Female Athletes's
Speed Tests
Good
Poor
41%
59%
Results of Male
Athletes's Speed
Endurance Test
Good
Poor
0%
100%
Results of Female
Athletes's Speed
Endurance Test
Good
Poor
16.90%
52.11%
30.98%
Speed Dribble Test Results in
Male Athletes
Good
Moderate
Poor
3
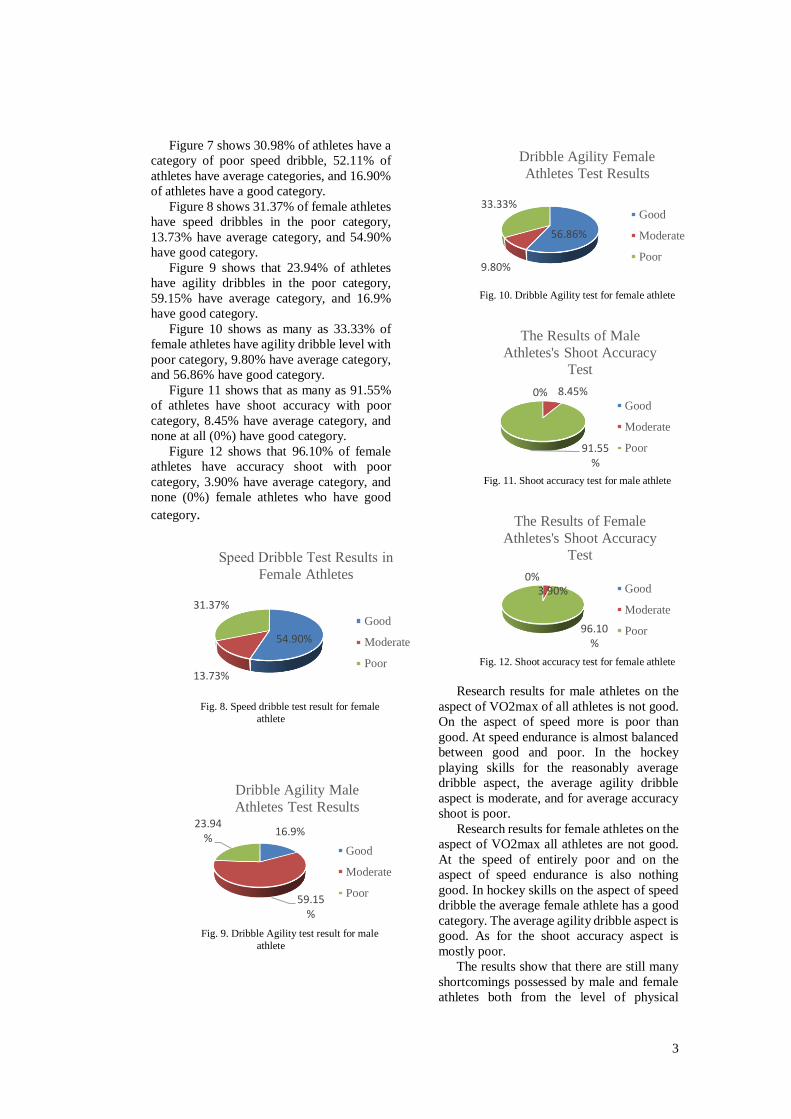
Figure 7 shows 30.98% of athletes have a
category of poor speed dribble, 52.11% of
athletes have average categories, and 16.90%
of athletes have a good category.
Figure 8 shows 31.37% of female athletes
have speed dribbles in the poor category,
13.73% have average category, and 54.90%
have good category.
Figure 9 shows that 23.94% of athletes
have agility dribbles in the poor category,
59.15% have average category, and 16.9%
have good category.
Figure 10 shows as many as 33.33% of
female athletes have agility dribble level with
poor category, 9.80% have average category,
and 56.86% have good category.
Figure 11 shows that as many as 91.55%
of athletes have shoot accuracy with poor
category, 8.45% have average category, and
none at all (0%) have good category.
Figure 12 shows that 96.10% of female
athletes have accuracy shoot with poor
category, 3.90% have average category, and
none (0%) female athletes who have good
category.
Fig. 8. Speed dribble test result for female
athlete
Fig. 9. Dribble Agility test result for male
athlete
Fig. 10. Dribble Agility test for female athlete
Fig. 11. Shoot accuracy test for male athlete
Fig. 12. Shoot accuracy test for female athlete
Research results for male athletes on the
aspect of VO2max of all athletes is not good.
On the aspect of speed more is poor than
good. At speed endurance is almost balanced
between good and poor. In the hockey
playing skills for the reasonably average
dribble aspect, the average agility dribble
aspect is moderate, and for average accuracy
shoot is poor.
Research results for female athletes on the
aspect of VO2max all athletes are not good.
At the speed of entirely poor and on the
aspect of speed endurance is also nothing
good. In hockey skills on the aspect of speed
dribble the average female athlete has a good
category. The average agility dribble aspect is
good. As for the shoot accuracy aspect is
mostly poor.
The results show that there are still many
shortcomings possessed by male and female
athletes both from the level of physical
54.90%
13.73%
31.37%
Speed Dribble Test Results in
Female Athletes
Good
Moderate
Poor
16.9%
59.15%
23.94%
Dribble Agility Male
Athletes Test Results
Good
Moderate
Poor
56.86%
9.80%
33.33%
Dribble Agility Female
Athletes Test Results
Good
Moderate
Poor
0% 8.45%
91.55%
The Results of Male
Athletes's Shoot Accuracy
Test
Good
Moderate
Poor
0%3.90%
96.10%
The Results of Female
Athletes's Shoot Accuracy
Test
Good
Moderate
Poor
4
condition and hockey playing skills in
athletes in East Java.
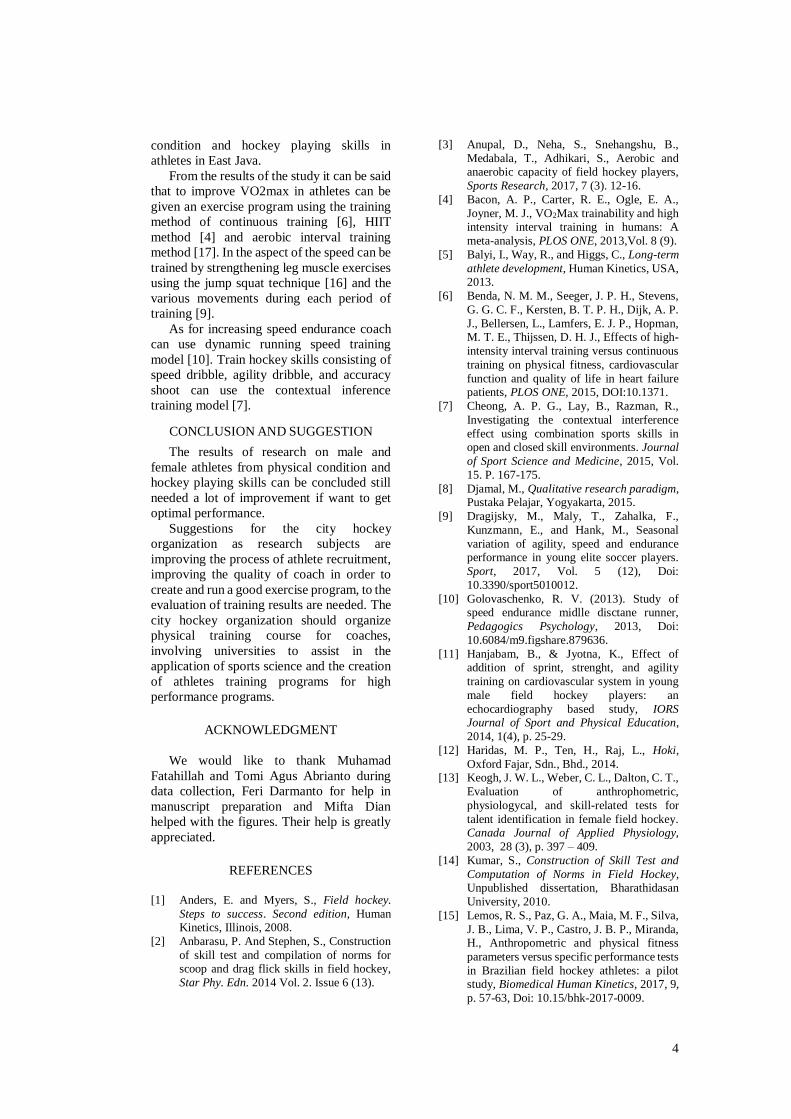
From the results of the study it can be said
that to improve VO2max in athletes can be
given an exercise program using the training
method of continuous training [6], HIIT
method [4] and aerobic interval training
method [17]. In the aspect of the speed can be
trained by strengthening leg muscle exercises
using the jump squat technique [16] and the
various movements during each period of
training [9].
As for increasing speed endurance coach
can use dynamic running speed training
model [10]. Train hockey skills consisting of
speed dribble, agility dribble, and accuracy
shoot can use the contextual inference
training model [7].
CONCLUSION AND SUGGESTION
The results of research on male and
female athletes from physical condition and
hockey playing skills can be concluded still
needed a lot of improvement if want to get
optimal performance.
Suggestions for the city hockey
organization as research subjects are
improving the process of athlete recruitment,
improving the quality of coach in order to
create and run a good exercise program, to the
evaluation of training results are needed. The
city hockey organization should organize
physical training course for coaches,
involving universities to assist in the
application of sports science and the creation
of athletes training programs for high
performance programs.
ACKNOWLEDGMENT
We would like to thank Muhamad
Fatahillah and Tomi Agus Abrianto during
data collection, Feri Darmanto for help in
manuscript preparation and Mifta Dian
helped with the figures. Their help is greatly
appreciated.
REFERENCES
[1] Anders, E. and Myers, S., Field hockey.
Steps to success. Second edition, Human Kinetics, Illinois, 2008.
[2] Anbarasu, P. And Stephen, S., Construction
of skill test and compilation of norms for
scoop and drag flick skills in field hockey,
Star Phy. Edn. 2014 Vol. 2. Issue 6 (13).
[3] Anupal, D., Neha, S., Snehangshu, B.,
Medabala, T., Adhikari, S., Aerobic and anaerobic capacity of field hockey players,
Sports Research, 2017, 7 (3). 12-16.
[4] Bacon, A. P., Carter, R. E., Ogle, E. A.,
Joyner, M. J., VO2Max trainability and high
intensity interval training in humans: A
meta-analysis, PLOS ONE, 2013,Vol. 8 (9).
[5] Balyi, I., Way, R., and Higgs, C., Long-term
athlete development, Human Kinetics, USA, 2013.
[6] Benda, N. M. M., Seeger, J. P. H., Stevens,
G. G. C. F., Kersten, B. T. P. H., Dijk, A. P.
J., Bellersen, L., Lamfers, E. J. P., Hopman, M. T. E., Thijssen, D. H. J., Effects of high-
intensity interval training versus continuous
training on physical fitness, cardiovascular
function and quality of life in heart failure patients, PLOS ONE, 2015, DOI:10.1371.
[7] Cheong, A. P. G., Lay, B., Razman, R.,
Investigating the contextual interference
effect using combination sports skills in open and closed skill environments. Journal
of Sport Science and Medicine, 2015, Vol.
15. P. 167-175.
[8] Djamal, M., Qualitative research paradigm, Pustaka Pelajar, Yogyakarta, 2015.
[9] Dragijsky, M., Maly, T., Zahalka, F.,
Kunzmann, E., and Hank, M., Seasonal
variation of agility, speed and endurance performance in young elite soccer players.
Sport, 2017, Vol. 5 (12), Doi:
10.3390/sport5010012.
[10] Golovaschenko, R. V. (2013). Study of speed endurance midlle disctane runner,
Pedagogics Psychology, 2013, Doi:
10.6084/m9.figshare.879636.
[11] Hanjabam, B., & Jyotna, K., Effect of
addition of sprint, strenght, and agility
training on cardiovascular system in young
male field hockey players: an
echocardiography based study, IORS Journal of Sport and Physical Education,
2014, 1(4), p. 25-29.
[12] Haridas, M. P., Ten, H., Raj, L., Hoki,
Oxford Fajar, Sdn., Bhd., 2014. [13] Keogh, J. W. L., Weber, C. L., Dalton, C. T.,
Evaluation of anthrophometric,
physiologycal, and skill-related tests for
talent identification in female field hockey. Canada Journal of Applied Physiology,
2003, 28 (3), p. 397 – 409.
[14] Kumar, S., Construction of Skill Test and
Computation of Norms in Field Hockey, Unpublished dissertation, Bharathidasan
University, 2010.
[15] Lemos, R. S., Paz, G. A., Maia, M. F., Silva,
J. B., Lima, V. P., Castro, J. B. P., Miranda, H., Anthropometric and physical fitness
parameters versus specific performance tests
in Brazilian field hockey athletes: a pilot study, Biomedical Human Kinetics, 2017, 9,
p. 57-63, Doi: 10.15/bhk-2017-0009.
5
[16] Loturco, I., Pereira, L. A., Kobal, R.,
Maldonado, T., Piazzi, A. F., Bottino, A., Kitamura, K., Abad, C. C. C., Arruda, M.,
Nakamura, F. Y., Improving sprint
performance in soccer: Effectiveness of
jump squat and olympic push press exercise,
PLOS ONE, 2016, Doi: 10.1371.
journal.pone. 0153958.
[17] Lunt, H., Draper, N., Marshall, H. C., Logan,
F. J., Hamlin, M. J., Shearman, J. P., Cotter, J. D., Kimber, N. E., Blackwell, G.,
Frampton, C. M. A., High intensity interval
training in a real world setting: A
randomized controlled feasibility study in
overweight inactive adults, measuring change in maximal oxygen uptake, PLOS
ONE, 2014, Vol. 9 (1).
[18] Strzelczyk, R., Konarsky, J., Karpowicz, K.,
Janowski, J., Changes in the main abilities of
field hockey players during the preparatory
period leading up to the main competition.
Gymnica, 2001, Vol. 31 (2).
[19] Tanner, R. K., Gore, C. J., Physiological tests for elite athlete. Second edition, Human
Kinetics, Australian Institute of Sport, 2012.
6
Shooting Movement Analysis in Futsal
1st Rahmat Hidayah
Universitas PGRI Semarang
Semarang, Indonesia
Abstract— Futsal is one of the sports that
become a trend among the public. One of the
basic techniques that players have to master
is shooting. Good shooting resulted from all
sequences of motion that work
synergistically in order to create a good kick
result (Anonymous, 2007). When player has
good shooting ability, he can score goals
easily. Therefore it is necessary to have an
analysis related to the movement when doing
shooting seen from the point of the segment
of the player's body. From this research, it is
hoped that it can give input and become
knowledge in doing shooting movement. The
purpose of this research is to know the angle
of body segment in shooting which includes
right knee flexion, left knee flexion, heeling
torso, left hand elbow, right hand elbow, and
ball velocity. This type of research is
qualitative, subjects in this study amounted
to 10 students. The data retrieval process is
done once with twice the opportunity by
using purposive sampling. The data of the
research were analyzed by using Dartfish
software program.
Keywords— analysis, futsal, movement,
shootin
Introduction
Futsal is the same as football but the difference
is in the size of the field and the number of
shoppers [7]. In playing futsal there are
some basic techniques that must be mastered by
players such as passing, dribbling, shooting and
heading [2]. One of the basic techniques that
become the main factor in playing futsal is
shooting. In the game or futsal game one way
to score goals is to do the shooting [3]. The
basic technique in playing futsal is very
important to be mastered, especially compared
to tactics and strategy. One of the basic
techniques to be trained is shooting [10]. Good
shooting results from all sequences of motion
that work synergistically in order to create a
good kick result. When a player has a good
shooting ability, he can score goals with ease.
Shooting can be done well if players perform
regular and programmed exercises but many
factors affect the quality of shooting performed
by someone. One of the factors that can affect
the quality of one's shooting is a series of
motion and body segments when shooting. The
angle of the body segments greatly affects the
outcome of the shooting. When the athlete is
right in doing the series of motion then the
shooting will be good, but when the player is
less or not right in doing the series of motion
then the shooting results were not good. When
someone is shooting then there are several
series of movements, this series of movements
give force and strength to the foot in order to do
shooting well. Every corner of the body can
have an effect on the athlete's success in
shooting. Than that required a research about
the series of motion in doing the shooting.
One cause of poor athletes in shooting is not
exactly the position of the body or the angle of
the body segment during the shooting then with
the issue required a motion analysis to
determine the sequence of movement
performed from everybody segments when
doing shooting . There are two things that
determine the quality of one's shooting is the
accuracy and speed of the ball. But both things
can be done well when a person has a good
series, such as bending the legs, bending hands,
7
body tendencies, sloping body and shooting
steps. From the above explanation, the
researcher wanted to do a research about the
angle of body segment of athlete when doing
shooting. The results of this study are expected
to provide recommendations on how to do
shooting seen from the corner of the body
segment.
materials and method
Type research this is research qualitative,
revealed that a qualitative approach is a
research approach that seeks to describe and
understand a phenomenon in depth with
research as the main instrument. The qualitative
approach focuses on the general principles or
patterns that underlie the manifestations of the
units of symptoms present in human life [11].
Plot in research this that is ten UPGRIS
students shooting futsal three times, then the
results of the three trials will be analyzed. In the
shooting of students documented in the form of
video, then the video is included in the software
dartfish for analysis. Then taken clips-clip
pieces of images to be taken the results and then
analyzed in accordance with the needs of
researchers. Subject selection research using
purposive sampling. Purposive sampling is
technique taking sample data source with
consideration certain [12]. Subjects in this
study were ten students who have followed
futsal training UPGRIS. Instruments and tools
used in this research are, (a) Stationary Used to
record the results of any shooting. (b) Meter
used to measure tripod distance from the point
of shooting. (c) Kun used to be a benchmark
tripod position. (d) Lakban used to perform
calibration. (e) Canon EOS 1100D and EOS
600D cameras are used to record movement
during shooting . (f) Tripod used to put the
camera so that the camera does not move, so the
recording obtained will be better. (g)Laptop
used after recording in can, to insert video and
as a tool to perform analysis. (h) Dartfish is a
software that can know the angle, distance and
speed of the athlete in doing a move.
Implementation and data collection to be
conducted by researchers in accordance with
the formulation of the problem. From the
results of the study were taken in accordance
with the problem namely, (a) Corner bend foot
pedestal before shooting. (b) The angle of the
foot at the time to swing backward. (c) The
angle of the foot at the time of the ball. (d) The
angle of the body. (e) Right arm bending corner
(f) Left arm bending angle. Some of the
procedures for conducting research are as
follows, (a) Students warm up before shooting.
(b) Preparing the video recorder is camera. (c)
Placing the video recorder in a designated
place. Stages in the implementation of research,
(a) Researchers give direction to athlete for
shooting maximally. (b) Research subjects
certainly understand the direction of the
researcher. (c) Research subjects warmed up.
(d) The subjects tested once. (e) The research
subject occupies the prefix position to wait for
the signal. (f) When the camera commands are
ready, the subject is allowed to jump. (g) The
subjects were given three times the cases
empatan to do the shooting. (h) The recorder
starts from the start until the end of the
movement. (i) Recorded video then saved and
imported to laptop
results and discussion
Based on the results of research conducted to
determine the angle of the body at the time of
shooting in the sport futsal average of the
sample do bend the left foot is 143.2 0 , bending
the left foot is taken when the sample put his
left foot beside the ball as the foot pedestal, this
is done to find out what is the degree of angle
of the foot that becomes the pedestal at the time
will do the shooting , whether there is a
significant relationship to the ball speed results
when shooting . Bend the right foot averaging
93.1 0 , this angle is taken when the right foot
preparing before the shooting , the goal is to
take this angle to see how many degrees of
bending is done so that affect the result kicks.
The average body bent 83.9 0 , to get a good
kick, there needs to be coordination between
the entire set of moves when shooting , many
top european players like Lionel Messi,
Cristiano Ronaldo and other star players when
doing the shooting must do the body tendency
towards the opposite from the foot that became
a force for shooting, for example Lionel Messi
who uses the left foot when doing shooting then
8
the body of Lionel Messi will be leaning or
tilting towards the right of his body this can
give effect to the kick results, it is necessary to
know how the angle of the player's body when
doing shooting . From the research conducted
there is data after analysis using dartfish. This
data can be a reference in doing the shooting
and the athletes can understand the proper set of
movements in the shooting. The result of
statistical test of correlation indicates that there
is a significant relationship between the speed
of the ball data with the speed of the knee angle
and forcing. The results also showed a large
influence of the angular velocity of the knee
ball influence 62 percent and force (force) by
68 percent and the rest is influenced by other
factors (Ikhwan, 2014). Each player has a
different body posture but we can do the right
movement analysis in doing the shooting, here
are the data obtained from the research:
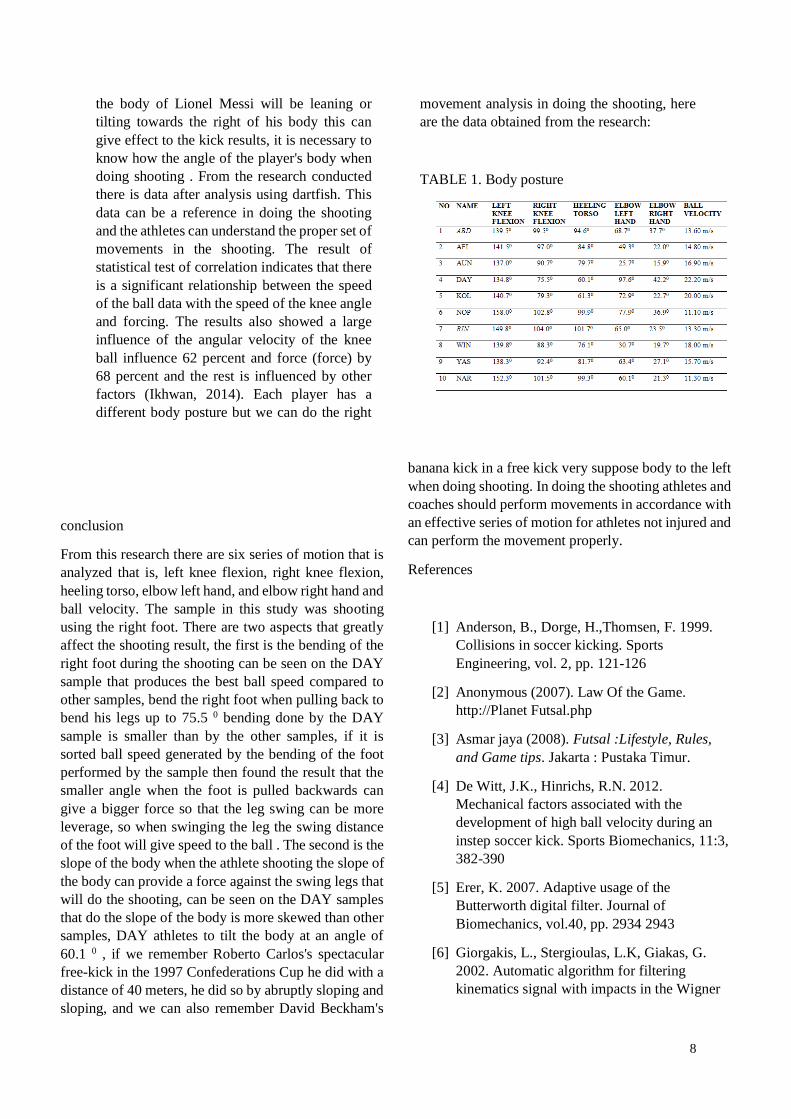
TABLE 1. Body posture
conclusion
From this research there are six series of motion that is
analyzed that is, left knee flexion, right knee flexion,
heeling torso, elbow left hand, and elbow right hand and
ball velocity. The sample in this study was shooting
using the right foot. There are two aspects that greatly
affect the shooting result, the first is the bending of the
right foot during the shooting can be seen on the DAY
sample that produces the best ball speed compared to
other samples, bend the right foot when pulling back to
bend his legs up to 75.5 0 bending done by the DAY
sample is smaller than by the other samples, if it is
sorted ball speed generated by the bending of the foot
performed by the sample then found the result that the
smaller angle when the foot is pulled backwards can
give a bigger force so that the leg swing can be more
leverage, so when swinging the leg the swing distance
of the foot will give speed to the ball . The second is the
slope of the body when the athlete shooting the slope of
the body can provide a force against the swing legs that
will do the shooting, can be seen on the DAY samples
that do the slope of the body is more skewed than other
samples, DAY athletes to tilt the body at an angle of
60.1 0 , if we remember Roberto Carlos's spectacular
free-kick in the 1997 Confederations Cup he did with a
distance of 40 meters, he did so by abruptly sloping and
sloping, and we can also remember David Beckham's
banana kick in a free kick very suppose body to the left
when doing shooting. In doing the shooting athletes and
coaches should perform movements in accordance with
an effective series of motion for athletes not injured and
can perform the movement properly.
References
[1] Anderson, B., Dorge, H.,Thomsen, F. 1999.
Collisions in soccer kicking. Sports
Engineering, vol. 2, pp. 121-126
[2] Anonymous (2007). Law Of the Game.
http://Planet Futsal.php
[3] Asmar jaya (2008). Futsal :Lifestyle, Rules,
and Game tips. Jakarta : Pustaka Timur.
[4] De Witt, J.K., Hinrichs, R.N. 2012.
Mechanical factors associated with the
development of high ball velocity during an
instep soccer kick. Sports Biomechanics, 11:3,
382-390
[5] Erer, K. 2007. Adaptive usage of the
Butterworth digital filter. Journal of
Biomechanics, vol.40, pp. 2934 2943
[6] Giorgakis, L., Stergioulas, L.K, Giakas, G.
2002. Automatic algorithm for filtering
kinematics signal with impacts in the Wigner
9
representation. Med. Biol. Eng. Comput., vol.
40, pp. 625–633
[7] Hatta Roeslan.(2003)./ Futsal rules
/Surabaya:pengurus daerah PSSI Jawa
Timur.
[8] Ismail, S., Sulaiman, N., Adnan, R. 2013.
Comparison of single and variable cut-off
frequency for the Butterworth filter utilized in
data smoothing for slow foot velocity during
instep soccer kick. Proceedings of the IEEE
Symposium on Humanities, Science and
Engineering (SHUSER), pp. 626-629, Penang
[9] Lees, A., Nolan, L. 1998. The biomechanics of
soccer: A review. Journal of Sports Science,
16:3, pp. 211–234
[10] Murhananto.(2007).Basic
Futsal.Jakarta: Kawan Pustaka.
[11] Purwanto. 2011. Method research for
administration public.
[12] Sugiyono. 2007. Method research
R&D. Bandung: Alfabeta
10
Physical Fitness Evaluation in Mental
Retardation Students at Sigi Biromaru
Regency
1st Bulu Baan
Addriana Postgraduate,
Semarang
state University
Semarang, Indonesia Addriana.palu@gmail
.com
2nd Rahayu Tandiyo
Postgraduate, Semarang state University
Semarang, Indonesia
s.ac.id
3rd KS. Soegiyanto
Postgraduate, Semarang state University
Semarang, Indonesia
s.ac.id
3rd Sulaiman
Postgraduate, Semarang
state University
Semarang, Indonesia
Abstract—Research is to find out the level of physical fitness students in mental retardation at Sigi Biromaru regency. The descriptive research method is used in this research with the indonesian test of physical fitness (TKJI: Tes Kebugaran Jasmani Indonesia). The researcher took the whole of Students in mental retardation at Sigi Biromaru regency. The purposive sampling is the technique of this research and the number of samples amounted to 16 students. The result of this research by using a descriptive percentage calculation which description in the level of physical fitness as follows: in very good category is 0%, also in good category 0%, then average category are 43.75%, 50% in less category, and very less category is about 6.25%. In conclusion physical fitness of mental retardation learners showed that physical fitness of mental retardation learners in Sigi Biromaru regency is on the less category.
Keywords— evaluation, physical
fitness, mental retardation students.
I. INTRODUCTION
Mental retardation students expected special needs. Adaptive learning in physical education is specially designed according to the characteristics of disability and needs of the learners. Adaptive Physical education activities is improve the basic motion skills of learners at mental retardation school [2]. The aim of physical education is to develop the physical aspects of health, fitness, critical thinking skills, social skills, emotional stability, reasoning and moral action through
physical activity and sports activities. Physical education adaptive encourage the growth of physical, psychic development, motor skills, as well as to stimulate the brain to increase mental retardation children's knowledge and his thought.
Adaptive physical education has adapted to the conditions of the students in need of special so that it can apply to learners in mental retardation, mental retardation because the child has the same rights with learners other normal in acquiring an education and learning every level of education. Granting a motion learning opportunities against mental retardation through Adaptive physical education from an early age to keep and develop the physical condition and the environment is very important, because it will be useful for the development of the normal skills once an adult, as well as for mental development.
Mental retardation children experiencing cognitive function disorders caused due to IQ level of the child's mental retardation is very low. Low IQ can cause slow stimuli and acceptance. The delay in receiving the stimulus will take a long time to do a reaction or response to new situations, limitations in the mastery of the subject less able to consider social development influence something will activities included in the motiNon. Research conducted by Somantri [20] which showed that the level of physical fitness that had a huge mental
11
retardation children's mental abilities at the age of 2 years to 12 years less in the category was once a normal child while on the category less. Advanced in research conducted by Westendrop, M, et al. [26]. That children have mild mental retardation score significantly lower on almost all items of a specific motor skills, and also skills against the control object when compared with peers of non mental retardation.
Low levels of physical fitness and mental retardation children will have an impact on his health so vulnerable to diseases. To find out the level of success of an education can be known through the evaluation, as it was said Beltasar Tarigan (2000:67) "how far the goal was reached or until where the learning progress learners can be expressed and presented through measurement and evaluation ". Sterdt et.al. , (2014) "results showed that physical fitness is a complex behavior and multi-dimensional is determined by many factors biological, psychological, socio-cultural and the environment.
A. Mental Retardation Children
The term mental retardation is often also referred to as mental retardation or mental inhibitions (mentally handicap). Yudi Child mental retardation globally is the child who has the intelligence of below average that occur when the period of growth and has Adaptive assessment of the barriers. According to Adam Pramono and Qari'ah Hamid [17] is a State of mental retardation lapses grew deladis pyrotechnics, while the growing swell of events itself is the most important process and essential on the child.
The American Association On Mental Deliciency (AAMD) in Mumpuniarti [15] says that the classification of mental retardation mental retardation is lightweight with 50-70 range IQ, mental retardation is being with an IQ ranging from 30 – 50 and heavy and very heavy mental retardationis IQ range < 30. Furthermore.
The ability of each child's own mental retardation varies, so there is a classification of mental retardation children's ability to distinguish itself. Based on the low level of high intelligence as measured by using a Wechsler Intelligence scale for Children
(WISC) and the Stanford Binet test in Smart, Aqila [19] mental retardation can be classified into four categories:
1) The lightweight Category
On the category of lightweight, has an IQ of 50-55 to 70. Based on Binet test his IQ ability shows the number 68-52, while with the WISC test his IQ ability of 69-55. Typically, these children have difficulty in learning. He more often live than move to the next class.
2) The medium Category
Usually has an IQ of 35-40 up to 50-55. According to Binet IQ test result is about 51-36, while 54-40 in WISC test. Often found in people with brain damage and other illnesses. There is a possibility of sufferers also experience nerve dysfunction that plagued the motor skill. In this type, sufferers can be detected at birth because at the time of its sufferers experience a delay in verbal and social skills.
3) The weight Category
This category has an IQ of 20-25 to 35-45. According to Binet IQ test the result is 32-20, while according to WISC test the IQ is 39-25. Sufferers have a physical abnormality and control remote motor is limited.
4) The very weight Category
In this category of sufferers have a very low IQ. According to the results of the IQ scale sufferers under 19, while according to WISC test the IQ below 24. Many sufferers who have physical disabilities and nerve damage.
The characteristics or traits of the child's mental retardation can be viewed in terms of:
a. Physically
The characteristics of the child's mental retardation in physically: 1) Almost the same as a normal child, 2) motor slow Maturity, 3) Coordination less motion, 4) mental retardation children's weight can be seen.
b. Intellectual
According to Somantri [21] that intelligence is a complex function that can be defined as the ability to learn the information and skills conform issues-a new life situation, learning from past experiences, abstract thinking,
12
creative, critically assess, avoid mistakes, overcome difficulties, and and the ability to plan for the future. Intellectual Level is 1) Difficult to learn the academic stuff, mild mental retardation Children 2), most of their learning abilities up to the height of the normal child 12 years of age with an IQ between 50 – 70, 3) mental retardation children's ability of learning are the highest level of normal children aged 7, 8 years IQ between 30 – 50, 4) Children of their learning ability weight up to the normal child age 3-4 years, with an IQ of 30 down. Seen from the intellectual level of mental retardation makes children cannot be studied in accordance with the normal learning and in terms of abstract thinking.
c. Social and Emotional
Social characteristics and emotions, namely: 1) hang out with younger children, 2) reclusive, 3) easily influenced, 4) Less dynamic, 5) Less consideration) 6) lack of concentration, 7) easily influenced, 8) can't lead himself as well as others.
B. Physical Fitness
Physical fitness is the ability of a person to complete a physical tasks without experiencing fatigue which means as well as having the ability to do other work. Tarigan [24] "Physical Fitness is the ability to perform daily activities with passion and full consciousness, which is done without experiencing fatigue which means, as well as avoid the disease less motion so that can enjoy life with a good and unpretentious ".
Physical fitness is a person who has a functional capabilities in job over and over again without causing fatigue means, they must be aware of the requirement to have physical fitness. Physical fitness criteria which have structural and functional nature such as: 1) Anatomical Fitness, 2) Physiological fitness.
II. MATERIAL AND METHODS
Based on the problems above this research can be classified in a descriptive research, because the process are systematic, factual, and accurate about the facts and the nature of the population or
specific areas with qualitative approach. The population in this research is the entire mental retardation learners in Sigi Biromaru regency. Samples taken in purposive sampling. The number of samples in the study is 16 learners mental retardation consists of 10 boys and 6 girls. The technique of data collection in this research is the use of physical fitness test (Tes Kebugaran Jasmani Indonesia). These kinds of tests, 40-meter Run, pull-up for 30 seconds, sit-up for 30 seconds, Vertical Jump, 600-meter run. Processing of data analysis in this study using a percentage test.
𝑃 =𝑓
𝑛𝑥100 %
P = precentage score
F = the frequency that is being sought after percentage
N = the number of individuals (Anas Sudijono, 2012:43)
III. RESULTS AND DISCUSSIONS
In the Rachiwong [18] study there was no change in stress level but changes in flexibility, strength of handling and vital capacity, in the Hatha Yoga Group (HYG) group after yoga treatment
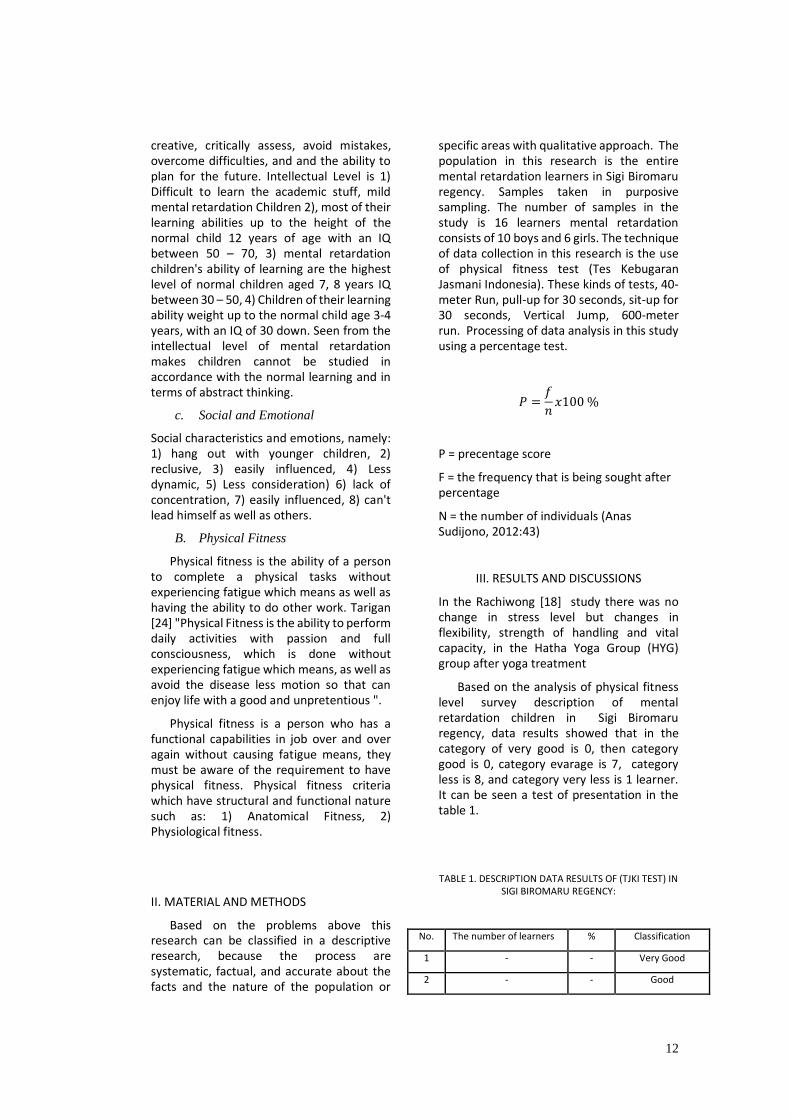
Based on the analysis of physical fitness level survey description of mental retardation children in Sigi Biromaru regency, data results showed that in the category of very good is 0, then category good is 0, category evarage is 7, category less is 8, and category very less is 1 learner. It can be seen a test of presentation in the table 1.
TABLE 1. DESCRIPTION DATA RESULTS OF (TJKI TEST) IN SIGI BIROMARU REGENCY:
No. The number of learners % Classification
1 - - Very Good
2 - - Good
13
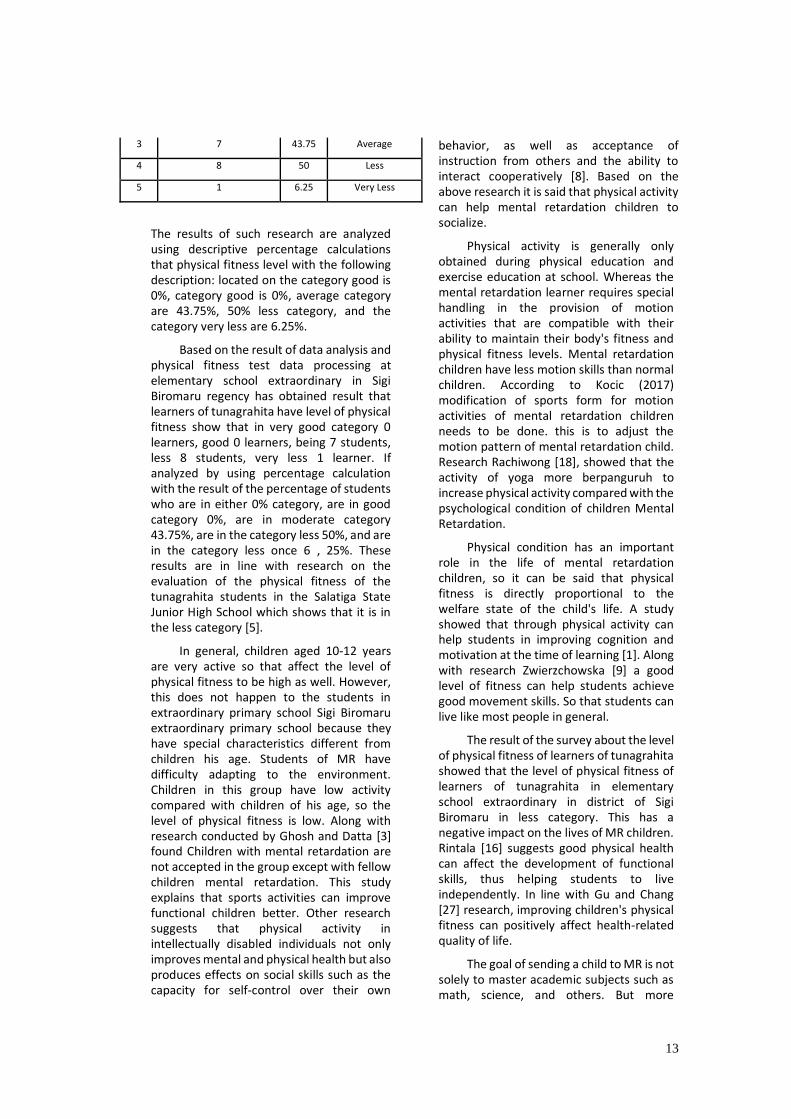
3 7 43.75 Average
4 8 50 Less
5 1 6.25 Very Less
The results of such research are analyzed using descriptive percentage calculations that physical fitness level with the following description: located on the category good is 0%, category good is 0%, average category are 43.75%, 50% less category, and the category very less are 6.25%.
Based on the result of data analysis and physical fitness test data processing at elementary school extraordinary in Sigi Biromaru regency has obtained result that learners of tunagrahita have level of physical fitness show that in very good category 0 learners, good 0 learners, being 7 students, less 8 students, very less 1 learner. If analyzed by using percentage calculation with the result of the percentage of students who are in either 0% category, are in good category 0%, are in moderate category 43.75%, are in the category less 50%, and are in the category less once 6 , 25%. These results are in line with research on the evaluation of the physical fitness of the tunagrahita students in the Salatiga State Junior High School which shows that it is in the less category [5].
In general, children aged 10-12 years are very active so that affect the level of physical fitness to be high as well. However, this does not happen to the students in extraordinary primary school Sigi Biromaru extraordinary primary school because they have special characteristics different from children his age. Students of MR have difficulty adapting to the environment. Children in this group have low activity compared with children of his age, so the level of physical fitness is low. Along with research conducted by Ghosh and Datta [3] found Children with mental retardation are not accepted in the group except with fellow children mental retardation. This study explains that sports activities can improve functional children better. Other research suggests that physical activity in intellectually disabled individuals not only improves mental and physical health but also produces effects on social skills such as the capacity for self-control over their own
behavior, as well as acceptance of instruction from others and the ability to interact cooperatively [8]. Based on the above research it is said that physical activity can help mental retardation children to socialize.
Physical activity is generally only obtained during physical education and exercise education at school. Whereas the mental retardation learner requires special handling in the provision of motion activities that are compatible with their ability to maintain their body's fitness and physical fitness levels. Mental retardation children have less motion skills than normal children. According to Kocic (2017) modification of sports form for motion activities of mental retardation children needs to be done. this is to adjust the motion pattern of mental retardation child. Research Rachiwong [18], showed that the activity of yoga more berpanguruh to increase physical activity compared with the psychological condition of children Mental Retardation.
Physical condition has an important role in the life of mental retardation children, so it can be said that physical fitness is directly proportional to the welfare state of the child's life. A study showed that through physical activity can help students in improving cognition and motivation at the time of learning [1]. Along with research Zwierzchowska [9] a good level of fitness can help students achieve good movement skills. So that students can live like most people in general.
The result of the survey about the level of physical fitness of learners of tunagrahita showed that the level of physical fitness of learners of tunagrahita in elementary school extraordinary in district of Sigi Biromaru in less category. This has a negative impact on the lives of MR children. Rintala [16] suggests good physical health can affect the development of functional skills, thus helping students to live independently. In line with Gu and Chang [27] research, improving children's physical fitness can positively affect health-related quality of life.
The goal of sending a child to MR is not solely to master academic subjects such as math, science, and others. But more
14
emphasis on the ability of children to face daily life. One alternative option to help the child's MR through motion activity. Motion activity in MR children brings many advantages. Research shows that physical fitness in adults with ID helps to perform daily tasks and helps individuals in socializing [12].
Physical fitness levels not only help mental retardation children to live independently, but also help the child's cognitive development. Findings from Martınez-Vizcaıno [25], There is a positive relationship between fitness and cognition. The better the level of fitness then the performance of cognition will be better. supported by other studies that stated that fitness level affects the students' learning achievement [13].
Children who have a good physical fitness to avoid insomnia fatigue, increase metabolism, intelligence, and health so it is necessary to prioritize the improvement of physical fitness is an outstanding primary school students so that they can follow the lesson properly, [24]. P De Miguel-Etayo, et al (2014) describes the relationship of physical fitness with a person's ability to perform physical activities that require aerobic capacity, long-term durability, strength or flexibility, which appear to be associated with heredity and the environmentAnother advantage of physical activity in mental retardtion children is as a means of socializing to the environment. The reality is in the field, mental retardation children get rejection from the environment. Children with special needs require intervention in developing social relationships. For that reason, the role of teachers is very important in facilitating children in improving their social [14]. Research Tucker et.al, (2018) the development of societal capacity through physical health education should involve the role of principals and teachers.
Adaptive physical education teachers have an important role in increasing the basic motion and health of children mental retardation through physical activity learners with modifyng games that are easy to do and gives rise to a sense of pleased at students to do increas physical Fitness, [22]. In this study, Adaptive physical education teachers
are expected to design a learning models in accordance with the growth and development of mental retardation children in extraordinary primary school, [11].
In addition to a good level of fitness, other things that have a role in improving the quality of life of children with special needs are Patterns of upbringing. Riyahi et.al, [4] states that the role of mothers with rigorous education helps change in children compared to the pattern of foster father.
IV. CONCLUSION
The low fitness of learners tunagrahita in Sigi Biromaru district due to low physical activity resulting in low socialization capabilities and not optimal cognitive development.
ACKNOWLEDGEMENT
All the praises be to God. The first and foremost, Addriana Bulu Baan, Rahayu Tandiyo, KS. Soegiyanto, Sulaiman wish to take the opportunity to express our greatest gratitude to God the Almighty for His blessing, grace, and strength leading to the completion of this article. This research was supported in part by a grant from the Department of Education and Culture, Mental Retardation School at sigi biromaru Regency and Semarang State University.
REFERENCES
[1] Amal Dandashi, Abdel Ghani Karkar, Sawsan
Saad, Zaara Barhoumi, Jihad Al-Jaam, and
Abdulmotaleb El Saddik, “Enhancing the
Cognitive and Learning Skills of Children with
Intellectual Disability through Physical Activity
and Edutainment Games” Multimedia
Communications Research Laboratory,
University of Ottawa, Ottawa, ON, Canada K1N
5N6 Correspondence should be addressed to Jihad
Al-Jaam; [email protected] Received 3 November
2014; Accepted 26 December 2014.
[2] National Education Standards Body. (2006). the
material Dissemination of ICT, Competency
Standards 2006 KTSP Korikulum and competence
of the basic Subjects of physical education.
Jakarta: BSNP.
[3] Dipanwita Ghosh and Tarit K Datta, “Functional
improvement and social participation through
sports activity for children with mental
retardation: a field study from a developing
nation,” Prosthetics and Orthotics International
36(3) 339–347 2012.
[4] Disabilities Azade Riyahi, Samira Yazdani
Ghadikolaee, Malihe Kolagar, Azade Azami
Sarukolaii, Hosseinali Abdolrazaghi, Fatemeh
15
Rafiei, Abolfazl Mohammadbeigi, “Comparing
the Parenting Role Tasks in Parents of Children
with Mental/Physical,” Original Article (Pages:
5079-5089) Int J Pediatr, Vol.5, N.6, Serial No.42,
Jun. 2017
[5] Gansar DWI Cahyo w., S.W., and Agus p.,
"Physical fitness level Survey On Students mental
retardation Junior Wonderful land of Salatiga
city". Journal of Physical Education, Sport, Health
and Recreation 1 (2), 2012
[6] Jooyeon Jin, Ph.D. , Joonkoo Yun, Ph.D., Stamatis
Agiovlasitis, Ph.D. “Impact of enjoyment on
physical activity and health among children with
disabilities in schools” Disability and Health
Journal 11 (2018) 14-19, 2018.
[7] Henry Joe Tucker1, Samuel Joseph Bebeley2,
Sam Augustine Laggao, ” Children and
Adolescents' Fitness Skill Level in Physical
Activity: A Motivational Concern for Public
Health Education,”International Journal of
Science and Research (IJSR) ISSN (Online):
2319-7064 Index Copernicus Value (2015): 78.96
| Impact Factor (2015): 6.391 Volume 6 Issue 11,
November 2017
[8] Kimiyasu Hayakawa & Kando Kobayashi ” Effect
of a 5-year cognitive motor training program on
intellectually disabled youth. Innovative
Teaching,” 2, 4. 2013, Volume 2, Article 4 ISSN
2165-2236 Received May 08, 2012 Accepted
December 24, 2012 Published May 2, 2013 DOI
10.2466/02.IT.2.4 © Kimiyasu Hayakawa 2013
[9] Krystyna Gawlik,Anna Zwierzchowska, Beata
Manowska, Diana Celebańska, “Aerobic
capacity of adults with intellectual disabilities,”
Annals of Agricultural and Environmental
Medicine 2017, Vol 24, No 1, Ann Agric Environ
Med 2017;24(1):117–120, 2017
[10] M. van Schijndel-Speet,1,4 H.M. Evenhuis,1 R.
van Wijck,2 K. C. A. G. M. van Montfort3 & M.
A. Echteld “A structured physical activity and
fitness programme for older adults with
intellectual disabilities: results of a cluster-
randomised clinical trial,” volume 61, Issue1,
January 2017 https://doi.org/10.1111/jir.12267,
2017
[11] Mansur, Soegianto K.S., “The Role of Physical
Fitness to Improve The Self-Quality of
Elementary School Students in The District of
Aceh Besar,” The Journal of Educational
Development 5 (1) (2017) 72 - 84
http://journal.unnes.ac.id/sju/index.php/jed, 2017
[12] Mehmet Yanardag, Hulya Arikan, Ilker Yilmaz
and Ferman Konukman. Kinesiology “Physical
Fitness levels of Young Adults With and Without
Intelektual Disability” Kinesiology 45 (2013)
2:233-240, 2013.
[13] Memory Olga G. Berwid, Sarah C. O’Neill,
Nacima Chen, “Anxiety Level Moderates the
Acute Impact of Light and Moderate Intensity
Aerobic Exercise on Working,”. Basic Science
World Congress/Poster - Stress and Behavior
Friday, June 2, 2017.
[14] Milene Ferreira, Cecília Aguiar, Nadine Correia,
Margarida Fialho, and Júlia Serpa Pimentel.
“Social Experiences of Children With Disabilities
in Inclusive Portuguese Preschool Settings,”
Journal of Early Intervention 2017, Vol. 39(1) 33–
50 © 2016 SAGE Publications, 2017.
[15] Mumpuniarti, “Learning Approach For Child
Mental Barriers”. Yogyakarta: Universitas Negeri
Yogyakarta. 2007
[16] Pauli Rintala , Piritta Asunta , Jukka Lahti , and
Edwin, “Physical fitness of individuals with
intellectual disability who have Special Olympics
experience,” European Journal of Adapted
Physical Activity, 9(2), 13–19 European
Federation of Adapted Physical Activity, 2016.
[17] Adam Pranowo and Qari’ah Hamid, “Techniques
to boost the ability of children with intelligence
under the average”, Yogyakarta. Familia, 2012.
[18] S. Rachiwong • P. Panasiriwong • J. Saosomphop
• W. Widjaja • A. Ajjimaporn ‘Effects of Modified
Hatha Yoga in Industrial Rehabilitation on
Physical Fitness and Stress of Injured Workers,”
Journal of Occupational Rehabilitation
September 2015, Volume 25, Issue 3, pp 669–
674| Cite as 2015
[19] Smart., Aqila, “Disabled children not of
judgement: learning methods & therapies for
children in need special”, Yogyakarta: Katahati,
2012.
[20] Somantri, “Child psychology beyond bias”,
Bandung: Refika Aditama, 2007.
[21] Somantri Sutjihati T., “The Psychology Of
Exceptional Children”. Bandung : Pt Refika
Aditama, 2012..
[22] Sumaryanti,Tandiyo Rahayu,Hari Amirullah,
Setya Rahayu, Dwi Rukmini, “Improving Basic
Movements And Health Of Mentally Disabled, Th
e Journal of Educational Development 1 (1 (2013)
http://journal.unnes.ac.id/sju/index.php/jed, 2013.
[23] Taringan Beltasa, “The Adaptive physical
education.” Departemen Pendidikan Nasioanal :
Jakarta, 2000.
[24] Tarigan Beltasa, “The Importance of Physical
Fitnes,”. Departemen Pendidikan Nasioanal :
Jakarta, 2009.
[25] Vicente Martınez-Vizcaıno, PhD, MD, Marıa
Jesus Pardo-Guijarro, PhD,Jorge, Natalia Marıa
Arias-Palencia, and Mairena Sanchez-Lopez,
PhD. “Physical Fitness, Obesity, and Academic
Achievement in Schoolchildren Coral,” THE
JOURNAL OF PEDIATRICS. 0022-3476/$ - see
front matter. Copyright ª 2014 Elsevier Inc. All
rights reserved, 2014
[26] Westendrop, Marieke, Hartman E. Visseber C.
Are Gross Motor Skill And Sport participation
Related In Children With Intellectual Disabilities.
Volume 32, 2012.
[27] Xiangli Gu and Mei Chang, Melinda A. Solmon
Louisiana “Physical Activity, Physical Fitness,
and Health-Related Quality of Life in School-
Aged Children,” Journal of Teaching in Physical
Education, 2016, 35, 117 -126
http://dx.doi.org/10.1123/jtpe.2015-0110 © 2016
Human Kinetics, Inc, 2016
[28] Yeni Marlina, Tandiyo Rahayu, “Evaluation of
The Physical Fitness Among The Students of SMP
Negeri Unggul in The District of Aceh Besar, The
Journal of Educational Development 5 (1) (2017)
72 - 84
http://journal.unnes.ac.id/sju/index.php/jed, 2017.

16
The Effect of Kettlebell Training on Total Increase
of Strength among Central Java PPLOP
Weightlifting Athletes in 2017
Hadi
Faculty of Sports Science, Universitas Negeri Semarang
Semarang, Indonesia [email protected]
Abstract—The weightlifting really needs strength, strong
bodies, and perfect techniques to improve its performance. The
objective of the research is to know the effectiveness of kettlebel
practice method to increase the total weight lifter at Central
Java PPLOP. The research method used experiment with
training program of kettebel load, composed from maximal
repetition (RM) 70% s.d 80% for 2 months. A total of 16 times
of practice with 2 meetings per week with a sample of 10
Athletes. Data analysis using ANOVA with SPSS 16. The result
of the data analysis showed that, snatch ability showed
significant improvement, proved from t test result obtained tct
= 7,154 with value of sign = 0,000 <0,05. Clean and jerk ability
shows significant change, from t count = 6,692 sign = 0,000
<0,05. In total, there was a significant increase, from the value
of t count = 8,581 sign = 0,000 <0.05. The results show short-
term kettlebell training is effective in increasing strength. In
conclusion, 8 weeks of kettlebell training led to an increase in
total force strength in weightlifting.
Keywords—kettlebell, weightlifting
INTRODUCTION
Weightlifting as a heavy sport group that is in need of
strength in doing lifting weights. Weightlifting is an exercise
that emphasizes the heavy burden and is a separate sport,
where the athlete is competing to lift the most weight possible
in his class, therefore this will determine whether he came out
in the champions or not [3]. Weightlifting is also a sport that
relies on the power to lift me out of the iron material. A
relatively new form of training for athletic training is
kettlebell training. Kettlebell training is believed to provide
many of the same benefits as weight lifting.
However, research on kettlebell training is limited.
Anecdotal reports about the benefits of using ls kettlebel
weight lifting involves ease of teaching, is less efficient than
buying a whole weight set, and is less intimidating to use.
Trainers may be interested in using to ttlebells; If space is
limited, there is a shortage of funds for the Olympics or b
tight beam, or to help athletes who never lifted weights to get
a foundation in the basics of similar movements related to the
strength and power (squat, press, clean and jerk, snatch).
The results of another study suggest that short-term
weightlifting and kettlebell training are effective in
increasing strength and power [7]. Good method training
causes change significant in any anthropometric action. In
conclusion, 6 week weightlifting led to a significant increase. Therefore, the purpose of this study was to see an increase
in weightlifting exercise achievement using kettebel, for 8 weeks.
MATERIALS AND METHOD
This type of research uses experimental type. The
research design used the pretest-postes group design .
Variable in this research is exercise exercise using kettebel.
Population used in this research is PPLOP athletes
weightlifting Central Java 2017 man . The sample used is
total sampling . The sample of 9 boys is the sample that
received treatment on kettebel load. Data collection
techniques using treatments or direct measurement treatment
on the subject of the snatch and clean and jerk forces . The
technique of data analysis using ANOVA was continued by
determinant test using SPSS 16.
RESULTS AND DISCUSSION
Based on the results of the preetest at the PPL O P Central
Java weightlifting athletes held on 21-22 April 2017 which
coincided with the regional level weightlifting championship
in Semarang.
Once preetest is done on the athlete, additional training is
provided for technical improvement using kettlebell. This
exercise is given for less than 2 Months. Athletes are given
kettlebell snatch and kettlebell clean with loads for men 34
kg. For variations of exercises with modifications to the
increase of reps and sets. After 16 rehearsals, a final test with
a force test is conducted in the final week of June 2017.
17
T-test is used to determine the improvement of athletes
achievement during the training from April to June 2017. The
results of data analysis showed a significant increase, as
evidenced from the results of t test obtained t arithmet = 7,154
with the value of sign=0.000<0,05. Similarly, the ability
clean & jerk showed a significant change, as evidenced from
t = 6.692 with a sign value = 0,000 <0, 05. In totality, there is
a significant increase, as evidenced from the value of t arithmetic
= 8.581 with the value of sign = 0.000 <0 , 05.
PRETEST AND POSTTEST ACHIEVEMENT OF CENTRAL JAVA
PPLOP WEIGHTLIFTER
NO
NAME
PREETEST MONTH
APRIL
POSTTEST
MONTHS JUNE
SNA
TCH
C &
J
TOTA
L
SN
AT
CH
C &
J
TOT
AL
1 SN 74 90 164 77 94 171
2 IR 70 80 150 72 82 154
3 AR 57 67 124 60 70 130
4 FJ 73 90 163 75 90 165
5 AYR 75 95 170 80 100 180
6 IDA 40 45 85 42 48 90
7 AP 98 127 225 103 130 233
8 AK 65 90 155 70 92 162
9 AH 103 126 229 105 130 235
10 ANDI 120 147 267 122 150 272
T TEST RESULTS
Paired Differences
T df
Sig.
(2-
tailed)
Mean
Std.
Deviation
Std.
Error
Mean
95%
Confidence
Interval of the
Difference
Lower Upper
Pair
1
SNATCH
(April) -
SNATCH
(June)
-
3.100 1.370 .433 -4.080 -2.12 7154 9 .000
Pair
2
C & J
(April) - C
& J (June)
-
2.900 1.370 .433 -3.880 -1.92 6.692 9 .000
Pair
3
Total
(April) -
Total
(June)
-
6.000 2.211 .699 -7.582 -4.42 8,581 9 .000
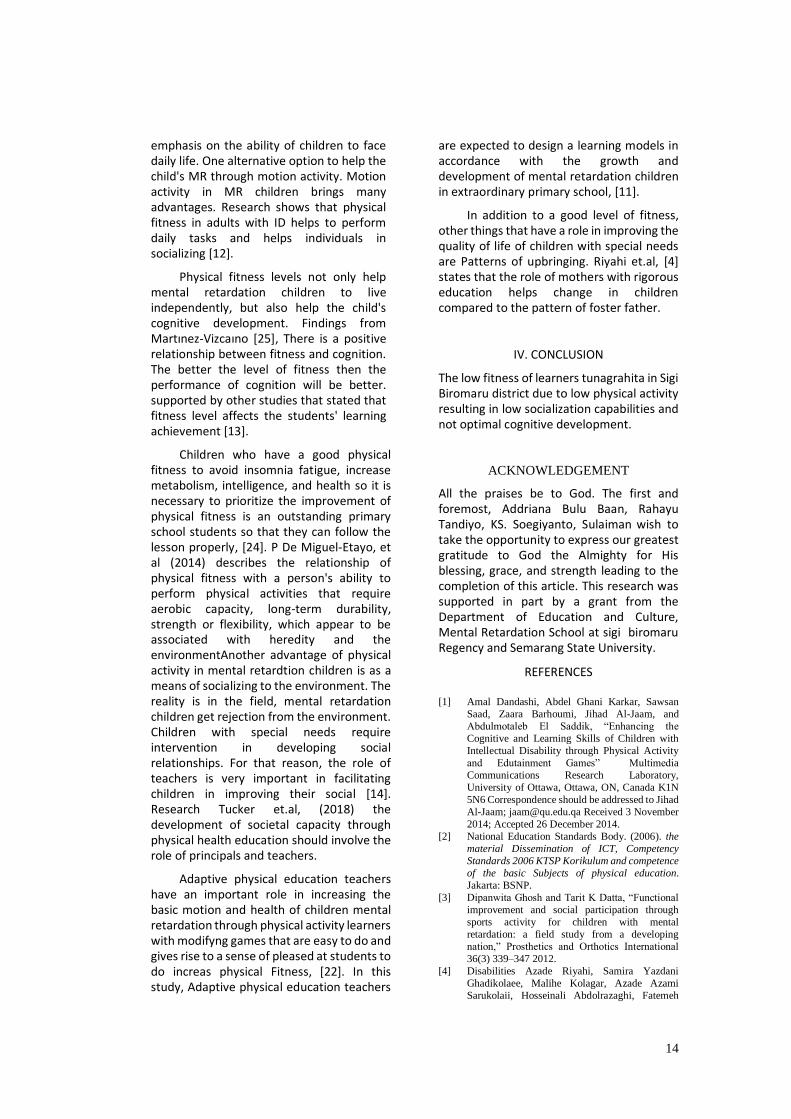
The average increase of snatch force from February to
April (preetest ) increased by 0,84 %, while the increase of
snatch force from April (preetest) to June ( posttest) increased
by 2.4%.
Fig 1. Snatch line diagram
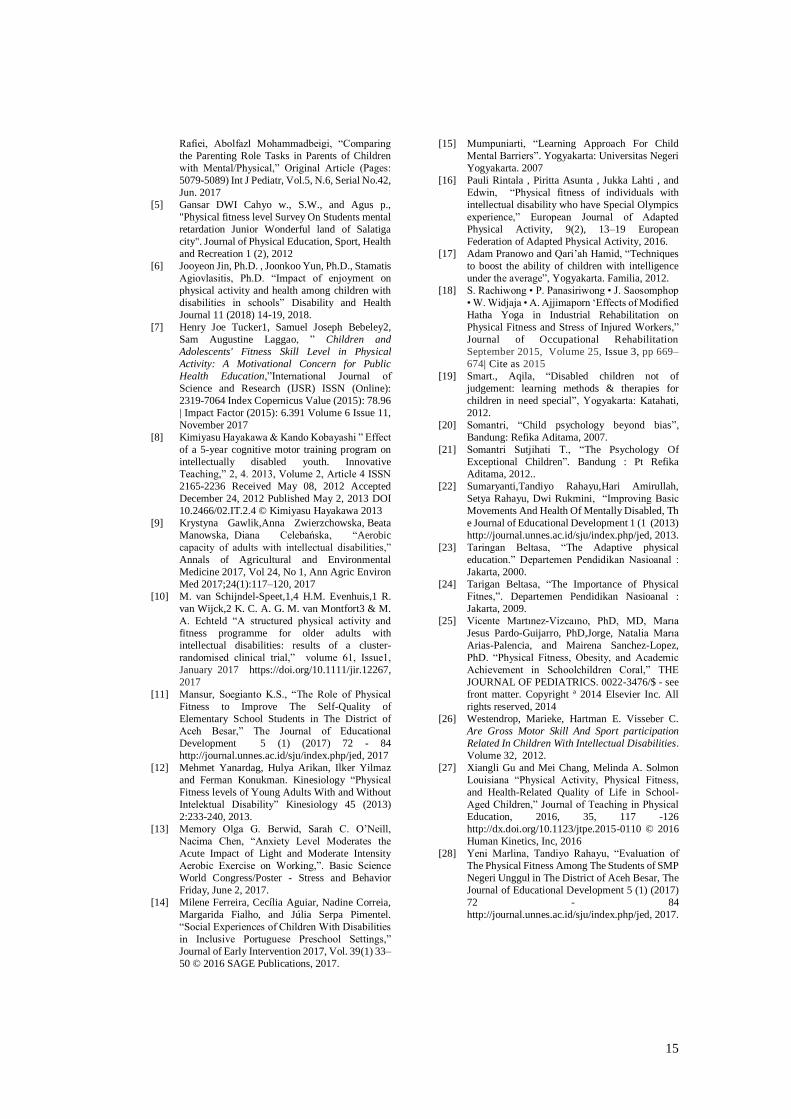
The average increase of clean & jerk generation from
February to April (preetest) increased 1,3 %, while the
average increase of clean & jerk generation from April
(preetest) to June (posttest) increased by 2.8%.
Fig 2. Diagram of Clean and Jerk Force Bar
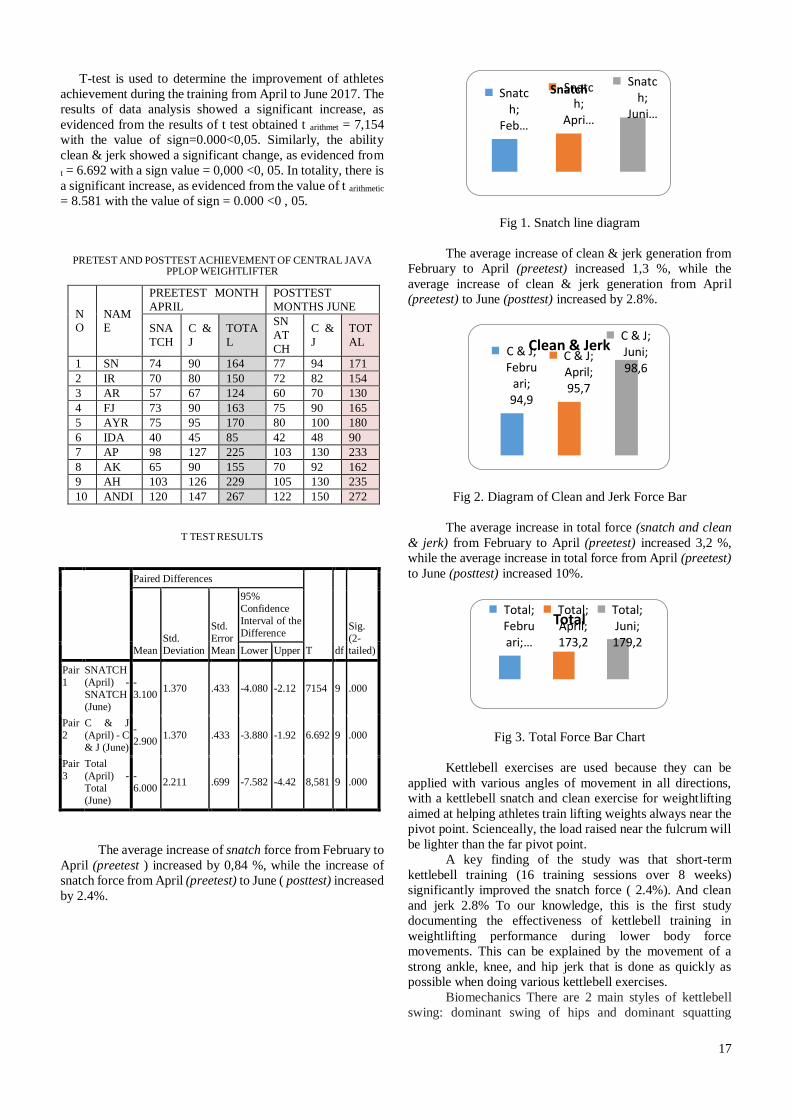
The average increase in total force (snatch and clean
& jerk) from February to April (preetest) increased 3,2 %,
while the average increase in total force from April (preetest)
to June (posttest) increased 10%.
Fig 3. Total Force Bar Chart
Kettlebell exercises are used because they can be
applied with various angles of movement in all directions,
with a kettlebell snatch and clean exercise for weightlifting
aimed at helping athletes train lifting weights always near the
pivot point. Scienceally, the load raised near the fulcrum will
be lighter than the far pivot point.
A key finding of the study was that short-term
kettlebell training (16 training sessions over 8 weeks)
significantly improved the snatch force ( 2.4%). And clean
and jerk 2.8% To our knowledge, this is the first study
documenting the effectiveness of kettlebell training in
weightlifting performance during lower body force
movements. This can be explained by the movement of a
strong ankle, knee, and hip jerk that is done as quickly as
possible when doing various kettlebell exercises.
Biomechanics There are 2 main styles of kettlebell
swing: dominant swing of hips and dominant squatting
Snatch;
Feb…
Snatch;
Apri…
Snatch;
Juni…
Snatch
C & J; Febru
ari; 94,9
C & J; April; 95,7
C & J; Juni; 98,6
Clean & Jerk
Total; Februari; …
Total; April; 173,2
Total; Juni; 179,2
Total
18
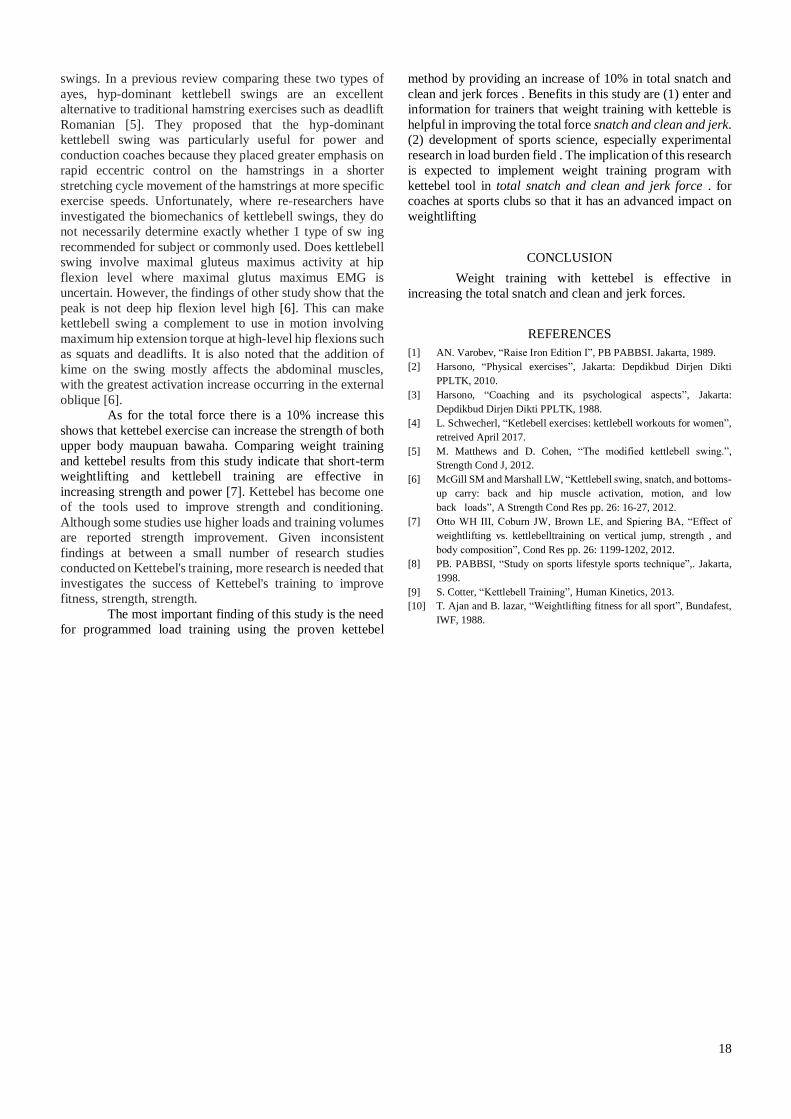
swings. In a previous review comparing these two types of
ayes, hyp-dominant kettlebell swings are an excellent
alternative to traditional hamstring exercises such as deadlift
Romanian [5]. They proposed that the hyp-dominant
kettlebell swing was particularly useful for power and
conduction coaches because they placed greater emphasis on
rapid eccentric control on the hamstrings in a shorter
stretching cycle movement of the hamstrings at more specific
exercise speeds. Unfortunately, where re-researchers have
investigated the biomechanics of kettlebell swings, they do
not necessarily determine exactly whether 1 type of sw ing
recommended for subject or commonly used. Does kettlebell
swing involve maximal gluteus maximus activity at hip
flexion level where maximal glutus maximus EMG is
uncertain. However, the findings of other study show that the
peak is not deep hip flexion level high [6]. This can make
kettlebell swing a complement to use in motion involving
maximum hip extension torque at high-level hip flexions such
as squats and deadlifts. It is also noted that the addition of
kime on the swing mostly affects the abdominal muscles,
with the greatest activation increase occurring in the external
oblique [6].
As for the total force there is a 10% increase this
shows that kettebel exercise can increase the strength of both
upper body maupuan bawaha. Comparing weight training
and kettebel results from this study indicate that short-term
weightlifting and kettlebell training are effective in
increasing strength and power [7]. Kettebel has become one
of the tools used to improve strength and conditioning.
Although some studies use higher loads and training volumes
are reported strength improvement. Given inconsistent
findings at between a small number of research studies
conducted on Kettebel's training, more research is needed that
investigates the success of Kettebel's training to improve
fitness, strength, strength.
The most important finding of this study is the need
for programmed load training using the proven kettebel
method by providing an increase of 10% in total snatch and
clean and jerk forces . Benefits in this study are (1) enter and
information for trainers that weight training with ketteble is
helpful in improving the total force snatch and clean and jerk.
(2) development of sports science, especially experimental
research in load burden field . The implication of this research
is expected to implement weight training program with
kettebel tool in total snatch and clean and jerk force . for
coaches at sports clubs so that it has an advanced impact on
weightlifting
CONCLUSION
Weight training with kettebel is effective in
increasing the total snatch and clean and jerk forces.
REFERENCES
[1] AN. Varobev, “Raise Iron Edition I”, PB PABBSI. Jakarta, 1989.
[2] Harsono, “Physical exercises”, Jakarta: Depdikbud Dirjen Dikti
PPLTK, 2010.
[3] Harsono, “Coaching and its psychological aspects”, Jakarta:
Depdikbud Dirjen Dikti PPLTK, 1988.
[4] L. Schwecherl, “Ketlebell exercises: kettlebell workouts for women”,
retreived April 2017.
[5] M. Matthews and D. Cohen, “The modified kettlebell swing.”,
Strength Cond J, 2012.
[6] McGill SM and Marshall LW, “Kettlebell swing, snatch, and bottoms-
up carry: back and hip muscle activation, motion, and low
back loads”, A Strength Cond Res pp. 26: 16-27, 2012.
[7] Otto WH III, Coburn JW, Brown LE, and Spiering BA, “Effect of
weightlifting vs. kettlebelltraining on vertical jump, strength , and
body composition”, Cond Res pp. 26: 1199-1202, 2012.
[8] PB. PABBSI, “Study on sports lifestyle sports technique”,. Jakarta,
1998.
[9] S. Cotter, “Kettlebell Training”, Human Kinetics, 2013.
[10] T. Ajan and B. lazar, “Weightlifting fitness for all sport”, Bundafest,
IWF, 1988.
19
The Influence of Learning Model Play to Increase
Vo2Max
1st Ruslan Universitas Mulawarman
Samarinda, Indonesia
2nd Hasan Universitas Al Asyariah Mandar
Polewali Mandar, Indonesia
3rd Palmizal A. Universitas Jambi
Jambi, Indonesia
Abstract—This study is aimed to determine the level
of influence of teaching models with the approach to
play against the increase in VO2max In the students of
SMA Negeri 10 Samarinda. The method used in this
research is quantitative by using experimental
approach. This study used the method of experiment. In
this study using the design of One Group Pretest-
Postest Design. In this design there is no control group,
and the subject is not placed randomly. The advantages
of this design is to do pretest and postest so it can be
known with certainty difference result due to treatment
given. The results showed that teaching method with
play approach can be obtained t value of obsevation =
9.253> t-table 1,70 (P 0.000 <α 0,05), meaning there is
influence of pretest and postest treatment. Can be
proven with an average value of 22.90: 25.13 with the
result showing an increase in the average value of 2.23
after treatment.
Keywords—play model, vo2max
TABLE I. INTRODUCTION
The increasingly complex and complex complexity of the
future seems to require education to be able to prepare
students for the real world [1]. At school, students need to
be made aware of the expectations they endure, the
challenges they face and the abilities they need to master.
Physical education teachers have a good position
in providing opportunities for students to participate in
activities that provide satisfaction for the process of
fulfilling basic sociological needs. In the process of
learning pemas, students meet sociological needs by
becoming a member of the group, for example given the
opportunity to play in a sports team. Students will gain
recognition, friendship, approval and appreciation from
their teammates and will benefit students' development in
their cognitive, affective and psychomotor aspects.
The play approach is based on the essential human
nature of play. This characteristic is a facet of human
beings as social beings, because involvement in the game
demands the willingness to obey and live the rules and
sanctions that essentially come from the culture of society.
Some experts say that play is a direct impulse from within
each individual, which for children is a job, while for adults
it is more perceived as a passion [2]. Play is an activity done
with pleasure [3].
Physical Education teachers should take
advantage of the school's active days, in an effort to
improve the level of motor skills and physical activity of
students by applying sports in the model of play [4]. The
model of play is able to facilitate teachers in applying
locomotor base motion training lessons as well as
improving VO2MAX.
Playing in addition to having an educative
function, it is also a fun reactions to children because
children can channel their tension in a more positive way
[5]. Play models can improve students' learning skills and
motivation because students can follow the learning
process enthusiastically and feel happy [6]. In addition play
is used as a medium to improve certain skills and abilities
in children [7].
The play approach is mostly done by teachers
because the community has done it regularly [11]. It is
called informal socialization in the form of a game. Broadly
speaking the steps taken in applying the play approach are
as follows: (a) Setting targets to be achieved. (b) Determine
the type of game as a student playing activity. (c) Describes
the ways and rules of play and always keeps students away
from the forms of competitive activity that spawns the
winners and the losers. For example the teacher gives the
task to do the jump rope game. Strictly the way and the
rules are disclosed and the grouping of students is made
according to their level of ability, so the skill level is not
too gigantic which affects the feeling of the inferiority of
20
the students with the lowest ability and the superior feeling
of self in the highest student of the leap result.
Increased VO2MAX is the most important part of
overall educational goals. The success of national
development is largely determined by the quality of
humans, and it is almost certain that one factor of
development actors is those who have good VO2MAX skills.
Various ways and efforts taken to achieve these ideals,
ranging from socializing sports and sports communities,
and optimize the performance of sports teachers in all
levels of education and sports coaches in the community.
VO2MAX's ability level is the maximum amount of
oxygen in milliliters, which can be used in one minute per
kg of body weight or oxygen volume in the body that can
be used while working hard. Students with low VO2MAX
ability are almost certain that their ability to absorb the
lessons maximally is also low, which ultimately affects low
learning achievement [12].
VO2MAX is the ability of the lungs, heart and blood
vessels to inhale and deliver a number of oxygen and
nutrients to the cells to meet the needs of physical activity
lasting more than three minutes or in a long time. When a
person breathes, some of the oxygen contained by the air
around us is absorbed by the lungs and transported through
the blood to the heart. Heart rate is a simple and informative
enough parameter to measure the height of one's body
activity. A normal person's heart rate, in the sense of not
having an abnormality, averages between 60-80 times per
minute. While the lowest level of a person's heart rate,
taken on a supine stretched calmly. It turns out there is a
linear relationship between the rise in heart rate per minute
with the use of aptake oxygen or Vo2max in the body [13].
The cardiovascular system of the body is the
system that carries oxygen to the active cells which are the
main factors determining the ability of VO2MAX [14]. A
study showed a weak association between the body's ability
to utilize available oxygen and increased VO2MAX [15].
To know the ability of VO2MAX researchers using
Bleep test. This form of test has several advantages
including VO2MAX data more accurate than other field tests
and can be implemented in bulk. The main principle is the
availability of a relatively small field (about 20 meters
long).
The implementation of the "bleep" test uses the
rhythm, initially very slowly and will progressively faster
then increasing the harder effort to follow the
predetermined rhythm. If "testi (perpetrator) can not follow
the rhythm (pace) then testi is considered to be incapable,
and recorded effort is a picture of VO2MAX it has" [16].
VO2MAX 's upgrading efforts through sports are
part of a flagship program in many countries including
Indonesia. The government has realized that by improving
the quality of society through increasing the level of ability
of VO2MAX, including the students, it is expected later in life
this nation will become a nation that has high productivity
and will be parallel to other nations in the world. From the above description it is known that the
learning that developed so far is a learning model play pproach that is taught by physical education teacher physical and health at high school level. In this research, the researcher wanted to know whether the implementation of the model can influence the improvement of VO2MAX ability
of students in East Kalimantan especially in SMA N 10 Samarinda by using bleep test.
TABLE II. MATERIALS AND METHOD
A. Procedures
The method used in this research is quantitative by
using experimental approach. This research used is the
method of experiment. In this study using the design of one
group retest-postest design used 30 subject. In this design
there is no control group, and the subject is not placed
randomly. The advantages of this design is to do pretest and
postest so it can be known with certainty difference result
due to treatment given. The research design is as follows:
RESEARCH DESIGN
TI X T2
Information :
T1: Pretest = VO2MAX
X: Treatment = Teaching Model Play
T2: Posttest = VO2MAX
Data collection techniques in this study conducted
through learning are:
1. Learning is given 3 times a week.
2. Duration of learning every 90 minutes for meeting
3. 16 meetings.
SCHEDULE OF LEARNING
Day Time Group Statement
Tuesday
Thursday
Saturday
07.15 – 08.45
07.15 – 08.45
07.15 – 08.45
Play
Play
Play
Playing
Field SMA
Negeri 10
Samarinda
B. Research Instrument
1) Aim
Measures maximum heart and lung function with
predicted VO2max.
2) Equipment tools
1. Test place - space inside the building or outside
field. Minimum length of 25 meters.
2. Create two parallel lines with a distance of 20
meters, with space / free field 2.5 meters from
continuation of running direction.
3. Each testi requires a run path of 90 cm, the number
of testi adjusted width of space / field.
4. A time observer, a whistle holder, and a supervisor
and resultant, a table modifying the
implementation of a Bleep test with time in
minutes and seconds.
5. Whistles, checklists, and ball points.
3) Implementation
1. Bleep test is done by running a distance of 20
meters back and forth (bb) begins with a slow run,
gradually increasingly faster, so the testi is not
able to follow the rhythm of running time, it means
the maximum ability at the level and back and
forth (bb) the.
2. Each time level is 1 (one) minute.
21
3. At level 1 the distance of 20 meters taken within
8.6 seconds of exercise 7 times back and forth.
4. At level 2.3 20 meters distance taken within 7.5
seconds in 8 times back and forth.
5. Level 4.5 20 meters distance taken within 6.7
seconds with 9 cal back and forth and so on.
6. At the same time the distance of 20 meters there is
whistle 1 time and simultaneously the last
alternating time every level there is a whistle 2
times.
7. For Star testi with star stand both legs behind the
start / limit line. With the signal "siaaap - Ya" testi
ran by the rhythm of time to the boundary line so
that 1 foot past the boundary line.
8. If before the whistle / tap testi has exceeded the
boundary line, for turning must wait for the
whistle / tap. Conversely, if there has been a
whistle / testie tap not to the boundary line, the
testi should accelerate the run to cross the
boundary line and immediately re-run in the
opposite direction.
9. If 2 consecutive testies are not able to follow the
rhythm of running time means maximum ability at
the level and the countercheck.
10. Suppose that at level 10 and reverse to 8; the
results recorded 10.8 seen in the table, VO2max
11. After the testi is not able to follow the rhythm of
running time, testi may continue to stop, but
continue to run slowly for 3 - 5 minutes for cooling
down.
The reference in making the length of the track is by
calculating the time between two "bleep" sounds on the
cassette (used as a benchmark). When the sound between
two "bleep" for 55 seconds then the length of the field to
the track is 18 333 meters. Meanwhile, when the sound
between two "bleep" for 60 seconds then the length of the
field that becomes the track is 20 meters. Calculate the
sound between two "bleep" and create an appropriate field
[17].
TABLE III. RESULTS AND DISCUSSION
A. Descriptive Data
In the description of this data discusses the average,
standard deviation, maximum and minimum values and
will be tested the requirements of normality with Shapiro-
Wilk Test test at a significant level of 95%. Shapiro-Wilk
Test Result Test conducted, obtained results as attached.
SUMMARY OF DESCRIPTIVE ANALYSIS OF VO2MAX PRETEST AND POST TEST DATA WITH LERANING MODEL PLAY
No
GROUP
N
Mean Min Max STD Sum
Pre-
test
Post-
test
Pre-
test
Post-
test
Pre-
test
Postte
st
Prete
st
Postt
est
Pre-
test
Post-
test
1. Learning
model play
30 22.90 25.13 20.40 21.50 25.80 29.50
1.63
1.99 687.1
0
753.9
0
Based on the table, summarizes the results of the data
description analysis of VO2MAX group play approach, group
of command approach, and control group, as follows:
Group Before Treatment or pretest (preliminary test)
VO2MAX data learning with play approach before treatment
or pretest (early test) obtained VO2MAX with an average of
22.90, maximum 25.80 Minimum 20.40, standard
deviation 1.63 Sum 687.10.
Group after Treatment or posttest (final test): VO2MAX
data learning with play approach after treatment or posttest
(final test) obtained Vo2 Max with average 25,13, max
25,80, Minimal 20,40, standard deviation 1,99 Sum 753,90.
On the basis of these differences can be seen the
increase in VO2MAX the average value of pretest or
preliminary test before the treatment of two months to the
final test or posttest with the play approach. The average
value of early test Vo2max 22.90 increased by 25.13 there
was an increase of 2.23.
To prove the increase of VO2MAX SMA Negeri 10
Samarinda is proved with an average value of 25.13: 22.90
with the result showing an increase in the average value of
0.45 after the posttest or final test. And also obtained t value
of observation = 9.255> t-table 1.70 (P 0.00 <α 0.05),
means there is a significant difference between pretest and
posttest.
B. Test Prerequisites and results of data analysis
inferential
T-Test results were used to test the effect of a two-
month play-approach.
SUMMARY OF T-TEST ANALYSIS OF SMA NEGERI 10
SAMARINDA
Variable Mean tobservation ttable P α
Learning
model play
2,23 9,255 1,70 0,00 0,05
C. Normality Test
Normality test is used to determine whether a normal
data or not and to determine whether the data is normally
distributed or not, then need to be tested by One Sample
Kolmogorov Smirnov. The basis of this analysis is used in
making a decision whether the data follows the normal
distribution or not ie if the value of significance or
probability is greater than 5% (0.05), then the data is
normally distributed.
SUMMARY OF NORMALITY TEST
Data Asym.Sig
(2-tailed)
Sig
Decision
Pretest 0,981 0,05 Normal
Posttest 0,945 0,05 Normal
22
The results of the analysis and explanation are
necessary to obtain the corresponding theories that have
been presented with the results of the research achieved.
The results achieved in this study through statistical
analysis as follows:
There is a significant influence using the teaching
model with a play approach to the increase in VO2MAX.
According t-test data of Vo2 Max SMA Negeri 10
Samarinda obtained t-observation bigger than t-table at
significant level α 0,05%. Furthermore, seen from the
average value of VO2MAX SMA Negeri 10 Samarinda after
treatment for two months there was a significant difference.
A play model approach is an activity that can shape the
personality and self-discovery for students. The emphasis
in playing will make the subject of physical education
something very fun and very interesting and always eagerly
awaited by students. With the learning model of play to
achieve the learning objectives will have an impact in the
learning process that can put the play model into the focus
of physical education subjects that can increase the
excitement and satisfaction in students in doing movements
to play in improving Vo2Max and children who do not has
an interest in enjoying sports.
VO2MAX may increase for untrained people, although
there has not been a change in aerobic capacity in skeletal
muscle. In those untrained, skeletal muscle capacity can be
burdened. The problem of oxygen is a limiting factor,
because even highly trained muscles can not use oxygen
when it is absent or not to the muscle, whereas oxygen is
supplied to the muscles, while the muscles themselves are
not trained in endurance, Vo2max will be more low,
although the o2 supplied is quite large.
VO2MAX is the maximum amount of oxygen that can be
consumed during intense physical activity until eventually
fatigue occurs. VO2MAX values depend on cardiovascular,
respiratory, hematological, and muscle oxidative states.
This measurement of VO2MAX value can apparently be used
to analyze the effects of a physical exercise program. In
children who are developing, physical exercise can provide
excellent health benefits. To be effective, physical exercise
should be endurance and include a certain duration,
frequency, and intensity. However, it is known that during
the period of child development, there are many structural,
hormonal, and biochemical changes that can affect the
value of VO2MAX. Therefore, it is important to know the
change in VO2MAX values in this population. A meta-
analysis study says that the majority of studies on VO2MAX
x in children still use boys as their subjects.
TABLE IV. CONCLUSION
VO2MAX is the maximum amount of oxygen that can be
consumed during intense physical activity until eventually
fatigue occurs. The value of VO2MAX depends on the
cardiovascular, respiratory, hematological, and muscular
oxidative states. This measurement of VO2MAX value can
apparently be used to analyze the effects of a physical
exercise program. In children who are developing, physical
exercise can provide excellent health benefits. To be
effective, physical exercise should be endurance and
include a certain duration, frequency, and intensity.
However, it is known that during the period of child
development, there are many structural, hormonal, and
biochemical changes that can affect the value of VO2MAX.
Therefore, it is important to know the changes in the value
of Vo2Max in this population. A meta-analysis study says
that the majority of studies on VO2max in children still use
boys as their subjects.
REFERENCES
[1] AS. jackson, Janggut EF, LT Wier, Ross RM, Stuteville JE, Blair
SN, “Changes in aerobic power of men, ages 25-70 yr”, Med Sci
Sports Exerc. 1995
[2] Barela, J. A, “Fundamental motor skill proficiency is necessary for
children’s motor activity inclusion”, 2013.
[3] Motriz, Rio Claro, http://www.scielo.br/pdf/ motriz/v19n3/03/pdf,
retrieved September 2015.
[4] Bremer, E. & Lloyd, M, “The importance of fundamental motor
skill proficiency for physicalactivity in elementary school age
females”, PHEnex Journal, 2014.
[5] Cholik, Mutohir, et al, “Teaching models”, 1993.
[6] Gollnick PD, Armstrong RB, Saubert CW 4th, Piehl K, B. Saltin,
“Enzim and activities on trained and untrained muscle
composition”, J Appl Physiol. J Appl Physiol, retrieved Desember
2009.
[7] Hairy, Junusul, “Basic of sports health”, Jakarta: Universitas
Terbuka Departemen Pendidikan Nasional, 2009.
[8] Harsuki, “Expertise study of recent sports”, Jakarta: Raja Grafindo
Persada, 2002.
[9] Lutan, Rusli, “Plan and strategy for physical education”, Jakarta:
National Department of Education, 2004
[10] Mahendra, Agus, “Reaching the holistic development”, Jakarta:
National Department of Elementary Education and Sports, 2001.
[11] Matakupan, J, “Theory of playing”, Jakarta: National Department
of Elementary Education and Sports, 1996.
[12] Riyanto, Yatim, “New paradigm of learning”, Jakarta: Kencana
Prenada Media Group, 2009.
[13] Rochdi, Simon, “Playing model in elementary school based on
DAP approach”, Journal of Education, Bandung: UPI, 2007.
[14] M. Sajoto, “Physical training and increasing”, Semarang: Dahara
Frize, 1995.
[15] Saltin, B, Rowell LB, “Functional adaptations to physical activity
and inactivity”, Federation Proceeding, retrieved December 2009.
[16] Sanjaya, Wina, “Learning strategy with educational process
oriented”, Jakarta: Kencana Prenada Media Group, 2009.
[17] Saputra, M. Yudha, “Basic of athletics”, Jakarta: National
Deoartment of Education, 2001.
[18] D. Siedentop, et al, “Complete guidance of sports education”,
1986.
[19] Stanojević, I. and Milenković, D, “Forms of movement in terms of
elementary games at physical education classes”, International
Journal of Cognitive Research in Science, Engineering and
Education, 2013.
[20] Sukadiyanto, “Theory and methodology of physical training”, Yogyakarta: Sports Coaching Education Department, Faculty of
Sports Science, Universitas Negeri Yogyakarta, 2005.
23
Educational Test and Measurement in Sport to
Semarang City Community Through Activities FIK
Goes to Public
1st Rivan Saghita Pratama
Department of Sports Coaching
Education, Faculty of Sports Sciences,
Universitas Negeri Semarang
Semarang, Indonesia
2nd Soedjatmiko
Department of Sports Coaching
Education, Faculty of Sports Sciences,
Universitas Negeri Surabaya
Semarang, Indonesia
3rd Nasuka
Department of Sports Coaching
Education, Faculty of Sports Sciences
Universitas Negeri Semarang,
Semarang, Indonesia
4th Joko Hartono
Department of Sports Coaching
Education, Faculty of Sports Sciences,
Universitas Negeri Semarang,
Semarang, Indonesia
Abstract— The purpose of community service activities is
to improve community knowledge about sports test and
measurement tools, improve community knowledge about the
use of test and sports measurements, improve community
knowledge about test and measurement norms in sports. The
method of the implementation of community service is
qualitative descriptive. Located of this devotion in front of the
Central Java Provincial Social Office. The sample in this
devotion amounted to 115 people. The result of this devotional
activity is an increase in community knowledge about sports
tests and measurements. Increased knowledge of the
community about the procedures for the use of test equipment
and sports measurements. Increased public knowledge about
test and measurement norms in sports. Suggestion of devotion
to the people present is 1). Socialization activities on test and
measurement tools to the community should be encouraged
actively, so that the community will be helped in making daily
activities plan in accordance with the ability of physical
condition owned by the community. 2). The proper use of test
and measurement tools can be a valid benchmark in drawing
conclusions about the physical condition of the community. 3).
The public should also know the norms applicable in sports
tests and measurements.
Keywords— Education, Test and Measurement in Sport,
FIK Goes to Public
TABLE V. INTRODUCTION
Exercise is all systematic activity to encourage,
nurture and develop physical, spiritual, and mental
potential [25]. The purpose of national is to maintain and
improve health and fitness, achievement, human quality,
inculcate moral values and noble character, sportsmanship,
discipline, cultivate and build unity and unity, strengthen
national resilience, and lift the dignity , dignity, and
national honor. To achieve these national goals there are 3
scope of coaching and sports development include: 1)
sports education, 2) recreational sports, 3) sports
achievements.
Society is a group of Indonesian non-governmental
citizens who have attention and role in the field of sport.
The public has equal and wide opportunity to participate in
sports activities [25]. Emphasis on crime rate, illness rate,
unemployment rate can be done by positive activity and
one of them with sport.
Society needs knowledge and skills about the many
things that are needed in modern life today. Including how
the life of the nation in the increasingly complex
constellation of relations between nations, filled with
various express or implied interests. In relations between
nations, even with the principle of equality of the degree,
can not be denied the existence of an international network
system that puts a nation in a position of dependence or be
very limited freedom in interacting with other nations, both
lateral and multilateral. Such circumstances require the
community to need the ability to remain conscious of the
dignity as a nation.
FIK Goes to Public is a sports-themed social event
that aims to cultivate the community and promote sports.
This event was first held in January 2016. Promoted by the
Dean of the Faculty of Sport Science Prof. Dr. Tandiyo
Rahayu, M.Pd., FIK Goes to Public activities continue to
show interesting events in order to foster and educate the
wider community in the field of sports and health. This
activity is held regularly every Sunday in the street of
heroes in front of Social Office of Central Java City
Semarang. This activity starts at 05.00 WIB until 09.00
WIB. This activity utilizes public space on Motor Vehicle
Free Day (HBKB) or often called Car Free Day (CFD).
CFD in Semarang City have been implemented by
Semarang City Government since February 1, 2007. The
activities of motor vehicle-free days in Semarang City are
centered in Simpang Lima, Jalan Pahlawan and Jalan
24
Pemuda. The activities of CFD involve hundreds of people
of Semarang city gathering with very high enthusiasm to
exercise.
The phenomenon of car free day in stimulating
people to do sports activities very well. This can be seen
from the society's participation that every week is
increasing. Some of the physical activities that people do in
car free day activities are street, running, aerobic
gymnastics, roller skates, skateboards, and cycling.
Based on the results of interviews with a team of
devotees who are present in the car free day, we found there
are some things that people lack attention before
exercising. Some of these include the lack of community
knowledge of programmed and measurable sports, lack of
knowledge of the consequences of carrying out
unprogrammed physical activity, lack of knowledge of
some test tools and sports measurements that serve to assist
in achieving the goals of physical activity undertaken.
Based on existing problems in the field, the solution that
the authors offer is by giving "Education Test Tools and
Measurements of Sports to the Community of Semarang
City through FIK Goes to Public Activities".
TABLE VI. MATERIALS AND METHOD
The method of implementation of community
service is qualitative descriptive. The population of this
devotion is the community of Semarang city that is present
in car free day activity which is held every Sunday and
located in front of Central Java Provincial Social Service
Office. The sample in this devotion was supervised by 115
people.
In this devotion the devotees present various sports
test and measurement tools, the function of the test and the
measurement of the sport, the procedure of the use of tools
and the socialization of the norms of the physical condition
read from the tool. The tools that will be displayed are: :
1. Sphygmomanometer atau Tensimeter.
2. Timbangan berat badan.
3. Hand grip dynamometer.
4. Jump power meter.
5. Back and leg dynamometer.
6. Push and pull dynamometer.
TABLE VII. RESULTS AND DISCUSSION
The community service entitled "Education of
Semarang City's Sports Measurements and Measurement
Apparatus Through FIK Goes to Public Activity" has the
purpose to increase community knowledge about sport as a
programmed lifestyle by promoting the norms of physical
condition, in order to reduce the risk of injury. This
devotional activity will feature some sports test and
measurement tools owned by FIK Unnes Laboratory.
This activity in cooperation with the Social Service
of Central Java Province, the Environment Office of
Semarang City and the Department of Transportation of
Semarang City. Community Service Team hopes that with
this activity people will be more active in carrying out
sports activities and can measure the achievements of each
activity undertaken. Outside of this devotional activity, the
authors will cooperate with local electronics media to
memplubikasikan this activity and impact on the quantity
of community participation to follow this devotional
activity.
The results achieved in this community service
activity is the team of devotees get data about the physical
condition test conducted by participants of car free day
activities located in front of Social Service of Central Java
Province. The data is directly conveyed to the visitor taking
the measurements. The data will provide a hypothesis about
the health condition of visitors. Based on these data the
team of devotees can also provide input on things to do in
order to improve the health condition of visitors.
The physical condition of blood pressure can be
measured using a sphygmomanometer or better known as a
tensimeter. This tool is useful for measuring blood pressure
that refers to the pressure of blood on blood vessels when
blood is pumped throughout the human body. The device
can measure blood pressure up the arteries due to a
heartbeat called a systole and it can also measure blood
pressure when the heart rests between pumps called
diastoles.
Power is a combination of two elements of the physical
condition components of strength and speed. The quality of
muscle power will be reflected in the element of strength
and speed in which the execution is carried out explosively
in the shortest time possible. Muscle power or muscular
power is the ability of a person to perform maximum
strength, with effort done in a short time. In this case it is
stated that muscle power is the multiplication of strength
and speed. Meanwhile, explosive power or explosive
power is a quality that allows the work of muscles or a
group of muscles to produce explosive physical labor
power determined muscle strength and speed of nerve
stimulation and speed of contraction. The devotion of this
community of devotees measures the muscle strength of
arms and limbs of the people of Semarang who participate
in car free day activities. Seed power arm by using push
and pull dynamometer.
TABLE VIII. CONCLUSION
Semarang city community have increase the knowledge
about the test and measurement in sport.
REFERENCES
[1] Absori. “Environment law enforcement and anticipation of free
trade era”, Yogyakarta: Muhammadiyah University Press, 2007.
[2] Alwisol, “Individual psychology”, Malang: UMM Press, 2007.
[3] Giriwijoyo, Santosa, “Sports faal sciences, body functions at
sports”, Bandung: FPOK UPI, 2004.
[4] Harper, Douglas. “Online etymological dictionary”, retrieved Juli
2013.
[5] Healey, Patsy, et. All, “The new urban context, managing cities”,
New York: John Wiley & Sons, 2005.
[6] International Olympic Committee, IOC World Conference Sport
For All, Lima Peru.
[7] Karim, Faizati, “Sports and health guidance for health workers”,
retrieved Juni 2016.
[8] Lutan, Rusli, “Sports pedagogy”, retrieved Juni 2016.
[9] M. Gerber, J. Linda, “Sociology 7th canadian ed. toronto”, Ontario:
Pearson Canada Inc, 2010.
25
[10] Mikkelsen, Brith, “Research methodology and enforcement, a
guidance for field practitioners”, Jakarta: Yayasan Obor Indonesia,
2001.
[11] M. Deddy, Rakhmat, Jalaluddin, “Intercultural communication, a
guidance to communicate with different culture”, Bandung:
Remaja Rosdakarya, 2006.
[12] Mutohir, T. Cholik, M. Ali, “Sport development index (concept,
methodology, and aplication)”, Jakarta: PT. Indeks, 2007.
[13] Nopembri, Soni, “People empowerment on sports: towards sports
industry”, retrieved Juni 2016.
[14] R. Jalaluddin, “Psychology of communication”, Bandung: PT
Remaja Rosdakarya, 2008.
[15] Salim, S. Amir, Pratiwi, W. Dwi, “Comercial building, sports, and
education and open area of cities: needs assesment, case study in
Bandung”, Journal of Infrastructure dan Environment, Vol.1 (1)
pp.1-8, 2005.
[16] Soetrisno, Loekman, “Facing the participatory community”,
Jakarta: Kanisius, 2004.
[17] Crime Statistic, Jakarta: Badan Pusat Statistik, 2014.
[18] S. Suherman, “Modul V playing concept”, retreived Juni 2016.
[19] Sutarto, “Basic of organization”, Yogyakarta: UGM Press, 2008.
[20] T. David, “A positivist tradition in early demand theory”, Madrid:
Dpt. of Logic, History and Philosophy of Science (UNED) and
Urrutia Elejalde Foundation, 2003.
[21] T. Claus, “Sport (and culture of human motion) for historians an
approach to precise the central term(s)”, Lecture held at the IX.
International CESH-Congress, 25. Sept. 2004 in Crotone (Italy),
2004.
[22] Tomoliyus. “Management for sports equipments”,. Yogyakarta,
Agustus 2010.
[23] Pratt, M. Macera, C. Wangm, G, “Higher direct medical costs
associated with physical inactivity”,. Journal The Physician and
Sportsmedicine, Vol. 2 (8) pp. 63-70, 2005.
[24] P. Jonny, “Management of social environment”,. Yayasan Obor
Indonesia, 2003.
[25] Law of Republic Indonesia Number 3 Year 2005 about National
Sports System.
[26] Law of Republic Indonesia Number 20 Year 2003 about National
Education System
[27] Z. Markus, “Integrated city management”, Yogyakarta: Kanisius,
2009
26
Effective Method Effleurage Traction
Reposition to the Improvement of ROM
(Range of Motion) in Knee Instructions
1st Arif Setiawan
Faculty of Sport Science
Universitas Negeri Semarang
Abstract- The most common injury to an athlete is
a knee injury. The knee is the body's propulsion and
weight-bearing. One sign of injury is the decrease of
range of motion (ROM). Massage effleurage
reposition traction is an alternative in healing injuries.
Which research problem formulation is most
influential between effleurage methods with effleurage
method coupled with repositioning traction on ROM
on knee injury.
Type of experimental research. The experimental
design used is the pretest and posttest design (one
group pretest posttest design). Samples of 8 athletes of
the BPPLOP son with knee injury. There are several
stages of implementation that is pretest, first posttest,
and second posttest. The research instruments are
goniometer, lotion and towel. The measurement
results were analyzed by paired sample T-Test with
5% significance level using SPSS 21.0.
The result of data analysis is obtained from the
result of paired sample T-Test with SPSS 21.0. The
pretest average is 114.63. The first posttest with an
average of 133.25. The second posttest obtained an
average value of 138.13. The first posttest has a sig
value. (2-tailed) of 0.073> 0.05. The second posttest has
a sig value. (2-tailed) by 0.036 <0.05. The second
posttest is a combination of massage effleurage
reposition traction.
Suggestion of this research for trainer, athlete,
masseur and masseus to be used as reference about
handling of sports injury especially with massage
method of reposition traction effleurage.
Keywords: massage effleurage, ROM, knee injury
INTRODUCTION
Sports is one activity that is very popular by the
public, ranging from children to parents. Exercising
in addition to improving body health and fitness,
exercise can be differentiated based on the purpose
of the sport, namely sports education, recreational
sports, and sports achievements. In doing the sport
of course someone must have experienced injury.
According to Hardianto Wibowo what is meant by
sports injuries (Sport Injures) are all kinds of
injuries that arise, both at the time of practice and at
the time of the sport (game) or after the game [9].
According to Garisson the factors that cause sports
injuries are: (1) intrinsic factors that include:
network weakness, flexibility, overload,
biomechanics error, lack of adjustment, body size,
performance ability, play style (2) include: wrong
equipment, other athletes, playing surface, weather
[17]. Ali Satya Graha and Bambang Priyonoadi
revealed that one of the signs of injury is impaired
function or decreased range of motion (ROM) [1].
There are basically two types of injuries that are
common in the sport world, namely: 1) acute
injuries, such as: fractures, dislocation (location of
bone is not in place). This type of sports injury
really takes serious care and handling as quickly as
possible. 2) Severe / sustained sports injuries, these
injuries are more difficult to detect and it is usually
difficult to know the initial symptoms.
Sports injuries slowly and gradually will be able
to interfere with other activities [21]. Meanwhile,
according to Garrison, Susan J, there are two types
of injuries that are often experienced by athletes are
acute and chronic injury that drag (overuse
syndrome) [17]. Acute trauma is a sudden, severe
injury, such as a scratch injury, a tear in the
ligament, or a falling bone. While overuse
syndrome is an injury that begins from the presence
of an abnormal strength in the level of low or light,
but occur repeatedly and in the long term. If the
injury is not handled properly it will aggravate the
injury itself.
Based on observations that researchers
conducted on March 8, 2017 section of massage and
therapy Center for Central Education and Sports
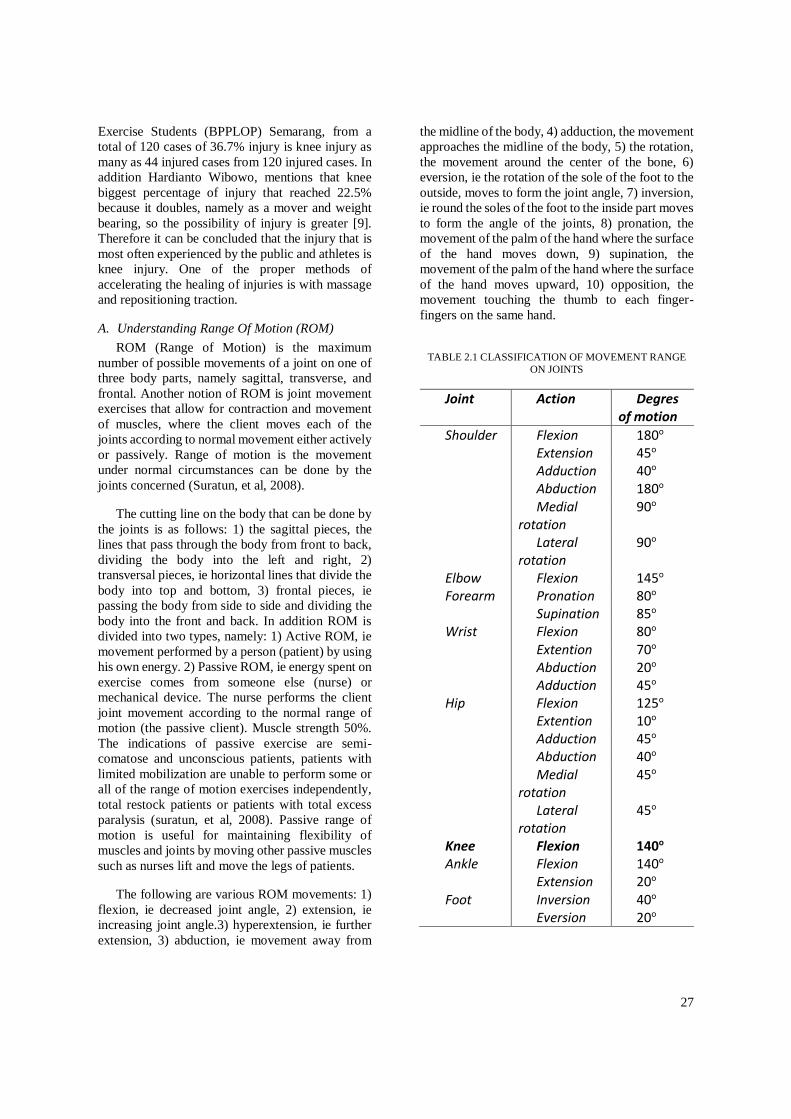
27
Exercise Students (BPPLOP) Semarang, from a
total of 120 cases of 36.7% injury is knee injury as
many as 44 injured cases from 120 injured cases. In
addition Hardianto Wibowo, mentions that knee
biggest percentage of injury that reached 22.5%
because it doubles, namely as a mover and weight
bearing, so the possibility of injury is greater [9].
Therefore it can be concluded that the injury that is
most often experienced by the public and athletes is
knee injury. One of the proper methods of
accelerating the healing of injuries is with massage
and repositioning traction.
A. Understanding Range Of Motion (ROM)
ROM (Range of Motion) is the maximum
number of possible movements of a joint on one of
three body parts, namely sagittal, transverse, and
frontal. Another notion of ROM is joint movement
exercises that allow for contraction and movement
of muscles, where the client moves each of the
joints according to normal movement either actively
or passively. Range of motion is the movement
under normal circumstances can be done by the
joints concerned (Suratun, et al, 2008).
The cutting line on the body that can be done by
the joints is as follows: 1) the sagittal pieces, the
lines that pass through the body from front to back,
dividing the body into the left and right, 2)
transversal pieces, ie horizontal lines that divide the
body into top and bottom, 3) frontal pieces, ie
passing the body from side to side and dividing the
body into the front and back. In addition ROM is
divided into two types, namely: 1) Active ROM, ie
movement performed by a person (patient) by using
his own energy. 2) Passive ROM, ie energy spent on
exercise comes from someone else (nurse) or
mechanical device. The nurse performs the client
joint movement according to the normal range of
motion (the passive client). Muscle strength 50%.
The indications of passive exercise are semi-
comatose and unconscious patients, patients with
limited mobilization are unable to perform some or
all of the range of motion exercises independently,
total restock patients or patients with total excess
paralysis (suratun, et al, 2008). Passive range of
motion is useful for maintaining flexibility of
muscles and joints by moving other passive muscles
such as nurses lift and move the legs of patients.
The following are various ROM movements: 1)
flexion, ie decreased joint angle, 2) extension, ie
increasing joint angle.3) hyperextension, ie further
extension, 3) abduction, ie movement away from
the midline of the body, 4) adduction, the movement
approaches the midline of the body, 5) the rotation,
the movement around the center of the bone, 6)
eversion, ie the rotation of the sole of the foot to the
outside, moves to form the joint angle, 7) inversion,
ie round the soles of the foot to the inside part moves
to form the angle of the joints, 8) pronation, the
movement of the palm of the hand where the surface
of the hand moves down, 9) supination, the
movement of the palm of the hand where the surface
of the hand moves upward, 10) opposition, the
movement touching the thumb to each finger-
fingers on the same hand.
TABLE 2.1 CLASSIFICATION OF MOVEMENT RANGE
ON JOINTS
Joint Action Degres of motion
Shoulder Flexion 180o
Extension 45o
Adduction 40o
Abduction 180o
Medial rotation
90o
Lateral rotation
90o
Elbow Flexion 145o
Forearm Pronation 80o
Supination 85o
Wrist Flexion 80o
Extention 70o
Abduction 20o
Adduction 45o
Hip Flexion 125o
Extention 10o
Adduction 45o
Abduction 40o
Medial rotation
45o
Lateral rotation
45o
Knee Flexion 140o
Ankle Flexion 140o
Extension 20o
Foot Inversion 40o
Eversion 20o
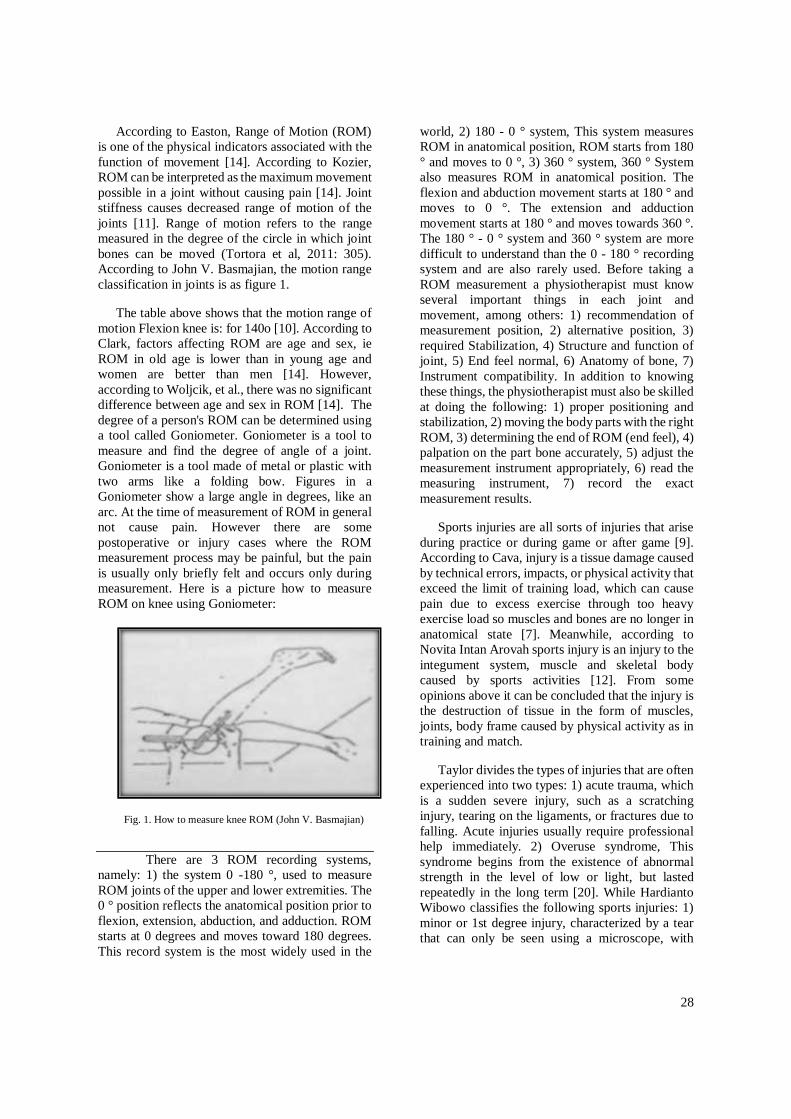
28
According to Easton, Range of Motion (ROM)
is one of the physical indicators associated with the
function of movement [14]. According to Kozier,
ROM can be interpreted as the maximum movement
possible in a joint without causing pain [14]. Joint
stiffness causes decreased range of motion of the
joints [11]. Range of motion refers to the range
measured in the degree of the circle in which joint
bones can be moved (Tortora et al, 2011: 305).
According to John V. Basmajian, the motion range
classification in joints is as figure 1.
The table above shows that the motion range of
motion Flexion knee is: for 140o [10]. According to
Clark, factors affecting ROM are age and sex, ie
ROM in old age is lower than in young age and
women are better than men [14]. However,
according to Woljcik, et al., there was no significant
difference between age and sex in ROM [14]. The
degree of a person's ROM can be determined using
a tool called Goniometer. Goniometer is a tool to
measure and find the degree of angle of a joint.
Goniometer is a tool made of metal or plastic with
two arms like a folding bow. Figures in a
Goniometer show a large angle in degrees, like an
arc. At the time of measurement of ROM in general
not cause pain. However there are some
postoperative or injury cases where the ROM
measurement process may be painful, but the pain
is usually only briefly felt and occurs only during
measurement. Here is a picture how to measure
ROM on knee using Goniometer:
Fig. 1. How to measure knee ROM (John V. Basmajian)
There are 3 ROM recording systems,
namely: 1) the system 0 -180 °, used to measure
ROM joints of the upper and lower extremities. The
0 ° position reflects the anatomical position prior to
flexion, extension, abduction, and adduction. ROM
starts at 0 degrees and moves toward 180 degrees.
This record system is the most widely used in the
world, 2) 180 - 0 ° system, This system measures
ROM in anatomical position, ROM starts from 180
° and moves to 0 °, 3) 360 ° system, 360 ° System
also measures ROM in anatomical position. The
flexion and abduction movement starts at 180 ° and
moves to 0 °. The extension and adduction
movement starts at 180 ° and moves towards 360 °.
The 180 ° - 0 ° system and 360 ° system are more
difficult to understand than the 0 - 180 ° recording
system and are also rarely used. Before taking a
ROM measurement a physiotherapist must know
several important things in each joint and
movement, among others: 1) recommendation of
measurement position, 2) alternative position, 3)
required Stabilization, 4) Structure and function of
joint, 5) End feel normal, 6) Anatomy of bone, 7)
Instrument compatibility. In addition to knowing
these things, the physiotherapist must also be skilled
at doing the following: 1) proper positioning and
stabilization, 2) moving the body parts with the right
ROM, 3) determining the end of ROM (end feel), 4)
palpation on the part bone accurately, 5) adjust the
measurement instrument appropriately, 6) read the
measuring instrument, 7) record the exact
measurement results.
Sports injuries are all sorts of injuries that arise
during practice or during game or after game [9].
According to Cava, injury is a tissue damage caused
by technical errors, impacts, or physical activity that
exceed the limit of training load, which can cause
pain due to excess exercise through too heavy
exercise load so muscles and bones are no longer in
anatomical state [7]. Meanwhile, according to
Novita Intan Arovah sports injury is an injury to the
integument system, muscle and skeletal body
caused by sports activities [12]. From some
opinions above it can be concluded that the injury is
the destruction of tissue in the form of muscles,
joints, body frame caused by physical activity as in
training and match.
Taylor divides the types of injuries that are often
experienced into two types: 1) acute trauma, which
is a sudden severe injury, such as a scratching
injury, tearing on the ligaments, or fractures due to
falling. Acute injuries usually require professional
help immediately. 2) Overuse syndrome, This
syndrome begins from the existence of abnormal
strength in the level of low or light, but lasted
repeatedly in the long term [20]. While Hardianto
Wibowo classifies the following sports injuries: 1)
minor or 1st degree injury, characterized by a tear
that can only be seen using a microscope, with
29
minimal complaints and little or no disturbing
performance of the athlete in question, such as
abrasions , bruising, mild sprain. 2) moderate or
second-degree injuries, characterized by apparent
tissue damage, pain, swelling, redness and heat,
with significant impairment of function and affect
the performance of the athlete concerned, eg muscle
widening and ligament tearing. 3) severe injury or
level III, this injury occurs complete or almost
complete tear in the muscles, ligaments and
fractures of the bone, requiring total rest, intensive
treatment, and even surgery [9].
In addition Hardianto Wibowo, mentions that the
largest knee percentage of injury that reached
22.5% because it doubles, namely as a mover and
weight bearing, so the possibility of greater injury
[9].
According to Tommy Fondy there are several
kinds of knee injuries, namely: 1) knee sprain
injury, 2) Injury to Muscle or Tendo and Ligaments,
3) Patella Injury (Kneecap), 4) Rear Knee Injury, 5)
Dislocation 6) Broken Bones (Fractur). There are
several methods in healing knee injury, one of them
is the method of massage and repositioning traction
[21].
Taylor shares the causes of injuries, internal
factors such as fatigue, neglect, lack of skills, and
lack of warming and stretching during exercise or
learning [20]. Then external factors such as poor
tools and facilities, poor weather, and mistreatment
of materials by teachers. One of the external factors
that is often forgotten by a teacher is the weather,
that is the temperature of the environment.
Temperatures in Indonesia generally range from 28-
34 degrees Celsius. According to Bompa lack of
knowledge about exercise and proper load addition,
incorrect posture on lifting, and weak abdominal
muscles are the cause of injury to children in sports
activities [6].
According to Hardianto Wibowo, Handling
Strain Injuries can be done as follows: 1) put the
patient in a comfortable position, rest the injured
part. Elevate the injured area. The goal is to reduce
excessive swelling, 2) give a cold compress, for 30
minutes, repeat every hour if necessary [9]. When a
new injury lasts, a blood vessel ruptures resulting in
the blood vessels in the surrounding tissue resulting
in swelling, the blood vessels around the injury site
will also widen in response to inflammation. Giving
cold compresses / ice will constrict blood vessels
widening so as to reduce swelling. Cold compress
can be done 1-2 times a day, not more than 20
minutes because it would interfere with blood
circulation. Conversely, when the injury is chronic,
inflammatory signs such as swelling, redness,
severe pain are gone, then the principle of warm
compresses can be done, 3) pressure bandage and
keep it elevated. Compress / emphasis on the injury,
can be done with bandages / bandaged. Do not be
too tight, the goal is to reduce swelling and keep
emphasis on being elevated. Press on the injured
area until the pain is gone (usually 7 to 10 days for
minor injuries and 3 to 5 weeks for severe injury If
needed, use a support stick when walking When in
doubt as a fracture do fot
II. METHODS
This type of research is an experimental
research. Experimental research can be interpreted
as a research method used to seek a certain
treatment against others in a controlled condition
[15]. The experimental design used is the pretest
and posttest design (one group pretest posttest
design)
According Suharsimi, that the variable is the
object of research, or what the point of attention of
a study. In this research there are two kinds of
variables that are independent variable and
dependent variable [16]. Independent variable is
independent more than one. Independent variable in
this research is massage effleurage reposition
traction.
The dependent variable is dependent variable or
dependent variable. As for the dependent variable in
this study is the ability of Range of Motion (ROM)
on knee injury. Sutrisno Hadi, which states that the
population is the entire population to be included for
investigation is called the population or universum
[18]. The population is limited as a number of
residents or individuals who have at least one
similar trait. The same characteristics of the
population are as follows: 1) BPPLOP athlete
Central Java, 2) gender of the son, 3) injured knee,
4) age 16-18 years. Based on these data, the
population in this study was the athlete of BPPLOP
son of Central Java who suffered knee injury as
many as 11 athletes.
The sample used in this research is athlete of
BPPLOP Jawa Tengah son who suffered injuries
and 8 knee ROM disturbances.
In this research, sampling technique using
purposive sampling of a group of subjects is based
on certain characteristics or traits that are deemed to
30
have a close relation to previously known
characteristics or population traits.
Research instruments are tools or facilities used
by researchers in collecting data for easier work and
better results, in a more accurate, complete and
systematic so easy to process [16]. Instruments used
in this research are: 1) hand and body lotion, small
towel, mat, book, pencil, goniometer. Hand and
body lotion is used for lubricant / lubricant during
massage. A small towel is used for tools while
tractioning and repositioning so that when pulling is
not slippery. Mattress is used for pedestal during
massage. Books and pencils are used to record the
results of measurements during pretest and post test.
Goniometer is used as a tool to measure the degree
of angle of joint movement.
The formula used to analyze the data using SPSS
version 21 through Paired Samples T Test. Test
paired samples t test or paired sample test that aims
to test the average difference of two groups of data
or paired samples. The way of decision making for
test paired samples t-test is: a) significance> 0.05
HO accepted, b) significance <0.05 HO rejected [8].
Paired Samples T Test requirements must first use
the normality test. The normality test is used to
determine whether the data has a normal
distribution. Normality tests were performed using
the Kolmogorof-Smirnov test. Decision-making for
normality test is: a) if significance> 0.05 then Ho is
accepted or data is normally distributed), b) if
significance <0.05 then Ho is rejected or data is not
normally distributed [8].
III. RESULT
Based on the results of data analysis obtained
can be seen that the provision of massage effleurage
has no significant effect although the sample has
increased ROM (Range Of Motion). This can be
seen when posttest results have increased from
pretest results. But when the result is tested with
Paired Sample T-Test using SPSS 21 with result of
sig value. (2-tailed) of 0.073> 0.05, since the sig
value. (2-tailed) of 0.073 greater than 0.05 it can be
concluded that there is no significant difference
between massage Effleurage to increase ROM
(Range Of Motion) on knee injury. Increased ROM
(Range Of Motion) on knee injury is influenced by
the treatment of massage effleurage. Massage
effleurage able to smooth blood circulation, relax
muscles, relieve pain. So that the knee injury
initially hard to bend because of muscle stiffness
and pain can be overcome by massage effleurage
method.
Massage effleurage method plus traction and
repositioning is the perfect combination to improve
ROM (Range Of Motion) on knee injury. This can
be reviewed from the function of each treatment.
massage effleurage able to smooth blood
circulation, relax muscles, relieve pain, so the
stiffness of muscle can be overcome by this method.
The function of repositioning traction is to restore
the position of the shifting joint to its original
position. Based on the function of both methods it
can be concluded that this method is suitable to
overcome the ROM (Range Of Motion) disorder on
knee injury.
IV. CONCLUSIONS AND SUGGESTIONS
Based on the results of research and discussion
it can be presented the following conclusions:
1) From Paired Sample T-Test test result using
SPSS 21 with sig value. (2-tailed) of 0.036 <0.05,
because the sig value. (2-tailed) of 0.036 smaller
than 0.05 it can be concluded that repositioning
trace effleurage massage can increase ROM (Range
Of Motion) on knee injury. So there is effect of
massage effleurage reposition traction on Range Of
Motion (ROM) on knee injury.
2) Massage efflaurage reposition traction has a
significant effect on ROM (Range Of Motion) on
knee injury. This method is perfect for handling
knee injuries that have ROM (Range Of Motion)
disorders.
A. SUGGESTION
Based on the above research conclusions,
suggestions that can be submitted by researchers
are:
1) The trainer can know how to properly handle the
knee injury. In addition it is expected the coach is
able to understand the condition of athletes so that
athletes do not get injured.
2) The athlete may know how to prevent injuries,
deal with injuries correctly, and treat injuries so that
injuries do not get worse.
REFERENCE
[1] Ali satya graha dan Bambang priyonoadi. 2012. Terapi
massage frirage. Penatalaksanaan Cedera pada Anggota
Tubuh Bagian Bawah. Yogyakarta: Klinik Terapi Fisik
UNY
[2] Andun Sudijandoko. (1999/2000). Perawatan Dan
Pencegahan Cedera. Jakarta: Depdikna
31
[3] Bahr, R. and I. Holme (2003). "Risk factors for sports
injuries—a methodological approach." British journal of
sports medicine 37(5): 38
[4] Bambang Trisno Wiyoto. 2011. Remedial Massage
Panduan Pijat Penyembuhan Bagi Fisioterapis, praktisi,
dan Infrastruktur. Yogyakarta: Nuha Medik
[5] Becker, J. 2005. Terapi Pijat Memijat Diri Sendiri Guna
Memperoleh Kesehatan Fisik dan Psikis. Terjemahan Agus
Supriyadi. 2007. Jakarta: PT. Prestasi Pustakary
[6] Bompa, Tudor O. (2000). Total Training for Young
Champions (dalam Yustinus Sukarmin.Jurnal). USA:
Human Kinetic
[7] Cava, G. La. 1995. Pengobatan dan Olahraga Bunga
Rampai. Semarang: Dahara Prize
[8] Duwi Priyatno. 2014.SPSS 22 Pengolahan Data
Terpraktis. Yogyakarta: Andi.
[9] Hardianto Wibowo.1994. pencegahan dan
penatalaksanaan cedera olahraga. Jakarta: EGC
[10] John V. Basmajian, 1980. Therapeutic exercise student
edition. Baltimore: Williams dan Wilkins Company.
[11] Murtaqib.”Perbedaan Latihan Range Of Mption (ROM)
Pasif dan Aktif Selama 1-2 Minggu Terhadap Peningkatan
Rentang Gerak Sendi Pada Penderita Stroke Di Kecamatan
Tanggul Kabupaten Jember”. Volume 8, No 1, Maret
2013:63.
[12] Novita Intan Arovah. 2010. Dasar-dasar Fisioterapi Pada
Cedera Olahraga. Yogyakarta
[13] Pfeiffer, R.P et al. 2009. Pertolongan Pertama dan
Pencegahan Cedera Olahraga. Terjemahan Huriawati
Hartanto. 2012. Jakarta: Erlangga
[14] Sarah U, dkk. Pengaruh Latihan Range Of Motion (Rom)
Terhadap Fleksibilitas Sendi Lutut Pada Lansia Di Panti
Wreda Wening Wardoyo Ungaran. Media Ners.Volume 1,
nomor 2, Oktober 2007:49.
[15] Sugiyono, 2010. Metode Penelitian Pendidikan. Bandung.
Alfabeta
[16] Suharsimi Arikunto. 2010. Prosedur Penelitian Suatu
Pendekatan Praktik. Jakarta: Rineka Cipta
[17] Susan J. Garison. 2001. Dasar-Dasar Terapi dan
Rehabilitasi Fisik. Jakarta: Hipokrates.
[18] Sutrisno Hadi. 2004. Statistik Jilid II. Yogyakarta: Andi
Offset.
[19] Stevenson, M. R., P. Hamer, et al. (2000). "Sport, age, and
sex specific incidence of sports injuries in Western
Australia." British journal of sports medicine 34(3): 188.
[20] Taylor, Paul M Dan Taylor, Diane K. (1997). Mencegah
Dan Mengatasi Cedera Olahraga. Jakarta: PT Raja
Grafindo Persada.
[21] Tommy Fondy. 2016. Sport Massage Panduan Praktis
Merawat dan Mereposisi Cedera. Jakarta: Gramedia
Pustaka Utama
[22] Van Mechelen, W., H. Hlobil, et al. (1992). "Incidence,
severity, aetiology and prevention of sports injuries. A
review of concepts." Sports Medicine (Auckland, NZ)
14(2): 82.
[23] http://eprints.undip.ac.id/46255/3/NadiaKurnia_22010111
130120_Bab2.pdf (diunduh pada tanggal 15 Mei 2017 jam
22.30)
[24] http://www.authorstream.com/Presentation/aSGuest12806
4-1346955-traksi-dalam-ortopedi/ (diunduh pada tanggal
16 Mei 2017 jam 22.20)
[25] https://www.google.co.id/search?q=anatomi+lutut&source
=lnms&tbm=isch&sa=X&ved=0ahUKEwin1Z2GnN7VA
hXDLI8KHeM6CEEQ_AUICigB&biw=1366&bih=672#i
mgrc=jxPiitF1ezvG1M:, diunduh diunduh tanggal 25-02-2017 jam 09.30
[26] http://www.health.com/health/library/mdp/0,,tp12880,00.
html (diunduh tanggal 25-02-2017 jam 09.00).
[27] https://id.wikipedia.org/wiki/Daftar_istilah_anatomi
(diunduh pada tanggal 15 Mei 2017 jam 22.30.
[28] http://library.usu.ac.id/download/fk/anatomi-fitriani.pdf
(diunduh pada tanggal 15 Mei 2017 jam 22.40)
[29] http://www.nlm.nih.gov/medlineplus/ency/imagepages/97
63.htm (diunduh pada tanggal 25-02-2017 jam 09.13).
[30] http://www.smartimagebase.com/knee-bones-with-
ligaments-anteriorlateral diunduh pada tanggal tanggal 25-
02-2017 jam 09.00).
[31] http://www.youcanbefit.com/ACL.html (diunduh tanggal
tanggal 25-02-2017 jam 09.10).
[32] www.lihat.co.id>KBBI>R (downloaded on May 16, 2017
at 22:27)
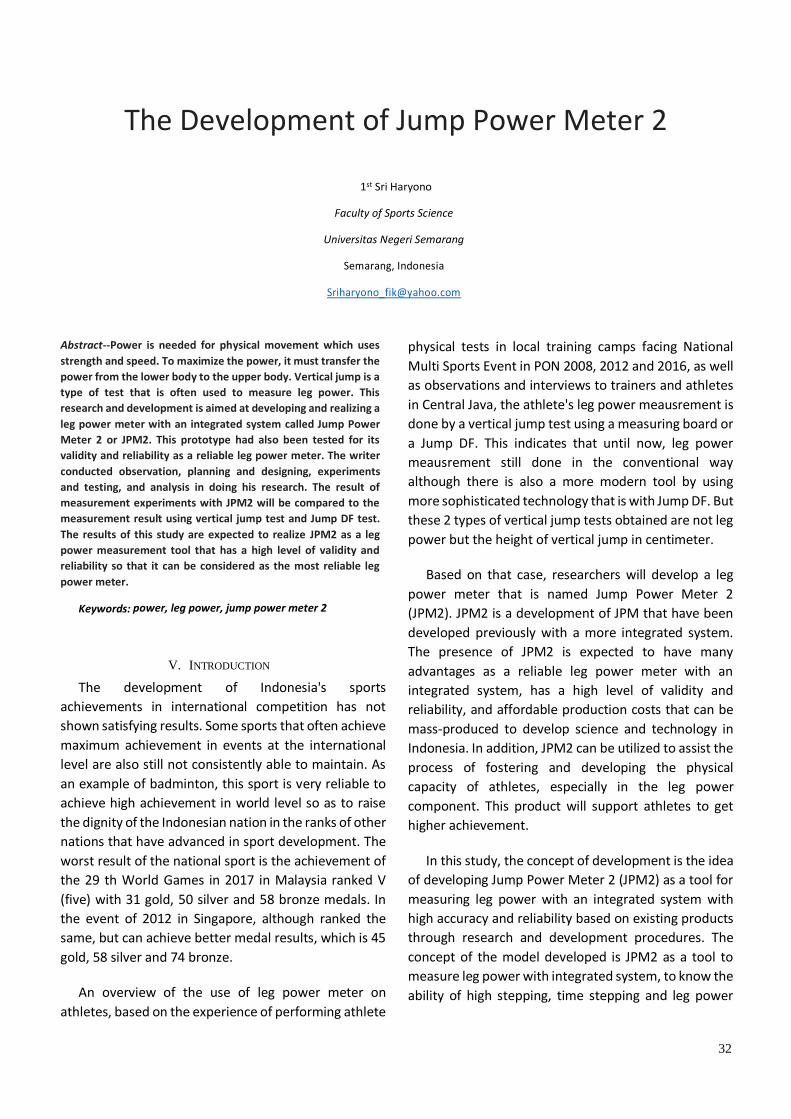
32
The Development of Jump Power Meter 2
1st Sri Haryono
Faculty of Sports Science
Universitas Negeri Semarang
Semarang, Indonesia
Abstract--Power is needed for physical movement which uses
strength and speed. To maximize the power, it must transfer the
power from the lower body to the upper body. Vertical jump is a
type of test that is often used to measure leg power. This
research and development is aimed at developing and realizing a
leg power meter with an integrated system called Jump Power
Meter 2 or JPM2. This prototype had also been tested for its
validity and reliability as a reliable leg power meter. The writer
conducted observation, planning and designing, experiments
and testing, and analysis in doing his research. The result of
measurement experiments with JPM2 will be compared to the
measurement result using vertical jump test and Jump DF test.
The results of this study are expected to realize JPM2 as a leg
power measurement tool that has a high level of validity and
reliability so that it can be considered as the most reliable leg
power meter.
Keywords: power, leg power, jump power meter 2
V. INTRODUCTION
The development of Indonesia's sports
achievements in international competition has not
shown satisfying results. Some sports that often achieve
maximum achievement in events at the international
level are also still not consistently able to maintain. As
an example of badminton, this sport is very reliable to
achieve high achievement in world level so as to raise
the dignity of the Indonesian nation in the ranks of other
nations that have advanced in sport development. The
worst result of the national sport is the achievement of
the 29 th World Games in 2017 in Malaysia ranked V
(five) with 31 gold, 50 silver and 58 bronze medals. In
the event of 2012 in Singapore, although ranked the
same, but can achieve better medal results, which is 45
gold, 58 silver and 74 bronze.
An overview of the use of leg power meter on
athletes, based on the experience of performing athlete
physical tests in local training camps facing National
Multi Sports Event in PON 2008, 2012 and 2016, as well
as observations and interviews to trainers and athletes
in Central Java, the athlete's leg power meausrement is
done by a vertical jump test using a measuring board or
a Jump DF. This indicates that until now, leg power
meausrement still done in the conventional way
although there is also a more modern tool by using
more sophisticated technology that is with Jump DF. But
these 2 types of vertical jump tests obtained are not leg
power but the height of vertical jump in centimeter.
Based on that case, researchers will develop a leg
power meter that is named Jump Power Meter 2
(JPM2). JPM2 is a development of JPM that have been
developed previously with a more integrated system.
The presence of JPM2 is expected to have many
advantages as a reliable leg power meter with an
integrated system, has a high level of validity and
reliability, and affordable production costs that can be
mass-produced to develop science and technology in
Indonesia. In addition, JPM2 can be utilized to assist the
process of fostering and developing the physical
capacity of athletes, especially in the leg power
component. This product will support athletes to get
higher achievement.
In this study, the concept of development is the idea
of developing Jump Power Meter 2 (JPM2) as a tool for
measuring leg power with an integrated system with
high accuracy and reliability based on existing products
through research and development procedures. The
concept of the model developed is JPM2 as a tool to
measure leg power with integrated system, to know the
ability of high stepping, time stepping and leg power
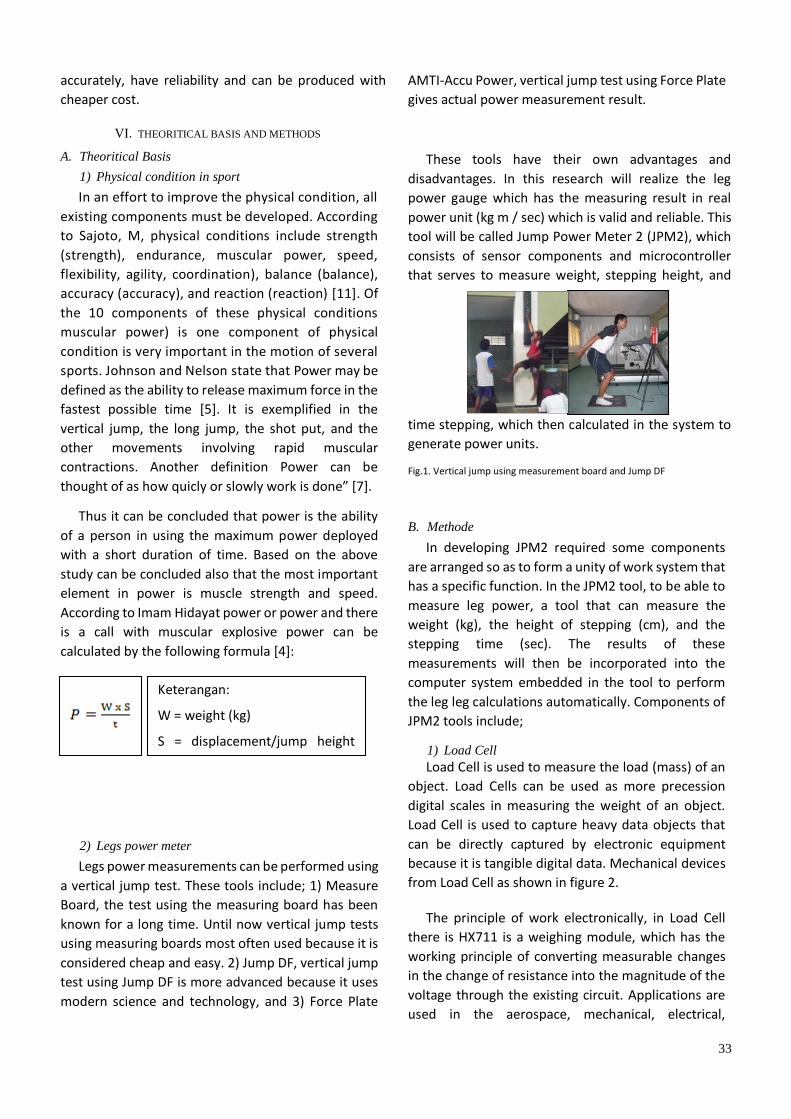
33
accurately, have reliability and can be produced with
cheaper cost.
VI. THEORITICAL BASIS AND METHODS
A. Theoritical Basis
1) Physical condition in sport
In an effort to improve the physical condition, all
existing components must be developed. According
to Sajoto, M, physical conditions include strength
(strength), endurance, muscular power, speed,
flexibility, agility, coordination), balance (balance),
accuracy (accuracy), and reaction (reaction) [11]. Of
the 10 components of these physical conditions
muscular power) is one component of physical
condition is very important in the motion of several
sports. Johnson and Nelson state that Power may be
defined as the ability to release maximum force in the
fastest possible time [5]. It is exemplified in the
vertical jump, the long jump, the shot put, and the
other movements involving rapid muscular
contractions. Another definition Power can be
thought of as how quicly or slowly work is done” [7].
Thus it can be concluded that power is the ability
of a person in using the maximum power deployed
with a short duration of time. Based on the above
study can be concluded also that the most important
element in power is muscle strength and speed.
According to Imam Hidayat power or power and there
is a call with muscular explosive power can be
calculated by the following formula [4]:
2) Legs power meter
Legs power measurements can be performed using
a vertical jump test. These tools include; 1) Measure
Board, the test using the measuring board has been
known for a long time. Until now vertical jump tests
using measuring boards most often used because it is
considered cheap and easy. 2) Jump DF, vertical jump
test using Jump DF is more advanced because it uses
modern science and technology, and 3) Force Plate
AMTI-Accu Power, vertical jump test using Force Plate
gives actual power measurement result.
These tools have their own advantages and
disadvantages. In this research will realize the leg
power gauge which has the measuring result in real
power unit (kg m / sec) which is valid and reliable. This
tool will be called Jump Power Meter 2 (JPM2), which
consists of sensor components and microcontroller
that serves to measure weight, stepping height, and
time stepping, which then calculated in the system to
generate power units.
Fig.1. Vertical jump using measurement board and Jump DF
B. Methode
In developing JPM2 required some components
are arranged so as to form a unity of work system that
has a specific function. In the JPM2 tool, to be able to
measure leg power, a tool that can measure the
weight (kg), the height of stepping (cm), and the
stepping time (sec). The results of these
measurements will then be incorporated into the
computer system embedded in the tool to perform
the leg leg calculations automatically. Components of
JPM2 tools include;
1) Load Cell
Load Cell is used to measure the load (mass) of an
object. Load Cells can be used as more precession
digital scales in measuring the weight of an object.
Load Cell is used to capture heavy data objects that
can be directly captured by electronic equipment
because it is tangible digital data. Mechanical devices
from Load Cell as shown in figure 2.
The principle of work electronically, in Load Cell
there is HX711 is a weighing module, which has the
working principle of converting measurable changes
in the change of resistance into the magnitude of the
voltage through the existing circuit. Applications are
used in the aerospace, mechanical, electrical,
Keterangan:
W = weight (kg)
S = displacement/jump height (m)
t = time (sec)
P = power (kg m/sec)
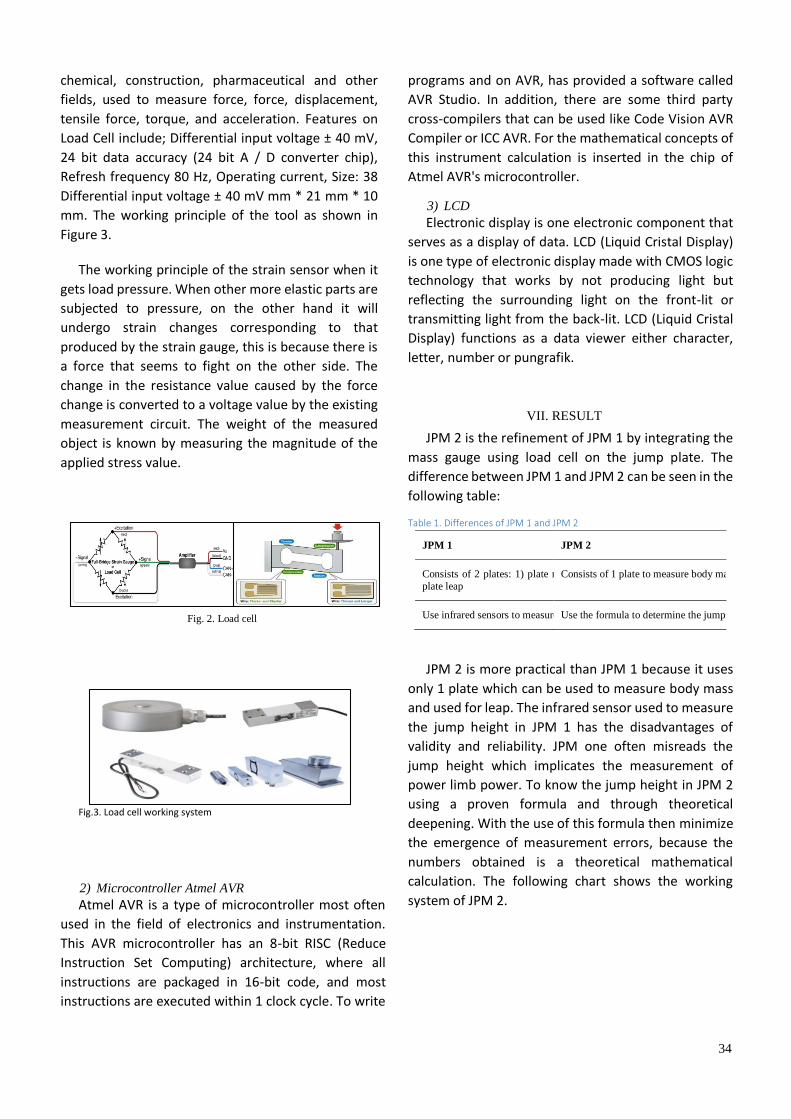
34
chemical, construction, pharmaceutical and other
fields, used to measure force, force, displacement,
tensile force, torque, and acceleration. Features on
Load Cell include; Differential input voltage ± 40 mV,
24 bit data accuracy (24 bit A / D converter chip),
Refresh frequency 80 Hz, Operating current, Size: 38
Differential input voltage ± 40 mV mm * 21 mm * 10
mm. The working principle of the tool as shown in
Figure 3.
The working principle of the strain sensor when it
gets load pressure. When other more elastic parts are
subjected to pressure, on the other hand it will
undergo strain changes corresponding to that
produced by the strain gauge, this is because there is
a force that seems to fight on the other side. The
change in the resistance value caused by the force
change is converted to a voltage value by the existing
measurement circuit. The weight of the measured
object is known by measuring the magnitude of the
applied stress value.
Fig. 2. Load cell
Fig.3. Load cell working system
2) Microcontroller Atmel AVR
Atmel AVR is a type of microcontroller most often
used in the field of electronics and instrumentation.
This AVR microcontroller has an 8-bit RISC (Reduce
Instruction Set Computing) architecture, where all
instructions are packaged in 16-bit code, and most
instructions are executed within 1 clock cycle. To write
programs and on AVR, has provided a software called
AVR Studio. In addition, there are some third party
cross-compilers that can be used like Code Vision AVR
Compiler or ICC AVR. For the mathematical concepts of
this instrument calculation is inserted in the chip of
Atmel AVR's microcontroller.
3) LCD
Electronic display is one electronic component that
serves as a display of data. LCD (Liquid Cristal Display)
is one type of electronic display made with CMOS logic
technology that works by not producing light but
reflecting the surrounding light on the front-lit or
transmitting light from the back-lit. LCD (Liquid Cristal
Display) functions as a data viewer either character,
letter, number or pungrafik.
VII. RESULT
JPM 2 is the refinement of JPM 1 by integrating the
mass gauge using load cell on the jump plate. The
difference between JPM 1 and JPM 2 can be seen in the
following table:
Table 1. Differences of JPM 1 and JPM 2
JPM 1 JPM 2
Consists of 2 plates: 1) plate mass body gauge and 2)
plate leap
Consists of 1 plate to measure body mass as well as jump plate
Use infrared sensors to measure jump height Use the formula to determine the jump height
JPM 2 is more practical than JPM 1 because it uses
only 1 plate which can be used to measure body mass
and used for leap. The infrared sensor used to measure
the jump height in JPM 1 has the disadvantages of
validity and reliability. JPM one often misreads the
jump height which implicates the measurement of
power limb power. To know the jump height in JPM 2
using a proven formula and through theoretical
deepening. With the use of this formula then minimize
the emergence of measurement errors, because the
numbers obtained is a theoretical mathematical
calculation. The following chart shows the working
system of JPM 2.
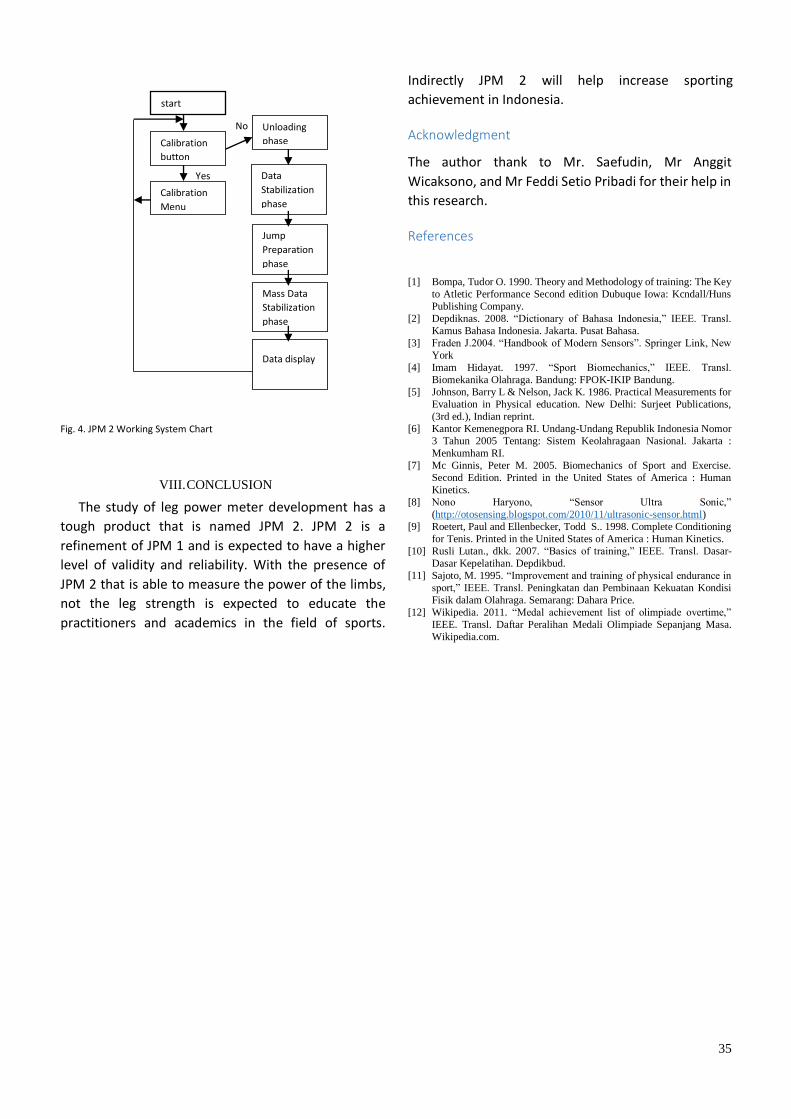
35
Fig. 4. JPM 2 Working System Chart
VIII. CONCLUSION
The study of leg power meter development has a
tough product that is named JPM 2. JPM 2 is a
refinement of JPM 1 and is expected to have a higher
level of validity and reliability. With the presence of
JPM 2 that is able to measure the power of the limbs,
not the leg strength is expected to educate the
practitioners and academics in the field of sports.
Indirectly JPM 2 will help increase sporting
achievement in Indonesia.
Acknowledgment
The author thank to Mr. Saefudin, Mr Anggit
Wicaksono, and Mr Feddi Setio Pribadi for their help in
this research.
References
[1] Bompa, Tudor O. 1990. Theory and Methodology of training: The Key
to Atletic Performance Second edition Dubuque Iowa: Kcndall/Huns
Publishing Company.
[2] Depdiknas. 2008. “Dictionary of Bahasa Indonesia,” IEEE. Transl.
Kamus Bahasa Indonesia. Jakarta. Pusat Bahasa.
[3] Fraden J.2004. “Handbook of Modern Sensors”. Springer Link, New
York
[4] Imam Hidayat. 1997. “Sport Biomechanics,” IEEE. Transl.
Biomekanika Olahraga. Bandung: FPOK-IKIP Bandung.
[5] Johnson, Barry L & Nelson, Jack K. 1986. Practical Measurements for
Evaluation in Physical education. New Delhi: Surjeet Publications,
(3rd ed.), Indian reprint.
[6] Kantor Kemenegpora RI. Undang-Undang Republik Indonesia Nomor
3 Tahun 2005 Tentang: Sistem Keolahragaan Nasional. Jakarta :
Menkumham RI.
[7] Mc Ginnis, Peter M. 2005. Biomechanics of Sport and Exercise.
Second Edition. Printed in the United States of America : Human
Kinetics.
[8] Nono Haryono, “Sensor Ultra Sonic,”
(http://otosensing.blogspot.com/2010/11/ultrasonic-sensor.html)
[9] Roetert, Paul and Ellenbecker, Todd S.. 1998. Complete Conditioning
for Tenis. Printed in the United States of America : Human Kinetics.
[10] Rusli Lutan., dkk. 2007. “Basics of training,” IEEE. Transl. Dasar-
Dasar Kepelatihan. Depdikbud.
[11] Sajoto, M. 1995. “Improvement and training of physical endurance in
sport,” IEEE. Transl. Peningkatan dan Pembinaan Kekuatan Kondisi
Fisik dalam Olahraga. Semarang: Dahara Price.
[12] Wikipedia. 2011. “Medal achievement list of olimpiade overtime,”
IEEE. Transl. Daftar Peralihan Medali Olimpiade Sepanjang Masa.
Wikipedia.com.
start
Calibration
button
Calibration
Menu
Unloading
phase
Data
Stabilization
phase
Jump
Preparation
phase
Mass Data
Stabilization
phase
Data display
Yes
No
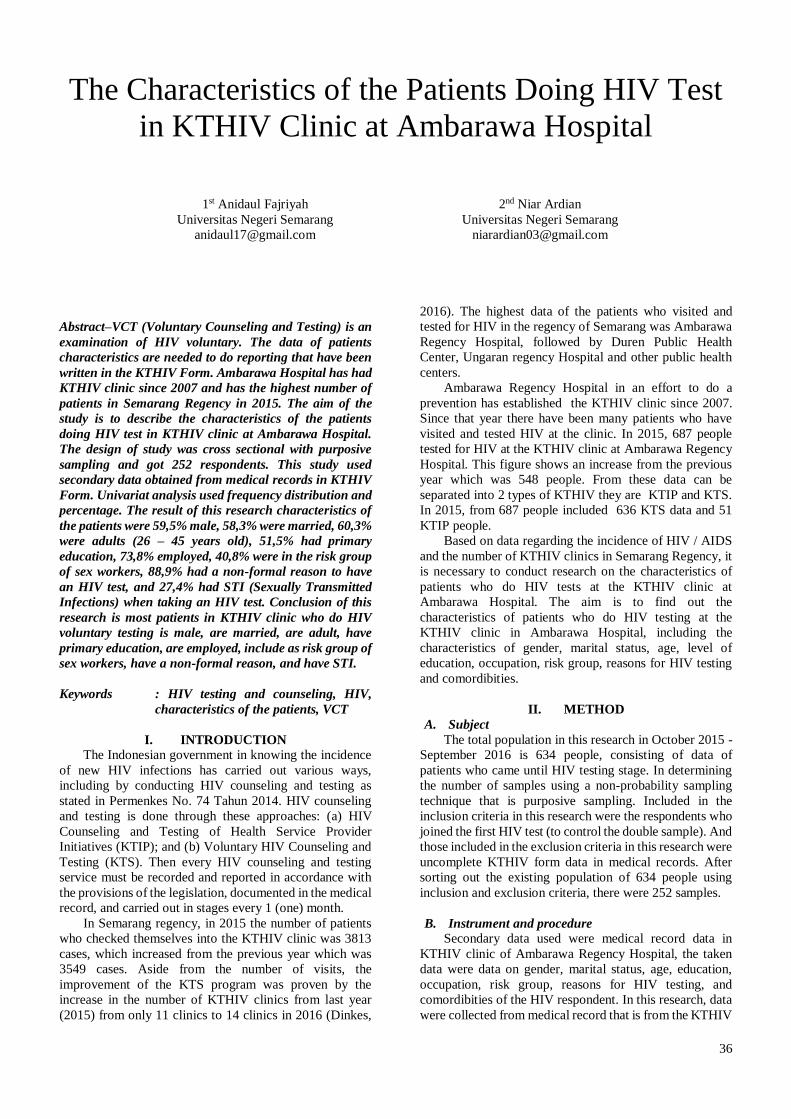
36
The Characteristics of the Patients Doing HIV Test
in KTHIV Clinic at Ambarawa Hospital
1st Anidaul Fajriyah
Universitas Negeri Semarang
2nd Niar Ardian
Universitas Negeri Semarang
Abstract–VCT (Voluntary Counseling and Testing) is an
examination of HIV voluntary. The data of patients
characteristics are needed to do reporting that have been
written in the KTHIV Form. Ambarawa Hospital has had
KTHIV clinic since 2007 and has the highest number of
patients in Semarang Regency in 2015. The aim of the
study is to describe the characteristics of the patients
doing HIV test in KTHIV clinic at Ambarawa Hospital.
The design of study was cross sectional with purposive
sampling and got 252 respondents. This study used
secondary data obtained from medical records in KTHIV
Form. Univariat analysis used frequency distribution and
percentage. The result of this research characteristics of
the patients were 59,5% male, 58,3% were married, 60,3%
were adults (26 – 45 years old), 51,5% had primary
education, 73,8% employed, 40,8% were in the risk group
of sex workers, 88,9% had a non-formal reason to have
an HIV test, and 27,4% had STI (Sexually Transmitted
Infections) when taking an HIV test. Conclusion of this
research is most patients in KTHIV clinic who do HIV
voluntary testing is male, are married, are adult, have
primary education, are employed, include as risk group of
sex workers, have a non-formal reason, and have STI.
Keywords : HIV testing and counseling, HIV,
characteristics of the patients, VCT
I. INTRODUCTION
The Indonesian government in knowing the incidence
of new HIV infections has carried out various ways,
including by conducting HIV counseling and testing as
stated in Permenkes No. 74 Tahun 2014. HIV counseling
and testing is done through these approaches: (a) HIV
Counseling and Testing of Health Service Provider
Initiatives (KTIP); and (b) Voluntary HIV Counseling and
Testing (KTS). Then every HIV counseling and testing
service must be recorded and reported in accordance with
the provisions of the legislation, documented in the medical
record, and carried out in stages every 1 (one) month.
In Semarang regency, in 2015 the number of patients
who checked themselves into the KTHIV clinic was 3813
cases, which increased from the previous year which was
3549 cases. Aside from the number of visits, the
improvement of the KTS program was proven by the
increase in the number of KTHIV clinics from last year
(2015) from only 11 clinics to 14 clinics in 2016 (Dinkes,
2016). The highest data of the patients who visited and
tested for HIV in the regency of Semarang was Ambarawa
Regency Hospital, followed by Duren Public Health
Center, Ungaran regency Hospital and other public health
centers.
Ambarawa Regency Hospital in an effort to do a
prevention has established the KTHIV clinic since 2007.
Since that year there have been many patients who have
visited and tested HIV at the clinic. In 2015, 687 people
tested for HIV at the KTHIV clinic at Ambarawa Regency
Hospital. This figure shows an increase from the previous
year which was 548 people. From these data can be
separated into 2 types of KTHIV they are KTIP and KTS.
In 2015, from 687 people included 636 KTS data and 51
KTIP people.
Based on data regarding the incidence of HIV / AIDS
and the number of KTHIV clinics in Semarang Regency, it
is necessary to conduct research on the characteristics of
patients who do HIV tests at the KTHIV clinic at
Ambarawa Hospital. The aim is to find out the
characteristics of patients who do HIV testing at the
KTHIV clinic in Ambarawa Hospital, including the
characteristics of gender, marital status, age, level of
education, occupation, risk group, reasons for HIV testing
and comordibities.
II. METHOD
A. Subject
The total population in this research in October 2015 -
September 2016 is 634 people, consisting of data of
patients who came until HIV testing stage. In determining
the number of samples using a non-probability sampling
technique that is purposive sampling. Included in the
inclusion criteria in this research were the respondents who
joined the first HIV test (to control the double sample). And
those included in the exclusion criteria in this research were
uncomplete KTHIV form data in medical records. After
sorting out the existing population of 634 people using
inclusion and exclusion criteria, there were 252 samples.
B. Instrument and procedure
Secondary data used were medical record data in
KTHIV clinic of Ambarawa Regency Hospital, the taken
data were data on gender, marital status, age, education,
occupation, risk group, reasons for HIV testing, and
comordibities of the HIV respondent. In this research, data
were collected from medical record that is from the KTHIV
37
form. When collecting data, the researcher used a table
format prepared by the researcher. Secondary data was
obtained by recaping the medical record data of KTHIV
clinic patient.
C. Statistic and analysis
data in this reasearch are data that can be used to
describe the respondent's data / characteristics obtained
from medical record documents. In this analysis, the data is
distributed into frequency distributions and percentages.
III. RESULT AND DISCUSSION
The results of the research were recap of medical
record data in the form of characteristics of sex, marital
status, age, education, occupation, risk group, reasons for
HIV testing, and comordibities. Patient characteristics are
presented in several tables below.
TABLE 1. Characteristics of sex
Sex Perecentage (%)
Male
Female
59,5
40,5
Male susceptibility to HIV infection is caused by
negative behaviors such as buying commercial sex
services, and injecting drug user. Men have a high risk
because having high mobility and away from wives
(Umam, 2015). This is similar with data from the
Directorate General of PP and PL of the Ministry of Health
of the Republic of Indonesia (2014), that the number of
people infected with HIV is higher in the male than female.
Based on table 1, the results of the research show that
the ratio of male gender characteristics is higher (59.1%),
which is 150 of the total 252 respondents. This can be
caused by the negative behavior of men so that they have a
higher susceptibility than women. Negative behaviors that
can cause susceptability included using alternate needles
for injecting drug user and tattooing. In addition, because
men are the head of the family who have the responsibility
to earn money for the family, they have high mobility and
are far from their wives. With this in mind, to meet their
biological needs as long as they are far from their wives
they have the option to buy commercial sex services.
Another reason is that from the KTHIV clinic Ambarawa
Hospital also has a program to conduct counseling on the
importance of HIV testing with the target of prison inmates
where most of them are male, who generally have tattoos.
The results of this research are in accordance with the
research held at Simpang Tiga (Riau) Public Health Center,
that most of the patients who visited and HIV test at the
KTHIV clinic were men (51.2%). Male susceptability to
HIV infection is caused by negative behaviors such as
buying commercial sex services, and Injecting Drug User.
Men have a high risk can be due to having high mobility
and away from wives [1].
TABLE 2. Marital Status
Marital Status Percentage (%)
Marry 58,3
Single 36,5
Divorce 4,4
Divorce by death 0,8
Ministry of Health's Directorate General of PP & PL
(2013) stated that when HIV-infected men marry, will have
the risk of transmitting HIV to their wives after having
unprotected sexual intercourse or without using condoms.
Based on the table of research results (table 2), shows
that the characteristics of marital status are sorted from the
highest, from marital status of 147 respondents (58.3%),
then the next sequence is the unmarried (single) status
(36.5%), divorce (4,4%) and in the last order is the divorce
by the death (0.8%). The results of this research have been
in accordance with the research conducted by Syahrir, et al.
(2013), in the City of Makassar, that out of 133 samples
that had a marital status is 88.7%[6].
In another research stated that married men and
women are susceptible to HIV infection. This is because
HIV transmission occurs through direct contact between
the deep skin layer (mucous membrane) or blood
circulation with HIV-infected body fluids [2].
It can be concluded that with marital status it will
increase the risk of transmitting HIV to their partners,
because when they are having sexual intercourse the
husband and wife don’t use condom to get descent and
because of that, it can make it possible that the baby being
infected with HIV.
TABLE 3. Age
Age Percentage (%)
Adolescent 25
Adult 60,3
Elderly 13,9
Seniors 0,8
Based on the theory and results of the existing
research, researchers revealed that in the age of adolescents
and adults have similarities, that is have a high risk of HIV
if having unsafe sex and oftenly change partners and other
risky behavior.
Based on the table of the results of the research(table
3) shows that the 252 respondents most of them were adults
(26 - 45 years) as many as 60.3%. The results of this
research are in accordance with the research that has been
held at the Duren Public Health Center, where most of
those who joined KTS test were adults as much as 71.8%
[2]. In addition, the results of the study of patients who
conducted HIV testing at the KTHIV clinic at Ambarawa
Hospital were in accordance with the incidence of HIV in
Indonesia in 2014, where the highest infection was in
adulthood (69.1%), followed by adolescent age groups
(17,2%) and the last is geriatrics (5.5%) (DG PP & PL,
2014)
Respondents who are in the category of adult (26 - 45
years) are more likely to have an HIV test than those who
are not because of their maturity in thinking of being able
to face and adapt to something new. In addition, because at
this age is sexually active and includes fertile age. At the
age of 26 - 45 years, they also understand the benefits of
having an HIV test, that respondents realize that they are
having risk ofHIV infection.
TABLE 4. Education
Education Percentage (%)
Never got education 1,6
Primary education 51,6
Secondary education 42,1
Higher education 4,8
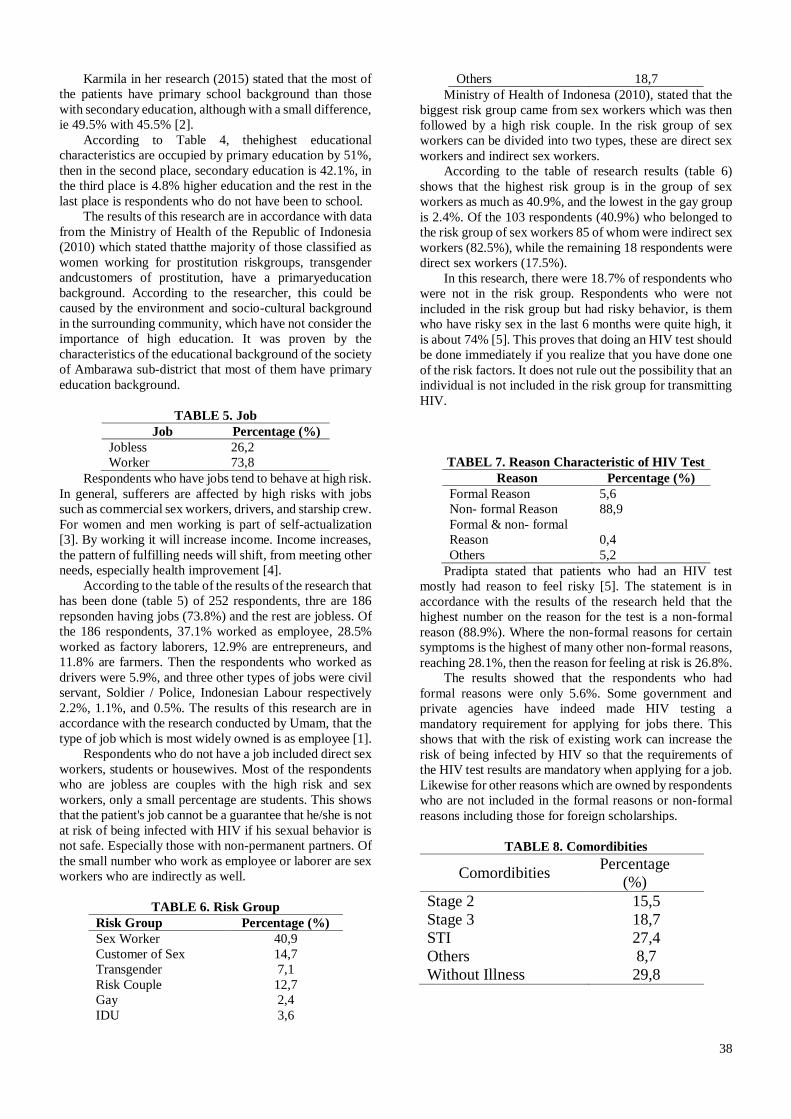
38
Karmila in her research (2015) stated that the most of
the patients have primary school background than those
with secondary education, although with a small difference,
ie 49.5% with 45.5% [2].
According to Table 4, thehighest educational
characteristics are occupied by primary education by 51%,
then in the second place, secondary education is 42.1%, in
the third place is 4.8% higher education and the rest in the
last place is respondents who do not have been to school.
The results of this research are in accordance with data
from the Ministry of Health of the Republic of Indonesia
(2010) which stated thatthe majority of those classified as
women working for prostitution riskgroups, transgender
andcustomers of prostitution, have a primaryeducation
background. According to the researcher, this could be
caused by the environment and socio-cultural background
in the surrounding community, which have not consider the
importance of high education. It was proven by the
characteristics of the educational background of the society
of Ambarawa sub-district that most of them have primary
education background.
TABLE 5. Job
Job Percentage (%)
Jobless 26,2
Worker 73,8
Respondents who have jobs tend to behave at high risk.
In general, sufferers are affected by high risks with jobs
such as commercial sex workers, drivers, and starship crew.
For women and men working is part of self-actualization
[3]. By working it will increase income. Income increases,
the pattern of fulfilling needs will shift, from meeting other
needs, especially health improvement [4].
According to the table of the results of the research that
has been done (table 5) of 252 respondents, thre are 186
repsonden having jobs (73.8%) and the rest are jobless. Of
the 186 respondents, 37.1% worked as employee, 28.5%
worked as factory laborers, 12.9% are entrepreneurs, and
11.8% are farmers. Then the respondents who worked as
drivers were 5.9%, and three other types of jobs were civil
servant, Soldier / Police, Indonesian Labour respectively
2.2%, 1.1%, and 0.5%. The results of this research are in
accordance with the research conducted by Umam, that the
type of job which is most widely owned is as employee [1].
Respondents who do not have a job included direct sex
workers, students or housewives. Most of the respondents
who are jobless are couples with the high risk and sex
workers, only a small percentage are students. This shows
that the patient's job cannot be a guarantee that he/she is not
at risk of being infected with HIV if his sexual behavior is
not safe. Especially those with non-permanent partners. Of
the small number who work as employee or laborer are sex
workers who are indirectly as well.
TABLE 6. Risk Group
Risk Group Percentage (%)
Sex Worker 40,9
Customer of Sex 14,7
Transgender 7,1
Risk Couple 12,7
Gay 2,4
IDU 3,6
Others 18,7
Ministry of Health of Indonesa (2010), stated that the
biggest risk group came from sex workers which was then
followed by a high risk couple. In the risk group of sex
workers can be divided into two types, these are direct sex
workers and indirect sex workers.
According to the table of research results (table 6)
shows that the highest risk group is in the group of sex
workers as much as 40.9%, and the lowest in the gay group
is 2.4%. Of the 103 respondents (40.9%) who belonged to
the risk group of sex workers 85 of whom were indirect sex
workers (82.5%), while the remaining 18 respondents were
direct sex workers (17.5%).
In this research, there were 18.7% of respondents who
were not in the risk group. Respondents who were not
included in the risk group but had risky behavior, is them
who have risky sex in the last 6 months were quite high, it
is about 74% [5]. This proves that doing an HIV test should
be done immediately if you realize that you have done one
of the risk factors. It does not rule out the possibility that an
individual is not included in the risk group for transmitting
HIV.
TABEL 7. Reason Characteristic of HIV Test
Reason Percentage (%)
Formal Reason 5,6
Non- formal Reason 88,9
Formal & non- formal
Reason
0,4
Others 5,2
Pradipta stated that patients who had an HIV test
mostly had reason to feel risky [5]. The statement is in
accordance with the results of the research held that the
highest number on the reason for the test is a non-formal
reason (88.9%). Where the non-formal reasons for certain
symptoms is the highest of many other non-formal reasons,
reaching 28.1%, then the reason for feeling at risk is 26.8%.
The results showed that the respondents who had
formal reasons were only 5.6%. Some government and
private agencies have indeed made HIV testing a
mandatory requirement for applying for jobs there. This
shows that with the risk of existing work can increase the
risk of being infected by HIV so that the requirements of
the HIV test results are mandatory when applying for a job.
Likewise for other reasons which are owned by respondents
who are not included in the formal reasons or non-formal
reasons including those for foreign scholarships.
TABLE 8. Comordibities
Comordibities Percentage
(%)
Stage 2 15,5
Stage 3 18,7
STI 27,4
Others 8,7
Without Illness 29,8
39
Comordibities when doing the HIV test is a disease
that has been suffered by respondents at this time. In this
research, comorbidities were classified into several types,
according to the stage of the AIDS disease itself, sexually
transmited disease, and the last is other diseases.
For STI disease, which is mostly suffered by 27.4% of
respondents, Syphilis is 21.7% and GO disease is 18.8%,
the rest are other STI diseases. This shows that the biggest
risk factor in the transmission of HIV infection is sexual
intercourse. The risk group that had experienced the most
STI symptoms in the past year was sex workers (31%)
(Ministry Of Health of Republic Indonesia, 2010).
In third stage of the disease that mostly affects
respondents is TB (Tuberculosis), which is 45.7%. Patients
who have TB disease are among the at-risk populations
along with prisoners, pregnant women, migrants, sex
worker customers and partners of PLWHA (People Living
with HIV AIDS) (WHO, 2011).
According to the results of research conducted almost
one third of the total respondents, as many as 29.8% did not
have the disease. This shows that the respondent done an
HIV test is not only because he had suffered from an illness.
There are still many respondents who do the HIV test
because they already have high knowledge so that their
self-awareness is high as well, especially those who are
susceptible to the HIV infection.
IV. CONCLUSION
Based on the results of research on the characteristics
of patients who done HIV testing at the KTHIV clinic
Ambarawa regency Hospital with a sample of 252
respondents, it can be concluded that all people have the
risk of infected by HIV if they have done HIV risk behavior
regardless of gender, marital status, age, education and
occupation. It does not even rule out the possibility that if
someone does not belong to the risk group category, they
will not be infected with HIV as long as they do a safe
behavioral. Not looking at the reasons and suffering from
any diseases that are owned, if you feel at risk you should
immediately do an HIV test. Because by doing that, it will
soon be revealed how far the spread of HIV, so that
prevention and treatment can be done (for those who are
declared positive) quickly and accurately.
REFERENCES
[1] Umam, Husnulet al. “IdentifikasiKarakteristik Orang RisikoTinggi HIV dan AIDS tentang Program Pelayanan
Voluntary Counselling and Testing (KTHIV)”. Universitas Riau; JomVol 2 No 1, Februari 2015.
[2] Karmila, Sri. “GambaranKarakteristikIndividu yang MelakukanKunjungan Voluntary Counselling Test (KTHIV) di
Wilayah KerjaPuskesmas Duren KecamatanBandunganKabupaten Semarang Tahun 2015”.UniversitasNgudiWaluyo.
[3] Djoerban. “HIV/AIDS di Indonesia dalamBuku Ajar IlmuPenyakitDalamJilid III Edisi V”. Jakarta:
DepartemenIlmuPenyakitDalam FKUI. 2011
[4] Widyastuti Y.“Kesehatan Reproduksi”. Yogyakarta: Fitramaya. 2009
[5] Pradipta, Setia. “GambaranEpidemiologiPengunjungKlinik KTHIV PuskesmasKecamatanGambir, Jakarta
PusatTahun 2011”.Universitas Indonesia. 2011
[6] Syahrir, Wahyunita, et al.“Faktor yang Berhubungan dengan Pemanfaatan Klinik Voluntary Counseling and Testing
(KTHIV) di Puskesmas Kota Makassar”.UniversitasHasanuddin. 2014
40
Adolescent Experience In Dealing With Kids
Transition to Puberty in 33 Junior High School
Semarang
1st Herlin Fitriyanti
Public Health Magister Program Semarang State University
Semarang, Indonesia
2nd Rose Nurhudhariani
Institute of Health Science Karya Husada Semarang
Semarang, Indonesia
3rd Anita Indra Afriani
Institute of Health Science Karya Husada Semarang
Semarang, Indonesia
Abstract— The problem that most teenagers consulted on
MCR at puberty , is problems related to physical changes 27 %
, concerns 16 % during puberty , puberty as early adolescence
10.1 % , and the emotional state of 7.6 % , By digging the
adolescent experience in dealing with child's transition into
puberty will find various kinds of physical and psychological
responses to them. The purpose of this study was to explore
attitudes , the support of parents , constraints and impact in the
face of the child transition into puberty. This study used a
qualitative method with phenomenological approach. The Data
was obtained through in-depth interviews. Number of
participants 4 students of 33 Junior High School Semarang
aged 10-14 years who are currently studying in Class VIII
bench. Triangulation in this study were parents and teachers
Guidance. All participants felt afraid when other people pay
attention to the changes experienced during puberty include a
sense of wanting to be alone, bored, imbalance movements,
emotions rising, uncooperative and loss of confidence. Support
parents by giving credence to the role and puberty to participate
in making decisions, communicating with provide an
understanding of puberty . The obstacles are puberty yet fully
understand what to do during the child's transition to puberty ,
due to the limited reproductive health education related to
child's transition to puberty . The impact in the face of the child
transition into puberty in male students - male sex high curiosity
marked with the tell - mails and pornographic pictures bullyng
female students . Female students lost confidence as a result of
physical changes and ignorant male student - male in children
at puberty leaving the child felt inferior.
Keywords— Juvenile, Puberty, Transition
I. INTRODUCTION
The smallest percentage of physical aspects of adolescent behavior regarding physical condition was 48.4%. This indicates that there are still many students who have poor knowledge, judgment and expectations about physical change. Using the Check Problem List (DCM) indicates a negative self-concept in students. This can be seen in the behavior of students who feel insecure with their physical possessions, arises between friends mockery about physical form that
causes students to become insecure in socializing, as well as the existence of behavior that is not in accordance with the ethics and values prevailing in the school or in the community [10].
One psychological aspect of changes in the body during puberty is that teenagers are worried about their body and forming a self-image of how their body is, maybe they look into the mirror every day and sometimes every hour to see if you detect something different about their body change, anxiety about a person's body image is strong during adolescence, but specifically acute during puberty when adolescents feel more dissatisfied with their bodies compared to late adolescence [9].
Puberty is a period when the development of children changes from asexuals to sexual beings. While puberty is a stage in development where there is maturity of sexual tools and achieving reproductive abilities. The most common criteria used to determine the onset of puberty are first menstruation in girls and nighttime wet dreams for boys[3]. Puberty is a sequence of transformations from a child to a young adult, with secondary sexual characteristics and reproductive abilities[2].
Experience can also be interpreted as episodic memory, which is the memory that receives and stores events that occur or are experienced by individuals at a particular time and place, which serves as an autobiographical referenceExperience is something that cannot be separated from everyday human life[1].
Attitude is the most important concept in social psychology which addresses the elements of attitude both as individuals and groups. Much research has been conducted on attitudes related to effects and
41
their role in character building and the system of relationships between groups and choices determined by the environment and their effects on change [8]. Experts formulate that puberty is used to express both form and physiological biological changes that occur rapidly from childhood to adulthood, especially changes in reproductive organs, while the term adolescence emphasizes psychosocial changes or maturity that accompanies puberty [6].
II. MATERIALS AND METHODS
a. Subject
In this study using 4 participants in 33 Junior High School Semarang students. Determination of the number of participants as many as 4 people was determined or limited because the data that the researchers got had reached saturation in the 4th participant. The selection of participants in this study uses purposive sampling method. The source triangulation in this study was concelor teacher and participant parents..
b. Instrument and Procedure
This type of research is qualitative research, namely
research conducted to obtain answers or in-depth
interview about one's opinions and feelings that make
it possible to get implied things about the attitudes,
beliefs, motivations and behavior of teenagers in 33
Junior High School Semarang. The approach used in
this study is phenomenology, where this approach is
defined as subjective experience and one's perspective
awareness of various types and types of subjects
encountered.
c. Statistical and analysis
Data analysis in this study uses qualitative analysis
by analyzing content or discussion content. Transcribe
the results of interview recordings about adolescents
about adolescent experiences, adolescent attitudes,
constraints and impacts in the face of children's
transition to puberty. Processing units of sound and
image recordings to detail the complexity of the reality
in the section. Researchers listen, write, read and study
carefully all types of data that has been collected, then
identify teenagers about their experiences in dealing
with children to puberty and enter into index cards.
Coding or categorizing, looking for patterns and
proportions of research, interpreting data, evaluating
interpretations . Data credibility is obtained through
data validity testing methods. The validity of the form
of the boundary is related to a certainty that the
measured is really the variable to be measured.
III. RESULT AND DISCUSSION
In-depth interviews are one of the qualitative data collection, where interviews are conducted between participants and the interviewer which is marked by deep excavations using open interviews about the impact of early marriage on reproductive health in adolescents. There were 4 participants in this study, namely An. R (P1), An. S (P2), An. M (P3), An. A (P4) and triangulation participants as many as 3 people, namely Ny. T (T1) as a concelor teacher at school and from one of the participant's parents, Mrs. T (T2), Mrs. D (T3).
Research on processing raw data that has been collected by writing words according to records and recordings that researchers have obtained. Next, the researcher looks at several times and is presented in search of keywords then makes a category then the researcher classifies keywords that contain predetermined categories.
Exploring the attitudes of adolescents in the face of children's transition to puberty Based on interviews with four participants. Participants 1, 2, 3 and 4 said that feeling embarrassed, shocked, closed and emotionally elevated due to the physical changes they experienced during puberty. Explore parental support in the face of child transition to puberty Based on interviews with four participants. All participants said that parents gave advice in the form of not going out, wearing loose clothes, careful - getting along and not falling into cigarettes, alcohol and sex [4,5].
Exploring obstacles in facing the transition of children to puberty Based on interviews with four participants all participants experienced obstacles in realizing expectations during puberty, among others, namely environmental influences, fear of telling the teacher if for example the time of counseling about the transition of children to puberty does not understand and many activities feel themselves busy.
Exploring the impact of dealing with the child's transition to puberty Based on the interviews, the four participants said that they were now familiar with body changes like that, and were not as worried as they once were. Although sometimes still feeling strange to yourself, still need more understanding about puberty [7].
IV. CONCLUSION
Attitudes of adolescents in facing the transition of
children to puberty include a feeling of wanting to be
alone, feeling bored, not willing to cooperate, rising
emotions, loss of confidence and fear when other
people pay attention to changes experienced by
puberty. Support parents in facing the transition of
children to puberty by giving the role and trust in
puberty to be involved in family decision making
related to the transition of children to puberty, giving
understanding of puberty to children from an early
age, communication between parents and children
42
regarding the transition of children to puberty goes
well and parents become friends near puberty. The
transition of children to puberty is puberty does not
fully understand what to do during the transition to
puberty, due to the limitations of reproductive health
counseling related to the transition of children to
puberty. The impact in dealing with the transition of
children to puberty in male students of high sex
curiosity is characterized by sending submission of
pornographic images and female students. Female
students lost self-confidence as a result of physical
changes and were male students in female students
during puberty resulting in female students feeling
inferior.
REFERENCE
[1] Daehler, et.al. 2010. Cognitive Development fisrt edition. New York : Alfred A.Knopf.
[2] Hacker, N.F.Cervical Cancer. In: Berek, J.S., Nacker, N.F. Practical GynecologyOncology. 14th Ed. Philadelphia: Lippincot Williams & Wilkins,337 - 395.
[3] Hurlock. 2010. Psikologi Perkembangan : Suatu Pendekatan Sepanjang Rentang Kehidupan. Jakarta : Erlangga
[4] Janiwarty, Bethsaida. 2014. Pendidikan Psikologi untuk Bidan Suatu Teori dan Terapannya. Yogyakarta : Andi Offset.
[5] Moleong, J. Dr. Lexy. 2010. Metodologi Penelitian Kualitatif. Bandung : CV. Remadja Karya.
[6] Poltekkes Depkes Jakarta I. 2010. Kesehatan Remaja Problem Dan Solusinya. Jakarta : Salemba Medika.
[7] Proverawati dan Misaroh.2009.Menarche Menstruasi Pertama Penuh Makna.Yogyakarta:Nuha Medika.
[8] Wawan, A dan Dewi, M. 2010. Teori dan pengukuran Pengetahuan, sikap dan perilaku Manusia. Yogyakarta : Nuha Medika.
[9] Santrock J. W. 2010. Perkembangan Remaja (trans). Jakarta : Erlangga
[10] Yulianto, H. 2012. Program bimbingan pribadi-sosial untuk mengembangkan konsep diri siswa (studi deskriptif terhadap siswa kelas X SMA Negeri 24 Bandung Tahun Ajaran 2011-2012.

43
Food Intake Relationship with Duration of
Inpatient Care at Sinjai Regional General Hospital
1st Satriani
Public Health Universitas Negeri Semarang
Semarang, Indonesia
2nd Wawan Iskandar
Public Health Universitas Negeri Semarang
Semarang, Indonesia
3rdNurhasanah Azis
Semarang, Indonesia [email protected]
Abstract—Food services at the Hospital
are an integral part of the entire hospital service
system which aims to achieve recovery of patients
in the shortest possible time so that feeding must
meet the requirements of nutritional needs and
must be consumed by patients . This research was
carried out in the Inpatient Section of Sinjai
District Regional General Hospital in 2016. This
type of research was observational with a cross
sectional study approach with the aim of finding
out the relationship, knowledge, eating habits,
taste of food, and length of treatment in
hospitalized patients. The sample of this study
were inpatients with purphosive sampling as
many as 142 samples. The results showed that
knowledge was associated with length of
treatment with p value (0,000) <0,05, eating
habits associated with length of treatment with p
value (0,000) 0,05, food taste was associated
with length of treatment with p value (0,000)
<0.05. It is expected that patients to get used to
consuming various types of foods that contain
balanced nutrition according to their needs and
varied menu and taste of foods that are expected
to increase the appetite of patients so that the
fulfillment of nutritional needs as part of the
healing process can be fulfilled. It is suggested to
the next researcher to continue this research by
observing other variables related to the title.
Keywords—Food Intake, Duration of
Care, Knowledge, Eating Habits, Taste of Food
I.INTRODUCTION
Hospital nutrition services are an integral
part of the entire hospital service system which aims
to achieve recovery of patients in the shortest
possible time so that the provision of food must meet
the requirements of nutritional needs and must be
consumed out by patients Syamsuddin (1995) found
that the provision of nutrients optimal in hospital
patients is very useful in reducing the period of
treatment and speeding healing reduces
complications reducing mortality and improving the
nutritional status of patients [3] The prevalence of malnutrition in hospitals
according to Mosner and Bader (2008) ranged from
30% -50%. Observations in 351 patients treated in
Australian public hospitals found 45% with low Hb,
35% low Albumen, and 24% reduced body weight.
This also happened in the observation of 13 patients
in teaching hospitals in America and Asia, found
48% lack of Nutrition intake, 37 of whom were
treated more than 2 weeks, 78% decreased upper
arm circumference, 70% lost weight and albumin
decreased on average 0.5 gr / dl [8]. Malnutrition is a problem in hospitalized
patients in the last fifteen years. Research conducted
by Galghar Allred (1996) that data on malnutrition
shows 40-50% of patients are malnourished or have
a risk of malnutrition, 12% of them are severe
malnutrition, 48% mild malnutrition, acute
nutritional status of patients has increased after 2
weeks, and increased up to 69%, of the total patients
with severe and mild malnutrition during hospital
care. Based on data from the Directorate of
Community Nutrition Research and Development,
out of 171 government hospitals there were 40% of
patients, stated that the food provided by the hospital
did not meet nutritional adequacy [5] The most common types of diseases that
affect the decline in nutritional status are liver
disease (hepatitis cirrhosis) as many as 16 people
(43%), kidney failure as many as 11 people (29%),
and the remaining 10 people with cancer. The type
of diet given to cirrhosis, chronic renal failure and
cancer was that some of the samples received the
form of soft foods as many as 31 people (83%) the
rest in the form of ordinary food. Food intake
containing energy with a median of 1240.65 calories
up to 427.06 while energy intake obtained a median
of 44.63 grams to 15.78 grams. Energy intake is
based on patient needs and hospital food diet
standards with a median of 62.03% of needs and a
median of 82.57% standard. While the percentage of
patient protein intake was obtained by a median of
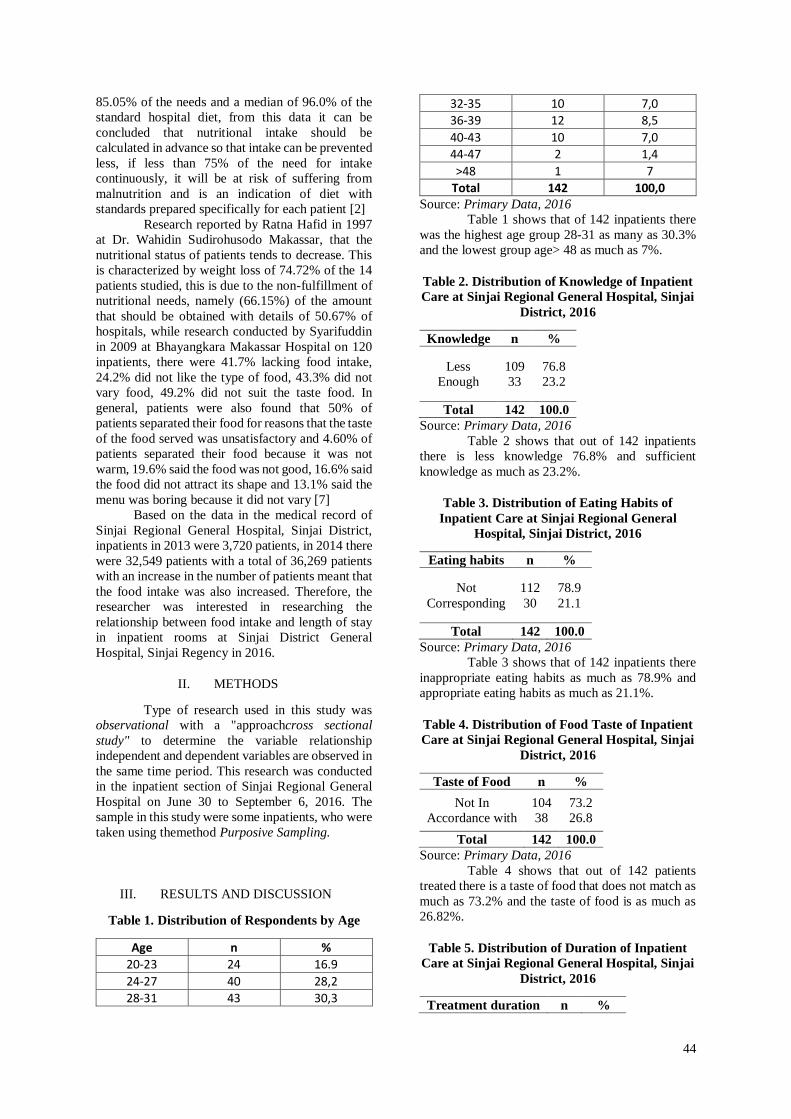
44
85.05% of the needs and a median of 96.0% of the
standard hospital diet, from this data it can be
concluded that nutritional intake should be
calculated in advance so that intake can be prevented
less, if less than 75% of the need for intake
continuously, it will be at risk of suffering from
malnutrition and is an indication of diet with
standards prepared specifically for each patient [2] Research reported by Ratna Hafid in 1997
at Dr. Wahidin Sudirohusodo Makassar, that the
nutritional status of patients tends to decrease. This
is characterized by weight loss of 74.72% of the 14
patients studied, this is due to the non-fulfillment of
nutritional needs, namely (66.15%) of the amount
that should be obtained with details of 50.67% of
hospitals, while research conducted by Syarifuddin
in 2009 at Bhayangkara Makassar Hospital on 120
inpatients, there were 41.7% lacking food intake,
24.2% did not like the type of food, 43.3% did not
vary food, 49.2% did not suit the taste food. In
general, patients were also found that 50% of
patients separated their food for reasons that the taste
of the food served was unsatisfactory and 4.60% of
patients separated their food because it was not
warm, 19.6% said the food was not good, 16.6% said
the food did not attract its shape and 13.1% said the
menu was boring because it did not vary [7] Based on the data in the medical record of
Sinjai Regional General Hospital, Sinjai District,
inpatients in 2013 were 3,720 patients, in 2014 there
were 32,549 patients with a total of 36,269 patients
with an increase in the number of patients meant that
the food intake was also increased. Therefore, the
researcher was interested in researching the
relationship between food intake and length of stay
in inpatient rooms at Sinjai District General
Hospital, Sinjai Regency in 2016.
II. METHODS
Type of research used in this study was
observational with a "approachcross sectional
study" to determine the variable relationship
independent and dependent variables are observed in
the same time period. This research was conducted
in the inpatient section of Sinjai Regional General
Hospital on June 30 to September 6, 2016. The
sample in this study were some inpatients, who were
taken using themethod Purposive Sampling.
III. RESULTS AND DISCUSSION
Table 1. Distribution of Respondents by Age
Age n %
20-23 24 16.9
24-27 40 28,2
28-31 43 30,3
32-35 10 7,0
36-39 12 8,5
40-43 10 7,0
44-47 2 1,4
>48 1 7
Total 142 100,0 Source: Primary Data, 2016
Table 1 shows that of 142 inpatients there
was the highest age group 28-31 as many as 30.3%
and the lowest group age> 48 as much as 7%.
Table 2. Distribution of Knowledge of Inpatient
Care at Sinjai Regional General Hospital, Sinjai
District, 2016
Knowledge n %
Less Enough
109 33
76.8 23.2
Total 142 100.0 Source: Primary Data, 2016
Table 2 shows that out of 142 inpatients
there is less knowledge 76.8% and sufficient
knowledge as much as 23.2%.
Table 3. Distribution of Eating Habits of
Inpatient Care at Sinjai Regional General
Hospital, Sinjai District, 2016
Eating habits n %
Not Corresponding
112 30
78.9 21.1
Total 142 100.0 Source: Primary Data, 2016
Table 3 shows that of 142 inpatients there
inappropriate eating habits as much as 78.9% and
appropriate eating habits as much as 21.1%.
Table 4. Distribution of Food Taste of Inpatient
Care at Sinjai Regional General Hospital, Sinjai
District, 2016
Taste of Food n %
Not In Accordance with
104 38
73.2 26.8
Total 142 100.0 Source: Primary Data, 2016
Table 4 shows that out of 142 patients
treated there is a taste of food that does not match as
much as 73.2% and the taste of food is as much as
26.82%.
Table 5. Distribution of Duration of Inpatient
Care at Sinjai Regional General Hospital, Sinjai
District, 2016
Treatment duration n %
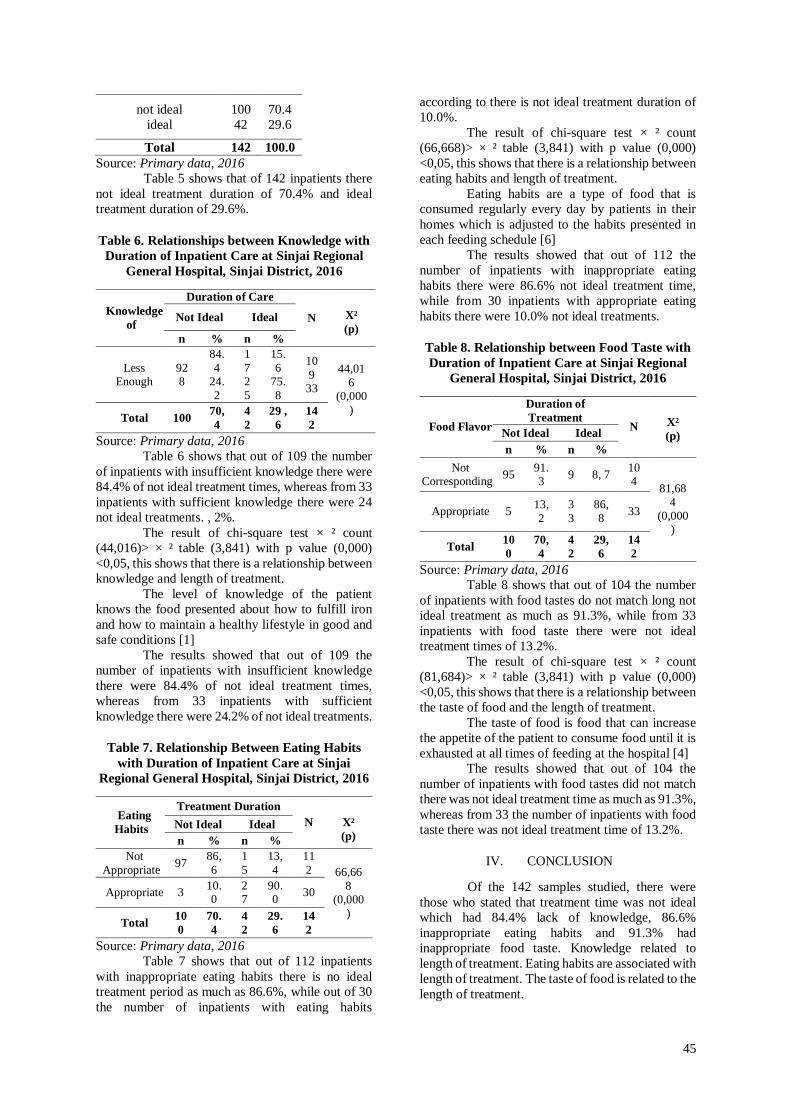
45
not ideal ideal
100 42
70.4 29.6
Total 142 100.0 Source: Primary data, 2016
Table 5 shows that of 142 inpatients there
not ideal treatment duration of 70.4% and ideal
treatment duration of 29.6%.
Table 6. Relationships between Knowledge with
Duration of Inpatient Care at Sinjai Regional
General Hospital, Sinjai District, 2016
Knowledge
of
Duration of Care
N
X² (p)
Not Ideal Ideal
n % n %
Less Enough
92 8
84.
4 24.
2
1
7 2
5
15.
6 75.
8
10
9 33
44,01
6 (0,000
) Total 100 70,
4 4
2 29 ,
6 14
2 Source: Primary data, 2016
Table 6 shows that out of 109 the number
of inpatients with insufficient knowledge there were
84.4% of not ideal treatment times, whereas from 33
inpatients with sufficient knowledge there were 24
not ideal treatments. , 2%. The result of chi-square test × ² count
(44,016)> × ² table (3,841) with p value (0,000)
<0,05, this shows that there is a relationship between
knowledge and length of treatment. The level of knowledge of the patient
knows the food presented about how to fulfill iron
and how to maintain a healthy lifestyle in good and
safe conditions [1] The results showed that out of 109 the
number of inpatients with insufficient knowledge
there were 84.4% of not ideal treatment times,
whereas from 33 inpatients with sufficient
knowledge there were 24.2% of not ideal treatments.
Table 7. Relationship Between Eating Habits
with Duration of Inpatient Care at Sinjai
Regional General Hospital, Sinjai District, 2016
Eating
Habits
Treatment Duration N
X² (p)
Not Ideal Ideal n % n %
Not
Appropriate 97 86,
6 1
5 13,
4 11
2 66,66
8 (0,000
)
Appropriate 3 10.0
27
90.0 30
Total 10
0 70.
4 4
2 29.
6 14
2 Source: Primary data, 2016
Table 7 shows that out of 112 inpatients
with inappropriate eating habits there is no ideal
treatment period as much as 86.6%, while out of 30
the number of inpatients with eating habits
according to there is not ideal treatment duration of
10.0%. The result of chi-square test × ² count
(66,668)> × ² table (3,841) with p value (0,000)
<0,05, this shows that there is a relationship between
eating habits and length of treatment. Eating habits are a type of food that is
consumed regularly every day by patients in their
homes which is adjusted to the habits presented in
each feeding schedule [6] The results showed that out of 112 the
number of inpatients with inappropriate eating
habits there were 86.6% not ideal treatment time,
while from 30 inpatients with appropriate eating
habits there were 10.0% not ideal treatments.
Table 8. Relationship between Food Taste with
Duration of Inpatient Care at Sinjai Regional
General Hospital, Sinjai District, 2016
Food Flavor
Duration of
Treatment N
X² (p) Not Ideal Ideal
n % n % Not
Corresponding 95 91.3 9 8, 7 10
4 81,68
4 (0,000
)
Appropriate 5 13,
2 3
3 86,
8 33
Total 10
0 70,
4 4
2 29,
6 14
2 Source: Primary data, 2016
Table 8 shows that out of 104 the number
of inpatients with food tastes do not match long not
ideal treatment as much as 91.3%, while from 33
inpatients with food taste there were not ideal
treatment times of 13.2%. The result of chi-square test × ² count
(81,684)> × ² table (3,841) with p value (0,000)
<0,05, this shows that there is a relationship between
the taste of food and the length of treatment. The taste of food is food that can increase
the appetite of the patient to consume food until it is
exhausted at all times of feeding at the hospital [4] The results showed that out of 104 the
number of inpatients with food tastes did not match
there was not ideal treatment time as much as 91.3%,
whereas from 33 the number of inpatients with food
taste there was not ideal treatment time of 13.2%.
IV. CONCLUSION
Of the 142 samples studied, there were
those who stated that treatment time was not ideal
which had 84.4% lack of knowledge, 86.6%
inappropriate eating habits and 91.3% had
inappropriate food taste. Knowledge related to
length of treatment. Eating habits are associated with
length of treatment. The taste of food is related to the
length of treatment.
46
REFERENCES [1] A. Hartono, Prinsip-Prinsip Keperawatan.
Yogyakarta: Yayasan Essentia Medika, 1996.
[2] Badan Penelitian dan Pengembangan Kesehatan, “Laporan Tahunan Gizi Tahun 2005.
[3] Departemen Kesehatan RI, “Pedoman Pelayanan Gizi Rumah Sakit,” 2006.
[4] Forum Koordinasi Jaringan Informasi Pangan dan Gizi., “Kiat Mengelola Rumah Sakit,” Gizi Baik Modal Kehidup. Mns., vol. Volume X, p. Hal. 2 – 5, 2002.
[5] S. Moehji, Pengaturan Makanan Institusi dan Diit Untuk Penyembuhan Penyakit. Jakarta: PT. Gramedia Pustaka Utama, 1982.
[6] S. Moehji, Ilmu Gizi dan Penanggulangan Gizi Buruk. Jakarta: Bharata, 2003.
[7] Subaeda, “Faktor Yang Berhubungan Dengan Asupan Makanan di Rawat Inap Rumah Sakit Umum Daerah Kabupaten Bulukumba,” 2007.
[8] Y. Ilyas, Kinerja (Teori Penilaian dan Penelitian Pusat Kajian Ekonomi Kesehatan), Cetakan Ke. Jakarta: FKM UI, 2001.
47
Environmental Factors on Spreading Filariasis Disease on Demak Coast
1st Rudatin Windraswara
Dept. of Public Health
Universitas Negeri Semarang
Semarang, Indonesia
2nd Dyah Mahendrasari Sukendra
Dept. of Public Health
Universitas Negeri Semarang
Semarang, Indonesia
3rd Ririn Wardhani
Dept. of Public Health
Universitas Negeri Semarang
Semarang, Indonesia
Filariasis is an endemic infectious disease in
Indonesia. Endemicity of filariasis was shown by
Demak district with mf rate was >1% in 2016.
Purpose of this research is to describe of
environmental (physics, biology, and social) in
endemic filariasis area. The result showed that
average distance of the biological environment
(garden plant, puddle rob, mangrove plants, open
sewerage, garbage inundated, and cattle pen) from
the house was <10 m.
Keywords: Filariasis, Environmental.
V. INTRODUCTION
Lymphatic filariasis is an infectious disease that
attacks lymph nodes with symptoms of lymphangitis
and lymphadenitis caused by filarial worms (Brugia
malayi, Brugia timori, and Wuchereria Bancrofti) and
is transmitted by mosquitoes (WHO, 2013).
Bedono village is a coastal area bordering the Java
Sea and has an area of 551,673 Ha. Administratively,
Bedono Village is divided into 5 hamlets, 5 RW and
23 RT and its territory is included in the lowland
because it is located at an altitude of 0-3 mdpl. Most
of Bedono Village area consists of wetland (pond) of
490,673 Ha, protected forest with area 166,876 Ha,
and settlement area is only 61 Ha (Government of
Bedono Village, 2017). In the preliminary study
results during March 2017, it was found that Bedono
village has environmental characteristics that are
mostly overgrown with mangrove and bush
vegetation (75%), puddles of rob in surrounding
houses (70%), chicken cages around mangrove plants
(10%), and ditch / open ditch (100%).
In addition, in Bedono Village area there has been
an extreme environmental change due to conversion
of mangrove forests for land clearing and
environmental pollution. Reduced mangrove forests
(since 2006) are known to have resulted in extreme
environmental changes such as abrasion that drowned
two hamlets (in 2009) and the emergence of vector-
borne disease (2016). Environmental changes such as
loss of mangrove vegetation are known to cause the
migration of mosquito habitat from mangrove forests
to settlements so that the behavior of mosquitoes
looking for blood also changes (Kemenkes 2011).
Mangrove forests are known to be vector-borne
diseases such as mangroves have a canopy that
protects mosquito larvae from breeding into mosquito
habitats (Putra et al., 2015). Because of the
environmental changes, the distribution of
mosquitoes is suspected to be uncontrollable. In
addition, mosquitoes could potentially be vector
filariasis since mosquitoes have invasive properties
(capable of widespread in new environments)
(Manguin, 2011).
2 METHOD
The research was conducted in Bedono Village,
Sayung District, Demak District with 1,081 families,
divided into 5 villages, Bedono, Morosari,
Mondoliko, Pandansari, Tonosari, and Tambaksari
Hamlet. This research was conducted for one month
since May II (11-20) to June II (11-20).
This study used descriptive study with
observational type and cross sectional design.
Sources of data in this study are secondary data and
primary data. Secondary data in the form of filariasis
case report (obtained from infectious disease report of
Demak District Health Office 2016 and Sayung I
Health Center) and data on rainfall (obtained from
BMKG 2017). Primary data comes from observations
about the physical and biological environment as well
as interviews related to the social environment during
the study.
The research instruments used in this research are
measurement sheet, observation, and questionnaire
sheet. The measurement sheets are used to record the
48
measurements of the physical environment
(temperature, humidity, and rainfall) and the
biological environment (garden plants, puddles,
mangroves, open SPALs, waste in puddles, and cattle
stables).
3 RESULT AND DISCUSSION
a. Biological Environment
The biological environment described in this
research is in the form of condition of yard plant,
mangrove plant, puddle rob, open SPAL, chicken
livestock pen, and garbage with water. It is known
that the average distance between the biological
environment (garden plants, mangroves, puddle rob,
open spal, chicken litter, and garbage) with a
population of <10 m. The distance of the yard plant is
in accordance with the research by Sipayung (2014)
that the yard plant found in the majority filariasis
endemic area is 0-500 m from the house. While the
distance of mangrove plants is in accordance with
research by Kurniawan (2008) that the average
distance of mangrove plants in the coastal area is 0-
200 m from the settlement. The puddle distance is
similar to that of Wulandhari (2015) that the average
pipe in Pekalongan City as endemic area is 0-10 m
from the house. The gap opening distance is similar
to that of Ginandjar (2008) that in Muaro Jambi
district as filariasis endemic areas have an average
gap of 0-100 m. While chicken and litter cages are the
same as Ardias's research, et. al (2013) that the
majority of the population in filariasis endemic areas
have cattle and trash cages 0-10 m from home.
The biological environment spacing of <10 m is a
vulnerability to filariasis transmission due to the
average mosquito flight distance of 0-3 km from the
blood-searching site (MOH RI, 2007; Tsuda, et al.,
2008; Okorie, 2014). However, the flying distance of
the mosquito can be as far as> 30 m from where the
blood is sought by the wind speed factor (Kusnanto,
2013). In addition to wind speed, the type of
biological environment in the form of yard plants can
affect the presence of filariasis vector, considering the
type of garden plants (trees and shrubs) is the
preferred place for mosquitoes to rest (Manimegalai,
2014).
While close proximity of mangroves (<100 m) to
households causes the risk of filariasis vector bites to
increase as mangroves can be a breeding ground for
mosquitoes. On the contrary, if the distance of
mangrove plant is far from settlement (> 100 m) then
mangrove plants can change function as protection of
vector borne disease. This is because the mangrove
plant provides a habitat for mosquitoes so that
mosquitoes can be localized to residential areas. The
statement is supported by Putra et. al (2015) which
mentions that mangrove plants can become immunity
vector borne disease diseases such as malaria because
mangroves have a canopy that is able to protect the
breeding of mosquito larvae to become a habitat when
adult mosquitoes. Loss of mangrove function as
protection of vector borne disease (filariasis, malaria,
dengue) can be caused by land clearing so mosquitoes
move habitat to settlement (Kemenkes, 2011).
In the biological environment, a puddle of rob
which is <10 m from the house is known to be at risk
of mosquito bites as it is closer to the mosquito
breeding area. Inundation with 0.2-18% salt is known
to be a breeding ground for mosquitoes such as
Anopheles sp (Jude, et al., 2012; Pratama, 2015),
Aedes sp (Jude, et al., 2012; Arduino, et al., 2015),
and Culex sp (Jude, et al., 2012; Saputri, 2015).
In addition to the salinity conditions, the
characteristics of the inundation pools found in the
village Bedono is overgrown with water plants and
clumps of fish. The existence of a water plant in the
form of catfish (Lemna sp) makes the puddle of rob
can not be used as a place for mosquito breeding due
to water plants type catfish eye (Lemna sp) makes the
mosquito larvae can not live because Lemna sp
releases substances capable of causing perforation in
larvae so that larvae can not survival (Tariq, M, et al.,
2009). In addition, the existence of the clump fish
makes the mosquito larvae can not survive because
the clump fish are known to eat mosquito larvae
(Manguin, et al., 2011). The existence of these
conditions causes a rob pool with water-planting
characteristics and the predators have no potential as
potential vector filariasis habitat. However, in the rob
pools that are not overgrown with catfish and
predatory fish can be used to breed mosquitoes.
While the presence of open drains within <100 m
can be at risk of mosquito bites since open ditches are
potential habitat of filariasis vector (Culex sp)
(Misrha, 2014). In addition to Culex sp. Mosquitoes,
Anopheles sp and Aedes sp mosquitoes are also
known to be able to breed in gullies (Arana-Guardia,
et al., 2014; Naeem, et al., 2015). Sewers may be used
by mosquitoes to breed because the gut provides
provides a place for female mosquitoes to ovoposit
(Arana-Guardia, et al., 2014). Therefore, it is
necessary to eradicate mosquito breeding such as
maintaining the smooth flow of sewer water from
blockage (eg garbage) so as not to stagnate.
49
The existence of livestock enclosures with a mean
distance of <10 m is known to increase the potential
for transmission of filariasis disease since cattle pens
can be used for mosquitoes to rest (Mishra, et al.,
2014). In addition, temperatures and humidity in
livestock enclosures that are compatible with
mosquito breeding, cattle pens may potentially be
potential habitat of filariasis vectors (Dhimal, et al.,
2014). While the presence of waste contained in
puddles may increase the risk of mosquito bites due
to waterlogged waste is one potential habitat of
aquatic mosquitoes phase with a minimum volume of
5 cc (Higa, et al, 2010).
b. Distribution of Filariasis
Vector by Temperature, Humidity,
and Rainfall
Based on the results of the study, it is known that the mosquitoes are caught in Bedono village at 25-300C with peak temperature caught at 29,50C. These results are similar to Sukendra's (2016) study which states that Culex sp mosquitoes caught in Pekalongan City as filariasis endemic areas are present at 27-300C. The temperature is known to be the optimal temperature for the development of several species of mosquitoes such as Culex sp (in the range 26-300C) (Okorie, et al., 2014), Aedes aegypti (temperature range 24-270C) (Puspawati, 2012), and Anopheles sp ( temperature range 25-300C) (Beck-Johnson, L., et.al, 2013). Due to the condition of air temperature in Bedono village as filariasis endemic area support activity of mosquito bites, hence needed strategy to avoid mosquito bites like repelent use mosquito repellent.
Changes in environmental conditions found in filariasis endemic area of Bedono Village is indicated by the decreasing of mangrove forest and abrasion phenomenon that drowns the land and sweeps the ponds. The existence of environmental changes is known to affect the temperature and humidity environment. In the Donatoa study, et. al. (2012) mentions that the reduction of mangrove vegetation by 0.7% causes an increase in carbon emissions by 10% which will affect the temperature rise of 0.0190C. Increased temperatures and decreased moisture can cause some types of mosquitoes to adapt and have an increased durability (Manguin, et al., 2011). Therefore, at the location of the research (Bedono Village) has a moisture that supports the activity of mosquitoes, the mosquitoes can move to bite optimally. For that, the strategy needed to avoid mosquito bites like the use of anti-mosquito drugs.
4 CONCLUSIONS The conclusions of this research are physical
condition such as temperature, humidity and rainfall in filariasis endemic area of Bedono Village during May-June 2017, ie temperature, humidity and rainfall in medium / tropical category. The existing social environment in filariasis endemic area of Bedono Village in 2017 is known that most respondents have average night-out habits at 23.00-24.00 with kind of activities chatting on home terrace, fishing, keep post pilgrimage ticket, and eat.
Suggestions from this research are for Bedono Village community should clean up the potential environment of mosquito breeding (open SPAL and waste water puddle), protect mosquito bites (wear mosquito repellent lotion, wear shirt and trousers) when out at night -20.00 and 23.0-03.00), and reduced nighttime activities outside the home with mangrove vegetation.
REFERENCES Ambarita, L. P., Taviv, Y., Sitorus, H., Pahlepi, R. I.,
Kasnodihardjo.2014. Perilaku Masyarakat
terkait Penyakit Kaki Gajah dan Program
Pengobatan Massal di Kecamatan
Pemayung Kabupaten Batanghari, Jambi.
Media Litbangkes.24(4):191 – 198
Arana-Guardia, R., Baak-Baak, C. M., Loroño-Pino,
M. A., Machain-Williams, C., Beaty, B. J.,
Eisen, L., & García-Rejón, J. E. 2014.
Stormwater Drains and Catch Basins as
Sources for Production of Aedes aegypti and
Culex quinquefasciatus. Acta Tropica. 134.
33–42.
http://doi.org/10.1016/j.actatropica.2014.01
.011
Ardias, Setiani, O. Hanani, Y. D.2012. Faktor
Lingkungan dan Perilaku Masyarakat yang
Berhubungan dengan Kejadian Filariasis di
Kabupaten Sambas. Jurnal Kesehatan
Lingkungan Indonesia.11(2):199-207
Arduino, M. d. B., Mucci, L. F., Serpa, L. L. N.,
Rodrigues, M. d. M.2015. Effect of salinity
on the behavior of Aedes aegypti
populations from the coast and plateau of
southeastern Brazil. J Vector Borne
Dis.(52):79–87
Chandra, Goutam.2008. Review: Nature limits
filarial transmission.Parasites and
Vectors.1(13):1-6.
50
Dhimal, M., Ahrens, B., Kuch, U.2014. Species
composition, seasonal occurrence, habitat
preference and altitudinal distribution of
malaria and other disease vectors in eastern
Nepal. Parasites & Vectors.7(1):1-11.
Dinas Kesehatan Kabupaten Demak.2016.
Rekapitulasi Kasus Filariasis Kabupaten
Demak tahun 1995-2016. Dinas Kesehatan
Kabupaten Demak.
Dinas Kesehatan Provinsi Jawa Tenagh.2015. Profil
Kesehatan Provinsi Jawa Tengah tahun
2015. Dinas kesehatan provinsi.
Donatoa, D. C., Kauffmanb, J. B., Murdiyarsoc, D.,
Kurniantoc, S., Stidhamd, M., dan
Kanninene, M. 2012. Mangrove adalah salah
satu hutan terkaya karbon di kawasan
tropis.Brief CIFOR. (3):1-12.
Erickson, S. M., Xi, S., Mayhew, J. F., Ramirez, J. L.,
Aliota, M. T., Crishtensen, B. M.,
Dimopuolos, G. 2009. Mosquito Infection
Responses to Developing Filarial Worms.
PLoS Negl Trop Dis. 3(10): e529.
Ginandjar, Praba dan Esther Sri Majawati.2014.
Faktor Risiko Kejadian Filariasis Limfatik di
Kecamatan Moro Sebo Kabupaten Muaro
Jambi. Artikel Penelitian Fakultas
Kedokteran UKRIDA. (1):1-5
Gleave, K. Cook, D., Taylor, M. J., Reimer, L. J.
2016. Filarial Infection Influences Mosquito
Behaviour and Fecundity.Sci. Rep.
6(36319): 1-4
Hardinisah, S., Marsaulina, I., Santi, D. N.2016.
Pemilihan Anti Nyamuk Ditinjau dari
Tingkat Pendidikan, Pendapatan dan
Perilaku Serta Keluhan Kesehatan pada
Keluarga di Kelurahan Asam Kumbang
Kecamatan Medan Selayang Tahun 2015.
Jurnal Kesehatan. 7(1):1-7
Hermawan, E.2017. Fenomena Urban Heat Island
(UHI) pada Beberapa Kota Besar di
Indonesia sebagai Salah Satu Dampak
Perubahan Lingkungan Global. Jurnal
Lingkungan. 5(1): 33-45
Higa Y., Yen, N. T., Kawada, H., Son, T. H., Hoa, N.
T., Takagi, M.2010. Geographic
Distribution of Aedes aegypti and Aedes
albopictus Collected from Used Tires in
Vietnam. Journal of the American Mosquito
Control Association. 26(1):1-9.
Jude, P. J., Tharmasegaram, T., Sivasubramaniyam,
G., Senthilnanthanan, M., Kannathasan, S.,
Raveendran, S., Ramasamy, R., Surendran,
S. N.2012. Salinity-tolerant larvae of
mosquito vectors in the tropical coast of
Jaffna, Sri Lanka and the effect of salinity on
the toxicity of Bacillus thuringiensis to
Aedes aegypti larvae.Parasite &
Vectors.5(1):1-8
Kemenkes RI.2011.Atlas Vektor Penyakit di
Indonesia: Seri 1.Jakarta:Kkementerian
Kesehatan RI.
Kemenkes RI.2015.Infodatin:Filariasis Menuju
Elimininasi Filariasis
2020.Jakarta:Kementerian Kesehatan RI
Khan, A. M., Dutta, P., Das, S., Pathak, A. K.,
Sarmah, P., Hussain, M. E., & Mahanta, J.
(2015). Microfilarial periodicity of
Wuchereria bancrofti in Assam, Northeast
India. Journal of Vector Borne Diseases.
52(3): 208–212
Kirti, J. S., Shipali, Kaur, J. 2014. Comparision of
Male and Female Genitalia of Culex species
with Scanning Electron Microscopy (SEM).
Int J Curr Res Aca Rev. 2(1): 17-24
Kurniawan, Jeppry.2008. Analisis Faktor Risiko
Lingkungan dan Perilaku Penduduk
Terhadap Kejadian Malaria Di Kabupaten
Asmat Tahun 2008. Tesis. Semarang:
Universitas Diponegoro
Kusnanto, H. M., & Lazuardi, L. 2013. The Relations
of Climate and Land Use with the Incident
of Filariasis in Pasaman Barat 2007-2013,
4531, 241–256
Komaria, R. H., Faisya, H. A. F., Sunarsih, E.2016.
Analisis Determinan Lingkungan Fisik Dan
Perilaku Preventif Terhadap Kasus Filariasis
di Kecamatan Talang Kelapa dan
Kecamatan Sembawa Kabupaten
51
Banyuasin. Jurnal Ilmu Kesehatan
Masyarakat. 7(2):1-10
Lestari, M. I. 2016.DEET: Bahan Aktif Repellent
yang Efektif dan Aman bagi Traveller.
Jurnal Kedokteran Udayana.5(1):1-11.
M. M., Manyi, Vajime, C.G and Imandeh, G. N.
2014. Seasonal changes of microfilarial
infection and infectivity rates in mosquito
populations within Makurdi, Benue State,
Nigeria. International Journal of Mosquito
Research.1 (4): 01-09
Manguin S, Bangs MJ, Pothikasikorn J,
Chareonviriyaphap T. 2010.Review on
Global Co-transmission of Human
Plasmodium species and Wuchereria
bancrofti by Anopheles Mosquitoes. Infect,
Gen. and Evol. 10:159-177
Manguin, S., & Boëte, C. 2011. Global impact of
mosquito biodiversity, human vector-borne
diseases and environmental change. The
Importance of Biological Interactions in the
Study of Biodiversity.27–50.
http://doi.org/10.5772/22970
Manimegalai K, Sukanya S.2014.Biology of the
filarial vector, Culex quinquefasciatus
(Diptera:Culicidae). Int J Curr Microbiol
App Sci.3 (4): 718–24
Misrha, Chirasmita.2014.Culex Mosquito:Vektor
Filariasis.Journal of Entomology.(1):95-98
Naeem, S., Ahmad, S., Sohail, K., Shah, S. F.,
Naeem, K. 2015. Study of Relative
Abundance of Different Mosquito Genera in
Different Habitats at Peshawar. Journal of
Entomology and Zoology Studies. 3(4): 391-
394
Nasirin.2008. Faktor-Faktor Lingkungan dan
Perilaku yang Berhubungan dengan
Kejadian Filariasis di Kabupaten Bangka
Barat.Tesis. Semarang: Universitas
Diponegoro.
Okorie,P. N., Popoola, K.O.K., Awobifa, O. M.,
Ibrahim, K. T., Ademowo, G.
O.2014.Species Compositon and Temporal
Distribution of Mosquito Populations in
Ibadan, Southwest Nigeria.Journal of
Entomology and Zoology.2(4):164-169
Paiting, S., & Setiani, O.2012. Faktor Risiko
Lingkungan dan Kebiasaan Penduduk
Berhubungan Dengan Kejadian Filariasis di
Distrik Windesi Kabupaten Kepulauan
Yapen Provinsi Papua. Jurnal Kesehatan
Lingkungan Indonesia.11(1): 76–81
Pemerintah Desa Bedono.2016. Profil Desa Bedono
tahun 2016. Pemerintah Desa Bedono
Sayung Demak
Pratama, G. Y. 2015. Nyamuk Anopheles sp dan
Faktor yang Mempengaruhi di Kecamatan
Rajabasa, Lampung Selatan. J Majority,
4(1), 20–27
Putra, A. K., Bakri, S., Kurniawan, B. 2015. Peranan
Ekosistem Hutan Mangrove pada Imunitas
terhadap Malaria: Studi di Kecamatan
Labuhan Maringgai Kabupaten Lampung
Timur. Jurnal Silvia Lestari. 3(2): 67-78
Raini, Mariana.2009. Toksikologiinsektisida Rumah
Tangga dan Pencegahan Keracunan. Media
Penelit. dan Pengembang. Kesehat.
19(2):27-33
Ridha, M. R.2016. Vektor Potensial Filariasis Dan
Habitatnya Di Desa Mandomai Kabupaten
Kapuas Provinsi Kalimantan Tengah. Tesis.
Bogor: Intitut Pertanian Bogor
Rohani, A., Zamree, I., Ali, W. M. W. N., Hadi, A.
A., Asmad, M., Lubim, D., Nor, Z. M., Lim,
L. H. 2013. Nocturnal man biting habits of
mosquito species in Serian, Sarawak,
Malaysia. Advances in Entomology 1(2):
42-49
Salim, M. F., Satoto, T. B. T., Kusnanto, H. 2016.
Zona Kerentanan Filariasis Berdasarkan
Faktor Risiko dengan Pendekatan Sistem
Informasi Geografis. Journal of Information
Systems for Public Health. 1(1): 16-24.
Saputri, R. P. I.2015. Perbandingan Kemampuan
Penetasan Telur Nyamuk Culex sp
Berdasarkan Jenis Air Perindukan (Air
Limbah Batik, Air Limbah Rumah Tangga,
Air Rob). Skripsi. Semarang: Universitas
Diponegoro
52
Sipayung, M., Chatarina, U. Wahjuni, Devy, S.
R.2014. Pengaruh Lingkungan Biologi dan
Upaya Pelayanan Kesehatan terhadap
Kejadian Filariasis Limfatik di Kabupaten
SarmI. Jurnal Berkala Epidemiologi.2(2):
263–273
Sukendra, D.M., Shidqon, M.A.,2016. Gambaran
Perilaku Menggigit Nyamuk Culex Sp.
sebagai Vektor Penyakit Filariasis
Wuchereria bancrofti.Jurnal Pena
Medika.6(1):19-33
Tariq, R. M., Naqvi, M. H., Zavar, S. M. N., 2009.
Two Indigenous Aquatic Weeds Lemna
Minor and Spirodella Spp., Gave Promising
Biological Control Of Mosquito Larvae
With Rainbow Fish On Field Level In
Karachi, Sindh, Pakistan. Pakistan Journal
of Botany. 41(1): 269-276
Tawas, R. C., Pijoh, V. D., Tuda, J.2015. Tindakan
Masyarakat tehadap Penyakit Malaria di
Kecamatan Silian Raya Kabupaten
Minahasa Tenggara. Jurnal e-Biomedik
(eBm).3(1):261-268
Tsuda Y., Komagata, O., Kasai, S., Hayashi, T.,
Nihei, N., Saito, K., Mizutani, M., Kunida,
M., Yoshida, M., Kobayashi, M.2008.A
Mark-release-recapture Study on Dispersal
and Flight Distances of Culex pipiens
pallens in a Urban Area o Japan. Journal of
The American Mosquioto Control
Association.24(3):33-343
Tuten , H.C., Bridges Jr, W.C., Adler, P.H.2012.
Comparative morphology of the pyloric
armature of adult mosquitoes (Diptera:
Culicidae). Arthropod Structure &
Development.41:475-481.
WHO.2013.Lymphatic Filariasis:Managing
Morbidity and Preventy Disability an aide-
memoire for National Programme
Magers.Geneva:WHO Press
Widiastuti, P. dan WInarsih.2016. Karakteristik Host
dan Lingkungan Penderita Filariasis di
Kabupaten Tangerang Tahun
2015.Skripsi:Program Studi Kesehatan
Masyarakat Universitas Islam Negeri jakarta
Wijayanti, Tri.2009. Analisis Situasi Filariasis
Limfatik di Kelurahan Simbang Kulon
Kecamatan Buaran Kabupaten Pekalongan.
BALABA.5(1):11-16
Windiastuti, Ike Ani, et.al.2013.Hubungan Kondisi
Lingkungan Rumah, Sosial Ekonomi, dan
Perilaku Masyarakat denganKejadian
Filariasis di Kecamatan Pekalongan Selatan
Kota Pekalongan.Jurnal Kesehatan
Lingkungan Indonesia.(12):51-57
Wulandhari, S. A.2015. Analisis Spasial Aspek
Kesehatan Lingkungan dengan Kejadian
Filariasis di Kota Pekalongan.Skripsi.Semarang:
Universitas Negeri Semarang.
53
The Characteristics of the Patients Doing HIV
Test in KTHIV Clinic at Ambarawa Hospital
1st Anidaul Fajriyah Public Health Magister Progra
Universitas Negeri Semarang
Semarang, Indonesia
2nd Niar Ardian Public Health Magister Progra
Universitas Negeri Semarang
Semarang, Indonesia
Abstract–VCT (Voluntary Counseling and Testing)
is an examination of HIV voluntary. The data of
patients characteristics are needed to do reporting
that have been written in the KTHIV Form.
Ambarawa Hospital has had KTHIV clinic since
2007 and has the highest number of patients in
Semarang Regency in 2015. The aim of the study is
to describe the characteristics of the patients doing
HIV test in KTHIV clinic at Ambarawa Hospital.
The design of study was cross sectional with
purposive sampling and got 252 respondents. This
study used secondary data obtained from medical
records in KTHIV Form. Univariat analysis used
frequency distribution and percentage. The result of
this research characteristics of the patients were
59,5% male, 58,3% were married, 60,3% were adults
(26 – 45 years old), 51,5% had primary education,
73,8% employed, 40,8% were in the risk group of sex
workers, 88,9% had a non-formal reason to have an
HIV test, and 27,4% had STI (Sexually Transmitted
Infections) when taking an HIV test. Conclusion of
this research is most patients in KTHIV clinic who
do HIV voluntary testing is male, are married, are
adult, have primary education, are employed,
include as risk group of sex workers, have a non-
formal reason, and have STI.
Keywords : HIV testing and counseling,
HIV, characteristics of the
patients, VCT
VI. INTRODUCTION
The Indonesian government in knowing the
incidence of new HIV infections has carried out
various ways, including by conducting HIV
counseling and testing as stated in Permenkes No. 74
Tahun 2014. HIV counseling and testing is done
through these approaches: (a) HIV Counseling and
Testing of Health Service Provider Initiatives (KTIP);
and (b) Voluntary HIV Counseling and Testing
(KTS). Then every HIV counseling and testing
service must be recorded and reported in accordance
with the provisions of the legislation, documented in
the medical record, and carried out in stages every 1
(one) month.
In Semarang regency, in 2015 the number of
patients who checked themselves into the KTHIV
clinic was 3813 cases, which increased from the
previous year which was 3549 cases. Aside from the
number of visits, the improvement of the KTS
program was proven by the increase in the number of
KTHIV clinics from last year (2015) from only 11
clinics to 14 clinics in 2016 (Dinkes, 2016). The
highest data of the patients who visited and tested for
HIV in the regency of Semarang was Ambarawa
Regency Hospital, followed by Duren Public Health
Center, Ungaran regency Hospital and other public
health centers.
Ambarawa Regency Hospital in an effort to do a
prevention has established the KTHIV clinic since
2007. Since that year there have been many patients
who have visited and tested HIV at the clinic. In 2015,
687 people tested for HIV at the KTHIV clinic at
Ambarawa Regency Hospital. This figure shows an
increase from the previous year which was 548
people. From these data can be separated into 2 types
of KTHIV they are KTIP and KTS. In 2015, from
687 people included 636 KTS data and 51 KTIP
people.
Based on data regarding the incidence of HIV /
AIDS and the number of KTHIV clinics in Semarang
Regency, it is necessary to conduct research on the
characteristics of patients who do HIV tests at the
KTHIV clinic at Ambarawa Hospital. The aim is to
find out the characteristics of patients who do HIV
testing at the KTHIV clinic in Ambarawa Hospital,
including the characteristics of gender, marital status,
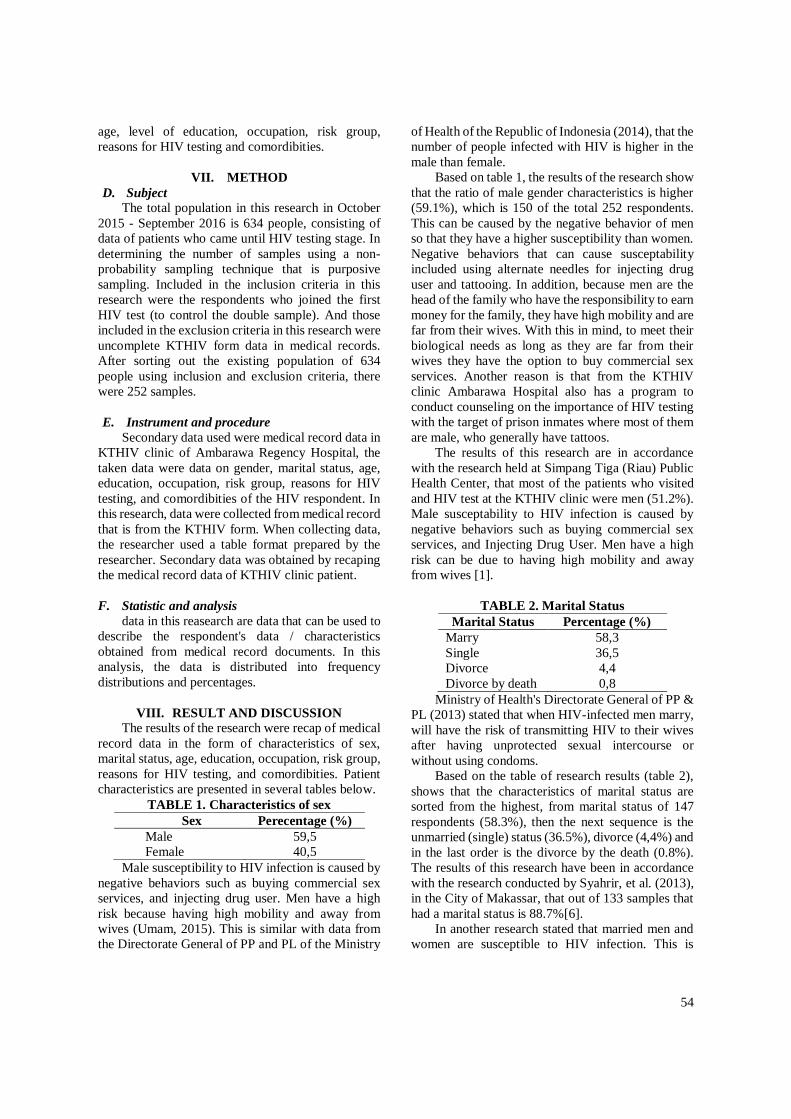
54
age, level of education, occupation, risk group,
reasons for HIV testing and comordibities.
VII. METHOD
D. Subject
The total population in this research in October
2015 - September 2016 is 634 people, consisting of
data of patients who came until HIV testing stage. In
determining the number of samples using a non-
probability sampling technique that is purposive
sampling. Included in the inclusion criteria in this
research were the respondents who joined the first
HIV test (to control the double sample). And those
included in the exclusion criteria in this research were
uncomplete KTHIV form data in medical records.
After sorting out the existing population of 634
people using inclusion and exclusion criteria, there
were 252 samples.
E. Instrument and procedure
Secondary data used were medical record data in
KTHIV clinic of Ambarawa Regency Hospital, the
taken data were data on gender, marital status, age,
education, occupation, risk group, reasons for HIV
testing, and comordibities of the HIV respondent. In
this research, data were collected from medical record
that is from the KTHIV form. When collecting data,
the researcher used a table format prepared by the
researcher. Secondary data was obtained by recaping
the medical record data of KTHIV clinic patient.
F. Statistic and analysis
data in this reasearch are data that can be used to
describe the respondent's data / characteristics
obtained from medical record documents. In this
analysis, the data is distributed into frequency
distributions and percentages.
VIII. RESULT AND DISCUSSION
The results of the research were recap of medical
record data in the form of characteristics of sex,
marital status, age, education, occupation, risk group,
reasons for HIV testing, and comordibities. Patient
characteristics are presented in several tables below.
TABLE 1. Characteristics of sex
Sex Perecentage (%)
Male
Female
59,5
40,5
Male susceptibility to HIV infection is caused by
negative behaviors such as buying commercial sex
services, and injecting drug user. Men have a high
risk because having high mobility and away from
wives (Umam, 2015). This is similar with data from
the Directorate General of PP and PL of the Ministry
of Health of the Republic of Indonesia (2014), that the
number of people infected with HIV is higher in the
male than female.
Based on table 1, the results of the research show
that the ratio of male gender characteristics is higher
(59.1%), which is 150 of the total 252 respondents.
This can be caused by the negative behavior of men
so that they have a higher susceptibility than women.
Negative behaviors that can cause susceptability
included using alternate needles for injecting drug
user and tattooing. In addition, because men are the
head of the family who have the responsibility to earn
money for the family, they have high mobility and are
far from their wives. With this in mind, to meet their
biological needs as long as they are far from their
wives they have the option to buy commercial sex
services. Another reason is that from the KTHIV
clinic Ambarawa Hospital also has a program to
conduct counseling on the importance of HIV testing
with the target of prison inmates where most of them
are male, who generally have tattoos.
The results of this research are in accordance
with the research held at Simpang Tiga (Riau) Public
Health Center, that most of the patients who visited
and HIV test at the KTHIV clinic were men (51.2%).
Male susceptability to HIV infection is caused by
negative behaviors such as buying commercial sex
services, and Injecting Drug User. Men have a high
risk can be due to having high mobility and away
from wives [1].
TABLE 2. Marital Status
Marital Status Percentage (%)
Marry 58,3
Single 36,5
Divorce 4,4
Divorce by death 0,8
Ministry of Health's Directorate General of PP &
PL (2013) stated that when HIV-infected men marry,
will have the risk of transmitting HIV to their wives
after having unprotected sexual intercourse or
without using condoms.
Based on the table of research results (table 2),
shows that the characteristics of marital status are
sorted from the highest, from marital status of 147
respondents (58.3%), then the next sequence is the
unmarried (single) status (36.5%), divorce (4,4%) and
in the last order is the divorce by the death (0.8%).
The results of this research have been in accordance
with the research conducted by Syahrir, et al. (2013),
in the City of Makassar, that out of 133 samples that
had a marital status is 88.7%[6].
In another research stated that married men and
women are susceptible to HIV infection. This is
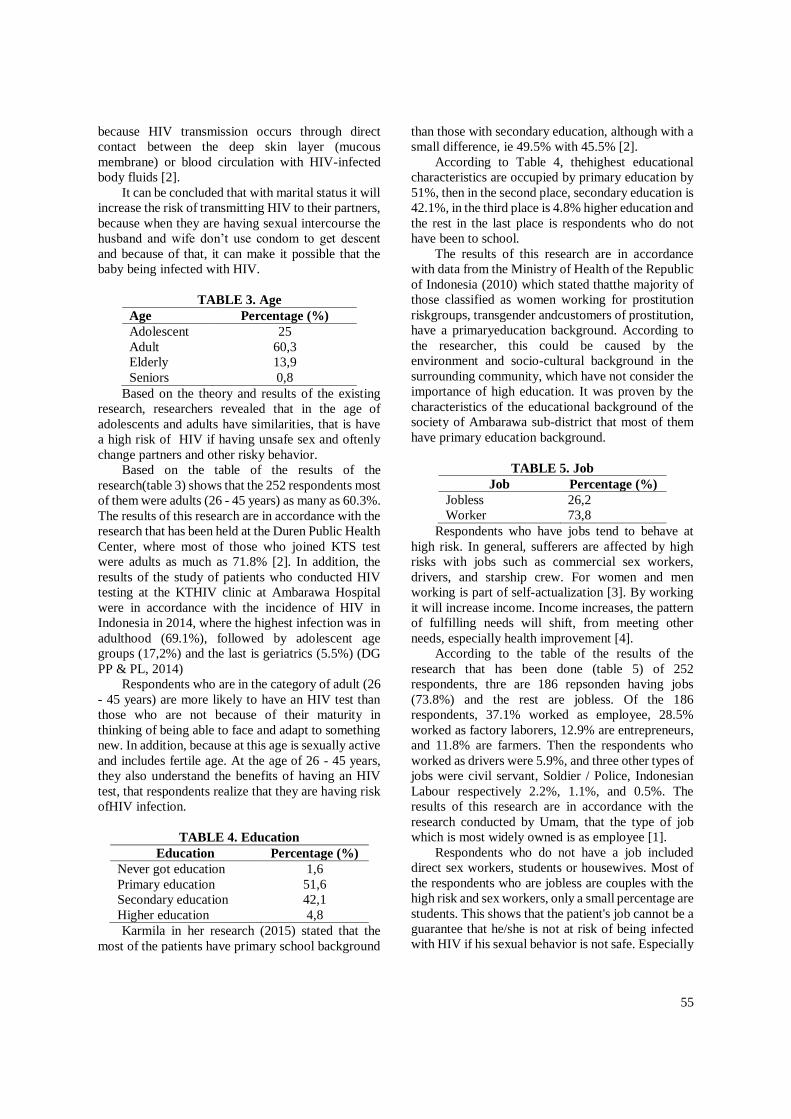
55
because HIV transmission occurs through direct
contact between the deep skin layer (mucous
membrane) or blood circulation with HIV-infected
body fluids [2].
It can be concluded that with marital status it will
increase the risk of transmitting HIV to their partners,
because when they are having sexual intercourse the
husband and wife don’t use condom to get descent
and because of that, it can make it possible that the
baby being infected with HIV.
TABLE 3. Age
Age Percentage (%)
Adolescent 25
Adult 60,3
Elderly 13,9
Seniors 0,8
Based on the theory and results of the existing
research, researchers revealed that in the age of
adolescents and adults have similarities, that is have
a high risk of HIV if having unsafe sex and oftenly
change partners and other risky behavior.
Based on the table of the results of the
research(table 3) shows that the 252 respondents most
of them were adults (26 - 45 years) as many as 60.3%.
The results of this research are in accordance with the
research that has been held at the Duren Public Health
Center, where most of those who joined KTS test
were adults as much as 71.8% [2]. In addition, the
results of the study of patients who conducted HIV
testing at the KTHIV clinic at Ambarawa Hospital
were in accordance with the incidence of HIV in
Indonesia in 2014, where the highest infection was in
adulthood (69.1%), followed by adolescent age
groups (17,2%) and the last is geriatrics (5.5%) (DG
PP & PL, 2014)
Respondents who are in the category of adult (26
- 45 years) are more likely to have an HIV test than
those who are not because of their maturity in
thinking of being able to face and adapt to something
new. In addition, because at this age is sexually active
and includes fertile age. At the age of 26 - 45 years,
they also understand the benefits of having an HIV
test, that respondents realize that they are having risk
ofHIV infection.
TABLE 4. Education
Education Percentage (%)
Never got education 1,6
Primary education 51,6
Secondary education 42,1
Higher education 4,8
Karmila in her research (2015) stated that the
most of the patients have primary school background
than those with secondary education, although with a
small difference, ie 49.5% with 45.5% [2].
According to Table 4, thehighest educational
characteristics are occupied by primary education by
51%, then in the second place, secondary education is
42.1%, in the third place is 4.8% higher education and
the rest in the last place is respondents who do not
have been to school.
The results of this research are in accordance
with data from the Ministry of Health of the Republic
of Indonesia (2010) which stated thatthe majority of
those classified as women working for prostitution
riskgroups, transgender andcustomers of prostitution,
have a primaryeducation background. According to
the researcher, this could be caused by the
environment and socio-cultural background in the
surrounding community, which have not consider the
importance of high education. It was proven by the
characteristics of the educational background of the
society of Ambarawa sub-district that most of them
have primary education background.
TABLE 5. Job
Job Percentage (%)
Jobless 26,2
Worker 73,8
Respondents who have jobs tend to behave at
high risk. In general, sufferers are affected by high
risks with jobs such as commercial sex workers,
drivers, and starship crew. For women and men
working is part of self-actualization [3]. By working
it will increase income. Income increases, the pattern
of fulfilling needs will shift, from meeting other
needs, especially health improvement [4].
According to the table of the results of the
research that has been done (table 5) of 252
respondents, thre are 186 repsonden having jobs
(73.8%) and the rest are jobless. Of the 186
respondents, 37.1% worked as employee, 28.5%
worked as factory laborers, 12.9% are entrepreneurs,
and 11.8% are farmers. Then the respondents who
worked as drivers were 5.9%, and three other types of
jobs were civil servant, Soldier / Police, Indonesian
Labour respectively 2.2%, 1.1%, and 0.5%. The
results of this research are in accordance with the
research conducted by Umam, that the type of job
which is most widely owned is as employee [1].
Respondents who do not have a job included
direct sex workers, students or housewives. Most of
the respondents who are jobless are couples with the
high risk and sex workers, only a small percentage are
students. This shows that the patient's job cannot be a
guarantee that he/she is not at risk of being infected
with HIV if his sexual behavior is not safe. Especially
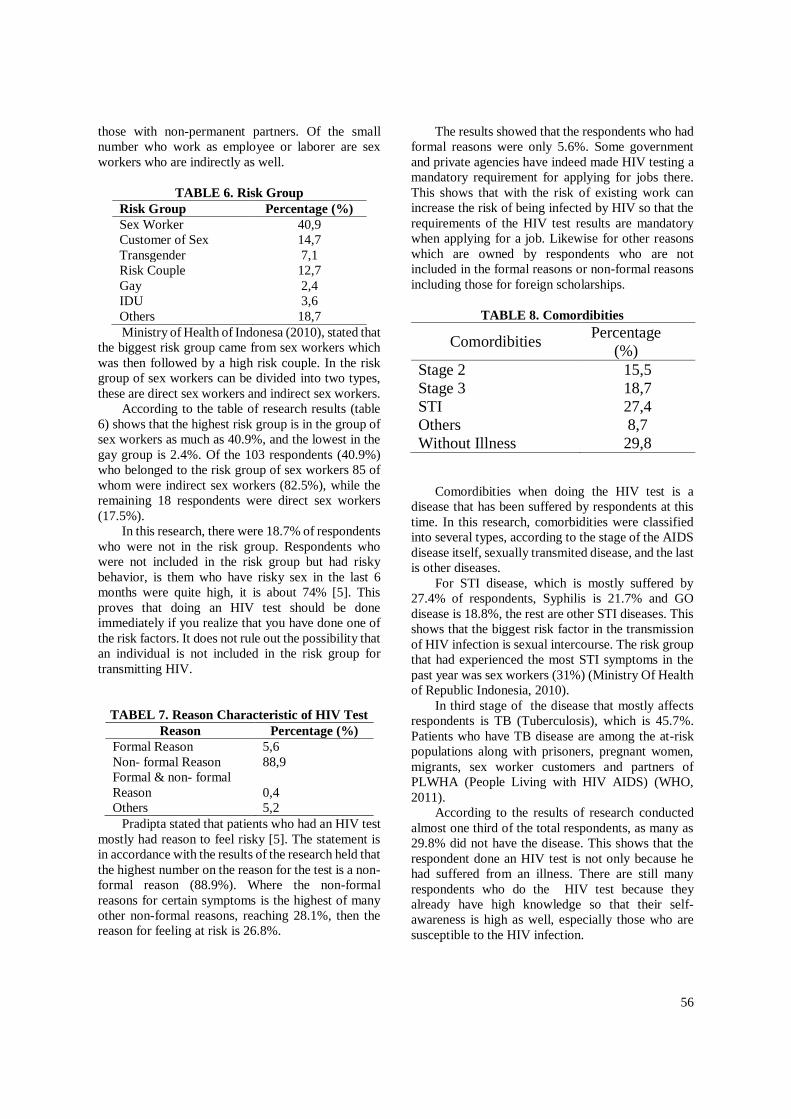
56
those with non-permanent partners. Of the small
number who work as employee or laborer are sex
workers who are indirectly as well.
TABLE 6. Risk Group
Risk Group Percentage (%)
Sex Worker 40,9
Customer of Sex 14,7
Transgender 7,1
Risk Couple 12,7
Gay 2,4
IDU 3,6
Others 18,7
Ministry of Health of Indonesa (2010), stated that
the biggest risk group came from sex workers which
was then followed by a high risk couple. In the risk
group of sex workers can be divided into two types,
these are direct sex workers and indirect sex workers.
According to the table of research results (table
6) shows that the highest risk group is in the group of
sex workers as much as 40.9%, and the lowest in the
gay group is 2.4%. Of the 103 respondents (40.9%)
who belonged to the risk group of sex workers 85 of
whom were indirect sex workers (82.5%), while the
remaining 18 respondents were direct sex workers
(17.5%).
In this research, there were 18.7% of respondents
who were not in the risk group. Respondents who
were not included in the risk group but had risky
behavior, is them who have risky sex in the last 6
months were quite high, it is about 74% [5]. This
proves that doing an HIV test should be done
immediately if you realize that you have done one of
the risk factors. It does not rule out the possibility that
an individual is not included in the risk group for
transmitting HIV.
TABEL 7. Reason Characteristic of HIV Test
Reason Percentage (%)
Formal Reason 5,6
Non- formal Reason 88,9
Formal & non- formal
Reason
0,4
Others 5,2
Pradipta stated that patients who had an HIV test
mostly had reason to feel risky [5]. The statement is
in accordance with the results of the research held that
the highest number on the reason for the test is a non-
formal reason (88.9%). Where the non-formal
reasons for certain symptoms is the highest of many
other non-formal reasons, reaching 28.1%, then the
reason for feeling at risk is 26.8%.
The results showed that the respondents who had
formal reasons were only 5.6%. Some government
and private agencies have indeed made HIV testing a
mandatory requirement for applying for jobs there.
This shows that with the risk of existing work can
increase the risk of being infected by HIV so that the
requirements of the HIV test results are mandatory
when applying for a job. Likewise for other reasons
which are owned by respondents who are not
included in the formal reasons or non-formal reasons
including those for foreign scholarships.
TABLE 8. Comordibities
Comordibities Percentage
(%)
Stage 2 15,5
Stage 3 18,7
STI 27,4
Others 8,7
Without Illness 29,8
Comordibities when doing the HIV test is a
disease that has been suffered by respondents at this
time. In this research, comorbidities were classified
into several types, according to the stage of the AIDS
disease itself, sexually transmited disease, and the last
is other diseases.
For STI disease, which is mostly suffered by
27.4% of respondents, Syphilis is 21.7% and GO
disease is 18.8%, the rest are other STI diseases. This
shows that the biggest risk factor in the transmission
of HIV infection is sexual intercourse. The risk group
that had experienced the most STI symptoms in the
past year was sex workers (31%) (Ministry Of Health
of Republic Indonesia, 2010).
In third stage of the disease that mostly affects
respondents is TB (Tuberculosis), which is 45.7%.
Patients who have TB disease are among the at-risk
populations along with prisoners, pregnant women,
migrants, sex worker customers and partners of
PLWHA (People Living with HIV AIDS) (WHO,
2011).
According to the results of research conducted
almost one third of the total respondents, as many as
29.8% did not have the disease. This shows that the
respondent done an HIV test is not only because he
had suffered from an illness. There are still many
respondents who do the HIV test because they
already have high knowledge so that their self-
awareness is high as well, especially those who are
susceptible to the HIV infection.
57
IX. CONCLUSION
Based on the results of research on the
characteristics of patients who done HIV testing at the
KTHIV clinic Ambarawa regency Hospital with a
sample of 252 respondents, it can be concluded that
all people have the risk of infected by HIV if they
have done HIV risk behavior regardless of gender,
marital status, age, education and occupation. It does
not even rule out the possibility that if someone does
not belong to the risk group category, they will not be
infected with HIV as long as they do a safe
behavioral. Not looking at the reasons and suffering
from any diseases that are owned, if you feel at risk
you should immediately do an HIV test. Because by
doing that, it will soon be revealed how far the spread
of HIV, so that prevention and treatment can be done
(for those who are declared positive) quickly and
accurately.
REFERENCES
[1] Umam, Husnulet al.
“IdentifikasiKarakteristik Orang
RisikoTinggi HIV dan AIDS tentang
Program Pelayanan Voluntary Counselling
and Testing (KTHIV)”. Universitas Riau;
JomVol 2 No 1, Februari 2015.
[2] Karmila, Sri.
“GambaranKarakteristikIndividu yang
MelakukanKunjungan Voluntary
Counselling Test (KTHIV) di Wilayah
KerjaPuskesmas Duren
KecamatanBandunganKabupaten Semarang
Tahun 2015”.UniversitasNgudiWaluyo.
[3] Djoerban. “HIV/AIDS di Indonesia
dalamBuku Ajar IlmuPenyakitDalamJilid
III Edisi V”. Jakarta:
DepartemenIlmuPenyakitDalam FKUI.
2011
[4] Widyastuti Y.“Kesehatan Reproduksi”.
Yogyakarta: Fitramaya. 2009
[5] Pradipta, Setia.
“GambaranEpidemiologiPengunjungKlinik
KTHIV PuskesmasKecamatanGambir,
Jakarta PusatTahun 2011”.Universitas
Indonesia. 2011
[6] Syahrir, Wahyunita, et al.“Faktor yang
Berhubungan dengan Pemanfaatan Klinik
Voluntary Counseling and Testing (KTHIV)
di Puskesmas Kota
Makassar”.UniversitasHasanuddin. 2014
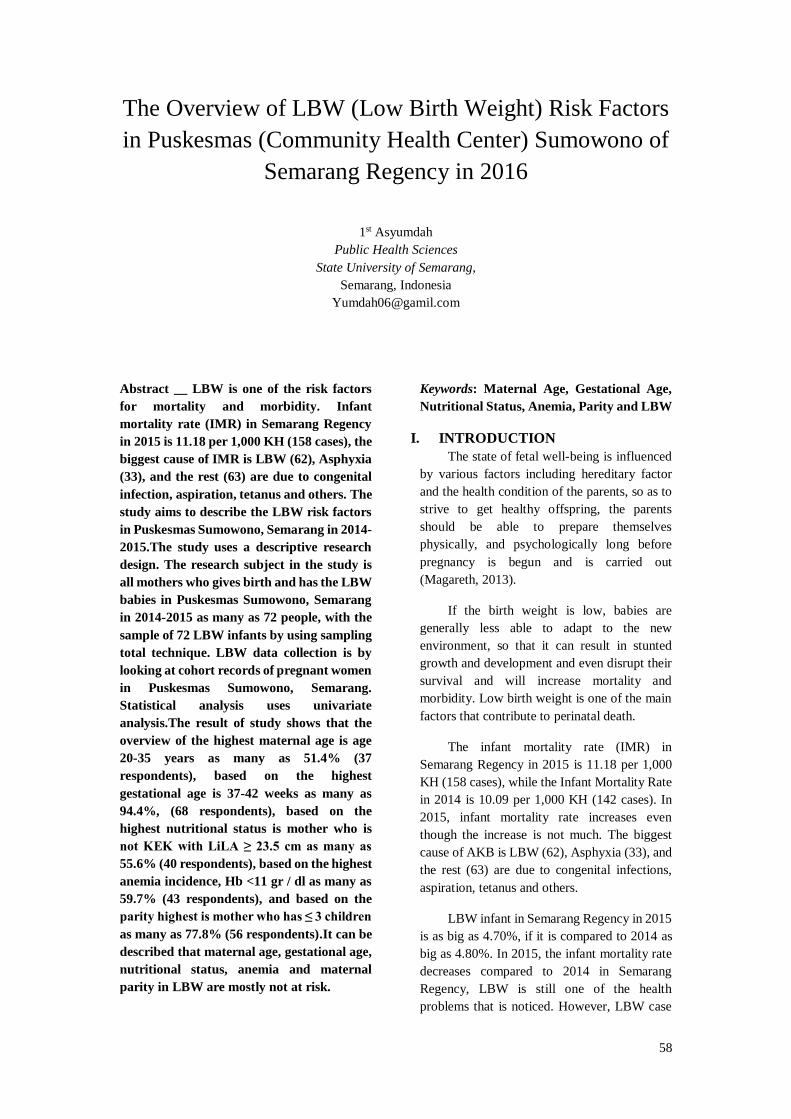
58
The Overview of LBW (Low Birth Weight) Risk Factors
in Puskesmas (Community Health Center) Sumowono of
Semarang Regency in 2016
1st Asyumdah
Public Health Sciences
State University of Semarang,
Semarang, Indonesia
Abstract __ LBW is one of the risk factors
for mortality and morbidity. Infant
mortality rate (IMR) in Semarang Regency
in 2015 is 11.18 per 1,000 KH (158 cases), the
biggest cause of IMR is LBW (62), Asphyxia
(33), and the rest (63) are due to congenital
infection, aspiration, tetanus and others. The
study aims to describe the LBW risk factors
in Puskesmas Sumowono, Semarang in 2014-
2015.The study uses a descriptive research
design. The research subject in the study is
all mothers who gives birth and has the LBW
babies in Puskesmas Sumowono, Semarang
in 2014-2015 as many as 72 people, with the
sample of 72 LBW infants by using sampling
total technique. LBW data collection is by
looking at cohort records of pregnant women
in Puskesmas Sumowono, Semarang.
Statistical analysis uses univariate
analysis.The result of study shows that the
overview of the highest maternal age is age
20-35 years as many as 51.4% (37
respondents), based on the highest
gestational age is 37-42 weeks as many as
94.4%, (68 respondents), based on the
highest nutritional status is mother who is
not KEK with LiLA ≥ 23.5 cm as many as
55.6% (40 respondents), based on the highest
anemia incidence, Hb <11 gr / dl as many as
59.7% (43 respondents), and based on the
parity highest is mother who has ≤ 3 children
as many as 77.8% (56 respondents).It can be
described that maternal age, gestational age,
nutritional status, anemia and maternal
parity in LBW are mostly not at risk.
Keywords: Maternal Age, Gestational Age,
Nutritional Status, Anemia, Parity and LBW
I. INTRODUCTION
The state of fetal well-being is influenced
by various factors including hereditary factor
and the health condition of the parents, so as to
strive to get healthy offspring, the parents
should be able to prepare themselves
physically, and psychologically long before
pregnancy is begun and is carried out
(Magareth, 2013).
If the birth weight is low, babies are
generally less able to adapt to the new
environment, so that it can result in stunted
growth and development and even disrupt their
survival and will increase mortality and
morbidity. Low birth weight is one of the main
factors that contribute to perinatal death.
The infant mortality rate (IMR) in
Semarang Regency in 2015 is 11.18 per 1,000
KH (158 cases), while the Infant Mortality Rate
in 2014 is 10.09 per 1,000 KH (142 cases). In
2015, infant mortality rate increases even
though the increase is not much. The biggest
cause of AKB is LBW (62), Asphyxia (33), and
the rest (63) are due to congenital infections,
aspiration, tetanus and others.
LBW infant in Semarang Regency in 2015
is as big as 4.70%, if it is compared to 2014 as
big as 4.80%. In 2015, the infant mortality rate
decreases compared to 2014 in Semarang
Regency, LBW is still one of the health
problems that is noticed. However, LBW case
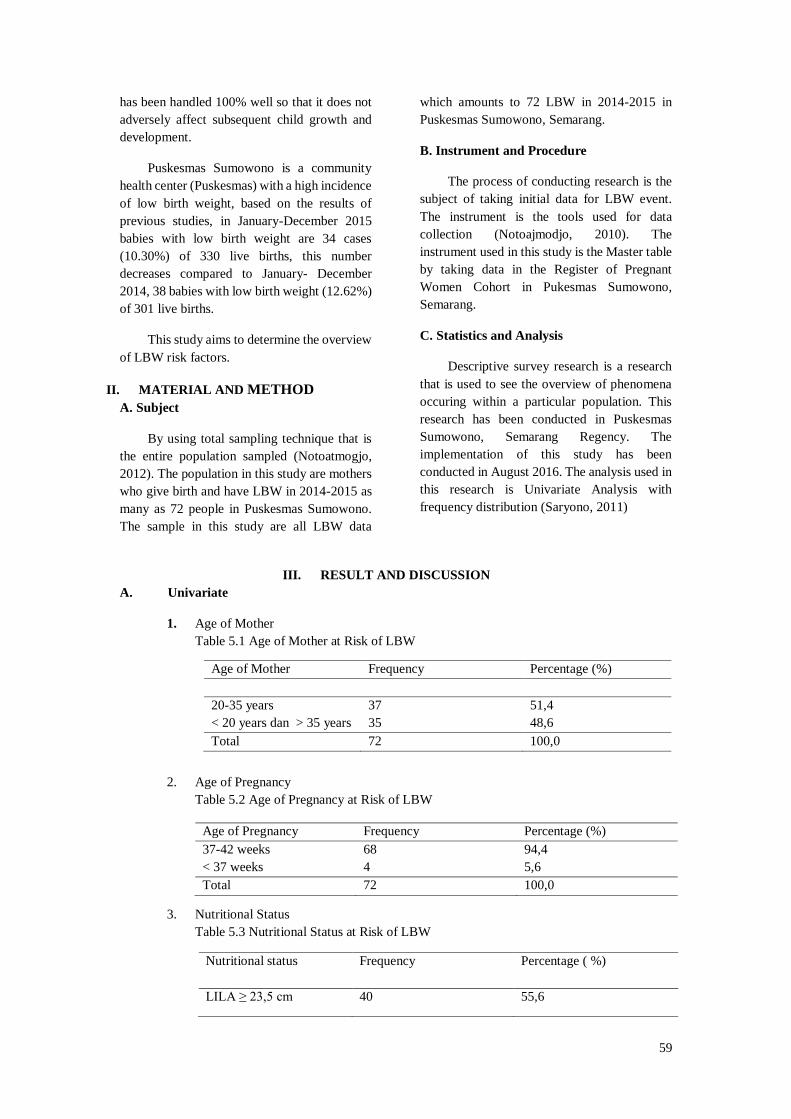
59
has been handled 100% well so that it does not
adversely affect subsequent child growth and
development.
Puskesmas Sumowono is a community
health center (Puskesmas) with a high incidence
of low birth weight, based on the results of
previous studies, in January-December 2015
babies with low birth weight are 34 cases
(10.30%) of 330 live births, this number
decreases compared to January- December
2014, 38 babies with low birth weight (12.62%)
of 301 live births.
This study aims to determine the overview
of LBW risk factors.
II. MATERIAL AND METHOD
A. Subject
By using total sampling technique that is
the entire population sampled (Notoatmogjo,
2012). The population in this study are mothers
who give birth and have LBW in 2014-2015 as
many as 72 people in Puskesmas Sumowono.
The sample in this study are all LBW data
which amounts to 72 LBW in 2014-2015 in
Puskesmas Sumowono, Semarang.
B. Instrument and Procedure
The process of conducting research is the
subject of taking initial data for LBW event.
The instrument is the tools used for data
collection (Notoajmodjo, 2010). The
instrument used in this study is the Master table
by taking data in the Register of Pregnant
Women Cohort in Pukesmas Sumowono,
Semarang.
C. Statistics and Analysis
Descriptive survey research is a research
that is used to see the overview of phenomena
occuring within a particular population. This
research has been conducted in Puskesmas
Sumowono, Semarang Regency. The
implementation of this study has been
conducted in August 2016. The analysis used in
this research is Univariate Analysis with
frequency distribution (Saryono, 2011)
III. RESULT AND DISCUSSION
A. Univariate
1. Age of Mother
Table 5.1 Age of Mother at Risk of LBW
2. Age of Pregnancy
Table 5.2 Age of Pregnancy at Risk of LBW
3. Nutritional Status
Table 5.3 Nutritional Status at Risk of LBW
Age of Mother Frequency Percentage (%)
20-35 years
1. < 20 years dan > 35 years
37
35
51,4
48,6
Total 72 100,0
Age of Pregnancy Frequency Percentage (%)
37-42 weeks
< 37 weeks
68
4
94,4
5,6
Total 72 100,0
Nutritional status
Frequency Percentage ( %)
1. LILA ≥ 23,5 cm 40 55,6
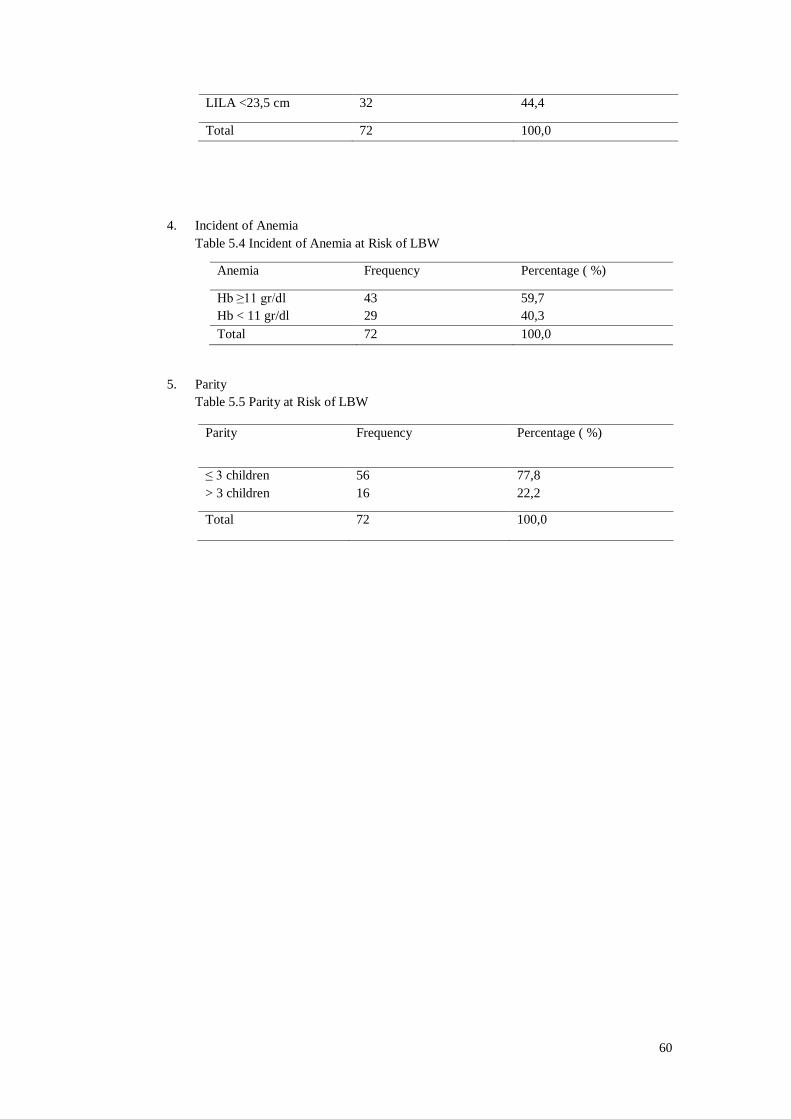
60
4. Incident of Anemia
Table 5.4 Incident of Anemia at Risk of LBW
5. Parity
Table 5.5 Parity at Risk of LBW
2. LILA <23,5 cm 32 44,4
Total 72 100,0
Anemia Frequency Percentage ( %)
1. Hb ≥11 gr/dl
Hb < 11 gr/dl
43
29
59,7
40,3
Total 72 100,0
Parity Frequency Percentage ( %)
≤ 3 children
> 3 children
56
16
77,8
22,2
Total 72 100,0
61
1. The overview of maternal age during pregnancy
at LBW risk di Puskesmas Sumowono, Semarang.
The mother age is an individual's age counted
from the moment of birth until the time of study, the
more enough the mother's age, the maturity level of
one's reproductive organs and strength will be more
mature. The result of research conducted in
Puskesmas Sumowono, Semarang in 2016, is known
that the percentage of respondents aged 20-35 years
is 51.4% (37 respondents), higher than the
respondents aged <20 years and ≥ 35 years is 48.6 %
(35 respondents). This shows that the age of 20-35
years is a good age to give birth because of the age
of 20-35 years it is a reproductive age and it is called
adulthood, where at this time people have been able
to prevent problems faced with calm emotionally,
especially in facing of pregnancy, childbirth,
postpartum, and taking care their baby later. At this
reproductive age the reproductive organ is mature,
and hormonal balance is still optimal. This makes
the process of conception, the development of the
fetus in the mother's womb until the baby is ready to
be born can run well, so as to reduce the emergence
of other risk factors that accompany pregnancy that
can endanger the mother and fetus in the womb.
Respondents aged 20-35 years are not at risk of
delivering LBW babies, namely 51.4% (37
respondents). But the reality in Puskesmas
Sumowono, even though the mother age during
pregnancy is more than 20-35 years old, but it still
gives birth to a baby with low birth weight. This is
known from the result of research obtained at
Puskesmas Sumowono in 2014-2015 the mother age
during normal childbirth, namely at the age of 21
years, but there are the other factors that the mother
experiences that the mother has a nutritional status
lacking with maternal LILA 21 cm, and the mother
also experiences anemia with a maternal
hemoglobin state of less than 11 gr / dl ie maternal
Hb of 10.2 gr / dl. It can also be explained in the
Master table on the number of 12 of 2014 the result
of research obtained by researchers that although
maternal age is normal during pregnancy but there
are other factors causing LBW, mother experiences
anemia with maternal hemoglobin 10 g / dl, mother
has more children of three, and giving birth mother
with a gestational age of less than 37 weeks, which
is 36 + 2 weeks, because it has been explained that
the nutritional status of mother during pregnancy
really affects the birth of a normal baby. if the
mother has normal nutritional status while pregnant
then most likely the mother will give birth a normal
baby, but on the contrary if the mother is
malnourished during pregnancy then the mother will
give birth to an abnormal baby. Aside from maternal
nutrition that must be fulfilled, the mother may not
experience anemia during pregnancy. Because if the
mother is pregnant with anemia, it will affect the
fetus who is born because the blood needs in the
mother is less, besides the mother is not anemic, the
baby will not be less from 37 weeks. The smaller the
gestational age, the bigger the mother will give birth
to a baby with low birth weight, and vice versa if the
maternal age is getting bigger, then the chances of
the mother giving birth to a baby with low birth rate
is low.
2. The overview of pregnancy age factor causing LBW
in Puskesmas Sumowono, Semarang.
From the result of research conducted in
Puskesmas Sumowono, Semarang, it is known that
the percentage of respondents whose gestational age
is 37-42 weeks is 94.4% (68 respondents), higher
than the respondents who have a pregnancy age <37
weeks and> 42 weeks namely 5.6% (4 respondents).
This indicates that a gestational age of 27-42 weeks
is the perfect age to give birth to a baby and the age
is ripe for childbirth. Age of maternal pregnancy has
the effect of complications in pregnancy, childbirth
and postpartum. At the beginning of pregnancy the
weight gain occurs so that it is large for the
preparation of maternal organs. In the next stage the
increase in body weight is more concentrated than
the addition of the fetus, so that the older the
gestational age, the more weight the baby will be
born.
But from the result of research conducted at
Puskesmas Sumowono, although the higher number
of mothers who give birth at 37-42 weeks of
gestation, where the age is the age that does not
cause risk, but from the result of the study even
though the mother give birth with a gestational age
of 37-42 weeks still giving birth to a baby with low
birth rate. This can be influenced by several factors,
namely the mother experiences that it can be
explained from the Master table found in number 33
of 2014 that although the age of maternal pregnancy
does not cause risk but the age of the mother when
pregnant under 20 years is 19 years where the age
really affects the condition of the fetus that is born,
apart from the mother age and the nutritional status
of the mother during pregnancy is also lacking,
namely the condition of the mother's LIL less than
23.5 cm which is 22 cm, where if the nutritional
status of the mother is less during pregnancy, then
62
most likely the mother will give birth to an abnormal
baby or baby born in low birth weight. Because of
nutritional status mothers during pregnancy greatly
affect fetal growth in the uterus, in addition to the
lack of maternal nutritional status, mothers also
experience anemia with Hb less than 11 g / dl which
is 10 g / dl. Where if the mother has anemia during
pregnancy, most likely the baby will be born not
normal, because the maternal blood hemoglobin
level also affects the condition of the mother's fetus,
apart from a number of factors causing the baby to
be born with low birth weight condition pregnant
woman in Puskesmas Sumowono also still works in
the garden and market as trader.
3. The overview of nutritional status factor during
pregnancy at LBW risk in Puskesmas Sumowono,
Semarang.
From the result of research conducted in
Pukesmas Sumowono, Semarang, it is known that
the percentage of respondents who possess LILA ≥
23.5 cm is 55.6% (40 respondents), higher than the
respondents who have LILA <23.5 cm which are 44,
4% (32 respondents). This shows that the upper arm
circumference ≥ 23.5 cm is a normal nutritional
status both before pregnancy and during pregnancy.
Because mothers who are pregnant with nutritional
status must be fulfilled, and most of all respondents
in the public health center have good nutritional
status although there are still some who have
nutritional status when pregnant is not normal, this
can be influenced by several factors, such as
maternal age, pregnancy age, mother is not anemic,
and the number of mother is not more than 3 people.
But from the result of research conducted in
Puskesmas Sumowono, even though the highest
number of respondents who has LILA is above 23.5
cm, which iss not a risk for babies to be born, but
from the result of research conducted in Puskesmas
Sumowono, respondents who have LILA above
23.5cm, the respondent gives birth to a baby with the
condition of a baby with low birth weight, this can
be influenced by several factors, such as the mother
experiences, which it can be seen in the Master table
in 2014-2015 which despites the normal nutritional
status of the mother but the mother experiences
several factors causing the baby to be born with low
birth rate, that is, the mother experiences anemia
during pregnancy, namely the condition of maternal
hemoglobin is less than 11 g / dl, that is 10 g / dl,
because if the mother experiences anemia during
pregnancy, then most likely the baby will be born
with low birth weight, besides mother experiences
anemia, mother also has more than 3 children,
mother has children 4, where the number of children
born to mother is also very affected by children who
are born now. If more children are born, then most
likely the fetus will be born that will experience the
weight of baby low birth, because if the mother
experiences repeated pregnancies that it will cause
damaging to the blood vessels of the uterine wall
which is the circulation of nutrient intake to the fetus
where the amount of nutrition will be reduced
compared to the previous pregnancy. Besides the
number of children who are born, the gestational age
of the mother is less than 37 weeks is 36 + 2 weeks,
where the gestational age affects the fetus to be born,
if the greater the gestational age the fetus to be born
does not experience low birth weight, but on the
contrary if the gestational age is lower or less than
37 weeks the baby will that lt's most likely to
experience be the body of a baby is born low,
because gestational age greatly affects the weight of
the fetus born.
4. The overview of anemia factor during pregnancy
at LBW risk in Puskesmas Sumowono, Semarang.
Based on the result of research conducted in
Puskesmas Sumowono, Semarang, it is known that
the percentage of respondents who has Hb <11 gr /
dl is 59.7% (43 respondents), higher than the
respondents who have Hb ≥ 11 gr / dl of 40, 3% (29
respondents). The large number of respondents who
has Hb <11 g / dl, namely 59.7% (43 respondents)
caused LBW due to pregnancy when the mother of
the baby they conceived have several complications
which requires the fetus to be removed, apart from
complications from the fetus the mother also lacked
knowledge about age and status poor nutrition
during pregnancy, and mothers are also mostly a
farmer.
From the result of research conducted in
Puskesmas Sumowono, it can be seen from the
Master table in 2014-2015 which even though the
higher respondents are mother who does not
experience anemia with hemoglobin levels above
11gr / dl, but it can be seen on the Master table even
though the mother was not anemic but the mother
gives birth to a baby with a low birth rate, because
this can be influenced by several factors, such as the
age of the mother when she is under 20 years of age
which is 17 years when the mother's age is smaller
when pregnant, it will affect the condition of the
fetus in her birth. because the mother must divide the
63
nutrition in her body with the fetus she carries, and
the mother is still in the process of growth, but if the
mother's age above 20 years is less likely the mother
will not give birth to a baby with a low birth rate,
because the nutritional needs of the fetus are no
longer divided the fetus, apart from the age of the
mother, also experienced a lack of nutritional status,
namely LILA Mother turtle of 23.5cm, which is
22cm, where if the nutritional status of the mother is
less then most likely the baby will experience a low
birth weight, because nutrition greatly affects the
fetus's weight at birth, but on the contrary if the
mother nutritional status is good during pregnancy,
it is less likely that the mother will give birth to a
baby with low birth weight, apart from the
nutritional status of the age of the mother's
pregnancy it also greatly affects the fetus's weight at
birth, here it can be seen when the mother gives birth
that is less than 37 weeks, where if the gestational
age of the mother is less than 37 weeks that it affects
the weight of the fetus at birth, and most likely the
fetus is born with a low birth weight, because the
smaller the gestational age during pregnancy, then
most likely the baby to be born will experience low
birth weight or can cause a baby to be born with a
premature state, and vice versa if the greater the age
of the mother's pregnancy during pregnancy is less
likely to give birth to a baby with a low birth
condition.
5. The overview of parity factor during pregnancy at
LBW risk in Puskesmas Sumowono, Semarang.
Based on the result of research conducted in
Puskesmas Sumowono, Semarang, it is known that
the percentage of respondents whose parity is not at
risk (≤ 3 children), namely 77.8% (56 respondents),
is higher than the risky respondents (> 3 children),
namely 22.2 % (16 respondents), because where the
number of children greatly affects the occurrence of
risk factors both in the mother and the fetus to be
born and the mother's knowledge of how many
children must be born. Respondents who have ≤ 3
children were not at risk of delivering LBW babies,
this was due to maternal age, gestational age,
nutritional status, hemoglobin, and maternal parity
which are not at risk, so the mother is very small to
give birth to LBW babies.
But the reality is from the result of research
conducted in Puskesmas Sumowono, although the
highest is mother who has children less than 3
mothers, they still give birth to baby with low birth
conditions. This can be influenced by several factors
that mother experiences, which can be seen from the
year Master table. 2014-2915 the number of children
born to mother is unconscionable, in which new
mothers are one, but mothers give birth to babies
with low birth weight, from which we can see that
the mother's age during pregnancy is less than 20
years, namely 17 years of age, where age can affect
the occurrence of low birth weight because if the
younger the mother's age it is likely that the baby
will be born having a low birth weight, because the
nutritional intake given by the fetus is divided with
the mother's body, because the mother is still in the
process of growth so the mother must share her
nutrition with the mother's mother biological, and
vice versa if the mother's age during pregnancy is
older then less likely to give birth to a baby with a
low birth weight condition, apart from the mother
age, it can be seen also the nutritional status of the
mother in which the mother is malnourished, which
can be seen from the size of the LILA, where the
mother's LILA is less than 23.5cm, which is 22cm.
It will experience low birth weight, because
nutritional status during pregnancy affects fetal
growth in the womb, and vice versa if the nutritional
status of the mother is good during pregnancy. The
chances are the baby will be born to have a low birth
weight, then in addition to maternal nutritional status
can also be seen from gestational age where the
gestational age of the mother here is less than 37
weeks which is 36 + 1 week, if the gestational age is
less than 37 weeks then most likely the baby will be
born that will experience low birth weight, because
gestational age greatly affects the fetus they are
carrying, the older gestational age, the bigger the
baby will be born does not experience weight born
low, on the contrary, the younger the age of
pregnancy, the more likely the baby will be born to
experience low birth weight or the baby will
experience premature, even the baby will be born
can experience death.
IV. Conclusion
Based on the result of the in Puskesmas
Sumowono, Semarang, it can be seen the overview
of the risk factors in LBW, where most of them are
not at risk, who are not at risk according to the age
factor of pregnant women, namely 51.4%, maternal
age of pregnancy is 94.4%, the nutritional status of
the mother is 55,6%, anemia during pregnancy is
59.7% and parity as many as 77.8%. But some are at
risk for those at risk according to age factors of
pregnant women, namely 48.6%, gestational age is
5.6%, maternal nutritional status is 44.4%, anemia is
40.3% and for parity is 22.2 %.

64
Reference
(1) Cunningham, at. Al. 2005. William
Obstetri. Jakarta :EGC
(2) Dinkes. 2014. Angka kematian bayi. Profil
Kesehatan Kabupaten Semarang.
(3) Margareth. 2013. Kehamilan, Persalinan, dan
Nifas. Yogyakarta : Sorawajan Baru
(4) Notoatmojo, S. 2012. Metodologi Penelitian
Kesehatan. Jakarta: Rineka Cipta.
(5) Notoatnodjo, S. 2010. Promosi Kesehatan teori
dan Aplikatif. Jakarta : Rineka
(6) Suryono dan Ari Setiawan, 2011. Metodologi
Penelitian Kebidanan DIII, DIV, SI, dan SII.
Yogyakarta: Nuha Medika.
(7) Saryono. 2010. Metodologi Penelitian
Kesehatan. Jogjakarta: Mitra Cendikia Offset
(8) Sugiyono . 2010, Statistika Untuk
Penelitian.bandung : Alfabeta
65
Knowledge Differences Class X before and after Giving Counselling about
Sexual Infection in Mandiri Balaraja High School 2015
1stArifatul Hidayah
Public Health Sciences
State University Of Semarang
Semarang, Indonesia [email protected]
2ndTri Novitasari
Public Health Sciences
State University Of Semarang
Semarang, Indonesia [email protected]
Abstract — District Health Office in
Tangerang 2010 the case of sexually transmitted
disease the most are HIV/AIDS and Gonorrhea,
the prevalence of HIV/AIDS infection 20.3%
15.4%, gonorrhea and syphilis 4.6%(5.) One of the
factors that affect that is lack of knowledge about
PMS. The efforts increased knowledge about PMS
can be provided through counseling. The purpose
of this research is to know the difference in class
10 student knowledge before and after the given
health counselling about PMS in high school
Independent Balaraja. Research methods the
research design of this is pre-eksperimen design
with the menggunkan approach of one group
pretest-posttest. The number of samples in this
study i.e. 56 respondents using the total population.
Normality test using Kolmogrov smirov and test
different using Wilcoxon (test the dependent). The
results of this research are knowledge grade x
before given guidance value an average of 9.20 and
after given extension value an average of 16.07.
Bivariat analysis showed that the existence of a
difference before and after the given extension
with results p value 0.000 < α (0.05). Conclusion of
this research is the knowledge the students of class
x getting better after being given counselling on
HIV/AIDS. Keywords- Knowledge, Teenagers, Health
Counselling, STD
1. INTRODUCTION
Teenagers also need to know what it is of the
reproduction health of adolescents because will be
easy understand the signs of secondary sex itself.
According to the WHO reproductive health is a
State of physical, mental and social whole, not just
free of disease or disability in all aspects related to
the reproductive system, function and process(3).
The impact of the globalization era is shown
from the results of a Baseline Survey conducted by
PILAR (Center for information and services teens)
PKBI in West Java in 2000 revealed a 20.4% of
respondents consisting of high school in the district
of Balaraja has been doing intercourse (intercourse)
is now dating. The activity of teenagers in dating is
known by the term KNPI (kissing, necking, petting,
intercouse) and ffrom this action, teenagers will try
and do not know the negative impact so that
teenagers often fall(5).
HIV/AIDS cases are found year after year ever
increasing. According to the WHO (2007) the
number of AIDS sufferers in the world there are as
many as 33.3 million and in Asia there are as many
as 4.9 million cases. In Indonesia alone, according
to estimates of health RI in 2002 HIV/AIDS there
are as many as 110,000 and in 2006 rose to 193,000
and in 2007-2008 the number of cases it has been
dated to be 270,000 people(5).
In Indonesia, the sexually transmitted disease
that is most widely found is syphilis and gonorrhea.
The prevalence of sexually transmitted diseases in
Indonesia found very high in Bandung city, namely
the prevalence of gonorrhea infection as much as
37.4%, 34.5% of chlamydia, syphilis 25.2%. In the
city of Surabaya, the prevalence of chlamydia 33.7%
28.8%, syphilis and gonorrhea 19.8%. While in
Jakarta infection gonorrhea 29.8% 25.2%, syphilis
and chlamydia 22.7%.
In Indonesia, the sexually transmitted disease
that is most widely found is syphilis and gonorrhea.
The prevalence of sexually transmitted diseases in
Indonesia found very high in Bandung city, namely
the prevalence of gonorrhea infection as much as
37.4%, 34.5% of chlamydia, syphilis 25.2%. In the
city of Surabaya, the prevalence of chlamydia 33.7%
28.8%, syphilis and gonorrhea 19.8%. While in
66
Jakarta infection gonorrhea 29.8% 25.2%, syphilis
and chlamydia 22.7%.
In Indonesia the incidence of syphilis continue
to increase every year. The increase of disease is
evident since the year 2003 increased by 15.4%,
while in 2004 continued to show improvement being
18.9%, while the year 2005 increased to 22.1%.
Anyone can become infected with a sexually
transmitted disease. Growing trend of the increasing
spread of the disease is due to an bergonta sexual
behavior-change partners, and the existence of
premarital sexual relationships outside of marriage
and are quite high. Most sufferers of sexually
transmitted diseases are adolescents aged 15-20
years, but there is also a babyof contracting because
from her mother(9).
Based on data from Tangerang Regency Health
Office in the year 2010 with the case of sexually
transmitted disease the most are HIV/AIDS and
Gonorrhea, the prevalence of HIV/AIDS infection
20.3% 15.4%, gonorrhea and syphilis 4.6% (5).
From the preliminary results of a study
conducted by the method of interview on 10
adolescent respondents high school Mandiri
Balaraja, there are 7 students who do not understand
about sexually transmitted diseases.
II MATERIALS AND METHODS
A. The subject of the
Samples taken amounted to 54 respondents
consisted of grade X in the Mandiri Balaraja
high scholl with total sampling based on
inclusion criteria i.e 1) have never followed the
health counselling of PMS. 2) Present on the
research time
B. Instruments And Procedures
This research uses the instrument in the form
of a questionnaire sheet contains 20 questions. The
process is done in this research is initial data
retrieval by providing a questionnaire sheet contains
knowledge about PMS (pre test). Then researchers
provide health counseling about PMS. After being
given health counselling, students are given a
posttest for data retrieval final.
C. Statistics and analysis
Data are presented as mean ± SD. normality
test for measuring, data obtained has a normal
distribution with the Wilcoxon test done the
possibility of using the software SPSS 16.0 version.
III. RESULTS AND DISCUSSION
Research results prior counseling about PMS
obtained mean 9.20, highest value respondents 14,
the lowest value is 5, and the middle value 9.00, after
conducted health counseling about PMS, the value
of the mean of 16.07, highest value of 20, the lowest
value is 7, and the middle value16.00 .
Test Data is analyzed with normality test of
Kolmogorov-smirnov (table 1) obtained pvalue >
0.05, it means that all the data for knowledge about
PMS pre test and posttest usually distributed
Table 1. TEST FOR NORMALITY
Group Means SD)±)
Pre test
Post test
0.027
0.064
2540
2756
The results of the research obtained by the p-value <
0.000 (0.05) showed that there difference is a
significant of knowledge grade X before and after
the given health counseling about PMS in Mandiri
Balaraja high school.
Table 2. The results of the statistical test of
Wilcoxon
Variable Treatment N Mean
Knowledge
Before After
56 56
9.20 16.07
Before given counseling obtained a low
knowladge because most of the students of class X
have not understood about PMS, besides in Mandiri
Balaraja high school is there is no programmes
regarding health education , in particular in the
discuss about PMS. so the know result from
knowledge about health in particular regarding PMS
are not widely known by them, this shows that
education also affects the level of knowledge. It is
supported by the theory of the Interview and the
Goddess (2011), that the factors that affect the
knowledge is internal and external factors. Internal
factors that affect the knowledge one of them is
education, where education is required to get
information such as things that support the health so
it can improve quality of life (19).
Ignorance of the X high school students Balaraja
can also affected because in the family nobody ever
suffered from sexually transmitted diseases, so that
information about HIV/AIDS and the transmission
method of less note. It is supported by the theory of
Notoatmodjo (2010), how to obtain knowledge is
based on personal experience. Where personal
experience can be used in an effort to gain
knowledge by way of repeating the experience ever
obtained in solving problems facing the past(14).
From the results of the study can be seen that
after a health counseling about PMS most
respondents have knowledge well. This indicates
that the information has been obtained regarding
education through health education is very
67
important. And public awareness can improve
knowledge, so expect students not only know and
understand about PMS and how to penularanya, but
also want to implement a prevention menularnya
PMS. This is expressed by Notoatmodjo (2012),
stating that the health education health education
activities is done by spreading the message and
instill confidence, not only of the community
sehinggga aware, know and understand, but also
want to and can make an argument that there are
hubungannnya with health(15). According to
Nursalam (2003), said that the extension of health is
part of health promotion process intentionally
planned to create opportunities for individuals to
learn to improve awareness and increase the
knowledge and his skills in the interest of her
health(16)
Other factors that affect the knowledge is age.
The average age of the students of SMK is 14-16
years old. At the age of adolescence this is they have
a sense of curiosity is high, so as to allow the
respondent to receive knowledge about PMS as an
update of knowledge. Such a theory advanced by
Fudyartanta (2012), that the period of adolescence is
an important period to be given a positive education.
On this phase starts to happen changes both
physically, psychologically and socially. Physical
development is fast and quick mental development
especially in early adolescence teens have a sense of
making a high knowledge. All developments that
give rise to the need for a mental adjustment, attitude
and interest in something that is considered recently
by teen (6). The material in this study is quite interest i.e.
PMS a thing related to health resproduksi, thus
making the students become more interested to
know. Methods in research in using the method of
lecture, this method fits in the granting of health
education in teenagers who are educated are pretty
high. in addition to the lecture, were held questions
answers , which makes the students become more
open in conveying a question or statement, students
can exchange information. Instrumental in this
research grant of extension health using audio visual
media in the form of LCD with power point and
video cases are made in such a way in order to get
someone's attention. Extension officers or educators
who provide health counseling by using language
that is easy to understand for the listener, act as a
friend and create a relaxing atmosphere. In
accordance with the theory of Notoatmodjo (2003),
said that the climate of the learning process must be
created situations of life, joyful, and not too formal.
After the granting of health education, improved
knowledge on respondents. (13).
IV. CONCLUSION
Based on the results of the study it can be
concluded that there is a difference of knowledge
grade X before and after the given health counselling
about PMS with a p-value of 0.000 < α (0.05).
REFERENCE
(1) A Balogun, Joseph. The Effect of Professional
Education on the Knowledge and Attitudes of
PhysicalTherapist andOccupational Therapist
Students
(2) AbouAcquiredImmunodeficiencySyndrome.
file:///D:/jurnal%20internasional/ptj1073.pdf
(3) Agustina, Wulan. 2013. the influence of health
education to knowledge and attitudes About
HIV/AIDS in students of Class XI in SMUN 1
Terrace. http://ipi.380303.pdf.
(4) BKKBN. 2008. Population Data for Indonesia.
Jakarta: Health RI.
(5) Budiman and Agus. 2014. Capita Selekta
Questionnaire Knowledge and attitudes of
teenagers about HIV-AIDS in Sukoharjo 2
year 2013 SMAN (Scientific Thesis). The
Faculty Of Health Sciences UMS
(6) Health Office Tangerang Regency. 2010. the
Declaration of the Forum of maternal and
Child Health Care Tangerang Regency.
Access: http://tangerang kab.go.id/deklarasi-
forum-peduli-kesehatan-ibu-dan-anak-
kabupaten-tangerang/. Accessed on 20 may
2015.
(7) Fudyartanta, Ki. 2012. the psychology of
personality, Philosophical Paradigm,
Tipologis, Psychodynamic, and Organismik-
holistic. Yogyakarta: Pustaka Pelajar.
(8) Hidayat, Aziz Alimul. 2011. the method of
Midwifery Research Techniques Data analysis.
Salemba Jakarta Medika.
(9) Hurlock. 2011. Developmental Psychology an
approach throughout the life span of the Fifth
Edition. Salemba Jakarta Medika.
(10) Kumiran, Eni. 2012. the reproductive health of
teenagers and women. Salemba Jakarta
Medika.
(11) Manuaba, Ida Bagus Gede. 2009. To
understand the reproductive health of women.
Jakarta: ECG.
(12) Notoatmodjo, Soekidjo. 2003. Health Science.
Jakarta: PT Rineka Copyright
(13) Notoatmodjo, Soekidjo. 2005. Research
methodology. Jakarta: Cipta Rineka.
68
(14) Notoatmodjo, Soekidjo. 2007. Health
promotion and behavioral sciences. Jakarta:
Cipta Rineka.
(15) Notoatmodjo, Soekidjo. 2010. Health
promotion and behavioral sciences. Jakarta:
Cipta Rineka.
(16) Notoatmodjo, Soekidjo. 2012. Health Research
Methods, Mold 2. Jakarta: Cipta Rineka.
(17) Nursalam, 2003. Promotion, Attitude And
Behaviour Of Human Beings. PT Cipta
Rineka: Jakarta.
(18) Saif Abdul Bari. 2010. The practical guide
book Maternal and Neonatal health services.
Jakarta: Pt. Bina Sarwono Prawirohardjo
Library.
(19) Widyastuti (19). 2009. Reproductive health.
Yogyakarta: Fitramaya.
(20) Interview and goddess. 2011. The theory and
measurement of knowledge, attitude and
behavior of human beings. Yogyakarta: Graha.
(21) Bachruddin, W., Kalalo, F., & Kundre, R.
(2017). Pengaruh Penyuluhan Tentang Bahaya
Seks Bebas Terhadap Pengetahuan Remaja
Tentang Seks Bebas Di Sma Negeri Binsus 9
Manado. Jurnal Keperawatan, 5(1). Retrieved
from
https://ejournal.unsrat.ac.id/index.php/jkp/arti
cle/view/15788/15299
(22) Buzarudina, F. (2013). Efektivitas Penyuluhan
Kesehatan Reproduksi Remaja Terhadap
Tingkat Pengetahuan Siswa Sman 6
Kecamatan Pontianak Timur. Jurnal
Mahasiswa PSPD FK Universitas ….
(23) Muin, M., Salmah, U., & Sarake, M. (2013).
Hubungan Pengetahuan Penyakit Menular
Seksual (PMS) Dengan Tindakan Kebersihan
Alat Reproduksi Eksternal Remaja Putri Di
SMA Nasional Makassar Tahun 2013. Jurbal
FKM UNHAS, 1–12.
https://doi.org/10.5162/sensor2017/D1.4
(24)
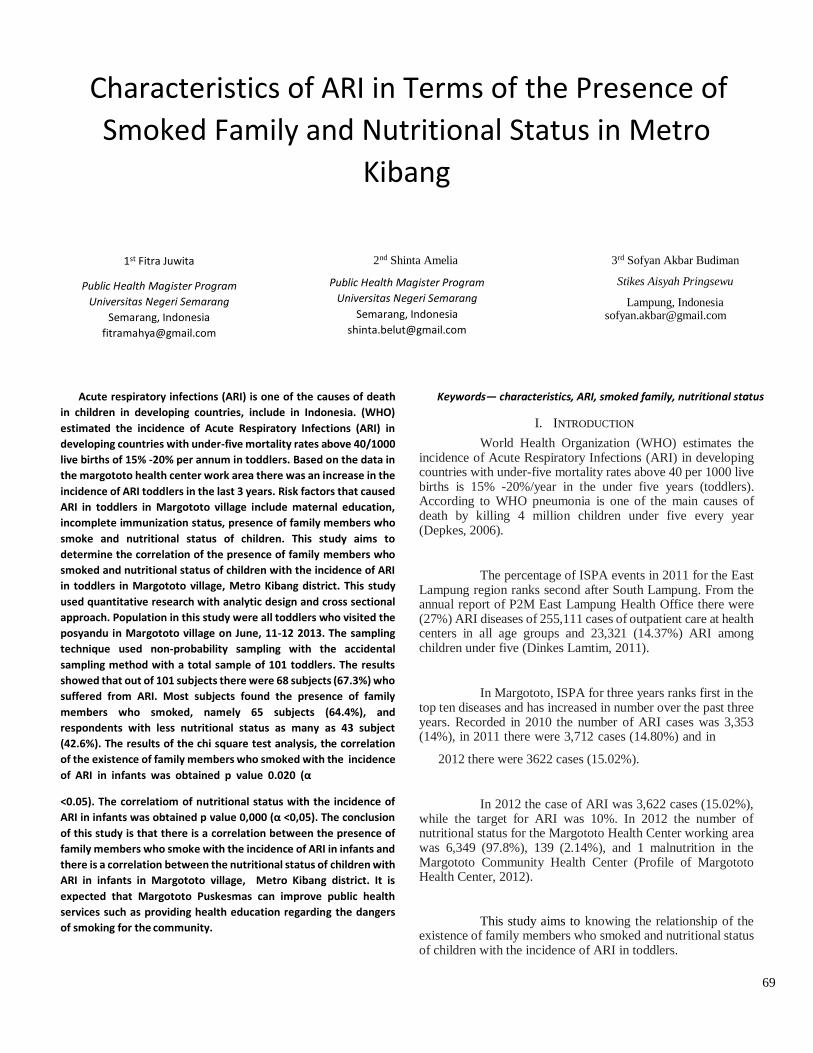
69
Characteristics of ARI in Terms of the Presence of
Smoked Family and Nutritional Status in Metro
Kibang
1st Fitra Juwita
Public Health Magister Program
Universitas Negeri Semarang
Semarang, Indonesia
2nd Shinta Amelia
Public Health Magister Program
Universitas Negeri Semarang
Semarang, Indonesia
3rd Sofyan Akbar Budiman
Stikes Aisyah Pringsewu
Lampung, Indonesia [email protected]
Acute respiratory infections (ARI) is one of the causes of death
in children in developing countries, include in Indonesia. (WHO)
estimated the incidence of Acute Respiratory Infections (ARI) in
developing countries with under-five mortality rates above 40/1000
live births of 15% -20% per annum in toddlers. Based on the data in
the margototo health center work area there was an increase in the
incidence of ARI toddlers in the last 3 years. Risk factors that caused
ARI in toddlers in Margototo village include maternal education,
incomplete immunization status, presence of family members who
smoke and nutritional status of children. This study aims to
determine the correlation of the presence of family members who
smoked and nutritional status of children with the incidence of ARI
in toddlers in Margototo village, Metro Kibang district. This study
used quantitative research with analytic design and cross sectional
approach. Population in this study were all toddlers who visited the
posyandu in Margototo village on June, 11-12 2013. The sampling
technique used non-probability sampling with the accidental
sampling method with a total sample of 101 toddlers. The results
showed that out of 101 subjects there were 68 subjects (67.3%) who
suffered from ARI. Most subjects found the presence of family
members who smoked, namely 65 subjects (64.4%), and
respondents with less nutritional status as many as 43 subject
(42.6%). The results of the chi square test analysis, the correlation
of the existence of family members who smoked with the incidence
of ARI in infants was obtained p value 0.020 (α
<0.05). The correlatiom of nutritional status with the incidence of
ARI in infants was obtained p value 0,000 (α <0,05). The conclusion
of this study is that there is a correlation between the presence of
family members who smoke with the incidence of ARI in infants and
there is a correlation between the nutritional status of children with
ARI in infants in Margototo village, Metro Kibang district. It is
expected that Margototo Puskesmas can improve public health
services such as providing health education regarding the dangers
of smoking for the community.
Keywords— characteristics, ARI, smoked family, nutritional status
I. INTRODUCTION
World Health Organization (WHO) estimates the incidence of Acute Respiratory Infections (ARI) in developing countries with under-five mortality rates above 40 per 1000 live births is 15% -20%/year in the under five years (toddlers). According to WHO pneumonia is one of the main causes of death by killing 4 million children under five every year (Depkes, 2006).
The percentage of ISPA events in 2011 for the East Lampung region ranks second after South Lampung. From the annual report of P2M East Lampung Health Office there were (27%) ARI diseases of 255,111 cases of outpatient care at health centers in all age groups and 23,321 (14.37%) ARI among children under five (Dinkes Lamtim, 2011).
In Margototo, ISPA for three years ranks first in the top ten diseases and has increased in number over the past three years. Recorded in 2010 the number of ARI cases was 3,353 (14%), in 2011 there were 3,712 cases (14.80%) and in
2012 there were 3622 cases (15.02%).
In 2012 the case of ARI was 3,622 cases (15.02%), while the target for ARI was 10%. In 2012 the number of nutritional status for the Margototo Health Center working area was 6,349 (97.8%), 139 (2.14%), and 1 malnutrition in the Margototo Community Health Center (Profile of Margototo Health Center, 2012).
This study aims to knowing the relationship of the existence of family members who smoked and nutritional status of children with the incidence of ARI in toddlers.
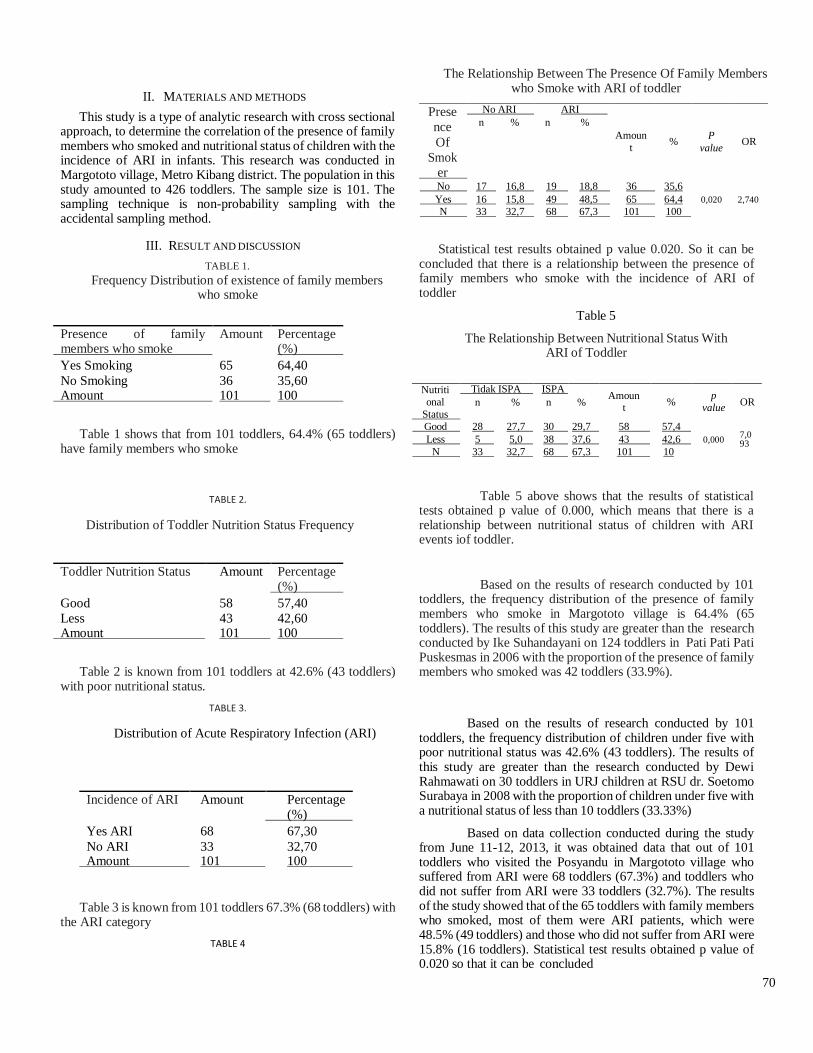
70
II. MATERIALS AND METHODS
This study is a type of analytic research with cross sectional approach, to determine the correlation of the presence of family members who smoked and nutritional status of children with the incidence of ARI in infants. This research was conducted in Margototo village, Metro Kibang district. The population in this study amounted to 426 toddlers. The sample size is 101. The sampling technique is non-probability sampling with the accidental sampling method.
III. RESULT AND DISCUSSION
TABLE 1.
Frequency Distribution of existence of family members who smoke
Presence of family members who smoke
Amount Percentage (%)
Yes Smoking
No Smoking Amount
65
36 101
64,40
35,60 100
Table 1 shows that from 101 toddlers, 64.4% (65 toddlers) have family members who smoke
TABLE 2.
Distribution of Toddler Nutrition Status Frequency
Toddler Nutrition Status Amount Percentage (%)
Good
Less Amount
58
43 101
57,40
42,60 100
Table 2 is known from 101 toddlers at 42.6% (43 toddlers) with poor nutritional status.
TABLE 3.
Distribution of Acute Respiratory Infection (ARI)
Incidence of ARI Amount Percentage (%)
Yes ARI
No ARI Amount
68
33 101
67,30
32,70 100
Table 3 is known from 101 toddlers 67.3% (68 toddlers) with the ARI category
TABLE 4
The Relationship Between The Presence Of Family Members who Smoke with ARI of toddler
Prese
nce
Of
Smok er
No ARI ARI
n % n %
Amoun
t %
P
value OR
No 17 16,8 19 18,8 36 35,6
Yes 16 15,8 49 48,5 65 64,4 0,020 2,740
N 33 32,7 68 67,3 101 100
Statistical test results obtained p value 0.020. So it can be concluded that there is a relationship between the presence of family members who smoke with the incidence of ARI of toddler
Table 5
The Relationship Between Nutritional Status With ARI of Toddler
Nutriti
onal
Status
Tidak ISPA ISPA Amoun
t
p
value
n % n % % OR
Good 28 27,7 30 29,7 58 57,4
7,0 93
0
Less 5 5,0 38 37,6 43 42,6 0,000
N 33 32,7 68 67,3 101 10
Table 5 above shows that the results of statistical tests obtained p value of 0.000, which means that there is a relationship between nutritional status of children with ARI events iof toddler.
Based on the results of research conducted by 101 toddlers, the frequency distribution of the presence of family members who smoke in Margototo village is 64.4% (65 toddlers). The results of this study are greater than the research conducted by Ike Suhandayani on 124 toddlers in Pati Pati Pati Puskesmas in 2006 with the proportion of the presence of family members who smoked was 42 toddlers (33.9%).
Based on the results of research conducted by 101 toddlers, the frequency distribution of children under five with poor nutritional status was 42.6% (43 toddlers). The results of this study are greater than the research conducted by Dewi Rahmawati on 30 toddlers in URJ children at RSU dr. Soetomo Surabaya in 2008 with the proportion of children under five with a nutritional status of less than 10 toddlers (33.33%)
Based on data collection conducted during the study from June 11-12, 2013, it was obtained data that out of 101 toddlers who visited the Posyandu in Margototo village who suffered from ARI were 68 toddlers (67.3%) and toddlers who did not suffer from ARI were 33 toddlers (32.7%). The results of the study showed that of the 65 toddlers with family members who smoked, most of them were ARI patients, which were 48.5% (49 toddlers) and those who did not suffer from ARI were 15.8% (16 toddlers). Statistical test results obtained p value of 0.020 so that it can be concluded
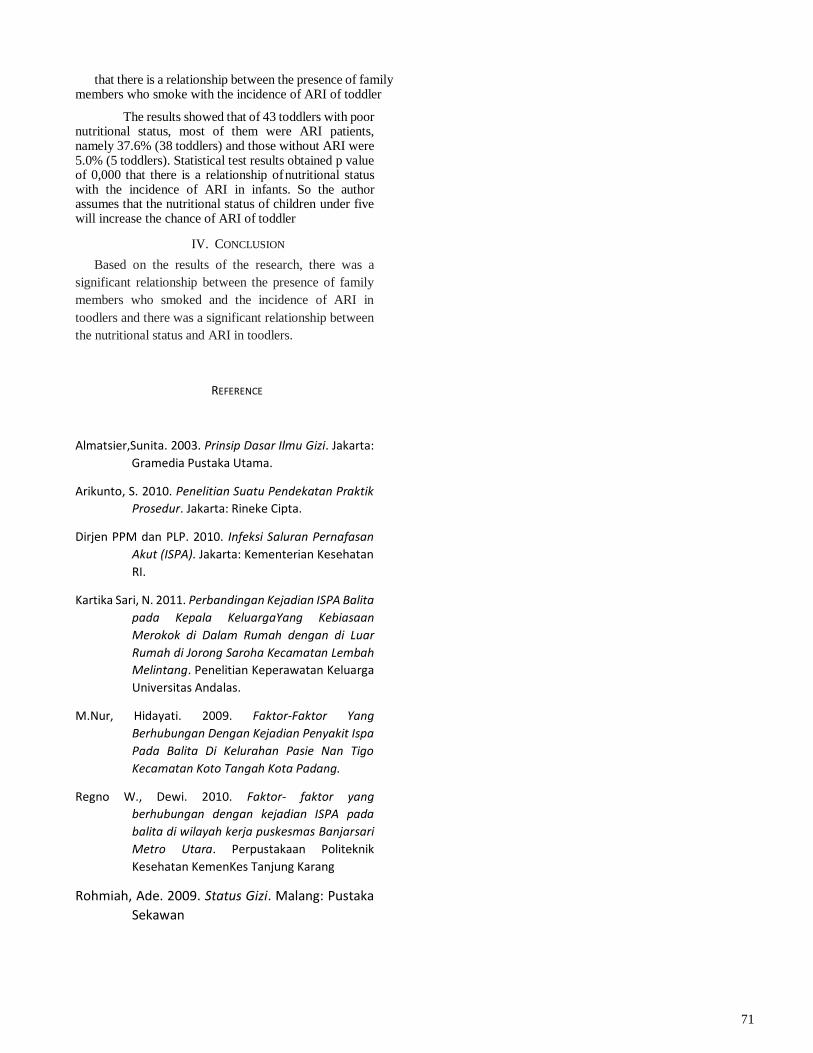
71
that there is a relationship between the presence of family members who smoke with the incidence of ARI of toddler
The results showed that of 43 toddlers with poor nutritional status, most of them were ARI patients, namely 37.6% (38 toddlers) and those without ARI were 5.0% (5 toddlers). Statistical test results obtained p value of 0,000 that there is a relationship of nutritional status with the incidence of ARI in infants. So the author assumes that the nutritional status of children under five will increase the chance of ARI of toddler
IV. CONCLUSION
Based on the results of the research, there was a
significant relationship between the presence of family
members who smoked and the incidence of ARI in
toodlers and there was a significant relationship between
the nutritional status and ARI in toodlers.
REFERENCE
Almatsier,Sunita. 2003. Prinsip Dasar Ilmu Gizi. Jakarta:
Gramedia Pustaka Utama.
Arikunto, S. 2010. Penelitian Suatu Pendekatan Praktik
Prosedur. Jakarta: Rineke Cipta.
Dirjen PPM dan PLP. 2010. Infeksi Saluran Pernafasan
Akut (ISPA). Jakarta: Kementerian Kesehatan
RI.
Kartika Sari, N. 2011. Perbandingan Kejadian ISPA Balita
pada Kepala KeluargaYang Kebiasaan
Merokok di Dalam Rumah dengan di Luar
Rumah di Jorong Saroha Kecamatan Lembah
Melintang. Penelitian Keperawatan Keluarga
Universitas Andalas.
M.Nur, Hidayati. 2009. Faktor-Faktor Yang
Berhubungan Dengan Kejadian Penyakit Ispa
Pada Balita Di Kelurahan Pasie Nan Tigo
Kecamatan Koto Tangah Kota Padang.
Regno W., Dewi. 2010. Faktor- faktor yang
berhubungan dengan kejadian ISPA pada
balita di wilayah kerja puskesmas Banjarsari
Metro Utara. Perpustakaan Politeknik
Kesehatan KemenKes Tanjung Karang
Rohmiah, Ade. 2009. Status Gizi. Malang: Pustaka
Sekawan
72
Level of Preference, Economic Value and Nutrition on Spring Rolls the Katuk Leaf
1st
Bernadetha 2nd
Diah U’um Ulfiah 3rd
Ratih Wirapuspita
Public Health Magister Program Public Health Magister Program Faculty of Public Health
Universitas Negeri Semarang Universitas Negeri Semarang Universitas Mulawarman
Semarang, Indonesia Semarang, Indonesia Samarinda, Indonesia
[email protected] [email protected] [email protected]
Abstract- Nutritional intake Breastfeeding mothers can
influence the baby during breastfeeding has an impact on the
nutritional needs of breastfeeding mothers. Clumps of katuk
leaves are processed food supplemental spring rolls made from
spring rolls filled with katuk leaves. Katuk leaf spring rolls for
breastfeeding mothers milk production are needed for baby
growth. The study aims to determine the level of preference and
nutrient content of katuk leaf spring rolls. Research design used
pre-experiment. At the Mulawarman University Agricultural
laboratory. The sampling technique with a completely
randomized design was analyzed using Kruskall Wallis with a
significant level of p <0.05. The results of the panelist test
statistical test (ρ = 0.000). Results of Organoleptic Assessment
Color lumpia A score of 3.84 B 3.625 and C 3.775 Texture
lumpia A 3.76 B 3.72 C 3.77 Aroma A 3.85, B 3,525 and C 3.70.
Taste A 3,758, B 3.76 and C 3.76. Kruskal Wallis test with
asymp. Colorig 0,851, flavor 0,977, aroma 0,670 and texture
0,820 with katuk leaf lumpia in conducting panelist test. The
level of preference of leaf lumpia katuk has no difference
between spring rolls A, B and C. Analysis of laboratory results
on the highest nutrient content in Spring Rolls namely Protein
3.26, Fat 4.26, Moisture Content 13.27, Ash Content 0.24, 0.035
Fiber and Carbohydrate Levels 78.9. Lumpia filled with katuk
leaves produce as much as 368.00 Kcal of energy. And the
economic value of the three Lumpia A samples is Rp. 1,053, B
Rp. 1,063 C Rp. 1,153. Suggestions for further research on
frying and leaf storage for leaf better to obtain better results.
Keywords- Spring rolls, The Katuk Leaf, Level of Preference,
Economic Value, Nutrition
I. INTRODUCTION
Coverage of nutritional intake Breastfeeding
mothers can influence the growth of the baby. Physical
and biological changes during breastfeeding have an impact on maternal nutritional needs. Thus during
breastfeeding, the mother must have nutritional needs
so that the breastfeeding output of breast milk (ASI) can
succeed well and perfectly. Inadequate nutritional intake of food during breastfeeding can not only cause
disruption to baby growth, but it is feared that it can also
reduce milk production [1].
Based on the annual report of the East Kalimantan Provincial Health Office from 2011 to
2013, data on Exclusive ASI Coverage was obtained. In
2011 there were 38.34% in February, 72.23% in 2012 and decreased to August 61.19% and 62.5% in 2013,
exclusive ASI coverage in February was the same as the
previous year in August in 2013 fell to 54.5%.
Katuk leaf vegetables (Sauropus androgynus) can facilitate breast milk, anti-germ and anti-fat,
because they contain estrogenic sterol compounds that
spur the production and expenditure of ASI. These
vegetables are also rich in chlorophyll which can cleanse the body's tissues and waste disposal of
metabolic waste, while being antiparasitic,
antibacterial, antiviral and cleanse toxins in the body. Based on research, katuk leaves contain ephedrine. In
addition, according to the study, in 100 g of katuk leaves
contained: energy 59 kcal, protein 6.4 grams, fat 1.0
grams, fiber 1.5 grams, ash 1.7 grams, calcium 204 mg, phosphorus 83 mg, iron 2.7 mg, vitamin A 10.370 SI, B
0.1, and C 239 mg, and water 81 grams [2]. Katuk
leaves are usually sauteed or made clear vegetables. This vegetable is rich in vitamin A and Vitamin C.
Vitamin A is good for eye health, cell growth, immune
system, reproduction, and maintaining healthy skin.
The Vitamin C is needed for collagen formation, regulate cholesterol levels, maintain healthy gums, and
maintain body resistance. Vitamin C is also needed for
wound healing and improves brain function in order to work optimally [1].
Katuk leaf spring rolls are processed food
additives to treat spring rolls -shaped snacks generally
made from spring roll skin wrapped in spring roll with katuk leaf mixture is beef that has been cut into small
pieces added with carrots, garlic and salt spices. Katuk
leaf spring is suitable for the daily menu of breastfeeding mothers who aim to increase the
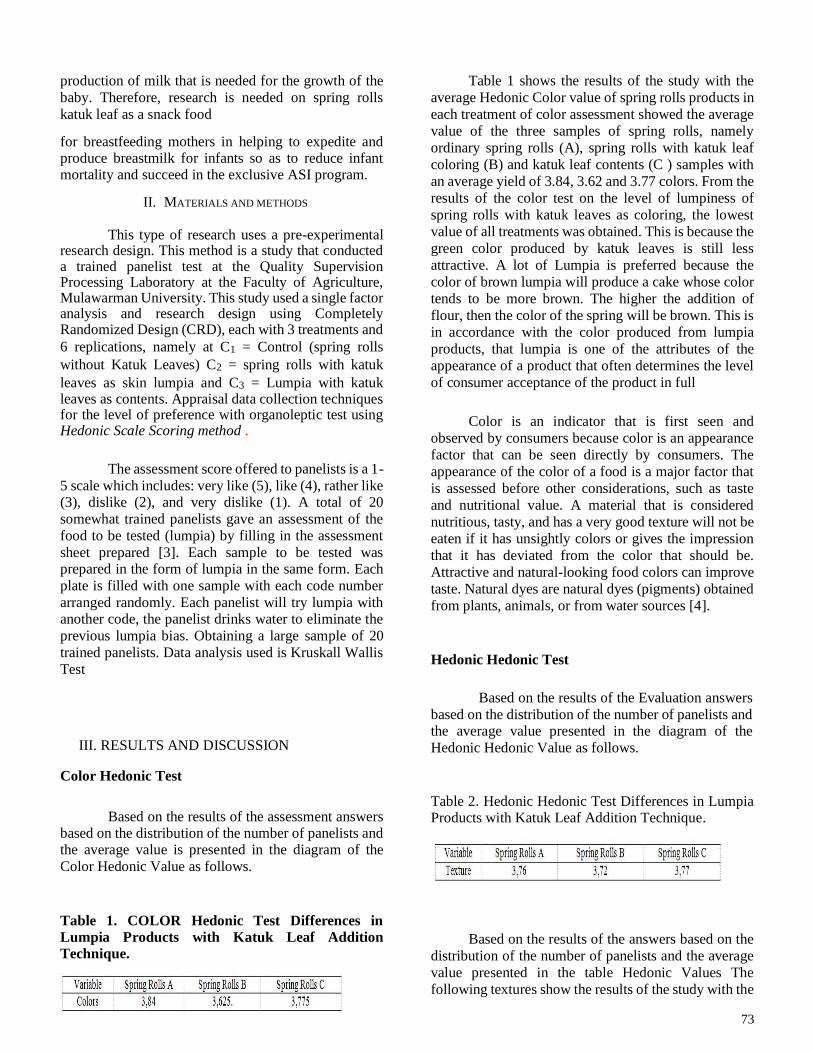
73
production of milk that is needed for the growth of the
baby. Therefore, research is needed on spring rolls
katuk leaf as a snack food
for breastfeeding mothers in helping to expedite and produce breastmilk for infants so as to reduce infant mortality and succeed in the exclusive ASI program.
II. MATERIALS AND METHODS
This type of research uses a pre-experimental research design. This method is a study that conducted a trained panelist test at the Quality Supervision Processing Laboratory at the Faculty of Agriculture, Mulawarman University. This study used a single factor analysis and research design using Completely Randomized Design (CRD), each with 3 treatments and
6 replications, namely at C1 = Control (spring rolls
without Katuk Leaves) C2 = spring rolls with katuk
leaves as skin lumpia and C3 = Lumpia with katuk leaves as contents. Appraisal data collection techniques for the level of preference with organoleptic test using Hedonic Scale Scoring method .
The assessment score offered to panelists is a 1-
5 scale which includes: very like (5), like (4), rather like (3), dislike (2), and very dislike (1). A total of 20
somewhat trained panelists gave an assessment of the
food to be tested (lumpia) by filling in the assessment
sheet prepared [3]. Each sample to be tested was prepared in the form of lumpia in the same form. Each
plate is filled with one sample with each code number
arranged randomly. Each panelist will try lumpia with another code, the panelist drinks water to eliminate the
previous lumpia bias. Obtaining a large sample of 20
trained panelists. Data analysis used is Kruskall Wallis
Test
III. RESULTS AND DISCUSSION
Color Hedonic Test
Based on the results of the assessment answers based on the distribution of the number of panelists and the average value is presented in the diagram of the
Color Hedonic Value as follows.
Table 1. COLOR Hedonic Test Differences in
Lumpia Products with Katuk Leaf Addition
Technique.
Table 1 shows the results of the study with the
average Hedonic Color value of spring rolls products in
each treatment of color assessment showed the average
value of the three samples of spring rolls, namely
ordinary spring rolls (A), spring rolls with katuk leaf
coloring (B) and katuk leaf contents (C ) samples with
an average yield of 3.84, 3.62 and 3.77 colors. From the
results of the color test on the level of lumpiness of
spring rolls with katuk leaves as coloring, the lowest
value of all treatments was obtained. This is because the
green color produced by katuk leaves is still less
attractive. A lot of Lumpia is preferred because the
color of brown lumpia will produce a cake whose color
tends to be more brown. The higher the addition of
flour, then the color of the spring will be brown. This is
in accordance with the color produced from lumpia
products, that lumpia is one of the attributes of the
appearance of a product that often determines the level
of consumer acceptance of the product in full
Color is an indicator that is first seen and
observed by consumers because color is an appearance
factor that can be seen directly by consumers. The
appearance of the color of a food is a major factor that
is assessed before other considerations, such as taste
and nutritional value. A material that is considered
nutritious, tasty, and has a very good texture will not be
eaten if it has unsightly colors or gives the impression
that it has deviated from the color that should be.
Attractive and natural-looking food colors can improve
taste. Natural dyes are natural dyes (pigments) obtained
from plants, animals, or from water sources [4].
Hedonic Hedonic Test
Based on the results of the Evaluation answers
based on the distribution of the number of panelists and the average value presented in the diagram of the
Hedonic Hedonic Value as follows.
Table 2. Hedonic Hedonic Test Differences in Lumpia Products with Katuk Leaf Addition Technique.
Based on the results of the answers based on the
distribution of the number of panelists and the average
value presented in the table Hedonic Values The
following textures show the results of the study with the
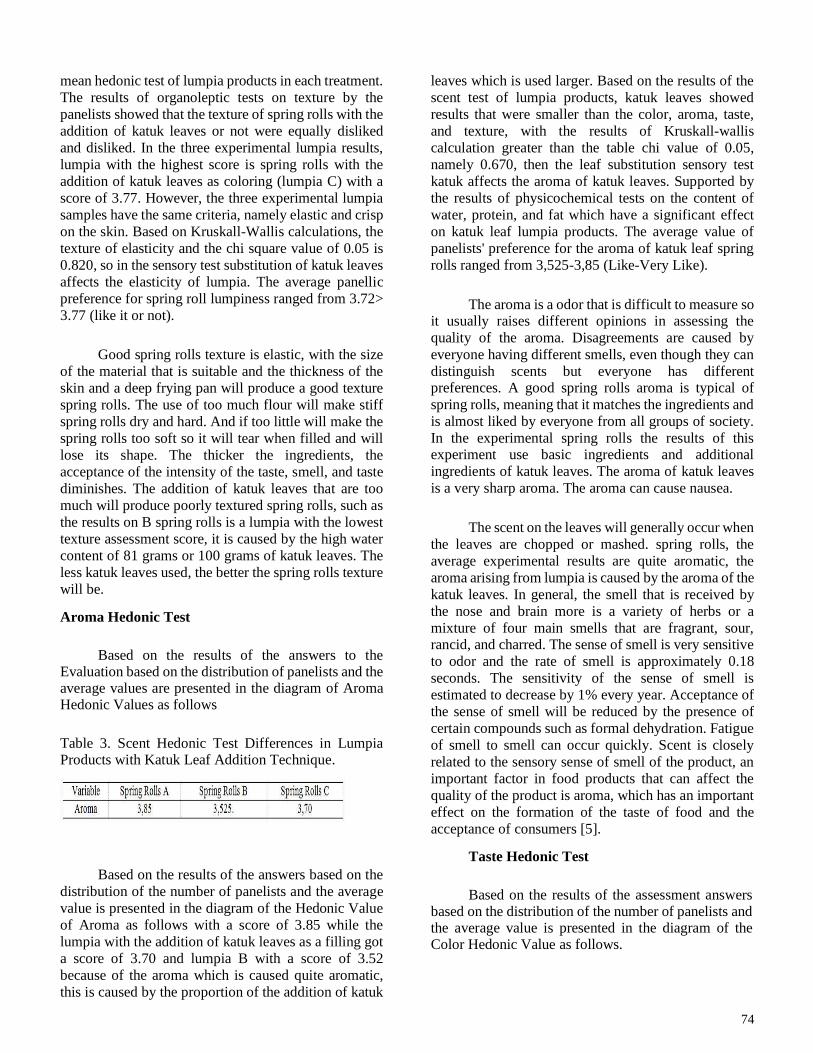
74
mean hedonic test of lumpia products in each treatment.
The results of organoleptic tests on texture by the
panelists showed that the texture of spring rolls with the
addition of katuk leaves or not were equally disliked
and disliked. In the three experimental lumpia results,
lumpia with the highest score is spring rolls with the
addition of katuk leaves as coloring (lumpia C) with a
score of 3.77. However, the three experimental lumpia
samples have the same criteria, namely elastic and crisp
on the skin. Based on Kruskall-Wallis calculations, the
texture of elasticity and the chi square value of 0.05 is
0.820, so in the sensory test substitution of katuk leaves
affects the elasticity of lumpia. The average panellic
preference for spring roll lumpiness ranged from 3.72>
3.77 (like it or not).
Good spring rolls texture is elastic, with the size
of the material that is suitable and the thickness of the
skin and a deep frying pan will produce a good texture
spring rolls. The use of too much flour will make stiff
spring rolls dry and hard. And if too little will make the
spring rolls too soft so it will tear when filled and will
lose its shape. The thicker the ingredients, the
acceptance of the intensity of the taste, smell, and taste
diminishes. The addition of katuk leaves that are too
much will produce poorly textured spring rolls, such as
the results on B spring rolls is a lumpia with the lowest
texture assessment score, it is caused by the high water
content of 81 grams or 100 grams of katuk leaves. The
less katuk leaves used, the better the spring rolls texture
will be.
Aroma Hedonic Test
Based on the results of the answers to the Evaluation based on the distribution of panelists and the average values are presented in the diagram of Aroma Hedonic Values as follows
Table 3. Scent Hedonic Test Differences in Lumpia Products with Katuk Leaf Addition Technique.
Based on the results of the answers based on the
distribution of the number of panelists and the average
value is presented in the diagram of the Hedonic Value
of Aroma as follows with a score of 3.85 while the
lumpia with the addition of katuk leaves as a filling got
a score of 3.70 and lumpia B with a score of 3.52
because of the aroma which is caused quite aromatic,
this is caused by the proportion of the addition of katuk
leaves which is used larger. Based on the results of the
scent test of lumpia products, katuk leaves showed
results that were smaller than the color, aroma, taste,
and texture, with the results of Kruskall-wallis
calculation greater than the table chi value of 0.05,
namely 0.670, then the leaf substitution sensory test
katuk affects the aroma of katuk leaves. Supported by
the results of physicochemical tests on the content of
water, protein, and fat which have a significant effect
on katuk leaf lumpia products. The average value of
panelists' preference for the aroma of katuk leaf spring
rolls ranged from 3,525-3,85 (Like-Very Like).
The aroma is a odor that is difficult to measure so it usually raises different opinions in assessing the
quality of the aroma. Disagreements are caused by
everyone having different smells, even though they can
distinguish scents but everyone has different preferences. A good spring rolls aroma is typical of
spring rolls, meaning that it matches the ingredients and
is almost liked by everyone from all groups of society.
In the experimental spring rolls the results of this experiment use basic ingredients and additional
ingredients of katuk leaves. The aroma of katuk leaves
is a very sharp aroma. The aroma can cause nausea.
The scent on the leaves will generally occur when
the leaves are chopped or mashed. spring rolls, the
average experimental results are quite aromatic, the
aroma arising from lumpia is caused by the aroma of the
katuk leaves. In general, the smell that is received by
the nose and brain more is a variety of herbs or a
mixture of four main smells that are fragrant, sour, rancid, and charred. The sense of smell is very sensitive
to odor and the rate of smell is approximately 0.18
seconds. The sensitivity of the sense of smell is
estimated to decrease by 1% every year. Acceptance of
the sense of smell will be reduced by the presence of
certain compounds such as formal dehydration. Fatigue
of smell to smell can occur quickly. Scent is closely
related to the sensory sense of smell of the product, an
important factor in food products that can affect the
quality of the product is aroma, which has an important
effect on the formation of the taste of food and the
acceptance of consumers [5].
Taste Hedonic Test
Based on the results of the assessment answers based on the distribution of the number of panelists and the average value is presented in the diagram of the Color Hedonic Value as follows.
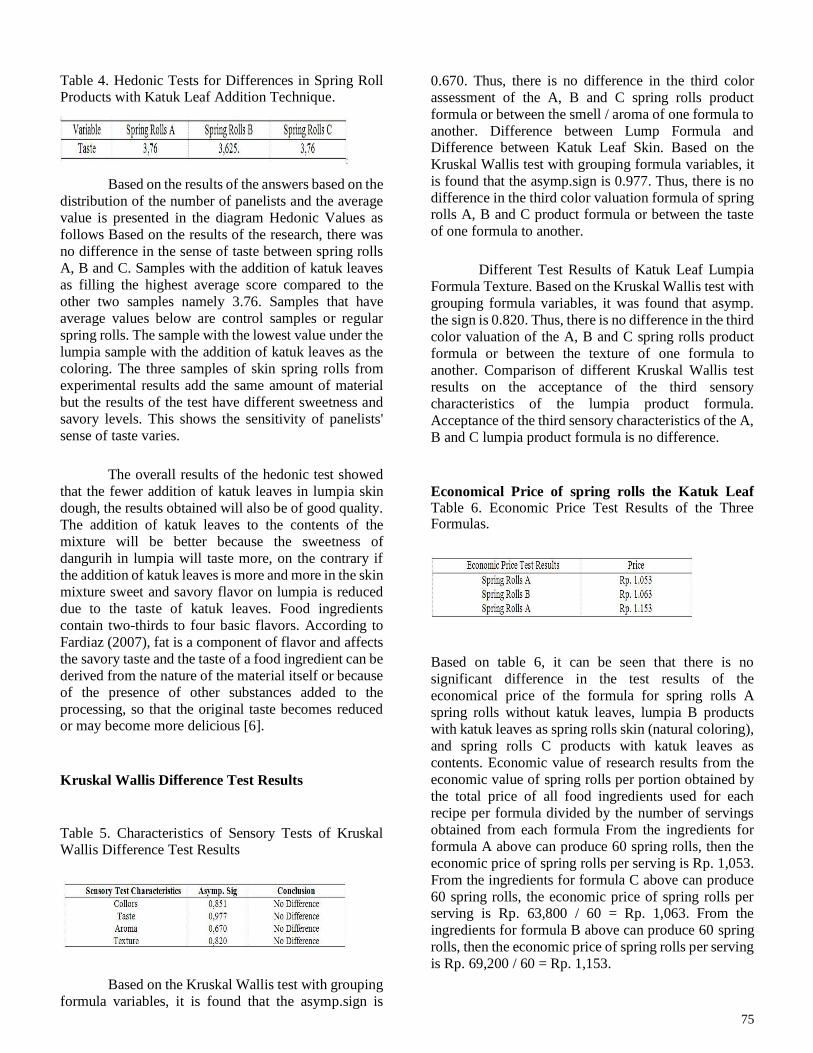
75
Table 4. Hedonic Tests for Differences in Spring Roll Products with Katuk Leaf Addition Technique.
Based on the results of the answers based on the
distribution of the number of panelists and the average
value is presented in the diagram Hedonic Values as
follows Based on the results of the research, there was
no difference in the sense of taste between spring rolls
A, B and C. Samples with the addition of katuk leaves
as filling the highest average score compared to the
other two samples namely 3.76. Samples that have
average values below are control samples or regular
spring rolls. The sample with the lowest value under the
lumpia sample with the addition of katuk leaves as the
coloring. The three samples of skin spring rolls from
experimental results add the same amount of material
but the results of the test have different sweetness and
savory levels. This shows the sensitivity of panelists'
sense of taste varies.
The overall results of the hedonic test showed
that the fewer addition of katuk leaves in lumpia skin
dough, the results obtained will also be of good quality.
The addition of katuk leaves to the contents of the
mixture will be better because the sweetness of
dangurih in lumpia will taste more, on the contrary if
the addition of katuk leaves is more and more in the skin
mixture sweet and savory flavor on lumpia is reduced
due to the taste of katuk leaves. Food ingredients
contain two-thirds to four basic flavors. According to
Fardiaz (2007), fat is a component of flavor and affects
the savory taste and the taste of a food ingredient can be
derived from the nature of the material itself or because
of the presence of other substances added to the
processing, so that the original taste becomes reduced or may become more delicious [6].
Kruskal Wallis Difference Test Results
Table 5. Characteristics of Sensory Tests of Kruskal Wallis Difference Test Results
Based on the Kruskal Wallis test with grouping
formula variables, it is found that the asymp.sign is
0.670. Thus, there is no difference in the third color
assessment of the A, B and C spring rolls product
formula or between the smell / aroma of one formula to
another. Difference between Lump Formula and Difference between Katuk Leaf Skin. Based on the
Kruskal Wallis test with grouping formula variables, it
is found that the asymp.sign is 0.977. Thus, there is no
difference in the third color valuation formula of spring rolls A, B and C product formula or between the taste
of one formula to another.
Different Test Results of Katuk Leaf Lumpia
Formula Texture. Based on the Kruskal Wallis test with
grouping formula variables, it was found that asymp.
the sign is 0.820. Thus, there is no difference in the third
color valuation of the A, B and C spring rolls product
formula or between the texture of one formula to
another. Comparison of different Kruskal Wallis test
results on the acceptance of the third sensory
characteristics of the lumpia product formula.
Acceptance of the third sensory characteristics of the A,
B and C lumpia product formula is no difference.
Economical Price of spring rolls the Katuk Leaf Table 6. Economic Price Test Results of the Three Formulas.
Based on table 6, it can be seen that there is no
significant difference in the test results of the
economical price of the formula for spring rolls A
spring rolls without katuk leaves, lumpia B products
with katuk leaves as spring rolls skin (natural coloring),
and spring rolls C products with katuk leaves as
contents. Economic value of research results from the
economic value of spring rolls per portion obtained by
the total price of all food ingredients used for each
recipe per formula divided by the number of servings
obtained from each formula From the ingredients for
formula A above can produce 60 spring rolls, then the
economic price of spring rolls per serving is Rp. 1,053.
From the ingredients for formula C above can produce
60 spring rolls, the economic price of spring rolls per serving is Rp. 63,800 / 60 = Rp. 1,063. From the
ingredients for formula B above can produce 60 spring
rolls, then the economic price of spring rolls per serving
is Rp. 69,200 / 60 = Rp. 1,153.
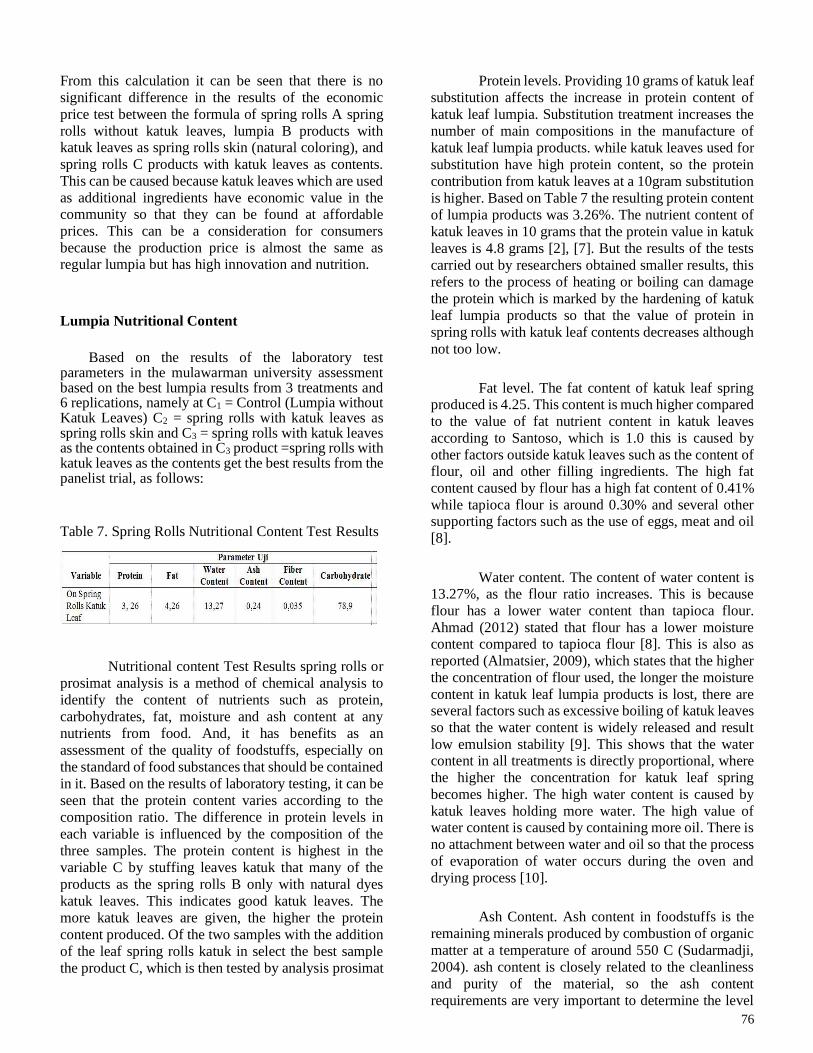
76
From this calculation it can be seen that there is no
significant difference in the results of the economic
price test between the formula of spring rolls A spring
rolls without katuk leaves, lumpia B products with katuk leaves as spring rolls skin (natural coloring), and
spring rolls C products with katuk leaves as contents.
This can be caused because katuk leaves which are used
as additional ingredients have economic value in the community so that they can be found at affordable
prices. This can be a consideration for consumers
because the production price is almost the same as regular lumpia but has high innovation and nutrition.
Lumpia Nutritional Content
Based on the results of the laboratory test parameters in the mulawarman university assessment based on the best lumpia results from 3 treatments and 6 replications, namely at C1 = Control (Lumpia without Katuk Leaves) C2 = spring rolls with katuk leaves as spring rolls skin and C3 = spring rolls with katuk leaves as the contents obtained in C3 product =spring rolls with katuk leaves as the contents get the best results from the panelist trial, as follows:
Table 7. Spring Rolls Nutritional Content Test Results
Nutritional content Test Results spring rolls or
prosimat analysis is a method of chemical analysis to
identify the content of nutrients such as protein,
carbohydrates, fat, moisture and ash content at any
nutrients from food. And, it has benefits as an
assessment of the quality of foodstuffs, especially on
the standard of food substances that should be contained
in it. Based on the results of laboratory testing, it can be
seen that the protein content varies according to the
composition ratio. The difference in protein levels in
each variable is influenced by the composition of the
three samples. The protein content is highest in the
variable C by stuffing leaves katuk that many of the
products as the spring rolls B only with natural dyes
katuk leaves. This indicates good katuk leaves. The
more katuk leaves are given, the higher the protein
content produced. Of the two samples with the addition
of the leaf spring rolls katuk in select the best sample
the product C, which is then tested by analysis prosimat
Protein levels. Providing 10 grams of katuk leaf
substitution affects the increase in protein content of
katuk leaf lumpia. Substitution treatment increases the
number of main compositions in the manufacture of
katuk leaf lumpia products. while katuk leaves used for
substitution have high protein content, so the protein
contribution from katuk leaves at a 10gram substitution
is higher. Based on Table 7 the resulting protein content
of lumpia products was 3.26%. The nutrient content of
katuk leaves in 10 grams that the protein value in katuk
leaves is 4.8 grams [2], [7]. But the results of the tests
carried out by researchers obtained smaller results, this
refers to the process of heating or boiling can damage
the protein which is marked by the hardening of katuk
leaf lumpia products so that the value of protein in
spring rolls with katuk leaf contents decreases although
not too low.
Fat level. The fat content of katuk leaf spring produced is 4.25. This content is much higher compared
to the value of fat nutrient content in katuk leaves
according to Santoso, which is 1.0 this is caused by
other factors outside katuk leaves such as the content of flour, oil and other filling ingredients. The high fat
content caused by flour has a high fat content of 0.41%
while tapioca flour is around 0.30% and several other supporting factors such as the use of eggs, meat and oil
[8].
Water content. The content of water content is 13.27%, as the flour ratio increases. This is because
flour has a lower water content than tapioca flour.
Ahmad (2012) stated that flour has a lower moisture content compared to tapioca flour [8]. This is also as
reported (Almatsier, 2009), which states that the higher
the concentration of flour used, the longer the moisture
content in katuk leaf lumpia products is lost, there are several factors such as excessive boiling of katuk leaves
so that the water content is widely released and result
low emulsion stability [9]. This shows that the water content in all treatments is directly proportional, where
the higher the concentration for katuk leaf spring
becomes higher. The high water content is caused by
katuk leaves holding more water. The high value of water content is caused by containing more oil. There is
no attachment between water and oil so that the process
of evaporation of water occurs during the oven and
drying process [10].
Ash Content. Ash content in foodstuffs is the
remaining minerals produced by combustion of organic
matter at a temperature of around 550 C (Sudarmadji,
2004). ash content is closely related to the cleanliness
and purity of the material, so the ash content
requirements are very important to determine the level
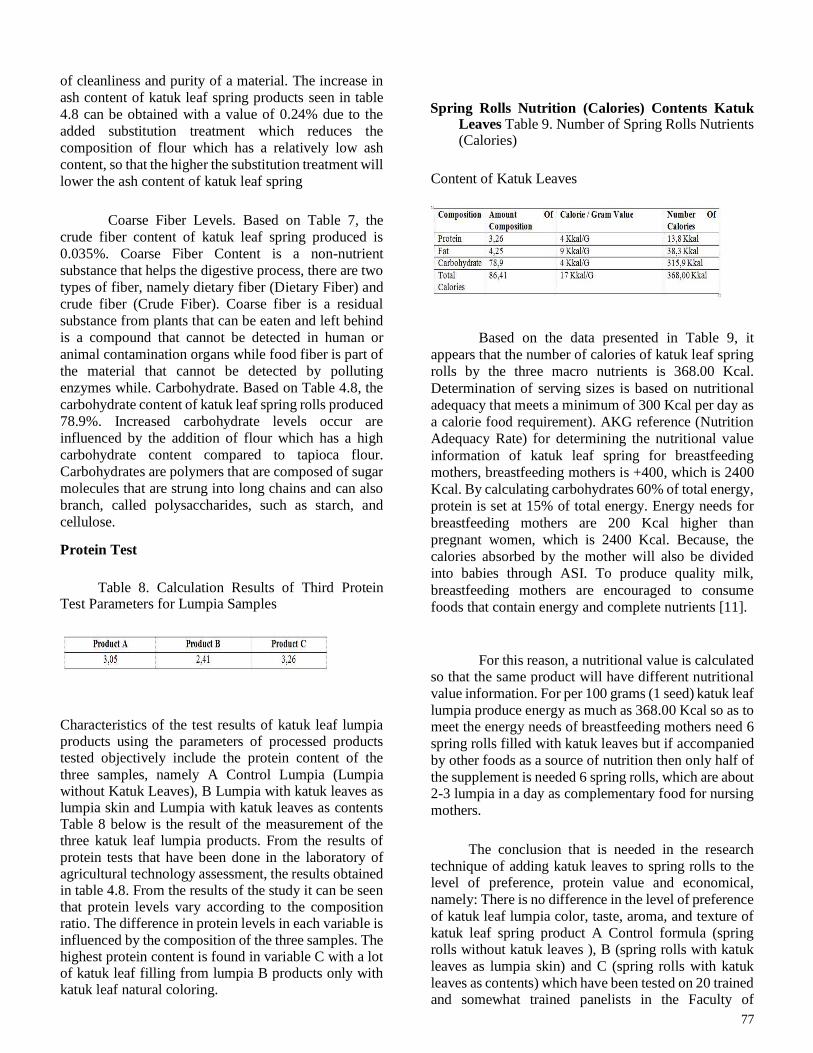
77
of cleanliness and purity of a material. The increase in
ash content of katuk leaf spring products seen in table
4.8 can be obtained with a value of 0.24% due to the
added substitution treatment which reduces the
composition of flour which has a relatively low ash
content, so that the higher the substitution treatment will
lower the ash content of katuk leaf spring
Coarse Fiber Levels. Based on Table 7, the
crude fiber content of katuk leaf spring produced is
0.035%. Coarse Fiber Content is a non-nutrient
substance that helps the digestive process, there are two
types of fiber, namely dietary fiber (Dietary Fiber) and
crude fiber (Crude Fiber). Coarse fiber is a residual
substance from plants that can be eaten and left behind
is a compound that cannot be detected in human or
animal contamination organs while food fiber is part of
the material that cannot be detected by polluting
enzymes while. Carbohydrate. Based on Table 4.8, the
carbohydrate content of katuk leaf spring rolls produced
78.9%. Increased carbohydrate levels occur are
influenced by the addition of flour which has a high
carbohydrate content compared to tapioca flour.
Carbohydrates are polymers that are composed of sugar
molecules that are strung into long chains and can also
branch, called polysaccharides, such as starch, and
cellulose.
Protein Test
Table 8. Calculation Results of Third Protein Test Parameters for Lumpia Samples
Characteristics of the test results of katuk leaf lumpia products using the parameters of processed products tested objectively include the protein content of the
three samples, namely A Control Lumpia (Lumpia without Katuk Leaves), B Lumpia with katuk leaves as lumpia skin and Lumpia with katuk leaves as contents Table 8 below is the result of the measurement of the three katuk leaf lumpia products. From the results of
protein tests that have been done in the laboratory of agricultural technology assessment, the results obtained in table 4.8. From the results of the study it can be seen that protein levels vary according to the composition ratio. The difference in protein levels in each variable is
influenced by the composition of the three samples. The highest protein content is found in variable C with a lot of katuk leaf filling from lumpia B products only with katuk leaf natural coloring.
Spring Rolls Nutrition (Calories) Contents Katuk Leaves Table 9. Number of Spring Rolls Nutrients (Calories)
Content of Katuk Leaves
Based on the data presented in Table 9, it
appears that the number of calories of katuk leaf spring
rolls by the three macro nutrients is 368.00 Kcal.
Determination of serving sizes is based on nutritional
adequacy that meets a minimum of 300 Kcal per day as
a calorie food requirement). AKG reference (Nutrition
Adequacy Rate) for determining the nutritional value
information of katuk leaf spring for breastfeeding
mothers, breastfeeding mothers is +400, which is 2400
Kcal. By calculating carbohydrates 60% of total energy,
protein is set at 15% of total energy. Energy needs for
breastfeeding mothers are 200 Kcal higher than
pregnant women, which is 2400 Kcal. Because, the
calories absorbed by the mother will also be divided
into babies through ASI. To produce quality milk,
breastfeeding mothers are encouraged to consume
foods that contain energy and complete nutrients [11].
For this reason, a nutritional value is calculated so that the same product will have different nutritional
value information. For per 100 grams (1 seed) katuk leaf
lumpia produce energy as much as 368.00 Kcal so as to meet the energy needs of breastfeeding mothers need 6
spring rolls filled with katuk leaves but if accompanied
by other foods as a source of nutrition then only half of
the supplement is needed 6 spring rolls, which are about 2-3 lumpia in a day as complementary food for nursing
mothers.
The conclusion that is needed in the research
technique of adding katuk leaves to spring rolls to the level of preference, protein value and economical,
namely: There is no difference in the level of preference
of katuk leaf lumpia color, taste, aroma, and texture of
katuk leaf spring product A Control formula (spring rolls without katuk leaves ), B (spring rolls with katuk
leaves as lumpia skin) and C (spring rolls with katuk
leaves as contents) which have been tested on 20 trained and somewhat trained panelists in the Faculty of
78
Agriculture Laboratory of processing and controlling
the quality of agricultural products.
The level of protein value of katuk leaf spring seen from the results of laboratory tests that have been carried out can be seen that the protein content varies according to the composition ratio, the highest protein content of 3.15 is found in variable C with katuk leaf filling. For the economic value level, there is no significant difference in the test results of the economic price of each spring rolls sample formula which ranges from Rp. 1053 to Rp. 1153 per serving.
Nutrient content (Protein, Carbohydrate, Fat,
Fiber, Mineral Content, ash content) in katuk leaf spring
rolls with the best formulation based on all the tests
carried out are spring rolls with katuk leaf contents are
Carbohydrate content 78.9 Protein 3, 26 Fat 4, 26
Content water 13.27 0.24 ash content and 0.035 crude
fiber content. For this reason, a nutritional value is
calculated so that the same product will have different
nutritional value information. For per 100gr (1 seed) katuk leaf lumpia produce energy as much as 368.00
Kcal so that to meet the energy needs of nursing
mothers need 6 spring rolls filled with katuk leaves but
if accompanied by other foods as a source of nutrition
then only half of the supplement 6 is needed lumpia,
which is about 2-3 spring rolls a day as a
complementary food for nursing mothers.
IV. SUGGESTION
Suggestions that are needed in the research technique of
adding katuk leaves to spring rolls to the level of
preference, protein value and economical, namely: Need further research on frying and steaming to obtain
spring rolls texture and further research on storage of
katuk leaf spring so that shelf life is longer.
REFERENCE
[1] M. Agnes, Panduan Penyiapan Pangan Sehat untuk Semua. Jakarta: Prenada Media, 2013.
[2] M. Zain, “Pengaruh Penambahan Tepung Daun
Katuk
(Saoropus androgynus)dalam Ransum Berbasis
Pakan
Lokal terhadap Performans Broiler,” Bul. Nutr. dan makanan ternak, vol. 9, pp. 18–26, 2013.
[3] R. H. K. Putri, “Uji Organoleptik Formula
Cookies
Kaya Gizi Sebagai Makanan Tambahan Dan Upaya Penanggulangan Anemia Pada Ibu Hamil Di
Rangkapan,” pp. 48–101, 2011.
[4] A. Arindya, R. J. Nainggolan, L. M. Lubis, and A. Sofyan, “Pengaruh Konsentrasi Karagenan terhadap
Mutu Selai Kelapa Muda lembaran
Selama
Penyimpanan,” vol. 4, no. 1, pp. 72–77, 2016.
[5] S. Kristianto, “Penerapan Metode-Metode Uji Organoleptik di Industri Es Krim,” no. 6103008043, pp. 134–175.
[6] A. Talib and T. Marlena, “Empek-Empek
Ikan
Cakalang,” vol. 8 Edisi 1, 2016.
[7] U. Santoso, “Penggunaan Daun Katuk (Sauropus androgynus) sebagai Suplemen Pakan pada Unggas. 1.
Pengaruhnya terhadap Performa Ayam,” vol.
13, no.
2, pp. 151–156, 2018.
[8] S. Lestari, “Uji organoleptik mie basah berbahan
dasar tepung talas beneng (Xantoshoma undipes) untuk meningkatkan nilai tambah bahan pangan lokal
Banten,” vol. 1, no. Badrudin 1994, pp. 941–946, 2015.
[9] A. Sunita, Prinsip Dasar Ilmu Gizi. Jakarta: PT.Gramedia Pustaka, 2009.
[10] M. Hadipernata, W. Supartono, and M. A. F.
Falah,

79
“Proses stabilisasi dedak padi (Oryza sativa L)
menggunakn radiasi far infra red (FIR) sebaai bahan baku minyak pangan,” J. Apl. Teknol.
Pangan, vol. 1, no. 4, pp. 103–107, 2012.
[11] B. Mary E, At A Glance Ilmu Gizi. Jakarta:
Erlangga, 2009
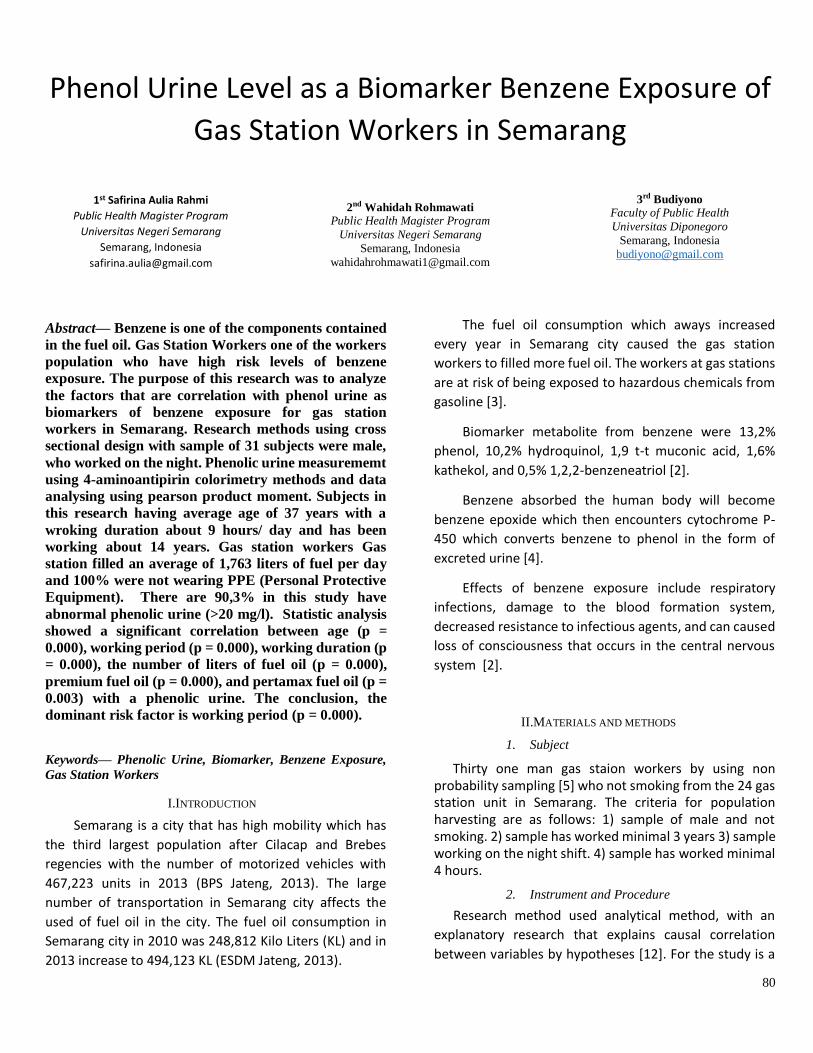
80
Phenol Urine Level as a Biomarker Benzene Exposure of
Gas Station Workers in Semarang
1st Safirina Aulia Rahmi
Public Health Magister Program
Universitas Negeri Semarang
Semarang, Indonesia
2nd Wahidah Rohmawati Public Health Magister Program
Universitas Negeri Semarang
Semarang, Indonesia
3rd Budiyono Faculty of Public Health
Universitas Diponegoro
Semarang, Indonesia
Abstract— Benzene is one of the components contained
in the fuel oil. Gas Station Workers one of the workers
population who have high risk levels of benzene
exposure. The purpose of this research was to analyze
the factors that are correlation with phenol urine as
biomarkers of benzene exposure for gas station
workers in Semarang. Research methods using cross
sectional design with sample of 31 subjects were male,
who worked on the night. Phenolic urine measurememt
using 4-aminoantipirin colorimetry methods and data
analysing using pearson product moment. Subjects in
this research having average age of 37 years with a
wroking duration about 9 hours/ day and has been
working about 14 years. Gas station workers Gas
station filled an average of 1,763 liters of fuel per day
and 100% were not wearing PPE (Personal Protective
Equipment). There are 90,3% in this study have
abnormal phenolic urine (>20 mg/l). Statistic analysis
showed a significant correlation between age (p =
0.000), working period (p = 0.000), working duration (p
= 0.000), the number of liters of fuel oil (p = 0.000),
premium fuel oil (p = 0.000), and pertamax fuel oil (p =
0.003) with a phenolic urine. The conclusion, the
dominant risk factor is working period (p = 0.000).
Keywords— Phenolic Urine, Biomarker, Benzene Exposure,
Gas Station Workers
I.INTRODUCTION
Semarang is a city that has high mobility which has
the third largest population after Cilacap and Brebes
regencies with the number of motorized vehicles with
467,223 units in 2013 (BPS Jateng, 2013). The large
number of transportation in Semarang city affects the
used of fuel oil in the city. The fuel oil consumption in
Semarang city in 2010 was 248,812 Kilo Liters (KL) and in
2013 increase to 494,123 KL (ESDM Jateng, 2013).
The fuel oil consumption which aways increased
every year in Semarang city caused the gas station
workers to filled more fuel oil. The workers at gas stations
are at risk of being exposed to hazardous chemicals from
gasoline [3].
Biomarker metabolite from benzene were 13,2%
phenol, 10,2% hydroquinol, 1,9 t-t muconic acid, 1,6%
kathekol, and 0,5% 1,2,2-benzeneatriol [2].
Benzene absorbed the human body will become
benzene epoxide which then encounters cytochrome P-
450 which converts benzene to phenol in the form of
excreted urine [4].
Effects of benzene exposure include respiratory
infections, damage to the blood formation system,
decreased resistance to infectious agents, and can caused
loss of consciousness that occurs in the central nervous
system [2].
II.MATERIALS AND METHODS
1. Subject
Thirty one man gas staion workers by using non probability sampling [5] who not smoking from the 24 gas station unit in Semarang. The criteria for population harvesting are as follows: 1) sample of male and not smoking. 2) sample has worked minimal 3 years 3) sample working on the night shift. 4) sample has worked minimal 4 hours.
2. Instrument and Procedure
Research method used analytical method, with an
explanatory research that explains causal correlation
between variables by hypotheses [12]. For the study is a
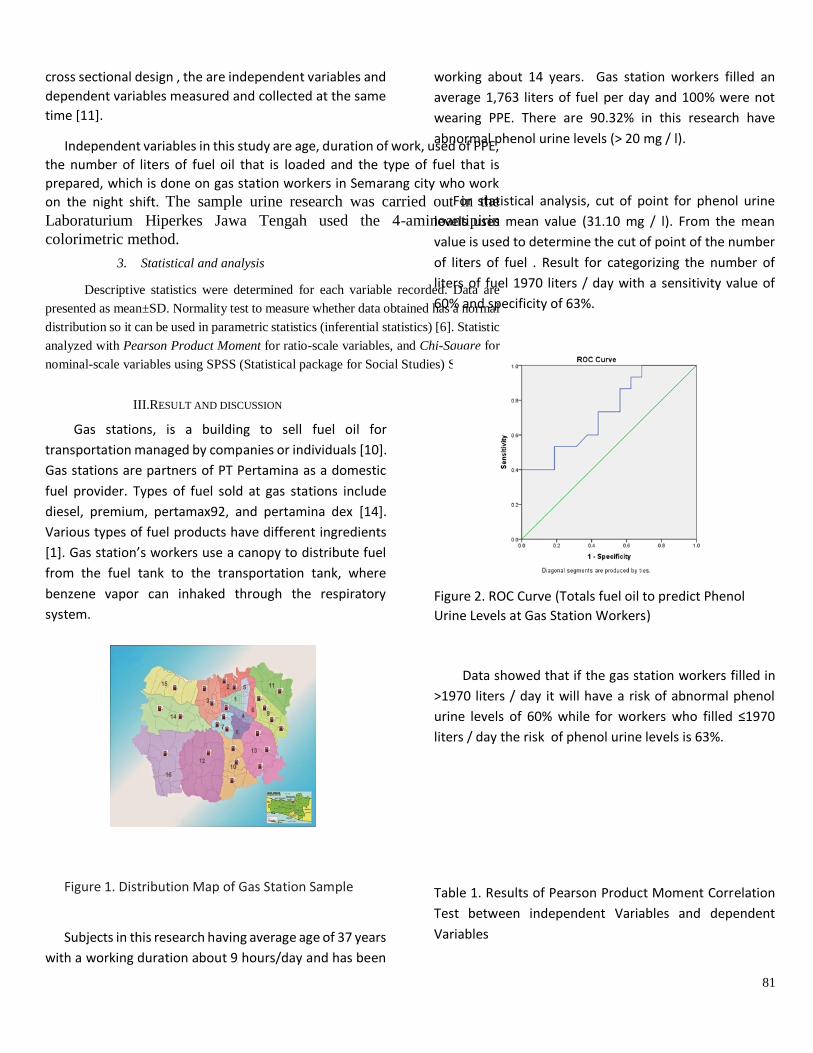
81
cross sectional design , the are independent variables and
dependent variables measured and collected at the same
time [11].
Independent variables in this study are age, duration of work, used of PPE,
the number of liters of fuel oil that is loaded and the type of fuel that is
prepared, which is done on gas station workers in Semarang city who work
on the night shift. The sample urine research was carried out in the
Laboraturium Hiperkes Jawa Tengah used the 4-aminoantipirin
colorimetric method.
3. Statistical and analysis
Descriptive statistics were determined for each variable recorded. Data are
presented as mean±SD. Normality test to measure whether data obtained has a normal
distribution so it can be used in parametric statistics (inferential statistics) [6]. Statistic
analyzed with Pearson Product Moment for ratio-scale variables, and Chi-Square for
nominal-scale variables using SPSS (Statistical package for Social Studies) Software.
III.RESULT AND DISCUSSION
Gas stations, is a building to sell fuel oil for
transportation managed by companies or individuals [10].
Gas stations are partners of PT Pertamina as a domestic
fuel provider. Types of fuel sold at gas stations include
diesel, premium, pertamax92, and pertamina dex [14].
Various types of fuel products have different ingredients
[1]. Gas station’s workers use a canopy to distribute fuel
from the fuel tank to the transportation tank, where
benzene vapor can inhaked through the respiratory
system.
Figure 1. Distribution Map of Gas Station Sample
Subjects in this research having average age of 37 years
with a working duration about 9 hours/day and has been
working about 14 years. Gas station workers filled an
average 1,763 liters of fuel per day and 100% were not
wearing PPE. There are 90.32% in this research have
abnormal phenol urine levels (> 20 mg / l).
For statistical analysis, cut of point for phenol urine
levels uses mean value (31.10 mg / l). From the mean
value is used to determine the cut of point of the number
of liters of fuel . Result for categorizing the number of
liters of fuel 1970 liters / day with a sensitivity value of
60% and specificity of 63%.
Figure 2. ROC Curve (Totals fuel oil to predict Phenol
Urine Levels at Gas Station Workers)
Data showed that if the gas station workers filled in
>1970 liters / day it will have a risk of abnormal phenol
urine levels of 60% while for workers who filled ≤1970
liters / day the risk of phenol urine levels is 63%.
Table 1. Results of Pearson Product Moment Correlation
Test between independent Variables and dependent
Variables

82
Independent Depend
e
n
t
p-value
Age
Phenol
Urin
Level
0,000
Working Period 0,000
Durasi of Work 0,000
Total Fuel Oil 0,000
The Correlation between age and phenol urine levels,
age is related to decreased physiological organs of the
body so that it affects metabolism and decreased muscle
work. The older the age of labor, the higher the risk of
benzene exposure based on phenol urine levels [8].
Duration of work on the fuel fill operator workers is
directly related to the number of benzene that expose
them while in the workplace. If the concentration of
benzene is inhaled every day for a long time it will affect
the amount of benzene exposure. The number of working
hours that exceeds normal time will be very vulnerable to
exposure to chemicals including benzene in the workplace
[9].
Working period is the length of time a person is
exposed to chemicals continuously [7]. The longer the
exposure that occurs will affect the degree of toxicity
experienced by a person due to the accumulation of toxic
substances in the body. Chronic toxic effects often occur
because small amounts of toxic substances are absorbed
for a long time, accumulating so that chronic toxicity is
achieved [13].
Correlation of the number of liters of fuel loaded with
phenol urine levels. From the data obtained in the field,
operator workers fill fuel at gas stations whose phenol
levels exceed the limited or ≥20 mg / l are workers who fill
more than 1013 liters of fuel per day. With an average
duration of work 9 hours, fuel filling operator workers will
be have higher risk of benzene exposure.
Correlation between type of fuel oil that is filled with
phenol urine levels. Benzene content in different types of
fuel oil, the premium content of benzene is the highest,
which is a maximum of 5% of the total amount of gasoline
per liter, while pertamax the maximum amount of
benzene is 2.5% of the total amount of gasoline per liter
and diesel is a maximum of 1% of the total amount of
gasoline per liter. Statistical test showed a significant
associated between Premium type and Pertamax type.
Multivariate analysis using multiple regression linear
statistic, the dominant independent variable is working
period variable with p value 0.000 (p (0.05).
To determine the effect of work period on the phenol
urine level, the calculation is then obtained results that at
each increase in the work period of 1 year the urine
phenol content increased 3.65 mg / l. Similar with
research of Sri Maywati and Siti Novianti which showed
that an increase of 1 year working period increased urine
phenol levels by 1,286 mg / l in gluing part workers in the
Industri Sendal Kota Tasimalaya 2011.
IV.CONCLUSION
Based on the results of the research, it can be
concluded that risk factors for benzene exposure to gas
station workers in the city of Semarang are age, work
period, duration of work, number of liters of fuel that is
loaded and the number of liters of fuel type that is loaded.
The dominant factor is the working period.
REFERENCE
[1] Achtnicht , Martin. 2012, “The Impact of Fuel
Availability on Demand for Alternative-fuel Vehicles”,
Transportation Research Part D: Transport and
Environment. Volume 17, Issue 3,Pages 262-269
[2] Agency for Toxic Substance and Disease Registry
(ASTDR), 2012, “Toxicological Profiles for Benzena.
83
US Departement of Health and Human Services”,
Public Health Services, Atlanta, Georgia, USA.
[3] Burson, J.L. and William, P.C, 2013, “Industrial
Toxicology : Safety and Health Aplications in
Workplace”, Van Nostrand Reinhold, New York
[4] Cassaret and Doull’s, 2011, “Toxicology The Basic
Science of Poison”, 7th Edition. Pengamon Press, New
York
[5] Dahlan MS, 2010, “Besar Sampel dan Cara
Pengambilan Sampel”, Jakarta : Salemba Medika
[6] Dahlan MS, 2013, “Statistik untuk Kedokteran dan
Kesehatan : Deskriptif, Bivariat, dan Multivariat”,
Jakarta : Salemba Medika
[7] Elisa, Nine. 2014, “Analisis Risiko Paparan benzene
terhadap Kadar Fenol dalam Urin pada Pekerja
Pengecetan Mobil di Kabupaten Wonogiri”, Universitas
Diponegoro.
[8] Eni Mahawati, Nurjazuli, Suhartono. 2014, “Hubungan
antara Kadar Fenol dalam Urin dengan Kadar Hb,
Eritrosit, Trombosit & Leukosit (Studi pada Tenaga
Kerja di Industri Karoseri CV Laksana Semarang)”,
Jurnal Kesehatan Lingkungan Indonesia Vol 5 No.1.
[9] Hwang-Young,Kim. 2012, “Effect of Phenol-Depleted
and Phenol-Rich Diets on Blood Marker of Oxidative
Stress and Urinary Excretion of Quercetin and
Kaemferol in Healthy Volunteers”, Jurnal of American
Colledge of Nutrition, Vol 22, No 3.
[10] Mehrjerdi , Mohammad, 2014, “The Investigation of
Exposure to Benzene, Toluene, Ethylbenzene and
Xylene (BTEX) with Solid Phase Microextr action
Method in Gas Station in Yazd province”,
Occupational Environmental Medicine. Volume 16,
Number 6, , pp. 419-427(9)
[11] Prof. Dr. Soekidjo Notoatmodjo, 2012, “Metode
Penelitian Kesehatan”, Jakarta : Rineka Cipta
[12] Sudigdo Sastroasmoro dan Sofyan Ismael, 2011,
“Dasar-dasar Metodologi Penelitian Klinis “ , Jakarta :
CV Sagung Seto
[13] Suseno, Bambang. 2012, “Hubungan Masa Kerja
dengan Kadar Hemoglobin dan Fenol Urin pada Pekerja
Bagian Finger Joint dan Hidproses Indistri Partikel
Bord CV. Citra Serayu Mas di Desa Kalibagor Kec.
Kalibagor Kab Banyumas”, Universitas Diponegoro.
[14] Zheng, Dong. 2014, “A Chemical Mechanism for
Ignition and Oxidation of Multi-component Gasoline
Surrogate Fuels” . Elsevier : Department of Engineering
Mechanics .
84