health-and-socio-economics.pdf - institute of policy studies of
TRANSCRIPT
Please address orders to:Institute of Policy Studies of Sri Lanka100/20, Independence Avenue, Colombo 7, Sri LankaTel: +94 11 2143100 Fax: +94 11 2665065Email: [email protected]: www.ips.lkBlog ‘Talking Economics’: www.ips.lk/talkingeconomicsTwitter: @TalkEconomicsSLFacebook: www.facebook.com/instituteofpolicystudies
Weerasinghe, Manuj C.
Health and socio-economic determinants of malnutrition in the plantation sectorof Sri Lanka / Manuj C. Weerasinghe and Samanthi Bandara. - Colombo: Instituteof Policy Studies of Sri Lanka, 2015
80 p. ; 30 cm.- (Working Paper series No. 21)
ISBN 978-955-8708-89-7
i. 338.433621 DDC 23 ii. Title
iii. Bandara, Samanthi jt. au. iv. Series
1. Public health - Economic aspects
2. Public health - Sri Lanka
3. Medical economics - Sri Lanka
Manuj C Weerasinghe (MBBS, MD) isa board certified specialist inCommunity Medicine and a seniorlecturer in the Faculty of Medicine,University of Colombo. His researchinterest includes health policy, healthprogramme evaluation and healthimplications in international tradeagreements. ([email protected])
Samanthi Bandara is a ResearchOfficer at the IPS. She has a BA(Hons.) in Economics with a specialmodule of Health Economics from theUniversity of Colombo, and an MSc inHealth Economics from the Centre forHealth Economics, University ofChulalongkorn,Thailand.([email protected])
©Copyright August 2015Institute of Policy Studies of Sri Lanka
ISBN 978-955-8708-89-7
National Library and Documentation Services Board -Cataloguing-In-Publication Data
No.
21
INSTITUTE OF POLICY STUDIES OF SRI LANKAINSTITUTE OF POLICY STUDIES OF SRI LANKAINSTITUTE OF POLICY STUDIES OF SRI LANKAINSTITUTE OF POLICY STUDIES OF SRI LANKAINSTITUTE OF POLICY STUDIES OF SRI LANKA
Working Paper Series
Health and Socio-economic Determinants of MalnutritionHealth and Socio-economic Determinants of MalnutritionHealth and Socio-economic Determinants of MalnutritionHealth and Socio-economic Determinants of MalnutritionHealth and Socio-economic Determinants of Malnutritionin the Plantation Sector of Sri Lankain the Plantation Sector of Sri Lankain the Plantation Sector of Sri Lankain the Plantation Sector of Sri Lankain the Plantation Sector of Sri Lanka
MANUJ C. WEERASINGHESAMANTHI BANDARA
A Review
IPS Publications
• Electricity Pricing Policy in Sri Lanka (July 1997)
• The Problems and Prospects of Sri Lanka’s Handloom Industry (September 1997)
• Population Projections in Sri Lanka (August 1997)
• Credit-Based, Participatory Poverty Alleviation Strategies in Sri. Lanka: What Have We learned? (October 1997)
• Performance Contracting: A Strategy for Public Enterprise Reform in Sri Lanka? (November 1997)
• Organization and Financing of Public Sector Health Care Delivery in Sri Lanka: The Need for Radical Change (December 1997)
• Globalization - Liberalizing the Capital Account in Sri Lanka (January 1998)
• A Method to Analyze Viability of Private Sector Participation in New Infrastructure Projects in Sri Lanka (February 1998)
• The Introduction of Effluent Charges as a Means for Controlling Industrial Water Pollution in Sri Lanka (March 1998)
• Capital Account Liberalization and Financial Crises in East Asia (July 1998)
• Sri Lanka: State of the Economy 1998 (October 1998)
• A Strategy for Nature Tourism Management in Sri Lanka (November 1998)
• Effective Local Governance - The Foundation for a Functioning Democracy in Sri Lanka (May 1999)
• Labour Legislation and Female Employment in Sri Lanka’s Manufacturing Sector (July 1999)
• Monitoring the 20/20 Compact on Budget and Aid Restructuring in Sri Lanka (August 1999)
• The Impact of Credit on Small & Medium - Scale Industries (SMIs) in Sri Lanka (September 1999)
• Sri Lanka: State of the Economy 1999 (October 1999)
• How Successful is Samurdhi’s Savings and Credit Programme in Reaching the Poor in Sri Lanka? (November 1999)
• The Integrated Rural Development Programme in Sri Lanka: Lessons of Experience for Poverty Reduction (December 1999)
• The Economic Cost of the War in Sri Lanka (January 2000)
• Designing Retirement - Income - Security Arrangements: Theory, Issues and Application to Sri Lanka (February 2000)
• South Asia Economic Journal (March 2000)
• Policy Impact Analysis in Contemporary Sri Lanka (March 2000)
• Review of Literature Linking Macroeconomic Policies to Household Welfare in Sri Lanka (March 2000)
• Annotated Bibliography of Macroeconomic and Adjustment Policies in Sri Lanka (May 2000)
• Review of Poverty Related Data and Data Sources in Sri Lanka (May 2000-2001)
• A Literature Survey of Macro Econometric and CGE Models in Sri Lanka (June 2000)
• Sri Lanka: State of the Economy 2000 (October 2000)
• Effectiveness of Welfare Programmes in Improving Estate Performance in Sri Lanka (December 2000)
• The Problems of Measuring Cost of Living in Sri Lanka (June 2000)
• An Economic and Environmental Analysis of Shrimp Farming Industry in Sri Lanka (September 2001)
• Sri Lanka: State of the Economy 2001 (October 2001)
• Regional Economic Cooperation in South Asia: A Sri Lanka Perspective (November 2001)
• The Implications of the Changing Role of Governance in Sri Lanka (December 2001)
• Policies and their Implications for the Domestic Agricultural Sector of Sri Lanka: 1995 - 2000 (August 2002)
• Sri Lanka Electricity Industry: Long Term Thermal Generation Fuel Options (September 2002)
• Irrigation and Agriculture in Sri Lanka (October 2002)
• Forward Contracts: A Market Based Alternative to Government Intervention in Agriculture Marketing in Sri Lanka (January 2003)
• The Delivery of General Education in Sri Lanka - An Alternate Approach (March 2003)
• Assessment of the Pension and Social Security Benefit Scheme for the Self-Employed Persons in Sri Lanka (August 2003)
• Assessment of the Farmers’ and Fishermen’s Pension and Social Security Benefit Scheme in Sri Lanka (August 2003)
• Assessment of the Employees’ Provident Fund in Sri Lanka (August 2003)
• Cross Border Competition: Implications for Sri Lanka (December 2003)
• Ready Made Garment Industry in Sri Lanka: Facing the Global Challenge (June 2004)
• Liberalization of International Air Transport in Sri Lanka: Policy Options. (July 2004)
• Economic Policy in Sri Lanka: Issues & Debates - A Festschrift in Honour of Gamani Corea (September 2004)
• Sri Lanka: State of the Economy: 2004 (October 2004)
• Governance Issues in Poverty Reduction in Sri Lanka (October 2004)
• Identification of the Poor in Sri Lanka: Development of Composite Indicator and Regional Poverty Lines (December 2004)
• Phoenix from the Ashes? Economic Policy Challenges and Opportunities for Post-Tsunami Sri Lanka (April 2005)
• Sri Lanka’s National Accounts (May 2005)
• Input Output Tables for Sri Lanka - 2000 (June 2005)
• Labour Standards and International Trade: The Case of EU GSP Concessions to Sri Lanka (July 2005)
• Regulatory Impact Assessment: A Tool for Better Regulatory Governance in Sri Lanka? (August 2005)
• Impact of Trade Liberalisation on Poverty and Household Welfare in Sri Lanka (September 2005)
• South Asia After the Quota System: Impact of the MFA Phase-Out (October 2005)
• Decentralization and Provincial Finance in Sri Lanka: 2004 - An Update (November 2005)
• Sri Lanka National Health Accounts 2000-2002 (December 2005)
• Microfinance in Sri Lanka : A Household Level Analysis of Outreach and Impact on Poverty (December 2005)
• A Framework for Social Accounting Matrices (SAMS) of Sri Lanka (January 2006)
• Devolution Revisited: Towards A More Effective Devolutionary Polity (February 2006)
• Livelihoods in Post-Tsunami Sri Lanka: “Building Back Better”? (April 2006)
• Rural Land Sector in Sri Lanka: Major Characteristics, Determinants and Implications for Land Policy (May 2006)
• Utilization of Preferential Trade Arrangements: Sri Lanka’s Experience with the EU and US GSP Schemes (January 2007)
• Beyond Twenty Million: Projecting the Population of Sri Lanka 2001-2081 (March 2007)
• Disaster Management Policy and Practice in Sri Lanka: Sharing Lessons among Government, Civil Society
and Private Sector (April 2007)
• Population Ageing, Policy Responses and Options to External Retirement Coverage Case Study of Sri Lanka (May 2007)
• Sri Lanka: State of the Economy 2007 (September 2007)
• South Asia in the WTO (November 2007)
• Mahinda Chinthana: A Commentary on Policy Options (October 2007)
• Sri Lanka National Health Accounts 2003-2004 (July 2008)
• Trade, Innovation and Growth: The Case of Sri Lankan Textile and Clothing Industry (July 2008)
• Sri Lanka: State of the Economy 2008 (September 2008)
• Educational Opportunities for the Poor in Sri Lanka: Assessing Spatial Disparities (November 2008)
• Gaining Competitive Advantage through the Protection of Geographical Indications: An Analysis of the Tea, Sapphire andCinnamon Industries of Sri Lanka (May 2009)
• Impact of Information Technology (IT) in Trade Facilitation on Small and Medium Enterprises(SMEs) in Sri Lanka (July 2009)
• Sri Lanka: State of the Economy 2009 (September 2009)
• International Migration Outlook – Sri Lanka, 2008 (October 2009)
• Ecotourism for Sustainable Forest Management in Sri Lanka (November 2009)
• Mainstreaming Climate Change for Sustainable Development in Sri Lanka: Towards A National Agendafor Action (December 2009)
• Targeting and Distribution of Post-Disaster Aid-A Case of the Fishery Sector in Post-Tsunami Sri Lanka (April 2010)
• Sri Lanka: State of the Economy 2010 (October 2010)
• Conservation vs. Conversion: Examining the Case of the Diyawanna Oya Wet Land Area in Sri Lanka (December 2010)
• Microinsurance in Sri Lanka: Combating Multiple and Overlapping Vulnerabilities (October 2011)
• Sri Lanka: State of the Economy 2011 (October 2011)
• Impact of Migration and Remittances on Investment in Agriculture and Food Security in Sri Lanka (February 2012)
• Sri Lanka National Health Accounts 2005–2009 (September 2012)
• Fostering Innovation to Fast-forward Growth in Sri Lanka (December 2012)
• Sri Lanka: State of The Economy 2012 (October 2012)
• Migration Profile-Sri Lanka (2013)
• Climate Change Issues in Sri Lanka (2013)
• Hand Book on the India- Sri Lanka Free Trade Agreement (2013)
• Incentivizing Foreign Investment in Sri Lanka and the Role of Tax Incentives (2013)
• Private Hospital Health Care Delivery in Sri Lanka : Some Issues on Equity, Fairness and Regulation (2013)
• Sri Lanka: State of The Economy 2013 (2013)
• State of the Sri Lankan Alcohol Industry and Analysis of Governing Policies (2013)
• Female Entrepreneurship and the Role of Business Development Services in Promoting Small and Medium WomenEntrepreneurs in Sri Lanka (2014)
• Labour Migration in Sri Lanka: Select Annotated Bibliography (2004-2014) (2014)
• Sri Lanka: State of The Economy 2014 (October 2014)
• Female Employment for Inclusive Growth:Trends,Issues and Concerns of Female Labour Force Participation in Sri Lanka (2014)
• Sri Lankan Female Domestic Workers in the Middle East: Does Recruitment Through an Agent Minimize Vulnerability? (2014)
• Sri Lanka National Health Accounts 2010 - 2011 (2014)
• Can People in Sri Lanka’s Estate Sector Break Away from Poor Nutrition: What Causes Malnutrition, and How it Can be Tackled(2014)
• Health Statistics 2013 (2014)
• Towards a Stronger, Dynamic and Inclusive South Asia (2014)
• Repositioning in the Global Apparel Value Chain in the Post-MFA Era: Strategic Issues and Evidence from Sri Lanka (2014)
Health and Socio-economic Determinants of Malnutrition in the Plantation Sector of Sri Lanka
i
LIST OF TABLES IIILIST OF FIGURES IVLIST OF BOXES IVABBREVIATIONS VACKNOWLEDGEMENT VIIEXECUTIVE SUMMARY VIII
1. Background to the Review 12. Profile of Sri Lanka 23. Sri Lankan Health System 6
3.1 National Health System 63.2 Provincial Health System 83.3 Health System in the Estate Sector 9
4. Estate Sector Profile 94.1 Historical Development 94.2 Current Situation 11
5. Nutritional Indicators of the Estate Sector 195.1 Nutritional Indicators of Children Under 5 Years, 1993-2012 205.2 Nutritional Indicators of Women in Reproductive Age Group 25
6. Nutrition and Associated Issues 276.1 Living Environment and Facilities 276.2 Education and Nutrition 296.3 Maternal Employment and Income 336.4 Women's Role in the Estate Sector 346.5 Maternal and Child Health, and Other Illnesses 36
7. Possible Risk Factors for Malnutrition in Estates 377.1 Use of Iodized Salt 377.2 Vitamin A and Iron During Pregnancy 377.3 Breast Feeding and Complementary Feeding 387.4 Other Factors 42
8. Evaluation of Nutritional Programmes-Estate Sector 448.1 Thriposha Programme 448.2 Fortified Corn-Soya Blend (CSB) 468.3 Poshana Malla 478.4 School and Pre-school Nutrition Programmes 478.5 Micronutrient Intake 478.6 Energy Intake 498.7 Evaluation of Health Service Facilities 49
Table of Contents
Working Paper Series No. 21
ii
9. Conclusion and Recommendations 51
Bibliography 53
Glossary 59
Appendices 60
Appendix A: School Attendance Status of Child Population
(aged 5-17 Years) by Age Group, Gender, and Sector, 2008/09 60
Appendix B: Low Birthweight According to Sectors, 1993 to 2006 60
Appendix C: Employment Rate by Sector and by Gender, Various Years 61
Health and Socio-economic Determinants of Malnutrition in the Plantation Sector of Sri Lanka
iii
List of Tables
Table 1: Percentage Distribution of Household Population by HealthStatus and Sector, 2012 04
Table 2: Key Statistics of Expenditure on Health, Sri Lanka, 2000-2011 06
Table 3: Curative Institutions and Bed Strength (No.), 2012 07
Table 4: Key Categories of Community Health System and AvailableHealth Staff at the Field, 2012 07
Table 5: Percentage Distribution of Households by Type of Lighting and Sector 15
Table 6: Average Monthly Household Expenditure on Foodand Non-Food Items by Sector, 2012 17
Table 7: Average Monthly Household Consumption and Expenditureby Selected Food Items and Sector, 2012 18
Table 8: Household Expenditure and Share of Prepared Foodby Total Food Expenditure, Various Years 18
Table 9: Major Studies and Analysis Conducted on Nutritional Statusof the Population in Sri Lanka, 1975-2013 19
Table 10: Height for Age < -2SD Children Under 5 Years from 1993-2012 (Stunting) 21
Table 11: Weight for Age<-2SD in Children under 5 Years from 1993-2012 (Underweight) 22
Table 12: Weight for Height<-2SD in Children Under 5 Years from 1993-2012 (Wasting) 23
Table 13: Anaemia Among Children Under 5 years (%), Various Survey Periods 24
Table 14: Vitamin A Deficiency Among Children Aged 6-60 Months (%),1995/96 and 2005/06 24
Table 15: Duration of Exclusive Breastfeeding Among Children Under3 Years (in months), Various Survey Periods 25
Table 16: Anaemia in Pregnant Women (%), Various Survey Periods 25
Table 17: Mid-Upper Arm Circumference of Pregnant Women, 2009 25
Table 18: Anaemia in Non-Pregnant Women Aged 15-49 Years, Various Survey Periods 26
Table 19: Body Mass Index Among Non-Pregnant Women Aged 15-49 Years,2006/07 and 2009 27
Table 20: Distribution of Children by their Reason of Not AttendingSchool, Sector-wise in Sri Lanka, 2008/09 30
Table 21: Prevalence of Low Level of Educational Performance(marks < 40%) by Nutritional Status of Children 32
Table 22: Reasons for Stopping Breastfeeding by Sector, 2008 40
Table 23: Recommended Daily Requirement of Energy, Proteinand Iron Provided by 50g of Thriposha Supplement (%) 45
Table 24: Summary of Direct Food Assistance and Supplementary Feeding Programmes 50
Working Paper Series No. 21
iv
List of Figures
Figure 1: Poverty Head Count Ratio by Sectors and Survey Period 03
Figure 2: Percentage Distribution of Population by Districts and Sector 05
Figure 3: Capital, Recurrent, and Per Capita Expenditure on Total HealthExpenditure by Provinces, 2010-2011 08
Figure 4: Population Distribution by Regional Plantation Companies, 2013 12
Figure 5: Population Distribution Among the Regions by Race, 2013 12
Figure 6: Type of Housing Unit by Sector, 2012 13
Figure 7: Percentage Distribution of Population (10 years and above)According to Literacy Rate by Sex, 1981, 2001, and 2012 13
Figure 8: Percentage Distribution of Population (5 years and above)According to Educational Attainment by Sector, 2012 14
Figure 9: Percentages of Type of Cooking Fuel by Sector, 2012 14
Figure 10: Percentage Distribution of Households by Main Sourcesof Drinking Water and Sector, 2012 15
Figure 11: Percentage Distribution of Households by Toilet Facilities and Sector, 2012 16
Figure 12: Average Monthly Household Consumption by Selected FoodItems and Sector, 2012 17
Figure 13: School Attendance Status of Child Population Aged 5-17 Yearsby Sector (%), 2008/09 29
Figure 14: Distribution of Children not Attending School by Sector in Sri Lanka (%), 2008/09 30
Figure 15: Protein Intake from Animal Sources, and Starchy Staple Ratio (%), Various Years 35
Figure 16: Employment Rate by Sector, and Gender, Various Years 35
Figure 17: Rates of Feeding Practices by Type of Feeding and by Sectors, 2000 39
Figure 18: Breastfeeding Indicators Among Children 0-23 Months of Age,2006/2007 (N = 2,735) 39
Figure 19: Complementary Feeding Indicators Among Children 6-23 Monthsof Age by Sectors, 2006/2007 (N=2,106) 41
Figure 20: Percentage of Thriposha Received by Target Groups and by Sectors, 2009 44
Figure 21: Percentage of Pregnant Mothers who Received "Poshana Malla" 47
Figure 22: Percentage of Children and Lactating Mothers Received Vitamin Aby Sectors, 2009 48
Figure 23: Percentage of Mothers who Received Iron Tablets and who Took them Daily,by Sectors, 2009 48
Figure 24: Proportion of Population Not Receiving the Minimum Requirementof Dietary Energy by Sector, 2009/10 and 2012/2013 49
List of Boxes
Box 1: Key Socio-Economic Indicators by Sector, 2012 04
Box 2: Few Quotations of Respondents Living in Separate Houses 28
Health and Socio-economic Determinants of Malnutrition in the Plantation Sector of Sri Lanka
v
Abbreviations
AAS - Assessment of Anaemia Status
AMOH - Additional Medical Officer of Health
ANC - Antenatal Clinic
BMI - Body Mass Index
CAR - Calorie Adequacy Ratio
CBS - Corn-Soya Blend
CDO - Child Development Officer
CHDR - Child Health Development Record
CI - Calorie Intake
DHS - Demographic and Health Survey
EBF - Exclusive Breast Feeding
EMA - Estate Medical Assistant
FHB - Family Health Bureau
GDP - Gross Domestic Product
HCR - Head Count Ratio
HR - Human Resource
IDDS - Mean Individual Dietary Diversity Score
IMO - Inspecting Medical Officer
IYCF - Infant and Young Child Feeding
JEDB - Janatha Estates Development Board
LBW - Low Birth Weight
MCH - Maternal and Child Health
MO - Medical Officer
MOH - Medical Officer of Health
MRI - Medical Research Institute
MUAC - Mid Upper Arm Circumference
NFSS - Nutrition and Food Security Assessment Survey
NGOs - Non-Governmental Organizations
PAEHS - Planters' Association Estates Health Scheme
PDHS - Provincial Director of Health Services
PHDT - Plantation Human Development Trust
PHI - Public Health Inspector
PHM - Public Health Midwife
PHNS - Public Health Nursing Sister
PHSWT - Plantation Housing and Social Welfare Trust
PSM - Professions Supplementary to Medicine
Working Paper Series No. 21
vi
RBP - Retinol Binding Protein
RCA - Relative Caloric Allocation
RPC - Regional Plantation Company
SHN - School Health Nutrition
SLIS - Sri Lanka Integrated Survey
SLSPC - Sri Lanka State Plantations Corporation
THE - Total Health Expenditure
Health and Socio-economic Determinants of Malnutrition in the Plantation Sector of Sri Lanka
vii
AcknowledgementThe authors would like to express their gratitude to the numerous persons and
institutions, which provided enormous support towards producing this review. Our
thanks initially go to the UNICEF for granting financial support to conduct this
project.
Our special thanks go to the Librarians of the Central Library and the Post Graduate
Institute of Agriculture of the University of Peradeniya, Tea Research Institute, Post
Graduate Institute of Medicine of the University of Colombo, Medical Research
Institute, Plantation Human Development Trust, Department of Agriculture and
Ministry of Health.
We deeply acknowledge the generous support from the IPS library staff and Project
Officer Dr. Munsif Sanoon for continuous assistance in collecting various research
papers from different institutions. Finally, the authors owe a great debt of gratitude
to Dr. Saman Kelegama (Executive Director), the Editor, Finance Unit, and
Publications Unit for their continuous support throughout the project period.
Working Paper Series No. 21
viii
Executive SummaryIn the early 19th century, thepredominant agrarian economy ofSri Lanka was transformed into acommercial and capitalist nature,with the introduction of theplantation (estate) sector by theBritish colonial rulers. Among thekey cultivation crops in Sri Lanka,tea became the major export cropafter the destruction of coffeeplantations due to a fungaldisease. Due to the failure ofrecruiting sufficient labour forcefrom the indigenous Sinhala andTamil communities, thousands oflabourers were brought fromSouth India for employment in theestates. These Indian labourerswere relocated in the estates,particularly in the central hills.Considering the specific nature ofthe population living in thoselocalities, including theiroccupational and ancestralrelations, those areas arecategorized as the estate sector.Due to political, cultural andreligious sensitivity of the estatesector, and the historicallyestablished management stylesof those geographical boundariesthey reside, different servicedelivery models and serviceseeking behaviour has evolved.Health is no exception.
Nutrition is one of the key areasthat the estate sector did notimprove in parallel to the othersectors. Routine health statistics,special surveys such as theDemographic and Health Surveyand other research studies hasshown only slow improvement innutritional status in the estatepopulation compared to the urbanand rural. This is in spite ofsuccessive governments andother agencies carrying outnumerous programmes to upliftthe nutritional status of this
population. Some of thenutritional interventions done inthe estate sector are specific tothat population whereas othersare country-wide interventions.Those interventions have shownmixed results. Many newprogrammes geared for nutritionalinterventions and coordinatedaction at different levels is alsoproposed at present. Thishighlights the failure of traditionalmethods to bring the desiredchanges in the nutritional status.New approaches are needed totackle the nutritional issuesparticularly among the estatecommunity. In order to institutefurther action on the nutritionstatus of the estate sector, thereis a need to collate and evaluateexisting information to understandthe issues peculiar to the estatecommunity.
This review was undertaken toexplore some aspects related toestate community health and theirnutrition status. The reviewfocuses on the research andsurvey findings during the period1990 to 2013. The report presentshistorical and socio-culturalevolution of the estate sector,health services development,nutritional status data for theestate population, livingconditions and lifestyle, dietaryhabits and food consumption,household income andexpenditure, and information onnutrition programme assessmentsconducted in the estate sector.
Estate population has beenassigned a lower social status inthe Sri Lankan society. This ismainly due to the historicalcircumstances that brought themto the country as migrantlabourers by the then colonial
rulers. Although much hasimproved since this communitywas granted citizenship in thecountry, they have still not gainedthe recognition on par with othercommunities, even within thesame ethnicity having differentancestral origins. Their identityrelated to the occupation has notbeen adequately uplifted withinthe mainstream to enjoy thesocio-economic gains that trickledown from the developmentactivities in the country. Inaddition, the governance structurewithin the estate managementhas changed only a littlecompared to the rest of thecountry in the post- independentera. Despite the rise of tradeunion power in handling labouraffairs and welfare within estates,the key elements of colonialmodel on estate governancepersist.
Existing health and nutritionissues in the estate sector isfound to be closely related to thecultural elements associated withthe living conditions. The Grouphousing in the estates since theinception of the tea and rubberestates has created a uniquesub-culture that perpetuates manynegative elements for health andnutrition. Many studies haveshown these cultural elements asmajor obstacles to improve thehealth and nutrition status of thiscommunity. Lifestyle within thelimited facilities of group housingis culturally male dominated andthe social influences within andfrom outside support tostrengthen the status quo. One ofthe key issues identified is thelower status for the female withinthe family and estate community.This prevents improving healthand nutrition of the female, thus
Health and Socio-economic Determinants of Malnutrition in the Plantation Sector of Sri Lanka
ix
leading to a vicious cycle of illhealth. Even when the female iscontributing the largest share ofthe household income, the abilityshe holds on key decisions suchas spending was found to be lessinfluential. Further, most of thehousehold work is done by thefemale, thus most studiesrecommend programmes toencourage shared responsibilityamong the family members toprevent the estate women fromundue physical strain.
Dietary practices and foodselection in the estate sector isdifferent to the rest of the country.The priority meal in estatehouseholds is the dinner.Breakfast and lunch are generallygiven less attention. Thisbehaviour is related to theoccupation and continued forgenerations. Hence, traditionallyfor breakfast and lunch, themajority of estate populationconsume wheat flour based fooditems with less nutritive value.Dinner is a rice based mealmainly with vegetables. Studiesrecommend action to reduce foodinsecurity, especially among thepoor in the estate sector toimprove nutrition status. Further,myths about food and harmfuldietary habits reduce the impactof nutrition programmes in thiscommunity. Since income ofmothers in the estate yield thehighest benefit to the householdcompared to the male, proposingmechanisms to increase themother's income/employabilityalong with child care facilities toimprove the household health andnutrition is another suggestion bymany studies.
Although estates under thecorporate management retain ahealth unit to cater to theirpopulation, smaller estates do notextend that facility. The facilitywithin the larger estate too hasmajor gaps with less facilities andless trained staff. Although,maternal and child health servicesare provided by the MOH staff, itis seen that domiciliary carecomponent is still not adequatelyaddressed. It is also found thatless domiciliary visits by thehealth workers is associated withlow exclusive breastfeeding rate,high bottle feeding, inappropriatecomplementary feeding and lowdietary diversity. There is lessnumber of healthcare workers topopulation in the districts withpredominantly estate population.Studies suggest scaling up thelessons from the Early ChildhoodCare and Development Project toincrease community participationand utilization of health andnutrition services among estateworkers. These include prioritizingthe delivery of quality services inthe estates; establishingoccupational health service tooccupation related healthproblems in estates; andincreasing male participation inactivities related to MCHprogrammes.
Labour rights related to workingmothers in the estate sector needto be reviewed and necessaryadjustments be made in a waythat the pregnant mother getsoptimum care during herpregnancy and deliver optimumcare to the child. Further, studiessuggest to improve the quality ofthe child care centres and tointervene on nutritional aspectsaccording to needs; to improve
the child developmental activitiesand strengthen the parental andcommunity participation in childcare programmes. A few studiesalso recommend regular annualde-worming, improvement oflatrine facilities and parentaleducation regarding hygiene oftheir children as a way forward forimproving nutritional status.
Many programmes directed toimproving nutritional status of thepopulation and specifically for theestate sector, have beenimplemented during the last threedecades by the government of SriLanka and other stakeholderorganizations. However,systematic evaluation of thoseprogrammes is rare in publishedliterature. Most evaluations arerestricted to measuring a fewdirect outputs of the programmeand conducted by the programmeimplementers themselves.Independent outcome and impactevaluations are extremely rare.This emphasizes the requirementof a mandatory inbuilt processevaluation of all future nutritionalprogrammes coupled withindependent outcome and impactevaluations to assess thesuccess of nutritionalprogrammes. The available fewstudies on nutrition programmeevaluation do not provideadequate information to assessthe contribution of individualprogramme success. Mostnutritional programmes haverelied on routine informationobtained from national studies tosatisfy post-hoc assessments oftheir own programme with lessobjective methodology. Thisapproach has limited value topolicy makers in the decisionmaking process.
Working Paper Series No. 21
x
úOdhl idrdxYh
19 jk ishjfia uq, § ì%;dkH hg;aúð; md,kh úiska jeú,s ^j;=&wxYh y÷kajd fokq ,eîu;a iu.YS% ,xldfõ m%uqL lDIsld¾ñlwd¾Ólh, jdKsc yd OfkaYajriajNdjhg mßj¾;kh úh. È,Srfrda.hla fya;= fldg f.k fldamsj.djka úkdY lr ±ófuka miq Y%S,xldfõ m%Odk jeú,s fnda. w;rf;a m%Odk wmkhk fnda.h njgm;a úh. iajfoaYSh isxy, m%cdfjkam%udKj;a Y%u n,ldhla n|jd.ekSug wiu;a ùu ;=< j;=j,fiajh i|yd oyia .Kka Y%ñlhskaol=Kq bkaÈhdfjka f.k tkq ,eìKs.fuu bka§h Y%ñlhka j;=j,,úfYaIfhka uOHu l÷lr m%foAYj,w¨f;ka mÈxÑ flßK. fuum%foaYj, jdih lrk ck.ykfhajD;a;Sh yd mrïmrd.; in|;dwe;=¿ úfYaIs; iajNdjh ie,ls,a,g.;a l, tu m%foaY j;= wxYh f,ij¾.SlrKh lrkq ,efí. j;=wxYfha foaYmd,k, ixialD;sl ydwd.ñl ixfõÈ;dj yd Tjqka jdihlrk tlS N+f.da,Sh iSud udhsïj,ft;sydisl jYfhka ia:dms; lrk,o l<ukdlrK ffY,Ska úúOfiajd iemhSfï udÈ,s yd fiajdjkafiùfï p¾hdjla úldYkh lr;sfí. fi!LHh fuys jH;sf¾Lhlafkdfõ.
wfkla wxYj,g iudka;rj j;=wxYfha ÈhqKq fkdjQ m%OdklafIa;%j,ska tlla jkafka fmdaIKlafIa;%h hs. iqmqreÿ fi!LH ixLHdf,aLk, ck úldY yd fi!LHiólaIK jeks úfYaI iólaIK ydwfkl=;a iólaIK fmkajd;sfnkafka kd.ßl yd .%dóhck.ykh yd ii|k úg j;=ck;dj ;=< fmdaIK ;;a;ajfhysukao ÈhqKqjla muKs. fuh fufiaù ;sfnkafka wkqhd; wdKavq ydwfkl=;a tackais wdh;k fuuckhdf.a fmdaIK ;;a;ajh k.disgqùfï wm%udK jevigyka lrf.k hñka ;sìh§;a h. j;=wxYfhys lrk ,o we;eï fmdaIK
ueÈy;a ùï tu ckhdg úfYaIs;tajd jqj o wfkla tajd §m jHdma;ueÈy;aùï úh. tlS ueÈy;aùïfmkajd ;sfnkafka ñY% m%;sM, h.fmdaIK ueÈy;aùï i|yd iQodkïlrk ,o fndfyda w¨;a jevigykayd úúO uÜgïj, iïnkaëlrKls%hdldß;ajhla o j¾;udkfha §fhdackd flf¾. fuh fmdaIK;;a;ajfhys wfmalaId lrk ,ofjkialï f.k taug iïm%odhsll%uj, we;s wid¾l;ajh u;=lrolajhs. úfYaIfhkau j;= m%cdjw;r we;s fmdaIK m%YakiïnkaOfhka lghq;= lsÍug kjm%fõYhka wjYH flf¾. j;=wxYfhys fmdaIK ;;a;ajh flfrysjeäÿr mshjr .ekSu msKsi j;=m%cdjg úfYaIs; m%Yak wjfndaOlr.ekSug mj;akd f;dr;=re iei£fïyd we.hSfï wjYH;djhla ;sfí.
fuu úu¾Ykh lrk ,oafoa j;=m%cdfõ fi!LHh yd Tjqkaf.afmdaIK ;;a;ajh yd iïnkaOwe;eï me;s .fõIKh lsÍug h.úu¾Ykh 1990 isg 2013 olajd ld,mßÉfþoh ;=< l< m¾fhaIK ydiólaIK fidhd .ekSï u; flakaøShfjhs. fuu jd¾;dj j;= wxYfhaft;sydisl yd iudc-ixialD;slúldYkh, fi!LH fiajd ixj¾Okh,j;= ck;dj iïnkaO fmdaIK;;a;aj o;a;, Ôjk ;;a;ajhka ydÔjk ffY,Ska, wdydr mqreÿ ydwdydr mßfNdackh, l=gqïn wdodhuyd úhou iy j;= wxYfhys lrk,o fmdaIK jevigyka we.hSïms<sn| f;dr;=re bÈßm;a lrhs.
YS% ,dxlSh iudcfhys j;= ckhdmy;a iudc ;;a;ajhlg oukq ,en;sfí. fuh m%Odk jYfhkau tjlhg;a úð; md,lhska úiska Tjqkaixl%uKsl Y%ñlhska f,i rggf.k tk ,o ft;sydisl ;;a;ajhkafya;= fldg f.k h. fuu m%cdjgrfÜ mqrjeisNdjh m%odkh lrkq,eîfï isg Tjqkaf.a ;;a;ajhkafndfyda ÈhqKq ù ;snqK o Tjqka
;ju;a wfkl=;a m%cdjka yd iudkms<s.ekSula fkdue;s w;ru úúOmdrïmßl iïNjhka ;sfnk tluckj¾.hl we;=<; mjd ,nd f.kfkdue;. rfÜ wd¾Ól ixj¾Oklghq;=j,ska ldkaÿ jk iudc-wd¾Ól m%;s,dN nqla;s ú£ug uQLHOdrdj we;=<; jD;a;sh yd iïnkaOTjqkaf.a wkkH;djh m%udKj;af,i k.d isgqjkq ,en ke;. Bgwu;rj mYapd;a iajdëk hq.fhysrfÜ fiiq fldgi iu. ii|k úgj;= l<ukdlrKh we;=<; md,kjHqyh fjkiaj ;sfnkafka iaj,amhlamuKs. j;= we;=<; Y%u lghq;= ydY=NidOkh yeisrùfï jD;a;Shix.ï n,fha ke.Su olakg ;sìh§;a j;= md,kfha hg;a úð;udÈ,sfha m%Odk wx. È.gu mj;S.
j;= wxYfhys mj;akd fi!LH ydfmdaIK m%Yak Ôjk ;;a;ajhka ydiïnkaê; ixialD;sl uQ,hkagiómj ne£ ;sfnk nj fidhd f.k;sfí. f;a yd rn¾ j;=j,wdrïNfha isgu ldKav ksjdi l%uh,fi!LHh yd fmdaIKh iïnkaOfndfyda ksfIaOd;aul uQ,hkaÑria:dhs lrk iqúfYaI WmixialD;shla j;=j, ks¾udKh lr;sfí. fndfyda wOHhkhka fuuixialD;sl uQ,hka fulS m%cdfõfi!LH yd fmdaIK ;;a;ajh ÈhqKqlsÍfï m%Odk ndOl f,i fmkajd §;sfí. ldKav ksjdihl iSudiys;myiqlï we;=<; we;s ÔjkffY,sh ixialD;sluh jYfhkamqreIdêm;s jk w;r we;=<; ydmsg;ska tk iudc n,mEï mj;sktlS ;;a;ajh Yla;su;a lsÍugwdOdr lrhs. y÷kd f.k ;sfnktl m%Odk m%Yakhla jkafka mjq, ydj;= m%cdj we;=<; ia;%Ska iïnkaOjmj;sk my;a ;;a;ajh hs. fuhia;s%hf.a fi!LHh yd fmdaIKhÈhqKq lsÍu j,lajk w;r úIu ÿYafi!LH pl%hlg u. mdohs. ia;s%hl=gqïn wdodhfï úYd,;u fldgigodhl jk úg mjd úhoï lsÍu jeksm%Odk ;SrK .ekSug wehg ;sfnk
Health and Socio-economic Determinants of Malnutrition in the Plantation Sector of Sri Lanka
xi
yelshdj lrkqfha wvq n,mEula njfidhd f.k ;sfí. ;j o l=gqïnjevj,ska fndfyduhla lrkq,nkafka ia;s%h hs. tf,i fndfydawOHhkhka j;= ia;S%ka wêl ldhslúvdfjka je,elaùug mjqf,aidudðlhska w;r fnodyod.;aj.lSu Èß .ekaùfï jevigykaks¾foaY lrhs.
j;= wxYfhys wdydr Ndú;hka ydwdydr f;dard .ekSu rfÜ fiiqm%foaYj,g jvd fjkia h. j;=ksjdij, m%Odk wdydr fõ, jkqfha? lEu fõ, hs. Wfoa wdydrhg ydÈjd wdydrhg fokq ,nkafka wvqwjOdkhls. fuu p¾hdj jD;a;shgiïnkaOj ;sfnk w;r mrïmrd.Kkdjka ;siafia wLKavj mj;S.fuf,i iïm%odhslj .;a l, Wfoawdydrh yd Èjd wdydrh fjkqfjkaj;= ck;djf.ka nyq;rhmßfNdackh lrkafka wvq fmdaIKw.hlska hq;a ;sß.= msá mdol lr.;a wdydr whs;u h. rd;s% wdydrhm%Odk jYfhka t<j¿ iu. yd,amdol wdydr fõ,ls. wOHhkhkawdydr wkdrlaIs;;dj wvq lsÍfïúfYaIfhka j;=lrfha È<s÷ ckhdw;r fmdaIK ;;a;ajh jeä ÈhqKqlsÍfï mshjr ks¾foaY lrhs. ;j owdydr ms<sn| ñ:Hdjka yd ydkslrwdydr mqreÿ fuu m%cdj ;=< fmdaIKjevigykaj, n,mEu wvq lrhs.mqreI md¾Yjh iu. ii|k úgj;af;a ujqjrekaf.a wdodhu .Dyhgby<u m%;s,dNh Wmhd fok fyhskal=gqïn fi!LHh yd fmdaIKh ÈhqKqlsÍug <ud iq/l=ï myiqlï iu.tlg ujf.awdodhu$fiajdfhdacH;dj jeä lsÍfïhdka;%Khka fhdackd lsÍu fndfydawOHhkhka úiska lrkq ,nk ;j;afhdackdjls.
wdh;ksl l<ukdlrKh hgf;af,dl= j;= tajdfha ck;djf.awjYH;d iemhSfï fi!LH tallhlamj;ajd .kafka jqj o jvd l=vd j;=tu myiqlu fkdimh hs. úYd,
j;=j, mjd wvq myiqlï yd mqyqKqld¾h uKav, wvqj ksidmyiqlïj, f,dl= ysveia ;sfí.fi!LH ffjoH ks,Odß ld¾huKav,h úiska ud;D yd <ud fi!LHfiajd iemhqj o ksfjia fi!LH iq/l=ï ixrplhg ;ju;a m%udKj;a;rï wjOdkhla fhduqlr ke;.tfiau ujq lsß §fï wvq ksrfmalaIwkqmd;h wvq ùu, fnda;,fhka lsߧfï by< wkqmd;h, wfhda.HW!kmQrl wdydr §u yd wvq wdydrúúO;ajh iu. fi!LH fiajlhkaúiska lrkq ,nk wvq ksfjia ixpdriïnkankaO ù ;sfnk nj o fidhd.kq ,en ;sfí. j;= ck.ykhm%uqLj isák Èia;s%lalj,ck.ykhg fi!LH iq/l=ïfiajlhska isákafka wvq .Kkls.wOHhkhka uq,a <ud úh iq/l=ï ydixj¾Ok jHdmD;sfha isg m%cdiyNd.s;ajh yd j;= lïlrejkaw;r fi!LH yd fmdaIK fiajdj,Wmfhdackh jeä lsÍu olajd mdvïmßudKkh lrkakg fhdackd lrhs.fïjdg j;=j, .=Kd;aul fiajdjkaiemhSug m%uqL;dj §u, j;=j,jD;a;sh yd iïnkaO fi!LHm%Yakj,g wduka;%Kh lrkjD;a;sh fi!LH fiajdjla we;s lsÍuyd ud;D yd <ud fi!LH ̂ MCH&jevigyka iïnkaO ls%hdldrlïj,mqreI iyNd.s;ajh jeälsÍuwe;=<;a h.
j;= wxYfha jev lrk ujqjreka ydiïnkaO lïlre whs;sjdislïúu¾Ykh lsÍu wjYH w;r .¾NsKSujlg wef.a .¾NsKS ld,h ;=<by<u /ljrKh ,efnk ydorejdg by<u /ljrKh ,ndfok wdldrhlg wjYH .e,mqï l<hq;= h. ;j o wOHhkhka <udiq/l=ï uOHia:dkj, ;;a;ajh jeäÈhqKq lsÍug yd wjYH;djkag wkqjfmdaIK wxYj,g ueÈy;a ùug, <udixj¾Ok ls%hdldrlï jeä ÈhqKqlsÍug yd <ud iq/l=ïjevigykaj, § uõmsh yd m%cdiyNd.s;ajh Yla;su;a lsÍug
fhdackd lrhs. tfiau wOHhkhkalsysmhla fmdaIK ;;a;ajh jeäÈhqKq lsÍfï bosß ud¾.hla f,iks;H jd¾Isl mKq yrKh, jeisls,smyiqlï ÈhqKq lsÍu yd ish<uqkaf.a iajia:;dj iïnkaO uõmsh wOHdmkh fhdackd lrhs.
miq.sh oYl ;=kl ld,h ;=< YS%,xld wdKavqj úiska yd wfkl=;aWkkaÿ md¾Yùh ixúOdkck.ykfha úfYaIfhkau j;=wxYfha fmdaIK ;;a;ajh ÈhqKqlsÍu lrd fhduq lrk ,o fndfydajevigyka ls%hd;aul lrkq ,en;sfí. flfia jqj o m%ldYs;idys;Hfhys tu jevigyka ms<sn|lr ;sfnk l%uj;a we.hSï ÿ¾,Nh. fndfyda we.hSï jevigyfka>Dcq ksuejqï lsysmhla uekSug ydjevigyka ls%hdjg k.k ,oaokaúiskau lrk we.hqïj,g iSud ù;sfí. iajdëk m%;sM, yd n,mEïwe.hqï w;sYhskau ÿ¾,N h. fuhish¨ wkd.; fmdaIK jevigykams<sn|j jevigykaj, id¾:l;ajh;lafiare lsÍfï iajdëk m%;sM, ydn,mEï we.hqï iu. w;sk; .;awksjd¾h tlg hd lrk ,o we.hqïls%hdj,shl wjYH;dj wjOdrKhlrhs. fmdaIK jevigyka we.hSums<sn| ,nd .; yels wOHhklsysmh m%f;Hl jevigykaid¾:l;ajh ms<sn| odhl;ajh;lafiare lsÍug m%udKj;af;dr;=re fkdimhhs. fmdaIKjevigyka fndfyduhla r|dmj;skafka wvq úIhnoaOl%ufõohlska hq;a Tjqkaf.aujevigyk ms<sn|j mYapd;a ld¾hwe.hqï ;Dma; lsÍug cd;slwOHhkhkaf.ka ,nd .kakd iqmqreÿf;dr;=re u; mokï ùu h. ;SrK.ekSfï ls%hdj,sh ;=< m%;sm;a;siïmdolhskag fuu m%fõYhgwe;af;a iSñ; w.hls.
Working Paper Series No. 21
xii
epiwNtw;Wr; RUf;fk;
19 Mk; E}w;whz;bd; Muk;gfhy fl;lj;jpy;> ,yq;ifapd;gpujhd tptrhag;nghUshjhuj;jpw;F> gpupj;jhdpafhyzpj;Jt Ml;rpapdhy;ngUe;Njhl;lj; Jiw mwpKfk;nra;ag;gl;lJld; tu;j;jfg;nghUshjhukhfkhw;wkile;jJld;%yjdkakhf;fg;gl;lJ. gq;fRnjhw;wpd; fhuzkhf Nfhg;gpg;gapu;r; nra;ifmoptile;jijj; njhlu;e;J,yq;ifapd; gpujhd tptrhag;gapu;r; nra;if cw;gj;jpfspy;gpujhd Vw;Wkjpg; gapuhf,wg;gu; cUntLj;jJ.cs;ehl;Lr; rpq;fsr;r%fj;jpypUe;J Nghjpasthdnjhopyhsu;fisg;Ml;r;Nru;g;Gr; nra;J nfhs;sKbahikapd; fhuzkhf>ngUe;Njhl;lj; Jiwapy;njhopy; nra;tjw;fhf Mapuf;fzf;fhd njd; ,e;jpanjhopyhsu;fs; ,yq;iff;Fnfhz;L tug;gl;L njhopypy;<LgLj;jg;gl;ldu;. ,e;j ,e;jpanjhopyhsu;fs; Njhl;lq;fspy;tpNrlkhf kj;jpa kiyehl;Lg;gpuNjrq;fspy;Fbaku;j;jg;gl;ldu;. ,e;jngUe;Njhl;lj; Jiwapy;trpf;fpd;w ,e;jnjhopyhsu;fspd;gpuj;jpNafkhd gz;Gfs; kw;Wk;mtu;fSila njhopy; kw;Wk;FLk;g cwTfis ftdj;jpy;nfhz;L> ,g;gpuNjrq;fs;Njhl;lj; Jiwahftifg;gLj;jg;gl;ld. mtu;fs;tho;fpd;w G+Nfhsg;gpuNjrj;jpy; tuyhw;W uPjpahfmikf;fg;gl;l Kfhikj;JtKiwik kw;Wk; ngUe;Njhl;lj;Jiwapy; ,Uf;fpd;wtu;fspd;murpay;> fyhr;rhuk; kw;Wk;rka czu;Tfspd;mbg;gilapy; khWgl;l Nritkhjpupfs; kw;Wk; Nritj;Njitg;ghl;L elj;ijfs;mgptpUj;jpaile;jd.RfhjhuKk; mtw;wpypUe;Jtpjptpyf;fd;W.
Vida gFjpfSld; xg;gPLnra;Ak; NghJ
Kd;Ndw;wkilahjgpujhdkhdnjhU gFjpahfNghrhf;F fhzg;gLfpd;wJ.efu kw;Wk; fpuhkpardj;njhifAld; xg;gPLnra;Ak; NghJ Njhl;lj; Jiwrdj;njhifapd; Nghrhf;Fepiyik gw;wpa Fbapay;kw;Wk; Rfhjhu Ma;Tfs;Nghd;w toikahd RfhjhuGs;sptpguq;fs;> tpNrlMa;Tfs; kw;Wk; VidaMuha;rpf; fw;iffs; kpfnkJthdnjhUKd;Ndw;wnkhd;iwNafhl;Lfpd;wJ. ,r;rdj;njhifapd; Nghrhf;Fepiyikapid Nkk;gLj;Jk;nghUl;L njhlu;r;rpahf te;jmurhq;fq;fs; kw;Wk; VidaKftuhz;ikfs; Nkw;nfhz;lgy;NtWgl;lepfo;r;rpj;jpl;lq;fspd;fhuzkhfNt ,e;j epiyikcUntLj;Js;sJ. rpyNghrhf;F epfo;r;rpj;jpl;lq;fs;tpNrlkhf Njhl;lj;Jiwrdj;njhifapidmbg;gilahf khj;jpuk;nfhz;ljhf ,Ug;gJld;Vida Nghrhf;Fepfo;r;rpj;jpl;lq;fs; ehLjOtpa tifapy;Nkw;nfhs;sg;gLfpd;wd. ,e;jeltbf;iffs; fyg;GngWNgWfisf; fhl;Lfpd;wd.Nghrhf;F epiyikapidNkk;gLj;jtjw;fhf gy Gjpaepfo;r;rpj;jpl;lq;fs; kw;Wk;gy;NtWgl;l kl;lq;fspy;xUq;fpizf;fg;gl;lnraw;ghLfs; jw;nghOJKd;nkhopag;gl;Ls;sd.Nghrhf;F epiyikapy;vjpu;ghu;j;j khw;wj;ij nfhz;LtUk; nghUl;LmKy;gLj;jg;gl;l ghuk;gupaKiwikfspd; Njhy;tpfNs,e;j Kf;fpa epfo;TfSf;Ftoptif nra;jd. Fwpg;ghfNjhl;l r%fj;jpy; fhzg;gLk;Nghrhf;F njhlu;ghdgpur;rpidfis eptu;j;jpnra;tjw;F GjpamZFKiwfs;Njitg;gLfpd;wd. Njhl;lj;Jiwapd; Nghrhf;F epiyik
njhlu;ghf Nkyjpfnraw;ghLfis mKy;gLj;Jk;Nehf;fpy; Njhl;lj;Jiwkf;fs; mDgtpf;fpd;wmrhjhuzkhd gpur;rpidfis,dq; fz;L nfhs;Sk;nghUl;L jw;nghOJs;sjfty;fis Nrfupj;J kjpg;gPLnra;tjw;fhd Njit cs;sJ.
Njhl;lq;fspy; tho;fpd;wkf;fspd; Rfhjhuk; kw;Wk;mtu;fSila Nghrhf;FepiyikAld; njhlu;Gilarpy Nehf;fq;fis ,dq;fz;Lnfhs;Sk; nghUl;L ,e;jMa;T Kd;ndLf;fg;gl;Ls;sJ.1990 Kjy; 2013 Mz;Lfhyg;gFjpapd; NghJMuha;rpfs; kw;Wk; fw;ifMa;Tfspd; KbTfs; gw;wp,e;j kPsha;T ftdk;nrYj;Jfpd;wJ.Njhl;lj;Jiwapdupd; tuyhWkw;Wk; r%f fyhr;rhugupzhkk;> RfhjhuNritfspd; mgptpUj;jp>Njhl;lj;Jiwrdj;njhiff;fhd Nghrhf;Fepiyik rhu; juTfs;>tho;f;if epyikfs; kw;Wk;tho;f;ifg; ghzp> czTg;gof;ftof;fk; kw;Wk; MfhuEfu;T> tPl;Lj;Jiw tUkhdk;kw;Wk; nrytpdk;> kw;Wk;Njhl;lj;Jiwapy;Nkw;nfhs;sg;gl;l Nghrhf;Fepfo;r;rpj;jpl;l kjpg;gPLfs;njhlu;ghd jfty;fis ,e;jmwpf;if ntspg;gLj;Jfpd;wJ.
,yq;ifapy; cs;sr%fq;fspy; Njhl;lj; Jiwapy;tho;fpd;w rdj;njhifFiwe;j r%f me;j];ijg;ngw;Ws;sJ. fhyzpj;JtMl;rpf; fhyj;jpy;Ml;rpahsu;fspdhy;,yq;ifapy; Ntiynra;tjw;fhf njd;,e;epahtpypUe;J nfhz;Ltug;gl;ltu;fs; vd;w tuyhw;WuPjpahd R+o;epiyNa ,e;jr%f me;j];J Fiwthffzpg;gPL nra;tjw;fhd gpujhdfhuzpahf cs;sJ. ,e;jr;r%fj;jpw;F FbAupik
Health and Socio-economic Determinants of Malnutrition in the Plantation Sector of Sri Lanka
xiii
toq;fg;gl;likapidj;njhlu;e;J mjpfkhdtplaq;fspy; Kd;Ndw;wk;Vw;gl;Ls;sd. ,Ue;j NghJk;>Vida r%fq;fSf;F rkkhdr%f Vw;Gilikapid ,d;Dk;milatpy;iy> Fwpg;ghfmtu;fSila xNu ,dkhdVida gpuNjrq;fspy;tho;fpd;w r%fj;Jld; xd;whfkjpf;fg;gLtjpy;iy. ,e;jehl;bd; mgptpUj;jpr;nraw;ghLfismKy;gLj;Jtjd; Clhf r%fnghUshjhu eyd;fismDgtpg;gjw;fhd gpujhdePNuhl;lj;jpy; ,tu;fSilanjhopy;rhu; milahsg;gLj;jy;njhlu;ghf NghjpasthdKd;Ndw;wk; toq;fg;gltpy;iy.NkYk; Rje;jpuk; mile;jgpd;duhd fhyg; gFjpapd;NghJ ehl;bd; VidagpuNjrq;fSld; xg;gPL nra;Ak;NghJ Njhl;lj; JiwKfhikapy; ey;yhl;rpf;fl;likg;G rpwpjsNtkhw;wkile;Js;sJ. Njhl;lj;Jiwapy; Copau;fspd;nraw;ghLfs; kw;Wk; eyd;Gupnjhlu;ghf nraw;gLtjw;fhdnjhopw;rq;fq;fspd; vOr;rpapd;fhuzkhf> Njhl;lj; Jiwapy;ey;yhl;rp njhlu;ghffhyzpj;Jt tplaq;fs;fisag;gl;LtUfpd;wd.
jw;nghOJ epyTfpd;w Rfhjhukw;Wk; Nghrhf;Fg;gpur;rpidfs; tho;thjhu
epiyikfSld; njhlu;Ggl;l
fyhr;rhu tplaq;fSld;neUq;fpa gpizg;gpidf;nfhz;bUg;gjhff;fz;lwpag;gl;Ls;sJ. Njapiykw;Wk; ,wg;gu; Njhl;lq;fs;mwpKfk; nra;ag;gl;l fhyk;njhlf;fk; Njhl;lg; gFjpapy;njhlu; FO tPLfs;gpuj;jpNafkhd cgfyhr;rhuj;jpidcUthf;fpAs;sJld; mitRfhjhuk; kw;Wk; Nghrhf;Fnjhlu;ghf gy Neu;khwhdtplaq;fis gutyilar;nra;Js;sJ. ,e;jr; r%fj;jpd;
Rfhjhuk; kw;Wk; Nghrhf;FepiyikapidNkk;gLj;Jtjw;F ,e;jfyhr;rhu tplaq;fs; ghupajilnahd;whf ,Ug;gjhf gyMa;Tf; fw;iffs; Rl;bf;fhl;bAs;sd. tiuaWf;fg;gl;lnjhlu; FO tPl;L trjpfSld;$ba tho;thjhu epiyikapy;fhyhr;rhu uPjpahf Mz;fspd;Mjpf;fk; Xq;fpf;fhzg;gLtJld;cs;sfuPjpahd kw;Wk;ntspaf uPjpahd xj;Jiog;G,e;j tho;thjhuepiyikfisNkk;gLj;Jtjw;F jw;nghOijaepiyik nry;thf;Fr;nrYJfpd;wJ. FLk;gj;jpYk;Njhl;l r%fj;jpYk;ngz;fSf;F Fiwthdme;j];j;J toq;fg;gLfpd;wikmilahsk; fhzg;gl;l kpfKf;fpakhdnjhU tplakhFk;.,e; epiyikahdJ ngz;fspd;Rfhjhu kw;Wk; MNuhf;fpaepiyikapidNkk;gLj;Jtjw;F jilahfcs;sJld; ,itnjhlu;r;rpahd ghjfkhdMNuhf;fpa epiyikfSf;Ftoptif nra;fpd;wJ. tPl;Lj;Jiw tUkhdj;jpd; ghupagq;fpw;F ngz;fs; gq;fspg;Gr;nra;fpd;w NghJk;> nryTnra;jy; Nghd;w kpfKf;fpakhd jPu;khdq;fspy;ngz;fspd; jpwd; njhlu;gpy;Fiwe;j nry;thf;ifnrYj;Jtjhffz;lwpag;gl;Ls;sJ. NkYk;>tPl;Lj; Jiwapd; mNdfkdNtiyfis ngz;fs;nra;fpd;w NghJk;> Njitaw;wcly;uPjpahdmOj;jq;fspypUe;J Njhl;lj;Jiwg; ngz;fspidghJfhf;Fk; nghUl;L FLk;gmq;fj;jtu;fSf;F kj;jpapy;nghWg;Gf;fis gfpu;e;Jnfhs;tjid Cf;fg;gLj;jy;njhlu;ghdepfo;r;rpj;jpl;lq;fismNdfkhd Ma;Tfs; rpghupRnra;Js;sd.
Njhl;lj; Jiwapd; czTg;gof;ftof;fq;fs; kw;Wk;czTfspd; njupT ehl;bd;Vida gFjp kf;fspYk; ghu;f;fNtWgl;ljhFk;. Njhl;lj;Jiwapdupd; gpujhdKd;Dupik czT ,uTr;rhg;ghlhFk;. fhiy kw;Wk;gfy; czT njhlu;ghfFiwe;j ftdk;nrYj;jg;gLfpd;wJ. ,e;jelj;ijahJ mtu;fSilanjhopYld;njhlu;GilajhfTk; guk;;giuguk;giuahf njhlu;e;Jgof;fg;gl;L te;Js;sJ. ,Ue;jNghJk;> ghuk;gupa uPjahffhiy kw;Wk; gfy; czTnjhlu;ghf> Fiwe;jNghrhf;Fr; rf;jpAld; $baNfhJik khtpidmbg;gilahff; nfhz;l khczTfis Njhl;lj; Jiwapd;mNdfkhdtu;fs;Efu;fpd;whu;fs;. ,uTr;rhg;ghlhdJ muprpiambg;gilahff; nfhz;lczTld; gpujhdkhffha;fwpfis nfhz;like;jJ.Nghrhf;F epiyikapidNkk;gLj;Jk; nghUl;L Njhl;lj;Jiwapy;; Viofs; kj;jpapy;tpNrlkhf czT njhlu;ghdmr;rj;jd;ikapid,opTgLj;Jtjw;fhdnraw;ghLfis Ma;Tfs;rpghupR nra;fpd;wd. NkYk;>czT kw;Wk; Mgj;jhdczTg; gof;ftof;fq;fs;gw;wpa ek;gpf;if ,e;jr;r%fj;jpd; Nghrhf;F gw;wpaepfo;r;rpj;jpl;lq;fspd;jhf;fj;ij Fiwf;fpd;wJ.Mz;fSld; xg;gPL nra;Ak;NghJ tPl;Lj; Jiwapy;ngz;fspd; tUkhdk; Njhl;lj;Jiwapy; cau; eyd;fis<l;bAs;sJ. tPl;Lj; Jiwapd;Rfhjhuk; kw;Wk; Nghrhf;Fepiykfis Nkk;gLj;Jk;nghUl;L Foe;ijg; guhkupg;GtrjpfSld; $ba ngz;fspd;tUkhdk; kw;Wk; njhopy;tha;g;ig mjpfupg;gjw;fhdKiwikfis Kd;nkhoptjw;FmNdfkhd Ma;Tfs; rpghupRnra;Js;sd.
Working Paper Series No. 21
xiv
,Ue;j NghJk; $l;LKfhikapd; fPo;Njhl;lj;JiwahdJ jkJrdj;njhifapd; gpur;rpidfisjPu;j;Jf; nfhs;tjw;fhfRfhjhu myfpidjf;fitj;Jf; nfhz;Ls;sJld;rpwpa Njhl;lq;fSf;F ,e;jtrjpahdJ tpupTgLj;jg;gltpy;iy. Fiwe;jtrjpfs; kw;Wk; Fiwthfgapw;wg;gl;l gjtpazpNghd;wtw;Wld; ghupaFiwghLfs; ghupaNjhl;lq;fspd; trjpfspYk;fhzg;gLfpd;wd.,Ue;jNghJk;> RfhjhukUj;Jt mjpfhupapd;gjtpazpapdhy; kfg;Ngw;Wkw;Wk; Foe;ij MNuhf;fpaNritfs; toq;fg;gLfpd;wd.Foe;ijg; guhkupg;Gf; $Wfs;gw;wp tPLfSf;F tUifjUtjd; Kf;fpaj;Jtk;,d;Dk; NghjpasTmwpTWj;jg;gltpy;iy. RfhjhuCopau;fspd; FiwthdFoe;ijg; guhkupg;G tUiffs;tpNrlkhf jha;g;ghy; Cl;ly;tPjk;> cau; Gl;bg;ghy; Cl;ly;>nghUj;jkw;w JizczT+l;ly;fs; kw;Wk;Fiwthd czTg;gy;tifikf;fhd fhuzpfshffz;lwpag;gl;Ls;sd.gpujhdkhf Njhl;lrdj;njhifAld;khtl;lq;fspy; %fj;jpw;fhdRfhjhu Copau;fspd;vz;zpf;if Fiwthfcs;sJ. Njhl;lj; Jiwapdu;kj;jpapy; rdr%f gq;Fgw;wiymjpfupg;gjw;Fk; Rfhjhuk;kw;Wk; Nghrhf;Fr;Nritfisg; gad;gLj;JtJnjhlu;ghf Muk;ggps;isg;gUt guhkupg;G kw;Wk;mgptpUj;jpnraw;jpl;lj;jpypUe;jhdghlq;fs; Nfhbl;Lf; fhl;Lk;tifapy; Ma;Tfs;gpNuuizfisKd;itf;fpd;wd. Njhl;lj;Jiwapy; jukhd Nrittoq;fiy Kd;Dupikg;gLj;jy;>Njhl;lj; Jiwapy; njhopYld;
njhlu;Gila Rfhjhug;gpur;rpidfSf;fhd njhopy;rhu;Rfhjur; Nritfisj;jhgpj;jy;> vk;.rp.vr; (MCH)epfo;rpj;jpl;lq;fs; njhlu;ghdnraw;ghLfspy; Mz;fspd;gq;Fgw;wiy mjpfupj;jy;vd;gtw;iw ,Jcs;slf;Ffpd;wJ.
Njhl;lj; Jiwapy;njhopy;GupAk; jha;khu;fs;njhlu;ghd njhopyhsu;cupikfs; kPsha;T nra;ag;glNtz;baJld; fu;g;gpzpj;jha;khu;fs; fu;g;g fhyj;jpd;NghJ cr;r mstpyhdftdpg;igg; ngWk; tifapYk;kw;Wk; Foe;ijfSf;Fk; cr;rmstpyhd ftdpg;ig toq;Fk;tifapYk; NjitahdjpUj;jq;fs; nra;ag;gLjy;Ntz;Lk;. NkYk;> Foe;ijg;guhkupg;G epiyaq;fspd;juj;jpid Nkk;gLj;Jtjw;Fk;rpWtu; guhkupg;Gepfo;r;rpj;jpl;lq;fspy; rdrKfgq;Fgw;wy; kw;Wk;ngw;Nwhu;fistYg;gLj;Jtjw;Fkhd rpWtu;mgptpUj;jp nraw;ghLfisNkk;gLj;Jjy; Nghd;wNghrhf;Fj;; NjitfSld;$ba Fwpf;Nfhs;fs;njhlu;ghf jiyaPLnra;tjw;Fk; ,e;j Ma;Tfs;jPu;Tfis Kd;itf;fpd;wd.fpukkhd tUlhe;j ntg;gf;Fiwg;G> fopayiw trjpfspd;Nkk;ghL kw;Wk; Nghrhf;Fepiyikfis Nkk;gLj;Jk;topnahd;W vd;w tifapy;mtu;fSila gps;isfspd;Rfhjhuk; njhlu;ghd ngw;Nwhu;fy;tp njhlu;ghf rpyMa;Tfs; rpghupR nra;fpd;wd.
kf;fspd; tpNrlkhf Njhl;lj;Jiwapdupd; Nghrhf;Fepiyikafis Nkk;gLj;Jk;Kfkhf newpg;gLj;jg;gl;lmNdfkhd epfo;r;rpj;jpl;lq;fs;,yq;if murhq;fk; kw;Wk;Vida mf;fiwfhl;Lk;epWtdq;fspdhy; fle;j %d;Wjrhg;j;j fhyj;jpd; NghJ
mKy;gLj;jg;gl;Ls;sd.vdpDk;> ,t;thwhdepfo;r;rpj;jpl;lq;fs; njhlu;ghdKiwikahd kjpg;gPLfs; kpfmupjhfNt fw;if mwpf;ifntspaPLfshf ,Uf;fpd;wd.epfo;r;rpj;jpl;lj;jpd; rpy NeubngWNgWfis mstPLnra;tjw;Fk; epfo;r;rpj;jpl;lmKy;gLj;Jdu;fs; jhkhfNtNkw;nfhs;tjw;Fkhf mNdfkjpg;gPLfs; tiuaiwnra;ag;gl;Ls;sd. Rje;jpukhdngWNgWfs; kw;Wk; nraw;wpwd;kjpg;gPLfs; kpfTk; mupjhfNtcs;sd. Nghrhf;Fepfo;r;rpj;jpl;lq;fspd;ntw;wpia kjpg;gPLnraw;tjw;fhd ngWNgw;Wkjpg;gPLfs; kw;Wk; Rje;jpukhdjhf;fq;fSld; gpize;Js;srfy vjpu;fhy Nghrhf;Fepfo;r;rpj;jpl;lq;fspd;fl;lhag;gLj;jg;gl;l cs;sftbtikg;G nra;ag;gl;lnrad;Kiwapd; Njitfis,J Kf;fpaj;Jtg;gLj;Jfpd;wJ.Nghrhf;F epfo;r;rpj;jpl;lkjpg;gPLfs; njhlu;ghffpilg;gdtpy; cs;s rpyMa;Tfs; jdpg;gl;lepfo;r;rpj;jpl;l ntw;wpfSf;fhdgq;fspg;ig kjpg;gPLnra;tjw;Fg; Nghjpasthdjfty;fis toq;Ftjpy;iy.Fiwe;j msthdFwpf;Nfhs;rhu; KiwikfSld;mtu;fSila nrhe;jepfo;r;rpj;jpl;lq;fs; njhlu;ghdMa;T fw;ifapd; gpd;duhdkjpg;gPl;il jpUg;j;jpg;gLj;Jk;Njrpa uPjpahdfw;iffspypUe;J ngw;Wf;nfhs;sg;gLfpd;w toikahdjfty;fs; kPJ mNdfkhdNghrhf;F epfo;r;rpj;jpl;lq;fs;jq;fpapUf;fpd;wd.jPu;khdnkLj;jy;nrad;Kiwapy; <LgLfpd;wnfhs;if cUthf;Fdu;fSf;FtiuaiwahdngWkhdq;fisNa ,e;jmZFKiwnfhz;bUf;fpd;wJ.
1
Health and Socio-economic Determinants of Malnutrition in the Plantation Sector of Sri Lanka
1. Background to the ReviewConventionally, the population of acountry is divided into urban andrural sectors according to the placeof residence considering theavailability of facilities at the locality.In the Sri Lankan context,administrative demarcationsbelonging to municipalities andurban councils are considered asurban sector while those within thePradeshiya Sabhas are consideredas the rural sector. Hence, the totalgeographical area of the countrycan be divided either into urban orrural sectors administratively.However, in Sri Lanka, historicallyanother demarcation has beencreated within the division of urbanand rural to accommodate a specificgroup of population that reside intea and rubber plantations in thecentral area of the country. Majorityof those plantations are situatedwithin the boundaries of PradashiyaSabhas administratively. Few aresituated within urban council areas.Plantations are defined as areasmore than 20 acres in extent andhaving not less than 10 residentiallabourers (Department of Censusand Statistics, 2009/10).Considering the specific nature ofthe population living in thoselocalities, including theiroccupational and ancestralrelations, those areas arecategorized as the estate sector.Due to political, cultural andreligious sensitivity of the estatesector, and the historicallyestablished management styles ofthose geographical boundaries theyreside, different service deliverymodels and service seekingbehaviour has evolved. Health is noexception.
The origins of the curative branch ofthe present healthcare deliverystructure in Sri Lanka can be traced
back to the mid 19th century. Thiswas initiated in order to maintain thehealth of the workers in theplantations (estates). The term“district” hospital actually means thehospital dedicated to a plantationdistrict. With the establishment ofthe civil medical department in the1850s, the spread of hospitalnetwork in the central part of thecountry focused on the populationsnow belonging to the “estate” sector(Uragoda, 1987). However, it couldbe seen that in the very populationwhere expansion of the healthservices started, the healthindicators continued to lag behindduring the last century.
Nutrition is one of the key areas thatthe estate sector did not improve inparallel to the other sectors.Routine health statistics, specialsurveys such as demographic andhealth survey and other researchstudies have shown only slowimprovement in nutritional status inthe estate population compared tothe urban and rural. This is in spiteof successive governments andother agencies carrying outnumerous programmes to uplift thenutritional status of this population.Some of the nutritional interventionsdone in the estate sector arespecific to that population whereasothers are country-wideinterventions. Those interventionshave shown mixed results. Manynew programmes geared fornutritional interventions andcoordinated action at different levelsare also proposed at present(National Nutritional Council, 2013).This highlights the failure oftraditional methods to bring thedesired changes in the nutritionalstatus. New approaches are neededto tackle the nutritional issuesparticularly among the estate
community. In order to institutefurther action on the nutrition statusof the estate sector, there is a needto collate and evaluate existinginformation to understand the issuespeculiar to the estate community.
This review was undertaken toexplore some aspects related toestate community health and theirnutrition status. The review focuseson the research and survey findingsduring the period 1990 to 2013.When there is a scarcity ofinformation on certain aspects ofestate health, studies conductedprior to 1990 were also taken intoconsideration. The report presentshistorical and socio-culturalevolution of the estate sector, healthservices development, nutritionalstatus data for the estate population,living conditions and lifestyle,dietary habits and foodconsumption, household incomeand expenditure, and information onnutrition programme assessmentsconducted in the estate sector.
The research team employed asearch strategy to maximize thecollation of related literature througha systematic approach. Digitallyavailable published papers andreports were accessed through pubmed, hinari, science direct, Athens,Google scholar and other researchdata bases using key words such asSri Lanka, nutrition, plantation,estate sector, malnutrition, teaindustry, rubber industry, and otherterms specified by the relevant databases. Libraries of the University ofColombo, University of Peradeniya,Postgraduate Institute of Medicine,Department of Agriculture, TeaResearch Institute, Institute of PolicyStudies, Plantation HumanDevelopment Trust, Ministry ofHealth and other government
2
Working Paper Series No. 21
institutions related to foodagriculture, plantations and healthwere utilized. In addition theresearch team had discussions withdifferent departments of the Ministryof Health, Plantation HumanDevelopment Trust (PHDT), TeaResearch Institute (TRI),Department of Census andStatistics, Central Bank, TeaSmallholder’s Authority, estatemanagement, individual
researchers and researchinstitutions to access reports andunpublished documents.
Apart from the few studies directlyfocusing on the estate sector as aseparate stratum, in mostquantitative national studies, thesample size of the estate populationwas inadequate to provide statisticalinferences. There were only fewstudies employing qualitative
methods to understand behaviouralelements of health and nutrition inthe estate sector. Original reportsand papers could not be found inseveral studies. Hence, for thepurpose of completion, the authorshave added them as secondarycitations. In the Bibliography, theauthors have included all theliterature perused for this reviewalthough some of them are notspecifically cited in the text.
2. Profile of Sri LankaSri Lanka is a small island in theIndian Ocean with an area of 65,610square kilometres, comprising of64,630 square kilometres of land,and 980 square kilometres of water(IndexMundi, 2014). In terms oftopography, the island consists of asouth central mountainous region,which rises to an elevation of 2,502metres and is surrounded by broadlowland plains at an elevation of0-75 metres above sea level. SriLanka inherits an ideal climate foragricultural activities, and the majorcultivation crops are tea, coconut,rubber and paddy. With thesubstantial change in the economicstructure from ‘developing’ phase to‘middle income’ phase, the countrygained a 7.3 per cent of growth in2013. This growth is achievedthrough a combination of shares ofthree major sectors namely; servicessectors (58.1 per cent), industry(31.1 per cent), and agriculture (10.8per cent) (Central Bank of Sri Lanka,2013). In 2013, per capita income isestimated at US$ 3,194.The target isto achieve per capita income of US$4,000 by 2016 (World Bank, 2014).
At present, Sri Lanka is placed atthe 57th position in the worldpopulation chart (IndexMundi,2014). According to the censusreport in 2012, the population of SriLanka is 20.2 million. The
population growth was estimated at1.4 per cent in the year 2000. Itdecreased to 1.0 per cent in 2011and 0.9 per cent in the followingyear. The growth at present isaccounted at 0.8 per cent (CentralBank of Sri Lanka, 2013).Furthermore, population density hasshown slight fluctuations over theyears. Population density in 2012was 323 per square kilometre, and itincreased to 327 people per squarekilomtre in 2013 (Department ofCensus and Statistics, 2012; CentralBank of Sri Lanka , 2013). There hasbeen a significant improvement inthe labour force, and labour forceparticipation. In 2013, the labourforce accounted for 8.8 million,which reflects a 29 per centincrease compared to 2000 (6.7million) (Central Bank of Sri Lanka,2013). Labour force participationhas increased to 53.8 per cent in2013 from 50.3 per cent in 2000. Asper the latest statistics,unemployment rate has come downfrom 7.6 per cent in 2000 to 4.4 percent in 2013, reflecting a 44 per centreduction. Sri Lanka experienced asubstantial decline in poverty overthe years; the poverty head countratio in 2012 was 6.7 per cent, thatis a 4 times decrease compared tothe ratio in 1991 (26.1 per cent)(Department of Census andStatistics, 2012/13).
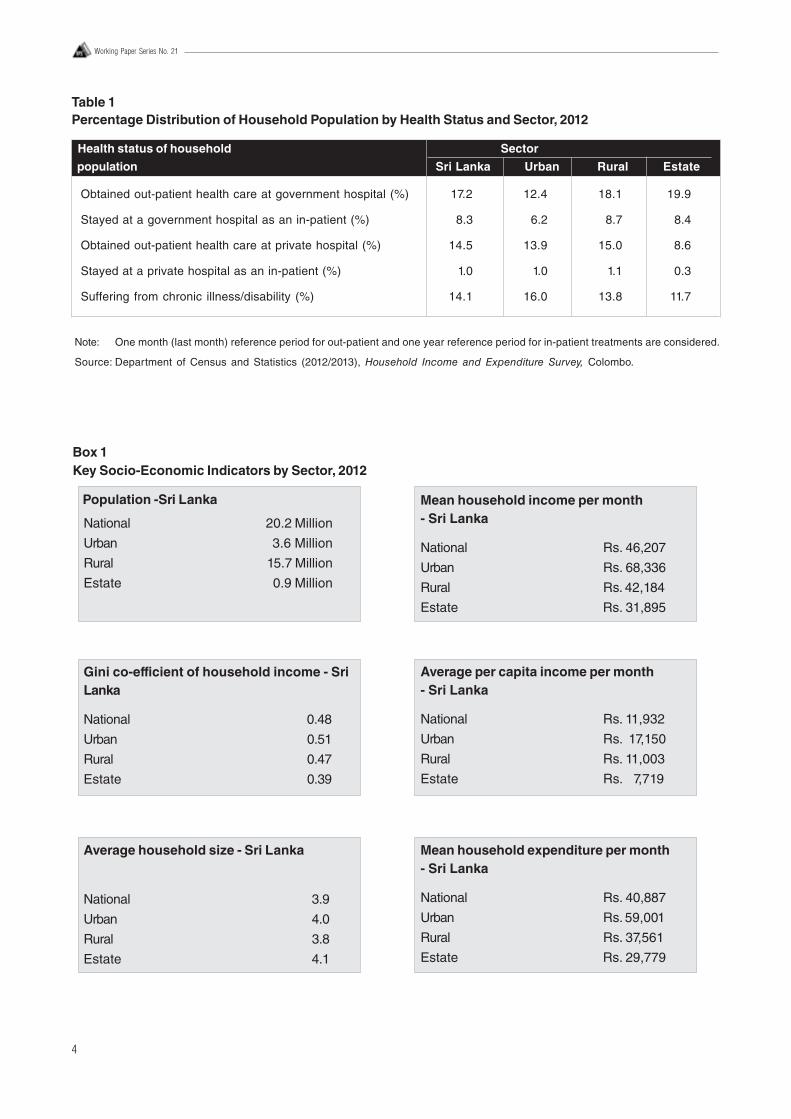
The key socio-economic indicatorsare presented by sectors in Box 1. Interms of population by sectors, themajority (78 per cent) isconcentrated in the rural areas,whereas 17 per cent reside in urbanareas. The estate sector population,which is the lowest proportion ofpopulation, accounts for almost 5per cent or 0.9 million. According tothe latest census data, all theestates in the country areconcentrated in 14 districts (referFigure 2). Females account for 52.8per cent of the total population ofestates. The national averagehousehold size in 2012 is 3.9, ofwhich the highest is reported fromthe estate sector (4.1). Secondhighest is in the urban sector (4.0)and the rural sector represents thelowest household size (3.8).
According to the data, the estatesector is relatively vulnerable interms of household income andexpenditure. Monthly meanhousehold income in the country isRs. 46,207. The urban sector showsthe highest household income (Rs.68,336 per month), which is nearly1.5 times higher than the nationalaverage. The rural sector reportsthe next highest income (Rs. 42,184per month). In terms of expenditureon food, the estate sector spendsthe highest amount (49.6 per cent),
3
Health and Socio-economic Determinants of Malnutrition in the Plantation Sector of Sri Lanka
which is substantially higher thanthe national average (39.4 per cent).The rural sector also spends (41.1per cent) slightly higher than thenational average. The urbansector—the highest monthly incomereceiver— spends the lowestamount (32.3 per cent) on food anddrink, which is significantly lowerthan the national level (Departmentof Census and Statistics, 2013).
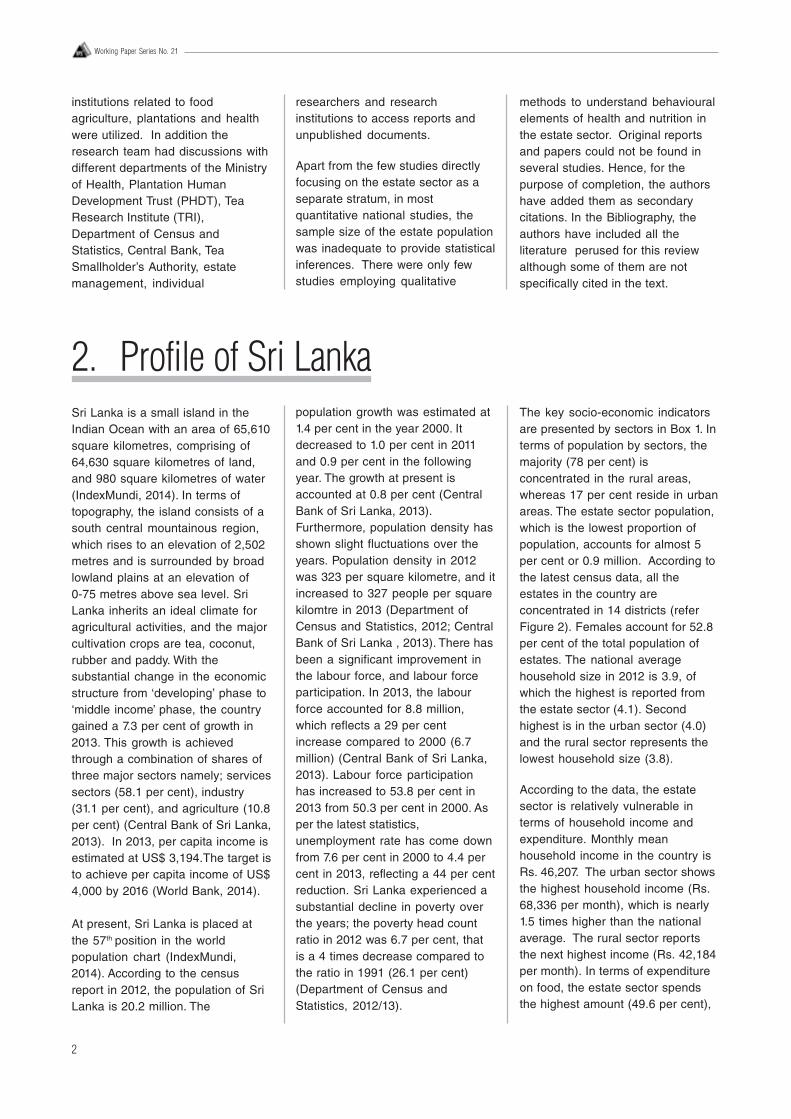
The national poverty head countratio (HCR) in the country hasdecreased drastically, from 26.1 percent in 1990/91 to 6.7 per cent in2012, which reflects a decrease of74 per cent (refer Figure 1). Overall,the decrease of poverty HCR by theurban, rural, and estate sectors from1990/91 to 2012 is 87, 74 and 47 percent, respectively. The estatesector’s poverty HCR however, ishigh between 1995/96 to 2012compared to that of the other twosectors (Department of Census andStatistics, 2014).
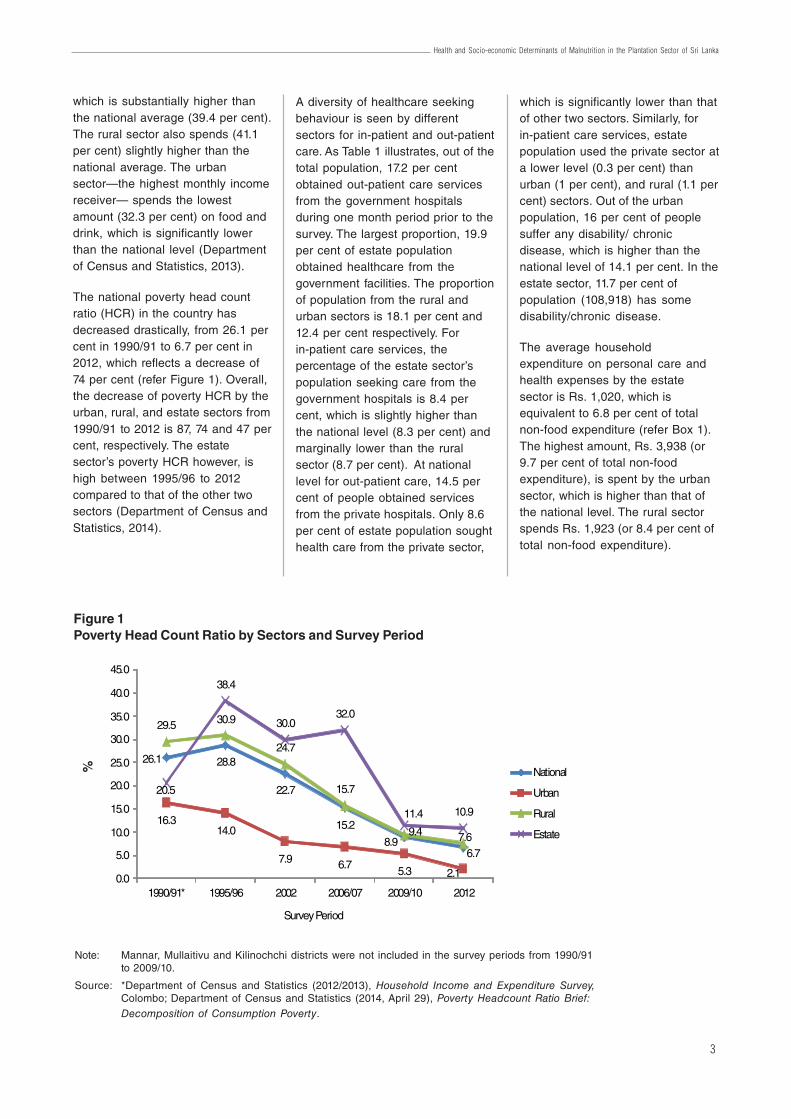
A diversity of healthcare seekingbehaviour is seen by differentsectors for in-patient and out-patientcare. As Table 1 illustrates, out of thetotal population, 17.2 per centobtained out-patient care servicesfrom the government hospitalsduring one month period prior to thesurvey. The largest proportion, 19.9per cent of estate populationobtained healthcare from thegovernment facilities. The proportionof population from the rural andurban sectors is 18.1 per cent and12.4 per cent respectively. Forin-patient care services, thepercentage of the estate sector’spopulation seeking care from thegovernment hospitals is 8.4 percent, which is slightly higher thanthe national level (8.3 per cent) andmarginally lower than the ruralsector (8.7 per cent). At nationallevel for out-patient care, 14.5 percent of people obtained servicesfrom the private hospitals. Only 8.6per cent of estate population soughthealth care from the private sector,
which is significantly lower than thatof other two sectors. Similarly, forin-patient care services, estatepopulation used the private sector ata lower level (0.3 per cent) thanurban (1 per cent), and rural (1.1 percent) sectors. Out of the urbanpopulation, 16 per cent of peoplesuffer any disability/ chronicdisease, which is higher than thenational level of 14.1 per cent. In theestate sector, 11.7 per cent ofpopulation (108,918) has somedisability/chronic disease.
The average householdexpenditure on personal care andhealth expenses by the estatesector is Rs. 1,020, which isequivalent to 6.8 per cent of totalnon-food expenditure (refer Box 1).The highest amount, Rs. 3,938 (or9.7 per cent of total non-foodexpenditure), is spent by the urbansector, which is higher than that ofthe national level. The rural sectorspends Rs. 1,923 (or 8.4 per cent oftotal non-food expenditure).
Figure 1Poverty Head Count Ratio by Sectors and Survey Period
Note: Mannar, Mullaitivu and Kilinochchi districts were not included in the survey periods from 1990/91to 2009/10.
Source: *Department of Census and Statistics (2012/2013), Household Income and Expenditure Survey,Colombo; Department of Census and Statistics (2014, April 29), Poverty Headcount Ratio Brief:Decomposition of Consumption Poverty.
26.1 28.8
22.7
15.2
8.96.7
16.314.0
7.9 6.75.3 2.1
29.5 30.9
24.7
15.7
9.4 7.6
20.5
38.4
30.032.0
11.4 10.9
0.0
5.0
10.0
15.0
20.0
25.0
30.0
35.0
40.0
45.0
1990/91* 1995/96 2002 2006/07 2009/10 2012
Survey Period
National
Urban
Rural
Estate
%
4
Working Paper Series No. 21
Box 1Key Socio-Economic Indicators by Sector, 2012
National 20.2 Million
Urban 3.6 Million
Rural 15.7 Million
Estate 0.9 Million
Mean household income per month- Sri Lanka
National Rs. 46,207
Urban Rs. 68,336
Rural Rs. 42,184
Estate Rs. 31,895
Gini co-efficient of household income - SriLanka
National 0.48
Urban 0.51
Rural 0.47
Estate 0.39
Average per capita income per month- Sri Lanka
National Rs. 11,932
Urban Rs. 17,150
Rural Rs. 11,003
Estate Rs. 7,719
Average household size - Sri Lanka
National 3.9
Urban 4.0
Rural 3.8
Estate 4.1
Mean household expenditure per month- Sri Lanka
National Rs. 40,887
Urban Rs. 59,001
Rural Rs. 37,561
Estate Rs. 29,779
Population -Sri Lanka
Table 1Percentage Distribution of Household Population by Health Status and Sector, 2012
Note: One month (last month) reference period for out-patient and one year reference period for in-patient treatments are considered.
Source: Department of Census and Statistics (2012/2013), Household Income and Expenditure Survey, Colombo.
Health status of household Sector
population Sri Lanka Urban Rural Estate
Obtained out-patient health care at government hospital (%) 17.2 12.4 18.1 19.9
Stayed at a government hospital as an in-patient (%) 8.3 6.2 8.7 8.4
Obtained out-patient health care at private hospital (%) 14.5 13.9 15.0 8.6
Stayed at a private hospital as an in-patient (%) 1.0 1.0 1.1 0.3
Suffering from chronic illness/disability (%) 14.1 16.0 13.8 11.7
5
Health and Socio-economic Determinants of Malnutrition in the Plantation Sector of Sri Lanka
Food ratio*
National 37.6 %
Urban 31.4 %
Rural 39.1 %
Estate 49.6 %
Average monthly household expenditureon personal care and health expenses**
National Rs. 2,228 (8.7%)
Urban Rs. 3,938 (9.7%)
Rural Rs. 1,923 (8.4%)
Estate Rs. 1,020 (6.8%)
Note: *Food ratio = Household expenditure on food and drink /Total household expenditure * 100;**- parentheses show the percentages on personal care and health expenditure out of total non-food expenditure.
Source: Department of Census and Statistics (2012/2013), Household Income and Expenditure Survey, Colombo.
Figure 2Percentage Distribution of Population by Districts and Sector, 2012
Source: Department of Census and Statistics (2012/2013), Household Income and Expenditure Survey, Colombo.
0 20 40 60 80 100 120
Colombo
Gampaha
Kalutara
Kandy
Matale
Nuwara Eliya
Galle
Matara
Hambantota
Jaffna
Mannar
Vavuniya
Mullaitivu
Kilinochchi
Batticaloa
Ampara
Trincomalee
Kurunegala
Puttalam
Anuradhapura
Polonnaruwa
Badulla
Monaragala
Kegalle
Ratnapura
National
Estate
Rural
Urban
6
Working Paper Series No. 21
3. Sri Lankan Health System
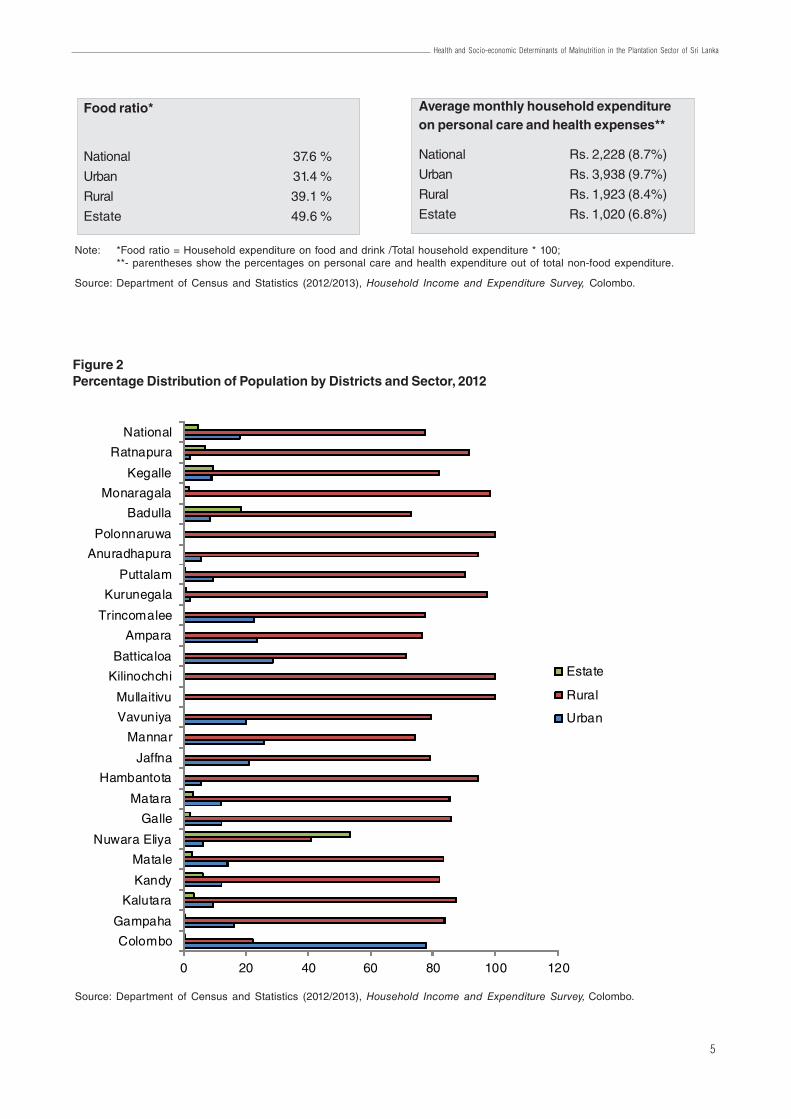
3.1 National Health SystemThe Sri Lankan government is theapex body for providing health careservices to the nation, playing themajor roles in terms of healthservice provision, health financingand imposing regulations. Sri Lankahas a two-tiered system in healthservice provision, of which, thepublic financed health system isdominant, and it provides freehealth care services at the point ofdelivery. The private sector, which isexpanding at a rapid pace, alsoplays a key role in providing out-patient and in-patient care services.At present, almost all preventivecare services are provided throughthe public health system. The statehospitals provide almost 95 per centof the in-patient care, and the rest isdelivered by the private healthfacilities. Government and privatefacilities contribute to out-patientcare services equally around 50 percent (Ministry of Health, 2012).
Government health services aremanaged by two administrative
systems, namely, line ministry andprovincial councils. Line ministry ismainly responsible for national levelimplementation such as formulatinghealth policy, strategy and actions,providing tertiary care services,providing medicinal drugs andconsumables as well as recruitingthe medical and non-medical staff.Provincial health authorities areresponsible for managing theprovincial health services, mainlydelivering of curative and preventivecare.
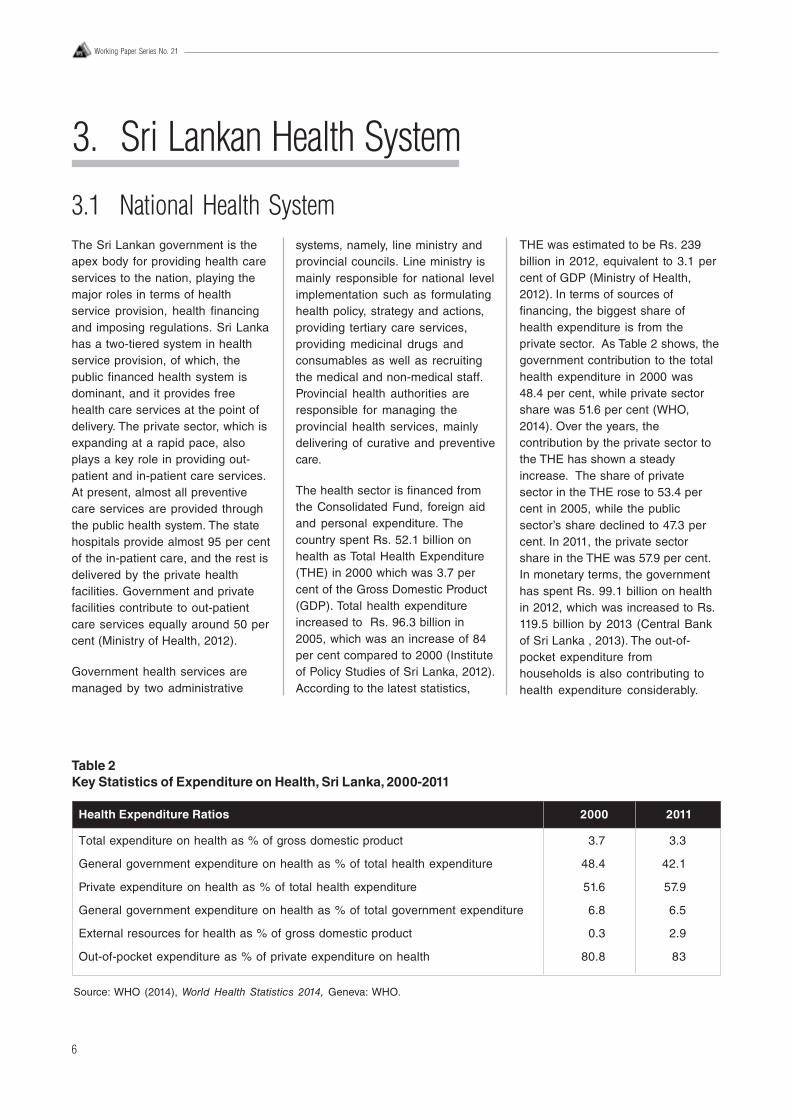
The health sector is financed fromthe Consolidated Fund, foreign aidand personal expenditure. Thecountry spent Rs. 52.1 billion onhealth as Total Health Expenditure(THE) in 2000 which was 3.7 percent of the Gross Domestic Product(GDP). Total health expenditureincreased to Rs. 96.3 billion in2005, which was an increase of 84per cent compared to 2000 (Instituteof Policy Studies of Sri Lanka, 2012).According to the latest statistics,
THE was estimated to be Rs. 239billion in 2012, equivalent to 3.1 percent of GDP (Ministry of Health,2012). In terms of sources offinancing, the biggest share ofhealth expenditure is from theprivate sector. As Table 2 shows, thegovernment contribution to the totalhealth expenditure in 2000 was48.4 per cent, while private sectorshare was 51.6 per cent (WHO,2014). Over the years, thecontribution by the private sector tothe THE has shown a steadyincrease. The share of privatesector in the THE rose to 53.4 percent in 2005, while the publicsector’s share declined to 47.3 percent. In 2011, the private sectorshare in the THE was 57.9 per cent.In monetary terms, the governmenthas spent Rs. 99.1 billion on healthin 2012, which was increased to Rs.119.5 billion by 2013 (Central Bankof Sri Lanka , 2013). The out-of-pocket expenditure fromhouseholds is also contributing tohealth expenditure considerably.
Table 2Key Statistics of Expenditure on Health, Sri Lanka, 2000-2011
Health Expenditure Ratios 2000 2011
Total expenditure on health as % of gross domestic product 3.7 3.3
General government expenditure on health as % of total health expenditure 48.4 42.1
Private expenditure on health as % of total health expenditure 51.6 57.9
General government expenditure on health as % of total government expenditure 6.8 6.5
External resources for health as % of gross domestic product 0.3 2.9
Out-of-pocket expenditure as % of private expenditure on health 80.8 83
Source: WHO (2014), World Health Statistics 2014, Geneva: WHO.
7
Health and Socio-economic Determinants of Malnutrition in the Plantation Sector of Sri Lanka
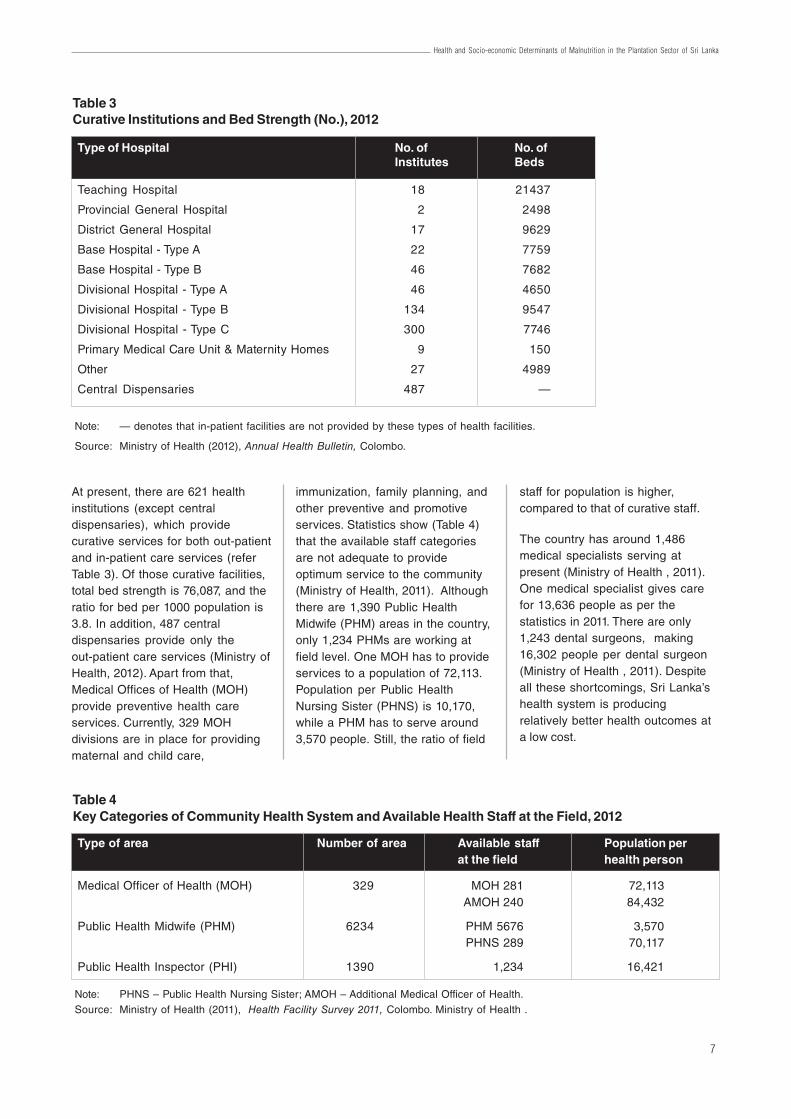
At present, there are 621 healthinstitutions (except centraldispensaries), which providecurative services for both out-patientand in-patient care services (referTable 3). Of those curative facilities,total bed strength is 76,087, and theratio for bed per 1000 population is3.8. In addition, 487 centraldispensaries provide only theout-patient care services (Ministry ofHealth, 2012). Apart from that,Medical Offices of Health (MOH)provide preventive health careservices. Currently, 329 MOHdivisions are in place for providingmaternal and child care,
immunization, family planning, andother preventive and promotiveservices. Statistics show (Table 4)that the available staff categoriesare not adequate to provideoptimum service to the community(Ministry of Health, 2011). Althoughthere are 1,390 Public HealthMidwife (PHM) areas in the country,only 1,234 PHMs are working atfield level. One MOH has to provideservices to a population of 72,113.Population per Public HealthNursing Sister (PHNS) is 10,170,while a PHM has to serve around3,570 people. Still, the ratio of field
staff for population is higher,compared to that of curative staff.
The country has around 1,486medical specialists serving atpresent (Ministry of Health , 2011).One medical specialist gives carefor 13,636 people as per thestatistics in 2011. There are only1,243 dental surgeons, making16,302 people per dental surgeon(Ministry of Health , 2011). Despiteall these shortcomings, Sri Lanka’shealth system is producingrelatively better health outcomes ata low cost.
Table 3Curative Institutions and Bed Strength (No.), 2012
Type of Hospital No. of No. ofInstitutes Beds
Teaching Hospital 18 21437
Provincial General Hospital 2 2498
District General Hospital 17 9629
Base Hospital - Type A 22 7759
Base Hospital - Type B 46 7682
Divisional Hospital - Type A 46 4650
Divisional Hospital - Type B 134 9547
Divisional Hospital - Type C 300 7746
Primary Medical Care Unit & Maternity Homes 9 150
Other 27 4989
Central Dispensaries 487 —
Note: — denotes that in-patient facilities are not provided by these types of health facilities.
Source: Ministry of Health (2012), Annual Health Bulletin, Colombo.
Table 4Key Categories of Community Health System and Available Health Staff at the Field, 2012
Type of area Number of area Available staff Population perat the field health person
Medical Officer of Health (MOH) 329 MOH 281 72,113 AMOH 240 84,432
Public Health Midwife (PHM) 6234 PHM 5676 3,570 PHNS 289 70,117
Public Health Inspector (PHI) 1390 1,234 16,421
Note: PHNS – Public Health Nursing Sister; AMOH – Additional Medical Officer of Health.Source: Ministry of Health (2011), Health Facility Survey 2011, Colombo. Ministry of Health .
8
Working Paper Series No. 21
3.2 Provincial Health SystemAs a consequence to the 13th
Amendment of the Constitution, adecentralization system wasintroduced with the launching of theProvincial Council System in 1987with a view to devolve power fromthe national level to the provinces(Act No. 42 of 1987). The provinceswere given the administrative poweron establishment, and managementof health institutions includingpreventive and promotive services.This however excludes theadministration of Teaching andSpecial Care Hospitals,procurement of medicines andhuman resource management ofcertain categories of staff.
With the supervision of theProvincial Ministry of Health, theProvincial Director of HealthServices (PDHS) implements thedesignated tasks. The provincialhealth services are financed bydifferent sources such as provincialcouncils, the line ministry,decentralized budget, statutory
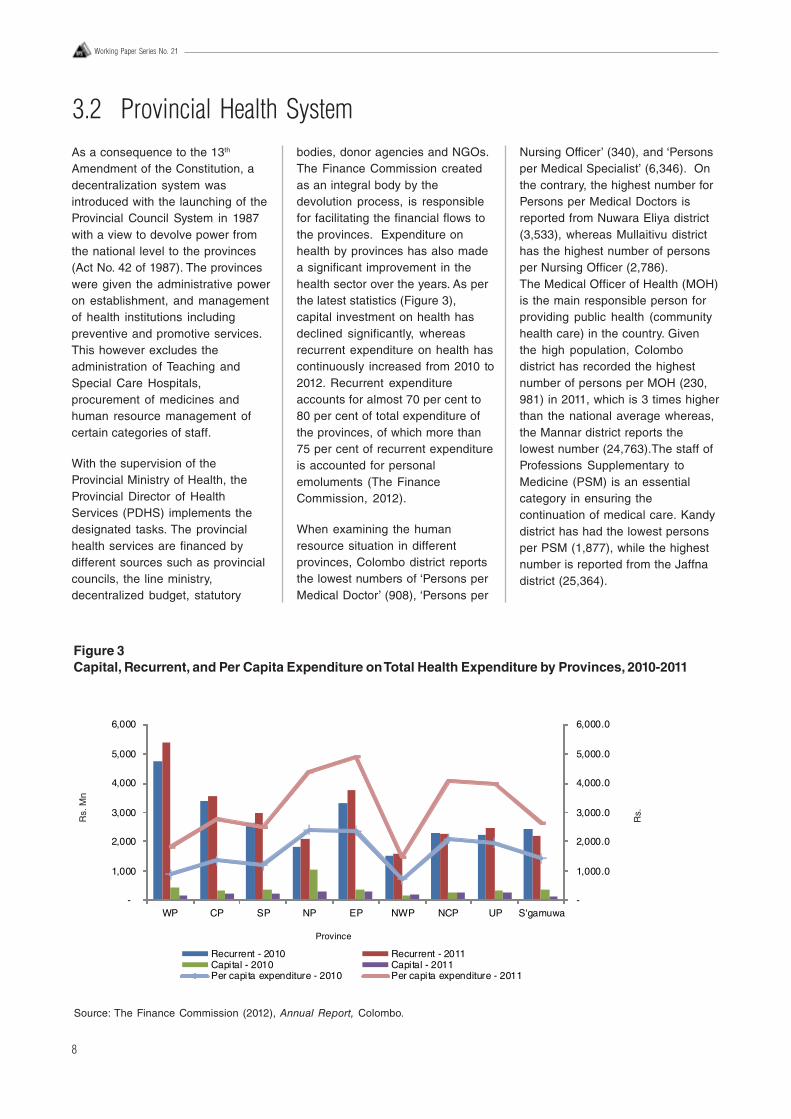
bodies, donor agencies and NGOs.The Finance Commission createdas an integral body by thedevolution process, is responsiblefor facilitating the financial flows tothe provinces. Expenditure onhealth by provinces has also madea significant improvement in thehealth sector over the years. As perthe latest statistics (Figure 3),capital investment on health hasdeclined significantly, whereasrecurrent expenditure on health hascontinuously increased from 2010 to2012. Recurrent expenditureaccounts for almost 70 per cent to80 per cent of total expenditure ofthe provinces, of which more than75 per cent of recurrent expenditureis accounted for personalemoluments (The FinanceCommission, 2012).
When examining the humanresource situation in differentprovinces, Colombo district reportsthe lowest numbers of ‘Persons perMedical Doctor’ (908), ‘Persons per
Nursing Officer’ (340), and ‘Personsper Medical Specialist’ (6,346). Onthe contrary, the highest number forPersons per Medical Doctors isreported from Nuwara Eliya district(3,533), whereas Mullaitivu districthas the highest number of personsper Nursing Officer (2,786).The Medical Officer of Health (MOH)is the main responsible person forproviding public health (communityhealth care) in the country. Giventhe high population, Colombodistrict has recorded the highestnumber of persons per MOH (230,981) in 2011, which is 3 times higherthan the national average whereas,the Mannar district reports thelowest number (24,763).The staff ofProfessions Supplementary toMedicine (PSM) is an essentialcategory in ensuring thecontinuation of medical care. Kandydistrict has had the lowest personsper PSM (1,877), while the highestnumber is reported from the Jaffnadistrict (25,364).
Figure 3Capital, Recurrent, and Per Capita Expenditure on Total Health Expenditure by Provinces, 2010-2011
Source: The Finance Commission (2012), Annual Report, Colombo.
R
s. M
n
R
s.
-
1,000.0
2,000.0
3,000.0
4,000.0
5,000.0
6,000.0
-
1,000
2,000
3,000
4,000
5,000
6,000
WP CP SP NP EP NWP NCP UP S'gamuwa
Province
Recurrent - 2010 Recurrent - 2011Capital - 2010 Capital - 2011Per capita expenditure - 2010 Per capita expenditure - 2011
9
Health and Socio-economic Determinants of Malnutrition in the Plantation Sector of Sri Lanka
3.3 Health System in the Estate SectorAlthough, the estate sector comesdirectly under the provincial systemsince the devolution of power in1987 and subsequentadministrative directives, it ishistorically considered as a specialcomponent of the Sri Lankan Healthcare system. This distinction ispartly due to the historicaldevelopment of the estate sectorhealthcare structure under thecolonial rulers as an incentive tosustain the export economy and itscontinued under-performancecompared to the rest of the country.Initially, total responsibility ofproviding services to the estatepopulation rested on the estatemanagement. The state intervenedin the late 19th century by institutingthe district hospitals system todeliver healthcare for designatedplantation districts. Still the estatemanagement was heavily involvedin the healthcare deliverythroughout the 20th centuryestablishing the estate hospital anddispensary system. Governmentcontrolled district hospital networkwas reasonably equipped with well
trained staff and material resources.Estate hospitals and dispensarieswere managed by para-medicalstaff with little training (Uragoda,1987). Many interventions weredone by the government in thehealthcare delivery structure in theestate sector during the last centuryto improve the health status of thepopulation (Vidyasagara, 2001). Inmid-1990s, a policy decision wastaken to acquire estate hospitalsunder government control, anddevelop as rural hospitals. TheMinistry of Health issued circularsto inform this takeover (HealthCircular, 02-27/99). The first set ofeleven hospitals in three provinceswas taken under the government inearly 1999.
At present, most of the estatehospitals function under the Ministryof Health. However, large estatesthat come under the regionalplantation companies still provideout-patient services to the residentsthrough a dispensary system. Largeestates owned by corporate playershave a separate department to
facilitate welfare and health caredelivery. Within the estate healthsystem, the healthcare teamconsists of the Estate MedicalAssistant (EMA), Welfare Officer,Public Health Midwives (PHM),Child Development Officers (CDO),Crèche Assistant, Dispenser andother minor staff helping to deliverthe services. EMA leads the teamunder the direction of the estatemanagement. First contact level forany illness is the estate dispensarymanned by the EMA, and theassistants. PHM is responsible formaternal and child health (MCH)provision at community level. Inaddition, an immunization clinic andantenatal clinic are held each monthby the Medical Officer of Health(MOH) and PHM. The population inthe smaller estates do not have aseparate health service dedicated tothem. They totally rely on thegovernment health facilities locatedclose to their residence. Hence,their health statistics cannot bedisaggregated for separate analysis.
4.1 Historical DevelopmentIn the early 19th century, thepredominant agrarian economy wastransformed into a commercial andcapitalist type, with the introductionof the plantation (estate) sector tothe country by the British ColonialRulers. Among the key cultivationcrops in Sri Lanka, tea became themajor export crop after thedestruction of coffee plantations dueto a fungal disease. Due to thefailure of recruiting sufficient labourfrom the indigenous Sinhala and
Tamil communities, thousands oflabourers were brought from SouthIndia for employment in the estates.These Indian labourers wererelocated in the estates, particularlyin the central hills. Nearly 500 teaestates owned by the privatecompanies were functioning inCentral, Uva, Sabaragamuwa,Western, and Southern provinces atthat time. The immigrant labourerswere settled in a peculiar type ofhousing scheme, which is called
“line rooms”. Those shelters were oflow standard with poor water supply,and lack of sanitary facilities.Illiteracy and their status as aminority group further pushed themto poor health conditions(Vidyasagara, 2001).
The contemporary history during thelast two centuries demonstrates howthe estate sector added value to theSri Lankan economy. Tea along withother crops (rubber, coconut)
4. Estate Sector Profile
10
Working Paper Series No. 21
contributed 37 per cent of the GDPto the national economy in 1950(The Planters’ Association of Ceylon,2013). In addition, it providedemployment to a significant portionof the labour force. Hence, itcontributed to the householdincome of estate residents as wellas others. It is important to note thataround half of the workforce in theplantation sector are females(Malwatte, 2000). The majority of theplantation workers are Tamils ofIndian origin. According to Malwatte(2000), this community was povertystricken due to two reasons; (1)exploitative production relationsinherent in a captive labour force,and (2) their position as an ethnicminority group. The primeresponsibility of uplifting thesocio-economic status of thiscommunity was in the hands of the‘plantation management’. This wasthe key challenge faced bygenerations of the plantationmanagers. Malwatte (2000), andVidyasagara (2001) identified threeperiods in the social development ofthe plantation community, which isclosely linked to historical andpolitical discourse. They are; (1) thecolonial period and up tomid-1970s; (2) the period of stateownership in mid -1970s; and(3) the period of restructuring andprivatization.
In the colonial period, theresponsibility of providing basichealth needs was with the individualestate management. Following theenactment of the Medical WantsOrdinance (MWO) in 1912, thecurative oriented health serviceswere initiated to serve the estatecommunity. Consequently, ‘amedical care system’ comprising ofhealth institutions, namely,hospitals, maternity homes anddispensaries, was set up in theestates to mainly provide curativecare services. Also, limitedpreventive care services, such ashookworm treatment, small poxvaccination, and treatment to control
infectious diseases was started dueto spread of different epidemics inthis community. However, disparitiesof health services among theindividual estates occurred due tothe availability of limited servicefacilities, and diverse of quality ofcare. Hence, the Health Departmentinterfered by appointing agovernment officer, named“Inspecting Medical Officer (IMO)”,with the responsibility of reportingall the health activities in theestates. However, providingadequate and quality housing andsanitary facilities was not given thesame priority compared to that ofproviding health services. Anotherinitiative was the establishment ofthe Planters’ Association EstatesHealth Scheme (PAEHS) in 1942.The key role of this scheme was tocoordinate health related workamong member estates, includingcollection of health data, andassisting matters related to health(Malwatte, 2000).
Following Independence, theGovernment of Sri Lanka introduceda wide range of health, and welfareinterventions throughout the country.Apart from developing curative careservices, provision of preventionand promotive health care servicesthrough ‘primary health careapproach’ was also strengthened. Inthis period, the following health andwelfare services were expanded inthe estate sector (Malwatte, 2000);
· Maternal and Child Health· Nutrition Programme· Expanded Programme of
Immunization· Control of Diarrhoeal Diseases· Family Planning· Introducing health management
information system (HMIS)· Improvement of safe water and
sanitary facilities· Developing the crèches
In 1974, the Family Health Bureau(FHB) initiated provision of MCHcare to estates through the
appointment of ten Medical Officers(MOs) to the estates using a networkof polyclinics. The FHB played acentral role of planning andimplementing MCH care and alliedservices. The MOs in thisprogramme worked under theMinistry of Health. Operationally,they worked at the Medical Officer ofHealth units (MOH), and under theimmediate supervision of RegionalHealth authorities. Apart from thegovernment allocation forstrengthening the MCH care, theFHB also received financialassistance from the UNFPA andUNICEF.
During the period of transferringownership of estates from colonialowners to the state, severallegislations were enacted tofacilitate the process. They are theLand Reform Commission Act No. 1of 1972 and the State AgriculturalCorporation Act No. 11 of 1975 (ThePlanters’ Association of Ceylon,2013). Accordingly, two governmentcorporations, the Sri Lanka StatePlantations Corporation (SLSPC),and the Janatha EstatesDevelopment Board (JEDB) wereestablished to manage the estates.These two corporations owned 502estates comprising of 272,902hectares. This included 51 per centof tea land, 35 per cent of rubberland, and 2 per cent of coconut land(The Planters’ Association of Ceylon,2013). During this period, aremarkable improvement of socialdevelopment of the estatesoccurred.
The two corporations – SLSPC andJEBD — were able to set up SocialDevelopment Centres at central andregional levels in order to supportand co-ordinate health and socialdevelopment activities in theestates. Consequently, directrelationships were built between thecorporations and the internationalorganizations such as, the WorldBank, Care International, and AsianDevelopment Bank etc. As a result,the corporations received direct
11
Health and Socio-economic Determinants of Malnutrition in the Plantation Sector of Sri Lanka
financial resources from the fundingagencies in order to improve healthand other basic needs such asimproving the housing, safe waterand sanitary facilities. In mid to late1980s, the majority of the immigrantTamil community working in theestate sector received Sri Lankancitizenship. This was an importantmilestone for social development.Early 1990s marked a range ofhealth and social outcomeimprovements in the estate sector,such as reduction of infant mortalityfrom 144 per hundred thousand livebirths in 1974, to 76.7 in 1980. Itfurther reduced to 53.7 in 1985 andto 44.6 in 1990 (Malwatte, 2000).Malwatte (2000) observed thathealth behaviours and attitudes ofthe estate community needed to beimproved through provision of bettereducation opportunities andimproved environmental conditionsalong with the improvement ofhealth and social services.However, in 1990s, the governmentowned corporations managing theestates experienced financialdifficulties due to a multitude ofcauses, which resulted in lessattention to health and socialdevelopment of the estatepopulation (Malwatte, 2000; ThePlanters’ Association of Ceylon,2013).
Owing to the financial difficultiesthat arose in the plantation sector,the Government decided torestructure the plantationmanagement system byestablishing ‘Regional PlantationCompanies’ (RPCs) under the Act ofNo. 17 of 1992 (Malwatte, 2000; ThePlanters’ Association of Ceylon,2013). As a result, 23 RPCs wereestablished in the regions with theintention of improving efficiency andproductivity to make profits. In thismodel, only the management ofestates was outsourced to theprivate entities with the governmentkeeping the absolute rights to theproperty. However, in 1995, themajority of the companies were sold
4.2 Current SituationFollowing the structural change inthe estate sector, the responsibilityof the social development of theestate community was alsotransferred to the new management.The functions of the SocialDevelopment Divisions of theSLSPC and JEDB were terminated.The Plantation Housing and SocialWelfare Trust (PHSWT) — (alsoreferred to as Trust) — wasestablished in September 1992under the Companies Act of No. 17of 1982 (Malwatte, 2000). ThePHSWT comprised of a head officeand 7 regional offices. Eachregional office had 70 estates undertheir responsibility (Malwatte, 2000).The PHSWT consisted of a tripartiteBoard of Management including 5directors representing managementcompanies, 4 governmentrepresentatives, and 2representatives from the TradeUnions in the estates. The PHSWT’smain responsibilities were tocoordinate and support the healthpromotion programmes in liaisingwith national (private andgovernment) and internationalagencies; planning and monitoringthe staff needs; monitoring theprovision of health services; andcollecting the vital health statisticsfor future policy and planning. ThePHSWT also facilitated other socialprogrammes in the estates, such ashousing and infrastructuredevelopment activities funded bythe donors.
The PHSWT was re-named as thePlantation Human DevelopmentTrust (PHDT) on October 2002
to the private sector by thegovernment; hence, the privatesector took the authority and controlof the entire estates. Still, the“Golden Share” of the estate lands iswith the Government while, theestates are operated in the basis oflong duration lease agreements.
(Plantation Human DevelopmentTrust, 2012/13).The aim of the PHDTis to deliver sustainabledevelopment programmes toimprove the quality of life in theplantation community. Compared tothe PHSWT, the scope of the PHDTwas broadened. It included a varietyof activities such as housing andinfrastructure, water and sanitation,health and nutrition, child care anddevelopment, establishing EstateWorker Housing CooperativeSocieties, training and humanresources development, sports andwelfare in collaboration with thenational and international agencies.
There are over 839,000 hectares ofplantations in the country. Tea,rubber and coconut are grown in222,000 hectares, 120,000 hectaresand 395,000 hectares, respectively(The Planters’ Association of Ceylon,2013). As per the data of PHDT, in2013 total population and families inthe 7 regions (excluding thepopulation in Chilaw, Kurunegala,Hopton, Hakgalla, and Kumarawattaplantation companies) were 977,781and 249,061 respectively. Proportionof population distribution among theregions is shown in Figure 4. Thelargest portion of population (23 percent) resides in Nuwara Eliyaregion, followed by Hatton (22 percent), Badulla (18 per cent), andKandy (13 per cent) regions. Thelowest proportion of population isreported from the Kegalle region,which is 6 per cent.
In 2013, of the total economicallyactive population, 4 per cent (or358,036 people) were from theestate sector, while 14 per cent (or1,245,036 people) and 82 per cent(or 7,067,915 people) were fromurban and rural sectors, respectively(Department of Census andStatistics, 2014). However, only249,000 were employed in the RPCestates in 2013 (The Planters’Association of Ceylon, 2013).Majority of the employed workers inthe estates are females. They are
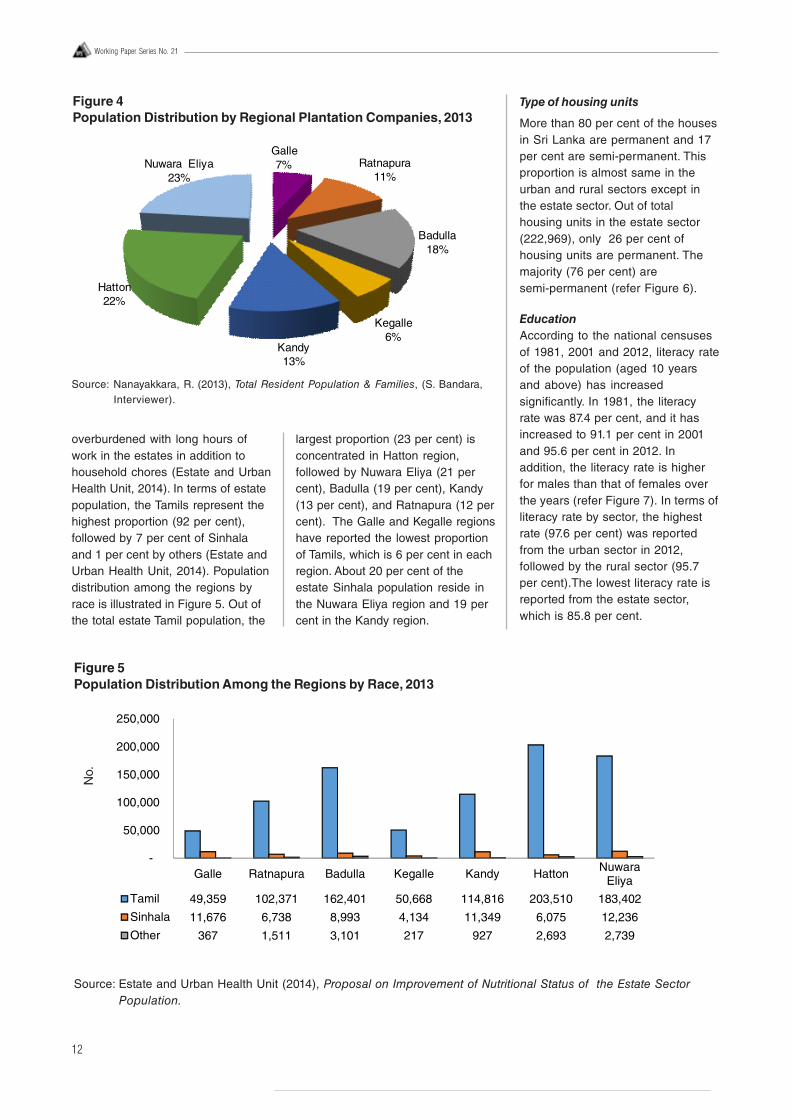
12
Working Paper Series No. 21
overburdened with long hours ofwork in the estates in addition tohousehold chores (Estate and UrbanHealth Unit, 2014). In terms of estatepopulation, the Tamils represent thehighest proportion (92 per cent),followed by 7 per cent of Sinhalaand 1 per cent by others (Estate andUrban Health Unit, 2014). Populationdistribution among the regions byrace is illustrated in Figure 5. Out ofthe total estate Tamil population, the
largest proportion (23 per cent) isconcentrated in Hatton region,followed by Nuwara Eliya (21 percent), Badulla (19 per cent), Kandy(13 per cent), and Ratnapura (12 percent). The Galle and Kegalle regionshave reported the lowest proportionof Tamils, which is 6 per cent in eachregion. About 20 per cent of theestate Sinhala population reside inthe Nuwara Eliya region and 19 percent in the Kandy region.
Type of housing units
More than 80 per cent of the housesin Sri Lanka are permanent and 17per cent are semi-permanent. Thisproportion is almost same in theurban and rural sectors except inthe estate sector. Out of totalhousing units in the estate sector(222,969), only 26 per cent ofhousing units are permanent. Themajority (76 per cent) aresemi-permanent (refer Figure 6).
EducationAccording to the national censusesof 1981, 2001 and 2012, literacy rateof the population (aged 10 yearsand above) has increasedsignificantly. In 1981, the literacyrate was 87.4 per cent, and it hasincreased to 91.1 per cent in 2001and 95.6 per cent in 2012. Inaddition, the literacy rate is higherfor males than that of females overthe years (refer Figure 7). In terms ofliteracy rate by sector, the highestrate (97.6 per cent) was reportedfrom the urban sector in 2012,followed by the rural sector (95.7per cent).The lowest literacy rate isreported from the estate sector,which is 85.8 per cent.
Source: Nanayakkara, R. (2013), Total Resident Population & Families, (S. Bandara,Interviewer).
Figure 4Population Distribution by Regional Plantation Companies, 2013
Galle7% Ratnapura
11%
Badulla18%
Kegalle6%
Kandy13%
Hatton22%
Nuwara Eliya23%
Figure 5Population Distribution Among the Regions by Race, 2013
Source: Estate and Urban Health Unit (2014), Proposal on Improvement of Nutritional Status of the Estate SectorPopulation.
No.
Galle Ratnapura Badulla Kegalle Kandy Hatton NuwaraEliya
Tamil 49,359 102,371 162,401 50,668 114,816 203,510 183,402
Sinhala 11,676 6,738 8,993 4,134 11,349 6,075 12,236
Other 367 1,511 3,101 217 927 2,693 2,739
-
50,000
100,000
150,000
200,000
250,000
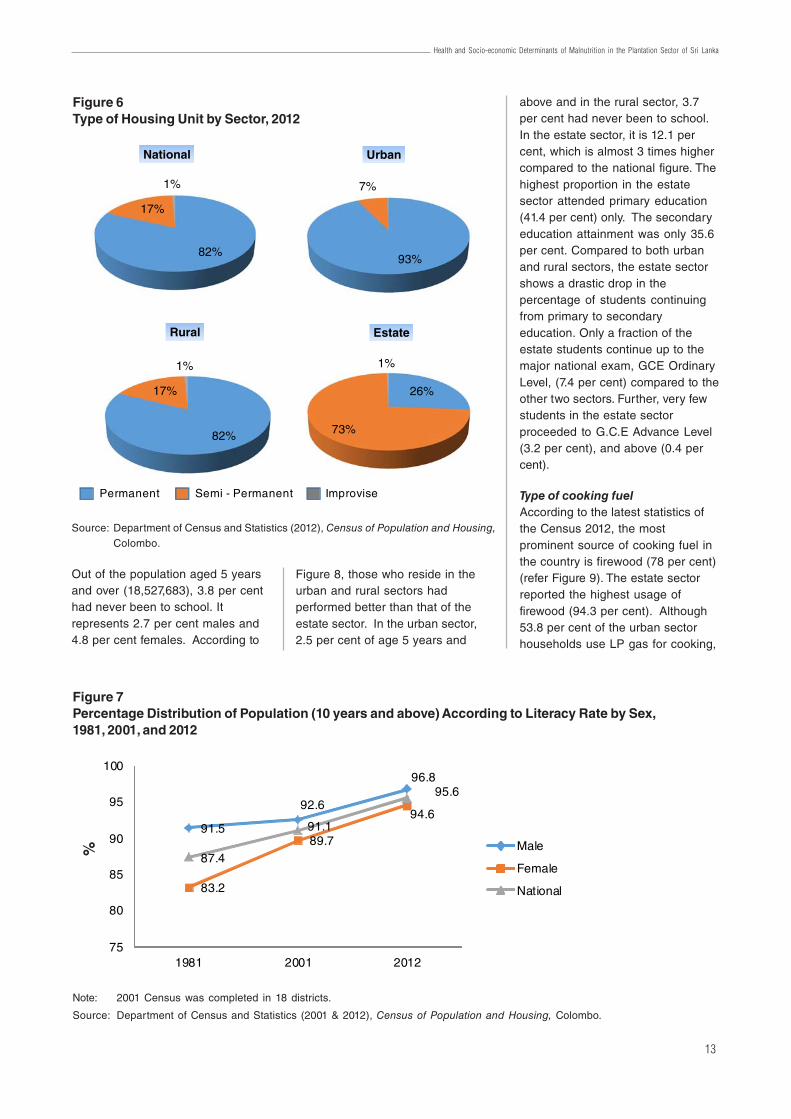
13
Health and Socio-economic Determinants of Malnutrition in the Plantation Sector of Sri Lanka
Out of the population aged 5 yearsand over (18,527,683), 3.8 per centhad never been to school. Itrepresents 2.7 per cent males and4.8 per cent females. According to
Figure 8, those who reside in theurban and rural sectors hadperformed better than that of theestate sector. In the urban sector,2.5 per cent of age 5 years and
above and in the rural sector, 3.7per cent had never been to school.In the estate sector, it is 12.1 percent, which is almost 3 times highercompared to the national figure. Thehighest proportion in the estatesector attended primary education(41.4 per cent) only. The secondaryeducation attainment was only 35.6per cent. Compared to both urbanand rural sectors, the estate sectorshows a drastic drop in thepercentage of students continuingfrom primary to secondaryeducation. Only a fraction of theestate students continue up to themajor national exam, GCE OrdinaryLevel, (7.4 per cent) compared to theother two sectors. Further, very fewstudents in the estate sectorproceeded to G.C.E Advance Level(3.2 per cent), and above (0.4 percent).
Type of cooking fuelAccording to the latest statistics ofthe Census 2012, the mostprominent source of cooking fuel inthe country is firewood (78 per cent)(refer Figure 9). The estate sectorreported the highest usage offirewood (94.3 per cent). Although53.8 per cent of the urban sectorhouseholds use LP gas for cooking,
Figure 6Type of Housing Unit by Sector, 2012
Source: Department of Census and Statistics (2012), Census of Population and Housing,Colombo.
Figure 7Percentage Distribution of Population (10 years and above) According to Literacy Rate by Sex,1981, 2001, and 2012
Note: 2001 Census was completed in 18 districts.
Source: Department of Census and Statistics (2001 & 2012), Census of Population and Housing, Colombo.
91.5
92.6
96.8
83.2
89.7
94.6
87.4
91.1
95.6
75
80
85
90
95
100
1981 2001 2012
Male
Female
National
%
82%
17%
1%
National
93%
7%
Urban
26%
73%
1%
Estate
82%
17%
1%
Rural
Permanent Semi - Permanent Improvise
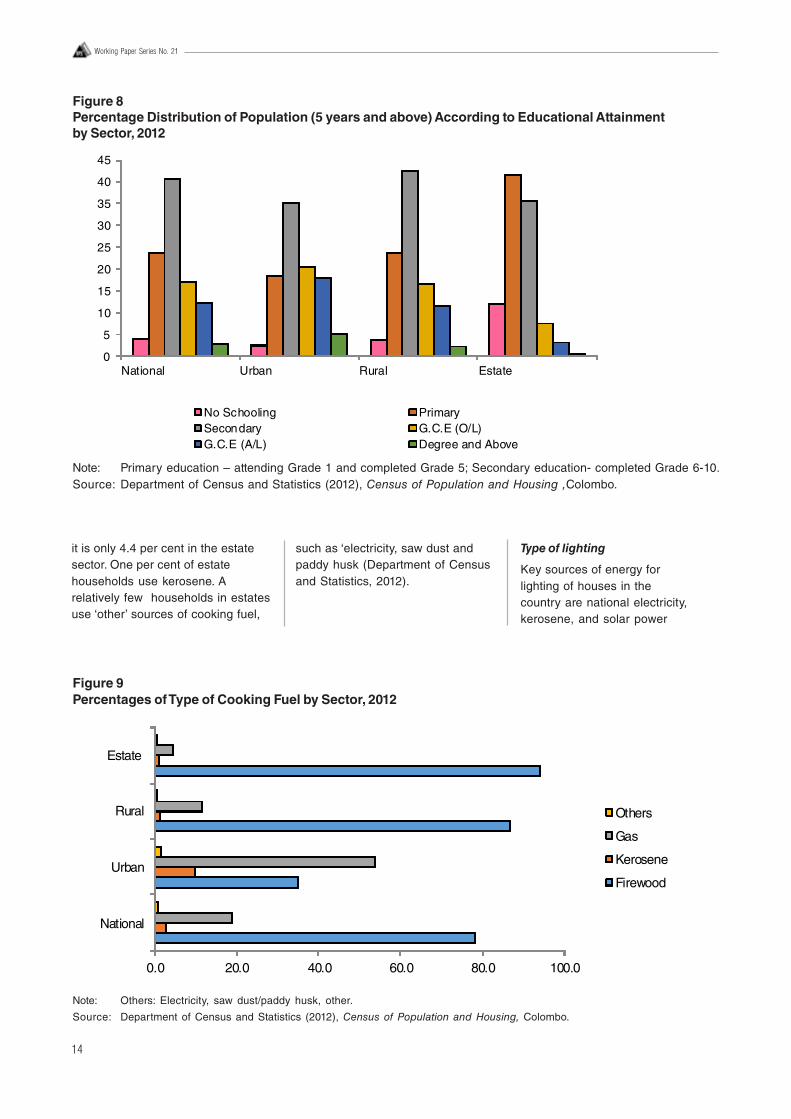
14
Working Paper Series No. 21
it is only 4.4 per cent in the estatesector. One per cent of estatehouseholds use kerosene. Arelatively few households in estatesuse ‘other’ sources of cooking fuel,
such as ‘electricity, saw dust andpaddy husk (Department of Censusand Statistics, 2012).
Type of lighting
Key sources of energy forlighting of houses in thecountry are national electricity,kerosene, and solar power
Figure 9Percentages of Type of Cooking Fuel by Sector, 2012
Note: Others: Electricity, saw dust/paddy husk, other.
Source: Department of Census and Statistics (2012), Census of Population and Housing, Colombo.
0.0 20.0 40.0 60.0 80.0 100.0
National
Urban
Rural
Estate
Others
Gas
Kerosene
Firewood
Figure 8Percentage Distribution of Population (5 years and above) According to Educational Attainmentby Sector, 2012
Note: Primary education – attending Grade 1 and completed Grade 5; Secondary education- completed Grade 6-10.Source: Department of Census and Statistics (2012), Census of Population and Housing ,Colombo.
0
5
10
15
20
25
30
35
40
45
National Urban Rural Estate
No Schooling PrimarySecondary G.C.E (O/L)G.C.E (A/L) Degree and Above
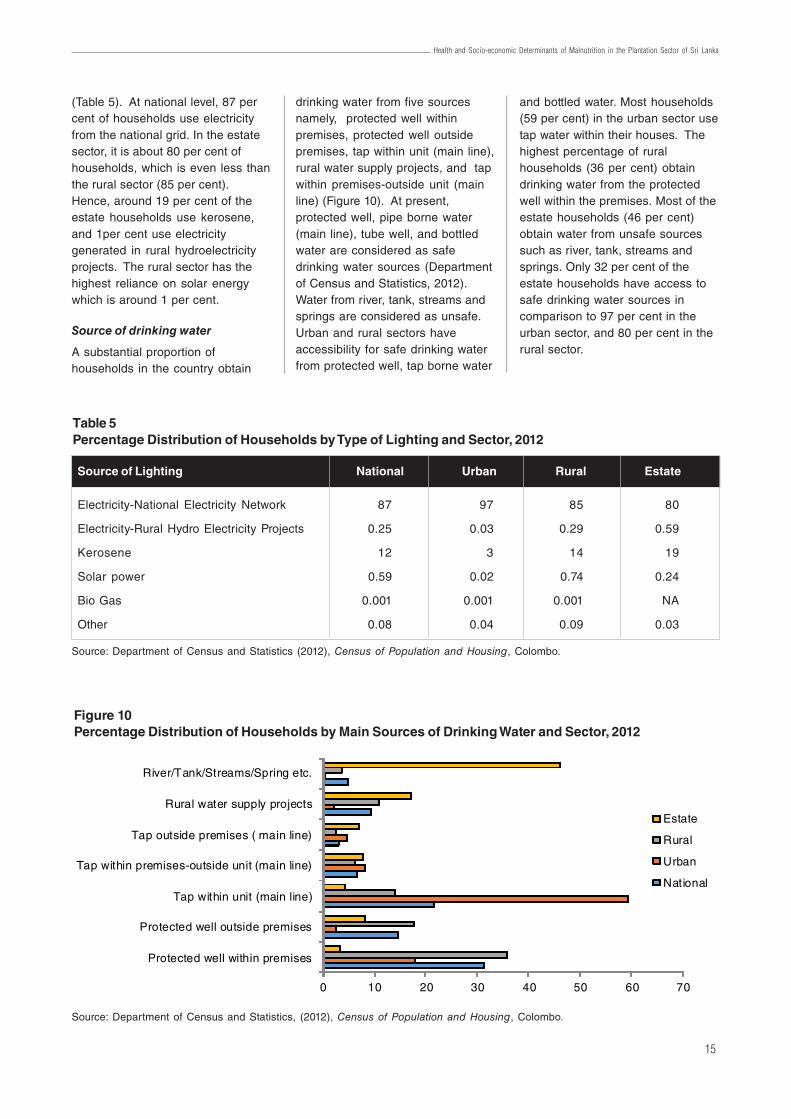
15
Health and Socio-economic Determinants of Malnutrition in the Plantation Sector of Sri Lanka
(Table 5). At national level, 87 percent of households use electricityfrom the national grid. In the estatesector, it is about 80 per cent ofhouseholds, which is even less thanthe rural sector (85 per cent).Hence, around 19 per cent of theestate households use kerosene,and 1per cent use electricitygenerated in rural hydroelectricityprojects. The rural sector has thehighest reliance on solar energywhich is around 1 per cent.
Source of drinking water
A substantial proportion ofhouseholds in the country obtain
drinking water from five sourcesnamely, protected well withinpremises, protected well outsidepremises, tap within unit (main line),rural water supply projects, and tapwithin premises-outside unit (mainline) (Figure 10). At present,protected well, pipe borne water(main line), tube well, and bottledwater are considered as safedrinking water sources (Departmentof Census and Statistics, 2012).Water from river, tank, streams andsprings are considered as unsafe.Urban and rural sectors haveaccessibility for safe drinking waterfrom protected well, tap borne water
and bottled water. Most households(59 per cent) in the urban sector usetap water within their houses. Thehighest percentage of ruralhouseholds (36 per cent) obtaindrinking water from the protectedwell within the premises. Most of theestate households (46 per cent)obtain water from unsafe sourcessuch as river, tank, streams andsprings. Only 32 per cent of theestate households have access tosafe drinking water sources incomparison to 97 per cent in theurban sector, and 80 per cent in therural sector.
Figure 10Percentage Distribution of Households by Main Sources of Drinking Water and Sector, 2012
Source: Department of Census and Statistics, (2012), Census of Population and Housing, Colombo.
0 10 20 30 40 50 60 70
Protected well within premises
Protected well outside premises
Tap within unit (main line)
Tap within premises-outside unit (main line)
Tap outside premises ( main line)
Rural water supply projects
River/Tank/Streams/Spring etc.
Estate
Rural
Urban
National
Table 5Percentage Distribution of Households by Type of Lighting and Sector, 2012
Source of Lighting National Urban Rural Estate
Electricity-National Electricity Network 87 97 85 80
Electricity-Rural Hydro Electricity Projects 0.25 0.03 0.29 0.59
Kerosene 12 3 14 19
Solar power 0.59 0.02 0.74 0.24
Bio Gas 0.001 0.001 0.001 NA
Other 0.08 0.04 0.09 0.03
Source: Department of Census and Statistics (2012), Census of Population and Housing, Colombo.
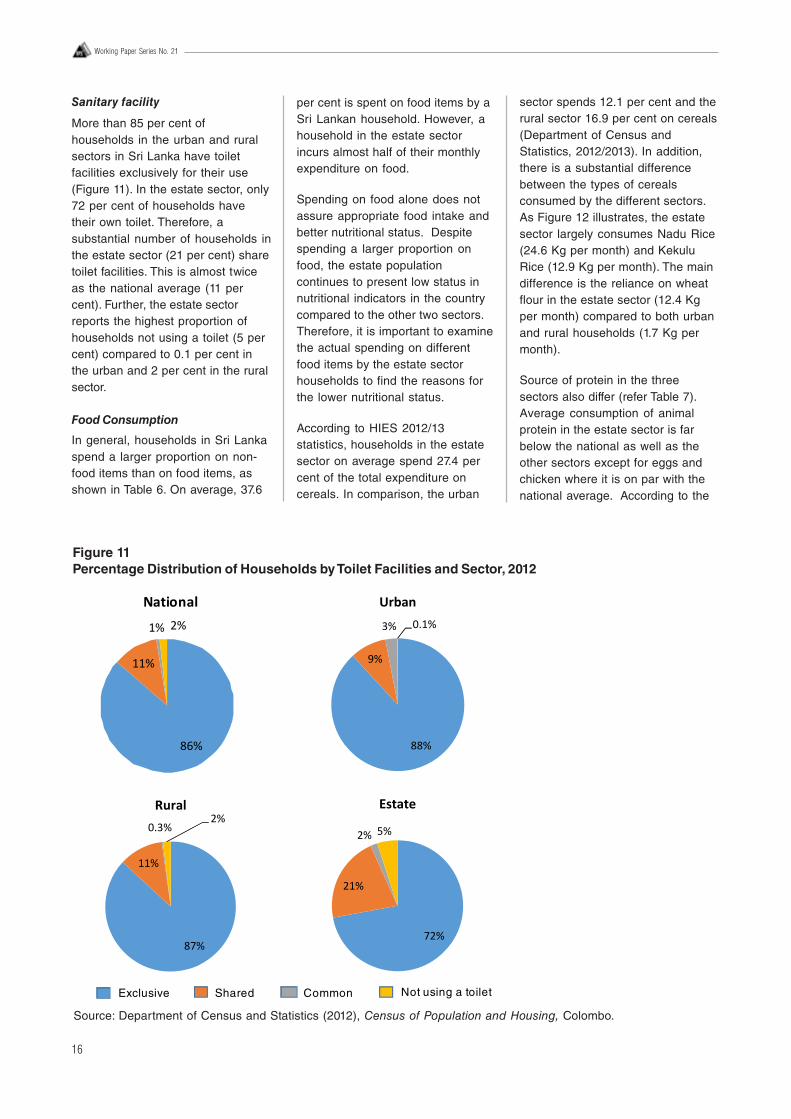
16
Working Paper Series No. 21
Sanitary facility
More than 85 per cent ofhouseholds in the urban and ruralsectors in Sri Lanka have toiletfacilities exclusively for their use(Figure 11). In the estate sector, only72 per cent of households havetheir own toilet. Therefore, asubstantial number of households inthe estate sector (21 per cent) sharetoilet facilities. This is almost twiceas the national average (11 percent). Further, the estate sectorreports the highest proportion ofhouseholds not using a toilet (5 percent) compared to 0.1 per cent inthe urban and 2 per cent in the ruralsector.
Food Consumption
In general, households in Sri Lankaspend a larger proportion on non-food items than on food items, asshown in Table 6. On average, 37.6
per cent is spent on food items by aSri Lankan household. However, ahousehold in the estate sectorincurs almost half of their monthlyexpenditure on food.
Spending on food alone does notassure appropriate food intake andbetter nutritional status. Despitespending a larger proportion onfood, the estate populationcontinues to present low status innutritional indicators in the countrycompared to the other two sectors.Therefore, it is important to examinethe actual spending on differentfood items by the estate sectorhouseholds to find the reasons forthe lower nutritional status.
According to HIES 2012/13statistics, households in the estatesector on average spend 27.4 percent of the total expenditure oncereals. In comparison, the urban
sector spends 12.1 per cent and therural sector 16.9 per cent on cereals(Department of Census andStatistics, 2012/2013). In addition,there is a substantial differencebetween the types of cerealsconsumed by the different sectors.As Figure 12 illustrates, the estatesector largely consumes Nadu Rice(24.6 Kg per month) and KekuluRice (12.9 Kg per month). The maindifference is the reliance on wheatflour in the estate sector (12.4 Kgper month) compared to both urbanand rural households (1.7 Kg permonth).
Source of protein in the threesectors also differ (refer Table 7).Average consumption of animalprotein in the estate sector is farbelow the national as well as theother sectors except for eggs andchicken where it is on par with thenational average. According to the
Figure 11Percentage Distribution of Households by Toilet Facilities and Sector, 2012
Source: Department of Census and Statistics (2012), Census of Population and Housing, Colombo.
72%
21%
2% 5%
Estate
87%
11%
0.3%2%
Rural
86%
11%
1% 2%
National
Exclusive Shared Common Not using a toilet
88%
9%
3% 0.1%
Urban
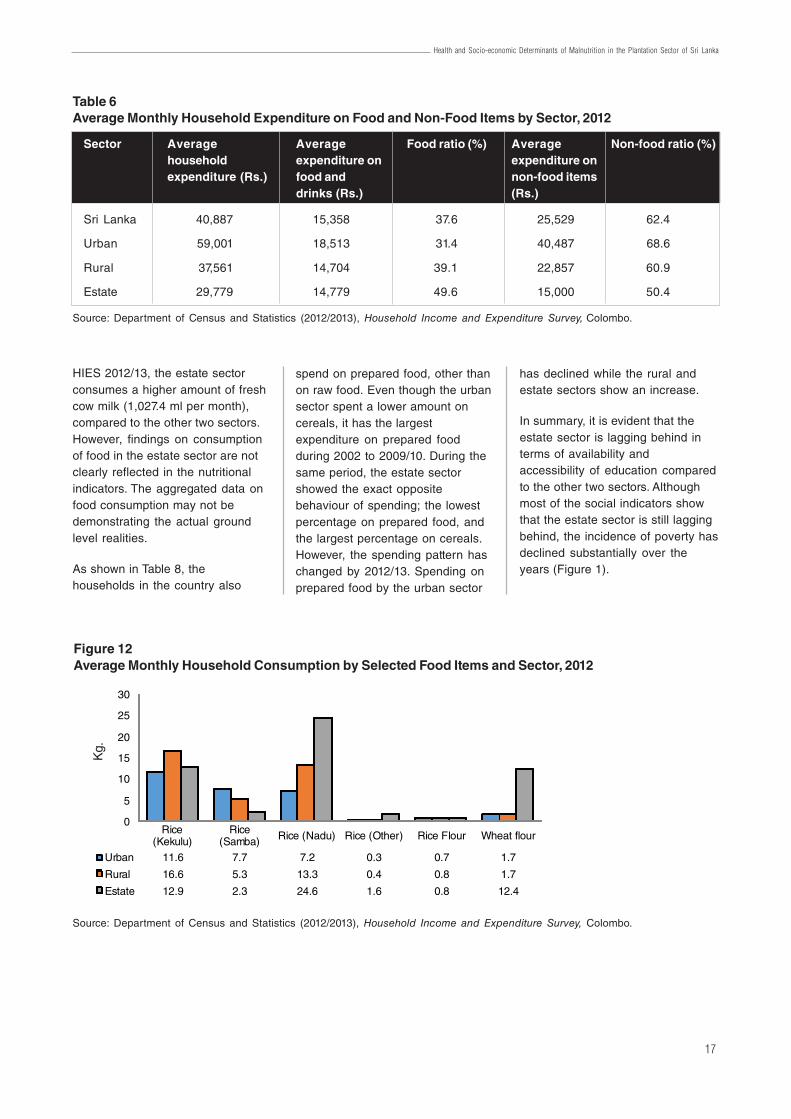
17
Health and Socio-economic Determinants of Malnutrition in the Plantation Sector of Sri Lanka
HIES 2012/13, the estate sectorconsumes a higher amount of freshcow milk (1,027.4 ml per month),compared to the other two sectors.However, findings on consumptionof food in the estate sector are notclearly reflected in the nutritionalindicators. The aggregated data onfood consumption may not bedemonstrating the actual groundlevel realities.
As shown in Table 8, thehouseholds in the country also
Figure 12Average Monthly Household Consumption by Selected Food Items and Sector, 2012
Source: Department of Census and Statistics (2012/2013), Household Income and Expenditure Survey, Colombo.
Rice(Kekulu)
Rice(Samba) Rice (Nadu) Rice (Other) Rice Flour Wheat flour
Urban 11.6 7.7 7.2 0.3 0.7 1.7
Rural 16.6 5.3 13.3 0.4 0.8 1.7
Estate 12.9 2.3 24.6 1.6 0.8 12.4
0
5
10
15
20
25
30
spend on prepared food, other thanon raw food. Even though the urbansector spent a lower amount oncereals, it has the largestexpenditure on prepared foodduring 2002 to 2009/10. During thesame period, the estate sectorshowed the exact oppositebehaviour of spending; the lowestpercentage on prepared food, andthe largest percentage on cereals.However, the spending pattern haschanged by 2012/13. Spending onprepared food by the urban sector
has declined while the rural andestate sectors show an increase.
In summary, it is evident that theestate sector is lagging behind interms of availability andaccessibility of education comparedto the other two sectors. Althoughmost of the social indicators showthat the estate sector is still laggingbehind, the incidence of poverty hasdeclined substantially over theyears (Figure 1).
Table 6Average Monthly Household Expenditure on Food and Non-Food Items by Sector, 2012
Source: Department of Census and Statistics (2012/2013), Household Income and Expenditure Survey, Colombo.
Sector Average Average Food ratio (%) Average Non-food ratio (%)household expenditure on expenditure onexpenditure (Rs.) food and non-food items
drinks (Rs.) (Rs.)
Sri Lanka 40,887 15,358 37.6 25,529 62.4
Urban 59,001 18,513 31.4 40,487 68.6
Rural 37,561 14,704 39.1 22,857 60.9
Estate 29,779 14,779 49.6 15,000 50.4
Kg.
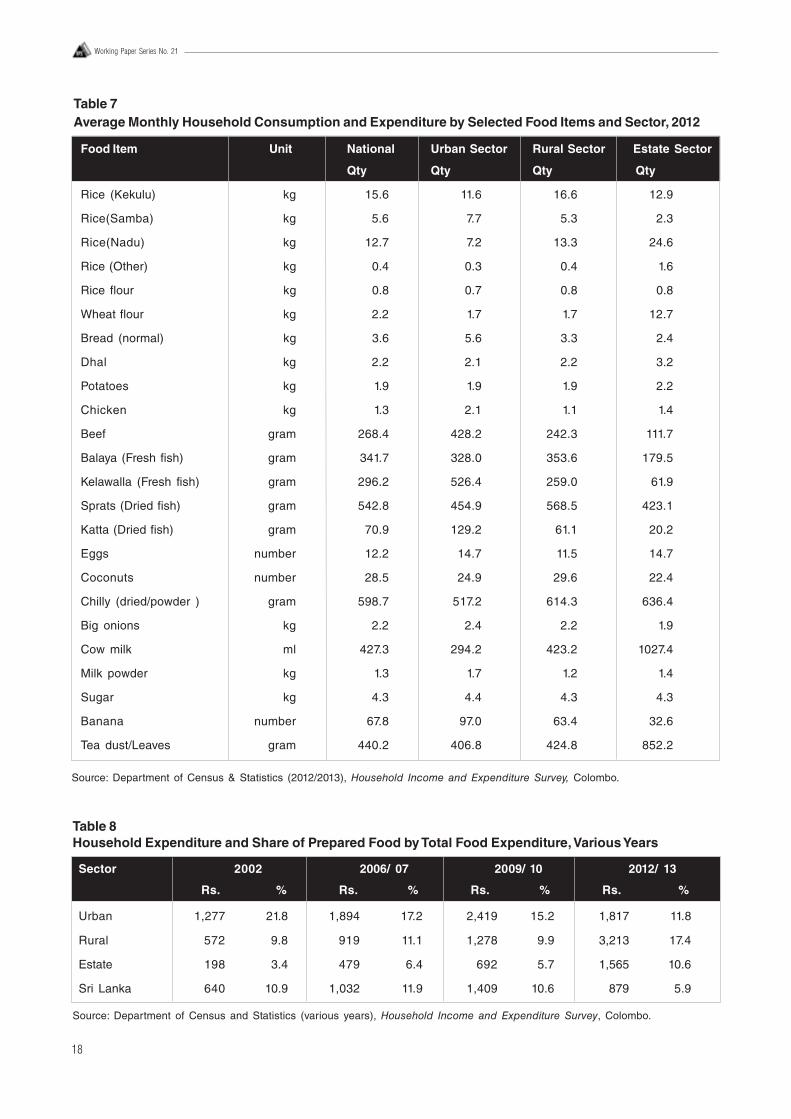
18
Working Paper Series No. 21
Table 7Average Monthly Household Consumption and Expenditure by Selected Food Items and Sector, 2012
Source: Department of Census & Statistics (2012/2013), Household Income and Expenditure Survey, Colombo.
Food Item Unit National Urban Sector Rural Sector Estate Sector
Qty Qty Qty Qty
Rice (Kekulu) kg 15.6 11.6 16.6 12.9
Rice(Samba) kg 5.6 7.7 5.3 2.3
Rice(Nadu) kg 12.7 7.2 13.3 24.6
Rice (Other) kg 0.4 0.3 0.4 1.6
Rice flour kg 0.8 0.7 0.8 0.8
Wheat flour kg 2.2 1.7 1.7 12.7
Bread (normal) kg 3.6 5.6 3.3 2.4
Dhal kg 2.2 2.1 2.2 3.2
Potatoes kg 1.9 1.9 1.9 2.2
Chicken kg 1.3 2.1 1.1 1.4
Beef gram 268.4 428.2 242.3 111.7
Balaya (Fresh fish) gram 341.7 328.0 353.6 179.5
Kelawalla (Fresh fish) gram 296.2 526.4 259.0 61.9
Sprats (Dried fish) gram 542.8 454.9 568.5 423.1
Katta (Dried fish) gram 70.9 129.2 61.1 20.2
Eggs number 12.2 14.7 11.5 14.7
Coconuts number 28.5 24.9 29.6 22.4
Chilly (dried/powder ) gram 598.7 517.2 614.3 636.4
Big onions kg 2.2 2.4 2.2 1.9
Cow milk ml 427.3 294.2 423.2 1027.4
Milk powder kg 1.3 1.7 1.2 1.4
Sugar kg 4.3 4.4 4.3 4.3
Banana number 67.8 97.0 63.4 32.6
Tea dust/Leaves gram 440.2 406.8 424.8 852.2
Table 8Household Expenditure and Share of Prepared Food by Total Food Expenditure, Various Years
Sector 2002 2006/ 07 2009/ 10 2012/ 13
Rs. % Rs. % Rs. % Rs. %
Urban 1,277 21.8 1,894 17.2 2,419 15.2 1,817 11.8
Rural 572 9.8 919 11.1 1,278 9.9 3,213 17.4
Estate 198 3.4 479 6.4 692 5.7 1,565 10.6
Sri Lanka 640 10.9 1,032 11.9 1,409 10.6 879 5.9
Source: Department of Census and Statistics (various years), Household Income and Expenditure Survey, Colombo.
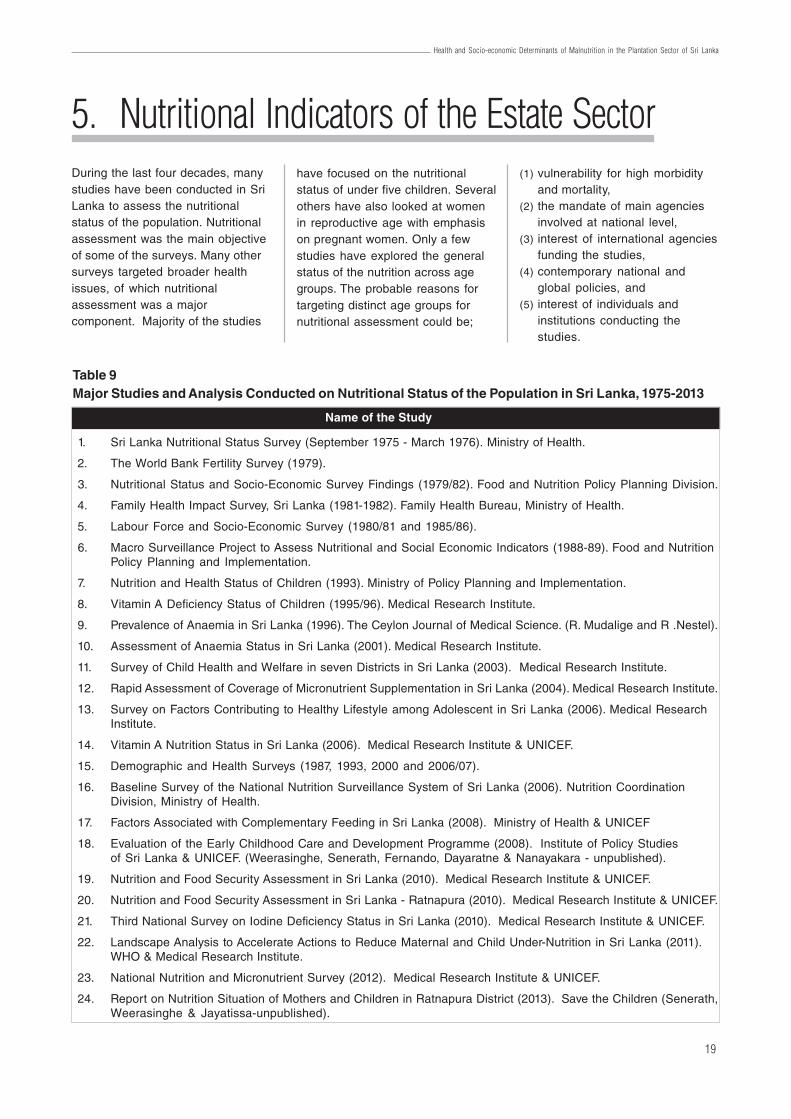
19
Health and Socio-economic Determinants of Malnutrition in the Plantation Sector of Sri Lanka
5. Nutritional Indicators of the Estate SectorDuring the last four decades, manystudies have been conducted in SriLanka to assess the nutritionalstatus of the population. Nutritionalassessment was the main objectiveof some of the surveys. Many othersurveys targeted broader healthissues, of which nutritionalassessment was a majorcomponent. Majority of the studies
have focused on the nutritionalstatus of under five children. Severalothers have also looked at womenin reproductive age with emphasison pregnant women. Only a fewstudies have explored the generalstatus of the nutrition across agegroups. The probable reasons fortargeting distinct age groups fornutritional assessment could be;
(1) vulnerability for high morbidityand mortality,
(2) the mandate of main agenciesinvolved at national level,
(3) interest of international agenciesfunding the studies,
(4) contemporary national andglobal policies, and
(5) interest of individuals andinstitutions conducting thestudies.
Table 9Major Studies and Analysis Conducted on Nutritional Status of the Population in Sri Lanka, 1975-2013
Name of the Study
1. Sri Lanka Nutritional Status Survey (September 1975 - March 1976). Ministry of Health.
2. The World Bank Fertility Survey (1979).
3. Nutritional Status and Socio-Economic Survey Findings (1979/82). Food and Nutrition Policy Planning Division.
4. Family Health Impact Survey, Sri Lanka (1981-1982). Family Health Bureau, Ministry of Health.
5. Labour Force and Socio-Economic Survey (1980/81 and 1985/86).
6. Macro Surveillance Project to Assess Nutritional and Social Economic Indicators (1988-89). Food and NutritionPolicy Planning and Implementation.
7. Nutrition and Health Status of Children (1993). Ministry of Policy Planning and Implementation.
8. Vitamin A Deficiency Status of Children (1995/96). Medical Research Institute.
9. Prevalence of Anaemia in Sri Lanka (1996). The Ceylon Journal of Medical Science. (R. Mudalige and R .Nestel).
10. Assessment of Anaemia Status in Sri Lanka (2001). Medical Research Institute.
11. Survey of Child Health and Welfare in seven Districts in Sri Lanka (2003). Medical Research Institute.
12. Rapid Assessment of Coverage of Micronutrient Supplementation in Sri Lanka (2004). Medical Research Institute.
13. Survey on Factors Contributing to Healthy Lifestyle among Adolescent in Sri Lanka (2006). Medical ResearchInstitute.
14. Vitamin A Nutrition Status in Sri Lanka (2006). Medical Research Institute & UNICEF.
15. Demographic and Health Surveys (1987, 1993, 2000 and 2006/07).
16. Baseline Survey of the National Nutrition Surveillance System of Sri Lanka (2006). Nutrition CoordinationDivision, Ministry of Health.
17. Factors Associated with Complementary Feeding in Sri Lanka (2008). Ministry of Health & UNICEF
18. Evaluation of the Early Childhood Care and Development Programme (2008). Institute of Policy Studiesof Sri Lanka & UNICEF. (Weerasinghe, Senerath, Fernando, Dayaratne & Nanayakara - unpublished).
19. Nutrition and Food Security Assessment in Sri Lanka (2010). Medical Research Institute & UNICEF.
20. Nutrition and Food Security Assessment in Sri Lanka - Ratnapura (2010). Medical Research Institute & UNICEF.
21. Third National Survey on Iodine Deficiency Status in Sri Lanka (2010). Medical Research Institute & UNICEF.
22. Landscape Analysis to Accelerate Actions to Reduce Maternal and Child Under-Nutrition in Sri Lanka (2011).WHO & Medical Research Institute.
23. National Nutrition and Micronutrient Survey (2012). Medical Research Institute & UNICEF.
24. Report on Nutrition Situation of Mothers and Children in Ratnapura District (2013). Save the Children (Senerath,Weerasinghe & Jayatissa-unpublished).
20
Working Paper Series No. 21
The differences in the nutritionalindicators, definitions used fornutritional indicators, cut off valuesused for indicators, sampling framesand sampling methods, samplesizes, changes in administrativeboundaries with time, datacollection techniques and analysismethod impose limitations incomparison and interpretation ofresults across studies and along thetime line. Hence, interpretation ofresults needs extra caution. Due toconceptual and methodologicaldifferences, several studies havenot focused the estate sector as aseparate entity. Hence, estate sectorspecific data is not available for allthe studies. In a few studies, theestimation for the estate sector isquestionable due to the low samplesize.
Indicators used for nutritional statusof under 5 population includeHeight for Age, Weight for Age,Weight for Height, anaemia, vitaminA status and exclusive breastfeeding rates. Anaemia inpregnancy and mid-armcircumference has been used toassess the nutrition status ofpregnant women. Non-pregnantwomen in reproductive age groupswere assessed for status ofanaemia and Body Mass index.Anaemia status of adolescents wasalso reported in one study. Low birthweight has also been used as aproxy indicator for nutritional statusof pregnant mothers (see Glossaryfor definitions).
In this review, data available fromdifferent studies for a given
5.1 Nutritional Indicators of Children Under 5 Years, 1993 - 2012Health and nutritional status ofunder five children is presentedaccording to 6 indictors. Those areHeight for Age, Weight for Age,Weight for Height, anaemia, vitaminA status and exclusivebreastfeeding.
There has been a reduction instunting during the last two decadesin the national level and in allsectors. However, data shows overtwice the prevalence of stunting inthe estate sector compared to thenational figure (refer Table 10).
There has been a reduction inunderweight during the last twodecades in the national level and inall sectors. However, data shows thatthe prevalence of underweight in theestate sector continued to be highercompared to the national figure andthe other sectors (refer Table 11).
nutritional indicator was pooled topresent the comparison ofnutritional status of the estate sectorwith the national figure and theother two sectors, urban and rural.When separate data was notavailable for the estate sector,analysis is presented to show theoverall country status on thatindicator. Table 9 presents the list ofimportant studies done on nutritionin Sri Lanka since 1975. Authorsreconstructed tables to present datathat was available from thosestudies. Data is presented accordingto both WHO standards (2006) andNCHS for studies when available.Comparison across studies isimpossible when indicatordefinitions are not similar.
According to the Table 12, Weightfor Height (wasting) at national levelhas been stagnating at around 15per cent throughout. Wasting inchildren under 5 years has shown aslow reduction in both rural andurban sectors. As Weight for Heightshould be interpreted in conjunctionwith the other two indicators,fluctuations seen in the estatesector in wasting of children under 5could be expected due to changesin the Weight for Age and Height forAge. However the National Nutritionand Micronutrient Survey (NNMS) in2012 has estimated a higherwasting percentage at nationallevel. It did not provide asector-wise breakdown.
As shown in Table 13, Anaemia inchildren under 5 years has shown adecline during the last two decades.The highest rates throughout was
observed in the urban sector. Theestate sector reported anaemiarates lower than the national rates.However, the anaemia status ofchildren under 5 throughout theperiod has fluctuated around 25 percent.
The two national studies conductedon Vitamin A status does not providedisaggregated data on the estatesector separately. Although, severeVitamin A deficiency had declined,moderate levels of deficiency haspersisted throughout the periodaccording to Table 14.
DHS used mean duration ofexclusive breastfeeding (EBF) asthe parameter in 1993 and 2000,and median duration in 2006/7(refer Table 15). EBF duration hasincreased during the two decades atnational level and in a comparable
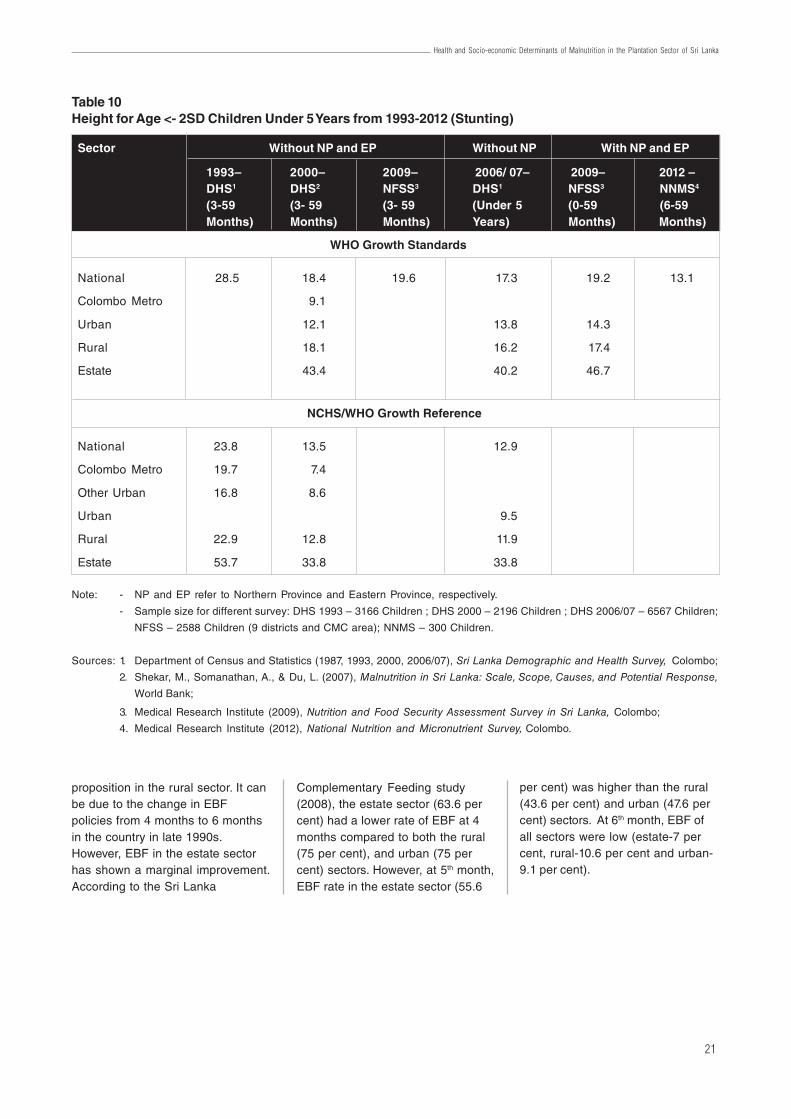
21
Health and Socio-economic Determinants of Malnutrition in the Plantation Sector of Sri Lanka
proposition in the rural sector. It canbe due to the change in EBFpolicies from 4 months to 6 monthsin the country in late 1990s.However, EBF in the estate sectorhas shown a marginal improvement.According to the Sri Lanka
Complementary Feeding study(2008), the estate sector (63.6 percent) had a lower rate of EBF at 4months compared to both the rural(75 per cent), and urban (75 percent) sectors. However, at 5th month,EBF rate in the estate sector (55.6
Table 10Height for Age <- 2SD Children Under 5 Years from 1993-2012 (Stunting)
Note: - NP and EP refer to Northern Province and Eastern Province, respectively.
- Sample size for different survey: DHS 1993 – 3166 Children ; DHS 2000 – 2196 Children ; DHS 2006/07 – 6567 Children;
NFSS – 2588 Children (9 districts and CMC area); NNMS – 300 Children.
Sources: 1. Department of Census and Statistics (1987, 1993, 2000, 2006/07), Sri Lanka Demographic and Health Survey, Colombo;
2. Shekar, M., Somanathan, A., & Du, L. (2007), Malnutrition in Sri Lanka: Scale, Scope, Causes, and Potential Response,
World Bank;
3. Medical Research Institute (2009), Nutrition and Food Security Assessment Survey in Sri Lanka, Colombo;
4. Medical Research Institute (2012), National Nutrition and Micronutrient Survey, Colombo.
Sector Without NP and EP Without NP With NP and EP
1993– 2000– 2009– 2006/ 07– 2009– 2012 –DHS1 DHS2 NFSS3 DHS1 NFSS3 NNMS4
(3-59 (3- 59 (3- 59 (Under 5 (0-59 (6-59Months) Months) Months) Years) Months) Months)
WHO Growth Standards
National 28.5 18.4 19.6 17.3 19.2 13.1
Colombo Metro 9.1
Urban 12.1 13.8 14.3
Rural 18.1 16.2 17.4
Estate 43.4 40.2 46.7
NCHS/WHO Growth Reference
National 23.8 13.5 12.9
Colombo Metro 19.7 7.4
Other Urban 16.8 8.6
Urban 9.5
Rural 22.9 12.8 11.9
Estate 53.7 33.8 33.8
per cent) was higher than the rural(43.6 per cent) and urban (47.6 percent) sectors. At 6th month, EBF ofall sectors were low (estate-7 percent, rural-10.6 per cent and urban-9.1 per cent).
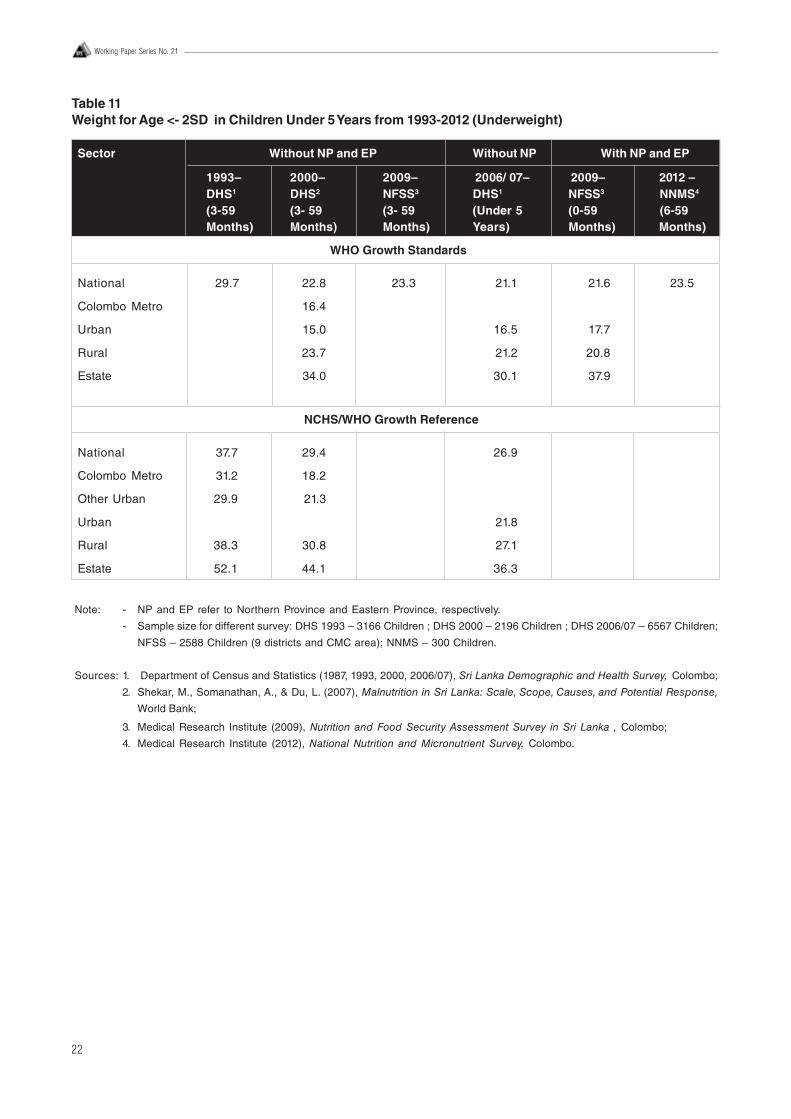
22
Working Paper Series No. 21
Table 11Weight for Age <- 2SD in Children Under 5 Years from 1993-2012 (Underweight)
Note: - NP and EP refer to Northern Province and Eastern Province, respectively.
- Sample size for different survey: DHS 1993 – 3166 Children ; DHS 2000 – 2196 Children ; DHS 2006/07 – 6567 Children;
NFSS – 2588 Children (9 districts and CMC area); NNMS – 300 Children.
Sources: 1. Department of Census and Statistics (1987, 1993, 2000, 2006/07), Sri Lanka Demographic and Health Survey, Colombo;
2. Shekar, M., Somanathan, A., & Du, L. (2007), Malnutrition in Sri Lanka: Scale, Scope, Causes, and Potential Response,
World Bank;
3. Medical Research Institute (2009), Nutrition and Food Security Assessment Survey in Sri Lanka , Colombo;
4. Medical Research Institute (2012), National Nutrition and Micronutrient Survey, Colombo.
Sector Without NP and EP Without NP With NP and EP
1993– 2000– 2009– 2006/ 07– 2009– 2012 –DHS1 DHS2 NFSS3 DHS1 NFSS3 NNMS4
(3-59 (3- 59 (3- 59 (Under 5 (0-59 (6-59Months) Months) Months) Years) Months) Months)
WHO Growth Standards
National 29.7 22.8 23.3 21.1 21.6 23.5
Colombo Metro 16.4
Urban 15.0 16.5 17.7
Rural 23.7 21.2 20.8
Estate 34.0 30.1 37.9
NCHS/WHO Growth Reference
National 37.7 29.4 26.9
Colombo Metro 31.2 18.2
Other Urban 29.9 21.3
Urban 21.8
Rural 38.3 30.8 27.1
Estate 52.1 44.1 36.3
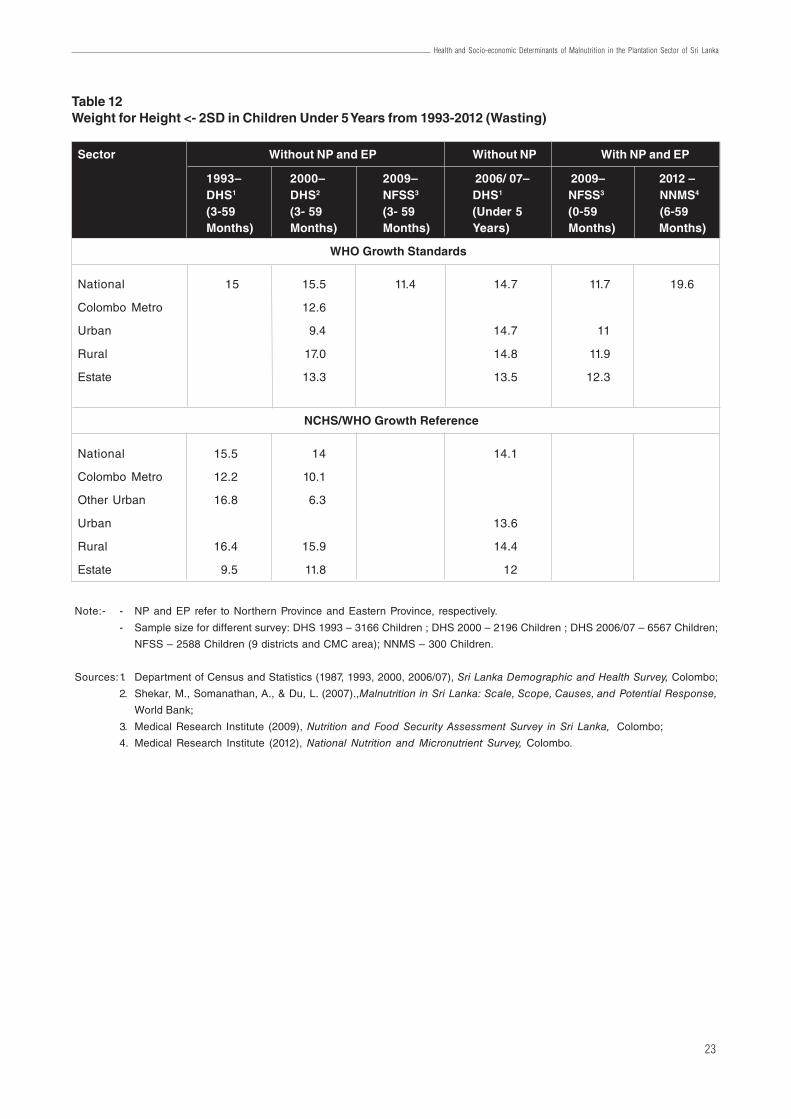
23
Health and Socio-economic Determinants of Malnutrition in the Plantation Sector of Sri Lanka
Table 12Weight for Height <- 2SD in Children Under 5 Years from 1993-2012 (Wasting)
Note:- - NP and EP refer to Northern Province and Eastern Province, respectively.
- Sample size for different survey: DHS 1993 – 3166 Children ; DHS 2000 – 2196 Children ; DHS 2006/07 – 6567 Children;
NFSS – 2588 Children (9 districts and CMC area); NNMS – 300 Children.
Sources:1. Department of Census and Statistics (1987, 1993, 2000, 2006/07), Sri Lanka Demographic and Health Survey, Colombo;
2. Shekar, M., Somanathan, A., & Du, L. (2007).,Malnutrition in Sri Lanka: Scale, Scope, Causes, and Potential Response,
World Bank;
3. Medical Research Institute (2009), Nutrition and Food Security Assessment Survey in Sri Lanka, Colombo;
4. Medical Research Institute (2012), National Nutrition and Micronutrient Survey, Colombo.
Sector Without NP and EP Without NP With NP and EP
1993– 2000– 2009– 2006/ 07– 2009– 2012 –DHS1 DHS2 NFSS3 DHS1 NFSS3 NNMS4
(3-59 (3- 59 (3- 59 (Under 5 (0-59 (6-59Months) Months) Months) Years) Months) Months)
WHO Growth Standards
National 15 15.5 11.4 14.7 11.7 19.6
Colombo Metro 12.6
Urban 9.4 14.7 11
Rural 17.0 14.8 11.9
Estate 13.3 13.5 12.3
NCHS/WHO Growth Reference
National 15.5 14 14.1
Colombo Metro 12.2 10.1
Other Urban 16.8 6.3
Urban 13.6
Rural 16.4 15.9 14.4
Estate 9.5 11.8 12
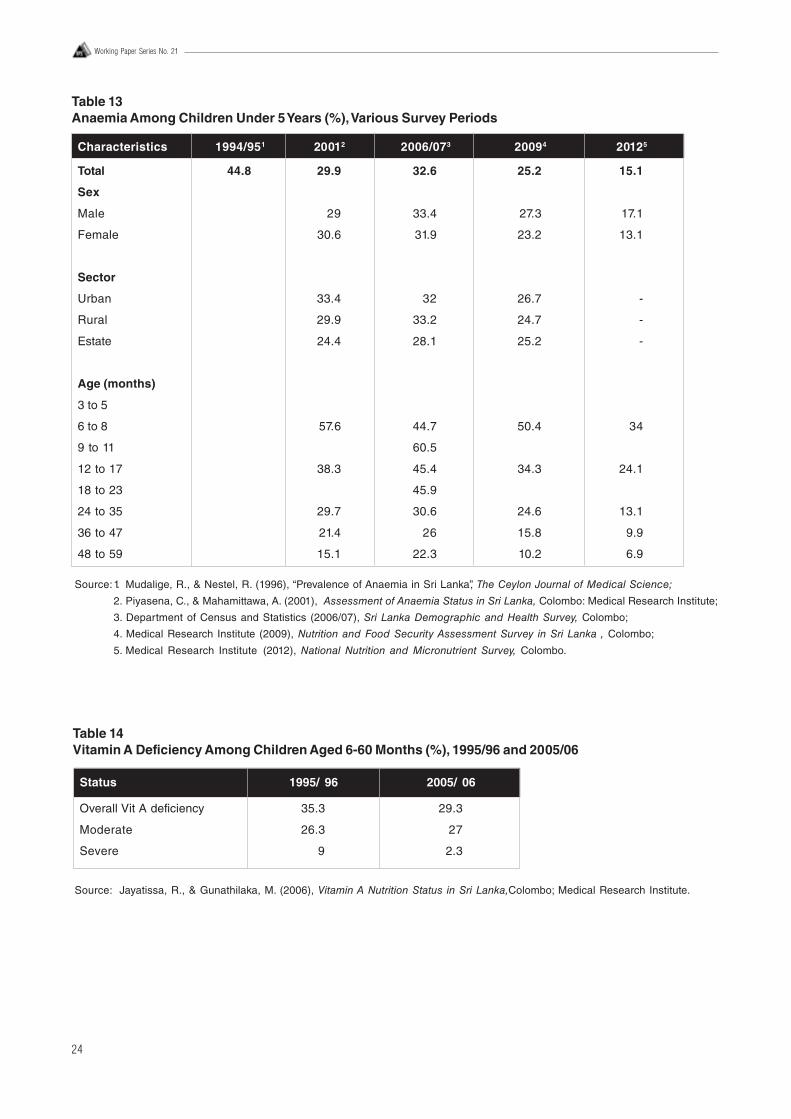
24
Working Paper Series No. 21
Table 13Anaemia Among Children Under 5 Years (%), Various Survey Periods
Characteristics 1994/951 20012 2006/073 20094 20125
Total 44.8 29.9 32.6 25.2 15.1
Sex
Male 29 33.4 27.3 17.1
Female 30.6 31.9 23.2 13.1
Sector
Urban 33.4 32 26.7 -
Rural 29.9 33.2 24.7 -
Estate 24.4 28.1 25.2 -
Age (months)
3 to 5
6 to 8 57.6 44.7 50.4 34
9 to 11 60.5
12 to 17 38.3 45.4 34.3 24.1
18 to 23 45.9
24 to 35 29.7 30.6 24.6 13.1
36 to 47 21.4 26 15.8 9.9
48 to 59 15.1 22.3 10.2 6.9
Source:1. Mudalige, R., & Nestel, R. (1996), “Prevalence of Anaemia in Sri Lanka”, The Ceylon Journal of Medical Science;
2. Piyasena, C., & Mahamittawa, A. (2001), Assessment of Anaemia Status in Sri Lanka, Colombo: Medical Research Institute;
3. Department of Census and Statistics (2006/07), Sri Lanka Demographic and Health Survey, Colombo;
4. Medical Research Institute (2009), Nutrition and Food Security Assessment Survey in Sri Lanka , Colombo;
5. Medical Research Institute (2012), National Nutrition and Micronutrient Survey, Colombo.
Table 14Vitamin A Deficiency Among Children Aged 6-60 Months (%), 1995/96 and 2005/06
Source: Jayatissa, R., & Gunathilaka, M. (2006), Vitamin A Nutrition Status in Sri Lanka,Colombo; Medical Research Institute.
Status 1995/ 96 2005/ 06
Overall Vit A deficiency 35.3 29.3
Moderate 26.3 27
Severe 9 2.3
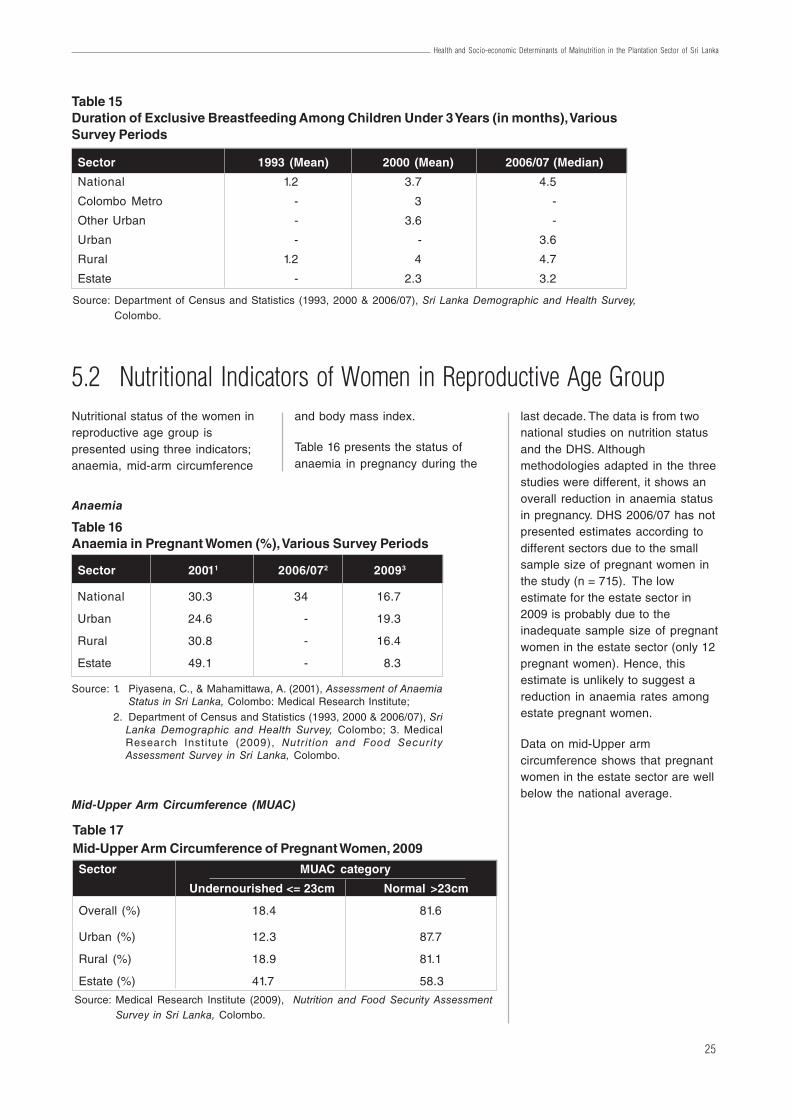
25
Health and Socio-economic Determinants of Malnutrition in the Plantation Sector of Sri Lanka
5.2 Nutritional Indicators of Women in Reproductive Age GroupNutritional status of the women inreproductive age group ispresented using three indicators;anaemia, mid-arm circumference
and body mass index.
Table 16 presents the status ofanaemia in pregnancy during the
last decade. The data is from twonational studies on nutrition statusand the DHS. Althoughmethodologies adapted in the threestudies were different, it shows anoverall reduction in anaemia statusin pregnancy. DHS 2006/07 has notpresented estimates according todifferent sectors due to the smallsample size of pregnant women inthe study (n = 715). The lowestimate for the estate sector in2009 is probably due to theinadequate sample size of pregnantwomen in the estate sector (only 12pregnant women). Hence, thisestimate is unlikely to suggest areduction in anaemia rates amongestate pregnant women.
Data on mid-Upper armcircumference shows that pregnantwomen in the estate sector are wellbelow the national average.
Table 16Anaemia in Pregnant Women (%), Various Survey Periods
Sector 20011 2006/072 20093
National 30.3 34 16.7
Urban 24.6 - 19.3
Rural 30.8 - 16.4
Estate 49.1 - 8.3
Anaemia
Source: 1. Piyasena, C., & Mahamittawa, A. (2001), Assessment of AnaemiaStatus in Sri Lanka, Colombo: Medical Research Institute;
2. Department of Census and Statistics (1993, 2000 & 2006/07), SriLanka Demographic and Health Survey, Colombo; 3. MedicalResearch Institute (2009), Nutrit ion and Food SecurityAssessment Survey in Sri Lanka, Colombo.
Table 15Duration of Exclusive Breastfeeding Among Children Under 3 Years (in months), VariousSurvey Periods
Source: Department of Census and Statistics (1993, 2000 & 2006/07), Sri Lanka Demographic and Health Survey,Colombo.
Sector 1993 (Mean) 2000 (Mean) 2006/07 (Median)
National 1.2 3.7 4.5
Colombo Metro - 3 -
Other Urban - 3.6 -
Urban - - 3.6
Rural 1.2 4 4.7
Estate - 2.3 3.2
Mid-Upper Arm Circumference (MUAC)
Table 17Mid-Upper Arm Circumference of Pregnant Women, 2009
Source: Medical Research Institute (2009), Nutrition and Food Security AssessmentSurvey in Sri Lanka, Colombo.
Sector MUAC category
Undernourished <= 23cm Normal >23cm
Overall (%) 18.4 81.6
Urban (%) 12.3 87.7
Rural (%) 18.9 81.1
Estate (%) 41.7 58.3
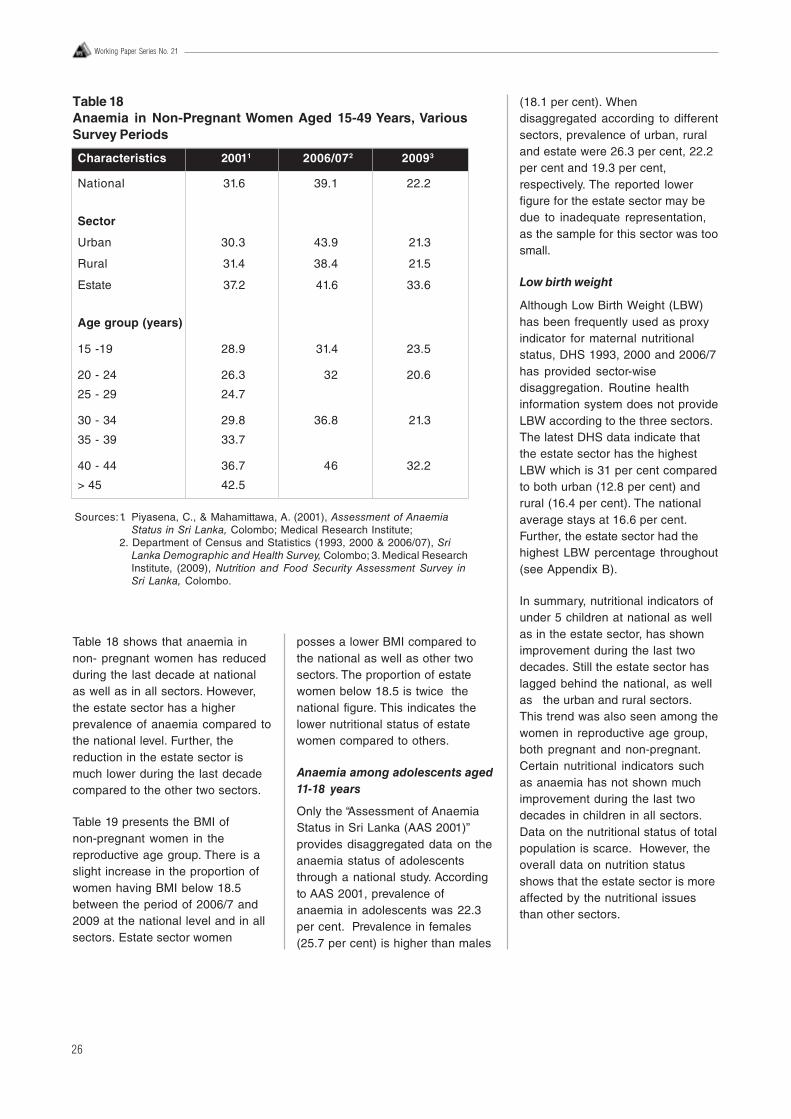
26
Working Paper Series No. 21
Table 18 shows that anaemia innon- pregnant women has reducedduring the last decade at nationalas well as in all sectors. However,the estate sector has a higherprevalence of anaemia compared tothe national level. Further, thereduction in the estate sector ismuch lower during the last decadecompared to the other two sectors.
Table 19 presents the BMI ofnon-pregnant women in thereproductive age group. There is aslight increase in the proportion ofwomen having BMI below 18.5between the period of 2006/7 and2009 at the national level and in allsectors. Estate sector women
posses a lower BMI compared tothe national as well as other twosectors. The proportion of estatewomen below 18.5 is twice thenational figure. This indicates thelower nutritional status of estatewomen compared to others.
Anaemia among adolescents aged11-18 years
Only the “Assessment of AnaemiaStatus in Sri Lanka (AAS 2001)”provides disaggregated data on theanaemia status of adolescentsthrough a national study. Accordingto AAS 2001, prevalence ofanaemia in adolescents was 22.3per cent. Prevalence in females(25.7 per cent) is higher than males
(18.1 per cent). Whendisaggregated according to differentsectors, prevalence of urban, ruraland estate were 26.3 per cent, 22.2per cent and 19.3 per cent,respectively. The reported lowerfigure for the estate sector may bedue to inadequate representation,as the sample for this sector was toosmall.
Low birth weight
Although Low Birth Weight (LBW)has been frequently used as proxyindicator for maternal nutritionalstatus, DHS 1993, 2000 and 2006/7has provided sector-wisedisaggregation. Routine healthinformation system does not provideLBW according to the three sectors.The latest DHS data indicate thatthe estate sector has the highestLBW which is 31 per cent comparedto both urban (12.8 per cent) andrural (16.4 per cent). The nationalaverage stays at 16.6 per cent.Further, the estate sector had thehighest LBW percentage throughout(see Appendix B).
In summary, nutritional indicators ofunder 5 children at national as wellas in the estate sector, has shownimprovement during the last twodecades. Still the estate sector haslagged behind the national, as wellas the urban and rural sectors.This trend was also seen among thewomen in reproductive age group,both pregnant and non-pregnant.Certain nutritional indicators suchas anaemia has not shown muchimprovement during the last twodecades in children in all sectors.Data on the nutritional status of totalpopulation is scarce. However, theoverall data on nutrition statusshows that the estate sector is moreaffected by the nutritional issuesthan other sectors.
Sources:1. Piyasena, C., & Mahamittawa, A. (2001), Assessment of AnaemiaStatus in Sri Lanka, Colombo; Medical Research Institute;
2. Department of Census and Statistics (1993, 2000 & 2006/07), SriLanka Demographic and Health Survey, Colombo; 3. Medical ResearchInstitute, (2009), Nutrition and Food Security Assessment Survey inSri Lanka, Colombo.
Table 18Anaemia in Non-Pregnant Women Aged 15-49 Years, VariousSurvey Periods
Characteristics 20011 2006/072 20093
National 31.6 39.1 22.2
Sector
Urban 30.3 43.9 21.3
Rural 31.4 38.4 21.5
Estate 37.2 41.6 33.6
Age group (years)
15 -19 28.9 31.4 23.5
20 - 24 26.3 32 20.6
25 - 29 24.7
30 - 34 29.8 36.8 21.3
35 - 39 33.7
40 - 44 36.7 46 32.2
> 45 42.5
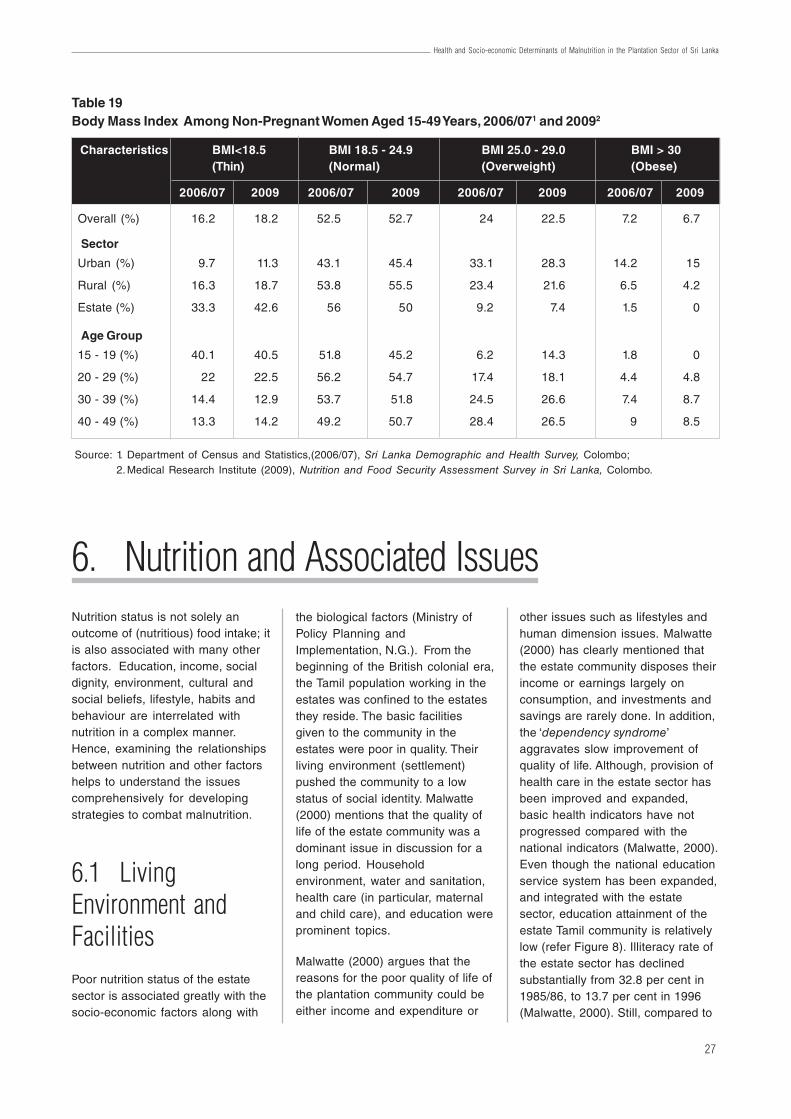
27
Health and Socio-economic Determinants of Malnutrition in the Plantation Sector of Sri Lanka
6. Nutrition and Associated IssuesNutrition status is not solely anoutcome of (nutritious) food intake; itis also associated with many otherfactors. Education, income, socialdignity, environment, cultural andsocial beliefs, lifestyle, habits andbehaviour are interrelated withnutrition in a complex manner.Hence, examining the relationshipsbetween nutrition and other factorshelps to understand the issuescomprehensively for developingstrategies to combat malnutrition.
6.1 LivingEnvironment andFacilitiesPoor nutrition status of the estatesector is associated greatly with thesocio-economic factors along with
the biological factors (Ministry ofPolicy Planning andImplementation, N.G.). From thebeginning of the British colonial era,the Tamil population working in theestates was confined to the estatesthey reside. The basic facilitiesgiven to the community in theestates were poor in quality. Theirliving environment (settlement)pushed the community to a lowstatus of social identity. Malwatte(2000) mentions that the quality oflife of the estate community was adominant issue in discussion for along period. Householdenvironment, water and sanitation,health care (in particular, maternaland child care), and education wereprominent topics.
Malwatte (2000) argues that thereasons for the poor quality of life ofthe plantation community could beeither income and expenditure or
other issues such as lifestyles andhuman dimension issues. Malwatte(2000) has clearly mentioned thatthe estate community disposes theirincome or earnings largely onconsumption, and investments andsavings are rarely done. In addition,the ‘dependency syndrome’aggravates slow improvement ofquality of life. Although, provision ofhealth care in the estate sector hasbeen improved and expanded,basic health indicators have notprogressed compared with thenational indicators (Malwatte, 2000).Even though the national educationservice system has been expanded,and integrated with the estatesector, education attainment of theestate Tamil community is relativelylow (refer Figure 8). Illiteracy rate ofthe estate sector has declinedsubstantially from 32.8 per cent in1985/86, to 13.7 per cent in 1996(Malwatte, 2000). Still, compared to
Table 19Body Mass Index Among Non-Pregnant Women Aged 15-49 Years, 2006/071 and 20092
Source: 1. Department of Census and Statistics,(2006/07), Sri Lanka Demographic and Health Survey, Colombo;2. Medical Research Institute (2009), Nutrition and Food Security Assessment Survey in Sri Lanka, Colombo.
Characteristics BMI<18.5 BMI 18.5 - 24.9 BMI 25.0 - 29.0 BMI > 30(Thin) (Normal) (Overweight) (Obese)
2006/07 2009 2006/07 2009 2006/07 2009 2006/07 2009
Overall (%) 16.2 18.2 52.5 52.7 24 22.5 7.2 6.7
Sector
Urban (%) 9.7 11.3 43.1 45.4 33.1 28.3 14.2 15
Rural (%) 16.3 18.7 53.8 55.5 23.4 21.6 6.5 4.2
Estate (%) 33.3 42.6 56 50 9.2 7.4 1.5 0
Age Group
15 - 19 (%) 40.1 40.5 51.8 45.2 6.2 14.3 1.8 0
20 - 29 (%) 22 22.5 56.2 54.7 17.4 18.1 4.4 4.8
30 - 39 (%) 14.4 12.9 53.7 51.8 24.5 26.6 7.4 8.7
40 - 49 (%) 13.3 14.2 49.2 50.7 28.4 26.5 9 8.5
28
Working Paper Series No. 21
the urban (2.4 per cent) and rural(4.3 per cent) sectors, illiteracy rateis still higher in the estate sector(14.2 per cent) (Department ofCensus and Statistics, 2012). LankaJathika Estate Workers’ Union in1996 (as cited in Malwatte, 2000)has reported a higher rate of schooldrop-outs in the estate sector.Observed reasons for not schoolingwere unaffordability, low interest inparents, unavailability of schoolsclose to residence, and taking careof younger children when parentsare at work. Women’s Needs Studyin 1983 (as cited in Malwatte, 2000)found that estate children lose theireducational gains in quick time,since they do not have anopportunity to use the knowledgeand skills productively.
Housing, water and sanitationfacilities were also a major area ofconcern in improving the quality oflife of the estate community.Experiences of living in the ‘linerooms’ did not promote the socialdevelopment of the estatecommunity. They had limited needs– work, eat, sleep, and regularalcohol. Prevailing householdenvironment and lifestyle did notprotect the privacy within andbetween families (Piyarathne, 2008;Malwatte, 2000). As a result, manyother social problems were created(Piyarathne, 2008; Malwatte, 2000).However, these basic needs andfacilities have been improvedsubstantially over the years, with theassistance of government projects,donors, and other responsibleentities (e.g. PHDT, Planters’Association). Currently, some of theestate residents own better qualityhousing facilities, particularly singlehousing units instead of age old‘line rooms’ (via self-help strategy).Piyarathne (2008) studied theimplications of two governmentschemes established in GangaNagar in Nuwara Eliya and JanaUdana Gammanaya in Kalutara, onsocial life of the estate Tamils. Theauthor revealed that there is a
notable difference of social lifebetween the estate people, thosewho live in their own single houseswith a plot of land, and those wholive in the traditional line rooms.According to his findings, the peoplehave mentally prepared themselvesto quit the unpleasant environmentin the line rooms, even before theymoved to new houses. They werewilling to change their social lifealong with the culture of povertyprevailing in the line roomenvironment. It was found that thepeople in the new settlement weresatisfied with a new lease of life anddesirable cultural transformation.The following statements as cited bythe author reflect their elated mood(refer Box 2).
Piyarathne (2008) in this studyconcluded that changing housingcondition is crucial to change thesocial identity of the estatepopulation. The study suggested tochange the current line room basedliving pattern of this community.They should be given equalopportunities in the society throughprovision of better healthcare,education, transport, sanitation andpoverty alleviation programmes.Piyarathne (2008) and Malwatte(2000) also found that other socialproblems can arise due to poorliving conditions in the traditionalline rooms. Violence, sexual abuse,and alcoholism are common social
ills found among the estatepopulation. Smoking and betelchewing are also popular amongthe estate worker. Piyarathne (2008)stated that estate people are highlyaddicted to alcohol and toddy.According to him, groups of estateworkers hire vehicles to travel tofaraway places seeking the toddybars in the evening. Women’s NeedAssessment (PHSWT/TAT) statesthat (as cited in Malwatte, 2000),workers chew betel to overcomehunger and cold during the workinghours. Malwatte (2000) mentionedthat estate workers tend to ‘drink’more because of the limitedperspective of their lives. As per thelatest statistics, a household in theestate sector spends 10.7 per centof the total non-food expenditure permonth on liquor, narcotic drugs andtobacco, which is the third highestnon-food expenditure item in theestate sector. It is almost 3.7 timeshigher than the national figure (2.9per cent). The rural (3.2 per cent)and urban (1.3 per cent) sectorsspend a substantially lower amountcompared to the estate sector onthose substances (Department ofCensus and Statistics, 2012/13).
It is observed that when the estatecommunity is exposed to the outerworld, their aspirations change overtime. This is due to the improvementof accessibility for informationthrough education and mass media,
Box 2A Few Quotations of Respondents Living in Separate Houses
“...no one would disturb his or her free and independent life unlike inthe estate. Settlers have a healthier life too. They get better ventilation;enough space…We have no such life in the gloomy line rooms”;
“…When we were in the estates, we expect help from the estatemanagement, but that dependency does not exist…If one wants todevelop lives of the plantation Tamils, all the line rooms should bereplaced by housing schemes…Planters did not consider theup-liftment of the Tamils..”;
“.. People in the new houses work hard unlike people in the linerooms. This effort would take them to a better life standard…”
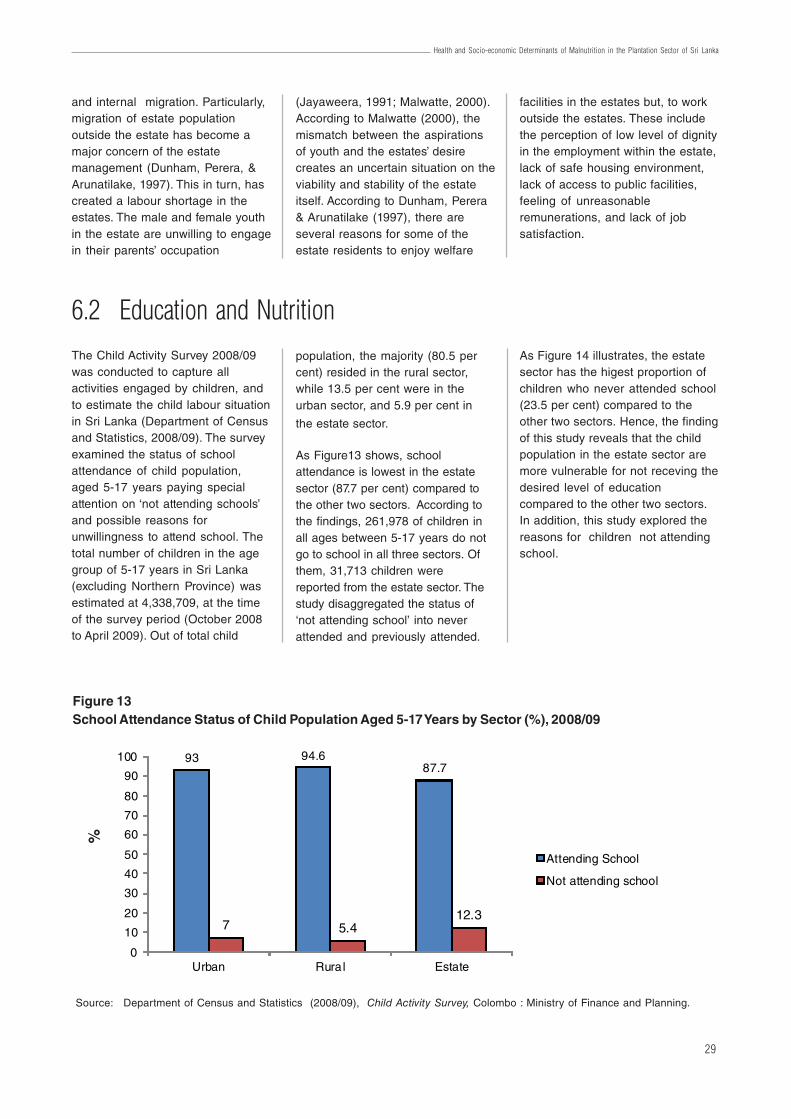
29
Health and Socio-economic Determinants of Malnutrition in the Plantation Sector of Sri Lanka
and internal migration. Particularly,migration of estate populationoutside the estate has become amajor concern of the estatemanagement (Dunham, Perera, &Arunatilake, 1997). This in turn, hascreated a labour shortage in theestates. The male and female youthin the estate are unwilling to engagein their parents’ occupation
6.2 Education and NutritionThe Child Activity Survey 2008/09was conducted to capture allactivities engaged by children, andto estimate the child labour situationin Sri Lanka (Department of Censusand Statistics, 2008/09). The surveyexamined the status of schoolattendance of child population,aged 5-17 years paying specialattention on ‘not attending schools’and possible reasons forunwillingness to attend school. Thetotal number of children in the agegroup of 5-17 years in Sri Lanka(excluding Northern Province) wasestimated at 4,338,709, at the timeof the survey period (October 2008to April 2009). Out of total child
population, the majority (80.5 percent) resided in the rural sector,while 13.5 per cent were in theurban sector, and 5.9 per cent in
the estate sector.
As Figure13 shows, schoolattendance is lowest in the estatesector (87.7 per cent) compared tothe other two sectors. According tothe findings, 261,978 of children inall ages between 5-17 years do notgo to school in all three sectors. Ofthem, 31,713 children werereported from the estate sector. Thestudy disaggregated the status of‘not attending school’ into neverattended and previously attended.
(Jayaweera, 1991; Malwatte, 2000).According to Malwatte (2000), themismatch between the aspirationsof youth and the estates’ desirecreates an uncertain situation on theviability and stability of the estateitself. According to Dunham, Perera& Arunatilake (1997), there areseveral reasons for some of theestate residents to enjoy welfare
facilities in the estates but, to workoutside the estates. These includethe perception of low level of dignityin the employment within the estate,lack of safe housing environment,lack of access to public facilities,feeling of unreasonableremunerations, and lack of jobsatisfaction.
As Figure 14 illustrates, the estatesector has the higest proportion ofchildren who never attended school(23.5 per cent) compared to theother two sectors. Hence, the findingof this study reveals that the childpopulation in the estate sector aremore vulnerable for not receving thedesired level of educationcompared to the other two sectors.In addition, this study explored thereasons for children not attendingschool.
Figure 13School Attendance Status of Child Population Aged 5-17 Years by Sector (%), 2008/09
Source: Department of Census and Statistics (2008/09), Child Activity Survey, Colombo : Ministry of Finance and Planning.
93 94.687.7
7 5.412.3
0
10
20
30
40
50
60
70
80
90
100
Urban Rural Estate
Attending School
Not attending school
%
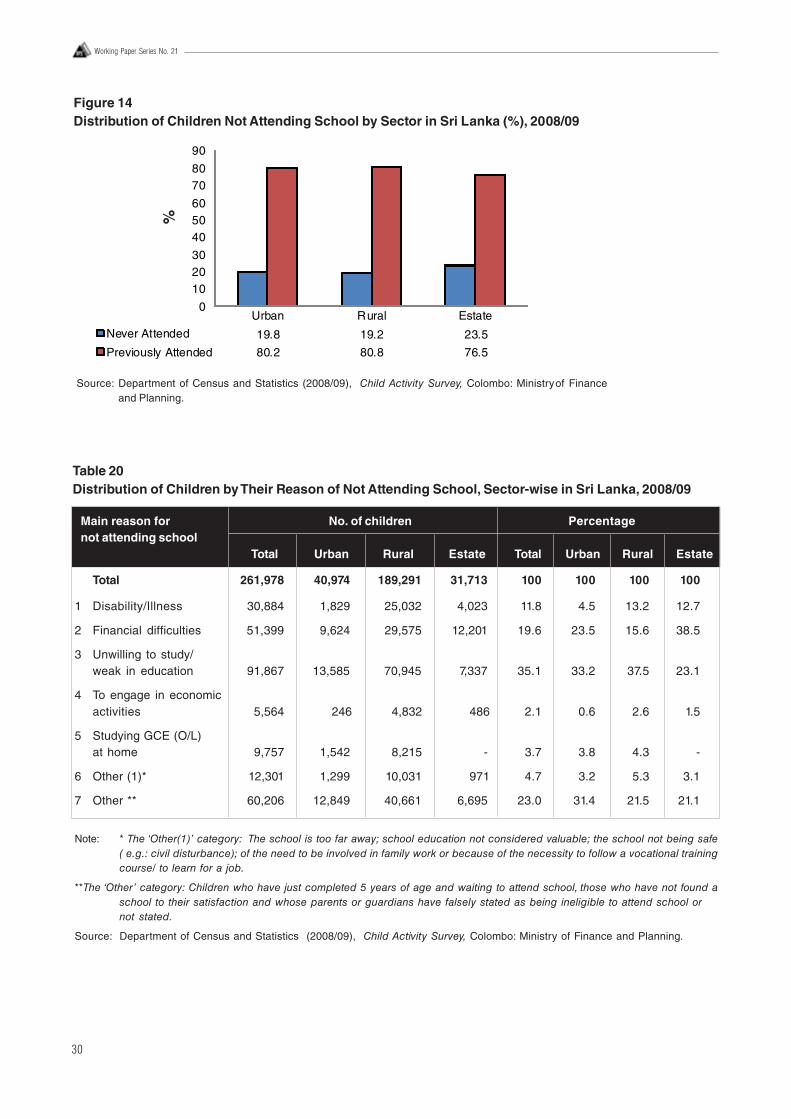
30
Working Paper Series No. 21
Figure 14Distribution of Children Not Attending School by Sector in Sri Lanka (%), 2008/09
Source: Department of Census and Statistics (2008/09), Child Activity Survey, Colombo: Ministryof Financeand Planning.
Urban Rural Estate
Never Attended 19.8 19.2 23.5
Previously Attended 80.2 80.8 76.5
0
102030
405060
7080
90
%
Table 20Distribution of Children by Their Reason of Not Attending School, Sector-wise in Sri Lanka, 2008/09
Main reason for No. of children Percentagenot attending school
Total Urban Rural Estate Total Urban Rural Estate
Total 261,978 40,974 189,291 31,713 100 100 100 100
1 Disability/Illness 30,884 1,829 25,032 4,023 11.8 4.5 13.2 12.7
2 Financial difficulties 51,399 9,624 29,575 12,201 19.6 23.5 15.6 38.5
3 Unwilling to study/weak in education 91,867 13,585 70,945 7,337 35.1 33.2 37.5 23.1
4 To engage in economicactivities 5,564 246 4,832 486 2.1 0.6 2.6 1.5
5 Studying GCE (O/L)at home 9,757 1,542 8,215 - 3.7 3.8 4.3 -
6 Other (1)* 12,301 1,299 10,031 971 4.7 3.2 5.3 3.1
7 Other ** 60,206 12,849 40,661 6,695 23.0 31.4 21.5 21.1
Note: * The ‘Other(1)’ category: The school is too far away; school education not considered valuable; the school not being safe( e.g.: civil disturbance); of the need to be involved in family work or because of the necessity to follow a vocational trainingcourse/ to learn for a job.
**The ‘Other’ category: Children who have just completed 5 years of age and waiting to attend school, those who have not found aschool to their satisfaction and whose parents or guardians have falsely stated as being ineligible to attend school ornot stated.
Source: Department of Census and Statistics (2008/09), Child Activity Survey, Colombo: Ministry of Finance and Planning.
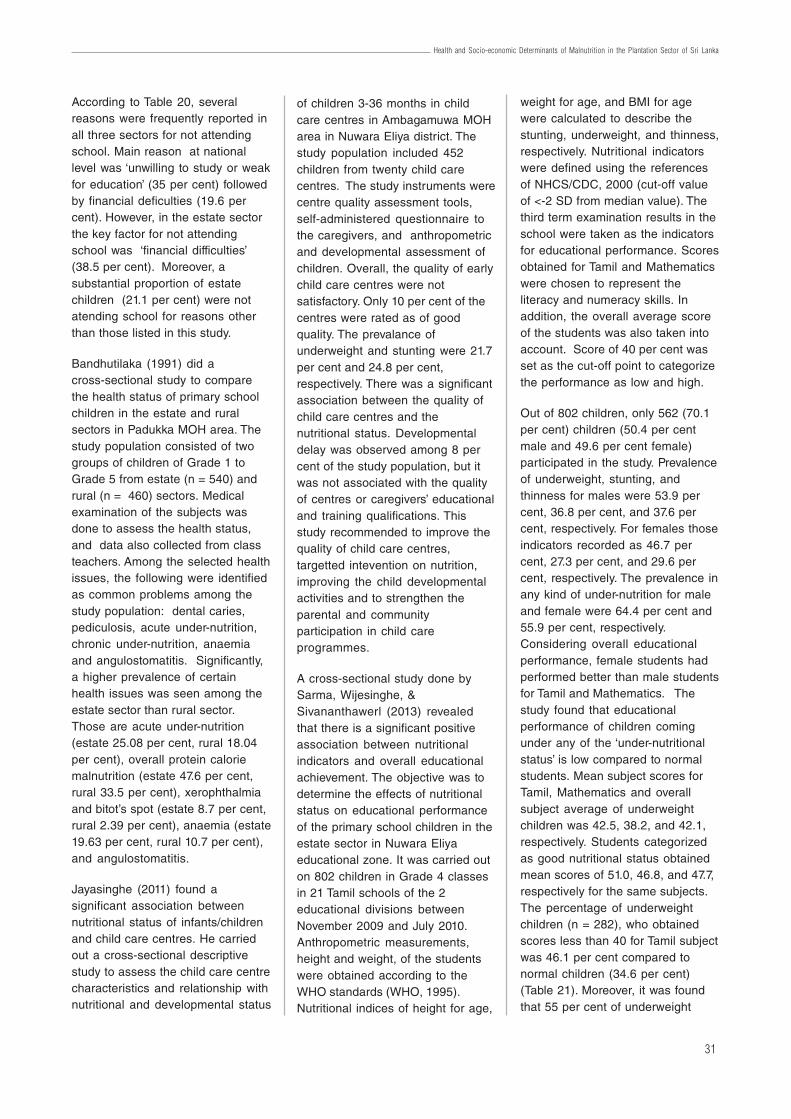
31
Health and Socio-economic Determinants of Malnutrition in the Plantation Sector of Sri Lanka
According to Table 20, severalreasons were frequently reported inall three sectors for not attendingschool. Main reason at nationallevel was ‘unwilling to study or weakfor education’ (35 per cent) followedby financial deficulties (19.6 percent). However, in the estate sectorthe key factor for not attendingschool was ‘financial difficulties’(38.5 per cent). Moreover, asubstantial proportion of estatechildren (21.1 per cent) were notatending school for reasons otherthan those listed in this study.
Bandhutilaka (1991) did across-sectional study to comparethe health status of primary schoolchildren in the estate and ruralsectors in Padukka MOH area. Thestudy population consisted of twogroups of children of Grade 1 toGrade 5 from estate (n = 540) andrural (n = 460) sectors. Medicalexamination of the subjects wasdone to assess the health status,and data also collected from classteachers. Among the selected healthissues, the following were identifiedas common problems among thestudy population: dental caries,pediculosis, acute under-nutrition,chronic under-nutrition, anaemiaand angulostomatitis. Significantly,a higher prevalence of certainhealth issues was seen among theestate sector than rural sector.Those are acute under-nutrition(estate 25.08 per cent, rural 18.04per cent), overall protein caloriemalnutrition (estate 47.6 per cent,rural 33.5 per cent), xerophthalmiaand bitot’s spot (estate 8.7 per cent,rural 2.39 per cent), anaemia (estate19.63 per cent, rural 10.7 per cent),and angulostomatitis.
Jayasinghe (2011) found asignificant association betweennutritional status of infants/childrenand child care centres. He carriedout a cross-sectional descriptivestudy to assess the child care centrecharacteristics and relationship withnutritional and developmental status
of children 3-36 months in childcare centres in Ambagamuwa MOHarea in Nuwara Eliya district. Thestudy population included 452children from twenty child carecentres. The study instruments werecentre quality assessment tools,self-administered questionnaire tothe caregivers, and anthropometricand developmental assessment ofchildren. Overall, the quality of earlychild care centres were notsatisfactory. Only 10 per cent of thecentres were rated as of goodquality. The prevalance ofunderweight and stunting were 21.7per cent and 24.8 per cent,respectively. There was a significantassociation between the quality ofchild care centres and thenutritional status. Developmentaldelay was observed among 8 percent of the study population, but itwas not associated with the qualityof centres or caregivers’ educationaland training qualifications. Thisstudy recommended to improve thequality of child care centres,targetted intevention on nutrition,improving the child developmentalactivities and to strengthen theparental and communityparticipation in child careprogrammes.
A cross-sectional study done bySarma, Wijesinghe, &Sivananthawerl (2013) revealedthat there is a significant positiveassociation between nutritionalindicators and overall educationalachievement. The objective was todetermine the effects of nutritionalstatus on educational performanceof the primary school children in theestate sector in Nuwara Eliyaeducational zone. It was carried outon 802 children in Grade 4 classesin 21 Tamil schools of the 2educational divisions betweenNovember 2009 and July 2010.Anthropometric measurements,height and weight, of the studentswere obtained according to theWHO standards (WHO, 1995).Nutritional indices of height for age,
weight for age, and BMI for agewere calculated to describe thestunting, underweight, and thinness,respectively. Nutritional indicatorswere defined using the referencesof NHCS/CDC, 2000 (cut-off valueof <-2 SD from median value). Thethird term examination results in theschool were taken as the indicatorsfor educational performance. Scoresobtained for Tamil and Mathematicswere chosen to represent theliteracy and numeracy skills. Inaddition, the overall average scoreof the students was also taken intoaccount. Score of 40 per cent wasset as the cut-off point to categorizethe performance as low and high.
Out of 802 children, only 562 (70.1per cent) children (50.4 per centmale and 49.6 per cent female)participated in the study. Prevalenceof underweight, stunting, andthinness for males were 53.9 percent, 36.8 per cent, and 37.6 percent, respectively. For females thoseindicators recorded as 46.7 percent, 27.3 per cent, and 29.6 percent, respectively. The prevalence inany kind of under-nutrition for maleand female were 64.4 per cent and55.9 per cent, respectively.Considering overall educationalperformance, female students hadperformed better than male studentsfor Tamil and Mathematics. Thestudy found that educationalperformance of children comingunder any of the ‘under-nutritionalstatus’ is low compared to normalstudents. Mean subject scores forTamil, Mathematics and overallsubject average of underweightchildren was 42.5, 38.2, and 42.1,respectively. Students categorizedas good nutritional status obtainedmean scores of 51.0, 46.8, and 47.7,respectively for the same subjects.The percentage of underweightchildren (n = 282), who obtainedscores less than 40 for Tamil subjectwas 46.1 per cent compared tonormal children (34.6 per cent)(Table 21). Moreover, it was foundthat 55 per cent of underweight
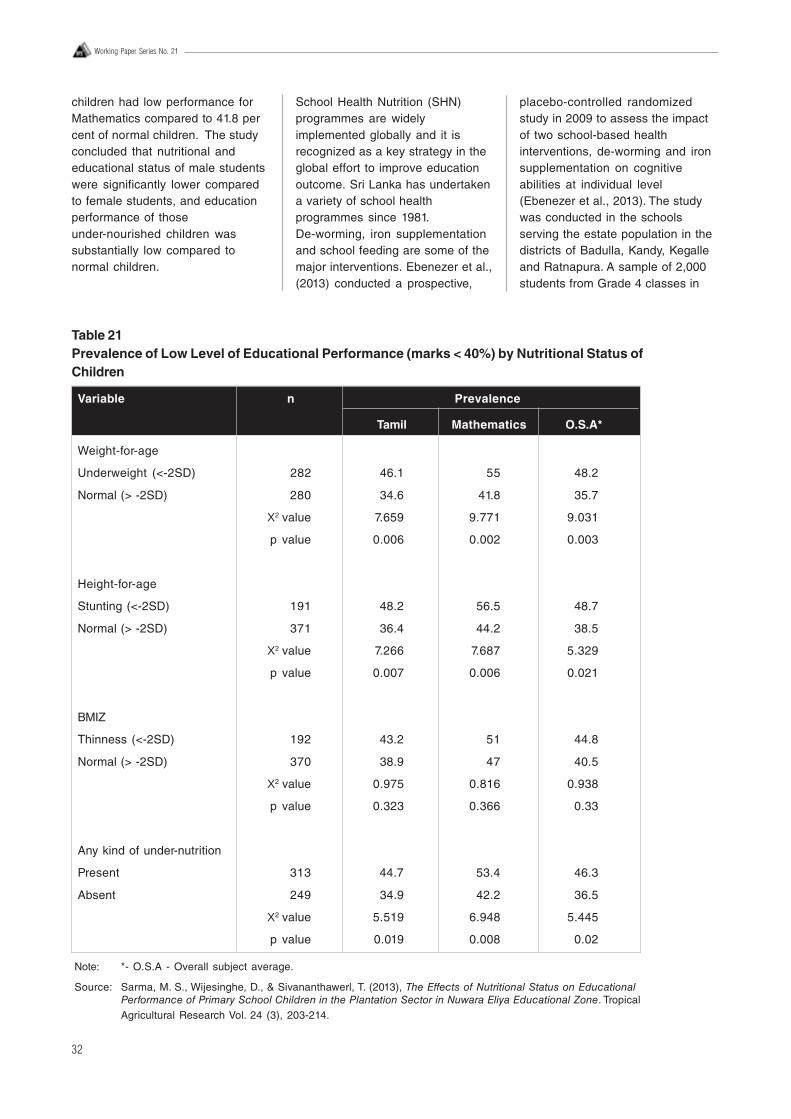
32
Working Paper Series No. 21
children had low performance forMathematics compared to 41.8 percent of normal children. The studyconcluded that nutritional andeducational status of male studentswere significantly lower comparedto female students, and educationperformance of thoseunder-nourished children wassubstantially low compared tonormal children.
School Health Nutrition (SHN)programmes are widelyimplemented globally and it isrecognized as a key strategy in theglobal effort to improve educationoutcome. Sri Lanka has undertakena variety of school healthprogrammes since 1981.De-worming, iron supplementationand school feeding are some of themajor interventions. Ebenezer et al.,(2013) conducted a prospective,
placebo-controlled randomizedstudy in 2009 to assess the impactof two school-based healthinterventions, de-worming and ironsupplementation on cognitiveabilities at individual level(Ebenezer et al., 2013). The studywas conducted in the schoolsserving the estate population in thedistricts of Badulla, Kandy, Kegalleand Ratnapura. A sample of 2,000students from Grade 4 classes in
Table 21Prevalence of Low Level of Educational Performance (marks < 40%) by Nutritional Status ofChildren
Variable n Prevalence
Tamil Mathematics O.S.A*
Weight-for-age
Underweight (<-2SD) 282 46.1 55 48.2
Normal (> -2SD) 280 34.6 41.8 35.7
X2 value 7.659 9.771 9.031
p value 0.006 0.002 0.003
Height-for-age
Stunting (<-2SD) 191 48.2 56.5 48.7
Normal (> -2SD) 371 36.4 44.2 38.5
X2 value 7.266 7.687 5.329
p value 0.007 0.006 0.021
BMIZ
Thinness (<-2SD) 192 43.2 51 44.8
Normal (> -2SD) 370 38.9 47 40.5
X2 value 0.975 0.816 0.938
p value 0.323 0.366 0.33
Any kind of under-nutrition
Present 313 44.7 53.4 46.3
Absent 249 34.9 42.2 36.5
X2 value 5.519 6.948 5.445
p value 0.019 0.008 0.02
Note: *- O.S.A - Overall subject average.
Source: Sarma, M. S., Wijesinghe, D., & Sivananthawerl, T. (2013), The Effects of Nutritional Status on EducationalPerformance of Primary School Children in the Plantation Sector in Nuwara Eliya Educational Zone. TropicalAgricultural Research Vol. 24 (3), 203-214.
33
Health and Socio-economic Determinants of Malnutrition in the Plantation Sector of Sri Lanka
100 schools was selected. Schoolswere randomized as treatment andcontrol. Treatment group had 813children in 49 schools and controlgroup had 808 children in 49schools. After a baseline survey,students in the treatment groupreceived 500 mg oral dose ofmebendazole followed by a weeklydose of iron supplementation(tablets containing 200 mg offerrous sulphate equivalent to 60mg of elemental iron) for a period ofsix months. The control groupreceived placebo in the samefrequency. The class teachers wereentrusted in delivering thetreatment.
Both baseline and follow-upassessment was competed for 615children in 49 schools in thetreatment group, and 575 children in47 schools in the placebo group.During the study, 24.4 per cent ofthe treatment group and 28.8 percent of the control group were lost tofollow up. A thirty minutes generaleducation test was done on Tamiland Mathematics separately as thecognitive assessment. Haemoglobin(Hb) level, presence of Ascarislumbricoides, hookworm andTrichuri strichiura eggs were theoutcome measures. The studyrevealed that prevalence of worminfection in the treatment groupdropped from 26.2 per cent to 18.5per cent with significant differencesbetween the treatment and controlgroup. The proportion of anaemicchildren in the treatment groupdeclined by 3.7 per cent frombaseline to follow-up; in the controlgroup, the decline was 5.5 per cent.However, these changes were notsignificantly different between thetreatment and control groups.Further, treatment (deworming andiron supplementation) has not madea considerable impact on cognitivetest and educational test scores,even after controlling for baselinedifferences in background variables(such as anaemia and parentaleducation). In conclusion, the
findings said that use of single-dosemebendazole in a mass dewormingprogramme may result in overallreduction of soil transmittedhelminth (STH) prevalence but haslittle impact on hookworm infections.However, there may be little or noimprovement in anaemia and ineducational outcomes owing tointermittent oral ironsupplementation.
A study on soil transmittedhelminthic infection was carried outby Kumarendran (2010) amongprimary school children in theplantation sector of Nuwar Eliyadistrict. The intentions of the studywere to estimate the prevalence ofmain infections, identify socio-demographic and behaviouralfactors and to detect associationbetween helminthic infection andnutritional indices. This descriptivecross-sectional study was done in420 primary school children mainlyfrom Grade four classes of sixteenTamil medium schools in theplantation sector. Intervieweradministered questionnaire, clinicalexamination, anthropometricmeasurements, laboratoryexamination for haemoglobin andstool samples, record sheets andGIS mapping were used to gatherinformation for the survey. The studyobserved that the prevalence ofround worm mono-infection andwhip worm mono infection amongthe study subjects were 34.2 percent and 1.3 per cent, respectively. Itwas found that 8 per cent of childrenhad no latrines in their residenceand 14.4 per cent of the childrenlack shoes. According to the study,dirty, overgrown fingernails werefound among 23.3 per cent ofchildren and only 46.6 per cent hadworm treatment within the last sixmonths. Significant associationswere found between infection withany worm and low educationalstatus of mothers, dirty overgrownfingernails, not using shoes, notdewormed during the last sixmonths and living in higher than
1,500 altitude. Although under-nutritional status was high (acutemalnutrition – 59.8 per cent, chronicmalnutrition – 37.8 per cent,anaemia – 34.9 per cent) among thepopulation, the study did not findassociation with any type of worminfection. This study recommendsregular annual deworming,improvement of latrine facility,parental education regardinghygiene of their children, andaddressing for the risk factors ofmalnutrition.
6.3 MaternalEmployment andIncomeDietary calorie inadequacy is a keycontributor of malnutrition ofchildren and mothers. In Sri Lanka,the highest malnourished mothersin terms of BMI measure and dietarycalorie adequacy was reported fromthe estate sector, whereas thehighest stunted and underweightchildren were also reported from theestate sector (Rathnayake &Weerahewa, 2005). Majority of theworkers in the tea estates arewomen (Rathnayake & Weerahewa,2005). The latest DHS 2006/07survey found that about 71 per centof estate sector women engage ineconomic activity, compared to thatof the urban (34 per cent) and rural(42 per cent) sectors (Department ofCensus and Statistics, 2006/07).Thomas and Chen (1993) found thatthere is a significant differencebetween the welfare benefits ofincome from men, and that fromwomen to the household. Also,mothers tend to spend a largeportion of their income on family’seducation and staples (Thomas &Chen, 1993). In this context,Rathnayake and Weerahewa(2005) did a study to assess thedietary caloric adequacy among lowincome groups in Sri Lanka, placing
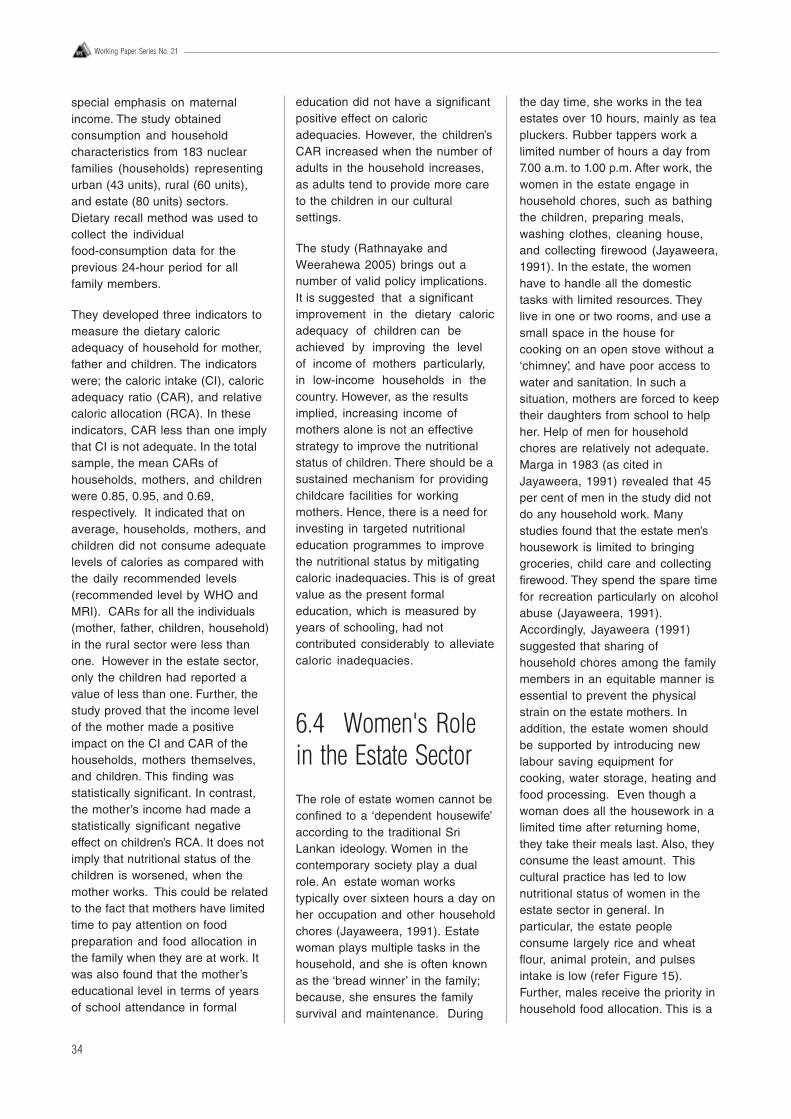
34
Working Paper Series No. 21
special emphasis on maternalincome. The study obtainedconsumption and householdcharacteristics from 183 nuclearfamilies (households) representingurban (43 units), rural (60 units),and estate (80 units) sectors.Dietary recall method was used tocollect the individualfood-consumption data for theprevious 24-hour period for allfamily members.
They developed three indicators tomeasure the dietary caloricadequacy of household for mother,father and children. The indicatorswere; the caloric intake (CI), caloricadequacy ratio (CAR), and relativecaloric allocation (RCA). In theseindicators, CAR less than one implythat CI is not adequate. In the totalsample, the mean CARs ofhouseholds, mothers, and childrenwere 0.85, 0.95, and 0.69,respectively. It indicated that onaverage, households, mothers, andchildren did not consume adequatelevels of calories as compared withthe daily recommended levels(recommended level by WHO andMRI). CARs for all the individuals(mother, father, children, household)in the rural sector were less thanone. However in the estate sector,only the children had reported avalue of less than one. Further, thestudy proved that the income levelof the mother made a positiveimpact on the CI and CAR of thehouseholds, mothers themselves,and children. This finding wasstatistically significant. In contrast,the mother’s income had made astatistically significant negativeeffect on children’s RCA. It does notimply that nutritional status of thechildren is worsened, when themother works. This could be relatedto the fact that mothers have limitedtime to pay attention on foodpreparation and food allocation inthe family when they are at work. Itwas also found that the mother’seducational level in terms of yearsof school attendance in formal
education did not have a significantpositive effect on caloricadequacies. However, the children’sCAR increased when the number ofadults in the household increases,as adults tend to provide more careto the children in our culturalsettings.
The study (Rathnayake andWeerahewa 2005) brings out anumber of valid policy implications.It is suggested that a significantimprovement in the dietary caloricadequacy of children can beachieved by improving the levelof income of mothers particularly,in low-income households in thecountry. However, as the resultsimplied, increasing income ofmothers alone is not an effectivestrategy to improve the nutritionalstatus of children. There should be asustained mechanism for providingchildcare facilities for workingmothers. Hence, there is a need forinvesting in targeted nutritionaleducation programmes to improvethe nutritional status by mitigatingcaloric inadequacies. This is of greatvalue as the present formaleducation, which is measured byyears of schooling, had notcontributed considerably to alleviatecaloric inadequacies.
6.4 Women's Rolein the Estate SectorThe role of estate women cannot beconfined to a ‘dependent housewife’according to the traditional SriLankan ideology. Women in thecontemporary society play a dualrole. An estate woman workstypically over sixteen hours a day onher occupation and other householdchores (Jayaweera, 1991). Estatewoman plays multiple tasks in thehousehold, and she is often knownas the ‘bread winner’ in the family;because, she ensures the familysurvival and maintenance. During
the day time, she works in the teaestates over 10 hours, mainly as teapluckers. Rubber tappers work alimited number of hours a day from7.00 a.m. to 1.00 p.m. After work, thewomen in the estate engage inhousehold chores, such as bathingthe children, preparing meals,washing clothes, cleaning house,and collecting firewood (Jayaweera,1991). In the estate, the womenhave to handle all the domestictasks with limited resources. Theylive in one or two rooms, and use asmall space in the house forcooking on an open stove without a‘chimney’, and have poor access towater and sanitation. In such asituation, mothers are forced to keeptheir daughters from school to helpher. Help of men for householdchores are relatively not adequate.Marga in 1983 (as cited inJayaweera, 1991) revealed that 45per cent of men in the study did notdo any household work. Manystudies found that the estate men’shousework is limited to bringinggroceries, child care and collectingfirewood. They spend the spare timefor recreation particularly on alcoholabuse (Jayaweera, 1991).Accordingly, Jayaweera (1991)suggested that sharing ofhousehold chores among the familymembers in an equitable manner isessential to prevent the physicalstrain on the estate mothers. Inaddition, the estate women shouldbe supported by introducing newlabour saving equipment forcooking, water storage, heating andfood processing. Even though awoman does all the housework in alimited time after returning home,they take their meals last. Also, theyconsume the least amount. Thiscultural practice has led to lownutritional status of women in theestate sector in general. Inparticular, the estate peopleconsume largely rice and wheatflour, animal protein, and pulsesintake is low (refer Figure 15).Further, males receive the priority inhousehold food allocation. This is a
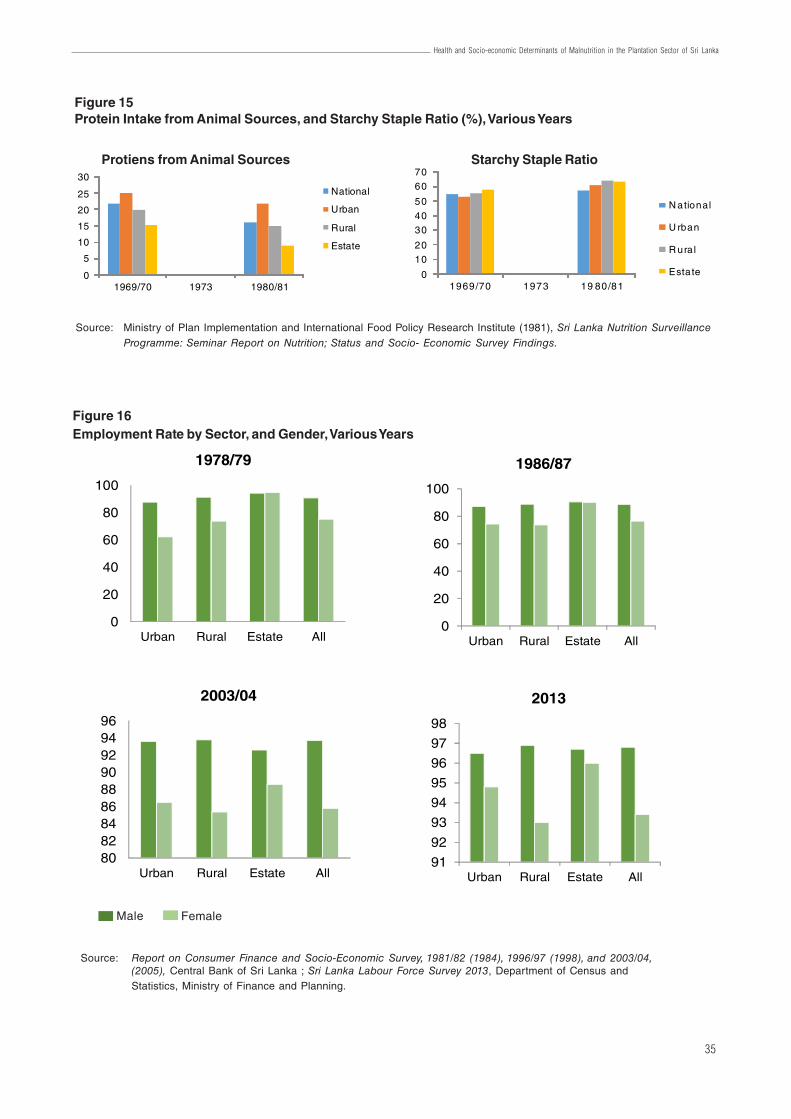
35
Health and Socio-economic Determinants of Malnutrition in the Plantation Sector of Sri Lanka
Source: Ministry of Plan Implementation and International Food Policy Research Institute (1981), Sri Lanka Nutrition SurveillanceProgramme: Seminar Report on Nutrition; Status and Socio- Economic Survey Findings.
0
10
20
30
40
50
60
70
1969/70 1973 19 80/81
N ational
U rban
R ura l
Estate
Figure 16Employment Rate by Sector, and Gender, Various Years
Source: Report on Consumer Finance and Socio-Economic Survey, 1981/82 (1984), 1996/97 (1998), and 2003/04,(2005), Central Bank of Sri Lanka ; Sri Lanka Labour Force Survey 2013, Department of Census andStatistics, Ministry of Finance and Planning.
0
20
40
60
80
100
Urban Rural Estate All
1978/79
0
20
40
60
80
100
Urban Rural Estate All
1986/87
808284868890929496
Urban Rural Estate All
2003/04
91
92
93
94
95
96
97
98
Urban Rural Estate All
2013
Figure 15Protein Intake from Animal Sources, and Starchy Staple Ratio (%), Various Years
0
5
10
15
20
25
30
1969/70 1973 1980/81
National
Urban
Rural
Estate
Protiens from Animal Sources Starchy Staple Ratio
Male Female
36
Working Paper Series No. 21
major reason for low nutritionalhealth status in the estate sector. Astudy revealed that lactating andpregnant women in the estate sectorin Nuwara Eliya district do notintake recommended quantities ofnutrition (Samarasinghe,Kiribamune, & Jayatilake, 1990). Inaddition, poor living condition, lackof safe drinking water andsanitation, accelerate the poornutrition conditions of the estatepopulation.
Income earning by an estate womanis the only source of stable incomein most households, as femalesemploy longer hours a day thanmen, and they regularly go for work.However, women in some estatesdo not have access to their income(i.e. in some estates, men weregiven the authority to collect theirwife’s salaries), no control over thespending, and no power fordecision making on otherhousehold activities (Jayaweera,1991).
As reported by the previous nationalsurveys, female employment rate inthe estate sector is the highestcompared to that of other twosectors (refer Figure 16). Forinstance, female employment rate inthe estate sector in the periods of1978/79 and 1981/82 was 94.6 percent and 96.4 per cent respectively,which was higher than the maleemployment rate in the same sectorand the other two sectors (referAppendix C) (Central Bank ofCeylon, 1984). Even in the period of1986/87 and 2013, femaleemployment rate in the estate sectorwas almost equivalent to maleemployment rates. The CongressLabour Foundation (as cited inJayaweera, 1991) has found anassociation between physical strain,occupational stress, and illness ofestate women. Chronic diseases inrespiratory tract are more in theestate women, due to exposure torain and cold, particularly to mistearly in the morning and without
proper clothing. Physical strain andexhaustion (i.e. plucking tea ortapping rubber in long hours,carrying heavy baskets on hillyterrain) can also lead to abortion,still birth, pains in joints and back,callosities of soles of feet, anddegenerative changes in the spine.
Niranjala (2009) revealed thatprevalence of under-nutrition among13 to 16 year old females issignificantly associated with pooreconomic status, consuming lessthan three main meals per day, lowdietary diversity, purchasing rawmaterials before every meal ratherthan buying weekly and pooraccess to food items.
6.5 Maternal andChild Health, andOther IllnessesVithana (2002) assessed theselected factors associated withmaternal weight gain inuncomplicated pregnancies in across-sectional descriptive studycarried out in MOH areas ofRuwanwella and Yatiyantota.Sample population comprised of384 uncomplicated single pregnantmothers, who have completed 37weeks of gestation. According to thestudy, mean maternal weight gainamong the pregnant mothers from14th week to 37th week was 8.12 kg(SD = 3.1) while 36.3 per cent had aweight gain below 7 kg. The meanweight gain among the pregnantmothers in the estate sector was6.18 kg, whereas in the non-estatesector it was 8.33 kg and thedifference was statisticallysignificant. Also, this study revealedthat there is a significant differenceof mean weight gain duringpregnancy among different ethnicgroups; lowest weight gain wasseen among the Tamils of whom the
majority are estate mothers.Statistically significant associationswere also seen with mother’seducational level, family income,domestic workload, parity and birthinterval. The study stresses the needfor attention on estate and nutritionsupplementation programmes tovulnerable groups comprisingteenage mothers, mothers with lowBMI, grand multipara mothers andestate mothers.
A cross-sectional descriptive studywas carried out in two selectedestates of the Sri Lankan PlantationCorporation to describe the acutediarrhoeal disorders amongpre-school children aged 2 to 5years (Amarasekara, 2001). Datawas collected using an intervieweradministered questionnaire among217 participants with the respondentrate of 88.9 per cent. Findingsshowed that the prevalence of acutediarrhoeal disorders was 4.4 percent and the prevalence was higheramong males (6.3 per cent) thanfemales (3.1 per cent). Majority ofthe residents (65.3 per cent)received their water supply fromtaps situated outside their homes,and others received it from spring(18.7 per cent) and river (8.8 percent). Only 57.5 per cent of thepopulation had toilet facility, and 43per cent of the study population hadthrown the excreta of small childrenoutside. Although, 49.2 per cent ofmothers had no formal education,mothers had a good knowledgeregarding diarrhoea (93.3 per cent)and knowledge on dehydration(85.2 per cent). However, 22.8 percent of mothers had poor practicesin dealing with acute diarrhoealdisorders, of which 59.1 per cent ofmothers restricted food during anepisode. This study recommends toimprove sanitary facilities, educatethe female children, and to educatemothers not to restrict food duringan episode.
Udayasiri (2003) describes theoccupational health problems,
37
Health and Socio-economic Determinants of Malnutrition in the Plantation Sector of Sri Lanka
associated factors and occupationalsafety measures among teaplantation workers in Kegalle districtin a cross-sectional descriptivestudy. He studied 534 tea estateworkers from 5 randomly selectedestates using an intervieweradministered questionnaire andclinical assessment of a sub-group.Of them, 68.7 per cent were femalesand 68.5 per cent were aged lessthan 41 years. Common occupationrelated health issues identified
were musculoskeletal disorders(chronic backache - 30 per cent,knee joint pain - 23 per cent, andneck pain -18 per cent), chronicbronchitis (10.7 per cent), varicoseveins and abrasions, and insectbites (wasp – 18.5 per cent,scorpion – 12.4 per cent, bees – 12per cent). Out of the participants,109 workers were sprayingpesticides, and 11 per cent of theworkers got pesticide poisoning.Usage of occupational safety
measures was low (i.e. only 26.6 ofworkers who spray insecticides useprotective measures and only 35per cent of workers wear slippersduring work). The studyrecommends that the occupationalhealth service should be widened tofind out solutions to theseoccupation related health problemsin the plantation sector.
7. Possible Risk Factors for Malnutrition in Estates7.1 Use of Iodized SaltIt is scientifically proved that iodinedeficiency disorders affect all stagesof human growth and development.Of which, the most important causeof preventable brain damage andmental retardation is iodinedeficiency (Delange, 2001). In SriLanka, iodization of salt iscompulsory by law, and salt is themain source of iodine, particularly inthe areas of high rainfall.
The pattern of salt consumption inthe estate population was studied ina cross-sectional study to find outthe relationship between householdsalt iodine concentration and TSHlevels in children (Abeysuriya,Wickramasinghe, Perera, &Kasturiratne, 2012). It was done in20 randomly selected estates in theRatnapura district from August toNovember 2009 among 1683households comprising at least onechild between 5-9 years. Theadequacy of iodine concentration insalt (> 30ppm) was tested byobtaining a salt sample from eachhousehold. Then, 519 children wererandomly selected from thesehouseholds and serum TSH levelswere tested. Majority of households(54.5 per cent) preferred to use saltpowder, while the rest of thehouseholds (45.5 per cent) were
using the salt crystals. Out of thosewho used salt crystal, 20 per centwashed the salt before use. Inaddition, 90.4 per cent ofhouseholds of the total sample keptthe salt containers away from thefireplace. Method of handling salt isimportant to guarantee that anadequate amount of iodine isretained in food. The researchersfound that iodine concentration insalt was significantly lower whensalt was stored near a fire-place orwashed before use. Of thehouseholds, 88.7 per cent had anadequate iodine concentration,while 11.3 per cent did not. It wasfound that the median TSHconcentrations of children fromhouseholds, who consumeadequately iodised salt [median
3.20 µIU/ml; interquartile range
= 2.59-3.92 µIU/ml] was significantly
lower than that of children who donot consume adequately iodised
salt (median 1.63 µIU/ml;
interquartile range = 1.10-2.20 µIU/
ml) [Median Test X2 = 78.47,p < 0.001]. According to the findings,the authors suggested that in orderto ensure an adequate iodised saltconsumption, more targetededucational interventions need tobe carried out.
7.2 Vitamin A andIron DuringPregnancyAthukorala, Jayasekara, & Perera(1989) studied the nutritional statusof estate workers with emphasis onVitamin A and the outcome ofpregnancy. In this study, 118pregnant female workers aged 15– 45 years from the large estatesbelonging to the Sri Lanka StatePlantations Corporations inKalutara, Ratnapura, and Mataleregions were included. Pregnantmothers were assessed during theearly stages of pregnancy (period ofgestation < 22 weeks) and followedup in late pregnancy (period ofgestation > 32 weeks).
The mean weight gain was 0.27 kgper week during the period of 18th to38th week of gestation, which islower than expected. Also, 32.8 percent of the subjects had weight gainrate less than 0.20 kg per week. Themean haemoglobin level of thestudy population was 9.2 g/dl withthe incidence of severe anaemia in25 per cent, which increased to 50.6per cent in late pregnancy despiteiron supplementation. It wasobserved that significantly highincidence of low birth weight babies
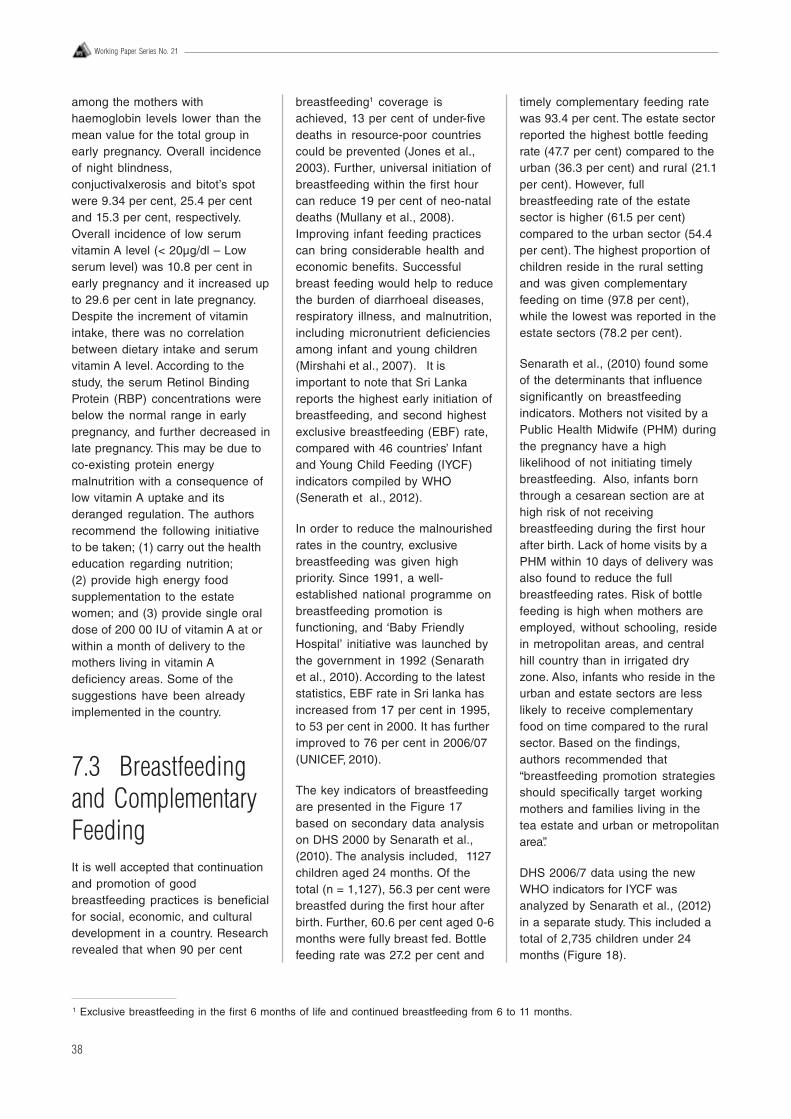
38
Working Paper Series No. 21
among the mothers withhaemoglobin levels lower than themean value for the total group inearly pregnancy. Overall incidenceof night blindness,conjuctivalxerosis and bitot’s spotwere 9.34 per cent, 25.4 per centand 15.3 per cent, respectively.Overall incidence of low serumvitamin A level (< 20μg/dl – Lowserum level) was 10.8 per cent inearly pregnancy and it increased upto 29.6 per cent in late pregnancy.Despite the increment of vitaminintake, there was no correlationbetween dietary intake and serumvitamin A level. According to thestudy, the serum Retinol BindingProtein (RBP) concentrations werebelow the normal range in earlypregnancy, and further decreased inlate pregnancy. This may be due toco-existing protein energymalnutrition with a consequence oflow vitamin A uptake and itsderanged regulation. The authorsrecommend the following initiativeto be taken; (1) carry out the healtheducation regarding nutrition;(2) provide high energy foodsupplementation to the estatewomen; and (3) provide single oraldose of 200 00 IU of vitamin A at orwithin a month of delivery to themothers living in vitamin Adeficiency areas. Some of thesuggestions have been alreadyimplemented in the country.
7.3 Breastfeedingand ComplementaryFeedingIt is well accepted that continuationand promotion of goodbreastfeeding practices is beneficialfor social, economic, and culturaldevelopment in a country. Researchrevealed that when 90 per cent
breastfeeding1 coverage isachieved, 13 per cent of under-fivedeaths in resource-poor countriescould be prevented (Jones et al.,2003). Further, universal initiation ofbreastfeeding within the first hourcan reduce 19 per cent of neo-nataldeaths (Mullany et al., 2008).Improving infant feeding practicescan bring considerable health andeconomic benefits. Successfulbreast feeding would help to reducethe burden of diarrhoeal diseases,respiratory illness, and malnutrition,including micronutrient deficienciesamong infant and young children(Mirshahi et al., 2007). It isimportant to note that Sri Lankareports the highest early initiation ofbreastfeeding, and second highestexclusive breastfeeding (EBF) rate,compared with 46 countries’ Infantand Young Child Feeding (IYCF)indicators compiled by WHO(Senerath et al., 2012).
In order to reduce the malnourishedrates in the country, exclusivebreastfeeding was given highpriority. Since 1991, a well-established national programme onbreastfeeding promotion isfunctioning, and ‘Baby FriendlyHospital’ initiative was launched bythe government in 1992 (Senarathet al., 2010). According to the lateststatistics, EBF rate in Sri lanka hasincreased from 17 per cent in 1995,to 53 per cent in 2000. It has furtherimproved to 76 per cent in 2006/07(UNICEF, 2010).
The key indicators of breastfeedingare presented in the Figure 17based on secondary data analysison DHS 2000 by Senarath et al.,(2010). The analysis included, 1127children aged 24 months. Of thetotal (n = 1,127), 56.3 per cent werebreastfed during the first hour afterbirth. Further, 60.6 per cent aged 0-6months were fully breast fed. Bottlefeeding rate was 27.2 per cent and
timely complementary feeding ratewas 93.4 per cent. The estate sectorreported the highest bottle feedingrate (47.7 per cent) compared to theurban (36.3 per cent) and rural (21.1per cent). However, fullbreastfeeding rate of the estatesector is higher (61.5 per cent)compared to the urban sector (54.4per cent). The highest proportion ofchildren reside in the rural settingand was given complementaryfeeding on time (97.8 per cent),while the lowest was reported in theestate sectors (78.2 per cent).
Senarath et al., (2010) found someof the determinants that influencesignificantly on breastfeedingindicators. Mothers not visited by aPublic Health Midwife (PHM) duringthe pregnancy have a highlikelihood of not initiating timelybreastfeeding. Also, infants bornthrough a cesarean section are athigh risk of not receivingbreastfeeding during the first hourafter birth. Lack of home visits by aPHM within 10 days of delivery wasalso found to reduce the fullbreastfeeding rates. Risk of bottlefeeding is high when mothers areemployed, without schooling, residein metropolitan areas, and centralhill country than in irrigated dryzone. Also, infants who reside in theurban and estate sectors are lesslikely to receive complementaryfood on time compared to the ruralsector. Based on the findings,authors recommended that“breastfeeding promotion strategiesshould specifically target workingmothers and families living in thetea estate and urban or metropolitanarea”.
DHS 2006/7 data using the newWHO indicators for IYCF wasanalyzed by Senarath et al., (2012)in a separate study. This included atotal of 2,735 children under 24months (Figure 18).
1 Exclusive breastfeeding in the first 6 months of life and continued breastfeeding from 6 to 11 months.
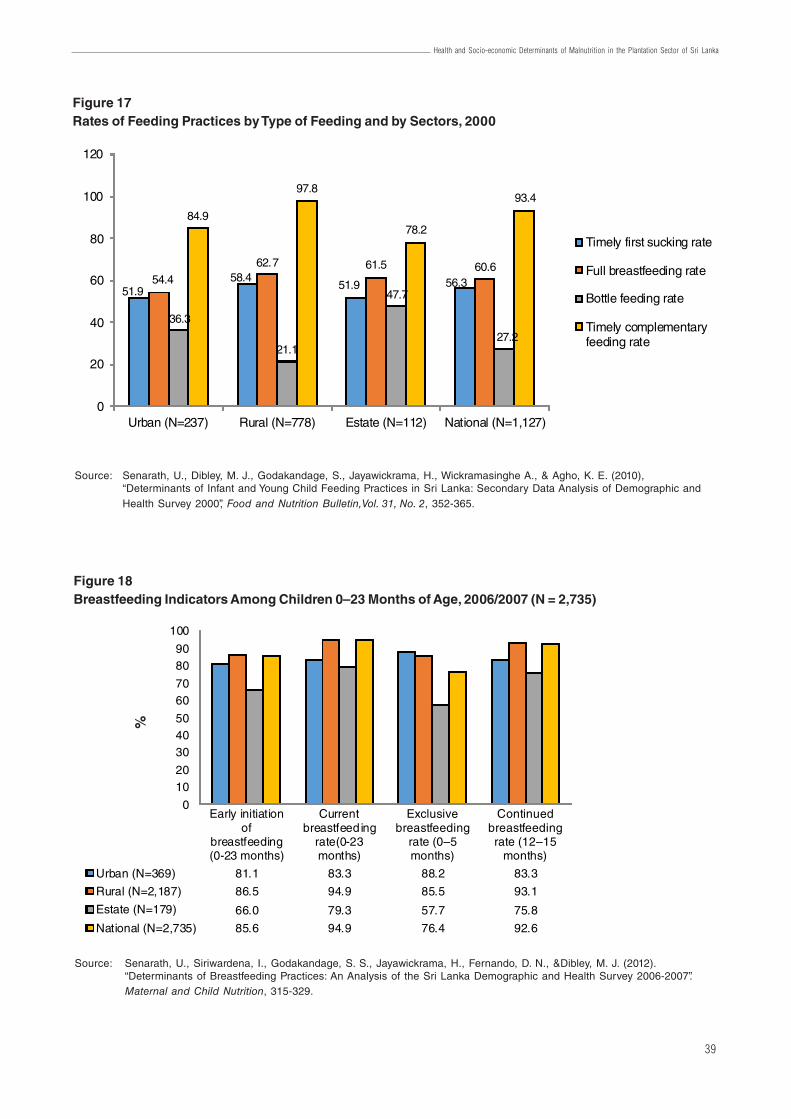
39
Health and Socio-economic Determinants of Malnutrition in the Plantation Sector of Sri Lanka
Figure 18Breastfeeding Indicators Among Children 0–23 Months of Age, 2006/2007 (N = 2,735)
Source: Senarath, U., Siriwardena, I., Godakandage, S. S., Jayawickrama, H., Fernando, D. N., &Dibley, M. J. (2012).“Determinants of Breastfeeding Practices: An Analysis of the Sri Lanka Demographic and Health Survey 2006-2007”.Maternal and Child Nutrition, 315-329.
Early initiationof
breastfeeding(0-23 months)
Currentbreastfeeding
rate(0-23months)
Exclusive breastfeeding
rate (0–5 months)
Continued breastfeeding rate (12–15
months)
Urban (N=369) 81.1 83.3 88.2 83.3
Rural (N=2,187) 86.5 94.9 85.5 93.1
Estate (N=179) 66.0 79.3 57.7 75.8
National (N=2,735) 85.6 94.9 76.4 92.6
0
1020
304050
6070
8090
100
%
Figure 17Rates of Feeding Practices by Type of Feeding and by Sectors, 2000
51.958.4
51.9 56.354.4
62.7 61.5 60.6
36.3
21.1
47.7
27.2
84.9
97.8
78.2
93.4
0
20
40
60
80
100
120
Urban (N=237) Rural (N=778) Estate (N=112) National (N=1,127)
Timely first sucking rate
Full breastfeeding rate
Bottle feeding rate
Timely complementaryfeeding rate
Source: Senarath, U., Dibley, M. J., Godakandage, S., Jayawickrama, H., Wickramasinghe A., & Agho, K. E. (2010),“Determinants of Infant and Young Child Feeding Practices in Sri Lanka: Secondary Data Analysis of Demographic andHealth Survey 2000”, Food and Nutrition Bulletin,Vol. 31, No. 2, 352-365.
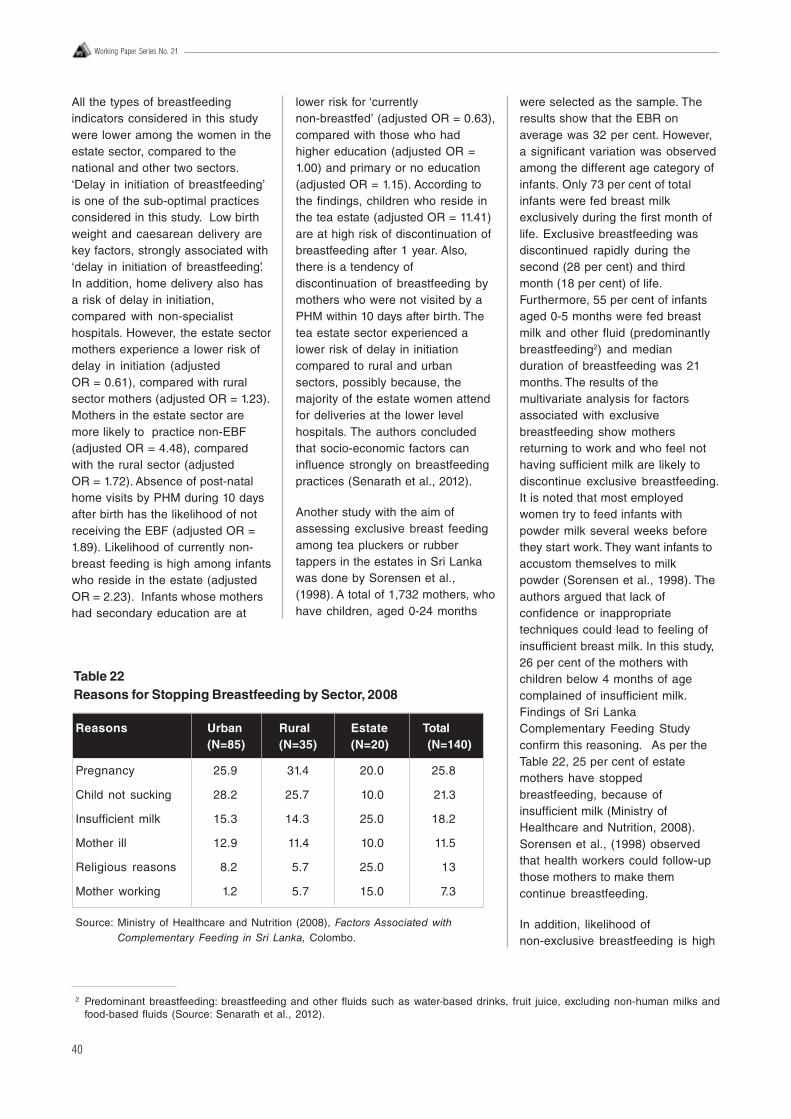
40
Working Paper Series No. 21
All the types of breastfeedingindicators considered in this studywere lower among the women in theestate sector, compared to thenational and other two sectors.‘Delay in initiation of breastfeeding’is one of the sub-optimal practicesconsidered in this study. Low birthweight and caesarean delivery arekey factors, strongly associated with‘delay in initiation of breastfeeding’.In addition, home delivery also hasa risk of delay in initiation,compared with non-specialisthospitals. However, the estate sectormothers experience a lower risk ofdelay in initiation (adjustedOR = 0.61), compared with ruralsector mothers (adjusted OR = 1.23).Mothers in the estate sector aremore likely to practice non-EBF(adjusted OR = 4.48), comparedwith the rural sector (adjustedOR = 1.72). Absence of post-natalhome visits by PHM during 10 daysafter birth has the likelihood of notreceiving the EBF (adjusted OR =1.89). Likelihood of currently non-breast feeding is high among infantswho reside in the estate (adjustedOR = 2.23). Infants whose mothershad secondary education are at
lower risk for ‘currentlynon-breastfed’ (adjusted OR = 0.63),compared with those who hadhigher education (adjusted OR =1.00) and primary or no education(adjusted OR = 1.15). According tothe findings, children who reside inthe tea estate (adjusted OR = 11.41)are at high risk of discontinuation ofbreastfeeding after 1 year. Also,there is a tendency ofdiscontinuation of breastfeeding bymothers who were not visited by aPHM within 10 days after birth. Thetea estate sector experienced alower risk of delay in initiationcompared to rural and urbansectors, possibly because, themajority of the estate women attendfor deliveries at the lower levelhospitals. The authors concludedthat socio-economic factors caninfluence strongly on breastfeedingpractices (Senarath et al., 2012).
Another study with the aim ofassessing exclusive breast feedingamong tea pluckers or rubbertappers in the estates in Sri Lankawas done by Sorensen et al.,(1998). A total of 1,732 mothers, whohave children, aged 0-24 months
were selected as the sample. Theresults show that the EBR onaverage was 32 per cent. However,a significant variation was observedamong the different age category ofinfants. Only 73 per cent of totalinfants were fed breast milkexclusively during the first month oflife. Exclusive breastfeeding wasdiscontinued rapidly during thesecond (28 per cent) and thirdmonth (18 per cent) of life.Furthermore, 55 per cent of infantsaged 0-5 months were fed breastmilk and other fluid (predominantlybreastfeeding2) and medianduration of breastfeeding was 21months. The results of themultivariate analysis for factorsassociated with exclusivebreastfeeding show mothersreturning to work and who feel nothaving sufficient milk are likely todiscontinue exclusive breastfeeding.It is noted that most employedwomen try to feed infants withpowder milk several weeks beforethey start work. They want infants toaccustom themselves to milkpowder (Sorensen et al., 1998). Theauthors argued that lack ofconfidence or inappropriatetechniques could lead to feeling ofinsufficient breast milk. In this study,26 per cent of the mothers withchildren below 4 months of agecomplained of insufficient milk.Findings of Sri LankaComplementary Feeding Studyconfirm this reasoning. As per theTable 22, 25 per cent of estatemothers have stoppedbreastfeeding, because ofinsufficient milk (Ministry ofHealthcare and Nutrition, 2008).Sorensen et al., (1998) observedthat health workers could follow-upthose mothers to make themcontinue breastfeeding.
In addition, likelihood ofnon-exclusive breastfeeding is high
2 Predominant breastfeeding: breastfeeding and other fluids such as water-based drinks, fruit juice, excluding non-human milks andfood-based fluids (Source: Senarath et al., 2012).
Table 22Reasons for Stopping Breastfeeding by Sector, 2008
Reasons Urban Rural Estate Total(N=85) (N=35) (N=20) (N=140)
Pregnancy 25.9 31.4 20.0 25.8
Child not sucking 28.2 25.7 10.0 21.3
Insufficient milk 15.3 14.3 25.0 18.2
Mother ill 12.9 11.4 10.0 11.5
Religious reasons 8.2 5.7 25.0 13
Mother working 1.2 5.7 15.0 7.3
Source: Ministry of Healthcare and Nutrition (2008), Factors Associated withComplementary Feeding in Sri Lanka, Colombo.
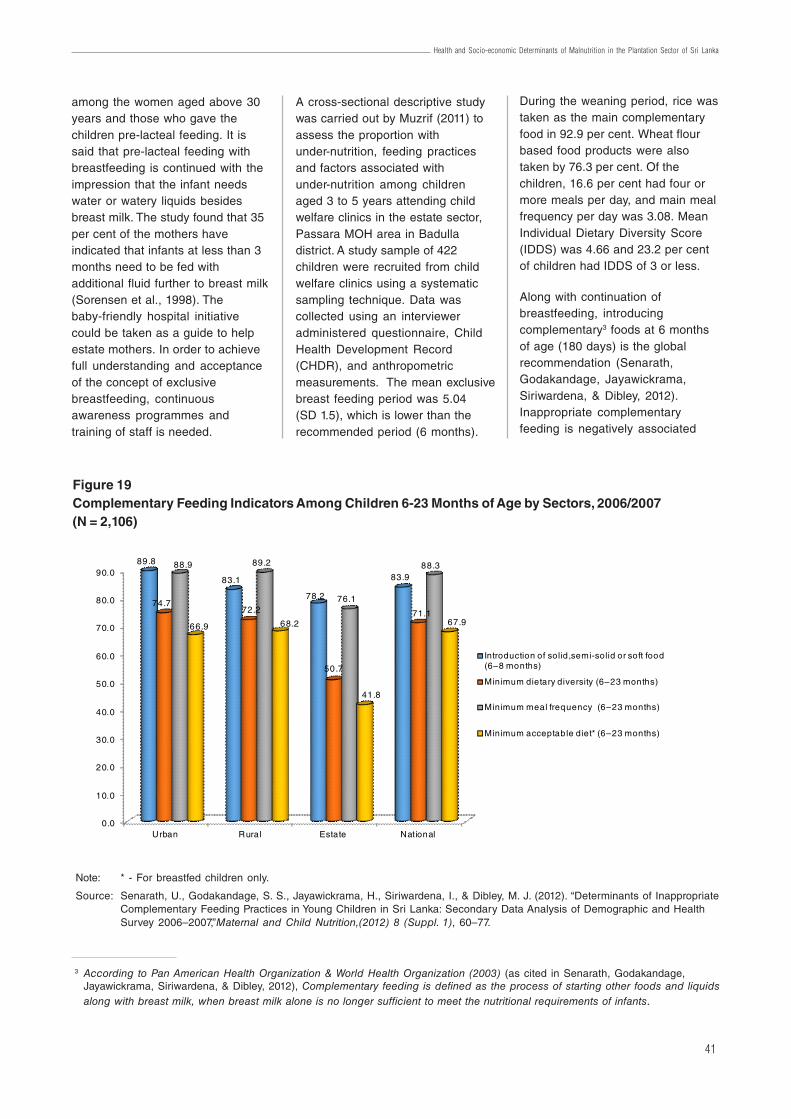
41
Health and Socio-economic Determinants of Malnutrition in the Plantation Sector of Sri Lanka
among the women aged above 30years and those who gave thechildren pre-lacteal feeding. It issaid that pre-lacteal feeding withbreastfeeding is continued with theimpression that the infant needswater or watery liquids besidesbreast milk. The study found that 35per cent of the mothers haveindicated that infants at less than 3months need to be fed withadditional fluid further to breast milk(Sorensen et al., 1998). Thebaby-friendly hospital initiativecould be taken as a guide to helpestate mothers. In order to achievefull understanding and acceptanceof the concept of exclusivebreastfeeding, continuousawareness programmes andtraining of staff is needed.
A cross-sectional descriptive studywas carried out by Muzrif (2011) toassess the proportion withunder-nutrition, feeding practicesand factors associated withunder-nutrition among childrenaged 3 to 5 years attending childwelfare clinics in the estate sector,Passara MOH area in Badulladistrict. A study sample of 422children were recruited from childwelfare clinics using a systematicsampling technique. Data wascollected using an intervieweradministered questionnaire, ChildHealth Development Record(CHDR), and anthropometricmeasurements. The mean exclusivebreast feeding period was 5.04(SD 1.5), which is lower than therecommended period (6 months).
During the weaning period, rice wastaken as the main complementaryfood in 92.9 per cent. Wheat flourbased food products were alsotaken by 76.3 per cent. Of thechildren, 16.6 per cent had four ormore meals per day, and main mealfrequency per day was 3.08. MeanIndividual Dietary Diversity Score(IDDS) was 4.66 and 23.2 per centof children had IDDS of 3 or less.
Along with continuation ofbreastfeeding, introducingcomplementary3 foods at 6 monthsof age (180 days) is the globalrecommendation (Senarath,Godakandage, Jayawickrama,Siriwardena, & Dibley, 2012).Inappropriate complementaryfeeding is negatively associated
3 According to Pan American Health Organization & World Health Organization (2003) (as cited in Senarath, Godakandage,Jayawickrama, Siriwardena, & Dibley, 2012), Complementary feeding is defined as the process of starting other foods and liquidsalong with breast milk, when breast milk alone is no longer sufficient to meet the nutritional requirements of infants.
Figure 19Complementary Feeding Indicators Among Children 6-23 Months of Age by Sectors, 2006/2007(N = 2,106)
Note: * - For breastfed children only.
Source: Senarath, U., Godakandage, S. S., Jayawickrama, H., Siriwardena, I., & Dibley, M. J. (2012). “Determinants of InappropriateComplementary Feeding Practices in Young Children in Sri Lanka: Secondary Data Analysis of Demographic and HealthSurvey 2006–2007,”Maternal and Child Nutrition,(2012) 8 (Suppl. 1), 60–77.
0.0
10.0
20.0
30.0
40.0
50.0
60.0
70.0
80.0
90.0
Urban Rural Estate National
89.8
83.1
78.2
83.9
74.772.2
50.7
71.1
88.9 89.2
76.1
88.3
66.9 68.2
41.8
67.9
Introduction of solid,semi-solid or soft food (6–8 months)
Minimum dietary diversity (6–23 months)
Minimum meal frequency (6–23 months)
Minimum acceptable diet* (6–23 months)
42
Working Paper Series No. 21
with improving nutritional status ofchildren and infants. According tothe DHS 2006/7 secondaryanalysis, the urban and ruralsectors show better complementaryfeeding indicators (Definitions aregiven in the glossary), compared tothe estate sector (refer Figure 19).Of children aged 6-8 months in theurban sector, 89.8 per cent ofchildren have been introducedcomplementary food on time. Thisindicator for the rural and estatesectors was 83.1 per cent and 78.2per cent, respectively. However,there was no significant differenceamong sectors (Senarath,Godakandage, Jayawickrama,Siriwardena, & Dibley, 2012).Nevertheless, introducingcomplementary feeding issignificantly associated with BMI ofmothers of infants. Mothers whoseBMI is ≥ 25 introducedcomplementary feeding for 91.5 percent of children, while those withnormal BMI introducedcomplementary feeding for 74.8 percent of children on time. In addition,an interesting finding is that,exposure to the media by mother isgreatly associated with theintroduction of complementaryfeeding practice. For instance,mothers with ‘satisfactory’ exposureto the media and ‘limited’ exposureto media had given solid/semi solid/soft food for 86.6 per cent and 69.1per cent of infants, respectively.
As in the Figure 19, significantly alower percentage of children in theestate sector received a diverse diet(50.7 per cent), compared to urban(74.7 per cent), and rural (72.2 percent) sectors. Hence, children (6-23years) in the estate sector were at agreater risk for inappropriate dietarydiversity (adjusted OR = 2.38),compared to the children in theurban sector. Sri LankaComplementary Feeding Survey(2008) also found that mothers’knowledge about diversity ofcomplementary feeding is slightly
lower in the estate mothers (28 percent), compared to the mothers inthe urban (33.3 per cent) and rural(33.5 per cent) sectors (Ministry ofHealthcare and Nutrition, 2008). It isfound that ‘working mother’, is aprotective factor for dietary diversity(adjusted OR = 0.71). Comparedwith mothers with higher levels ofeducation, those who hadcompleted up to secondaryeducation or no schooling reporteda higher risk for poor diversity (ORbeing 1.97 and 1.48, respectively).In addition, absence of post-natalhome visits by the PHM, and fewerantenatal clinic (ANC) visits alsohave significant influence againstproper diverse diet. Mothers’non-involvement in householddecisions was also found as a riskfactor for inappropriate dietarydiversity (adjusted OR = 1.33). SriLanka Complementary FeedingSurvey (2008) also revealed that theestate mothers are more vulnerablefor not concerning the food density.Only 4.8 per cent of mothers in theestate sector are concerned aboutdensity/consistency ofcomplementary food, compared tothe mothers from the other twosectors, 8.1 per cent from urban and7.4 per cent from rural (Ministry ofHealthcare and Nutrition, 2008).
Minimum meal frequency in theurban (88.9 per cent) and rural (89.2per cent) sectors were higher,compared to the national level (88.3per cent). This is low in the estatesector (76.1 per cent). However, thefindings did not show anyassociation between sectors andinadequate meal frequency(Senarath, Godakandage,Jayawickrama, Siriwardena, &Dibley, 2012). Children at youngerages (aged 6-11 months and 12-17months) are more likely forinadequate meal frequency.Particularly, factors such as lowmaternal BMI (adjusted OR = 1.60),limited exposure to media (adjustedOR = 1.55), less ANC visits and no
antenatal home visits (adjusted OR= 1.85) are highly associated withinadequate meal frequency.
Likelihood of not receivingadequate acceptable diet is high forthe children, who live in the estatesector (adjusted OR = 2.04),compared to the rural sector(adjusted OR = 0.82). Child havingacute respiratory infection (past twoweeks) (adjusted OR = 2.13), lowermaternal education (adjusted OR forsecondary = 1.84; no schooling= 1.48), shorter maternal height(adjusted OR for 150–155 cm= 1.34), lower wealth index(adjusted OR for poorest =1.45),limited media exposure of mother(adjusted OR = 1.36), and lack ofpost-natal visit (adjusted OR = 1.71)are also significantly and positivelyassociated with inadequateacceptable diet (Senarath,Godakandage, Jayawickrama,Siriwardena, & Dibley, 2012). Theyconcluded that lack of dietarydiversity for younger children,especially those aged 6–11 months,lack of protein-rich food and fruits inthe diet, maternal education level,household wealth, and exposure tomedia by mothers are the keydeterminants of complementaryfeeding in Sri Lanka.
7.4 Other FactorsGamagedara (2012) carried out asurvey in the estate community ofBadulla district to identifydeterminants of chronic under-nutrition, among children less thanfive years of age. A matched casecontrol study was undertakenamong 260 cases, and 260 controls.There was significant association ofunder-nutrition with five variables,which are low birth weight(< 2500g), three or more children inthe family, mother’s pre-pregnancyBMI < 18.5 kg/m2, low educationallevel of father, and the absence of
43
Health and Socio-economic Determinants of Malnutrition in the Plantation Sector of Sri Lanka
home gardening. Attributable riskpercentages of each of the abovevariables are 88.8 per cent for lowbirth weight, 37.1 per cent for threeor more children, and 10.7 per centfor mother’s pre-pregnancy BMI <18.5 kg/m2 and 22.5per cent forfather’s low level of education.
Jayawardene (2012) analyzedmicro data of DHS 2006/07 toevaluate the socio-economicdeterminants and inequalities inchildhood malnutrition in Sri Lanka.She found that a child belonging toa lower economic class has ahigher chance of being stunted andunderweight. As per the findings, outof children under 5 years in theestate sector, 40 per cent arestunted while, 30 per cent areunderweight. But, prevalence ofbeing wasted is 15 per cent innational, rural, and estate sectors,while the urban sector defersslightly (14 per cent). Further, lowbirth weight in the estate sector isalso substantially higher –approximately one in 3 children inthe estate sector and one in 6children in urban, rural, andnational levels are born with lowbirth weight. In addition, the authormeasured the Concentrations Index(CI) to show the socio-economicinequity. As per the findings,socio-economic related inequality inchild malnutrition in the estatesector is low compared to the othertwo regions. For instance, CI forstunted in the estate sector is -0.08while the same indicator in the rural(-0.21) and urban (-0.27) sectors isconsiderably higher.
Almost 63 per cent of householdsfall into the poorest category inestates. In the urban and ruralsectors, this is 8 per cent and 19per cent respectively (Jayawardena,2012). Furthermore, children who
reside in Uva, Central, and Easternprovinces have significantly higherrisk of being malnourished. Findingsshow that poor sanitary conditionsincrease the risk of chronicunder-nutrition significantly. Safedrinking water was not available forabout 17 per cent, and 22 per centhave no access to water sealedlatrines in the estate sector. Pooreducational status of mothersincreased the risk of long-termgrowth failures. This is supported bythe low education level of womenaged 15-49 years in estates (46 percent below primary education).Ratnayake & Weerahewa (2005)also studied the determinants ofnutritional status among 1,764pre-school children (between 3-59months), representing 23 districts,excluding Killinochchi andMullaitivu districts. The analysiswas based on Sri Lanka IntegratedSurvey (SLIS) conducted betweenOctober 1999 and the third quarterof 2000 by the World Bank. Theindicator, weight for age(underweight) was used to measurethe nutritional status of children. Theresults found that 28 per cent ofchildren are underweight. Of this,the highest incidence, depth andseverity of underweight children isreported from Sabaragamuwaprovince (incidence = 0.46;depth = 0.33; severity = 0.43). Uvaprovince reported the secondhighest incidence (0.35), while thesecond highest depth (0.30) andseverity (0.38) was reported fromthe North Western province. Amongthe sectors, the estate sectorreported the highest incidence (44per cent), compared to the ruralsector (31 per cent). The factorssuch as area of residence,household size, age of the child,mother’s education, birth weight ofchild, and household income, aresignificantly associated with
malnutrition of pre-school children(Ratnayake & Weerahewa, 2005).
Based on the data from severalnational surveys Rannan-Eliya atel., (2012) analyzed the trends anddeterminants of child under-nutritionin Sri Lanka. They used the datafrom DHS (1987 to 2006/07) andNFSS (2009). The nutritionalindicators were re-estimatedaccording to 2006 WHO growthstandards. The trend analysis foundthat stunting and underweight hasreduced substantially from 1987 to2000. However, there was littlechange from year 2000 to 2006/07.Wasting did not show any realreduction (wasting among 3-59months old children for 1993, 2000,and 2006/07 were 15 per cent, 16.3per cent, and 14.2 per centrespectively). Both stunting andunderweight were concentrated inthe central hill country, the highestbeing in the estate sector and alsoamong the Indian Tamils comparedto other ethnic groups. According tothe study, stunting and underweightare higher in male children, multiplebirth and impoverishment (wealthindex is considered as a proxy fordefining the impoverishment) of thefamily, but decrease with maternaleducation. Birth weight was found tohave a positive effect on height ofthe child, while altitude has anegative effect.
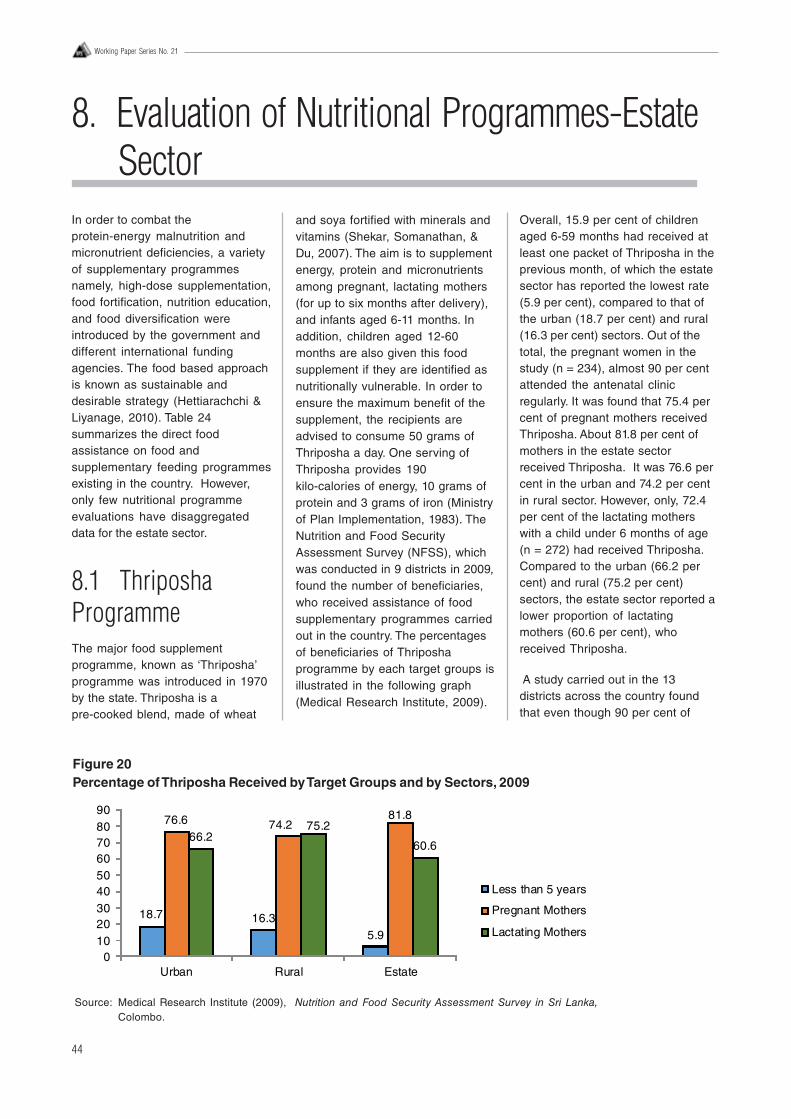
44
Working Paper Series No. 21
8. Evaluation of Nutritional Programmes-EstateSector
In order to combat theprotein-energy malnutrition andmicronutrient deficiencies, a varietyof supplementary programmesnamely, high-dose supplementation,food fortification, nutrition education,and food diversification wereintroduced by the government anddifferent international fundingagencies. The food based approachis known as sustainable anddesirable strategy (Hettiarachchi &Liyanage, 2010). Table 24summarizes the direct foodassistance on food andsupplementary feeding programmesexisting in the country. However,only few nutritional programmeevaluations have disaggregateddata for the estate sector.
8.1 ThriposhaProgrammeThe major food supplementprogramme, known as ‘Thriposha’programme was introduced in 1970by the state. Thriposha is apre-cooked blend, made of wheat
Overall, 15.9 per cent of childrenaged 6-59 months had received atleast one packet of Thriposha in theprevious month, of which the estatesector has reported the lowest rate(5.9 per cent), compared to that ofthe urban (18.7 per cent) and rural(16.3 per cent) sectors. Out of thetotal, the pregnant women in thestudy (n = 234), almost 90 per centattended the antenatal clinicregularly. It was found that 75.4 percent of pregnant mothers receivedThriposha. About 81.8 per cent ofmothers in the estate sectorreceived Thriposha. It was 76.6 percent in the urban and 74.2 per centin rural sector. However, only, 72.4per cent of the lactating motherswith a child under 6 months of age(n = 272) had received Thriposha.Compared to the urban (66.2 percent) and rural (75.2 per cent)sectors, the estate sector reported alower proportion of lactatingmothers (60.6 per cent), whoreceived Thriposha.
A study carried out in the 13districts across the country foundthat even though 90 per cent of
and soya fortified with minerals andvitamins (Shekar, Somanathan, &Du, 2007). The aim is to supplementenergy, protein and micronutrientsamong pregnant, lactating mothers(for up to six months after delivery),and infants aged 6-11 months. Inaddition, children aged 12-60months are also given this foodsupplement if they are identified asnutritionally vulnerable. In order toensure the maximum benefit of thesupplement, the recipients areadvised to consume 50 grams ofThriposha a day. One serving ofThriposha provides 190kilo-calories of energy, 10 grams ofprotein and 3 grams of iron (Ministryof Plan Implementation, 1983). TheNutrition and Food SecurityAssessment Survey (NFSS), whichwas conducted in 9 districts in 2009,found the number of beneficiaries,who received assistance of foodsupplementary programmes carriedout in the country. The percentagesof beneficiaries of Thriposhaprogramme by each target groups isillustrated in the following graph(Medical Research Institute, 2009).
18.7 16.35.9
76.6 74.281.8
66.275.2
60.6
0102030405060708090
Urban Rural Estate
Less than 5 years
Pregnant Mothers
Lactating Mothers
Figure 20Percentage of Thriposha Received by Target Groups and by Sectors, 2009
Source: Medical Research Institute (2009), Nutrition and Food Security Assessment Survey in Sri Lanka,Colombo.
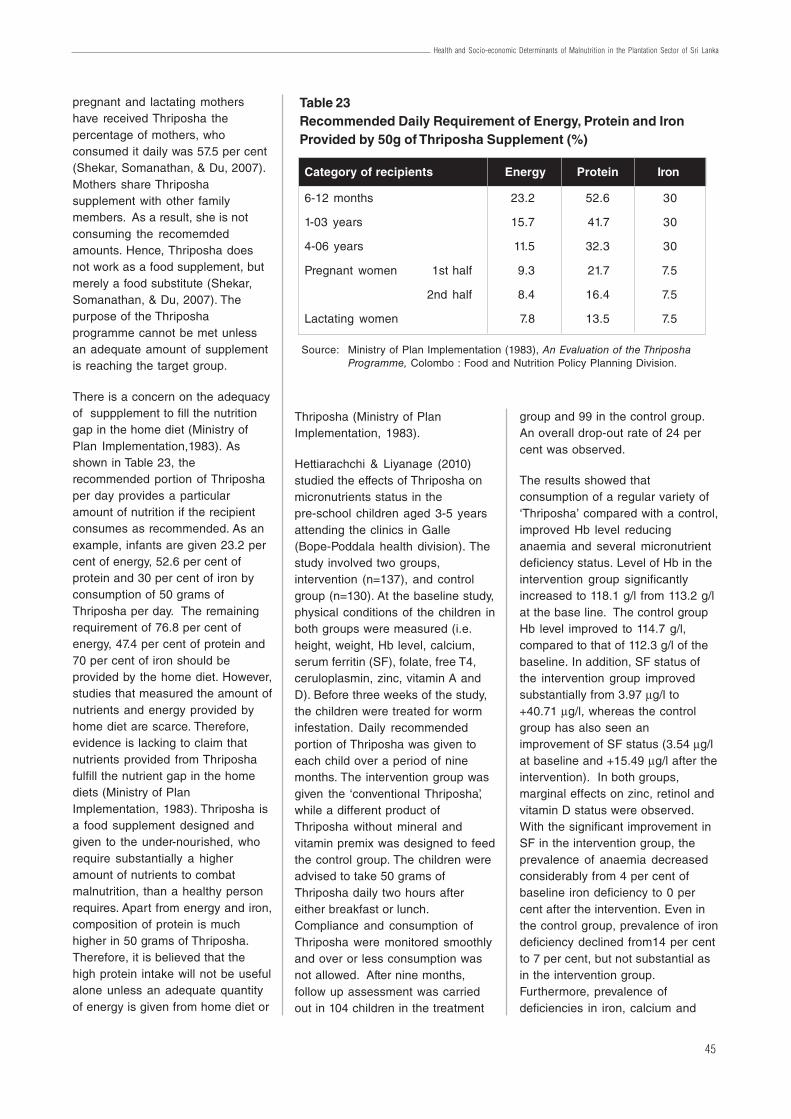
45
Health and Socio-economic Determinants of Malnutrition in the Plantation Sector of Sri Lanka
pregnant and lactating mothershave received Thriposha thepercentage of mothers, whoconsumed it daily was 57.5 per cent(Shekar, Somanathan, & Du, 2007).Mothers share Thriposhasupplement with other familymembers. As a result, she is notconsuming the recomemdedamounts. Hence, Thriposha doesnot work as a food supplement, butmerely a food substitute (Shekar,Somanathan, & Du, 2007). Thepurpose of the Thriposhaprogramme cannot be met unlessan adequate amount of supplementis reaching the target group.
There is a concern on the adequacyof suppplement to fill the nutritiongap in the home diet (Ministry ofPlan Implementation,1983). Asshown in Table 23, therecommended portion of Thriposhaper day provides a particularamount of nutrition if the recipientconsumes as recommended. As anexample, infants are given 23.2 percent of energy, 52.6 per cent ofprotein and 30 per cent of iron byconsumption of 50 grams ofThriposha per day. The remainingrequirement of 76.8 per cent ofenergy, 47.4 per cent of protein and70 per cent of iron should beprovided by the home diet. However,studies that measured the amount ofnutrients and energy provided byhome diet are scarce. Therefore,evidence is lacking to claim thatnutrients provided from Thriposhafulfill the nutrient gap in the homediets (Ministry of PlanImplementation, 1983). Thriposha isa food supplement designed andgiven to the under-nourished, whorequire substantially a higheramount of nutrients to combatmalnutrition, than a healthy personrequires. Apart from energy and iron,composition of protein is muchhigher in 50 grams of Thriposha.Therefore, it is believed that thehigh protein intake will not be usefulalone unless an adequate quantityof energy is given from home diet or
Thriposha (Ministry of PlanImplementation, 1983).
Hettiarachchi & Liyanage (2010)studied the effects of Thriposha onmicronutrients status in thepre-school children aged 3-5 yearsattending the clinics in Galle(Bope-Poddala health division). Thestudy involved two groups,intervention (n=137), and controlgroup (n=130). At the baseline study,physical conditions of the children inboth groups were measured (i.e.height, weight, Hb level, calcium,serum ferritin (SF), folate, free T4,ceruloplasmin, zinc, vitamin A andD). Before three weeks of the study,the children were treated for worminfestation. Daily recommendedportion of Thriposha was given toeach child over a period of ninemonths. The intervention group wasgiven the ‘conventional Thriposha’,while a different product ofThriposha without mineral andvitamin premix was designed to feedthe control group. The children wereadvised to take 50 grams ofThriposha daily two hours aftereither breakfast or lunch.Compliance and consumption ofThriposha were monitored smoothlyand over or less consumption wasnot allowed. After nine months,follow up assessment was carriedout in 104 children in the treatment
group and 99 in the control group.An overall drop-out rate of 24 percent was observed.
The results showed thatconsumption of a regular variety of‘Thriposha’ compared with a control,improved Hb level reducinganaemia and several micronutrientdeficiency status. Level of Hb in theintervention group significantlyincreased to 118.1 g/l from 113.2 g/lat the base line. The control groupHb level improved to 114.7 g/l,compared to that of 112.3 g/l of thebaseline. In addition, SF status ofthe intervention group improvedsubstantially from 3.97 μg/l to+40.71 μg/l, whereas the controlgroup has also seen animprovement of SF status (3.54 μg/lat baseline and +15.49 μg/l after theintervention). In both groups,marginal effects on zinc, retinol andvitamin D status were observed.With the significant improvement inSF in the intervention group, theprevalence of anaemia decreasedconsiderably from 4 per cent ofbaseline iron deficiency to 0 percent after the intervention. Even inthe control group, prevalence of irondeficiency declined from14 per centto 7 per cent, but not substantial asin the intervention group.Furthermore, prevalence ofdeficiencies in iron, calcium and
Table 23Recommended Daily Requirement of Energy, Protein and IronProvided by 50g of Thriposha Supplement (%)
Category of recipients Energy Protein Iron
6-12 months 23.2 52.6 30
1-03 years 15.7 41.7 30
4-06 years 11.5 32.3 30
Pregnant women 1st half 9.3 21.7 7.5
2nd half 8.4 16.4 7.5
Lactating women 7.8 13.5 7.5
Source: Ministry of Plan Implementation (1983), An Evaluation of the ThriposhaProgramme, Colombo : Food and Nutrition Policy Planning Division.
46
Working Paper Series No. 21
ceruloplasmin were much less inthe intervention group than in thecontrol group.
An earlier study was conducted tomeasure the effectiveness ofThriposha and supplementationinterventions under the fieldconditions and outcome ofpregnancy (Atukorala, De Silva,Dechering, Dassenaeike, & Perera,1994). A sample of 195 pregnant teaplantation workers (14-24 weekgestation) in five plantation regionsin hill areas, that belong to the SriLanka State Plantation Corporationwas studied. Two packets,containing 750 gram of fortified foodsupplement (Thriposha), were givento each woman per month, at theantenatal clinic. The recommendedintake per day is 50 grams, whichwould give an average energycontent of 753 kJ (180 kcal), 10 ghigh quality protein, 9 g Fe, and 20mg ascorbic acid. It was observedthat distribution of food supplementto the pregnant women varied. Outof the pregnant mothers studied,12.3 per cent of women (24subjects) had not received any foodsupplement. Another 31.3 per cent ofwomen (61 subjects) received foodsupplements below 10 wk ofpregnancy. Also, 52.3 per cent ofwomen got the supplement at theirpregnancy period of 10-24 wk. It wasseen that the expected distributionof food supplements does nothappen at field conditions. Hence,the amount consumed by thepregnant women varied and it is notadvisable to quantify per day intakeof mothers according to theprescribed 50 g per day. Intendedeffect of the intervention may not beachieved due to such logisticissues.
Apart from the food supplement, thepregnant women are being giventhe oral iron folate supplement andoral anthelminthic therapy (courseof mebendazole) after the first
trimester of pregnancy, at theantenatal clinics. The pregnantmothers were told about thesubstance contained in the tabletswith instructions about intake ofmedicines. However, they were noteducated on the importance oftaking these medications. Theresults of the study did not reflect apositive impact on the pregnancyoutcome. There was no significantassociation between foodsupplement and weight gain orchange in mid-arm circumference(MUAC). In addition, no significantrelationship between access to thefood supplement by pregnantwomen, and birth weight,haemoglobin concentration wasseen. Weight gain of pregnantmothers before and after 14 wk ofpregnancy was 0.25-+0.18 kg/wk.Mothers were followed up after 14weeks , of which, 46.9 per cent hadweight gain of <0.2 kg/month. TheirMUAC had also reducedsignificantly. The prevalence ofanaemia of the first and secondassessments was 65.4 per cent, and59.2 per cent, respectively. Theeffectiveness of these interventionson the target group could beincreased further if the mothersfollowed the instructions properlyand systematic distribution of foodsupplement. The authors suggestedtwo vital changes of the foodsupplement programme to be done.First, better outcomes could beobtained from the food supplementby increasing energy valuecontained in Thiposha rather thanjust providing Thriposha as asupplementation. Secondly, thepregnant mothers can benefitsubstantially from the iron-folatesupplementation programme, whenthe duration of supplementation isincreased than the dose frequencyincreased.
8.2 FortifiedCorn-Soya Blend(CSB)During 2002-06, the World FoodProgramme (WFP) has carried out a‘maternal and child nutritionprogram’ in 33 MOH areas. Theytargeted pregnant, lactating mothersand children living in areasidentified as food insecure. Themain objectives were to improveknowledge of expectant andlactating mothers on nutrition andthe health needs of their children. Inaddition, the programmeencouraged communitypartnerships with local NGOs andhealth care providers to improve theprovision of nutrition services(Shekar, Somanathan, & Du, 2007).Fortified corn soya blend (CSB) wasdistributed among 93,241 peoplecomprising pregnant and lactatingmothers and children aged 6months to 3 years. According to thefindings at the end of theprogramme, no significant effectswere observed in the interventiongroup, who received ‘foodsupplements’ and ‘behaviourchange communication intervention’.The prevalence of both underweightand stunting declined in bothintervention and control areas, andbreastfeeding and complementaryfeeding also improved. However, noimprovement occurred in thepopulation’s knowledge with regardto foods rich in micronutrients orother food related issues. One of thekey reasons for not achieving theintended outcomes/impacts was theinability to target the mostvulnerable groups for theintervention. In addition,effectiveness of food supplementscould be also limited by the lack ofadditional supplements forthemselves (Shekar, Somanathan, &Du, 2007).
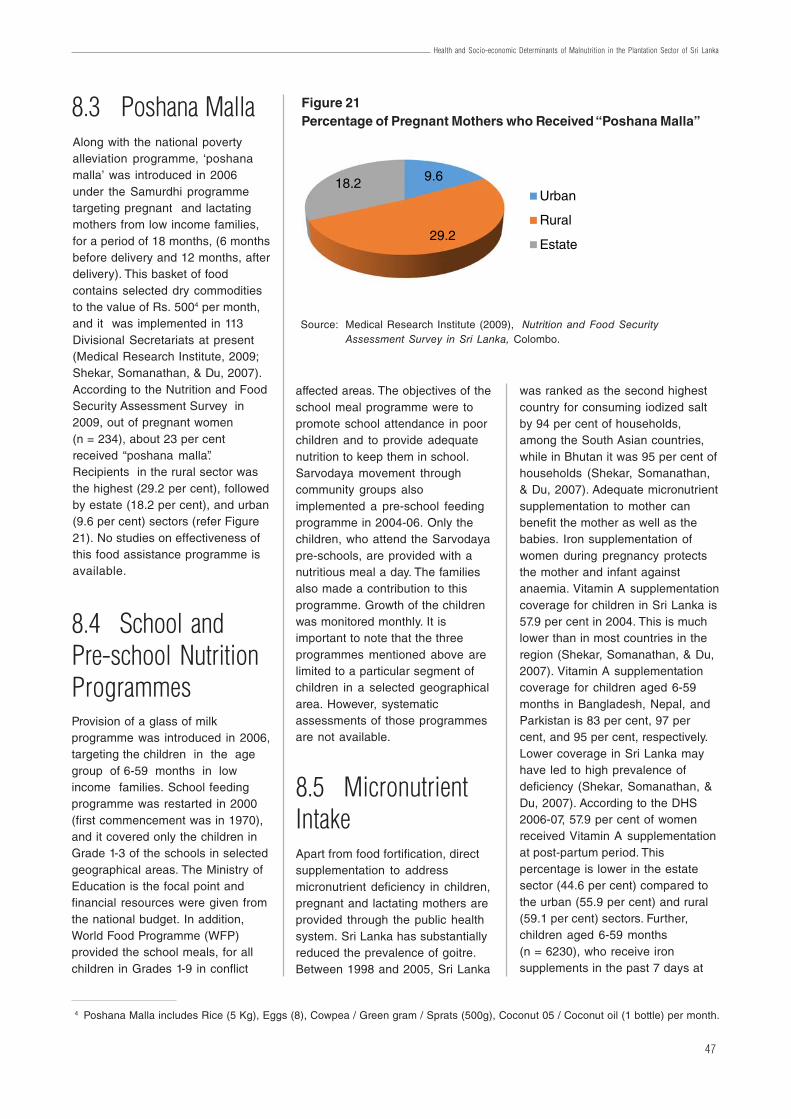
47
Health and Socio-economic Determinants of Malnutrition in the Plantation Sector of Sri Lanka
8.3 Poshana MallaAlong with the national povertyalleviation programme, ‘poshanamalla’ was introduced in 2006under the Samurdhi programmetargeting pregnant and lactatingmothers from low income families,for a period of 18 months, (6 monthsbefore delivery and 12 months, afterdelivery). This basket of foodcontains selected dry commoditiesto the value of Rs. 5004 per month,and it was implemented in 113Divisional Secretariats at present(Medical Research Institute, 2009;Shekar, Somanathan, & Du, 2007).According to the Nutrition and FoodSecurity Assessment Survey in2009, out of pregnant women(n = 234), about 23 per centreceived “poshana malla”.Recipients in the rural sector wasthe highest (29.2 per cent), followedby estate (18.2 per cent), and urban(9.6 per cent) sectors (refer Figure21). No studies on effectiveness ofthis food assistance programme isavailable.
8.4 School andPre-school NutritionProgrammesProvision of a glass of milkprogramme was introduced in 2006,targeting the children in the agegroup of 6-59 months in lowincome families. School feedingprogramme was restarted in 2000(first commencement was in 1970),and it covered only the children inGrade 1-3 of the schools in selectedgeographical areas. The Ministry ofEducation is the focal point andfinancial resources were given fromthe national budget. In addition,World Food Programme (WFP)provided the school meals, for allchildren in Grades 1-9 in conflict
affected areas. The objectives of theschool meal programme were topromote school attendance in poorchildren and to provide adequatenutrition to keep them in school.Sarvodaya movement throughcommunity groups alsoimplemented a pre-school feedingprogramme in 2004-06. Only thechildren, who attend the Sarvodayapre-schools, are provided with anutritious meal a day. The familiesalso made a contribution to thisprogramme. Growth of the childrenwas monitored monthly. It isimportant to note that the threeprogrammes mentioned above arelimited to a particular segment ofchildren in a selected geographicalarea. However, systematicassessments of those programmesare not available.
8.5 MicronutrientIntakeApart from food fortification, directsupplementation to addressmicronutrient deficiency in children,pregnant and lactating mothers areprovided through the public healthsystem. Sri Lanka has substantiallyreduced the prevalence of goitre.Between 1998 and 2005, Sri Lanka
was ranked as the second highestcountry for consuming iodized saltby 94 per cent of households,among the South Asian countries,while in Bhutan it was 95 per cent ofhouseholds (Shekar, Somanathan,& Du, 2007). Adequate micronutrientsupplementation to mother canbenefit the mother as well as thebabies. Iron supplementation ofwomen during pregnancy protectsthe mother and infant againstanaemia. Vitamin A supplementationcoverage for children in Sri Lanka is57.9 per cent in 2004. This is muchlower than in most countries in theregion (Shekar, Somanathan, & Du,2007). Vitamin A supplementationcoverage for children aged 6-59months in Bangladesh, Nepal, andParkistan is 83 per cent, 97 percent, and 95 per cent, respectively.Lower coverage in Sri Lanka mayhave led to high prevalence ofdeficiency (Shekar, Somanathan, &Du, 2007). According to the DHS2006-07, 57.9 per cent of womenreceived Vitamin A supplementationat post-partum period. Thispercentage is lower in the estatesector (44.6 per cent) compared tothe urban (55.9 per cent) and rural(59.1 per cent) sectors. Further,children aged 6-59 months(n = 6230), who receive ironsupplements in the past 7 days at
4 Poshana Malla includes Rice (5 Kg), Eggs (8), Cowpea / Green gram / Sprats (500g), Coconut 05 / Coconut oil (1 bottle) per month.
Figure 21Percentage of Pregnant Mothers who Received “Poshana Malla”
Source: Medical Research Institute (2009), Nutrition and Food SecurityAssessment Survey in Sri Lanka, Colombo.
9.6
29.2
18.2Urban
Rural
Estate
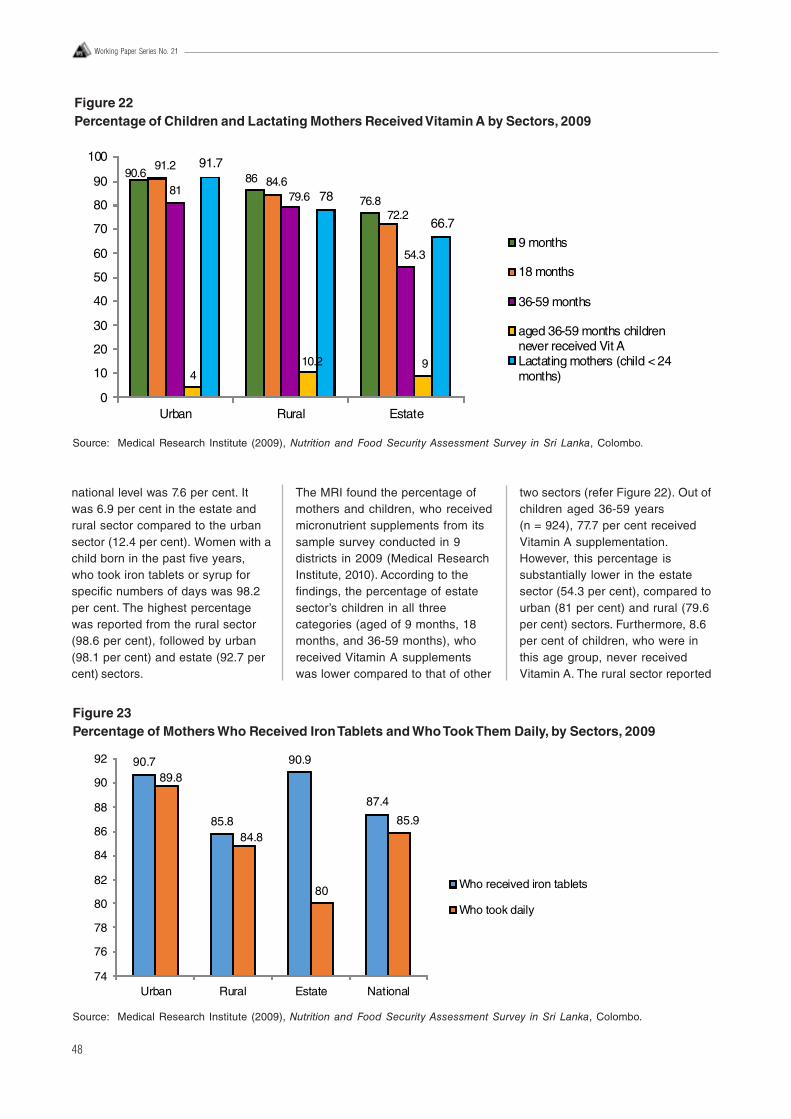
48
Working Paper Series No. 21
national level was 7.6 per cent. Itwas 6.9 per cent in the estate andrural sector compared to the urbansector (12.4 per cent). Women with achild born in the past five years,who took iron tablets or syrup forspecific numbers of days was 98.2per cent. The highest percentagewas reported from the rural sector(98.6 per cent), followed by urban(98.1 per cent) and estate (92.7 percent) sectors.
The MRI found the percentage ofmothers and children, who receivedmicronutrient supplements from itssample survey conducted in 9districts in 2009 (Medical ResearchInstitute, 2010). According to thefindings, the percentage of estatesector’s children in all threecategories (aged of 9 months, 18months, and 36-59 months), whoreceived Vitamin A supplementswas lower compared to that of other
two sectors (refer Figure 22). Out ofchildren aged 36-59 years(n = 924), 77.7 per cent receivedVitamin A supplementation.However, this percentage issubstantially lower in the estatesector (54.3 per cent), compared tourban (81 per cent) and rural (79.6per cent) sectors. Furthermore, 8.6per cent of children, who were inthis age group, never receivedVitamin A. The rural sector reported
Figure 22Percentage of Children and Lactating Mothers Received Vitamin A by Sectors, 2009
Source: Medical Research Institute (2009), Nutrition and Food Security Assessment Survey in Sri Lanka, Colombo.
90.6 86
76.8
91.284.6
72.2
81 79.6
54.3
410.2 9
91.7
78
66.7
0
10
20
30
40
50
60
70
80
90
100
Urban Rural Estate
9 months
18 months
36-59 months
aged 36-59 months childrennever received Vit ALactating mothers (child < 24months)
Figure 23Percentage of Mothers Who Received Iron Tablets and Who Took Them Daily, by Sectors, 2009
Source: Medical Research Institute (2009), Nutrition and Food Security Assessment Survey in Sri Lanka, Colombo.
90.7
85.8
90.9
87.4
89.8
84.8
80
85.9
74
76
78
80
82
84
86
88
90
92
Urban Rural Estate National
Who received iron tablets
Who took daily
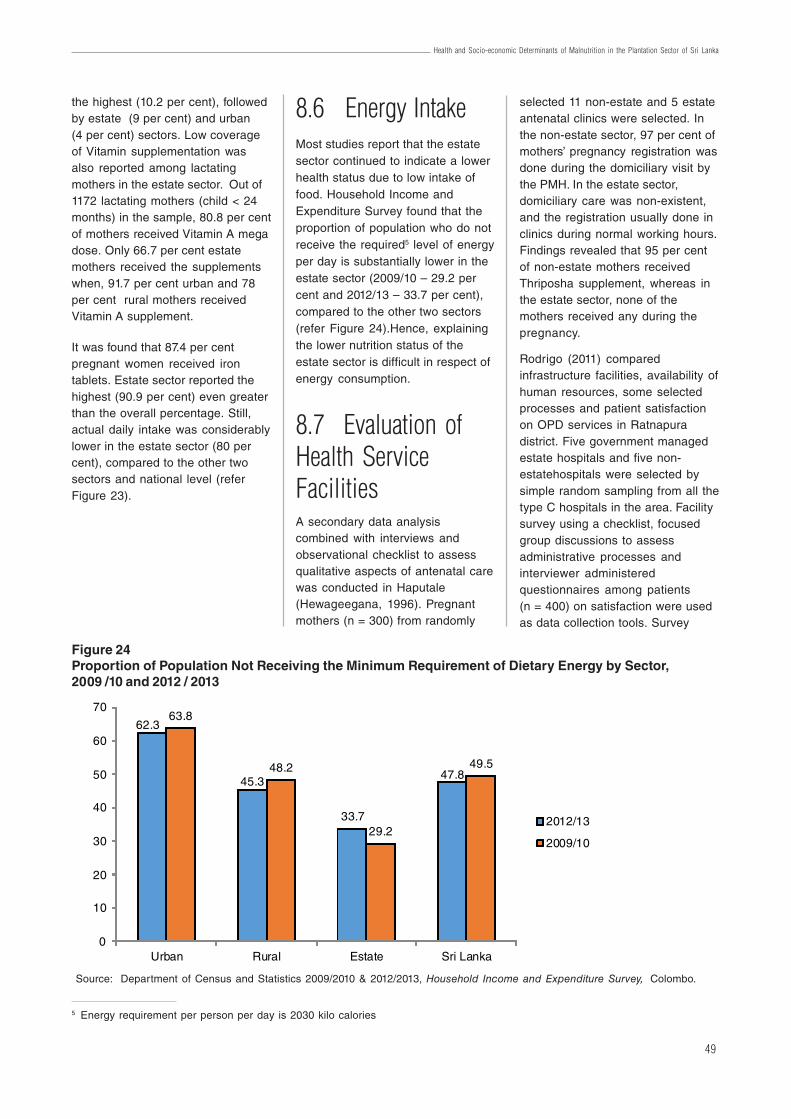
49
Health and Socio-economic Determinants of Malnutrition in the Plantation Sector of Sri Lanka
the highest (10.2 per cent), followedby estate (9 per cent) and urban(4 per cent) sectors. Low coverageof Vitamin supplementation wasalso reported among lactatingmothers in the estate sector. Out of1172 lactating mothers (child < 24months) in the sample, 80.8 per centof mothers received Vitamin A megadose. Only 66.7 per cent estatemothers received the supplementswhen, 91.7 per cent urban and 78per cent rural mothers receivedVitamin A supplement.
It was found that 87.4 per centpregnant women received irontablets. Estate sector reported thehighest (90.9 per cent) even greaterthan the overall percentage. Still,actual daily intake was considerablylower in the estate sector (80 percent), compared to the other twosectors and national level (referFigure 23).
8.6 Energy IntakeMost studies report that the estatesector continued to indicate a lowerhealth status due to low intake offood. Household Income andExpenditure Survey found that theproportion of population who do notreceive the required5 level of energyper day is substantially lower in theestate sector (2009/10 – 29.2 percent and 2012/13 – 33.7 per cent),compared to the other two sectors(refer Figure 24).Hence, explainingthe lower nutrition status of theestate sector is difficult in respect ofenergy consumption.
5 Energy requirement per person per day is 2030 kilo calories
8.7 Evaluation ofHealth ServiceFacilitiesA secondary data analysiscombined with interviews andobservational checklist to assessqualitative aspects of antenatal carewas conducted in Haputale(Hewageegana, 1996). Pregnantmothers (n = 300) from randomly
Figure 24Proportion of Population Not Receiving the Minimum Requirement of Dietary Energy by Sector,2009 /10 and 2012 / 2013
62.3
45.3
33.7
47.8
63.8
48.2
29.2
49.5
0
10
20
30
40
50
60
70
Urban Rural Estate Sri Lanka
2012/13
2009/10
Source: Department of Census and Statistics 2009/2010 & 2012/2013, Household Income and Expenditure Survey, Colombo.
selected 11 non-estate and 5 estateantenatal clinics were selected. Inthe non-estate sector, 97 per cent ofmothers’ pregnancy registration wasdone during the domiciliary visit bythe PMH. In the estate sector,domiciliary care was non-existent,and the registration usually done inclinics during normal working hours.Findings revealed that 95 per centof non-estate mothers receivedThriposha supplement, whereas inthe estate sector, none of themothers received any during thepregnancy.
Rodrigo (2011) comparedinfrastructure facilities, availability ofhuman resources, some selectedprocesses and patient satisfactionon OPD services in Ratnapuradistrict. Five government managedestate hospitals and five non-estatehospitals were selected bysimple random sampling from all thetype C hospitals in the area. Facilitysurvey using a checklist, focusedgroup discussions to assessadministrative processes andinterviewer administeredquestionnaires among patients(n = 400) on satisfaction were usedas data collection tools. Survey
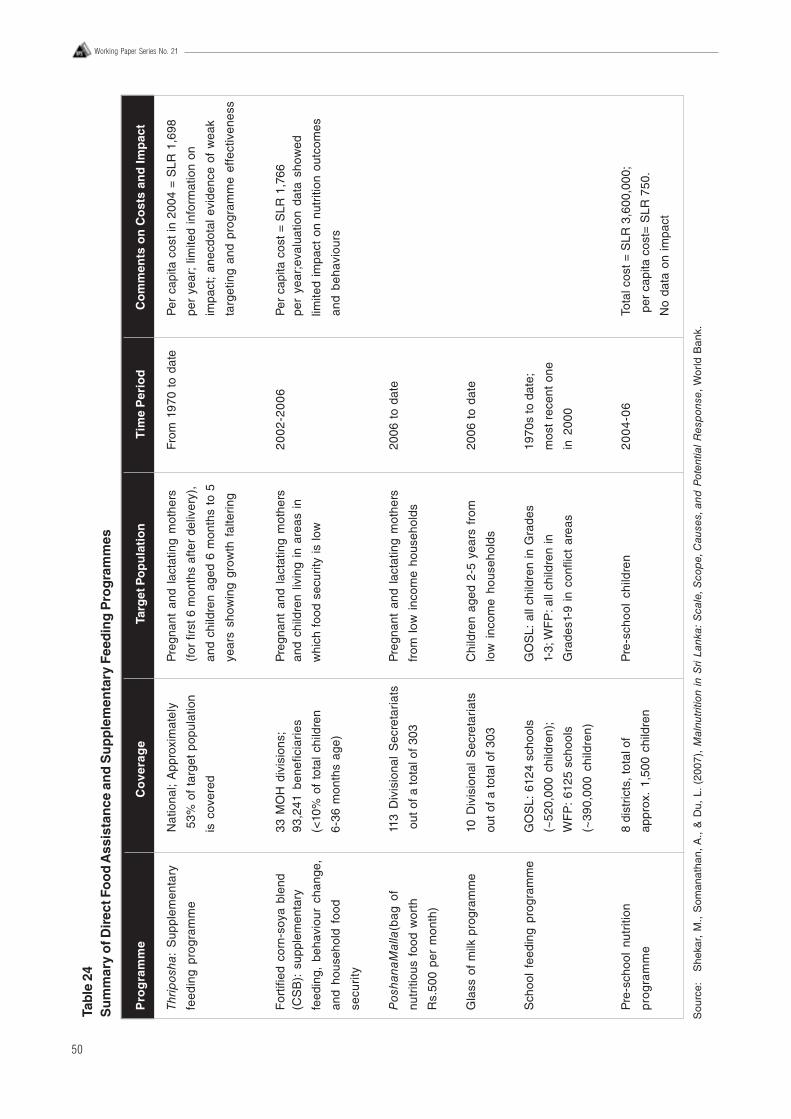
50
Working Paper Series No. 21
Tab
le 2
4S
um
mar
y o
f Dir
ect F
oo
d A
ssis
tan
ce a
nd
Su
pp
lem
enta
ry F
eed
ing
Pro
gra
mm
es
Pro
gra
mm
eC
ove
rag
eTa
rget
Po
pu
lati
on
Tim
e P
erio
dC
om
men
ts o
n C
ost
s an
d Im
pac
t
Thrip
osha
: S
uppl
emen
tary
Nat
iona
l; A
ppro
xim
atel
yP
regn
ant
and
lact
atin
g m
othe
rsFr
om 1
970
to d
ate
Per
cap
ita c
ost
in 2
004
= S
LR 1
,698
feed
ing
prog
ram
me
53%
of
targ
et p
opul
atio
n(f
or fi
rst 6
mon
ths
afte
r de
liver
y),
per
year
; lim
ited
info
rmat
ion
on
is c
over
edan
d ch
ildre
n ag
ed 6
mon
ths
to 5
impa
ct;
anec
dota
l evi
denc
e of
wea
k
year
s sh
owin
g gr
owth
fal
terin
gta
rget
ing
and
prog
ram
me
effe
ctiv
enes
s
For
tifie
d co
rn-s
oya
blen
d33
MO
H d
ivis
ions
;P
regn
ant
and
lact
atin
g m
othe
rs2
00
2-2
00
6P
er c
apita
cos
t =
SLR
1,7
66(C
SB
): s
uppl
emen
tary
93,2
41 b
enef
icia
ries
and
child
ren
livin
g in
are
as i
npe
r ye
ar;e
valu
atio
n da
ta s
how
ed
feed
ing,
beh
avio
ur c
hang
e,(<
10%
of
tota
l ch
ildre
nw
hich
foo
d se
curit
y is
low
limite
d im
pact
on
nutr
ition
out
com
es
and
hous
ehol
d fo
od6-
36 m
onth
s ag
e)an
d be
havi
ours
secu
rity
Pos
hana
Mal
la(b
ag o
f11
3 D
ivis
iona
l S
ecre
tari
ats
Pre
gnan
t an
d la
ctat
ing
mot
hers
2006
to
date
nutr
itiou
s fo
od w
orth
out
of a
tota
l of 3
03fr
om l
ow i
ncom
e ho
useh
olds
Rs.
500
per
mon
th)
Gla
ss o
f m
ilk p
rogr
amm
e10
Div
isio
nal
Sec
reta
riat
sC
hild
ren
aged
2-5
yea
rs f
rom
2006
to
date
out o
f a to
tal o
f 303
low
inc
ome
hous
ehol
ds
Sch
ool
feed
ing
prog
ram
me
GO
SL:
612
4 sc
hool
sG
OS
L: a
ll ch
ildre
n in
Gra
des
1970
s to
dat
e;
(~52
0,00
0 ch
ildre
n);
1-3;
WF
P: a
ll ch
ildre
n in
mos
t re
cent
one
WF
P:
6125
sch
ools
Gra
des1
-9 i
n co
nflic
t ar
eas
in 2
000
(~39
0,00
0 ch
ildre
n)
Pre
-sch
ool
nutr
ition
8 di
stric
ts, t
otal
of
Pre
-sch
ool
child
ren
20
04
-06
Tota
l cos
t = S
LR 3
,600
,000
;
pro
gra
mm
eap
prox
. 1,
500
child
ren
per
cap
ita c
ost=
SLR
750
.
No
data
on
impa
ct
Sou
rce:
S
heka
r, M
., S
oman
atha
n, A
., &
Du,
L.
(200
7),
Mal
nutr
ition
in
Sri
Lank
a: S
cale
, Sco
pe,
Cau
ses,
and
Pot
entia
l R
esp
onse
, W
orld
Ban
k.
51
Health and Socio-economic Determinants of Malnutrition in the Plantation Sector of Sri Lanka
9. Conclusion and RecommendationsHistorical condition
Estate population has beenassigned a lower social status in theSri Lankan society. This is mainlydue to the historical circumstancesthey were brought to the country asmigrant labourers by the thencolonial rulers. Although much hasimproved since this community wasgranted citizenship in Sri Lanka,they have still not gained therecognition on par with othercommunities, even within the sameethnicity having different ancestralorigins. Their identity related to theoccupation has not beenadequately uplifted within themainstream to enjoy thesocio-economic gains that trickledown from the developmentactivities in the country. In addition,the governance structure within theestate management has changedonly a little compared to the rest ofthe country in the post- independentera. Despite the rise of trade unionpower in handling labour affairs andwelfare within estates, the keyelements of colonial model onestate governance persist.Furthermore, trade union discoursehas not been able to empower thecommunity substantially to be‘self-reliant’ departing from inheriteddependent mentality. Rather, it hasmade them dependent on anadditional force apart from existinggovernance structure. All thosefactors that persisted for over oneand half centuries have contributed
for the present socio-cultural statusof the estate community.
Living condition
Existing health and nutrition issuesin the estate sector are found to beclosely related to the culturalelements associated with the livingconditions. The group housing inthe estate since the inception of thetea and rubber estates has createda unique sub-culture thatperpetuates many negativeelements for health and nutrition.Many studies have shown thesecultural elements as major obstaclesto improve the health and nutritionstatus of this community. Lack ofprivacy, limitations to sustain well-being in a family environment,chronic exposure to alcohol andsubstance abuse from younger ageand regular violence that leads to apessimistic mind frame preventsexploring opportunities forimprovement. Many studies haverecommended that improvement ofliving conditions through singlehousing with adequate facilities,could make a major shift in themindset of the estate community tobenefit from available opportunitiessuch as education, employment,health services, social and welfarebenefits delivered to them. Althougha small proportion in the youngergeneration has started to thinkbeyond the traditional expectations,the present lifestyle within the estatedoes not encourage most to pursuebeyond the parental destiny.
Lifestyles
Lifestyle within the limited facilitiesof a group housing is culturallymale dominated and the socialinfluences within and from outsidesupport to strengthen the statusquo. One of the key issues identifiedis the lower status for the femalewithin the family and estatecommunity. This prevents improvinghealth and nutrition of the female,thus leading to a vicious cycle of illhealth. Most of the household workis done by the female, thus moststudies recommend programmes toencourage shared responsibilityamong the family members toprevent the estate women fromundue physical strain. Throughout,significant associations were seenwith mother’s educational level,family income, domestic workload,parity and birth interval withnutrition. Low literacy amongfemales has led to low receptivity forhealth and nutrition messages andcontinued improper practices. Thestereotyped lifestyle connected tothe occupation, prevents femalesfrom exploring possible innovationsto improve the health and nutritionalstatus of the family. The financialcontrol of the household mainlyrests with the male and the femalehas a less decision making power.Even when the female iscontributing the largest share of thehousehold income, the ability sheholds on key decisions such asspending was found be lessinfluential.
revealed that 40 per cent of estatehospitals had no separate male andfemale wards, while non-estatehospitals had separate wards. Allhad antenatal clinics and medicalclinics, while none had laboratories.Estate hospitals had only 30 percent of approved medical officers,
while non-estate hospitals had anexcess of 37 per cent according toapproved cadre. Non-estatehospitals had nursing officers fourper cent above the approved cadre,while estates had no nursingofficers. Minor staff shortage wasobserved in estate hospitals.
Although, there was no differencebetween both types of hospitals onoverall patient satisfaction, patientsat estate hospitals showed asignificantly low satisfaction ininterpersonal aspect, and accessand convenience.
52
Working Paper Series No. 21
Dietary habits and foodMany studies show that dietarypractices and food selection in theestate sector is different to the restof the country. The priority meal inestate households is the dinner.Breakfast and lunch are generallygiven less attention. This behaviouris related to the occupation andcontinued for generations. Hence,traditionally for breakfast and lunch,the majority of estate populationconsume wheat flour based fooditems with less nutritive value.Dinner is a rice based meal mainlywith vegetables. Most studies showthat protein consumption among theestate population is less than theother two sectors. This is despitespending over 50% of thehousehold income on food items.Studies recommend action toreduce food insecurity, especiallyamong the poor in the estate sectorto improve nutrition status. Further,myths about food and harmfuldietary habits reduce the impact ofnutrition programmes in thiscommunity. Use of female schoolchildren as the vehicle to educatethe mothers in changing those foodhabits is suggested.
Income and expenditureThe income of the estate populationhas increased substantially duringthe last decade. Poverty headcounthas also reduced. A notableproportion of estate residents havealso shifted from their traditionaloccupations in the estate tomigratory work in urban settings.However, it was shown that theexpenditure patterns and absenceof a culture for saving has resultedin food insecurity, inappropriateexpenditure and malnutrition.Estate household spends thehighest proportion on food itemsthan the other two sectors.Furthermore, many studies havefound high expenditure on alcoholand other substances too. Incomeof mothers in the estate yield thehighest benefit to household
compared to the male. Hence,studies suggest mechanisms toincrease the mother’s income/employability along with child carefacilities to improve the householdhealth and nutrition. Povertyreduction strategies, specificallydesigned to reduce incomeinequalities is recommended bymost studies.
Health servicesAlthough estates under thecorporate management retain ahealth unit to cater to theirpopulation, smaller estates do notextend that facility. The facility withinthe larger estate too has major gapswith less facilities and less trainedstaff. Although, MCH services areprovided by the MOH staff, it is seenthat domiciliary care component isstill not adequately addressed. It isalso found that less domiciliaryvisits by the health workers isassociated with low EBF rate, highbottle feeding, inappropriatecomplementary feeding and lowdietary diversity. There are lessnumber of healthcare workers topopulation in the districts withpredominantly estate population. Studies suggest scaling up thelessons from the Early ChildhoodCare and Development Project toincrease community participationand utilization of health andnutrition services among estateworkers. These include prioritizingthe delivery of quality services in theestates; establishing occupationalhealth service to occupation relatedhealth problems in estates; andincreasing male participation inactivities related to MCHprogrammes. In addition, labourrights related to working mothers inthe estate sector need to bereviewed and necessaryadjustments be made in a way thatthe pregnant mother gets optimumcare during her pregnancy anddeliver optimum care to the child.Further, studies suggest to improvethe quality of the child care centres
and to intervene on nutritionalaspects according to needs; toimprove the child developmentalactivities and strengthen theparental and communityparticipation in child careprogrammes. A few studies alsorecommend regular annualde-worming, improvement of latrinefacilities and parental educationregarding hygiene of their childrenas a way forward for improvingnutritional status.
Nutritional programmeevaluationMany programmes directed toimproving nutritional status of thepopulation and specifically for theestate sector, have beenimplemented during the last threedecades by the government of SriLanka and other stakeholderorganizations. However, systematicevaluation of those programmes israre in published literature. Mostevaluations are restricted tomeasuring a few direct outputs ofthe programme and conducted bythe programme implementersthemselves. Independent outcomeand impact evaluations areextremely rare. This emphasizes therequirement of a mandatory in-builtprocess evaluation of all futurenutritional programmes coupledwith independent outcome andimpact evaluations to assess thesuccess of nutritional programmes.
The available few studies onnutrition programme evaluation donot provide adequate information toassess the contribution of individualprogramme success. Mostnutritional programmes have reliedon routine information obtained fromnational studies to satisfy post-hocassessments of their ownprogramme with less objectivemethodology. This approach haslimited value to policy makers in thedecision making process.
53
Health and Socio-economic Determinants of Malnutrition in the Plantation Sector of Sri Lanka
Bibliography
Abeysuriya, V., A. R. Wickramasinghe, P.J. Perera, & A. Kasturiratne, (2012), “Consumption Pattern of Iodised Saltin Households and Serum TSH Levels Among 5-9 Year Old Children in the Plantation Sector of Sri Lanka,”Ceylon Medical Journal, 57;69-74.
Amarasekara, M. T. (2001), Acute Diarrhoeal Disorders Among Pre-school Children in the Estate Population of TwoSelected Estates in Hunnasgiriya in the Kandy District.
Atukorala, T. M., L. D. De Silva, W. Dechering, T. S. Dassenaeike, & S. R. Perera, (1994), “Evaluation ofEffectiveness of Iron-folate Supplementation and Anthelminthic Therapy Against Anemia in Pregnancy:a Studyin the Plantation Sector of Sri Lanka,” An, J Cliii Nutr y , 60:286-92.
Banduthilaka, T. (1991), Comparative Health Status Assessment of Primary School Children in Estate and RuralSectors of Padukka Health Area, MSc dissertation, post Grduate Institute of Medicine, Colombo.
Central Bank of Ceylon (1984), Report on Consumer Finance and Socio-Economic Survey, 1981/82, Colombo.
Central Bank of Sri Lanka (2013). Annual Report 2013, Colombo.
De Silva, S. (2000), “Nutrition: Status, Causes, and Achievements in Sri Lanka,” In Demography of Sri Lanka - Issuesand Challenges (p. 197). Colombo: Department of Demography, University of Colombo.
Delange, F. (2001), “Iodine Deficiency as a Cause of Brain Damage,”Postgrad Med J , 77:217–220.
Department of Census and Statistics (1980/81,1985/86), Labour Force and Socio-Economic Survey .
Department of Census and Statistics (1987, 1993, 2000, 2006/07), Sri Lanka Demographic and Health Survey,Colombo.
Department of Census and Statistics (2003), Survey of Child Health and Welfare in Seven Districts in Sri Lanka,Colombo.
Department of Census and Statistics (2006/07), Sri Lanka Demographic and Health Survey. Colombo.
Department of Census and Statistics (2008/09), Child Activity Survey, Colombo.
Department of Census and Statistics (2009), Prevalence of Anaemia among Children and Women: Demographicand Health Survey 2006/7, Colombo: Health Sector Development Project: Ministry of Healthcare and Nutrition.
Department of Census and Statistics (2011), Household Income and Expenditure Survey 2009/2010, Colombo.
Department of Census and Statistics (2012), Census of Population and Housing,Colombo.
Department of Census and Statistics (2013), Household Income and Expenditure Survey 2012/13, Colombo.
Department of Census and Statistics (2014, April 29), Poverty Headcount Ratio Brief: Decomposition ofConsumption Poverty, Colombo.
Department of Census and Statistics (2014), Quarterly Report of the Sri Lanka Labour Force Survey – 4th Quarter2013, Colombo.
Dunham, D., R. Perera, & N. Arunatileke, (1997), The Labour Situation on Sri Lankan Tea Estates – A view to 2005.Colombo: Institute of Policy Studies of Sri Lanka.
54
Working Paper Series No. 21
Ebenezer, R., K. Gunawardena, B. Kumarendran, A. Pathmeswaran, C. H. Jukes, J. J. Drake & N. De Silva,(2013), “Cluster-Randomised Trial of the Impact of School-based Deworming and Iron Supplementation onthe Cognitive Abilities of Schoolchildren in Sri Lanka’s Plantation Sector,” Tropical Medicine and InternationalHealth, 1-10 (doi:10.1111/tmi.12128).
Estate and Urban Health Unit (2014), Proposal on Improvement of Nutritional Status of the Estate Sector Population.
Family Health Bureau (1981/1982), Family Health Impact Survey, Sri Lanka, Colombo: Ministry of Health.
Food and Nutrition Policy Planning and Implementation (1988/89), Macro Surveillance Project to Assess Nutritionaland Social Economic Indicators, Ministry of Plan Implementation.
Food and Nutrition Policy Planning Division (1979/1982), Nutritional Status and Socio-Economic Survey Findings,Colombo: Ministry of Plan Implementation.
Gamage, D. (1998), Promoting Grassroots Participation in Nutrition Programmes, Hector Kobbekaduwa AgriculturalResearch and Training Institute.
Gamagedara, N. (2012), Prevalence and Determinants of Chronic Under-Nutrition Among Under Five Children Livingin Estates in the District of Badulla.
Hettiarachchi, M., & C. Liyanage, (2010), “Efficacy of ‘Thriposha’ Supplementation in Improving the MicronutrientStatus of Preschool Children,” Ceylon Medical Journal Vol. 55, No. 3, September 2010, 85-89.
Hewageegana, N. (1996), Evaluation of Antenatal Care Provided at Clinics and at Home in the Area of the DivisionalDirector of Health Services Haputale. MSc dissertation, post Grduate Institute of Medicine, Colombo.
Institute of Policy Studies of Sri Lanka (2012), Sri Lanka National Health Accounts 2005-2009. Colombo: Sri LankaNational Health Accounts 2005-2009.
Jayasinghe, L. (2011), Characteristics of Estate Child Care Centres and the Nutritional and the DevelopmentalAssessment of the Children between 3-36 months of Age who are Cared at these Centers at MOH AreaAmbagamuwa, MSc dissertation, post Grduate Institute of Medicine, Colombo.
Jayatissa, R. (2012), “Determinants of and Interventions for Malnutrition,” Ceylon Medical Journal, 57, 51-55.
Jayatissa, R., & D. Fernando, (2011), Landscape Analysis to Accelerate Actions to Reduce Maternal and ChildUnder-Nutrition in Sri Lanka. Colombo: Medical Research Institute.
Jayatissa, R., & M. Gunathilaka, (2006), Vitamin A Nutrition Status in Sri Lanka, Colombo: Medical Research Institute.
Jayatissa, R., & M. Gunathilaka, (2010), Third National Survey on Iodine Deficiency Status in Sri Lanka, Colombo:Medical Research Institute.
Jayatissa, R., & M. S. Hossaine, (2009), Nutrition and Food Security Assessment in Sri Lanka, Colombo: MedicalResearch Institute.
Jayatissa, R., & S. Mahamithawa, (2004), Rapid Assessment of Coverage of Micronutrient Supplementation in SriLanka, Colombo: Medical Research Institute.
Jayatissa, R., M. Gunathilaka & D. N. Fenando, (2012), Aneamia among Children aged 6-59 months and NutritionalStatus of Children and Adults, Colombo: Medical Research Institute.
Jayawardena, P. (2012), “Socio-Economic Determinants and Inequalities in Childhood Malnutrition in Sri Lanka,”Well-being and Social Policy; Vol. 8, No. 1, 1-22.
Jayaweera, A. (1991), Women in the Estate Sector- Situation Analysis, Colombo: Centre for Women’s Research.
Jones G., R. W. Steketee, R. Black, Z. A. Bhutta, & S. Morris, (2003), “How Many Child Deaths can We Preventthis Year?” The Lancet, 362: 65–71.
55
Health and Socio-economic Determinants of Malnutrition in the Plantation Sector of Sri Lanka
Kumarendran, B. (2010), Soil-transmitted Helminthic Infections Among Plantation Sector Primary School Children inNuwareliya District.
Liyanage, C., & T. Wickramanayake, (1984), “Food Beliefs and Practices among Sri Lankan Estate Sector”. J. Natn.Sci.Coun. Sri Lanka 1984 (12)1, 103-105.
Malwatte, H. (2000), “ Social Development”, In B. Sivaram, Plantation Management in the New Millennium (pp. 403-460), National Institute of Plantation Management.
Medical Research Institute (1995/96), Vitamin A Deficiency Status of Children, Colombo: Ministry of Health andIndigenous Medicine.
Medical Research Institute (2009), Nutrition and Food Security Assessment Survey in Sri Lanka, Colombo: MedicalResearch Institute.
Medical Research Institute (2012), National Nutrition and Micronutrient Survey, Colombo: Ministry of Health.
Mihrshahi S., N. Ichikawa, M. Shuaib, W. Oddy, R. Ampon, M. Dibley, & J. Peat, (2007), “Prevalence of ExclusiveBreastfeeding in Bangladesh and its Association with Diarrhoea and Acute Respiratory Infection: Results ofthe Multiple Indicator Cluster Survey 2003,” J Health Popul Nutr, 25(2):195-204.
Ministry of Health (1975/76), Sri Lanka Nutritional Status Survey .
Ministry of Health (2008), Factors Associated with Complementary Feeding in Sri Lanka, Colombo.
Ministry of Health (2011), Health Facility Survey 2011, Colombo.
Ministry of Health (2012), Annual Health Bulletin, Colombo.
Ministry of Healthcare and Nutrition (2008), Factors Associated with Complementary Feeding in Sri Lanka,Colombo.
Ministry of Plan Implementation (1983), An Evaluation of the Thriposha Programme, Colombo : Food and NutritionPolicy Planning Division.
Ministry of Plan Implementation and International Food Policy Research Institute (1981), Sri Lanka NutritionSurveillance Programme: Seminar Report on Nutritional Status and Socio Economic Survey Findings.
Ministry of Policy Planning and Impeimentation (N.G.), International Conference on Nutrition - Sri Lanka CountryReport, Colombo.
Mudalige, R., & R. Nestel, (1996), “Prevalence of Anemia in Sri Lanka,” The Ceylon Journal of Medical Science.
Mullany, L.C., J. Katz, Y.M. Li, S.K. Khatry, S.C. LeClerq, G.L. Darmstadt, J.M. Tielsch, (2008), “Breast-FeedingPatterns, Time to Initiation, and Mortality Risk among Newborns in Southern Nepal,” The Journal of Nutrition:Community and International Nutrition, 138, 599–603.
Muzrif, M. (2011), Under-Nutrition, Feeding Practices and Factors Associated among Pre-school Children AttendingChild Welfare Clinics in Estate Sector, Passara MOH area.
Nanayakkara, R. (2013), “ Total Resident Population & Families,” (S. Bandara, Interviewer)
National Nutritional Council (2013), Vision 2016: Sri Lanka, A Nourished Nation-Multi-sector Action Plan for Nutrition,Colombo.
Nestel, P., & R. Ratnayake, (1993), Nutrition and Health Status of Children, Battaramulla: Ministry of Policy Planningand Implementation.
56
Working Paper Series No. 21
Niranjala, A. M. (2009), Prevalence of Under-Nutrition and Associated Factors among 13 to 16 year old Females inPlantation Sector in the Medical Officer of Health area Haliela, MSc dissertation, post Grduate Institute ofMedicine, Colombo.
Nutrition Coordination Division (2006), Baseline Survey of the National Nutrition Surveillance System of Sri Lanka,Colombo: Ministry of Health.
Office of the International Health (1989), Analysis of Health, Nutrition and Poverty in Sri Lanka, Colombo: Agency forInternational Development.
Oriji, V., C. Enyindah, & S. Nyeche, (2011), “ Factors Determining Compliance to Routine Iron Supplementation inPregnancy at the University of Portharcout Teaching Hospital,” Niger J Med, 20(1):131-4.
Piyarathna, A. (2008), Between Inner and Outer Worlds: A Sociological Analysis of the Changing Social Identity ofEstate Tamil Worker, Colombo: Godage International Publishers (Pvt) Ltd.
Piyasena, C., & A. Mahamittawa, (2001), Assessment of Anaemia Status in Sri Lanka, Colombo: Medical ResearchInstitute.
Plantation Human Development Trust (2012/13), Retrieved November 07, 2014, from http://www.phdt.org/2014/public/we-are.php
Rannan-Eliya, R., C. Anuranga, & A. Abeykoon, (2013), “ Trends and Determinants of Childhood Stunting andUnderweight in Sri Lanka,” Ceylon Medical Journal 58 , 10-18.
Rathnayake, I. M., & J. Weerahewa, (2005), “Maternal Employment and Income Affect Dietary Calorie Adequacy inHouseholds in Sri Lanka,” Food and Nutrition Bulletin,Vol. 26, No. 2 .
Ratnayake, I., & J. Weerahewa, (2005), “Determinants of Nutritional Status among Pre-School Children in SriLanka,” Tropical Agricultural Research Vol. 17, 148-161 .
Rodrigo, M. A. (2011), Government Estate and Non-Estate Sector Hospitals in the District of Rathnapura: Comparisonof Selected Aspects of Curative Health Care Services, MSc dissertation, Postgraduate Institute of Medicine,Colombo.
Samarasinghe, V., S. Kiribamune, & W. Jayatilake, (1990), Maternal Nutrition and Health Status of Indian TamilFemale Tea Plantation Workers in Sri Lanka.
Sarma, M. S., D. Wijesinghe, & T. Sivananthawerl, (2013),” The Effects of Nutritional Status on EducationalPerformance of Primary School Children in the Plantation Sector in Nuwara Eliya Educational Zone,” TropicalAgricultural Research Vol. 24 (3), 203-214.
Senarath, U., M. J. Dibley, S. Godakandage, H. Jayawickrama, A. Wickramasinghe, & K. E. Agho, (2010),“Determinants of Infant and Young Child Feeding Practices in Sri Lanka: Secondary Data Analysis ofDemographic and Health Survey 2000,” Food and Nutrition Bulletin, Vol. 31, No. 2, 352-365.
Senarath, U., S. S. Godakandage, H. Jayawickrama, I. Siriwardena, & M. J. Dibley, (2012), “Determinants ofInappropriate Complementary Feeding Practices in Young Children in Sri Lanka: Secondary Data Analysis ofDemographic and Health Survey 2006–2007,” Maternal and Child Nutrition,(2012) 8 (Suppl. 1), 60–77.
Senarath, U., I. Siriwardena, S.S. Godakandage, H. Jayawickrama, D. N. Fernando , & M. J. Dibley, (2012),“Determinants of Breastfeeding Practices: An Analysis of the Sri Lanka Demographic and Health Survey2006-2007.” Maternal and Child Nutrition, 315-329.
Senerath, U., M. C. Weerasinghe, & R. Jayatissa, (2013), Report on Nutrition Situation of Mothers and Children inRathnapura District, Save the Children (unpublished).
Shekar, M., A. Somanathan, & L. Du, (2007), Malnutrition in Sri Lanka: Scale, Scope, Causes, and PotentialResponse, World Bank .
57
Health and Socio-economic Determinants of Malnutrition in the Plantation Sector of Sri Lanka
Sorensen, E., D. Fernando, I. Hettiarachchi, S. Durongdej, A. Podhipak, & B. Skaara, (1998), “ExclusiveBreastfeeding among Women on the Plantations in Sri Lanka,” Journal of Tropical Pediatrics, 44, 313–315.
Sri Lanka Country Profile (2014, August 23), Retrieved 10. 28, 2014, from Index Mundi: http://www.indexmundi.com/sri_lanka/#Geography
Sri Lanka Demographics Profile 2013 (2013), Retrieved from Index Mundi: http://www.indexmundi.com/sri_lanka/demographics_profile.html
Sri Lanka Overview (2014, March 31), Retrieved October 28, 2014, from World Bank : http://www.worldbank.org/en/country/srilanka/overview#1
Sri Lanka Population- Population Rank Chart (2014), Retrieved from IndexMundi: http://www.indexmundi.com/g/r.aspx?c=ce&v=21
The Finance Commission (2012), Annual Report, Colombo.
The Planters’ Association of Ceylon (2013, August 30), Round Table Discussion with Representatives of thePlanters’ Association of Ceylon.
Thomas, D., & C. Chen, (1993, April), Income Shares and Shares of Income: Empirical Tests of Models of ResourceAllocation, Los Angeles, USA: University of California, Mimeo.
Udayasiri, A. (2003), Selected Occupation Related Health Problems in Tea Plantation Workers in the Kegalle District,MSc dissertation, Post Graduate Institute of Medicine, Colombo.
United Nations Children’s Fund (UNICEF) (2010), Infant and Young Child Feeding Programme Review: ConsolidatedReport of Six-Country Review of Breastfeeding Programmes.
Uragoda, C. G. (1987), A History of Medicine in Sri Lanka, Colombo: Sri Lanka Medical Association.
USAID/Sri Lanka (1989), Review of Nutrition and Socio Economic Surveys in Sri Lanka, Colombo .
Vidyasagara, N. (2001), “Healthcare in Plantation Sector: Public Health Development in Sri Lanka.” Journal of theCollege of Community Physicians of Sri Lanka, Millennium Supplement.
Vithana, B. (2002), Selected Factors Associated with Maternal Weight Gain in Uncompleted Pregnancies in TwoMedical Offices of Health Areas, Post Graduate Institute of Medicine, Colombo.
Vithana, E. (2001), Selected Factors Associated with Maternal Weight Gain in Uncompleted Pregnancies in TwoMedical Offices of Health Areas, Post Graduate Institute of Medicine, Colombo.
Weerasinghe, M. C., U. Senerath, D. Fernando, W. Nanayakkara, & G. D. Dayarane, (2008). Evaluation of the EarlyChildhood Care and Development Programme, Colombo: Institute of Policy Studies of Sri Lanka.
WHO (1995), Physical Status: The Use and Interpretation of Anthropometry, Report of a WHO Expert Committee,Technical Report Series No. 854. Geneva: World Health Organization.
WHO (2014), World Health Statistics 2014, Geneva: WHO.
58
Working Paper Series No. 21
Glossary
1. Poverty Head Count Ratio (HCR) – The proportion of poor population in a domain or count of persons belowthe poverty line as a percentage of the total population in the domain.
2. Food Ratio - The proportion of expenditure on food and drink to total expenditure (%).
3. Economically Active Population - Number of persons (age 15 years & above) who were employed orunemployed during the reference week.
4. Permanent Housing– Housing units which are made of for instance, bricks for wall, cement/tile for floor, andtile/asbestos for roof.
5. Semi-permanent Housing - Housing units which are made of for instance, mud for wall, any material forfloor, and metal sheet for roof.
6. Prepared food – Type of cooked food which is bought from outside as meals such as Bread (Normal/Special), Roasted Bread, Buns/ Spunchi , Hoppers, String hoppers, Pittu number, Roti Thosai/ Itly, Rice(meat and vegetables), Rice (fish and vegetables) , Rice (only vegetables ), Curry (meat/fish/vegetables) ,and Other prepared foods.
7. Stunting - A child whose height for age is below -2 SD from the median of the reference population isconsidered short for his/her age, or “stunted,” a condition reflecting the cumulative effect of chronic under-nutrition. Those that have height for age values less than -3 SD are considered as “severely stunted”.
8. Wasting - A child whose weight for height is below -2 SD from the median of the reference population isconsidered as “wasted,” a condition reflecting the effect of short-term under- nutrition. Those that haveweight for height values less than -3 SD are considered as “severely wasted”.
9. Underweight - A child whose weight for age is below -2 SD from the median of the reference population isconsidered as “underweight”. Those that have weight for age values less than -3 SD are considered as“severely underweight”.
10. Overweight - A child whose weight for height is above +2 SD from the median of the reference population isconsidered as “overweight”.
11. Body Mass Index - Body Mass Index (BMI) is a simple index of weight-for-height that is commonly used toclassify underweight, overweight and obesity in adults. It is defined as the weight in kilograms divided by thesquare of the height in metres (kg/m2).
12. Exclusive Breast Feeding – Exclusive breastfeeding means that the infant receives only breast milk. Noother liquids or solids are given – not even water – with the exception of oral rehydration solution, or drops/syrups of vitamins, minerals or medicines. (http://www.who.int/elena/titles/exclusive_breastfeeding/en/)
13. Mid Upper Arm Circumference - A measurement of the circumference of the arm at a midpoint between thetip of the acromial process of the scapula and the olecranon process of the ulna. It is an indication of upperarm muscle wasting.
14. Fully Breastfed - Only breast milk, no additional food-based fluids other than fruit juice and sugar water.
15. Complementary Feeding Rate - The proportion of infants 6-9 months of age who receive complementaryfood in addition to breast milk in the previous 24 hours.
16. Non-Breast Feeding - Proportion of children under 24 months of age who were not fed breast milk duringthe previous day.
17. Predominant breastfeeding - Breastfeeding and other fluids such as water-based drinks, fruit juice,excluding non-human milks and food-based fluids.
18. Complementary Feeding - The process of starting other foods and liquids along with breast milk, whenbreast milk alone is no longer sufficient to meet the nutritional requirements of infants.
59
Health and Socio-economic Determinants of Malnutrition in the Plantation Sector of Sri Lanka
19. Food density - Density/Consistency of complementary food refers to what extent the prepared food is thin/liquid or semi-solid.
20. Introduction of solid, semi-solid or soft foods: Proportion of infants 6–8 months of age who receive solid,semi-solid or soft foods.
21. Minimum dietary diversity: Proportion of children 6–23 months of age who receive foods from four or morefood groups of the seven food groups. The seven foods groups used for tabulation of this indicator were:grains, roots and tubers; legumes and nuts; dairy products (milk, yogurt, cheese); flesh foods (meat, fish,poultry and liver/organ meats); eggs; vitamin A-rich fruits and vegetables; and fruits and vegetables otherthan those rich in vitamin A. Consumption of any amount of food from each food group is sufficient to ‘count’,i.e. there is no minimum quantity, except if an item is only used as a condiment.
22. Minimum meal frequency: Proportion of breastfed and non-breastfed children 6–23 months of age whoreceive solid, semi-solid or soft foods (but also including milk feeds for non-breastfed children) the minimumnumber of times or more. Minimum was defined as: two times for breastfed infants 6–8 months, three timesfor breastfed children 9–23 months and four times for non-breastfed children 6–23 months.
23. Minimum acceptable diet: Proportion of children 6–23 months of age who receive a minimum acceptablediet (apart from breast milk). This composite indicator is calculated from the following two fractions: breastfedchildren 6–23 months of age who had at least the minimum dietary diversity and the minimum mealfrequency during the previous day, and non-breastfed children 6–23 months of age who received at leasttwo milk feedings and had at least the minimum dietary diversity not including milk feeds and the minimummeal frequency during the previous day. However, in the present analysis, this indicator was confined toonly breastfed children because the minimum number of non-breast milk feeds as in the definition was notavailable in the DHS survey data.
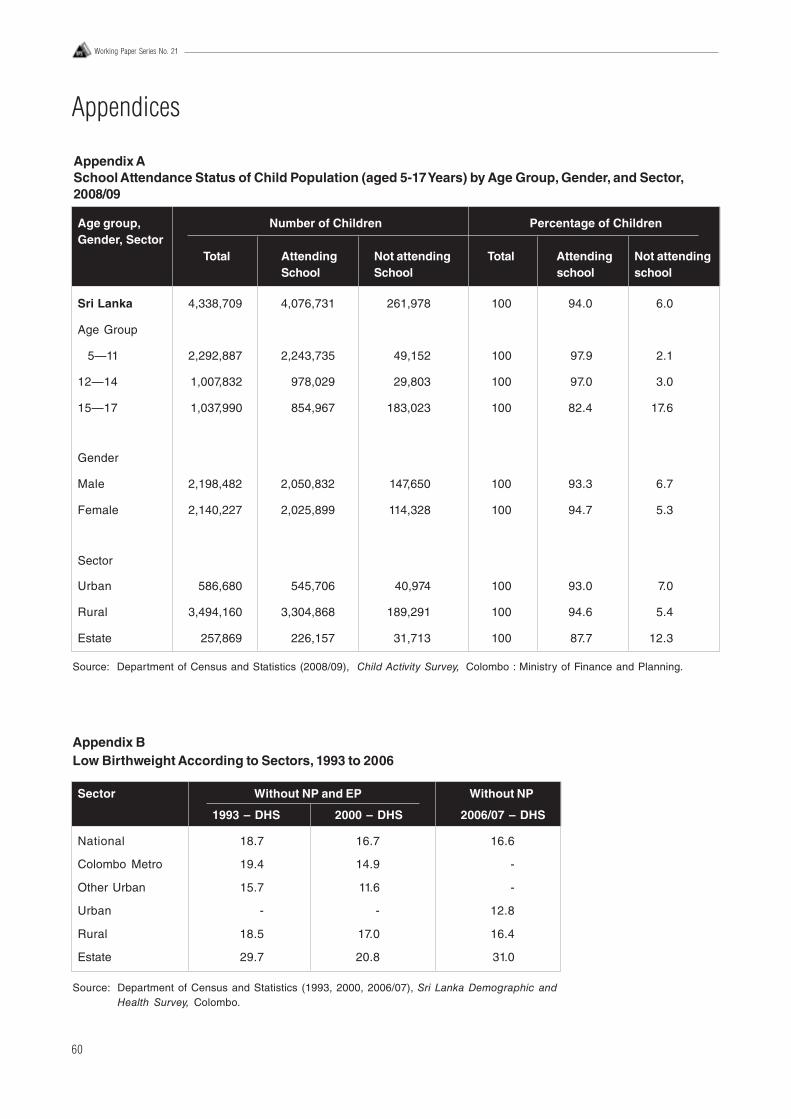
60
Working Paper Series No. 21
Appendices
Appendix ASchool Attendance Status of Child Population (aged 5-17 Years) by Age Group, Gender, and Sector,2008/09
Age group, Number of Children Percentage of ChildrenGender, Sector
Total Attending Not attending Total Attending Not attendingSchool School school school
Sri Lanka 4,338,709 4,076,731 261,978 100 94.0 6.0
Age Group
5—11 2,292,887 2,243,735 49,152 100 97.9 2.1
12—14 1,007,832 978,029 29,803 100 97.0 3.0
15—17 1,037,990 854,967 183,023 100 82.4 17.6
Gender
Male 2,198,482 2,050,832 147,650 100 93.3 6.7
Female 2,140,227 2,025,899 114,328 100 94.7 5.3
Sector
Urban 586,680 545,706 40,974 100 93.0 7.0
Rural 3,494,160 3,304,868 189,291 100 94.6 5.4
Estate 257,869 226,157 31,713 100 87.7 12.3
Source: Department of Census and Statistics (2008/09), Child Activity Survey, Colombo : Ministry of Finance and Planning.
Appendix BLow Birthweight According to Sectors, 1993 to 2006
Sector Without NP and EP Without NP
1993 – DHS 2000 – DHS 2006/07 – DHS
National 18.7 16.7 16.6
Colombo Metro 19.4 14.9 -
Other Urban 15.7 11.6 -
Urban - - 12.8
Rural 18.5 17.0 16.4
Estate 29.7 20.8 31.0
Source: Department of Census and Statistics (1993, 2000, 2006/07), Sri Lanka Demographic andHealth Survey, Colombo.
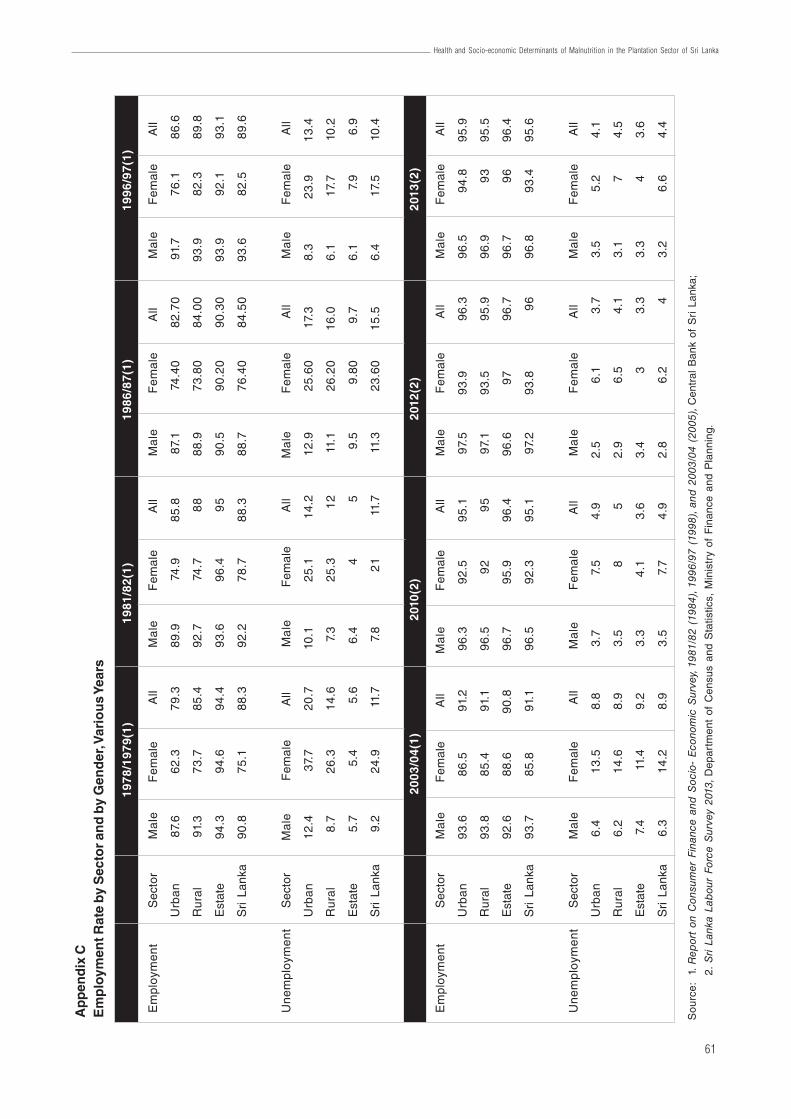
61
Health and Socio-economic Determinants of Malnutrition in the Plantation Sector of Sri Lanka
Ap
pen
dix
CE
mp
loym
ent R
ate
by
Sec
tor
and
by
Gen
der
, Var
iou
s Ye
ars
Sou
rce:
1. R
epor
t on
Con
sum
er F
inan
ce a
nd S
ocio
- E
cono
mic
Sur
vey,
1981
/82
(198
4), 1
996/
97 (
1998
), an
d 2
003/
04 (
2005
), C
entr
al B
ank
of S
ri L
anka
;
2. S
ri La
nka
Lab
our
For
ce S
urve
y 20
13, D
epar
tmen
t of
Cen
sus
and
Sta
tistic
s, M
inis
try
of F
inan
ce a
nd P
lann
ing.
1978
/197
9(1)
1981
/82(
1)19
86/8
7(1)
1996
/97(
1)
Em
ploy
men
tS
ecto
rM
ale
Fem
ale
All
Ma
leF
emal
eA
llM
ale
Fem
ale
All
Ma
leF
emal
eA
ll
Urb
an
87.
66
2.3
79.3
89.9
74.9
85.8
87.1
74.4
082
.70
91.7
76.1
86.6
Ru
ral
91.3
73
.785
.492
.774
.78
888
.973
.80
84.0
093
.982
.389
.8
Est
ate
94.3
94.6
94.4
93.6
96.4
95
90.5
90.2
090
.30
93.9
92.1
93.1
Sri
Lank
a90
.875
.188
.392
.278
.788
.388
.776
.40
84.5
093
.682
.589
.6
Un
em
plo
yme
nt
Sec
tor
Ma
leF
emal
eA
llM
ale
Fem
ale
All
Ma
leF
emal
eA
llM
ale
Fem
ale
All
Urb
an
12
.43
7.7
20.7
10.1
25.1
14.2
12.9
25.6
017
.38.
323
.913
.4
Ru
ral
8.7
26
.314
.67.
325
.31
211
.126
.20
16.0
6.1
17.7
10.2
Est
ate
5.7
5.4
5.6
6.4
45
9.5
9.80
9.7
6.1
7.9
6.9
Sri
Lank
a9.
224
.911
.77.
82
111
.711
.323
.60
15.5
6.4
17.5
10.4
2003
/04(
1)20
10(2
)20
12(2
)20
13(2
)
Em
ploy
men
tS
ecto
rM
ale
Fem
ale
All
Ma
leF
emal
eA
llM
ale
Fem
ale
All
Ma
leF
emal
eA
ll
Urb
an
93
.686
.591
.296
.392
.595
.197
.593
.996
.396
.594
.895
.9
Ru
ral
93
.885
.491
.196
.59
29
597
.193
.595
.996
.99
395
.5
Est
ate
92.6
88.6
90.8
96.7
95.9
96.4
96.6
97
96.7
96.7
96
96.4
Sri
Lank
a93
.785
.891
.196
.592
.395
.197
.293
.89
696
.893
.495
.6
Un
em
plo
yme
nt
Sec
tor
Ma
leF
emal
eA
llM
ale
Fem
ale
All
Ma
leF
emal
eA
llM
ale
Fem
ale
All
Urb
an
6.4
13
.58.
83.
77.
54.
92.
56.
13.
73.
55.
24.
1
Ru
ral
6.2
14
.68.
93.
58
52.
96.
54.
13.
17
4.5
Est
ate
7.4
11.4
9.2
3.3
4.1
3.6
3.4
33.
33.
34
3.6
Sri
Lank
a6.
314
.28.
93.
57.
74.
92.
86.
24
3.2
6.6
4.4
100/20, Independence Avenue, Colombo 7, Sri LankaTel: +94 11 2143100 Fax: +94 11 2665065
Email: [email protected]: www.ips.lk
Blog ‘Talking Economics’ : www.ips.lk/talkingeconomicsTwitter: @TalkEconomicsSL
Facebook: www.facebook.com/instituteofpolicystudies
ISBN 978-955-8708-89-7