hawaii institute of marine biology - citeseerx
TRANSCRIPT
•
SOME CHLORINATED PESTICIDE RESIDUES IN THE WATER,
SEDIMENT AND SELECTED BIOTA IN THE ALA WAI CANAL,
A TROPICAL ESTUARY ON OAHU, HAWAII
BY CYNTHIA DAWN SHULTZ
DEPARTMENT OF OCEANOGRAPHY UNIVERSITY OF HAWAII
UNIVIRSI" OF HAWAII
HAWAII INSTITUTE OF MARINE BIOLOGY HONOLULU, HAWAII TECHNICAL REPORT NO. 28 SEPTEMBER 1971
SOME CHLORINATED PESTICIDE RESIDUES IN THE WATER,
SEDIMENT AND SELECTED BIOTA IN THE ALA WAI CANAL,
A TROPICAL ESTUARY ON OAHU, HAWAII
By
Cynthia Dawn Shultz
Department of Oceanography
University of Hawaii
UNIVERSITY OF HAWAII
HAWAII INSTITUTE OF MARINE BIOLOGY
HONO£ijjJJ,.Hfo;~~J;~'d . '.~~!~C.@ICAL REPORT NO. 28 SEPTEMBER 1971
SOME CHLORINATED PESTICIDE RESIDUES
IN THE WATER, SEDIMENT AND SELECTED BIOTA
IN THE ALA WAI CANAL, A TROPICAL ESTUARY ON
OAHU, HAWAII
By
Cynthia Dawn Shultz
Department of Oceanography
University of Hawaii
HAWAII INSTITUTE OF MARINE BIOLOGY
UNIVERSITY OF HAWAII
Technical Report No. 28
September 1971
ACKNOWLEDGMENTS •
INTRODUCTION
MATERIALS AND METHODS •
RESULTS AND DISCUSSION
TABLE OF CONTENTS
A. Comparison of E"lops and Cranos •
B. Comparison of Biota from the Ala Wai Canal and
Manoa Stream •
C.
SUMMARY •
APPENDIX
A.
B.
Comparison of Manoa and Palolo Organisms •
Residue Content of E"lop s hxwaiensi s (ppm)
Residue Content of Cmnos cmnos (ppm)
BIBLIOGRAPHY
.ii
1
9
• 10
• 10
• 19
• 23
• 27
• 29
• 30
• 34
• 36
ii
ACKNOWLEDGEMENTS
The author would like to acknowledge: Mr. William Yauger and the
staff at the Community Studies on Pesticides for their interest and
assistance in this study and for the generous use of the facilities at
CSP; and Mrs. Jackie Miller for obtaining the samples as a part of the
Ala Wai Canal Project in the Department of Oceanography, a project
supported by the State of Hawaii Department of Land and Natural
Resources. The project was also supported in part by the University of
Hawaii Environmental Center. Garth I. Murphy, Arthur Bevenue, and
Peter Kroopnick guided the research.
INTRODUCTION
The Ala Wai Canal is an estuary running through urban Honolulu.
It was built in 1927 by the Army Corps of Engineers to reclaim the
marsh lands in the area that is now known as Waikiki. It currently
serves as a drainage canal, receiving waters from the Manoa and Pa1o10
Streams and runoff from the Ala Wai Golf Course. Two years ago, a
comprehensive study of the canal was initiated by the University of
Hawaii Institute of Marine Biology. Included in this study are the
physical and chemical characteristics of the canal (Gonzalez, 1971)
as well as several ecological studies of the biota. One phase of the
biological study consisted of a survey: of the types of organisms which
inhabit the canal including several species of fish. The fish for this
particular study were obtained by gill nets which were set out once a
week in various locations in the canal. After capture the fish were
measured and weighed and later the stomachs were examined for their
contents.
Chlorinated pesticide residues in the Ala Wai Canal have not been
previously examined, and it was decided to analyze the fish from the
canal, since they would serve as long term indicators of the presence
or absence of the residues. Two of the species studied were the Elope
~aien~8 commonly known as the Ten Pounder or Awaawa, and the Chanoe
cr.anoe commonly known as the mi1kfish or Awa. Since the Elopa is a
carnivore and the Chanoe a plankton and detrital feeder of nearly the
same size, it seemed that a comparison of the two species might provide
interesting data on the food chain in relation to pesticide residues.
The values for the Elopa and the Cr.anoa are integrative over the entire
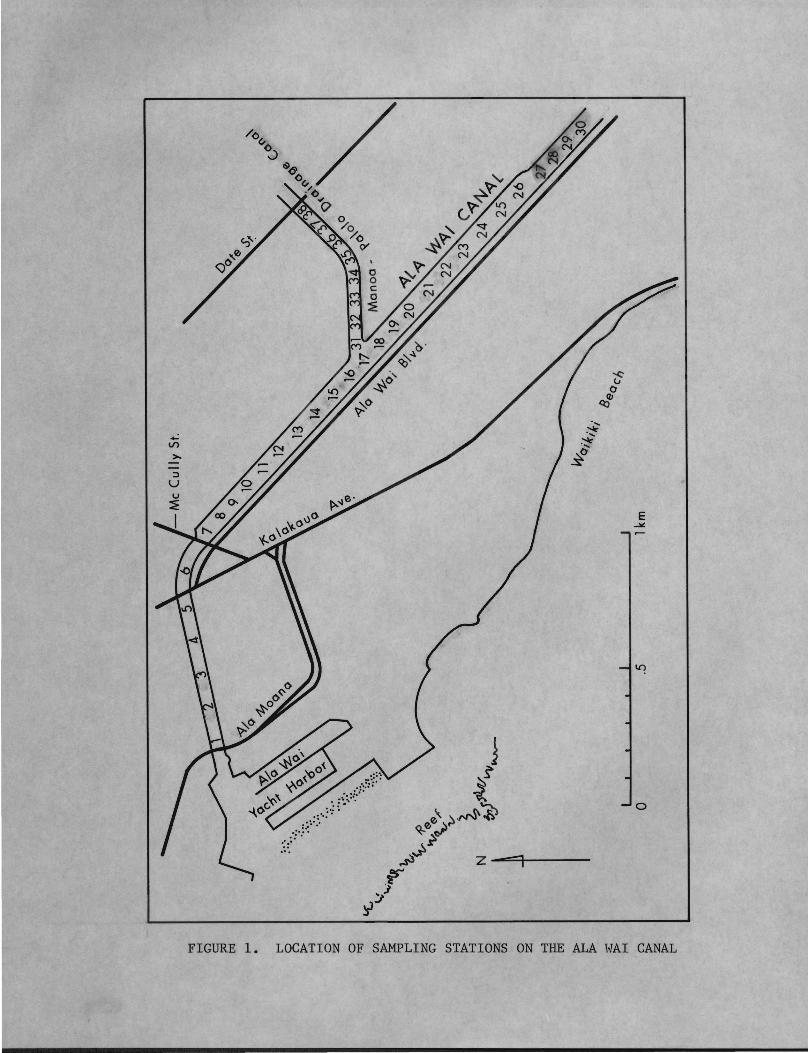
FIGURE 1. LOCATION OF SAMPLING STATIONS ON THE ALA WAI CANAL
3
canal and thus provide little information regarding the contribution
of the Manoa and Palolo Streams to pesticide residues. In order to
determine what portion of the pesticides are being contributed to the
canal from these streams, samples of water, fish and algae were taken
at various stations in the canal and stream areas. (Figure 1.)
Water and sediment samples were taken at Stations 29, 6 and 38;
samples of mollies, MoZZiem si.a IfJhanophs" were taken at Station 30;
samples of algae, UZva" were taken at Station 2; and, guppies, Lebistes
retiauZatus" and algae, Pithophora" were taken up in the stream halfway
between Date Street and Kalakaua Avenue--the salinity at this location
was nearly zero. Later, samples of algae, guppies and mollies were
taken from the Manoa Stream near the tennis courts on Dole Street and
from the Palolo Stream near St. Louis High School, Waialae Avenue, The
fish were caught with a hand seine and the algae was picked off the
bottoms of the streams.
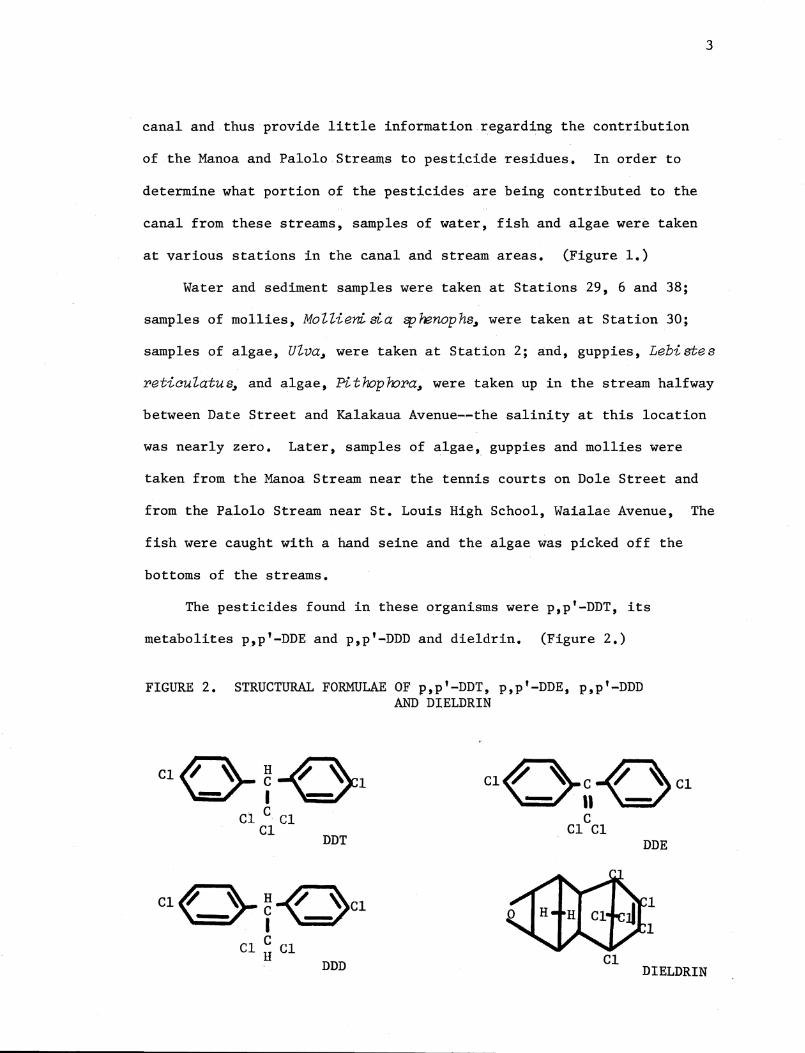
The pesticides found in these organisms were p,p'-DDT, its
metabolites p,p'-DDE and p,p'-DDD and dieldrin. (Figure 2.)
FIGURE 2. STRUCTURAL FORMULAE OF p,p'-DDT, p,p'-DDE, p,p'-DDD AND DIELDRIN
Cl~ ~~Cl "===T I '==7
Cl ~ Cl DDD
Cl~-C~Cl "'==.T II "==7
C Cl Cl
Cl
DDE
DIELDRIN
4
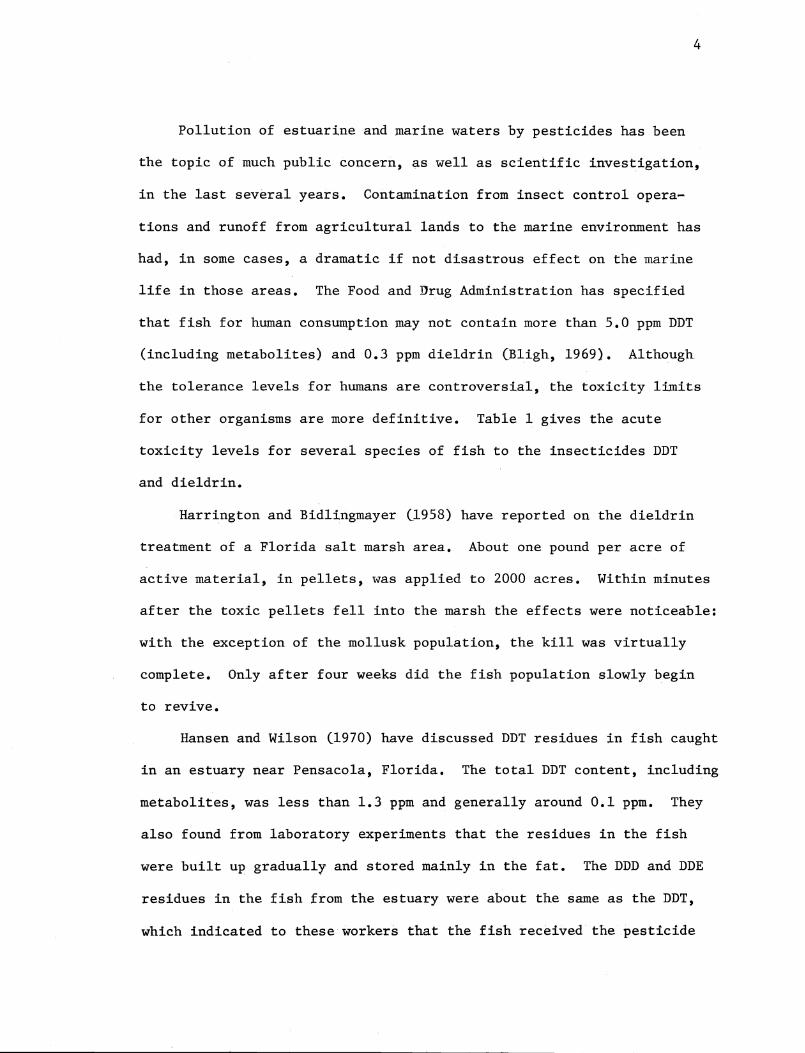
Pollution of estuarine and marine waters by pesticides has been
the topic of much public concern, as well as scientific investigation,
in the last several years. Contamination from insect control opera
tions and runoff from agricultural lands to the marine environment has
had, in some cases, a dramatic if not disastrous effect on the marine
life in those areas. The Food and Drug Administration has specified
that fish for human consumption may not contain more than 5.0 ppm DDT
(including metabolites) and 0.3 ppm dieldrin (Bligh, 1969). Although
the tolerance levels for humans are controversial, the toxicity limits
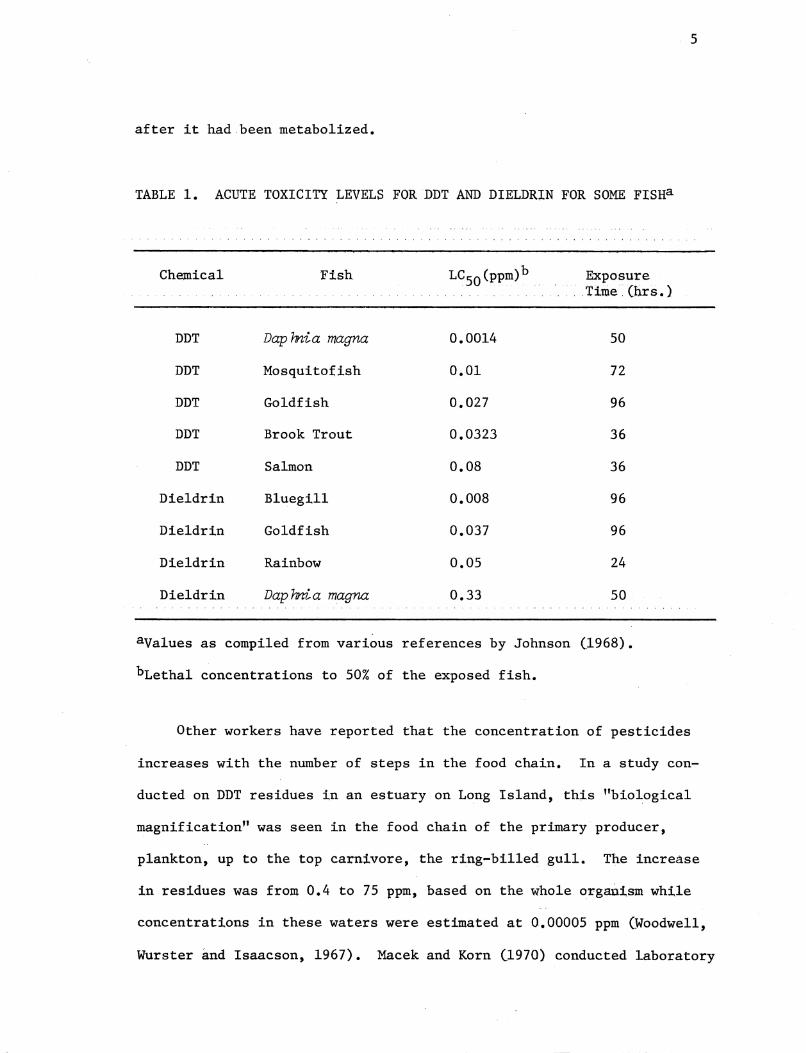
for other organisms are more definitive. Table 1 gives the acute
toxicity levels for several species of fish to the insecticides DDT
and dieldrin.
Harrington and Bidlirigmayer (1958) have reported on the dieldrin
treatment of a Florida salt marsh area. About one pound per acre of
active material, in pellets, was applied to 2000 acres. Within minutes
after the toxic pellets fell into the marsh the effects were noticeable:
with the exception of the mollusk population, the kill was virtually
complete. Only after four weeks did the fish population slowly begin
to revive.
Hansen and Wilson (1970) have discussed DDT residues in fish caught
in an estuary near Pensacola, Florida. The total DDT content, including
metabolites, was less than 1.3 ppm and generally around 0.1 ppm. They
also found from laboratory experiments that the residues in the fish
were built up gradually and stored mainly in the fat. The DDD and DDE
residues in the fish from the estuary were about the same as the DDT,
which indicated to these workers that the fish received the pesticide
after it had been metabolized.
TABLE 1. ACUTE TOXICITX LEVELS ~OR DDT AND DIELDRIN FOR SOME FISHa
Chentical Fish LC50 (ppm) b . Exposure , ..... ... T:l1ne . (hrs.)
DDT Da:p hnia magna 0.0014 50
DDT Mosquitofish 0.01 72
DDT Goldfish 0.027 96
DDT Brook Trout 0.0323 36
DDT Salmon 0.08 36
Dieldrin Bluegill 0.008 96
Dieldrin Goldfish 0.037 96
Dieldrin Rainbow 0.05 24
Dieldrin Vap mia magna 0.33 50
aValues as compiled from various references by Johnson (1968).
bLethal concentrations to 50% of the exposed fish.
Other workers have reported that the concentration of pesticides
5
increases with the number of steps in the food chain. In a study con-
ducted on DDT residues in an estuary on Long Island, this "biological
magnification" was seen in the food chain of the primary producer,
plankton, up to the top carnivore, the ring-billed gull. The increase
in residues was from 0.4 to 75 ppm, based on the whole organism while
concentrations in these waters were estimated at 0.00005 ppm (Woodwell,
Wurster and Isaacson, 1967). Macek and Korn (1970) conducted laboratory
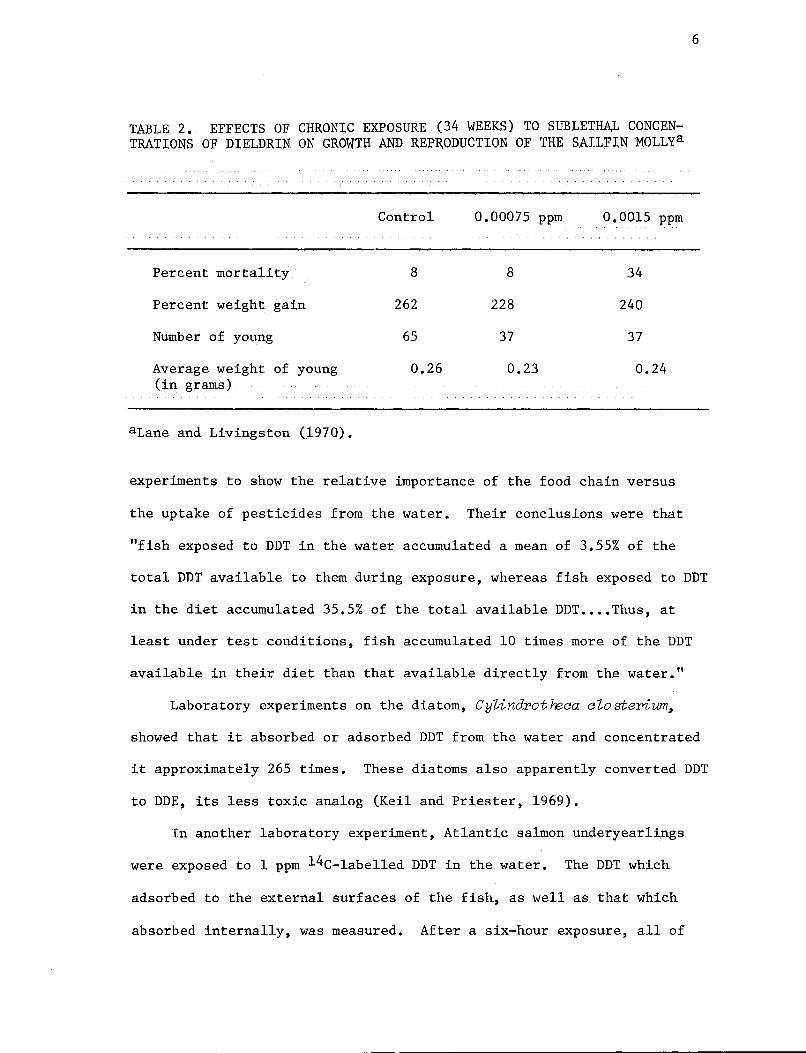
TABLE 2. EFFECTS OF CHRONIC EXPOSURE .. (34 WEEKS) TO SUBLETHAL CONCEN~ TRATIONS OF DIELDRIN ON GROWTH AND REPRODUCTION OF THE S.AJL;FIN MOLLya
Percent mortality
Percent weight gain
Number of young
Average weight of young (in grams)
aLane and Livingston (1970).
Control
8
262
65
0.26
0.00075 ppm 0.0015 ppm
8 34
228 240
37 37
0.23 0.24
experiments to show the relative importance of the food chain versus
the uptake of pesticides from the water. Their conclusions were that
"fish exposed to DDT in the water accumulated a mean of 3.55% of the
6
total DDT available to them during exposure, whereas fish exposed to DDT
in the diet accumulated 35.5% of the total available DDT •••• Thus, at
least under test conditions, fish accumulated 10 times more of the DDT
available in their diet than that available directly from the water."
Laboratory experiments on the diatom, CyZindrotneca cZosterium~
showed that it absorbed or adsorbed DDT from the water and concentrated
it approximately 265 times. These diatoms also apparently converted DDT
to DDE, its less toxic analog (Kei1 and Priester, 1969).
In another laboratory experiment, Atlantic salmon underyear1ings
were exposed to 1 ppm 14C~labe11ed DDT in the water. The DDT which
adsorbed to the external surfaces of the fish, as well as that which
absorbed internally, was measured. After a six-hour exposure, all of
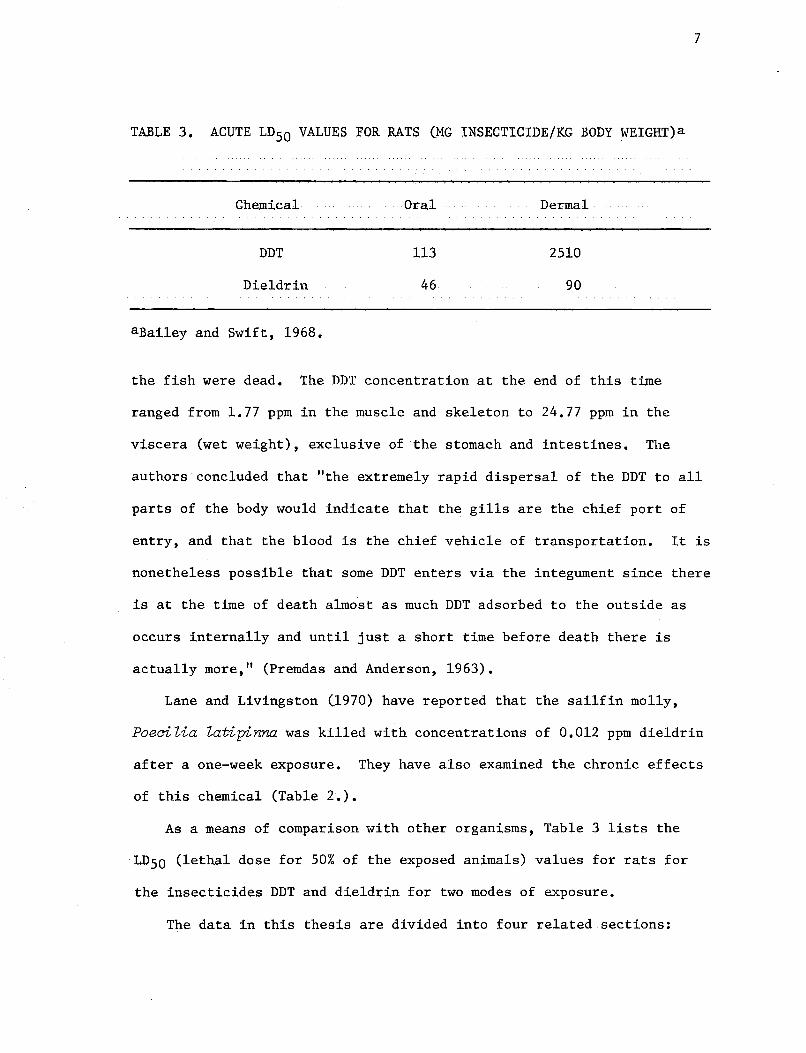
TABLE 3. ACUTE LD50 VALUES FOR RATS (MG INSECTICIDE/KG BODY WEIGHT) a
Chemical
DDT
Dieldrin
aBailey and Swift, 1968.
Oral
113
46
Dermal
2510
90
7
the fish were dead. The DDT concentration at the end of this time
ranged from 1.77 ppm in the muscle and skeleton to 24.77 ppm in the
viscera (wet weight), exclusive of the stomach and intestines. The
authors concluded that "the extremely rapid dispersal of the DDT to all
parts of the body would indicate that the gills are the chief port of
entry, and that the blood is the chief vehicle of transportation. It is
nonetheless possible that some DDT enters via the integument since there
is at the time of death almost as much DDT adsorbed to the outside as
occurs internally and until just a short time before death there is
actually more," (Premdas and Anderson, 1963).
Lane and Livingston (1970) have reported that the sailfin molly,
PoeaiZia Zatipinna was killed with concentrations of 0.012 ppm dieldrin
after a one-week exposure. They have also examined the chronic effects
of this chemical (Table 2.).
As a means of comparison with other organisms, Table 3 lists the
'LD50 (lethal dose for 50% of the exposed animals) values for rats for
the insecticides DDT and dieldrin for two modes of exposure.
The data in this thesis are divided into four related sections:
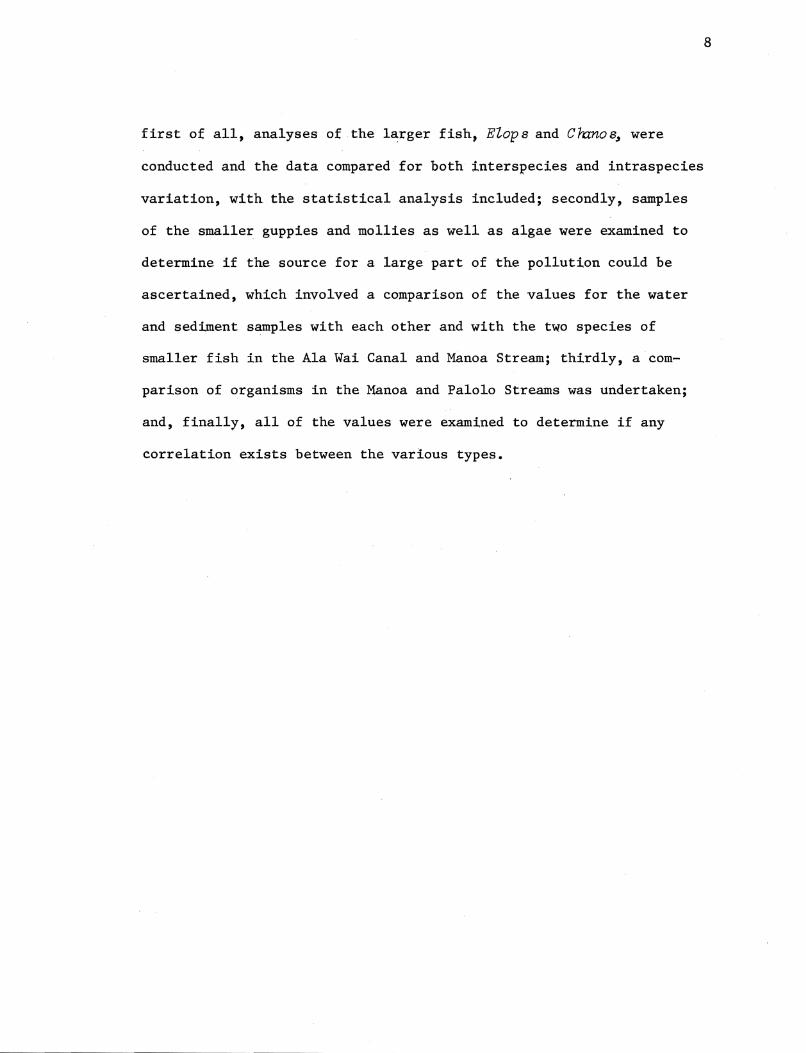
first 0:1; all, analyses of the larger fish, E"lops and CranosJ were
conducted and the data compared for both interspecies and intraspecies
variation, with the statistical analysis included; secondly, samples
of the smaller guppies and mollies as well as algae were examined to
determine if the source for a large part of the pollution could be
ascertained, which involved a comparison of the values for the water
and sediment samples with each other and with the two species of
smaller fish in the Ala Wai Canal and Manoa Stream; thirdly, a com
parison of organisms in the Manoa and Palolo Streams was undertaken;
and, finally, all of the values were examined to determine if any
correlation exists between the various types.
8
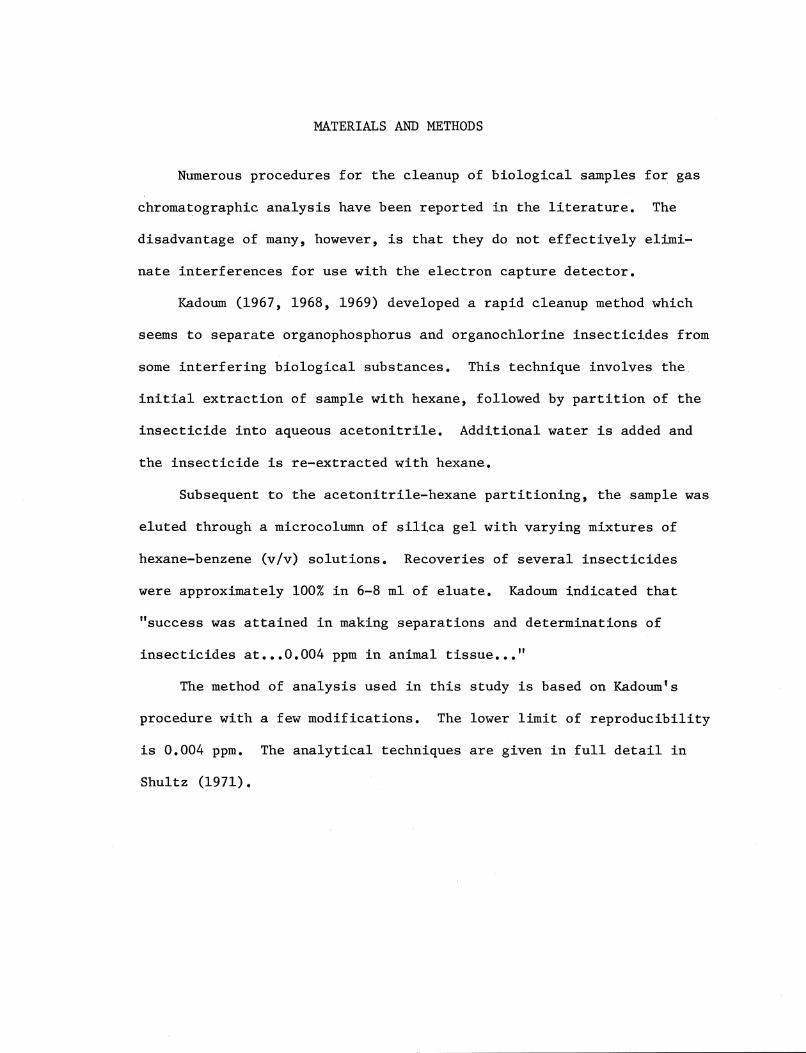
MATERIALS AND METHODS
Numerous procedures for the cleanup of oiological samples for gas
chromatographic analysis have been reported in the literature. The
disadvantage of many, however, is that they do not effectively elimi
nate interferences for use with the electron capture detector.
Kadoum (1967, 1968, 1969) developed a rapid cleanup method which
seems to separate organophosphorus and organochlorine insecticides from
some interfering biological substances. This technique involves the
initial extraction of sample with hexane, followed by partition of the
insecticide into aqueous acetonitrile. Additional water is added and
the insecticide is re-extracted with hexane.
Subsequent to the acetonitrile-hexane partitioning, the sample was
eluted through a microco1umn of silica gel with varying mixtures of
hexane-benzene (v/v) solutions. Recoveries of several insecticides
were approximately 100% in 6-8 m1 of eluate. Kadoum indicated that
"success was attained in making separations and determinations of
insecticides at ••• 0.004 ppm in animal tissue ••• "
The method of analysis used in this study is based on Kadoum's
procedure with a few modifications. The lower limit of reproducibility
is 0.004 ppm. The analytical techniques are given in full detail in
Shultz (1971).
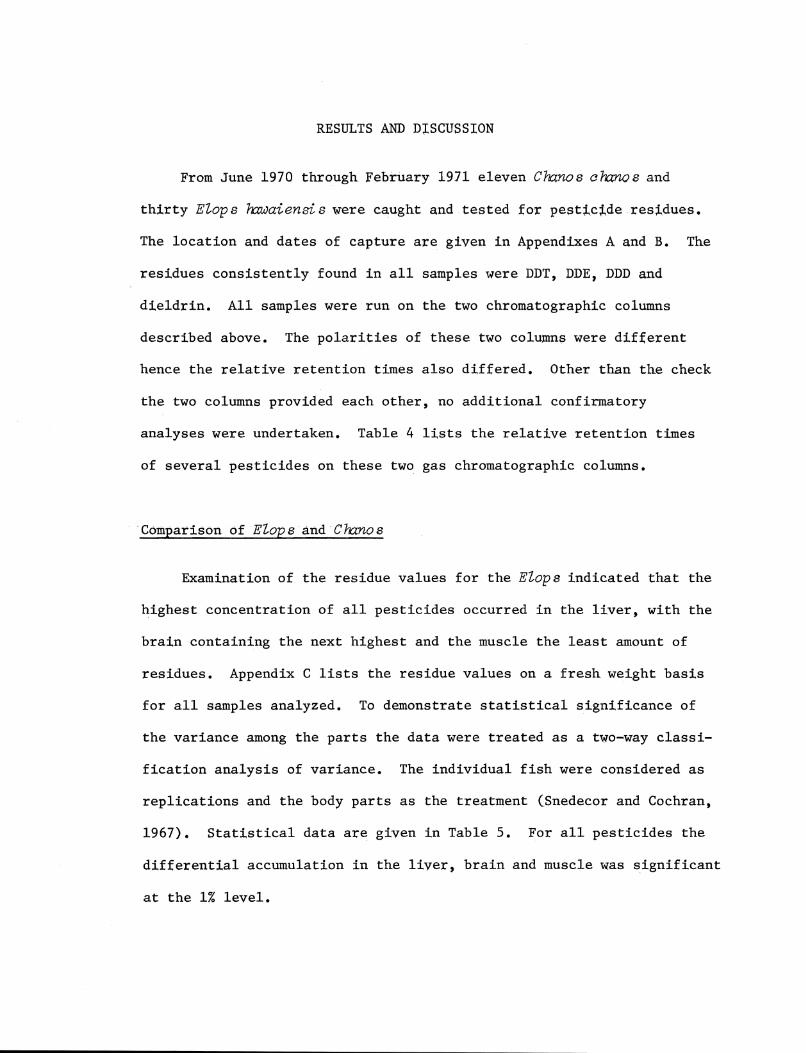
RESULTS AND DJSCUSSION
From June 1970 through February 1971 eleven Cho;YW$ chemoa and
thirty Elopa hxwaiensis were caught and tested £or pesticide residues.
The location and dates of capture are given in Appendixes A and B. The
residues consistently found in all samples were DDT, DDE, DDD and
dieldrin. All samples were run on the two chromatographic columns
described above. The polarities of these two columns were dif£erent
hence the relative retention times also dif£ered. Other than the check
the two columns provided each other, no additional confirmatory
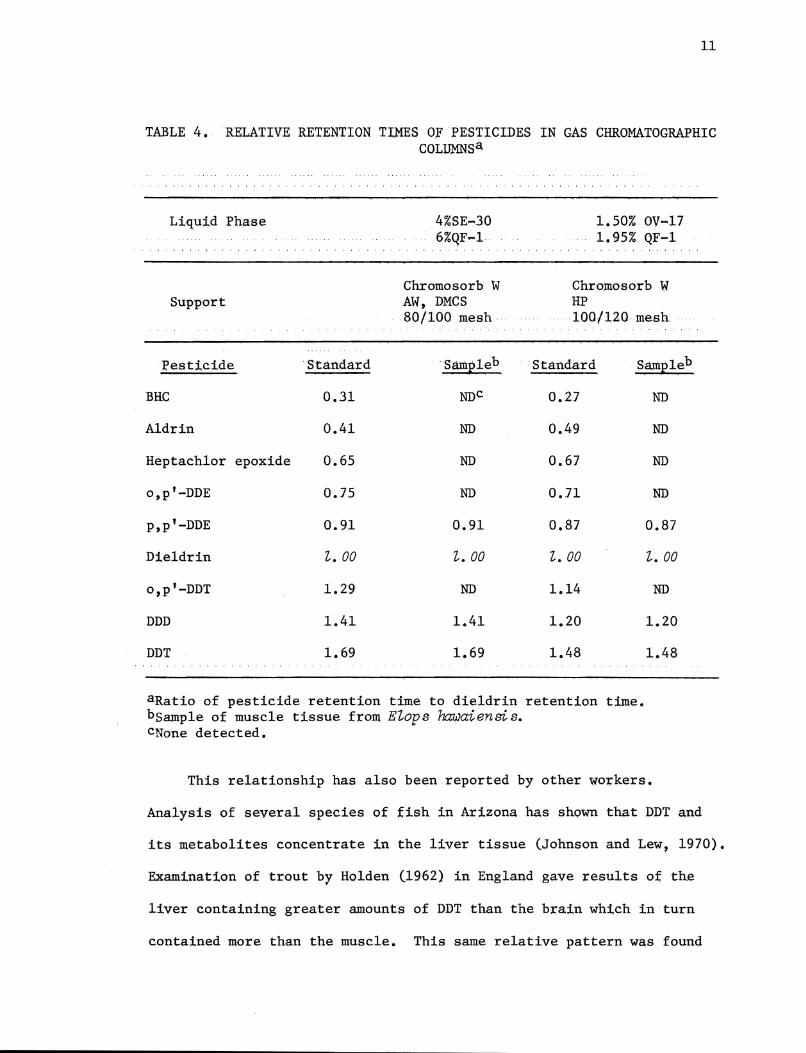
analyses were undertaken. Table 4 lists the relative retention times
of several pesticides on these two gas chromatographic columns •
. Comparison of Elop a . and· Ch::rno a
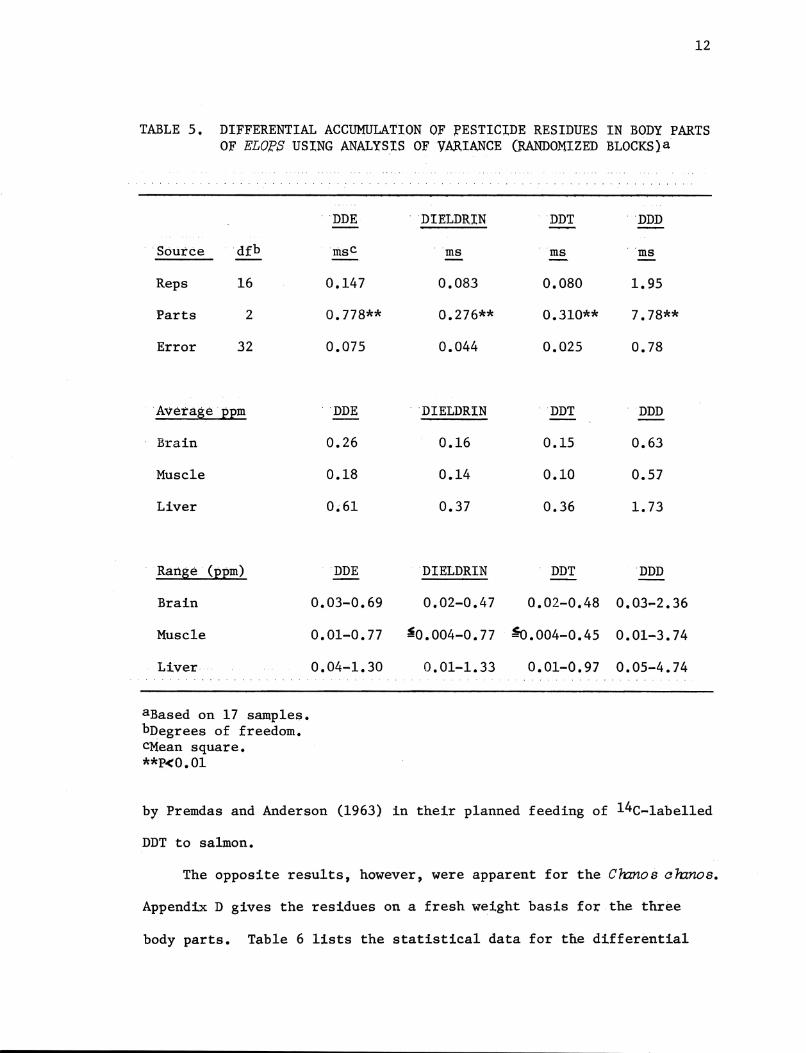
Examination of the residue values for the Elopa indicated that the
highest concentration of all pesticides occurred in the liver, with the
brain containing the next highest and the muscle the least amount of
residues. Appendix C lists the residue values on a fresh weight basis
for all samples analyzed. To demonstrate statistical significance of
the variance among the parts the data were treated as a two-way classi
fication analysis of variance. The individual fish were considered as
replications and the body parts as the treatment (Snedecor and Cochran,
1967). Statistical data are given in Table 5. For all pesticides the
dif£erential accumulation in the liver, brain and muscle was signi£icant
at the 1% level.
11
TABLE 4. RELATIVE RETENTION TIMES O~ PESTICIDES IN GAS CHROMATOGRAPHIC COLlJ,MNSa,
Liquid Phase
Support
Pesticide . Standard
BHC 0.31
Aldrin 0.41
Heptachlor epoxide 0.65
o,p'-DDE 0.75
p,p'-DDE 0.91
Dieldrin l.00
o,p'-DDT 1.29
DDD 1.41
DDT 1.69
4%SE~30
6%QF-l
Chromo sorb W AW, DMCS 80/100 mesh
. ·Sampleb
NDc
ND
ND
ND
0.91
l. 00
ND
1.41
1.69
1.50% OV-17 1.95% QF-l
Chroroosorb W HP .100/120 mesh
. Standard Sampleb
0.27 ND
0.49 ND
0.67 ND
0.71 ND
0.87 0.87
Z.OO Z~ 00
1.14 ND
1.20 1.20
1.48 1.48
aRatio of pesticide retention time to dieldrin retention time. bSample of muscle tissue from EZops hawa£enBi s. cNone detected.
This relationship has also been reported by other workers.
Analysis of several species of fish in Arizona has shown that DDT a,nd
its metabolites concentrate in the liver tissue (Johnson and Lew, 1970).
Examination of trout by Holden (1962) in England gave results Of the
liver containing greater amounts of DDT than the brain which in turn
contained more than the muscle. This same relative pattern was found
12
TABLE 5. DIFFERENTIAL ACCUMULATION OF ;PESTICIDE RESIDUES IN BODY PARTS OF ELO?S USING ANALYSIS OF VARIANCE (RANDOMIZED BLOCKS}a
Sourcedfb
Reps 16
Parts 2
Error 32
Average ppm
Brain
Muscle
Liver
Rartge (ppm)
Brain
Muscle
Liver
aBased on 17 samples. bDegrees of freedom. CMean square. **P<O.Ol
, > •••• . , , ..... ,
·DDE . DIELDRIN DDT ·DDD
msc .. ms ms . . ms
0.147 0.OS3 O.OSO 1. 95
O.77S** 0.276** 0.310** 7.7S**
0.075 0.044 0.025 0.78
·DDEDIELDRIN DDT DDD
0.26 0.16 0.15 0.63
O.lS 0.14 0.10 0.57
0.61 0.37 0.36 1.73
DDEDIELDRIN DDT DDD
0.03-0.69 0.02-0.47 0.02~0.48 0.03-2.36
0.01-0.77 ~0.004-0.77 ~.004-0.45 0.01-3.74
0.04-1.30 0.01-1.33 0.01-0.97 0.05-4.74
by Premdas and Anderson (1963) in their planned feeding of 14C-1abe11ed
DDT to salmon.
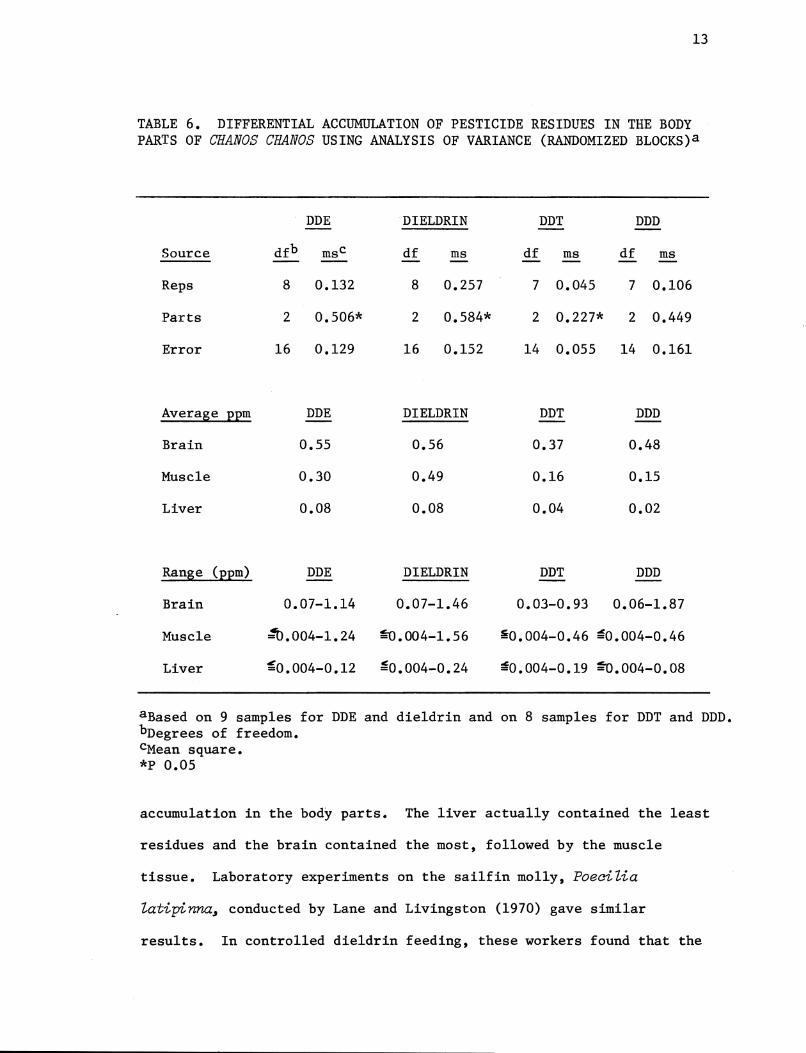
The opposite results, however, were apparent for the Cnanos ananos.
Appendix D gives the residues on a fresh weight basis for the three
body parts. Table 6 lists the statistical data for the differential
13
TABLE 6. DIFFERENTIAL ACCUMULATION OF PESTICIDE RESIDUES IN THE BODY PARTS OF CHANOS CHANOS USING ANALYSIS OF VARIANCE (RANDOMIZED BLOCKS)a
DDE
Source
Reps 8 0.132
Parts 2 0.506*
Error 16 0.129
Average ppm DDE
Brain 0.55
Muscle 0.30
Liver 0.08
Range (EEm) DDE
Brain 0.07-1.14
Muscle :0.004-1. 24
Liver ~0.004-0.12
DIELDRIN
df ms
8 0.257
2 0.584*
16 0.152
DIELDRIN
0.56
0.49
0.08
DIELDRIN
0.07-1.46
~.004-1.56
~0.004-0.24
DDT DDD
df ms df ms
7 0.045 7 0.106
2 0.227* 2 0.449
14 0.055 14 0.161
DDT
0.37
0.16
0.04
DDT
0.03-0.93
DDD
0.48
0.15
0.02
DDD
0.06-1.87
~0.004-0.46 ~0.004-0.46
~0.004-0.19 ~.004-0.08
aBased on 9 samples for DDE and dieldrin and on 8 samples for DDT and DDD. bDegrees of freedom. cMean square. *p 0.05
accumulation in the body parts. The liver actually contained the least
residues and the brain contained the most, followed by the muscle
tissue. Laboratory experiments on the sai1fin molly, PoeaiZia
Zatipinna, conducted by Lane and Livingston (1970) gave similar
results. In controlled dieldrin feeding, these workers found that the
14
brain accumulated higher residues than the liver which contained about
66% as much as the brain. The muscle tissue contained the least of
these three body parts.
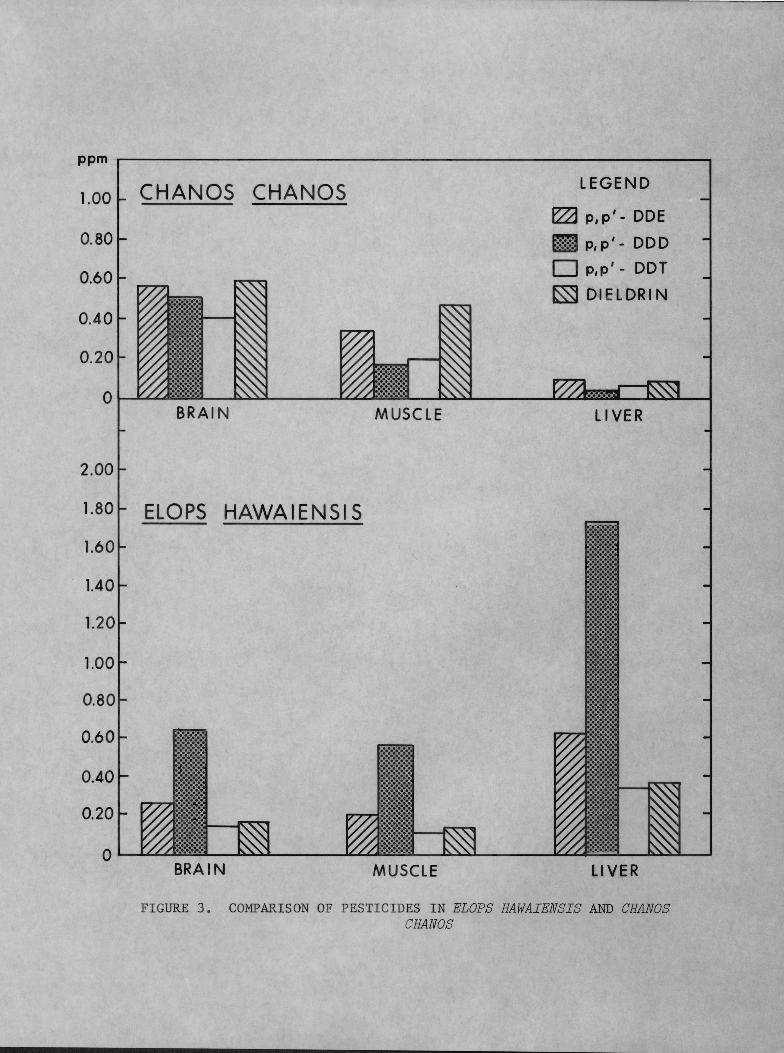
Although both species inhabit lagoons, brackish water and the
oceanic coastal areas, differences are evident. The EZops attains a
size of perhaps two feet while the Ghanos may reach three feet or
larger. The diet of the EZops consists of small fish and crustacea.
Plant material, detritus and plankton make up the diet of the Ghanos
(Hildebrand, 1943). It would seem that because the EZops is higher on
the food chain than the other species it should have the greater con
centration of pesticides. Examination of Figure 3 suggests that the
opposite may be true. The statistical evidence is given in Table 7.
The liver of the EZops contained significantly more residues than the
liver of the Granos. For the other tissues, however, the GhanOS had
accumulated more. Significance in brain tissues was reached for all
pesticides except DDD and even for this pesticide the average does
point to a greater concentration in the Chxnos. In the muscle tissue,
although not statistically significant with the exception of dieldrin,
Chxnos generally contained higher residues than its counterpart.
In human tissue, studies on pesticides have revealed that the
residue accumulation is dependent on the lipid content of the tissue
(Morgan and Roan, 1970). Studies on fish have shown that the
difference in residue values reported between species and individuals
within species can be lessened if the values are reported on an oil
basis rather than on a whole fish basis. Reinert (1970) cited the
example of two species of fish found in the Great Lakes: The DDT and
ppm r-------------------------------------------------~
O (HANOS (HANOS 1.0
0.80
0.60
0.40
0.20
BRAIN
2.00
1.80 ELOPS HAWAIENSI S
1.60
1.40
1.20
1.00
0.80
0.60
0.40
0.20
BRAIN
MUSCLE
MUSCLE
LEGEND
~ p,p' - DOE
tm:?J p, p' - DOD
o p,p' - DDT
~ DIELDRIN
LIVER
LIVER
F IGURE 3 . COMPARISON OF PESTICIDES IN ELOPS HAWAIENSIS AND CHANOS CBANOS
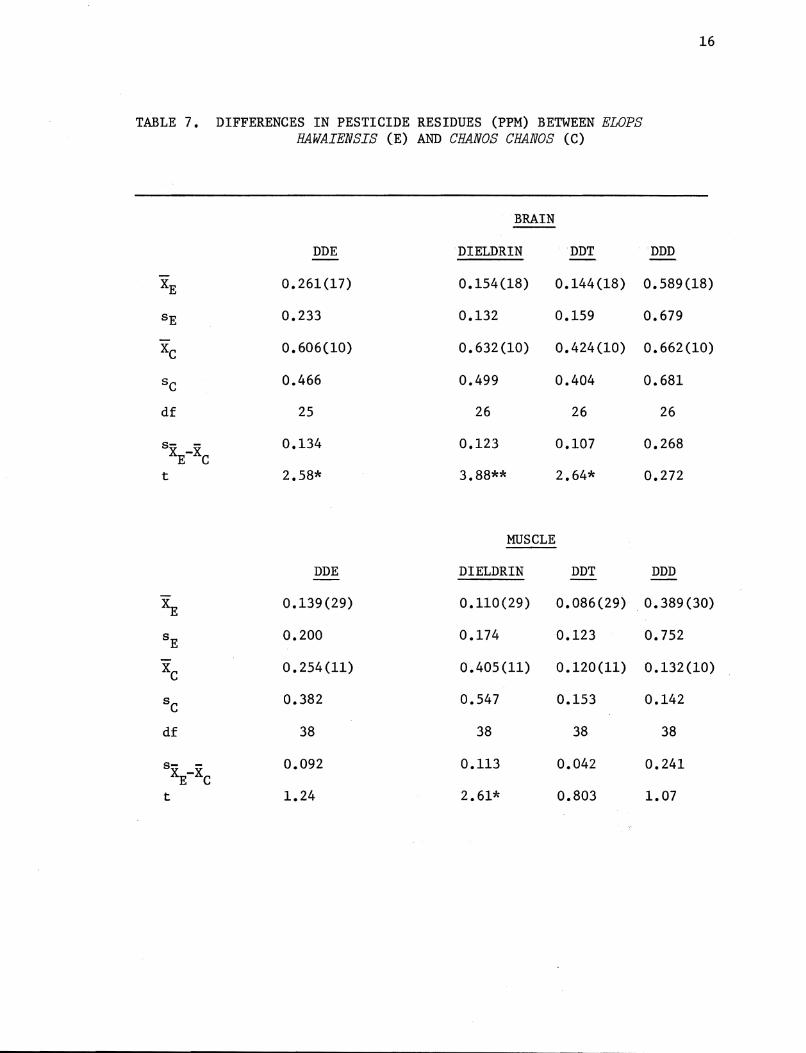
TABLE 7. DIFFERENCES IN PESTICIDE RESIDUES (PPM) BETWEEN ELOPS HAWAIENSIS (E) AND CBANOS CBANOS (C)
BRAIN
DDE DIELDRIN DDT
XE 0.261(17) 0.154(18) 0.144(18)
sE 0.233 0.l32 0.159
Xc 0.606(10) 0.632(10) 0.424(10)
Sc 0.466 0.499 0.404
df 25 26 26
s- -XE-XC
0.l34 0.123 0.107
t 2.58* 3.88** 2.64*
MUSCLE
DDE DIELDRIN DDT
XE 0.139(29) 0.110(29) 0.086(29)
sE 0.200 0.174 0.123
Xc 0.254(11) 0.405(11) 0.120(11)
Sc 0.382 0.547 0.153
df 38 38 38
s- -XE-XC
0.092 0.113 0.042
t 1.24 2.61* 0.803
16
DDD
0.589(18)
0.679
0.662(10)
0.681
26
0.268
0.272
DDD
0.389(30)
0.752
0.l32(10)
0.142
38
0.241
1.07
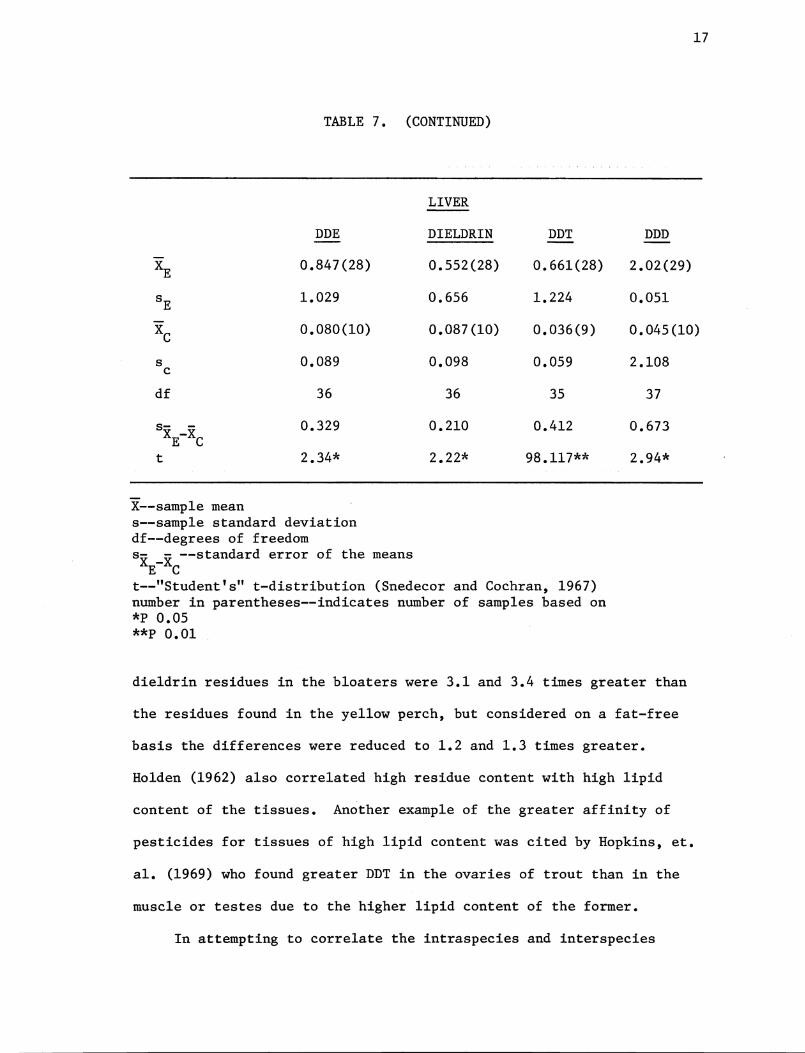
17
TABLE 7. (CONTINUED)
LIVER
DDE DIELDRIN DDT DDD
XE 0.847(28) 0.552(28) 0.661(28) 2.02(29)
sE 1.029 0.656 1.224 0.051
Xc 0.080(10) 0.087(10) 0.036(9) 0.045(10)
s 0.089 c
df 36
s- -XE-XC
0.329
t 2.34*
X--samp1e mean s--samp1e standard deviation df--degrees of freedom Sx -x --standard error of the means
E C
0.098 0.059
36 35
0.210 0.412
2.22* 98.117**
t--"Student's" t-distribution (Snedecor and Cochran, 1967) number in parentheses--indicates number of samples based on *p 0.05 **p 0.01
2.108
37
0.673
2.94*
dieldrin residues in the bloaters were 3.1 and 3.4 times greater than
the residues found in the yellow perch, but considered on a fat-free
basis the differences were reduced to 1.2 and 1.3 times greater.
Holden (1962) also correlated high residue content with high lipid
content of the tissues. Another example of the greater affinity of
pesticides for tissues of high lipid content was cited by Hopkins, et.
a1. (1969) who found greater DDT in the ovaries of trout than in the
muscle or testes due to the higher lipid content of the former.
In attempting to correlate the intraspecies and interspecies
EZops
Cranos
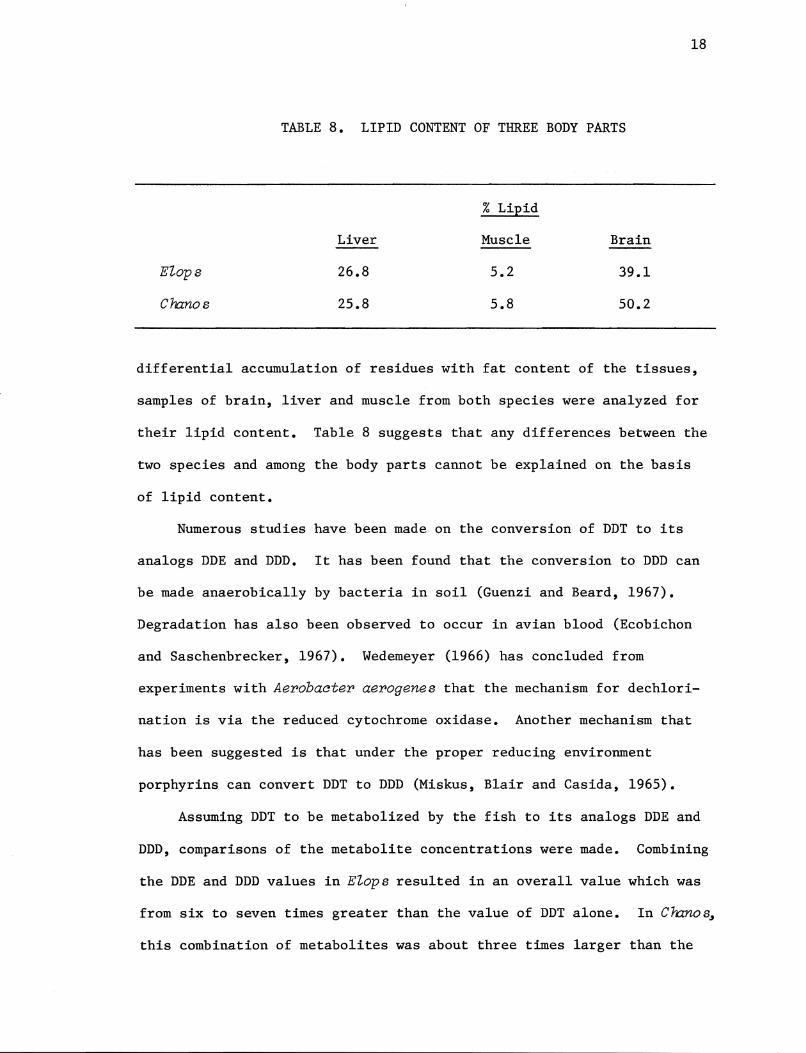
TABLE 8. LIPID CONTENT OF THREE BODY PARTS
Liver
26.8
25.8
% Lipid
Muscle
5.2
5.8
Brain
39.1
50.2
18
differential accumulation of residues with fat content of the tissues,
samples of brain, liver and muscle from both species were analyzed for
their lipid content. Table 8 suggests that any differences between the
two species and among the body parts cannot be explained on the basis
of lipid content.
Numerous studies have been made on the conversion of DDT to its
analogs DDE and DDD. It has been found that the conversion to DDD can
be made anaerobically by bacteria in soil (Guenzi and Beard, 1967).
Degradation has also been observed to occur in avian blood (Ecobichon
and Saschenbrecker, 1967). Wedemeyer (1966) has concluded from
experiments with Aerobacter aerogenes that the mechanism for dechlori
nation is via the reduced cytochrome oxidase. Another mechanism that
has been suggested is that under the proper reducing environment
porphyrins can convert DDT to DDD (Miskus, Blair and Casida, 1965).
Assuming DDT to be metabolized by the fish to its analogs DDE and
DDD, comparisons of the metabolite concentrations were made. Combining
the DDE and DDD values in EZops resulted in an overall value which was
from six to seven times greater than the value of DDT alone. In C1nnos~
this combination of metabolites was about three times larger than the
19
DDT value. This tends to indicate that both species received DDD and
DDE, as well as DDT, in their diet or through their gills. Whether the
fish accumulated the residues from the diet rather than through the
gills was not definitely determinable in this study, although if the
diet has been the primary source of pesticides it would be expected
that the organism highest on the food chain would have contained the
highest ratio of metabolites to DDT. Since the DDT in the EZops has
gone through more steps on the food chain than has the DDT in the
Cnanos the higher observed ratio of derivatives to the parent compound
in the former was a predictable result.
To further substantiate the food chain hypothesis, four Nehu,
StoZephorus puppuratus.J which were taken from the stomach of an EZops
were analyzed for pesticides. The average values were: DDE 0.03 ppm,
DDD 0.09 ppm, DDT 0.03 ppm and dieldrin 0.01 ppm. The metabolites DDE
and DDD were only four times greater than the parent compound in
contrast to the much higher ratio found in the EZops (6:1).
Comparison of Biota From the Ala Wai Canal and Manoa Stream
There appear to be two possibilities as primary sources for
pesticide entry into the Ala Wai Canal. The Ala Wai Golf Course which
borders the canal for a third of its length has utilized such insecti
cides as chlordane, DDT and diazinon. Termite and other insect control
spraying in Manoa and Pa1010 Valleys contributes such chemicals as
aldrin, dieldrin, BHC, c~lordane, DDT and diazinon, among others, to
the Ala Wai Canal (Evaluation of Pesticide Problems in Hawaii, Appendix,
1969). To gain insight into which source contributes more residues,
20
TABLE 9. PESTICIDE LEVELS a IN WATER FROM THREE STATIONS IN THE ALA WAI CANALb
Station Date Taken DDE Dieldrin DDD DDT
30 8-12-70 1 5.0 2.0 1.0
30 2-18-71 NDC 9.6 1.3 1.6
38 8-12-70 ND 17.0 3.0 3.0
38 2-26-71 ND 18.6 1.3 1.6
6 8-12-70 ND 16.0 3.0 2.0
6 2-26-71 ND 0.4 2.6 1.6
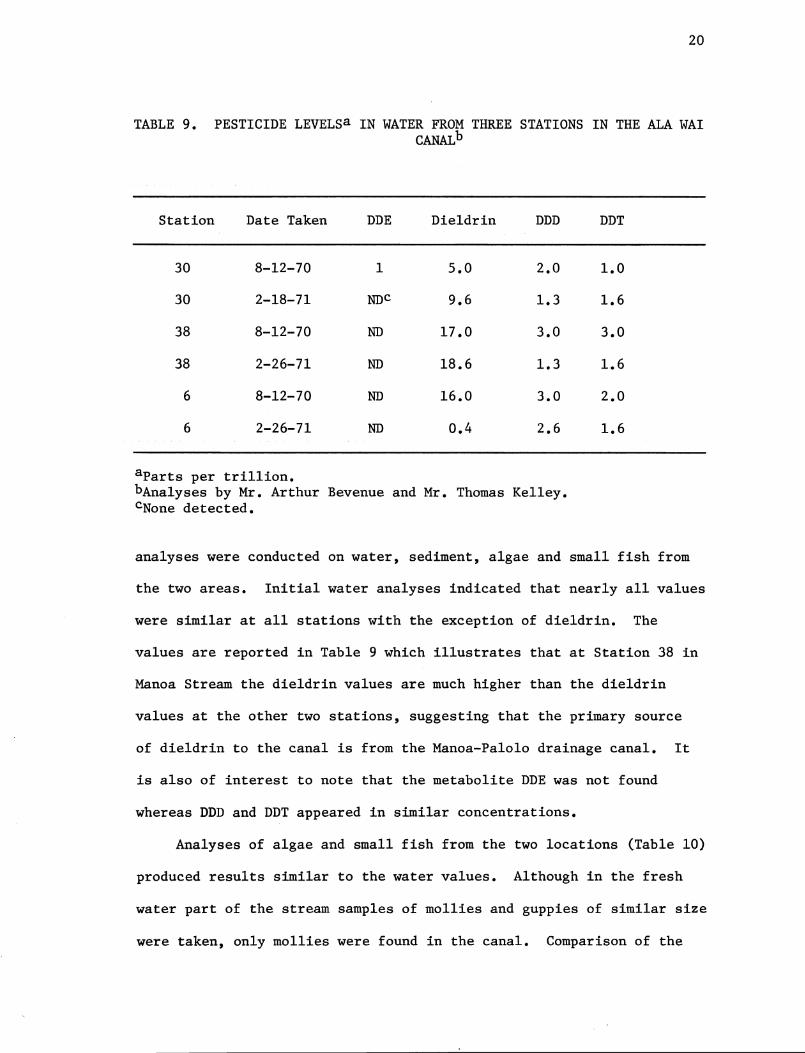
aparts per trillion. bAnalyses by Mr. Arthur Bevenue and Mr. Thomas Kelley. cNone detected.
analyses were conducted on water, sediment, algae and small fish from
the two areas. Initial water analyses indicated that nearly all values
were similar at all stations with the exception of dieldrin. The
values are reported in Table 9 which illustrates that at Station 38 in
Manoa Stream the dieldrin values are much higher than the dieldrin
values at the other two stations, suggesting that the primary source
of dieldrin to the canal is from the Manoa-Palolo drainage canal. It
is also of interest to note that the metabolite DDE was not found
whereas DDD and DDT appeared in similar concentrations.
Analyses of algae and small fish from the two locations (Table 10)
produced results similar to the water values. Although in the fresh
water part of the stream samples of mollies and guppies of similar size
were taken, only mollies were found in the canal. Comparison of the
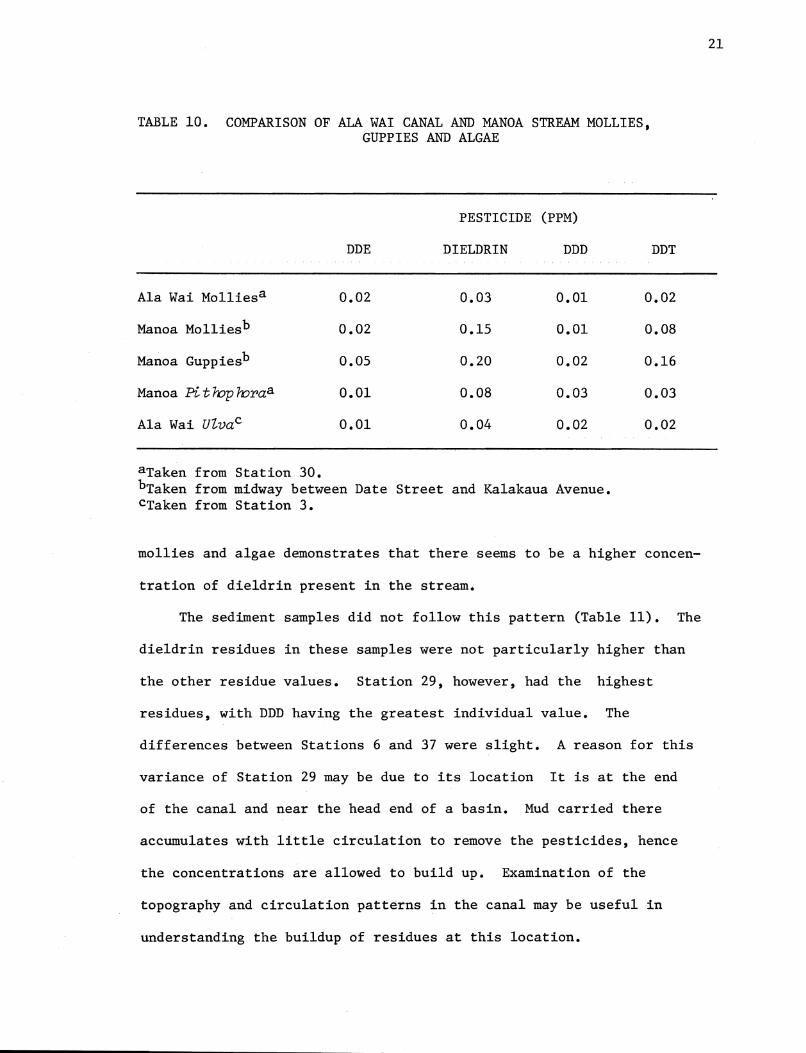
TABLE 10. COMPARISON OF ALA WAI CANAL AND MANOA STREAM MOLLIES, GUPPIES AND ALGAE
PESTICIDE (PPM)
DDE DIELDRIN DDD
Ala Wai Molliesa 0.02 0.03 0.01
Manoa Molliesb 0.02 0.15 0.01
Manoa Guppiesb 0.05 0.20 0.02
Manoa Pi t mp mr>aa 0.01 0.08 0.03
Ala Wai UZvac 0.01 0.04 0.02
aTaken from Station 30. bTaken from midway between Date Street and Kalakaua Avenue. cTaken from Station 3.
DDT
0.02
0.08
0.16
0.03
0.02
mollies and algae demonstrates that there seems to be a higher concen-
tration of dieldrin present in the stream.
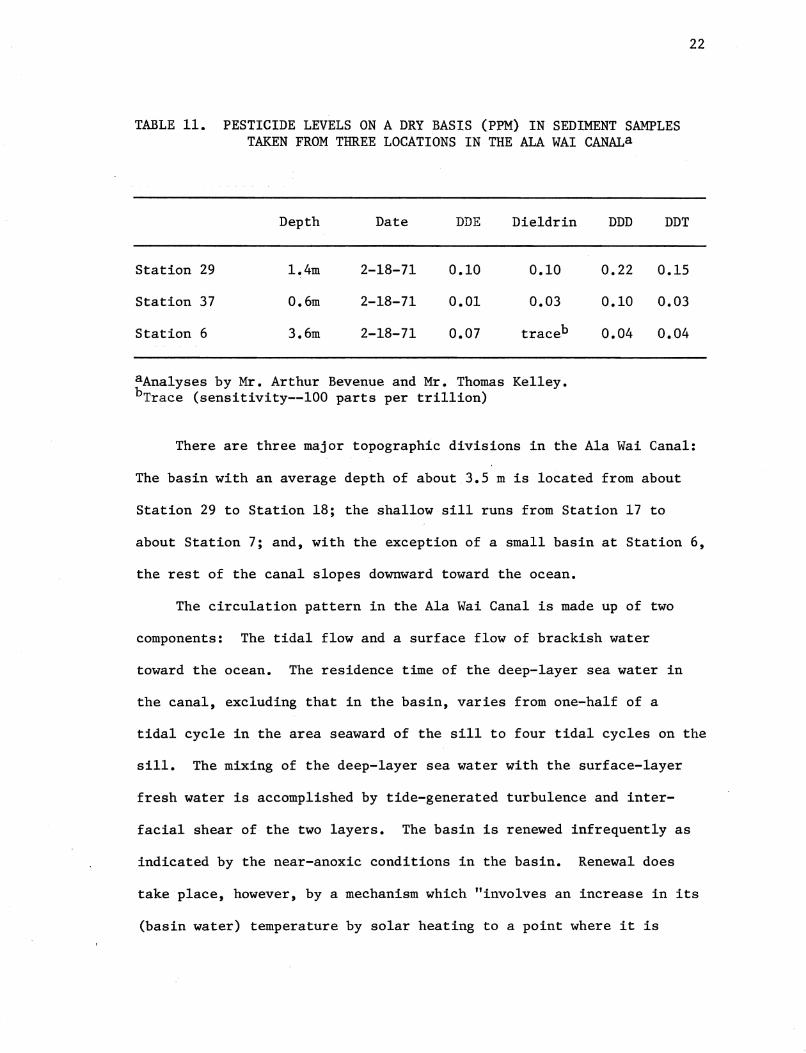
The sediment samples did not follow this pattern (Table 11). The
dieldrin residues in these samples were not particularly higher than
the other residue values. Station 29, however, had the highest
residues, with DDD having the greatest individual value. The
differences between Stations 6 and 37 were slight. A reason for this
variance of Station 29 may be due to its location It is at the end
of the canal and near the head end of a basin. Mud carried there
accumulates with little circulation to remove the pesticides, hence
the concentrations are allowed to build up. Examination of the
topography and circulation patterns in the canal may be useful in
understanding the buildup of residues at this location.
21
22
TABLE 11. PESTICIDE LEVELS ON A DRY BASIS (PPM) IN SEDIMENT SAMPLES TAKEN FROM THREE LOCATIONS IN THE ALA WAI CANAL a
Depth Date DDE Dieldrin DDD DDT
Station 29 1.4m 2-18-71 0.10 0.10 0.22 0.15
Station 37 0.6m 2-18-71 0.01 0.03 0.10 0.03
Station 6 3.6m 2-18-71 0.07 traceb 0.04 0.04
aAnalyses by Mr. Arthur Bevenue and Mr. Thomas bTrace (sensitivity--lOO parts per trillion)
Kelley.
There are three major topographic divisions in the Ala Wai Canal:
The basin with an average depth of about 3.5 m is located from about
Station 29 to Station 18; the shallow sill runs from Station 17 to
about Station 7; and, with the exception of a small basin at Station 6,
the rest of the canal slopes downward toward the ocean.
The circulation pattern in the Ala Wai Canal is made up of two
components: The tidal flow and a surface flow of brackish water
toward the ocean. The residence time of the deep-layer sea water in
the canal, excluding that in the basin, varies from one-half of a
tidal cycle in the area seaward of the sill to four tidal cycles on the
sill. The mixing of the deep-layer sea water with the surface-layer
fresh water is accomplished by tide-generated turbulence and inter-
facial shear of the two layers. The basin is renewed infrequently as
indicated by the near-anoxic conditions in the basin. Renewal does
take place, however, by a mechanism which "involves an increase in its
(basin water) temperature by solar heating to a point where it is
23
TABLE 12. PESTICIDE LEVELS IN ORGANISMS FROM MANOA AND PALOLO STREAMSa
Pesticide (ppm)
Location Type Date DDE Dieldrin DDT DDD
Manoa guppies 12-17-70 0.04 0.16 0.04 0.04
Pa1010 guppies 12-17-70 0.07 0.10 0.19 0.23
Pa1010 mo11ies 12-17-70 0.03 0.15 0.16 0.07
Pa101o a1gaeb 12-17-70 0.01 0,04 0.06 0.03
Manoa Pi thop hora 12-17-70 0.01 O.OS 0.03 0.03
Manoa guppies 4-1S-71 0.13 0.S4 0.33 0.42
Pa101o guppies 4-15-71 0.04 0.12 0.11 0.07
Manoa mo11ies 4-1S-71 0.08 0.40 0.09 0.28
Pa101o mo11ies 4-15-71 0.13 0.48 0.30 0.24
aManoa Stream location--near tennis courts, Dole Street; Pa101o Stream location--at St. Louis High School, Waia1ae Avenue
bStigeocZoniwn and Pithophora
lighter than the relatively cool water on the sill. On the flood tide
the sill water spills over into the basin, sinking to an appropriate
depth" (Gonzales, 1971).
Comparison of Manoa and Pa1010 Organisms
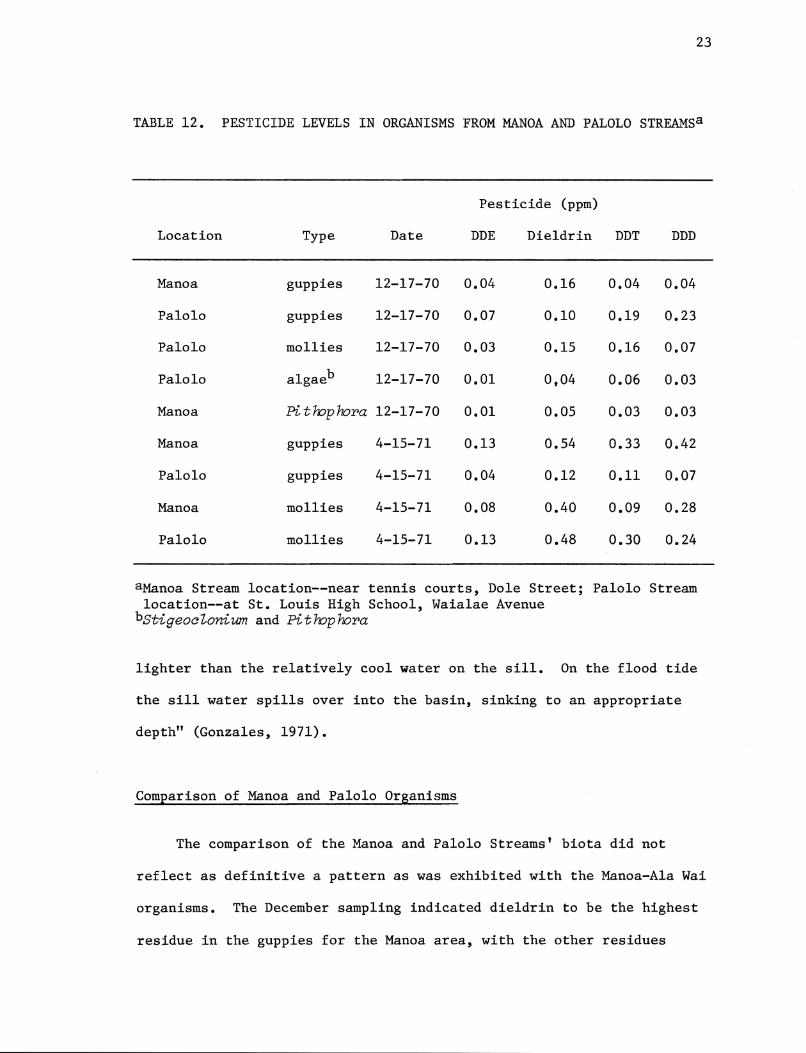
The comparison of the Manoa and Pa101o Streams' biota did not
reflect as definitive a pattern as was exhibited with the Manoa-Ala Wai
organisms. The December sampling indicated dieldrin to be the highest
residue in the guppies for the Manoa area, with the other residues
24
being nearly the same. The Palolo guppies contained more DDT and DDD
than dieldrin, while the algae samples hardly differed between areas.
The April sampling indicated that dieldrin was concentrated in higher
amounts than were the other insecticides. Overall, the concentrations
of pesticides found in the two species of fish increased over the
December sampling (Table 12). This could be a reflection of any of
several factors: The fish caught in December may have been younger,
thus having less exposure to the residues; there may have been more use
of the pesticides, especially dieldrin, in April as compared to
December; more of the residues may have been washed down the streams
in April compared to December. It is evident that the Manoa guppies
contained greater concentrations than the Pa1010 guppies, and it should
be noted that these fish were all females and of the same size. This
would then imply that greater concentrations of pesticides came from
Manoa Valley. Since termite control is widespread here this result is
not surprising. The situation, however, was not borne out by the
results from the mo11ies--for both areas the results were similar. It
is of interest, though, to realize that the Pa1010 organisms were about
1 1/2 times the size of the others. A larger size indicates a greater
age which would, in turn, indicate a greater exposure to the insecti
cides. Perhaps a longer exposure of the Pa1010 mo11ies helped to
balance a smaller initial concentration. In general, no pattern seemed
to be definitely determinable as the values for the stream organisms
were so varied. A possible trend however was that the Manoa area has
been contributing somewhat more to the overall insecticide concentra
tion in the Ala Wai Canal than has the Pa1010 area.
25
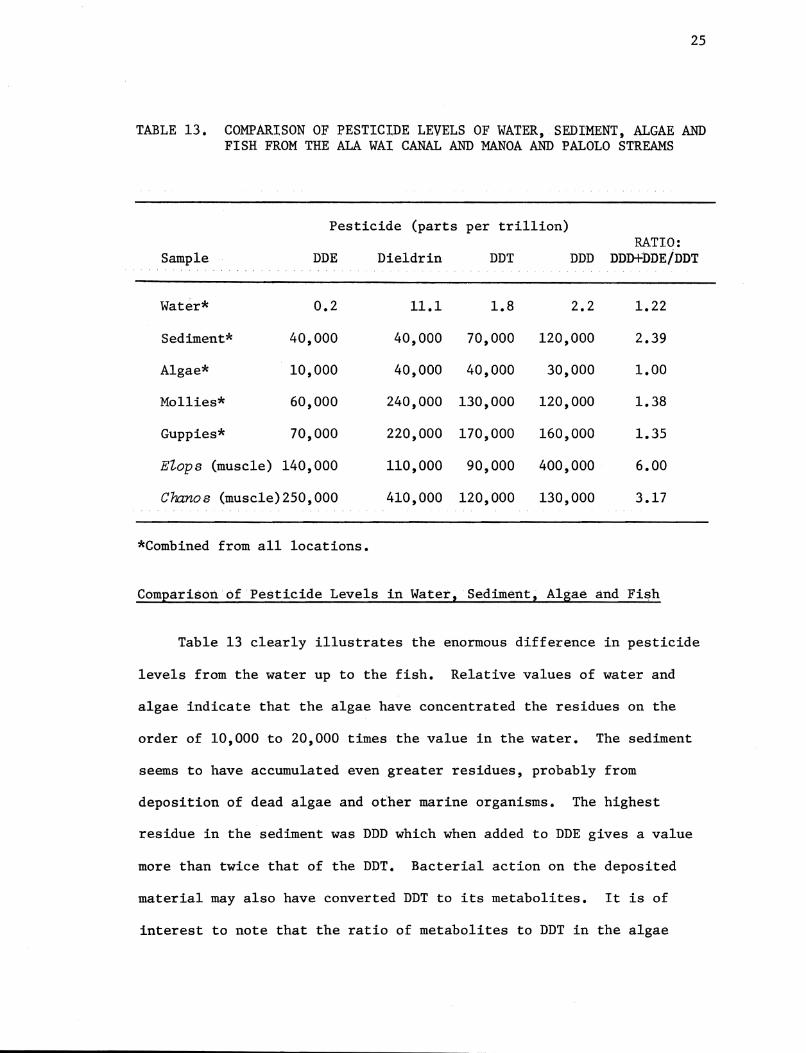
TABLE 13. COMPARISON OF PESTICIDE LEVELS OF WATER, SEDIMENT, ALGAE AND FISH FROM THE ALA WAI CANAL AND MANOA AND PALOLO STREAMS
Pesticide (parts per trillion)
Sample DDE
Water* 0.2
Sediment* 40,000
Algae* 10,000
Mollies* 60,000
Guppies* 70,000
EZops (muscle) 140,000
Cnanos (muscle)250,000
*Combined from all locations.
Dieldrin DDT
11.1 1.8
40,000 70,000
40,000 40,000
240,000 130,000
220,000 170,000
110,000 90,000
410,000 120,000
RATIO: DDD DDD+DDE/DDT
2.2 1.22
120,000 2.39
30,000 1.00
120,000 1.38
160,000 1.35
400,000 6.00
130,000 3.17
Comparison of Pesticide Levels in Water, Sediment, Algae and Fish
Table 13 clearly illustrates the enormous difference in pesticide
levels from the water up to the fish. Relative values of water and
algae indicate that the algae have concentrated the residues on the
order of 10,000 to 20,000 times the value in the water. The sediment
seems to have accumulated even greater residues, probably from
deposition of dead algae and other marine organisms. The highest
residue in the sediment was DDD which when added to DDE gives a value
more than twice that of the DDT. Bacterial action on the deposited
material may also have converted DDT to its metabolites. It is of
interest to note that the ratio of metabolites to DDT in the algae
26
was l:l,similar to the ratio in the water (1.22:1). The ratios in the
guppies and mollies were about 35% greater than that in the algae. The
residue values indicate that the concentrations observed in these fish
were from 2 to 50 times the concentration observed in the algae.
Among the individual pesticides, dieldrin was the most abundant
for all organisms with the exception of the EZops. The reason is not
clear.
The large fish have concentrated the insecticides to a higher
degree than any of the other organisms. It appears that the increasing
residue accumulation from the water to algae to fish demonstrates that
as higher steps on the food chain were reached the compounds had become
more concentrated and the relative amounts of metabolites increased
with increasing steps of metabolism.
SUMMARY
This study has been concerned with several aspects of pesticide
contamination in the Ala Wai Canal. Two species of fish, Elops
lravaiensis and Ch:mos chanos, were examined as indicators of pesticide
pollution in the canal. It was found that the average concentration of
DDT residues for both species was below the arbitrary limit set by the
Food and Drug Administration. On an individual basis, however, several
fish surpassed these limits for DDT, including metabolites.
The average dieldrin values for the muscle tissue in Elops were
observed to be approximately a third of the FDA limit, while a number
of individual fish exceeded this amount. The average dieldrin concen
tration in the Chanos has been observed to border on tolerance limits
in edible fish.
Intraspecies examination of the Elop sand Chano s indicates that
each specie accumulated the contaminants to differing degrees in each
tissue. To account for this differential accumulation, lipid analyses
were conducted. These results contributed no substantive evidence,
however, that affinity for the lipid fraction was the cause for the
accumulation. Interspecies comparisons have revealed that the brain
and muscle tissues of the Chanos contained the higher amount of
pesticides. The opposite was observed for the liver tissue. It has
also been apparent from inter species comparisons that the metabolite/DDT
ratio is twice as high in the Elops as in the Chanos. This may be
related to the higher position of the Elops on the food chain.
A second aspect of this study has dealt with the relative amounts
of pesticides in the canal and in the two streams which ultimately
enter into the canal. It has appeared that a major source of residue
contamination was from the Manoa-Palolo Drainage Canal. Of the two
streams, a slight trend towards Manoa Valley as the larger contributant
was observed. Termite and other insect control in this area is known
to be widely used, thus accounting for this difference.
The final section of this thesis has dealt with the organisms,
water and sediment values in total. The degree of concentration of
residues from the water to the fish has been quite apparent. The
degree to which the ratio of derivatives of DDT to the parent compound
has increased implies that they were formed via internal metabolism of
the organism and passed on to the next higher level in the food web.
A survey of chlorinated pesticide residues present in the Ala Wai
Canal has been conducted. DDE, DDD, DDT and dieldrin were the pre
dominant pesticides observed in all samples examined.
28

APPENDIX
30
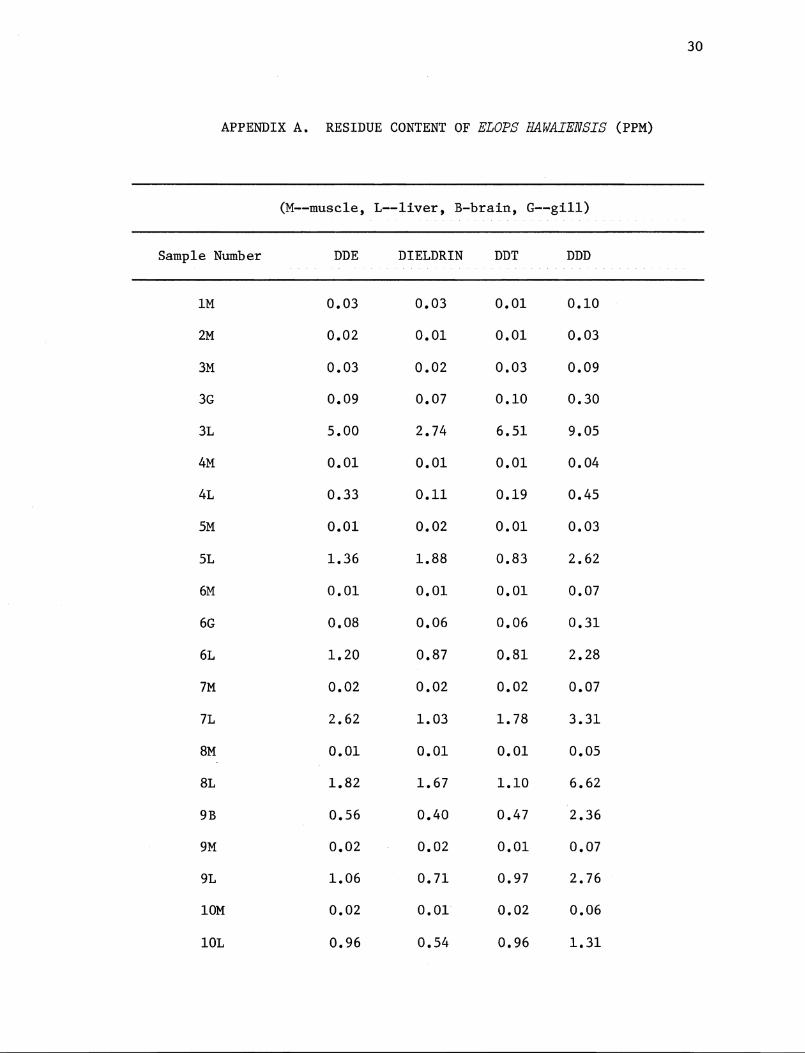
APPENDIX A. RESIDUE CONTENT OF ELOPS HAWAIENSIS (PPM)
(M--musc1e, L--1iver, B-brain, G--gi11)
Sample Number DDE DIELDRIN DDT DDD
1M 0.03 0.03 0.01 0.10
2M 0.02 0.01 0.01 0.03
3M 0.03 0.02 0.03 0.09
3G 0.09 0.07 0.10 0.30
3L 5.00 2.74 6.51 9.05
4M 0.01 0.01 0.01 0.04
4L 0.33 0.11 0.19 0.45
5M 0.01 0.02 0.01 0.03
5L 1.36 1.88 0.83 2.62
6M 0.01 0.01 0.01 0.07
6G 0.08 0.06 0.06 0.31
6L 1.20 0.87 0.81 2.28
7M 0.02 0.02 0.02 0.07
7L 2.62 1.03 1. 78 3.31
8M 0.01 0.01 0.01 0.05
8L 1.82 1.67 1.10 6.62
9B 0.56 0.40 0.47 2.36
9M 0.02 0.02 0.01 0.07
9L 1.06 0.71 0.97 2.76
10M 0.02 0.01 0.02 0.06
10L 0.96 0.54 0.96 1.31
31
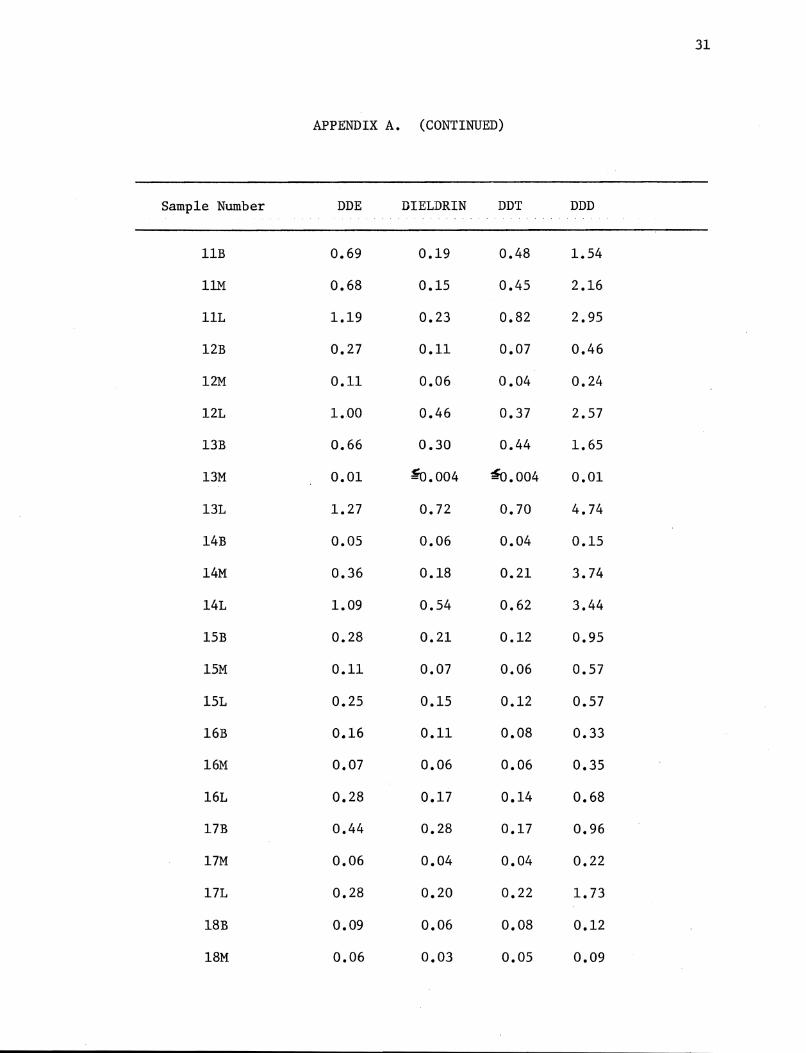
APPENDIX A. (CONTINUED)
Sample Number DDE DIELDRIN DDT DDD
lIB 0.69 0.19 0.48 1.54
11M 0.68 0.15 0.45 2.16
IlL 1.19 0.23 0.82 2.95
12B 0.27 0.11 0.07 0.46
12M 0.11 0.06 0.04 0.24
12L 1.00 0.46 0.37 2.57
13B 0.66 0.30 0.44 1.65
13M 0.01 ~.004 ~.004 0.01
13L 1.27 0.72 0.70 4.74
14B 0.05 0.06 0.04 0.15
14M 0.36 0.18 0.21 3.74
14L 1.09 0.54 0.62 3.44
15B 0.28 0.21 0.12 0.95
15M 0.11 0.07 0.06 0.57
15L 0.25 0.15 0.12 0.57
16B 0.16 0.11 0.08 0.33
16M 0.07 0.06 0.06 0.35
16L 0.28 0.17 0.14 0.68
17B 0.44 0.28 0.17 0.96
17M 0.06 0.04 0.04 0.22
17L 0.28 0.20 0.22 1. 73
18B 0.09 0.06 0.08 0.12
IBM 0.06 0.03 0.05 0.09
32
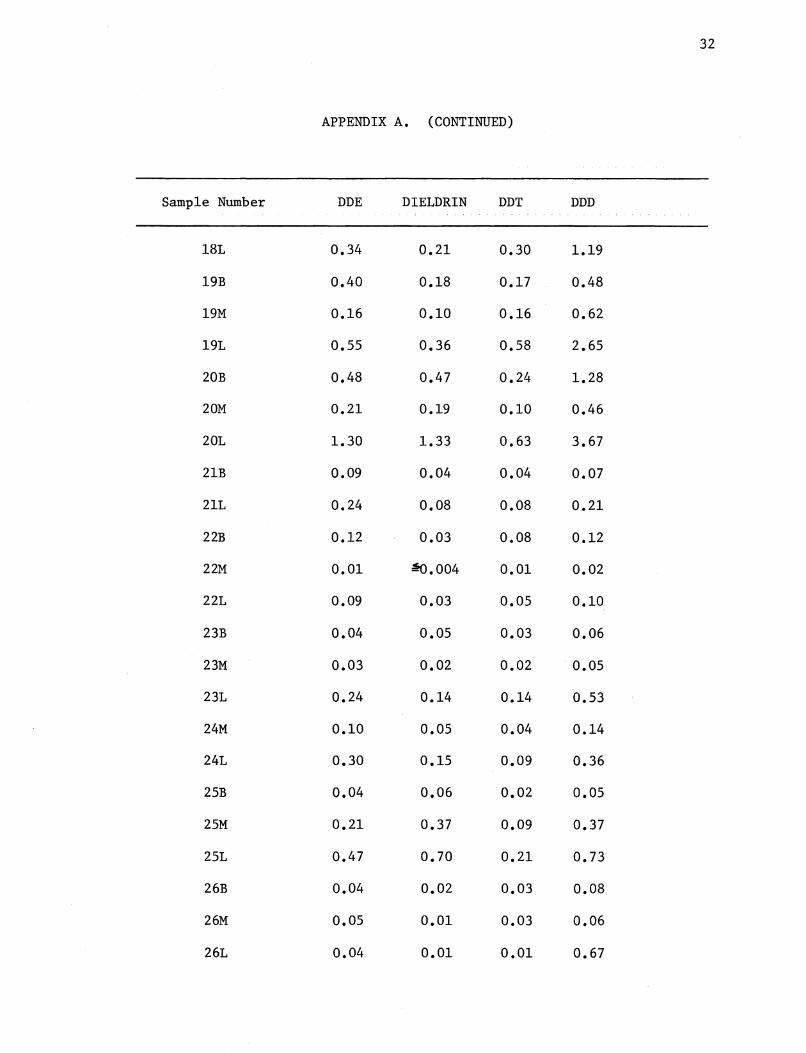
APPENDIX A. (CONTINUED)
Sample Number DDE DIELDRIN DDT DDD
lSL 0.34 0.21 0.30 1.19
19B 0.40 O.lS 0.17 0.4S
19M 0.16 0.10 0.16 0.62
19L 0.55 0.36 0.58 2.65
20B 0.48 0.47 0.24 1.28
20M 0.21 0.19 0.10 0.46
20L 1.30 1.33 0.63 3.67
21B 0.09 0.04 0.04 0.07
21L 0.24 O.OS O.OS 0.21
22B 0.12 0.03 0.08 0.12
22M 0.01 ~.004 0.01 0.02
22L 0.09 0.03 0.05 0.10
23B 0.04 0.05 0.03 0.06
23M 0.03 0.02 0.02 0.05
23L 0.24 0.14 0.14 0.53
24M 0.10 0.05 0.04 0.14
24L 0.30 0.15 0.09 0.36
25B 0.04 0.06 0.02 0.05
25M 0.21 0.37 0.09 0.37
25L 0.47 0.70 0.21 0.73
26B 0.04 0.02 0.03 O.OS
26M 0.05 0.01 0.03 0.06
26L 0.04 0.01 0.01 0.67
33
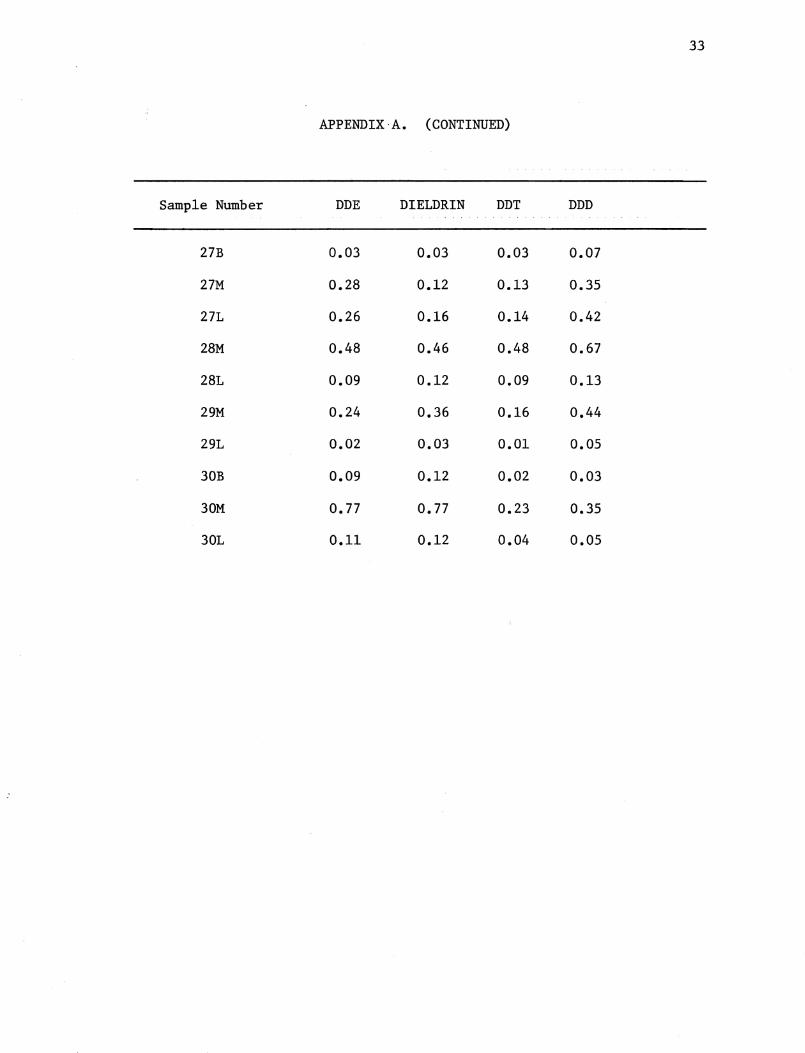
APPENDIX-A. (CONTINUED)
Sample Number DDE DIELDRIN DDT DDD
27B 0.03 0.03 0.03 0.07
27M 0.28 0.12 0.13 0.35
27L 0.26 0.16 0.14 0.42
28M 0.48 0.46 0.48 0.67
28L 0.09 0.12 0.09 0.13
29M 0.24 0.36 0.16 0.44
29L 0.02 0.03 0.01 0.05
30B 0.09 0.12 0.02 0.03
30M 0.77 0.77 0.23 0.35
30L 0.11 0.12 0.04 0.05
34
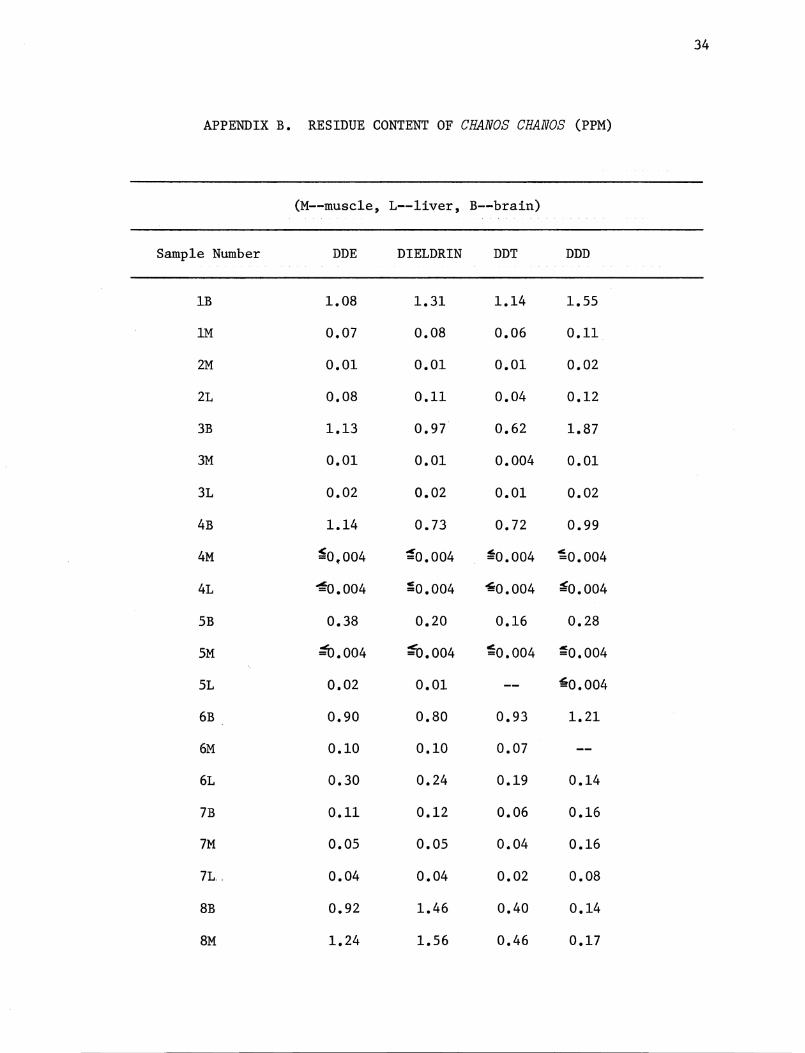
APPENDIX B. RESIDUE CONTENT OF CHANOS CHANOS (PPM)
(M--musc1e, L--1iver, B--brain)
Sample Number DDE DIELDRIN DDT DDD
1B 1.08 1.31 1.14 1.55
1M 0.07 0.08 0.06 0.11
2M 0.01 0.01 0.01 0.02
2L 0.08 0.11 0.04 0.12
3B 1.13 0.97 0.62 1.87
3M 0.01 0.01 0.004 0.01
3L 0.02 0.02 0.01 0.02
4B 1.14 0.73 0.72 0.99
4M ~0,004 ~0.004 ~0.004 ~0.004
4L ~.004 ~0.004 ~0.004 ~0.004
5B 0.38 0.20 0.16 0.28
5M ~.004 ~.004 ~0.004 ~0.004
5L 0.02 0.01 ~0.004
6B 0.90 0.80 0.93 1.21
6M 0.10 0.10 0.07
6L 0.30 0.24 0.19 0.14
7B 0.11 0.12 0.06 0.16
7M 0.05 0.05 0.04 0.16
7L .. 0.04 0.04 0.02 0.08
8B 0.92 1.46 0.40 0.14
8M 1.24 1.56 0.46 0.17
35
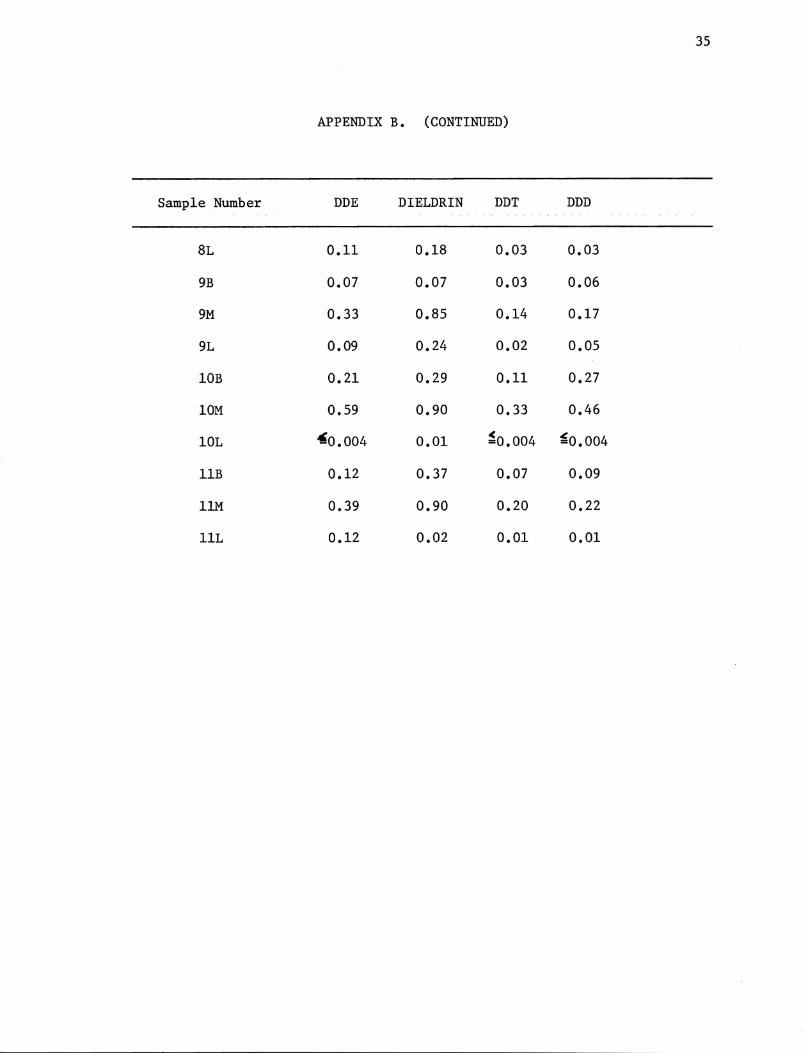
APPENDIX B. (CONTINUED)
Sample Number DDE DIELDRIN DDT DDD
8L 0.11 0.18 0.03 0.03
9B 0.07 0.07 0.03 0.06
9M 0.33 0.85 0.14 0.17
9L 0.09 0.24 0.02 0.05
lOB 0.21 0.29 0.11 0.27
10M 0.59 0.90 0.33 0.46
10L ~O. 004 0.01 ~0.004 ~0.004
lIB 0.12 0.37 0.07 0.09
11M 0.39 0.90 0.20 0.22
IlL 0.12 0.02 0.01 0.01
BIBLIOGRAPHY
Bailey, J. Blair and John E. Swift. 1968. Pedicide Information and Safety Manual. University of California Agriculture Extension Service.
Bevenue, A., T. W. Kelley and J. W. Hylin. 1971. "Problems in Water Analysis for Pesticide Residues," J. Cfrtoomatog. 54:71-6.
Bligh, E. Graham. 1969. "Environmental Factors Affecting the Utilization of Great Lakes Fish as Human Food," Umnos 2(3): 13-18.
37
Deubert, Karl H. 1970. "Sources of Compounds Interfering with the Analysis of Extracts for Dieldrin and DDT by GLC," Bull. Environ. Cont. & Tox.~ 5(4):379-81.
Ecobichon, D. J. and P. W. Saschenbrecker. 1967. "Dechlorination of DDT in Frozen Blood," Science 156:663-5.
Eschmeyer, Paul H. and Arthur M. Phillips, Jr. 1965. "Fat Content of the Flesh of Siscowets and Lake Trout from Lake Superior," Trans. Amer. Pi sh Soc. 94(1): 62-74.
Evaluation of Pesticide Problems in HaUJaii ~ Appendix. 1969. State of Hawaii Department of Agriculture.
Fredeen, F. J. H. and J. Regis Duffy. 1970. "Insecticide Residues in Some Components of the St. Lawrence River Ecosystem Following Applications of DDD," PeiUaidesMonitoring Journal 3(4):219-26.
Gonzalez, Frank 1. 1971. "Descriptive Study of the Physical Oceanography of the Ala Wai Canal," Hawaii Institute of Marine Biology Technical Report Number 26.
Guenzi, W. D. and W. E. Beard. 1967. "Anaerobic Biodegradation of DDT to DDD in Soil," Science 156:1116-7.
Hansen, David J. and Alfred J. Wilson, Jr. 1970. "Significance of DDT Residues from the Estuary Near Penasco1a [sial, Florida," Pe dicide s Monitoring Journal 4 (2): 51-6.
Harrington, Robert W., Jr. and William L. Bid1ingmayer. 1958. "Effects of Dieldrin on Fishes and Invertebrates of a Salt Marsh," J. Wildlife Management 22(1):76-82.
Henderson, Croswell, Wendell L. Johnson and Anthony Inglis. 1969. "Organochlorine Insecticide Residues in Fish," Pe dicide s Monitoring Journal 3(3):145-71.
Hildebrand, Samuel F. 1943. "Notes on the Affinity, Anatomy, and Development of Elops saurus Linnaeus," J. Wash. Acad. Sci. 33:90-94.
Hoffman, William S., Howard Adler, William I. Fishbein and Frank C. Bauer. 1967. "Relation of Pesticide Concentrations in Fat to Pathological Changes in Tissues," Arch. Environ. HeaUh 15: 758-65.
Holden, A. V. 1962. "A Study of the Absorption of l4C-labelled DDT from Water by Fish," Ann. AppZ. BioZ. 50: 467-77.
Holland, Hugh T. and David L. Coppage. 1970. "Sensitivity to Pesticides in Three Generations of Sheep shead Minnows," BuZZ. Environ. Contam. ToxicoZ. 5(4):362-7.
Hopkins, C. L., S. R. B. Solly and A. R. Ritchie. 1969. "DDT in Trout and its Possible Effect on Reproductive Potential," N. Z. JZ. Mar. Freshwat. Res. 3:220-29.
Jensen, S. and A. G. Johnels, M. Olsson and G. Otterlind. 1969. "DDT and PCB in Marine Animals from Swedish Waters," Nature 224:247-50.
Johnson, Donald W. 1968. "Pesticides and Fishes--A Review of Selected Literature," Trans. Amer. Fish Soc. 97:398-424.
Johnson, Donald W. and Sam Lew. 1970. "Chlorinated Hydrocarbon Pesticides in Representative Fishes of Southern Arizona," Pe sticide s Moni toring JournaZ 4 (2) : 57-61.
Kadoum, A. M. 1967. "A Rapid 1';1icromethod of Sample Cleanup for Gas Chromatographic Analysis of Insecticidal Residues in Plant, Animal, Soil, and Surface and Ground Water Extracts," BuZZ. Environ. Contam. ToxicoZ. 2(5):264-73.
Kadoum, A. M. 1968. "Cleanup Procedure for Water, Soil, Animal and Plant Extracts for the Use of Electron-Capture Detector in the Gas Chromatographic Analysis of Organophosphorus Insecticide Residues," Bull. Environ. Contam. ToxicoZ. 3(4): 247-53.
Kadoum, A. M. 1969. "Partitioning Method for Sample Cleanup for Gas Chromatographic Analysis of Common Organic Pesticide Residues in Biological Materials," Bull. Environ. Contam. ToxicoZ. 4(3):184-91.
Keil, Julian E. and Lamar E. Priester. 1969. "DDT Uptake and Metabolism by a Marine Diatom," Bull. Environ. Contam. ToxicoZ. 4(3):169-73.
Lane, Charles E. and Robert J. Livingston. 1970. "Some Acute and Chronic Effects of Dieldrin on the Sailfin Molly, PoeciZia Zatipinna," Trans. Amer. Fish. Soc. 99(3) :489-95.
38
Lichtenberg, James J., James W. Eichelberger, Ronald C. Dressman and James E. Longbottom. 1970. "Pesticides in Surface Waters of the United States--A 5-Year Summary, 1964-68," Pesticides Monitoring JournaZ 4(2):71-86.
Macek, Kenneth J. and Sidney Korn. 1970. "Significance of the Food Chain in DDT Accumulation by Fish," J. Fish. Res. Bd. Canada 27(8):1496-98.
Matsumura, F. and Ching M. Wang. 1968. "Reduction of Dieldrin Storage in Rat Liver: Factors Affecting in Situ,," Bull. Environ. Contam. ToxicoZ. 3(4):203-210.
Mayer,· F. L., Jr., J. C. Street and J. M. Neuho1d. 1970. "Organochlorine Insecticide Interactions Affecting Residue Storage in Rainbow Trout," Bull. Environ. Contam. Toxicol. 5(4):300-309.
Menzie, Calvin M. MetaboUmz of Pesticides. Washington, D.C.: Bureau of Sport Fisheries and Wildlife, 1969.
Mills, P. A., J. H. Onley and R. A. Gaither. 1963. "Rapid Method for Chlorinated Pesticide Residues in Nonfatty Foods," J. Assoc. Offic. Agr. Chern. 46:186-91.
Miskua, Raymond P., Deanna P. Blair and John E. Casida. 1965. "Conversion of DDT to DDD by Bovine Rumen Fluid, Lake Water, and Reduced Porphyrins," J. Agr. Food Chern. 13(5):481-83.
Morgan, Donald P. and Clifford C. Roan. 1970. "Chlorinated Hydrocarbon Pesticide Residue in Human Tissues," Arc h. of Environ. Health 20:452-57.
Murphy, Philip G. 1971. "The Effect of Size on the Uptake of DDT from Water by Fish," Bull. Environ. Contam. ToxicoZ. 6(1):20-23.
Porter, Mildred L., Susan J. V. Young and Jerry A. Burke. 1970. "A Method for the Analysis of Fish, Animal, and Poultry Tissue for Chlorinated Pesticide Residues," JournaZ of t m AOAC 53(6):1300-1303.
Premdas, F. H. and J. M. Anderson. 1963. "The Uptake and Detoxification of C14-1abe11ed DDT in Atlantic Salmon, SaZrno saZar,," J. Fish Res. Bd. Canada 20(3) :827-37.
Reinert, Robert E. 1970. "Pesticide Concentrations in Great Lakes Fish," Pesticides Monitoring JournaZ 3(4):233-40.
Saschenbrecker, Peter W. and Donald J. Ecobichon. 1967. "Extraction and Gas Chromatographic Analysis of Chlorinated Insecticides from Animal Tissues," J. Agr. Food Chern. 15(1):168-70.
39
Shultz, C. O. 1971. An Examination of Some Chlorinated Pesticide Residues in the Water, Sediment and Selected Biota in the Ala Wai Canal, Oahu, Hawaii. U. H. Ms. Thesis, Sept. 1971. pp. i-vi, 1-48.
Snedecor, George W. and William G. Cochran. Statistical Methods. Ames, Iowa: The Iowa State University, Press, 1967.
Stout, Virginia F. 1968. "Pesticide Levels in Fish of the Northeast Pacific," BuZZ. Environ. Contam. ToxicoZ. 3(4) :240-46.
Vinson, S. Brad1eigh, Claude E. Boyd and Denzel E. Ferguson. 1963. "Resistance to DDT in the Misquito Fish, Gambusia affinis., " Science 139:217-18.
Wang, Ching M. and Fumio Matsumura. 1969. "Dieldrin, Effect on the Ion Transport Activities in Liver Tissues," BuZZ. Environ. Contam. ToxicoZ. 4(3):144-51.
Wedemeyer, Gary. 1966. "Dechlorination of DDT by Aerobacter aerogene s., " Sci ence 152: 647.
Woodwe11, George M., Charles F. Wurster, Jr. and Peter A. Isaacson. 1967. "DDT Residues in an East Coast Estuary: A Case of Biological Concentration of a Persistent Insecticide," Science 156:821-24.
40