hard rock tunnel boring vol. 3 - advance rate and cutter wear
TRANSCRIPT

Amund BrulandHard Rock Tunnel Boring
Advance Rate and Cutter Wear
Tron
dheim
U
NT
N f
o yt
isre
vin
U na
ige
wro
Nyg
olo
nhc
eT
dna
ec
neic
S s
ise
h t l
arot
coD
ee
rged
eht
rof
fo t
nemt
rap e
D
Doctoral theses at NTNU 1998:81
Vol. 3 of 10
Facu
lty of En
gineerin
g Science
and T
echn
ology Civil an
d T
ransport E
ngin
eering
of doktor ingen
iør

PREFACE 1
0 GENERAL
0.1 Project Reports about Hard Rock Tunnel Boring
3
3
1 PARAMETERS
1.0 Introduction
1.1 Rock Parameters
1.2 Machine Parameters
6
6
7
10
2 NET PENETRATION RATE
2.0 Introduction
2.1 Fracturing
2.2 Rock Porosity
2.3 Basic Penetration
2.4 Basic Net Penetration Rate
2.5 Marked Single Joints
2.6 Torque Demand
2.7 Other Advance Rate Limitations
14
14
16
18
19
21
22
24
26
3 CUTTER LIFE
3.0 Introduction
3.1 Cutter Ring Life
27
27
32
4 GROSS ADVANCE RATE
4.0 Introduction
4.1 Machine Utilisation
4.2 Additional Time Consumption
33
33
34
40
APPENDICES
A. Previous Editions
B. Research Partners
C. List of Parameters
D. Estimation Forms
41
41
42
43
46

PREFACE
1
HARD ROCK TUNNEL BORING Advance Rate and Cutter Wear
Project Report 1B-98 The report is one of six reports about hard rock tunnel boring: • = 1A-98 HARD ROCK TUNNEL BORING Design and Construction • = 1B-98 HARD ROCK TUNNEL BORING Advance Rate and Cutter Wear • = 1C-98 HARD ROCK TUNNEL BORING Costs • = 1D-98 HARD ROCK TUNNEL BORING Geology and Preinvestigations • = 1E-98 HARD ROCK TUNNEL BORING Performance Data and Back-mapping • = 1F-98 HARD ROCK TUNNEL BORING The Boring Process In addition, HARD ROCK TUNNEL BORING Background and Discussion gives general information about the basis of the above listed reports. Combined with the other reports in the Project Report Series from the Department of Building and Construction Engineering at NTNU, the reports present an updated and systematised material on rock excavation and tunnelling to be used for: • = Economic dimensioning • = Choice of alternative • = Time planning • = Cost estimates, tender, budgeting and cost control • = Choice of excavation method and equipment. A list of available Project Reports may be requested from the Department of Building and Construction Engineering at NTNU. The advance rate, cutter wear and excavation cost models also exist as a WINDOWS programme. The report is prepared by Amund Bruland and is part of his dr.ing thesis about hard rock tunnel boring. The reports listed above describe a comprehensive model developed at NTNU. The model covers the complete tunnel boring process from the early planning stage

PREFACE
2
through preinvestigations, time and cost estimates, tunnel excavation and finally ac-quisition and treatment of experience data. The models and data presented in the reports are meant to be a practical tool for owners, consultants and contractors, more than a theoretical analysis of the tunnel boring process. The project has been granted financial support by our external research partners, see list in Appendix. For reference, registration and similar, we ask for the following:
NTNU-Anleggsdrift (1998): Project Report 1B-98 HARD ROCK TUNNEL BORING Advance Rate and Cutter Wear.
When copying from the report, the source should be stated. Trondheim, December 1998 Odd Johannessen Professor Contact address: Amund Bruland Department of Building and Construction Engineering, NTNU N-7034 Trondheim NORWAY Telephone +47 73 59 47 37 Fax +47 73 59 70 21 e-mail [email protected] Internet http://www.bygg.ntnu.no/batek/batek.htm

0. GENERAL 0.1 Project Reports about Hard Rock Tunnel Boring
3
0.1 PROJECT REPORTS ABOUT HARD ROCK TUNNEL BORING 1B-98
The report provides methods and necessary data for estimation of time consump-tion and cutter wear for tunnel boring. Geological parameters and machine factors of significance for the penetration rate and the cutter wear are presented briefly.
The report presents the following data and models: • = Chapter 1: Required rock mass and machine parameters to be used in the
estimation models. • = Chapter 2: Estimation of net penetration rate. • = Chapter 3: Estimation of cutter wear and cutter life • = Chapter 4: Estimation of machine utilisation and weekly advance rate • = Appendix D: Estimation forms adapted to the estimation models. Project Report 1B-98 is a revised and updated version of parts of the Project Reports 1-76, 1-79, 1-83, 1-88 and 1-94, all published by the Department of Building and Construction Engineering at NTNU. Appendix A shows a list of previous editions of the report. Other Reports The Project Report 1A-98 HARD ROCK TUNNEL BORING Design and Con-struction describes general design parameters such as tunnel profile, tunnel inclina-tion and curve radius. Some features of various tunnel types like water, sewage, road and rail tunnels are treated. Transport, ventilation and other necessary service systems are presented. The Project Report 1C-98 HARD ROCK TUNNEL BORING Costs presents models and data for estimation of tunnel excavation costs and total construction costs.

0. GENERAL 0.1 Project Reports about Hard Rock Tunnel Boring
4
The Project Report 1D-98 HARD ROCK TUNNEL BORING Geology and Pre-investigations treats the rock mass parameters of the model in more detail. Preinves-tigations and building of an engineering geological model adapted to the estimation models for penetration rate and excavation costs are treated closely. The Project Report 1E-98 HARD ROCK TUNNEL BORING Performance Data and Back-mapping covers follow-up procedures and collecting of performance data from tunnel boring projects. Engineering geological back-mapping is treated in detail. Project Report 1F-98 HARD ROCK TUNNEL BORING The Boring Process covers rock breaking and chipping, machine factors affecting performance, boring in fractured rock mass, and various types of cutter wear. Use of the Estimation Models The estimation models are aimed at being used through several stages in a project: • = Preliminary and feasibility studies • = Project design and optimisation • = Tendering and contract • = Construction • = Possible claims. The estimation models for Hard Rock Tunnel Boring should be used with care. Com-bined with other estimation models in the Project Report Series from the Department of Building and Construction Engineering, the Hard Rock Tunnel Boring reports pro-vide a reliable and practical tool to be used for: • = Estimating net penetration rate and cutter wear • = Estimating time consumption and excavation costs, included risk • = Assess risk with regard to variation in rock mass boreability or machine
parameters

0. GENERAL 0.1 Project Reports about Hard Rock Tunnel Boring
5
• = Establish and manage price regulation in contracts • = Verify machine performance • = Verify variation in geological conditions. Background The estimation models are based on job site studies and statistics from tunnelling in Norway and abroad, including more than 35 job sites and more than 250 km of tunnel. The data have been systematised and normalised. The results are regarded as being representative for well organised tunnelling. A more detailed treatment of the background and the basis for the Hard Rock Tunnel Boring estimation models is found in HARD ROCK TUNNEL BORING Back-ground and Discussion.

1. PARAMETERS 1.0 Introduction
6
1.0 INTRODUCTION The net penetration rate depends on rock properties and machine parameters. Rock Mass Parameters Machine Parameters • = Fracturing; frequency and orientation • = Drilling Rate Index, DRI • = Porosity
• = Cutter thrust • = Cutterhead rpm • = Cutter spacing • = Cutter size and shape • = Installed cutterhead power
Table 1.1 Machine and rock parameters influencing the net penetration rate. The cutter wear depends on the following rock properties and machine parameters. Rock Mass Parameters Machine Parameters • = Cutter Life Index, CLI • = Content of abrasive minerals
• = Cutter diameter • = Cutter type and quality • = Cutterhead diameter and shape • = Cutterhead rpm • = Number of cutters on the cutterhead
Table 1.2 Machine and rock parameters influencing the cutter wear. The gross advance rate is estimated based on three input parameters: • = Net penetration rate • = Machine utilisation • = Number of working hours in the period (e.g. a week). The machine utilisation is again based on time consumption for the various operations in the tunnel excavation process, see Chapter 4. The estimation models apply to boring with single disc steel ring cutters.

1. PARAMETERS 1.1 Rock Parameters
7
1.1 ROCK PARAMETERS To estimate time consumption and costs, an engineering geological preinvestigation, adapted to tunnel boring, is required. This section gives a brief description of the required geological parameters and may be an aid at an early planning phase. See Project Report 1E-98 HARD ROCK TUNNEL BORING Geology and Preinvestigations for detailed studies of geological conditions. Degree of Fracturing The rock mass fracturing is the most important penetration rate parameter for tunnel boring. In this context, fracturing means fissures or joints with little or no shear strength along the planes of weakness. The less the distance between the fractures is, the greater the influence on the penetration rate is. Rock mass fracturing is characterised by degree of fracturing (type and spacing) and the angle between the tunnel axis and the planes of weakness. Joints (Sp): Includes continuous joints that can be followed all around the tunnel profile. They can be open (e.g. bedding joints in granite) or filled with clay or weak minerals, e.g. calcite, chlorite or similar minerals. Fissures (St): Includes non-continuous joints (can only be followed partly around the tunnel profile), filled joints with low shear strength and bedding plane fissures, e.g. as in mica schist or mica gneiss. Homogenous Rock Mass (Class 0): Includes massive rock without joints or fissures (may appear in intrusive dikes, sills, batholithes, etc.). Rock mass with filled joints of high shear strength (e.g. joints healed with quartz, epidote, etc.) may approach Class 0. The degree of fracturing in systematically fractured rock mass is divided into classes for practical use when mapping (see Table 1.3). The classes include both distance between and type of weakness planes. Figure 1.1 shows recorded fracture classes for various rock types in bored tunnels.

1. PARAMETERS 1.1 Rock Parameters
8
Fracture Class (Joints = Sp / Fissures = St)
Distance between Planes of Weakness
[cm] 0
0-I I- I II III IV
- 160 80 40 20 10 5
Table 1.3 Fracture classes with distance between the planes of weakness.
Figure 1.1 Recorded degree of fracturing for some rock types. Rock Drillability Rock drillability is evaluated on the basis of the Drilling Rate Index DRI and the Cutter Life Index CLI. The test methods are described in Project Report 13A-98 DRILLABILITY Test Methods. The Project Report 13B-98 DRILLABILITY Catalogue of Drillability Indices lists 2000 samples tested in our laboratory. Variation of DRI and CLI for some rock types is shown in Figures 1.2 and 1.3. The influence of rock porosity is described in Section 2.2.
� � �� ������ ���� ������ ������
������ �
�����
����
�����
���� �
���� �������
���� ���
���������
��������
����� �
���� � �
������� ����!�"�����#� ���!��$��� �������#�%

1. PARAMETERS 1.1 Rock Parameters
9
� &� '� (� )� *� +� ,� -� .�
������ ������ /�� �������������� ����� ������������� ������� ������������������������� ����� ����� � ����%� ��������
/����0�1� ����%�23�/1�&�4 '*4 *�4 ,*4 .�4 ������ ���
Figure 1.2 Recorded Drilling Rate Index for some rock types. Data from Project
Report 13C-98 DRILLABILITY Statistics of Drillability Test Results.
� &� '� (� )� *� +� ,� -� .�
������ ������ /�� �������������� ����� ������������� ������� ������������������������� ����� ����� � ����%� ��������
� ����!����%�23� ��&�4 '*4 *�4 ,*4 .�4 ������ ���
Figure 1.3 Recorded Cutter Life Index for some rock types. Data from Project
Report 13C-98 DRILLABILITY Statistics of Drillability Test Results.

1. PARAMETERS 1.2 Machine Parameters
10
1.2 MACHINE PARAMETERS To estimate the penetration rate and the cutter life, some machine parameters are required. At an early stage of planning, the parameters must be assumed based on general machine specifications. TBM Diameter Machines with diameters from 1.2 m to 12 m have been developed for boring in hard rock. Considering the background data, the estimation models are applicable for TBM diameters from 3 m to 10 m. The diameter of a given machine may be changed when rebuilt. Modifications of ± 10 - 20 % are normal, depending on diameter and manufacturer. For some machines the diameter may be changed even more; 100 % from smallest to largest possible diameter. Cutter Diameter Over the recent years, the state of the art cutter diameter has increased from 394 mm (15.5 inches) to 500 mm (19 and 20 inches). The increase is motivated by higher cutter loads and longer cutter ring life. 483 mm has become the most used cutter size for hard rock applications. Cutter Thrust Figure 1.4 shows a general outline of maximum gross average thrust per cutter disc as a function of cutter diameter and TBM diameter. Gross average thrust means the thrust the cutters are able to utilise over a longer period of time, not peak loads occurring over short time intervals. At present, the material quality of the steel ring is the limiting factor of the cutter thrust. When estimating penetration rate etc., one must consider the thrust capacity of the cutter rings, in addition to the capacity of the cutter bearings and the main bearing. Cutterhead RPM The cutterhead rpm is inverse proportional to the cutterhead diameter. This is because one needs to limit the rolling velocity of the peripheral cutter. Figure 1.5 shows cutterhead rpm as a function of TBM diameter and cutter diameter.

1. PARAMETERS 1.2 Machine Parameters
11
Number of Cutters on the Cutterhead Figure 1.6 shows the standard number of cutters on a cutterhead as a function of cutter diameter and TBM diameter. For the smaller TBM diameters, the available space on the cutterhead is limited and the indicated number of cutters is the maximum. For the larger TBM diameters, the number of cutters may be increased compared to Figure 1.6. Cutterhead Power Figure 1.7 shows the installed power for cutterhead rotation as a function of cutter diameter and TBM diameter. The installed power indicated should give sufficient torque to handle a penetration rate of approximately 10 mm/rev for e.g. one stroke length.
Figure 1.4 Recommended maximum gross average thrust per disc. The upper limit
indicates boring in homogenous rock mass, the lower limit indicates boring in medium to very fractured rock mass.

1. PARAMETERS 1.2 Machine Parameters
12
&)
&'
&�
-
+
)
'
)9� *9� +9� ,9� -9� .9�
1����#7��
8���%��� ��3��
&���%�:)-(��
'���%�:)('��
(���%�:(.)��
)���%�:(*+��
&
(
'
)
Figure 1.5 Cutterhead rpm.
Figure 1.6 Normal number of cutters on the cutterhead.
)9� *9� +9� ,9� -9� .9�
8���%��� ��3��
(9�'�
(�
)�
*�
+�
6�
(.)��
)-(��

1. PARAMETERS 1.2 Machine Parameters
13
Figure 1.7 Installed cutterhead power.
)9� *9� +9� ,9� -9� .9�
� �5;
8���%��� ��3��
&���
'���
(���
%�:)-(��
%�:)('��
%�:(.)��
%�:(*+��

2. NET PENETRATION RATE 2.0 Introduction
14
2.0 INTRODUCTION Net penetration rate is defined as metres tunnel bored per hour while the cutterhead rotates with thrust against the face. The penetration rate estimation model is based on normalised penetration curves, see [2.1]. For more details, see Project Report 1F-98 HARD ROCK TUNNEL BORING The Boring Process.
i0 = basic penetration rate Mekv = equivalent cutter thrust in kN/c M1 = critical cutter thrust in kN/c (necessary thrust to achieve 1 mm/rev) b = penetration coefficient The Figures 2.1 and 2.2 show the relation between the equivalent fracturing factor kekv and the critical thrust M1 and the penetration coefficient b respectively.
Figure 2.1 Critical thrust as a function of the equivalent fracturing factor.
(mm/rev)
1
0
����
�=
M
Mi ekv
b
[2.1]
���
���
���
��
�
��
� ��� ��� ��� ��� ��� ���
��� ������� �������� ����������

2. NET PENETRATION RATE 2.0 Introduction
15
Figure 2.2 Penetration coefficient as a function of the equivalent fracturing factor. The Estimation Forms in Appendix D may be used as examples of application and will guide the user through all parts of the models.
���
���
���
���
���
�� ��� ��� ��� ��� ��� ���
��� ������� �������� ����������
�

2. NET PENETRATION RATE 2.1 Fracturing
16
2.1 FRACTURING The rock mass fracturing is expressed by the fracturing factor ks, which is dependent on the degree of fracturing (type and spacing) and the angle between the tunnel axis and the planes of weakness, α. The orientation of the weakness planes is determined from measurements of strike and dip.
αs = strike angle α f = dip angle α t = tunnel direction. The fracturing factor is shown in Figure 2.3, as a function of Fissure or Joint Class and angle between the tunnel axis and the planes of weakness. For more than one set of weakness planes, the total fracturing factor is as follows:
ks-tot = total fracturing factor ksi = fracturing factor for set no. i n = number of fracturing sets. The rock mass properties for TBM boring is expressed by the equivalent fracturing factor.
)( )) - ( sin sin ( arcsin = °⋅ stf αααα [2.2]
( ) 0.36 1 = 1
⋅−−=
− nkkn
isitots [2.3]

2. NET PENETRATION RATE 2.1 Fracturing
17
kekv = equivalent fracturing factor kDRI = correction factor for DRI of the rock kpor = correction factor for porosity of the rock
�� �� �� �� �� �� �� �� ��
� �� �����!
���
���
���
���
�!
���
���
���
���
����� �� �� �� �� �� ��
"#$
�"#$�!%����
�!%���
�!%���
$&
'�!!���(� !!
$$$)$&
$$$
$$)$$$
$$
$
�
*�����(� !!
$$
$)$$
$
�)$
�
Figure 2.3 Fracturing factor. Correction factor for DRI ≠ 50.
porDRItotsekv kkkk ⋅⋅= − [2.4]

2. NET PENETRATION RATE 2.2 Rock Porosity
18
2.2 ROCK POROSITY The porosity must be measured for rock types with porosity higher than approximately 2 %. The porosity's influence on the DRI is negligible for porosity less than 10 - 12 %. Hence, the porosity must be incorporated in the penetration rate model as an independent parameter. Boring in North Atlantic basalt (The Faeroe Islands) has shown that porosity has a significant influence on the net penetration rate. The experience data are limited to approximately 15 % porosity. A rough estimate of the influence of porosity on the penetration rate is shown in Figure 2.4.
Figure 2.4 Influence of rock porosity on the equivalent fracturing factor.
���
���
���
���
���
� � � � �� ��
+���!��,��-
�.��

2. NET PENETRATION RATE 2.3 Rock Porosity
19
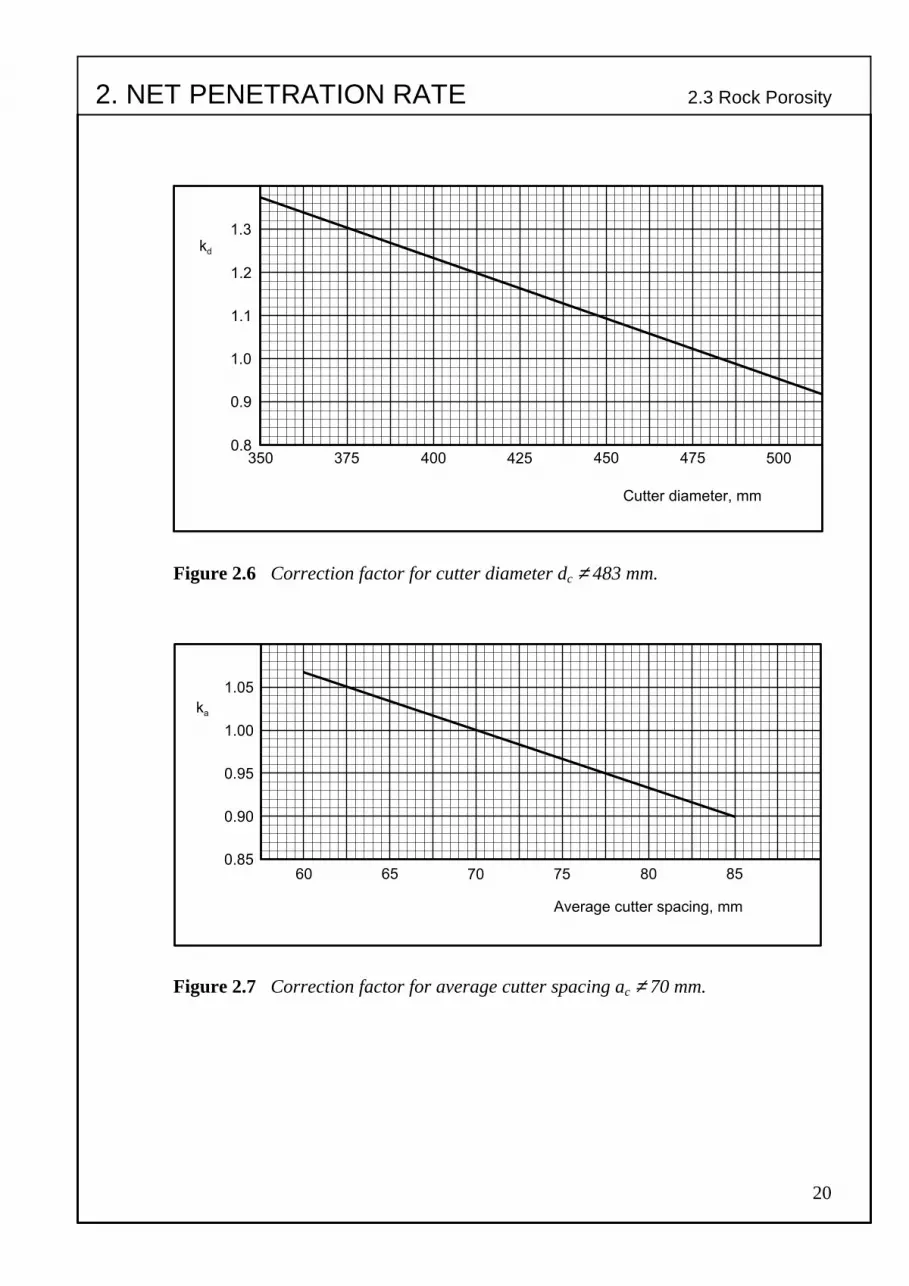
2.3 BASIC PENETRATION Basic penetration i0 as a function of equivalent thrust and equivalent fracturing factor is shown in Figure 2.5. Equivalent thrust is given by [2.5]. Figure 2.6 shows the correction factor kd and Figure 2.7 shows the correction factor ka.
Figure 2.5 Basic penetration. dc = 483 mm and ac = 70 mm.
)(kN/cutter = adBekv kkMM ⋅⋅ [2.5]
��� ��� ��� ��� ���
��� ������� �������� �����������
����
����
���
���
���
���
��//0���
��� ������1�!�
����20�
����20�
����20�
����20�
2. NET PENETRATION RATE 2.3 Rock Porosity
20
Figure 2.6 Correction factor for cutter diameter dc ≠ 483 mm.
Figure 2.7 Correction factor for average cutter spacing ac ≠ 70 mm.
���
���
���
���
���
������ ��� ��� ��� ��� ��� ���
�
(����� � /������//
����
����
����
����
������ �� �� �� �� ��
�
3��� ���������!. ������//

2. NET PENETRATION RATE 2.4 Basic Net Penetration Rate
21
2.4 BASIC NET PENETRATION RATE The basic net penetration rate I0 is a function of basic penetration and cutterhead rpm. The basic net penetration rate is applicable for systematically fractured rock mass without Marked Single Joints.
(m/h)1000
6000
���
�⋅⋅= RPMiI [2.6]

2. NET PENETRATION RATE 2.5 Marked Single Joints
22
2.5 MARKED SINGLE JOINTS For a more detailed treatment of boring through Marked Single Joints, see Project Report 1F-98 HARD ROCK TUNNEL BORING The Boring Process. The model is based on a relatively small number of observations. The theoretical penetration addition is shown in Figure 2.8. The normalised correction factor is shown in Figure 2.9 The tunnel length lesp influenced by Marked Single Joints is estimated from the tunnel diameter dtbm, the angle between the Marked Single Joints and the tunnel axis αesp, and the number n of similar Marked Single Joints occurring in the geological zone. αesp is found by [2.2].
Net penetration rate when boring through Marked Single Joints, Iesp is found by
kesp = correction factor for Marked Single Joints kesp should not be given a higher value than 1.4. When the penetration addition is of this size, the vibration level of the cutterhead and the peak forces on the cutters are very high, requiring a reduction of the thrust level. The average net penetration rate In over a geological zone with a total length of lj, is found by
(m)tan/ esptbmesp dnl α⋅= [2.7]
(m/h)0 espesp kII ⋅= [2.8]
(m/h)
0 esp
espespj
jn
Il
Ill
lI
+−
= [2.9]

2. NET PENETRATION RATE 2.5 Marked Single Joints
23
+����� ����� �������
�!.��-
�� ��� ��� ���
3��������4���������� 5�!� � �!������6������� �!.
Figure 2.8 Theoretical averaged penetration addition for marked single joints.
���
���
���
���
�� �� �� �� �� ��
� �!.�� �����!
"#$%�� "#$%��
"#$%��
"#$%��
��!.
Figure 2.9 Correction factor for Marked Single Joints.

2. NET PENETRATION RATE 2.6 Torque Demand
24
2.6 TORQUE DEMAND For high net penetration rates or when boring in fractured rock, one must check that there is sufficient cutterhead power installed to utilise the estimated thrust. The machine is torque limited if the installed power is too low to rotate the cutterhead for a given penetration. Then the thrust must be reduced until the required torque is less than the torque capacity of the cutterhead drive. Necessary torque is given by:
rmc = relative position of the average cutter on the cutterhead. When the
cutterhead design is known, the factor may be calculated, see [2.11]. Normally, rmc is approximately 0.59.
dtbm = cutterhead diameter Ntbm = number of cutters on the cutterhead MB = gross average cutter thrust kc = cutter coefficient (rolling resistance), see [2.12].
ri = radius to position of cutter no. i
Figure 2.10 shows the cutter constant cc as a function of cutter diameter. The necessary torque decides the installed power. Necessary installed power is given by [2.13].
(kNm) 2/ cBtbmtbmmcn kMNdrT [2.10]
tbm
tbm
N
ii
mc dN
r
r
tbm
5.0
1
[2.11]
0ick cc [2.12]

2. NET PENETRATION RATE 2.6 Torque Demand
25
If the installed cutterhead power is less than Pn, the estimation of penetration rate must me recalculated with a lower cutter load MB.
Figure 2.10 Cutter constant. For more details on torque demand, see Project Report 1F-98 HARD ROCK TUNNEL BORING The Boring Process.
(kW) 60
2 =
RPMTP n
n⋅⋅⋅ π [2.13]
����
����
����
����
������� ��� ��� ��� ���
��
(����� � /������//

2. NET PENETRATION RATE 2.7 Other Advance Rate Limitations
26
2.7 OTHER ADVANCE RATE LIMITATIONS Besides limitations due to available torque, the system's capacity (the TBM and the backup) for muck removal may limit the net penetration rate. Particularly, muck removal may limit the net penetration rate for large diameter machines. When boring through marked single joints or heavy fractured rock, it may be necessary to reduce the thrust due to too high machine vibration level and very high momentary cutter loads.

3. CUTTER LIFE 3.0 Introduction
27
3.0 INTRODUCTION The estimation model presupposes that the TBM is operated at a thrust level resulting in mainly abrasive wear of the cutter rings. The amount of blocked cutters and cutter rings worn by ring chipping should be less than 10 - 20 % of the total number of changed cutters. The Estimation Forms in Appendix D may be used as examples of application and will guide the user through all parts of the models.

3. CUTTER LIFE 3.1 Cutter Ring Life
28
3.1 CUTTER RING LIFE The cutter ring life, in boring hours, is proportional to the Cutter Life Index CLI. Figure 3.1 shows basic cutter ring life as a function of CLI and cutter diameter.
Figure 3.1 Basic cutter ring life, H0 .
���
���
���
��
��
��
��
�� �� �� �� ���
���� ���������� �
��
��
��������
��������
��������
��������

3. CUTTER LIFE 3.1 Cutter Ring Life
29
Correction for TBM Diameter Correction factor for TBM diameter is shown in Figure 3.2. The centre and gage cutters have a shorter lifetime than the face cutters. With increasing TBM diameter, the ratio of centre and gage cutters to face cutters decreases, and the average cutter will live longer.
Figure 3.2 Correction factor for TBM diameter. Correction for Cutterhead RPM The cutter ring life is inversely proportional to the cutterhead rpm, according to the assumption that the time dependent wear is proportional to the rolling velocity of the cutter. In other words: The cutter ring life in given rock conditions is constant if measured in rolled distance, independent of the rolling velocity. The correction factor for varying cutterhead rpm is shown in [3.1].
���
���
���
���
��� ��� ��� ��� ��� ���
�
!"#���$�����

3. CUTTER LIFE 3.1 Cutter Ring Life
30
dtbm = TBM diameter RPM = cutterhead rpm. Correction for Number of Cutters When the actual number of cutters on the cutterhead differs from the model, the life of the average cutter will change. Correction for actual number of cutters is:
Ntbm = actual number of cutters N0 = normal number of cutters (Figure 1.6). Correction for Quartz Content The cutter ring life varies with the rock content of quartz and other hard and abrasive minerals. Figure 3.3 shows the correction factor as a function of quartz content only. According to our experience, the content of minerals such as epidote and garnet may be included in the quartz content when estimating the cutter ring life from Figure 3.3. The correction factor in Figure 3.3 is based on normalised field and laboratory data. For rock types of Group 1, the curve may be explained by the fact that the CLI and the rock quartz content are not independent variables. Another possible explanation is that the laboratory test procedures for the CLI are influenced by the mineral composition of the rock.
RPMd
k tbmrpm
/50 = [3.1]
0
= N
Nk tbm
N [3.2]

3. CUTTER LIFE 3.1 Cutter Ring Life
31
When using the estimation model, CLI and rock quartz content should not be varied independently. For rock types of Group 1, one should be cautious when using quartz content close to 0 % and 27 %.
Figure 3.3 Correction factor for rock quartz content. The average life of cutter rings is given by [3.3], [3.4] and [3.5].
(h/c) / ) ( = 0 tbmNrpmQDh NkkkkHH ⋅⋅⋅⋅ [3.3]
(m/c)nhm IHH ⋅= [3.4]
/c)sm( 4 / = 32tbmnhf dIHH ⋅⋅⋅ π [3.5]
����#��$�%���%
�����#��$�&��%%
�����'��%%
�����'�$�����'��%%
�����'�$��
���
���
���
���
���
���
���
�(
� �� �� �� �� ���
(�$�)��*����+
�

3. CUTTER LIFE 3.1 Cutter Ring Life
32
H0 = basic average cutter ring life Hh = average cutter ring life in hours Hm = average cutter ring life in metres Hf = average cutter ring life solid cubic metres In = net penetration rate dtbm = TBM diameter. H0 (and Ht , see Appendix D) expresses life of one individual cutter ring in the average cutter position (≈ 0.59 ⋅ rtbm) in machine hours. E.g. for a CLI of 10 and a quartz content of 30 %, one 483 mm diameter cutter ring will have a life of approximately 70 hours in position 15 on a 3.5 m diameter TBM with standard machine parameters. Hh, Hm and Hf express averaged cutter life for the cutterhead or the tunnel. E.g. Hm = 10 m/c means that for each 10 m of tunnel, the total averaged wear on all the cutters on the cutterhead corresponds to one complete cutter ring. Hm = 10 m/c also means that, as an average, one has to change one cutter for every 10 m of tunnel bored.

4. GROSS ADVANCE RATE 4.0 Introduction
33
4.0 INTRODUCTION Gross advance rate is given in metres per week as an average for a longer period. Gross advance rate depends on net penetration rate, machine utilisation and the number of working hours during the period. The model is to a large extent based on experience data from a shift system that totals approximately 100 working hours per week. The machine utilisation includes only small amounts of rock support work. The model is therefore not directly applicable for tunnels with substantial amounts of rock support. The possibilities of changing cutters, performing maintenance and repair of the TBM and the backup, etc., while installing the rock support, should be evaluated. The Estimation Forms in Appendix D may be used as examples of application and will guide the user through all parts of the models.

4. GROSS ADVANCE RATE 4.1 Machine Utilisation
34
4.1 MACHINE UTILISATION The machine utilisation is net boring time expressed in per cent of total tunnelling time. Total tunnelling time includes • = Boring Tb • = Regripping Tt • = Cutter change and inspection Tc • = Repair and service of the TBM Ttbm • = Repair and service of the backup Tbak • = Miscellaneous Ta. The time consumption of the activities is expressed in hours per kilometre. Time consumption used in this report is representative for the better part of today's tunnelling practice. The machine utilisation is given by:
Boring The boring time depends on the average net penetration rate In.
Regripping Time for regripping depends on the stroke length of the thrust cylinders and time per regrip.
(%) + + + + +
100 =
abaktbmctb
b
TTTTTTT
u⋅ [4.1]
(h/km) 1000 = n
b IT [4.2]
4. GROSS ADVANCE RATE 4.1 Machine Utilisation
35
ls = stroke length, typically 1.5 - 2.0 m ttak = time per regrip. As an average, time per regrip ttak is 4.5 minutes. Time consumption varies with gripper hold, the stroke length, the TBM diameter, boring in curves, and the capacity of the hydraulic system. Under favourable conditions the time consumption will be somewhat lower, but may increase substantially under difficult conditions. Cutter Change Time for cutter change and inspection depends on the cutter ring life Hh, the net penetration rate In, and time used per changed cutter tc.
Time per changed cutter varies with the cutter size. Typically, time consumption is tc = 45 minutes for cutter diameter dc ≤ 432 mm (17 inches) tc = 60 minutes for cutter diameter dc ≥ 483 mm (19 inches). tc is based on data from cutterheads with front loaded cutters being changed under favourable working conditions. Water ingress, unstable rock conditions, high rock temperature, back loaded cutters, etc., may change the unit time substantially. The inspection time per changed cutter increases when boring in rock with low abrasivity. This gives an increased total time per changed cutter. Time per changed
(h/km) 60 1000
= s
takt l
tT
⋅⋅ [4.3]
(h/km) 60
1000 =
nh
cc IH
tT
⋅⋅⋅ [4.4]

4. GROSS ADVANCE RATE 4.1 Machine Utilisation
36
cutter also depends on number of cutters changed at one time. Few cutters changed each round gives a higher unit time tc, and may also give reduced cutter life. Other Activities The time consumption for repair, maintenance and service of the TBM and the backup, and miscellaneous activities, is shown in Figure 4.1. The time consumption is representative for well organised tunnelling operations. Time for possible main bearing failure and other long lasting stops is not included. Such risks must be evaluated separately. Miscellaneous includes the following activities: • = Normal rock support in good rock conditions, i.e. rock support that may be
installed while boring and without increasing the tunnelling crew • = Waiting for transport • = Tracks or roadway; installation and maintenance • = Surveying, moving of laser • = Water, ventilation, electric cable; installation and maintenance • = Washing and cleaning of the TBM and the backup • = Other (change of crews, incidental lost time, etc.). In addition to the listed items, miscellaneous includes time consumption related to the tunnelling method and organisation. For long headings (> 8 km), Miscellaneous demands an increasing part of the available tunnelling time. Waiting for transport will increase substantially if the capacity of the transport system is too low. Continuous Conveyor We have little data from TBM tunnelling using continuous conveyor for muck transport. The few data available suggests that a conveyor based system has more stop time than a rail based system, considering muck transport only. However, when the

4. GROSS ADVANCE RATE 4.1 Machine Utilisation
37
advantages of the conveyor-based system are incorporated fully into the total tunnelling operations in long tunnels, we expect a machine utilisation equal to or better than for a rail-based system. In tunnels requiring a large amount of installations following the excavation (e.g. road and railway tunnels), use of a continuous conveyor for muck transport is a good solution to reduce the overall construction time. Weekly Working Hours Most of the data are taken from tunnelling operations based on approximately 100 working hours per week. Hence, it is presupposed some available time outside the standard working hours to handle unforeseen and critical incidents like major repairs. Some parts of such time consumption are not registered in the shift log and are therefore not included in Figure 4.1. Figure 4.2 indicates that the possibilities to handle unforeseen and critical incidents in a flexible manner are fewer as the weekly working hours Tu increase towards 168 hours. Te expresses the available effective working hours when the weekly working hours differ from 100, which is the basis for the model. The curve is based on relative few observations, but is believed to be a conservative estimate regarding the loss of effective working hours. The weekly advance rate Iu will be:
u = machine utilisation Te = effective working hours per week Im = average net penetration rate over the tunnel
(m/week) 100/= meu ITuI ⋅⋅ [4.5]

4. GROSS ADVANCE RATE 4.1 Machine Utilisation
38
Figure 4.1 Time consumption for various activities.

4. GROSS ADVANCE RATE 4.1 Machine Utilisation
39
Figure 4.2 Effective working hours per week.
���
��
���
���
���
���
��
��
��
�� �� ��� ��� �� ��
��� ��� ��!����"� ���
#$�
����������
�����%
��

4. GROSS ADVANCE RATE 4.2 Additional Time Consumption
40
4.2 ADDITIONAL TIME CONSUMPTION Estimation of time consumption for a tunnel is based on weekly advance rate, estimated on the basis of the net penetration rate and the machine utilisation. In addition, extra time must be added for: • = Excavation of underground assembly and start-up area, tip station, etc., if
necessary • = Assembly and disassembly of the TBM and the backup in the tunnel, normally
from 4 to 8 weeks, mainly depending on the TBM diameter • = Excavation of niches, branchings, etc. • = Boring through and stabilising zones of poor rock quality • = Additional time for unexpected rock mass conditions • = Permanent rock support and lining work • = Downtime TBM (additional time for possible major machine breakdowns) • = Dismantling of tracks, ventilation, invert cleanup, etc. Furthermore, time for manufacturing or refurbishing the TBM and the backup may influence the overall time schedule, depending on the duration of the necessary activities to precede the TBM excavation. Refurbishing a used TBM may take from 3 to 6 months. Manufacturing a new TBM may take from 6 months to one year, depending mainly on the TBM diameter. Transport of the TBM and the backup to the site may also be influence the overall time schedule, for the same reasons as above. Transport of the TBM is a demanding operation since the largest component may weigh 20 tons or more, even for a 3.5 m diameter machine.

APPENDIX A. Previous Editions
41
A. PREVIOUS EDITIONS Previous editions of Hard Rock Tunnel Boring Report including project group members: 1-76 Norwegian edition Bengt Drageset Roy-Egil Hovde Erik Dahl Johansen Roar Sandnes O. Torgeir Blindheim Odd Johannessen 1-79 Norwegian edition Knut Gakkestad Jan Helgebostad Svein Paulsen Oddbjørn Aasen Erik Dahl Johansen O. Torgeir Blindheim Odd Johannessen 1-83 Norwegian and English edition Arne Lislerud Steinar Johannessen Amund Bruland Tore Movinkel Odd Johannessen 1-88 Norwegian and English edition Arne Lislerud Amund Bruland Bjørn-Erik Johannessen Tore Movinkel Karsten Myrvold Odd Johannessen 1-94 Norwegian and English edition Bård Sandberg Amund Bruland Jan Lima Odd Johannessen

APPENDIX B. Research Partners
42
B. RESEARCH PARTNERS The following external research partners have supported the project:
• =Statkraft anlegg as • =Norwegian Public Roads Administration • =Statsbygg • =Scandinavian Rock Group AS • =NCC Eeg-Henriksen Anlegg AS • =Veidekke ASA • =Andersen Mek. Verksted AS • =DYNO Nobel • =Atlas Copco Rock Drills AB • =Tamrock OY • =The Research Council of Norway

APPENDIX C. List of Parameters
43
C. List of Parameters The parameters used in the report are listed in the following. The list is according to when the parameter first is explained or treated. Parameter Description Unit Page ac average cutter spacing - cutterhead mm 20 b penetration coefficient 14 cc cutter constant - torque demand 25 CLI Cutter Life Index 9 dc cutter diameter mm 10 dtbm TBM diameter m 10 DRI Drilling Rate Index 9 H0 basic cutter ring life - individual cutter h 28 Hf cutter ring life - cutterhead sm3/c 31 Hfm averaged cutter ring life over the tunnel - cutterhead sm3/c 53 Hh cutter ring life - cutterhead h/c 31 Hhm averaged cutter ring life over the tunnel - cutterhead h/c 53 Hm cutter ring life - cutterhead m/c 31 Hmm averaged cutter ring life over the tunnel - cutterhead m/c 53 Ht average cutter ring life over the tunnel - individual cutter h 53 i0 basic penetration mm/rev 14 I0 basic net penetration rate m/h 21 Iesp net penetration rate including the effect of Marked Single Joints m/h 22 In net penetration rate m/h 22 Im average net penetration rate over the tunnel m/h 37 Iu weekly advancerate m/week 37 ka correction factor for cutter spacing - penetration 20 kc cutter coefficient - torque demand 24 kd correction factor for cutter diameter - penetration 20

APPENDIX C. List of Parameters
Parameter Description Unit Page
44
kD correction factor for cutterhead diameter - cutter ring life 29 kDRI correction factor for DRI ≠ 49 - penetration 17 kesp penetration addition for Marked Single Joints 22 kekv equivalent fracturing factor 17 kN correction factor for no. of cutters - cutter ring life 30 kpor correction factor for porosity - penetration 18 kQ correction factor for rock quartz content - cutter ring life 31 kRPM correction factor for cutterhead RPM - cutter ring life 30 ks fracturing factor 16 ksi fracturing factor for set no. i 16 ks-tot total fracturing factor 16 lesp tunnel length of Marked Single Joints m 22 lj lengt of (geological) zone no. j m 22 ls stroke length of TBM m 35 M1 critical thrust for 1 mm/rev penetration kN/c 14 MB gross average thrust per cutter kN/c 10 Mekv equivalent thrust per cutter kN/c 14 N0 normal no. of cutters on the cutterhead 12 Ntbm actual no. of cutters on the cutterhead 12 P rock porosity % 18 Pn necessary installed cutterhead power kW 25 Ptbm installed cutterhead power kW 13 Q rock quartz content % 30 ri position on cutterhead for cutter no. i m 24 rmc relative position of the average cutter position 24 RPM cutterhead revolutions rev/min 12 Sp type of fracturing - joints 7 St type of fracturing - fissures 7 Ta time for miscellaneous tunnelling activities h/km 34 Tb time for boring h/km 34 Tbak time for repair and service of the backup h/km 34

APPENDIX C. List of Parameters
Parameter Description Unit Page
45
tc time per changed cutter min 35 Tc time for cutter change and inspection h/km 34 Te effective working (shift) hours m/week 37 Tn gross torque demand kNm 24 Tt time for regripping h/km 34 ttak time per regrip min 35 Ttbm time for repair and service of TBM h/km 34 Tu weekly working hours h/week 37 u machine utilization % 34 α angle between tunnel axis and planes of weakness degrees(°) 16 αesp angle between tunnel axis and Marked Single Joints degrees(°) 22 α f dip angle of planes of weakness degrees(°) 16 αs strike direction of planes of weakness degrees(°) 16 α t tunnel direction degrees(°) 16

APPENDIX D. Estimation Forms
The Department of Building and Construction Engineering, NTNU, Trondheim 46
D.1 Machine Data
Tunnel Date Signed
TBM diameter dtbm m Figure 1.4
Cutter diameter dc mm Figure 1.4
Cutterhead rpm RPM rpm Figure 1.5
Number of cutters on the cutterhead Ntbm Figure 1.6
Average cutter spacing ac = dtbm · 1000 / (2 · Ntbm )
mm
Gross thrust per cutter MB kN/c Figure 1.4
Installed power Ptbm kW Figure 1.7
Relative position of the average cutter rmc [2.11]
Stroke length ls m Page 35

APPENDIX D. Estimation Forms
The Department of Building and Construction Engineering, NTNU, Trondheim 47
D.2 Geological Parameters
Tunnel/zone Date Signed
Length lj m
Drilling Rate Index DRI Figure 1.2
Cutter Life Index CLI Figure 1.3
Quartz content Q %
Rock group Figure 3.3
Porosity P %
Fracturing Class Figure 1.1
Set no. 1 Orientation α ° [2.2]
Fracturing factor ks1 Figure 2.3
Fracturing Class Figure 1.1
Set no. 2 Orientation α ° [2.2]
Fracturing factor ks2 Figure 2.3
Fracturing Class Figure 1.1
Set no. 3 Orientation α ° [2.2]
Fracturing factor ks3 Figure 2.3
Total fracturing factor ( ) 0.36 1 = 1
⋅−−=
− nkkn
isitots
[2.3]

APPENDIX D. Estimation Forms
The Department of Building and Construction Engineering, NTNU, Trondheim 48
D.3 Net Penetration Rate
Tunnel/zone Date Signed
Rock mass fracturing factor ks-tot D.2
Correction for DRI ≠ 50 kDRI Figure 2.3
Correction for porosity > 2 % kpor Figure 2.4
Equivalent fracturing kekv = ks-tot · kDRI ⋅ kpor [2.4]
Gross thrust per cutter MB kN/c Figure 1.4
Correction for cutter diameter ≠ 483 mm kd Figure 2.6
Correction for average cutter spacing ≠ 70 mm ka Figure 2.7
Equivalent thrust Mekv = MB · kd · ka kN/c [2.5]
Basic penetration i0 mm/rev Figure 2.5
Cutterhead rpm RPM rpm Figure 1.5
Basic net penetration rate I0 = i0 · RPM · 60 / 1000 m/h [2.6]

APPENDIX D. Estimation Forms
The Department of Building and Construction Engineering, NTNU, Trondheim 49
D.4 Net Penetration Rate (including correction for Marked Single Joints)
Tunnel/zone Date Signed
Length of zone lj m
Tunnel length of Marked Single Joints lesp m [2.7]
Basic net penetration rate I0 m/h D.3
Drilling Rate Index DRI Figure 1.2
Orientation of Marked Single Joints αesp ° [2.2]
Correction for Marked Single Joints kesp Figure 2.9
Penetration rate in Marked Single Joints Iesp = I0 · kesp
m/h
[2.8]
Average net penetration rate of the zone In = lj / ((lj - lesp ) /I0 + lesp / Iesp )
m/h
[2.9]

APPENDIX D. Estimation Forms
The Department of Building and Construction Engineering, NTNU, Trondheim 50
D.5 Torque Control
Tunnel/zone
Date Signed
Relative position of the average cutter rmc [2.11]
TBM diameter dtbm m D.1
Number of cutters Ntbm Figure 1.6
Gross thrust per cutter MB kN/c Figure 1.4
Cutter diameter dc mm D.1
Cutter constant cc Figure 2.10
Basic penetration i0 mm/rev Figure 2.5
Cutter coefficient kc = cc · √i0 [2.12]
Required torque Tn = rmc · dtbm · Ntbm · MB · kc / 2 kNm [2.10]
Cutterhead rpm RPM rpm Figure 1.5
Required power Pn = Tn · 2 · π · RPM / 60 kW [2.13]
Installed power Ptbm kW Figure 1.7
If the installed power is insufficient to meet the required torque, the estimation of net penetration rate and required power must be repeated with a lower gross thrust per cutter. The necessary torque is estimated without including Marked Single Joints.

APPENDIX D. Estimation Forms
The Department of Building and Construction Engineering, NTNU, Trondheim 51
D.6 Cutter Ring Life
Tunnel/zone Date Signed
Cutter Life Index CLI Figure 1.3
Quartz content Q % D.2
Rock group Figure 3.3
Basic cutter ring life H0 h Figure 3.1
Correction for TBM diameter kD Figure 3.2
Correction for quartz content kQ Figure 3.3
TBM diameter dtbm m D.1
Cutterhead rpm RPM rpm Figure 1.5
Correction for cutterhead rpm kRPM = (50 / dtbm ) / RPM
[3.1]
Number of cutters on the cutterhead Ntbm Figure 1.6
Standard number of cutters N0 Figure 1.6
Correction for number of cutters kN = Ntbm / N0 [3.2]
Cutter ring life Hh = H0 · kD · kQ · kRPM · kN / Ntbm h/c [3.3]
Net penetration rate In m/h D.4
Cutter ring life Hm = Hh · In m/c [3.4]
Cutter ring life Hf = Hh · In · π · dtbm2 / 4 sm3/c [3.5]

APPENDIX D. Estimation Forms
The Department of Building and Construction Engineering, NTNU, Trondheim 52
D.7 Net Penetration Rate, Average Over the Tunnel
Tunnel Date Signed
Zone no. j 1 2 3 4 5
Length lj (m)
Net penetration rate Inj (m/h)
Average net penetration rate Im
(m/h)
=Σ
Σ=
)/( njj
jm Il
lI

APPENDIX D. Estimation Forms
The Department of Building and Construction Engineering, NTNU, Trondheim 53
D.8 Cutter Ring Life, Average Over the Tunnel
Tunnel Date Signed
Zone no. j 1 2 3 4 5
Length lj (m)
Net penetration rate Inj (m/h)
Cutter ring life Hhj (h/c)
Cutter ring life Hmj (m/c)
Cutter ring life Hfj (sm3/c)
Average cutter ring life
h/c
Average cutter ring life
m/c
Average cutter ring life
sm3/c
Average cutter ring life h/c
=⋅= tbmhmt NHH
=Σ
Σ=
)/
(
)/(
hj
njj
njjhm
HIlIl
H
=Σ
Σ=
)/( mjj
jmm Hl
lH
=Σ
Σ=
)/( fjj
jfm Hl
lH

APPENDIX D. Estimation Forms
The Department of Building and Construction Engineering, NTNU, Trondheim 54
D.9 Machine Utilisation and Weekly Advance Rate
Tunnel Date Signed
Net penetration rate Im m/h D.7
Boring time Tb = 1000 / Im h/km [4.2]
Stroke length ls m Page 35
Time per regrip ttak min Page 35
Regripping time Tt = 1000 · ttak / (60 · ls ) h/km [4.3]
Time per changed cutter tc min Page 35
Cutter ring life Hhm h/c D.8
Cutter time Tc = 1000 · tc / (60 · Hhm · Im ) h/km [4.4]
Repair and service of TBM Ttbm h/km Figure 4.1
Repair and service of backup Tbak h/km Figure 4.1
Other time consumption Ta h/km Figure 4.1
Machine utilization u = (100 · Tb ) / (Tb + Tt + Tc + Ttbm + Tbak + Ta )
%
[4.1]
Nominal working hours Tu h/week Page 37
Effective working hours Te h/week Figure 4.2
Weekly advance rate Iu = u ⋅ Te · Im / 100 m/week [4.5]

ISBN 82-471-0281-1ISSN 0802-3271