hanging drop online supplimentary (3)
TRANSCRIPT
1
Supporting Online Material for
Hanging drop: an in-vitro air toxic exposure
model using human lung cells in 2D and 3D
structures Faye F. Liu*
1, 2, Cheng Peng
1, 2, Beate I. Escher
1, Emmanuelle Fantino
3, Cindy Giles
4,
Stephen Were4, Lesley Duffy
5, Jack C. Ng*
1, 2
RECEIVED DATE (to be automatically inserted after your manuscript is accepted)
*To whom correspondence should be addressed: 1. Faye F. Liu, Phone: +61 7
32749060, Fax: + 67 32749003, Email: [email protected]; 2. Jack C. Ng, Phone: +61
7 32749020, Fax: + 67 32749003, Email: [email protected].
This PDF file includes:
Materials and methods
Figures S1 to S4
Table S1
References S1 to S4
2
1 IN SITU MTS, CELLTITER-GLO® AND CELLTITER-BLUE®
ASSAY
Three types of cell viability assays were used for cell viability monitoring in this paper due
to differences in reaction volume and the need of higher surface tension of the reaction drops.
The assays were: CellTiter 96® AQueous Non-Radioactive Cell Proliferation Assay
(Promega # G5430), CellTiter-Glo® Luminescent Cell Viability Assay (Promega #G7571)
and CellTiter-Blue® Cell Viability Assay (Promega #G8081).
1.1 MTS assay
Promega CellTiter 96 AQueous Non-Radioactive Cell Proliferation (MTS) assay kit was
used for diffusion air exposure and the protocol was in accordance to the manufacturer’s
instructions with modifications to perform in situ reaction in the following three steps: 1)
pipette 400 µL MTS agent into a 20 mL VOA vial containing 1.6 mL of DMEM with
HEPES; 2) transfer the vial into a 37oC constant temperature room for 45 min, and 3) transfer
150 µL of the reaction mix into each well of a 96 well plate, for absorbance reading @
490nm on a Tecan Infinite plate reader (M200, Tecan group Ltd, Switzerland).
1.2 CellTiter-Glo® Luminescent Cell Viability Assay
CellTiter-Glo® Luminescent Cell Viability Assays were used in monitoring cell viability of
Hanging drop cultures and it was performed according to the manufacturer’s instructions with
modifications to perform in-situ cell lysis reaction: After the exposure, the VOA vials were
opened in the laminar flow cabinet with the lid facing up. 20 µL of CellTiter-Glo® agent
were pipette onto the 20 µL hanging drop culture on the septum of the lid. These lids were
3
then placed in a tray, covered with a transparent cover to prevent evaporation and at the same
time to allow luminescence to develop under light. This tray was then placed on a platform
shaker to shake for 12 min at room temperature, at a speed that did not disturb the drops.
When finished, an aliquot of 25 µL of the reaction mixture was then transferred into a clear
bottom 384 well plate (Corning #3712) for luminescence measurement on an Infinite M200
plate reader (TECAN, Switzerland).
1.3 CellTiter-Blue® Cell Viability Assay
In situ CellTiter-Blue®
Cell Viability assays were performed according to manufacturer’s
recommendation with modifications. Briefly: 1 plate of HD cultures were opened, inverted
to have the drops on top of the lid in the biohazard hood, water from the bottom tray was
drained on a tissue; 20 µL of CellTiter-Blue® reagent was then added on top of each drop of
10 randomly selected drops; the drops were then capped with the bottom of the tray on top
and placed back into the incubator for 2 hours before the drops were transferred into a 384
well plates (Corning #3712) for florescent measurement on an Infinite M200 plate reader
(TECAN, Switzerland) with the gain manually set at 100.
2 HISTOLOGY
For histology studies, A549 cell 3D structures were fixed in 10% formalin, confined into a
cell button for easy handing with 3% low melting point agarose, processed, embedded in wax
in Cytology Laboratory in Queen Elizabeth II Hospital and stained in the Queensland Health
Forensic and Scientific Services (QHFSS) Histology Laboratory.
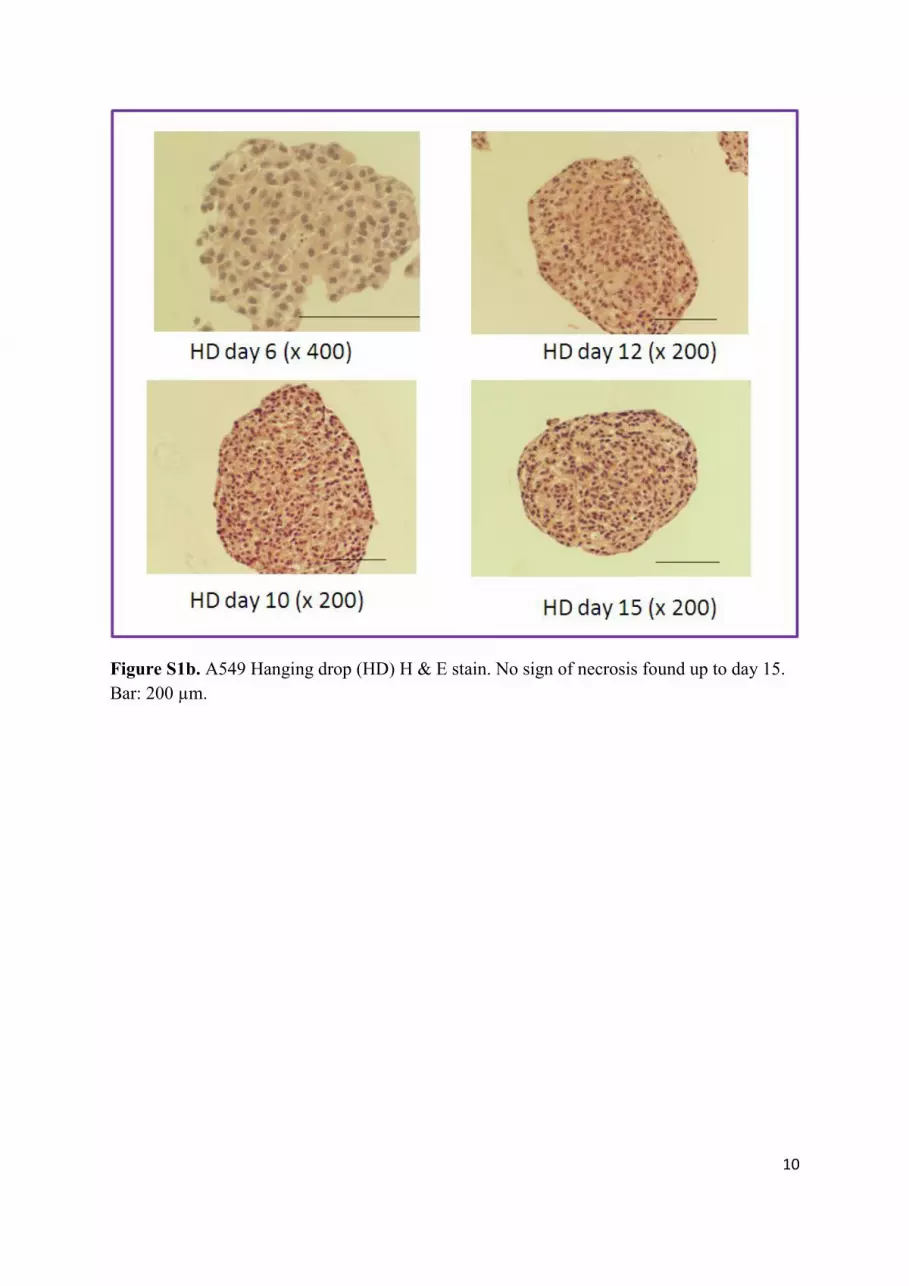
As have shown in microscopic and histological studies illustrated in Figure S1, although
A549 cells in a 2D format do not differentiate, in 3D spheroid form, H and E stains of day 10
HD showed that the culture underwent different stages of differentiation and evidently ducts
4
resembling alveolar sacs were starting to form on day 10. No evidence of necrosis was found
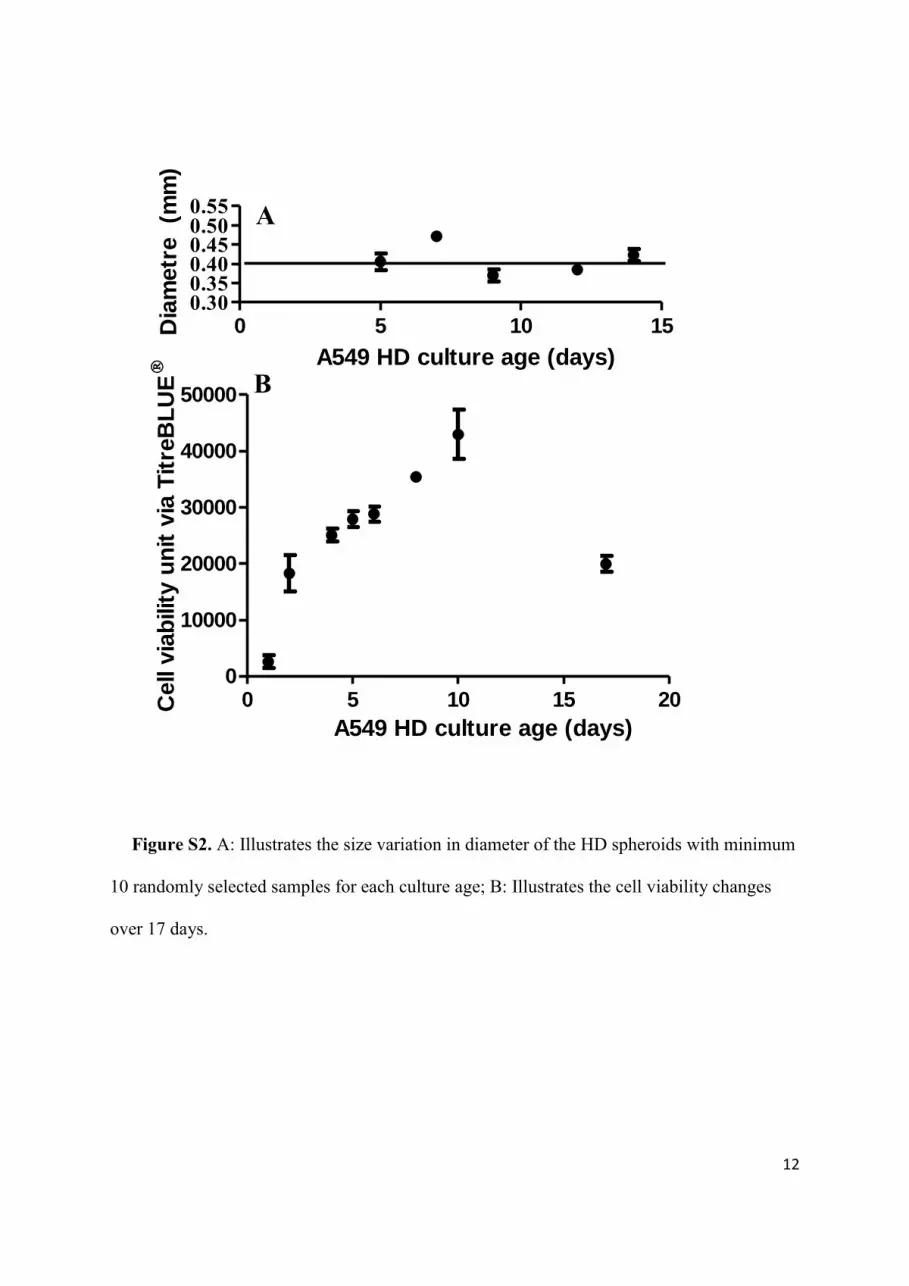
for all of the 3D cultures. The growth of HD spheroids is illustrated in Figure S2. Although as
illustrated in Figure S2, no trend of changes in spheroid diameter was found between days 5
to 14 cultures, a trend of increase in cell viability via CellTiter-Blue® assay was found from
day 1 up until day 10.
3 CELL GROWTH
Because CellTiter-Glo® assay reagent has a weak surface tension, which makes the
neighboring reaction drops to run into each other hence loose the reaction. CellTiter-Blue®
Cell Viability Assay (Promega #G8081) were chosen instead of CellTiter-Glo® assay to
monitor cell viability changes of non exposed HD cultures over 20 days. To set up the
cultures, 20 µL hanging drop (HD) cultures at 1 x 10⁴ cells/mL were inoculated on the lids of
each of 60-well plates (Thermo Scientific #439225) using a multichannel pipette. 1 mL of
water was added into the well side of the 60-well plate for form individual humidity
chambers. All of the plates with HD cultures were then packed further into plastic humidity
chamber before placed into 37ºC incubator until cell viability assay time. The HD cell
viability is assayed on day 1, 2, 4, 5, 6, 8, 10 and 17 to monitor cell growth of HD cultures.
Cell viability of the HDs was plotted against culture age as shown in Figure S2. As have
shown in Figure S2, HD cell viability, as represented by florescent intensity, continued to
grow from day 1 until day 10. The florescent intensity at day 17 falls to the same level as in
day 4.
5
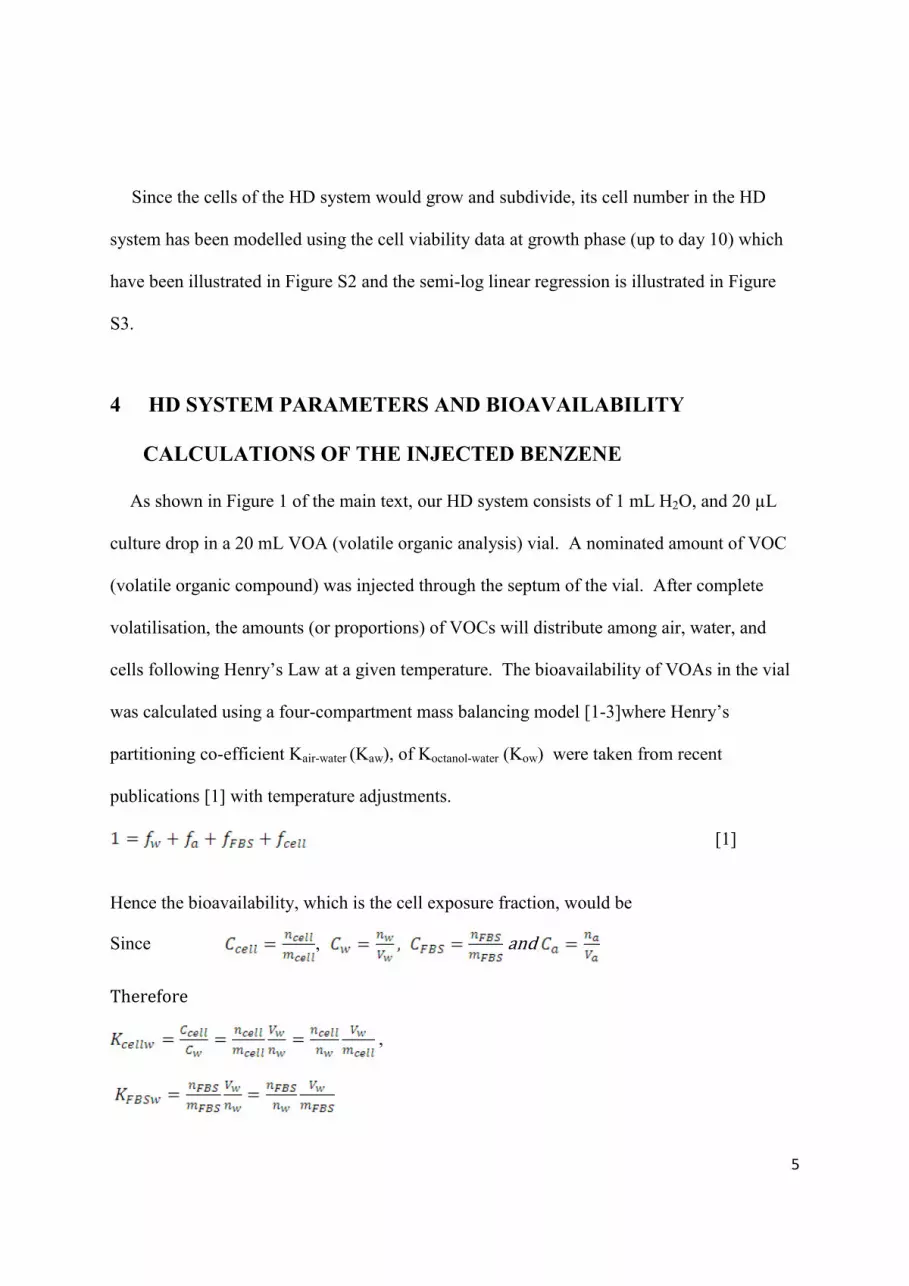
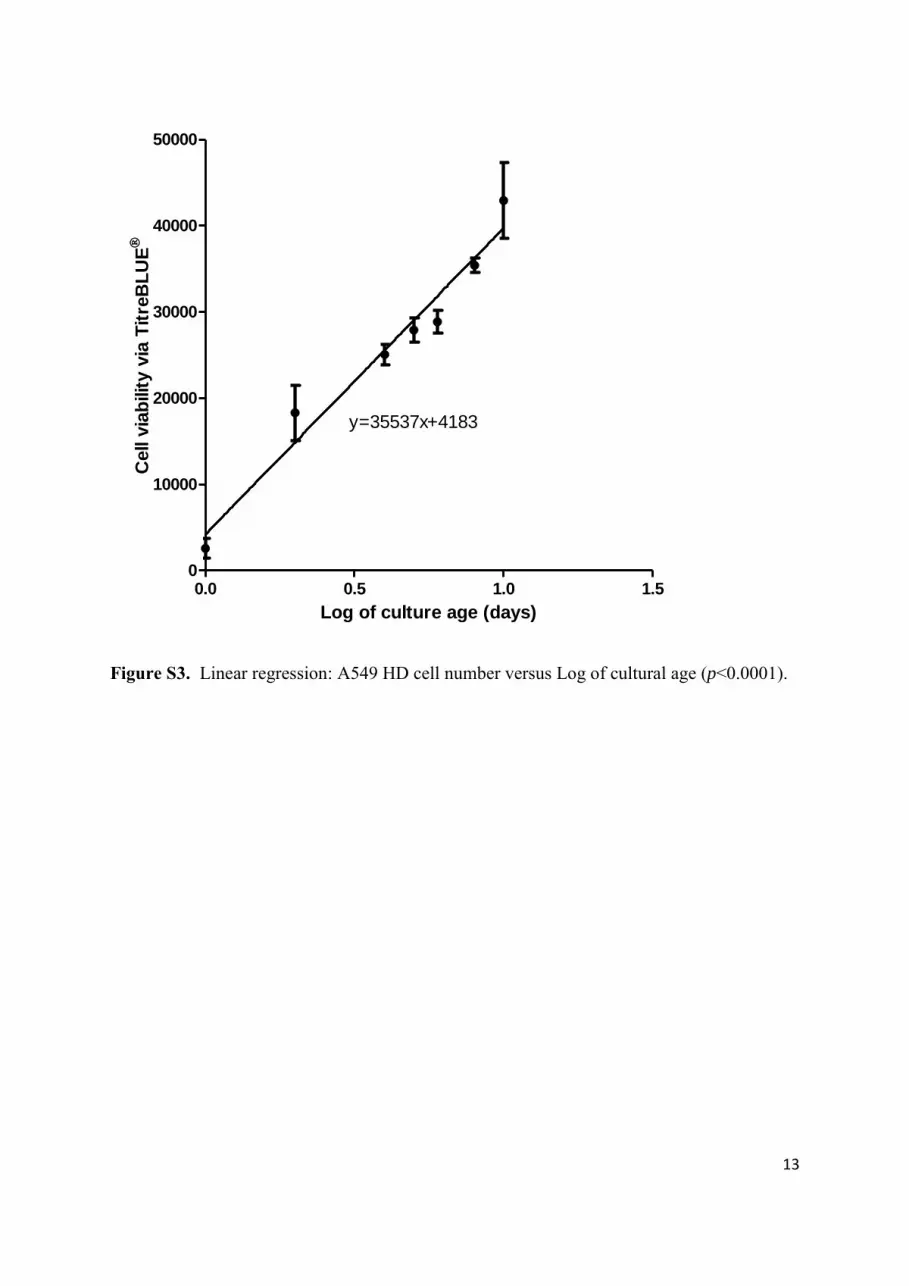
Since the cells of the HD system would grow and subdivide, its cell number in the HD
system has been modelled using the cell viability data at growth phase (up to day 10) which
have been illustrated in Figure S2 and the semi-log linear regression is illustrated in Figure
S3.
4 HD SYSTEM PARAMETERS AND BIOAVAILABILITY
CALCULATIONS OF THE INJECTED BENZENE
As shown in Figure 1 of the main text, our HD system consists of 1 mL H2O, and 20 µL
culture drop in a 20 mL VOA (volatile organic analysis) vial. A nominated amount of VOC
(volatile organic compound) was injected through the septum of the vial. After complete
volatilisation, the amounts (or proportions) of VOCs will distribute among air, water, and
cells following Henry’s Law at a given temperature. The bioavailability of VOAs in the vial
was calculated using a four-compartment mass balancing model [1-3]where Henry’s
partitioning co-efficient Kair-water (Kaw), of Koctanol-water (Kow) were taken from recent
publications [1] with temperature adjustments.
[1]
Hence the bioavailability, which is the cell exposure fraction, would be
Since , and
Therefore
,
6
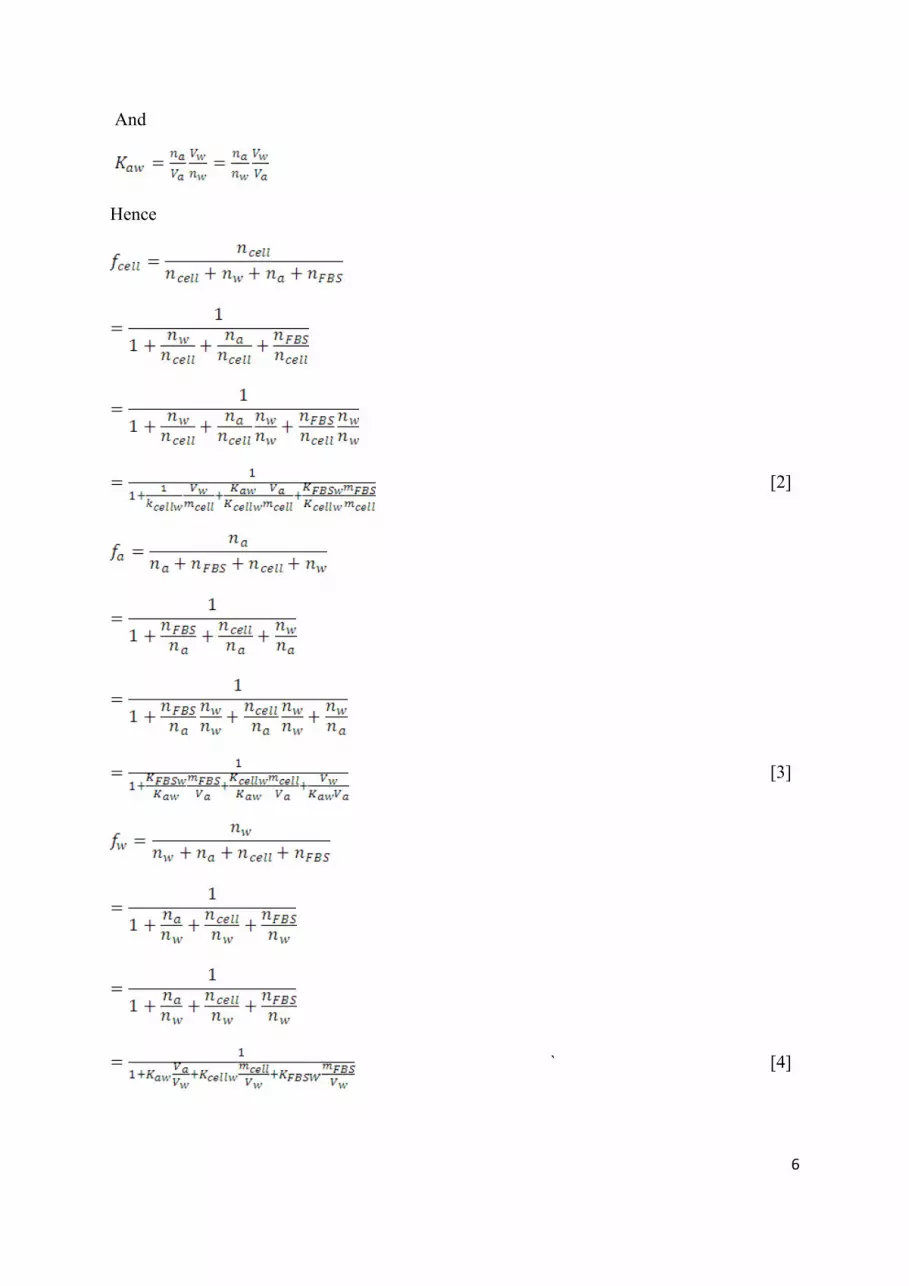
And
Hence
[2]
[3]
` [4]
7
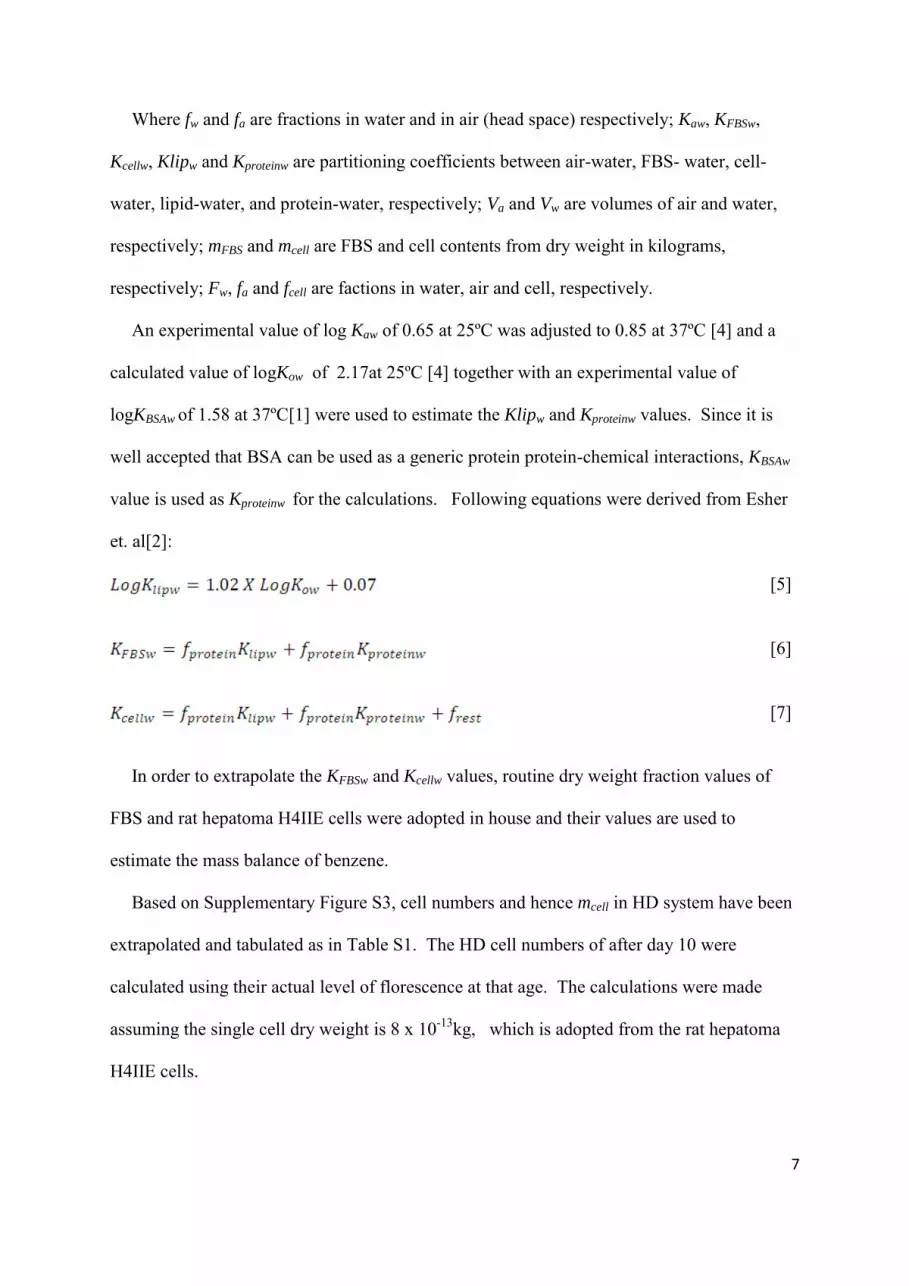
Where fw and fa are fractions in water and in air (head space) respectively; Kaw, KFBSw,
Kcellw, Klipw and Kproteinw are partitioning coefficients between air-water, FBS- water, cell-
water, lipid-water, and protein-water, respectively; Va and Vw are volumes of air and water,
respectively; mFBS and mcell are FBS and cell contents from dry weight in kilograms,
respectively; Fw, fa and fcell are factions in water, air and cell, respectively.
An experimental value of log Kaw of 0.65 at 25ºC was adjusted to 0.85 at 37ºC [4] and a
calculated value of logKow of 2.17at 25ºC [4] together with an experimental value of
logKBSAw of 1.58 at 37ºC[1] were used to estimate the Klipw and Kproteinw values. Since it is
well accepted that BSA can be used as a generic protein protein-chemical interactions, KBSAw
value is used as Kproteinw for the calculations. Following equations were derived from Esher
et. al[2]:
[5]
[6]
[7]
In order to extrapolate the KFBSw and Kcellw values, routine dry weight fraction values of
FBS and rat hepatoma H4IIE cells were adopted in house and their values are used to
estimate the mass balance of benzene.
Based on Supplementary Figure S3, cell numbers and hence mcell in HD system have been
extrapolated and tabulated as in Table S1. The HD cell numbers of after day 10 were
calculated using their actual level of florescence at that age. The calculations were made
assuming the single cell dry weight is 8 x 10-13kg, which is adopted from the rat hepatoma
H4IIE cells.
8
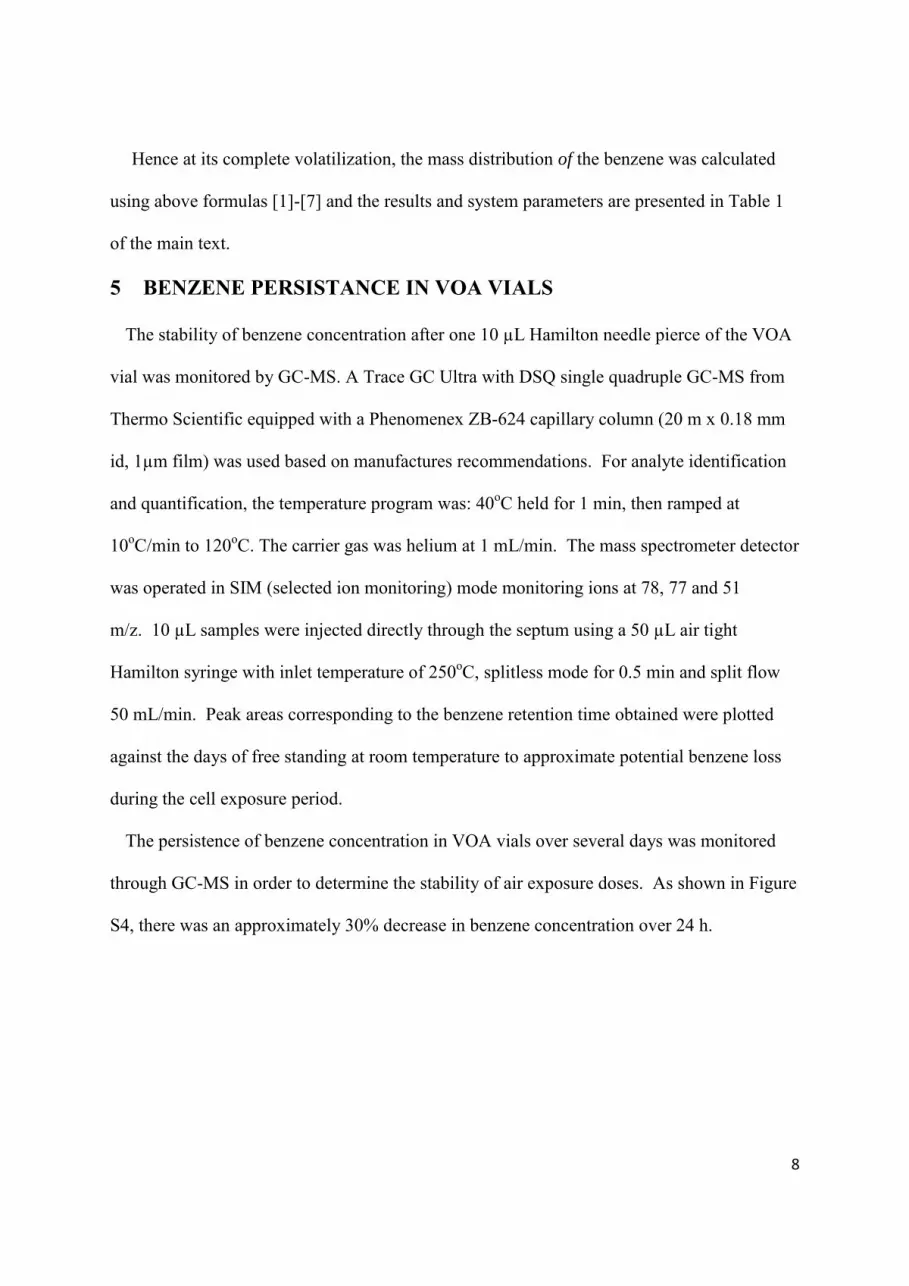
Hence at its complete volatilization, the mass distribution of the benzene was calculated
using above formulas [1]-[7] and the results and system parameters are presented in Table 1
of the main text.
5 BENZENE PERSISTANCE IN VOA VIALS
The stability of benzene concentration after one 10 µL Hamilton needle pierce of the VOA
vial was monitored by GC-MS. A Trace GC Ultra with DSQ single quadruple GC-MS from
Thermo Scientific equipped with a Phenomenex ZB-624 capillary column (20 m x 0.18 mm
id, 1µm film) was used based on manufactures recommendations. For analyte identification
and quantification, the temperature program was: 40oC held for 1 min, then ramped at
10oC/min to 120oC. The carrier gas was helium at 1 mL/min. The mass spectrometer detector
was operated in SIM (selected ion monitoring) mode monitoring ions at 78, 77 and 51
m/z. 10 µL samples were injected directly through the septum using a 50 µL air tight
Hamilton syringe with inlet temperature of 250oC, splitless mode for 0.5 min and split flow
50 mL/min. Peak areas corresponding to the benzene retention time obtained were plotted
against the days of free standing at room temperature to approximate potential benzene loss
during the cell exposure period.
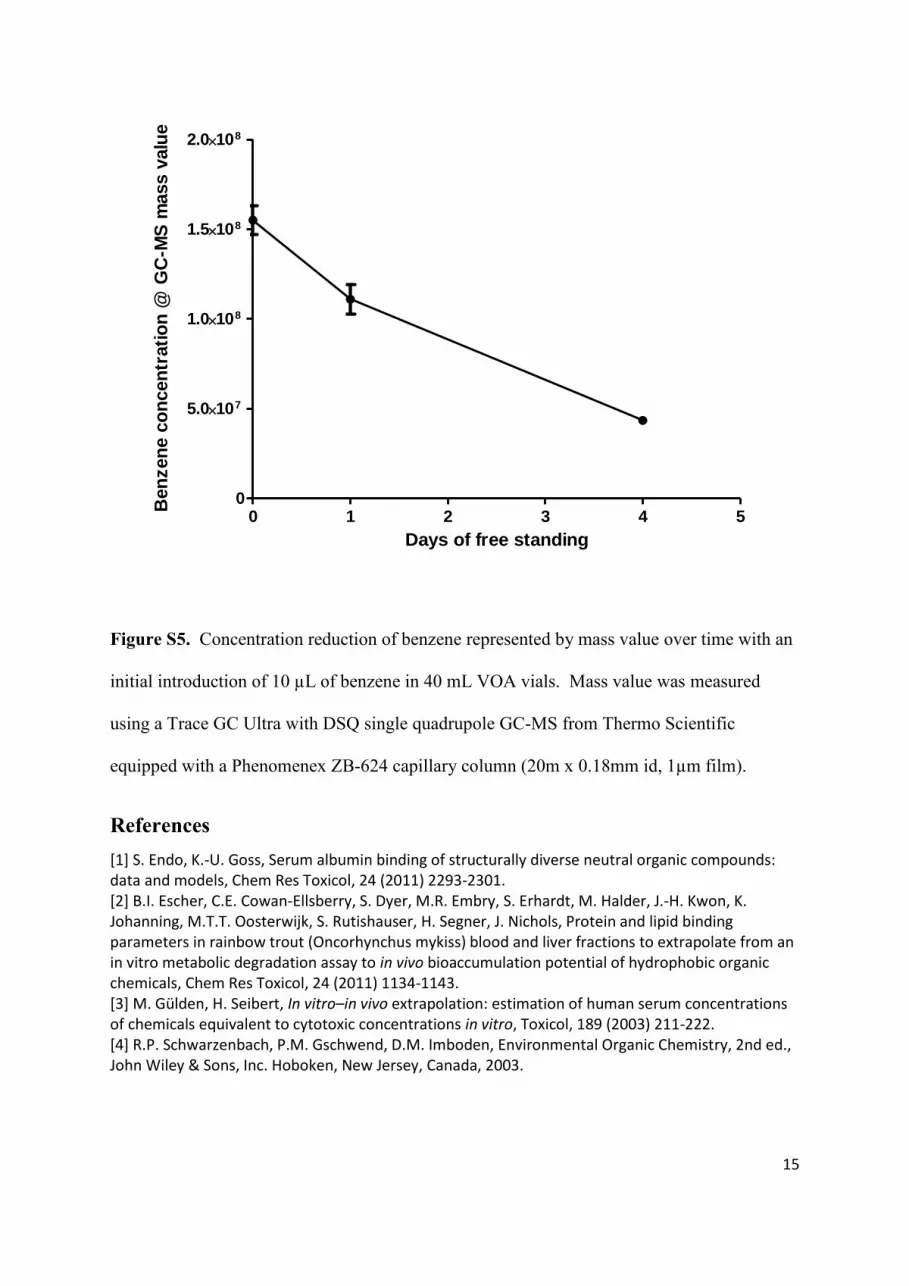
The persistence of benzene concentration in VOA vials over several days was monitored
through GC-MS in order to determine the stability of air exposure doses. As shown in Figure
S4, there was an approximately 30% decrease in benzene concentration over 24 h.
9
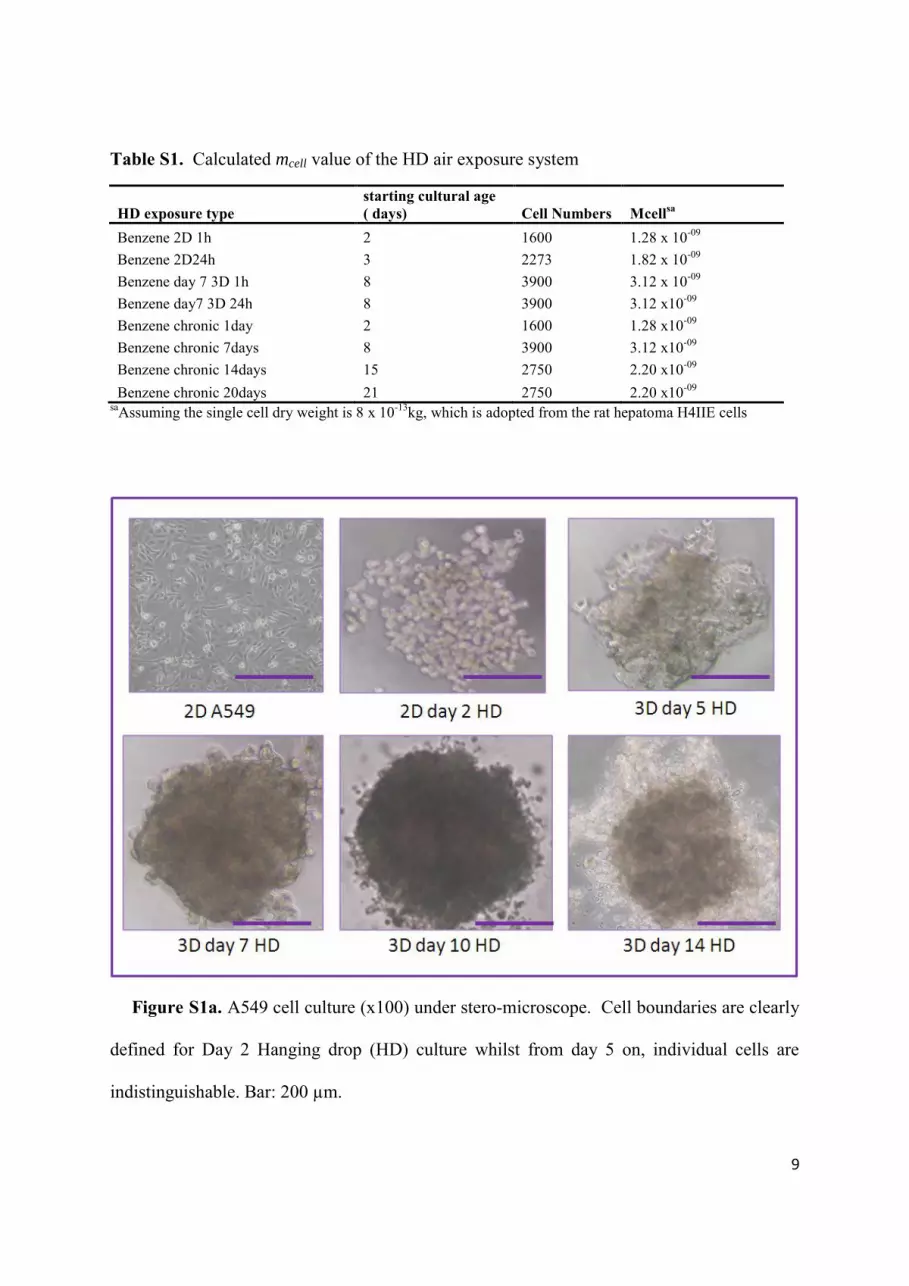
Table S1. Calculated mcell value of the HD air exposure system
HD exposure type starting cultural age ( days) Cell Numbers Mcellsa
Benzene 2D 1h 2 1600 1.28 x 10-09 Benzene 2D24h 3 2273 1.82 x 10-09 Benzene day 7 3D 1h 8 3900 3.12 x 10-09 Benzene day7 3D 24h 8 3900 3.12 x10-09 Benzene chronic 1day 2 1600 1.28 x10-09 Benzene chronic 7days 8 3900 3.12 x10-09 Benzene chronic 14days 15 2750 2.20 x10-09 Benzene chronic 20days 21 2750 2.20 x10-09
saAssuming the single cell dry weight is 8 x 10-13kg, which is adopted from the rat hepatoma H4IIE cells
Figure S1a. A549 cell culture (x100) under stero-microscope. Cell boundaries are clearly
defined for Day 2 Hanging drop (HD) culture whilst from day 5 on, individual cells are
indistinguishable. Bar: 200 µm.
10
Figure S1b. A549 Hanging drop (HD) H & E stain. No sign of necrosis found up to day 15.
Bar: 200 µm.
11
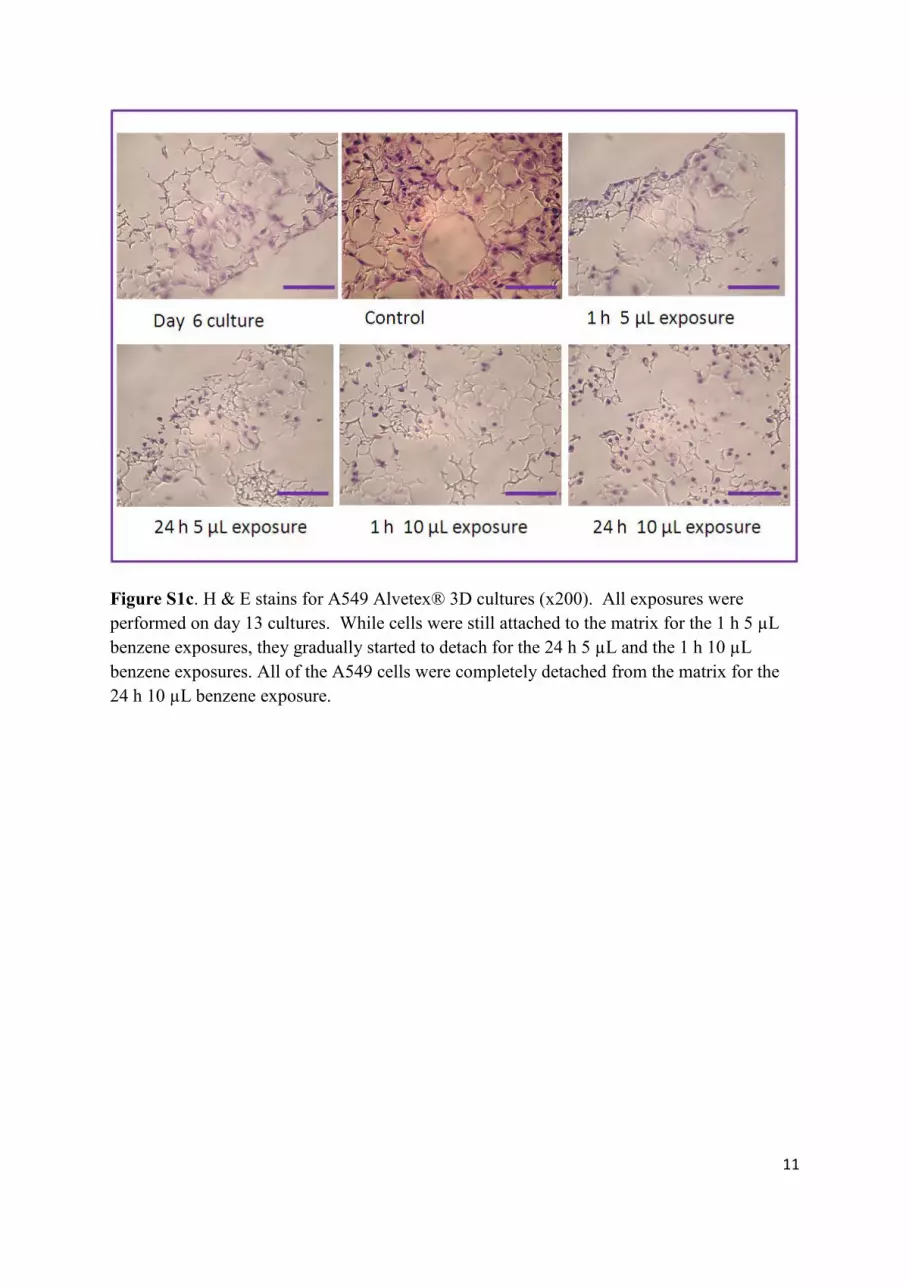
Figure S1c. H & E stains for A549 Alvetex® 3D cultures (x200). All exposures were performed on day 13 cultures. While cells were still attached to the matrix for the 1 h 5 µL benzene exposures, they gradually started to detach for the 24 h 5 µL and the 1 h 10 µL benzene exposures. All of the A549 cells were completely detached from the matrix for the 24 h 10 µL benzene exposure.
12
0 5 10 150.300.350.400.450.500.55
A549 HD culture age (days)
A
Dia
metr
e
(mm
)
0 5 10 15 200
10000
20000
30000
40000
50000
A549 HD culture age (days)
B
Cell v
iab
ilit
y u
nit
via
Tit
reB
LU
E
Figure S2. A: Illustrates the size variation in diameter of the HD spheroids with minimum
10 randomly selected samples for each culture age; B: Illustrates the cell viability changes
over 17 days.
13
0.0 0.5 1.0 1.50
10000
20000
30000
40000
50000
y=35537x+4183
Log of culture age (days)
Cell v
iab
ilit
y v
ia T
itre
BL
UE
Figure S3. Linear regression: A549 HD cell number versus Log of cultural age (p<0.0001).
14
D: 1h HD vs scaffold
Control 5 L 10 L0
50
100
150Hanging drop2D roller mixer- control3D scaffold roller mixer
Benzene vol (uL)
% C
ell v
iabi
lity
via
MTS
Control 5 L 10 L0
50
100
150
200
C: 48h air exposure comparison
Benzene vol (L)
E: 24h HD vs scaffold
Control 5 L 10 L0
50
100
150Hanging drop2D roller mixer - control3D scaffold
Benzene vol (uL)
% r
ecov
ery
via
MTS
Control 5 L 10 L0
50
100
150Hanging drop1mL roller mixer1mL media diffusion2mL media diffusion4mL media diffusion
A: 1h Air exposure comparison
1 2 30
50
100
150 B: 24h Air exposure comparison
control 5 L 10L
%C
ell v
iail
ity
via
Titr
eGlo
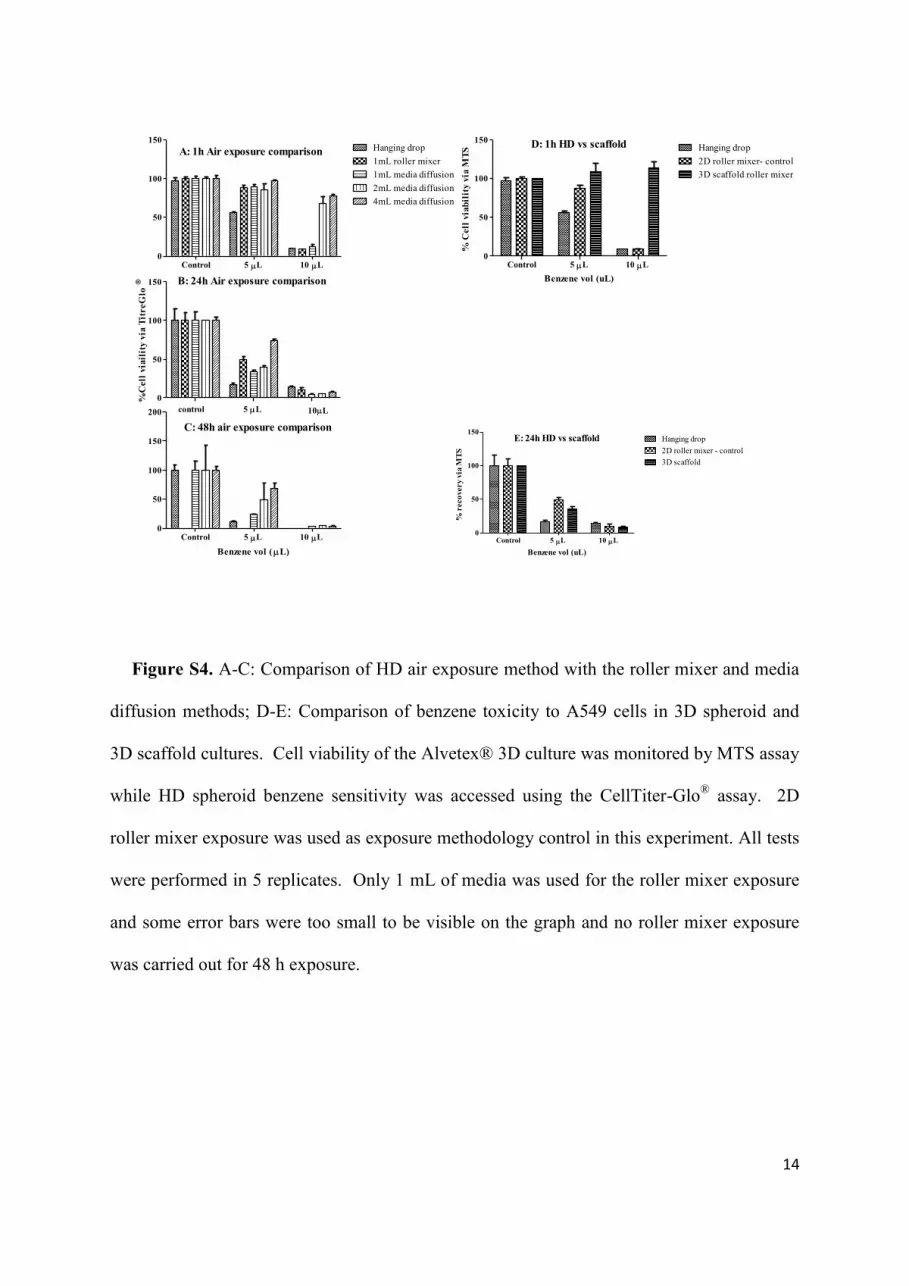
Figure S4. A-C: Comparison of HD air exposure method with the roller mixer and media
diffusion methods; D-E: Comparison of benzene toxicity to A549 cells in 3D spheroid and
3D scaffold cultures. Cell viability of the Alvetex® 3D culture was monitored by MTS assay
while HD spheroid benzene sensitivity was accessed using the CellTiter-Glo® assay. 2D
roller mixer exposure was used as exposure methodology control in this experiment. All tests
were performed in 5 replicates. Only 1 mL of media was used for the roller mixer exposure
and some error bars were too small to be visible on the graph and no roller mixer exposure
was carried out for 48 h exposure.
15
0 1 2 3 4 50
5.0107
1.0108
1.5108
2.0108
Days of free standing
Ben
zen
e c
on
cen
trati
on
@ G
C-M
S m
ass v
alu
e
Figure S5. Concentration reduction of benzene represented by mass value over time with an
initial introduction of 10 µL of benzene in 40 mL VOA vials. Mass value was measured
using a Trace GC Ultra with DSQ single quadrupole GC-MS from Thermo Scientific
equipped with a Phenomenex ZB-624 capillary column (20m x 0.18mm id, 1µm film).
References [1] S. Endo, K.-U. Goss, Serum albumin binding of structurally diverse neutral organic compounds: data and models, Chem Res Toxicol, 24 (2011) 2293-2301. [2] B.I. Escher, C.E. Cowan-Ellsberry, S. Dyer, M.R. Embry, S. Erhardt, M. Halder, J.-H. Kwon, K. Johanning, M.T.T. Oosterwijk, S. Rutishauser, H. Segner, J. Nichols, Protein and lipid binding parameters in rainbow trout (Oncorhynchus mykiss) blood and liver fractions to extrapolate from an in vitro metabolic degradation assay to in vivo bioaccumulation potential of hydrophobic organic chemicals, Chem Res Toxicol, 24 (2011) 1134-1143. [3] M. Gülden, H. Seibert, In vitro–in vivo extrapolation: estimation of human serum concentrations of chemicals equivalent to cytotoxic concentrations in vitro, Toxicol, 189 (2003) 211-222. [4] R.P. Schwarzenbach, P.M. Gschwend, D.M. Imboden, Environmental Organic Chemistry, 2nd ed., John Wiley & Sons, Inc. Hoboken, New Jersey, Canada, 2003.